united states
securities and exchange commission
washington, d.c. 20549
form n-csr
certified shareholder report of registered management
investment companies
Investment Company Act file number 811-21237
Unified Series Trust
(Exact name of registrant as specified in charter)
225 Pictoria Drive, Suite 450
Cincinnati, OH 45246
(Address of principal executive offices)
(Zip code)
Zachary P. Richmond
Ultimus Fund Solutions, LLC
225 Pictoria Drive. Suite 450
Cincinnati, OH 45246
(Name and address of agent for service)
Registrant's telephone number, including area code: 513-587-3400
Date of fiscal year end: 3/31
Date of reporting period: 9/30/23
Form N-CSR is to be used by management investment companies to file reports with the Commission not later than 10 days after the transmission to stockholders of any report that is required to be transmitted to stockholders under Rule 30e-1 under the Investment Company Act of 1940 (17 CFR 270.30e-1). The Commission may use the information provided on Form N-CSR in its regulatory, disclosure review, inspection and policymaking roles.
A registrant is required to disclose the information specified by Form N-CSR, and the Commission will make this information public. A registrant is not required to respond to the collection of information contained in Form N-CSR unless the Form displays a currently valid Office of Management and Budget ("OMB") control number. Please direct comments concerning the accuracy of the information collection burden estimate and any suggestions for reducing the burden to Secretary, Securities and Exchange Commission, 450 Fifth Street, NW, Washington, DC 20549-0609. The OMB has reviewed this collection of information under the clearance requirements of 44 U.S.C. § 3507.
Item 1. Reports to Stockholders.
| (a) |
 |
| Absolute Select Value ETF (ABEQ) |
| NYSE Arca, Inc. |
| Semi-Annual Report September 30, 2023 |
| Fund Adviser: |
| Absolute Investment Advisers LLC |
| 82 S. Barrett Square, Unit 4G |
| Rosemary Beach, FL 32461 |
| 1-833-267-3383 |
| Investment Results (Unaudited) |
Average Annual Total Returns* as of September 30, 2023
| Since | ||||||
| Inception | ||||||
| Six Months | One Year | 1/21/2020 | ||||
| Absolute Select Value ETF - NAV | (0.86)% | 11.25% | 3.54% | |||
| Absolute Select Value ETF - Market Price | (0.72)% | 11.26% | 3.54% | |||
| S&P 500® Index(a) | 5.18% | 21.62% | 8.93% |
Total annual operating expenses, as disclosed in the Absolute Select Value ETF’s (the “Fund”) prospectus dated July 29, 2023, were 0.85% of the Fund’s average daily net assets (1.16% before fee waivers/expense reimbursements by Absolute Investment Advisers LLC (the “Adviser”)). The Adviser has contractually agreed to waive its management fee and/or reimburse expenses so that total annual Fund operating expenses, excluding portfolio transaction and other investment-related costs (including brokerage fees and commissions); taxes; borrowing costs (such as interest and dividend expenses on securities sold short); acquired fund fees and expenses; fees and expenses associated with investments in other collective investment vehicles or derivative instruments (including for example option and swap fees and expenses); any amounts payable pursuant to a distribution or service plan adopted in accordance with Rule 12b-1 under the Investment Company Act of 1940; any administrative and/or shareholder servicing fees payable pursuant to a plan adopted by the Board of Trustees; expenses incurred in connection with any merger or reorganization; extraordinary expenses (such as litigation expenses, indemnification of Trust officers and Trustees and contractual indemnification of Fund service providers); and other expenses that the Trustees agree have not been incurred in the ordinary course of the Fund’s business, do not exceed 0.85% of the Fund’s average daily net assets through July 31, 2024. This expense cap may not be terminated prior to this date except by the Board of Trustees upon 60 days’ written notice to the Adviser. Each waiver/expense payment by the Adviser is subject to recoupment by the Adviser from the Fund in the three years following the date the particular waiver/expense payment occurred, but only if such recoupment can be achieved without exceeding the annual expense limitation in effect at the time of the waiver/ expense payment and any expense limitation in effect at the time of the recoupment. Additional information pertaining to the Fund’s expense ratios (not including acquired fund fees and expenses) as of September 30, 2023 can be found in the financial highlights.
The performance quoted represents past performance, which does not guarantee future results. The investment return and principal value of an investment will fluctuate so that an investor’s shares, when redeemed, may be worth more or less than their original cost. The returns shown do not reflect deduction of taxes that a shareholder would pay on Fund distributions or the redemption of Fund shares. Current performance of the Fund may be lower or higher than the performance quoted. The Fund’s investment objective, risks, charges and expenses should be considered carefully before investing. Performance data current to the most recent month-end may be obtained by calling (833) 267-3383. The Fund’s per share net asset value (“NAV”) is the value of one share of the Fund as calculated in accordance with the standard formula for valuing shares. The NAV return is based on the NAV of the Fund and the market return is based on the market price per share of the Fund. The price used to calculate market return (“Market Price”) is determined by using the midpoint between the highest bid and the lowest offer on the primary stock exchange on which the shares of the Fund are listed for trading, as of the time that the Fund’s NAV is calculated. Market Price and NAV returns assume that dividends and capital gain distributions have been reinvested in the Fund at Market Price and NAV, respectively. Since exchange-traded funds are bought and sold at prices set by the market, which can result in a premium or discount to NAV, the returns calculated using Market Price can differ from those calculated using NAV.
| * | Return figures reflect any change in price per share and assume the reinvestment of all distributions. The Fund’s returns reflect any fee reductions during the applicable periods. If such fee reductions |
1
| Investment Results (Unaudited) (continued) |
had not occurred, the quoted performance would have been lower. Total returns for periods less than one year are not annualized.
(a) The S&P 500® Index (the “Index”), or Standard & Poor’s 500 Index, is a market-capitalization weighted index of 500 leading publicly traded companies in the U.S. and is representative of a broader domestic equity market and range of securities than are found in the Fund’s portfolio. Individuals cannot invest directly in the Index; however, an individual can invest in exchange-traded funds or other investment vehicles that attempt to track the performance of a benchmark index.
The Fund’s investment objective, risks, charges and expenses should be considered carefully before investing. The prospectus contains this and other important information about the Fund and may be obtained by calling (833) 267-3383. Please read it carefully before investing.
The Fund is distributed by Northern Lights Distributors, LLC, member FINRA/SIPC
2
| Fund Holdings (Unaudited) |
Absolute Select Value ETF Holdings as of September 30, 2023.*
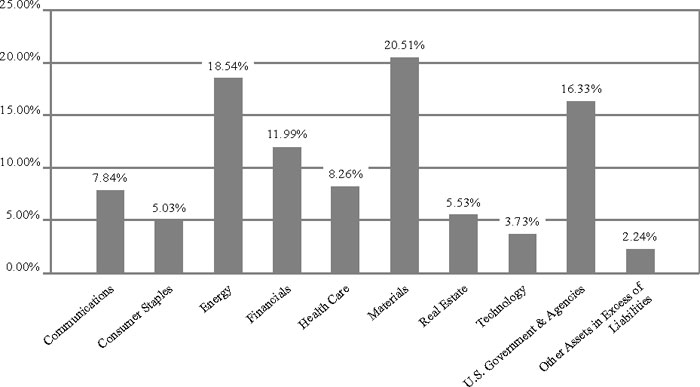
| * | As a percentage of net assets. |
The Fund’s investment objective is to seek positive absolute returns.
Portfolio holdings are subject to change.
| Availability of Portfolio Schedule (Unaudited) |
The Fund files a complete schedule of portfolio holdings with the Securities and Exchange Commission (the “SEC”) for the first and third quarters of each fiscal year as an exhibit to its reports on Form N-PORT. The Fund’s Form N-PORT reports are available on the SEC’s website at www. sec.gov or on the Fund’s website at www.absoluteadvisers.com.
3
| Absolute Select Value ETF |
| Schedule of Investments |
| September 30, 2023 (Unaudited) |
| Common Stocks — 81.43% | Shares | Fair Value | ||||||
| Canada — 17.44% | ||||||||
| Energy — 4.81% | ||||||||
| Enbridge, Inc. | 132,831 | $ | 4,408,661 | |||||
| Financials — 2.82% | ||||||||
| Brookfield Corporation | 82,500 | 2,579,775 | ||||||
| Materials — 9.81% | ||||||||
| Agnico Eagle Mines Ltd. | 136,927 | 6,223,332 | ||||||
| Franco-Nevada Corp. | 20,680 | 2,760,573 | ||||||
| 8,983,905 | ||||||||
| Total Canada | 15,972,341 | |||||||
| Ireland — 3.66% | ||||||||
| Health Care — 3.66% | ||||||||
| Medtronic PLC | 42,762 | 3,350,830 | ||||||
| Total Ireland | 3,350,830 | |||||||
| United Kingdom — 5.03% | ||||||||
| Consumer Staples — 5.03% | ||||||||
| Unilever PLC - ADR | 93,306 | 4,609,316 | ||||||
| Total United Kingdom | 4,609,316 | |||||||
| United States — 55.30% | ||||||||
| Communications — 7.84% | ||||||||
| Comcast Corp., Class A | 94,848 | 4,205,560 | ||||||
| Verizon Communications, Inc. | 91,743 | 2,973,391 | ||||||
| 7,178,951 | ||||||||
| Energy — 13.73% | ||||||||
| Berkshire Hathaway, Inc., Class B(a) | 27,311 | 9,567,044 | ||||||
| EOG Resources, Inc. | 23,753 | 3,010,930 | ||||||
| 12,577,974 | ||||||||
| Financials — 9.17% | ||||||||
| Loews Corp. | 87,641 | 5,548,551 | ||||||
| Travelers Companies, Inc. (The) | 17,492 | 2,856,619 | ||||||
| 8,405,170 | ||||||||
| Health Care — 4.60% | ||||||||
| Merck & Co., Inc. | 40,990 | 4,219,921 | ||||||
| Materials — 10.70% | ||||||||
| Corteva, Inc. | 53,973 | 2,761,259 | ||||||
| DuPont de Nemours, Inc. | 69,111 | 5,154,990 | ||||||
| International Flavors & Fragrances, Inc. | 27,770 | 1,893,081 | ||||||
| 9,809,330 | ||||||||
| Real Estate — 5.53% | ||||||||
| Crown Castle International Corp. | 19,000 | 1,748,570 | ||||||
| Equity Commonwealth | 180,357 | 3,313,158 | ||||||
| 5,061,728 | ||||||||
See accompanying notes which are an integral part of these financial statements.
4
| Absolute Select Value ETF |
| Schedule of Investments (continued) |
| September 30, 2023 (Unaudited) |
| Common Stocks — 81.43% (continued) | Shares | Fair Value | ||||||
| United States — 55.30% (continued) | ||||||||
| Technology — 3.73% | ||||||||
| Cisco Systems, Inc. | 63,545 | $ | 3,416,179 | |||||
| Total United States | 50,669,253 | |||||||
| Total Common Stocks | ||||||||
| (Cost $73,360,509) | 74,601,740 | |||||||
| Principal | ||||||||
| U.S. Government & Agencies — 16.33% | Amount | |||||||
| United States Treasury Bill 5.49%, 2/15/2024 | $ | 2,000,000 | 1,960,022 | |||||
| United States Treasury Bill 5.26%, 6/13/2024 | 3,000,000 | 2,889,082 | ||||||
| United States Treasury Note 0.25%, 3/15/2024 | 3,000,000 | 2,931,392 | ||||||
| United States Treasury Note 0.25%, 6/15/2024 | 3,000,000 | 2,892,169 | ||||||
| United States Treasury Note 0.38%, 9/15/2024 | 2,000,000 | 1,906,026 | ||||||
| United States Treasury Note 0.63%, 10/15/2024 | 2,500,000 | 2,379,710 | ||||||
| TOTAL U.S. GOVERNMENT & AGENCIES | ||||||||
| (Cost $15,035,910) | 14,958,401 | |||||||
| Total Investments — 97.76% | ||||||||
| (Cost $88,396,419) | 89,560,141 | |||||||
| Other Assets in Excess of Liabilities — 2.24% | 2,053,430 | |||||||
| Net Assets — 100.00% | $ | 91,613,571 | ||||||
| (a) | Non-income producing security. |
ADR - American Depositary Receipt
See accompanying notes which are an integral part of these financial statements.
5
| Absolute Select Value ETF |
| Statement of Assets and Liabilities |
| September 30, 2023 (Unaudited) |
| Assets | ||||
| Investments in securities, at fair value (cost $88,396,419) | $ | 89,560,141 | ||
| Cash | 1,925,138 | |||
| Dividends and interest receivable | 92,009 | |||
| Tax reclaims receivable | 105,490 | |||
| Prepaid expenses | 2,500 | |||
| Total Assets | 91,685,278 | |||
| Liabilities | ||||
| Payable to Adviser, net of waiver | 45,148 | |||
| Payable to affiliates | 8,145 | |||
| Payable to trustees | 91 | |||
| Other accrued expenses | 18,324 | |||
| Total Liabilities | 71,707 | |||
| Net Assets | $ | 91,613,571 | ||
| Net Assets consist of: | ||||
| Paid-in capital | $ | 90,959,544 | ||
| Accumulated earnings | 654,027 | |||
| Net Assets | $ | 91,613,571 | ||
| Shares outstanding (unlimited number of shares authorized, no par value) | 3,350,000 | |||
| Net asset value per share | $ | 27.35 |
See accompanying notes which are an integral part of these financial statements.
6
| Absolute Select Value ETF |
| Statement of Operations |
| For the six months ended September 30, 2023 (Unaudited) |
| Investment Income | ||||
| Dividend income (net of foreign taxes withheld of $42,581) | $ | 880,625 | ||
| Interest income | 443,670 | |||
| Total investment income | 1,324,295 | |||
| Expenses | ||||
| Adviser | 401,564 | |||
| Administration | 28,507 | |||
| Compliance services | 13,750 | |||
| Custodian | 13,506 | |||
| Legal | 12,570 | |||
| Audit and tax | 9,463 | |||
| Trustee | 8,429 | |||
| Report printing | 7,135 | |||
| Transfer agent | 5,092 | |||
| Insurance | 1,676 | |||
| Pricing | 653 | |||
| Miscellaneous | 20,666 | |||
| Total expenses | 523,011 | |||
| Fees waived and/or expenses reimbursed by Adviser | (121,431 | ) | ||
| Net operating expenses | 401,580 | |||
| Net investment income | 922,715 | |||
| Net Realized and Change in Unrealized Gain (Loss) on Investments | ||||
| Net realized gain (loss) on: | ||||
| Investment securities | 1,106,131 | |||
| Foreign currency translations | (450 | ) | ||
| Change in unrealized depreciation on: | ||||
| Investment securities | (2,888,851 | ) | ||
| Foreign currency translations | (270 | ) | ||
| Net realized and unrealized gain (loss) on investment securities and foreign currency translations | (1,783,440 | ) | ||
| Net decrease in net assets resulting from operations | $ | (860,725 | ) |
See accompanying notes which are an integral part of these financial statements.
7
| Absolute Select Value ETF |
| Statements of Changes in Net Assets |
| For the Six | ||||||||
| Months Ended | For the Year | |||||||
| September 30, | Ended March 31, | |||||||
| 2023 | 2023 | |||||||
| (Unaudited) | ||||||||
| Increase (Decrease) in Net Assets due to: | ||||||||
| Operations | ||||||||
| Net investment income | $ | 922,715 | $ | 1,787,138 | ||||
| Net realized gain on investment securities and foreign currency translations | 1,105,681 | 79,145 | ||||||
| Change in unrealized depreciation on investment securities | (2,889,121 | ) | (4,946,752 | ) | ||||
| Net decrease in net assets resulting from operations | (860,725 | ) | (3,080,469 | ) | ||||
| Distributions to Shareholders From: | ||||||||
| Earnings | (1,339,200 | ) | (982,915 | ) | ||||
| Total distributions | (1,339,200 | ) | (982,915 | ) | ||||
| Capital Transactions | ||||||||
| Proceeds from shares sold | 4,987,743 | 39,387,641 | ||||||
| Amount paid for shares redeemed | (2,109,699 | ) | (8,632,199 | ) | ||||
| Net increase in net assets resulting from capital transactions | 2,878,044 | 30,755,442 | ||||||
| Total Increase in Net Assets | 678,119 | 26,692,058 | ||||||
| Net Assets | ||||||||
| Beginning of period | $ | 90,935,452 | $ | 64,243,394 | ||||
| End of period | $ | 91,613,571 | $ | 90,935,452 | ||||
| Share Transactions | ||||||||
| Shares sold | 175,000 | 1,425,000 | ||||||
| Shares redeemed | (75,000 | ) | (325,000 | ) | ||||
| Net increase in shares outstanding | 100,000 | 1,100,000 | ||||||
See accompanying notes which are an integral part of these financial statements.
8
| Absolute Select Value ETF |
| Financial Highlights |
| (For a share outstanding during each period) |
| For the Six | ||||||||||||||||||||
| Months | For the | |||||||||||||||||||
| Ended | For the | For the | For the | Period | ||||||||||||||||
| September | Year Ended | Year Ended | Year Ended | Ended | ||||||||||||||||
| 30, 2023 | March 31, | March 31, | March 31, | March 31, | ||||||||||||||||
| (Unaudited) | 2023 | 2022 | 2021 | 2020(a) | ||||||||||||||||
| Selected Per Share Data: | ||||||||||||||||||||
| Net asset value, beginning of period | $ | 27.98 | $ | 29.88 | $ | 26.22 | $ | 20.14 | $ | 25.00 | ||||||||||
| Investment operations: | ||||||||||||||||||||
| Net investment income | 0.27 | 0.56 | 0.22 | 0.13 | 0.03 | |||||||||||||||
| Net realized and unrealized gain (loss) on investments | (0.50 | ) | (2.13 | ) | 3.61 | 6.10 | (4.89 | ) | ||||||||||||
| Total from investment operations | (0.23 | ) | (1.57 | ) | 3.83 | 6.23 | (4.86 | ) | ||||||||||||
| Less distributions to shareholders from: | ||||||||||||||||||||
| Net investment income | (0.40 | ) | (0.33 | ) | (0.17 | ) | (0.15 | ) | — | |||||||||||
| Total distributions | (0.40 | ) | (0.33 | ) | (0.17 | ) | (0.15 | ) | — | |||||||||||
| Net asset value, end of period | $ | 27.35 | $ | 27.98 | $ | 29.88 | $ | 26.22 | $ | 20.14 | ||||||||||
| Market price, end of period | $ | 27.35 | $ | 27.94 | $ | 29.92 | $ | 26.23 | $ | 20.21 | ||||||||||
| Total Return(b) | �� | (0.86 | )% (c) | (5.22 | )% | 14.66 | % | 31.02 | % | (19.44 | )% (c) | |||||||||
| Ratios and Supplemental Data: | ||||||||||||||||||||
| Net assets, end of period (000 omitted) | $ | 91,614 | $ | 90,935 | $ | 64,243 | $ | 45,887 | $ | 22,151 | ||||||||||
| Ratio of net expenses to average net assets | 0.85 | % (d) | 0.85 | % | 0.85 | % | 0.85 | % | 0.85 | % (d) | ||||||||||
| Ratio of expenses to average net assets before waiver and reimbursement | 1.11 | % (d) | 1.16 | % | 1.24 | % | 1.51 | % | 3.88 | % (d) | ||||||||||
| Ratio of net investment income to average net assets | 1.95 | % (d) | 2.30 | % | 0.85 | % | 0.58 | % | 1.40 | % (d) | ||||||||||
| Portfolio turnover rate(e) | 10 | % (c) | 24 | % | 23 | % | 36 | % | 30 | % (c) | ||||||||||
| (a) | For the period January 21, 2020 (commencement of operations) to March 31, 2020. |
| (b) | Total return is calculated assuming a purchase of shares at net asset value on the first day and a sale at net asset value on the last day of the period. Distributions are assumed, for the purpose of this calculation, to be reinvested at the ex-dividend date net asset value per share on their respective payment dates. |
| (c) | Not annualized. |
| (d) | Annualized. |
| (e) | Portfolio turnover rate excludes securities received or delivered from in-kind processing of creations or redemptions. |
See accompanying notes which are an integral part of these financial statements.
9
| Absolute Select Value ETF |
| Notes to the Financial Statements |
| September 30, 2023 (Unaudited) |
NOTE 1. ORGANIZATION
Absolute Select Value ETF (the “Fund”) was organized as a non-diversified series of Unified Series Trust (the “Trust”) on August 20, 2019, and is registered under the Investment Company Act of 1940, as amended (the “1940 Act”). The Trust is an open-end investment company established under the laws of Ohio by an Agreement and Declaration of Trust dated October 14, 2002, as amended (the “Trust Agreement”). The Trust Agreement permits the Board of Trustees of the Trust (the “Board”) to issue an unlimited number of shares of beneficial interest of separate series without par value. The Fund is one of a series of funds currently authorized by the Board. The Fund’s investment adviser is Absolute Investment Advisers LLC (the “Adviser”). The Adviser has retained St. James Investment Company, LLC (the “Sub-Adviser”) to serve as Sub-Adviser to the Fund. The Fund’s investment objective is to seek positive absolute returns.
Non-Diversification Risk – The Fund is non-diversified, which means it may invest a greater percentage of its assets in a fewer number of securities as compared to other exchange-traded funds that are more broadly diversified. As a result, the Fund’s share price may be more volatile than the share price of some other funds, and the poor performance of an individual security in the Fund’s portfolio may have a significant negative impact on the Fund’s performance.
NOTE 2. SIGNIFICANT ACCOUNTING POLICIES
The Fund is an investment company and follows accounting and reporting guidance under Financial Accounting Standards Board Accounting Standards Codification (“ASC”) Topic 946, “Financial Services-Investment Companies”. The following is a summary of significant accounting policies followed by the Fund in the preparation of its financial statements. These policies are in conformity with generally accepted accounting principles in the United States of America (“GAAP”).
Regulatory Update – Tailored Shareholder Reports for Mutual Funds and Exchange-Traded Funds (“ETFs”) – Effective January 24, 2023, the Securities and Exchange Commission adopted rule and form amendments to require mutual funds and ETFs to transmit concise and visually engaging streamlined annual and semiannual reports to shareholders that highlight key information. Other information, including financial statements, will no longer appear in a streamlined shareholder report but must be available online, delivered free of charge upon request, and filed on a semiannual basis on Form N-CSR. The rule and form amendments have a compliance date of July 24, 2024. At this time, management is evaluating the impact of these amendments on the shareholder reports for the Fund.
10
| Absolute Select Value ETF |
| Notes to the Financial Statements (continued) |
| September 30, 2023 (Unaudited) |
Estimates – The preparation of financial statements in conformity with GAAP requires management to make estimates and assumptions that affect the reported amounts of assets and liabilities and disclosure of contingent assets and liabilities at the date of the financial statements and the reported amounts of increases and decreases in net assets from operations during the reporting period. Actual results could differ from those estimates.
Foreign Currency Translation – The accounting records of the Fund are maintained in U.S. dollars. Foreign currency amounts are translated into U.S. dollars at the current rate of exchange each business day to determine the value of investments, and other assets and liabilities. Purchases and sales of foreign securities, and income and expenses, are translated at the prevailing rate of exchange on the respective date of these transactions. The Fund does not isolate that portion of the results of operations resulting from changes in foreign exchange rates on investments from fluctuations arising from changes in market prices of securities held. These fluctuations are included with the realized and unrealized gain or loss from investments. Net realized gain (loss) on foreign currency translations on the Statement of Operations represents currency gains (losses) realized between the trade and settlement dates on securities transactions, and the difference between the amount of investment income and foreign withholding taxes recorded on the Fund’s books and the U.S. dollar equivalent amounts actually received or paid. The change in unrealized currency gains (losses) on foreign currency translations for the period is reflected in the Statement of Operations.
Federal Income Taxes – The Fund makes no provision for federal income or excise tax. The Fund has qualified and intends to qualify each year as a regulated investment company (“RIC”) under subchapter M of the Internal Revenue Code of 1986, as amended, by complying with the requirements applicable to RICs and by distributing substantially all of its taxable income. The Fund also intends to distribute sufficient net investment income and net realized capital gains, if any, so that it will not be subject to excise tax on undistributed income and gains. If the required amount of net investment income or gains is not distributed, the Fund could incur a tax expense.
As of and during the six months ended September 30, 2023, the Fund did not have any liabilities for any unrecognized tax benefits. The Fund recognizes interest and penalties, if any, related to unrecognized tax benefits as income tax expense in the Statement of Operations when incurred. During the period, the Fund did not incur any interest or penalties. Management of the Fund has reviewed tax positions taken in tax years that remain subject to examination by all major tax jurisdictions, including federal (i.e., the previous three tax year ends and the interim tax period since then, as applicable) and has concluded that no provision for unrecognized tax benefits or expenses is required in these financial statements and does not expect this to change over the next twelve months.
11
| Absolute Select Value ETF |
| Notes to the Financial Statements (continued) |
| September 30, 2023 (Unaudited) |
Expenses – Expenses incurred by the Trust that do not relate to a specific fund of the Trust are allocated to the individual funds of the Trust based on each fund’s relative net assets or another appropriate basis (as determined by the Board).
Security Transactions and Related Income – The Fund follows industry practice and records security transactions on the trade date for financial reporting purposes. The specific identification method is used for determining gains or losses for financial statements and income tax purposes. Dividend income is recorded on the ex-dividend date and interest income is recorded on an accrual basis. Distributions received from investments in real estate investment trusts (“REITs”) that represent a return of capital or capital gain are recorded as a reduction of the cost of investment or as a realized gain, respectively. The calendar year-end amounts of ordinary income, capital gains, and return of capital included in distributions received from the Fund’s investments in REITs are reported to the Fund after the end of the calendar year; accordingly, the Fund estimates these amounts for accounting purposes until the characterization of REIT distributions is reported. Estimates are based on the most recent REIT distributions information available. Withholding taxes on foreign dividends and related reclaims have been provided for in accordance with the Fund’s understanding of the applicable country’s tax rules and rates.
Dividends and Distributions – The Fund intends to distribute substantially all of its net investment income, if any, at least semi-annually. The Fund intends to distribute its net realized long-term and short-term capital gains, if any, annually. Distributions to shareholders, which are determined in accordance with income tax regulations, are recorded on the ex-dividend date. The treatment for financial reporting purposes of distributions made to shareholders during the year from net investment income or net realized capital gains may differ from their ultimate treatment for federal income tax purposes. These differences are caused primarily by differences in the timing of the recognition of certain components of income, expense or realized capital gain for federal income tax purposes. Where such differences are permanent in nature, they are reclassified in the components of the net assets based on their ultimate characterization for federal income tax purposes. Any such reclassifications will have no effect on net assets, results of operations or net asset value (“NAV”) per share of the Fund.
NOTE 3. SECURITIES VALUATION AND FAIR VALUE MEASUREMENTS
The Fund values its portfolio securities at fair value as of the close of regular trading on the New York Stock Exchange (“NYSE”) (normally 4:00 p.m. Eastern Time) on each business day the NYSE is open for business. Fair value is defined as the price that the Fund would receive upon selling an investment in a timely transaction to an independent buyer in the principal or most advantageous market of the investment. GAAP establishes a three-tier hierarchy to maximize the use of observable market data and minimize the
12
| Absolute Select Value ETF |
| Notes to the Financial Statements (continued) |
| September 30, 2023 (Unaudited) |
use of unobservable inputs and to establish classification of fair value measurements for disclosure purposes.
Inputs refer broadly to the assumptions that market participants would use in pricing the asset or liability, including assumptions about risk (the risk inherent in a particular valuation technique used to measure fair value including a pricing model and/or the risk inherent in the inputs to the valuation technique). Inputs may be observable or unobservable. Observable inputs are inputs that reflect the assumptions market participants would use in pricing the asset or liability developed based on market data obtained and available from sources independent of the reporting entity. Unobservable inputs are inputs that reflect the reporting entity’s own assumptions about the assumptions market participants would use in pricing the asset or liability developed based on the best information available in the circumstances.
Various inputs are used in determining the value of the Fund’s investments. These inputs are summarized in the three broad levels listed below.
| ● | Level 1 – unadjusted quoted prices in active markets for identical investments and/or registered investment companies where the value per share is determined and published and is the basis for current transactions for identical assets or liabilities at the valuation date |
| ● | Level 2 – other significant observable inputs (including, but not limited to, quoted prices for an identical security in an inactive market, quoted prices for similar securities, interest rates, prepayment speeds, credit risk, etc.) |
| ● | Level 3 – significant unobservable inputs (including the Fund’s own assumptions in determining fair value of investments based on the best information available) |
The inputs used to measure fair value may fall into different levels of the fair value hierarchy. In such cases, for disclosure purposes, the level in the fair value hierarchy which is reported is determined based on the lowest level input that is significant to the fair value measurement in its entirety.
Equity securities that are traded on any stock exchange are generally valued at the last quoted sale price on the security’s primary exchange. Lacking a last sale price, an exchange-traded security is generally valued at its last bid price. Securities traded in the Nasdaq over-the-counter market are generally valued at the Nasdaq Official Closing Price. When using market quotations and when the market is considered active, the security is classified as a Level 1 security. In the event that market quotations are not readily available or are considered unreliable due to market or other events, securities are valued in good faith by the Adviser, as Valuation Designee, under oversight of the Board’s Pricing &
13
| Absolute Select Value ETF |
| Notes to the Financial Statements (continued) |
| September 30, 2023 (Unaudited) |
Liquidity Committee. The Adviser has adopted written policies and procedures for valuing securities and other assets in circumstances where market quotes are not readily available in conformity with guidelines adopted by the Board. In the event that market quotes are not readily available, and the security or asset cannot be valued pursuant to one of the valuation methods, the value of the security or asset will be determined in good faith by the Valuation Designee pursuant to its policies and procedures. Any fair value provided by the Valuation Designee is subject to the ultimate review of the pricing methodology by the Pricing & Liquidity Committee of the Board on a quarterly basis. Under these policies, the securities will be classified as Level 2 or 3 within the fair value hierarchy, depending on the inputs used.
Investments in mutual funds, including money market mutual funds, are generally priced at the ending NAV provided by the service agent of the mutual funds. These securities are categorized as Level 1 securities.
In accordance with the Trust’s valuation policies and fair value determinations pursuant to Rule 2a-5 under the 1940 Act, the Valuation Designee is required to consider all appropriate factors relevant to the value of securities for which it has determined other pricing sources are not available or reliable as described above. No single method exists for determining fair value because fair value depends upon the circumstances of each individual case. As a general principle, the current fair value of a security being valued by the Valuation Designee would be the amount that the Fund might reasonably expect to receive upon the current sale. Methods that are in accordance with this principle may, for example, be based on (i) a multiple of earnings; (ii) a discount from market prices of a similar freely traded security (including a derivative security or a basket of securities traded on other markets, exchanges or among dealers); or (iii) yield to maturity with respect to debt issues, or a combination of these and other methods. Fair-value pricing is permitted if, in the Valuation Designee’s opinion, the validity of market quotations appears to be questionable based on factors such as evidence of a thin market in the security based on a small number of quotations, a significant event occurs after the close of a market but before the Fund’s NAV calculation that may affect a security’s value, or the Valuation Designee is aware of any other data that calls into question the reliability of market quotations. The Valuation Designee may obtain assistance from others in fulfilling its duties. For example, it may seek assistance from pricing services, fund administrators, sub-advisers, accountants, or counsel; it may also consult the Trust’s Fair Value Committee. The Valuation Designee, however, remains responsible for the final fair value determination and may not designate or assign that responsibility to any third party.
14
| Absolute Select Value ETF |
| Notes to the Financial Statements (continued) |
| September 30, 2023 (Unaudited) |
The following is a summary of the inputs used to value the Fund’s investments as of September 30, 2023:
| Valuation Inputs | ||||||||||||||||
| Assets | Level 1 | Level 2 | Level 3 | Total | ||||||||||||
| Common Stocks (a) | $ | 74,601,740 | $ | — | $ | — | $ | 74,601,740 | ||||||||
| U.S. Government & Agencies | — | 14,958,401 | — | 14,958,401 | ||||||||||||
| Total | $ | 74,601,740 | $ | 14,958,401 | $ | — | $ | 89,560,141 | ||||||||
| (a) | Refer to Schedule of Investments for sector classifications. |
The Fund did not hold any investments at the end of the reporting period for which significant unobservable inputs (Level 3) were used in determining fair value; therefore, no reconciliation of Level 3 securities is included for this reporting period.
NOTE 4. FEES AND OTHER TRANSACTIONS WITH AFFILIATES AND OTHER SERVICE PROVIDERS
The Adviser, under the terms of the management agreement with the Trust with respect to the Fund (the “Agreement”), manages the Fund’s investments. As compensation for its management services, the Fund is obligated to pay the Adviser a management fee computed and accrued daily and paid monthly at an annual rate of 0.85% of the Fund’s average daily net assets. For the six months ended September 30, 2023, before the waiver described below, the Adviser earned a management fee of $401,564 from the Fund.
The Adviser has contractually agreed to waive its management fee and/or reimburse expenses through July 31, 2024 so that total annual operating expenses (excluding portfolio transaction and other investment-related costs (including brokerage fees and commissions); taxes; borrowing costs (such as interest and dividend expenses on securities sold short); acquired fund fees and expenses; fees and expenses associated with investments in other collective investment vehicles or derivative instruments (including for example option and swap fees and expenses); any amounts payable pursuant to a distribution or service plan adopted in accordance with Rule 12b-1 under the 1940 Act; any administrative and/ or shareholder servicing fees payable pursuant to a plan adopted by the Board of Trustees; expenses incurred in connection with any merger or reorganization; extraordinary expenses (such as litigation expenses, indemnification of Trust officers and Trustees and contractual indemnification of Fund service providers); and other expenses that the Trustees agree have not been incurred in the ordinary course of the Fund’s business) do not exceed 0.85% of the Fund’s average daily net assets through July 31, 2024. For the six months ended September 30, 2023, the Adviser waived fees of $121,431. At September 30, 2023, the Fund owed the Adviser $45,148.
15
| Absolute Select Value ETF |
| Notes to the Financial Statements (continued) |
| September 30, 2023 (Unaudited) |
Each fee waiver/expense payment by the Adviser is subject to recoupment by the Adviser from the Fund in the three years following the date in which that particular waiver/expense payment occurred, but only if such recoupment can be achieved without exceeding the annual expense limitation in effect at the time of the waiver/expense payment and any expense limitation in effect at the time of the recoupment. As of September 30, 2023, the Adviser may seek repayment of management fees waived and expense reimbursements pursuant to the aforementioned conditions, from the Fund no later than the dates stated below:
| Recoverable Through | ||||
| March 31, 2024 | $ | 217,326 | ||
| March 31, 2025 | 205,812 | |||
| March 31, 2026 | 237,336 | |||
| September 30, 2026 | 121,431 |
Ultimus Fund Solutions, LLC (“Ultimus”) provides administration and fund accounting services to the Fund. The Fund pays Ultimus fees in accordance with the agreements for such services.
Northern Lights Compliance Services, LLC (“NLCS”), an affiliate of Ultimus, provides a Chief Compliance Officer to the Trust, as well as related compliance services, pursuant to a consulting agreement between NLCS and the Trust. Under the terms of such agreement, NLCS receives fees from the Fund, which are approved annually by the Board.
Under the terms of a Distribution Agreement with the Trust, Northern Lights Distributors, LLC (the “Distributor”) serves as principal underwriter to the Fund. The Distributor is an affiliate of Ultimus. The Distributor is compensated by the Adviser (not the Fund) for acting as principal underwriter.
Certain officers of the Trust are also employees of Ultimus and such persons are not paid by the Fund for serving in such capacities. One Trustee is a former employee of Ultimus who is not currently paid by the Fund for serving in such capacity.
The Board supervises the business activities of the Trust. Each Trustee serves as a trustee until termination of the Trust unless the Trustee dies, resigns, retires, or is removed. The Chair of the Board and more than 75% of the Trustees are “Independent Trustees,” which means that they are not “interested persons” as defined in the 1940 Act. The Independent Trustees review and establish compensation at least annually. Each Independent Trustee of the Trust receives annual compensation, which is an established amount paid quarterly per fund in the Trust at the time of the regular quarterly Board meetings. The Chair of the Board receives the highest compensation, commensurate with his additional duties and each Chair of a committee receives additional compensation as well. Independent
16
| Absolute Select Value ETF |
| Notes to the Financial Statements (continued) |
| September 30, 2023 (Unaudited) |
Trustees also receive additional fees for attending any special meeting. In addition, the Trust reimburses Independent Trustees for out-of-pocket expenses incurred in conjunction with attendance at meetings.
NOTE 5. INVESTMENT TRANSACTIONS
For the six months ended September 30, 2023, purchases and sales of investment securities, other than short-term investments, were $18,819,253 and $8,533,614, respectively.
For the six months ended September 30, 2023, purchases and sales of long-term U.S. government obligations were $5,700,669 and $472,991, respectively.
For the six months ended September 30, 2023, purchases and sales for in-kind transactions were $3,737,794 and $1,600,494, respectively.
For the six months ended September 30, 2023, the Fund had in-kind net realized gains of $443,525.
NOTE 6. CAPITAL SHARE TRANSACTIONS
Shares are not individually redeemable and may be redeemed by the Fund at NAV only in large blocks known as “Creation Units”. Only Authorized Participants or transactions done through an Authorized Participant are permitted to purchase or redeem Creation Units from the Fund. An Authorized Participant is either (i) a broker-dealer or other participant in the clearing process through the Continuous Net Settlement System of the National Securities Clearing Corporation or (ii) a Depository Trust Company participant and, in each case, must have executed a Participant Agreement with the Distributor. Such transactions are generally permitted on an in-kind basis, with a balancing cash component to equate the transaction to the NAV per share of the Fund on the transaction date. Cash may be substituted equivalent to the value of certain securities generally when they are not available in sufficient quantity for delivery, not eligible for trading by the Authorized Participant or as a result of other market circumstances. In addition, the Fund may impose transaction fees on purchases and redemptions of Fund shares to cover the custodial and other costs incurred by the Fund in effecting trades. A fixed fee payable to the Custodian may be imposed on each creation and redemption transaction regardless of the number of Creation Units involved in the transaction (“Fixed Fee”). Purchases and redemptions of Creation Units for cash or involving cash-in-lieu are required to pay an additional variable charge to compensate the Fund and its ongoing shareholders for brokerage and market impact expenses relating to Creation Unit transactions (“Variable Charge”, and together with the Fixed Fee, the “Transaction Fees”). Transactions in capital shares for the Fund are disclosed in the Statement of Changes in Net Assets. For the six months ended September
17
| Absolute Select Value ETF |
| Notes to the Financial Statements (continued) |
| September 30, 2023 (Unaudited) |
30, 2023, the Fund received $1,750 and $0 in fixed fees and variable fees, respectively. The Transaction Fees for the Fund are listed in the table below:
| Fixed Fee | Variable Charge | |
| $250 | 2.00%* |
| * | The maximum Transaction Fee may be up to 2.00% of the amount invested. |
NOTE 7. FEDERAL TAX INFORMATION
At September 30, 2023, the net unrealized appreciation (depreciation) and tax cost of investments for tax purposes was as follows:
| Gross unrealized appreciation | $ | 6,810,873 | ||
| Gross unrealized depreciation | (5,649,850 | ) | ||
| Net unrealized appreciation on investments | $ | 1,161,023 | ||
| Tax cost of investments | $ | 88,399,118 |
The tax character of distributions paid for the fiscal year ended March 31, 2023, the Fund’s most recent fiscal year end, was as follows:
| Distributions paid from: | ||||
| Ordinary income(a) | $ | 982,915 | ||
| Total distributions paid | $ | 982,915 |
| (a) | Short-term capital gain distributions are treated as ordinary income for tax purposes. |
At March 31, 2023, the Fund’s most recent fiscal year end, the components of accumulated earnings (deficit) on a tax basis were as follows:
| Undistributed ordinary income | $ | 925,258 | ||
| Accumulated capital and other losses | (2,119,126 | ) | ||
| Unrealized appreciation on investments | 4,049,874 | |||
| Total accumulated earnings | $ | 2,856,006 |
The difference between book basis and tax basis undistributed net investment income/ (loss), accumulated net realized gain/(loss), and unrealized appreciation/(depreciation) from investments is primarily attributable to the tax deferral of losses on wash sales.
At March 31, 2023, the Fund had $1,069,548 short-term and $1,049,578 long-term capital loss carryforwards for federal income tax purposes available to offset future capital gains. These capital loss carryforwards do not expire. At March 31, 2023, the Fund did not utilize capital loss carryforwards.
18
| Absolute Select Value ETF |
| Notes to the Financial Statements (continued) |
| September 30, 2023 (Unaudited) |
NOTE 8. COMMITMENTS AND CONTINGENCIES
The Trust indemnifies its officers and Trustees for certain liabilities that may arise from their performance of their duties to the Trust or the Fund. Additionally, in the normal course of business, the Trust enters into contracts that contain a variety of representations and warranties which provide general indemnifications. The Trust’s maximum exposure under these arrangements is unknown, as this would involve future claims that may be made against the Trust that have not yet occurred.
NOTE 9. SUBSEQUENT EVENTS
Management of the Fund has evaluated the need for disclosures and/or adjustments resulting from subsequent events through the date at which these financial statements were issued. Based upon this evaluation, management has determined there were no items requiring adjustment of the financial statements or additional disclosure.
19
| Liquidity Risk Management Program (Unaudited) |
The Trust has adopted and implemented a written liquidity risk management program (the “Program”) as required by Rule 22e-4 (the “Liquidity Rule”) under the 1940 Act. The Program is reasonably designed to assess and manage the Fund’s liquidity risk of each individual series of the Trust (each a “Fund” and collectively, the “Funds”), taking into consideration, among other factors, the Fund’s investment strategy and the liquidity of its portfolio investments during normal and reasonably foreseeable stressed conditions; its short and long-term cash flow projections; and its cash holdings and access to other funding sources. The Board approved the appointment of the Liquidity Administrator Committee, comprising certain Trust officers and employees of the Adviser. The Liquidity Administrator Committee maintains Program oversight and reports to the Board on at least an annual basis regarding the Program’s operational effectiveness through a written report (the “Report”). The most recent Report, which was presented to the Board for consideration at its meeting held on August 14-15, 2023, outlined the operation of the Program and the adequacy and effectiveness of the Program’s implementation. During the review period, the Funds did not experience unusual stress or disruption to their operations related to purchase and redemption activity. Also, during the review period each Fund held adequate levels of cash and highly liquid investments to meet shareholder redemption activities in accordance with such Fund’s prospectus and within the requirements of the 1940 Act. The Report concluded that the Program is reasonably designed to prevent violation of the Liquidity Rule and has been effectively implemented.
20
| Summary of Fund Expenses (Unaudited) |
As a shareholder of the Fund, you incur two types of costs: (1) transaction costs and (2) ongoing costs, including management fees and other Fund expenses. These examples are intended to help you understand your ongoing costs (in dollars) of investing in the Fund and to compare these costs with the ongoing costs of investing in other funds. You may pay brokerage commissions on purchases and sales of exchange-traded fund shares, which are not reflected in the example. The example is based on an investment of $1,000 invested at the beginning of the period and held for the entire period from April 1, 2023 through September 30, 2023.
Actual Expenses
The first line of the table below provides information about actual account values and actual expenses. You may use the information in this line, together with the amount you invested, to estimate the expenses that you paid over the period. Simply divide your account value by $1,000 (for example, an $8,600 account value divided by $1,000 = 8.6), then multiply the result by the number in the first line under the heading “Expenses Paid During Period” to estimate the expenses you paid on your account during this period.
Hypothetical Example for Comparison Purposes
The second line of the table below provides information about hypothetical account values and hypothetical expenses based on the Fund’s actual expense ratio and an assumed rate of return of 5% per year before expenses, which is not the Fund’s actual return. The hypothetical account values and expenses may not be used to estimate the actual ending account balance or expenses you paid for the period. You may use this information to compare the ongoing costs of investing in the Fund and other funds. To do so, compare this 5% hypothetical example with the 5% hypothetical examples that appear in the shareholder reports of other funds.
Expenses shown in the table are meant to highlight your ongoing costs only and do not reflect any transactional costs. Therefore, the second line of the table below is useful in comparing ongoing costs only and will not help you determine the relative total costs of owning different funds. In addition, if transaction costs were included, your costs would have been higher.
| Beginning | Ending | |||||||||||||
| Account | Account | Expenses | ||||||||||||
| Value | Value | Paid | Annualized | |||||||||||
| April 1, | September | During | Expense | |||||||||||
| 2023 | 30, 2023 | Period(a) | Ratio | |||||||||||
| Actual | $ | 1,000.00 | $ | 991.40 | $ | 4.23 | 0.85% | |||||||
| Hypothetical(b) | $ | 1,000.00 | $ | 1,020.82 | $ | 4.29 | 0.85% | |||||||
| (a) | Expenses are equal to the Fund’s annualized expense ratios, multiplied by the average account value over the period, multiplied by 183/365 (to reflect the one-half year period). |
| (b) | Hypothetical assumes 5% annual return before expenses. |
21
| Management and Sub-Advisory Agreement Renewal (Unaudited) |
The Absolute Select Value ETF (the “Fund”) is a series of Unified Series Trust (the “Trust”). The Trust’s Board of Trustees (the “Board”) oversees the management of the Fund and, as required by law, has considered the renewal of the management agreement with its investment adviser, Absolute Investment Advisers LLC (“Absolute”) and the renewal of the sub-advisory agreement between Absolute and St. James Investment Company, LLC (“St. James”). In connection with such approvals, the Board requested and evaluated all information that the Trustees deemed reasonably necessary under the circumstances.
The Trustees held a teleconference on May 10, 2023 to review and discuss materials compiled by Ultimus Fund Solutions, LLC, the Trust’s administrator, with regard to the management agreement between the Trust and Absolute and the sub-advisory agreement between Absolute and St. James. At the Trustees’ quarterly meeting held in May 2023, the Board interviewed certain executives of Absolute and St. James, including Absolute’s Chief Compliance Officer and Managing Principals and a Partner of St. James. After discussion, the Trustees, including the Trustees who are not “interested persons” (as that term is defined in the Investment Company Act of 1940, as amended) of the Trust, Absolute or St. James (the “Independent Trustees”), approved the renewal of the management agreement between the Trust and Absolute and the sub-advisory agreement between Absolute and St. James, each for an additional year. The Trustees’ renewal of the Fund’s management agreement and sub-advisory agreement were based on a consideration of all the information provided to the Trustees, and were not the result of any single factor. Some of the factors that figured particularly in the Trustees’ deliberations are described below, although individual Trustees may have evaluated this information differently, ascribing different weights to various factors.
(i) The Nature, Extent, and Quality of Services. The Trustees reviewed and considered information regarding the nature, extent, and quality of services that each of Absolute and St. James provide to the Fund, which include, but are not limited to, providing a continuous investment program for the Fund, adhering to the Fund’s investment restrictions, complying with the Trust’s policies and procedures, and voting proxies on behalf of the Fund. They noted Absolute provided oversight of St. James and is very involved in managing the Fund. The Trustees considered the qualifications and experience of St. James’ portfolio manager who will continue to be responsible for the day-to-day management of the Fund’s portfolio, as well as the qualifications and experience of the other individuals at each of Absolute and St. James who continue to provide services to the Fund. They noted that the Trust CCO has done an on-site visit of St. James recently and concluded that the compliance program is effectively implemented. The Trustees concluded that they are satisfied with the robust nature, extent, and quality of investment management services provided by each of Absolute and St. James to the Fund.
(ii) Fund Performance. The Trustees next reviewed and discussed the Fund’s performance over various periods ended February 28, 2023. The Trustees observed that the Fund had outperformed its Morningstar Large Value category and benchmark, the Russell 1000 Value Index, for the one-year period ended February 28, 2023, and performed in line with its peer group over the same period. The Trustees observed that the Fund had underperformed all references for the three-year and since-inception periods. The Trustees noted that the Fund’s commencement of operations coincided with the COVID-19 inspired market decline and volatility which partially explained its longer-term underperformance, but that its one-year performance reflects the persistence of the Fund’s strategy and its management. The Trustees further acknowledged that Absolute attributed underperformance
22
| Management and Sub-Advisory Agreement Renewal (Unaudited) (continued) |
over the three-year and since inception periods to its more conservative allocations than those of its peers. The Trustees observed that management of the Fund was deliberate and a very thorough commentary had been provided by the portfolio manager. It was the consensus of the Trustees that the performance had been satisfactory.
(iii) Fee Rate and Profitability. The Trustees noted that the Fund’s management fee and net expense ratio are higher than the medians and averages of its Morningstar category and peer group. The Trustees considered the size of the Fund compared to others in the peer group and Morningstar category, as well as the resources required to implement the Fund’s unique strategy. The Trustees also considered a profitability analysis prepared by Absolute for its management of the Fund, which indicated that, before deduction of marketing expenses, Absolute is earning a slight profit as a result of managing the Fund. The Trustees also noted that Absolute has committed to waiving a portion of its fees through at least July 31, 2024.
The Trustees considered other potential benefits that Absolute or St. James may receive in connection with management of the Fund and determined the services provided are not duplicative as between adviser and sub-adviser. After considering the above information, the Trustees concluded that the management fee and the sub-advisory fee for the Fund each represent reasonable compensation in light of the nature and quality of services to the Fund.
(iv) Economies of Scale. In determining the reasonableness of the management fee and sub-advisory fee, the Trustees also considered the extent to which Absolute or St. James will realize economies of scale as the Fund grows larger. The Trustees determined that, in light of the size of the Fund, the relatively brief period since launch, and the fact that Absolute is still waiving a portion of its fees, it is premature to consider reducing the management fee or introduce breakpoints in the management fee at this time.
23
Proxy Voting
A description of the policies and procedures that the Fund uses to determine how to vote proxies relating to portfolio securities and information regarding how the Fund voted those proxies during the most recent twelve month period ended June 30, are available (1) without charge upon request by calling the Fund at (833) 267-3383 and (2) in Fund documents filed with the SEC on the SEC’s website at www.sec.gov.
| TRUSTEES Daniel J. Condon, Chair David R. Carson Kenneth G.Y. Grant Freddie Jacobs, Jr. Catharine B. McGauley Ronald C. Tritschler | INDEPENDENT REGISTERED PUBLIC ACCOUNTING FIRM Cohen & Company, Ltd. 151 North Franklin Street, Suite 575 Chicago, IL 60606 |
| OFFICERS Martin R. Dean, President GwenethK. Gosselink, Chief Compliance Officer Zachary P. Richmond, Treasurer and Chief Financial Officer | LEGAL COUNSEL Thompson Hine LLP 312 Walnut Street, 20th Floor Cincinnati, OH 45202 |
| INVESTMENT ADVISER Absolute Investment Advisers LLC 82 South Barrett Square, Unit 4G Rosemary Beach, FL 32461 | CUSTODIAN Brown Brothers Harriman & Co. 50 Post Office Square Boston, MA 02110 |
| DISTRIBUTOR Northern Lights Distributors, LLC 4221 North 203rd Street, Suite 100 Elkhorn, NE 68022 | ADMINISTRATOR Ultimus Fund Solutions, LLC 225 Pictoria Drive, Suite 450 Cincinnati, OH 45246 |
This report is intended only for the information of shareholders or those who have received the Fund’s prospectus which contains information about the Fund’s management fee and expenses. Please read the prospectus carefully before investing.
Distributed by Northern Lights Distributors, LLC Member FINRA/SIPC
Absolute Select-SAR-23
|
| Absolute Strategies Fund |
| Absolute Capital Opportunities Fund |
| Absolute Convertible Arbitrage Fund |
| Absolute Flexible Fund |
| Semi-Annual Report |
| September 30, 2023 |
| Fund Adviser: |
| Absolute Investment Advisers, LLC |
| 82 S. Barrett Square, Unit 4G |
| Rosemary Beach, FL 32461 |
| 1-888-992-2765 |
Absolute Strategies Fund
Investment Results (Unaudited)
Average Annual Total Returns* as of September 30, 2023
| Six Months | One Year | Five Year | Ten Year | ||||
| Absolute Strategies Fund Institutional Shares | -4.47% | -12.01% | -3.01% | -2.57% | |||
| S&P 500 Index(a) | 5.18% | 21.62% | 9.92% | 11.91% | |||
| Bloomberg U.S. Aggregate Bond Index(b) | -4.05% | 0.64% | 0.10% | 1.13% | |||
| HFRX Global Hedge Fund Index(c) | 1.39% | 1.55% | 1.94% | 1.48% | |||
| MSCI World Index(d) | 3.13% | 21.95% | 7.26% | 8.26% |
Total annual operating expenses, which include acquired fund fees and expenses of 0.66%, as disclosed in the Absolute Strategies Fund (the “Fund”) prospectus dated September 5, 2023, were 2.81% of the Fund’s average daily net assets (2.25% after fee waivers/expense reimbursements by Absolute Investment Advisers LLC (the “Adviser” or “Absolute”)). Additional information pertaining to the expense ratios as of September 30, 2023 can be found in the financial highlights. The Adviser has contractually agreed to waive its management fee and/or reimburse certain operating expenses, but only to the extent necessary so that the Fund’s total annual operating expenses, excluding portfolio transaction and other investment-related costs (including brokerage fees and commissions); taxes; borrowing costs (such as interest and dividend expenses on securities sold short); acquired fund fees and expenses; fees and expenses associated with investments in other collective investment vehicles or derivative instruments (including for example option and swap fees and expenses); any administrative and/or shareholder servicing fees payable pursuant to a plan adopted by the Board; expenses incurred in connection with any merger or reorganization; extraordinary expenses (such as litigation expenses, indemnification of Trust officers and Trustees and contractual indemnification of Fund service providers); and other expenses that the Trustees agree have not been incurred in the ordinary course of the Fund’s business, do not exceed 1.79% through July 31, 2025 (the “Expense Cap”). This Expense Cap may not be terminated prior to this date except by the Board of Trustees upon sixty (60) days’ written notice to Absolute. Absolute may recoup from the Fund fees waived (other than advisory fees waived by Absolute related to the Fund’s investments in other pooled vehicles sponsored by Absolute) and expenses reimbursed by Absolute pursuant to the Expense Cap in the three years following the date the particular waiver/expense payment occurred in connection with the Fund or the Predecessor Fund, but only if such recoupment can be achieved without exceeding the annual expense limitation in effect at the time of the waiver/expense payment and any expense limitation in effect at the time of the recoupment. Absolute has contractually agreed to waive its investment advisory fees related to any Fund assets invested in pooled vehicles sponsored by Absolute.
The performance quoted represents past performance, which does not guarantee future results. The investment return and principal value of an investment will fluctuate so that an investor’s shares, when redeemed, may be worth more or less than their original cost. The returns shown do not reflect deduction of taxes that a shareholder would pay on Fund distributions or the redemption of Fund shares. Current performance of the Fund may be lower or higher than the performance quoted. The Fund’s investment objectives, risks, charges and expenses should be considered carefully before investing. Performance data current to the most recent month-end may be obtained by calling (888) 992-2765.
| * | Return figures reflect any change in price per share and assume the reinvestment of all distributions. The Fund’s returns reflect any fee reductions during the applicable period. If such fee reductions had not occurred, the quoted performance would have been lower. Total Returns for periods less than one year are not annualized. The Fund acquired all of the assets and liabilities of the Absolute Capital Opportunities Fund, a series of Forum Funds (the “Predecessor Fund”), in a tax-free reorganization on September 8, 2023. In connection with this acquisition, shares of the Predecessor Fund’s Institutional Class shares were exchanged for Institutional Class shares of the Fund. The Predecessor Fund had an investment objective and strategies that were, in all material respects, the same as those of the Fund, and was managed in a manner that, in all material respects, |
1
Absolute Strategies Fund
Investment Results (Unaudited) (continued)
complied with the investment guidelines and restrictions of the Fund. The Fund’s performance for periods prior to September 11, 2023 is that of the Predecessor Fund. The Fund is a continuation of the Predecessor Fund, and therefore, the performance information includes the performance of the Predecessor Fund.
| (a) | The S&P 500 Index is a widely recognized unmanaged, market-capitalization weighted index of 500 leading publicly traded companies in the U.S. and is representative of a broader domestic equity market and range of securities than is found in the Fund’s portfolio. Index returns assume reinvestment of dividends and do not reflect any fees or expenses. An individual cannot invest directly in an index. However, an individual may be able to invest in exchange traded funds or other investment vehicles that attempt to track the performance of an index. |
| (b) | The Bloomberg U.S. Aggregate Bond Index is an unmanaged index comprised of U.S. investment grade, fixed rate bond market securities, including government, government agency, corporate and mortgage-backed securities between one and ten years. Index returns assume reinvestment of dividends. An individual cannot invest directly in an index. However, an individual may be able to invest in exchange traded funds or other investment vehicles that attempt to track the performance of an index. |
| (c) | The HFRX Global Hedge Fund Index is designed to be representative of the overall composition of the hedge fund universe. It is comprised of all eligible hedge fund strategies, including but not limited to convertible arbitrage, distressed securities, equity hedge, equity market neutral, event driven, macro, merger arbitrage, and relative value arbitrage. An individual cannot invest directly in an index. However, an individual may be able to invest in exchange traded funds or other investment vehicles that attempt to track the performance of an index. |
| (d) | The MSCI World Index is an unmanaged index that is designed to capture large and mid-cap representation across 23 developed market countries, including securities listed on exchanges in the U.S., Europe, Canada, Australia, New Zealand, Israel and the Far East. An individual cannot invest directly in an index. However, an individual may be able to invest in exchange traded funds or other investment vehicles that attempt to track the performance of an index. |
You should consider the Fund’s investment objectives, risks, charges and expenses carefully before you invest. The Fund’s prospectus contains important information about the Fund’s investment objectives, potential risks, management fees, charges and expenses, and other information and should be read carefully before investing. You may obtain a current copy of the Fund’s prospectus or performance data current to the most recent month-end by calling (888) 992-2765.
2
Absolute Capital Opportunities Fund
Investment Results (Unaudited)
Average Annual Total Returns* as of September 30, 2023
| Since | |||||||
| Inception | |||||||
| Six Months | One Year | Five Year | 12/30/2015 | ||||
| Absolute Capital Opportunities Fund | 0.17% | -4.54% | 0.23% | 2.44% | |||
| HFRX Equity Hedge Index(a) | 2.36% | 4.94% | 3.46% | 3.35% | |||
| S&P 500 Index(b) | 5.18% | 21.62% | 9.92% | 11.93% |
Total annual operating expenses, which include acquired fund fees and expenses of 0.08%, as disclosed in the Absolute Capital Opportunities Fund (the “Fund”) prospectus dated September 5, 2023, were 1.79% of the Fund’s average daily net assets (1.62% after fee waivers/expense reimbursements by Absolute Investment Advisers LLC (the “Adviser” or “Absolute”)). Additional information pertaining to the expense ratios as of September 30, 2023 can be found in the financial highlights. The Adviser has contractually agreed to waive its management fee and/or reimburse certain operating expenses, but only to the extent necessary so that the Fund’s total annual operating expenses, excluding portfolio transaction and other investment-related costs (including brokerage fees and commissions); taxes; borrowing costs (such as interest and dividend expenses on securities sold short); acquired fund fees and expenses; fees and expenses associated with investments in other collective investment vehicles or derivative instruments (including for example option and swap fees and expenses); any administrative and/or shareholder servicing fees payable pursuant to a plan adopted by the Board; expenses incurred in connection with any merger or reorganization; extraordinary expenses (such as litigation expenses, indemnification of Trust officers and Trustees and contractual indemnification of Fund service providers); and other expenses that the Trustees agree have not been incurred in the ordinary course of the Fund’s business, does not exceed 1.48% through July 31, 2025 (the “Expense Cap”). The Expense Cap may not be terminated prior to this date except by the Board of Trustees upon sixty (60) days’ written notice to Absolute. Absolute may recoup from the Fund fees waived (other than advisory fees waived by Absolute related to the Fund’s investments in other pooled vehicles sponsored by Absolute) and expenses reimbursed by Absolute pursuant to the Expense Cap in the three years following the date the particular waiver/expense payment occurred in connection with the Fund or the Predecessor Fund, but only if such recoupment can be achieved without exceeding the annual expense limitation in effect at the time of the waiver/expense payment and any expense limitation in effect at the time of the recoupment. Absolute has contractually agreed to waive its investment advisory fees related to any Fund assets invested in pooled vehicles sponsored by Absolute.
The performance quoted represents past performance, which does not guarantee future results. The investment return and principal value of an investment will fluctuate so that an investor’s shares, when redeemed, may be worth more or less than their original cost. The returns shown do not reflect deduction of taxes that a shareholder would pay on Fund distributions or the redemption of Fund shares. Current performance of the Fund may be lower or higher than the performance quoted. The Fund’s investment objectives, risks, charges and expenses should be considered carefully before investing. Performance data current to the most recent month-end may be obtained by calling (888) 992-2765.
| * | Return figures reflect any change in price per share and assume the reinvestment of all distributions. The Fund’s returns reflect any fee reductions during the applicable period. If such fee reductions had not occurred, the quoted performance would have been lower. Total Returns for periods less than one year are not annualized. The Fund acquired all of the assets and liabilities of the Absolute Capital Opportunities Fund, a series of Forum Funds (the “Predecessor Fund”), in a tax-free reorganization on September 8, 2023. In connection with this acquisition, shares of the Predecessor Fund’s Institutional Class shares were exchanged for Institutional Class shares of the Fund. The Predecessor Fund had an investment objective and strategies that were, in all material respects, the same as those of the Fund, and was managed in a manner that, in all material respects, complied with the investment guidelines and restrictions of the Fund. The Fund’s performance for periods |
3
Absolute Capital Opportunities Fund
Investment Results (Unaudited) (continued)
prior to September 11, 2023 is that of the Predecessor Fund. The Fund is a continuation of the Predecessor Fund, and therefore, the performance information includes the performance of the Predecessor Fund.
| (a) | The HFRX Equity Hedge Index is an unmanaged index designed to measure daily performance representative of long-short equity hedge funds. Hedge Fund Research, Inc. is the established global leader in the indexation, analysis and research of the hedge fund industry. With over 150 indices ranging from broad composites down to specific, niche areas of sub-strategy and regional investment focus, the HFRX Indices are considered the industry standard benchmarks of hedge fund performance. The HFRX branded indices are daily indices utilizing a rigorous quantitative selection process to represent the larger hedge fund universe. The index includes the reinvestment of dividends and does not reflect deduction of expenses. An individual cannot invest directly in an index. However, an individual may be able to invest in exchange traded funds or other investment vehicles that attempt to track the performance of an index. |
| (b) | The S&P 500 Index is a widely recognized unmanaged, market-capitalization weighted index of 500 leading publicly traded companies in the U.S. and is representative of a broader domestic equity market and range of securities than is found in the Fund’s portfolio. Index returns assume reinvestment of dividends and do not reflect any fees or expenses. An individual cannot invest directly in an index. However, an individual may be able to invest in exchange traded funds or other investment vehicles that attempt to track the performance of an index. |
You should consider the Fund’s investment objectives, risks, charges and expenses carefully before you invest. The Fund’s prospectus contains important information about the Fund’s investment objectives, potential risks, management fees, charges and expenses, and other information and should be read carefully before investing. You may obtain a current copy of the Fund’s prospectus or performance data current to the most recent month-end by calling (888) 992-2765.
4
Absolute Convertible Arbitrage Fund
Investment Results (Unaudited)
Average Annual Total Returns* as of September 30, 2023
| Since | ||||||||||
| Inception | ||||||||||
| Six Months | One Year | Five Year | Ten Year | 2/25/2021 | ||||||
| Absolute Convertible Arbitrage Fund - Institutional Shares | 2.36% | 5.70% | 4.24% | 4.08% | N/A | |||||
| Absolute Convertible Arbitrage Fund - Investor Shares | 2.24% | 5.41% | N/A | N/A | 1.38% | |||||
| HFRX Fixed Income Convertible Arbitrage Index(a) | 2.92% | 2.50% | 2.50% | 1.70% | -3.12% | |||||
| Bloomberg U.S. Aggregate Bond Index(b) | -4.05% | 0.64% | 0.10% | 1.13% | -5.14% | |||||
| iBoxx High Yield Index(c) | 3.22% | 2.45% | 2.45% | 3.62% | -0.90% | |||||
| S&P 500 Index(d) | 5.18% | 21.62% | 9.92% | 11.91% | 6.10% |
Total annual operating expenses, which include acquired fund fees and expenses of 0.02%, as disclosed in the Absolute Convertible Arbitrage Fund (the “Fund”) prospectus dated September 5, 2023, were 1.33% and 1.58% of the average daily net assets of the Fund’s Institutional Class Shares and Investor Class Shares, respectively (1.35% and 1.60% after recoupment of fee waivers/expense reimbursements by Absolute Investment Advisers LLC (the “Adviser”)). Additional information pertaining to the expense ratios as of September 30, 2023 can be found in the financial highlights. The Adviser has contractually agreed to waive its management fee and/or reimburse certain operating expenses, but only to the extent necessary so that the Fund’s total annual operating expenses, excluding portfolio transaction and other investment-related costs (including brokerage fees and commissions); taxes; borrowing costs (such as interest and dividend expenses on securities sold short); acquired fund fees and expenses; fees and expenses associated with investments in other collective investment vehicles or derivative instruments (including for example option and swap fees and expenses); any administrative and/or shareholder servicing fees payable pursuant to a plan adopted by the Board; expenses incurred in connection with any merger or reorganization; extraordinary expenses (such as litigation expenses, indemnification of Trust officers and Trustees and contractual indemnification of Fund service providers); and other expenses that the Trustees agree have not been incurred in the ordinary course of the Fund’s business, do not exceed 1.20% and 1.45% of the Institutional Shares and Investor Shares, respectively, through July 31, 2025 (the “Expense Cap”). The Expense Cap may not be terminated prior to this date except by the Board of Trustees upon sixty (60) days’ written notice to Absolute. Absolute may recoup from the Fund fees waived (other than management fees waived by Absolute related to the Fund’s investments in other pooled vehicles sponsored by Absolute) and expenses pursuant to the Expense Cap in the three years following the date the particular waiver/expense payment occurred in connection with the Fund or the Predecessor Fund, but only if such recoupment can be achieved without exceeding the annual expense limitation in effect at the time of the waiver/expense payment and any expense limitation in effect at the time of the recoupment. Absolute has contractually agreed to waive its investment advisory fees related to any Fund assets invested in pooled vehicles sponsored by Absolute.
The performance quoted represents past performance, which does not guarantee future results. The investment return and principal value of an investment will fluctuate so that an investor’s shares, when redeemed, may be worth more or less than their original cost. The returns shown do not reflect deduction of taxes that a shareholder would pay on Fund distributions or the redemption of Fund shares. Current performance of the Fund may be lower or higher than the performance quoted. The Fund’s investment objectives, risks, charges and expenses should be considered carefully before investing. Performance data current to the most recent month-end may be obtained by calling (888) 992-2765.
5
Absolute Convertible Arbitrage Fund
Investment Results (Unaudited) (continued)
| * | Return figures reflect any change in price per share and assume the reinvestment of all distributions. The Fund’s returns reflect any fee reductions during the applicable period. If such fee reductions had not occurred, the quoted performance would have been lower. Total Returns for periods less than one year are not annualized. The Fund acquired all of the assets and liabilities of the Absolute Convertible Arbitrage Fund, a series of Forum Funds (the “Predecessor Fund”), in a tax-free reorganization on September 8, 2023. In connection with this acquisition, shares of the Predecessor Fund’s Investor Class and Institutional Class shares were exchanged for Investor Class and Institutional Class shares of the Fund, respectively. The Predecessor Fund had an investment objective and strategies that were, in all material respects, the same as those of the Fund, and was managed in a manner that, in all material respects, complied with the investment guidelines and restrictions of the Fund. The Fund’s performance for periods prior to September 11, 2023 is that of the Predecessor Fund. The Fund is a continuation of the Predecessor Fund, and therefore, the performance information includes the performance of the Predecessor Fund. |
| (a) | HFRX Fixed Income Convertible Arbitrage Index is designed to reflect the performance of the hedge fund universe employing convertible arbitrage strategies. The index selects constituents which exhibit strategies in which the investment thesis is predicated on realization of a spread between related instruments in which one or multiple components of the spread is a convertible fixed income instrument. Strategies employ an investment process designed to isolate attractive opportunities between the price of a convertible security and the price of a non-convertible security, typically of the same issuer An individual cannot invest directly in an index. However, an individual may be able to invest in exchange traded funds or other investment vehicles that attempt to track the performance of an index. |
| (b) | The Bloomberg U.S. Aggregate Bond Index is an unmanaged index comprised of U.S. investment grade, fixed rate bond market securities, including government, government agency, corporate and mortgage-backed securities between one and ten years. Index returns assume reinvestment of dividends. An individual cannot invest directly in an index. However, an individual may be able to invest in exchange traded funds or other investment vehicles that attempt to track the performance of an index. |
| (c) | The iBoxx High Yield Index consists of liquid USD high yield bonds, selected to provide a balanced representation of the broad USD high yield corporate bond universe. An individual cannot invest directly in an index. However, an individual may be able to invest in exchange traded funds or other investment vehicles that attempt to track the performance of an index. |
| (d) | The S&P 500 Index is a widely recognized unmanaged, market-capitalization weighted index of 500 leading publicly traded companies in the U.S. and is representative of a broader domestic equity market and range of securities than is found in the Fund’s portfolio. Index returns assume reinvestment of dividends and do not reflect any fees or expenses. An individual cannot invest directly in an index. However, an individual may be able to invest in exchange traded funds or other investment vehicles that attempt to track the performance of an index. |
You should consider the Fund’s investment objectives, risks, charges and expenses carefully before you invest. The Fund’s prospectus contains important information about the Fund’s investment objectives, potential risks, management fees, charges and expenses, and other information and should be read carefully before investing. You may obtain a current copy of the Fund’s prospectus or performance data current to the most recent month-end by calling (888) 992-2765.
6
Absolute Flexible Fund
Investment Results (Unaudited)
Average Annual Total Returns* as of September 30, 2023
| Since | |||||
| Inception | |||||
| Six Months | One Year | 6/30/2022 | |||
| Absolute Flexible Fund | 1.41% | 7.83% | 5.44% | ||
| Bloomberg U.S. Aggregate Bond Index(a) | -4.05% | 0.64% | -3.32% | ||
| S&P 500 Index(b) | 5.18% | 21.62% | 12.34% |
Total annual operating expenses, which include acquired fund fees and expenses of 0.02%, as disclosed in the Absolute Flexible Fund (the “Fund”) prospectus dated September 5, 2023, were 2.22% of the Fund’s average daily net assets (1.50% after fee waivers/expense reimbursements by Absolute Investment Advisers LLC (the “Adviser”)). Additional information pertaining to the expense ratios as of September 30, 2023 can be found in the financial highlights. The Adviser has contractually agreed to waive its management fee and/or reimburse certain operating expenses, but only to the extent necessary so that the Fund’s total annual operating expenses, excluding portfolio transaction and other investment-related costs (including brokerage fees and commissions); taxes; borrowing costs (such as interest and dividend expenses on securities sold short); acquired fund fees and expenses; fees and expenses associated with investments in other collective investment vehicles or derivative instruments (including for example option and swap fees and expenses); any administrative and/or shareholder servicing fees payable pursuant to a plan adopted by the Board; expenses incurred in connection with any merger or reorganization; extraordinary expenses (such as litigation expenses, indemnification of Trust officers and Trustees and contractual indemnification of Fund service providers); and other expenses that the Trustees agree have not been incurred in the ordinary course of the Fund’s business, do not exceed 1.48% through July 31, 2025 (the “Expense Cap”). The Expense Cap may not be terminated prior to this date except by the Board of Trustees upon sixty (60) days’ written notice to Absolute. Absolute may recoup from the Fund fees waived (other than advisory fees waived by Absolute related to the Fund’s investments in other pooled vehicles sponsored by Absolute) and expenses reimbursed by Absolute pursuant to the Expense Cap in the three years following the date the particular waiver/ expense payment occurred in connection with the Fund or the Predecessor Fund, but only if such recoupment can be achieved without exceeding the annual expense limitation in effect at the time of the waiver/expense payment and any expense limitation in effect at the time of the recoupment. Absolute has contractually agreed to waive its investment advisory fees related to any Fund assets invested in pooled vehicles sponsored by Absolute.
The performance quoted represents past performance, which does not guarantee future results. The investment return and principal value of an investment will fluctuate so that an investor’s shares, when redeemed, may be worth more or less than their original cost. The returns shown do not reflect deduction of taxes that a shareholder would pay on Fund distributions or the redemption of Fund shares. Current performance of the Fund may be lower or higher than the performance quoted. The Fund’s investment objectives, risks, charges and expenses should be considered carefully before investing. Performance data current to the most recent month-end may be obtained by calling (888) 992-2765.
| * | Return figures reflect any change in price per share and assume the reinvestment of all distributions. The Fund’s returns reflect any fee reductions during the applicable period. If such fee reductions had not occurred, the quoted performance would have been lower. Total Returns for periods less than one year are not annualized. The Fund acquired all of the assets and liabilities of the Absolute Flexible Fund, a series of Forum Funds (the “Predecessor Fund”), in a tax-free reorganization on September 8, 2023. In connection with this acquisition, shares of the Predecessor Fund’s Institutional Class shares were exchanged for Institutional Class shares of the Fund. The Predecessor Fund had an investment objective and strategies that were, in all material respects, the same as those of the Fund, and was managed in a manner that, in all material respects, complied with the investment guidelines and restrictions of the Fund. The Fund’s performance for periods prior to September 11, 2023 is that of the Predecessor Fund. The Fund is a continuation of the Predecessor Fund, and therefore, the performance information includes the performance of the Predecessor Fund. |
7
Absolute Flexible Fund
Investment Results (Unaudited) (continued)
| (a) | The Bloomberg U.S. Aggregate Bond Index is an unmanaged index comprised of U.S. investment grade, fixed rate bond market securities, including government, government agency, corporate and mortgage-backed securities between one and ten years. Index returns assume reinvestment of dividends. An individual cannot invest directly in an index. However, an individual may be able to invest in exchange traded funds or other investment vehicles that attempt to track the performance of an index. |
| (b) | The S&P 500 Index is a widely recognized unmanaged, market-capitalization weighted index of 500 leading publicly traded companies in the U.S. and is representative of a broader domestic equity market and range of securities than is found in the Fund’s portfolio. Index returns assume reinvestment of dividends and do not reflect any fees or expenses. An individual cannot invest directly in an index. However, an individual may be able to invest in exchange traded funds or other investment vehicles that attempt to track the performance of an index. |
You should consider the Fund’s investment objectives, risks, charges and expenses carefully before you invest. The Fund’s prospectus contains important information about the Fund’s investment objectives, potential risks, management fees, charges and expenses, and other information and should be read carefully before investing. You may obtain a current copy of the Fund’s prospectus or performance data current to the most recent month-end by calling (888) 992-2765.
8
Fund Holdings (Unaudited)
Absolute Strategies Fund Holdings as of September 30, 2023*
| * | As a percentage of net assets. |
The Fund’s investment objective is to achieve long-term capital appreciation with an emphasis on absolute (positive) returns and low sensitivity to traditional financial market indices, such as the S&P 500 Index.
Portfolio holdings are subject to change.
9
Fund Holdings (Unaudited) (continued)
Absolute Capital Opportunities Fund Holdings as of September 30, 2023*
| * | As a percentage of net assets. |
The Fund’s investment objective is to achieve long-term capital appreciation with a lower sensitivity to traditional financial market indices, such as the S&P 500 Index.
Portfolio holdings are subject to change.
10
Fund Holdings (Unaudited) (continued)
Absolute Convertible Arbitrage Fund Holdings as of September 30, 2023*
| * | As a percentage of net assets. |
The Fund’s investment objective is to achieve positive absolute returns over the long-term with low volatility when compared to traditional market indices.
Portfolio holdings are subject to change.
11
Fund Holdings (Unaudited) (continued)
Absolute Flexible Fund Holdings as of September 30, 2023*
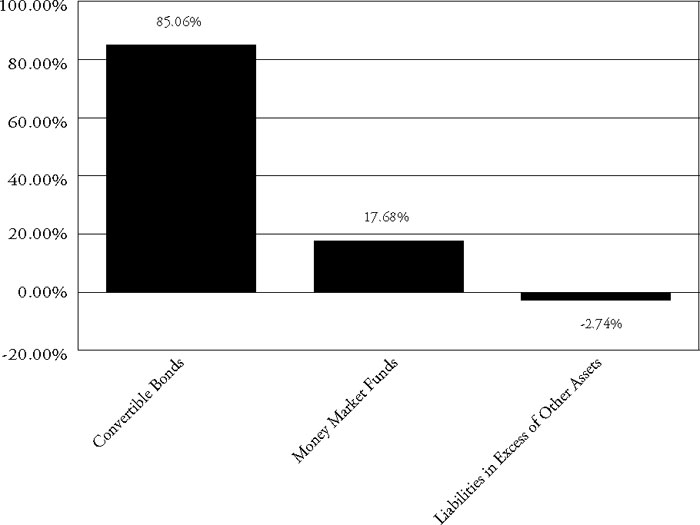
| * | As a percentage of net assets. |
The Fund’s investment objective is to achieve positive absolute returns over the long-term with low volatility when compared to traditional market indices.
Portfolio holdings are subject to change.
Availability of Portfolio Schedule (Unaudited)
The Funds file their complete schedule of portfolio holdings with the Securities and Exchange Commission (the “SEC”) for the first and third quarters of each fiscal year as an exhibit to their reports on Form N-PORT. The Funds’ Form N-PORT reports are available on the SEC’s website at www.sec.gov or on the Funds’ website at www.absoluteadvisers.com.
12
| Absolute Strategies Fund |
| Schedule of Investments |
| September 30, 2023 (Unaudited) |
| Shares | Fair Value | |||||||
| Mutual Funds — 61.25% | ||||||||
| Absolute Capital Opportunities Fund(a) | 689,579 | $ | 6,585,479 | |||||
| Absolute Flexible Fund(a) | 640,605 | 6,559,792 | ||||||
| Total Mutual Funds | ||||||||
| (Cost $13,361,850) | 13,145,271 | |||||||
| Exchange-Traded Funds — 5.60% | ||||||||
| Absolute Select Value ETF(a) | 39,364 | 1,076,810 | ||||||
| ETFMG Prime Junior Silver Miners ETF(b) | 2,000 | 16,960 | ||||||
| VanEck Vectors Gold Miners ETF | 4,000 | 107,640 | ||||||
| Total Exchange-Traded Funds | ||||||||
| (Cost $1,259,286) | 1,201,410 | |||||||
| Principal | ||||||||
| Amount | ||||||||
| Collateralized Mortgage Obligations — 0.56% | ||||||||
| Alternative Loan Trust 2005-50CB Pool | ||||||||
| #Series 2005-50CB, 5.50%, 11/25/2035(c) | $ | 8,432 | 6,704 | |||||
| Adjustable Rate Mortgage Trust 2006-1 Pool | ||||||||
| #Series 2006-1, 3.90%, 03/25/2036(c) | 10,033 | 8,119 | ||||||
| Adjustable Rate Mortgage Trust 2005-12 Pool | ||||||||
| #Series 2005-12, 4.10%, 03/25/2036(c) | 25,721 | 18,206 | ||||||
| Banc of America Funding 2006-E Trust Pool | ||||||||
| #Series 2006-E, 4.93%, 06/20/2036(c) | 6,189 | 5,556 | ||||||
| IndyMac INDX Mortgage Loan Trust 2006-AR25 Pool | ||||||||
| #Series 2006-AR25, 3.73%, 09/25/2036(c) | 27,642 | 18,547 | ||||||
| CitiMortgage Alternative Loan Trust Series 2006-A7 Pool | ||||||||
| #Series 2006-A7, 6.00%, 12/25/2036 | 24,899 | 20,981 | ||||||
| JP Morgan Mortgage Trust 2007-A2 Pool | ||||||||
| #Series 2007-A2, 3.87%, 04/25/2037(c) | 6,297 | 5,059 | ||||||
| CitiMortgage Alternative Loan Trust Series 2007-A4 Pool | ||||||||
| #Series 2007-A4, 5.75%, 04/25/2037 | 9,827 | 8,620 | ||||||
| Structured Adjustable Rate Mortgage Loan Pool | ||||||||
| #Series 2007-3, 4.20%, 04/25/2047(c) | 13,191 | 6,188 | ||||||
| Banc of America Funding 2007-E Trust Pool | ||||||||
| #Series 2007-E, 3.94%, 07/20/2047(c) | 13,646 | 12,806 | ||||||
| CHL Mortgage Pass-Through Trust 2007-HY5 Pool | ||||||||
| #Series 2007-HY5, 4.72%, 09/25/2047(c) | 12,176 | 9,224 | ||||||
| Total Collateralized Mortgage Obligations | ||||||||
| (Cost $101,003) | 120,010 | |||||||
See accompanying notes which are an integral part of these financial statements.
13
| Absolute Strategies Fund |
| Schedule of Investments (continued) |
| September 30, 2023 (Unaudited) |
| Number of | Notional | Exercise | Expiration | |||||||||||||
| Description | Contracts | Amount | Price | Date | Fair Value | |||||||||||
| Put Options Purchased — 0.48% | ||||||||||||||||
| Apple, Inc. | 400 | $ | 6,848,400 | $ | 160.00 | October 2023 | $ | 32,800 | ||||||||
| Pfizer, Inc. | 250 | 829,250 | 35.00 | January 2024 | 71,000 | |||||||||||
| Total Put Options Purchased | ||||||||||||||||
| (Cost $107,820) | 103,800 | |||||||||||||||
| Shares | ||||||||||||||||
| Money Market Funds — 18.73% | ||||||||||||||||
| First American Treasury Obligations Fund, Class X, 5.27%(d) | 4,020,154 | 4,020,154 | ||||||||||||||
| Total Money Market Funds | ||||||||||||||||
| (Cost $4,020,154) | 4,020,154 | |||||||||||||||
| Total Investments — 86.62% | ||||||||||||||||
| (Cost $18,850,113) | 18,590,645 | |||||||||||||||
| Other Assets in Excess of Liabilities — 13.38% | 2,872,763 | |||||||||||||||
| Net Assets — 100.00% | $ | 21,463,408 | ||||||||||||||
| (a) | Affiliated Company. |
| (b) | Non-income producing security. |
| (c) | Variable rate security, the interest rate of which adjusts periodically based on changes in current interest rates. Rate represented is as of September 30, 2023. |
| (d) | Rate disclosed is the seven day effective yield as of September 30, 2023. |
See accompanying notes which are an integral part of these financial statements.
14
| Absolute Strategies Fund |
| Schedule of Securities Sold Short |
| September 30, 2023 (Unaudited) |
| Shares | Fair Value | |||||||
| Common Stocks - Short — (1.75%) | ||||||||
| Consumer Discretionary — (1.75%) | ||||||||
| Tesla, Inc. | (1,500 | ) | $ | (375,330 | ) | |||
| Total Common Stocks — Short | ||||||||
| (Proceeds Received $338,972) | (375,330 | ) | ||||||
| Total Securities Sold Short — (1.75)% | ||||||||
| (Proceeds Received $338,972) | (375,330 | ) | ||||||
| Absolute Strategies Fund |
| Schedule of Futures Contract |
| September 30, 2023 (Unaudited) |
| Expiration | Notional | Value/Unrealized | ||||||||||
| Futures Contracts | Contracts | Date | Value | Appreciation | ||||||||
| Short Contracts | ||||||||||||
| CME E-Mini NASDAQ 100 Index Future | (25) | December 2023 | $ | (7,433,250 | ) | $ | 123,815 | |||||
| E-Mini S&P 500 Future | (15) | December 2023 | (3,244,125 | ) | 8,375 | |||||||
| Total Futures | 132,190 | |||||||||||
See accompanying notes which are an integral part of these financial statements.
15
| Absolute Capital Opportunities Fund |
| Schedule of Investments |
| September 30, 2023 (Unaudited) |
| Shares | Fair Value | |||||||
| Common Stocks — 88.90% | ||||||||
| Communications — 13.98% | ||||||||
| Activision Blizzard, Inc.(c) | 6,472 | $ | 605,973 | |||||
| Alphabet, Inc., Class C(a) | 9,395 | 1,238,731 | ||||||
| Alphabet, Inc., Class A(a) | 18,903 | 2,473,646 | ||||||
| Charter Communications, Inc., Class A(a) | 4,846 | 2,131,368 | ||||||
| Liberty Media Corp.-Liberty SiriusXM(a) | 3,942 | 100,324 | ||||||
| Meta Platforms, Inc., Class A(a)(c) | 10,396 | 3,120,983 | ||||||
| Paramount Global, Class B | 15,134 | 195,229 | ||||||
| Spark Networks SE - ADR(a) | 3,667 | 477 | ||||||
| Spotify Technology SA(a) | 4,315 | 667,272 | ||||||
| Warner Bros. Discovery, Inc.(a) | 35,556 | 386,138 | ||||||
| 10,920,141 | ||||||||
| Consumer Discretionary — 16.95% | ||||||||
| Alibaba Group Holding Ltd. - ADR(a) | 2,632 | 228,299 | ||||||
| Amazon.com, Inc.(a)(c) | 21,474 | 2,729,775 | ||||||
| CarMax, Inc.(a) | 26,189 | 1,852,348 | ||||||
| Carvana Co.(a) | 1,000 | 41,980 | ||||||
| Fisker, Inc.(a) | 9,973 | 64,027 | ||||||
| General Motors Co.(c) | 84,318 | 2,779,964 | ||||||
| Gildan Activewear, Inc. | 45,054 | 1,261,963 | ||||||
| Hasbro, Inc. | 19,068 | 1,261,157 | ||||||
| Las Vegas Sands Corp. | 23,077 | 1,057,850 | ||||||
| Liberty Media Corp.-Liberty Live(a) | 985 | 31,441 | ||||||
| Lowe’s Companies, Inc. | 6,995 | 1,453,841 | ||||||
| MGM Resorts International(c) | 9,247 | 339,920 | ||||||
| Tapestry, Inc.(c) | 4,770 | 137,137 | ||||||
| 13,239,702 | ||||||||
| Consumer Staples — 6.61% | ||||||||
| Diageo PLC - ADR | 8,137 | 1,213,878 | ||||||
| Dollar Tree, Inc.(a) | 13,754 | 1,464,113 | ||||||
| Philip Morris International, Inc.(c) | 26,894 | 2,489,846 | ||||||
| 5,167,837 | ||||||||
| Energy — 6.30% | ||||||||
| Berkshire Hathaway, Inc., Class B(a) | 7,143 | 2,502,193 | ||||||
| EOG Resources, Inc. | 7,759 | 983,531 | ||||||
| Occidental Petroleum Corp. | 14,363 | 931,871 | ||||||
| Pioneer Natural Resources Co. | 2,190 | 502,715 | ||||||
| 4,920,310 | ||||||||
| Financials — 13.43% | ||||||||
| AerCap Holdings NV(a) | 2,795 | 175,163 | ||||||
| American Express Co. | 11,385 | 1,698,528 | ||||||
| Aon PLC, Class A | 2,815 | 912,679 | ||||||
| Bank of America Corp. | 24,346 | 666,594 | ||||||
| Charles Schwab Corp. (The)(c) | 40,543 | 2,225,811 | ||||||
| Intercontinental Exchange, Inc. | 14,664 | 1,613,333 | ||||||
See accompanying notes which are an integral part of these financial statements.
16
| Absolute Capital Opportunities Fund |
| Schedule of Investments (continued) |
| September 30, 2023 (Unaudited) |
| Shares | Fair Value | |||||||
| Common Stocks — 88.90% (continued) | ||||||||
| Financials — 13.43% (continued) | ||||||||
| JPMorgan Chase & Co. | 12,404 | $ | 1,798,828 | |||||
| Morgan Stanley(c) | 2,000 | 163,340 | ||||||
| PPG Industries, Inc. | 9,499 | 1,232,970 | ||||||
| 10,487,246 | ||||||||
| Health Care — 4.36% | ||||||||
| Becton, Dickinson and Co. | 9,958 | 2,574,441 | ||||||
| Bristol-Myers Squibb Co. | 3,700 | 214,748 | ||||||
| CVS Health Corp. | 8,790 | 613,718 | ||||||
| 3,402,907 | ||||||||
| Industrials — 7.65% | ||||||||
| Hayward Holdings, Inc.(a) | 43,889 | 618,835 | ||||||
| Jacobs Solutions, Inc. | 16,677 | 2,276,411 | ||||||
| Keysight Technologies, Inc.(a) | 9,266 | 1,225,984 | ||||||
| PACCAR, Inc. | 21,791 | 1,852,671 | ||||||
| 5,973,901 | ||||||||
| Technology — 19.62% | ||||||||
| Analog Devices, Inc. | 11,407 | 1,997,251 | ||||||
| Apple, Inc. | 22,380 | 3,831,680 | ||||||
| Arista Networks, Inc.(a) | 5,845 | 1,075,071 | ||||||
| Autodesk, Inc.(a) | 5,820 | 1,204,216 | ||||||
| Motorola Solutions, Inc. | 5,796 | 1,577,903 | ||||||
| PayPal Holdings, Inc.(a) | 3,572 | 208,819 | ||||||
| Salesforce, Inc.(a) | 8,584 | 1,740,664 | ||||||
| Splunk, Inc.(a) | 9,245 | 1,352,081 | ||||||
| Visa, Inc., Class A | 10,167 | 2,338,512 | ||||||
| 15,326,197 | ||||||||
| Total Common Stocks | ||||||||
| (Cost $56,782,319) | 69,438,241 | |||||||
| Number of | Notional | Exercise | Expiration | |||||||||||||
| Description | Contracts | Amounts | Price | Date | Fair Value | |||||||||||
| Call Options Purchased — 0.34% | ||||||||||||||||
| Alibaba Group Holding Ltd. | 19 | $ | 164,806 | $ | 180.00 | January 2024 | 133 | |||||||||
| Charles Schwab Corp. (The) | 17 | 93,330 | 60.00 | June 2024 | 8,007 | |||||||||||
| Charles Schwab Corp. (The) | 377 | 2,069,730 | 70.00 | December 2023 | 7,540 | |||||||||||
| General Motors Co. | 564 | 1,859,508 | 45.00 | January 2024 | 8,460 | |||||||||||
| General Motors Co. | 593 | 1,955,121 | 48.00 | January 2024 | 4,744 | |||||||||||
| SPDR S&P 500 ETF Trust | 1,500 | 64,122,000 | 470.00 | January 2024 | 237,000 | |||||||||||
| Total Call Options Purchased | ||||||||||||||||
| (Cost $1,066,914) | 265,884 | |||||||||||||||
See accompanying notes which are an integral part of these financial statements.
17
| Absolute Capital Opportunities Fund |
| Schedule of Investments (continued) |
| September 30, 2023 (Unaudited) |
| Number of | Notional | Exercise | Expiration | |||||||||||||
| Description | Contracts | Amounts | Price | Date | Fair Value | |||||||||||
| Put Options Purchased — 3.88% | ||||||||||||||||
| SPDR S&P 500 ETF Trust | 1,457 | $ | 62,283,836 | $ | 360.00 | October 2023 | $ | 729 | ||||||||
| SPDR S&P 500 ETF Trust | 2,186 | 93,447,128 | 380.00 | October 2023 | 2,186 | |||||||||||
| SPDR S&P 500 ETF Trust | 546 | 23,340,408 | 395.00 | October 2023 | 546 | |||||||||||
| SPDR S&P 500 ETF Trust | 1,500 | 64,122,000 | 360.00 | January 2024 | 320,250 | |||||||||||
| SPDR S&P 500 ETF Trust | 2,250 | 96,183,000 | 395.00 | January 2024 | 1,173,375 | |||||||||||
| SPDR S&P 500 ETF Trust | 1,500 | 64,122,000 | 420.00 | January 2024 | 1,537,500 | |||||||||||
| Total Put Options Purchased | ||||||||||||||||
| (Cost $3,960,609) | 3,034,586 | |||||||||||||||
| Shares | ||||||||||||||||
| Money Market Funds — 14.33% | ||||||||||||||||
| First American Treasury Obligations Fund, Class X, 5.27%(b) | 11,192,452 | 11,192,452 | ||||||||||||||
| Total Money Market Funds | ||||||||||||||||
| (Cost $11,192,452) | 11,192,452 | |||||||||||||||
| Total Investments — 107.45% | ||||||||||||||||
| (Cost $73,002,294) | 83,931,163 | |||||||||||||||
| Liabilities in Excess of Other Assets — (7.45)% | (5,822,051 | ) | ||||||||||||||
| Net Assets — 100.00% | $ | 78,109,112 | ||||||||||||||
| (a) | Non-income producing security. |
| (b) | Rate disclosed is the seven day effective yield as of September 30, 2023. |
| (c) | All or a portion of this security is held as collateral for written options. |
See accompanying notes which are an integral part of these financial statements.
18
| Absolute Capital Opportunities Fund |
| Schedule of Written Options |
| September 30, 2023 (Unaudited) |
| Number of | Notional | Exercise | Expiration | |||||||||||||
| Description | Contracts | Amounts | Price | Date | Fair Value | |||||||||||
| Written Call Options — (8.50)% | ||||||||||||||||
| Activision Blizzard, Inc. | (49) | $ | (458,787 | ) | $ | 95.00 | January 2024 | $ | (490 | ) | ||||||
| Meta Platforms, Inc. | (24) | (720,504 | ) | 300.00 | September 2024 | (129,240 | ) | |||||||||
| Morgan Stanley | (20) | (163,340 | ) | 100.00 | June 2024 | (3,200 | ) | |||||||||
| SPDR S&P 500 ETF Trust | (1,457) | (62,283,836 | ) | 400.00 | March 2024 | (6,509,877 | ) | |||||||||
| Total Written Call Options | ||||||||||||||||
| (Premiums Received $9,126,061) | (6,642,807 | ) | ||||||||||||||
| Written Put Options — (1.63)% | ||||||||||||||||
| Amazon.com, Inc. | (14) | (177,968 | ) | 85.00 | January 2024 | (679 | ) | |||||||||
| Charles Schwab Corp. (The) | (11) | (60,390 | ) | 55.00 | June 2024 | (6,325 | ) | |||||||||
| Charles Schwab Corp. (The) | (65) | (356,850 | ) | 60.00 | June 2024 | (54,600 | ) | |||||||||
| General Motors Co. | (185) | (609,945 | ) | 40.00 | June 2025 | (166,500 | ) | |||||||||
| Meta Platforms, Inc. | (28) | (840,588 | ) | 95.00 | January 2024 | (168 | ) | |||||||||
| MGM Resorts International | (37) | (136,012 | ) | 45.00 | June 2024 | (33,855 | ) | |||||||||
| Philip Morris International, Inc. | (36) | (333,288 | ) | 85.00 | June 2024 | (12,240 | ) | |||||||||
| SPDR S&P 500 ETF Trust | (3,639) | (155,559,972 | ) | 370.00 | October 2023 | (3,639 | ) | |||||||||
| SPDR S&P 500 ETF Trust | (3,375) | (144,274,500 | ) | 370.00 | January 2024 | (921,375 | ) | |||||||||
| Tapestry, Inc. | (95) | (273,125 | ) | 35.00 | September 2024 | (75,050 | ) | |||||||||
| Total Written Put Options | ||||||||||||||||
| (Premiums Received $2,588,247) | (1,274,431 | ) | ||||||||||||||
See accompanying notes which are an integral part of these financial statements.
19
| Absolute Convertible Arbitrage Fund |
| Schedule of Investments |
| September 30, 2023 (Unaudited) |
| Shares | Fair Value | |||||||
| Mutual Funds — 1.61% | ||||||||
| Absolute Flexible Fund(a) | 1,858,129 | $ | 19,027,240 | |||||
| Total Mutual Funds | ||||||||
| (Cost $18,732,198) | 19,027,240 | |||||||
| Principal | ||||||||
| Amount | ||||||||
| Convertible Bonds — 81.84% | ||||||||
| Communications — 2.06% | ||||||||
| Fiverr International Ltd., 0.00%, 11/1/2025 | $ | 6,000,000 | 5,231,400 | |||||
| Magnite, Inc., 0.25%, 3/15/2026 | 6,500,000 | 5,658,641 | ||||||
| TechTarget, Inc., 0.00%, 12/15/2026 | 8,000,000 | 6,440,978 | ||||||
| Upwork, Inc., 0.25%, 8/15/2026 | 8,640,000 | 7,132,513 | ||||||
| 24,463,532 | ||||||||
| Consumer Discretionary — 11.65% | ||||||||
| Carnival Corp, 5.75%, 12/1/2027(b) | 5,160,000 | 6,914,400 | ||||||
| Chegg, Inc., 0.00%, 9/1/2026 | 7,200,000 | 5,670,000 | ||||||
| Cracker Barrel Old Country Store, Inc., 0.63%, 6/15/2026 | 10,339,000 | 8,587,832 | ||||||
| Fisker, Inc., 2.50%, 9/15/2026(b) | 5,500,000 | 2,863,300 | ||||||
| Freshpet, Inc., 3.00%, 4/1/2028(b) | 7,000,000 | 8,307,250 | ||||||
| Guess?, Inc., 3.75%, 4/15/2028 | 6,750,000 | 7,079,400 | ||||||
| indie Semiconductor, Inc., 4.50%, 11/15/2027(b) | 5,900,000 | 6,094,700 | ||||||
| LCI Industries, 1.13%, 5/15/2026 | 7,210,000 | 6,734,140 | ||||||
| Live Nation Entertainment, Inc., 3.13%, 1/15/2029(b) | 9,379,000 | 9,749,470 | ||||||
| Lucid Group, Inc., 1.25%, 12/15/2026(b) | 2,000,000 | 1,213,500 | ||||||
| Luminar Technologies, Inc., 1.25%, 12/15/2026(b) | 10,000,000 | 6,620,000 | ||||||
| Marriott Vacations Worldwide Corp., 3.25%, 12/15/2027(b) | 6,000,000 | 5,250,000 | ||||||
| NCL Corp Ltd., 1.13%, 2/15/2027 | 8,175,000 | 6,805,688 | ||||||
| NCL Corp Ltd., 2.50%, 2/15/2027 | 1,250,000 | 1,083,750 | ||||||
| Patrick Industries, Inc., 1.75%, 12/1/2028 | 10,949,000 | 10,385,127 | ||||||
| Royal Caribbean Cruises Ltd., 6.00%, 8/15/2025(b) | 2,500,000 | 4,941,250 | ||||||
| Stride, Inc., 1.13%, 9/1/2027 | 8,502,000 | 8,973,861 | ||||||
| Topgolf Callaway Brands Corp., 2.75%, 5/1/2026 | 7,409,000 | 7,723,883 | ||||||
| Virgin Galactic Holdings, Inc., 2.50%, 2/1/2027(b) | 2,000,000 | 750,000 | ||||||
| Wayfair, Inc., 3.25%, 9/15/2027 | 10,000,000 | 12,090,000 | ||||||
| Winnebago Industries, Inc., 1.50%, 4/1/2025 | 9,096,000 | 10,214,808 | ||||||
| 138,052,359 | ||||||||
| Consumer Staples — 1.77% | ||||||||
| Chefs’ Warehouse, Inc. (The), 2.38%, 12/15/2028(b) | 7,500,000 | 6,102,750 | ||||||
| MGP Ingredients, Inc., 1.88%, 11/15/2041 | 12,000,000 | 14,784,000 | ||||||
| 20,886,750 | ||||||||
See accompanying notes which are an integral part of these financial statements.
20
| Absolute Convertible Arbitrage Fund |
| Schedule of Investments (continued) |
| September 30, 2023 (Unaudited) |
| Principal | ||||||||
| Amount | Value | |||||||
| Convertible Bonds — 81.84% (continued) | ||||||||
| Energy — 4.42% | ||||||||
| Array Technologies, Inc., 1.00%, 12/1/2028 | $ | 6,500,000 | $ | 7,419,750 | ||||
| Enphase Energy, Inc., 0.00%, 3/1/2028 | 2,000,000 | 1,665,000 | ||||||
| Green Plains, Inc., 2.25%, 3/15/2027 | 9,000,000 | 10,474,200 | ||||||
| Helix Energy Solutions Group, Inc., 6.75%, 2/15/2026(c) | 3,000,000 | 5,176,500 | ||||||
| Northern Oil and Gas, Inc., 3.63%, 4/15/2029(b) | 10,000,000 | 12,402,898 | ||||||
| Oil States International, Inc., 4.75%, 4/1/2026 | 7,000,000 | 7,748,300 | ||||||
| Stem, Inc., 4.25%, 4/1/2030(b) | 9,000,000 | 7,308,000 | ||||||
| 52,194,648 | ||||||||
| Financials — 0.98% | ||||||||
| Encore Capital Group, Inc., 4.00%, 3/15/2029(b) | 8,250,000 | 7,944,174 | ||||||
| EZCORP, Inc., 3.75%, 12/15/2029(b) | 3,750,000 | 3,649,125 | ||||||
| 11,593,299 | ||||||||
| Health Care — 14.00% | ||||||||
| Accuray, Inc., 3.75%, 6/1/2026 | 8,000,000 | 7,160,000 | ||||||
| Alphatec Holdings, Inc., 0.75%, 8/1/2026 | 11,000,000 | 10,594,375 | ||||||
| Artivion, Inc., 4.25%, 7/1/2025 | 9,000,000 | 9,101,700 | ||||||
| Bridgebio Pharma, Inc., 2.25%, 2/1/2029 | 4,240,000 | 3,180,000 | ||||||
| CONMED Corp., 2.63%, 2/1/2024(c) | 4,115,000 | 4,763,112 | ||||||
| CONMED Corp., 2.25%, 6/15/2027(b) | 9,000,000 | 8,613,000 | ||||||
| Cutera, Inc., 2.25%, 6/1/2028(b) | 2,500,000 | 1,473,500 | ||||||
| Cutera, Inc., 4.00%, 6/1/2029(b) | 2,750,000 | 1,607,100 | ||||||
| Envista Holdings Corp, 1.75%, 8/15/2028 | 4,000,000 | 3,704,000 | ||||||
| Exact Sciences Corp, 0.38%, 3/15/2027 | 10,095,000 | 9,186,450 | ||||||
| Gossamer Bio, Inc., 5.00%, 6/1/2027(c) | 5,000,000 | 1,985,000 | ||||||
| Halozyme Therapeutics, Inc., 1.00%, 8/15/2028(b) | 9,000,000 | 8,448,750 | ||||||
| Inotiv, Inc., 3.25%, 10/15/2027 | 1,000,000 | 505,000 | ||||||
| Insmed, Inc., 0.75%, 6/1/2028 | 8,515,000 | 8,489,455 | ||||||
| Integer Holdings Corp., 2.13%, 2/15/2028(b) | 13,000,000 | 14,189,500 | ||||||
| Integra LifeSciences Holdings Corp., 0.50%, 8/15/2025 | 7,500,000 | 6,877,500 | ||||||
| Jazz Investments I Ltd., 2.00%, 6/15/2026 | 7,500,000 | 7,673,437 | ||||||
| Lantheus Holdings, Inc., 2.63%, 12/15/2027(b) | 10,000,000 | 11,644,000 | ||||||
| MannKind Corp., 2.50%, 3/1/2026 | 9,000,000 | 9,489,375 | ||||||
| NuVasive, Inc., 0.38%, 3/15/2025 | 6,382,000 | 5,893,777 | ||||||
| Omnicell, Inc., 0.25%, 9/15/2025 | 8,000,000 | 7,255,000 | ||||||
| PetIQ, Inc., 4.00%, 6/1/2026 | 10,007,000 | 9,738,062 | ||||||
| Shockwave Medical, Inc., 1.00%, 8/15/2028 | 7,000,000 | 6,734,000 | ||||||
| Varex Imaging Corp., 4.00%, 6/1/2025 | 6,500,000 | 7,381,400 | ||||||
| 165,687,493 | ||||||||
| Industrials — 12.83% | ||||||||
| Advanced Energy Industries, Inc., 2.50%, 9/15/2028 | 10,000,000 | 10,136,375 | ||||||
| Alarm.com Holdings, Inc., 0.00%, 1/15/2026 | 8,185,000 | 7,112,765 | ||||||
See accompanying notes which are an integral part of these financial statements.
21
| Absolute Convertible Arbitrage Fund |
| Schedule of Investments (continued) |
| September 30, 2023 (Unaudited) |
| Principal | ||||||||
| Amount | Value | |||||||
| Convertible Bonds — 81.84% (continued) | ||||||||
| Industrials — 12.83% (continued) | ||||||||
| American Airlines Group, Inc., 6.50%, 7/1/2025 | $ | 8,240,000 | $ | 8,833,280 | ||||
| Axon Enterprise, Inc., 0.50%, 12/15/2027 | 10,000,000 | 10,700,000 | ||||||
| Bloom Energy Corp, 3.00%, 6/1/2028 | 8,000,000 | 8,024,800 | ||||||
| Camtek Ltd./Israel, 0.00%, 12/1/2026(b) | 10,000,000 | 12,120,000 | ||||||
| CryoPort, Inc., 0.75%, 12/1/2026(b) | 7,620,000 | 6,057,900 | ||||||
| FARO Technologies, Inc., 5.50%, 2/1/2028(b) | 1,500,000 | 1,149,450 | ||||||
| Fluor Corp., 1.13%, 8/15/2029 | 7,500,000 | 7,779,375 | ||||||
| Granite Construction, Inc., 3.75%, 5/15/2028 | 10,000,000 | 10,535,682 | ||||||
| Greenbrier Companies, Inc. (The), 2.88%, 4/15/2028 | 11,500,000 | 10,890,500 | ||||||
| Itron, Inc., 0.00%, 3/15/2026 | 10,000,000 | 8,650,000 | ||||||
| John Bean Technologies Corp., 0.25%, 5/15/2026 | 10,771,000 | 9,715,442 | ||||||
| Mesa Laboratories, Inc., 1.38%, 8/15/2025(c) | 9,982,000 | 9,008,755 | ||||||
| Middleby Corp. (The), 1.00%, 9/1/2025 | 12,000,000 | 13,494,000 | ||||||
| PureCycle Technologies, Inc., 7.25%, 8/15/2030 | 4,000,000 | 2,864,000 | ||||||
| Tetra Tech, Inc., 2.25%, 8/15/2028 | 7,833,000 | 7,754,670 | ||||||
| Xometry, Inc., 1.00%, 2/1/2027 | 9,500,000 | 6,925,716 | ||||||
| 151,752,710 | ||||||||
| Materials — 2.79% | ||||||||
| Century Aluminum Co, 2.75%, 5/1/2028 | 3,395,000 | 2,352,735 | ||||||
| MP Materials Corp., 0.25%, 4/1/2026(b) | 7,000,000 | 6,046,600 | ||||||
| Peabody Energy Corp., 3.25%, 3/1/2028 | 9,000,000 | 13,612,500 | ||||||
| SSR Mining, Inc., 2.50%, 4/1/2039 | 10,497,000 | 10,948,371 | ||||||
| 32,960,206 | ||||||||
| Real Estate — 0.15% | ||||||||
| Redfin Corp., 0.50%, 4/1/2027 | 3,000,000 | 1,755,000 | ||||||
| Technology — 30.12% | ||||||||
| Altair Engineering, Inc., 1.75%, 6/15/2027(b) | 11,000,000 | 11,693,000 | ||||||
| Alteryx, Inc., 1.00%, 8/1/2026 | 8,000,000 | 7,129,532 | ||||||
| Alteryx, Inc., 8.75%, 3/15/2028(b) | 2,000,000 | 1,993,511 | ||||||
| Bandwidth, Inc., 0.25%, 3/1/2026 | 3,000,000 | 2,421,000 | ||||||
| Bandwidth, Inc., 0.50%, 4/1/2028 | 7,240,000 | 4,706,000 | ||||||
| Bentley Systems, Inc., 0.38%, 7/1/2027 | 11,500,000 | 9,993,500 | ||||||
| BlackLine, Inc., 0.00%, 3/15/2026 | 7,500,000 | 6,496,875 | ||||||
| Box, Inc., 0.00%, 1/15/2026 | 9,348,000 | 10,128,558 | ||||||
| Confluent, Inc., 0.00%, 1/15/2027 | 7,750,000 | 6,359,650 | ||||||
| CSG Systems International, Inc., 3.88%, 9/15/2028 | 8,000,000 | 7,824,800 | ||||||
| CyberArk Software, Ltd., 0.00%, 11/15/2024 | 9,000,000 | 10,417,500 | ||||||
| DigitalOcean Holdings, Inc., 0.00%, 12/1/2026 | 7,910,000 | 6,085,954 | ||||||
| Dropbox, Inc., 0.00%, 3/1/2026 | 10,000,000 | 9,470,000 | ||||||
| Envestnet, Inc., 2.63%, 12/1/2027(b) | 11,000,000 | 10,081,500 | ||||||
See accompanying notes which are an integral part of these financial statements.
22
| Absolute Convertible Arbitrage Fund |
| Schedule of Investments (continued) |
| September 30, 2023 (Unaudited) |
| Principal | ||||||||
| Amount | Value | |||||||
| Convertible Bonds — 81.84% (continued) | ||||||||
| Technology — 30.12% (continued) | ||||||||
| Everbridge, Inc., 0.00%, 3/15/2026 | $ | 5,000,000 | $ | 4,250,000 | ||||
| Fastly, Inc., 0.00%, 3/15/2026 | 8,000,000 | 6,860,000 | ||||||
| GoPro, Inc., 1.25%, 11/15/2025 | 7,725,000 | 6,759,375 | ||||||
| IMAX Corp, 0.50%, 4/1/2026 | 10,345,000 | 9,698,437 | ||||||
| Impinj, Inc., 1.13%, 5/15/2027 | 10,500,000 | 9,154,950 | ||||||
| Infinera Corp., 2.50%, 3/1/2027 | 13,000,000 | 11,504,519 | ||||||
| InterDigital, Inc., 2.00%, 6/1/2024 | 4,000,000 | 4,272,500 | ||||||
| InterDigital, Inc., 3.50%, 6/1/2027 | 6,000,000 | 7,091,400 | ||||||
| Lumentum Holdings, Inc., 1.50%, 12/15/2029 | 3,000,000 | 2,734,500 | ||||||
| Lumentum Holdings, Inc., 0.50%, 12/15/2026 | 11,000,000 | 9,273,000 | ||||||
| Mitek Systems, Inc., 0.75%, 2/1/2026 | 2,450,000 | 2,156,000 | ||||||
| Model N, Inc., 2.63%, 6/1/2025 | 7,000,000 | 7,171,500 | ||||||
| Model N, Inc., 1.88%, 3/15/2028(b) | 3,000,000 | 2,674,500 | ||||||
| NextGen Healthcare, Inc., 3.75%, 11/15/2027 | 5,000,000 | 5,609,500 | ||||||
| ON Semiconductor Corp., 0.50%, 3/1/2029(b) | 8,000,000 | 8,824,000 | ||||||
| Parsons Corp., 0.25%, 8/15/2025 | 8,000,000 | 10,196,000 | ||||||
| Perficient, Inc., 0.13%, 11/15/2026 | 12,499,000 | 10,077,944 | ||||||
| Progress Software Corp., 1.00%, 4/15/2026 | 10,350,000 | 10,701,900 | ||||||
| PROS Holdings, Inc., 2.25%, 9/15/2027 | 12,825,000 | 13,581,675 | ||||||
| Q2 Holdings, Inc., 0.13%, 11/15/2025 | 4,500,000 | 3,977,100 | ||||||
| Q2 Holdings, Inc., 0.75%, 6/1/2026 | 6,000,000 | 5,261,400 | ||||||
| Semtech Corp., 1.63%, 11/1/2027(b) | 9,595,000 | 9,014,503 | ||||||
| SMART Global Holdings, Inc., 2.25%, 2/15/2026 | 7,000,000 | 9,423,750 | ||||||
| SMART Global Holdings, Inc., 2.00%, 2/1/2029 | 5,000,000 | 6,585,000 | ||||||
| Unity Software, Inc., 0.00%, 11/15/2026 | 5,000,000 | 3,982,500 | ||||||
| Veeco Instruments, Inc., 2.88%, 6/1/2029 | 9,000,000 | 10,642,500 | ||||||
| Veradigm, Inc., 0.88%, 1/1/2027 | 11,255,000 | 12,740,660 | ||||||
| Verint Systems, Inc., 0.25%, 4/15/2026 | 8,465,000 | 7,269,319 | ||||||
| Veritone, Inc., 1.75%, 11/15/2026 | 7,000,000 | 2,541,700 | ||||||
| Vishay Intertechnology Inc., 2.25%, 9/15/2030 | 9,500,000 | 9,352,750 | ||||||
| Wolfspeed, Inc., 0.25%, 2/15/2028 | 7,000,000 | 4,753,000 | ||||||
| Workiva, Inc., 1.13%, 8/15/2026 | 10,675,000 | 14,726,163 | ||||||
| Zscaler, Inc., 0.13%, 7/1/2025 | 7,500,000 | 9,045,000 | ||||||
| 356,708,425 | ||||||||
| Utilities — 1.07% | ||||||||
| Ormat Technologies, Inc., 2.50%, 7/15/2027(b) | 13,000,000 | 12,675,000 | ||||||
| Total Convertible Bonds | ||||||||
| (Cost $1,019,160,557) | 968,729,422 | |||||||
See accompanying notes which are an integral part of these financial statements.
23
| Absolute Convertible Arbitrage Fund |
| Schedule of Investments (continued) |
| September 30, 2023 (Unaudited) |
| Shares | Value | |||||||
| Money Market Funds — 9.48% | ||||||||
| First American Treasury Obligations Fund, Class X, 5.27%(d) | 112,231,721 | $ | 112,231,721 | |||||
| Total Money Market Funds | ||||||||
| (Cost $112,231,721) | 112,231,721 | |||||||
| Total Investments — 92.93% | ||||||||
| (Cost $1,150,124,476) | 1,099,988,383 | |||||||
| Other Assets in Excess of Liabilities — 7.07% | 83,645,179 | |||||||
| Net Assets — 100.00% | $ | 1,183,633,562 | ||||||
| (a) | Affiliated Company. |
| (b) | Security exempt from registration under Rule 144A under the Securities Act of 1933. |
| (c) | All or a portion of this security is held as collateral for securities sold short. |
| (d) | Rate disclosed is the seven day effective yield as of September 30, 2023. |
See accompanying notes which are an integral part of these financial statements.
24
| Absolute Convertible Arbitrage Fund |
| Schedule of Securities Sold Short |
| September 30, 2023 (Unaudited) |
| Shares | Fair Value | |||||||
| Common Stocks - Short — (34.85%) | ||||||||
| Communications — (0.36%) | ||||||||
| Fiverr International Ltd. | (2,724 | ) | $ | (66,656 | ) | |||
| IMAX Corp. | (170,981 | ) | (3,303,353 | ) | ||||
| Magnite, Inc. | (8,000 | ) | (60,320 | ) | ||||
| TechTarget, Inc. | (17,600 | ) | (534,337 | ) | ||||
| Upwork, Inc. | (22,304 | ) | (253,373 | ) | ||||
| (4,218,039 | ) | |||||||
| Consumer Discretionary — (5.97%) | ||||||||
| Axon Enterprise, Inc. | (30,758 | ) | (6,120,534 | ) | ||||
| Callaway Golf Co. | (264,500 | ) | (3,660,680 | ) | ||||
| Carnival Corp. | (309,500 | ) | (4,246,340 | ) | ||||
| Chegg, Inc. | (930 | ) | (8,296 | ) | ||||
| Cracker Barrel Old Country Store, Inc. | (17,237 | ) | (1,158,326 | ) | ||||
| Fisker, Inc. | (136,908 | ) | (878,949 | ) | ||||
| Freshpet, Inc. | (76,500 | ) | (5,039,820 | ) | ||||
| Guess?, Inc. | (193,174 | ) | (4,180,285 | ) | ||||
| indie Semiconductor, Inc. | (565,597 | ) | (3,563,261 | ) | ||||
| LCI Industries | (22,900 | ) | (2,688,918 | ) | ||||
| Live Nation Entertainment, Inc. | (64,365 | ) | (5,344,871 | ) | ||||
| Lucid Group, Inc. | (26,013 | ) | (145,413 | ) | ||||
| Luminar Technologies, Inc. | (259,391 | ) | (1,180,229 | ) | ||||
| Marriott Vacations Worldwide Corp. | (18,676 | ) | (1,879,366 | ) | ||||
| Norwegian Cruise Lines Holdings Ltd. | (145,956 | ) | (2,405,355 | ) | ||||
| Patrick Industries, Inc. | (76,100 | ) | (5,712,066 | ) | ||||
| Royal Caribbean Cruises Ltd. | (44,900 | ) | (4,137,086 | ) | ||||
| Stride, Inc. | (104,689 | ) | (4,714,145 | ) | ||||
| Virgin Galactic Holdings, Inc. | (133,618 | ) | (240,512 | ) | ||||
| Wayfair, Inc., Class A | (126,400 | ) | (7,656,048 | ) | ||||
| Winnebago Industries, Inc. | (95,200 | ) | (5,659,640 | ) | ||||
| (70,620,140 | ) | |||||||
| Consumer Staples — (1.08%) | ||||||||
| Chefs’ Warehouse, Inc. (The) | (116,914 | ) | (2,476,239 | ) | ||||
| MGP Ingredients, Inc. | (97,930 | ) | (10,329,656 | ) | ||||
| (12,805,895 | ) | |||||||
| Energy — (2.67%) | ||||||||
| Array Technologies, Inc. | (224,274 | ) | (4,976,640 | ) | ||||
| Enphase Energy, Inc. | (3,370 | ) | (404,906 | ) | ||||
| Green Plains, Inc. | (215,000 | ) | (6,471,499 | ) | ||||
| Helix Energy Solutions Group, Inc. | (395,766 | ) | (4,420,706 | ) | ||||
| Northern Oil and Gas, Inc. | (198,764 | ) | (7,996,276 | ) | ||||
| Oil States International, Inc. | (356,876 | ) | (2,987,052 | ) | ||||
| Stem, Inc. | (1,024,253 | ) | (4,342,833 | ) | ||||
| (31,599,912 | ) | |||||||
See accompanying notes which are an integral part of these financial statements.
25
| Absolute Convertible Arbitrage Fund |
| Schedule of Securities Sold Short (continued) |
| September 30, 2023 (Unaudited) |
| Shares | Fair Value | |||||||
| Common Stocks - Short — (34.85%) (continued) | ||||||||
| Financials — (0.55%) | ||||||||
| Encore Capital Group, Inc. | (94,000 | ) | $ | (4,489,440 | ) | |||
| EZCORP, Inc., Class A | (249,500 | ) | (2,058,375 | ) | ||||
| (6,547,815 | ) | |||||||
| Health Care — (5.43%) | ||||||||
| Accuray, Inc. | (448,000 | ) | (1,218,560 | ) | ||||
| Alphatec Holdings, Inc. | (346,263 | ) | (4,491,031 | ) | ||||
| Bridgebio Pharma, Inc. | (25,229 | ) | (665,289 | ) | ||||
| CONMED Corp. | (79,019 | ) | (7,969,066 | ) | ||||
| CryoLife, Inc. | (170,500 | ) | (2,584,780 | ) | ||||
| Cutera, Inc. | (54,500 | ) | (328,090 | ) | ||||
| Envista Holdings Corp. | (44,600 | ) | (1,243,448 | ) | ||||
| Exact Sciences Corp. | (48,000 | ) | (3,274,560 | ) | ||||
| Globus Medical, Inc., Class A | (3,500 | ) | (173,775 | ) | ||||
| Gossamer Bio, Inc. | (125,000 | ) | (104,100 | ) | ||||
| Halozyme Therapeutics, Inc. | (99,600 | ) | (3,804,720 | ) | ||||
| Inotiv, Inc. | (7,000 | ) | (21,560 | ) | ||||
| Insmed, Inc. | (190,500 | ) | (4,810,124 | ) | ||||
| Integer Holdings Corp. | (108,240 | ) | (8,489,263 | ) | ||||
| Integra LifeSciences Holdings Corp. | (31,440 | ) | (1,200,694 | ) | ||||
| Jazz Pharmaceuticals PLC | (31,047 | ) | (4,018,724 | ) | ||||
| Lantheus Holdings, Inc. | (86,600 | ) | (6,016,968 | ) | ||||
| Mannkind Corp. | (1,085,000 | ) | (4,481,050 | ) | ||||
| PetIQ, Inc., Class A | (126,600 | ) | (2,494,020 | ) | ||||
| Shockwave Medical, Inc. | (15,700 | ) | (3,125,870 | ) | ||||
| Varex Imaging Corp. | (198,635 | ) | (3,732,352 | ) | ||||
| (64,248,044 | ) | |||||||
| Industrials — (5.74%) | ||||||||
| Advanced Energy Industries, Inc. | (45,514 | ) | (4,693,404 | ) | ||||
| Alarm.com Holdings, Inc. | (15,612 | ) | (954,518 | ) | ||||
| American Airlines Group, Inc. | (334,433 | ) | (4,284,087 | ) | ||||
| Bloom Energy Corp., Class A | (322,762 | ) | (4,279,824 | ) | ||||
| Camtek Ltd. | (122,640 | ) | (7,635,566 | ) | ||||
| Cryoport, Inc. | (6,500 | ) | (89,115 | ) | ||||
| FARO Technologies, Inc. | (18,600 | ) | (283,278 | ) | ||||
| Fluor Corp. | (112,105 | ) | (4,114,254 | ) | ||||
| Granite Construction, Inc. | (146,124 | ) | (5,555,634 | ) | ||||
| Greenbrier Companies, Inc. (The) | (136,054 | ) | (5,442,160 | ) | ||||
| Itron, Inc. | (26,751 | ) | (1,620,576 | ) | ||||
| John Bean Technologies Corp. | (26,717 | ) | (2,809,025 | ) | ||||
| Mesa Laboratories, Inc. | (9,650 | ) | (1,013,926 | ) | ||||
| Middleby Corp. (The) | (67,700 | ) | (8,665,600 | ) | ||||
| PureCycle Technologies, Inc. | (147,589 | ) | (827,974 | ) | ||||
See accompanying notes which are an integral part of these financial statements.
26
| Absolute Convertible Arbitrage Fund |
| Schedule of Securities Sold Short (continued) |
| September 30, 2023 (Unaudited) |
| Shares | Fair Value | |||||||
| Common Stocks - Short — (34.85%) (continued) | ||||||||
| Industrials — (5.74%) (continued) | ||||||||
| SMART Global Holdings, Inc. | (424,100 | ) | $ | (10,326,834 | ) | |||
| Tetra Tech, Inc. | (24,032 | ) | (3,653,585 | ) | ||||
| Xometry, Inc. | (102,656 | ) | (1,743,099 | ) | ||||
| (67,992,459 | ) | |||||||
| Materials — (1.43%) | ||||||||
| Century Aluminum Co. | (125,100 | ) | (899,469 | ) | ||||
| MP Materials Corp. | (70,428 | ) | (1,345,175 | ) | ||||
| Peabody Energy Corp. | (396,536 | ) | (10,305,970 | ) | ||||
| SSR Mining, Inc. | (328,530 | ) | (4,366,164 | ) | ||||
| (16,916,778 | ) | |||||||
| Real Estate — 0.00% | ||||||||
| Redfin Corp. | (6,800 | ) | (47,872 | ) | ||||
| Technology — (11.00%) | ||||||||
| Allscripts Healthcare Solutions, Inc. | (620,000 | ) | (8,146,800 | ) | ||||
| Altair Engineering, Inc., Class A | (98,800 | ) | (6,180,928 | ) | ||||
| Alteryx, Inc., Class A | (7,861 | ) | (296,281 | ) | ||||
| Bandwidth, Inc., Class A | (20,874 | ) | (235,250 | ) | ||||
| Bentley Systems, Inc. | (63,203 | ) | (3,170,262 | ) | ||||
| BlackLine, Inc. | (9,985 | ) | (553,868 | ) | ||||
| Box, Inc., Class A | (274,668 | ) | (6,649,712 | ) | ||||
| Confluent, Inc., Class A | (19,059 | ) | (564,337 | ) | ||||
| CSG Systems International, Inc. | (64,500 | ) | (3,297,240 | ) | ||||
| CyberArk Software, Ltd. | (36,788 | ) | (6,024,771 | ) | ||||
| DigitalOcean Holdings, Inc. | (11,854 | ) | (284,852 | ) | ||||
| Dropbox, Inc., Class A | (106,001 | ) | (2,886,407 | ) | ||||
| Envestnet, Inc. | (82,700 | ) | (3,641,281 | ) | ||||
| Everbridge, Inc. | (1,500 | ) | (33,630 | ) | ||||
| Fastly, Inc., Class A | (13,164 | ) | (252,354 | ) | ||||
| GoPro, Inc., Class A | (240,000 | ) | (753,600 | ) | ||||
| Impinj, Inc. | (49,800 | ) | (2,740,494 | ) | ||||
| Infinera Corp. | (974,576 | ) | (4,073,728 | ) | ||||
| InterDigital, Inc. | (84,300 | ) | (6,764,232 | ) | ||||
| Lumentum Holdings, Inc. | (79,846 | ) | (3,607,442 | ) | ||||
| Mitek Systems, Inc. | (52,700 | ) | (564,944 | ) | ||||
| Model N, Inc. | (159,619 | ) | (3,896,300 | ) | ||||
| NextGen Healthcare, Inc. | (110,000 | ) | (2,610,300 | ) | ||||
| Omnicell, Inc. | (31,721 | ) | (1,428,714 | ) | ||||
| ON Semiconductor Corp. | (57,400 | ) | (5,335,330 | ) | ||||
| Parsons Corp. | (139,115 | ) | (7,560,900 | ) | ||||
| Perficient, Inc. | (19,066 | ) | (1,103,159 | ) | ||||
| Progress Software Corp. | (121,500 | ) | (6,388,470 | ) | ||||
See accompanying notes which are an integral part of these financial statements.
27
| Absolute Convertible Arbitrage Fund |
| Schedule of Securities Sold Short (continued) |
| September 30, 2023 (Unaudited) |
| Shares | Fair Value | |||||||
| Common Stocks - Short — (34.85%) (continued) | ||||||||
| Technology — (11.00%) continued | ||||||||
| PROS Holdings, Inc. | (202,200 | ) | $ | (7,000,164 | ) | |||
| Q2 Holdings, Inc. | (34,115 | ) | (1,100,891 | ) | ||||
| Semtech Corp. | (168,100 | ) | (4,328,575 | ) | ||||
| Unity Software, Inc. | (2,256 | ) | (70,816 | ) | ||||
| Veeco Instruments, Inc. | (243,000 | ) | (6,830,730 | ) | ||||
| Verint Systems, Inc. | (23,000 | ) | (528,770 | ) | ||||
| Veritone, Inc. | (76,058 | ) | (196,230 | ) | ||||
| Vishay Intertechnology, Inc. | (190,200 | ) | (4,701,744 | ) | ||||
| Wolfspeed, Inc. | (35,332 | ) | (1,346,149 | ) | ||||
| Workiva, Inc., Class A | (100,922 | ) | (10,227,436 | ) | ||||
| Zscaler, Inc. | (30,910 | ) | (4,809,287 | ) | ||||
| (130,186,378 | ) | |||||||
| Utilities — (0.62%) | ||||||||
| Ormat Technologies, Inc. | (104,921 | ) | (7,336,076 | ) | ||||
| Total Common Stocks — Short | ||||||||
| (Proceeds Received $481,442,797) | (412,519,408 | ) | ||||||
| Total Securities Sold Short — (34.85)% | ||||||||
| (Proceeds Received $481,442,797) | (412,519,408 | ) | ||||||
| Absolute Convertible Arbitrage Fund |
| Schedule of Futures Contracts |
| September 30, 2023 (Unaudited) |
| Expiration | Notional | Value/Unrealized | ||||||||||
| Futures Contracts | Contracts | Date | Amount | Appreciation | ||||||||
| Short Contracts | ||||||||||||
| 5 Year US Treasury Note Future | (650) | January 2024 | $ | (68,483,594 | ) | $ | 599,630 | |||||
See accompanying notes which are an integral part of these financial statements.
28
| Absolute Flexible Fund |
| Schedule of Investments |
| September 30, 2023 (Unaudited) |
| Principal | ||||||||
| Amount | Fair Value | |||||||
| Convertible Bonds — 85.06% | ||||||||
| Communications — 10.43% | ||||||||
| Magnite, Inc., 0.25%, 3/15/2026 | $ | 1,000,000 | $ | 870,560 | ||||
| TechTarget, Inc., 0.00%, 12/15/2026(a) | 1,000,000 | 805,122 | ||||||
| Upwork, Inc., 0.25%, 8/15/2026 | 1,250,000 | 1,031,903 | ||||||
| 2,707,585 | ||||||||
| Consumer Discretionary — 7.13% | ||||||||
| Chegg, Inc., 0.00%, 9/1/2026 | 800,000 | 630,000 | ||||||
| Cracker Barrel Old Country Store, Inc., 0.63%, 6/15/2026 | 1,000,000 | 830,625 | ||||||
| Fisker, Inc., 2.50%, 9/15/2026(b) | 750,000 | 390,450 | ||||||
| 1,851,075 | ||||||||
| Energy — 2.87% | ||||||||
| Enphase Energy, Inc., 0.00%, 3/1/2028 | 895,000 | 745,087 | ||||||
| Health Care — 11.27% | ||||||||
| Accuray, Inc., 3.75%, 6/1/2026(a) | 1,000,000 | 895,000 | ||||||
| Bridgebio Pharma, Inc., 2.25%, 2/1/2029 | 364,000 | 273,000 | ||||||
| Insmed, Inc., 0.75%, 6/1/2028 | 164,000 | 163,508 | ||||||
| NuVasive, Inc., 0.38%, 3/15/2025 | 515,000 | 475,602 | ||||||
| PetIQ, Inc., 4.00%, 6/1/2026 | 1,150,000 | 1,119,094 | ||||||
| 2,926,204 | ||||||||
| Industrials — 10.45% | ||||||||
| Itron, Inc., 0.00%, 3/15/2026 | 1,250,000 | 1,081,250 | ||||||
| John Bean Technologies Corp, 0.25%, 5/15/2026 | 1,000,000 | 902,000 | ||||||
| Xometry, Inc., 1.00%, 2/1/2027 | 1,000,000 | 729,023 | ||||||
| 2,712,273 | ||||||||
| Real Estate — 1.69% | ||||||||
| Redfin Corp., 0.50%, 4/1/2027 | 750,000 | 438,750 | ||||||
| Technology — 41.22% | ||||||||
| Alteryx, Inc., 1.00%, 8/1/2026 | 1,100,000 | 980,311 | ||||||
| Bandwidth, Inc., 0.25%, 3/1/2026 | 1,000,000 | 807,000 | ||||||
| Bentley Systems, Inc., 0.38%, 7/1/2027 | 1,324,000 | 1,150,556 | ||||||
| Confluent, Inc., 0.00%, 1/15/2027 | 1,250,000 | 1,025,750 | ||||||
| Dropbox, Inc., 0.00%, 3/1/2026 | 1,000,000 | 947,000 | ||||||
| Fastly, Inc., 0.00%, 3/15/2026 | 500,000 | 428,750 | ||||||
| GoPro, Inc., 1.25%, 11/15/2025 | 400,000 | 350,000 | ||||||
| IMAX Corp., 0.50%, 4/1/2026 | 1,250,000 | 1,171,875 | ||||||
| Infinera Corp, 2.50%, 3/1/2027 | 1,250,000 | 1,106,204 | ||||||
| Perficient, Inc., 0.13%, 11/15/2026 | 1,250,000 | 1,007,875 | ||||||
See accompanying notes which are an integral part of these financial statements.
29
| Absolute Flexible Fund |
| Schedule of Investments (continued) |
| September 30, 2023 (Unaudited) |
| Principal | ||||||||
| Amount | Fair Value | |||||||
| Convertible Bonds — 85.06% (continued) | ||||||||
| Technology — 41.22% (continued) | ||||||||
| Q2 Holdings, Inc., 0.13%, 11/15/2025 | $ | 1,000,000 | $ | 883,800 | ||||
| Rapid7, Inc., 0.25%, 3/15/2027 | 456,000 | 390,735 | ||||||
| Veritone, Inc., 1.75%, 11/15/2026 | 1,246,000 | 452,423 | ||||||
| 10,702,279 | ||||||||
| Total Convertible Bonds | ||||||||
| (Cost $22,736,048) | 22,083,253 | |||||||
| Shares | ||||||||
| Money Market Funds — 17.68% | ||||||||
| First American Treasury Obligations Fund, Class X, 5.27%(c) | 4,589,289 | 4,589,289 | ||||||
| Total Money Market Funds | ||||||||
| (Cost $4,589,289) | 4,589,289 | |||||||
| Total Investments — 102.74% | ||||||||
| (Cost $27,325,337) | 26,672,542 | |||||||
| Liabilities in Excess of Other Assets — (2.74)% | (710,221 | ) | ||||||
| Net Assets — 100.00% | $ | 25,962,321 | ||||||
| (a) | All or a portion of this security is held as collateral for securities sold short. |
| (b) | Security exempt from registration under Rule 144A under the Securities Act of 1933. |
| (c) | Rate disclosed is the seven day effective yield as of September 30, 2023. |
See accompanying notes which are an integral part of these financial statements.
30
| Absolute Flexible Fund |
| Schedule of Securities Sold Short |
| September 30, 2023 (Unaudited) |
| Shares | Fair Value | |||||||
| Common Stocks - Short — (10.51%) | ||||||||
| Communications — (1.72%) | ||||||||
| IMAX Corp. | (18,650 | ) | $ | (360,318 | ) | |||
| TechTarget, Inc. | (1,800 | ) | (54,648 | ) | ||||
| Upwork, Inc. | (2,838 | ) | (32,240 | ) | ||||
| (447,206 | ) | |||||||
| Consumer Discretionary — (0.56%) | ||||||||
| Cracker Barrel Old Country Store, Inc. | (1,200 | ) | (80,640 | ) | ||||
| Fisker, Inc. | (10,000 | ) | (64,200 | ) | ||||
| (144,840 | ) | |||||||
| Energy — (0.71%) | ||||||||
| Enphase Energy, Inc. | (1,530 | ) | (183,830 | ) | ||||
| Health Care — (1.81%) | ||||||||
| Accuray, Inc. | (50,000 | ) | (136,000 | ) | ||||
| Bridgebio Pharma, Inc. | (1,771 | ) | (46,701 | ) | ||||
| Insmed, Inc. | (2,500 | ) | (63,125 | ) | ||||
| PetIQ, Inc., Class A | (11,400 | ) | (224,580 | ) | ||||
| (470,406 | ) | |||||||
| Industrials — (2.14%) | ||||||||
| Itron, Inc. | (3,215 | ) | (194,765 | ) | ||||
| John Bean Technologies Corp. | (2,283 | ) | (240,034 | ) | ||||
| Xometry, Inc. | (7,120 | ) | (120,898 | ) | ||||
| (555,697 | ) | |||||||
| Technology — (3.57%) | ||||||||
| Alteryx, Inc., Class A | (1,000 | ) | (37,690 | ) | ||||
| Bentley Systems, Inc. | (4,340 | ) | (217,694 | ) | ||||
| Confluent, Inc., Class A | (1,600 | ) | (47,376 | ) | ||||
| Dropbox, Inc., Class A | (7,230 | ) | (196,873 | ) | ||||
| Fastly, Inc., Class A | (500 | ) | (9,585 | ) | ||||
| Infinera Corp. | (65,360 | ) | (273,204 | ) | ||||
| Perficient, Inc. | (1,030 | ) | (59,596 | ) | ||||
| Q2 Holdings, Inc. | (800 | ) | (25,816 | ) | ||||
| Rapid7, Inc. | (660 | ) | (30,215 | ) | ||||
| Veritone, Inc. | (10,658 | ) | (27,498 | ) | ||||
| (925,547 | ) | |||||||
| Total Common Stocks — Short | ||||||||
| (Proceeds Received $2,950,142) | (2,727,526 | ) | ||||||
| Total Securities Sold Short — (10.51)% | ||||||||
| (Proceeds Received $2,950,142) | (2,727,526 | ) | ||||||
See accompanying notes which are an integral part of these financial statements.
31
| Absolute Mutual Funds |
| Statements of Assets and Liabilities |
| September 30, 2023 (Unaudited) |
| Absolute Strategies Fund | Absolute Capital Opportunities Fund | Absolute Convertible Arbitrage Fund | Absolute Flexible Fund | |||||||||||||
| Assets | ||||||||||||||||
| Investments in securities at fair value (cost $4,353,750, $56,782,319, $1,131,392,278 and $27,325,337) | $ | 4,368,564 | $ | 83,931,163 | $ | 1,080,961,143 | $ | 26,672,542 | ||||||||
| Investments in affiliates, at value (Cost $14,496,363, $—, $18,732,198 and $—) | 14,222,081 | — | 19,027,240 | — | ||||||||||||
| Cash and cash equivalents | 2,115 | — | 5,540,504 | 8,513 | ||||||||||||
| Cash at broker | 3,249,589 | 2,050,071 | 487,709,356 | 2,215,746 | ||||||||||||
| Receivable for fund shares sold | — | 31,502 | 872,636 | — | ||||||||||||
| Receivable for investments sold | — | — | 11,169,039 | 92,767 | ||||||||||||
| Receivable for net variation margin on futures contracts | 31,908 | — | — | — | ||||||||||||
| Dividends and interest receivable | 22,035 | 116,611 | 4,666,227 | 77,486 | ||||||||||||
| Tax reclaims receivable | 2,403 | 5,971 | — | — | ||||||||||||
| Prepaid expenses | 13,341 | 9,885 | 82,222 | 11,506 | ||||||||||||
| Total Assets | 21,912,036 | 86,145,203 | 1,610,028,367 | 29,078,560 | ||||||||||||
See accompanying notes which are an integral part of these financial statements.
32
| Absolute Mutual Funds |
| Statements of Assets and Liabilities |
| September 30, 2023 (Unaudited) (continued) |
| Absolute Strategies Fund | Absolute Capital Opportunities Fund | Absolute Convertible Arbitrage Fund | Absolute Flexible Fund | |||||||||||||
| Liabilities | ||||||||||||||||
| Securities sold short (premium received $338,972, $–, $481,442,797 and $2,950,142) | 375,330 | — | 412,519,408 | 2,727,526 | ||||||||||||
| Written call options (premium received $–, $11,714,308, $– and $–) | — | 7,917,238 | — | — | ||||||||||||
| Payable for investments purchased | — | — | 11,735,011 | 331,035 | ||||||||||||
| Payable for fund shares redeemed | — | — | 622,257 | — | ||||||||||||
| Payable for variation margin on futures contracts | 22,813 | — | 101,563 | — | ||||||||||||
| Payable to Adviser | 21,062 | 72,241 | 954,123 | 16,695 | ||||||||||||
| Accrued 12b-1 fees | — | — | 56,155 | — | ||||||||||||
| Payable to affiliates | 1,698 | 4,581 | 31,602 | 3,480 | ||||||||||||
| Payable to auditors | 10,637 | 11,041 | 11,686 | 11,961 | ||||||||||||
| Payable to trustees | 322 | 363 | — | 705 | ||||||||||||
| Other accrued expenses | 16,766 | 30,627 | 363,000 | 24,837 | ||||||||||||
| Total Liabilities | 448,628 | 8,036,091 | 426,394,805 | 3,116,239 | ||||||||||||
| Net Assets | $ | 21,463,408 | $ | 78,109,112 | $ | 1,183,633,562 | $ | 25,962,321 | ||||||||
See accompanying notes which are an integral part of these financial statements.
33
| Absolute Mutual Funds |
| Statements of Assets and Liabilities |
| September 30, 2023 (Unaudited) (continued) |
| Absolute | ||||||||||||||||
| Absolute Strategies | Absolute Capital | Convertible | Absolute Flexible | |||||||||||||
| Fund | Opportunities Fund | Arbitrage Fund | Fund | |||||||||||||
| Net Assets consist of: | ||||||||||||||||
| Paid-in capital | $ | 60,418,731 | $ | 99,024,049 | $ | 1,183,802,092 | $ | 25,569,804 | ||||||||
| Accumulated earnings (deficit) | (38,955,323 | ) | (20,914,937 | ) | (168,530 | ) | 392,517 | |||||||||
| Net Assets | $ | 21,463,408 | $ | 78,109,112 | $ | 1,183,633,562 | $ | 25,962,321 | ||||||||
| Institutional Shares: | ||||||||||||||||
| Net Assets | 21,463,408 | 78,109,112 | 910,087,866 | 25,962,321 | ||||||||||||
| Shares outstanding (unlimited number of shares authorized, no par value) | 3,231,186 | 8,178,061 | 82,823,837 | 2,535,863 | ||||||||||||
| Net asset value, offering and redemption price per share | $ | 6.64 | $ | 9.55 | $ | 10.99 | $ | 10.24 | ||||||||
| Investor Shares: | ||||||||||||||||
| Net Assets | — | — | $ | 273,545,696 | — | |||||||||||
| Shares outstanding (unlimited number of shares authorized, no par value) | — | — | 24,977,094 | — | ||||||||||||
| Net asset value, offering and redemption price per share | — | — | $ | 10.95 | — | |||||||||||
See accompanying notes which are an integral part of these financial statements.
34
| Absolute Mutual Funds |
| Statements of Operations |
| For the six months ended September 30, 2023 (Unaudited) |
| Absolute | ||||||||||||||||
| Absolute Strategies | Absolute Capital | Convertible | Absolute Flexible | |||||||||||||
| Fund | Opportunities Fund | Arbitrage Fund | Fund | |||||||||||||
| Investment Income: | ||||||||||||||||
| Dividend income (net of foreign taxes withheld of $29,166, $–, $– and $–) | $ | 171,579 | $ | 782,019 | $ | 2,276,870 | $ | 56,728 | ||||||||
| Dividend income from affiliated investments | 157,760 | — | 412,291 | — | ||||||||||||
| Interest income | 37,087 | 35,302 | 23,610,513 | 755,238 | ||||||||||||
| Total investment income | 366,426 | 817,321 | 26,299,674 | 811,966 | ||||||||||||
| Expenses: | ||||||||||||||||
| Adviser | 172,724 | 613,645 | 6,636,849 | 170,733 | ||||||||||||
| 12b-1 fees - Investor Shares | — | — | 342,301 | — | ||||||||||||
| Transfer agent | 56,732 | 22,115 | 490,882 | 3,260 | ||||||||||||
| Registration | 12,069 | 10,724 | 25,277 | 9,568 | ||||||||||||
| Audit and tax preparation | 10,637 | 11,041 | 11,685 | 11,961 | ||||||||||||
| Legal | 8,471 | 14,344 | 81,207 | 8,331 | ||||||||||||
| Report printing | 8,108 | 7,810 | 21,585 | 6,338 | ||||||||||||
| Custodian | 6,676 | 8,975 | 49,962 | 3,932 | ||||||||||||
| Fund accounting | 6,647 | 8,684 | 22,034 | 6,819 | ||||||||||||
| Administration | 6,490 | 21,593 | 269,689 | 5,986 | ||||||||||||
| Trustee | 3,071 | 3,753 | 13,023 | 3,382 | ||||||||||||
| Compliance services | 2,725 | 3,496 | 12,609 | 3,055 | ||||||||||||
| Offering | — | — | — | 9,162 | ||||||||||||
| Dividend expense on securities sold short | — | — | 751,173 | 647 | ||||||||||||
| Miscellaneous | 11,923 | 15,345 | 319,975 | 12,930 | ||||||||||||
| Total expenses | 306,273 | 741,525 | 9,048,251 | 256,104 | ||||||||||||
| Fees contractually waived and expenses reimbursed by Adviser | (73,187 | ) | (89,115 | ) | (954,832 | ) | (73,947 | ) | ||||||||
| Net operating expenses | 233,086 | 652,410 | 8,093,419 | 182,157 | ||||||||||||
| Net investment income | 133,340 | 164,911 | 18,206,255 | 629,809 | ||||||||||||
See accompanying notes which are an integral part of these financial statements.
35
| Absolute Mutual Funds |
| Statements of Operations |
| For the six months ended September 30, 2023 (Unaudited) (continued) |
| Absolute | ||||||||||||||||
| Absolute Strategies | Absolute Capital | Convertible | Absolute Flexible | |||||||||||||
| Fund | Opportunities Fund | Arbitrage Fund | Fund | |||||||||||||
| Net Realized and Change in Unrealized Gain (Loss) on Investments | ||||||||||||||||
| Net realized gain (loss) on: | ||||||||||||||||
| Investment in unaffiliated issuers | $ | 142,965 | $ | 1,397,437 | $ | (9,287,239 | ) | $ | 883,010 | |||||||
| Investments in affiliated issuers | — | — | 89,205 | — | ||||||||||||
| Securities sold short | (64,188 | ) | — | 9,469,478 | (574,558 | ) | ||||||||||
| Written options | (195,514 | ) | 468,461 | — | — | |||||||||||
| Purchased options | (333,020 | ) | (8,316,565 | ) | — | — | ||||||||||
| Futures contracts | (1,935,725 | ) | — | — | — | |||||||||||
| Net change in unrealized appreciation (depreciation) on: | ||||||||||||||||
| Unaffiliated investments | 264,451 | 5,588,837 | (154,800 | ) | (758,945 | ) | ||||||||||
| Affiliated investments | (159,140 | ) | — | (190,026 | ) | — | ||||||||||
| Written options | 5,709 | 2,604,973 | — | — | ||||||||||||
| Securities sold short | 104,341 | (1 | ) | 5,707,145 | 122,050 | |||||||||||
| Purchased options | (4,019 | ) | (1,727,052 | ) | — | — | ||||||||||
| Futures contracts | 629,878 | — | 1,950,368 | — | ||||||||||||
| Foreign currency | 89 | (111 | ) | — | — | |||||||||||
| Net realized and change in unrealized gain (loss) on investments | (1,544,173 | ) | 15,979 | 7,584,131 | (328,443 | ) | ||||||||||
| Net increase (decrease) in net assets resulting from operations | $ | (1,410,833 | ) | $ | 180,890 | $ | 25,790,386 | $ | 301,366 | |||||||
See accompanying notes which are an integral part of these financial statements.
36
| Absolute Mutual Funds |
| Statements of Changes in Net Assets |
| Absolute Strategies Fund | ||||||||
| For the | ||||||||
| Six Months Ended | ||||||||
| September 30, 2023 | For the Year Ended | |||||||
| (Unaudited) | March 31, 2023 | |||||||
| Increase (Decrease) in Net Assets due to: | ||||||||
| Operations | ||||||||
| Net investment income (loss) | $ | 133,340 | $ | (44,768 | ) | |||
| Net realized gain (loss) on investment securities transactions | (2,385,482 | ) | 1,108,889 | |||||
| Net change in unrealized appreciation (depreciation) of investment securities | 841,309 | (1,383,022 | ) | |||||
| Net decrease in net assets resulting from operations | (1,410,833 | ) | (318,901 | ) | ||||
| Distributions to Shareholders from Earnings: | ||||||||
| Institutional Shares | (178,897 | ) | — | |||||
| Total distributions | (178,897 | ) | — | |||||
| Capital Transactions: | ||||||||
| Institutional Shares: | ||||||||
| Proceeds from shares sold | 1,162,878 | 9,781,890 | ||||||
| Reinvestment of distributions | 175,904 | — | ||||||
| Amount paid for shares redeemed | (11,118,801 | ) | (7,192,521 | ) | ||||
| Total Institutional Shares | (9,780,019 | ) | — | |||||
| Net increase (decrease) in net assets resulting from capital transactions | (9,780,019 | ) | 2,589,339 | |||||
| Total Increase (Decrease) in Net Assets | (11,369,749 | ) | 2,270,438 | |||||
| Net Assets | ||||||||
| Beginning of period | 32,833,157 | 30,562,719 | ||||||
| End of period | $ | 21,463,408 | $ | 32,833,157 | ||||
| Share Transactions: | ||||||||
| Institutional Shares: | ||||||||
| Shares sold | 172,578 | 1,356,256 | ||||||
| Shares issued in reinvestment of distributions | 26,938 | — | ||||||
| Shares redeemed | (1,661,869 | ) | (983,735 | ) | ||||
| Total Institutional Shares | (1,462,353 | ) | 372,521 | |||||
See accompanying notes which are an integral part of these financial statements.
37
| Absolute Mutual Funds |
| Statements of Changes in Net Assets |
| Absolute Capital Opportunities Fund | ||||||||
| For the | ||||||||
| Six Months Ended | ||||||||
| September 30, 2023 | For the Year Ended | |||||||
| (Unaudited) | March 31, 2023 | |||||||
| Increase (Decrease) in Net Assets due to: | ||||||||
| Operations | ||||||||
| Net investment income (loss) | $ | 164,911 | $ | (231,812 | ) | |||
| Net realized loss on investment securities transactions | (6,450,667 | ) | (5,832,642 | ) | ||||
| Net change in unrealized appreciation (depreciation) of investment securities | 6,466,646 | (1,572,601 | ) | |||||
| Net increase (decrease) in net assets resulting from operations | 180,890 | (7,637,055 | ) | |||||
| Distributions to Shareholders from Earnings: | ||||||||
| Institutional Shares | (56,191 | ) | — | |||||
| Total distributions | (56,191 | ) | — | |||||
| Capital Transactions: | ||||||||
| Institutional Shares: | ||||||||
| Proceeds from shares sold | 20,578,127 | 32,211,215 | ||||||
| Reinvestment of distributions | 55,443 | — | ||||||
| Amount paid for shares redeemed | (39,330,134 | ) | (74,159,077 | ) | ||||
| Total Institutional Shares | (18,696,564 | ) | (41,947,862 | ) | ||||
| Net decrease in net assets resulting from capital transactions | (18,696,564 | ) | (41,947,862 | ) | ||||
| Total Decrease in Net Assets | (18,571,865 | ) | (49,584,917 | ) | ||||
| Net Assets | ||||||||
| Beginning of period | 96,680,977 | 146,265,894 | ||||||
| End of period | $ | 78,109,112 | $ | 96,680,977 | ||||
| Share Transactions: | ||||||||
| Institutional Shares: | ||||||||
| Shares sold | 324,417 | 3,254,150 | ||||||
| Shares issued in reinvestment of distributions | 5,781 | — | ||||||
| Shares redeemed | (2,282,412 | ) | (7,621,142 | ) | ||||
| Total Institutional Shares | (1,952,214 | ) | (4,366,992 | ) | ||||
See accompanying notes which are an integral part of these financial statements.
38
| Absolute Mutual Funds |
| Statements of Changes in Net Assets |
| Absolute Convertible Arbitrage Fund | ||||||||
| For the | ||||||||
| Six Months Ended | ||||||||
| September 30, 2023 | For the Year Ended | |||||||
| (Unaudited) | March 31, 2023 | |||||||
| Increase (Decrease) in Net Assets due to: | ||||||||
| Operations | ||||||||
| Net investment income | $ | 18,206,255 | $ | 17,728,798 | ||||
| Net realized gain on investment securities transactions | 271,444 | 5,260,035 | ||||||
| Net change in unrealized appreciation (depreciation) of investment securities | 7,312,687 | (5,931,182 | ) | |||||
| Net increase in net assets resulting from operations | 25,790,386 | 17,057,651 | ||||||
| Distributions to Shareholders from Earnings: | ||||||||
| Institutional Shares | (12,552,845 | ) | (24,625,866 | ) | ||||
| Investor Shares | (3,801,708 | ) | (7,243,929 | ) | ||||
| Total distributions | (16,354,553 | ) | (31,869,795 | ) | ||||
| Capital Transactions: | ||||||||
| Institutional Shares: | ||||||||
| Proceeds from shares sold | 215,082,301 | 351,645,129 | ||||||
| Reinvestment of distributions | 9,753,751 | 19,509,262 | ||||||
| Amount paid for shares redeemed | (104,954,172 | ) | (254,565,141 | ) | ||||
| Total Institutional Shares | 119,881,880 | 116,589,250 | ||||||
| Investor Shares: | ||||||||
| Proceeds from shares sold | 6,092,216 | 248,352,894 | ||||||
| Reinvestment of distributions | 3,800,961 | 7,242,919 | ||||||
| Amount paid for shares redeemed | (12,895,710 | ) | (11,458,541 | ) | ||||
| Total Investor Shares | (3,002,533 | ) | 244,137,272 | |||||
| Net increase in net assets resulting from capital transactions | 116,879,347 | 360,726,522 | ||||||
| Total Increase in Net Assets | 126,315,180 | 345,914,378 | ||||||
| Net Assets | ||||||||
| Beginning of period | 1,057,318,382 | 711,404,004 | ||||||
| End of period | $ | 1,183,633,562 | $ | 1,057,318,382 | ||||
See accompanying notes which are an integral part of these financial statements.
39
| Absolute Mutual Funds |
| Statements of Changes in Net Assets (continued) |
| Absolute Convertible Arbitrage Fund | ||||||||
| For the | ||||||||
| Six Months Ended | ||||||||
| September 30, 2023 | For the Year Ended | |||||||
| (Unaudited) | March 31, 2023 | |||||||
| Share Transactions: | ||||||||
| Institutional Shares: | ||||||||
| Shares sold | 19,645,594 | 32,192,388 | ||||||
| Shares issued in reinvestment of distributions | 894,839 | 1,805,002 | ||||||
| Shares redeemed | (9,572,722 | ) | (23,367,099 | ) | ||||
| Total Institutional Shares | 10,967,711 | 10,630,291 | ||||||
| Investor Shares: | ||||||||
| Shares sold | 557,573 | 22,885,727 | ||||||
| Shares issued in reinvestment of distributions | 349,674 | 671,597 | ||||||
| Shares redeemed | (1,183,312 | ) | (1,056,836 | ) | ||||
| Total Investor Shares | (276,065 | ) | 22,500,488 | |||||
See accompanying notes which are an integral part of these financial statements.
40
| Absolute Mutual Funds |
| Statements of Changes in Net Assets |
| Absolute Flexible Fund | ||||||||
| For the | ||||||||
| Six Months Ended | For the | |||||||
| September 30, 2023 | Period Ended | |||||||
| (Unaudited) | March 31, 2023(a) | |||||||
| Increase (Decrease) in Net Assets due to: | ||||||||
| Operations | ||||||||
| Net investment income | $ | 629,809 | $ | 618,866 | ||||
| Net realized gain on investment securities transactions | 308,452 | 262,249 | ||||||
| Net change in unrealized appreciation (depreciation) of investment securities | (636,895 | ) | 206,716 | |||||
| Net increase in net assets resulting from operations | 301,366 | 1,087,831 | ||||||
| Distributions to Shareholders from Earnings: | ||||||||
| Institutional Shares | (562,664 | ) | (434,016 | ) | ||||
| Total distributions | (562,664 | ) | (434,016 | ) | ||||
| Capital Transactions: | ||||||||
| Institutional Shares: | ||||||||
| Proceeds from shares sold | 4,223,123 | 20,350,011 | ||||||
| Reinvestment of distributions | 562,664 | 434,016 | ||||||
| Amount paid for shares redeemed | — | (10 | ) | |||||
| Total Institutional Shares | 4,785,787 | 20,784,017 | ||||||
| Net increase in net assets resulting from capital transactions | 4,785,787 | 20,784,017 | ||||||
| Total Increase in Net Assets | 4,524,489 | 21,437,832 | ||||||
| Net Assets | ||||||||
| Beginning of period | 21,437,832 | — | ||||||
| End of period | $ | 25,962,321 | $ | 21,437,832 | ||||
| Share Transactions: | ||||||||
| Institutional Shares: | ||||||||
| Shares sold | 403,362 | 2,035,046 | ||||||
| Shares issued in reinvestment of distributions | 54,734 | 42,722 | ||||||
| Shares redeemed | — | (1 | ) | |||||
| Total Institutional Shares | 458,096 | 2,077,767 | ||||||
| (a) | For the period June 30, 2022 (commencement of operations) to March 31, 2023. |
See accompanying notes which are an integral part of these financial statements.
41
| Absolute Strategies Fund — Institutional Shares |
| Financial Highlights |
(For a share outstanding during each period)
| For the | ||||||||||||||||||||||||
| Six Months | ||||||||||||||||||||||||
| Ended | ||||||||||||||||||||||||
| September | ||||||||||||||||||||||||
| 30, | ||||||||||||||||||||||||
| 2023 | For the Years Ended March 31, | |||||||||||||||||||||||
| (Unaudited) | 2023 | 2022 | 2021 | 2020 | 2019 | |||||||||||||||||||
| Net asset value, beginning of period | $ | 7.00 | $ | 7.07 | $ | 7.88 | $ | 8.38 | $ | 8.10 | $ | 8.37 | ||||||||||||
| Income from investment operations: | ||||||||||||||||||||||||
| Net investment income (loss)(a) | 0.03 | (0.01 | ) | (0.09 | ) | (0.08 | ) | (0.03 | ) | 0.04 | ||||||||||||||
| Net realized and unrealized gain (loss) on investments | (0.34 | ) | (0.06 | ) | (0.53 | ) | (0.42 | ) | 0.32 | (0.31 | ) | |||||||||||||
| Total from investment operations | (0.31 | ) | (0.07 | ) | (0.62 | ) | (0.50 | ) | 0.29 | (0.27 | ) | |||||||||||||
| Less distributions to shareholders from: | ||||||||||||||||||||||||
| Net investment income | (0.05 | ) | — | (0.19 | ) | — | (0.01 | ) | — | |||||||||||||||
| Total from distributions | (0.05 | ) | — | (0.19 | ) | — | (0.01 | ) | — | |||||||||||||||
| Net asset value, end of period | $ | 6.64 | $ | 7.00 | $ | 7.07 | $ | 7.88 | $ | 8.38 | $ | 8.10 | ||||||||||||
| Total Return (b) | (4.47 | )% (c) | (0.99 | )% | (7.96 | )% | (5.97 | )% | 3.54 | % | (3.23 | )% | ||||||||||||
| Ratios and Supplemental Data: | ||||||||||||||||||||||||
| Net assets, end of period (000 omitted) | $ | 21,463 | $ | 32,833 | $ | 30,563 | $ | 71,378 | $ | 68,539 | $ | 88,048 | ||||||||||||
| Before waiver or recoupment: | ||||||||||||||||||||||||
| Ratio of net investment income (loss) to average net assets | 1.02 | % (d) | (0.13 | )% | (1.15 | )% | (0.97 | )% | (0.42 | )% | 0.49 | % | ||||||||||||
| Ratio of net expenses to average net assets | 1.78 | % (d) | 1.79 | % | 1.69 | % | 1.60 | % | 1.52 | % | 1.67 | % | ||||||||||||
| Dividend and interest expenses | — | % (d) | 0.02 | % | 0.05 | % | 0.02 | % | 0.02 | % | 0.05 | % | ||||||||||||
| Net Expenses without dividend and interest expenses | 1.78 | % (d) | 1.77 | % | 1.64 | % | 1.58 | % | 1.50 | % | 1.62 | % | ||||||||||||
| Ratio of gross expenses to average net assets | 2.34 | % (d) | 2.34 | % | 2.32 | % | 2.21 | % | 2.22 | % | 2.31 | % | ||||||||||||
| Portfolio turnover | 13 | % (c) | 42 | % | 11 | % | 23 | % | 45 | % | 33 | % | ||||||||||||
| (a) | Per share net investment income has been calculated using the average shares method. |
| (b) | Total return in the above table represents the rate that the investor would have earned or lost on an investment in the Absolute Strategies Fund, assuming reinvestment of distributions. |
| (c) | Not annualized. |
| (d) | Annualized. |
See accompanying notes which are an integral part of these financial statements.
42
| Absolute Capital Opportunities Fund — Institutional Shares |
| Financial Highlights |
(For a share outstanding during each period)
| For the | ||||||||||||||||||||||||
| Six Months | ||||||||||||||||||||||||
| Ended | ||||||||||||||||||||||||
| September | ||||||||||||||||||||||||
| 30, | ||||||||||||||||||||||||
| 2023 | For the Years Ended March 31, | |||||||||||||||||||||||
| (Unaudited) | 2023 | 2022 | 2021 | 2020 | 2019 | |||||||||||||||||||
| Net asset value, beginning of period | $ | 9.54 | $ | 10.09 | $ | 10.63 | $ | 11.90 | $ | 11.50 | $ | 12.52 | ||||||||||||
| Income from investment operations: | ||||||||||||||||||||||||
| Net investment income (loss)(a) | 0.02 | (0.02 | ) | (0.11 | ) | (0.14 | ) | 0.04 | (0.12 | ) | ||||||||||||||
| Net realized and unrealized gain (loss) on investments | — | (b) | (0.53 | ) | (0.43 | ) | 0.82 | 0.36 | (0.13 | ) | ||||||||||||||
| Total from investment operations | 0.02 | (0.55 | ) | (0.54 | ) | 0.68 | 0.40 | (0.25 | ) | |||||||||||||||
| Less distributions to shareholders from: | ||||||||||||||||||||||||
| Net investment income | (0.01 | ) | — | — | — | (b) | — | — | ||||||||||||||||
| Net realized gains | — | — | — | (1.95 | ) | — | (0.77 | ) | ||||||||||||||||
| Total from distributions | (0.01 | ) | — | — | (1.95 | ) | — | (0.77 | ) | |||||||||||||||
| Net asset value, end of period | $ | 9.55 | $ | 9.54 | $ | 10.09 | $ | 10.63 | $ | 11.90 | $ | 11.50 | ||||||||||||
| Total Return (c) | 0.17 | % (d) | (5.45 | )% | (5.08 | )% | 5.41 | % | 3.48 | % | (1.78 | )% | ||||||||||||
| Ratios and Supplemental Data: | ||||||||||||||||||||||||
| Net assets, end of period (000 omitted) | $ | 78,109 | $ | 96,681 | $ | 146,266 | $ | 122,942 | $ | 57,950 | $ | 50,958 | ||||||||||||
| Before waiver or recoupment: | ||||||||||||||||||||||||
| Ratio of net investment income (loss) to average net assets | 0.38 | % (e) | (0.17 | )% | (1.10 | )% | (1.22 | )% | 0.37 | % | (0.99 | )% | ||||||||||||
| Ratio of net expenses to average net assets | 1.49 | % (e) | 1.55 | % | 1.57 | % | 1.81 | % | 1.78 | % | 3.02 | % | ||||||||||||
| Dividend and interest expenses | — | % (e) | 0.06 | % | 0.08 | % | 0.06 | % | 0.03 | % | 1.27 | % | ||||||||||||
| Net Expenses without dividend and interest expenses | 1.49 | % (e) | 1.49 | % | 1.49 | % | 1.75 | % | 1.75 | % | 1.75 | % | ||||||||||||
| Ratio of gross expenses to average net assets | 1.69 | % (e) | 1.71 | % | 1.73 | % | 1.82 | % | 1.87 | % | 3.21 | % | ||||||||||||
| Portfolio turnover | 7 | % (d) | 120 | % | 30 | % | 140 | % | 46 | % | 23 | % | ||||||||||||
| (a) | Per share net investment income has been calculated using the average shares method. |
| (b) | Rounds to less than $0.005 per share. |
| (c) | Total return in the above table represents the rate that the investor would have earned or lost on an investment in the Absolute Capital Opportunities Fund, assuming reinvestment of distributions. |
| (d) | Not annualized. |
| (e) | Annualized. |
See accompanying notes which are an integral part of these financial statements.
43
| Absolute Convertible Arbitrage Fund — Institutional Shares |
| Financial Highlights |
(For a share outstanding during each period)
| For the | ||||||||||||||||||||||||
| Six Months | ||||||||||||||||||||||||
| Ended | ||||||||||||||||||||||||
| September | ||||||||||||||||||||||||
| 30, | ||||||||||||||||||||||||
| 2023 | For the Years Ended March 31, | |||||||||||||||||||||||
| (Unaudited) | 2023 | 2022 | 2021 | 2020 | 2019 | |||||||||||||||||||
| Net asset value, beginning of period | $ | 10.90 | $ | 11.12 | $ | 11.34 | $ | 10.32 | $ | 10.49 | $ | 10.29 | ||||||||||||
| Income from investment operations: | ||||||||||||||||||||||||
| Net investment income (loss)(a) | 0.18 | 0.21 | 0.01 | (0.02 | ) | 0.08 | 0.10 | |||||||||||||||||
| Net realized and unrealized gain (loss) on investments | 0.08 | (0.07 | ) | 0.12 | 1.37 | 0.05 | 0.30 | |||||||||||||||||
| Total from investment operations | 0.26 | 0.14 | 0.13 | 1.35 | 0.13 | 0.40 | ||||||||||||||||||
| Less distributions to shareholders from: | ||||||||||||||||||||||||
| Net investment income | (0.17 | ) | (0.14 | ) | — | (0.01 | ) | (0.11 | ) | (0.05 | ) | |||||||||||||
| Net realized gains | — | (0.22 | ) | (0.35 | ) | (0.32 | ) | (0.19 | ) | (0.15 | ) | |||||||||||||
| Total from distributions | (0.17 | ) | (0.36 | ) | (0.35 | ) | (0.33 | ) | (0.30 | ) | (0.20 | ) | ||||||||||||
| Net asset value, end of period | $ | 10.99 | $ | 10.90 | $ | 11.12 | $ | 11.34 | $ | 10.32 | $ | 10.49 | ||||||||||||
| Total Return (b) | 2.36 | % (c) | 1.30 | % | 1.13 | % | 13.12 | % | 1.18 | % | 3.95 | % | ||||||||||||
| Ratios and Supplemental Data: | ||||||||||||||||||||||||
| Net assets, end of period (000 omitted) | $ | 910,088 | $ | 783,028 | $ | 680,871 | $ | 440,974 | $ | 139,865 | $ | 88,768 | ||||||||||||
| Before waiver or recoupment: | ||||||||||||||||||||||||
| Ratio of net investment income (loss) to average net assets | 3.28 | % (d) | 1.96 | % | 0.10 | % | (0.16 | )% | 0.77 | % | 0.95 | % | ||||||||||||
| Ratio of net expenses to average net assets | 1.37 | % (d) | 1.33 | % | 1.51 | % | 1.68 | % | 1.59 | % | 1.91 | % | ||||||||||||
| Dividend and interest expenses | 0.13 | % (d) | 0.13 | % | 0.31 | % | 0.38 | % | 0.07 | % | 0.31 | % | ||||||||||||
| Net Expenses without dividend and interest expenses | 1.20 | % (d) | 1.20 | % | 1.20 | % | 1.30 | % | 1.52 | % | 1.60 | % | ||||||||||||
| Ratio of gross expenses to average net assets | 1.54 | % (d) | 1.54 | % | 1.75 | % | 1.88 | % | 1.78 | % | 2.16 | % | ||||||||||||
| Portfolio turnover(e) | 30 | % (c) | 34 | % | 45 | % | 93 | % | 95 | % | 121 | % | ||||||||||||
| (a) | Per share net investment income has been calculated using the average shares method. |
| (b) | Total return in the above table represents the rate that the investor would have earned or lost on an investment in the Absolute Convertible Arbitrage Fund, assuming reinvestment of distributions. |
| (c) | Not annualized. |
| (d) | Annualized. |
| (e) | Portfolio turnover is calculated on the basis on the Absolute Convertible Arbitrage Fund as a whole without distinguishing among the classes of shares. |
See accompanying notes which are an integral part of these financial statements.
44
| Absolute Convertible Arbitrage Fund — Investor Shares |
| Financial Highlights |
(For a share outstanding during each period)
| For the | ||||||||||||
| Six Months | ||||||||||||
| Ended | For the | For the | ||||||||||
| September | Year | Period | ||||||||||
| 30, | Ended | Ended | ||||||||||
| 2023 | March 31, | March 31, | ||||||||||
| (Unaudited) | 2023 | 2022(a) | ||||||||||
| Net asset value, beginning of period | $ | 10.86 | $ | 11.09 | $ | 11.34 | ||||||
| Income from investment operations: | ||||||||||||
| Net investment income(b) | 0.17 | 0.24 | — | (c) | ||||||||
| Net realized and unrealized gain (loss) on investments | 0.07 | (0.14 | ) | 0.10 | ||||||||
| Total from investment operations | 0.24 | 0.10 | 0.10 | |||||||||
| Less distributions to shareholders from: | ||||||||||||
| Net investment income | (0.15 | ) | (0.11 | ) | — | |||||||
| Net realized gains | — | (0.22 | ) | (0.35 | ) | |||||||
| Total from distributions | (0.15 | ) | (0.33 | ) | (0.35 | ) | ||||||
| Net asset value, end of period | $ | 10.95 | $ | 10.86 | $ | 11.09 | ||||||
| Total Return (d) | 2.24 | % (e) | 1.01 | % | 0.86 | % (e) | ||||||
| Ratios and Supplemental Data: | ||||||||||||
| Net assets, end of period (000 omitted) | $ | 273,546 | $ | 274,291 | $ | 30,533 | ||||||
| Before waiver or recoupment: | ||||||||||||
| Ratio of net investment income (loss) to average net assets | 3.03 | % (f) | 2.20 | % | (0.01 | )% (f) | ||||||
| Ratio of net expenses to average net assets | 1.62 | % (f) | 1.58 | % | 1.77 | % (f) | ||||||
| Dividend and interest expenses | 0.13 | % (f) | 0.13 | % | 0.32 | % (f) | ||||||
| Net Expenses without dividend and interest expenses | 1.45 | % (f) | 1.45 | % | 1.45 | % (f) | ||||||
| Ratio of gross expenses to average net assets | 1.80 | % (f) | 1.82 | % | 2.16 | % (f) | ||||||
| Portfolio turnover(g) | 30 | % (e) | 34 | % | 45 | % (e) | ||||||
| (a) | For the period February 25, 2021 (commencement of operations) to March 31, 2021. |
| (b) | Per share net investment income has been calculated using the average shares method. |
| (c) | Rounds to less than $0.005 per share. |
| (d) | Total return in the above table represents the rate that the investor would have earned or lost on an investment in the Absolute Convertible Arbitrage Fund, assuming reinvestment of distributions. |
| (e) | Not annualized. |
| (f) | Annualized. |
| (g) | Portfolio turnover is calculated on the basis on the Absolute Convertible Arbitrage Fund as a whole without distinguishing among the classes of shares. |
See accompanying notes which are an integral part of these financial statements.
45
| Absolute Flexible Fund — Institutional Shares |
| Financial Highlights |
(For a share outstanding during each period)
| For the | ||||||||
| Six Months | ||||||||
| Ended | For the | |||||||
| September | Period | |||||||
| 30, | Ended | |||||||
| 2023 | March 31, | |||||||
| (Unaudited) | 2023(a) | |||||||
| Net asset value, beginning of period | $ | 10.32 | $ | 10.00 | ||||
| Income from investment operations: | ||||||||
| Net investment income(b) | 0.27 | 0.30 | ||||||
| Net realized and unrealized gain (loss) on investments | (0.12 | ) | 0.23 | |||||
| Total from investment operations | 0.15 | 0.53 | ||||||
| Less distributions to shareholders from: | ||||||||
| Net investment income | (0.23 | ) | (0.17 | ) | ||||
| Net realized gains | — | (0.04 | ) | |||||
| Total from distributions | (0.23 | ) | (0.21 | ) | ||||
| Net asset value, end of period | $ | 10.24 | $ | 10.32 | ||||
| Total Return (c) | 1.41 | % (d) | 5.37 | % (d) | ||||
| Ratios and Supplemental Data: | ||||||||
| Net assets, end of period (000 omitted) | $ | 25,962 | $ | 21,438 | ||||
| Before waiver or recoupment: | ||||||||
| Ratio of net investment income to average net assets | 5.16 | % (e) | 3.96 | % (e) | ||||
| Ratio of net expenses to average net assets | 1.49 | % (e) | 1.49 | % (e) | ||||
| Dividend and interest expenses | 0.01 | % (e) | — | % (e) | ||||
| Net Expenses without dividend and interest expenses | 1.49 | % (e) | 1.49 | % (e) | ||||
| Ratio of gross expenses to average net assets | 2.10 | % (e) | 2.43 | % (e) | ||||
| Portfolio turnover | 34 | % (d) | 21 | % (d) | ||||
| (a) | For the period June 30, 2022 (commencement of operations) to March 31, 2023. |
| (b) | Per share net investment income has been calculated using the average shares method. |
| (c) | Total return in the above table represents the rate that the investor would have earned or lost on an investment in the Absolute Flexible Fund, assuming reinvestment of distributions. |
| (d) | Not annualized. |
| (e) | Annualized. |
See accompanying notes which are an integral part of these financial statements.
46
| Absolute Funds |
| Notes to the Financial Statements (Unaudited) |
| September 30, 2023 |
NOTE 1. ORGANIZATION
Absolute Strategies Fund, Absolute Capital Opportunities Fund, Absolute Convertible Arbitrage Fund and Absolute Flexible Fund (individually, a “Fund” and collectively, the “Funds” or the “Absolute Funds”) are each registered under the Investment Company Act of 1940, as amended (the “1940 Act”), as a diversified series of Unified Series Trust (the “Trust”). Prior to a tax-free reorganization as of the close of business on September 8, 2023, the Funds were each a diversified series of the Forum Funds Trust. The Trust is an open-end investment company established under the laws of Ohio by an Agreement and Declaration of Trust dated October 14, 2002, as amended (the “Trust Agreement”). The Trust Agreement permits the Board of Trustees (the “Board”) to issue an unlimited number of shares of beneficial interest of separate series without par value. Each Fund is one of a series of funds currently authorized by the Board. The investment adviser to the Funds is Absolute Investment Advisers LLC (the “Adviser”). Kovitz Investment Group Partners, LLC is the sub-adviser to the Absolute Capital Opportunities Fund. Absolute Strategies Fund currently offers Institutional Shares. Institutional Shares of the Absolute Strategies Fund’s Predecessor Fund commenced operations on July 11, 2005. Absolute Strategies Fund seeks to achieve long-term capital appreciation with an emphasis on absolute (positive) returns and low sensitivity to traditional financial market indices, such as the S&P 500 Index. Absolute Capital Opportunities Fund currently offers Institutional Shares. Institutional Shares of the Absolute Capital Opportunities Fund’s Predecessor Fund commenced operations on December 30, 2015. Absolute Capital Opportunities Fund seeks to achieve long-term capital appreciation with a lower sensitivity to traditional financial market indices, such as the S&P 500 Index. Absolute Flexible Fund currently offers Institutional Shares. Institutional Shares of the Absolute Flexible Fund’s Predecessor Fund commenced operations on June 30, 2022. The Absolute Flexible Fund seeks to achieve positive absolute returns over the long-term with low volatility when compared to traditional market indices.
Absolute Convertible Arbitrage Fund currently offers Institutional Shares and Investor Shares. The predecessor fund of the Absolute Convertible Arbitrage Fund commenced operations on August 14, 2017, after it acquired the net assets of the Mohican VCA Fund, LP, a privately offered hedge fund (“Mohican”), in exchange for the Absolute Convertible Fund Predecessor Fund’s shares. Mohican commenced operations in 2002. Absolute Convertible Arbitrage Fund seeks to achieve positive absolute returns over the long-term with low volatility when compared to traditional market indices. The Absolute Convertible Arbitrage Fund’s Predecessor Fund Investor Shares commenced operations on April 1, 2021.
NOTE 2. SIGNIFICANT ACCOUNTING POLICIES
The Funds are investment companies and follow accounting and reporting guidance under Financial Accounting Standards Board Accounting Standards Codification (“ASC”) Topic 946, “Financial Services-Investment Companies”. The following is a summary of significant
47
| Absolute Funds |
| Notes to the Financial Statements (Unaudited) (continued) |
| September 30, 2023 |
accounting policies followed by the Funds in the preparation of their financial statements. These policies are in conformity with generally accepted accounting principles in the United States of America (“GAAP”).
Estimates – The preparation of financial statements in conformity with GAAP requires management to make estimates and assumptions that affect the reported amounts of assets and liabilities and disclosure of contingent assets and liabilities at the date of the financial statements and the reported amounts of increases and decreases in net assets from operations during the reporting period. Actual results could differ from those estimates.
Regulatory Update – Tailored Shareholder Reports for Mutual Funds and Exchange-Traded Funds (“ETFs”) – Effective January 24, 2023, the Securities and Exchange Commission adopted rule and form amendments to require mutual funds and ETFs to transmit concise and visually engaging streamlined annual and semiannual reports to shareholders that highlight key information. Other information, including financial statements, will no longer appear in a streamlined shareholder report but must be available online, delivered free of charge upon request, and filed on a semiannual basis on Form N-CSR. The rule and form amendments have a compliance date of July 24, 2024. At this time, management is evaluating the impact of these amendments on the shareholder reports for the Funds.
Foreign Currency Translation – The accounting records of the Funds are maintained in U.S. dollars. Foreign currency amounts are translated into U.S. dollars at the current rate of exchange each business day to determine the value of investments, and other assets and liabilities. Purchases and sales of foreign securities, and income and expenses, are translated at the prevailing rate of exchange on the respective date of these transactions. The Funds do not isolate that portion of the results of operations resulting from changes in foreign exchange rates on investments from fluctuations arising from changes in market prices of securities held. These fluctuations are included with the realized and unrealized gain or loss from investments. Net realized gain (loss) on foreign currency translations on the Statements of Operations represents currency gains (losses) realized between the trade and settlement dates on securities transactions, and the difference between the amount of investment income and foreign withholding taxes recorded on the Funds’ books and the U.S. dollar equivalent amounts actually received or paid. The net change in unrealized currency gains (losses) on foreign currency translations for the period is reflected in the Statements of Operations.
Federal Income Taxes – The Funds make no provision for federal income or excise tax. Each Fund has qualified and intends to qualify each year as a regulated investment company (“RIC”) under subchapter M of the Internal Revenue Code of 1986, as amended, by complying with the requirements applicable to RICs and by distributing substantially all of its taxable income. Each Fund also intends to distribute sufficient net investment income
48
| Absolute Funds |
| Notes to the Financial Statements (Unaudited) (continued) |
| September 30, 2023 |
and net capital gains, if any, so that it will not be subject to excise tax on undistributed income and gains. If the required amount of net investment income or gains is not distributed, the Funds could incur a tax expense.
As of and during the six months ended September 30, 2023, the Funds did not have any liabilities for any unrecognized tax benefits. The Funds recognize interest and penalties, if any, related to unrecognized tax benefits as income tax expense in the Statements of Operations when incurred. During the period, the Funds did not incur any interest or penalties. Management of the Funds has reviewed tax positions taken in tax years that remain subject to examination by all major tax jurisdictions, including federal (i.e., the previous three tax year ends and the interim tax period since then, as applicable) and has concluded that no provision for unrecognized tax benefits or expenses is required in these financial statements and does not expect this to change over the next twelve months.
Expenses – Expenses incurred by the Trust that do not relate to a specific fund of the Trust are allocated to the individual funds based on each fund’s relative net assets or another appropriate basis (as determined by the Board). Expenses specifically attributable to any class are borne by that class. Income, realized gains and losses, unrealized appreciation and depreciation, and fund-wide expenses not allocated to a particular class shall be allocated to each class based on the net assets of that class in relation to the net assets of the entire fund.
Security Transactions and Related Income – The Funds follow industry practice and record security transactions on the trade date for financial reporting purposes. The specific identification method is used for determining gains or losses for financial statements and income tax purposes. Dividend income is recorded on the ex-dividend date and interest income is recorded on an accrual basis. Distributions received from investments in real estate investment trusts (“REITs”) that represent a return of capital or capital gain are recorded as a reduction of the cost of investment or as a realized gain, respectively. The calendar year-end amounts of ordinary income, capital gains, and return of capital included in distributions received from the Funds’ investments in REITs are reported to the Funds after the end of the calendar year; accordingly, the Funds estimate these amounts for accounting purposes until the characterization of REIT distributions is reported. Estimates are based on the most recent REIT distributions information available. Withholding taxes on foreign dividends and related reclaims have been provided for in accordance with the Funds’ understanding of the applicable country’s tax rules and rates.
Distributions to Shareholders – Distributions to shareholders of net investment income, if any, are declared and paid semi-annually. Distributions to shareholders of net capital gains and foreign currency gains, if any, are declared and paid at least annually. Distributions to shareholders are recorded on the ex-dividend date. Distributions are based on amounts calculated in accordance with applicable federal income tax regulations, which may differ
49
| Absolute Funds |
| Notes to the Financial Statements (Unaudited) (continued) |
| September 30, 2023 |
from GAAP. These differences are due primarily to differing treatments of income and gain on various investment securities held by each Fund, timing differences and differing characterizations of distributions made by each Fund.
Foreign Currency Transactions – Each Fund may enter into transactions to purchase or sell foreign currency contracts and options on foreign currency. Forward currency contracts are agreements to exchange one currency for another at a future date and at a specified price. A fund may use forward currency contracts to facilitate transactions in foreign securities, to manage a fund’s foreign currency exposure and to protect the U.S. dollar value of its underlying portfolio securities against the effect of possible adverse movements in foreign exchange rates. These contracts are intrinsically valued daily based on forward rates, and a fund’s net equity therein, representing unrealized gain or loss on the contracts as measured by the difference between the forward foreign exchange rates at the dates of entry into the contracts and the forward rates at the reporting date, is recorded as a component of NAV. These instruments involve market risk, credit risk, or both kinds of risks, in excess of the amount recognized in the Statements of Assets and Liabilities. Risks arise from the possible inability of counterparties to meet the terms of their contracts and from movement in currency and securities values and interest rates. Due to the risks associated with these transactions, a fund could incur losses up to the entire contract amount, which may exceed the net unrealized value included in its NAV.
Futures Contracts – Each Fund may purchase futures contracts to gain exposure to market changes, which may be more efficient or cost effective than actually buying the securities. A futures contract is an agreement between parties to buy or sell a security at a set price on a future date. Upon entering into such a contract, a fund is required to pledge to the broker an amount of cash, U.S. Government obligations or other high-quality debt securities equal to the minimum “initial margin” requirements of the exchange on which the futures contract is traded. Pursuant to the contract, the Fund agrees to receive from or pay to the broker an amount of cash equal to the daily fluctuation in the value of the contract. Such receipts or payments are known as “variation margin” and are recorded by the Fund as unrealized gains or losses. When the contract is closed, the Fund records a realized gain or loss equal to the difference between the value of the contract at the time it was opened and value at the time it was closed. Risks of entering into futures contracts include the possibility that there may be an illiquid market and that a change in the value of the contract may not correlate with changes in the value of the underlying securities.
Notional amounts of each individual futures contract outstanding as of September 30, 2023, for Absolute Strategies Fund and Absolute Convertible Arbitrage Fund, are disclosed in the Schedule of Futures Contracts.
Securities Sold Short – Each Fund may sell a security short to increase investment returns. Each Fund may also sell a security short in anticipation of a decline in the market value of a security. A short sale is a transaction in which the Fund sells a security that it does not own.
50
| Absolute Funds |
| Notes to the Financial Statements (Unaudited) (continued) |
| September 30, 2023 |
To complete the transaction, the Fund must borrow the security in order to deliver it to the buyer. The Fund must replace the borrowed security by purchasing it at market price at the time of replacement; the price may be higher or lower than the price at which the Fund sold the security. The Fund incurs a loss from a short sale if the price of the security increases between the date of the short sale and the date on which the Fund replaces the borrowed security. The Fund realizes a profit if the price of the security declines between those dates.
Until the Fund replaces the borrowed security, the Fund will maintain on its books and records cash and long securities to sufficiently cover its short position on a daily basis. The collateral for the securities sold short includes the Deposits with Brokers as shown on the Statements of Assets and Liabilities and the securities held long as shown on the Schedules of Investments. Dividends and interest paid on securities sold short are recorded as an expense on the Statements of Operations.
Purchased Options – When a fund purchases an option, an amount equal to the premium paid by the fund is recorded as an investment and is subsequently adjusted to the current value of the option purchased. If an option expires on the stipulated expiration date or if the fund enters into a closing sale transaction, a gain or loss is realized. If a call option is exercised, the cost of the security acquired is increased by the premium paid for the call. If a put option is exercised, a gain or loss is realized from the sale of the underlying security, and the proceeds from such sale are decreased by the premium originally paid. Purchased options are non-income producing securities.
The values of each individual purchased option outstanding as of September 30, 2023, for each Fund, if any, are disclosed in each Fund’s Schedule of Investments.
Written Options – When a fund writes an option, an amount equal to the premium received by the fund is recorded as a liability and is subsequently adjusted to the current value of the option written. Premiums received from writing options that expire unexercised are treated by the fund on the expiration date as realized gain from written options. The difference between the premium and the amount paid on effecting a closing purchase transaction, including brokerage commissions, is also treated as a realized gain, or if the premium is less than the amount paid for the closing purchase transaction, as a realized loss. If a call option is exercised, the premium is added to the proceeds from the sale of the underlying security in determining whether the fund has realized a gain or loss. If a put option is exercised, the premium reduces the cost basis of the securities purchased by the fund. The fund, as writer of an option, bears the market risk of an unfavorable change in the price of the security underlying the written option. Written options are non-income producing securities.
The values of each individual written option outstanding as of September 30, 2023, for each Fund, if any, are disclosed in each Fund’s Schedule of Call and Put Options Written.
51
| Absolute Funds |
| Notes to the Financial Statements (Unaudited) (continued) |
| September 30, 2023 |
Restricted Securities – Each Fund may invest in securities that are subject to legal or contractual restrictions on resale (“restricted securities”). Restricted securities may be resold in transactions that are exempt from registration under the Federal securities laws or if the securities are registered to the public. The sale or other disposition of these securities may involve additional expenses and the prompt sale of these securities at an acceptable price may be difficult. Information regarding restricted securities held by each Fund is included in their Schedule of Investments, if applicable.
When-Issued Transactions – Each Fund may purchase securities on a forward commitment or ‘when-issued’ basis. A fund records a when-issued transaction on the trade date and will segregate with the custodian qualifying assets that have a value sufficient to make payment for the securities purchased. Securities purchased on a when-issued basis are marked-to-market daily and the fund begins earning interest on the settlement date. Losses may arise due to changes in the market value of the underlying securities or if the counterparty does not perform under the contract.
Offering Costs – Offering costs for the Absolute Flexible Fund of $36,646 consisted of fees related to the mailing and printing of the initial prospectus, certain startup legal costs, and initial registration filings. Such costs are amortized over a twelve-month period beginning with the commencement of operations of the Absolute Flexible Fund. During the six months ended September 30, 2023, the Absolute Flexible Fund expensed $9,162.
NOTE 3. SECURITIES VALUATION AND FAIR VALUE MEASUREMENTS
Each Fund values its portfolio securities at fair value as of the close of regular trading on the New York Stock Exchange (“NYSE”) (normally 4:00 p.m. Eastern Time) on each business day the NYSE is open for business. Fair value is defined as the price that a Fund would receive upon selling an investment in a timely transaction to an independent buyer in the principal or most advantageous market of the investment. GAAP establishes a three-tier hierarchy to maximize the use of observable market data and minimize the use of unobservable inputs and to establish classification of fair value measurements for disclosure purposes.
Inputs refer broadly to the assumptions that market participants would use in pricing the asset or liability, including assumptions about risk (the risk inherent in a particular valuation technique used to measure fair value including a pricing model and/or the risk inherent in the inputs to the valuation technique). Inputs may be observable or unobservable. Observable inputs are inputs that reflect the assumptions market participants would use in pricing the asset or liability developed based on market data obtained and available from sources independent of the reporting entity. Unobservable inputs are inputs that reflect the reporting entity’s own assumptions about the assumptions market participants would use in pricing the asset or liability developed based on the best information available in the circumstances.
52
| Absolute Funds |
| Notes to the Financial Statements (Unaudited) (continued) |
| September 30, 2023 |
Various inputs are used in determining the value of each Fund’s investments. These inputs are summarized in the three broad levels listed below.
| ● | Level 1 – unadjusted quoted prices in active markets for identical investments and/ or registered investment companies where the value per share is determined and published and is the basis for current transactions for identical assets or liabilities at the valuation date |
| ● | Level 2 – other significant observable inputs (including, but not limited to, quoted prices for an identical security in an inactive market, quoted prices for similar securities, interest rates, prepayment speeds, credit risk, etc.) |
| ● | Level 3 – significant unobservable inputs (including the Funds’ own assumptions in determining fair value of investments based on the best information available) |
The inputs used to measure fair value may fall into different levels of the fair value hierarchy. In such cases, for disclosure purposes, the level in the fair value hierarchy which is reported is determined based on the lowest level input that is significant to the fair value measurement in its entirety.
Equity securities that are traded on any stock exchange are generally valued at the last quoted sale price on the security’s primary exchange. Lacking a last sale price, an exchange-traded security is generally valued at its last bid price. Securities traded in the Nasdaq over-the-counter market are generally valued at the Nasdaq Official Closing Price. When using market quotations and when the market is considered active, the security is classified as a Level 1 security. In the event that market quotations are not readily available or are considered unreliable due to market or other events, securities are valued in good faith by the Adviser, as Valuation Designee, under the oversight of the Board’s Pricing & Liquidity Committee. The Adviser has adopted written policies and procedures for valuing securities and other assets in circumstances where market quotes are not readily available in conformity with guidelines adopted by the Board. In the event that market quotes are not readily available, and the security or asset cannot be valued pursuant to one of the valuation methods, the value of the security or asset will be determined in good faith by the Valuation Designee pursuant to its policies and procedures. Any fair value provided by the Valuation Designee is subject to the ultimate review of the pricing methodology by the Pricing & Liquidity Committee of the Board on a quarterly basis. Under these policies, the securities will be classified as Level 2 or 3 within the fair value hierarchy, depending on the inputs used.
Investments in mutual funds, including money market mutual funds, are generally priced at the ending NAV provided by the service agent of the mutual funds. These securities are categorized as Level 1 securities.
53
| Absolute Funds |
| Notes to the Financial Statements (Unaudited) (continued) |
| September 30, 2023 |
Debt securities are valued by using the mean between the closing bid and ask prices provided by a pricing service. If the closing bid and ask prices are not readily available, the pricing service may provide a price determined by a matrix pricing method. Matrix pricing is a mathematical technique used to value fixed income securities without relying exclusively on quoted prices. Matrix pricing takes into consideration recent transactions, yield, liquidity, risk, credit quality, coupon, maturity, type of issue and any other factors or market data the pricing service deems relevant for the actual security being priced and for other securities with similar characteristics. These securities will generally be categorized as Level 2 securities. If the Adviser, as Valuation Designee, decides that a price provided by the pricing service does not accurately reflect the fair value of the securities or when prices are not readily available from a pricing service, securities are valued at fair value as determined by the Valuation Designee, in conformity with guidelines adopted by and subject to review of the Board through its Pricing & Liquidity Committee. These securities will generally be categorized as Level 3 securities.
Futures contracts that the Fund invests in are valued at the settlement price established each day by the board of trade or exchange on which they are traded, and when the market is considered active, will generally be categorized as Level 1 securities.
Option contracts are generally traded on an exchange and are generally valued at the last trade price, as provided by a pricing service. If there is no such reported sale on the valuation date, long positions are valued at the most recent bid price, and short positions are valued at the most recent ask price. The option contracts will generally be categorized as Level 1 securities unless the market is considered inactive or the absence of a last bid or ask price, in which case, they will be categorized as Level 2 securities.
In accordance with the Trust’s valuation policies and fair value determinations pursuant to Rule 2a-5 under the 1940 Act, the Valuation Designee is required to consider all appropriate factors relevant to the value of securities for which it has determined other pricing sources are not available or reliable as described above. No single method exists for determining fair value because fair value depends upon the circumstances of each individual case. As a general principle, the current fair value of a security being valued by the Valuation Designee would be the amount that a Fund might reasonably expect to receive upon the current sale. Methods that are in accordance with this principle may, for example, be based on (i) a multiple of earnings; (ii) a discount from market prices of a similar freely traded security (including a derivative security or a basket of securities traded on other markets, exchanges or among dealers); or (iii) yield to maturity with respect to debt issues, or a combination of these and other methods. Fair-value pricing is permitted if, in the Valuation Designee’s opinion, the validity of market quotations appears to be questionable based on factors such as evidence of a thin market in the security based on a small number of quotations, a significant event occurs after the close of a market but before a Fund’s NAV calculation that may affect a security’s value, or the Valuation Designee is aware of any other data that calls into question the reliability of market quotations. The Valuation Designee may obtain assistance from others in
54
| Absolute Funds |
| Notes to the Financial Statements (Unaudited) (continued) |
| September 30, 2023 |
fulfilling its duties. For example, it may seek assistance from pricing services, fund administrators, sub-advisers, accountants, or counsel; it may also consult the Trust’s Fair Value Committee. The Valuation Designee, however, remains responsible for the final fair value determination and may not designate or assign that responsibility to any third party.
The following is a summary of the inputs used to value the Funds’ investments as of September 30, 2023:
| Absolute Strategies Fund | Valuation Inputs | |||||||||||||||
| Assets | Level 1 | Level 2 | Level 3 | Total | ||||||||||||
| Mutual Funds | $ | 13,145,271 | $ | — | $ | — | $ | 13,145,271 | ||||||||
| Exchange-Traded Funds | 1,201,410 | — | — | 1,201,410 | ||||||||||||
| Collateralized Mortgage Obligations | — | 120,010 | — | 120,010 | ||||||||||||
| Put Options Purchased | 103,800 | — | — | 103,800 | ||||||||||||
| Money Market Funds | 4,020,154 | — | — | 4,020,154 | ||||||||||||
| Total | $ | 18,470,635 | $ | 120,010 | $ | — | $ | 18,590,645 | ||||||||
| Liabilities | ||||||||||||||||
| Common Stocks(a) | $ | (375,330 | ) | — | $ | — | $ | (375,330 | ) | |||||||
| Futures(b) | 132,190 | — | — | 132,190 | ||||||||||||
| Total | $ | (243,140 | ) | $ | — | $ | — | $ | (243,140 | ) | ||||||
| Absolute Capital Opportunities Fund | ||||||||||||||||
| Assets | ||||||||||||||||
| Common Stocks(a) | $ | 69,438,241 | $ | — | $ | — | $ | 69,438,241 | ||||||||
| Call Options Purchased | 265,884 | — | — | 265,884 | ||||||||||||
| Put Options Purchased | 3,034,586 | — | — | 3,034,586 | ||||||||||||
| Money Market Funds | 11,192,452 | — | — | 11,192,452 | ||||||||||||
| Total | $ | 83,931,163 | $ | — | $ | — | $ | 83,931,163 | ||||||||
| Liabilities | ||||||||||||||||
| Written Options | $ | (7,917,238 | ) | $ | — | $ | — | $ | (7,917,238 | ) | ||||||
| Total | $ | (7,917,238 | ) | $ | — | $ | — | $ | (7,917,238 | ) | ||||||
| Absolute Convertible Arbitrage Fund | ||||||||||||||||
| Assets | ||||||||||||||||
| Mutual Funds | $ | 19,027,240 | $ | — | $ | — | $ | 19,027,240 | ||||||||
| Convertible Bonds(a) | — | 968,729,422 | — | 968,729,422 | ||||||||||||
| Money Market Funds | 112,231,721 | — | — | 112,231,721 | ||||||||||||
| Total | $ | 131,258,961 | $ | 968,729,422 | $ | — | $ | 1,099,988,383 | ||||||||
| Liabilities | ||||||||||||||||
| Common Stocks(a) | $ | (412,519,408 | ) | $ | — | $ | — | $ | (412,519,408 | ) | ||||||
| Futures(b) | 599,630 | — | — | 599,630 | ||||||||||||
| Total | $ | (411,919,778 | ) | $ | — | $ | — | $ | (411,919,778 | ) | ||||||
55
| Absolute Funds |
| Notes to the Financial Statements (Unaudited) (continued) |
| September 30, 2023 |
| Absolute Flexible Fund | Valuation Inputs | |||||||||||||||
| Assets | Level 1 | Level 2 | Level 3 | Total | ||||||||||||
| Convertible Bonds(a) | $ | — | $ | 22,083,253 | $ | — | $ | 22,083,253 | ||||||||
| Money Market Funds | 4,589,289 | — | — | 4,589,289 | ||||||||||||
| Total | $ | 4,589,289 | $ | 22,083,253 | $ | — | $ | 26,672,542 | ||||||||
| Liabilities | ||||||||||||||||
| Common Stocks(a) | $ | (2,727,526 | ) | $ | — | $ | — | $ | (2,727,526 | ) | ||||||
| Total | $ | (2,727,526 | ) | $ | — | $ | — | $ | (2,727,526 | ) | ||||||
| (a) | Refer to Schedule of Investments for sector classifications. |
| (b) | The amount shown represents the net unrealized appreciation/depreciation of the futures contracts. |
The Funds did not hold any investments at the end of the reporting period for which significant unobservable inputs (Level 3) were used in determining fair value; therefore, no reconciliation of Level 3 securities is included for this reporting period.
NOTE 4. DERIVATIVE TRANSACTIONS
The Funds may invest in certain derivatives, as detailed below, to meet their respective investment objectives. Each Fund’s use of derivative instruments involves risks different from, or possibly greater than, the risks associated with investing directly in securities and other traditional investments. Derivatives are subject to a number of risks, such as liquidity risk, interest rate risk, market risk, credit risk and management risk. They also involve the risk of mispricing or improper valuation and the risk that changes in the value of the derivative may not correlate perfectly with the underlying asset, rate or index. In some cases, a Fund could lose more than the principal amount invested by investing in a derivative instrument. Also, suitable derivative transactions may not be available in all circumstances and there can be no assurance that a Fund will engage in these transactions to reduce exposure to other risks when doing so would be beneficial.
The Funds may also utilize certain derivative instruments and investment techniques for risk management or hedging purposes. There is no assurance that such risk management and hedging strategies will be successful, as such success will depend on, among other factors, the Adviser’s ability to predict the future correlation, if any, between the performance of the instruments utilized for hedging purposes and the performance of the investments being hedged.
The following provides more information on specific types of derivatives and activity in each Fund:
The use of derivative instruments by the Absolute Strategies Fund for the six months ended September 30, 2023, related to the use of futures contracts and purchased and written options. The Absolute Strategies Fund utilized such derivative instruments in order to generate absolute return and to implement selective hedging and to manage risk exposure.
56
| Absolute Funds |
| Notes to the Financial Statements (Unaudited) (continued) |
| September 30, 2023 |
The use of derivative instruments by the Absolute Capital Opportunities Fund for the six months ended September 30, 2023, related to the use of purchased and written options. The Absolute Capital Opportunities Fund utilized such options in order to manage or enhance return (including through leverage), to obtain leverage for speculative purposes, and to implement selective hedging and to manage risk exposure.
The use of derivative instruments by the Absolute Convertible Arbitrage Fund for the six months ended September 30, 2023, related to the use of futures contracts. The Absolute Convertible Arbitrage Fund utilized futures contracts in order to generate absolute, risk-adjusted returns, to obtain leverage for speculative purposes, to gain exposure to certain asset classes (in which case the derivatives may have economic characteristics similar to those of the reference asset), and to implement selective hedging and to manage risk exposure.
A futures contract is a bilateral agreement where one party agrees to accept, and the other party agrees to make, delivery of cash or underlying securities or commodities, as called for in the contract, at a specified date and at an agreed upon price. An index futures contract involves the delivery of an amount of cash equal to a specified dollar amount multiplied by the difference between the index value at the close of trading of the contract and at the price designated by the futures contract. Generally, these futures contracts are closed out prior to the expiration date of the contracts. A public market exists in futures contracts covering certain indexes, financial instruments and foreign currencies.
A call option is a contract under which the purchaser of the call option, in return for a premium paid, has the right to buy the security (or index) underlying the option at a specified price at any time during the term of the option.
The writer of the call option, who receives the premium, has the obligation upon exercise of the option to deliver the underlying security against payment of the exercise price. A put option gives its purchaser, in return for a premium, the right to sell the underlying security at a specified price during the term of the option. The writer of the put, who receives the premium, has the obligation to buy, upon exercise of the option, the underlying security (or a cash amount equal to the value of the index) at the exercise price. The amount of a premium received or paid for an option is based upon certain factors including the market price of the underlying security, the relationship of the exercise price to the market price, the historical price volatility of the underlying security, the option period and interest rates. Options on futures contracts are similar to options on securities except that an option on a futures contract gives the purchaser the right, in return for the premium paid, to assume a position in a futures contract at a specified exercise price at any time during the period of the option. Upon exercise of the option, the delivery of the futures position to the holder of the option will be accompanied by transfer to the holder of an accumulated balance representing the amount by which the market price of the futures contract exceeds, in the case of a call, or is less than, in the case of a put, the exercise price of the option on the future.
57
| Absolute Funds |
| Notes to the Financial Statements (Unaudited) (continued) |
| September 30, 2023 |
The following tables identify the location and fair value of derivative instruments on the Statements of Assets and Liabilities as of September 30, 2023, and the effect of derivative instruments on the Statements of Operations for the six months ended September 30, 2023.
| Location of Derivatives on Statement of Assets and Liabilities | ||||||||||
| Asset | Liability | |||||||||
| Derivatives | Derivatives | Derivatives | Fair Value | |||||||
| Equity Price Risk: | ||||||||||
| Absolute Strategies Fund | Purchased Options | Investments in securities at fair value | $ | 103,800 | ||||||
| Futures Contracts | Unrealized appreciation on futures | 132,190 | ||||||||
| Absolute Capital Opportunities Fund | Purchased Options | Investments in securities at fair value | 3,300,470 | |||||||
| Written Options | Written options, at fair value | (7,917,238 | ) | |||||||
| Absolute Convertible Arbitrage Fund | Futures Contracts | Unrealized appreciation on futures | 599,630 | |||||||
58
| Absolute Funds |
| Notes to the Financial Statements (Unaudited) (continued) |
| September 30, 2023 |
For the six months ended September 30, 2023:
| Location of | Change in | |||||||||||
| Gain (Loss) on | Unrealized | |||||||||||
| Derivatives on | Realized Gain | Appreciation | ||||||||||
| Statements of | (Loss) on | (Depreciation) | ||||||||||
| Derivatives | Operations | Derivatives | on Derivative | |||||||||
| Equity Risk Exposure: | Net realized gain and change in unrealized appreciation (depreciation) on investments | |||||||||||
| Absolute Strategies Fund | Purchased Options | $ | (333,020 | ) | $ | (4,019 | ) | |||||
| Written Options | (195,514 | ) | 5,709 | |||||||||
| Futures Contracts | (1,935,725 | ) | 629,878 | |||||||||
| Absolute Capital Opportunities Fund | Purchased Options | (8,316,565 | ) | (1,727,052 | ) | |||||||
| Written Options | 468,461 | 2,604,973 | ||||||||||
| Futures Contracts | — | — | ||||||||||
| Absolute Convertible Arbitrage Fund | Futures Contracts | — | 1,950,368 | |||||||||
The following table summarizes the average ending monthly fair value of derivatives outstanding during the six months ended September 30, 2023:
| Average Ending Monthly | ||||||
| Derivatives | Fair Value(a) | |||||
| Absolute Strategies Fund | Purchased Options | $ | 241,608 | |||
| Written Options | (57,042 | ) | ||||
| Futures Contracts | (16,133,056 | ) | ||||
| Absolute Capital Opportunities Fund | Purchased Options | 1,812,963 | ||||
| Written Options | (8,889,523 | ) | ||||
| Absolute Convertible Arbitrage Fund | Futures Contracts | (66,270,573 | ) | |||
| (a) | Average based on the six months during the period that had activity. |
NOTE 5. FEES AND OTHER TRANSACTIONS WITH AFFILIATES AND OTHER SERVICE PROVIDERS
Absolute Investment Advisers LLC (the “Adviser”) is the investment adviser to each Fund. Pursuant to an investment management agreement, the Adviser receives a management fee from Absolute Strategies Fund, Absolute Capital Opportunities Fund, Absolute Convertible Arbitrage Fund and Absolute Flexible Fund at an annual rate of 1.40%, 1.40%, 1.20% and 1.40%, respectively, of such Fund’s average daily net assets. Prior to September 8, 2023, the advisory fee for Absolute Convertible Arbitrage Fund was 1.00%.
59
| Absolute Funds |
| Notes to the Financial Statements (Unaudited) (continued) |
| September 30, 2023 |
Any sub-advisory fee, calculated as a percentage of a Fund’s average daily net assets managed by a subadviser, is paid by the Adviser.
The Trust and the Adviser assumed the expense limitation agreements that were in effect for each fund of the Forum Funds and the Adviser has contractually agreed to waive its management fee and/or reimburse certain Absolute Strategies Fund operating expenses, but only to the extent necessary so that the Fund’s total annual operating expenses, excluding portfolio transaction and other investment-related costs (including brokerage fees and commissions); taxes; borrowing costs (such as interest and dividend expenses on securities sold short); acquired fund fees and expenses; fees and expenses associated with investments in other collective investment vehicles or derivative instruments (including for example option and swap fees and expenses); any administrative and/or shareholder servicing fees payable pursuant to a plan adopted by the Board; expenses incurred in connection with any merger or reorganization; extraordinary expenses (such as litigation expenses, indemnification of Trust officers and Trustees and contractual indemnification of Fund service providers); and other expenses that the Trustees agree have not been incurred in the ordinary course of the Fund’s business, do not exceed 1.79% of the Absolute Strategies Fund’s average daily net assets. Prior to September 8, 2023, the expense cap was 1.99%. During the year, Absolute Strategies Fund invested in Absolute Capital Opportunities Fund, Absolute Convertible Arbitrage Fund, Absolute Flexible Fund and the Absolute Select Value ETF. As of September 30, 2023, Absolute Strategies Fund owned approximately 8.4%, 25.3% and 1.2% of Absolute Capital Opportunities Fund, Absolute Flexible Fund and Absolute Select Value ETF, respectively. The Adviser has agreed to waive its investment advisory fees related to any Fund assets invested in pooled vehicles sponsored by Absolute. For the six months ended September 30, 2023, the Adviser waived fees of $73,187 related to these pooled vehicles sponsored by Absolute and this waiver is not subject to recoupment.
The Adviser has contractually agreed to waive its management fee and/or reimburse certain operating expenses, but only to the extent necessary so that the Fund’s total annual operating expenses, excluding portfolio transaction and other investment-related costs (including brokerage fees and commissions); taxes; borrowing costs (such as interest and dividend expenses on securities sold short); acquired fund fees and expenses; fees and expenses associated with investments in other collective investment vehicles or derivative instruments (including for example option and swap fees and expenses); any administrative and/or shareholder servicing fees payable pursuant to a plan adopted by the Board; expenses incurred in connection with any merger or reorganization; extraordinary expenses (such as litigation expenses, indemnification of Trust officers and Trustees and contractual indemnification of Fund service providers); and other expenses that the Trustees agree have not been incurred in the ordinary course of the Fund’s business, do not exceed 1.48% of the Absolute Capital Opportunities Fund’s average daily net assets and 1.48% of the Absolute Flexible Fund’s average daily net assets. The contractual agreement is in place
60
| Absolute Funds |
| Notes to the Financial Statements (Unaudited) (continued) |
| September 30, 2023 |
through at least July 31, 2025. Prior to September 8, 2023, the expense cap was 1.48%. The Adviser waived fees of $89,115 and $73,947 for Absolute Capital Opportunities Fund and Absolute Flexible Fund, respectively, for the six months ended September 30, 2023. The Adviser waived fees of $146,612 for Absolute Flexible Fund for the period June 30, 2022 (commencement of operations) through September 30, 2023.
The Adviser has also contractually agreed to waive its management fee and/or reimburse certain operating expenses, but only to the extent necessary so that the Fund’s total annual operating expenses, excluding portfolio transaction and other investment-related costs (including brokerage fees and commissions); taxes; borrowing costs (such as interest and dividend expenses on securities sold short); acquired fund fees and expenses; fees and expenses associated with investments in other collective investment vehicles or derivative instruments (including for example option and swap fees and expenses); any administrative and/or shareholder servicing fees payable pursuant to a plan adopted by the Board; expenses incurred in connection with any merger or reorganization; extraordinary expenses (such as litigation expenses, indemnification of Trust officers and Trustees and contractual indemnification of Fund service providers); and other expenses that the Trustees agree have not been incurred in the ordinary course of the Fund’s business, do not exceed 1.20% and 1.45% of the Absolute Convertible Arbitrage Fund’s average daily net assets of the Institutional Shares and Investor Shares, respectively, through at least July 31, 2025. The Adviser waived fees of $829,868 for Absolute Convertible Arbitrage Fund for the six months ended September 30, 2023. In addition, the Adviser has agreed to waive fees owed to it by the Absolute Convertible Arbitrage Fund in an amount equal to the fee it receives from Absolute Flexible Fund based on Absolute Convertible Arbitrage Fund’s investment in Absolute Flexible Fund. As of September 30, 2023, Absolute Convertible Arbitrage Fund owned approximately 73.3% of Absolute Flexible Fund. For the six months ended September 30, 2023, the Adviser waived management fees of $124,964 for Absolute Convertible Arbitrage Fund related to this investment in a pooled vehicle sponsored by Absolute and this waiver is not subject to recoupment.
The Funds may repay the Adviser for fees waived (other than management fees waived by the Adviser related to the Absolute Strategies Fund and Absolute Convertible Arbitrage’s investments in other pooled vehicles sponsored by the Adviser) and expenses reimbursed pursuant to the expense cap if such payment is made within three years of the fee waiver or expense reimbursement and does not cause the total annual fund operating expenses after fee waiver and/or expense reimbursement of the Funds to exceed the lesser of (i) the then-current expense cap, and (ii) the expense cap in place at the time the fees/expenses were waived/reimbursed. As of September 30, 2023, $505,623, $4,250,582 and $220,560 for Absolute Capital Opportunities Fund, Absolute Convertible Arbitrage Fund and Absolute Flexible Fund, respectively, is subject to recapture by the Adviser. Other waivers are not eligible for recoupment.
61
| Absolute Funds |
| Notes to the Financial Statements (Unaudited) (continued) |
| September 30, 2023 |
Ultimus Fund Solutions, LLC (“Ultimus”) provides administration, fund accounting and transfer agent services to the Funds. The Funds pay Ultimus fees in accordance with the agreements for such services.
Northern Lights Compliance Services, LLC (“NLCS”), an affiliate of Ultimus, provides a Chief Compliance Officer to the Trust, as well as related compliance services, pursuant to a consulting agreement between NLCS and the Trust. Under the terms of such agreement, NLCS receives fees from the Funds, which are approved annually by the Board.
Prior to September 8, 2023, Apex Fund Services provided fund accounting, fund administration, compliance and transfer agency services to each Fund.
Under the terms of a Distribution Agreement with the Trust, Ultimus Fund Distributors, LLC (the “Distributor”) serves as principal underwriter to the Funds. The Distributor is a wholly-owned subsidiary of Ultimus. The Distributor is compensated by the Adviser (not the Funds) for acting as principal underwriter. Prior to September 8, 2023, Foreside Fund Services, LLC served as the Funds’ distributor. The Trust has adopted a Rule 12b-1 plan under which each Fund pays the Distributor a fee up to 0.25% of the average daily net assets of Investor Shares of Convertible Arbitrage Fund for distribution services and/or the servicing of shareholder accounts.
Certain officers of the Trust are also employees of Ultimus and such persons are not paid by the Funds for serving in such capacities. One Trustee is a former employee of Ultimus who is not currently paid by the Funds for serving in such capacity.
The Board supervises the business activities of the Trust. Each Trustee serves as a trustee until termination of the Trust unless the Trustee dies, resigns, retires, or is removed. The Chair of the Board and more than 75% of the Trustees are “Independent Trustees”, which means that they are not “interested persons” as defined in the 1940 Act. The Independent Trustees review and establish compensation at least annually. Each Independent Trustee of the Trust receives annual compensation, which is an established amount paid quarterly per fund in the Trust at the time of the regular quarterly Board meetings. The Chair of the Board receives the highest compensation, commensurate with his additional duties and each Chair of a committee receives additional compensation as well. Independent Trustees also receive additional fees for attending any special meetings. In addition, the Trust reimburses Independent Trustees for out-of-pocket expenses incurred in conjunction with attendance at meetings.
62
| Absolute Funds |
| Notes to the Financial Statements (Unaudited) (continued) |
| September 30, 2023 |
NOTE 6. INVESTMENT TRANSACTIONS
For the six months ended September 30, 2023, purchases and sales of investment securities, other than short-term investments, were as follows:
| Purchases | Sales | |||||||
| Absolute Strategies Fund | $ | 2,213,008 | $ | 2,465,370 | ||||
| Absolute Capital Opportunities Fund | 5,327,387 | 20,017,849 | ||||||
| Absolute Convertible Arbitrage Fund | 263,498,620 | 179,983,891 | ||||||
| Absolute Flexible Fund | 8,541,008 | 9,749,372 | ||||||
There were no purchases or sales of long-term U.S. government obligations during the six months ended September 30, 2023.
NOTE 7. FEDERAL INCOME TAX
At September 30, 2023, the net unrealized appreciation (depreciation) and tax cost of investments for tax purposes was as follows:
| Absolute | ||||||||||||||||
| Capital | Absolute | |||||||||||||||
| Absolute | Opportunities | Convertible | Absolute | |||||||||||||
| Strategies Fund | Fund | Arbitrage Fund | Flexible Fund | |||||||||||||
| Gross unrealized appreciation | $ | 148,648 | $ | 16,844,548 | $ | 34,416,678 | $ | 321,031 | ||||||||
| Gross unrealized depreciation | (408,116 | ) | (5,915,678 | ) | (84,552,771 | ) | (973,827 | ) | ||||||||
| Net unrealized appreciation/ (depreciation) on investments | $ | (259,468 | ) | $ | 10,928,870 | $ | (50,136,093 | ) | $ | (652,796 | ) | |||||
| Tax cost of investments | $ | 18,850,113 | $ | 73,002,294 | $ | 1,150,124,476 | $ | 27,325,337 | ||||||||
The tax character of distributions paid for the fiscal year ended March 31, 2023, the Funds’ most recent fiscal year end, were as follows:
| Absolute | ||||||||
| Convertible | Absolute | |||||||
| Arbitrage Fund | Flexible Fund | |||||||
| Distributions paid from: | ||||||||
| Ordinary income(a) | $ | 14,436,705 | $ | 434,016 | ||||
| Long-term capital gains | 17,433,090 | — | ||||||
| Total distributions paid | $ | 31,869,795 | $ | 434,016 | ||||
| (a) | Short-term capital gain distributions are treated as ordinary income for tax purposes. |
63
| Absolute Funds |
| Notes to the Financial Statements (Unaudited) (continued) |
| September 30, 2023 |
At March 31, 2023, the Funds’ most recent fiscal year end, the components of accumulated earnings (deficit) on a tax basis were as follows:
| Absolute | ||||||||||||||||
| Capital | Absolute | |||||||||||||||
| Absolute | Opportunities | Convertible | Absolute | |||||||||||||
| Strategies Fund | Fund | Arbitrage Fund | Flexible Fund | |||||||||||||
| Undistributed ordinary income | $ | — | $ | — | $ | 7,603,715 | $ | 480,163 | ||||||||
| Accumulated capital and other losses | (36,818,353 | ) | (25,313,622 | ) | (1,808,917 | ) | — | |||||||||
| Unrealized appreciation/ (depreciation) on investments | (547,240 | ) | 4,500,013 | (15,399,161 | ) | 173,652 | ||||||||||
| Other temporary differences | — | (226,027 | ) | — | — | |||||||||||
| Total accumulated earnings | $ | (37,365,593 | ) | $ | (21,039,636 | ) | $ | (9,604,363 | ) | $ | 653,815 | |||||
The difference between components of distributable earnings on a tax basis and the amounts reflected in the Statements of Assets and Liabilities are primarily due to return of capital on equity securities, convertible bond deemed dividends, wash sales, futures, constructive sales, convertible bond premium amortization, straddles, cover loss deferrals, contingent payment debt instruments and deferred business interest expense.
As of March 31, 2023, the Absolute Strategies Fund and the Absolute Capital Opportunities Fund have $36,818,353 and $25,313,622 of available short-term capital loss carryforwards, respectively, not subject to expiration.
For tax purposes, the current deferred post October short-term and long-term losses are $1,808,917 for the Absolute Convertible Arbitrage Fund (realized during the period November 1, 2022 through March 31, 2023). These losses will be recognized for tax purposes on the first business day of the Fund’s current fiscal year, April 1, 2023.
NOTE 8. COMMITMENTS AND CONTINGENCIES
The Trust indemnifies its officers and Trustees for certain liabilities that may arise from their performance of their duties to the Trust or the Funds. Additionally, in the normal course of business, the Trust enters into contracts that contain a variety of representations and warranties which provide general indemnifications. The Trust’s maximum exposure under these arrangements is unknown, as this would involve future claims that may be made against the Trust that have not yet occurred.
NOTE 9. SUBSEQUENT EVENTS
Management of the Funds has evaluated the need for disclosures and/or adjustments resulting from subsequent events through the date at which these financial statements were issued. Based upon this evaluation, management has determined there were no items requiring adjustment of the financial statements or additional disclosure.
64
| Summary of Fund Expenses (Unaudited) |
As a shareholder of a Fund, you incur two types of costs: (1) transaction costs and (2) ongoing costs, including management fees, distribution (12b-1) fees and other Fund expenses. These examples are intended to help you understand your ongoing costs (in dollars) of investing in each Fund and to compare these costs with the ongoing costs of investing in other funds. Each Fund’s example is based on an investment of $1,000 invested at the beginning of the period and held for the entire period from April 1, 2023 through September 30, 2023.
Actual Expenses
The first line of the table for each Fund provides information about actual account values and actual expenses. You may use the information in these lines, together with the amount you invested, to estimate the expenses that you paid over the period. Simply divide your account value by $1,000 (for example, an $8,600 account value divided by $1,000 = 8.6), then multiply the result by the number in the first line under the heading “Expenses Paid During Period” to estimate the expenses you paid on your account during this period.
Hypothetical Example for Comparison Purposes
The second line of the table for each Fund provides information about hypothetical account values and hypothetical expenses based on each Fund’s actual expense ratios and an assumed rate of return of 5% per year before expenses, which is not the Fund’s actual return. The hypothetical account values and expenses may not be used to estimate the actual ending account balances or expenses you paid for the period. You may use this information to compare the ongoing costs of investing in the Funds and other funds. To do so, compare this 5% hypothetical example with the 5% hypothetical examples that appear in the shareholder reports of other funds.
Expenses shown in the table are meant to highlight your ongoing costs only and do not reflect any transactional costs. Therefore, the second line of the table is useful in comparing ongoing costs only and will not help you determine the relative total costs of owning different funds. In addition, if transaction costs were included, your costs would have been higher.
65
| Summary of Fund Expenses (Unaudited) |
| Beginning | Ending | |||||||||||||||
| Account Value | Account Value | Expenses Paid | Annualized | |||||||||||||
| April 1, | September 30, | During | Expense | |||||||||||||
| 2023 | 2023 | Period(a) | Ratio | |||||||||||||
| Absolute Strategies Fund | ||||||||||||||||
| Institutional Shares | Actual | $ | 1,000.00 | $ | 955.30 | $ | 8.73 | 1.78% | ||||||||
| Hypothetical(b) | $ | 1,000.00 | $ | 1,016.14 | $ | 9.00 | 1.78% | |||||||||
| Absolute Capital Opportunities Fund | ||||||||||||||||
| Institutional Shares | Actual | $ | 1,000.00 | $ | 1,001.70 | $ | 7.48 | 1.49% | ||||||||
| Hypothetical(b) | $ | 1,000.00 | $ | 1,024.33 | $ | 7.54 | 1.49% | |||||||||
| Absolute Convertible Arbitrage Fund | ||||||||||||||||
| Institutional Shares | Actual | $ | 1,000.00 | $ | 1,023.60 | $ | 6.96 | 1.37% | ||||||||
| Hypothetical(b) | $ | 1,000.00 | $ | 1,024.22 | $ | 6.94 | 1.37% | |||||||||
| Investor Shares | Actual | $ | 1,000.00 | $ | 1,022.40 | $ | 8.22 | 1.62% | ||||||||
| Hypothetical(b) | $ | 1,000.00 | $ | 1,024.13 | $ | 8.20 | 1.62% | |||||||||
| Absolute Flexible Fund | ||||||||||||||||
| Institutional Shares | Actual | $ | 1,000.00 | $ | 1,014.10 | $ | 7.53 | 1.49% | ||||||||
| Hypothetical(b) | $ | 1,000.00 | $ | 1,017.59 | $ | 7.55 | 1.49% | |||||||||
| (a) | Expenses are equal to the Fund’s annualized expense ratios, multiplied by the average account value over the period, multiplied by 183/365 (to reflect the one-half year period). |
| (b) | Hypothetical assumes 5% annual return before expenses. |
66
| Management and Sub-Advisory Agreement Approval (Unaudited) |
The Absolute Capital Opportunities Fund (“CAPOX”), Absolute Convertible Arbitrage Fund (“ARBIX/ARBOX”), Absolute Flexible Fund (“FLXIX”), and Absolute Strategies Fund (“ASFIX”) (each, a “Fund”, together, the “Funds”) are series of Unified Series Trust (the “Trust”). The Trust’s Board of Trustees (the “Board” or “Trustees”) oversees the management of the Funds and, as required by law, has considered the approval of each Fund’s management agreement with its proposed investment adviser, Absolute Investment Advisers LLC (“Absolute”), as well as the sub-advisory agreement between Absolute and Kovitz Investment Group Partners, LLC (both before and after the pending change of control “Kovitz”) on behalf of CAPOX pursuant to which Kovitz is the proposed sub-adviser to CAPOX. In connection with such approvals, the Board requested and evaluated all information that the Trustees deemed reasonably necessary under the circumstances.
The Trustees held a teleconference on May 10, 2023 to review and discuss materials compiled by Ultimus Fund Solutions, LLC, the Trust’s administrator, with regard to the approval of the management agreements between the Trust and Absolute and the sub-advisory agreement between Absolute and Kovitz. The Trustees noted that each Fund has a corresponding fund (each an “Existing Fund”) that is currently offered as a series of the Forum Funds (the “Selling Trust”). The Trustees recalled each Existing Fund would reorganize into its corresponding Fund in the Trust upon approval of the Selling Trust’s Board of Trustees, the Board, and shareholders of the applicable Existing Fund. At the Trustees’ quarterly meeting held in May 2023, the Board interviewed certain executives of Absolute and Kovitz, including Absolute’s Chief Compliance Officer and its Managing Principals, and Kovitz’ Chief Compliance Officer and its Principal. The Trust’s CCO and Assistant CCO completed a review of Absolute’s and Kovitz’ Code of Ethics and compliance program and reported to the Board. At a special meeting held in June 2023, the Board considered and approved a proposal from Absolute to lower the management fee for ARBIX/ARBOX. After a thorough discussion reviewing all of the information provided and based upon various factors discussed below and their related conclusions, the Trustees, including the Trustees who are not “interested persons” (as that term is defined in the Investment Company Act of 1940, as amended) of the Trust, Absolute or Kovitz (the “Independent Trustees”), unanimously approved the management agreements between the Trust and Absolute, and the sub-advisory agreement between Absolute and Kovitz, each for an initial period of two years. The Trustees’ approval of each Fund’s management agreement and CAPOX’s sub-advisory agreement was based on a consideration of all the information provided to the Trustees, and was not the result of any single factor. Some of the factors that figured particularly in the Trustees’ deliberations are described below, although individual Trustees may have evaluated this information differently, ascribing different weights to various factors.
(i) The Nature, Extent, and Quality of Services. The Trustees reviewed and considered information regarding the nature, extent, and quality of services that Absolute provides to the Existing Funds, and will provide to the Funds, as well as the services that
67
| Management and Sub-Advisory Agreement Approval (Unaudited) (continued) |
Kovitz will provide to CAPOX and currently provides to the corresponding Existing Fund of CAPOX. The Trustees noted that the services to be provided include but are not limited to, providing a continuous investment program for each Fund, adhering to each Fund’s investment restrictions, complying with the Trust’s policies and procedures, and voting proxies on behalf of the Funds. The Trustees acknowledged the qualifications and experience of the proposed portfolio managers to each Fund, and noted that Absolute will oversee Kovitz’s sub-advisory services to CAPOX. The Trustees considered the backgrounds of other individuals at each of Absolute and Kovitz who will provide or continue to provide services to the Funds, considering their education and financial industry experience. The Trustees concluded that they are satisfied with the nature, extent, and high quality of investment management services that each of Absolute and Kovitz propose to provide to the Funds.
(ii) Fund Performance. The Trustees next reviewed and discussed each Existing Fund’s performance for periods ended February 28, 2023.
The Trustees observed that CAPOX had underperformed its Morningstar Equity Market Neutral category and peer group for the one-, three-, and five-year periods, but outperformed its Morningstar category and peer group over the since-inception period. The Trustees observed that CAPOX had underperformed its benchmark, the S&P 500 Index, for the three- and five-year and since-inception periods, but outperformed its benchmark over the one-year period. The Trustees noted Absolute’s explanation that the Fund’s strategy does not align well with the category or benchmark in that it is not a pure market neutral strategy and may be net long, short, or neutral depending on the market environment. It was the consensus of the Trustees that it was reasonable to conclude that Absolute and Kovitz have the ability to manage CAPOX successfully from a performance standpoint.
The Trustees observed that ARBIX/ARBOX had outperformed its Morningstar Relative Value Arbitrage category, peer group, and primary benchmark, the Bloomberg US Aggregate Bond Index, across all periods It was the consensus of the Trustees that it was reasonable to conclude that Absolute has the ability to manage the Fund successfully from a performance standpoint.
The Trustees observed that FLXIX had outperformed its Morningstar Convertibles category and peer group for the since-inception period beginning June 30, 2022 and ended February 28, 2023. The Trustees observed that the Fund underperformed its benchmark, the S&P 500 Index, for the same period. The Trustees considered Absolute’s explanation that the benchmark provided in the Broadridge report is not a relevant primary benchmark for the Fund and Absolute would expect significant deviations when compared to the benchmark during times of increased volatility. It was the consensus of the Trustees that it was reasonable to conclude that Absolute has the ability to manage the Fund successfully from a performance standpoint.
68
| Management and Sub-Advisory Agreement Approval (Unaudited) (continued) |
The Trustees observed that ASFIX had underperformed its Morningstar Multistrategy category and peer group for the one-, three- and five-year periods and performed in line with each over the since-inception period. The Trustees observed that the Fund underperformed its benchmark, the S&P 500 Index, for all periods except the one-year period. The Trustees considered Absolute’s explanation that the Fund’s positioning has led the Fund to exhibit negative sensitivity to traditional stocks and bonds in recent years. The Trustees also considered Absolute’s discussion about the Fund’s multi-strategy approach compared to certain peers with exposure to managed futures and/or other quantitative trend following strategies which performed well over the last several years. It was the consensus of the Trustees that it was reasonable to conclude that Absolute and St. James have the ability to manage the Fund successfully from a performance standpoint.
(iii) Fee Rate and Profitability. The Trustees noted that the proposed management fee for each Fund is higher than the medians and averages of each Fund’s respective Morningstar category and peer group. The Trustees noted that each Fund’s net expenses are higher than the medians and averages of its respective Morningstar category and peer group with the exception of ARBIX/ARBOX, where the net expense ratio is equal to the peer group and Morningstar category median. The Trustees considered profitability analyses prepared by Absolute for its management of each Fund which indicated that Absolute is earning a profit as a result of managing each Existing Fund except FLXIX, and that it expects the same profit/loss to continue following the reorganization and management of the Funds. The Trustees also noted that Absolute is waiving a portion of its fees and/or reimbursing expenses from the Existing Funds pursuant to an expense limitation agreement, that an expense limitation agreement with the same cap for each Existing Fund would remain in place for the Funds after the reorganization.
The Trustees considered other potential benefits that Absolute or Kovitz may receive in connection with the management of each Fund. With respect to CAPOX, the Trustees determined the services provided are not duplicative as between adviser and sub-adviser. After considering the above information, the Trustees concluded that the management fee for each Fund, and the sub-advisory fee for CAPOX, represent reasonable compensation in light of the nature and quality of services to be provided to the Funds.
(iv) Economies of Scale. In determining the reasonableness of the management fees, and sub-advisory fee for CAPOX, the Trustees also considered the extent to which Absolute or Kovitz will realize economies of scale as each Fund grows larger. The Trustees determined that, in light of the size of the Existing Funds and the fact that Absolute is still waiving a portion of its management fees, it is premature to reduce the management fees or introduce breakpoints in the management fee at this time.
69
| PRIVACY NOTICE | |
| Rev: May 2023 |
| FACTS | WHAT DOES ABSOLUTE FUNDS (THE “FUNDS”) DO WITH YOUR PERSONAL INFORMATION? |
| Why? | Financial companies choose how they share your personal information. Federal law gives consumers the right to limit some but not all sharing. Federal law also requires us to tell you how we collect, share, and protect your personal information. Please read this notice carefully to understand what we do. |
| What? | The types of personal information we collect and share depend on the product or service you have with us. This information can include:
● Social Security number
● account balances and account transactions
● transaction or loss history and purchase history
● checking account information and wire transfer instructions
When you are no longer our customer, we continue to share your information as described in this notice. |
| How? | All financial companies need to share customers’ personal information to run their everyday business. In the section below, we list the reasons financial companies can share their customers’ personal information; the reasons the Funds choose to share; and whether you can limit this sharing. |
| Reasons we can share your personal information | Do the Funds share? |
For our everyday business purposes— such as to process your transactions, maintain your account(s), respond to court orders and legal investigations, or report to credit bureaus | Yes |
For our marketing purposes— to offer our products and services to you | No |
| For joint marketing with other financial companies | No |
For our affiliates’ everyday business purposes— information about your transactions and experiences | No |
For our affiliates’ everyday business purposes— information about your creditworthiness | No |
| For nonaffiliates to market to you | No |
| Questions? | Call (888) 992-2765 |
70
| Who we are | |
| Who is providing this notice? | Absolute Funds Ultimus Fund Distributors, LLC (Distributor) Ultimus Fund Solutions, LLC (Administrator) |
| What we do | |
| How do the Funds protect my personal information? | To protect your personal information from unauthorized access and use, we use security measures that comply with federal law. These measures include computer safeguards and secured files and buildings. Our service providers are held accountable for adhering to strict policies and procedures to prevent any misuse of your nonpublic personal information. |
| How do the Funds collect my personal information? | We collect your personal information, for example, when you
● open an account or deposit money
● buy securities from us or sell securities to us
● make deposits or withdrawals from your account or provide account information
● give us your account information
● make a wire transfer
● tell us who receives the money
● tell us where to send the money
● show your government-issued ID
● show your driver’s license |
| Why can’t I limit all sharing? | Federal law gives you the right to limit only
● sharing for affiliates’ everyday business purposes— information about your creditworthiness
● affiliates from using your information to market to you
● sharing for nonaffiliates to market to you
State laws and individual companies may give you additional rights to limit sharing. |
| Definitions | |
| Affiliates | Companies related by common ownership or control. They can be financial and nonfinancial companies.
● Absolute Investment Advisers LLC., the investment adviser to the Funds, could be deemed to be an affiliate. |
| Nonaffiliates | Companies not related by common ownership or control. They can be financial and nonfinancial companies.
● The Funds do not share your personal information with nonaffiliates so they can market to you |
| Joint marketing | A formal agreement between nonaffiliated financial companies that together market financial products or services to you.
● The Fund don’t jointly market. |
71
| This page is intentionally left blank. |
| This page is intentionally left blank. |
Proxy Voting
A description of the policies and procedures that the Funds use to determine how to vote proxies relating to portfolio securities and information regarding how the Funds voted those proxies during the most recent twelve month period ended June 30, are available (1) without charge upon request by calling the Funds at (888) 992-2765 and (2) in Fund documents filed with the SEC on the SEC’s website at www.sec.gov.
| TRUSTEES Daniel J. Condon, Chair David R. Carson Kenneth G.Y. Grant Freddie Jacobs, Jr. Catharine B. McGauley Ronald C. Tritschler OFFICERS Martin R. Dean, President Gweneth K. Gosselink, Chief Compliance Officer Zachary P. Richmond, Treasurer and Chief Financial Officer INVESTMENT ADVISER Absolute Investment Advisers LLC 82 South Barrett Square, Unit 4G Rosemary Beach, FL 32461 DISTRIBUTOR Ultimus Fund Distributors, LLC 225 Pictoria Drive, Suite 450 Cincinnati, OH 45246 | INDEPENDENT REGISTERED PUBLIC ACCOUNTING FIRM Cohen & Company, Ltd. 151 North Franklin Street, Suite 575 Chicago, IL 60606 LEGAL COUNSEL Thompson Hine LLP 312 Walnut Street, 20th Floor Cincinnati, OH 45202 CUSTODIAN U.S. Bank, N.A. 425 Walnut Street Cincinnati, OH 45202 ADMINISTRATOR Ultimus Fund Solutions, LLC 225 Pictoria Drive, Suite 450 Cincinnati, OH 45246 |
This report is intended only for the information of shareholders or those who have received the Funds’ prospectus which contains information about the Funds’ management fee and expenses. Please read the prospectus carefully before investing.
Distributed by Ultimus Fund Distributors, LLC Member FINRA/SIPC
| Absolute MF-SAR-23 |

| DEAN FUNDS |
Dean Small Cap Value Fund
Dean Mid Cap Value Fund
Dean Equity Income Fund
Semi-Annual Report
September 30, 2023
| Investment Results (Unaudited) |
Average Annual Total Returns(a) as of September 30, 2023
| Six Months | One Year | Five Years | Ten Years | |||||
| Dean Small Cap Value Fund | (7.03)% | 6.12% | 5.16% | 6.56% | ||||
| Russell 2000 Value Index(b) | 0.13% | 7.84% | 2.59% | 6.19% | ||||
| Russell 2000 Index(b) | (0.19)% | 8.93% | 2.40% | 6.65% |
Total annual operating expenses, as disclosed in the Dean Small Cap Value Fund (the “Fund”) prospectus dated July 29, 2023, were 1.14% of the Fund’s average daily net assets. Dean Investment Associates, LLC (the “Adviser”) has contractually agreed to waive its management fee and/or to reimburse certain Fund operating expenses through July 31, 2024, but only to the extent necessary so that total annual operating expenses (excluding portfolio transaction and other investment-related costs (including brokerage fees and commissions); taxes; borrowing costs (such as interest and dividend expenses on securities sold short); acquired fund fees and expenses; fees and expenses associated with investments in other collective investment vehicles or derivative instruments (including for example option and swap fees and expenses); any amounts payable pursuant to a distribution or service plan adopted in accordance with Rule 12b-1 under the Investment Company Act of 1940, as amended; expenses incurred in connection with any merger or reorganization; extraordinary expenses (such as litigation expenses, indemnification of Trust officers and Trustees and contractual indemnification of Fund service providers)) do not exceed 1.25% of the Fund’s average daily net assets. Each waiver/expense payment by the Adviser is subject to recoupment by the Adviser from the Fund in the three years following the date the particular waiver/expense payment occurred, but only if such recoupment can be achieved without exceeding the annual expense limitation in effect at the time of the waiver/ expense payment and any expense limitation in effect at the time of recoupment. This expense limitation agreement may not be terminated prior to July 31, 2024, except by the Board of Trustees upon sixty days’ written notice to the Adviser. Additional information pertaining to the expense ratios as of September 30, 2023 can be found in the financial highlights.
The performance quoted represents past performance, which does not guarantee future results. The investment return and principal value of an investment will fluctuate so that an investor’s shares, when redeemed, may be worth more or less than their original cost. The returns shown do not reflect deduction of taxes that a shareholder would pay on Fund distributions or the redemption of Fund shares. Current performance may be lower or higher than the performance quoted. The Fund’s investment objective, risks, charges and expenses should be considered carefully before investing. Performance data current to the most recent month end may be obtained by calling (888) 899-8343.
| (a) | Return figures reflect any change in price per share and assume the reinvestment of all distributions. |
| (b) | The Russell 2000 Index is an equity index that measures the performance of the 2,000 smallest companies in the Russell 3000 Index, which is made up of 3,000 of the biggest U.S. stocks. The Russell 2000 Value Index is an unmanaged index of common stock prices that measures the performance of those Russell 2000 companies with lower price-to-book ratios forecasted growth values. The indices are representative of a broader market and range of securities than are found in the Fund’s portfolio. An individual cannot invest directly in an index or the indices. However, an individual may be able to invest in exchange traded funds or other investment vehicles that attempt to track the performance of an index. |
1
| Investment Results (Unaudited) (continued) |
You should consider the Fund’s investment objective, risks, charges and expenses carefully before you invest. The Fund’s prospectus contains important information about the Fund’s investment objective, potential risks, management fees, charges and expenses, and other information and should be read carefully before investing. You may obtain a current copy of the Fund’s prospectus or performance data current to the most recent month end by calling (888) 899-8343.
The Fund is distributed by Ultimus Fund Distributors, LLC, member FINRA/SIPC.
2
| Investment Results (Unaudited) (continued) |
Average Annual Total Returns(a) as of September 30, 2023
| Six Months | One Year | Five Years | Ten Years | |||||
| Dean Mid Cap Value Fund | 0.67% | 13.58% | 6.08% | 8.29% | ||||
| Russell Midcap Value Index(b) | (0.77)% | 11.05% | 5.18% | 7.92% | ||||
| Russell Midcap Index(b) | (0.14)% | 13.45% | 6.38% | 8.98% |
Total annual operating expenses, as disclosed in the Dean Mid Cap Value Fund, the (“Fund”) prospectus dated July 29, 2023, were 1.08% of the Fund’s average daily net assets. Dean Investment Associates, LLC (the “Adviser”) has contractually agreed to waive its management fee and/or to reimburse certain Fund operating expenses through July 31, 2024, but only to the extent necessary so that total annual operating expenses (excluding portfolio transaction and other investment-related costs (including brokerage fees and commissions); taxes; borrowing costs (such as interest and dividend expenses on securities sold short); acquired fund fees and expenses; fees and expenses associated with investments in other collective investment vehicles or derivative instruments (including for example option and swap fees and expenses); any amounts payable pursuant to a distribution or service plan adopted in accordance with Rule 12b-1 under the Investment Company Act of 1940, as amended; expenses incurred in connection with any merger or reorganization; extraordinary expenses (such as litigation expenses, indemnification of Trust officers and Trustees and contractual indemnification of Fund service providers)) do not exceed 0.85% of the Fund’s average daily net assets. Each waiver/expense payment by the Adviser is subject to recoupment by the Adviser from the Fund in the three years following the date the particular waiver/expense payment occurred, but only if such recoupment can be achieved without exceeding the annual expense limitation in effect at the time of the waiver/ expense payment and any expense limitation in effect at the time of recoupment. This expense limitation agreement may not be terminated prior to July 31, 2024, except by the Board of Trustees upon sixty days’ written notice to the Adviser. Additional information pertaining to the expense ratios as of September 30, 2023 can be found in the financial highlights.
The performance quoted represents past performance, which does not guarantee future results. The investment return and principal value of an investment will fluctuate so that an investor’s shares, when redeemed, may be worth more or less than their original cost. The returns shown do not reflect deduction of taxes that a shareholder would pay on Fund distributions or the redemption of Fund shares. Current performance may be lower or higher than the performance quoted. The Fund’s investment objective, risks, charges and expenses should be considered carefully before investing. Performance data current to the most recent month end may be obtained by calling (888) 899-8343.
| (a) | Return figures reflect any change in price per share and assume the reinvestment of all distributions. The Fund’s returns reflect any fee reductions during the applicable periods. If such fee reductions had not occurred, the quoted performance would have been lower. |
| (b) | The Russell Midcap Index is a market capitalization weighted index representing the smallest 800 companies in the Russell 1000 Index. The Russell Midcap Value Index is an unmanaged index of common stock prices that measures the performance of those Russell Midcap companies with lower price-to-book ratios and lower forecasted growth values. The indices are representative of a broader market and range of securities than are found in the Fund’s portfolio. An individual cannot invest directly in an index. However, an individual may be able to invest in exchange traded funds or other investment vehicles that attempt to track the performance of an index. |
3
| Investment Results (Unaudited) (continued) |
You should consider the Fund’s investment objective, risks, charges and expenses carefully before you invest. The Fund’s prospectus contains important information about the Fund’s investment objective, potential risks, management fees, charges and expenses, and other information and should be read carefully before investing. You may obtain a current copy of the Fund’s prospectus or performance data current to the most recent month end by calling (888) 899-8343.
The Fund is distributed by Ultimus Fund Distributors, LLC, member FINRA/SIPC.
4
| Investment Results (Unaudited) (continued) |
Average Annual Total Returns(a) as of September 30, 2023
| Since | ||||
| Inception | ||||
| Six Months | (11/22/2022) | |||
| Dean Equity Income Fund | (3.84)% | (6.39)% | ||
| Russell 1000 Value Index(d) | 0.78% | (0.86)% |
Total annual operating expenses, as disclosed in the Dean Equity Income Fund, the (“Fund”) prospectus dated July 29, 2023, were 1.04% of the Fund’s average daily net assets. Dean Investment Associates, LLC (the “Adviser”) has contractually agreed to waive its management fee and/or to reimburse certain Fund operating expenses through July 31, 2024, but only to the extent necessary so that total annual operating expenses (excluding portfolio transaction and other investment-related costs (including brokerage fees and commissions); taxes; borrowing costs (such as interest and dividend expenses on securities sold short); acquired fund fees and expenses; fees and expenses associated with investments in other collective investment vehicles or derivative instruments (including for example option and swap fees and expenses); any amounts payable pursuant to a distribution or service plan adopted in accordance with Rule 12b-1 under the Investment Company Act of 1940, as amended; expenses incurred in connection with any merger or reorganization; extraordinary expenses (such as litigation expenses, indemnification of Trust officers and Trustees and contractual indemnification of Fund service providers)) do not exceed 0.70% of the Fund’s average daily net assets. Each waiver/expense payment by the Adviser is subject to recoupment by the Adviser from the Fund in the three years following the date the particular waiver/expense payment occurred, but only if such recoupment can be achieved without exceeding the annual expense limitation in effect at the time of the waiver/ expense payment and any expense limitation in effect at the time of recoupment. This expense limitation agreement may not be terminated prior to July 31, 2024, except by the Board of Trustees upon sixty days’ written notice to the Adviser. Additional information pertaining to the expense ratios as of September 30, 2023 can be found in the financial highlights.
The performance quoted represents past performance, which does not guarantee future results. The investment return and principal value of an investment will fluctuate so that an investor’s shares, when redeemed, may be worth more or less than their original cost. The returns shown do not reflect deduction of taxes that a shareholder would pay on Fund distributions or the redemption of Fund shares. Current performance may be lower or higher than the performance quoted. The Fund’s investment objective, risks, charges and expenses should be considered carefully before investing. Performance data current to the most recent month end may be obtained by calling (888) 899-8343.
| (a) | Return figures reflect any change in price per share and assume the reinvestment of all distributions. Total returns for less than one year are not annualized. |
| (b) | The Russell 1000 Value Index (the “Index”) is an unmanaged market capitalization weighted index of the 1,000 largest U.S. companies with lower price-to-book ratios and lower forecasted growth values. The Index is a widely recognized unmanaged index of equity prices and are representative of a broader market and range of securities than are found in the Fund’s portfolio. An individual cannot invest directly in an index. However, an individual may be able to invest in exchange traded funds or other investment vehicles that attempt to track the performance of an index. |
5
| Investment Results (Unaudited) (continued) |
You should consider the Fund’s investment objective, risks, charges and expenses carefully before you invest. The Fund’s prospectus contains important information about the Fund’s investment objective, potential risks, management fees, charges and expenses, and other information and should be read carefully before investing. You may obtain a current copy of the Fund’s prospectus or performance data current to the most recent month end by calling (888) 899-8343.
The Fund is distributed by Ultimus Fund Distributors, LLC, member FINRA/SIPC.
6
| Fund Holdings (Unaudited) |
Dean Small Cap Value Fund Holdings as of September 30, 2023*
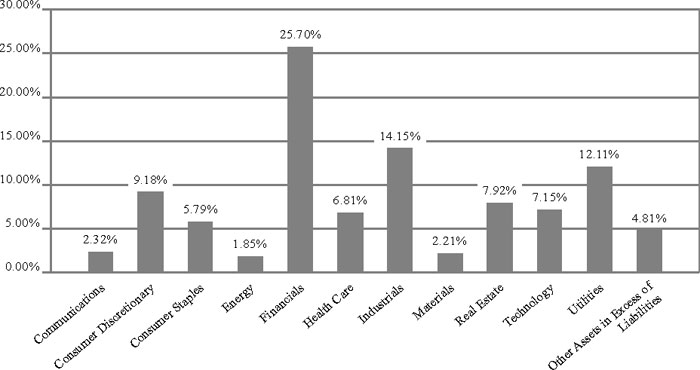
| * | As a percentage of net assets |
The investment objective of the Dean Small Cap Value Fund is long-term capital appreciation and, secondarily, dividend income. Portfolio holdings are subject to change.
7
| Fund Holdings (Unaudited) |
Dean Mid Cap Value Fund Holdings as of September 30, 2023*
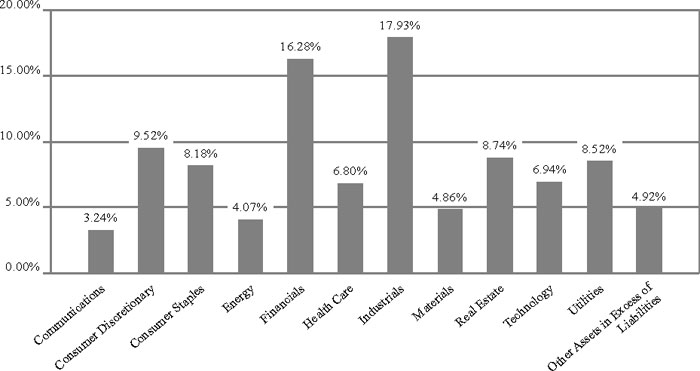
| * | As a percentage of net assets. |
The investment objective of the Dean Mid Cap Value Fund is long-term capital appreciation and, secondarily, dividend income. Portfolio holdings are subject to change.
8
| Fund Holdings (Unaudited) |
Dean Equity Income Fund Holdings as of September 30, 2023*
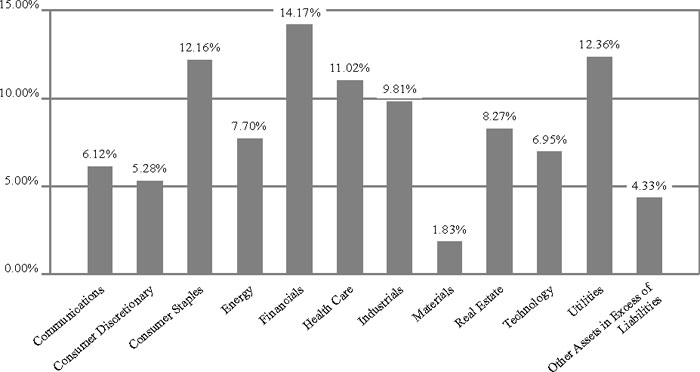
| * | As a percentage of net assets. |
The investment objective of the Dean Equity Income Fund is long-term capital appreciation with an income focus. Portfolio holdings are subject to change.
| Availability of Portfolio Schedule (Unaudited) |
Each Fund files a complete schedule of portfolio holdings with the Securities and Exchange Commission (the “SEC”) for the first and third quarters of each fiscal year as an exhibit to its reports on Form N-PORT. The Funds’ Form N-PORT reports are available on the SEC’s website at www. sec.gov and on the Funds’ website at www.deanmutualfunds.com.
9
| Dean Small Cap Value Fund |
| Schedule of Investments |
| September 30, 2023 - (Unaudited) |
| COMMON STOCKS — 95.19% | Shares | Fair Value | ||||||
| Communications — 2.32% | ||||||||
| TEGNA, Inc. | 304,080 | $ | 4,430,446 | |||||
| Consumer Discretionary — 9.18% | ||||||||
| Advance Auto Parts, Inc. | 15,672 | 876,535 | ||||||
| Carter’s, Inc. | 38,167 | 2,639,248 | ||||||
| Fox Factory Holding Corp.(a) | 9,962 | 987,035 | ||||||
| Johnson Outdoors, Inc., Class A | 33,773 | 1,847,045 | ||||||
| Malibu Boats, Inc., Class A(a) | 11,549 | 566,132 | ||||||
| Silgan Holdings, Inc. | 92,208 | 3,975,087 | ||||||
| Standard Motor Products, Inc. | 88,236 | 2,966,494 | ||||||
| Wendy’s Co. (The) | 180,260 | 3,679,107 | ||||||
| 17,536,683 | ||||||||
| Consumer Staples — 5.79% | ||||||||
| Calavo Growers, Inc. | 53,211 | 1,342,514 | ||||||
| Cal-Maine Foods, Inc. | 79,087 | 3,829,392 | ||||||
| Fresh Del Monte Produce, Inc. | 138,251 | 3,572,406 | ||||||
| SpartanNash Co. | 64,023 | 1,408,506 | ||||||
| TreeHouse Foods, Inc.(a) | 20,896 | 910,648 | ||||||
| 11,063,466 | ||||||||
| Energy — 1.85% | ||||||||
| Dril-Quip, Inc.(a) | 67,911 | 1,913,053 | ||||||
| World Kinect Corp. | 72,649 | 1,629,516 | ||||||
| 3,542,569 | ||||||||
| Financials — 25.70% | ||||||||
| 1st Source Corp. | 61,229 | 2,577,129 | ||||||
| Camden National Corp. | 101,805 | 2,872,937 | ||||||
| Cathay General Bancorp | 102,308 | 3,556,227 | ||||||
| Diamond Hill Investment Group, Inc. | 23,325 | 3,931,895 | ||||||
| Employers Holdings, Inc. | 113,104 | 4,518,504 | ||||||
| Federated Hermes, Inc., Class B | 86,180 | 2,918,917 | ||||||
| Great Southern Bancorp, Inc. | 55,519 | 2,660,470 | ||||||
| Independent Bank Corp. | 54,183 | 2,659,843 | ||||||
| Nelnet, Inc., Class A | 31,343 | 2,799,557 | ||||||
| Open Lending Corp.(a) | 69,733 | 510,446 | ||||||
| PJT Partners, Inc., Class A | 57,494 | 4,567,323 | ||||||
| QCR Holdings, Inc. | 72,400 | 3,512,848 | ||||||
| S&T Bancorp, Inc. | 91,843 | 2,487,108 | ||||||
| Safety Insurance Group, Inc. | 39,483 | 2,692,346 | ||||||
| WaFd, Inc. | 84,068 | 2,153,822 | ||||||
| Waterstone Financial, Inc. | 147,727 | 1,617,611 | ||||||
| White Mountains Insurance Group Ltd. | 2,065 | 3,088,600 | ||||||
| 49,125,583 | ||||||||
| Health Care — 6.81% | ||||||||
| Haemonetics Corp.(a) | 11,298 | 1,012,075 | ||||||
| National Healthcare Corp. | 64,995 | 4,158,380 | ||||||
| Patterson Companies, Inc. | 120,271 | 3,564,832 | ||||||
| Perrigo Co. PLC | 33,530 | 1,071,284 | ||||||
See accompanying notes which are an integral part of these financial statements.
10
| Dean Small Cap Value Fund |
| Schedule of Investments (continued) |
| September 30, 2023 - (Unaudited) |
| COMMON STOCKS — 95.19% - continued | Shares | Fair Value | ||||||
| Health Care — 6.81% - continued | ||||||||
| Prestige Consumer Healthcare, Inc.(a) | 56,248 | $ | 3,216,823 | |||||
| 13,023,394 | ||||||||
| Industrials — 14.15% | ||||||||
| Air Transport Services Group, Inc.(a) | 110,552 | 2,307,220 | ||||||
| Argan, Inc. | 88,732 | 4,039,081 | ||||||
| AZZ, Inc. | 65,724 | 2,995,700 | ||||||
| Brady Corp., Class A | 87,713 | 4,817,198 | ||||||
| Heartland Express, Inc. | 325,271 | 4,778,231 | ||||||
| Seaboard Corp. | 1,336 | 5,014,008 | ||||||
| Werner Enterprises, Inc. | 79,251 | 3,086,826 | ||||||
| 27,038,264 | ||||||||
| Materials — 2.21% | ||||||||
| SSR Mining, Inc. | 112,739 | 1,498,301 | ||||||
| Stepan Co. | 36,471 | 2,734,231 | ||||||
| 4,232,532 | ||||||||
| Real Estate — 7.92% | ||||||||
| CareTrust REIT, Inc. | 82,732 | 1,696,006 | ||||||
| Cousins Properties, Inc. | 103,249 | 2,103,182 | ||||||
| Equity Commonwealth | 212,601 | 3,905,480 | ||||||
| Getty Realty Corp. | 62,963 | 1,745,964 | ||||||
| Physicians Realty Trust | 330,081 | 4,023,687 | ||||||
| Universal Health Realty Income Trust | 40,869 | 1,652,334 | ||||||
| 15,126,653 | ||||||||
| Technology — 7.15% | ||||||||
| Benchmark Electronics, Inc. | 101,860 | 2,471,124 | ||||||
| CSG Systems International, Inc. | 85,025 | 4,346,478 | ||||||
| MAXIMUS, Inc. | 24,905 | 1,859,905 | ||||||
| NextGen Healthcare, Inc.(a) | 154,530 | 3,666,997 | ||||||
| Viavi Solutions, Inc.(a) | 145,457 | 1,329,477 | ||||||
| 13,673,981 | ||||||||
| Utilities — 12.11% | ||||||||
| American States Water Co. | 47,777 | 3,759,094 | ||||||
| Avista Corp. | 100,781 | 3,262,280 | ||||||
| Northwest Natural Holding Co. | 70,097 | 2,674,902 | ||||||
| Northwestern Energy Group, Inc. | 64,631 | 3,106,166 | ||||||
| ONE Gas, Inc. | 49,445 | 3,376,105 | ||||||
| Portland General Electric Co. | 60,570 | 2,451,874 | ||||||
| Spire, Inc. | 79,750 | 4,512,255 | ||||||
| 23,142,676 | ||||||||
| Total Common Stocks/Investments — 95.19% (Cost $192,908,166) | 181,936,247 | |||||||
| Other Assets in Excess of Liabilities — 4.81% | 9,188,876 | |||||||
| NET ASSETS — 100.00% | $ | 191,125,123 | ||||||
| (a) | Non-income producing security. |
See accompanying notes which are an integral part of these financial statements.
11
| Dean Mid Cap Value Fund |
| Schedule of Investments |
| September 30, 2023 - (Unaudited) |
| COMMON STOCKS — 95.08% | Shares | Fair Value | ||||||
| Communications — 3.24% | ||||||||
| Omnicom Group, Inc. | 21,636 | $ | 1,611,449 | |||||
| Take-Two Interactive Software, Inc.(a) | 11,126 | 1,561,979 | ||||||
| 3,173,428 | ||||||||
| Consumer Discretionary — 9.52% | ||||||||
| AutoZone, Inc.(a) | 615 | 1,562,094 | ||||||
| BorgWarner, Inc. | 44,195 | 1,784,152 | ||||||
| Genuine Parts Co. | 8,913 | 1,286,859 | ||||||
| Masco Corp. | 29,320 | 1,567,154 | ||||||
| PulteGroup, Inc. | 21,575 | 1,597,628 | ||||||
| Skechers U.S.A., Inc., Class A(a) | 31,410 | 1,537,520 | ||||||
| 9,335,407 | ||||||||
| Consumer Staples — 8.18% | ||||||||
| BJ’s Wholesale Club Holdings, Inc.(a) | 20,469 | 1,460,873 | ||||||
| Casey’s General Stores, Inc. | 7,130 | 1,935,937 | ||||||
| Conagra Brands, Inc. | 55,505 | 1,521,947 | ||||||
| Pilgrim’s Pride Corp.(a) | 79,047 | 1,804,643 | ||||||
| US Foods Holding Corp.(a) | 32,823 | 1,303,073 | ||||||
| 8,026,473 | ||||||||
| Energy — 4.07% | ||||||||
| Baker Hughes Co. | 52,370 | 1,849,708 | ||||||
| Pioneer Natural Resources Co. | 9,343 | 2,144,686 | ||||||
| 3,994,394 | ||||||||
| Financials — 16.28% | ||||||||
| Ameriprise Financial, Inc. | 4,856 | 1,600,926 | ||||||
| Assurant, Inc. | 13,953 | 2,003,371 | ||||||
| Bank of New York Mellon Corp. (The) | 34,790 | 1,483,794 | ||||||
| Fifth Third Bancorp | 62,696 | 1,588,089 | ||||||
| Globe Life, Inc. | 18,440 | 2,004,981 | ||||||
| Raymond James Financial, Inc. | 20,469 | 2,055,702 | ||||||
| Regions Financial Corp. | 82,858 | 1,425,158 | ||||||
| Reinsurance Group of America, Inc. | 12,724 | 1,847,398 | ||||||
| W.R. Berkley Corp. | 30,918 | 1,962,984 | ||||||
| 15,972,403 | ||||||||
| Health Care — 6.80% | ||||||||
| Encompass Health Corp. | 31,471 | 2,113,592 | ||||||
| Jazz Pharmaceuticals PLC(a) | 14,998 | 1,941,341 | ||||||
| Quest Diagnostics, Inc. | 10,388 | 1,265,882 | ||||||
| Zimmer Biomet Holdings, Inc. | 11,986 | 1,345,070 | ||||||
| 6,665,885 | ||||||||
| Industrials — 17.93% | ||||||||
| Curtiss-Wright Corp. | 9,527 | 1,863,767 | ||||||
| Dover Corp. | 11,248 | 1,569,208 | ||||||
| FTI Consulting, Inc.(a) | 8,114 | 1,447,619 | ||||||
| Hubbell, Inc. | 6,270 | 1,965,080 | ||||||
| ITT, Inc. | 19,485 | 1,907,777 | ||||||
| Littelfuse, Inc. | 5,286 | 1,307,334 | ||||||
See accompanying notes which are an integral part of these financial statements.
12
| Dean Mid Cap Value Fund |
| Schedule of Investments (continued) |
| September 30, 2023 - (Unaudited) |
| COMMON STOCKS — 95.08% - continued | Shares | Fair Value | ||||||
| Industrials — 17.93% - continued | ||||||||
| MSC Industrial Direct Co., Inc., Class A | 18,932 | $ | 1,858,176 | |||||
| nVent Electric PLC | 34,176 | 1,810,986 | ||||||
| Regal Rexnord Corp. | 5,716 | 816,702 | ||||||
| Republic Services, Inc. | 11,863 | 1,690,596 | ||||||
| Stanley Black & Decker, Inc. | 16,227 | 1,356,253 | ||||||
| 17,593,498 | ||||||||
| Materials — 4.86% | ||||||||
| Avery Dennison Corp. | 8,974 | 1,639,281 | ||||||
| Eagle Materials, Inc. | 9,404 | 1,565,954 | ||||||
| Eastman Chemical Co. | 20,346 | 1,560,945 | ||||||
| 4,766,180 | ||||||||
| Real Estate — 8.74% | ||||||||
| Alexandria Real Estate Equities, Inc. | 7,806 | 781,381 | ||||||
| AvalonBay Communities, Inc. | 9,282 | 1,594,091 | ||||||
| CBRE Group, Inc., Class A(a) | 19,301 | 1,425,572 | ||||||
| Regency Centers Corp. | 24,157 | 1,435,892 | ||||||
| STAG Industrial, Inc. | 47,145 | 1,626,973 | ||||||
| Welltower, Inc. | 20,776 | 1,701,970 | ||||||
| 8,565,879 | ||||||||
| Technology — 6.94% | ||||||||
| Arrow Electronics, Inc.(a) | 15,674 | 1,963,013 | ||||||
| Broadridge Financial Solutions, Inc. | 10,142 | 1,815,925 | ||||||
| Corning, Inc. | 51,018 | 1,554,518 | ||||||
| SS&C Technologies Holdings, Inc. | 27,967 | 1,469,386 | ||||||
| 6,802,842 | ||||||||
| Utilities — 8.52% | ||||||||
| Ameren Corp. | 20,591 | 1,540,825 | ||||||
| Atmos Energy Corp. | 14,875 | 1,575,709 | ||||||
| CenterPoint Energy, Inc. | 59,623 | 1,600,878 | ||||||
| CMS Energy Corp. | 31,287 | 1,661,652 | ||||||
| OGE Energy Corp. | 59,193 | 1,972,902 | ||||||
| 8,351,966 | ||||||||
| Total Common Stocks/Investments — 95.08% (Cost $83,250,790) | 93,248,355 | |||||||
| Other Assets in Excess of Liabilities — 4.92% | 4,820,351 | |||||||
| NET ASSETS — 100.00% | $ | 98,068,706 | ||||||
| (a) | Non-income producing security. |
See accompanying notes which are an integral part of these financial statements.
13
| Dean Equity Income Fund |
| Schedule of Investments |
| September 30, 2023 - (Unaudited) |
| COMMON STOCKS — 95.67% | Shares | Fair Value | ||||||
| Communications — 6.12% | ||||||||
| BCE, Inc. | 47,311 | $ | 1,805,861 | |||||
| Omnicom Group, Inc. | 12,648 | 942,023 | ||||||
| Verizon Communications, Inc. | 54,751 | 1,774,480 | ||||||
| 4,522,364 | ||||||||
| Consumer Discretionary — 5.28% | ||||||||
| Home Depot, Inc. (The) | 6,434 | 1,944,097 | ||||||
| Packaging Corp. of America | 12,736 | 1,955,613 | ||||||
| 3,899,710 | ||||||||
| Consumer Staples — 12.16% | ||||||||
| Altria Group, Inc. | 53,701 | 2,258,126 | ||||||
| Flowers Foods, Inc. | 54,226 | 1,202,733 | ||||||
| Kimberly-Clark Corp. | 16,894 | 2,041,640 | ||||||
| PepsiCo, Inc. | 7,134 | 1,208,785 | ||||||
| Philip Morris International, Inc. | 16,981 | 1,572,101 | ||||||
| Sysco Corp. | 10,591 | 699,536 | ||||||
| 8,982,921 | ||||||||
| Energy — 7.70% | ||||||||
| Chevron Corp. | 15,099 | 2,545,993 | ||||||
| EOG Resources, Inc. | 11,204 | 1,420,219 | ||||||
| Kinder Morgan, Inc., Class P | 103,637 | 1,718,302 | ||||||
| 5,684,514 | ||||||||
| Financials — 14.17% | ||||||||
| BlackRock, Inc. | 1,838 | 1,188,249 | ||||||
| Canadian Imperial Bank of Commerce | 30,986 | 1,196,369 | ||||||
| JPMorgan Chase & Co. | 11,292 | 1,637,566 | ||||||
| PNC Financial Services Group, Inc. (The) | 10,941 | 1,343,227 | ||||||
| Principal Financial Group, Inc. | 19,870 | 1,432,031 | ||||||
| Prudential Financial, Inc. | 17,025 | 1,615,502 | ||||||
| T. Rowe Price Group, Inc. | 19,607 | 2,056,186 | ||||||
| 10,469,130 | ||||||||
| Health Care — 11.02% | ||||||||
| Amgen, Inc. | 7,790 | 2,093,640 | ||||||
| Bristol-Myers Squibb Co. | 20,395 | 1,183,726 | ||||||
| Johnson & Johnson | 14,924 | 2,324,413 | ||||||
| Merck & Co., Inc. | 14,224 | 1,464,361 | ||||||
| Pfizer, Inc. | 32,430 | 1,075,703 | ||||||
| 8,141,843 | ||||||||
| Industrials — 9.81% | ||||||||
| Fastenal Co. | 33,831 | 1,848,526 | ||||||
| Lockheed Martin Corp. | 2,407 | 984,367 | ||||||
| Paychex, Inc. | 9,891 | 1,140,729 | ||||||
| Union Pacific Corp. | 7,309 | 1,488,332 | ||||||
| United Parcel Service, Inc., Class B | 11,423 | 1,780,502 | ||||||
| 7,242,456 | ||||||||
| Materials — 1.83% | ||||||||
| Air Products & Chemicals, Inc. | 4,770 | 1,351,818 | ||||||
See accompanying notes which are an integral part of these financial statements.
14
| Dean Equity Income Fund |
| Schedule of Investments (continued) |
| September 30, 2023 - (Unaudited) |
| COMMON STOCKS — 95.67% - continued | Shares | Fair Value | ||||||
| Real Estate — 8.27% | ||||||||
| American Tower Corp., Class A | 7,484 | $ | 1,230,744 | |||||
| Digital Realty Trust, Inc. | 15,668 | 1,896,141 | ||||||
| Essex Property Trust, Inc. | 6,827 | 1,447,938 | ||||||
| Lamar Advertising Co., Class A | 18,382 | 1,534,346 | ||||||
| 6,109,169 | ||||||||
| Technology — 6.95% | ||||||||
| Broadcom, Inc. | 1,357 | 1,127,097 | ||||||
| Cisco Systems, Inc. | 40,833 | 2,195,182 | ||||||
| Texas Instruments, Inc. | 11,379 | 1,809,375 | ||||||
| 5,131,654 | ||||||||
| Utilities — 12.36% | ||||||||
| Alliant Energy Corp. | 26,259 | 1,272,249 | ||||||
| American Electric Power Co., Inc. | 17,331 | 1,303,638 | ||||||
| Duke Energy Corp. | 20,395 | 1,800,062 | ||||||
| Eversource Energy | 26,828 | 1,560,048 | ||||||
| WEC Energy Group, Inc. | 21,183 | 1,706,291 | ||||||
| Xcel Energy, Inc. | 25,997 | 1,487,549 | ||||||
| 9,129,837 | ||||||||
| Total Common Stocks/Investments — 95.67% (Cost $75,792,186) | 70,665,416 | |||||||
| Other Assets in Excess of Liabilities — 4.33% | 3,197,576 | |||||||
| NET ASSETS — 100.00% | $ | 73,862,992 | ||||||
See accompanying notes which are an integral part of these financial statements.
15
| Dean Funds |
| Statements of Assets and Liabilities |
| September 30, 2023 - (Unaudited) |
| Dean Small Cap | Dean Mid Cap | Dean Equity | ||||||||||
| Value Fund | Value Fund | Income Fund | ||||||||||
| Assets | ||||||||||||
| Investments in securities at value (cost $192,908,166, $83,250,790 and $75,792,186) | $ | 181,936,247 | $ | 93,248,355 | $ | 70,665,416 | ||||||
| Cash and cash equivalents | 9,171,368 | 4,604,255 | 3,206,720 | |||||||||
| Receivable for fund shares sold | 99,091 | 54,774 | 27,855 | |||||||||
| Receivable for investments sold | 1,350,016 | — | — | |||||||||
| Dividends receivable | 350,192 | 214,452 | 225,789 | |||||||||
| Prepaid expenses | 17,231 | 23,275 | 26,727 | |||||||||
| Total Assets | 192,924,145 | 98,145,111 | 74,152,507 | |||||||||
| Liabilities | ||||||||||||
| Payable for investments purchased | 1,547,353 | — | 39,029 | |||||||||
| Payable for fund shares redeemed | 55,405 | 9,453 | 194,943 | |||||||||
| Payable to Adviser | 145,409 | 49,564 | 26,088 | |||||||||
| Payable to affiliates | 22,468 | 7,460 | 10,230 | |||||||||
| Payable to trustees | 876 | 876 | 814 | |||||||||
| Other accrued expenses | 27,511 | 9,052 | 18,411 | |||||||||
| Total Liabilities | 1,799,022 | 76,405 | 289,515 | |||||||||
| Net Assets | $ | 191,125,123 | $ | 98,068,706 | $ | 73,862,992 | ||||||
| Net Assets consist of: | ||||||||||||
| Paid-in capital | $ | 201,782,550 | $ | 80,592,071 | $ | 79,484,040 | ||||||
| Accumulated earnings (deficit) | (10,657,427 | ) | 17,476,635 | (5,621,048 | ) | |||||||
| Net Assets | $ | 191,125,123 | $ | 98,068,706 | $ | 73,862,992 | ||||||
| Shares outstanding (unlimited number of shares authorized, no par value) | 10,943,896 | 4,332,014 | 4,044,331 | |||||||||
| Net asset value, offering and redemption price per share | $ | 17.46 | $ | 22.64 | $ | 18.26 | ||||||
See accompanying notes which are an integral part of these financial statements.
16
| Dean Funds |
| Statements of Operations |
| For the Six Months Ended September 30, 2023 - (Unaudited) |
| Dean Small Cap | Dean Mid Cap | Dean Equity | ||||||||||
| Value Fund | Value Fund | Income Fund | ||||||||||
| Investment Income | ||||||||||||
| Dividend income (net of foreign taxes withheld of $2,658, $– and $16,165) | $ | 2,896,820 | $ | 777,254 | $ | 1,414,681 | ||||||
| Interest income | 236,028 | 97,011 | 87,076 | |||||||||
| Total investment income | 3,132,848 | 874,265 | 1,501,757 | |||||||||
| Expenses | ||||||||||||
| Adviser | 906,628 | 311,709 | 188,642 | |||||||||
| Administration | 82,073 | 33,857 | 29,740 | |||||||||
| Custodian | 27,587 | 8,189 | 10,940 | |||||||||
| Registration | 22,712 | 12,144 | 7,640 | |||||||||
| Transfer agent | 19,672 | 5,460 | 2,182 | |||||||||
| Fund accounting | 16,551 | 10,009 | 8,674 | |||||||||
| Legal | 12,158 | 12,158 | 10,408 | |||||||||
| Trustee | 9,213 | 9,213 | 9,152 | |||||||||
| Audit and tax preparation | 8,942 | 8,942 | 9,168 | |||||||||
| Report printing | 8,332 | 3,246 | 4,461 | |||||||||
| Compliance services | 4,819 | 4,819 | 4,829 | |||||||||
| Insurance | 2,265 | 1,630 | 752 | |||||||||
| Pricing | 741 | 603 | 618 | |||||||||
| Miscellaneous | 32,499 | 16,392 | 12,336 | |||||||||
| Total expenses | 1,154,192 | 438,371 | 299,542 | |||||||||
| Fees waived by Adviser | — | (86,090 | ) | (36,252 | ) | |||||||
| Net operating expenses | 1,154,192 | 352,281 | 263,290 | |||||||||
| Net investment income | 1,978,656 | 521,984 | 1,238,467 | |||||||||
| Net Realized and Change in Unrealized Gain (Loss) on Investments | ||||||||||||
| Net realized gain (loss) on investment securities transactions | (1,250,492 | ) | 3,359,090 | (602,775 | ) | |||||||
| Net realized gain on foreign currency translations | — | — | 792 | |||||||||
| Net change in unrealized depreciation of investment securities | (15,447,753 | ) | (4,939,011 | ) | (3,513,771 | ) | ||||||
| Foreign currency | — | — | (663 | ) | ||||||||
| Net realized and change in unrealized loss on investments | (16,698,245 | ) | (1,579,921 | ) | (4,116,417 | ) | ||||||
| Net decrease in net assets resulting from operations | $ | (14,719,589 | ) | $ | (1,057,937 | ) | $ | (2,877,950 | ) | |||
See accompanying notes which are an integral part of these financial statements.
17
| Dean Funds |
| Statements of Changes in Net Assets |
| Dean Small Cap Value Fund | Dean Mid Cap Value Fund | |||||||||||||||
| For the Six | For the Six | |||||||||||||||
| Months Ended | For the Year | Months Ended | For the Year | |||||||||||||
| September 30, | Ended | September 30, | Ended | |||||||||||||
| 2023 | March 31, 2023 | 2023 | March 31, 2023 | |||||||||||||
| (Unaudited) | (Unaudited) | |||||||||||||||
| Increase (Decrease) in Net Assets due to: | ||||||||||||||||
| Operations | ||||||||||||||||
| Net investment income | $ | 1,978,656 | $ | 3,592,767 | $ | 521,984 | $ | 946,890 | ||||||||
| Net realized gain (loss) on investment securities transactions | (1,250,492 | ) | 17,593,024 | 3,359,090 | 3,226,530 | |||||||||||
| Net change in unrealized depreciation of investment securities | (15,447,753 | ) | (11,956,951 | ) | (4,939,011 | ) | (4,524,099 | ) | ||||||||
| Net increase (decrease) in net assets resulting from operations | (14,719,589 | ) | 9,228,840 | (1,057,937 | ) | (350,679 | ) | |||||||||
| Distributions to Shareholders From: | ||||||||||||||||
| Earnings | — | (2,517,470 | ) | — | (3,867,873 | ) | ||||||||||
| Total distributions | — | (2,517,470 | ) | — | (3,867,873 | ) | ||||||||||
| Capital Transactions | ||||||||||||||||
| Proceeds from shares sold | 25,260,826 | 64,099,879 | 32,685,970 | 7,559,031 | ||||||||||||
| Reinvestment of distributions | — | 2,018,672 | — | 3,748,284 | ||||||||||||
| Amount paid for shares redeemed | (34,199,804 | ) | (38,311,897 | ) | (8,026,584 | ) | (13,001,231 | ) | ||||||||
| Net increase (decrease) in net assets resulting from capital transactions | (8,938,978 | ) | 27,806,654 | 24,659,386 | (1,693,916 | ) | ||||||||||
| Total Increase (Decrease) in Net Assets | (23,658,567 | ) | 34,518,024 | 23,601,449 | (5,912,468 | ) | ||||||||||
| Net Assets | ||||||||||||||||
| Beginning of period | 214,783,690 | 180,265,666 | 74,467,257 | 80,379,725 | ||||||||||||
| End of period | $ | 191,125,123 | $ | 214,783,690 | $ | 98,068,706 | $ | 74,467,257 | ||||||||
| Share Transactions | ||||||||||||||||
| Shares sold | 1,382,532 | 3,487,527 | 1,370,504 | 333,562 | ||||||||||||
| Shares issued in reinvestment of distributions | — | 107,376 | — | 166,368 | ||||||||||||
| Shares redeemed | (1,875,655 | ) | (2,101,158 | ) | (349,708 | ) | (567,825 | ) | ||||||||
| Net increase (decrease) in shares outstanding | (493,123 | ) | 1,493,745 | 1,020,796 | (67,895 | ) | ||||||||||
See accompanying notes which are an integral part of these financial statements.
18
| Dean Funds |
| Statements of Changes in Net Assets (continued) |
| Dean Equity Income Fund | ||||||||
| For the Six | ||||||||
| Months Ended | For the Period | |||||||
| September 30, | Ended March | |||||||
| 2023 | 31, 2023(a) | |||||||
| (Unaudited) | ||||||||
| Increase (Decrease) in Net Assets due to: | ||||||||
| Operations | ||||||||
| Net investment income | $ | 1,238,467 | $ | 524,043 | ||||
| Net realized gain (loss) on investment securities transactions | (601,983 | ) | 45,883 | |||||
| Net change in unrealized depreciation of investment securities | (3,514,434 | ) | (1,612,567 | ) | ||||
| Net decrease in net assets resulting from operations | (2,877,950 | ) | (1,042,641 | ) | ||||
| Distributions to Shareholders From: | ||||||||
| Earnings | (1,649,497 | ) | (50,960 | ) | ||||
| Total distributions | (1,649,497 | ) | (50,960 | ) | ||||
| Capital Transactions | ||||||||
| Proceeds from shares sold | 7,914,834 | 75,338,469 | ||||||
| Reinvestment of distributions | 1,552,000 | 50,891 | ||||||
| Amount paid for shares redeemed | (4,723,226 | ) | (648,928 | ) | ||||
| Net increase in net assets resulting from capital transactions | 4,743,608 | 74,740,432 | ||||||
| Total Increase in Net Assets | 216,161 | 73,646,831 | ||||||
| Net Assets | ||||||||
| Beginning of period | 73,646,831 | — | ||||||
| End of period | $ | 73,862,992 | $ | 73,646,831 | ||||
| Share Transactions | ||||||||
| Shares sold | 414,242 | 3,825,371 | ||||||
| Shares issued in reinvestment of distributions | 82,491 | 2,533 | ||||||
| Shares redeemed | (247,156 | ) | (33,150 | ) | ||||
| Net increase in shares outstanding | 249,577 | 3,794,754 | ||||||
| (a) | For the period November 22, 2022 (commencement of operations) to March 31, 2023. |
See accompanying notes which are an integral part of these financial statements.
19
| Dean Small Cap Value Fund |
| Financial Highlights |
(For a share outstanding during each period)
| For the Six | ||||||||||||||||||||||||
| Months | ||||||||||||||||||||||||
| Ended | ||||||||||||||||||||||||
| September | ||||||||||||||||||||||||
| 30, 2023 | For the Years Ended March 31, | |||||||||||||||||||||||
| (Unaudited) | 2023 | 2022 | 2021 | 2020 | 2019 | |||||||||||||||||||
| Selected Per Share Data: | ||||||||||||||||||||||||
| Net asset value, beginning of period | $ | 18.78 | $ | 18.13 | $ | 16.96 | $ | 9.25 | $ | 14.19 | $ | 14.63 | ||||||||||||
| Investment operations: | ||||||||||||||||||||||||
| Net investment income | 0.19 | 0.32 | 0.20 | 0.27 | 0.16 | 0.15 | ||||||||||||||||||
| Net realized and unrealized gain (loss) | (1.51 | ) | 0.57 | 1.15 | 7.67 | (4.51 | ) | (0.18 | ) | |||||||||||||||
| Total from investment operations | (1.32 | ) | 0.89 | 1.35 | 7.94 | (4.35 | ) | (0.03 | ) | |||||||||||||||
| Less distributions to shareholders from: | ||||||||||||||||||||||||
| Net investment income | — | (0.24 | ) | (0.18 | ) | (0.23 | ) | (0.19 | ) | (0.20 | ) | |||||||||||||
| Net realized gains | — | — | — | — | (0.40 | ) | (0.21 | ) | ||||||||||||||||
| Total distributions | — | (0.24 | ) | (0.18 | ) | (0.23 | ) | (0.59 | ) | (0.41 | ) | |||||||||||||
| Net asset value, end of period | $ | 17.46 | $ | 18.78 | $ | 18.13 | $ | 16.96 | $ | 9.25 | $ | 14.19 | ||||||||||||
| Total Return(a) | (7.03 | )% (b) | 4.89 | % | 7.98 | % | 86.33 | % | (32.14 | )% | (0.08 | )% | ||||||||||||
| Ratios and Supplemental Data: | ||||||||||||||||||||||||
| Net assets, end of period (000 omitted) | $ | 191,125 | $ | 214,784 | $ | 180,266 | $ | 169,048 | $ | 226,564 | $ | 321,178 | ||||||||||||
| Ratio of net expenses to average net assets | 1.15 | % (c) | 1.14 | % | 1.13 | % | 1.19 | % | 1.15 | % | 1.12 | % | ||||||||||||
| Ratio of gross expenses to average net assets before waiver or recoupment | 1.15 | % (c) | 1.14 | % | 1.13 | % | 1.19 | % | 1.15 | % | 1.12 | % | ||||||||||||
| Ratio of net investment income to average net assets | 1.97 | % (c) | 1.90 | % | 1.15 | % | 1.16 | % | 1.14 | % | 1.04 | % | ||||||||||||
| Portfolio turnover rate | 53 | % (b) | 77 | % | 57 | % | 181 | % | 157 | % | 120 | % | ||||||||||||
| (a) | Total return represents the rate that the investor would have earned or lost on an investment in the Fund, assuming reinvestment of distributions. |
| (b) | Not annualized. |
| (c) | Annualized. |
See accompanying notes which are an integral part of these financial statements.
20
| Dean Mid Cap Value Fund |
| Financial Highlights |
(For a share outstanding during each period)
| For the Six | ||||||||||||||||||||||||
| Months | ||||||||||||||||||||||||
| Ended | ||||||||||||||||||||||||
| September | ||||||||||||||||||||||||
| 30, 2023 | For the Years Ended March 31, | |||||||||||||||||||||||
| (Unaudited) | 2023 | 2022 | 2021 | 2020 | 2019 | |||||||||||||||||||
| Selected Per Share Data: | ||||||||||||||||||||||||
| Net asset value, beginning of period | $ | 22.49 | $ | 23.79 | $ | 22.58 | $ | 14.26 | $ | 19.83 | $ | 19.87 | ||||||||||||
| Investment operations: | ||||||||||||||||||||||||
| Net investment income | 0.09 | 0.29 | 0.19 | 0.16 | 0.22 | 0.22 | ||||||||||||||||||
| Net realized and unrealized gain (loss) | 0.06 | (0.41 | ) | 2.34 | 8.34 | (4.08 | ) | 0.36 | ||||||||||||||||
| Total from investment operations | 0.15 | (0.12 | ) | 2.53 | 8.50 | (3.86 | ) | 0.58 | ||||||||||||||||
| Less distributions to shareholders from: | ||||||||||||||||||||||||
| Net investment income | — | (0.21 | ) | (0.20 | ) | (0.18 | ) | (0.22 | ) | (0.16 | ) | |||||||||||||
| Net realized gains | — | (0.97 | ) | (1.12 | ) | — | (1.49 | ) | (0.46 | ) | ||||||||||||||
| Total distributions | — | (1.18 | ) | (1.32 | ) | (0.18 | ) | (1.71 | ) | (0.62 | ) | |||||||||||||
| Net asset value, end of period | $ | 22.64 | $ | 22.49 | $ | 23.79 | $ | 22.58 | $ | 14.26 | $ | 19.83 | ||||||||||||
| Total Return(a) | 0.67 | % (b) | (0.50 | )% | 11.22 | % | 59.75 | % | (22.04 | )% | 3.10 | % | ||||||||||||
| Ratios and Supplemental Data: | ||||||||||||||||||||||||
| Net assets, end of period (000 omitted) | $ | 98,069 | $ | 74,467 | $ | 80,380 | $ | 79,576 | $ | 32,673 | $ | 41,889 | ||||||||||||
| Ratio of net expenses to average net assets | 0.85 | % (c) | 0.85 | % | 0.85 | % | 0.85 | % | 1.02 | % | 1.10 | % | ||||||||||||
| Ratio of gross expenses to average net assets before waiver or recoupment | 1.06 | % (c) | 1.08 | % | 1.06 | % | 1.15 | % | 1.30 | % | 1.40 | % | ||||||||||||
| Ratio of net investment income to average net assets | 1.26 | % (c) | 1.25 | % | 0.75 | % | 1.20 | % | 1.14 | % | 1.20 | % | ||||||||||||
| Portfolio turnover rate | 22 | % (b) | 22 | % | 27 | % | 65 | % | 76 | % | 46 | % | ||||||||||||
| (a) | Total return represents the rate that the investor would have earned or lost on an investment in the Fund, assuming reinvestment of distributions. |
| (b) | Not annualized. |
| (c) | Annualized. |
See accompanying notes which are an integral part of these financial statements.
21
| Dean Equity Income Fund |
| Financial Highlights |
(For a share outstanding during each period)
| For the Six | ||||||||
| Months | For the | |||||||
| Ended | Period | |||||||
| September | Ended | |||||||
| 30, 2023 | March 31, | |||||||
| (Unaudited) | 2023(a) | |||||||
| Selected Per Share Data: | ||||||||
| Net asset value, beginning of period | $ | 19.41 | $ | 20.00 | ||||
| Investment operations: | ||||||||
| Net investment income | 0.31 | 0.18 | ||||||
| Net realized and unrealized loss | (1.04 | ) | (0.71 | ) | ||||
| Total from investment operations | (0.73 | ) | (0.53 | ) | ||||
| Less distributions to shareholders from: | ||||||||
| Net investment income | (0.42 | ) | (0.06 | ) | ||||
| Total distributions | (0.42 | ) | (0.06 | ) | ||||
| Net asset value, end of period | $ | 18.26 | $ | 19.41 | ||||
| Total Return(b) | (3.84 | )% (c) | (2.66 | )% (c) | ||||
| Ratios and Supplemental Data: | ||||||||
| Net assets, end of period (000 omitted) | $ | 73,863 | $ | 73,647 | ||||
| Ratio of net expenses to average net assets | 0.70 | % (d) | 0.70 | % (d) | ||||
| Ratio of gross expenses to average net assets before waiver or recoupment | 0.80 | % (d) | 1.04 | % (d) | ||||
| Ratio of net investment income to average net assets | 3.29 | % (d) | �� | 3.62 | % (d) | |||
| Portfolio turnover rate | 8 | % (c) | 16 | % (c) | ||||
| (a) | For the period November 22, 2022 (commencement of operations) to March 31, 2023. |
| (b) | Total return represents the rate that the investor would have earned or lost on an investment in the Fund, assuming reinvestment of distributions. |
| (c) | Not annualized. |
| (d) | Annualized. |
See accompanying notes which are an integral part of these financial statements.
22
| Dean Funds |
| Notes to the Financial Statements |
| September 30, 2023 - (Unaudited) |
NOTE 1. ORGANIZATION
Dean Small Cap Value Fund (the “Small Cap Fund”), Dean Mid Cap Value Fund (the “Mid Cap Fund”) and Dean Equity Income Fund (the “Equity Income Fund”) (each a “Fund” and, collectively the “Funds”), are each organized as diversified series of Unified Series Trust (the “Trust”). The Small Cap Fund and the Mid Cap Fund were organized on November 13, 2006 and the Equity Income Fund was organized on November 15, 2022. The Funds are registered under the Investment Company Act of 1940, as amended (“1940 Act”). The Trust is an open-end investment company established under the laws of Ohio by an Agreement and Declaration of Trust dated October 14, 2002, as amended from time to time (the “Trust Agreement”). The Trust Agreement permits the Board of Trustees (the “Board”) to issue an unlimited number of shares of beneficial interest of separate series. The Funds are each a series of the Trust currently authorized by the Board. The investment adviser to each Fund is Dean Investment Associates, LLC (“Dean Investment Associates” or “Adviser”). In addition, the Adviser has retained Dean Capital Management, LLC (“DCM” or “Sub-Adviser”) to serve as sub-adviser to the Funds. DCM is an affiliate of the Adviser. The investment objective of the Small Cap Fund and the Mid Cap Fund is long-term capital appreciation and, secondarily, dividend income. The investment objective of the Equity Income Fund is long-term capital appreciation with an income focus.
NOTE 2. SIGNIFICANT ACCOUNTING POLICIES
The Funds are investment companies and follow accounting and reporting guidance under Financial Accounting Standards Board Accounting Standards Codification (“ASC”) Topic 946, “Financial Services-Investment Companies”, including Accounting Standards Update 2013-08. The following is a summary of significant accounting policies followed by the Funds in the preparation of their financial statements. These policies are in conformity with generally accepted accounting principles in the United States of America (“GAAP”).
Estimates – The preparation of financial statements in conformity with GAAP requires management to make estimates and assumptions that affect the reported amounts of assets and liabilities and disclosure of contingent assets and liabilities at the date of the financial statements and the reported amounts of increases and decreases in net assets from operations during the reporting period. Actual results could differ from those estimates.
Regulatory Update – Tailored Shareholder Reports for Mutual Funds and Exchange-Traded Funds (“ETFs”) – Effective January 24, 2023, the SEC adopted rule and form amendments to require mutual funds and ETFs to transmit concise and visually engaging streamlined annual and semiannual reports to shareholders that highlight key information. Other information, including financial statements, will no longer appear in a streamlined
23
| Dean Funds |
| Notes to the Financial Statements (continued) |
| September 30, 2023 - (Unaudited) |
shareholder report but must be available online, delivered free of charge upon request, and filed on a semiannual basis on Form N-CSR. The rule and form amendments have a compliance date of July 24, 2024. At this time, management is evaluating the impact of these amendments on the shareholder reports for the Funds.
Federal Income Taxes – The Funds make no provision for federal income or excise tax. Each Fund has qualified and intends to qualify each year as a regulated investment company (“RIC”) under subchapter M of the Internal Revenue Code of 1986, as amended, by complying with the requirements applicable to RICs and by distributing substantially all of its taxable income. Each Fund also intends to distribute sufficient net investment income and net capital gains, if any, so that it will not be subject to excise tax on undistributed income and gains. If the required amount of net investment income or gains is not distributed, the Funds could incur a tax expense.
As of and during the six months ended September 30, 2023, the Funds did not have any liabilities for any unrecognized tax benefits. The Funds recognize interest and penalties, if any, related to unrecognized tax benefits as income tax expense in the Statements of Operations when incurred. During the period, the Funds did not incur any interest or penalties. Management of the Funds has reviewed tax positions taken in tax years that remain subject to examination by all major tax jurisdictions, including federal (i.e., the previous three tax year ends and the interim tax period since then, as applicable) and has concluded that no provision for unrecognized tax benefits or expenses is required in these financial statements and does not expect this to change over the next twelve months.
Expenses – Expenses incurred by the Trust that do not relate to a specific Fund are allocated to the individual funds of the Trust based on each Fund’s relative net assets or another appropriate basis (as determined by the Board).
Security Transactions and Related Income – The Funds follow industry practice and record security transactions on the trade date for financial reporting purposes. The specific identification method is used for determining gains or losses for financial statements and income tax purposes. Dividend income is recorded on the ex-dividend date and interest income is recorded on an accrual basis. Distributions received from investments in real estate investment trusts (“REITs”) that represent a return of capital or capital gain are recorded as a reduction of the cost of investment or as a realized gain, respectively. The calendar year-end amounts of ordinary income, capital gains, and return of capital included in distributions received from the Funds’ investments in REITs are reported to the Funds after the end of the calendar year; accordingly, the Funds estimate these amounts for accounting purposes until the characterization of REIT distributions is reported. Estimates are based on the most recent REIT distributions information available. Withholding taxes
24
| Dean Funds |
| Notes to the Financial Statements (continued) |
| September 30, 2023 - (Unaudited) |
on foreign dividends and related reclaims have been provided for in accordance with the Funds’ understanding of the applicable country’s tax rules and rates.
Dividends and Distributions – Each Fund intends to distribute its net investment income and net realized long-term and short-term capital gains, if any, at least annually. Dividends and distributions to shareholders, which are determined in accordance with income tax regulations, are recorded on the ex-dividend date. The treatment for financial reporting purposes of distributions made to shareholders during the period from net investment income or net realized capital gains may differ from their ultimate treatment for federal income tax purposes. These differences are caused primarily by differences in the timing of the recognition of certain components of income, expense or realized capital gain for federal income tax purposes. Where such differences are permanent in nature, they are reclassified among the components of the net assets based on their ultimate characterization for federal income tax purposes. Any such reclassifications will have no effect on net assets, results of operations or net asset Value (“NAV”) per share of the Funds.
Cash and Cash Equivalents — Idle cash may be swept into various interest bearing overnight demand deposits and is classified as a cash equivalent on the Statements of Assets and Liabilities. The Funds maintain cash in the bank deposit accounts which, at times, may exceed the Federal Deposit Insurance Corporation (FDIC) limit of $250,000. Amounts swept overnight are available on the next business day.
NOTE 3. SECURITIES VALUATION AND FAIR VALUE MEASUREMENTS
Each Fund values its portfolio securities at fair value as of the close of regular trading on the New York Stock Exchange (“NYSE”) (normally 4:00 p.m. Eastern time) on each business day the NYSE is open for business. Fair value is defined as the price that a Fund would receive upon selling an investment in a timely transaction to an independent buyer in the principal or most advantageous market of the investment. GAAP establishes a three-tier hierarchy to maximize the use of observable market data and minimize the use of unobservable inputs and to establish classification of fair value measurements for disclosure purposes.
Inputs refer broadly to the assumptions that market participants would use in pricing the asset or liability, including assumptions about risk (the risk inherent in a particular valuation technique used to measure fair value including a pricing model and/or the risk inherent in the inputs to the valuation technique). Inputs may be observable or unobservable. Observable inputs are inputs that reflect the assumptions market participants would use in pricing the asset or liability developed based on market data obtained and available from sources independent of the reporting entity. Unobservable inputs are inputs that reflect the reporting entity’s own assumptions about the assumptions market participants would use
25
| Dean Funds |
| Notes to the Financial Statements (continued) |
| September 30, 2023 - (Unaudited) |
in pricing the asset or liability developed based on the best information available in the circumstances.
Various inputs are used in determining the value of each Fund’s investments. These inputs are summarized in the three broad levels listed below.
| ● | Level 1 – unadjusted quoted prices in active markets for identical investments and/or registered investment companies where the value per share is determined and published and is the basis for current transactions for identical assets or liabilities at the valuation date |
| ● | Level 2 – other significant observable inputs (including, but not limited to, quoted prices for an identical security in an inactive market, quoted prices for similar securities, interest rates, prepayment speeds, credit risk, etc.) |
| ● | Level 3 – significant unobservable inputs (including the Funds’ own assumptions in determining fair value of investments based on the best information available) |
The inputs used to measure fair value may fall into different levels of the fair value hierarchy. In such cases, for disclosure purposes, the level in the fair value hierarchy which is reported is determined based on the lowest level input that is significant to the fair value measurement in its entirety.
Equity securities that are traded on any stock exchange are generally valued at the last quoted sale price on the security’s primary exchange. Lacking a last sale price, an exchange-traded security is generally valued at its last bid price. Securities traded in the Nasdaq over-the-counter market are generally valued at the Nasdaq Official Closing Price. When using market quotations and when the market is considered active, the security is classified as a Level 1 security. In the event that market quotations are not readily available or are considered unreliable due to market or other events, securities are valued in good faith by the Adviser, as Valuation Designee, under the oversight of the Board’s Pricing & Liquidity Committee. The Adviser has adopted written policies and procedures for valuing securities and other assets in circumstances where market quotes are not readily available in conformity with guidelines adopted by the Board. In the event that market quotes are not readily available, and the security or asset cannot be valued pursuant to one of the valuation methods, the value of the security or asset will be determined in good faith by the Valuation Designee pursuant to its policies and procedures. Any fair value provided by the Valuation Designee is subject to the ultimate review of the pricing methodology by the Pricing & Liquidity Committee of the Board on a quarterly basis. Under these policies, the securities will be classified as Level 2 or 3 within the fair value hierarchy, depending on the inputs used.
26
| Dean Funds |
| Notes to the Financial Statements (continued) |
| September 30, 2023 - (Unaudited) |
Investments in mutual funds, including money market mutual funds, are generally priced at the ending NAV provided by the service agent of the mutual funds. These securities are categorized as Level 1 securities.
In accordance with the Trust’s valuation policies and fair value determinations pursuant to Rule 2a-5 under the 1940 Act, the Valuation Designee is required to consider all appropriate factors relevant to the value of securities for which it has determined other pricing sources are not available or reliable as described above. No single method exists for determining fair value because fair value depends upon the circumstances of each individual case. As a general principle, the current fair value of a security being valued by the Valuation Designee would be the amount that a Fund might reasonably expect to receive upon the current sale. Methods that are in accordance with this principle may, for example, be based on (i) a multiple of earnings; (ii) a discount from market prices of a similar freely traded security (including a derivative security or a basket of securities traded on other markets, exchanges or among dealers); or (iii) yield to maturity with respect to debt issues, or a combination of these and other methods. Fair-value pricing is permitted if, in the Valuation Designee’s opinion, the validity of market quotations appears to be questionable based on factors such as evidence of a thin market in the security based on a small number of quotations, a significant event occurs after the close of a market but before a Fund’s NAV calculation that may affect a security’s value, or the Valuation Designee is aware of any other data that calls into question the reliability of market quotations. The Valuation Designee may obtain assistance from others in fulfilling its duties. For example, it may seek assistance from pricing services, fund administrators, sub-advisers, accountants, or counsel; it may also consult the Trust’s Fair Value Committee. The Valuation Designee, however, remains responsible for the final fair value determination and may not designate or assign that responsibility to any third party.
The following is a summary of the inputs used to value the Funds’ investments as of September 30, 2023:
| Small Cap Fund | Valuation Inputs | |||||||||||||||
| Assets | Level 1 | Level 2 | Level 3 | Total | ||||||||||||
| Common Stocks(a) | $ | 181,936,247 | $ | — | $ | — | $ | 181,936,247 | ||||||||
| Total | $ | 181,936,247 | $ | — | $ | — | $ | 181,936,247 | ||||||||
| Mid Cap Fund | Valuation Inputs | |||||||||||||||
| Assets | Level 1 | Level 2 | Level 3 | Total | ||||||||||||
| Common Stocks(a) | $ | 93,248,355 | $ | — | $ | — | $ | 93,248,355 | ||||||||
| Total | $ | 93,248,355 | $ | — | $ | — | $ | 93,248,355 | ||||||||
27
| Dean Funds |
| Notes to the Financial Statements (continued) |
| September 30, 2023 - (Unaudited) |
| Equity Income Fund | Valuation Inputs | |||||||||||||||
| Assets | Level 1 | Level 2 | Level 3 | Total | ||||||||||||
| Common Stocks(a) | $ | 70,665,416 | $ | — | $ | — | $ | 70,665,416 | ||||||||
| Total | $ | 70,665,416 | $ | — | $ | — | $ | 70,665,416 | ||||||||
| (a) | Refer to Schedule of Investments for sector classifications. |
The Funds did not hold any investments at the end of the reporting period in which significant unobservable inputs (Level 3) were used in determining fair value; therefore, no reconciliation of Level 3 securities is included for this reporting period.
NOTE 4. FEES AND OTHER TRANSACTIONS WITH AFFILIATES AND OTHER SERVICE PROVIDERS
Each Fund’s investments are managed by the Adviser pursuant to the terms of a management agreement with the Trust. The Adviser has hired the Sub-Adviser to manage the Funds’ assets on a day-to-day basis. The Sub-Adviser is paid by the Adviser. In accordance with the management agreement for each Fund, the Adviser is entitled to a management fee, computed and accrued daily and paid monthly, at an annual rate of 0.90%, 0.75% and 0.50% of the average daily net assets of the Small Cap Fund, the Mid Cap Fund and the Equity Income Fund, respectively. For the six months ended September 30, 2023, the Adviser earned management fees, before the waiver described below, of $906,628, $311,709 and $188,642 from the Small Cap Fund, the Mid Cap Fund and the Equity Income Fund, respectively. At September 30, 2023, the Adviser was owed $145,409 from the Small Cap Fund, $49,564 from the Mid Cap Fund and $26,088 from the Equity Income Fund.
The Adviser has contractually agreed to waive its management fee and/or to reimburse certain Fund operating expenses through July 31, 2024 for the each Fund, but only to the extent necessary so that total annual operating expenses, excluding portfolio transaction and other investment-related costs (including brokerage fees and commissions); taxes; borrowing costs (such as interest and dividend expenses on securities sold short); acquired fund fees and expenses; fees and expenses associated with investments in other collective investment vehicles or derivative instruments (including for example option and swap fees and expenses); any amounts payable pursuant to a distribution or service plan adopted in accordance with Rule 12b-1 under the 1940 Act; expenses incurred in connection with any merger or reorganization; extraordinary expenses (such as litigation expenses, indemnification of Trust officers and Trustees and contractual indemnification of Fund service providers, and other expenses that the Trustees agree have not been incurred in the ordinary course of the Funds’ business), do not exceed 1.25% of the Small Cap Fund’s average daily net assets, 0.85% of the Mid Cap Fund’s average daily net assets and 0.70% of the Equity Income Fund’s average daily net assets. For the six months ended September
28
| Dean Funds |
| Notes to the Financial Statements (continued) |
| September 30, 2023 - (Unaudited) |
30, 2023, the Adviser waived fees of $86,090 and $36,252 for the Mid Cap Fund and the Equity Income Fund, respectively.
Each waiver/expense payment by the Adviser is subject to recoupment by the Adviser from the Fund in the three years following the date the particular waiver/expense payment occurred, but only if such recoupment can be achieved without exceeding the annual expense limitation in effect at the time of the waiver/expense payment and any expense limitation in effect at the time of recoupment. As of September 30, 2023, the Adviser may seek repayment of management fees waived and expense reimbursements pursuant to the aforementioned conditions, from the Mid Cap Fund and the Equity Income Fund no later than the dates stated below:
| Equity Income | ||||||||
| Recoverable Through | Mid Cap Fund | Fund | ||||||
| March 31, 2024 | $ | 88,790 | $ | — | ||||
| March 31, 2025 | 170,376 | — | ||||||
| March 31, 2026 | 172,518 | 48,814 | ||||||
| September 30, 2026 | 86,090 | 36,252 | ||||||
Ultimus Fund Solutions, LLC (“Ultimus”) provides administration, fund accounting and transfer agent services to the Funds. The Funds pay Ultimus fees in accordance with the agreements for such services.
Northern Lights Compliance Services, LLC (“NLCS”), an affiliate of Ultimus, provides a Chief Compliance Officer to the Trust, as well as related compliance services, pursuant to a consulting agreement between NLCS and the Trust. Under the terms of such agreement, NLCS receives fees from the Funds, which are approved annually by the Board.
Under the terms of a Distribution Agreement with the Trust, Ultimus Fund Distributors, LLC (the “Distributor”) serves as principal underwriter to the Funds. The Distributor is a wholly-owned subsidiary of Ultimus. The Distributor is compensated by the Adviser (not the Funds) for acting as principal underwriter.
Certain officers of the Trust are also employees of Ultimus and such persons are not paid by the Funds for serving in such capacities. One Trustee is a former employee of Ultimus who is not currently paid by the Funds for serving in such capacity.
The Board supervises the business activities of the Trust. Each Trustee serves as a trustee until termination of the Trust unless the Trustee dies, resigns, retires, or is removed. The Chair of the Board and more than 75% of the Trustees are “Independent Trustees”, which means that they are not “interested persons” as defined in the 1940 Act. The Independent Trustees review and establish compensation at least annually. Each Independent Trustee
29
| Dean Funds |
| Notes to the Financial Statements (continued) |
| September 30, 2023 - (Unaudited) |
of the Trust receives annual compensation, which is an established amount paid quarterly per fund in the Trust at the time of the regular quarterly Board meetings. The Chair of the Board receives the highest compensation, commensurate with his additional duties and each Chair of a committee receives additional compensation as well. Independent Trustees also receive additional fees for attending any special meetings. In addition, the Trust reimburses Independent Trustees for out-of-pocket expenses incurred in conjunction with attendance at meetings.
NOTE 5. PURCHASES AND SALES OF SECURITIES
For the six months ended September 30, 2023, purchases and sales of investment securities, other than short-term investments, were as follows:
| Purchases | Sales | |||||||
| Small Cap Fund | $ | 102,128,777 | $ | 108,021,917 | ||||
| Mid Cap Fund | 40,820,616 | 17,181,470 | ||||||
| Equity Income Fund | 10,108,986 | 5,563,400 | ||||||
There were no purchases or sales of long-term U.S. government obligations during the six months ended September 30, 2023.
NOTE 6. FEDERAL TAX INFORMATION
At September 30, 2023, the net unrealized appreciation (depreciation) and tax cost of investments for tax purposes was as follows:
| Small Cap | Mid Cap | Equity Income | ||||||||||
| Fund | Fund | Fund | ||||||||||
| Gross unrealized appreciation | $ | 5,365,966 | $ | 11,896,695 | $ | 1,436,725 | ||||||
| Gross unrealized depreciation | (16,337,885 | ) | (1,899,130 | ) | (6,563,494 | ) | ||||||
| Net unrealized appreciation (depreciation) | $ | (10,971,919 | ) | $ | 9,997,565 | $ | (5,126,769 | ) | ||||
| Tax cost of investments | $ | 192,908,166 | $ | 83,250,790 | $ | 75,792,186 | ||||||
The tax character of distributions paid for the fiscal year ended March 31, 2023, the Funds’ most recent fiscal year end, were as follows:
| Small Cap | Equity Income | |||||||||||
| Fund | Mid Cap Fund | Fund | ||||||||||
| Distributions paid from: | ||||||||||||
| Ordinary income(a) | $ | 2,517,470 | $ | 692,115 | $ | 50,960 | ||||||
| Long-term capital gains | — | 3,175,758 | — | |||||||||
| Total distributions paid | $ | 2,517,470 | $ | 3,867,873 | $ | 50,960 | ||||||
| (a) | Short-term capital gain distributions are treated as ordinary income for tax purposes. |
30
| Dean Funds |
| Notes to the Financial Statements (continued) |
| September 30, 2023 - (Unaudited) |
At March 31, 2023, the components of accumulated earnings (deficit) on a tax basis were as follows:
| Equity Income | ||||||||||||
| Small Cap Fund | Mid Cap Fund | Fund | ||||||||||
| Undistributed ordinary income | $ | 2,372,654 | $ | 394,987 | $ | 522,874 | ||||||
| Undistributed long-term capital gains | — | 3,233,339 | 5,834 | |||||||||
| Accumulated capital and other losses | (63,860 | ) | — | — | ||||||||
| Unrealized appreciation (depreciation) on investments | 1,753,368 | 14,906,246 | (1,622,310 | ) | ||||||||
| Total accumulated earnings (deficit) | $ | 4,062,162 | $ | 18,534,572 | $ | (1,093,602 | ) | |||||
The difference between book basis and tax basis of unrealized appreciation (depreciation) is primarily attributable to the tax deferral of losses on wash sales.
As of March 31, 2023, the Small Cap Fund had short-term capital loss carryforwards of $63,860. These capital loss carryforwards, which do not expire, may be utilized in future years to offset net realized capital gains, if any, prior to distributing such gains to shareholders.
NOTE 7. SECTOR RISK
If a Fund has significant investments in the securities of issuers within a particular sector, any development affecting that sector will have a greater impact on the value of the net assets of the Fund than would be the case if the Fund did not have significant investments in that sector. In addition, this may increase the risk of loss in the Fund and increase the volatility of the Fund’s NAV per share. For instance, economic or market factors, regulatory changes or other developments may negatively impact all companies in a particular sector, and therefore the value of the Fund’s portfolio will be adversely affected. As of September 30, 2023, the Small Cap Fund had 25.70% of the value of its net assets invested in stocks within the Financials sector.
NOTE 8. COMMITMENTS AND CONTINGENCIES
The Trust indemnifies its officers and Trustees for certain liabilities that may arise from their performance of their duties to the Trust or the Funds. Additionally, in the normal course of business, the Trust enters into contracts that contain a variety of representations and warranties which provide general indemnifications. The Trust’s maximum exposure under these arrangements is unknown, as this would involve future claims that may be made against the Trust that have not yet occurred.
31
| Dean Funds |
| Notes to the Financial Statements (continued) |
| September 30, 2023 - (Unaudited) |
NOTE 9. SUBSEQUENT EVENTS
Management of the Funds has evaluated the need for disclosures and/or adjustments resulting from subsequent events through the date at which these financial statements were issued. Based upon this evaluation, management has determined there were no items requiring adjustment of the financial statements or additional disclosure.
32
| Liquidity Risk Management Program (Unaudited) |
The Trust has adopted and implemented a written liquidity risk management program (the “Program”) as required by Rule 22e-4 (the “Liquidity Rule”) under the 1940 Act. The Program is reasonably designed to assess and manage the liquidity risk of each individual series of the Trust (each a “Fund” and collectively, the “Funds”), taking into consideration, among other factors, the Fund’s investment strategy and the liquidity of its portfolio investments during normal and reasonably foreseeable stressed conditions; its short and long-term cash flow projections; and its cash holdings and access to other funding sources. The Board approved the appointment of the Liquidity Administrator Committee, comprising certain Trust officers and employees of the Adviser. The Liquidity Administrator Committee maintains Program oversight and reports to the Board on at least an annual basis regarding the Program’s operational effectiveness through a written report (the “Report”). The most recent Report, which was presented to the Board for consideration at its meeting held on August 14-15, 2023, outlined the operation of the Program and the adequacy and effectiveness of the Program’s implementation. During the review period, the Funds did not experience unusual stress or disruption to their operations related to purchase and redemption activity. Also, during the review period each Fund held adequate levels of cash and highly liquid investments to meet shareholder redemption activities in accordance with such Fund’s prospectus and within the requirements of the 1940 Act. The Report concluded that the Program is reasonably designed to prevent violation of the Liquidity Rule and has been effectively implemented.
33
| Summary of Fund Expenses (Unaudited) |
As a shareholder of a Fund, you incur two types of costs: (1) transaction costs and (2) ongoing costs, including management fees, distribution (12b-1) fees and other Fund expenses. These examples are intended to help you understand your ongoing costs (in dollars) of investing in each Fund and to compare these costs with the ongoing costs of investing in other funds. Each Fund’s example is based on an investment of $1,000 invested at the beginning of the period and held for the entire period from April 1, 2023 through September 30, 2023.
Actual Expenses
The first line of the table below provides information about actual account values and actual expenses. You may use the information in this line, together with the amount you invested, to estimate the expenses that you paid over the period. Simply divide your account value by $1,000 (for example, an $8,600 account value divided by $1,000 = 8.6), then multiply the result by the number in the first line under the heading “Expenses Paid During Period” to estimate the expenses you paid on your account during this period.
Hypothetical Example for Comparison Purposes
The second line of the table below provides information about hypothetical account values and hypothetical expenses based on each Fund’s actual expense ratio and an assumed rate of return of 5% per year before expenses, which is not the Fund’s actual return. The hypothetical account values and expenses may not be used to estimate the actual ending account balance or expenses you paid for the period. You may use this information to compare the ongoing costs of investing in the Funds and other funds. To do so, compare this 5% hypothetical example with the 5% hypothetical examples that appear in the shareholder reports of other funds.
Expenses shown in the table are meant to highlight your ongoing costs only and do not reflect any transactional costs. Therefore, the second line of the table below is useful in comparing ongoing costs only and will not help you determine the relative total costs of owning different funds. In addition, if transaction costs were included, your costs would have been higher.
| Beginning | Ending | ||||||||||||||
| Account | Account | Expenses | |||||||||||||
| Value | Value | Paid | Annualized | ||||||||||||
| April 1, | September | During | Expense | ||||||||||||
| 2023 | 30, 2023 | Period(a) | Ratio | ||||||||||||
| Small Cap Fund | |||||||||||||||
| Actual | $ | 1,000.00 | $ | 929.70 | $ | 5.55 | 1.15% | ||||||||
| Hypothetical(b) | $ | 1,000.00 | $ | 1,019.32 | $ | 5.80 | 1.15% | ||||||||
| Mid Cap Fund | |||||||||||||||
| Actual | $ | 1,000.00 | $ | 1,006.70 | $ | 4.26 | 0.85% | ||||||||
| Hypothetical(b) | $ | 1,000.00 | $ | 1,020.82 | $ | 4.29 | 0.85% | ||||||||
| Equity Income Fund | |||||||||||||||
| Actual | $ | 1,000.00 | $ | 961.60 | $ | 3.43 | 0.70% | ||||||||
| Hypothetical(b) | $ | 1,000.00 | $ | 1,021.57 | $ | 3.54 | 0.70% | ||||||||
| (a) | Expenses are equal to the Fund’s annualized expense ratios, multiplied by the average account value over the period, multiplied by 183/365 (to reflect the one-half year period). |
| (b) | Hypothetical assumes 5% annual return before expenses. |
34
Privacy Notice
Rev: March 2021
| FACTS | WHAT DO THE DEAN FUNDS (THE “FUNDS”) DO WITH YOUR PERSONAL INFORMATION? |
| Why? | Financial companies choose how they share your personal information. Federal law gives consumers the right to limit some but not all sharing. Federal law also requires us to tell you how we collect, share, and protect your personal information. Please read this notice carefully to understand what we do. |
| What? | The types of personal information we collect and share depend on the product or service you have with us. This information can include:
■ Social Security number
■ account balances and account transactions
■ transaction or loss history and purchase history
■ checking account information and wire transfer instructions
When you are no longer our customer, we continue to share your information as described in this notice. |
| How? | All financial companies need to share customers’ personal information to run their everyday business. In the section below, we list the reasons financial companies can share their customers’ personal information; the reasons the Funds choose to share; and whether you can limit this sharing. |
| Reasons we can share your personal information | Do the Funds share? |
| For our everyday business purposes— such as to process your transactions, maintain your account(s), respond to court orders and legal investigations, or report to credit bureaus | Yes |
| For our marketing purposes— to offer our products and services to you | No |
| For joint marketing with other financial companies | No |
| For our affiliates’ everyday business purposes— information about your transactions and experiences | No |
| For our affiliates’ everyday business purposes— information about your creditworthiness | No |
| For nonaffiliates to market to you | No |
| Questions? | Call (888) 899-8343 |
35
| Who we are | |
| Who is providing this notice? | Dean Funds Ultimus Fund Distributors, LLC (Distributor) Ultimus Fund Solutions, LLC (Administrator) |
| What we do | |
| How do the Funds protect my personal information? | To protect your personal information from unauthorized access and use, we use security measures that comply with federal law. These measures include computer safeguards and secured files and buildings. Our service providers are held accountable for adhering to strict policies and procedures to prevent any misuse of your nonpublic personal information. |
| How do the Funds collect my personal information? | We collect your personal information, for example, when you
■ open an account or deposit money
■ buy securities from us or sell securities to us
■ make deposits or withdrawals from your account
■ give us your account information
■ make a wire transfer
■ tell us who receives the money
■ tell us where to send the money
■ show your government-issued ID
■ show your driver’s license |
| Why can’t I limit all sharing? | Federal law gives you the right to limit only
■ sharing for affiliates’ everyday business purposes —information about your creditworthiness
■ affiliates from using your information to market to you
■ sharing for nonaffiliates to market to you
State laws and individual companies may give you additional rights to limit sharing. |
| Definitions | |
| Affiliates | Companies related by common ownership or control. They can be financial and nonfinancial companies.
■ Dean Investment Associates, LLC, the investment adviser to the Funds, could be deemed to be an affiliate. |
| Nonaffiliates | Companies not related by common ownership or control. They can be financial and nonfinancial companies.
■ The Dean Funds do not share your personal information with nonaffiliates so they can market to you |
| Joint marketing | A formal agreement between nonaffiliated financial companies that together market financial products or services to you.
■ The Dean Funds do not jointly market. |
36
PROXY VOTING
A description of the policies and procedures that each Fund uses to determine how to vote proxies relating to portfolio securities and information regarding how each Fund voted those proxies during the most recent twelve month period ended June 30, are available (1) without charge upon request by calling the Funds at (888) 899-8343 and (2) in Fund documents filed with the SEC on the SEC’s website at www.sec.gov.
| TRUSTEES Daniel J. Condon, Chair David R. Carson Kenneth G.Y. Grant Freddie Jacobs, Jr. Catharine B. McGauley Ronald C. Tritschler | INDEPENDENT REGISTERED PUBLIC ACCOUNTING FIRM Cohen & Company, Ltd. 151 North Franklin Street, Suite 575 Chicago, IL 60606 |
| OFFICERS Martin R. Dean, President Gweneth K. Gosselink, Chief Compliance Officer Zachary P. Richmond, Treasurer and Chief Financial Officer | LEGAL COUNSEL Thompson Hine LLP 312 Walnut Street, 20th Floor Cincinnati, OH 45202 |
| INVESTMENT ADVISER Dean Investment Associates LLC 3500 Pentagon Blvd., Suite 200 Beavercreek, OH. 45431 | CUSTODIAN Huntington National Bank 41 South High Street Columbus, OH 43215 |
| DISTRIBUTOR Ultimus Fund Distributors, LLC 225 Pictoria Drive, Suite 450 Cincinnati, OH 45246 | ADMINISTRATOR, TRANSFER AGENT AND FUND ACCOUNTANT Ultimus Fund Solutions, LLC 225 Pictoria Drive, Suite 450 Cincinnati, OH 45246 |
This report is intended only for the information of shareholders or those who have received the Funds’ prospectus which contains information about the Funds’ management fees and expenses. Please read the prospectus carefully before investing.
Distributed by Ultimus Fund Distributors, LLC
Member FINRA/SIPC
Dean-SAR-23
(b) Not applicable
Item 2. Code of Ethics. NOT APPLICABLE – disclosed with annual report
Item 3. Audit Committee Financial Expert. NOT APPLICABLE – disclosed with annual report
Item 4. Principal Accountant Fees and Services. NOT APPLICABLE – disclosed with annual report
Item 5. Audit Committee of Listed Companies. Certain series of the registrant that appear in the shareholder report included in Item 1 are listed issuers as defined in Rule 10A-3 under the Securities Exchange Act of 1934, as amended (the “Exchange Act”) and have a separately-designated standing audit committee established in accordance with Section 3(a)(58)A of the Exchange Act. The registrant’s audit committee member is Freddie Jacobs, Jr.
Item 6. Schedule of Investments. Schedule filed with Item 1.
Item 7. Disclosure of Proxy Voting Policies and Procedures for Closed-End Management Investment Companies. NOT APPLICABLE – applies to closed-end funds only
Item 8. Portfolio Managers of Closed-End Investment Companies. NOT APPLICABLE – applies to closed-end funds only
Item 9. Purchases of Equity Securities by Closed-End Management Investment Company and Affiliated Purchasers. NOT APPLICABLE – applies to closed-end funds only
Item 10. Submission of Matters to a Vote of Security Holders.
The registrant has not adopted procedures by which shareholders may recommend nominees to the registrant’s board of trustees.
Item 11. Controls and Procedures.
(a) Based on their evaluation of the registrant’s disclosure controls and procedures (as defined in Rule 30a-3(c) under the Investment Company Act of 1940, as amended (the “Act”)) as of a date within 90 days of the filing date of this report, the registrant’s principal executive officer and principal financial officer have concluded that such disclosure controls and procedures are reasonably designed and are operating effectively to ensure that material information relating to the registrant is made known to them by others within those entities, particularly during the period in which this report is being prepared, and that the information required in filings on Form N-CSR is recorded, processed, summarized, and reported on a timely basis.
(b) There were no changes in the registrant's internal control over financial reporting (as defined in Rule 30a-3(d) under the Investment Company Act of 1940) that occurred during the period covered by this report that have materially affected, or are reasonably likely to materially affect, the registrant's internal control over financial reporting.
Item 12. Disclosure of Securities Lending Activities for Closed-End Investment Companies.
Not Applicable.
Item 13. Exhibits.
(a)(1) Not Applicable – filed with annual report
(a)(3) Not Applicable – there were no written solicitations to purchase securities under Rule 23c-1
during the period
| (b) | Certification pursuant to 18 U.S.C. Section 1350, as adopted pursuant to Section 906 of the Sarbanes-Oxley Act of 2002 is filed herewith |
SIGNATURES
Pursuant to the requirements of the Securities Exchange Act of 1934 and the Investment Company Act of 1940, the registrant has duly caused this report to be signed on its behalf by the undersigned, thereunto duly authorized.
(Registrant) Unified Series Trust
By /s/ Martin R. Dean
Martin R. Dean, President
Date 12/8/2023 _
Pursuant to the requirements of the Securities Exchange Act of 1934 and the Investment Company Act of 1940, this report has been signed below by the following persons on behalf of the registrant and in the capacities and on the dates indicated.
By _/s/ Martin R. Dean_
Martin R. Dean, President
Date 12/8/2023
By _/s/ Zachary P. Richmond
Zachary P. Richmond, Treasurer
Date 12/8/2023__