United States Securities and Exchange Commission
Washington, D.C. 20549
FORM 10-K
ANNUAL REPORT PURSUANT TO SECTION 13 OR 15(d) OF THE SECURITIES EXCHANGE ACT OF 1934
FOR THE FISCAL YEAR ENDED DECEMBER 31, 2006
OR
FOR THE TRANSITION PERIOD FROM TO
Commission File No. 000-50343
INTEGRATED ALARM SERVICES GROUP, INC.
(Exact name of Registrant as specified in its charter)
Delaware (State or other jurisdiction of incorporation or organization) | 42-1578199 (IRS Employer Identification No.) | |
99 Pine Street, 3rd Floor, Albany, New York (Address of principal executive offices) | 12207 (Zip code) | |
(518) 426-1515 ( Registrant’s telephone number, including area code) | ||
| Securities registered pursuant to Section 12(b) of the Act: | ||
Title of each class Common Stock | Name of each exchange on which registered The NASDAQ Stock Market LLC | |
Securities registered pursuant to Section 12(g) of the Act: NONE | ||
Indicate by check mark if the registrant is a well-known seasoned issuer, as defined in Rule 405 of the Securities Act. Yes o No x
Indicate by check mark if the registrant is not required to file reports pursuant to Section 13 or Section 15(d) of the Act. Yes o No x
Indicate by check mark whether the registrant (1) has filed all reports required to be filed by Section 13 or 15(d) of the Securities Exchange Act of 1934 during the preceding 12 months (or for such shorter period that the registrant was required to file such reports), and (2) has been subject to such filing requirements for the past 90 days. Yes x No o
Indicate by check mark if disclosure of delinquent filers pursuant to Item 405 of Regulation S-K is not contained herein, and will not be contained, to the best of registrant’s knowledge, in definitive proxy or information statements incorporated by reference in Part III of this Form 10-K or any amendment to this Form 10-K. x
Indicate by check mark whether the registrant is a large accelerated filer, an accelerated filer, or a non-accelerated filer (as defined in Rule 12b-2 of the Securities Exchange Act of 1934). Large accelerated filer o Accelerated filer x Non-accelerated filer o
Indicate by check mark whether the registrant is a shell company (as defined in Rule 12b-2 of the Act). Yes o No x
The aggregate market value of common stock held by non-affiliates of the registrant as of December 31, 2006, was $79,198,717.
The number of shares outstanding of the registrant’s common stock as of March 1, 2007 was 24,368,836 shares.
Integrated Alarm Services Group, Inc.
FORM 10-K
For The Fiscal Year Ended December 31, 2006
INDEX
Part I | Page | |
Part II | ||
Part III | ||
Part IV | ||
PART I
This Annual Report on Form 10-K contains forward-looking statements. The forward-looking statements involve a number of risks and uncertainties. A number of factors could cause our actual results, performance, achievements or industry results to be materially different from any future results, performance or achievements expressed or implied by these forward-looking statements. These factors include, but are not limited to:
| · | general economic and business conditions; |
| · | our business strategy for expanding our presence in our industry, including acquisitions; |
| · | anticipated trends in our financial condition and results of operations; |
| · | the impact of competition and technological change; |
| · | existing and future regulations affecting our business; and |
| · | other risk factors set forth under Item 1A - Risk Factors below. |
You can identify forward-looking statements generally by the use of forward-looking terminology such as ‘‘believes,’’ ‘‘expects,’’ ‘‘may,’’ ‘‘will,’’ ‘‘intends,’’ ‘‘plans,’’ ‘‘should,’’ ‘‘could,’’ ‘‘seeks,’’ ‘‘pro forma,’’ ‘‘anticipates,’’ ‘‘estimates,’’ ‘‘continues,’’ or other variations thereof, including their use in the negative, or by discussions of strategies, opportunities, plans or intentions. These forward-looking statements necessarily depend upon assumptions and estimates that may prove to be incorrect.
Although we believe that the assumptions and estimates reflected in the forward-looking statements contained in this Annual Report on Form 10-K are reasonable, we cannot guarantee that we will achieve our plans, intentions or expectations. The forward-looking statements involve known and unknown risks, uncertainties and other factors that may cause actual results to differ in significant ways
from any future results expressed or implied by the forward-looking statements.
Recent Developments
On December 20, 2006, Protection One, Inc. (“Protection One”), Integrated Alarm Services Group, Inc. (“IASG”) and Tara Acquisition Corp., a direct, wholly owned subsidiary of Protection One (“Tara”), entered into an Agreement and Plan of Merger (the “Merger Agreement”) pursuant to which Protection One will acquire IASG (the “Merger”). If IASG’s Board of Directors withdraws or modifies the Merger Agreement in a manner adverse to Protection One or its recommendation of the merger, the Company may be subject to a $7.5 million payment to Protection One consisting of a termination fee and reimbursement of expenses.
Subject to the terms and conditions of the Merger Agreement, which has been unanimously approved by the boards of directors of Protection One and IASG, upon the completion of the Merger, each share of IASG common stock will be converted into 0.29 shares of Protection One common stock, with cash to be paid in lieu of fractional shares. On March 27, 2007, the Shareholders of IASG will vote on adoption of the Merger Agreement. If approved by the Shareholders, the merger is scheduled to be consummated on April 2, 2007.
Overview
We are one of the largest providers of monitoring, financing, and business support services to independent security alarm Dealers, which we refer to as “Dealers”, in the United States. We offer our services to Dealers competing in both the residential and commercial security alarm markets. We believe our services better allow Dealers to compete with larger, self-monitoring national alarm companies. The major categories of services we provide include:
| · | Monitoring: We monitor alarm systems on behalf of Dealers who do not have the capital resources or critical mass to economically establish their own monitoring facilities and for our own accounts. We believe we are the largest wholesale alarm monitoring company in the United States, monitoring approximately 620,000 alarm systems on behalf of approximately 4,000 independent Dealers. We refer to this as our wholesale business and we currently receive approximately $2.6 million of revenue per month to monitor contracts owned by Dealers. Our alarm monitoring services are provided through two redundant alarm monitoring centers located in New Jersey and California. The acquisition of Financial Security Services, Inc. (“FSS”) in 2005 provided us with approximately 95,000 new monitored alarm systems as of December 31, 2006 and approximately 147 new Dealer relationships (these are included in the above totals) as well as an alarm monitoring center in Minnesota. |
| · | Financing: Since 1993, we have provided financing for Dealers in the form of loans or alarm monitoring contract purchases of approximately $520 million. As of December 31, 2006, we owned and monitored a portfolio of approximately 145,000 retail alarm monitoring contract equivalents. A contract equivalent is equal to $30 per month in Recurring Monthly Revenue (“RMR”) from a typical residential customer. We refer to this as our retail business and we currently receive approximately $4.3 million of revenue per month from this portfolio. In addition, we hold approximately 27,000 contracts as collateral against loans we have made to Dealers, 20,000 of which are from our FSS portfolio acquired in 2005. |
| · | Business Support Services: For some of our Dealers, we provide billing, collection and marketing services as well as access to equipment discount programs. Because of our scale, we can generally provide these services on a more cost-effective basis for Dealers than they can for themselves. In addition, our equipment discount program allows Dealers who use our monitoring services to automatically receive preferential pricing for certain alarm equipment. |
Our retail portfolio is comprised of both commercial and residential subscribers, which represent approximately 77% of our revenue in this portfolio, and commercial subscribers, which represent approximately 23% of our revenue in this portfolio.
We acquire alarm monitoring contracts on both a “flow business” and “bulk purchase” basis. Flow business is the purchase of newly created alarm monitoring contracts on a recurring, or “as originated,” basis from Dealers. We currently have relationships with over 75 Dealers from which we acquire alarm monitoring contracts on a flow basis. Bulk purchases are the acquisition of existing portfolios of alarm monitoring contracts with demonstrated payment histories. These alarm monitoring contracts are typically purchased from Dealers on a non-recurring basis. We also acquire monitoring contracts and Dealer relationships by acquiring monitoring call centers.
We believe our package of services allows Dealers to compete against the large self-monitoring national providers in the security alarm market by giving them access to technical sophistication, financing, back office and other services that they would not otherwise have, while allowing them to remain the local and visible contact with their customer, the end-user of the security alarm system. We intend to continue to expand the number of Dealers to which we provide these services through direct marketing of our services as well as acquisitions of Dealer relationships. See financial statement footnote 17 for segment information.
Our Business Strategy
Growth Initiatives
Acquisition of Additional Alarm Monitoring Contracts
We intend to expand our acquisition and financing of alarm monitoring contracts through purchasing retail alarm monitoring contracts on both a flow business and bulk purchase basis and by expanding our internal sales organization. Since our initial public offering in July 2003, we have acquired approximately 167,000 retail alarm monitoring contract equivalents at an average purchase multiple of 28 times the RMR. The sources of contracts available for acquisition include (i) our existing Dealer network, (ii) purchases from independent brokers representing pools of seasoned contracts and (iii) opportunistic purchases in the normal course of business.
Building Additional Wholesale Monitoring Relationships with Dealers
We intend to grow our wholesale business both internally and by acquiring Dealer relationships. Our internal growth is driven by the quality of service that we provide to our Dealers and their end-users. Our state-of-the-art redundant monitoring centers are important factors that enable us to attract additional Dealers. We believe that the fact that we do not compete, in most markets, with Dealers in the sale or installation of security alarm systems provides us a competitive advantage over many of our competitors that do compete with independent Dealers. We also intend to purchase Dealer relationships from monitoring companies.
Cross-Selling Opportunities
We have initiated a comprehensive cross-selling program of our primary services to Dealers. For those Dealers to whom we provide wholesale monitoring services, we will encourage them to use us as the purchaser when they wish to sell alarm monitoring contracts, or as a financing source should they wish to borrow funds against the value of their alarm monitoring contracts. We also have a program to offer additional services to the Dealers’ end-users, such as two-way voice communication, extended warranty coverage, personal emergency response service and GPS tracking services for movable assets.
Maximize Subscriber Retention
We seek to maximize subscriber retention by continuing to acquire high quality retail alarm monitoring contracts with demonstrated payment histories (for bulk purchases) and to increase the average life of an alarm monitoring contract by providing superior customer service and actively identifying subscribers who are relocating, the number one reason for account cancellations, and target retention of such subscribers, we also target the new residents moving into the relocating subscriber’s residence.
Maximize Economies of Scale
Our existing infrastructure will allow us to add a substantial number of additional alarm monitoring contracts with minimal additional costs. As we continue to grow our subscriber base, we believe our margins will increase as some of these costs are spread over larger recurring revenue streams. We believe our cash flows will also benefit from our continued efforts to reduce subscriber attrition. In addition, we believe that the consolidation of our various operating systems into one company wide product, as well as other actions we plan to take, will allow us to realize substantial cost savings.
Our Industry
Overview
The security alarm industry is characterized by a large number of privately owned companies involved in security alarm sales, leasing, installation, repair and monitoring. Based on information from BarnesAssociates, approximately 45% of this market is served by companies not included in the 100 largest companies. The top 100 companies include large self-monitoring national providers such as ADT, Brinks and Protection One. Our target market is the portion of the market served by the Dealers outside of the top 100, or approximately 45% of the overall alarm monitoring market.
The growth in the security alarm industry has been fueled by several factors. We believe the aging of the population and the increase in two-career families have both contributed to an increased focus on the security of the home. Many insurance companies offer discounts to home and business owners who install electronic security alarm systems. In fact, many commercial enterprises are required by insurance underwriters to have monitored alarm systems. Additionally, we believe that many new homes have pre-installed security alarm systems. We also anticipate that historic growth rates in penetration will increase as technology continues to lower the cost of security alarm systems and monitoring and increases the potential applications of monitoring centers.
The performance of the security alarm industry has been impacted by numerous factors including the significant amount of consolidation that occurred in the mid-to-late nineties, self-monitoring national providers such as ADT and Protection One, private regional providers, as well as new entrants into the market which acquired a large number of independent Dealers (with and without monitoring call centers) and wholesale monitoring stations. During this period of consolidation, purchase multiples of RMR ranged from approximately 35x to 68x. This growth was largely financed with debt. Most of these acquirers experienced service disruptions in connection with the integration of these newly-acquired customer accounts, which resulted in a significant loss of customers, or “attrition,” as is referred to in the industry. Further, many acquirers were facing and continue to face financial pressures to service the debt used to effect these acquisitions. We believe that we will be able to complete acquisitions at purchase multiples of RMR lower than those which existed industry-wide in the mid-to-late nineties. Further, we expect that such acquisitions will be completed without compromising our account underwriting and due diligence criteria.
Dealer Operations
The primary sources of revenue for Dealers are the sale and installation of security alarm systems and the monthly subscription of the monitoring service. Typically, upon installation, the end-user enters into an annual alarm monitoring contract. Under an alarm monitoring contract, the Dealer agrees to monitor, or contract with another company to monitor, the security alarm from a remote location and to take certain pre-determined actions, such as calling the police, an ambulance service or fire department, when a security system is triggered and an alarm signal is received. After its initial term, most alarm monitoring contracts are subject to automatic renewal on an annual basis unless the Dealer or end-user notifies the other party within a defined time period that the alarm monitoring contract will not be renewed. The average life of alarm monitoring contracts, including renewals, typically ranges from 8 to 12 years.
Most Dealers do not have the capability to monitor alarms internally and outsource the monitoring and/or administrative aspects of the business to an outside wholesale alarm monitoring company. We believe that Dealers look for a partner, such as us, who offers a wide array of services, including state-of-the-art monitoring service, billing and collection capabilities and marketing support, all at a reasonable cost.
Financing support is often just as important as monitoring support since many Dealers are constrained by the working capital requirements required to build their business. In many cases, the cost of the installed equipment to the end-user is at or below the Dealer’s cost. In these cases, much of the Dealer's capital and financial return comes from future monthly payments under the alarm monitoring contracts. As a result, Dealers often need or desire to monetize these alarm monitoring contracts and will, consequently, sell or borrow against their alarm monitoring contracts.
Although there is a well-developed market for the purchase and sale of alarm monitoring contracts and several specialty finance companies have been willing to lend against alarm monitoring contracts held by Dealers, many Dealers have not had access to traditional credit lending markets. Several characteristics of the industry, including the lack of standardization among individual alarm monitoring contracts and the under-capitalization of most Dealers, make it difficult for traditional lenders to comfortably lend against the value of individual alarm monitoring contracts. Further, the ability to provide or control monitoring service is critical to maximizing the value of the alarm monitoring contract since service issues are the primary reasons why end-users do not renew alarm monitoring contracts. Traditional lenders and many specialty lenders do not have this capability.
When acquiring alarm monitoring contracts from Dealers, purchasers typically pay a multiple of the RMR. According to BarnesAssociates, a financial services provider to the security alarm industry, the average RMR purchase multiple for portfolios with less than $50,000 in RMR was, 33.5x in 2004, 34.8x in 2005 and an estimated 36.1x in 2006. For example, assuming a monthly security alarm monitoring cost to the end-user of $30, the acquisition price of the alarm monitoring contract would be approximately $1,080 in 2006.
Our Services
Our two primary business activities are acquiring and managing portfolios of alarm monitoring contracts and monitoring security alarms. We also offer administrative services to our Dealers, such as billing and collection, as well as new and emerging products and services. Our acquisition and financing solutions provide capital to Dealers, allowing them to compete with larger competitors on the initial price of equipment and installation to the end-user.
We also provide Dealers with access to technical sophistication and back office services that they may not otherwise have (or be able to profitably operate), while allowing them to maintain visible contact with their local customers, the end-users of the alarm. Our alarm monitoring contract acquisition, financing solutions and monitoring services complement one another and drive growth in other areas of our business.
We generally require Dealers to whom we provide alarm monitoring contract financing to use our monitoring services for all of the alarm monitoring contracts they continue to own. We typically also require these Dealers to use our billing and collection services, enabling us to gain an additional level of control over the reliability of the alarm monitoring contracts’ cash flows. This places us in a unique position to minimize alarm monitoring contract attrition because we can control the quality of the monitoring, billing and collection and to a significant extent Dealer interaction with the end-user.
Alarm Monitoring Contract Acquisition and Financing Services
Generally, Dealers have had limited access to traditional credit providers. Several characteristics of the industry, including the lack of standardization among many individual alarm monitoring contracts, the under capitalization of Dealers and their inability to provide monitoring services directly has historically made lenders hesitant to provide financing to Dealers. When providing financing to Dealers, we obtain a security interest in the underlying alarm monitoring contracts. The payment terms are generally between 36 and 72 months, at interest rates based on prevailing overall interest rates and market conditions.
We believe that we are uniquely positioned to maximize the value of alarm monitoring contracts through the depth of our knowledge of the security alarm industry and the integrated nature of the services we provide. We have the ability to exercise greater control over alarm monitoring contract attrition than most capital providers because we have direct influence over the quality of the monitoring, interaction with the end-user and billing and collection. Consequently, we are able to deploy more capital and achieve higher returns.
With respect to purchased alarm monitoring contracts, we typically acquire them from the Dealers that originally sold and installed the security alarm systems giving rise to the alarm monitoring contracts. We structure the payment terms and pricing of both our alarm monitoring contract purchases and loans to provide us with a competitive internal rate of return. In a typical transaction, the Dealer will sell their alarm monitoring contracts for a purchase price that is a multiple of the RMR. The multiple paid in any actual transaction is impacted by several factors, including average RMR, the amount of the homeowner's investment in the alarm system, geographic diversity of the accounts and our own due diligence of the Dealer.
Generally, Dealers that sell or borrow against their alarm monitoring contracts do so on either a flow basis or a bulk basis. We purchase alarm monitoring contracts on both a flow and a bulk basis. Typically, the price paid for a flow alarm monitoring contract is less than that paid in a bulk purchase because very often the bulk purchases are comprised of seasoned, performing alarm monitoring contracts. In either instance, we typically require Dealers to replace any cancelled alarm monitoring contracts and lost revenues for the first year after we purchase an alarm monitoring contract. Such replacement must be in cash or acceptable alarm monitoring contracts. We also hold back a portion of the payment to purchase the contracts to secure this Dealer obligation.
Since alarm monitoring contract quality is a key driver of our profitability, underwriting discipline is critical. We maintain a very strict underwriting discipline. For example, we do not typically purchase alarm monitoring contracts that were generated by Dealers offering “zero-down” on equipment purchases and installation, unless the contracts have been outstanding for a minimum of 12 months and exhibit acceptable payment patterns as well as acceptable responses to quality control calls, since the lack of such costs does not create an investment stake in the service by the end-user. Further, end-users attracted to “zero-down” promotions are often of lower credit standing and therefore, may be more likely to default.
Credit quality of the end-user is also a key consideration when purchasing alarm monitoring contracts on a flow basis. We require credit rating scores on all alarm monitoring contracts that we acquire on a flow basis. We typically reject those alarm monitoring contracts with Beacon Scores (a credit rating employing a methodology developed by Fair, Isaac and Co., primarily used by Equifax in the U.S. and Canada) of less than 625 and typically accept alarm monitoring contracts with a Beacon Score of 640 or more (provided they satisfy all of our other due diligence criteria). Alarm monitoring contracts with a Beacon Score between 625 and 640 are further scrutinized through an additional review of the end-user’s credit status. We do not conduct a credit review of the end-user for bulk purchases because of the seasoned performance characteristics of such alarm monitoring contracts, such as the customer payment history.
Our due diligence process begins with an examination of the Dealer in much the same way as a bank reviews a mortgage applicant. We perform judgment and lien searches, review tax filings (corporate and personal), and obtain credit scores, certificates of good standing and proof of licensure from the state(s) in which the Dealer does business. In addition, we pre-approve each Dealer's standard end-user alarm monitoring contract and with respect to flow purchases obtain a credit rating for each end-user. We also generally require that the selling Dealers carry errors and omissions insurance with at least $1 million of coverage and provide us with a personal guarantee of the dealer recourse obligation. When we purchase on a flow basis, we also generally contact the end-user to ensure that they understand the alarm monitoring contract and know how to use the alarm system.
When purchasing alarm monitoring contracts on a bulk basis, we contact a significant random sample to ensure the customers exist. In all cases, we verify that the alarm system generates a live signal to our monitoring call centers. We include certain additional safeguards in our purchase and loan agreements. We generally bill end-users directly and require that the receipts be deposited into a lock-box account for our benefit. The contents of the lock-box are remitted daily to an accumulation account. The Dealers have no right in, or any right to withdraw any amounts held in the accumulation account. For loans, we also take physical possession of the original alarm monitoring contracts and file financing statements to perfect our security interest.
While some of our monitoring competitors also claim to offer alarm monitoring contract acquisition and financing alternatives to Dealers, many act merely as an intermediary. In contrast, we operate as a principal and either lend directly to the Dealers or acquire alarm monitoring contracts for our own portfolio. We are not aware of any other monitoring competitor in the industry that acts as a principal for loans to Dealers.
In addition to the alarm monitoring contract acquisition and finance process described above, we generally require that Dealers use us to monitor all of their alarm monitoring contracts, not just those that have been acquired or financed. This monitoring requirement enables us to ensure the quality of the monitoring services.
Monitoring Services
We provide monitoring to Dealers on alarm monitoring contracts that they have entered into with an end-user. Dealers typically pay us a fixed monthly monitoring fee for each account that we monitor on their behalf. The cost of the monthly monitoring fee is either based on a published list price or is negotiated between us and the Dealer. The charges are billed to the Dealer on a monthly, quarterly, semi-annual or annual basis in accordance with the contract agreement. The collection of payments by the Dealer from their end users have no effect on the prices charged or collected by us from the Dealer. We currently monitor approximately 765,000 end-user accounts. Generally, when an alarm is activated, a signal is sent from the alarm system through a phone line, radio transmitter or wireless service to a receiver located at one of our two monitoring facilities. This signal is immediately routed through our automated system and an operator personally handles each call. When the operator receives the alarm condition, his or her computer will simultaneously display a series of instructions on how to handle the alarm. These instructions are prepared by the Dealer and the end-user in advance and are customized to the particular logistics of the geographic area as well as the individual needs of the end-user.
In many instances, the operator will call a phone number specified by the end-user and ask for a code word. If the operator is unable to contact the end-user or an incorrect code word is given, the operator will dispatch the appropriate authority to the scene of the alarm. In the instance of a fire alarm, the operator is typically instructed to dispatch emergency vehicles without making an attempt to contact the end-user. In any event, after dispatching the appropriate authority, the operator will then call any other individuals specified in the end-user's instructions and will provide notice to the Dealer servicing the end-user of the event. The Dealer can then provide follow-up support with the local end-user.
In a typical week, our operators respond to approximately 68,000 priority alarm activations. We have consistently met a response time for priority events, measured by us as the time between when an alarm signal arrives in our alarm monitoring centers and our first response to that alarm, of 19 seconds on average, which we believe is among the best response times in the industry.
We own and operate two redundant alarm monitoring centers, which operate with state-of-the-art equipment and a highly trained staff. Our alarm monitoring centers are located in Manasquan, New Jersey and Irvine, California, and are linked via advanced software that creates a real-time queuing process. Having two facilities located strategically in different time zones allows us to efficiently allocate alarm responses based on time-of-day or specific event drivers that may cause one area of the country to have a higher volume of alarms than others. As a result, alarm signals, which would otherwise wait for available operators during peak periods, are routed to our other alarm monitoring centers where they are more quickly processed. For instance, a large number of alarms at our New Jersey facility resulting from bad weather in the Northeast would result in the transfer of a portion of these calls to our California facility. In addition, we also own and operate a monitoring center in St. Paul, Minnesota which we acquired as part of the FSS acquisition. The St. Paul facility operates on a different software platform than our other two alarm monitoring centers and is therefore unable to load share with those facilities.
All of our alarm monitoring centers are Underwriters Laboratories (R) (“UL”) listed. To obtain and maintain a UL listing, a monitoring call center must be located in a building meeting UL's structural requirements, have back-up and uninterruptible power supply, have secure and redundant telephone lines and redundant computer systems that meet UL criteria. Access to the facility must also be strictly controlled.
Alarm monitoring offerings vary widely with the specific needs of the end-user and encompass many types of monitored alarms including burglary, hold-up, panic, fire, two-way voice communication, industrial process control, medical emergency and environmental alert. We monitor all of these types of alarms from our existing monitoring call centers. Our alarm monitoring centers are also capable of supporting a full range of add-on services such as remote video monitoring, network intrusion detection, cellular transmission, private radio access, personal emergency response systems and Global Positioning System (“GPS”) monitoring and emergency dispatch services using GPS technology.
Historically, our wholesale alarm monitoring services business has grown by adding new Dealer relationships generated by both direct marketing and sales activities and by cross-selling to those Dealers to whom we have provided financing. Additionally, over the last four years we have acquired five wholesale alarm monitoring companies and we expect to acquire additional alarm monitoring centers in the future, subject to the availability of suitable acquisition opportunities.
We continually monitor the efficiency of each of our alarm monitoring centers. In recent years we have consolidated eight alarm monitoring centers into two alarm monitoring centers, taking advantage of new technologies that enable us to monitor large geographic areas very effectively from a single location. This consolidation has allowed us to increase efficiency and productivity, and decrease duplicative expenses. However, we intend to always maintain at least one fully redundant facility. During 2005, a third alarm monitoring center was added as a result of the FSS acquisition.
Other Products and Services
Billing and Collection
We create paper invoices and mail them to end-users serviced by our Dealers. We also utilize electronic and credit card payment options for our customer’s convenience. Additionally, we may provide collection services for accounts receivable. We generally charge on a per account basis. In instances where we provide the billing and collection function in addition to alarm monitoring contract acquisition and financing, we gain an additional level of assurance that timely payments will be made on the alarm monitoring contracts that we have purchased or lent against. It also enables us to minimize billing errors, which are also a cause of alarm monitoring contract attrition. By offering billing and collection services to our Dealers, we enable Dealers to focus their efforts on sales and installation, rather than administration of alarm monitoring contracts.
Equipment Sales without Monitoring
We sell equipment, such as motion detectors, sensors, cameras and closed circuit televisions without monitoring to certain commercial customers.
Commercial and Residential Bundled Arrangements
We sell bundled arrangements to our commercial and residential customers which consist of equipment, installation services and ongoing monitoring services generally under three to five year contracted terms. These bundled arrangements generally require an upfront payment and recurring monthly revenue (RMR) payments over the term of the contract. Amounts assigned to each component are based on the component’s objectively determined fair value. If fair value can not be determined for a sale involving multiple elements, upfront non-refundable deposits are deferred and recognized over the expected life of the customer relationship. The RMR is recognized monthly over the term of the contract.
Equipment Discount Program
We provide our Dealers with access to discounts on equipment. For example, we have entered into a relationship with Honeywell, which is the largest security alarm equipment manufacturer and provider in the world. Our understanding with Honeywell is that any Dealer who uses our monitoring services will automatically receive preferential pricing for all equipment purchased from Honeywell. This program can represent significant savings to our Dealers. To be eligible for this program, we require that the Dealer (i) be an existing customer of ours, (ii) connect all of their new end-users to our alarm monitoring center and (iii) maintain a current standing with regard to their monitoring charges.
We are currently in discussions with other major manufacturers of alarm equipment to institute a similar type of discount program for their equipment. This will give our Dealers a choice of using different types and brands of equipment while enjoying similar reduced pricing plans.
Sales and Marketing
Our sales and marketing activities are conducted through a network of 74 in-house professionals.
Sales activities are separated between retail and wholesale customers. Wholesale customer sales activities are structured under three product areas: wholesale monitoring, finance and acquisitions. The Company employs a salaried and commissioned sales force that is geographically distributed throughout the United States, which is responsible for identifying opportunities. The Company also employs product specialists, which assist the sales force. There are 8 professionals in our wholesale sales force. Our retail segment has 63 employees involved in sales activities related to servicing commercial and residential customers.
Our marketing department is comprised of 3 professionals and is responsible for the production and distribution of print advertising materials and direct mail marketing pieces. The team also issues corporate communications to employees, customers, strategic partners and other interested parties through regular press releases and announcements of new products and services. The group is also responsible for business development activities including the identification and procurement of new products and services that Dealers can sell to their customers.
We believe that this multi-faceted approach to sales and marketing activities is an important ingredient to the successful ongoing growth in all our business areas.
Acquisition Process
Since 2003, we have acquired four businesses. Through these acquisitions, we have not only significantly increased our number of contracts owned and dealer loan portfolios, but have increased our installation and servicing of commercial and residential monitoring systems.
Our alarm monitoring flow business includes the purchase of newly created alarm monitoring contracts on a recurring, or as originated, basis from our Dealers. We have engaged in flow business with over 75 Dealers over time, and are actively seeking to increase the number of Dealers with whom we conduct flow business.
Bulk purchases occur when we buy existing portfolios of alarm monitoring contracts with demonstrated payment histories of at least six months. Bulk purchases typically range in size from 1,000 to 5,000 alarm monitoring contracts. These alarm monitoring contracts are typically purchased from Dealers on a non-recurring basis. The bulk purchases are less predictable in terms of the timing of account acquisitions, but are generally more predictable in terms of performance than flow business because the actual historical performance of individual alarm monitoring contracts is known. Many of the bulk purchases made by us are made from Dealers who are existing monitoring customers.
In a typical alarm monitoring contract acquisition, we retain the selling Dealer to service the underlying alarm system, which helps us maintain strong relationships with the Dealers and encourages the Dealer to sell additional alarm monitoring contracts to us as new installations are completed.
The impact of the acquired contracts on revenue and profitability will be affected by the attrition rates of acquired portfolios, as well as the variable expenses relating to such acquisitions including billing, collection and servicing.
Employees
As of December 31, 2006, we had a workforce of 682 employees. Of our total workforce, 255 are engaged in finance, administration and management, 219 are engaged in the monitoring business, 74 are engaged in sales and marketing, and 134 are engaged in service and installation of monitoring systems. None of our employees are represented by a collective bargaining agreement, nor have we experienced work stoppages. We believe that our relations with our employees are good.
Competition
The security alarm industry is highly competitive and fragmented. While we generally do not compete directly with many of the large companies in the industry such as ADT, Brinks, Protection One and Honeywell because we do not primarily sell and install security systems, we are nonetheless impacted by the competitive challenge these companies present to Dealers. While all of these companies provide monitoring services, some of these companies, may from time to time, purchase portfolios of monitoring contracts.
We compete with several companies that have alarm monitoring contract acquisition and loan programs for Dealers and some of these competitors may be better capitalized than us. There is also the potential for other entities such as banks or finance companies to gain a better understanding of the industry and become more active as a source of competition for alarm monitoring contract acquisition and financing portions of our business. Further, we compete with participants that primarily provide alarm monitoring contract acquisition and financing services.
History
We were formed as King Central in 1985 in the State of New Jersey. In 1986, Thomas Few, Sr. our former Vice Chairman and President joined King Central as Executive Vice President and Chief Operating Officer and acquired 20% of King Central's capital stock. In January 1998, as part of a reorganization of King Central, Mr. Few, Sr.'s ownership was increased to 80% and the remaining 20% was acquired by Timothy M. McGinn, our former Chief Executive Officer, and David L. Smith, a former Director. At that time, we changed our name to KC Acquisition.
In September 2002, KC Acquisition acquired all of the capital stock of Criticom International Corporation (“Criticom”) in exchange for $1.0 million and 155,911 shares of our common stock. An additional 68,182 shares of our common stock have been issued to the sellers based upon Criticom's financial performance in 2003. Criticom provides wholesale alarm monitoring services to Dealers. In addition, it provides Global Positioning System monitoring and asset tracking services to various customers. KC Acquisition adopted the name Criticom International as its trade name for our monitoring services business during 2003.
M&S Partners, a New York general partnership equally owned by Mr. McGinn and Mr. Smith began to acquire portfolios of alarm monitoring contracts from Dealers in 1992. Each contract was ultimately placed by M&S Partners with one of 41 leveraged trusts of which Mr. McGinn, Mr. Few, Sr. and Mr. Smith were the beneficiaries. M&S Partners also acquired alarm monitoring contracts through three limited liability companies (Guardian Group, LLC, Palisades Group, LLC and Payne Security Group, LLC) which were owned by TJF Enterprises, LLC, which is owned by Mr. Few, Sr., and First Integrated Capital Corporation, which is majority owned by Mr. McGinn and Mr. Smith. They bundled those alarm monitoring contracts and sold them as Trust Certificates collateralized by the underlying alarm monitoring contracts and their recurring monthly revenue. We do not expect to engage in securitizing alarm monitoring contracts in the future.
Between March and November 2002, IASI, a company that was controlled by Mr. McGinn, Mr. Smith and Mr. Few, Sr., offered the holders of the trust certificates the right to exchange such certificates for promissory notes of IASI. Upon completion of the exchanges, all but eleven of the trusts were liquidated and their assets were transferred to IASI. The trust certificates of the remaining trusts were repaid with the proceeds of the offering and the assets of the trusts were transferred to us. In January 2003, IASI entered into a merger with a wholly owned subsidiary of ours and became our wholly owned subsidiary. In connection with the acquisition of IASI, we issued an aggregate of 772,192 shares of our common stock.
Palisades Group, LLC was the owner of approximately 38% of the alarm monitoring contracts underlying the trusts. In January 2003, Palisades exchanged all of its ownership interests for our stock and distributed such stock to its members, TJF Enterprises, LLC and First Integrated Capital Corporation. In connection with the acquisition of Palisades, we issued an aggregate of 25,000 shares of our common stock. This acquisition was accounted for under the purchase method of accounting. In January 2003, Payne Security Group, LLC and Guardian Group, LLC were acquired by us and became our wholly owned subsidiaries. In connection with the acquisition of Payne Security Group, LLC, we issued an aggregate of 50,250 shares to TJF Enterprises, LLC, and First Integrated Capital Corporation. In connection with the acquisition of Guardian Group, LLC, we issued an aggregate of 16,750 shares to TJF Enterprises, LLC, and First Integrated Capital Corporation.
Morlyn Financial Group, LLC was founded in May 2000 to assist Dealers who were interested in selling their alarm monitoring contracts to IASI. Morlyn originates alarm monitoring contracts for acquisition and provides due diligence, billing and other related services. In connection with the acquisition of Morlyn, in January 2003, we issued an aggregate of 17,000 shares of our common stock to Messrs. McGinn, Few Sr., and Smith.
In June 1999, KC Acquisition acquired all of the assets and assumed certain liabilities of Criticom CA, Inc., a monitoring call center in Santa Fe Springs, California, in exchange for approximately $3.2 million. In May 2000, KC Acquisition acquired 99.2% of the capital stock of Monital Signal Corporation in exchange for approximately $10.7 million. Monital, located in Manasquan, New Jersey, was KC Acquisition's largest competitor in the Northeast, United States. In October 2001, KC Acquisition acquired Custom Design Security, an independent wholesale alarm monitoring company which services the Western and Central Regions of Florida, in exchange for approximately $1.2 million. In January 2002, KC Acquisition acquired certain assets of RTC Alarm Monitoring Services, an alarm monitoring call center in California, in exchange for $5.1 million.
In January 2003, we effected a migratory merger into KC Alarm Services Group, Inc., a Delaware corporation. The sole purpose of the migratory merger was to change our jurisdiction of incorporation from New Jersey to Delaware. Subsequent to the migratory merger, we assumed all of the assets and liabilities of Integrated Alarm Services Group, Inc., a pre-existing, Delaware company whose only activity was the sale of $5.5 million of convertible debentures. The pre-existing Integrated Alarm Services Group, Inc. was then dissolved and we changed our name to Integrated Alarm Services Group, Inc.
See heading “Acquisitions” in Item 7. Management’s Discussion and Analysis of Financial Condition and Results of Operations for entities acquired since our initial public offering of common stock.
Risk Management
We carry insurance of various types, including general liability and errors and omissions insurance. Our errors and omissions coverage is $10 million per occurrence. Our loss experience and the loss experience of other companies in the security industry may affect the cost and availability of such insurance. Since 1998 we have had no significant uninsured losses. Certain of our insurance policies and the laws of some states may limit or prohibit insurance coverage for punitive or other types of damages, or liability arising from gross negligence or wanton behavior. See “Risk Factors—In the event that adequate insurance is not available or our insurance is not deemed to cover a claim we could face liability.”
The nature of the services we provide potentially exposes us to greater risks of liability for employee acts or omissions or systems failure than may be inherent in other businesses. Our agreements with Dealers and end-users contain provisions limiting our liability to end-users and Dealers in an attempt to reduce this risk. However, in the event of litigation with respect to such matters, there can be no assurance that these limitations will continue to be enforced. In addition, the costs of such litigation could have an adverse effect on us.
Regulatory Matters
A number of local governmental authorities have adopted or are considering various measures aimed at reducing the number of false alarms. Such measures include: (i) subjecting alarm monitoring companies to fines or penalties for transmitting false alarms, (ii) licensing individual alarm systems and the revocation of such licenses following a specified number of false alarms, (iii) imposing fines on end-users for false alarms, (iv) imposing limitations on the number of times the police will respond to alarms at a particular location after a specified number of false alarms and (v) requiring further verification of an alarm signal before the police will respond.
Our operations are subject to a variety of other laws, regulations and licensing requirements of federal, state and local authorities. In certain jurisdictions, we are required to obtain licenses or permits to comply with standards governing employee selection and training and to meet certain standards in the conduct of our business. Many jurisdictions also require certain of our employees to obtain licenses or permits.
The alarm industry is also subject to requirements imposed by various insurance, approval, listing and standards organizations. Depending upon the type of end-user served, the type of service provided and the requirements of the relevant local governmental jurisdiction, adherence to the requirements and standards of such organizations is mandatory in some instances and voluntary in others.
Our alarm monitoring business utilizes radio frequencies to transmit alarm signals. The Federal Communications Commission and state public utilities commissions regulate the operation and utilization of radio frequencies.
The Company’s current reports on Form 8-K, quarterly reports on Form 10-Q, and annual reports on Form 10-K are electronically filed with the Securities and Exchanged Commission (“SEC”), and all such reports and amendments to such reports have been and will be made available, free of charge, through the Company’s website (www.iasg.us) as soon as reasonably practicable after such filing. The public may read and copy any material filed by the Company with the SEC at the SEC‘s Public Reference Room at100 F Street, N. E., Washington, D.C. The public may obtain information on the operation of the public reference room by calling the SEC at 1-800-SEC-0330. The SEC maintains a website (www.sec.gov) that contains reports, proxy and information statements, and other information regarding issuers that file electronically with the SEC.
Risks Related to Our Business
Consummation of IASG’s merger with Protection One is subject to the satisfaction of various closing conditions; IASG’s inability to consummate the merger could have a material adverse effect on IASG’s results of operations and financial condition. Consummation of the proposed merger with Protection One is subject to the satisfaction of various closing conditions, including the following:
| · | the merger agreement shall have been approved by a majority of the outstanding shares of IASG common stock; |
| · | the shares of Protection One common stock issuable to IASG stockholders as part of the merger and issuable upon exercise of outstanding IASG stock options converted into Protection One stock options shall have been approved for listing on a NASDAQ stock market, subject to official notice of issuance; |
| · | certain holders of IASG’s 12% Senior Secured Notes due 2011 shall have exchanged their notes for new notes issued by a subsidiary of Protection One; |
| · | Protection One shall have obtained an amendment to its existing credit facility; and |
| · | other customary closing conditions described in the merger agreement, including the receipt of tax opinions, accuracy of representations and warranties and the performance of obligations under the merger agreement. |
IASG cannot guarantee that these closing conditions will be satisfied or that the proposed merger will be successfully completed. In the event that the proposed merger is not completed:
| · | IASG’s board of directors will need to determine whether to seek an alternative transaction or whether to remain an independent business ; |
| · | If IASG’s board of directors seeks an alternative transaction, there can be no assurance whether any such transaction can be entered into or consummated or what the terms of such a transactions would be; |
| · | If IASG’s board of directors determines that IASG should remain an independent company, IASG’s management will need to revise its business plan and there can be no assurance that such business plan can be successfully implemented; |
| · | IASG’s relationships with customers, suppliers and employees may be adversely affected as a result of uncertainties with regard to its business and prospects; |
| · | IASG may be required to pay significant transaction costs related to the proposed Merger, such as a transaction termination (break-up) fee and/or reimbursement expenses as follows: |
| · | A cash amount equal to $7.5 million, consisting of both a termination fee and reimbursement of expenses, will be paid by IASG to Protection One if prior to the adoption of the merger agreement by IASG stockholders, the IASG board of directors has withdrawn or modified in a manner adverse to Protection One its recommendation of the merger; recommended to the stockholders of IASG, or caused IASG to enter into any definitive agreement providing for the implementation of, another acquisition proposal; materially breached its obligations regarding the delivery of a proxy statement/prospectus or the calling and holding of the special meeting to vote on adoption of the merger agreement; or materially breached its obligations regarding non-solicitation. |
| · | Reasonable out-of-pocket fees and expenses up to $2 million actually incurred by Protection One in connection with the merger agreement and related agreements, and the transactions contemplated in those agreements, including fees and expenses of counsel, investment bankers, accountants, experts, consultants and other representatives of Protection One will be paid by IASG to Protection One if Protection One is not in breach in any material respect of its obligations under the merger agreement, and IASG has breached or failed to perform any of its representations, warranties, covenants or agreements in the merger agreement which breach or failure to perform (a) would give rise to the failure of a condition regarding representations and warranties and performance of obligations and (b) such breach has not been cured by IASG within 30 days after written notice to IASG. |
Any such events could have a material negative impact on IASG’s results of operations and financial condition.
Significant attrition, or non-renewal of retail alarm monitoring contracts or loss of dealer relationships would materially adversely affect our results of operations. We experience attrition of Dealer customer relationships and alarm monitoring contracts as a result of several factors including relocation of end-users, adverse financial and economic conditions and competition from other alarm service companies. In addition, we may lose or experience non-renewal of certain alarm monitoring contracts of Dealers, particularly acquired Dealer customer relationships and alarm monitoring contracts, if we do not service those alarm monitoring contracts adequately or do not successfully integrate new alarm monitoring contracts into our operations. A significant increase in attrition or the non-renewal of alarm monitoring contracts would have a material adverse effect on our revenues and earnings. To the extent that actual attrition exceeds our expectations, our revenues, profitability, cash flow and earnings would be adversely affected. Attrition for acquired Dealer customer relationships and alarm monitoring contracts may be greater in the future than the attrition rate assumed or historically incurred by us. In addition, because some Dealer customer relationships and acquired alarm monitoring contracts are prepaid on an annual, semi-annual or quarterly basis, attrition may not become evident for some time after an acquisition is consummated.
If our retail alarm monitoring contract attrition exceeds 18% for certain periods, we will be required to offer to purchase a portion of the outstanding 12% Senior Secured Notes due 2011. Our actual attrition for fiscal year 2006 was 12.9%. Under the same circumstances, our ability to purchase new retail alarm monitoring contracts may be limited. If we are required to make such an offer, we may not have sufficient funds to purchase the Notes we are required to repurchase or such repurchase could adversely affect our liquidity.
We face significant competition in the security alarm industry, which could make it more difficult for us to succeed in securing relationships with Dealers and reduce the number of alarm monitoring contracts we are able to acquire. We are dependent on entering into and maintaining relationships with Dealers who will either sell their alarm monitoring contracts directly to us, borrow from us, or enter into alarm monitoring contracts for us to provide wholesale monitoring services for the alarm monitoring contracts retained by them. While we do not typically compete directly with many of the larger companies in the industry because we do not primarily sell and install security systems, we are nonetheless impacted by the competitive challenge these entrants present to Dealers.
There is the potential that larger companies in the industry may generate alarm monitoring contracts offering "zero down" on equipment purchases and installation. The independent Dealer may have to offer the same "zero down" deal in order to effectively compete. Since the end-users attracted to "zero- down" promotions are often of lower credit standing and thereby are more likely to default, we will only purchase these contracts if they have been outstanding for periods longer than 12 months and exhibit acceptable payment patterns as well as acceptable responses to quality control calls, thus potentially limiting the available alarm monitoring contracts which meet our due diligence standards.
We also compete with several companies that have alarm monitoring contract acquisition and loan programs for Dealers and some of those competitors may be larger and better capitalized than we are. Some of these companies may be able to pay higher multiples of recurring monthly revenue for the portfolios they acquire than we can. We may be required to offer higher prices for such acquisitions than we have in the past, thus making these acquisitions less financially advantageous. Some of the companies we compete with include ADT, Protection One, Brinks and Honeywell. There is also the potential for other entities such as banks or finance companies to become more active as a source of competition for the Dealer financing portions of our business.
We may not be able to obtain all of the benefits of the security alarm monitoring contracts we purchase. A principal element of our business strategy is to acquire portfolios of alarm monitoring contracts. Acquisitions of end-user alarm monitoring contracts involve a number of risks, including the possibility that we will not be able to realize the recurring monthly revenue stream we contemplated at the time of acquisition because of higher than expected attrition rates or fraud. Although we complete an extensive due diligence process prior to acquiring alarm monitoring contracts and obtain representations and warranties from the seller, we may not be able to detect fraud on the part of the seller, including the possibility that the seller has misrepresented the historical attrition rates of the sold contracts or has sold or pledged the contracts to a third party. If the sale of alarm monitoring contracts involves fraud or the representations and warranties are otherwise inaccurate, we may not be able to recover from the seller damages in the amount sufficient to fully compensate us for any resulting losses. In such event, we may incur significant costs in litigating ownership or breach of acquisition contract terms.
We may pursue acquisitions of alarm monitoring call centers that by their nature present risks and may not be successful. An element of our business strategy is to acquire additional alarm monitoring call centers. The following are some of the risks associated with these acquisitions:
| · | We may be unable to achieve anticipated revenues, earnings or cash flow because of higher than expected attrition rates or other reasons. |
| · | We may be unable to integrate acquired call centers successfully and realize anticipated economic, operational and other benefits in a timely manner. If we are unable to integrate acquired call centers successfully, we could incur substantial costs and delays or other operational, technical or financial problems. |
| · | If we are not successful in integrating acquired call centers, we could have increased attrition because of service-related problems. |
| · | Acquisitions could disrupt our ongoing business, distract management, divert resources and make it difficult to maintain our current business standards, controls and procedures. |
We also face competition in identifying and purchasing suitable alarm monitoring centers. We compete with other firms, many of which have greater financial and other resources than we do, for the acquisition of alarm monitoring centers. Should this competition increase, it will be more difficult to acquire additional alarm monitoring centers, on terms acceptable to us.
Our ability to continue to grow our business is dependent upon our ability to obtain additional financing. We intend to continue to pursue growth through the acquisition of end-user alarm monitoring contracts and wholesale monitoring businesses. We will be required to seek additional funding from third party lenders and/or from the possible sale of additional securities, which may lead to higher leverage or the dilution of then existing stockholders. Our senior secured notes contain terms that limit our ability to incur additional indebtedness which may negatively impact our ability to acquire additional monitoring contracts. Any inability to obtain funding through third party financing is likely to adversely affect our ability to continue or increase our acquisition activities. Third party funding may not be available to us on attractive terms or at all.
Rising interest rates could negatively affect our profitability. The interest rate of our financing is generally tied to prevailing market rates. In the event that interest rates rise, the spread between our cost of capital and the amount that we can charge Dealers who borrow from us may decrease, which will negatively affect our profitability.
We could face liability for our failure to respond adequately to alarm activations. The nature of the services we provide potentially exposes us to risks of liability for employee acts or omissions or system failures. In an attempt to reduce this risk, our alarm monitoring agreements and other agreements pursuant to which we sell our products and services contain provisions limiting liability to end-users and Dealers. However, in the event of litigation with respect to such matters, there can be no assurance that these limitations will continue to be enforced. In addition, the costs of such litigation could have an adverse effect on us.
We may face additional costs and potential liability as a result of "false alarm" ordinances. Significant concern has arisen in certain municipalities about the high incidence of false alarms. This concern could cause a decrease in the likelihood or timeliness of police response to alarm activations and thereby decrease the propensity of consumers to purchase or maintain alarm monitoring services.
A number of local governmental authorities have considered or adopted various measures aimed at reducing the number of false alarms. Such measures include subjecting alarm monitoring companies to fines or penalties for transmitting false alarms, licensing individual alarm systems and the revocation of such licenses following a specified number of false alarms, imposing fines on alarm end-users for false alarms, imposing limitations on the number of times the police will respond to alarms at a particular location after a specified number of false alarms and requiring sufficient further verification of an alarm signal before the police will respond. Enactment of such measures could increase our costs and thus adversely affect our future results of operations.
Future government or other organization regulations and standards could have an adverse effect on our operations. Our operations are subject to a variety of laws, regulations and licensing requirements of federal, state and local authorities. In certain jurisdictions, we are required to obtain licenses or permits, to comply with standards governing employee selection and training and to meet certain standards in the conduct of our business. The loss of such licenses, or the imposition of conditions to the granting or retention of such licenses, could have an adverse effect on us. We believe that we are in material compliance with applicable laws and licensing requirements. In the event that these laws, regulations and/or licensing requirements change, it could require us to modify our operations or to utilize resources to maintain compliance with such rules and regulations. There can be no assurance as to what new regulations will be enacted and what effect they may have on us.
The loss of our Underwriters Laboratories listing could negatively impact our competitive position. All of our monitoring call centers are UL listed. To obtain and maintain a UL listing, an alarm monitoring call center must be located in a building meeting UL's structural requirements, have back-up and uninterruptible power supply, have secure telephone lines and maintain redundant computer systems. UL conducts periodic reviews of monitoring call centers to ensure compliance with their regulations. Non-compliance could result in a suspension of our UL listing. The loss of our UL listing could negatively impact our competitive position.
We rely on technology which may become obsolete. Our monitoring services depend upon the technology (hardware and software) of security alarm systems. We may be required to upgrade or implement new technology which could require significant capital expenditures. There can be no assurance that we will be able to successfully implement new technologies or adapt existing technologies to changing market demands. If we are unable to adapt in a timely manner in response to changing market conditions or customer requirements, such inability could adversely affect our business.
In the event that adequate insurance is not available or our insurance is not deemed to cover a claim we could face liability. We carry insurance of various types, including general liability and errors and omissions insurance. Our loss experience and that of other security service companies may affect the availability and cost of such insurance. Certain of our insurance policies and the laws of some states may limit or prohibit insurance coverage for punitive or certain other types of damages, or liability arising from gross negligence. To the extent that insurance was not available, or a particular claim was not covered or exceeded our coverage, we could be exposed to material costs.
None.
In September 2003, the Company entered into a five-year lease for office space for its headquarters in Albany, New York. The lease is for approximately 21,000 square feet. The lease period is November 15, 2003 through November 14, 2008. The lease has a five-year renewal option. Annual rents will be $190,000 for year one and two and $225,000 for years three through five.
We also have offices at our East Coast call monitoring center in Manasquan, New Jersey. The facility is approximately 7,000 square feet. We own the premises, subject to a mortgage in favor of LaSalle Bank, creating a first priority security interest for the benefit of LaSalle Bank, and subject to a second mortgage in favor of the Trustee, creating a second priority security interest for the benefit of the holders of the Notes.
Morlyn’s executive offices are located in Oakland, New Jersey. The offices are approximately 3,500 square feet. The lease expires in July 2007 and provides for a monthly rental of approximately $4,000.
Our Wall, NJ facility houses both administrative and dealer care offices. The facility is approximately 5,000 square feet. The lease expires in August 2007 with a monthly cost of approximately $6,000.
As part of the acquisition of National Alarm Computer Center (“NACC”), we assumed the lease of office space and a monitoring center of approximately 19,000 square feet in Irvine, California at a monthly cost of approximately $40,000. The lease runs through April 2007. This facility will be replaced by a new office property in Cypress, California.
We also had an alarm monitoring center in Minneapolis, Minnesota. During 2005, it was consolidated into our Manasquan, NJ monitoring call center. The Minneapolis facility is approximately 13,000 square feet. The lease expires in 2010, and provides for a monthly rental rate of approximately $15,000. We closed this facility during 2006.
Our Las Vegas, Nevada location houses a customer call center and service, installation and administrative offices. The facility is approximately 10,000 square feet. The lease expires in June 2007 with a current monthly cost of approximately $12,000, with annual rent increases based upon the U.S. Department of Labor Consumer Price Index.
As part of the acquisition of FSS, we assumed the leases of office space in Dallas, Texas and an alarm monitoring center in St. Paul, Minnesota. The Dallas facility is approximately 3,000 square feet. The lease expires in October 2008 with an early termination option in October 2007 with a monthly cost of approximately $4,300 and $4,500 in 2007 and 2008 respectively. The St. Paul facility is approximately 7,000 square feet. The lease expires in April 2008 with a five year renewal option at a monthly cost of approximately $5,000.
We also have two sales, service and administrative offices as well as seven sales and service branch offices located in California, New Mexico and Arizona. The leases expire at various dates through 2010 and currently have a monthly rental rate of approximately $28,000.
We also have administrative and service offices as well as dealer care centers located in California, Michigan, New Jersey, Minnesota and Georgia. The leases expire at various dates through 2008 and currently have a monthly rental rate of approximately $13,000. Some of these dealer care centers have been consolidated into our other dealer care facilities during 2005.
We entered into a long-term lease for secure office property in Cypress, California in December 2006. The Cypress facility is expected to be occupied in the second quarter of 2007 after leasehold improvements and central station operating infrastructure construction is completed. This facility will replace the NACC, Irvine, CA location.
In March 2003, Protection One, a company engaged in the business of providing security and other alarm monitoring services to residential and commercial customers, brought an action against us in the Superior Court of New Jersey, Camden County for $1.4 million unspecified damages in connection with our purchase of certain alarm monitoring contracts from B&D Advertising Corp. B&D had previously sold alarm monitoring contracts to Protection One. As part of such sales, B&D agreed not to solicit any customers whose contracts had been purchased and to keep certain information confidential. Protection One claims that our subsequent purchase of contracts from B&D constitutes tortious interference, that we utilized confidential information belonging to Protection One and that Protection One had an interest in some of the contracts that we purchased from B&D. We plan to vigorously defend this claim. We believe the resolution of this matter will not have a material adverse effect on our financial condition, results of operations or cash flows. This matter has been stayed pending the completion of the merger between Protection One and us, at which time it is expected that the matter will be dismissed by agreement of the parties, without costs or recovery by any party.
In December of 2005, Ira R. Beer, former president of our American Home Security, Inc (“AHS”) subsidiary in Las Vegas, brought an action against AHS and us in District Court for Clark County, Nevada. Mr. Beer sought monies allegedly due under a certain Employment Agreement dated November 21, 2003. Mr. Beer’s employment was terminated, for cause, on December 8, 2005. Mr. Beer’s lawsuit alleged that his termination was not for cause and that he was owed unpaid salary through the end of 2006 of some $440,000 and a certain “bonus buy-out” which he asserted to be approximately $2,192,000. He also sought unspecified punitive damages. We had also filed a counterclaim against Mr. Beer for derogation of his management duties. This matter was settled in it entirety in early December 2006 for approximately $1.76 million.
On June 26, 2006, our former president Thomas J. Few, Sr. initiated litigation against us in connection with his employment, seeking a monetary award for amounts allegedly due to him under an employment agreement. The claim was filed in the Superior Court of New Jersey, in the Bergen County Law Division. The principal parties to the suit are Thomas J. Few, Sr. and us. Mr. Few alleges that he is owed up to 36 months of pay as well as an amount representing accrued but unused vacation as a result of his resignation following our alleged breach of the employment agreement. Settlement negotiations have been unsuccessful and discovery proceedings are underway as ordered by the Bergen County Law Division.
We are involved in litigation and various legal matters that have arisen in the ordinary course of business. We do not believe that the outcome of these matters will have a material adverse effect on our financial position, results of operations or cash flows, although it is possible that an adverse resolution of a number of these matters could have a material adverse effect on the Company’s financial position, results of operations, or cash flows in a particular quarter or fiscal year.
No matters were submitted to a vote of stockholders during the fourth quarter of the fiscal year ended December 31, 2006, through the solicitation of proxies or otherwise.
Part II
The Company’s common stock is traded in the NASDAQ National Market System under the symbol IASG. Quarterly high and low bid information for the quarterly periods of 2006 and 2005 as reported by NASDAQ for normal trading hours (4 pm EST closing) are set forth below:
Year ended December 31, 2006 | High | Low | ||||
| First Quarter | $ | 4.27 | $ | 2.41 | ||
| Second Quarter | 4.11 | 3.25 | ||||
| Third Quarter | 4.29 | 3.56 | ||||
| Fourth Quarter | 3.95 | 2.56 | ||||
Year ended December 31, 2005 | High | Low | ||||
| First Quarter | $ | 6.40 | $ | 4.83 | ||
| Second Quarter | 4.96 | 3.60 | ||||
| Third Quarter | 5.08 | 3.50 | ||||
| Fourth Quarter | 3.90 | 1.89 | ||||
These over the counter market quotations reflect inter-dealer prices, without retail mark-up, mark-down or commission and may not necessarily represent actual transactions.
No dividends have been paid on the common shares to date and none are anticipated for the foreseeable future.
During 2005, the Company’s Board of Directors approved an initial plan to repurchase up to $2.5 million of the Company’s common stock, the maximum permitted under the Senior Secured Note covenants. As of December 31, 2006, the Company has purchased 312,626 shares of treasury stock at an aggregate cost of approximately $1.0 million.
As of December 31, 2006 there were 24,681,462 common shares issued and 24,368,836 common shares outstanding held by 12 shareholders of record, not including persons or entities where stock is held in nominee or “street” name through various brokerage firms or banks.
The following selected financial data have been derived from the Consolidated Financial Statements of the Company.
Year ended December 31, | ||||||||||||||||
2002 | 2003 | 2004 | 2005 | 2006 | ||||||||||||
(in thousands, except share and per share data) | ||||||||||||||||
Statement of operations data (1): | ||||||||||||||||
| Revenue | $ | 23,496 | $ | 40,868 | $ | 80,369 | $ | 99,234 | $ | 94,364 | ||||||
| Total operating expenses, inclusive of cost of revenue | 24,268 | 44,517 | 82,496 | 107,752 | 166,493 | |||||||||||
| Income (loss) from operations | (772 | ) | (3,649 | ) | (2,127 | ) | (8,518 | ) | (72,129 | ) | ||||||
| Other (expense), net | (5,557 | ) | (14,829 | ) | (9,172 | ) | (13,251 | ) | (12,799 | ) | ||||||
| Income (loss) before income taxes | (6,329 | ) | (18,478 | ) | (11,299 | ) | (21,769 | ) | (84,928 | ) | ||||||
| Income tax expense (benefit) | (682 | ) | 3,527 | 418 | 563 | (1,013 | ) | |||||||||
| Net income (loss) | $ | (5,647 | ) | $ | (22,005 | ) | $ | (11,717 | ) | $ | (22,332 | ) | $ | (83,915 | ) | |
| Basic and diluted income (loss) per share | $ | (9.53 | ) | $ | (1.95 | ) | $ | (0.47 | ) | $ | (0.91 | ) | $ | (3.44 | ) | |
| Shares used computing basic and diluted income (loss) per common share (3) | 592,785 | 11,263,455 | 24,667,960 | 24,662,198 | 24,368,836 | |||||||||||
Pro forma income tax to give effect as if a C corporation (2): | ||||||||||||||||
| Loss before income tax expense (benefit) | (6,329 | ) | (18,478 | ) | N/A | N/A | N/A | |||||||||
| Income tax expense (benefit) | (2,872 | ) | (90 | ) | ||||||||||||
| Net income (loss) | $ | (3,457 | ) | $ | (18,388 | ) | ||||||||||
| Net income (loss) per share | $ | (5.83 | ) | $ | (1.63 | ) | ||||||||||
Year ended December 31, | ||||||||||||||||
2002 | 2003 | 2004 | 2005 | 2006 | ||||||||||||
(in thousands, except share and per share data) | ||||||||||||||||
Balance sheet data: | ||||||||||||||||
| Cash, cash equivalents and short-term investments | $ | 3,442 | $ | 35,436 | $ | 31,555 | $ | 16,239 | $ | 13,664 | ||||||
| Total assets | 45,628 | 241,036 | 302,084 | 273,074 | 188,716 | |||||||||||
| Long-term debt | 45,061 | 65,743 | 130,225 | 125,000 | 125,000 | |||||||||||
| Capital lease obligations | 508 | 885 | 1,035 | 811 | 836 | |||||||||||
| Total stockholders' equity (deficit) | (11,563 | ) | 153,403 | 142,850 | 120,114 | 36,585 | ||||||||||
| Working capital (deficit) | (8,077 | ) | 4,769 | 16,956 | 9,066 | 7,525 | ||||||||||
Other financial data: | ||||||||||||||||
| Cash provided by (used in) operating activities | 2,692 | (4,239 | ) | 14,149 | 8,099 | 6,367 | ||||||||||
| Cash provided by (used in) investing activities | (8,863 | ) | (57,984 | ) | (76,766 | ) | (16,348 | ) | (8,613 | ) | ||||||
| Cash provided (used in) financing activities | 5,389 | 97,217 | 58,736 | (7,067 | ) | (329 | ) | |||||||||
(1) Results of operations for acquired companies are included from the date of acquisition. As a result comparability of periods presented has been affected by our acquisitions. For more information about our acquisition history, see “Business”, Management’s Discussion and Analysis of Financial Condition and Results of Operations” and Note 11 to our consolidated financial statements.
(2) To give effect to the conversion of KC Acquisition from an S corporation to a C corporation for federal income tax purposes. The tax provision was prepared as if we had a combined federal and state effective tax rate of 40% and giving effect for permanent differences.
(3) During July 2003, the Company completed its IPO and issued a total of 22,982,729 shares of common stock and received net proceeds of approximately $195,857,000.
See Item 1 Business (Recent Developments) and Item IA Risk Factors for disclosure related to our pending merger with Protection One.
Executive Overview
During the third quarter of 2006, the Company realigned its segments. Prior period segment information for the year ended December 31, 2005 has been retroactively adjusted to reflect this realignment. The Company is unable to retroactively adjust segment information for the year ended December 31 2004 as the necessary data is not available. Effective third quarter of 2006, IASG has three reportable segments: alarm-monitoring wholesale services, alarm-monitoring residential services and alarm-monitoring commercial services. The Company has determined its reportable segments based on its method of internal reporting which is used by management for making operational decisions and assessing performance.
The Company conducts business in the security industry through three segments:
| · | Alarm Monitoring Wholesale Services (Wholesale Segment) The alarm-monitoring wholesale services segment provides monitoring services to a broad range of independent alarm-monitoring dealers. This division also offers administrative services such as billing and collection to dealers. Criticom International, our wholesale services also provides monitoring services to our other divisions. |
| · | Alarm Monitoring Residential Services (Residential Segment) The alarm-monitoring residential services segment provides monitoring services to its end customers, working capital to independent alarm-monitoring dealers and customer service and billing and collection services to our portfolio of accounts. This is accomplished by purchasing alarm monitoring contracts from the dealer or by providing loans using the dealer's alarm monitoring contracts as collateral. The monitoring of the customer’s system is performed primarily by Criticom International. |
| · | Alarm Monitoring Commercial Services (Commercial Segment) The alarm-monitoring commercial services segment is a commercial security integrator that provides installation, testing and maintenance for commercial customers as well as monitoring services to its end customers. Growth in this segment is accomplished by purchasing alarm monitoring contracts from dealers or by installing monitoring systems for new commercial customers. The monitoring of the customer’s system is performed exclusively by Criticom International. |
Management’s approach to each of its security businesses is similar, with a focus on quality service, risk management and a patient and disciplined approach to markets. Management believes each business is a premium provider of services in the markets that it serves. The Company’s marketing and sales efforts are enhanced by its brands so the Company seeks to protect their value. Since the Company’s services focus on protecting people and valuables, its employees strive to understand and manage risk. Overlaying management’s approach is an understanding that the Company must be disciplined and patient enough to charge fair prices that reflect the value provided, the risk assumed and the need for an appropriate return on invested capital.
The business environments in which the Company’s security businesses operate throughout the United States are constantly changing. Management continually adapts to changes in the competitive landscapes, economic conditions in different parts of the country and each customer’s level of business. As a result, the Company operates largely on a decentralized basis so local management can adjust operations to its unique circumstances.
For the same reasons that the Company operates on a decentralized basis, short-term forecasts of performance are difficult to make with precision. As a result, the Company does not provide detailed earnings forecasts.
The Company measures financial performance on a long-term basis. The key financial factors on which it focuses are:
| · | Growth in revenues and earnings |
| · | Attrition minimization |
| · | Generation of cash flow |
| · | Creation of value through portfolio growth |
These and similar measures are critical components of the Company’s employee performance evaluations.
The following discussion and analysis of our financial condition and results of operations should be read together with the Consolidated Financial Statements and Notes thereto.
Overview
We are one of the largest providers of monitoring, financing, and business support services to independent security alarm Dealers, which we refer to as “Dealers”, in the United States. We offer our services to Dealers competing in both the residential and commercial security alarm markets. We believe our services better allow Dealers to compete with larger, self-monitoring national alarm companies. The major categories of services we provide include:
| · | Monitoring. We monitor alarm systems on behalf of Dealers who do not have the capital resources or critical mass to economically establish their own monitoring facilities and for our own accounts. We believe we are the largest wholesale alarm monitoring company in the United States, monitoring approximately 620,000 alarm systems on behalf of approximately 4,000 independent Dealers. We refer to this as our wholesale business and we currently receive approximately $2.6 million of revenue per month to monitor contracts owned by Dealers. Our alarm monitoring services are provided through two, state-of-the-art, redundant alarm monitoring centers located in New Jersey and California. The acquisition of FSS in 2005 discussed below provided us with 95,000 new monitored alarm systems and approximately 147 new Dealer relationships (these are included in the above totals) as well as an alarm monitoring center in Minnesota. |
| · | Financing. Since 1993, we have provided financing for Dealers in the form of loans or alarm monitoring contract purchases of approximately $520 million in the aggregate. As of December 31, 2006, we owned and monitored a portfolio of approximately 145,000 retail alarm monitoring contract equivalents. A contract equivalent is equal to $30 per month in RMR (“Recurring Monthly Revenue”) from a typical residential customer. We refer to this as our retail business and we currently receive approximately $4.3 million of revenue per month from this portfolio. In addition, we hold approximately 26,000 contracts as collateral against loans we have made to Dealers. The FSS acquisition added in 2005 has approximately 19,000 contracts as collateral against loans made to Dealers (which we assumed in the acquisition) and these are included in the above totals. |
| · | Business Support Services. For many of our Dealers, we provide billing, collection and marketing services as well as access to equipment discount programs. Because of our scale, we can generally provide these services on a more cost-effective basis for Dealers than they can for themselves. In addition, our equipment discount program allows Dealers who use our monitoring services to automatically receive preferential pricing for certain alarm equipment. |
Our retail portfolio is comprised of both commercial and residential subscribers, which represent approximately 77% of our revenue in this portfolio, and commercial subscribers, which represent approximately 23% of our revenue in this portfolio. We believe maintaining an appropriate balance between residential and commercial customers will be important going forward.
We believe our package of services allows Dealers to compete against self-monitoring national providers in the security alarm market by giving them access to technical sophistication, financing, back office and other services that they would not otherwise have, while allowing them to remain the local and visible contact with their customer, the end-user of the security alarm system. We intend to continue to expand the number of Dealers for which we provide these services through direct marketing of our services as well as acquisitions of alarm contracts and alarm monitoring companies.
Our revenues are derived primarily from our portfolio of retail alarm monitoring contracts and providing wholesale alarm monitoring services to Dealers for the benefit of the end-user of the alarm system. We typically enter into contracts with our Dealers to provide alarm monitoring services for periods ranging from one to five years. The majority of monitoring contracts entered into by end-users with our Dealers generally permit cancellation with notice of 30-60 days before the end of the original, or any renewal, contract term. Some alarm monitoring contracts with Dealers have longer, more definitive terms. However, essentially all alarm monitoring contracts may be broken for non-performance. Our alarm monitoring contracts with Dealers may require the Dealer to place its entire portfolio of end-user alarm monitoring contracts in our monitoring centers. Our revenues will fluctuate based upon changes in the net number of end-user alarm monitoring contracts and the timing of connections and disconnections that any one Dealer has with us. Our revenues will also fluctuate based upon the number of Dealers that are added or lost during any particular period. We may gain or lose Dealers based upon the quality, range or price of the services we provide relative to what is provided by our competitors and the effectiveness of our sales and marketing efforts. Our revenues may also be affected by the application of various pricing strategies we may choose to use with our Dealers.
In addition to our organic revenue growth, our revenues will increase because of acquisitions of retail alarm monitoring contracts and Dealer relationships and their related wholesale alarm monitoring business. Our RMR derived from acquired businesses are also subject to the standard risks associated with any acquisition and subsequent integration. We may suffer attrition because of differences in, among other things, the application of policies and procedures, or disruption caused by any conversion or consolidation activity.
The cost of services is primarily a function of labor, telecommunication, data processing and technical support costs. Labor costs are driven in part by the number and productivity of operators, supervisors and management within our alarm monitoring centers that provide alarm monitoring services on behalf of our Dealers' customers. Labor costs are also a function of the quality of our data processing, customer service and quality management functions. Labor costs also reflect the number of technical staff required to maintain and develop our state-of-the-art monitoring systems. Telecommunication costs reflect, among other things, the number of signals processed, the time required to process any particular signal, the number and type of lines, the design and functionality of our telecommunications network and the negotiated rate with our chosen telecommunication providers. We are constantly evaluating how to improve the quality of our services while lowering the cost of providing those services.
Our operating expenses are primarily comprised of general and administrative, selling and marketing and depreciation and amortization expenses. General and administrative expenses are comprised primarily of office staff and officer salaries, rent and professional fees. Fluctuations in general and administrative expenses generally reflect net increases in staff associated with acquisitions, changes in professional fees primarily associated with acquisition activity and audits of our financial statements and merit compensation increases. Selling and marketing expenses are primarily driven by the size of our sales force, commissions based upon successful selling activities, travel and advertising. Depreciation and amortization expenses are primarily a function of the acquisition of Dealer relationships and alarm monitoring contracts, along with accelerated amortization.
Streamlining of Operations
Our November 2004 acquisition of NACC’s state of the art monitoring center, located in Irvine, California, substantially increased our capacity to provide monitoring services. During 2005, we consolidated our Minneapolis, Minnesota monitoring center into our existing monitoring centers. Additionally, during 2005, we reduced the number of dealer care centers from six to three.
Acquisitions
On October 1, 2005, we purchased substantially all of the assets and assumed certain liabilities of Financial Security Services, Inc. for approximately $23.1 million in cash. FSS primarily engages in alarm dealer financing along with wholesale monitoring and billing services. On the date of acquisition, FSS was generating approximately $0.2 million of wholesale RMR and approximately $0.2 million of monthly interest income on notes receivable from Dealers. The acquisition has been accounted for as a purchase business combination and the results of the acquirees are included in our results of operations from the date of acquisition.
On November 19, 2004, we acquired substantially all of the assets and assumed certain liabilities of NACC, a subsidiary of Tyco, for approximately $50.6 million in cash, subject to certain closing adjustments. NACC engages in the wholesale and retail alarm monitoring business and also provides secured financing to Dealers. At November 19, 2004, NACC contributed approximately $0.8 million of wholesale RMR, $0.4 million of retail RMR and $0.2 million of monthly interest income on notes receivable from Dealers collateralized by retail contracts to us. The acquisition has been accounted for as a purchase business combination and the results of the acquirees are included in our results of operations from the date of acquisition.
In May 2004, we acquired the alarm portfolio and certain other assets of Alliant Protection Services, Inc. (“Alliant”) for a total cash purchase price of approximately $14.5 million, which included accounts receivable (approximately $0.8 million), customer contracts (approximately $8.7 million), goodwill (approximately $5.8 million), non-compete agreement (approximately $.3 million) and current liabilities (approximately $1.1 million). The acquisition has been accounted for as a purchase business combination and the results of the acquirees are included in our results of operations from the date of acquisition.
Prior to the acquisition of Integrated Alarm Services, Inc., Messrs. Timothy M. McGinn and David L. Smith controlled 41 trusts and three limited liability companies which were principally created to acquire alarm monitoring contracts. Approximately 62% of the trust certificates of the 41 trusts were exchanged for promissory notes of Integrated Alarm Services, Inc. and some of these notes were repaid with proceeds from our initial public offering. Approximately 38% of the trust certificates were not exchanged and were subsequently repaid out of the proceeds of our initial public offering. An additional $9.5 million of bank debt relating to these contract acquisitions was also repaid with proceeds from our initial public offering. Messrs. McGinn and Smith were residual beneficiaries of these trusts but have contributed their residual benefits in the trusts to us. The three limited liability companies, Palisades Group, LLC, Payne Security Group, L.L.C. and Guardian Group, LLC were acquired by us in January 2003 and Payne Security Group, L.L.C. and Guardian Group, LLC are now our wholly owned subsidiaries. Palisades Group, LLC was dissolved on July 22, 2004.
Operations
We have completed the consolidation of our alarm monitoring centers. Key expenses such as payroll and telecommunication costs have been reduced. We believe that our costs per subscriber will continue to decline as additional subscriber accounts are added.
Our RMR may include amounts billable to customers or Dealers with past due balances which we believe are collectible. We seek to preserve the revenue stream associated with each end-user alarm monitoring contract, primarily to maximize our return on the investment we made to generate each alarm monitoring contract or Dealer relationship. As a result, we actively work to collect amounts owed to us and to retain the end-user at the same time.
In some instances, we may allow more than six months to collect past due amounts, while evaluating the ongoing customer or Dealer relationship. After we have made every reasonable effort to collect past due balances, we will disconnect the customer.
Customer creation and marketing
Our current customer acquisition strategy relies on both internally generated sales and acquiring Dealer relationships and alarm monitoring contract rights to monitor security systems. We currently have a salaried and commissioned sales force in select markets which perform end-user sales activities across the United States. The internal sales program generated in the wholesale segment approximately 79,000, 127,000 and 208,000 new monitoring contracts in 2004, 2005 and 2006, respectively.
Attrition
Alarm-Monitoring Wholesale Services
End-user attrition has a direct impact on our results of operations since it affects our revenues, amortization expense and cash flow. We define attrition in the wholesale alarm monitoring business as the number of end-user accounts lost, expressed as a percentage, for a given period. In some instances, we use estimates to derive attrition data. We monitor end-user attrition each month, each quarter and each year. In periods of end-user account growth, end-user attrition may be understated and in periods of end-user account decline, end-user attrition may be overstated. Our actual attrition experience shows that the relationship period with any individual Dealer or end-user can vary significantly. Dealers discontinue service with us for a variety of reasons, including but not limited to, the sale of their alarm monitoring contracts, performance issues and receipt of lower pricing from competitors. End-users may discontinue service with the Dealer and therefore with us for a variety of reasons, including, but not limited to, relocation, service issues and cost. A portion of Dealer and end-user relationships, whether acquired or originated via our sales force, can be expected to discontinue service every year. Any significant change in the pattern of our historical attrition experience would have a material effect on our results of operations, financial position or cash flows.
For the years ended December 31, 2004, 2005 and 2006 our trailing annual end-user account growth rates in the wholesale monitoring segment, including acquisitions were 31.7%, 1.2% and 5.0%, respectively. For the years ended December 31, 2004, 2005, and 2006 our trailing annual end-user account growth rates in the wholesale monitoring segment, excluding acquisitions, were (6.1%), (7.4%) an 2.9% respectively. For the years ended December 31, 2004, 2005, and 2006 our trailing annual end-user attrition rates in the wholesale monitoring segment, calculated as end-user losses divided by the sum of beginning end-users, end-users added and end-users acquired, was 13.1%, 19.8% and 19.4% respectively. End-users acquired includes accounts purchased by the wholesale segment and customers acquired by the residential segment. Included in total end-users for 2004, 2005, 2006 are approximately 149,000, 159,000 and 145,000 contracts, respectively, that are owned by us, the remainder are third-party owned.
Following is a summary of our end-user accounts:
2004 | 2005 | 2006 | ||||||||
| Beginning balance, January 1, | 546,649 | 719,881 | 728,223 | |||||||
| Reporting discrepancy adjustments (see Note) | (26,592 | ) | - | - | ||||||
| End-users added, excluding acquisitions | 79,191 | 126,617 | 207,672 | |||||||
| End-users acquired | 232,984 | 61,837 | 14,890 | |||||||
| End-user losses | (112,351 | ) | (180,112 | ) | (186,203 | ) | ||||
| Ending balance, December 31, | 719,881 | 728,223 | 764,582 | |||||||
Note: As a result of the discovery of a discrepancy in the reporting mechanism for the number of wholesale accounts, an adjustment of 26,592 to the January 1, 2004 beginning balance is necessitated and is reflected in the table above.
Attrition for acquired Dealer customer relationships and alarm monitoring contracts may be greater in the future than the attrition rate assumed or historically incurred by us. In addition, because some Dealer customer relationships and acquired alarm monitoring contracts are prepaid on an annual, semi-annual or quarterly basis, attrition may not become evident for some time after an acquisition is consummated.
Alarm-Monitoring Residential and Commercial Services (formerly reported combined as “retail services”)
We employ, for contracts purchased on a bulk basis subsequent to January 31, 2003, an amortization methodology which is the total of the charges calculated by a straight line, 18 year life; together with charges incurred as a result of actual contract attrition. For bulk contracts purchased prior to that date, we employ an amortization methodology which uses 150% declining balance over a life of 8 years.
The annualized attrition rates, based upon customer accounts cancelled or becoming significantly delinquent, during the periods presented are as follows:
Quarter Ended | ||||||||||||||||
Year Ended | ||||||||||||||||
March 31, | June 30, | September 30, | December 31, | December 31, | ||||||||||||
2006 | 2006 | 2006 | 2006 | 2006 | ||||||||||||
| Legacy and flow | 12.12% | 11.83% | 16.33% | 16.86% | 13.54% | |||||||||||
| Residential since IPO | 12.07% | 11.91% | 20.99% | 15.42% | 14.25% | |||||||||||
| Total Residential | 12.08% | 11.88% | 19.58% | 15.84% | 14.05% | |||||||||||
| Commercial since IPO | 5.30% | 12.50% | 11.10% | 7.60% | 8.83% | |||||||||||
| Total Retail | 10.60% | 12.02% | 17.57% | 13.96% | 12.88% | |||||||||||
The 2006 portfolio retail attrition rate of 12.88% compares to the 2005 portfolio retail attrition of 13.67%.
The attrition for a given period is calculated as the quotient of: (i) the sum of (a) cancelled RMR plus (b) the increase (or minus the decrease) in “disqualified RMR” (i.e., RMR with related account receivable balances over 90 days from invoice date) minus (c) “replacement RMR” (i.e., cancelled or disqualified RMR that has been replaced by the selling Dealer with new RMR as required by the original sales contract with the Dealer); divided by (ii) “qualified RMR” (i.e., RMR with no related account receivable balances over 90 days from invoice date).
Critical Accounting Policies
Our discussion and analysis of results of operations, financial condition and cash flows are based upon our financial statements, which have been prepared in accordance with accounting principles generally accepted in the United States of America. The preparation of these financial statements requires us to make estimates and judgments that affect the reported amounts of assets, liabilities, revenues and expenses, and related disclosure of contingent assets and liabilities. These estimates are evaluated on an on-going basis, including those related to revenue recognition and allowance for doubtful accounts, valuation to allocate the purchase price for a business combination, notes receivable reserve and fair value of customer contracts on foreclosed loans, fair value and forecasted data to access recoverability of intangible assets and goodwill, income taxes and contingencies and litigation. We base our estimates on historical experience and on various other assumptions that are believed to be reasonable under the circumstances, the results of which form the basis for making judgments about the carrying values of assets and liabilities that are not readily apparent from other sources. Actual results may differ from these estimates under different assumptions or conditions.
Note 2 of the "Notes to Financial Statements" includes a summary of the significant accounting policies and methods used in the preparation of our financial statements. The following is a brief description of the more significant accounting policies and methods we use.
Revenue Recognition and Allowance for Doubtful Accounts
All revenue is recognized on an accrual basis. Accounts receivable are recorded at the invoiced amount and do not bear interest. Credit is extended based upon an evaluation of the customer’s financial condition and history. The allowance for doubtful accounts is our best estimate of the amount of probable credit losses in our existing accounts receivable. We review our allowance for doubtful accounts monthly. Customer accounts, including a high percentage of accounts with balances over 90 days from the invoice date are reserved based on historical trends. Account balances are charged-off against the allowance when we feel it is probable the receivable will not be recovered. We do not have any off-balance-sheet credit exposure related to our customers.
Revenue from providing monitoring only service to the customers of our dealers and our retail owned customer contracts is recognized as the monitoring service is provided over the term of the contract.
Revenue from sales of installed equipment without monitoring is recognized upon the completed installation of the equipment.
We sell bundled arrangements to our commercial and residential customers which consist of equipment, installation services and ongoing monitoring services generally under three to five year contracted terms. These bundled arrangements generally require an upfront payment and recurring monthly revenue (RMR) payments over the term of the contract. Amounts assigned to each component are based on the component’s objectively determined fair value. If fair value can not be determined for a sale involving multiple elements, upfront non-refundable deposits are deferred and recognized over the expected life of the customer relationship. The RMR is recognized monthly over the term of the contract.
Notes Receivable Reserve and Fair Value of Customer Contracts on Foreclosed Loans
We make loans to Dealers, which are collateralized by the Dealers’ portfolio of end-user alarm monitoring contracts. Loans to Dealers are carried at the lower of the principal amount outstanding or if non-performing, the net realizable value of the portfolio underlying the loan. Loans are generally considered non-performing if they are 120 days in arrears of contractual terms.
Management periodically evaluates the loan portfolio to assess the collectibility of Dealer notes and adequacy of allowance for loan losses. Management reviews certain criteria in assessing the adequacy of the allowance for loan losses, including our past loan loss experience, known and inherent risks in the portfolio, adverse situations that may affect the borrower's ability to repay, the estimated value of any underlying collateral and current economic conditions. Loan impairment is identified when a portfolio's cash flow is materially below the minimum necessary to service the loan. In most cases, loans will be foreclosed and valued at the lower of cost (loan carrying value) or fair value of end-user contracts using recent transaction prices and industry benchmarks.
Unearned discount on acquired notes that are prepaid within the first year of acquisition is offset to goodwill.
Notes receivable consists primarily of loans to Dealers which are collateralized by a portfolio of individual end-user monitoring contracts. When a Dealer becomes delinquent, we generally foreclose on and take ownership of the portfolio of end-user monitoring contracts.
At December 31, 2006, we had non-performing loans to Dealers aggregating approximately $1.2 million. Currently, the cash flows from the underlying collateral support the carrying value of the loans. However, if the cash flow from the underlying collateral deteriorates, it may result in a future charge to earnings.
Deferred customer acquisition costs, net
The direct incremental costs associated with obtaining a new customer including the installation of the monitoring systems, to the extent of deferred revenue (upfront non-refundable deposits), are capitalized and amortized over the expected life of the customer relationship. Excess direct incremental costs over deferred revenue (upfront non-refundable deposits) are being amortized over the term of the contract.
Deferred issuance costs
Debt issuance costs represent direct costs incurred in connection with obtaining financing with related parties, banks and other lenders. Debt issuance costs are being amortized over the life of the related obligations using the effective interest method.
Intangible Assets and Goodwill
Alarm monitoring services for Dealers’ end-users are outsourced to us. We acquire such Dealer relationships from our internally generated sales efforts and from other monitoring companies. Acquired Dealer relationships are recorded at cost, which management believes approximates fair value. End-user alarm monitoring contracts are acquired from the Dealers’ pre-existing portfolios of contracts or assumed upon the foreclosure on Dealers’ loans.
Acquired end-user alarm monitoring contracts are recorded at cost which management believes approximates fair value. End-user alarm monitoring contracts assumed as a result of foreclosure on dealer loans are recorded at the lower of cost (loan carrying value) or the fair value of such contracts using recent transaction prices and industry benchmarks at the time of foreclosure.
End-user alarm monitoring contracts are amortized over the term that such end-users are expected to remain as our customer. We, on an ongoing basis, conduct comprehensive reviews of our amortization policy for end-user contracts and, when deemed appropriate, use an independent appraisal firm to assist in performing an attrition study.
Amortization methods for end-user contracts below consider the average estimated life and historical and projected attrition rates determined from actual experience and consists of the following portfolios:
Acquired as a result of the IASI merger:
| Existing at January 31, 2003 | Accelerated method | Period | ||
| Existing portfolio accounts (bulk) | 150% Declining balance | 8 years | ||
| Dealer acquired new accounts (flow) | 160% Declining balance | 8 years | ||
| Contracts assumed from dealers | 160% Declining balance | 4 years |
Acquired subsequent to the IASI merger:
| Acquired after January 31, 2003 | Accelerated method | Period | ||
| Existing portfolio accounts (bulk) | Straight-line plus attrition | 18 years | ||
| Dealer acquired new accounts (flow) | 200% Declining balance | 12 years | ||
| Contracts assumed from dealers | 200% Declining balance | 8 years |
Dealer relationships and end-user contracts are amortized using methods and lives which are management’s estimates, based upon all information available (including industry data, attrition studies, current portfolio trends), of the life (attrition pattern) of the underlying contracts and relationships. If actual results vary negatively (primarily attrition) from management assumptions, amortization will be accelerated, which will negatively impact results from operations. If amortization is not accelerated or conditions deteriorate dramatically, the asset could become impaired. For existing portfolio accounts purchased subsequent to January 31, 2003, we amortize such accounts using the straight-line method over an 18-year period plus actual attrition. This methodology may cause significant variations in amortization expense in future periods. Dealer relationships and end-user alarm monitoring contracts are tested for impairment on a periodic basis or as circumstances warrant. Recoverability of Dealer relationship costs and end-user alarm monitoring contracts are highly dependent on our ability to maintain our Dealers. Factors we consider important that could trigger an impairment review include higher levels of attrition of dealers and/or end-user alarm monitoring contracts and continuing recurring losses.
SFAS No. 144, Accounting for the Impairment or Disposal of Long-Lived Assets, requires that the assets be reviewed for impairment whenever events or changes in circumstances indicate that the carrying amount of an asset may not be recoverable. Recoverability of the assets to be held and used is measured by a comparison of the carrying amount of the assets with the future net cash flows expected to be generated. Cash flows of Dealer relationships and retail customer contracts are analyzed at the same group level (acquisition by acquisition and portfolio grouping, respectively) that they are identified for amortization, the lowest level for which independent cash flows are identifiable. All other long-lived assets are evaluated for impairment at the company level, using one asset grouping. If such assets are considered to be impaired, the impairment to be recognized is measured by the amount by which the carrying amount of the assets exceeds the fair value of the assets. As of December 31, 2006, our long-lived assets aggregate approximately $117.0 million.
We account for goodwill under Statement of Financial Accounting Standards (SFAS) No. 142, Goodwill and Other Intangible Assets. Under SFAS No. 142, goodwill is not amortized, but it is tested for impairment at least annually. Each year we test for impairment of goodwill according to a two-step approach. In the first step, we test for impairment of goodwill by estimating the fair values of our reporting units using the present value of future cash flows approach, subject to a comparison for reasonableness to our market capitalization at the date of valuation. If the carrying amount exceeds the fair value, the second step of the goodwill impairment test is performed to measure the amount of the impairment loss, if any. In the second step the implied fair value of the goodwill is estimated as the fair value of the reporting unit used in the first step less the fair values of all other net tangible and intangible assets of the reporting unit. If the carrying amount of the goodwill exceeds its implied fair market value, an impairment loss is recognized in an amount equal to that excess, not to exceed the carrying amount of the goodwill. In addition, goodwill of a reporting unit is tested for impairment between annual tests if an event occurs or circumstances change that would more likely than not reduce the fair value of a reporting unit below its carrying value. We perform our annual impairment test in the third quarter of each year and to date have not been required to record an impairment charge. During the second quarter of 2004 and continuing through the third quarter of 2006, the common stock of the Company traded below its book value. During the third quarter of 2006, the Company’s Residential and Commercial segments continued to incur operating losses and failed to achieve their respective nine months operating plan. As a result, the Company revised its future operating forecasts and determined that goodwill was impaired at September 30, 2006. A non-cash goodwill impairment charge of $65,000,000 has been recorded in the third quarter of
2006. The impairment reduces the goodwill associated with the Residential segment by $47,430,000 and the Commercial segment by $17,570,000. Our goodwill balance at December 31, 2006 is approximately $26.2 million.
Income taxes
As part of the process of preparing our financial statements, we are required to estimate our income taxes in each of the jurisdictions in which we operate. This process involves estimates of our actual current tax exposure together with assessing temporary differences resulting from differing treatment of items, such as depreciation and amortization, for tax and accounting purposes.
Litigation
See Part I, Item 3 Legal Proceedings.
The following table sets forth, for the periods indicated, selected statements of operations data for IASG:
Years Ended December 31, | ||||||||||
2004 | 2005 | 2006 | ||||||||
(in thousands, except per share data) | ||||||||||
| Total revenue | $ | 80,369 | $ | 99,234 | $ | 94,364 | ||||
| Expenses: | ||||||||||
| Cost of revenue (excluding depreciation and amortization) | 32,748 | 43,381 | 38,165 | |||||||
| Selling and marketing | 4,357 | 4,977 | 5,298 | |||||||
| Depreciation and amortization | 23,013 | 28,572 | 27,166 | |||||||
| Loss (gain) on disposal of equipment | (184 | ) | 1,032 | (124 | ) | |||||
| Loss on business transferred | - | - | 1013 | |||||||
| General and administrative | 22,562 | 29,790 | 29,975 | |||||||
| Goodwill impairment | - | - | 65,000 | |||||||
| Total operating expenses | 82,496 | 107,752 | 166,493 | |||||||
| Income (loss) from operations | (2,127 | ) | (8,518 | ) | (72,129 | ) | ||||
| Other income, net | 11 | - | - | |||||||
| Amortization of debt issuance costs | (1,750 | ) | (1,080 | ) | (973 | ) | ||||
| Interest expense | (8,886 | ) | (17,009 | ) | (16,244 | ) | ||||
| Interest income | 1,453 | 4,838 | 4,418 | |||||||
| Income (loss) before income taxes | (11,299 | ) | (21,769 | ) | (84,928 | ) | ||||
| Income tax expense (benefit) | 418 | 563 | (1,013 | ) | ||||||
| Net income (loss) | $ | (11,717 | ) | $ | (22,332 | ) | $ | (83,915 | ) | |
| Basic and diluted income (loss) per share | $ | (0.47 | ) | $ | (0.91 | ) | $ | (3.44 | ) | |
The following table sets forth, for the periods indicated, selected statements of operations data as a percentage of revenues:
Years Ended December 31, | ||||||||||
2004 | 2005 | 2006 | ||||||||
| Total revenue | 100.0 % | 100.0 % | 100.0% | |||||||
| Cost of revenue (excluding depreciation and amortization) | 40.7 % | 43.7 % | 40.4 % | |||||||
| Operating expenses: | ||||||||||
| Selling and marketing | 5.4 % | 5.0 % | 5.6 % | |||||||
| Depreciation and amortization | 28.6 % | 28.8 % | 28.8 % | |||||||
| Loss (gain) on disposal of equipment | (0.2% | ) | 1.0 % | (0.1% | ) | |||||
| Loss on business transferred | -% | -% | 1.1% | |||||||
| General and administrative | 28.1 % | 30.0 % | 31.8 % | |||||||
| Goodwill impairment charge | - % | - % | 68.9 % | |||||||
| Total operating expenses | 102.6 % | 108.6 % | 176.4 % | |||||||
| Income (loss) from operations | (2.6% | ) | (8.6% | ) | (76.4% | ) | ||||
| Other income, net | 0.0 % | - % | - % | |||||||
| Amortization of debt issuance costs | (2.2% | ) | (1.1% | ) | (1.0% | ) | ||||
| Interest expense | (11.1% | ) | (17.1% | ) | (17.2% | ) | ||||
| Interest income | 1.8 % | 4.9 % | 4.7 % | |||||||
| Income (loss) before benefit from income taxes | (14.1% | ) | (21.9% | ) | (90.0% | ) | ||||
| Income tax expense (benefit) | 0.5 % | 0.6 5% | (1.1% | ) | ||||||
| Net income (loss) | (14.6% | ) | (22.5% | ) | (88.9% | ) | ||||
Results of operations
2006 Compared to 2005
Consolidated. Year Ended December 31, 2006 Compared to the Year Ended December 31, 2005.
The following chart and discussion reflects the impact of the elimination of inter-segment revenue and cost of revenue:
For the Year Ended December 31, | Dollar | Percent | |||||||||||
2005 | 2006 | Variance | Variance | ||||||||||
(in thousands) | |||||||||||||
| Total revenue | $ | 99,234 | $ | 94,364 | $ | (4,870 | ) | (4.9 | %) | ||||
| Expenses: | |||||||||||||
| Cost of revenue (excluding depreciation | |||||||||||||
| and amortization) | 43,381 | 38,165 | (5,216 | ) | (12.0 | %) | |||||||
| Selling and marketing | 4,977 | 5,298 | 321 | 6.4 | % | ||||||||
| Depreciation and amortization | 28,572 | 27,166 | (1,406 | ) | (4.9 | %) | |||||||
| Loss on sale or disposal of assets | 1,032 | (124 | ) | (1,156 | ) | (112.0 | %) | ||||||
| Loss on business transferred | - | 1,013 | 1,013 | NA | |||||||||
| General and administrative | 29,790 | 29,975 | 185 | 0.6 | % | ||||||||
| Goodwill impairment | - | 65,000 | 65,000 | N/A | |||||||||
| Total expenses | 107,752 | 166,493 | 58,741 | 54.5 | % | ||||||||
| Income (loss) from operations | (8,518 | ) | (72,129 | ) | (63,611 | ) | 746.8 | % | |||||
| Other income (expense): | |||||||||||||
| Amortization of debt issuance costs | (1,080 | ) | (973 | ) | 107 | (9.9 | %) | ||||||
| Interest expense | (17,009 | ) | (16,244 | ) | 765 | (4.5 | %) | ||||||
| Interest income | 4,838 | 4,418 | (420 | ) | (8.7 | %) | |||||||
| Income (loss) before income taxes | (21,769 | ) | (84,928 | ) | (63,159 | ) | 290.1 | % | |||||
| Income tax expense (benefit) | 563 | (1,013 | ) | (1,576 | ) | (279.9 | %) | ||||||
| Net income (loss) | $ | (22,332 | ) | $ | (83,915 | ) | $ | (61,583 | ) | 275.8 | % | ||
Revenue
Total consolidated revenue decreased approximately $4,870,000. This decrease was due to decreases of approximately $4,730,000 and $483,000 in the residential and commercial segments, respectively, offset, in part, by an increase in revenue in wholesale segment of approximately $300,000 addressed in the individual segment discussions below.
Cost of Revenue (excluding Depreciation and Amortization)
Total consolidated cost of revenue decreased approximately $5,216,000. This decrease was primarily due to decreases of approximately $3,157,000, $1,281,000 and $821,000 in the wholesale, commercial and residential segments, respectively.
Selling and Marketing Expense
Total consolidated selling and marketing expense increased approximately $321,000. This increase was primarily due to increases of approximately $235,000, $64,000 and $22,000 in the commercial, residential and wholesale segments, respectively.
Depreciation and Amortization Expense
Total consolidated depreciation and amortization expense decreased approximately $1,406,000. This decrease was primarily due to decreases of approximately $941,000 and $598,000 in the commercial and residential segments, offset, in part, by increases of approximately $116,000 and $17,000 in the wholesale segment and corporate expenses, respectively.
Gain/Loss on Sale or Disposal of Assets
Loss on sale or disposal of assets in 2005 of approximately $1,032,000 compared to a loss in 2006 of approximately $889,000. Most of the loss in 2005 was attributable to the closure of certain dealer care centers and a monitoring station in the wholesale segment whereas the 2006 loss was primarily attributable to the sale of certain monitoring contracts.
General and Administrative Expense
Total consolidated general and administrative expenses increased by approximately $185,000 The segments experienced decreases of approximately $1,079,000, $314,000 and $221,000 in the wholesale, commercial and residential segments, respectively, offset by an increase of approximately $1,799,000 in corporate expenses.
Goodwill Impairment
A non-cash goodwill impairment charge of approximately $65,000,000 was recorded in the quarter ended September 30, 2006 based upon the annual impairment test conducted during the third quarter of each year. This impairment charge affected the residential and commercial segments by approximately $47,430,000 and $17,570,000, respectively.
Amortization of Debt Issuance Costs
The decrease in amortization of debt issuance costs of approximately $107,000 was due primarily to the decrease in amortization of certain debt issuance costs that became fully amortized by late 2005.
Interest Expense
The decrease in interest expense of approximately $765,000 was due primarily to retirement of debt during 2005.
Interest Income
Total consolidated interest income decreased by approximately $420,000. This decrease was primarily due to a decrease in the residential segment of approximately $571,000, offset, in part, by an increase of approximately $151,000 at corporate related to the increase in average excess funds and interest rates.
Taxes
The decrease in income tax expense is primarily due to the adjustment to deferred tax liabilities as a result of the goodwill impairment charge offset by an increase in current state income tax expense due to an increase of state taxes in separate taxing jurisdictions.
Results of Operations by Segment
The comparable financial results for the Company’s three segments: Wholesale Services, Residential Services and Commercial Services, as well as Corporate related income and expenses for the year ended December 31, 2006 compared with the year ended December 31, 2005 are discussed below.
The following charts and discussions include inter-segment revenue and cost of revenue that are eliminated in the consolidated financial statements. These amounts for the year ended December 31, 2006 and 2005 are approximately $4,753,000 and $4,796,000, respectively. The residential and commercial segments incurs expense for the monitoring services provided by the wholesale segment. The inclusion of inter-segment activity provides a more realistic presentation of how these segments would operate on a stand alone basis.
Wholesale Segment. Year Ended December 31, 2006 Compared to the Year Ended December 31, 2005.
For the Year Ended December 31, | Dollar | Percent | |||||||||||
2005 | 2006 | Variance | Variance | ||||||||||
(in thousands) | |||||||||||||
| Total revenue | $ | 36,406 | $ | 36,706 | $ | 300 | 0.8 | % | |||||
| Expenses: | |||||||||||||
| Cost of revenue (excluding depreciation | |||||||||||||
| and amortization) | 24,920 | 21,763 | (3,157 | ) | (12.7 | %) | |||||||
| Selling and marketing | 1,574 | 1,596 | 22 | 1.4 | % | ||||||||
| Depreciation and amortization | 5,708 | 5,824 | 116 | 2.0 | % | ||||||||
| (Gain) loss on sale or disposal of assets | 682 | (12 | ) | (694 | ) | (101.8 | %) | ||||||
| General and administrative | 2,070 | 991 | (1,079 | ) | (52.1 | %) | |||||||
| Total expenses | 34,954 | 30,162 | (4,792 | ) | (13.7 | %) | |||||||
| Income from operations | 1,452 | 6,544 | 5,092 | 350.7 | % | ||||||||
| Other income (expense): | |||||||||||||
| Interest expense | (20 | ) | (1 | ) | 19 | (95.0 | %) | ||||||
| Income before income taxes | $ | 1,432 | $ | 6,543 | $ | 5,111 | 356.9 | % | |||||
Revenue from the wholesale segment increased approximately $300,000. This increase was primarily due to an increase in revenue associated with end-user accounts obtained as part of the FSS acquisition of approximately $2,806,000. This increase was offset, in part, by a decrease in average number of end-user accounts of approximately 32,060 which resulted in a decrease in revenue of approximately $1,773,000; a decrease in the average revenue per end-user account per month of approximately $0.10 which resulted in a decrease in revenue of approximately $642,000; a decrease in inter-segment revenue of approximately $43,000; and, a decrease in other revenue of approximately $48,000.
Cost of Revenue
Cost of revenue for the wholesale segment decreased by approximately $3,157,000. This decrease was primarily due to reductions in salaries, benefits and payroll taxes of approximately $1,069,000, rent expense of approximately $824,000, telephone expense of approximately $672,000 and other direct expenses of approximately $592,000 as a result of facility closures made during 2005.
Selling and Marketing Expense
Selling and marketing expense for the wholesale segment remained reasonably consistent with the prior year.
Depreciation and Amortization Expense
Depreciation and amortization expense for the wholesale segment increased by approximately $116,000. This increase is primarily due to an increase in depreciation expense of approximately $260,000, offset, by a decrease in amortization expense of approximately $144,000.
Loss on Sale or Disposal of Assets
Loss on sale or disposal of assets for the wholesale segment decreased by approximately $694,000. This decrease is primarily due to a decrease from equipment disposals associated with facility closures which were completed during 2005.
General and Administrative Expense
General and administrative expense for the wholesale segment decreased by approximately $1,079,000. This decrease is primarily due to decreases in salaries, benefits and payroll taxes of approximately $581,000, bank service charges of approximately $127,000, bad debt expense of approximately $96,000 and professional fees of approximately $89,000.
Interest Expense
Interest expense for the wholesale segment decreased by approximately $19,000. This decrease is primarily due to the termination of capital leases related to equipment utilized in facilities that were closed in 2005.
Residential Segment. Year Ended December 31, 2006 Compared to the Year Ended December 31, 2005.
For the Year Ended December 31, | Dollar | Percent | |||||||||||
2005 | 2006 | Variance | Variance | ||||||||||
(in thousands) | |||||||||||||
| Total revenue | $ | 49,323 | $ | 44,593 | $ | (4,730 | ) | (9.6 | %) | ||||
| Expenses: | |||||||||||||
| Cost of revenue (excluding depreciation | |||||||||||||
| and amortization) | 12,692 | 11,871 | (821 | ) | (6.5 | %) | |||||||
| Selling and marketing | 895 | 959 | 64 | 7.2 | % | ||||||||
| Depreciation and amortization | 18,959 | 18,361 | (598 | ) | (3.2 | %) | |||||||
| Loss on sale or disposal of assets | 142 | 969 | 827 | 582.4 | % | ||||||||
| General and administrative | 13,539 | 13,318 | (221 | ) | (1.6 | %) | |||||||
| Goodwill impairment | - | 47,430 | 47,430 | N/A | |||||||||
| Total expenses | 46,227 | 92,908 | 46,681 | 101.0 | % | ||||||||
| Income from operations | 3,096 | (48,315 | ) | (51,411 | ) | (1,660.6 | %) | ||||||
| Other income (expense): | |||||||||||||
| Interest expense | (3 | ) | (37 | ) | (34 | ) | 1,133.3 | % | |||||
| Interest income | 4,353 | 3,782 | (571 | ) | (13.1 | %) | |||||||
| Income (loss) before income taxes | $ | 7,446 | $ | (44,570 | ) | $ | (52,016 | ) | (698.6 | %) | |||
Revenue
Revenue from the residential segment decreased approximately $4,730,000. This decrease was primarily due to a decrease in revenue from customer accounts of approximately $4,174,000. A portion of this decrease in revenue from customer accounts was due to a reduction to the average number of accounts per month of 14,870, which resulted in a revenue decrease of approximately $5,404,000. This decrease was offset, in part, by an increase of approximately $1,230,000 due to an increase in the average revenue per account per month of approximately $.96. This decrease was further enhanced by a decrease in service, installation and other revenue of approximately $556,000. Revenue associated with the FSS acquisition for 2006 was approximately $1,380,000 and is reflected in the amounts above.
Cost of Revenue
Cost of revenue for the residential segment decreased approximately $821,000. This decrease was primarily due to decreases in capitalized installation cost amortization and cost of parts of approximately $968,000 and $119,000, respectively, offset, in part, by an increase in salaries, benefits and payroll taxes of approximately $233,000.
Selling and Marketing Expense
Selling and marketing expense for the residential segment increased approximately $64,000. This increase was primarily due to a reduction in capitalized costs of approximately $225,000 and an increase in advertising expense of approximately $132,000, offset, in part, by a decrease in salaries, benefits and payroll taxes of approximately $289,000.
Depreciation and Amortization Expense
Depreciation and amortization expense for the residential segment decreased approximately $598,000. This decrease was primarily due to a reduction in amortization expense of approximately $920,000, offset, by an increase in depreciation expense of approximately $322,000.
Loss on Sale or Disposal of Assets
Loss on sale or disposal of assets for the residential segment increased approximately $827,000. This increase is primarily attributable to the 2006 sale of certain alarm monitoring contracts.
General and Administrative Expense
General and administrative expense for the residential segment decreased approximately $221,000. This decrease was primarily due to a reduction in bad debt expense of approximately $703,000 as a result of system conversions in 2005, a decrease in billing fees of approximately $413,000 and a decrease in third party services of approximately $351,000, offset, in part, by an increases in salaries, benefits and payroll taxes of approximately $552,000, professional fees of approximately $359,000, bank service charges of approximately $213,000 and rent and utilities of approximately $142,000.
Goodwill Impairment
The residential segment recorded a non-cash goodwill impairment charge of approximately $47,430,000 during the quarter ended September 30, 2006 based upon the annual impairment test conducted during the third quarter of each year.
Interest Expense
Interest expense for the residential segment remained reasonable consistent with the prior year.
Interest Income
Interest income for the residential segment decreased approximately $571,000. This decrease was primarily attributable to a significant reduction in the loan portfolio from notes receivable of approximately $19,357,000 at the end of 2005 to a balance of approximately $12,267,000 at the end of 2006.
Commercial Segment. Year Ended December 31, 2006 Compared to the Year Ended December 31, 2005.
For the Year Ended December 31, | Dollar | Percent | |||||||||||
2005 | 2006 | Variance | Variance | ||||||||||
(in thousands) | |||||||||||||
| Total revenue | $ | 18,301 | $ | 17,818 | $ | (483 | ) | (2.6)% | |||||
| Expenses: | |||||||||||||
| Cost of revenue (excluding depreciation | |||||||||||||
| and amortization) | 10,565 | 9,284 | (1,281 | ) | (12.1)% | ||||||||
| Selling and marketing | 2,508 | 2,743 | 235 | 9.4% | |||||||||
| Depreciation and amortization | 3,905 | 2,964 | (941 | ) | (24.1)% | ||||||||
| (Gain) loss on sale or disposal of assets | 208 | (68 | ) | (276 | ) | (132.7)% | |||||||
| General and administrative | 3,435 | 3,121 | (314 | ) | (9.1)% | ||||||||
| Goodwill impairment | - | 17,570 | 17,570 | N/A | |||||||||
| Total expenses | 20,621 | 35,614 | 14,993 | 72.7% | |||||||||
| Income from operations | (2,320 | ) | (17,796 | ) | (15,476 | ) | 667.1% | ||||||
| Other income (expense): | |||||||||||||
| Interest expense | (51 | ) | (51 | ) | - | 0.0% | |||||||
| Income (loss) before income taxes | $ | (2,371 | ) | $ | (17,847 | ) | $ | (15,476 | ) | 652.7% | |||
Revenue
Revenue from the commercial segment operations decreased approximately $483,000. This decrease was primarily due to a decrease in revenue from customer accounts of approximately $573,000. Revenue from customer accounts decreased by approximately $749,000 due to a reduction in the average number of accounts per month of approximately 1,000 accounts. This decrease was offset, in part, by approximately $176,000 in revenue from an increase in the average revenue per account per month of approximately $.99 and an increase in service, installation and other revenue of approximately $90,000.
Cost of Revenue
Cost of revenue for the commercial segment decreased approximately $1,281,000. This decrease was primarily due to decreases in salaries, benefits and payroll taxes of approximately $1,355,000.
Selling and Marketing Expense
Selling and marketing expense for the commercial segment increased approximately $235,000. This increase was primarily due to an increase in salaries, benefits and payroll taxes of approximately $190,000.
Depreciation and Amortization Expense
Depreciation and amortization expense for the commercial segment decreased approximately $941,000. This decrease was primarily due to decreases in depreciation expense of approximately $500,000 and amortization expense of approximately $441,000.
Gain/Loss on Sale or Disposal of Assets
The loss on sale or disposal of assets was approximately $208,000 in 2005 compared to a gain of approximately $68,000 in 2006. The loss in 2005 was due primarily to the write-off of obsolete equipment. The gain in 2006 was due, for the most part, to the sale of vehicles at amounts higher than their net book value.
General and Administrative Expense
General and administrative expense for the commercial segment decreased approximately $314,000. This decrease was primarily due to a decrease in salaries, benefits and payroll taxes of approximately $306,000.
Goodwill Impairment
The commercial segment recorded a non-cash goodwill impairment charge of approximately $17,570,000 during the quarter ended September 30, 2006 based upon the annual impairment test conducted during the third quarter of each year.
Interest Expense
Interest expense for the commercial segment remained reasonably consistent with the prior year.
Corporate. Year Ended December 31, 2006 Compared to the Year Ended December 31, 2005.
For the Year Ended December 31, | Dollar | Percent | |||||||||||
2005 | 2006 | Variance | Variance | ||||||||||
(in thousands) | |||||||||||||
| Expenses: | |||||||||||||
| Depreciation | $ | - | $ | 17 | $ | 17 | N/A | ||||||
| General and administrative | 10,746 | 12,545 | 1,799 | 16.7% | |||||||||
| Total expenses | 10,746 | 12,562 | 1,816 | ||||||||||
| Income (loss) from operations | (10,746 | ) | (12,562 | ) | (1,816 | ) | 16.9% | ||||||
| Other income (expense): | |||||||||||||
| Amortization of debt issuance costs | (1,080 | ) | (973 | ) | 107 | (9.9)% | |||||||
| Interest expense | (16,935 | ) | (16,155 | ) | 780 | (4.6)% | |||||||
| Interest income | 485 | 636 | 151 | 31.1% | |||||||||
| Income (loss) before income taxes | $ | (28,276 | ) | $ | (29,054 | ) | $ | (778 | ) | 2.8% | |||
Depreciation Expense
Depreciation expense at the corporate level remained reasonably consistent with the prior year.
General and Administrative Expense
General and administrative expense at the corporate level increased approximately $1,799,000. This increase was primarily due to the increases in salaries, benefits and payroll taxes of approximately $908,000, the expense associated with the settlement of certain legal proceedings of approximately $717,000, stock based compensation of approximately $386,000, payroll processing fees of approximately $241,000 and bank service charges of approximately $205,000, offset, in part, by a decrease in professional fees of approximately $729,000.
Amortization of Debt Issuance Costs
Amortization of debt issuance costs at the corporate level decreased approximately $107,000. This decrease was primarily due to the retirement of certain debt obligations in 2005.
Interest Expense
Interest expense at the corporate level decreased approximately $780,000. This decrease was primarily due to the retirement of certain debt obligations in 2005.
Interest Income
Interest income at the corporate level increased approximately $151,000. This increase was primarily due to an increase in daily average excess funds available as well as an increase in interest rates.
2005 COMPARED TO 2004
Effective in 2006, our segment reporting was expanded such that the segment formerly referred to as retail was divided into the residential and commercial segments. We have assessed our ability to report information for 2004 in conformity with this expanded segment structure and found it to be impractical. The branch operational structure in place prior to 2005 did not capture revenue or costs by the residential and commercial classifications. As such, the comparison of the information for 2005 and 2004 will be presented based on the segment structure in existence during 2004.
Consolidated. Year ended December 31, 2005 compared to the year ended December 31, 2004.
For the Year Ended December 31, | Dollar | Percent | |||||||||||
2004 | 2005 | Variance | Variance | ||||||||||
(in thousands) | |||||||||||||
| Total revenue | $ | 80,369 | $ | 99,234 | $ | 18,865 | 23.5% | ||||||
| Expenses: | |||||||||||||
| Cost of revenue (excluding depreciation | |||||||||||||
| and amortization) | 32,748 | 43,381 | 10,633 | 32.5% | |||||||||
| Selling and marketing | 4,357 | 4,977 | 620 | 14.2% | |||||||||
| Depreciation and amortization | 23,013 | 28,572 | 5,559 | 24.2% | |||||||||
| (Gain) loss on sale or disposal of assets | (184 | ) | 1,032 | 1,216 | (660.9)% | ||||||||
| General and administrative | 22,562 | 29,790 | 7,228 | 32.0% | |||||||||
| Total expenses | 82,496 | 107,752 | 25,256 | 30.6% | |||||||||
| Income (loss) from operations | (2,127 | ) | (8,518 | ) | (6,391 | ) | 300.5% | ||||||
| Other income (expense): | |||||||||||||
| Other income, net | 11 | - | (11 | ) | (100.0)% | ||||||||
| Amortization of debt issuance costs | (1,750 | ) | (1,080 | ) | 670 | (38.3)% | |||||||
| Interest expense | (8,886 | ) | (17,009 | ) | (8,123 | ) | 91.4% | ||||||
| Interest income | 1,453 | 4,838 | 3,385 | 233.0% | |||||||||
| Income (loss) before income taxes | (11,299 | ) | (21,769 | ) | (10,470 | ) | 92.7% | ||||||
| Income tax expense (benefit) | 418 | 563 | 145 | 34.7% | |||||||||
| Net income (loss) | $ | (11,717 | ) | $ | (22,332 | ) | $ | (10,615 | ) | 90.6% | |||
Revenue
The increase in total revenue was primarily a result of the incremental revenues associated with the November 2004 NACC acquisition and the October 2005 FSS acquisition of approximately $13,842,000 and $1,077,000, respectively. The remaining increase was due to an increase in the retail segment revenue of approximately $6,128,000, offset by decreases in the wholesale segment revenue of approximately $2,182,000 addressed in the individual segment discussions below.
Cost of Revenue (excluding Depreciation and Amortization)
Our cost of revenue increase for the year ended December 31, 2005 was primarily due to incremental expenses related to the November 2004 NACC acquisition and the October 2005 FSS acquisition of approximately $7,006,000 and $543,000, respectively. The remaining increase was due to an increase in the retail segment cost of revenue of approximately $3,140,000, offset by a decrease in the wholesale segment cost of revenue of approximately $56,000 addressed in the individual segment discussions below.
Expenses
Selling and marketing expense increased primarily due to the incremental costs associated with the November 2004 NACC acquisition of approximately $479,000, which consists primarily of increases in advertising and trade shows of approximately $411,000. The remaining increase in sales and marketing expense was primarily due to an increase in the wholesale segment sales salaries of approximately $195,000.
The depreciation and amortization expense increase was mainly caused by increases in customer contract amortization and dealer relationship amortization of approximately $4,870,000 and $653,000, respectively. The increase in the customer contract amortization, including attrition reserve offsets, was a result of both an increase in the number of customer contracts acquired and the accelerated amortization due to attrition. The increase in dealer relationship amortization was primarily due to the incremental increase related to NACC’s dealer relationships of approximately $1,371,000, offset by decreases in existing dealer relationships of approximately $796,000 from the effects of accelerated depreciation methods.
The increase in the loss on sale or disposal of assets was due to approximately $682,000 relating to fixed asset disposals and write-downs from various wholesale segment closures during 2005. The remaining increase was primarily due to write-offs of assets in our retail segment.
The increase in general and administrative expense was primarily due to increases in corporate segment expenses. The majority of corporate general and administrative expense increase was from an increase in accounting, legal and other professional fees of approximately $3,760,000, of which approximately $2,505,000 relates to Sarbanes-Oxley compliance. An increase in corporate salaries, benefits and other compensation accounted for approximately an additional $1,067,000 of the increase and approximately $560,000 in litigation settlement expense. The increase in corporate salaries reflects 3 finance professionals hired during 2004 (not a full year of salary in 2004) and 6 finance and management professionals hired during 2005. Incremental expenses associated with NACC and FSS acquisitions accounted for approximately $701,000 and $447,000 of the total general and administrative increase. Excluding NACC and FSS, the remaining increase primarily consists of approximately $676,000 in retail, offset by a decrease in the wholesale segment of approximately $141,000.
Amortization of Debt Issuance Costs
The decrease in amortization of debt issuance costs was primarily due to the amortization acceleration in 2004 on early pay-offs of debt using the proceeds from the issuance of the $125,000,000 Senior Secured Notes in the fourth quarter of 2004, offset in part, by the amortization of the issuance costs related to the Senior Secured Notes.
Interest Expense
The increase in interest expense was primarily due to the expense associated with the issuance of the $125,000,000 Senior Secured Notes in the fourth quarter of 2004, offset in part by the decrease in interest associated with the retirement of certain debt in the later half of 2004.
Interest Income
Incremental interest income relating to NACC of approximately $2,653,000 and FSS of approximately $697,000 contributed to the majority of the total interest income increase in 2005. The interest income from these two acquisitions was primarily attributable to interest earned from their notes receivable portfolios, including interest income as a result of the amortization of the discount on notes receivable.
Taxes
Income tax expense totaled approximately $563,000 for the year ended December 31, 2005 compared with an expense of approximately $418,000 for the year ended December 31, 2004. The expense recorded in 2004 and 2005 represents state taxes attributable to subsidiaries of the Company which conduct business in separate taxing jurisdictions and deferred taxes related to business acquisitions.
Results of Operations by Segment
The comparable financial results for the Company’s operating segments; Alarm-Monitoring, Wholesale Services and Alarm-Monitoring, Retail Services for the year ended December 31, 2004 compared with the year ended December 31, 2005 are discussed below.
The following charts and discussions include intersegment revenue and cost of revenue that are eliminated in the consolidated financial statements. Those amounts for the year ended December 31, 2004 and 2005 are approximately $3,416,000 and $4,796,000, respectively. The Retail segment incurs expense for the monitoring services provided by the Wholesale segment. The inclusion of the intersegment activity provides a more realistic presentation of how these segments would operate on a stand alone basis.
Wholesale Segment. Year ended December 31, 2005 compared to the year ended December 31, 2004.
For the Year Ended December 31, | Dollar | Percent | |||||||||||
2004 | 2005 | Variance | Variance | ||||||||||
(in thousands) | |||||||||||||
| Total revenue | $ | 27,690 | $ | 36,406 | $ | 8,716 | 31.5% | ||||||
| Expenses: | |||||||||||||
| Cost of revenue (excluding depreciation | |||||||||||||
| and amortization) | 17,629 | 24,920 | 7,291 | 41.4% | |||||||||
| Selling and marketing | 798 | 1,574 | 776 | 97.2% | |||||||||
| Depreciation and amortization | 4,896 | 5,708 | 812 | 16.6% | |||||||||
| Loss on sale or disposal of assets | - | 682 | 682 | N/A | |||||||||
| General and administrative | 1,986 | 2,070 | 84 | 4.2% | |||||||||
| Total expenses | 25,309 | 34,954 | 9,645 | 38.1% | |||||||||
| Income from operations | 2,381 | 1,452 | (929 | ) | (39.0)% | ||||||||
| Other income (expense): | |||||||||||||
| Other income, net | 12 | - | (12 | ) | |||||||||
| Interest expense | (34 | ) | (20 | ) | 14 | (41.2)% | |||||||
| Income before income taxes | $ | 2,359 | $ | 1,432 | $ | (927 | ) | (39.3)% | |||||
The increase in Alarm Monitoring, Wholesale segment total revenue in 2005 was primarily due to the incremental revenue of approximately $8,898,000 associated with NACC (including approximately $514,000 of intersegment revenue), which was purchased in November 2004 and approximately $620,000 from the FSS acquisition in October 2005. Additionally, approximately $866,000 was due to an increase in intersegment revenue (incremental to the NACC intersegment revenue). The offsetting decrease was due primarily to a decrease in the aggregate number of accounts (not owned by the Company, or “external”) monitored during 2005. This decrease in external accounts monitored, of approximately 26,000 resulted in a decrease in revenue of approximately $1,668,000.
The decrease in wholesale segment income from operations was primarily due to the increases in cost of revenue and other operating expenses offset by the revenue increase described above. Cost of revenue increased approximately $6,904,000 due to the incremental costs associated with the November 2004 NACC acquisition. An additional $443,000 was due to the October 2005 acquisition of FSS. The sales and marketing expense increase was primarily due to increases in advertising and trade show expenses of approximately $491,000, of which approximately $411,000 related to the incremental costs of NACC. Additionally, approximately $195,000 of the increase was due to increases in salaries, benefits and other compensation. The increase in depreciation and amortization was primarily due to NACC’s incremental increase in depreciation expense of approximately $235,000 and dealer relationship amortization related to NACC of approximately $1,371,000, offset by decreases in existing dealer relationships of approximately $796,000 from the effects of accelerated depreciation methods. The $682,000 increase in loss on sale or disposal of fixed assets was caused by disposals and write-downs of fixed assets as a result of the closure of various wholesale facilities during 2005.
The decrease in the income before income taxes was primarily due to the decrease in the income from operations discussed above.
Retail Segment. Year ended December 31, 2005 compared to the year ended December 31, 2004.
For the Year Ended December 31, | Dollar | Percent | |||||||||||
2004 | 2005 | Variance | Variance | ||||||||||
(in thousands) | |||||||||||||
| Total revenue | $ | 56,095 | $ | 67,624 | $ | 11,529 | 20.6 | % | |||||
| Expenses: | |||||||||||||
| Cost of revenue (excluding depreciation | |||||||||||||
| and amortization) | 18,535 | 23,257 | 4,722 | 25.5 | % | ||||||||
| Selling and marketing | 3,559 | 3,403 | (156 | ) | (4.4 | %) | |||||||
| Depreciation and amortization | 18,117 | 22,864 | 4,747 | 26.2 | % | ||||||||
| (Gain) loss on sale or disposal of assets | (184 | ) | 350 | 534 | (290.2 | %) | |||||||
| General and administrative | 15,376 | 16,974 | 1,598 | 10.4 | % | ||||||||
| Total expenses | 55,403 | 66,848 | 11,445 | 20.7 | % | ||||||||
| Income from operations | 692 | 776 | 84 | 12.1 | % | ||||||||
| Other income (expense): | |||||||||||||
| Other income, net | (1 | ) | - | 1 | (100.0 | %) | |||||||
| Amortization of debt issuance costs | (1,471 | ) | - | 1,471 | (100.0 | %) | |||||||
| Interest expense | (6,484 | ) | (54 | ) | 6,430 | (99.2 | %) | ||||||
| Interest income | 1,362 | 4,353 | 2,991 | 219.6 | % | ||||||||
| Income (loss) before income taxes | $ | (5,902 | ) | $ | 5,075 | $ | 10,977 | (186.0 | %) | ||||
Alarm Monitoring, Retail segment total revenue increased approximately $4,944,000 due to incremental revenues relating to the November 2004 NACC acquisition while an additional $457,000 of the increase was due to the October 2005 FSS acquisition. Additional revenue of approximately $3,243,000 was generated due to an increase of approximately 7,000 in the average number of retail contracts owned per month along with an increase of approximately $157,000 which was due to an increase in the average revenue per contract of $0.11 per month. Additionally, installation revenue increased approximately $2,753,000.
For the year ended December 31, 2005, the increase in the income from operations was primarily due to the above mentioned increase in revenue, offset by increases in cost of revenue, depreciation and amortization and general and administrative expenses. The increase in cost of revenue was attributable to the costs associated with the increases in revenue. Cost of revenue as a percentage of revenue for the year ended December 31, 2004 and 2005 was consistent at 33.0% and 34.4%, respectively. The increase in depreciation and amortization was primarily a result of an increase in customer contract amortization of approximately $4,870,000, including attrition reserve offsets, as a result of both an increase in the number of customer contracts acquired and the accelerated amortization due to attrition. The increase in general and administrative expenses was due, in part, to approximately $454,000 relating to NACC and approximately $469,000 from FSS. The remaining increase in general and administrative expenses in the retail segment are primarily due to increases in salaries, benefits and other compensation of approximately $1,328,000, postage and shipping of approximately $295,000, collections expense of approximately $228,000, offset in part by decreases in telephone expense of approximately $498,000, accounting, legal and other professional fees of approximately $344,000 and bad debt expense of approximately $465,000.
The increase in income before income taxes from a loss before income taxes in the prior year was partially due to a decrease in interest expense. Certain subsidiaries have entered into debt agreements with the parent. The interest income and offsetting interest expense related to these arrangements is not recognized in the above tables. Debt issued by IASI (Retail Services) was retired in 2004 using funds obtained by the parent. As a result, debt and interest expense were reallocated from IASI to corporate in late 2004, which was the primary cause of the decrease in retail segment interest expense. The amortization of debt issuance costs associated with the debt agreements reclassed to corporate are also now recorded in corporate, accounting for the approximate $1,471,000 decrease. Additionally, the increase in income before income taxes was caused by increases in NACC and FSS interest income of approximately $2,653,000 and $697,000, respectively, resulting primarily from interest earned on notes receivable, including interest income as a result of the amortization of the discount on notes receivable.
Corporate. Year ended December 31, 2005 compared to the year ended December 31, 2004.
For the Year Ended December 31, | Dollar | Percent | |||||||||||
2004 | 2005 | Variance | Variance | ||||||||||
(in thousands) | |||||||||||||
| Expenses: | |||||||||||||
| General and administrative | $ | 5,200 | $ | 10,746 | $ | 5,546 | 106.7 | % | |||||
| Total expenses | 5,200 | 10,746 | 5,546 | 106.7 | % | ||||||||
| Income (loss) from operations | (5,200 | ) | (10,746 | ) | (5,546 | ) | 106.7 | % | |||||
| Other income (expense): | |||||||||||||
| Amortization of debt issuance costs | (279 | ) | (1,080 | ) | (801 | ) | 287.1 | % | |||||
| Interest expense | (2,368 | ) | (16,935 | ) | (14,567 | ) | 615.2 | % | |||||
| Interest income | 91 | 485 | 394 | 433.0 | % | ||||||||
| Income (loss) before income taxes | $ | (7,756 | ) | $ | (28,276 | ) | $ | (20,520 | ) | 264.6 | % | ||
The increase in the loss from operations was due to an increase in general and administrative expenses. This increase was primarily due to an increase of approximately $3,760,000 in accounting, legal and other professional fees, of which $2,505,000 was related to Sarbanes-Oxley compliance and approximately $1,067,000 in salaries, benefits and other compensation.
Certain subsidiaries have entered into debt agreements with the parent. The interest income and offsetting interest expense related to these arrangements was not recognized in the above tables. Debt issued by IASI (Retail Services) was retired in 2004 using funds obtained by the parent. As a result, debt and interest expense were reallocated from IASI to corporate in late 2004.
Loss before income taxes increased primarily as a result of the above mentioned allocation of debt and interest expense to corporate. Additionally, the November 2004 $125,000,000 debt offering increased amortization of debt issuance costs and interest expense in 2005, offset in part, by an increase in interest income as a result of an increase in invested funds with the proceeds from the debt offering.
Liquidity and Capital Resources
(bracketed amounts represent uses of funds)
Net cash provided by operating activities was approximately $6,367,000 for year ended December 31, 2006 compared to approximately $8,099,000 provided by operating activities for the year ended December 31, 2005, a decrease of approximately ($1,732,000). The decrease is primarily the result of a decrease in accounts payable and accrued expenses of approximately ($1,902,000) and an increase in accounts receivable of approximately ($1,070,000). These cash flows used by operations were offset, in part, by a reduction to incremental deferred customer acquisition costs of approximately $864,000 and a decrease in other assets of approximately $465,000. Net cash provided by operating activities was approximately $8,099,000 for the year ended December 31, 2005 compared to net cash provided by operating activities of $14,149,000 for the year ended December 31, 2004, a decrease of approximately ($6,050,000). The decrease in cash provided by operations was primarily the result an increase in the net loss of approximately ($10,615,000) offset, in part, by an increase in depreciation and amortization of approximately $5,559,000; and a decrease in accounts payable of approximately ($1,414,000).
Net cash used in investing activities was approximately ($8,613,000) for the year ended December 31, 2006 compared to approximately ($16,348,000) for the same period of 2005, a decrease in net cash used of approximately $7,735,000. The decrease in net cash used in investing activities was primarily due to a reduction in business acquisitions, net of cash acquired, of approximately $22,473,000 and the absence of a reimbursement of the remaining attrition guarantees withheld as part of the final settlement of the PSI acquisition of approximately $1,427,000 made in 2005. These decreases in net cash used were partially offset by a decrease in repayment on dealer loans of approximately ($15,691,000). Net cash used in investing activities was approximately ($16,348,000) for the year ended December 31, 2005 compared to approximately ($76,766,000) for the year ended December 31, 2004, a decrease of approximately $60,418,000. The significant reduction in cash used in investing activities was primarily due to a reduction to business acquisitions, net of cash acquired, of approximately $42,402,000 and an increase in the repayment of loans to dealers of approximately $24,021,000 which was offset, in part, by a decrease in the proceeds from sale of customer contracts and accounts receivable of approximately ($4,123,000) and the reimbursement of the remaining attrition guarantees withheld as part of the final settlement of the PSI acquisition of approximately ($1,427,000).
Net cash used in financing activities was approximately ($329,000) for the year ended December 31, 2006 compared to the year ended December 31, 2005 of approximately ($7,067,000), a change of approximately $6,738,000. The decrease in cash used in financing activities was due primarily to the absence of any repayment of long-term debt and the purchase of treasury stock which resulted in a use of funds in 2005 of approximately $5,225,000 and approximately $1,000,000, respectively. Net cash used by financing activities was approximately ($7,067,000) for the year ended December 31, 2005 compared to cash provided by financing activities of approximately $58,736,000 for the year ending December 31, 2004, or a change of approximately ($65,803,000). The increased use of funds in financing activities was primarily due to a decrease in proceeds from long-term debt issuance of ($125,000,000) and the purchase of treasury stock of approximately ($1,000,000) offset, in part, by a reduction in repayments on long-term debt and capital lease obligations of approximately $55,247,000 and a decrease in debt issuance costs of approximately $4,950,000.
The balance sheet at December 31, 2006 reflects net working capital of approximately $7,525,000. As of December 31, 2006, we had recurring monthly revenue (“RMR”) of approximately $3,354,000 in our residential monitoring segment, approximately $993,000 in our commercial monitoring segment and approximately $3,079,000 (including inter-company recurring monthly revenue of approximately $452,000) in our wholesale monitoring segment. Total debt was $125,000,000 as of December 31, 2006. The balance sheet at December 31, 2005 reflects net working capital of approximately $9,066,000. As of December 31, 2005, we had recurring monthly revenue (“RMR”) of approximately $3,750,000 in our residential monitoring segment, approximately $1,025,000 in our commercial monitoring segment and approximately $2,968,000 (including inter-company recurring monthly revenue of approximately $399,000) in our wholesale monitoring segment. Total debt was $125,000,000 as of December 31, 2005.
On November 16, 2004, we completed a private offering of $125 million aggregate principal amount of 12% Senior Secured Notes due November 15, 2011. The proceeds of this offering, net of issuance costs, were approximately $120.1 million.
On November 16, 2004, we entered into the LaSalle Credit Facility with LaSalle Bank. The maximum amount available of $30 million is limited to 10.0x RMR of eligible retail alarm contracts. The interest rate initially is LIBOR plus 3.50%. The minimum fixed charge coverage ratio is 2.0:1. There was no outstanding balance as of December 31, 2006.
Our capital expenditures anticipated over the next twelve months include equipment and software of approximately $5,836,000. In addition, our strategy calls for us to purchase monitoring contracts at an aggregate cost of approximately $10,000,000.
As part of the NACC and FSS Acquisitions, we agreed to assume obligations to provide open lines of credit to Dealers, subject to the terms of the agreements with the Dealers as of the date of purchase. We intend to fund these commitments with available funds and available capacity under the $30.0 million LaSalle Credit Facility. At December 31, 2006, open lines of credit to these Dealers were approximately $5.0 million.
If IASG’s Board of Directors withdraws or modifies the Merger Agreement in a manner adverse to Protection One or its recommendation of the merger, the Company may be subject to a $7.5 million payment to Protection One consisting of a termination fee and reimbursement of expenses.
We believe that our existing cash, cash equivalents, LaSalle Credit Facility and RMR are adequate to fund our operations for at least the next twelve months.
Recent Accounting Pronouncements
In February 2007, the FASB issued Statement of Financial Accounting Standards No. 159,“The Fair Value Option for Financial Assets and Financial Liabilities.” This statement permits entities to choose to measure many financial instruments and certain other items at fair value. The Company will be required to apply the guidance contained in FAS No. 159 beginning with financial statements for the year ended December 31, 2008 and has not yet determined the effect that adoption will have on the financial statements.
In September 2006, the SEC staff issued Staff Accounting Bulletin No. 108, “Considering the Effects of Prior year Misstatements when Quantifying Misstatements in Current year Financial Statements.” SAB 108 was issued in order to eliminate the diversity of practice surrounding how public companies quantify financial statement misstatements. The Company was required to apply the guidance contained in SAB 108 beginning with financial statements for the year ending December 31, 2006. We adopted SAB 108 for fiscal 2006 and it did not have any effect on our financial statements.
In September, 2006, the FASB issued Statement of Financial Accounting Standards No. 157 Fair Value Measurements. This statement defines fair value, establishes a framework for measuring fair value in generally accepted accounting principles (GAAP) and expands disclosures about fair value measurements. This Statement applies under other accounting pronouncements that require or permit fair value measurements. The Company will be required to apply the guidance contained in FAS No. 157 beginning with financial statements for the year ended December 31, 2008 and has not yet determined the effect that adoption will have on the financial statements.
In June 2006, the FASB issued Interpretation No. 48 (“FIN 48”), “Accounting for Uncertainty in Income Taxes, an interpretation of FASB Statement No. 109,”which seeks to reduce the diversity in practice associated with the accounting and reporting for uncertainty in income tax provisions. This interpretation prescribes a comprehensive model for the financial statement recognition, measurement, presentation and disclosure of uncertain tax positions taken or expected to be taken in income tax returns. FIN 48 is effective for fiscal years beginning after December 31, 2006 and the Company will adopt the new requirements in the first quarter of 2007. The Company is currently assessing the impact of FIN 48 but does not expect that the adoption of the standard will have any significant or material impact on its financial statements.
In March 2006, the FASB issued Statement of Financial Accounting Standards No. 156, Accounting for Servicing of Financial Assets, an amendment of FASB Statement No. 140 (“FAS No. 156”). This Standard amends FASB Statement No. 140, Accounting for Transfers and Servicing Assets and Extinguishment of Liabilities, with respect to the accounting for separately recognized servicing assets and servicing liabilities. This Standard requires an entity to recognize a servicing asset or servicing liability each time it undertakes an obligation to service a financial asset by entering into a servicing contract when there is a related sale of financial assets, certain transfers, or assumption of an obligation to service a financial asset that does not relate to the financial assets of the servicer. We adopted this Statement on January 1, 2007 and it did not have any effect on our financial statements.
In February 2006, the FASB issued Statement of Financial Accounting Standards No. 155, Accounting for Certain Hybrid Financial Instruments, an amendment of FASB statements No. 133 and 140 (“FAS No. 155”). This Standard resolves and clarifies the accounting and reporting for certain financial instruments including, hybrid financial instruments with embedded derivatives, interest-only strips, and securitized financial instruments. FAS No. 155 is effective for all financial instruments acquired or issued after the beginning of an entity’s first fiscal year that begins after September 15, 2006. The Company will be required to adopt this Standard on January 1, 2007 and it has not determined the effect that adopting FAS No. 155 will have on the financial statements.
Disclosures About Market Risk
Our exposure to market risk is limited to interest income and expense sensitivity, which is affected by changes in the general level of interest rates. The primary objective of our investment activities is to preserve principal while at the same time maximizing the income we receive without significantly increasing risk. To minimize risk, we maintain our portfolio of cash, cash equivalents and short-term and restricted investments in a variety of interest-bearing instruments, including United States government and agency securities, high-grade United States corporate bonds, municipal bonds, mortgage-backed securities, commercial paper and money market accounts at established financial institutions. Due to the nature of our short-term and restricted investments, we believe that we are not subject to any material market risk exposure. We do not have any foreign currency risk. At December 31, 2006, we have no short-term investments and our cash and cash equivalents are invested in money market accounts.
Off Balance Sheet Arrangements
The Company is not a party to any off-balance sheet arrangements with the exception of commercial letters of credit totaling approximately $150,000. These letters of credit are collateralized with cash deposits which are included in restricted cash on our consolidated balance sheet.
Contractual Obligations and Commercial Commitments
The Company’s significant contractual obligations as of December 31, 2006 are approximately $205,991,000. Debt by year of maturity and future payments under operating and capital lease agreements and estimated interest expense are presented below.
Contractual Obligations | Payments due by Period | ||||||||||||||
Total | less than 1 year | 1-3 years | 4-5 years | After 5 years | |||||||||||
(in thousands) | |||||||||||||||
| Long-term debt | $ | 125,000 | $ | - | $ | - | $ | 125,000 | $ | - | |||||
| Capital leases | 836 | 321 | 392 | 123 | - | ||||||||||
| Operating leases | 4,340 | 1,573 | 1,688 | 641 | 438 | ||||||||||
| Interest expense (estimated)* | 75,815 | 15,689 | 30,096 | 30,030 | - | ||||||||||
| $ | 205,991 | $ | 17,583 | $ | 32,176 | $ | 155,794 | $ | 438 | ||||||
*Consists primarily of annual interest payments of approximately $15,000,000 on $125,000,000 million of senior secured notes bearing interest at 12.0%.
In August of 2006, the Company engaged Houlihan Lokey Howard & Zukin (“Houlihan Lokey”) as the financial advisor. Houlihan Lockey has been assisting the Company in negotiating the merger with Protection One, which is more fully disclosed in footnote 13 to the financial statements listed at Item 15 of this Form 10-K. The aggregate fees payable to Houlihan Lokey are estimated to be approximately $2.4 million excluding out-of-pocket expenses reimbursable by the Company, of which $450,000 has been paid and the balance of which is payable contingent upon the consummation of the merger. The Company incurred approximately $470,000 during 2006 for Houlihan’s service.
See item 7. Management’s Discussion and Analysis of Financial Condition and Results of Operation, Market Risk.
Our consolidated financial statements and supplementary data, together with the report of PricewaterhouseCoopers LLP, independent registered public accounting firm, are included elsewhere herein. See “Index to Financial Statements” on page F-1.
None.
Disclosure Controls and Procedures
The Company's management, including its Chief Executive Officer ,and its Chief Financial Officer, evaluated the effectiveness of the Company's disclosure controls and procedures (as defined in the Securities Exchange Act of 1934 “Exchange Act” Rules 13a-15(e) and 15d-15(e)) as of the end of the period covered by this Annual Report on Form 10-K. Based upon that evaluation, the Company’s management has concluded that as of December 31, 2006, the Company's disclosure controls and procedures were effective in ensuring that all material information required to be disclosed in reports that the Company files with or submits to the Securities and Exchange Commission ("SEC") is recorded, processed, summarized and reported within the time periods specified in the rules and the forms of the SEC, and that such information is accumulated and communicated to the Company’s management, as appropriate, to allow timely decisions regarding required financial disclosure.
Management’s Annual Report on Internal Control over Financial Reporting
Management of the Company is responsible for establishing and maintaining adequate internal control over financial reporting, as such term is defined in Rule 13a-15(f) under the Exchange Act. The Company's internal control over financial reporting is a process designed to provide reasonable assurance regarding the reliability of financial reporting and the preparation of financial statements for external purposes in accordance with generally accepted accounting principles ("GAAP"). The Company’s internal control over financial reporting includes those policies and procedures that:
| · | Pertain to the maintenance of records that, in reasonable detail, accurately and fairly reflect the transactions and dispositions of the assets of the Company; |
| · | Provide reasonable assurance that the transactions are recorded as necessary to permit preparation of financial statements in accordance with GAAP, and that receipts and expenditures of the Company are being made only in accordance with authorizations of management and directors of the Company; and |
| · | Provide reasonable assurance regarding the prevention or timely detection of unauthorized acquisitions, use, or disposition of the Company’s assets that could have a material effect on the financial statements. |
Because of its inherent limitations, internal control over financial reporting may not prevent or detect misstatements. Also, projections of any evaluation of effectiveness to future periods are subject to the risk that controls may become inadequate because of changes in conditions or that the degree of compliance with the policies or procedures may deteriorate.
The Company’s management, including the Company’s Chief Executive Officer and Chief Financial Officer, assessed the effectiveness of the Company’s internal control over financial reporting as of December 31, 2006. In making its assessment of the effectiveness of the Company’s internal control over financial reporting, management used the criteria set forth in Internal Control - Integrated Framework issued by the Committee of Sponsoring Organizations of the Treadway Commission (COSO). Based on that assessment, management concluded that, as of December 31, 2006, the Company's internal control over financial reporting is effective based on those criteria.
The Company's independent registered public accounting firm has audited management's assessment of the effectiveness of the Company's internal control over financial reporting as of December 31, 2006 as stated in their report herein.
Changes in Internal Control over Financial Reporting
As of December 31, 2005, we disclosed the following material weakness (noted below) in our internal control over financial reporting. A material weakness is a control deficiency, or combination of control deficiencies, that results in more than a remote likelihood that a material misstatement of the annual or interim financial statements will not be prevented or detected. We disclosed this material weakness in the first three quarters of fiscal 2006 and took steps to remediate it throughout fiscal 2006. As of December 31, 2006, we completed our testing of the design and operating effectiveness of the remediated controls and concluded that the following previously reported material weakness was remediated such that it no longer constituted a material weakness as of December 31, 2006 as described below:
The Company did not maintain effective controls over accounts receivable, revenue and deferred revenue accounts. Specifically, the Company’s controls were not designed and in place to ensure the completeness and accuracy of revenues recorded under standard or multiple billing arrangements. This control deficiency resulted in an audit adjustment to the 2005 annual consolidated financial statements. Additionally, this control deficiency could result in a misstatement of the aforementioned accounts that would result in a material misstatement of the annual or interim financial statements that would not be prevented or detected. Accordingly, management has determined that this control deficiency constitutes a material weakness.
The Company implemented and completed the following remediation steps during fiscal year 2006:
| · | The Company instituted new edit reports to facilitate the effective review of the completeness of customer monitoring contract set up in its retail revenue system. |
| · | The Company instituted a formal review process for all customer contract packages to ensure accuracy of data input into the retail revenue system. |
| · | The Company instituted a formal review of customer contract cancellations to ensure the cancellation is executed properly. |
| · | The Company instituted cut-off procedures to ensure revenues and deferred revenues are recorded in the proper period. |
| · | Various business performance reviews are performed by the Company to reduce exposures to material adjustments going undetected. |
| · | The Company converted one of the remaining three stand-alone revenue systems over to the corporate platform during fiscal year 2006. |
During the fourth quarter of 2006, we completed our testing and concluded that these newly implemented controls were effective. There were no changes to our internal controls over financial reporting during the fourth quarter of 2006, that materially affected, or are reasonable likely to materially affect, our internal control over financial reporting.
None.
PART III
The information contained under the caption “Election of Directors” to appear in the Company’s definitive proxy statement relating to the Company’s 2006 Annual Meeting of Stockholders, which definitive proxy statement will be filed with the Securities and Exchange Commission not later than 120 days after the end of the Company’s fiscal year covered by this report on Form 10-K (hereinafter referred to as the “Annual Meeting Proxy Statement”), is incorporated herein by reference.
The names of our executive officers and directors, together with a brief description of their employment histories, are provided below:
Name | Age | Position |
| Charles T. May | 62 | Acting President and Chief Executive Officer |
| Bruce E. Quay | 49 | Chief Operating Officer |
| Brian E. Shea | 48 | Executive Vice President |
| Robert B. Heintz | 51 | Executive Vice President-Monitoring COO |
| Michael T. Moscinski | 55 | Chief Financial Officer |
| Raymond C. Kubacki | 62 | Director |
| John W. Mabry | 69 | Non-Executive Chairman of the Board |
| Ralph S. Michael III | 52 | Director |
| Jason B. Mudrick | 32 | Director |
| Timothy J. Tully | 43 | Director |
| Arlene M. Yocum | 49 | Director |
Mr. May is our Acting President and Chief Executive Officer. He joined the Company in April 2006. He started his career in the alarm industry in 1961 at Federal Alarm Systems in Washington D.C. In 1967, Mr. May joined Wells Fargo Alarm Services as one of its earliest employees. He participated in or led over 30 acquisitions and held several titles including Manager of Government Sales and Services and Vice President of Engineering, Manufacturing and Product Sales. In 1980 Mr. May was a co-founder of National Guardian and served as Executive Vice President of Electronic Security. Over the next four years, Mr. May worked on the acquisitions of more than 45 companies in 9 major cities and eventually took the company public. From 1984-1994, Mr. May, as President, led Guardian Security in Detroit in acquiring 22 companies while increasing revenues to in excess of $50 million. In 1995, Mr. May purchased Smith Alarm Systems in Texas and served as CEO growing the business from 12,000 customers to over 75,000 customers and the 10th largest security company in the U.S. with approximately $3 million in Monthly Recurring Revenue, up from $550,000 in RMR before it was sold to Ameritech/SBC. Mr. May currently serves on the Board of Directors of Ackerman Security in Atlanta Georgia and the Board of Directors of IASG.
Mr. Quay is our Chief Operating Officer. He joined the Company in April 2005. Prior to serving in his current role, Mr. Quay was Executive Vice President and Principal of Aquatic Development Group (“ADG”), a privately held company servicing the aquatics industry through its project services and equipment systems divisions from 2003 to 2005. Prior to ADG, from 1990 to 2002, Mr. Quay held various senior level positions at Cookson Plastic Molding Group where he served as President and Chief Executive Officer from 1998 to 2002. Cookson Plastic Molding Group is a wholly owned subsidiary of Cookson Group, PLC, which is a global leader in the supply of plastic products to the material handling, pool construction, office equipment and lawn and garden markets. Prior to Cookson Plastic Molding Group, Mr. Quay held various senior level management positions with Heldor Industries, a leading national manufacturer and distributor of swimming pool products.
Mr. Shea has served as an Executive Vice President since March 2003. In this role, he heads our retail account acquisition and loan division, including portfolio management, due diligence, performance monitoring and collections. Additionally Mr. Shea serves as our Corporate Secretary and Insider Trading Compliance Officer. Prior to serving in his current role, he was our Chief Financial Officer and had served as the Chief Financial Officer of IASI and its predecessor companies since 1992. Prior thereto, he was Vice President of Finance/Controller of Hiland Park, a real estate development company. Prior to joining Hiland Park, he was an Analyst at Galesi Group and a Financial Manager for General Electric Corporation, where he graduated from GE's Financial Management Training Program.
Mr. Heintz has served as our Executive Vice President-Monitoring Services since February 2005. Prior to serving in his current role, he was our Vice President, Finance and Administration—Monitoring Services since January 2003. He was previously our Chief Financial Officer, a position he held since April 2000. Prior to joining IASG, he was Vice President and Chief Financial Officer of Monital Signal Corporation, from January 1997 to April 2000, which we acquired in April 2000. Before working for Monital, he was Vice President Finance & Information Services for Brownstone Studio, Inc., a garment cataloger and manufacturer, where he worked from 1994 to 1996. Before Brownstone, he spent 14 years with the Dun & Bradstreet Corporation where he held several finance and accounting positions.
Mr. Moscinski has served as our Chief Financial Officer since March 2003. Prior to serving in his current role, Mr. Moscinski served IASG and its predecessor companies in various financial positions since April 2002. Prior to joining IASG, he served as Vice President, Corporate Controller and Interim Chief Financial Officer for United Road Services, Inc., a public company based in Albany, New York, where he worked from 1998 through 2001. From 1987 to 1998, Mr. Moscinski was the Director of Corporate Accounting for National Micronetics, Inc. From 1976 to 1987, Mr. Moscinski was with KPMG International and its predecessor firms, where he was a Senior Manager in audit. Mr. Moscinski is a Certified Public Accountant and a member of the American Institute of Certified Public Accountants and the New York State Society of Certified Public Accountants.
Mr. Kubacki has served as a director since June 2004. Mr. Kubacki has been President and Chief Executive Officer of Psychemedics Corporation, a biotechnology company with a proprietary drug test product, since July 1991. He has also served as Chairman of the Board since November 2003. Prior to joining Psychemedics, he held senior management positions in marketing and operations with Reliance Electric Company and ACME Cleveland Corporation; and as an investment officer for Massachusetts Financial Services, a major mutual fund and investment management firm. He is also a trustee for the Center for Excellence in Education based in Washington, D.C.
Mr. Mabry has served as a director of IASG since March 2003 and as Chairman of the Board since April 2006. Mr. Mabry has approximately 35 years of experience in the alarm industry. In 1969 he founded and began building the American Alarm Company that was purchased by Honeywell in 1983. He remained with Honeywell through 1993 with responsibilities for operations, sales and business development. From 1993 to 2000, Mr. Mabry was President of Security Network of America. Mr. Mabry serves on numerous alarm industry associations' boards and was President of the National Burglary and Fire Alarm Association.
Mr. Michael has served as a director of IASG since January 2003. He has been President and Chief Operating Officer of the Ohio Casualty Insurance Company since July 2005. From 2003 to 2005, Mr. Michael served as Executive Vice President of U.S. Bank, N.A. and President of U.S. Bank-Oregon. From 1979 to 2002, Mr. Michael held management and executive positions with PNC Financial Services Group. He also currently serves as a board member of Key Energy Services Inc., Cincinnati Bengals Inc., Xavier University (OH) and Friedman, Billings, Ramsay Group, Inc. Mr. Michael is Chairman of the IASG Audit Committee.
Mr. Mudrick has served as a director of IASG since 2005. Mr. Mudrick was suggested as a board candidate by Contrarian Capital Management, LLC, an investment firm based in Greenwich, CT, which as of December 31, 2006 owned approximately 13.21% of the Company’s stock. Mr. Mudrick is a Portfolio Manager at Contrarian. Prior to joining Contrarian in 2001, Mr. Mudrick was an associate in the Mergers & Acquisitions Investment Banking Group at Merrill Lynch & Co from 2000 to 2001. Mr. Mudrick is admitted to the New York State Bar. Mr. Mudrick is a member of the Board of Directors of Safety-Kleen Holdco., Inc., a private company in the industrial waste services industry, and Salton Inc., a designer and marketer of a broad range of kitchen and home appliances that trades on the NYSE.
Mr. Tully has served as a director of IASG since January 2003. Mr. Tully is the managing member of Tully Capital Partners, LLC, a diversified private investment firm that he co-founded in 1997. Prior to Tully Capital Partners, Mr. Tully was President of Pioneer Investment Properties, which engaged in commercial real estate acquisitions/operations. He is a former Floor Official on the New York Options Exchange, where he traded equity and index options as an independent market maker. Mr. Tully serves as a board member on various charitable foundations and community based organizations. Mr. Tully is Chairman of the IASG Compensation Committee.
Ms. Yocum has served as a director of IASG since October 2005. Ms. Yocum has been Executive Vice President, Managing Executive of PNC Wealth Management and Institutional Investment Groups since 2003. From 2000 to 2003 Ms. Yocum was an Executive Vice President of the Institutional Investment Group of PNC Advisors. From 1993 to 2000 Ms. Yocum held management and executive positions with PNC Advisors. Ms Yocum is a Trustee and Vice President of the Philadelphia Community College Foundation and a member of American Bankers Association Wealth Management and Trust Conference Board. Ms. Yocum is Chairperson of the IASG Independent Committee and the Governance and Nominating Committee.
Committees of the Board
The Audit Committee appoints and provides for the compensation of the Company’s independent auditors; oversees and evaluates the work and performance of the independent auditors; reviews the scope of the audit; examines the results of audits and quarterly reviews; considers comments made by the independent auditors with respect to accounting procedures and internal controls and the consideration given thereto by the Company’s management; approves all professional services to be provided to the Company by its independent auditors; reviews internal accounting procedures and controls with the Company’s financial and accounting staff; oversees a procedure that provides for the receipt, retention and treatment of complaints received by the Company and of confidential and anonymous submissions by employees regarding questionable accounting or auditing matters; and performs related duties as set forth in applicable securities laws, NASDAQ corporate governance guidelines, and the Audit Committee charter. The Board functions pursuant to the Audit Committee charter adopted by the Board in August 2003.
The members of the Company’s Audit Committee are Messrs. Michael, Mabry, Tully and Kubacki. Mr. Ralph S. Michael III is the Audit Committee Chairman. The Audit Committee met eight (8) times during the fiscal year ended December 31, 2006. Each of Messrs. Michael, Mabry, Kubacki and Tully are independent Directors under the rules of the NASDAQ Stock Market. Each of the members of the Audit Committee are able to read and understand fundamental financial statements. While more than one member of the Company’s Audit Committee qualifies as an “audit committee financial expert” under Item 401(h) of Regulation S-K, Mr. Michael is the designated audit committee financial expert.
The Compensation Committee has such powers as may be assigned to it by the Board of Directors from time to time and is currently charged with, among other things, reviewing and recommending compensation packages for our officers, administering our Stock Option Plan and establishing and reviewing general policies relating to compensation and benefits of the Company’s employees. The Compensation Committee met ten (10) times during fiscal 2006.The Committee members during fiscal 2006 were Messrs. Tully, Mabry and Kubacki.
The Company has established a Governance and Nominating Committee that has the authority to identify individuals qualified to become board members and provide recommendations to the Board regarding potential new directors. This Committee also has the authority to develop and recommend to the board a set of corporate governance principles applicable to the Company and to oversee the evaluation of the Board and management. The Governance and Nominating Committee meet four (4) times during fiscal 2006. The Committee members during fiscal 2006 were Ms. Yocum and Messrs. Michael and Kubacki.
The Board of Directors also has an Independent Committee which held ten (10) meetings during fiscal 2006. The function of the Independent Committee is to assist the Board in reviewing and assessing strategic alternatives for the Company. The Independent Committee is chaired by Arlene M. Yocum, and its members include Raymond C. Kubacki, John W. Mabry, Ralph S. Michael III, Jason B. Mudrick and Timothy J. Tully.
All Directors attended in excess of 75% of the Board of Directors meetings and their assigned Committee meetings during fiscal 2006.
We have adopted a Code of Ethics for our officers, including our principal executive officer, principal financial officer, principal accounting officer, persons performing similar functions and directors.
Shareholders may request a free copy of the Code of Ethics and/or Annual Report from:
Integrated Alarm Services Group, Inc.
Attn: Investor Relations
99 Pine Street, 3rd floor
Albany, NY 12207
(518) 426-1515
Any amendment of our Code of Ethics or waiver thereof applicable to any of our principal executive officer, principal financial officer, principal accounting officer or persons performing similar functions will be disclosed on our website within 5 days of the date of such amendment or waiver. In the case of a waiver, the nature of the waiver, the name of the person to whom the waiver was granted and the date of the waiver will also be disclosed. A copy of our Code of Ethics is also available at our website at www.iasg.us.
The individuals who served as Integrated Alarm Services Group, Inc (the Company)’s Chief Executive Officer and Chief Financial Officer during 2006, as well as the Company’s three other most highly compensated executive officers during such year, are referred to as the “named executive officers.” These individuals are listed in the Summary Compensation Table. The following compensation discussion and analysis, executive compensation tables and related narrative describe the compensation awarded to, earned by or paid to the named executive officers for services provided to the Company in 2006, their outstanding equity awards at the end of 2006 and their compensatory arrangements with the Company.
Compensation Discussion and Analysis
Overview, Philosophy and Objectives of Executive Compensation
The Compensation Committee of the Company’s board of directors has authority to establish the salaries, bonuses and equity plan participation levels for the named executive officers. The Compensation Committee also has the authority to review and approve employment agreements, severance arrangements and retirement plans for the named executive officers, to oversee the design and administration of equity-based and incentive compensation plans and otherwise to review and approve the Company’s compensation plans. The compensation committee of the Board of Directors believes it is important to attract, retain, and motivate highly talented individuals at all levels of the organization through appropriately administered compensation plans and programs. These plans and programs should be consistent with industry practices, or otherwise companies representative of our size and complexity, and be tailored to align an employees performance with shareholder interests. In particular:
| · | The Compensation Committee bases compensation on the level of job responsibility, individual performance, and Company performance. As employees progress to higher levels in the organization, an increasing proportion of their pay is linked to Company performance and shareholder returns. |
| · | The Compensation Committee reflects in compensation the value of the job in the marketplace. To attract and retain a highly skilled work force, the Company must remain competitive with the pay of other premier employers who compete with us for talent. |
Components of Executive Compensation
Base Salary
The Compensation Committee considers various measures of Company and industry performance, including sales, earnings per share, attrition rates, total market value, and total shareholder return. These data points and metrics assist the Committee in exercising judgment in establishing total compensation ranges. The Compensation Committee does not assign these performance measures relative weights. Instead, the Compensation Committee makes a subjective determination after considering all such measures collectively.
The Compensation Committee also retains as needed, an independent compensation consultant to assist us in evaluating the executive compensation programs and in setting the chief executive officer’s compensation. The consultant reports directly to the committee. The use of an independent consultant provides additional assurance that our programs are reasonable and consistent with the Company’s objectives.
The Compensation Committee further retains independent legal counsel to assist us however the committee feels necessary, including but not limited to contract negotiations, terminations, and restructurings. The independent legal counsel reports directly to the committee.
Annual Bonus
The Company rewards the named executive officers for achieving annual company financial performance objectives and for demonstrating individual leadership. The Company believes that by providing a positive incentive and annual cash rewards, it motivates and retains qualified executives. The Company also believes that the allocation of base salary and annual incentive compensation opportunity for named executive officers generally represents a reasonable combination of fixed salary compared to variable incentive pay opportunity and reflects the Company’s goal of retaining and motivating its named executive officers. The Compensation Committee approved an informal bonus plan for 2006 to the named executive officers and other individuals based on the 2006 operating budget. No bonus was issued in 2006 due to the fact that the budget was not achieved.
Equity Compensation
Equity compensation has historically been offered to employees of the Company who are in positions to affect the Company’s long-term success through the formation and execution of its business strategies.
Stock options align employee incentives with shareholders because options have value only if the stock price increases over time. Our options, granted at the market price on the date of grant, or in the case of recent (2006) grants, at a premium to market price, ensure that employees are focused on long-term growth. In addition, options help retain key employees because they typically cannot be exercised for three years and, if not exercised, are forfeited if the employee leaves the Company voluntarily. The three-year vesting also helps keep employees focused on long-term performance. In determining the size of option grants, we consider job responsibility, individual performance, and the number of options previously granted.
The Compensation Committee granted 150,000 to Mr. Charles T. May, Acting President in April 2006 under the 2004 Stock Option Plan.
2003 Stock Option Plan
The 2003 Stock Option Plan ("SOP") permits the grant of options which may either be "incentive stock options", ("ISOs"), within the meaning of Section 422 of the Code or "non-qualified stock options" ("NSOs"), which do not meet the requirements of Section 422 of the Code. The total number of shares of our common stock that may be issued under the SOP may not exceed 150,000, subject to possible adjustment in the future as described below.
Within the limits of the SOP, the Compensation Committee has exclusive authority, among other things, to select those to whom options shall be granted, to determine the number of shares of common stock to be covered by each option, and to determine the other terms of each option, including, but not limited to, the exercise price and duration. Only employees may be granted ISOs.
The number of shares of common stock authorized for issuance under the SOP may be adjusted in the event our shares of common stock are changed into, or exchanged for cash, or securities of another entity through a reorganization, merger, recapitalization, reclassification, stock split, stock dividend, stock consolidation or combination or other similar transaction. In the event of the occurrence of any of the following, the Compensation Committee may adjust the number of authorized shares under the SOP, and the options issued under the SOP, as appropriate under the circumstances.
2004 Stock Option Plan
In June 2004 the stockholders approved the 2004 Stock Option Plan (“2004 Plan”). The adoption and approval of the 2004 Plan did not amend or modify the 2003 Plan or adversely affect rights under any outstanding stock options previously granted under the 2003 Plan.
| (a) | (b) | (c) | |||||||
Plan category | Number of securities to be issued upon exercise of outstanding options, warrants and rights | Weighted-average exercise price of outstanding options, warrants and rights | Number of securities remaining available for future issuance under equity compensation plans (excluding securities reflected in column (a)) | ||||||
Equity compensation plans approved by security holders - 2003 Plan | 122,500 | $ | 7.12 | 27,500 | |||||
Equity compensation plans approved by security holders - 2004 Plan | 296,000 | $ | 5.02 | 904,000 | |||||
The compensation committee has the full authority to select the recipients of awards granted under the 2004 Plan, to determine the type and size of awards, and to determine and amend the terms, restrictions and conditions of awards. Eligibility for awards under the 2004 Plan is limited to our key employees (including employees who are also officers and/or directors) and consultants as selected by the committee based on, among other things, their duties and the compensation committee’s assessment of their present and potential contributions to our success.
All Other Compensation
As described in footnote 3 to the Summary Compensation Table, other compensation to the named executive officers of the Company included: commuter travel expenses and related taxes; car allowances; company contributions under the Company 401(k) Profit Sharing Plan, which are available to employees generally. These payments and other benefits, the amounts of which are not material to the Company, provide additional compensation and benefits to the applicable named executive officers and, in the case of travel expenses and car allowances, in part defray certain personal expenses related to the applicable named executive officer’s employment.
Severance Arrangement and Change in Control
The Company believes that it should provide severance benefits to the named executive officers. The Company’s severance benefits for the named executive officers reflect, among other things, the fact that it may be difficult for a named executive officer to find comparable employment within a short period of time. The Company believes that its severance arrangements are an important element in the retention of the named executive officers.
The Company believes that it is important to protect the named executive officers in the event of a change in control. The employment agreement provisions regarding payment upon termination in connection with a change in control were intended to, among other things, encourage the named executive officers to enter into the new employment agreements and focus on the Company’s performance rather than other employment alternatives. On November 22, 2006, in anticipation of entering into a merger agreement with Protection One and to assure their continued service, the Company entered into new or amended employment agreements with several named executive officers.
Chief Executive Officer Compensation for 2006
In April of 2006, the Committee approved the hiring of Charles May as Acting President and Chief Executive Officer of the Company. Mr. May was hired for his proven ability to build and strengthen companies in this industry and assist the Company in achieving its short term and intermediate term objectives. Mr. May's annual compensation is $420,000 per year and is reflective of his responsibilities and experience.
On December 20, 2006, Integrated Alarm Services Group, Inc. (the "Company") entered into an agreement with Mr. May to assure his continued service. The Agreement will become effective upon the closing dates of certain transactions (the "Closing Date") contemplated by the merger agreement entered into on December 20, 2006 between Protection One, Inc.("P1"), the Company, and Tara Acquisition Corp. (the "Merger Agreement") pursuant to which the Company will be merged with Tara and become a wholly-owned subsidiary of P1. Under the agreement Mr. May will remain employed by the Company for a period of three months following the Closing Date, at a salary of $35,000 per month. In addition, within 30 days after the end of the three-month period, the Company will pay to Mr. May a bonus of $105,000. Additionally, Mr. May will continue to perform the functions he performed for the Company prior to the Closing Date, and such other duties as are reasonably requested by the Company in good faith. However, Mr. May will not be required to work more than two days per week.
Chief Financial Officer Compensation for 2006
On November 22, 2006, the Company entered into an amendment to an employment agreement dated March 1, 2006 with Michael T. Moscinski. Under the agreement, Mr. Moscinski will receive a base salary of $160,000 and is eligible to receive an annual bonus at the discretion of the compensation committee based on the achievement of one or more performance goals. This agreement also states that upon a change of control of the Company, all equity awards held by Mr. Moscinski will vest and become immediately exercisable.
On December 29, 2006, the Company entered into an agreement with Mr. Moscinski to assure his continued service. The agreement will become effective upon the closing dates of certain transactions (the "Closing Date") contemplated by the merger agreement entered into on December 20, 2006 between P1, the Company, and Tara Acquisition Corp. (the "Merger Agreement") pursuant to which the Company will be merged with Tara and become a wholly-owned subsidiary of P1. Once effective, Mr. Moscinski will remain employed by the Company for a period of six months following the Closing Date, or such lesser period as determined by the Company (the "Transition Period"). Under the agreement, Mr. Moscinski will continue to perform the functions he performed for the Company prior to the Closing Date, and such other duties as are reasonably requested by the Company in good faith.
During the Transition Period, the Company will pay Mr. Moscinski a monthly salary equal to the monthly salary payable to Mr. Moscinski by the Company immediately prior to the Closing Date. In addition, 6 months after the Closing Date, the Company will pay to Mr. Moscinski a bonus of $450,000. In the event that any payments by the Company to Mr. Moscinski would be subject to the excise tax imposed by Section 4999 of the Internal Revenue Code of 1986, as amended, then the amount payable under the agreement will be reduced to the maximum amount that could be paid to Mr. Moscinski without giving rise to such excise tax.
Chief Operating Officer Compensation for 2006
On November 22, 2006, the Company entered into an employment agreement with Mr. Quay, the Chief Operating Officer of the Company. The agreement provides for an eighteen-month term, which will extend automatically for additional eighteen-month periods unless sooner terminated in accordance with the terms of the agreement.
Under the employment agreement, Mr. Quay will receive a base salary of $360,000. In addition, he is eligible to receive an annual bonus at the discretion of the Compensation Committee based on the achievement of one or more performance goals. Upon termination without Cause, Mr. Quay will be entitled to receive his salary for the remaining portion of the employment term.
The agreement for Mr. Quay provides that upon a change in control (as defined below), the employment terms will automatically extend for an additional eighteen months. In addition, upon a termination of employment by the Company without cause within eighteen months following a change in control, (i) Mr. Quay will receive a lump sum payment $540,000; and (ii) all outstanding equity awards will automatically vest and become immediately exercisable. The payments and equity award acceleration will also be made if, within such eighteen-month period, the executive resigns as a result of (i) a change in the location of his principal place of employment of more than fifty miles, (ii) a reduction in his base salary of more than 10%, or, (iii) a failure by the successor entity to retain him in a management position. A "change in control" is generally defined as the acquisition of securities representing 30% or more of the Company's outstanding securities by a single shareholder, a change in the majority of the members of the Board over a twelve-month period, the occurrence of a corporate transaction after which the majority stockholders of the Company immediately prior to such transaction do not, immediately after the transaction, own more than 50% of the combined voting power of the Company, or the sale, liquidation or distribution of all or substantially all of the assets of the Company.
| Summary Compensation Table | |||||||||||||||||||||||||||
Name and Principal Position | Year | Salary ($) | Bonus ($) | Stock Awards ($) | Option Awards ($) (2) | Non Equity Incentive Plan Compensation ($) | Other Compensation ($) (3) | Total ($) | |||||||||||||||||||
| Charles T. May | (1) | ||||||||||||||||||||||||||
| Acting President and Chief Executive Officer | 2006 | 420,000 | - | - | 206,500 | - | - | 626,500 | |||||||||||||||||||
| Michael T. Moscinski | 2006 | 160,000 | - | - | - | - | 2,730 | 162,730 | |||||||||||||||||||
| Chief Financial Officer | |||||||||||||||||||||||||||
| Bruce E. Quay | 2006 | 360,000 | - | - | - | - | 2,730 | 362,730 | |||||||||||||||||||
| Chief Operating Officer | |||||||||||||||||||||||||||
| Brian E. Shea | 2006 | 170,000 | - | - | - | - | 2,730 | 172,730 | |||||||||||||||||||
| Executive Vice President | |||||||||||||||||||||||||||
| Robert B. Heintz | 2006 | 170,000 | - | - | - | - | 14,730 | 184,730 | |||||||||||||||||||
| Executive VP & COO, Criticom Int'l Corp. | |||||||||||||||||||||||||||
(1) Mr. May was employed effective April 24, 2006. His actual gross pay for 2006 was $274,615.
(2) The amount in Option Awards is the FAS 123R value of such awards. See footnote 7 of the form 10-K financial statements for the relevant assumptions used in the calculating the FAS 123R value.
(3) Other Compensation for 2006 includes the following items:
a) Company contribution under the Company’s 401(k) plan in the amount of $2,730 for Messers. Moscinski, Quay, Shea and Heintz;
| b) Car allowance in the amount $12,000 for Mr. Heintz. |
Grants of Plan-Based Awards | |||||||||
Name and Principal Position | Grant Date | All other stock awards: Number of shares of Stock or Units (#) | Closing Market Price on Date of Grant ($/Sh) | ||||||
| Charles T. May | 5/1/2006 (1 | ) | 50,000 | $ | 4.25 | ||||
| Acting President and Chief Executive Officer | 5/1/2006 (1 | ) | 100,000 | 5.25 | |||||
| Michael T. Moscinski | - | ||||||||
| Chief Financial Officer | |||||||||
| Bruce E. Quay | - | ||||||||
| Chief Operating Officer | |||||||||
| Brian E. Shea | - | ||||||||
| Executive Vice President | |||||||||
| Robert B. Heintz | - | ||||||||
| Executive VP & COO, Criticom Int'l Corp. | |||||||||
(1) Mr. May was awarded 150,000 shares of options on May 1, 2006 under the 2004 Stock Option Plan. The options are non-forfeitable and are exercisable as follows: (i) 100,000 shares were immediately exercisable on November 1, 2006; (ii) remaining 50,000 were immediately exercisable on December 1, 2006.
Outstanding Equity Awards at Fiscal Year-End | ||||||||||||||||||
Name | Number of Securities Underlying Unexercised Options (#) Unexercisable | Equity Incentive Plan Awards: Number of Securities underlying Unexercised Unearned Options (#) | Equity Incentive Plan Awards: Number of Securities Underlying Unexercised Unearned Options (#) | Weighted Average Option Exercise Price ($) | Option Expiration Date | |||||||||||||
| Charles T. May | 150,000 | (1) | - | - | 4.92 | 4/23/2009 | ||||||||||||
| Acting President and Chief Executive Officer | ||||||||||||||||||
| Michael T. Moscinski | 7,999 | (2) | 4,001 | - | 5.75 | 6/14/2014 | ||||||||||||
| Chief Financial Officer | ||||||||||||||||||
| Bruce E. Quay | 25,000 | (3) | 16,667 | - | 4.86 | 4/3/2015 | ||||||||||||
| Chief Operating Officer | ||||||||||||||||||
| Brian E. Shea | 5,333 | (2) | 2,667 | - | 5.75 | 6/14/2014 | ||||||||||||
| Executive Vice President | ||||||||||||||||||
| Robert B. Heintz | 5,333 | (2) | 2,667 | - | 5.75 | 6/14/2014 | ||||||||||||
| Executive VP & COO, Criticom Int'l Corp. | ||||||||||||||||||
| (1) | Mr. May was awarded 150,000 shares of options on May 1, 2006 under the 2004 Stock Option Plan. The options are non-forfeitable and are exercisable as follows: (i) 100,000 shares were immediately exercisable on November 1, 2006; (ii) remaining 50,000 were immediately exercisable on December 1, 2006. |
| (2) | These options were granted under the 2003 Stock Option Plan. |
| (3) | These options were granted under the 2004 Stock Option Plan upon Mr. Quay’s employment with the Company. One third for total options granted was immediately vested upon employment and one third became vested in 2006. The balance will be vested in April 2007. |
| Potential Payments Upon Termination or Change in Control | |||||||||||||||
Accrued Vacation ($) | Non Qualifying Termination (1) | Qualifying Termination | Qualifying Termination with Change in Control (2) (4) | ||||||||||||
| Charles T. May | - | - | - | - | (3) | ||||||||||
| Acting President and Chief Executive Officer | |||||||||||||||
| Michael T. Moscinski | 18,462 | 3,077 | 320,000 | 470,000 | (2), (3) | ||||||||||
| Chief Financial Officer | |||||||||||||||
| Bruce E. Quay | 24,321 | 6,923 | 510,000 | 540,000 | (2) | ||||||||||
| Chief Operating Officer | |||||||||||||||
| Brian E. Shea | 16,225 | 3,269 | 170,000 | 170,000 | (2) | ||||||||||
| Executive Vice President | |||||||||||||||
| Robert B. Heintz | 19,615 | 3,269 | 170,000 | 170,000 | (2) | ||||||||||
| Executive VP & COO, Criticom Int'l Corp. | |||||||||||||||
| (1) | These calculations assume that the named executive’s date of termination was December 23, 2006, which was the last date payroll was processed in 2006. A non-qualifying termination is any termination not qualifying as a qualifying termination, and includes a voluntary termination by the named executive without good reason, retirement, a termination by the Company for cause, or any termination on account of death or disability. The meanings of the terms “cause” and “good reason” for purposes of determining potential payments to named executive officers upon termination or a change in control are described below. "Cause" is generally defined as a material breach of the agreement, the executive's failure to perform his duties, conviction of or plea of nolo contendere to a felony or a crime involving dishonesty or moral turpitude, engaging in misconduct, negligence, dishonesty, violence or threat of violence, a breach of a written policy of the Company or its Code of Ethics or of governmental rules applicable to the Company, refusal to follow the lawful and good faith directions of the Board of Directors, competing with the Company, or any other misconduct which is injurious to the Company. Under the employment agreement for Mr. Moscinski, "Cause" is generally defined as misconduct which results in an adverse effect on the Company, disregard of instructions of the Board of Directors or neglect of duties which adversely affects the Company, competing with the Company, conviction of a felony, or the habitual abuse of alcohol or controlled substances. |
| (2) | The agreements for Messrs. Quay, Heintz and Shea provide that upon a change in control, the employment terms will automatically extend for an additional twelve months (or in the case of Mr. Quay, eighteen months). In addition, upon a termination of employment by the Company without cause within twelve months (or in the case or Mr. Quay, eighteen months) following a change in control, (i) the executives will receive a lump sum payment equal to one years' salary (or in the case of Mr. Quay, $540,000); and (ii) all outstanding equity awards will automatically vest and become immediately exercisable. The payments and equity award acceleration will also be made if, within such twelve or in the case of Mr. Quay, eighteen-month period, the executive resigns as a result of (i) a change in the location of his principal place of employment of more than fifty miles, (ii) a reduction in his base salary of more than 10%, or, (iii) in the case of Mr. Quay, a failure by the successor entity to retain him in a management position. A "change in control" is generally defined as the acquisition of securities representing 30% or more of the Company 's outstanding securities by a single shareholder, a change in the majority of the members of the Board over a twelve-month period, the occurrence of a corporate transaction after which the majority stockholders of the Company immediately prior to such transaction do not, immediately after the transaction, own more than 50% of the combined voting power of the Company, or the sale, liquidation or distribution of all or substantially all of the assets of the Company. |
The agreement for Mr. Moscinski provides that upon the occurrence of certain events, he will have the right to terminate his employment and receive a payment equal to two years' salary. The events generally include a failure by the Company to retain Mr. Moscinski as CFO, a material reduction in his duties and responsibilities, a change in the principal place of employment of more than thirty miles, a reduction in his base pay or benefits of greater than 10%, a failure by the Company to have a successor assume the agreement or a material breach of the agreement by the Company which is not cured within thirty days of written notice. In the event of a change of control of the Company, Mr. Moscinski shall be eligible to receive a one time cash bonus, equal on an after tax basis to two times his average compensation for the three previous fiscal years.
The agreements for Messrs. Heintz and Shea contain one year post-termination non-competition and non-solicitation covenants. The agreements for Messrs. Quay and Moscinski contain eighteen-month and two-year post-termination non-competition and non-solicitation covenants, respectively. In addition, they are prohibited at all times from disclosing confidential information about the Company.
| (3) | On December 20, 2006, the Company entered into an agreement with Mr. May. This agreement becomes effective upon the closing dates of certain transactions (the "Closing Date") contemplated by the merger agreement entered into on December 20, 2006 between Protection One, Inc.("P1"), the Company, and Tara Acquisition Corp. (the "Merger Agreement") pursuant to which the Company will be merged with Tara and become a wholly-owned subsidiary of P1. Under the agreement Mr. May will remain employed by the Company for a period of three months following the Closing Date, at a salary of $35,000 per month. In addition, within 30 days after the end of the three-month period, the Company will pay to Mr. May a bonus of $105,000. |
On December 29, 2006, the Company entered into an agreement with Mr. Moscinski. The agreement will become effective upon the closing date of certain transactions (the "Closing Date") contemplated by the merger agreement entered into on December 20, 2006 between P1, the Company, and Tara Acquisition Corp. (the "Merger Agreement") pursuant to which the Company will be merged with Tara and become a wholly-owned subsidiary of P1. In the event that the transactions set forth in the Merger Agreement are not consummated, the agreement with Mr. Moscinski will be void and without force or effect. Under the agreement, if it becomes effective, Mr. Moscinski waives any right of payment under his agreement with the Company dated November 22, 2006.
Once effective, under the agreement Mr. Moscinski will remain employed by the Company for a period of six months following the Closing Date, or such lesser period as determined by the Company (the "Transition Period"). Under the agreement, Mr. Moscinski will continue to perform the functions he performed for the Company prior to the Closing Date, and such other duties as are reasonably requested by the Company in good faith.
During the Transition Period, the Company will pay Mr. Moscinski a monthly salary equal to the monthly salary payable to Mr. Moscinski by the Company immediately prior to the Closing Date. In addition, 6 months after the Closing Date, the Company will pay to Mr. Moscinski a bonus of $450,000. In the event that any payments by the Company to Mr. Moscinski would be subject to the excise tax imposed by Section 4999 of the Internal Revenue Code of 1986, as amended, then the amount payable under the agreement will be reduced to the maximum amount that could be paid to Mr. Moscinski without giving rise to such excise tax.
The agreement contains a non-competition and non-solicitation covenant that applies, once the agreement is effective, during the Transition Period and for two years thereafter.
All of the agreements also state that upon a change of control of the Company, all equity awards will vest and become immediately exercisable. Under the Company’s stock option plans, an employee has 30 days upon termination of employment to exercise vested options. Since the Company’s stock has been trading significantly under the option grant price and due to the short time frame a former employee has to exercise the option, we assume a limited number of the options will be exercised.
Section 280G of the Code
Under the employment agreements with the named executive officers of the Company, in the event that any amounts or benefits paid to a named executive officer pursuant to his current employment agreement are subject to the excise tax imposed under Section 4999 of the Code, the Company will pay the named executive officer an additional amount to compensate him for that tax liability. In general, if the total amount of payments to an individual that are contingent upon a “change in control” (as defined in Section 280G of the Code) of the Company equals or exceeds three times the individual’s “base amount” (generally, the individual’s average annual compensation for the five (5) calendar years preceding the change in control), the payments may be treated as “parachute payments” under the Code. The portion of such payments that exceeds the individual’s “base amount” is non-deductible to the Company under Section 280G of the Code, and the individual is subject to a 20% excise tax on such amount under Section 4999 of the Code. Under existing employment agreements, the Company is obligated to make additional cash payments to the named executive officers to compensate them for the 20% excise tax so that they receive the same benefit from their awards as if such excise tax did not apply. These additional payments are nondeductible by the Company and constitute income to the executives, which requires further payment under the employment agreements to compensate the executives for the income tax incurred with respect to such payments. Non-deductible parachute payments generally reduce the $1 million deduction limitation under Section 162(m) of the Code, discussed above.
Each named executive officer’s employment agreement provides that he agrees to reduce the aggregate amount of any payments or benefits that constitute “parachute payments” under Section 280G of the Code to the extent necessary so that such payments and benefits do not equal or exceed three times the named executive officer’s “base amount” (and therefore are not subject to the excise tax imposed by Section 4999); provided, however, that a named executive officer is not required to make any such reduction if the reduction necessary to cause such payments and benefits not to equal or exceed three times his “base amount” is more than $100,000.
Section 409A of the Code
Section 409A of the Code sets forth specific requirements relating to the payment of deferred compensation to employees and other service providers. Deferred compensation payments that do not meet these requirements are generally taxed to the employee or service provider when they vest, and may also be subject to a 20% penalty tax, payable by the employee or service provider. The Company has structured payments under its executive compensation programs in a manner that is intended to meet the requirements of Code Section 409A.
| Compensation of Directors | |||||||||||||||||||
Name | Fees Earned or Paid in Cash ($) | Stock Awards ($ | ) | Option Awards ($) (1) | Non-Equity Incentive Plan Compensation | All Other Compensations | Total ($ | ) | |||||||||||
| John W. Mabry | 155,167 | - | 103,250 | - | - | 258,417 | |||||||||||||
| Raymond C. Kubacki | 78,125 | - | - | - | - | 78,125 | |||||||||||||
| Ralph S. Michael III | 75,625 | - | - | - | - | 75,625 | |||||||||||||
| Jason B. Mudrick | - | - | - | - | - | - | |||||||||||||
| Timothy J. Tully | 75,000 | - | - | - | - | 75,000 | |||||||||||||
| Arlene M. Yocum | 53,750 | - | - | - | - | 53,750 | |||||||||||||
(1) Stock Option represents the amortization under FAS 123R awarded in April 23, 2006. Mr. John W. Mabry was appointed as the non-executive Chairman of the Board. In connection with his appointment, the Board granted Mr. Mabry option to purchase (i) 25,000 shares of the Company at an exercise price of $4.25 per share and (ii) 50,000 shares of the Company at an exercise price of $5.25 per share. This stock option vested and become non-forfeitable on December 1, 2006 and shall become exercisable on April 23, 2007, the first anniversary of the date on which it was granted. The stock option shall automatically vest, to the extent not then vested, if his position as interim non-executive Chairman of the Board is terminated other than for just cause. The stock option will become fully exercisable, to the extent not exercisable, upon a "Change of Control" of the Company, as such term is defined in the Company's 2004 Stock Incentive Plan. His stock option, once vested, shall remain exercisable until April 23, 2009, the third anniversary of the date on which it was granted, except that it will be forfeited immediately, whether or not it is vested, if his position as interim non-executive Chairman of the Board is terminated for just cause. The stock option shall otherwise be subject to the terms of the 2004 Stock Incentive Plan and the Company's form of option agreement.
Director Fee Structure
| Annual Retainer | $ | 25,000 | |
| Annual Retainer-Non Executive Chairman | 140,000 | (1) | |
| Annual Retainer for Audit Committee Chair | 15,000 | ||
| Annual Retainer for Compensation Committee Chair | 5,000 | ||
| Annual Retainer for Govern/Nomination Committee Chair | 5,000 | ||
| Annual Retainer for Audit Committee Members | 5,000 | ||
| Annual Retainer for Compensation Committee Members | 3,500 | ||
| Annual Retainer for Govern/Nomination Committee Members | 3,500 | ||
| Attendance fee for each meeting | 1,000 |
(1) Amount paid in addition to base retainer
Compensation Committee Report
The compensation committee has reviewed and discussed the CD&A with management and, based on this review and discussion, recommended its inclusion in the annual report on Form 10-K.
The following table sets forth certain information, as of the date hereof, with respect to the beneficial ownership of the common stock by each director, each nominee to become a director and each executive named in the Summary Compensation Table and by all executive officers, directors and nominees to become our directors as of July 28, 2006, by each beneficial owner of more than 5% of the outstanding shares thereof as of March 16, 2007. As of the date hereof, we had 24,368,836 shares of our common stock outstanding. Pursuant to the rules and regulations of the Securities and Exchange Commission, shares of common stock that an individual or group has a right to acquire within 60 days pursuant to the exercise of options or warrants are deemed to be outstanding for the purposes of computing the percentage ownership of such individual or group, but are not deemed to be outstanding for the purposes of computing the percentage ownership of any other person shown in the table.
Name and Address of Beneficial Owner (1) | Number of Shares of Common Stock Beneficially Owned | Percentage of Outstanding Common Stock Beneficially Owned | ||||
| Charles T. May (9) | 150,000 | * | ||||
| Timothy M. McGinn (10) | 739,618 | 3.04% | ||||
| John W. Mabry (4) (8) | 98,500 | * | ||||
| Robert B. Heintz (5) | 6,333 | * | ||||
| Michael T. Moscinski (6) | 9,000 | * | ||||
| Brian E. Shea (5) | 8,333 | * | ||||
| Bruce E. Quay (2) | 50,000 | * | ||||
| Raymond C. Kubacki (3) | 7,000 | * | ||||
| Jason Mudrick (7) | - | * | ||||
| Ralph S. Michael, III (4) | 23,000 | * | ||||
| Timothy J. Tully (4) | 46,000 | * | ||||
| Arlene Yocum | 5,000 | * | ||||
| All Executive Officers and Directors as a | ||||||
| Group, 11 persons | 1,142,784 | 4.69% | ||||
5% Stockholders | ||||||
Contrarian Capital Management, LLC 411 West Putnam Avenue, Suite 225 Greenwich, CT 06830 | 3,217,970 | 13.21% | ||||
State Teachers Retirement System of Ohio 275 East Broad Street Columbus, OH 43215 | 3,000,000 | 12.31% | ||||
Franklin Mutual Advisers LLC 51 John F. Kennedy Parkway Short Hills, NJ 07078 | 2,619,600 | 10.75% | ||||
Greywolf Capital Management LP 4 Manhattanville Rd. Purchase, NY 10577 | 2,443,465 | 10.03% | ||||
Mariner Investment Group, Inc. 100 Federal Street, 29th Floor Boston, MA 02110 | 1,758,255 | 7.22% | ||||
____________________
* represents persons who beneficially own less than 1% of our common stock.
(1) Other than 5% stockholder the address of each of such individuals is c/o Integrated Alarm Services Group, Inc., One Capital Center, 99 Pine Street, 3rd Floor, Albany, New York, 12207.
(2) Includes 7,900 shares of common stock owned by his spouse. Includes 25,000 shares issuable upon the exercise of options.
(3) Includes 5,000 shares of common stock issuable upon the exercise of currently exercisable options.
(4) Includes 13,000 shares of common stock issuable upon the exercise of currently exercisable stock options.
(5) Includes 5,333 shares issuable upon the exercise of options out of a total of 8,000 options granted.
(6) Includes 8,000 shares issuable upon the exercise of options out of a total of 12,000 options granted.
(7) Jason Mudrick is with the Portfolio Manager of Contrarian Capital Management, LLC which beneficially owns 3,217,970 shares as of December 31, 2006.
(8) Includes 75,000 shares of common stock issuable upon the exercise of currently exercisable stock options.
(9) Includes 150,000 shares of common stock issuable upon the exercise of currently exercisable stock options.
(10) As of Form 4 filed on June 14, 2006.
Stock Performance Graph
The graph below provides an indicator of cumulative total return on the Company's common stock as compared with the Nasdaq Index and the S&P SmallCap 600 during the period from July 23, 2003 through the end of fiscal 2006. The graph shows the value, at the end of each fiscal quarter, of $100 invested in the Company's common stock or the indices on July 23, 2003 and assumes reinvestment of all dividends. The graph depicts the change in the value of the Company's common stock relative to the noted indices as of the end of each fiscal quarter and not for any interim period. Historical stock price performance is not necessarily indicative of future stock performance.
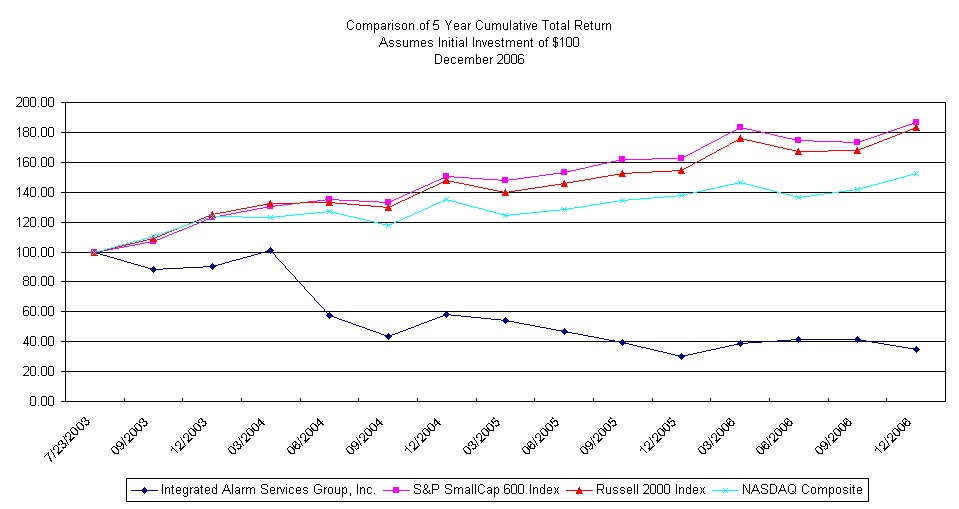
IASG cumulative total Return Versus Selected Equity Indices
| 7/23/2003 | 09/2003 | 12/2003 | 03/2004 | 06/2004 | 09/2004 | 12/2004 | 03/2005 | 06/2005 | 09/2005 | 12/2005 | ||||||||||||||||||||||||||
| IASG | Return | % | -11.41 | 1.75 | 12.35 | -43.46 | -23.52 | 32.93 | -7.29 | -13.75 | -14.58 | -23.47 | ||||||||||||||||||||||||
| Cum $ | 100.00 | 88.59 | 90.14 | 101.27 | 57.26 | 43.80 | 58.22 | 53.98 | 46.55 | 39.77 | 30.43 | |||||||||||||||||||||||||
| NASDAQ Composite | Return | % | 10.22 | 12.29 | -0.35 | 2.80 | -7.24 | 14.87 | -7.95 | 3.07 | 4.78 | 2.73 | ||||||||||||||||||||||||
| Cum $ | 100.00 | 110.22 | 123.77 | 123.33 | 126.78 | 117.61 | 135.09 | 124.35 | 128.17 | 134.30 | 137.96 | |||||||||||||||||||||||||
| Russell 2000 Index | Return | % | 9.07 | 14.53 | 6.27 | 0.47 | -2.86 | 14.09 | -5.34 | 4.32 | 4.69 | 1.13 | ||||||||||||||||||||||||
| Cum $ | 100.00 | 109.07 | 124.92 | 132.74 | 133.37 | 129.56 | 147.82 | 139.93 | 145.97 | 152.82 | 154.55 | |||||||||||||||||||||||||
| S&P 600 Index | Return | % | 7.08 | 14.77 | 6.22 | 3.60 | -1.37 | 13.00 | -2.07 | 3.94 | 5.38 | 0.39 | ||||||||||||||||||||||||
| Cum $ | 100.00 | 107.08 | 122.90 | 130.54 | 135.25 | 133.39 | 150.73 | 147.62 | 153.44 | 161.69 | 162.31 | |||||||||||||||||||||||||
IASG provides alarm monitoring services to related parties which are owned by former management of the Company who are also stockholders. Revenue earned from these alarm monitoring services was approximately $171,000, $122,000 and $100,000 for the years ended December 31, 2004, 2005 and 2006.
During November 2005, the Company borrowed approximately $2,500,000 from and entity controlled by stockholders of the Company for a seven day period at a 7.6% interest rate. This was done as the bank credit line was temporarily unavailable during a bank due diligence review. The total interest expense was approximately $4,000. The transaction was approved by the independent directors of the Company.
Suzanne Sweeney, the daughter of Mr. Few, Sr. (former Vice Chairman and President), is Director of Legal Affairs, and has received aggregate compensation of approximately $130,000, $136,000 and $130,000 for fiscal years 2004, 2005 and 2006, respectively.
Jeffrey Few, the son of Mr. Few, Sr. was Vice President of Sales and has received aggregate compensation of approximately $135,000, $133,000 and $98,000 for fiscal years 2004, 2005 and 2006, respectively. His employment with the Company was terminated during 2006.
Thomas Few, Jr., the son of Mr. Few, is Vice President of Sales and Marketing and has received aggregate compensation of approximately $127,000, $154,000 and $176,000 for fiscal years 2004, 2005 and 2006, respectively.
Robert W. Few, the son of Mr. Few, Sr. is Vice President of Operations—Criticom International Corp. and has received aggregate compensation of approximately $80,000, $96,000, and $96,000 for fiscal years, 2004, 2005 and 2006, respectively.
Kathleen Few, the daughter of Mr. Few, Sr. was National Manager of Dealer Care Centers and has received aggregate compensation of approximately $53,000, $70,000 and $52,000 for fiscal years 2004, 2005 and 2006, respectively. Her employment with the Company was terminated during 2006.
Mary Ann McGinn, the former wife of Mr. McGinn (Chairman of the Board and Chief Executive Officer), was Senior Vice President—Legal Affairs and remained a consultant to our Company through 2005. She has received aggregate compensation of approximately $132,000, $145,000 for fiscal years 2004 and 2005, respectively.
Policy Regarding Transactions with Affiliates
Although we believe the foregoing transactions were fair and in our best interests we did not have any formal policy in place. Our Board of Directors adopted a policy in May 2003, that any future transactions with affiliates, including without limitation, our officers, Directors, and principal stockholders, will be on terms no less favorable to us than we could have obtained from unaffiliated third parties. Any such transactions will be approved by a majority of our Board of Directors, including a majority of the independent and disinterested members, or, if required by law, a majority of our disinterested stockholders.
The Board of Directors appointed PricewaterhouseCoopers LLP as independent auditors to audit the financial statements of the Company for the fiscal year ending December 31, 2006.
Fiscal 2006 was the eighth year that PricewaterhouseCoopers LLP audited the Company's financial statements.
Independent Auditor Fee Information
The information presented below discloses the aggregated fees billed to us for each of the last two fiscal years by PricewaterhouseCoopers LLP.
Audit Fees
Fiscal 2006—$1,976,013. Fiscal 2005—$1,816,405.
This category includes fees for professional services rendered for the audit of our annual financial statements, the review of financial statements included in our Form 10-Q, the audit of our internal control over financial reporting as of December 31, 2006 and 2005, and services that are normally provided by the accountant in connection with statutory and regulatory filings or engagements.
Audit Related Fees
The Company was also billed by PricewaterhouseCoopers LLP $215,582 during 2006 for due diligence services rendered related to the merger more fully disclosed in footnote 13 to the financial statements listed at Item 13 of this Form 10-K.
Tax Fees
Fiscal 2006—$227,325. Fiscal 2005—$203,120.
This category includes fees for professional services that are rendered for tax compliance, tax advice, and tax planning. The nature of the services comprising the fees disclosed in this category are tax return preparation.
All Other Fees
There were no other fees for products and services that are not disclosed in the other categories of this section.
PART IV
(a) The following documents are filed as a part of this report:
1. The financial statements listed on the accompanying Index to Financial Statements on page F-1.
2. Financial statement schedules
Schedules have been omitted since they are either not required, are not applicable or the required information is shown in the consolidated financial statements or related notes.
3. The following Exhibits:
Exhibit Description
Exhibit No.
| 2.1 | (1) | Merger Agreement by and between KC Alarm Services Group (Delaware Corporation) and the registrant |
| 2.2 | Stock Purchase Agreement dated as of December 15, 2003 between Integrated Alarm Services Group, Inc. and Lane Industries, Inc. (incorporated by reference to Exhibit 99.1 to the Current Report on Form 8-K filed by IASG dated December 22, 2003) | |
| 2.3 | Purchase Agreement with Wells Fargo Bank, N.A., as trustee for the initial purchasers dated November 16, 2004 (incorporated by reference to Exhibit 2.11 to our annual report on Form 10-K for the year ended December 31, 2004 filed on June 13, 2005) | |
| 2.4 | Agreement and Plan of Merger among Protection One, Inc., Tara Acquisition Corp. and Integrated Alarm Services Group, Inc. dated as of December 20, 2006 (Incorporated by reference to Exhibit 2.1 on Form 8-K filed by Protection One Inc. on December 21, 2006 (SEC File No. 1-2181)) | |
| 3.1 | (1) | Certificate of Incorporation of registrant |
| 3.1(a) | (1) | Certificate of Amendment to the Certificate of Incorporation |
| 3.2 | (1) | Amendment to Certificate of Incorporation of registrant |
| 3.3(a) | (1) | Amended and Restated By-Laws of registrant |
| 4.1 | (3) | Indenture dated as of November 16, 2004 among Registrant, Additional Registrants and the Trustee relating to the 12% Senior Secured Notes due 2011 |
| 4.2 | (3) | Registration Rights Agreement among Additional Registrants, Registrant and certain Initial Purchasers named therein, dated as of November 16, 2004 |
| 4.3 | (3) | Security Agreement among LaSalle National Bank Association, Registrant and certain Additional Registrants dated as of November 16, 2004 (without schedules or exhibits) |
| 4.4 | (3) | Security Agreement among the Trustee, Registrant and the Additional Registrants dated as of November 16, 2004 (without schedules or exhibits) |
Exhibit No.
| 4.5 | (3) | Intercreditor Agreement among the Trustee, LaSalle National Bank Association and Registrant, dated as of November 16, 2004 |
| 4.6 | (3) | Form of Senior Secured Note due 2011 |
| 4.7 | (3) | Pledge Agreement by and among the Registrant, Madison Protection Inc. and LaSalle Bank National Association, dated November 16, 2004 (without schedule). |
| 4.8 | (3) | Pledge Agreement by and among the Registrant, Madison Protection Inc. and Wells Fargo Bank, N.A., dated November 16, 2004 (without schedule) |
| 10.1** | (1) | 2003 Stock Option Plan |
| 10.2** | (1) | Amended and Restated Employment Agreement by and between the registrant and Timothy M. McGinn |
| 10.3** | (1) | Employment Agreement by and between the registrant and Thomas J. Few, Sr. |
| 10.4** | Amended and Restated Employment Agreement by and between registrant and Michael T. Moscinski (incorporated by reference to Exhibit of the same number to the Current Report on Form 8-K filed by IASG dated as of November 27, 2006) | |
| 10.5** | Employment Agreement by and between the registrant and Brian E. Shea (incorporated by reference to Exhibit 10.3 to the Current Report on Form 8-K filed by IASG dated as of November 27, 2006) | |
| 10.6** | Employment Agreement by and between the registrant and Robert B. Heintz (incorporated by reference to Exhibit 10.2 to the Current Report on Form 8-K filed by IASG dated as of November 27, 2006) | |
| 10.7** | Employment Agreement by and between the registrant and Bruce E. Quay (incorporated by reference to Exhibit 10.1 to the Current Report on Form 8-K filed by IASG dated as of November 27, 2006) | |
| 10.8 | (1) | Lease Agreement between the registrant and Pine Street Associates, LLC for the Albany, New York Office space |
| 10.11** | Transitional Service Agreement dated December 20, 2006 between the company and Charles T. May (incorporated by reference to Exhibit 99.1 to the Current Report on Form 8-K filed by IASG dated as of December 20, 2006) | |
| 10.12** | Transitional Service Agreement dated December 29, 2006 between the company and Michael T. Moscinski (incorporated by reference to Exhibit 99.1 to the Current Report on Form 8-K filed by IASG dated as of December 29, 2006) | |
| 10.13 to 10.17 | Not Used | |
| 10.18 | (1) | Installing company Monitoring Receivable Financing Agreement by and between the registrant and M&S Partners |
| 10.19 | (1) | Receivable Financing Purchase Agreement between McGinn, Smith Acceptance Corp., Pointe Bank, and King Trust 01 |
| 10.20** | (1) | Form of Indemnification Agreement between registrant and member of the Board of Directors |
| 10.21 to 10.22 | Not Used | |
| 10.23** | 2004 Stock Incentive Plan (incorporated by reference to Appendix A to the Definitive Proxy Statement filed by IASG dated April 29, 2004) | |
| 10.24 | (3) | Mortgage in favor of LaSalle National Bank Association dated as of November 16, 2004 |
| 10.25 | (3) | Second Mortgage in favor of Trustee dated as of November 16, 2004 |
Exhibit No.
| 10.26 | (3) | Revolving Credit Facility Credit Agreement by and among Integrated Alarms Services Group, Inc., Criticom International Corporation, Monital Signal Corporation, Integrated Alarm Services, Inc., Payne Security Group, LLC, American Home Security, Inc. and the Guarantors Party Hereto and The Banks Party Hereto and LaSalle Bank National Association, as Agent dated November 16, 2004 |
(1) Incorporated by reference to Exhibit of same number to the Registration Statement on Form S-1 (Registration Number 333-101159)
(2) Incorporated by reference to Exhibit of the same number to our annual report filed on Form 10-K for the year ended
December 31, 2003 filed on March 30, 2004
| (3) | Incorporated by reference to Exhibit of the same number to our annual report or Form 10-K for the year ended December 31, 2004 filed on June 13, 2005 |
** Constitutes a management contract or compensatory plan or arrangement required to be filed or incorporated by reference as an Exhibit to this report pursuant to item 15(c) of Form 10-K
INTEGRATED ALARM SERVICES GROUP, INC.
INDEX
| Page (s) | ||
| Report of Independent Registered Public Accounting Firm | F-2 | |
| Financial Statements | ||
Report of Independent Registered Public Accounting Firm
To the Board of Directors and Shareholders of
Integrated Alarm Services Group, Inc.:
We have completed integrated audits of Integrated Alarm Services Group, Inc.’s consolidated financial statements and of its internal control over financial reporting as of December 31, 2006, in accordance with the standards of the Public Company Accounting Oversight Board (United States). Our opinions, based on our audits, are presented below.
Consolidated financial statements
In our opinion, the consolidated financial statements listed in the index appearing under Item 15(a)(1) present fairly, in all material respects, the financial position of Integrated Alarm Services Group, Inc. and its subsidiaries at December 31, 2006 and 2005, and the results of their operations and their cash flows for each of the three years in the period ended December 31, 2006 in conformity with accounting principles generally accepted in the United States of America. These financial statements are the responsibility of the Company’s management. Our responsibility is to express an opinion on these financial statements based on our audits. We conducted our audits of these statements in accordance with the standards of the Public Company Accounting Oversight Board (United States). Those standards require that we plan and perform the audit to obtain reasonable assurance about whether the financial statements are free of material misstatement. An audit of financial statements includes examining, on a test basis, evidence supporting the amounts and disclosures in the financial statements, assessing the accounting principles used and significant estimates made by management, and evaluating the overall financial statement presentation. We believe that our audits provide a reasonable basis for our opinion.
As discussed in Note 7 to the consolidated financial statements, the Company changed the manner in which it accounts for share-based compensation in 2006.
Internal control over financial reporting
Also, in our opinion, management's assessment, included in Management’s Annual Report on Internal Control over Financial Reporting appearing under Item 9A, that Integrated Alarm Services Group, Inc. maintained effective internal control over financial reporting as of December 31, 2006, based on criteria established in Internal Control - Integrated Framework issued by the Committee of Sponsoring Organizations of the Treadway Commission (COSO), is fairly stated, in all material respects, based on those criteria. Furthermore, in our opinion, the Company maintained, in all material respects, effective internal control over financial reporting as of December 31, 2006, based on the criteria established in Internal Control-Integrated Framework issued by COSO. The Company's management is responsible for maintaining effective internal control over financial reporting and for its assessment of the effectiveness of internal control over financial reporting. Our responsibility is to express opinions on management's assessment and on the effectiveness of the Company's internal control over financial reporting based on our audit. We conducted our audit of internal control over financial reporting in accordance with the standards of the Public Company Accounting Oversight Board (United States). Those standards require that we plan and perform the audit to obtain reasonable assurance about whether effective internal control over financial reporting was maintained in all material respects. An audit of internal control over financial reporting includes obtaining an understanding of internal control over financial reporting, evaluating management's assessment, testing and evaluating the design and operating effectiveness of internal control, and performing such other procedures as we consider necessary in the circumstances. We believe that our audit provides a reasonable basis for our opinions.
A company’s internal control over financial reporting is a process designed to provide reasonable assurance regarding the reliability of financial reporting and the preparation of financial statements for external purposes in accordance with generally accepted accounting principles. A company’s internal control over financial reporting includes those policies and procedures that (i) pertain to the maintenance of records that, in reasonable detail, accurately and fairly reflect the transactions and dispositions of the assets of the company; (ii) provide reasonable assurance that transactions are recorded as necessary to permit preparation of financial statements in accordance with generally accepted accounting principles, and that receipts and expenditures of the company are being made only in accordance with authorizations of management and directors of the company; and (iii) provide reasonable assurance regarding prevention or timely detection of unauthorized acquisition, use, or disposition of the company’s assets that could have a material effect on the financial statements.
Because of its inherent limitations, internal control over financial reporting may not prevent or detect misstatements. Also, projections of any evaluation of effectiveness to future periods are subject to the risk that controls may become inadequate because of changes in conditions, or that the degree of compliance with the policies or procedures may deteriorate.
PricewaterhouseCoopers LLP
Albany, New York
March 16, 2007
INTEGRATED ALARM SERVICES GROUP, INC. AND SUBSIDIARIES
As of December 31, | |||||||
2005 | 2006 | ||||||
(in thousands, except for share data) | |||||||
Assets | |||||||
| Current assets: | |||||||
| Cash and cash equivalents | $ | 16,239 | $ | 13,664 | |||
| Current portion of notes receivable | 6,108 | 4,154 | |||||
| Accounts receivable less allowance for doubtful | |||||||
| accounts of $847 in 2005 and $483 in 2006 | 5,158 | 5,673 | |||||
| Inventories | 1,477 | 1,378 | |||||
| Prepaid expenses | 1,084 | 1,533 | |||||
| Due from related parties | 87 | 159 | |||||
| Total current assets | 30,153 | 26,561 | |||||
| Property and equipment, net | 7,843 | 8,094 | |||||
| Notes receivable net of current portion and allowance | |||||||
| for doubtful accounts of $246 in 2005 and $302 in 2006 | 10,085 | 6,333 | |||||
| Dealer relationships, net | 33,000 | 28,475 | |||||
| Customer contracts, net | 80,532 | 70,003 | |||||
| Deferred customer acquisition costs, net | 7,874 | 8,314 | |||||
| Goodwill | 94,919 | 26,233 | |||||
| Debt issuance costs, net | 4,596 | 3,630 | |||||
| Assets of business transferred | - | 7,687 | |||||
| Other identifiable intangibles, net | 2,790 | 2,154 | |||||
| Restricted cash | 758 | 1,063 | |||||
| Other assets | 524 | 169 | |||||
| Total assets | $ | 273,074 | $ | 188,716 | |||
Liabilities and Stockholders' Equity | |||||||
| Current liabilities: | |||||||
| Current portion of capital lease obligations | $ | 350 | $ | 321 | |||
| Accounts payable | 2,306 | 1,190 | |||||
| Accrued expenses | 9,256 | 9,223 | |||||
| Current portion of deferred revenue | 7,693 | 6,399 | |||||
| Current portion of deferred revenue - bundled arrangments | 1,031 | 1,200 | |||||
| Other liabilities | 390 | 593 | |||||
| Due to related parties | 61 | 110 | |||||
| Total current liabilities | 21,087 | 19,036 | |||||
| Long-term debt | 125,000 | 125,000 | |||||
| Capital lease obligations, net of current portion | 461 | 515 | |||||
| Deferred revenue, net of current portion | 84 | 37 | |||||
| Deferred revenue - bundled arrangments, net of current portion | 4,746 | 5,312 | |||||
| Liabilities of business transferred | - | 1,043 | |||||
| Advance payment | - | 762 | |||||
| Deferred income taxes | 1,582 | 426 | |||||
| Total liabilities | 152,960 | 152,131 | |||||
| Commitments and Contingencies (note 10) | |||||||
| Stockholders' equity: | |||||||
| Preferred stock, $0.001 par value, authorized | |||||||
| 3,000,000 shares, none issued and outstanding | - | - | |||||
| Common stock, $0.001 par value, authorized | |||||||
| 100,000,000 shares, 24,681,462 shares issued | 25 | 25 | |||||
| Paid-in capital | 207,162 | 207,548 | |||||
| Accumulated deficit | (86,073 | ) | (169,988 | ) | |||
| Treasury stock - common, at cost, 312,626 shares | |||||||
| in 2005 and 2006 | (1,000 | ) | (1,000 | ) | |||
| Total stockholders' equity | 120,114 | 36,585 | |||||
| Total liabilities and stockholders' equity | $ | 273,074 | $ | 188,716 | |||
The accompanying notes are an integral part of the consolidated financial statements.
INTEGRATED ALARM SERVICES GROUP, INC. AND SUBSIDIARIES
CONSOLIDATED STATEMENTS OF OPERATIONS
Years ended December 31, | ||||||||||
2004 | 2005 | 2006 | ||||||||
(in thousands, except share and per share data) | ||||||||||
| Revenue: | ||||||||||
| Monitoring fees | $ | 24,103 | $ | 31,441 | $ | 31,854 | ||||
| Revenue from customer accounts | 50,759 | 56,843 | 52,096 | |||||||
| Related party monitoring fees | 171 | 122 | 100 | |||||||
| Service, installation and other revenue | 5,336 | 10,828 | 10,314 | |||||||
| Total revenue | 80,369 | 99,234 | 94,364 | |||||||
| Expenses: | ||||||||||
| Cost of revenue (excluding depreciation | ||||||||||
| and amortization) | 32,748 | 43,381 | 38,165 | |||||||
| Selling and marketing | 4,357 | 4,977 | 5,298 | |||||||
| Depreciation and amortization | 23,013 | 28,572 | 27,166 | |||||||
| (Gain) loss on sale or disposal of assets | (184 | ) | 1,032 | (124 | ) | |||||
| Loss on business transferred | - | - | 1,013 | |||||||
| General and administrative | 22,562 | 29,790 | 29,975 | |||||||
| Impairment of goodwill | - | - | 65,000 | |||||||
| Total expenses | 82,496 | 107,752 | 166,493 | |||||||
| Income (loss) from operations | (2,127 | ) | (8,518 | ) | (72,129 | ) | ||||
| Other income (expense): | ||||||||||
| Other expense, net | 11 | - | - | |||||||
| Amortization of debt issuance costs | (1,750 | ) | (1,080 | ) | (973 | ) | ||||
| Interest expense | (8,886 | ) | (17,009 | ) | (16,244 | ) | ||||
| Interest income | 1,453 | 4,838 | 4,418 | |||||||
| Income (loss) before income taxes | (11,299 | ) | (21,769 | ) | (84,928 | ) | ||||
| Income tax expense (benefit) | 418 | 563 | (1,013 | ) | ||||||
| Net income (loss) | $ | (11,717 | ) | $ | (22,332 | ) | $ | (83,915 | ) | |
| Basic and diluted income (loss) per share | $ | (0.47 | ) | $ | (0.91 | ) | $ | (3.44 | ) | |
| Weighted average number of common shares outstanding | 24,667,960 | 24,662,198 | 24,368,836 | |||||||
The accompanying notes are an integral part of the consolidated financial statements.
INTEGRATED ALARM SERVICES GROUP, INC. AND SUBSIDIARIES
CONSOLIDATED STATEMENTS OF STOCKHOLDERS' EQUITY
Common Stock | Common Stock | Paid-in | Accumulated | Treasury Stock | Total Stockholders' | ||||||||||||||||||||||||||||
Shares | Amount | Subscribed | Capital | Deficit | Shares | Amount | Equity | ||||||||||||||||||||||||||
(in thousands, except for share data) | |||||||||||||||||||||||||||||||||
| Balance, December 31, 2003 | 24,607,731 | $ | 25 | $ | 315 | $ | 205,087 | $ | (52,024 | ) | - | $ | - | $ | 153,403 | ||||||||||||||||||
| Net income (loss) | - | - | - | - | (11,717 | ) | - | - | (11,717 | ) | |||||||||||||||||||||||
| Issuance of contingent shares for Criticom | |||||||||||||||||||||||||||||||||
| purchase | 34,091 | - | (315 | ) | 315 | - | - | - | - | ||||||||||||||||||||||||
| Conversion of debt to stock | 39,640 | - | - | 275 | - | - | - | 275 | |||||||||||||||||||||||||
| Issuance of stock options to consultant | - | - | - | 13 | - | - | - | 13 | |||||||||||||||||||||||||
| Imputed interest expense associated with | |||||||||||||||||||||||||||||||||
| conversion feature of debt | - | - | - | 876 | - | - | 876 | ||||||||||||||||||||||||||
| Balance, December 31, 2004 | 24,681,462 | 25 | - | 206,566 | (63,741 | ) | - | - | 142,850 | ||||||||||||||||||||||||
| Net income (loss) | - | - | - | - | (22,332 | ) | - | - | (22,332 | ) | |||||||||||||||||||||||
| Issuance of shareholder options | - | - | - | 27 | - | - | - | 27 | |||||||||||||||||||||||||
| Puchase of treasury stock | - | - | - | - | - | 312,626 | (1,000 | ) | (1,000 | ) | |||||||||||||||||||||||
| Imputed interest expense associated with | |||||||||||||||||||||||||||||||||
| conversion feature of debt | - | - | - | 569 | - | - | - | 569 | |||||||||||||||||||||||||
| Balance, December 31, 2005 | 24,681,462 | 25 | - | 207,162 | (86,073 | ) | 312,626 | (1,000 | ) | 120,114 | |||||||||||||||||||||||
| Net income (loss) | - | - | - | - | (83,915 | ) | (83,915 | ) | |||||||||||||||||||||||||
| Stock-based compensation | - | - | - | 386 | 386 | ||||||||||||||||||||||||||||
| Balance, December 31, 2006 | 24,681,462 | $ | 25 | $ | - | $ | 207,548 | $ | (169,988 | ) | 312,626 | $ | (1,000 | ) | $ | 36,585 | |||||||||||||||||
The accompanying notes are an integral part of the consolidated financial statements.
INTEGRATED ALARM SERVICES GROUP, INC. AND SUBSIDIARIES
CONSOLIDATED STATEMENTS OF CASH FLOWS
Years ended December 31, | ||||||||||
2004 | 2005 | 2006 | ||||||||
(in thousands) | ||||||||||
| Cash flows from operating activities: | ||||||||||
| Net income (loss) | $ | (11,717 | ) | $ | (22,332 | ) | $ | (83,915 | ) | |
| Adjustments to reconcile net loss to net cash | ||||||||||
| provided by operating activities: | ||||||||||
| Depreciation and amortization | 23,013 | 28,572 | 27,166 | |||||||
| Amortization of deferred customer acquisition costs , net | 197 | 589 | 784 | |||||||
| Amortization of debt issuance costs | 1,750 | 1,080 | 973 | |||||||
| Interest expense - non-cash, notes | 876 | 569 | - | |||||||
| Stock options issued to consultant | 13 | - | - | |||||||
| Stock-based compensation | - | - | 386 | |||||||
| Provision for bad debts | 1,390 | 1,191 | 393 | |||||||
| Deferred income taxes | 353 | 470 | (1,156 | ) | ||||||
| Earned discount on notes receivable | (151 | ) | (1,350 | ) | (924 | ) | ||||
| Loss on business transferred | - | - | 1,013 | |||||||
| (Gain) loss on sale of customer contracts and accounts receivable | - | 132 | (50 | ) | ||||||
| (Gain) loss on sale or disposal of assets | (135 | ) | 900 | (68 | ) | |||||
| Gain on settlement of notes receivable | (49 | ) | - | - | ||||||
| Goodwill impairment | - | - | 65,000 | |||||||
| Changes in assets and liabilities, net of effects of | ||||||||||
| acquisitions and non-cash transactions: | ||||||||||
| Accounts receivable | (1,158 | ) | 171 | (899 | ) | |||||
| Inventories | (57 | ) | (243 | ) | 49 | |||||
| Prepaid expenses | 465 | 44 | (449 | ) | ||||||
| Other assets | (193 | ) | (254 | ) | 211 | |||||
| Deferred customer acquistion costs | (6,351 | ) | (3,631 | ) | (2,767 | ) | ||||
| Due from/to related parties | 12 | 41 | (23 | ) | ||||||
| Accounts payable and accrued expenses | 2,252 | 1,098 | (804 | ) | ||||||
| Deferred revenue | (1,006 | ) | (1,404 | ) | (1,024 | ) | ||||
| Deferred revenue-bundled arrangements | 4,997 | 2,226 | 2,268 | |||||||
| Other liabilities | (352 | ) | 230 | 203 | ||||||
| Net cash provided by operating activities | 14,149 | 8,099 | 6,367 | |||||||
| Cash flows from investing activities: | ||||||||||
| Purchase of property and equipment | (3,150 | ) | (2,873 | ) | (2,704 | ) | ||||
| Proceeds from sale of property and equipment | 177 | 57 | 84 | |||||||
| Purchase of customer contracts and dealer relationships | (14,713 | ) | (13,635 | ) | (13,303 | ) | ||||
| Proceeds from sale of customer contracts and accounts receivable | 4,596 | 473 | 370 | |||||||
| Financing of dealer loans | (4,670 | ) | (6,016 | ) | (6,996 | ) | ||||
| Repayment of dealer loans | 5,559 | 29,580 | 13,889 | |||||||
| Decrease (increase) in restricted cash | 343 | (1 | ) | (305 | ) | |||||
| Proceeds from net assets of business transferred | - | - | 385 | |||||||
| Reimbursement of attrition guarantee withhold related to PSI acquisition | - | (1,427 | ) | - | ||||||
| Business acquisitions, net of cash acquired | (64,908 | ) | (22,506 | ) | (33 | ) | ||||
| Net cash used in investing activities | (76,766 | ) | (16,348 | ) | (8,613 | ) | ||||
| Cash flows from financing activities: | ||||||||||
| Proceeds of borrowing on line of credit | - | 3,000 | - | |||||||
| Proceeds of long-term debt | 125,000 | - | - | |||||||
| Proceeds of borrowing from related party | - | 2,500 | - | |||||||
| Repayment of borrowing on line of credit | - | (3,000 | ) | - | ||||||
| Repayment of long-term debt | (60,242 | ) | (5,225 | ) | - | |||||
| Repayment of borrowing from related party | - | (2,500 | ) | - | ||||||
| Payments of obligations under capital leases | (718 | ) | (488 | ) | (329 | ) | ||||
| Debt issuance costs | (5,304 | ) | (354 | ) | - | |||||
| Purchase of treasury stock | - | (1,000 | ) | - | ||||||
| Net cash provided by (used in) financing activities | 58,736 | (7,067 | ) | (329 | ) | |||||
| Net increase (decrease) in cash and cash equivalents for the year | (3,881 | ) | (15,316 | ) | (2,575 | ) | ||||
| Cash and cash equivalents at beginning of year | 35,436 | 31,555 | 16,239 | |||||||
| Cash and cash equivalents at end of year | $ | 31,555 | $ | 16,239 | $ | 13,664 | ||||
| Supplemental disclosure of cash flow information: | ||||||||||
| Interest paid | $ | 5,486 | $ | 15,991 | $ | 16,492 | ||||
| Income taxes paid | $ | 417 | $ | 12 | $ | 145 | ||||
| Supplemental disclosure of non-cash items: | ||||||||||
| Net assets of business transferred | $ | - | $ | - | $ | 6,267 | ||||
| Debt converted to common stock | $ | 275 | $ | - | $ | - | ||||
| Notes receivable converted to customer contracts | $ | 2,441 | $ | 3,511 | $ | 725 | ||||
| Equipment financed under capital lease obligations | $ | 868 | $ | 264 | $ | 519 | ||||
The accompanying notes are an integral part of the consolidated financial statements.
INTEGRATED ALARM SERVICES GROUP, INC. AND SUBSIDIARIES
1. Description of Business
Integrated Alarm Services Group, Inc. and Subsidiaries (“IASG” or the “Company”) is the successor to KC Acquisition Corporation (“KC Acquisition”). In January 2003, KC Acquisition was re-incorporated by merging into IASG (Note 11). IASG provides alarm-monitoring services to independent alarm dealers and other telemetry customers on a contract basis. IASG operates three Underwriters Laboratories listed call centers that provide alarm receiving, processing, notification and related services for the monitoring of various types of alarm systems. In addition to its call centers, IASG maintains three regional dealer care locations designed to provide customized services to independent alarm dealers. Alarm monitoring services for subscribers of independent alarm dealers are outsourced to IASG. Subscribers contract with alarm dealers for services like alarm installation, maintenance and monitoring. The Company also performs installations and provides maintenance services to some of its customers.
Morlyn Financial Group (“Morlyn”), a limited liability company, was formed in May 2000 to assist independent alarm dealers in selling their retail portfolios to Integrated Alarm Services, Inc. (“IASI”), a related party of Morlyn. Morlyn provides due diligence and other related services for IASI and also earns fees from independent alarm dealers by providing billing services. In January 2003, Morlyn (formerly under common ownership) was acquired by IASG and became a wholly owned subsidiary.
Criticom-IDC (“Criticom”) is a wholly owned subsidiary of IASG. Criticom provides alarm-monitoring services to independent alarm dealers and other telemetry customers as well as Global Positioning Systems (“GPS”) technology that customers use to track various types of moveable assets. Criticom operates two Underwriters Laboratories listed call centers that provide alarm receiving, processing, notification and related services for the monitoring of various types of alarm systems.
Integrated Alarm Services, Inc. which was acquired on January 31, 2003 provides financing and capital to independent security alarm dealers throughout the United States. IASI provides working capital to the independent dealers necessary for the growth of the dealers’ business and financing for acquisitions. IASI has built a vertically integrated infrastructure, capable of handling all aspects of financing for independent alarm dealers including due diligence, billing and collections and the securitizing of alarm contracts assumed upon the foreclosure of loans to dealers for which it provides monitoring services (through IASG and other non-affiliated entities) to its customers.
Madison Security, Inc. (“Lane”) was acquired in December 2003. Its primary operating entity, Protection Service Industries, L.P. (“PSI”), installs, services and monitors commercial and residential alarm systems in Arizona, California and New Mexico.
2. Summary of Significant Accounting Policies
Principles of consolidated financial statements
The consolidated financial statements include the accounts of IASG and its subsidiaries from the date of their acquisition. All inter-company balances and transactions have been eliminated.
Use of estimates
The preparation of financial statements in conformity with accounting principles generally accepted in the United States of America requires management to make estimates and assumptions that affect the reported amounts of assets and liabilities and disclosure of contingent assets and liabilities at the date of the financial statements and reported amounts of revenues and expenses during the reporting period. Actual results could differ from those estimates.
Comprehensive income
No statement of comprehensive income has been included in the accompanying financial statements since the Company does not have any other comprehensive income to report.
Revenue recognition
IASI provides monitoring services to customers under contracts (including contracts acquired from dealers, other third parties or in business acquisitions or under foreclosure) with typical initial terms ranging from one to five years in duration. Such contracts are cancelable with a typical notice sixty days prior to the contract expiration date and contain no upfront fees or set up service. Most contracts automatically renew for a stated term if no customer action is taken. Revenue from customer contracts is recognized as services are provided over the related monitoring contract period when a written contract is in place and collection is probable. Services may be billed in advance on a monthly, quarterly or annual basis and amounts billed but not earned are recorded as deferred revenues. Revenues deferred are recognized on a straight line basis over the term of the service agreement as the alarm monitoring services are provided.
INTEGRATED ALARM SERVICES GROUP, INC. AND SUBSIDIARIES
NOTES TO CONSOLIDATED FINANCIAL STATEMENTS (continued)
2. Summary of Significant Accounting Policies (cont.)
The Company provides monitoring and billing services for a monthly fee for the subscribers of independent alarm dealers. The majority of the contracts are annual and contain no upfront fees or setup service. Monitoring and billing revenue is recognized as the monitoring and billing services are provided. Deferred revenue represents amounts billed and or collected in advance of services being provided. Revenues deferred are recognized over the term of the service agreement as the alarm monitoring and billing services are provided. Certain owned customer contacts are being monitored by third party monitoring service providers. The Company recognizes revenue from these contracts as the monitoring service is being provided.
Revenue from sales of installed equipment without monitoring is recognized upon the completed installation of the equipment.
The Company sells bundled arrangements to its commercial and residential customers which consist of equipment, installation services and ongoing monitoring service generally under three to five year contracted terms. These bundled arrangements generally require an upfront payment and recurring monthly revenue (RMR) payments over the term of the contract. Amounts assigned to each component are based on the component’s objectively determined fair value. If fair value can not be determined for a sale involving multiple elements, upfront non-refundable deposits are deferred and recognized over the expected life of the customer relationship. The RMR is recognized monthly over the term of the contract.
Interest income from dealer notes receivable is recognized using the interest method. Accrual of interest income on notes receivable is suspended when a dealer is contractually delinquent for one hundred twenty days or more. The accrual is resumed when the dealer becomes contractually current, and past due interest income is recognized at that time. Generally, IASI forecloses on delinquent accounts and takes ownership of the related contracts which collateralize the notes. Refunds are granted only upon request from the customer when a payment is made on a closed account or a payment was processed where the funds were not payable to IASI.
Cash and cash equivalents
Cash and cash equivalents include cash, certificates of deposit, and money market funds with original maturities of three months or less at the time of purchase. The carrying amount of cash and cash equivalents approximates fair value.
The Company maintains cash and cash equivalents in accounts with financial institutions, which at times may be in excess of the amount insured by the Federal Deposit Insurance Corporation.
Restricted cash and cash equivalents
Cash and cash equivalents restricted under the terms of the Company's debt obligations and letters of credit are classified to correspond with the classification of the related obligations.
Notes receivable
IASI which was acquired on January 31, 2003, makes loans to dealers, which are collateralized by the dealers’ portfolio of customer monitoring contracts. Loans to dealers are carried at the lower of the principal amount outstanding or the net realizable value of the portfolio underlying the loan. Loans are generally considered nonperforming if they are 120 days in arrears of contractual terms. Interest income stops accruing on non-performing loans. Management periodically evaluates the loan portfolio to assess the collectibility of dealer notes and adequacy of the allowance for loan losses. Management reviews certain criteria in assessing the adequacy of the allowance for loan losses including IASI’s past loan loss experience, known and inherent risks in the portfolio, adverse situations that may affect the borrower’s ability to repay, the estimated value of any underlying collateral and current economic conditions. Loan impairment is identified when a portfolio’s cash flow is materially below the minimum necessary to service the loan. In most cases, loans will be foreclosed and valued at the lower of cost (loan carrying value) or fair value of customer contracts using recent transaction prices and industry benchmarks. When a dealer becomes delinquent, the Company generally forecloses on and takes ownership of the portfolio of customer monitoring contracts resulting in an increase in customer contracts and a decrease in notes receivable.
INTEGRATED ALARM SERVICES GROUP, INC. AND SUBSIDIARIES
NOTES TO CONSOLIDATED FINANCIAL STATEMENTS (continued)
2. Summary of Significant Accounting Policies (cont.)
The Company’s notes receivable consisted of the following at December 31:
2005 | 2006 | ||||||
(in thousands) | |||||||
| Performing loans | $ | 17,693 | $ | 11,024 | |||
| Non-performing loans | 1,664 | 1,243 | |||||
| Total Loans | 19,357 | 12,267 | |||||
| Less: Reserves | (246 | ) | (302 | ) | |||
| Purchase Discount | (2,918 | ) | (1,478 | ) | |||
| Net loans | $ | 16,193 | $ | 10,487 | |||
At December 31, 2005 and 2006, we had non-performing loans aggregating approximately $1,664,000 and $1,243,000, respectively. During the year ended December 31, 2005, the Company negotiated the purchase of certain contracts from dealers resulting in a conversion of approximately $3,511,000 of notes to customer contracts. Additionally during 2005, a dealer repaid a note of approximately $17,890,000 prior to its maturity date. The collateral supported the carrying value and therefore no impairment charge was recorded. Currently the cash flows from the underlying collateral support the carrying value of the loans. However, if the cash flow from the underlying collateral deteriorates, it may result in a future charge to earnings.
As part of the acquisitions of Financial Security Services, Inc. (“FSS”) in 2005, the Company agreed to assume FSS’s obligations to provide open lines of credit to Dealers, subject to the terms of the agreements with the Dealers. At December 31, 2005 and 2006, amounts available to Dealers under these lines of credit were $6.2 million and $5.0 million, respectively. The Company intends to fund these commitments with available funds and available capacity under the $30.0 million LaSalle Credit Facility.
The purchase discount resulted from the acquisitions of Financial Security Services (Note 11). Purchase discount on acquired notes that are prepaid within the first year of acquisition is offset to goodwill
Allowance for doubtful accounts—Notes Receivable
Changes in the allowance for doubtful accounts were as follows:
2004 | 2005 | 2006 | |||||||
(in thousands) | |||||||||
| January 1, | $ | 131 | $ | 246 | $ | 246 | |||
| Provisions | 115 | - | 56 | ||||||
| December 31, | $ | 246 | $ | 246 | $ | 302 | |||
INTEGRATED ALARM SERVICES GROUP, INC. AND SUBSIDIARIES
NOTES TO CONSOLIDATED FINANCIAL STATEMENTS (continued)
2. Summary of Significant Accounting Policies (cont.)
Contractual maturities of notes receivable as of December 31, 2006 are as follows:
(in thousands) | |||
| 2007 | $ | 4,154 | |
| 2008 | 3,205 | ||
| 2009 | 2,238 | ||
| 2010 | 1,613 | ||
| 2011 | 232 | ||
| 2012 and thereafter | 825 | ||
| $ | 12,267 | ||
At December 31, 2006 notes receivable from dealers was collateralized by customer monitoring contracts with recurring monthly revenue of approximately $818,000. Interest income on notes receivable was approximately $682,000, $2,897,000 and $2,828,000 for the years ended December 31, 2004, 2005 and 2006, respectively, and is included in interest income in the statement of operations. Also included in interest income in 2004, 2005 and 2006 were approximately $151,000, $1,350,000 and $924,000, respectively, which represented the amortization of the discount on notes receivable.
Deferred revenue-notes receivable
Deferred revenue on notes receivable represents amounts paid by the dealers for services the Company will render in the future. In connection with the loans to dealers, the Company withholds a portion of the amount loaned to cover services for the remaining term of the contract. The deferred fees are recognized as revenues as the billing and collection services are provided to the dealers. Amounts withheld are nonrefundable. Amounts recognized as revenue in 2004, 2005 and 2006 were approximately $108,000, $92,000 and $101,000 respectively.
Accounts receivable and allowance for doubtful accounts
Accounts receivable are recorded at the invoiced amount and do not bear interest. Credit is extended based upon an evaluation of the customer’s financial condition and history. The allowance for doubtful accounts is the Company’s best estimate of the amount of probable credit losses in its existing accounts receivable. The Company reviews its allowance for doubtful accounts monthly. Customer accounts including accounts with balances over 90 days from the invoice date are reserved based upon historical trends. Account balances are charged-off against the allowance when the Company believes it is probable the receivable will not be recovered. The Company does not have any off-balance-sheet credit exposure related to its customers.
Changes in the allowance for doubtful accounts were as follows:
(in thousands) | |||
| January 1, 2004 | $ | 750 | |
| Provisions | 1,275 | ||
| Write-offs | (2,070 | ) | |
| Recoveries | 1,031 | ||
| December 31, 2004 | 986 | ||
| Provisions | 1,191 | ||
| Write-offs | (2,916 | ) | |
| Recoveries | 1,586 | ||
| December 31, 2005 | 847 | ||
| Provisions | 337 | ||
| Write-offs | (1,148 | ) | |
| Recoveries | 447 | ||
| December 31, 2006 | $ | 483 | |
INTEGRATED ALARM SERVICES GROUP, INC. AND SUBSIDIARIES
NOTES TO CONSOLIDATED FINANCIAL STATEMENTS (continued)
2. Summary of Significant Accounting Policies (cont.)
Inventories
Inventories are stated at the lower of cost or market. Inventories include commercial and residential alarm system components, parts and supplies. Cost is determined using the first-in, first-out method. Provision for potentially obsolete or slow moving inventory is made based on analysis of inventory levels and forecasts.
Changes in the allowance for obsolescence for inventories were as follows:
(in thousands) | ||||
| Balance at January 1, 2004 | $ | - | ||
| Reserve recorded | 401 | |||
| Balance at December 31, 2004 | 401 | |||
| Write-offs | (260 | ) | ||
| Reserve recorded | 5 | |||
| Balance at December 31, 2005 | 146 | |||
| Write-offs | (20 | ) | ||
| Balance at December 31, 2006 | $ | 126 | ||
Deferred customer acquisition costs, net
The direct incremental costs associated with obtaining a new customer including the installation of the monitoring systems, to the extent of deferred revenue (upfront non-refundable deposits), are capitalized and amortized over the expected life of the customer relationship. Excess direct incremental costs over deferred revenue (upfront non-refundable deposits) are being amortized over the term of the contract.
Customer contracts
Customer monitoring contracts are acquired from the dealers’ pre-existing portfolios of contracts or assumed upon the foreclosure on dealers’ loans. These acquired customer contracts are recorded at cost which management believes approximates fair value. Customer contracts assumed as a result of foreclosure on dealer loans are recorded at the lower of cost (loan carrying value) or the fair value of customer contracts using recent transaction prices and industry benchmarks at the time of foreclosure.
Customer contracts are amortized over the term that such contracts are expected to remain a customer of the Company. The Company on an ongoing basis conducts comprehensive reviews of its attrition experience and adjusts its estimated lives of customer contracts. As a result of the Company’s comprehensive review, no adjustment to estimated lives was required.
The Company’s amortization methods below consider the average estimated life and historical and projected attrition rates determined from actual experience and consists of the following portfolios:
Acquired as a result of the IASI merger:
| Existing at January 31, 2003 | Accelerated method | Period | ||
| Existing portfolio accounts (bulk) | 150% Declining balance | 8 years | ||
| Dealer acquired new accounts (flow) | 160% Declining balance | 8 years | ||
| Contracts assumed from dealers | 160% Declining balance | 4 years |
Acquired subsequent to the IASI merger:
| Acquired after January 31, 2003 | Accelerated method | Period | ||
| Existing portfolio accounts (bulk) | Straight-line plus attrition | 18 years | ||
| Dealer acquired new accounts (flow) | 200% Declining balance | 12 years | ||
| Contracts assumed from dealers | 200% Declining balance | 8 years |
INTEGRATED ALARM SERVICES GROUP, INC. AND SUBSIDIARIES
NOTES TO CONSOLIDATED FINANCIAL STATEMENTS (continued)
2. Summary of Significant Accounting Policies (cont.)
Debt issuance costs
Debt issuance costs represent direct costs incurred in connection with obtaining financing with related parties and banks and other lenders. Debt issuance costs are being amortized over the term of the related obligations using the effective interest method.
Other identifiable intangibles
Other identifiable intangibles, which include trade names and partnering (marketing) relationships and non-compete agreements, are being amortized over their estimated lives of 5 to 10 years.
Property and equipment
Property and equipment are reported at cost less accumulated depreciation. Repairs and maintenance are charged to expense as incurred. Renewals and betterments are capitalized. When assets are sold, retired or otherwise disposed of, the related costs and accumulated depreciation are removed from the respective accounts, and any resulting gain or loss is recognized.
Property and equipment are depreciated using the straight-line method over the following estimated useful lives:
| Furniture, leaseholds and equipment | 3-10 years |
| Vehicles | 3-5 years |
| Building and building improvements | 10-39 years |
| Computer software | 3-5 years |
Leasehold improvements are being amortized over the shorter of the estimated useful life of the asset or lease term. Equipment under capital lease is being amortized over the lease term.
Dealer relationships
Alarm monitoring services for subscribers of independent alarm dealers are outsourced to the Company. The Company acquires such dealer relationships from other monitoring companies. The Company amortizes the cost of dealer relationships using declining balance accelerated methods. The Company primarily utilizes the 150% declining balance method over 15 years.
Goodwill
The Company accounts for its goodwill under Statement of Financial Accounting Standards (SFAS) No. 142, “Goodwill and Other Intangible Assets.” Under SFAS No. 142, goodwill is not amortized, but it is tested for impairment at least annually. Each year the Company tests for impairment of goodwill according to a two-step approach. In the first step, the Company tests for impairment of goodwill by estimating the fair values of its reporting units using the present value of future cash flows approach, subject to a comparison for reasonableness to its market capitalization at the date of valuation. If the carrying amount exceeds the fair value, the second step of the goodwill impairment test is performed to measure the amount of the impairment loss, if any. In the second step the implied fair value of the goodwill is estimated as the fair value of the reporting unit used in the first step less the fair values of all other net tangible and intangible assets of the reporting unit. If the carrying amount of the goodwill exceeds its implied fair market value, an impairment loss is recognized in an amount equal to that excess, not to exceed the carrying amount of the goodwill. In addition, goodwill of a reporting unit is tested for impairment between annual tests if an event occurs or circumstances change that would more likely than not reduce the fair value of a reporting unit below its carrying value. The Company performs its annual impairment test in the third quarter of each year and previously has not been required to record an impairment charge. During the second quarter of 2004 and continuing through the third quarter of 2006, the common stock of the Company traded below its book value. During the third quarter of 2006, the Company’s Residential and Commercial segments continued to incur operating losses and failed to achieve their respective nine months operating plan. As a result, the Company revised its future operating forecasts and determined that goodwill was impaired at September 30, 2006. A non-cash goodwill impairment charge of $65,000,000 has been recorded in the third quarter of 2006. The impairment reduces the goodwill associated with the Residential segment by $47,430,000 and the Commercial segment by $17,570,000. Our goodwill balance at December 31, 2006 is approximately $26,233,000.
INTEGRATED ALARM SERVICES GROUP, INC. AND SUBSIDIARIES
NOTES TO CONSOLIDATED FINANCIAL STATEMENTS (continued)
2. Summary of Significant Accounting Policies (cont.)
Accrued Expenses
Accrued expenses consist of the following:
December 31, | |||||||
2005 | 2006 | ||||||
(in thousands) | |||||||
| Compensation & employee benefits | $ | 2,082 | $ | 1,854 | |||
| Interest | 2,326 | 2,078 | |||||
| Litigation reserves | 685 | 188 | |||||
| Facility closures | 697 | 401 | |||||
| Vendor accruals and sales tax | 1,597 | 2,853 | |||||
| Other | 1,869 | 1,849 | |||||
| $ | 9,256 | $ | 9,223 | ||||
In 2005, the Company closed three dealer care centers, along with a monitoring center in order to streamline operations. These costs are accounted for in accordance with Statement of Financial Accounting Standards No. 146, “Accounting for Costs Associated with Exit or Disposal Activities” (“FAS 146”), whereby the liability is recognized when the exit costs are incurred. During 2005 and 2006, the Company recorded charges relating to the location closures in the amount of approximately $1,312,000 and ($8,000), respectively. The equipment of the locations that were closed were either transferred to other locations or adjusted to the estimated net realizable value, resulting in a non-cash write-down of approximately $373,000 charged to loss on sale or disposal of assets during 2005. Lease commitments, severance and benefits of approximately $860,000 were charged to cost of revenue during 2005. The remaining severance costs of approximately $79,000 were charged to general and administrative expense in 2005. Lease commitments represent the present value of the remaining lease obligation, net of any estimated sublease rentals in accordance with FAS 146.
The following table provides additional details regarding the costs:
Write-down of Equipment | Severance and Benefits | Lease Commitments | Total | ||||||||||
(in thousands) | |||||||||||||
| Reserve for closing and related costs | $ | 373 | $ | 283 | $ | 656 | $ | 1,312 | |||||
| Write-down of equipment | (373 | ) | - | - | (373 | ) | |||||||
| Payments | - | (186 | ) | (56 | ) | (242 | ) | ||||||
| Balance at December 31, 2005 | - | 97 | 600 | 697 | |||||||||
| Payments | - | (97 | ) | (191 | ) | (288 | ) | ||||||
| Adjustment to reserve | - | - | (8 | ) | (8 | ) | |||||||
| Balance at December 31, 2006 | $ | - | $ | - | $ | 401 | $ | 401 | |||||
Stock based compensation
Prior to January 1, 2006, we accounted for activity under the employee stock plans using the intrinsic value method prescribed by Accounting Principles Board Opinion (“APB”) No. 25, Accounting for Stock Issued to Employees, and had adopted the disclosure-only provisions of SFAS No. 123, Accounting for Stock-Based Compensation as amended by SFAS No. 148, (Accounting for Stock-Based Compensation-Transition and Disclosure). Under APB No. 25, we generally recognized no compensation expense with respect to options granted to employees and directors as the option exercise price is generally equal to or greater than the fair value of the our common stock on the date of the grant. The value of stock options granted to non-employees were expensed.
INTEGRATED ALARM SERVICES GROUP, INC. AND SUBSIDIARIES
NOTES TO CONSOLIDATED FINANCIAL STATEMENTS (continued)
2. Summary of Significant Accounting Policies (cont.)
Effective January 1, 2006, we adopted Statement of Financial Accounting Standard No. 123 (revised), Share-Based Payment (“FAS 123R”), an amendment of FAS No. 123, Accounting for Stock-Based Compensation. FAS 123R eliminates the ability to account for share-based payments using Accounting Principles Board Opinion No. 25, Accounting for Stock Issued to Employees and instead requires companies to recognize compensation expense using a fair-value based method for costs related to share-based payments including stock options and employee stock purchase plans. The expense will be measured as the fair value of the award at its grant date based on the estimated number of awards that are expected to vest, and recorded over the applicable service period. In the absence of an observable market price for a share-based award, the fair value would be based upon a valuation methodology that takes into consideration various factors, including the exercise price of the award, the expected term of the award, the current price of the underlying shares, the expected volatility of the underlying share price, the expected dividends on the underlying shares and the risk-free interest rate. The standard also provides for different transition methods for past award grants, including the retrospective adjustment of prior period results. We have elected to apply the modified prospective transition method to all past awards outstanding and unvested as of the effective date of January 1, 2006 and are recognizing the associated expense over the remaining vesting period based on the fair values previously determined and disclosed as part of our pro-forma disclosures. We will not retrospectively adjust the results of prior periods. Prior to the effective date of FAS 123R, we provided the pro-forma disclosures for past award grants as required under FAS 123. As such, we have recognized expense for unvested options during 2006 of approximately $386,000.
The Company used the Black-Scholes option-pricing model (“Black-Scholes”) as its method of valuation under FAS 123R in fiscal year 2006 and a single option award approach. This fair value is then amortized on a straight-line basis over the requisite service periods of the awards, which is generally the vesting period. Black-Scholes was previously used for our proforma information required under FAS 123 for periods prior to fiscal year 2006. The fair value of share-based payment awards on the date of grant as determined by the Black-Scholes model is affected by our stock price as well as other assumption, including, but not limited to the expected volatility over the term of the awards and risk-free interest rate.
The fair value of each option plan option grant was estimated at the date of grant using the Black-Scholes option valuation model with the following weighted average assumptions:
2004 | 2005 | 2006 | ||||||||
| Risk-free interest rate | 4.58 | % | 4.07 | % | 4.56 | % | ||||
| Volatility | 29 | % | 63 | % | 63 | % | ||||
| Expected term (in years) | 10 | 5 | 3 | |||||||
| Dividend yield | 0 | % | 0 | % | 0 | % | ||||
Income taxes
For federal and state income tax purposes, IASG became a C corporation effective January 31, 2003 which results in recording current and deferred income taxes from its earnings and losses and recognizing the tax consequences of "temporary differences" between financial statement and tax basis of existing assets and liabilities.
Advertising costs
The Company's policy is to expense advertising costs in the period in which the expense is incurred. Advertising expense was approximately $167,000, $437,000 and $245,000 for the years ended December 31, 2004, 2005 and 2006, respectively.
Net income (loss) per share
The Company computes net income (loss) per common share in accordance with Statement of Financial Accounting Standards No. 128, "Earnings per Share" (SFAS 128) and SEC Staff Accounting Bulletin No. 98 (SAB 98). Under the provisions of SFAS 128 and SAB 98, basic and diluted net income (loss) per common share is computed by dividing the net income (loss) available to common stockholders for the period by the weighted average number of shares of common stock outstanding during the period. Because the Company is in a net loss position, there are no potentially dilutive securities outstanding. Accordingly, the number of weighted average shares outstanding as well as the amount of net income (loss) per share are the same for basic and diluted per share calculations for the periods reflected in the accompanying financial statements.
INTEGRATED ALARM SERVICES GROUP, INC. AND SUBSIDIARIES
NOTES TO CONSOLIDATED FINANCIAL STATEMENTS (continued)
2. Summary of Significant Accounting Policies (cont.)
Risks and uncertainties
The Company operates in one industry and three segments. A principal element of the Company's business strategy is to acquire wholesale security system alarm monitoring businesses and related security alarm monitoring contracts or businesses. Acquisitions of monitoring call centers involve a number of special risks, including the possibility of unanticipated problems not discovered prior to the acquisition, account attrition (i.e. cancellation) and the diversion of management's attention from other business activities in order to focus on the assimilation of such acquisitions.
The Company is subject to operational and regulatory risk. Liabilities may arise due to system failures and false alarms. New technologies may cause existing technologies to become obsolete. Future government or other organizational regulations and standards could have an adverse effect on the Company's financial position, results of operations or cash flow.
Impairment or disposal of long-lived assets
SFAS No. 144 “Accounting for the Impairment or Disposal of Long Lived Assets” requires that long-lived assets be reviewed for impairment whenever events or changes in circumstances indicate that the carrying amount of an asset may not be recoverable. Recoverability of the assets to be held and used is measured by a comparison of the carrying amount of the assets with the future net cash flows expected to be generated. Cash flows of dealer relationships and retail customer contracts are analyzed at the same group level (acquisition by acquisition and portfolio grouping, respectively) that they are identified for amortization, the lowest level for which independent cash flows are identifiable. All other long-lived assets are evaluated for impairment at the Company level, using one asset grouping. If such assets are considered to be impaired, the impairment to be recognized is measured by the amount by which the carrying amount of the assets exceeds the fair value of the assets. The Company has identified no impairment losses for any of the periods presented.
Recent accounting pronouncements
In February 2007, the FASB issued Statement of Financial Accounting Standards No. 159,“The Fair Value Option for Financial Assets and Financial Liabilities.” This statement permits entities to choose to measure many financial instruments and certain other items at fair value. The Company will be required to apply the guidance contained in FAS No. 159 beginning with financial statements for the year ended December 31, 2008 and has not yet determined the effect that adoption will have on the financial statements.
In September 2006, the SEC staff issued Staff Accounting Bulletin No. 108, “Considering the Effects of Prior year Misstatements when Quantifying Misstatements in Current year Financial Statements.” SAB 108 was issued in order to eliminate the diversity of practice surrounding how public companies quantify financial statement misstatements. The Company was required to apply the guidance contained in SAB 108 beginning with financial statements for the year ending December 31, 2006. The Company adopted SAB 108 during fiscal 2006 and it did not have any effect on our financial statements.
In September 2006, the FASB issued Statement of Financial Accounting Standards No. 157, “Fair Value Measurements.” This statement defines fair value, establishes a framework for measuring fair value in generally accepted accounting principles (GAAP) and expands disclosures about fair value measurements. This Statement applies under other accounting pronouncements that require or permit fair value measurements. The Company will be required to apply the guidance contained in FAS No. 157 beginning with financial statements for the year ended December 31, 2008 and has not yet determined the effect that adoption will have on the financial statements.
In June 2006, the FASB issued Interpretation No. 48 (“FIN 48”), “Accounting for Uncertainty in Income Taxes”, an interpretation of FASB Statement No. 109, which seeks to reduce the diversity in practice associated with the accounting and reporting for uncertainty in income tax provisions. This interpretation prescribes a comprehensive model for the financial statement recognition, measurement, presentation and disclosure of uncertain tax positions taken or expected to be taken in income tax returns. FIN 48 is effective for fiscal years beginning after December 31, 2006 and the Company will adopt the new requirements in the first quarter of 2007. The Company is currently assessing the impact of FIN 48 but does not expect that the adoption of the standard will have any significant or material impact on its financial statements.
In March 2006, the FASB issued Statement of Financial Accounting Standards No. 156, “Accounting for Servicing of Financial Assets”, an amendment of FASB Statement No. 140 (“FAS No. 156”). This Standard amends FASB Statement No. 140, Accounting for Transfers and Servicing Assets and Extinguishment of Liabilities, with respect to the accounting for separately recognized servicing assets and servicing liabilities. This Standard requires an entity to recognize a servicing asset or servicing liability each time it undertakes an obligation to service a financial asset by entering into a servicing contract when there is a related sale of financial assets, certain transfers, or assumption of an obligation to service a financial asset that does not relate to the financial assets of the servicer. We adopted this Statement on January 1, 2007 and it did not have any effect on our financial statements.
INTEGRATED ALARM SERVICES GROUP, INC. AND SUBSIDIARIES
NOTES TO CONSOLIDATED FINANCIAL STATEMENTS (continued)
2. Summary of Significant Accounting Policies (cont.)
In February 2006, the FASB issued Statement of Financial Accounting Standards No. 155, “Accounting for Certain Hybrid Financial Instruments”, an amendment of FASB statements No. 133 and 140 (“FAS No. 155”). This Standard resolves and clarifies the accounting and reporting for certain financial instruments including, hybrid financial instruments with embedded derivatives, interest-only strips, and securitized financial instruments. FAS No. 155 is effective for all financial instruments acquired or issued after the beginning of an entity’s first fiscal year that begins after September 15, 2006. The Company will be required to adopt this Standard on January 1, 2007 and has not determined the effect that adopting FAS No. 155 will have on the financial statements.
3. Property and Equipment
Property and equipment consist of the following at:
December 31, | |||||||
2005 | 2006 | ||||||
(in thousands) | |||||||
| Furniture, leaseholds and equipment | $ | 9,830 | $ | 11,450 | |||
| Vehicles | 1,836 | 1,589 | |||||
| Building and building improvements | 529 | 529 | |||||
| Computer software | 2,011 | 2,960 | |||||
| Land | 124 | 124 | |||||
| 14,330 | 16,652 | ||||||
| Less accumulated depreciation and amortization | (6,487 | ) | (8,558 | ) | |||
| $ | 7,843 | $ | 8,094 | ||||
Depreciation expense was approximately $2,768,000, $2,634,000 and $2,733,000 for the years ended December 31, 2004, 2005 and 2006, respectively.
Unamortized computer software costs totaled approximately, $1,344,000 and $1,806,000 respectively, at December 31, 2005 and 2006. Amortization expense related to computer software was approximately $348,000, $539,000 and $493,000 for the years ended December 31, 2004, 2005 and 2006, respectively. The cost basis of equipment under capital leases approximated $2,257,000 and $2,068,000 at December 31, 2005 and 2006, respectively. Accumulated amortization for equipment under capital lease approximated $1,400,000 and $1,104,000 at December 31, 2005 and 2006, respectively.
4. Debt Issuance Costs
Debt issuance costs consist of the following at:
December 31, | |||||||
2005 | 2006 | ||||||
(in thousands) | |||||||
| Debt issuance costs | $ | 6,161 | $ | 6,161 | |||
| Accumulated amortization | (1,565 | ) | (2,531 | ) | |||
| $ | 4,596 | $ | 3,630 | ||||
Amortization expense of debt issuance costs for the years ended December 31, 2004, 2005 and 2006 was approximately $1,750,000, $1,080,000 and $973,000 respectively. Included in amortization expense for the year ended December 31, 2004 is approximately $674,000 of debt issuance costs charged to earnings due to the prepayment of certain debt from the proceeds of the issuance of $125,000,000 million of senior secured notes in November 2004.
INTEGRATED ALARM SERVICES GROUP, INC. AND SUBSIDIARIES
NOTES TO CONSOLIDATED FINANCIAL STATEMENTS (continued)
5. Goodwill and Intangibles
During the years ended December 31, 2005 and 2006, goodwill balance change by approximately $3,484,000 and ($68,686,000) respectively (see Note 11) as a result of the following:
(in thousands) | ||||
| Balance at January 1, 2005 | $ | 91,435 | ||
| Acquisition of FSS | 4,015 | |||
Unamortized discount recapture on early repayment of notes receivable | (1,541 | ) | ||
| AHS contingent consideration | 482 | |||
| Lane purchase accounting adjustments | (115 | ) | ||
| Other acquisitions adjustments and costs | 643 | |||
| Balance at December 31, 2005 | $ | 94,919 | ||
| Purchase price reallocation - prepaid loans | (282 | ) | ||
| Purchase price adjustment | (807 | ) | ||
| Goodwill of business transferred (Note 12) | (2,659 | ) | ||
| Impairment charge | (65,000 | ) | ||
| Direct acquisition costs | 62 | |||
| Balance at December 31, 2006 | $ | 26,233 | ||
The amount of goodwill that is expected to be deductible for income tax purposes is approximately $22,200,000.
Customer contracts consists of the following:
Existing Portfolio | Dealer Acquired | Contracts assumed from Dealers | Total | ||||||||||
(in thousands) | |||||||||||||
| Customer contracts January 1, 2005 | $ | 75,385 | $ | 26,401 | $ | 8,059 | $ | 109,845 | |||||
| Purchases 2005 | 14,706 | 3,636 | - | 18,342 | |||||||||
| Sales and reclassifications 2005 | (1,307 | ) | - | - | (1,307 | ) | |||||||
| Customer contracts December 31, 2005 | 88,784 | 30,037 | 8,059 | 126,880 | |||||||||
| Purchases 2006 | 7,843 | 6,185 | 16 | 14,044 | |||||||||
| Sales and reclassifications 2006 | (8,601 | ) | (164 | ) | - | (8,765 | ) | ||||||
| Customer contracts December 31, 2006 | 88,026 | 36,058 | 8,075 | 132,159 | |||||||||
| Accumulated amortization January 1, 2005 | 12,982 | 7,620 | 4,074 | 24,676 | |||||||||
| Amortization 2005 | 15,785 | 4,261 | 1,736 | 21,782 | |||||||||
| Sales and reclassifications 2005 | (110 | ) | - | - | (110 | ) | |||||||
| Accumulated amortization December 31, 2005 | 28,657 | 11,881 | 5,810 | 46,348 | |||||||||
| Amortization 2006 | 13,662 | 4,603 | 1,112 | 19,377 | |||||||||
| Sales and reclassifications 2006 | (3,528 | ) | (41 | ) | - | (3,569 | ) | ||||||
| Accumulated amortization December 31, 2006 | 38,791 | 16,443 | 6,922 | 62,156 | |||||||||
| Customer contracts, net December 31, 2005 | $ | 60,127 | $ | 18,156 | $ | 2,249 | $ | 80,532 | |||||
| Customer contracts, net December 31, 2006 | $ | 49,235 | $ | 19,615 | $ | 1,153 | $ | 70,003 | |||||
Customer contract amortization expenses (including attrition and net of use of dealer holdbacks) for the years ended December 31, 2004, 2005 and 2006 were approximately $15,805,000, $20,675,000 and $19,272,000 respectively. Customer contracts with a cost of approximately $8,438,000 and accumulated amortization of $3,569,000 were sold during 2006 as a result of the sale of alarm contracts in Colorado, Idaho and Utah. This disposal of assets is more fully described in footnote 12.
INTEGRATED ALARM SERVICES GROUP, INC. AND SUBSIDIARIES
NOTES TO CONSOLIDATED FINANCIAL STATEMENTS (continued)
5. Goodwill and Intangibles (cont.)
Dealer relationships consist of the following:
(in thousands) | |||
| Dealer Relationship at January 1, 2005 | $ | 55,390 | |
| 2005 Additions | 3,139 | ||
| Dealer Relationship at December 31, 2005 | 58,529 | ||
| 2006 Additions | - | ||
| Dealer Relationship at December 31, 2006 | $ | 58,529 | |
| Accumulated amortization at January 1, 2005 | $ | 20,860 | |
| 2005 Amortization | 4,669 | ||
| Accumulated amortization at December 31, 2005 | 25,529 | ||
| 2006 Amortization | 4,525 | ||
| Accumulated amortization at December 31, 2006 | $ | 30,054 | |
| Dealer Relationship, net at December 31, 2005 | $ | 33,000 | |
| Dealer Relationship, net at December 31, 2006 | $ | 28,475 | |
The 2005 dealer relationship addition is primarily due to the FSS acquisition (Note 11).
Dealer relationship amortization expense was approximately $4,016,000, $4,669,000 and $4,525,000 for 2004, 2005 and 2006, respectively.
Other identifiable intangibles consist of the following:
December 31, | |||||||
2005 | 2006 | ||||||
(in thousands) | |||||||
| Trade name | $ | 1,757 | $ | 1,757 | |||
| Partnering relationships | 874 | 874 | |||||
| Non-compete agreements | 1,209 | 1,209 | |||||
| Accumulated amortization | (1,050 | ) | (1,686 | ) | |||
| $ | 2,790 | $ | 2,154 | ||||
Other identifiable intangible asset amortization expense was approximately $423,000, $594,000 and $636,000 for the years ended December 31, 2004, 2005 and 2006, respectively.
Estimated amortization expense of customer contracts, dealer relationships, other identifiable intangible assets and deferred customer acquisition costs for the years ending December 31, 2007 through 2011 is as follows:
Year | Customer Contracts | Dealer Relationships | Other Identifiable Intangible Assets | Deferred Installation Costs | Total | |||||||||||
(in thousands) | ||||||||||||||||
| 2007 | $ | 8,844 | $ | 4,060 | $ | 615 | $ | 1,977 | $ | 15,496 | ||||||
| 2008 | 7,662 | 3,802 | 599 | 1,684 | 13,747 | |||||||||||
| 2009 | 6,883 | 3,542 | 554 | 1,328 | 12,307 | |||||||||||
| 2010 | 5,956 | 3,277 | 119 | 924 | 10,276 | |||||||||||
| 2011 | 4,870 | 2,988 | 89 | 715 | 8,662 | |||||||||||
INTEGRATED ALARM SERVICES GROUP, INC. AND SUBSIDIARIES
NOTES TO CONSOLIDATED FINANCIAL STATEMENTS (continued)
5. Goodwill and Intangibles (cont.)
Customer contract amortization for existing portfolios acquired subsequent to January 31, 2003 is calculated using an 18 year straight-line
rate. No attrition has been recognized in the customer contract amortization projected for future years. The actual amortization expense in future periods will be higher due to the impact of attrition. Amortization expense related to attrition in 2004, 2005 and 2006 approximated $7,527,000, $10,615,000 and $9,528,000, respectively. The net unamortized cost of portfolios subject to variable amortization based upon attrition was approximately $55,919,000 and $46,391,000 as of December 31, 2005 and 2006.
6. Long-Term Debt
Long-term debt consists of the following at:
December 31, | |||||||
2005 | 2006 | ||||||
(in thousands) | |||||||
| $125,000,000 senior secured notes payable to investors maturing on November 15, 2011. Interest payments are made on May 15 and November 15 of each year, beginning on May 15, 2005. Fixed interest rate of 12%. The Notes and related guarantees are collateralized by a second priority lien on substantially all of our tangible and intangible property. The interest rate on the Notes has been increased by .25% per year for every 90 day period up to the maximum of 1.00% as the Notes are not registered with the SEC and as of December 31, 2006, the Notes have an interest rate of the maximum of 13%. When the Notes are registered with the SEC, the interest rate will revert back to the original rate of 12%. If reported retail attrition exceeds 18% for three succeeding quarters, the Note covenants require the Company to offer to purchase 10% of the Notes at par value. | $ | 125,000 | $ | 125,000 | |||
| Less: current portion of long-term debt | - | - | |||||
| $ | 125,000 | $ | 125,000 | ||||
In September 2002, one of the Company’s subsidiaries borrowed $5,500,000 from investors in a private offering. The promissory notes were convertible into IASG's common stock at seventy-five percent of the initial public offering price. During 2004, $275,000 of principal was converted into 39,640 shares of common stock. There were no conversions into shares of common stock during 2005. As a result of the initial public offering, the benefit of the conversion to the note holders was approximately $1,833,000, which was charged to earnings as interest expense, over the remaining life of the debt (twenty-six months at time of IPO). The expense (including changes for conversions) for the years ended December 31, 2004, 2005 and 2006 were approximately $876,000, $569,000 and $0, respectively. Upon conversion, any remaining unamortized benefit was charged to earnings. The notes matured during 2005.
On November 16, 2004, the Company entered into a $30.0 million senior secured credit facility with LaSalle Bank N.A. The facility will bear interest at a floating rate equal to the London Interbank Offered Rate (“LIBOR”) plus 3.5%. The facility is collateralized by a first priority perfected security interest in substantially all of our tangible and intangible property. Covenants include a minimum fixed charge coverage ratio of 2.0 times and a maximum senior secured debt to eligible recurring monthly revenue of 10.0 times. The Company did not have any outstanding balances owed under this facility as of December 31, 2006. At December 31, 2005, the Company was not in compliance with certain administrative covenants of the LaSalle Credit Facility. On March 14, 2006, LaSalle permanently waived the administrative covenants which the Company was not in compliance with through March 13, 2006, at which time the $30 million became available to the Company.
INTEGRATED ALARM SERVICES GROUP, INC. AND SUBSIDIARIES
NOTES TO CONSOLIDATED FINANCIAL STATEMENTS (continued)
7. Stockholders’ Equity
On August 16, 2005, 140,000 shares of Shareholder Options were issued at $9.25. The options are non-forfeitable and are exercisable as follows: (i) 30% will be immediately exercisable on the first anniversary of the issuance; (ii) 30% will be immediately exercisable on the second anniversary of the issuance; (iii) 40% will become immediately exercisable on the third anniversary of the issuance. These additional options were issued in connection with the terms of the American Home Securities, Inc (“AHS”) purchase agreement. The fair value of these shareholder options was approximately $27,000, as determined under the Black-Scholes option valuation model, has been charged to goodwill with a corresponding credit to paid-in capital.
During 2005, the Company’s Board of Directors approved an initial plan to repurchase up to $2.5 million of the Company’s common stock, the maximum permitted under the Senior Secured Note covenants. By December 31, 2005, the Company had purchased 312,626 shares of treasury stock at an aggregate cost of approximately $1.0 million. The repurchase plan was discontinued by the Board of Directors in 2006.
On April 16, 2006, an additional 225,000 shares of Shareholder Options were issued, 150,000 of which were issued at $5.25 and 75,000 at $4.25. The options are non-forfeitable and are exercisable as follows: (i) 150,000 shares were immediately exercisable on November 1, 2006; (ii) remaining 75,000 were immediately exercisable on December 1, 2006. These additional options were issued in connection with the change of senior management that occurred during the second quarter of 2006.
Stock-Based Compensation
The Company’s 2003 Stock Option Plan and 2004 Stock Option Plan, collectively (“SOP”) permit the grant of options which may
either be “incentive stock options” (“ISOs”) or “non-qualified stock options: (“NSOs”). The total number of shares of our common stock that may be issued under the SOP may not exceed 1,350,000, subject to possible adjustment in the future as described below. All employees, officers, directors, consultants and independent contractors of the Company, or of any parent, subsidiary or affiliate are eligible to be granted options.
The exercise price of an option granted under the SOP may not be less than 100% of the fair market value of the Company’s common stock on the date of grant (110% of such fair market value in the case of an ISO granted to an optionee who owns or is deemed to own stock possessing more than 10% of the combined voting power of all classes of our stock).
The number of shares of common stock authorized for issuance under the SOP may be adjusted in the event our shares of common stock are changed into, or exchanged for cash, or securities of another entity through a reorganization, merger, recapitalization, reclassification, stock split, stock dividend, stock consolidation or combination or other similar transaction.
In the event of the occurrence of any of the foregoing, the compensation committee may adjust the number of authorized shares under the SOP, and the options issued under the SOP, as appropriate under the circumstances.
Prior to January 1, 2006, the Company accounted for activity under the employee stock plans using the intrinsic value method prescribed by Accounting Principles Board Opinion (“APB”) No. 25, Accounting for Stock Issued to Employees, and had adopted the disclosure-only provisions of SFAS No. 123, Accounting for Stock-Based Compensation as amended by SFAS No. 148, (Accounting for Stock-Based Compensation-Transition and Disclosure).
Effective January 1, 2006, the Company adopted Statement of Financial Accounting Standard No. 123 (revised), Share-Based Payment (“FAS 123R”), an amendment of FAS No. 123 (“FAS 123”), Accounting for Stock-Based Compensation. FAS 123R eliminates the ability to account for share-based payments using Accounting Principles Board Opinion No. 25, Accounting for Stock Issued to Employees. See Note 2.
INTEGRATED ALARM SERVICES GROUP, INC. AND SUBSIDIARIES
NOTES TO CONSOLIDATED FINANCIAL STATEMENTS (continued)
7. Stockholders’ Equity (cont.)
The following table reflects the pro forma information of the Company for the years ended December 31, 2004 and 2005 as if the compensation cost had been determined in accordance with the fair value-based method prescribed by FAS 123.
Year ended December 31, | |||||||
2004 | 2005 | ||||||
(in thousands, except per share data) | |||||||
| Net loss, as reported | $ | (11,717 | ) | $ | (22,332 | ) | |
| Less: Stock-based compensation expense determined under fair value method for all awards, net of related tax effects. | (194 | ) | (174 | ) | |||
| Pro forma net loss | $ | (11,911 | ) | $ | (22,506 | ) | |
| Net loss per share, as reported - basic and diluted | $ | (0.47 | ) | $ | (0.91 | ) | |
| Pro forma net loss per share - basic and diluted | $ | (0.48 | ) | $ | (0.91 | ) | |
There were no options exercised during 2006.
The options disclosed in the table above had no aggregate intrinsic value associated with them at December 31, 2006. Total stock option compensation expense for the year ended December 31, 2006 was approximately $386,000. At December 31, 2006, unrecognized costs related to stock options totaled approximately $14,000 and are expected to be recognized over a weighted average period of .41 years.
Company stock options outstanding become exercisable as follows:
Period Ending | Option Plan Option Shares | Weighted Average Exercise Price | Shareholder Option Shares | Weighted Average Exercise Price | |||||||||
| Currently exercisable | 392,396 | $ | 5.63 | 1,942,000 | $ | 9.25 | |||||||
| December 31, 2007 | 26,104 | 5.68 | 42,000 | 9.25 | |||||||||
| December 31, 2008 | - | - | 56,000 | 9.25 | |||||||||
| 418,500 | 5.63 | 2,040,000 | 9.25 | ||||||||||
Options exercisable at December 31, 2005 and 2006 were 1,275,500 and 2,334,396 respectively.
Changes in options outstanding are as follows:
Options | Weighted Average Exercise Price | ||||||
| Options outstanding at January 1, 2004 | 1,948,000 | $ | 9.25 | ||||
| Options issued during 2004 | 150,000 | 5.75 | |||||
| Options forfeited during 2004 | (11,834 | ) | 5.75 | ||||
| Options outstanding at December 31, 2004 | 2,086,166 | 9.01 | |||||
| Options issued during 2005 | 182,500 | 8.27 | |||||
| Options forfeited during 2005 | (10,250 | ) | 5.75 | ||||
| Options outstanding at December 31, 2005 | 2,258,416 | 8.97 | |||||
| Options issued during 2006 | 225,000 | 4.92 | |||||
| Options forfeited during 2006 | (24,916 | ) | 5.70 | ||||
| Options outstanding at December 31, 2006 | 2,458,500 | 8.64 | |||||
INTEGRATED ALARM SERVICES GROUP, INC. AND SUBSIDIARIES
NOTES TO CONSOLIDATED FINANCIAL STATEMENTS (continued)
7. Stockholders’ Equity (cont.)
The weighted average estimated fair value of option plan option shares granted during the years ended December 31, 2004, 2005 and 2006 was $2.89, $2.32 and $1.77 per share, respectively.
For various price ranges, weighted average characteristics of outstanding stock options a December 31, 2006 were as follows:
Options Outstanding | Options Exercisable | |||||||||||||||||||
Range of | Outstanding | Remaining | Weighted Average | Exercisable | Weighted Average | |||||||||||||||
Exercise Prices | at 12/31/06 | Contractual Life | Exercise Price | at 12/31/06 | Exercise Price | |||||||||||||||
| $ | 3.75 | - | 5.58 | 252,500 | 9.20 | $ | 4.90 | 251,666 | $ | 4.90 | ||||||||||
| 5.59 | - | 7.42 | 118,000 | 7.47 | 5.75 | 92,730 | 5.75 | |||||||||||||
| 7.43 | - | 9.25 | 2,088,000 | 6.69 | 9.25 | 1,990,000 | 9.25 | |||||||||||||
| 2,458,500 | 6.99 | 8.64 | 2,334,396 | 8.64 | ||||||||||||||||
8. Income Taxes
The components of the provision (benefit) for income taxes are as follows:
For the Years Ended December 31, | ||||||||||
2004 | 2005 | 2006 | ||||||||
(in thousands) | ||||||||||
| Current expense | ||||||||||
| Federal | $ | - | $ | - | $ | - | ||||
| State | 65 | 243 | 143 | |||||||
| Total current expense | 65 | 243 | 143 | |||||||
| Deferred tax expense | 353 | 320 | (1,156 | ) | ||||||
| Income tax expense | $ | 418 | $ | 563 | $ | (1,013 | ) | |||
The significant components of deferred income tax (benefit) expense are as follows:
For the Years Ended December 31, | ||||||||||
2004 | 2005 | 2006 | ||||||||
(in thousands) | ||||||||||
| Deferred tax (benefit) expense | $ | (4,299 | ) | $ | (5,127 | ) | $ | (8,556 | ) | |
| Net operating loss carryforward | 56 | (3,257 | ) | (5,172 | ) | |||||
| Valuation allowance | 4,596 | 8,704 | 12,572 | |||||||
| Deferred income tax expense | $ | 353 | $ | 320 | $ | (1,156 | ) | |||
As part of the acquisition of FSS, a net deferred tax liability was recorded, all of which except the state portion of approximately $149,000 will be offset by existing deferred tax assets. The state deferred tax liability is related to states that tax in separate jurisdictions. The opening balance of approximately $149,000 was recorded to goodwill.
INTEGRATED ALARM SERVICES GROUP, INC. AND SUBSIDIARIES
NOTES TO CONSOLIDATED FINANCIAL STATEMENTS (continued)
8. Income Taxes (cont.)
The tax effects of temporary differences that give rise to significant portions of the deferred tax assets and deferred tax liabilities at December 31, 2005 and 2006 are as follows:
December 31, | |||||||
2005 | 2006 | ||||||
(in thousands) | |||||||
| Current deferred tax assets (liabilities): | |||||||
| Allowance for bad debts | $ | 616 | $ | 234 | |||
| Accrued expenses and reserves | 981 | 897 | |||||
| Current deferred tax assets | 1,597 | 1,131 | |||||
| Valuation allowance | (1,597 | ) | (1,131 | ) | |||
| Net current deferred tax assets | - | - | |||||
| Long term deferred tax assets (liabilities): | |||||||
| Charitable contributions carryforward | 8 | 9 | |||||
| Customer contracts | 32,676 | 35,678 | |||||
| Non-compete agreements | (52 | ) | 146 | ||||
| Dealer relationships | (4,726 | ) | (3,454 | ) | |||
| Depreciation | (229 | ) | (617 | ) | |||
| Net operating loss carryforward | 10,302 | 15,474 | |||||
| Other intangibles- tax goodwill | (200 | ) | 4,737 | ||||
| Net long term deferred tax assets | 37,779 | 51,973 | |||||
| Valuation allowance | (39,361 | ) | (52,399 | ) | |||
| Net deferred tax assets (liabilities) | $ | (1,582 | ) | $ | (426 | ) | |
The deferred tax liability of approximately $1,582,000 and $426,000 as of December 31, 2005 and 2006, respectively, represents the state deferred tax liability of IASG which cannot be offset by the state deferred tax asset of its subsidiaries due to the companies being subject to state taxes in different state tax jurisdictions and for 2005 only, deferred tax liabilities relating to tax goodwill basis differences associated with acquisitions.
The details of the deferred tax valuation allowance are as follows:
(in thousands) | ||||
| Balance at January 1, 2004 | $ | 29,392 | ||
| Valuation allowance established as a result of operations | 4,596 | |||
| Balance at December 31, 2004 | 33,988 | |||
| Valuation allowance established as a result of operations | 8,704 | |||
| Reduction to allowance relating to acquisition deferred tax liabilities | (1,734 | ) | ||
| Balance at December 31, 2005 | 40,958 | |||
| Valuation allowance established as a result of operations | 12,572 | |||
| Balance at December 31, 2006 | $ | 53,530 | ||
INTEGRATED ALARM SERVICES GROUP, INC. AND SUBSIDIARIES
NOTES TO CONSOLIDATED FINANCIAL STATEMENTS (continued)
8. Income Taxes (cont.)
The provision for income taxes differs from the amount computed by applying the federal statutory income tax rate of 34% as follows:
December 31, | ||||||||||
2004 | 2005 | 2006 | ||||||||
| Pretax (loss) at statutory tax rate | (34.00)% | (34.00)% | (34.00)% | |||||||
| Effect of state taxes, net of federal benefit | 0.38 % | 0.74 % | 0.11 % | |||||||
| Effect of net deferred state taxes, net of federal benefit | (0.34)% | (2.92)% | ) | (1.33)% | ||||||
| Valuation allowance | 40.67 % | 39.98 % | 14.80 % | |||||||
| Goodwill impairment | - % | - % | 19.56 % | |||||||
| Effect of changes in state tax rates and tax return true-up | (11.33)% | (2.98)% | - % | |||||||
| Effect of permanent differences | 8.26 % | 1.90% | 0.05 % | |||||||
| Other, net | 0.06 % | (0.13)% | (0.38)% | |||||||
| Provision for income tax | 3.70 % | 2.59 % | (1.19)% | |||||||
The goodwill impairment charge was allocated between non-deductible goodwill and the goodwill that is eligible for amortization for tax purposes over a fifteen year period and included in the detail of temporary differences. An amount of $16,200,000 was allocated to goodwill eligible for tax deductible amortization and the remaining amount of $48,800,000 was allocated to goodwill for which there is no tax deductible basis that gives rise to the above permanent difference.
December 31, 2006, the Company has approximately $50,852,000 of net operating loss carryforwards, which begin to expire in 2020. As the result of ownership changes caused by the IPO and related to the acquisition of Lane, approximately $23,565,000 of these net operating losses are subject to Internal Revenue Code (“IRC”) Section 382 limitations, which significantly limits the Company’s ability to utilize these net operating losses on an annual basis. As a result of IRC Section 382 limitations approximately $9,268,000 of the net operating loss can not be utilized. Approximately $28,872,000 of these net operating losses are currently available and approximately $12,712,000 of the carryforwards, subject to certain limitations, will become available in future years. Additionally, as a result of the acquisition of Lane, the Company acquired customer contracts that have a tax basis that is approximately $28,539,000 in excess of book basis. A portion of this excess tax basis is considered to be a built-in loss pursuant to IRC Section 382 and is also subject to an IRC Section 382 limitation, which significantly limits the Company’s ability to utilize the tax amortization deduction from these contracts on an annual basis. The Company reduced the gross carrying value of its deferred tax assets to reflect the amount that will not be utilized due to section 382 in the amount of approximately $4,009,000 and $3,427,000 in 2005 and 2006, respectively.
In assessing whether deferred tax assets are realizable, management considers whether or not it is more likely than not that some portion or all deferred tax assets will be realized. The ultimate realization of deferred tax assets is dependent upon the generation of future taxable income during the periods in which those temporary differences become deductible. Management considers the projected future taxable income and tax planning strategies in making this assessment.
If the portion of the valuation allowance associated with the acquisitions is reversed in the future, the benefit of any reversal would (a) first be applied to reduce to zero any goodwill related to the acquisitions (b) second to reduce to zero other non-current intangible assets related to the acquisitions and (c) third to reduce income tax expenses.
INTEGRATED ALARM SERVICES GROUP, INC. AND SUBSIDIARIES
NOTES TO CONSOLIDATED FINANCIAL STATEMENTS (continued)
9. Loss Per Common Share
Loss per common share is as follows:
December 31, | ||||||||||
2004 | 2005 | 2006 | ||||||||
(in thousands, except per share data) | ||||||||||
| Numerator: | ||||||||||
| Net income (loss) | $ | (11,717 | ) | $ | (22,332 | ) | $ | (83,915 | ) | |
| Denominator: | ||||||||||
| Weighted average shares outstanding | 24,667,960 | 24,662,198 | 24,368,836 | |||||||
| Basic and diluted income (loss) per share | $ | (0.47 | ) | $ | (0.91 | ) | $ | (3.44 | ) | |
The shares represented by options and convertible promissory notes below have not been included as common stock equivalents, as they would be anti-dilutive.
As of December 31, | |||||||||||||||||||
2004 | Weighted Average Option Price | 2005 | Weighted Average Option Price | 2006 | Weighted Average Option Price | ||||||||||||||
Stock options and convertible promissory notes outstanding are as follows: | |||||||||||||||||||
| Convertible promissory notes | 753,153 | $ | 6.94 | - | $ | - | - | $ | - | ||||||||||
| Stock option plans | 186,166 | 6.65 | 218,416 | 6.37 | 418,500 | 5.63 | |||||||||||||
| Shareholder options | 1,900,000 | 9.25 | 2,040,000 | 9.25 | 2,040,000 | 9.25 | |||||||||||||
| Total | 2,839,319 | 2,258,416 | 2,458,500 | ||||||||||||||||
10. Commitments and Contingencies
Leases
The Company is obligated under operating leases for facility, property and equipment expiring at various dates through 2011. Rent expense amounted to approximately $1,601,000, $2,043,000 and $2,009,000 for the years ended December 31, 2004, 2005 and 2006, respectively.
In addition, the Company leases vehicles, telephone systems and computer equipment under capital leases.
Minimum future annual rental commitments under non-cancelable capital and operating leases at December 31, 2006 are as follows:
Year | Capital | Operating | |||||
(in thousands) | |||||||
| 2007 | $ | 385 | $ | 1,573 | |||
| 2008 | 289 | 1,027 | |||||
| 2009 | 199 | 661 | |||||
| 2010 | 130 | 359 | |||||
| 2011 and thereafter | 23 | 720 | |||||
| Total minimum lease payments | 1,026 | $ | 4,340 | ||||
| Less: amounts representing interest | 190 | ||||||
| Present value of minimum lease payments | 836 | ||||||
| Less: current portion | 321 | ||||||
| Long-term portion | $ | 515 | |||||
INTEGRATED ALARM SERVICES GROUP, INC. AND SUBSIDIARIES
NOTES TO CONSOLIDATED FINANCIAL STATEMENTS (continued)
10. Commitments and Contingencies (cont.)
In April 2003, the Company entered into a three-year contract with a committed two-year term with AT&T, Inc. for communications services. The minimum annual commitments and billing rates were renegotiated effective November 11, 2004. The terms of the agreement require the Company to use $1,360,000 in services in the first year and $1,250,000 per year in years two through four. Expense incurred under agreements with AT&T in 2004, 2005 and 2006 was approximately $1,684,000, $1,614,000 and $1,739,000 respectively.
Letters of Credit
The Company has outstanding commercial letters of credit totaling approximately $150,000. These letters of credit are collateralized with cash deposits which are included in restricted cash on our consolidated balance sheet.
Litigation
In March 2003, Protection One, a company engaged in the business of providing security and other alarm monitoring services to residential and commercial customers, brought an action against the Company in the Superior Court of New Jersey, Camden County for $1.4 million unspecified damages in connection with the Company’s purchase of certain alarm monitoring contracts from B&D Advertising Corp. B&D
had previously sold alarm monitoring contracts to Protection One. As part of such sales, B&D agreed not to solicit any customers whose contracts had been purchased and to keep certain information confidential. Protection One claims that the Company’s subsequent purchase of contracts from B&D constitutes tortious interference, that the Company utilized confidential information belonging to Protection One and that Protection One had an interest in some of the contracts that the Company purchased from B&D. The Company plans to vigorously defend this claim. The Company believes the resolution of this matter will not have a material adverse effect on our financial condition, results of operations or cash flows. This matter has been stayed pending the completion of the merger between Protection One and the Company, at which time it is expected that the matter will be dismissed by agreement of the parties, without costs or recovery by any party.
In December of 2005, Ira R. Beer, former president of the Company’s American Home Security, Inc (“AHS”) subsidiary in Las Vegas, brought an action against AHS and the Company in District Court for Clark County, Nevada. Mr. Beer sought monies allegedly due under a certain Employment Agreement dated November 21, 2003. Mr. Beer’s employment was terminated, for cause, on December 8, 2005. Mr. Beer’s lawsuit alleged that his termination was not for cause and that he was owed unpaid salary through the end of 2006 of some $440,000 and a certain “bonus buy-out” which he asserted to be approximately $2,192,000. The Company filed a counterclaim against Mr. Beer for derogation of his management duties. This matter was settled in it entirety in early December 2006 for approximately $1.76 million.
On June 26, 2006, the Company’s former president Thomas J. Few, Sr. initiated litigation against the Company in connection with his employment, seeking a monetary award for amounts allegedly due to him under an employment agreement. The claim was filed in the Superior Court of New Jersey, in the Bergen County Law Division. The principal parties to the suit are Thomas J. Few, Sr. and the Company. Mr. Few alleges that he is owed up to 36 months of pay as well as an amount representing accrued but unused vacation as a result of his resignation following the Company’s alleged breach of the employment agreement. Settlement negotiations have been unsuccessful and discovery proceedings are underway as ordered by the Bergen county Law Division.
The Company is involved in litigation and various legal matters that have arisen in the ordinary course of business. The Company does not believe that the outcome of these matters will have a material adverse effect on the Company’s financial position, results of operations or cash flows in a particular quarter or fiscal year.
Professional Fees
In August of 2006, the Company engaged Houlihan Lokey Howard & Zukin (“Houlihan Lokey”) as the financial advisor. Houlihan Lokey has been assisting the Company in negotiating the merger with Protection One, which is more fully disclosed in footnote 13. The aggregate fees payable to Houlihan Lokey are estimated to be approximately $2.4 million excluding out-of-pocket expenses reimbursable by the Company, of which $450,000 has been paid and the balance of which is payable contingent upon the consummation of the merger. The Company incurred approximately $470,000 during 2006 for Houlihan Lokey’s service.
11. Acquisitions
All goodwill on acquisitions completed in 2004 and 2005 was recorded in the alarm monitoring residential services segment except $1.2 million that was allocated to the wholesale services segment as a result of dealer relationships acquired with the NACC and FSS acquisitions.
On October 1, 2005, the Company purchased substantially all of the assets and assumed certain liabilities of Financial Security Services, Inc. (“FSS”) for an adjusted purchase price of approximately $23,062,000. The purchase price allocation was based on an independent valuation obtained by the Company.
INTEGRATED ALARM SERVICES GROUP, INC. AND SUBSIDIARIES
NOTES TO CONSOLIDATED FINANCIAL STATEMENTS (continued)
11. Acquisitions (cont’d)
The purchase price has been allocated to the fair value of assets acquired and liabilities assumed on the date of acquisition as follows:
October 1, 2005 | |||
(in thousands) | |||
Assets: | |||
| Accounts receivable | $ | 373 | |
| Property and equipment | 370 | ||
| Notes receivable | 14,411 | ||
| Dealer relationships | 3,100 | ||
| Customer contracts | 563 | ||
| Other identifiable intangibles | 330 | ||
| Goodwill | 4,015 | ||
| Total assets | 23,162 | ||
Liabilities: | |||
| Accrued expenses | 92 | ||
| Deferred revenue | 8 | ||
| Total liabilities | 100 | ||
| Net purchase price | $ | 23,062 | |
This acquisition brought to the Company an established market of alarm dealers who required financing. FSS also owned a portfolio of residential customer contracts, provided monitoring to dealers on a wholesale basis and had an assembled workforce. The major intangible asset classes acquired were Dealer relationships and customer contracts which have a weighted average amortization period of 15.0 years and 3.9 years, respectively. The remaining intangible assets have a weighted average amortization period of 6.3 years. The weighted average life of the total intangible assets acquired is 12.7 years.
Tax deductible goodwill associated with this acquisition is approximately $2,366,000 at December 31, 2006.
The following unaudited pro forma combined results of operations have been prepared as if the FSS acquisition had occurred as of the beginning of the periods presented:
Year Ended December 31, | |||||||
2004 | 2005 | ||||||
(in thousands, except per share data) | |||||||
| Revenue: | |||||||
| Monitoring fees | $ | 28,501 | $ | 34,160 | |||
| Customer accounts | 51,440 | 58,752 | |||||
| Related party monitoring fees | 171 | 122 | |||||
| Service and installation | 5,336 | 8,303 | |||||
| Total Revenue | 85,448 | 101,337 | |||||
| Income (loss) from operations | (3,364 | ) | (9,733 | ) | |||
| Income (loss) before income taxes | (10,692 | ) | (22,267 | ) | |||
| Net income (loss) | $ | (11,261 | ) | $ | (22,916 | ) | |
| Net income (loss) per share | $ | (0.46 | ) | $ | (0.93 | ) | |
The proforma results of operations do not purport to represent what the Company’s results of operations would actually have been had the acquisitions been affected for the periods presented, or to predict the Company’s results of operations for any future periods.
The Company purchased substantially all of the assets and assumed certain liabilities of National Alarm Computer Center, Inc. a unit of Tyco International Ltd.’s Fire and Security Segment (NYSE: TYC) and certain assets from Tyco (collectively “NACC”) on November 19,
INTEGRATED ALARM SERVICES GROUP, INC. AND SUBSIDIARIES
NOTES TO CONSOLIDATED FINANCIAL STATEMENTS (continued)
11. Acquisitions (cont.)
2004 for a total purchase price of $50.6 million. The amount paid due to NACC for the purchase of the business was approximately $50,880,000. This represents the contractual purchase price of approximately $49,190,000 and a working capital adjustment (net of cash) of approximately $1,690,000. The NACC acquisition brought to the Company an established market of alarm dealers who required financing. NACC also owned a portfolio of residential customer contracts, provided monitoring to dealers on a wholesale basis and had an assembled workforce.
The following unaudited pro forma combined results of operations have been prepared as if the NACC acquisition had occurred as of the beginning of the period presented:
December 31, 2004 | ||||
(in thousands, except per share data) | ||||
| Revenue: | ||||
| Monitoring fees | $ | 33,565 | ||
| Customer accounts | 55,126 | |||
| Billing fees | - | |||
| Related party monitoring fees | 171 | |||
| Related party placement fees | - | |||
| Service and installation | 5,591 | |||
| Total Revenue | 94,453 | |||
| Income (loss) from operations | (2,871 | ) | ||
| Income (loss) before income taxes | (15,461 | ) | ||
| Net income (loss) | $ | (15,919 | ) | |
| Net income (loss) per share | $ | (0.65 | ) | |
The pro forma results of operations do not purport to represent what the Company's results of operations would actually have been had the acquisition been effected for the periods presented, or to predict the Company's results of operations for any future period.
During May 2004, the Company acquired the alarm portfolio and certain other assets of Alliant Protection Services, Inc. for a total purchase price of $14.5 million. Alliant brought to the Company an established regional market of residential and commercial customer contracts. It also had an assembled workforce to provide service as well as to install new alarm systems and expand operations of the business.
The operating results of Alliant have been included in the Company’s consolidated results since the date of acquisition (May 21, 2004). The pro forma revenue and results of operations for this acquisition, had the acquisition occurred at the beginning of 2004 is not significant, and accordingly, have not been provided.
12. Disposal of Assets
During the second quarter of 2006, the Company sold alarm contracts in Colorado, Idaho and Utah for $7,100,000 and other assets including inventory, vehicles and deposits valued at approximately $224,000. The Company received a cash payment of approximately $762,000 (which has been classified as “Advanced payment”) and the balance of approximately $6,512,000 in the form of a promissory note due December 31, 2006. The Company incurred direct and incremental costs related to the transaction in the aggregate amount of $377,000, which is reflected in the table below as prepaid expenses. The note bears interest of 12% per annum with interest payable monthly. If no event of default has occurred, the buyer has the option up to December 31, 2006 to pay $1 million on the note to extend its maturity date to July 1, 2007 with interest of 13% per annum. The agreement includes a sales price adjustment for an attrition guarantee for the six months ended November 30, 2006 when the contract attrition is more than 5% of the total recurring monthly revenue acquired. The total recurring monthly revenue (“RMR”) sold was $212,000. If the buyer incurs attrition in excess of $11,000 of the RMR, the Company will reimburse the buyer for the next approximately $11,000 of RMR that is lost at a rate of $34.773 per $1 of RMR lost, up to a maximum purchase price
INTEGRATED ALARM SERVICES GROUP, INC. AND SUBSIDIARIES
NOTES TO CONSOLIDATED FINANCIAL STATEMENTS (continued)
12. Disposal of Assets (cont.)
adjustment of approximately $369,000. The buyer did not make a payment on the note at December 31, 2006 as required by the terms. The buyer is negotiating financing with a lender which, if successful, would result in paying all but $500,000 of the outstanding promissory note balance. Based upon the revised terms being negotiated including the impact from attrition for the six months ended November 30, 2006, the carrying value of the customer contracts was reduced by an additional $513,000 in the fourth quarter of 2006 and the remaining note balance is expected to be collateralized by alarm contracts and due in one year from signing. The Company will continue to provide the monitoring and billing services until the note is paid. The sale will be recognized when the note is paid in full, the attrition guarantee has been settled, and continuing involvement (monitoring services) has ceased. The assets and liabilities of the business transferred have been separately segregated on the consolidated balance sheet at December 31, 2006. The net assets of the business transferred were determined to be impaired; as a result the Company recognized a $1,013,000 charge to operations during 2006.
The following table summarizes assets and liabilities sold:
Assets | Liabilities | ||||||
(in thousands) | |||||||
| Customer contract, net | $ | 4,869 | $ | - | |||
| Deferred revenue | - | 639 | |||||
| Deferred customer acquisition, net | 331 | - | |||||
| Misc A/R | 47 | - | |||||
| Property and equipment, net | 223 | - | |||||
| Inventories | 50 | - | |||||
| Capital Lease obligations | - | 164 | |||||
| Accrued Expenses | - | 240 | |||||
| Other assets | 144 | - | |||||
| Prepaid expenses | 377 | - | |||||
| Goodwill | 2,659 | - | |||||
| Loss on transfer of business | (1,013 | ) | - | ||||
| $ | 7,687 | $ | 1,043 | ||||
13. Merger
On December 20, 2006, Protection One, Inc. (“Protection One”), Integrated Alarm Services Group, Inc. (“IASG”) and Tara Acquisition Corp., a direct, wholly owned subsidiary of Protection One (“Tara”), entered into an Agreement and Plan of Merger (the “Merger Agreement”) pursuant to which Protection One will acquire IASG (the “Merger”). If IASG’s Board of Directors withdraws or modifies the Merger Agreement in a manner adverse to Protection One or its recommendation of the merger, the Company may be subject to a $7.5 million payment to Protection One consisting of a termination fee and reimbursement of expenses.
Subject to the terms and conditions of the Merger Agreement, which has been unanimously approved by the boards of directors of Protection One and IASG, upon the completion of the Merger, each share of IASG common stock will be converted into 0.29 shares of Protection One common stock, with cash to be paid in lieu of fractional shares. On March 27, 2007, the Shareholders of IASG will vote on adoption of the Merger Agreement. If approved by the Shareholders, the merger is scheduled to be consummated on April 2, 2007.
14. Related Party Transactions
As discussed throughout the footnotes to the combined and consolidated financial statements, the Company has had significant transactions with related parties. Whether the terms of these transactions would have been the same had they been between non-related parties cannot be determined.
IASG provides alarm monitoring services to related parties which are owned by former management of the Company who are also stockholders. Revenue earned from these alarm monitoring services was approximately $171,000, 122,000 and $100,000 for the years ended December 31, 2004, 2005 and 2006.
INTEGRATED ALARM SERVICES GROUP, INC. AND SUBSIDIARIES
NOTES TO CONSOLIDATED FINANCIAL STATEMENTS (continued)
14. Related Party Transactions(cont.)
During November 2005, the Company borrowed approximately $2,500,000 from and entity controlled by stockholders of the Company for a seven day period at a 7.6% interest rate. This was done as the bank credit line was temporarily unavailable during a bank due diligence review. The total interest expense was approximately $4,000. The transaction was approved by the independent directors of the Company.
Suzanne Sweeney, the daughter of Mr. Few, Sr. (former Vice Chairman and President), is Director of Legal Affairs, and has received aggregate compensation of approximately $130,000, $136,000 and $130,000 for fiscal years 2004, 2005 and 2006, respectively.
Jeffrey Few, the son of Mr. Few, Sr. was Vice President of Sales and has received aggregate compensation of approximately $135,000, $133,000 and $98,000 for fiscal years 2004, 2005 and 2006, respectively. His employment with the Company was terminated during 2006.
Thomas Few, Jr., the son of Mr. Few, Sr. is Vice President of Sales and Marketing and has received aggregate compensation of approximately $127,000, $154,000 and $176,000 for fiscal years 2004, 2005 and 2006, respectively.
Robert W. Few, the son of Mr. Few, Sr. is Vice President of Operations—Criticom International Corp. and has received aggregate compensation of approximately $96,000, $101,000 and $96,000 for fiscal years, 2004, 2005 and 2006, respectively.
Kathleen Few, the daughter of Mr. Few, Sr. was National Manager of Dealer Care Centers and has received aggregate compensation of approximately $53,000, $70,000 and $52,000 for fiscal years 2004, 2005 and 2006, respectively. Her employment with the Company was terminated during 2006.
Mary Ann McGinn, the former wife of Mr. McGinn (Chairman of the Board and Chief Executive Officer), was Senior Vice President—Legal Affairs and remained a consultant to our Company through 2005. She has received aggregate compensation of approximately $132,000, $145,000 for fiscal years 2004 and 2005, respectively.
Amounts due from related parties at:
December 31, | ||||||
2005 | 2006 | |||||
(in thousands) | ||||||
| Unreimbursed disbursements: | ||||||
| SPT Trusts | $ | 36 | $ | 93 | ||
| Capital Trust | 26 | 12 | ||||
| Other Trusts | 25 | 54 | ||||
| $ | 87 | $ | 159 | |||
Amounts due to related parties at:
December 31, | ||||||
2005 | 2006 | |||||
(in thousands) | ||||||
| Undistributed collections: | ||||||
| Other Trusts | $ | 61 | $ | 110 | ||
| $ | 61 | $ | 110 | |||
15. Fair Value of Financial Instruments
Fair value estimates, assumptions, and methods used to estimate the fair value of the Company’s financial instruments are made in accordance with the requirements of SFAS No. 107, “Disclosure about Fair Value of Financial Instruments”. The Company has used available information to derive its estimates. However, because these estimates are made as of a specific point in time, they are not necessarily indicative of amounts the Company could realize currently. The use of different assumptions or estimating methods may have a material effect on the estimated fair value amounts.
INTEGRATED ALARM SERVICES GROUP, INC. AND SUBSIDIARIES
NOTES TO CONSOLIDATED FINANCIAL STATEMENTS (continued)
15. Fair Value of Financial Instruments (cont.)
The carrying values of the Company’s financial instruments (including cash and cash equivalents, accounts receivable, accounts payable, accrued expenses and deferred revenue) as of December 31, 2004, 2005 and 2006 are a reasonable estimate of their fair value due to the short-term nature of the instruments. The carrying value of the Company’s bank debt and notes receivable approximates fair value because substantially they are the result of recent transactions. The notes receivable acquired as a result of the acquisition of FSS were discounted to fair value as of the October 1, 2005 acquisition date. The $125,000,000 of senior secured notes payable were entered into on November 16, 2004 and are currently trading at approximately par value.
16. Benefit Plans
Effective September 1, 2004, the parent Company and its subsidiaries merged their three 401(k) plans into one plan which provides benefits to all Company employees meeting customary eligibility requirements. The Company matches 50% of employees’ contributions up to 6% of employee compensation. The Company matching contributions are discretionary and subject to management review and approval. The total expense for all 401(k) plans was approximately $168,000, $267,000 and $215,000 for the years ended December 31, 2004, 2005 and 2006, respectively.
The Company maintained various plans that provided health, dental and life insurance benefits to all eligible employees. The total cost of health, dental and life insurance benefits was approximately $1,291,000, $3,460,000 and $3,307,000 for the years ended December 31, 2004, 2005 and 2006, respectively.
17. Segment and Related Information
During the third quarter of 2006, the Company realigned its segments. Prior period segment information for the year ended December 31, 2005 has been retroactively adjusted to reflect this realignment. The Company is unable to retroactively adjust segment information for the year ended December 31 2004 as the necessary data is not available. Effective third quarter of 2006, IASG has three reportable segments: alarm-monitoring wholesale services, alarm-monitoring residential services and alarm-monitoring commercial services. The Company has determined its reportable segments based on its method of internal reporting which is used by management for making operational decisions and assessing performance.
The alarm-monitoring wholesale services segment provides monitoring services to a broad range of independent alarm-monitoring dealers. The alarm-monitoring residential services segment provides monitoring services to its end customers, working capital to independent alarm-monitoring dealers and customer service and billing and collection services to our portfolio of accounts. This is accomplished by purchasing alarm monitoring contracts from the dealer or by providing loans using the dealer’s alarm monitoring contracts as collateral. IASI provides monitoring services (through IASG and other affiliated and non-affiliated entities) to its customers through the wholesale segment. The alarm-monitoring commercial services segment is a commercial security integrator that provides installation, testing and maintenance for commercial customers as well as monitoring services to its end customers.
The accounting policies of each of the segments are the same as those described in the summary of significant accounting policies, as outlined in Note 2. Management has determined that an appropriate measure of the performance of its operating segments would be made through an evaluation of each segment's income (loss) before income taxes. The Company does not allocate corporate accounting, legal and other professional fees, corporate salaries, benefits and other compensation, director related expenses and other corporate expenses to the segments because the decision making for the majority of these expenses does not reside within the segments. Interest related changes are allocated to the segments based on inter-company agreements in place during the specific year. Accordingly, the Company's summarized financial information regarding the Company's reportable segments is presented through income (loss) before income taxes for the years ended December 31, 2004, 2005 and 2006.
INTEGRATED ALARM SERVICES GROUP, INC. AND SUBSIDIARIES
NOTES TO CONSOLIDATED FINANCIAL STATEMENTS (continued)
17. Segment and Related Information (cont.)
Summarized financial information for the years ended December 31, 2004, 2005 and 2006, concerning the Company's reportable segments is shown in the following tables:
For the Year Ended December 31, 2006: | ||||||||||||||||
Wholesale | Residential | Commercial | Corporate and Eliminations | Consolidated Total | ||||||||||||
(in thousands) | ||||||||||||||||
| Total revenue | $ | 31,953 | $ | 44,593 | $ | 17,818 | $ | - | $ | 94,364 | ||||||
| Intersegment revenue | 4,753 | - | - | (4,753 | ) | - | ||||||||||
| Interest income | - | 3,782 | - | 636 | 4,418 | |||||||||||
| Interest expense | 1 | 37 | 51 | 16,155 | 16,244 | |||||||||||
| Income (loss) before income taxes | 6,543 | (44,570 | ) | (17,847 | ) | (29,054 | ) | (84,928 | ) | |||||||
| Total assets | 45,949 | 94,305 | 32,381 | 16,081 | 188,716 | |||||||||||
| Goodwill | 9,063 | 10,759 | 6,411 | - | 26,233 | |||||||||||
| Purchase of customer contracts, | ||||||||||||||||
| dealer relationships and businesses | - | 13,352 | - | - | 13,352 | |||||||||||
| Depreciation and amortization | 5,824 | 18,361 | 2,964 | 17 | 27,166 | |||||||||||
| Amortization of deferred customer | ||||||||||||||||
| acquisition costs | - | 401 | 1,595 | - | 1,996 | |||||||||||
| During 2006, goodwill of approximately $1.2 million was reallocated to the wholesale segment from the residential segment based upon assets acquired in 2004 and 2005 in the NACC and FSS acquisitions. | ||||||||||||||||
For the Year Ended December 31, 2005: | ||||||||||||||||
Wholesale | Residential | Commercial | Corporate and Eliminations | Consolidated Total | ||||||||||||
(in thousands) | ||||||||||||||||
| Total revenue | $ | 31,610 | $ | 49,323 | $ | 18,301 | $ | - | $ | 99,234 | ||||||
| Intersegment revenue | 4,796 | - | - | (4,796 | ) | - | ||||||||||
| Interest income | - | 4,353 | - | 485 | 4,838 | |||||||||||
| Interest expense | 20 | 3 | 51 | 16,935 | 17,009 | |||||||||||
| Income (loss) before income taxes | 1,432 | 7,446 | (2,371 | ) | (28,276 | ) | (21,769 | ) | ||||||||
| Total assets | 49,525 | 161,901 | 44,922 | 16,726 | 273,074 | |||||||||||
| Goodwill | 7,868 | 76,344 | 10,707 | - | 94,919 | |||||||||||
| Purchase of customer contracts, | ||||||||||||||||
| dealer relationships and businesses | 3,486 | 32,655 | - | - | 36,141 | |||||||||||
| Depreciation and amortization | 5,708 | 18,959 | 3,905 | - | 28,572 | |||||||||||
| Amortization of deferred customer | ||||||||||||||||
| acquisition costs | - | 545 | 1,158 | - | 1,703 | |||||||||||
| Effective in 2006, the Company's segment reporting was expanded such that the segment formerly referred to as retail was divided into the residential and commercial segments. The Company has assessed its ability to report information for 2004 in conformity with this expanded segment structure and found it to be impractical. The branch operational structure in place prior to 2005 did not capture revenue or costs by the residential and commercial classifications. As such, the information for 2004 will be presented based on the segment structure in existence during 2004. | ||||||||||||||||
INTEGRATED ALARM SERVICES GROUP, INC. AND SUBSIDIARIES
NOTES TO CONSOLIDATED FINANCIAL STATEMENTS (continued)
17. Segment and Related Information (cont.)
For the Year Ended December 31, 2004: | |||||||||||||
Wholesale | Retail | Corporate and Eliminations | Consolidated Total | ||||||||||
(in thousands) | |||||||||||||
| Total revenue | $ | 24,274 | $ | 56,095 | $ | - | $ | 80,369 | |||||
| Intersegment revenue | 3,416 | - | (3,416 | ) | - | ||||||||
| Interest income | - | 1,362 | 91 | 1,453 | |||||||||
| Interest expense | 34 | 6,484 | 2,368 | 8,886 | |||||||||
| Income (loss) before income taxes | 2,359 | (5,902 | ) | (7,756 | ) | (11,299 | ) | ||||||
| Total assets | 51,215 | 221,099 | 29,770 | 302,084 | |||||||||
| Goodwill | 7,849 | 83,586 | - | 91,435 | |||||||||
| Purchase of customer contracts, | |||||||||||||
| dealer relationships and businesses | 18,730 | 60,891 | - | 79,621 | |||||||||
| Depreciation and amortization | 4,896 | 18,117 | - | 23,013 | |||||||||
| Amortization of deferred customer | |||||||||||||
| acquisition costs | - | 629 | - | 629 | |||||||||
Reconciliation of segment income (loss) before income taxes to consolidated income (loss) before income taxes: | ||||||||||
For the Year Ended December 31, | ||||||||||
2004 | 2005 | 2006 | ||||||||
(in thousands) | ||||||||||
| Income (loss) before income taxes: | ||||||||||
| Alarm-Monitoring - Wholesale Services | $ | 2,359 | $ | 1,432 | $ | 6,543 | ||||
| Alarm-Monitoring - Retail Services | (5,902 | ) | - | - | ||||||
| Alarm-Monitoring - Residential Services | - | 7,446 | (44,570 | ) | ||||||
| Alarm-Monitoring - Commercial Services | - | (2,371 | ) | (17,847 | ) | |||||
| Unallocated Expenses: | ||||||||||
| Corporate accounting, legal and other professional services | (1,964 | ) | (5,724 | ) | (4,994 | ) | ||||
| Corporate salaries, benefits and other compensation | (1,386 | ) | (2,421 | ) | (3,330 | ) | ||||
| Director and officer related expenses | (1,306 | ) | (1,117 | ) | (1,168 | ) | ||||
| Interest expense, net | (2,277 | ) | (16,450 | ) | (15,519 | ) | ||||
| Amortization of debt issuance costs | (279 | ) | (1,080 | ) | (973 | ) | ||||
| Litigation settlement | (64 | ) | (624 | ) | (1,341 | ) | ||||
| Travel, lodging and meals | (77 | ) | (170 | ) | (300 | ) | ||||
| Stock-based compensation | - | - | (386 | ) | ||||||
| Other corporate expenses | (403 | ) | (690 | ) | (1,043 | ) | ||||
| Consolidated income (loss) before income taxes | $ | (11,299 | ) | $ | (21,769 | ) | $ | (84,928 | ) | |
INTEGRATED ALARM SERVICES GROUP, INC. AND SUBSIDIARIES
NOTES TO CONSOLIDATED FINANCIAL STATEMENTS (continued)
18. Selected Quarterly Financial data (Unaudited)
March 31 | June 30 | September 30 | December 31 | ||||||||||
(amounts in thousands, except for per share amounts) | |||||||||||||
2006 | |||||||||||||
| Total revenue | $ | 24,148 | $ | 23,070 | $ | 23,051 | $ | 24,095 | |||||
| Cost of revenue (excluding depreciation and amortization) | 9,451 | 9,751 | 9,226 | 9,737 | |||||||||
| Total expenses | 24,046 | 26,005 | 90,268 | 26,174 | |||||||||
| Income (loss) from operations | 102 | (2,935 | ) | (67,217 | ) | (2,079 | ) | ||||||
| Net income (loss) | (3,414 | ) | (6,447 | ) | (69,340 | ) | (4,714 | ) | |||||
| Basic and diluted income (loss) per share | $ | (0.14 | ) | $ | (0.26 | ) | $ | (2.85 | ) | $ | (0.19 | ) | |
| Weighted average number of shares of | |||||||||||||
| common stock outstanding | 24,369 | 24,369 | 24,369 | 24,369 | |||||||||
2005 | |||||||||||||
| Total revenue | $ | 24,458 | $ | 24,688 | $ | 24,501 | $ | 25,587 | |||||
| Cost of revenue (excluding depreciation and amortization) | 10,319 | 10,429 | 10,781 | 11,852 | |||||||||
| Total expenses | 23,699 | 27,427 | 26,384 | 30,242 | |||||||||
| Income (loss) from operations | 759 | (2,739 | ) | (1,883 | ) | (4,655 | ) | ||||||
| Net income (loss) | (2,586 | ) | (6,339 | ) | (5,429 | ) | (7,978 | ) | |||||
| Basic and diluted income (loss) per share | $ | (0.10 | ) | $ | (0.26 | ) | $ | (0.22 | ) | $ | (0.32 | ) | |
| Weighted average number of shares of | |||||||||||||
| common stock outstanding | 24,681 | 24,681 | 24,681 | 24,605 | |||||||||
Pursuant to the requirements of Section 13 or 15(d) of the Securities Exchange Act of 1934, the Registrant has duly caused this report to be signed on its behalf by the undersigned, thereunto duly authorized.
&# 160;
Integrated Alarm Services Group, Inc.
| Dated: March 16, 2007 | By: /s/ Charles T. May | |
| Charles T. May | ||
| Acting President and Chief Executive Officer | ||
Pursuant to the requirements of the Securities Exchange Act of 1934, this report has been signed by the following persons on behalf of the registrant in the capacities and on the dates indicated.
Date | Title | Signature |
| Dated: March 16, 2007 | Acting President and Chief Executive | By: /s/ Charles T. May |
| Officer and Principal Executive Officer | Charles T. May | |
| Dated: March 16, 2007 | Chief Financial Officer and | By: /s/ Michael T. Moscinski |
| Principal Accounting Officer | Michael T. Moscinski | |
| Dated: March 16, 2007 | Director | By: /s/ Raymond C. Kubacki |
| Raymond C. Kubacki | ||
| Dated: March 16, 2007 | Non-Executive Chairman of the Board | By: /s/ John W. Mabry |
| John W. Mabry | ||
| Dated: March 16, 2007 | Director | By: /s/ Ralph S. Michael, III |
| Ralph S. Michael, III | ||
| Dated: March 16, 2007 | Director | By: /s/ Jason B. Mudrick |
| Jason B. Mudrick | ||
| Dated: March 16, 2007 | Director | By: /s/ Timothy J. Tully |
| Timothy J. Tully | ||
| Dated: March 16, 2007 | Director | By: /s/ Arlene M. Yocum |
| Arlene M. Yocum |