Roth 2008 OC Growth Stock
Conference
February 19, 2008
1
1

Safe Harbor Statement
The Private Securities Litigation Reform Act of 1995 provides a safe
harbor for forward-looking information made on the Company's
behalf. All statements, other than statements of historical facts which
address the Company's expectations of sources of capital or which
express the Company's expectation for the future with respect to
financial performance or operating strategies, can be identified as
forward-looking statements. Such statements made by the company
are based on knowledge of the environment in which it operates, but
because of the factors previously listed, as well as other factors
beyond the control of the Company, actual results may differ
materially from the expectations expressed in the forward-looking
statements.
2
2

BooKoo Snapshot
BooKoo energy drinks launched in 2004
Among the leaders in sales and sales per point of distribution
Distributed in parts of the US and Canada
Coca-Cola, Pepsi, Cadbury, beer and others
Recent issues with Tier 1 Coke distribution strategy
Nielsen ACV coverage - 13%
Track record of innovation
Recognized taste leader in category
First 24 oz. can
First and only 5.75 oz. “shot”
Ready to launch the first energy ‘protein’ drink
3
3
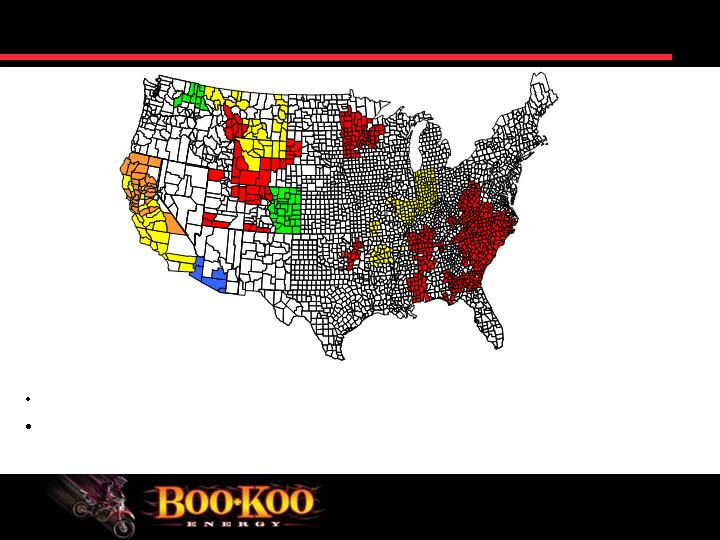
In discussions with several larger independent beverage and beer distributors.
Focus on supporting existing distributors with “pull” marketing.
Distribution Partners
Mineral
Nye
4
4
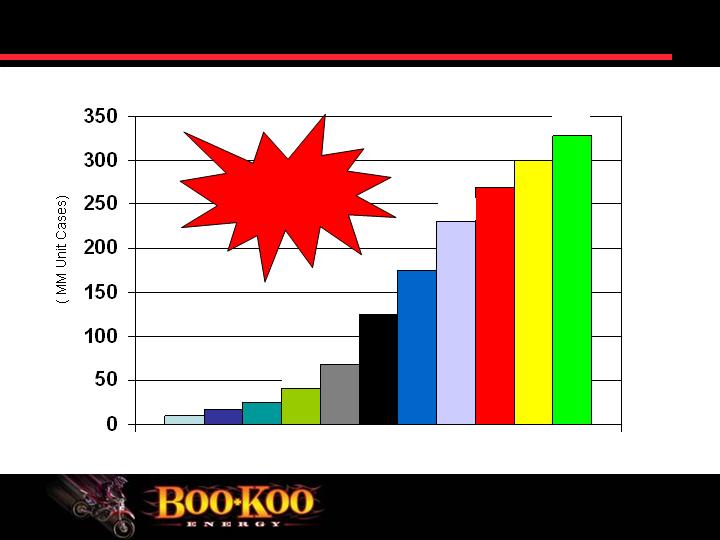
Source: Goldman Sachs Global Investment Research May 2006
2000 2001 2002 2003 2004 2005 2006E 2007E 2008E 2009E 2010E
136%
85%
74%
83%
51%
33%
18%
11%
10%
62%
Double digit volume
increases are expected
thru 2010
Energy Drink Volume and % Volume Change
5
5

AC Nielsen Sales Data
29.3
2,354,969,601
3,045,731,460
TOTAL ENERGY DRINK
Anheuser
9.6
8,858,180
9,712,422
180 R
Hansen
-35.5
17,725,960
11,436,650
LOST R
Rip It
62.5
8,049,648
13,081,042
RIP IT R
Coca-Cola
-48.6
26,093,654
13,414,265
FULL THROTTLE DT
Pepsi
N/A
0
13,895,898
JEFF GORDON 24 ENERGY R
Boo Koo
-7.7
23,070,542
21,286,537
BOO+KOO R
Pepsi
N/A
0
21,543,508
SOBE ESSENTIAL
Pepsi
7.6
37,083,427
39,886,599
SOBE DT
Coca-Cola
200.7
15,482,148
46,561,061
NOS R
Hansen
32.1
41,262,884
54,497,854
MONSTER ASSAULT R
Coca-Cola
56.0
64,332,025
100,354,229
ROCKSTAR DT
Pepsi
-22.9
206,214,831
159,028,839
SOBE R
Coca-Cola
6.1
167,860,499
178,165,668
ROCKSTAR R
Pepsi
43.1
126,679,661
181,286,580
AMP R
Coca-Cola
47.5
142,722,731
210,467,505
FULL THROTTLE R
Red Bull
41.9
152,044,091
215,719,565
RED BULL DT
Hansen
39.5
458,860,158
639,998,470
MONSTER R
Red Bull
36.8
716,206,508
979,674,235
RED BULL R
Affiliation
% Change
Last Year $
Retail Sales $
BRAND
AC Nielsen Total U.S.-CTMM 52 weeks 12-29-07
6
6

Source: AC Nielsen
¹ All Commodity Volume (“ACV”) is a measure of retail distribution that represents the percent of total stores that carry the product
Distribution Opportunity
AC Nielsen Total U.S.-CTMM 52 weeks 12-29-07
Pepsi
243,788
57
13,895,898
JEFF GORDON 24 ENERGY R
Hansen
408,452
28
11,436,650
LOST R
Coca-Cola
462,561
29
13,414,265
FULL THROTTLE DT
Pepsi
512,941
42
21,543,508
SOBE ESSENTIAL
Anheuser
647,495
15
9,712,422
180 R
Pepsi
848,651
47
39,886,599
SOBE DT
Hansen
908,298
60
54,497,854
MONSTER ASSAULT R
Coca-Cola
1,108,597
42
46,561,061
NOS R
Boo Koo
1,637,426
13
21,286,587
BOO+KOO R
Coca-Cola
2,007,085
50
100,354,229
ROCKSTAR DT
Pepsi
2,149,038
74
159,028,839
SOBE R
Rip It
2,180,174
6
13,081,042
RIP IT R
Pepsi
2,266,082
80
181,286,580
AMP R
Coca-Cola
2,440,626
73
178,165,668
ROCKSTAR R
Coca-Cola
2,664,146
79
210,467,505
FULL THROTTLE R
Red Bull
2,696,495
80
215,719,565
RED BULL DT
Hansen
7,190,994
89
639,998,470
MONSTER R
Red Bull
10,648,633
92
979,674,235
RED BULL R
Affiliation
$ Sales per Point of
Distribution
ACV %
Retail Sales $
BRAND
7
7

Milestones in 2007
Consistent pricing structure
Renegotiated vendor/supplier agreements
Improved quality of distributor network
Coca-Cola Consolidated (2nd largest Coke Bottler – NASDAQ:COKE)
Leading Brands of Canada (NASDAQ: LBIX)
Formed strategic partnerships
Circle K
Focus on innovation
Fruit Punch
Burner
Wet Vitamin
Took Company public through a reverse merger in conjunction with
a PIPE
8
8

The Boo Koo Brand Position Hierarchy
For: Older Millennia and
Generation X-ers who have more
mainstream values and
entertainment lifestyles
Boo Koo is: An alternative to the
traditional bad tasting energy
drinks and comes in five great
flavors.
Overall positioning: Boo Koo has
more energy, great taste and
provides better performance when
you need it.
Target/insight : Who the
brand needs to be most
relevant to and they’re
needs
Frame of Reference:
Categorization and
differentiated relative to
the competition
Brand offers unique and
relevant benefits to its
target audience – for
consumers who want to
be their best
9
9

Q1 “Pull” Marketing Campaign
Coke Consolidated and Coke United promotion – 9 markets – 6
week promotion
Raleigh, Charlotte, Birmingham, Nashville, plus 5 more markets
Consumer have a chance to win up to $1m – many other prizes
Promoted through local radio stations and retailers
“Large Crowd” events – basketball games, concerts, etc.
Trial/volume generating program
Sampling teams will be in place to sample product
In store POS tie in
Start date February 4, ends in mid-March
10
10
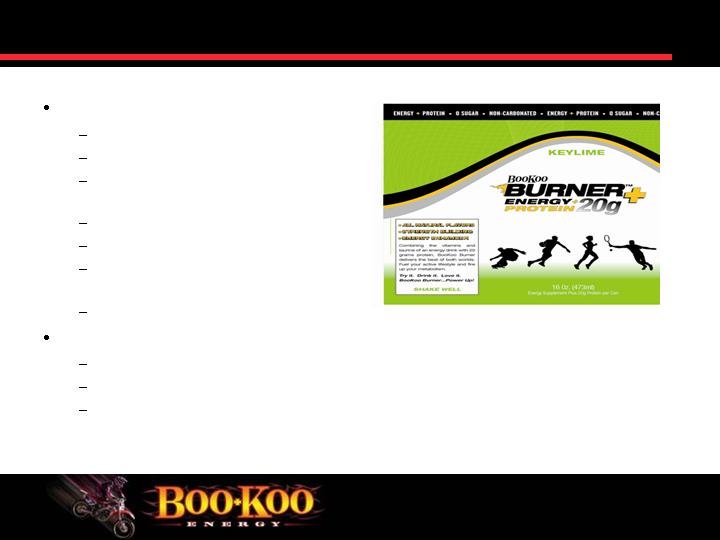
Continuing Innovation
Burner
Energy + Protein
First in class hybrid
20 grams of Whey Protein per
Bottle
2 grams of Carbs per Bottle
Sugar Free
With Taurine, Ginseng and B
Vitamins
3 Flavors
‘Charger’
2 oz Energy Supplement
Hot category
Alternative distribution
11
11
New Products
Custom Packaging
Retail Specific
New Benefits
Expanded Offering
New Distribution
Marketing
Innovation
Sampling
Market Research
Chain authorizations:
Pantry
Circle K
Growth Opportunities
12
12

Natural and organic search
engine optimization (SEO)
On-line promotions
Viral videos
User-friendly, interactive website
Viral Marketing
13
13

Seasoned Management Team and Board
14
14
Name
Position
Experience
Years
Steve Solomon
Executive Chairman
• Citadel Security Software
20+
• CT Holdings,Inc.
• Parago, Inc.
Steve Ruffini
COO/CFO
• Hit Entertainment
25+
- Sold to Apax for $1.4B
• Big Four Public Accounting
Chuck Jarvie
Director
• Procter & Gamble
40+
• Dr. Pepper
• Guiness America
Jim Carreker
Director
• Wyndham Hotels & Resorts
35+
• Trammell Crow Company
• Bombay Company
Ken Johnsen
Director
• HG Food
30+
• Parago, Inc.
• IBM
Steve Johnson
Director
• Aspen Advisors, LP
30+
• Gibson, Dunn & Crutcher

2007 Revenue down roughly 40% from 2006
$11.3 million private placement in August/September 2007
Business model has significant operating leverage
Potential to significantly grow sales through independent distributor
network
Financial Information
15
15

Participation in the large and fast-growing Energy Drink category.
Change in distribution strategy from Coca Cola to independent and beer
distributors.
Seasoned Management and Board with significant experience in
beverages and consumer products.
Increased emphasis on “pull marketing” to support brand at retail.
Line extensions and innovation.
Burner Launch in Q2.
Summary
16
16