Exhibit 99.2

May 9, 2016 Recent Results and Developments First Quarter 2016
Statements made in this presentation regarding American Public Education, Inc . or its subsidiaries, that are not historical facts are forward - looking statements based on current expectations, assumptions, estimates and projections about American Public Education and the industry . These forward - looking statements are subject to risks and uncertainties that could cause actual future events or results to differ materially from such statements . Forward - looking statements can be identified by words such as “anticipate", “believe”, “seek”, “could”, “estimate”, “expect”, “intend”, “may”, “plan”, “should”, “will” and “would” . These forward - looking statements include, without limitation, statements regarding expected growth, expected registrations and enrollments, expected revenues, and expected earnings . Actual results could differ materially from those expressed or implied by these forward - looking statements as a result of various factors, including the various risks described in the “ Risk Factors ” section and elsewhere in the American Public Education ’ s Annual Report on Form 10 - K for the year ended December 31 , 2015 , Quarterly Report on Form 10 - Q for the three months ended March 31 , 2016 and in the American Public Education’s other filings with the SEC . American Public Education undertakes no obligation to update publicly any forward - looking statements for any reason, unless required by law, even if new information becomes available or other events occur in the future . 2 Advancing the Learning Experience | Exploring New Opportunities SAFE HARBOR STATEMENT American Public Education, Inc.
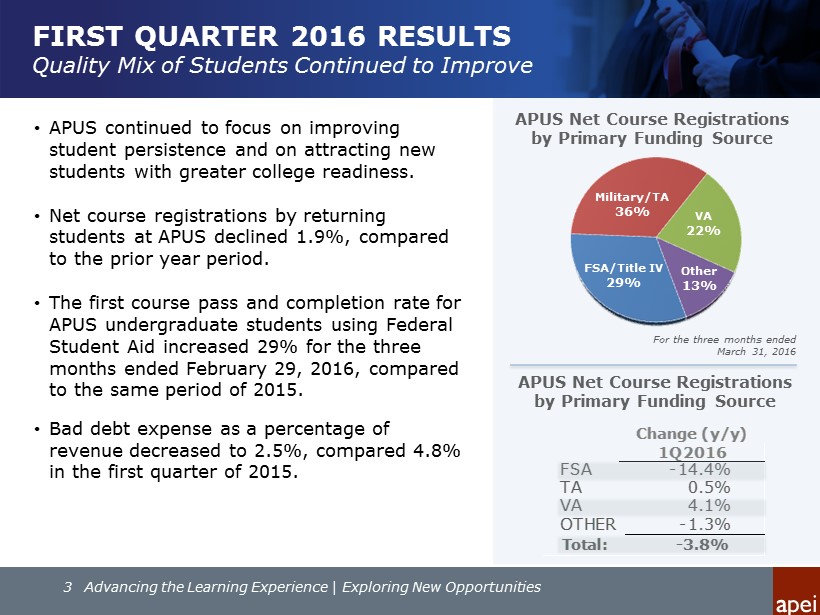
FIRST QUARTER 2016 RESULTS Quality Mix of Students Continued to Improve • APUS continued to focus on improving student persistence and on attracting new students with greater college readiness. • Net course registrations by returning students at APUS declined 1.9%, compared to the prior year period . • The first course pass and completion rate for APUS undergraduate students using Federal Student Aid increased 29 % for the three months ended February 29, 2016, compared to the same period of 2015. • Bad debt expense as a percentage of revenue decreased to 2.5%, compared 4.8% in the first quarter of 2015. For the three months ended March 31, 2016 APUS Net Course Registrations by Primary Funding Source Other 13% FSA/Title IV 29% Military/TA 36% VA 22% 3 Advancing the Learning Experience | Exploring New Opportunities FSA -14.4% TA 0.5% VA 4.1% OTHER -1.3% Total: -3.8% 1Q2016 Change (y/y) APUS Net Course Registrations by Primary Funding Source
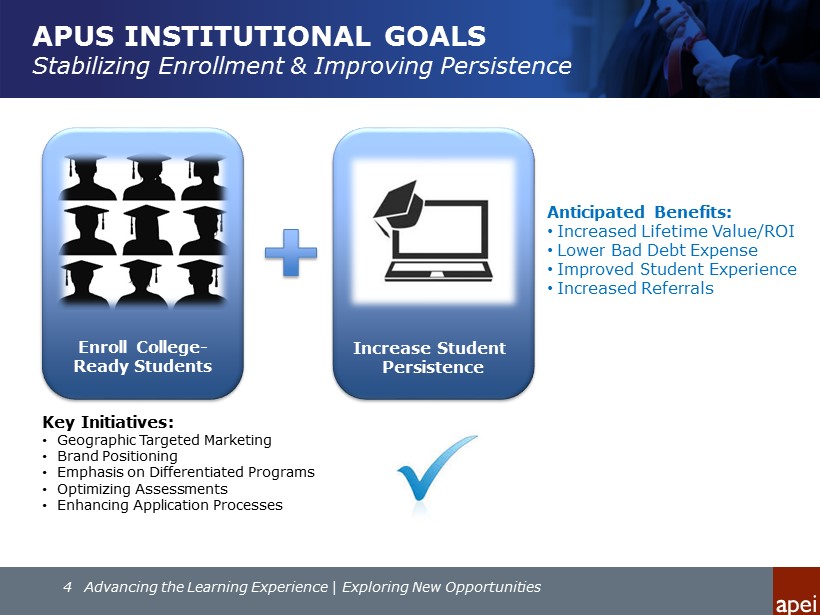
APUS INSTITUTIONAL GOALS Stabilizing Enrollment & Improving Persistence 4 Advancing the Learning Experience | Exploring New Opportunities Increase Student Persistence Enroll College - Ready Students Key Initiatives: • Geographic Targeted Marketing • Brand Positioning • Emphasis on Differentiated Programs • Optimizing Assessments • Enhancing Application Processes Anticipated Benefits: • Increased Lifetime Value/ROI • Lower Bad Debt Expense • Improved Student Experience • Increased Referrals
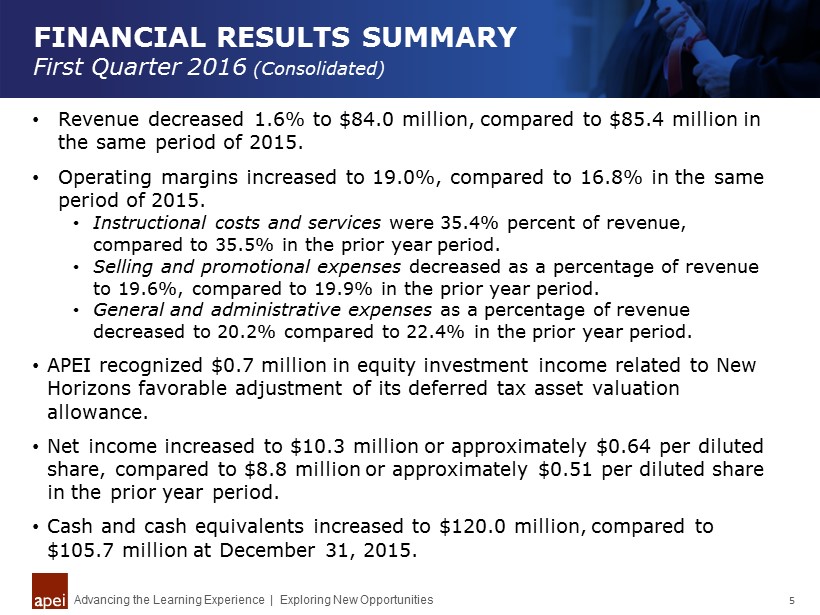
FINANCIAL RESULTS SUMMARY First Quarter 2016 (Consolidated) Advancing the Learning Experience | Exploring New Opportunities 5 • R evenue decreased 1.6% to $84.0 million, compared to $85.4 million in the same period of 2015. • Operating margins increased to 19.0%, compared to 16.8% in the same period of 2015. • Instructional costs and services were 35.4% percent of revenue, compared to 35.5% in the prior year period. • Selling and promotional expenses decreased as a percentage of revenue to 19.6%, compared to 19.9% in the prior year period. • General and administrative expenses as a percentage of revenue decreased to 20.2% compared to 22.4% in the prior year period. • APEI recognized $0.7 million in equity investment income related to New Horizons favorable adjustment of its deferred tax asset valuation allowance. • Net income increased to $10.3 million or approximately $0.64 per diluted share, compared to $8.8 million or approximately $0.51 per diluted share in the prior year period. • Cash and cash equivalents increased to $120.0 million, compared to $105.7 million at December 31, 2015.
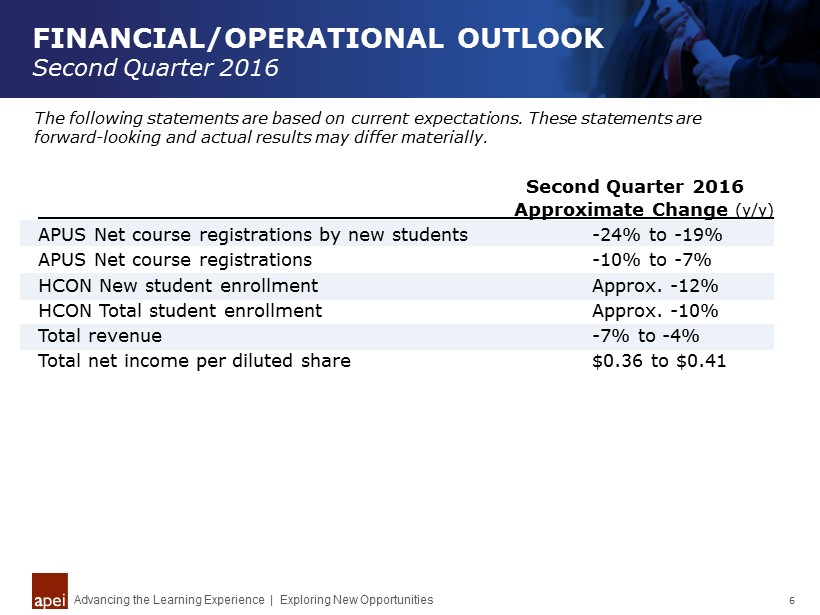
FINANCIAL/OPERATIONAL OUTLOOK Second Quarter 2016 Advancing the Learning Experience | Exploring New Opportunities 6 The following statements are based on current expectations. These statements are forward - looking and actual results may differ materially. Approximate Change (y/y) APUS Net course registrations by new students - 24% to - 19% APUS Net course registrations - 10% to - 7% HCON New student enrollment Approx. - 12% HCON Total student enrollment Approx. - 10% Total revenue - 7% to - 4% Total net income per diluted share $0.36 to $0.41 Second Quarter 2016

First Quarter 2016 Financial Results Conference Call May 9, 2016