Exhibit 99.2

Education that makes a difference FOURTH QUARTER 2017 RESULTS | FEBRUARY 27, 2017 PRESENTED BY DR. WALLACE BOSTON - PRESIDENT AND CEO MR. RICHARD SUNDERLAND, CPA – EXECUTIVE VP AND CFO MR. CHRISTOPHER SYMANOSKIE, IRC – VICE PRESIDENT OF INVESTOR REL ATIONS

PAGE SAFE HARBOR STATEMENT 1 Statements made in this presentation regarding American Public Education, Inc . , or its subsidiaries, that are not historical facts are forward - looking statements based on current expectations, assumptions, estimates and projections about American Public Education, Inc . and the industry . These forward - looking statements are subject to risks and uncertainties that could cause actual future events or results to differ materially from such statements . Forward - looking statements can be identified by words such as “anticipate,” “believe,” “seek,” “could,” “estimate,” “expect,” “intend,” “may,” “should,” “will” and “would . ” These forward - looking statements include, without limitation, statements regarding expected growth, expected registration and enrollments, expected revenues, and expected earnings . Actual results could differ materially from those expressed or implied by these forward - looking statements as a result of various factors, including the various risks described in the “Risk Factors” section and elsewhere in the Company’s Annual Report on Form 10 - K for the year ended December 31 , 2016 , Quarterly Report on Form 10 - Q for the period ended September 30 , 2017 and other filings with the SEC . The Company undertakes no obligation to update publicly any forward - looking statements for any reason, unless required by law, even if new information becomes available or other events occur in the future .

PAGE RECENT RESULTS AND HIGHLIGHTS 2 • Enrollment stabilization at APUS remains a top priority. • The first course pass and completion rate, a measure of student persistence, for APUS undergraduate students using Federal Student Aid increased by 16% for the three months ended November 30, 2017, compared to the same period last year. • APUS net course registrations by new students decreased 4% y/y and total net course registrations declined 3% y/y for the three months ended December 31, 2017 . • HCN new student enrollment increased 29% y/y and total student enrollment increased 23% y/y (Fall 2017). % Change (Y/Y) FSA - 10.7% TA - 0.5% VA +0.1% Cash/Other +0.3% Total - 3.2% APUS NET COURSE REGISTRATIONS BY PRIMARY FUNDING SOURCE Three months ending December 31, 2017 ███ 38.6% TA ███ 26.6% FSA ███ 22.5% VA ███ 12.3% Other APUS NET COURSE REGISTRATIONS BY PRIMARY FUNDING SOURCE Three months ending December 31, 2017 16 % 1 Y/Y INCREASE IN FIRST COURSE PASS/ COMPLETION RATE OF UNDERGRADUATE STUDENTS UTILIZING FSA AT APUS 1. For three months ending November 30, 2017

PAGE 3 STRENGTHEN ENROLLMENT MANAGEMENT EXPAND PROGRAMS ALIGNED WITH WORKFORCE DEMAND INCREASED FOCUS ON WORKFORCE SKILLS GAP APUS ENROLLMENT STABILIZATION: LONG - TERM PLAN - 8.4% - 5.8% - 4.0% - 3.0% -10.0% -5.0% 0.0% 1Q17 2Q17 3Q17 4Q17 APUS Returning Students Y/Y Change in Net Course Registrations by Returning Students - 10.1% - 9.4% - 6.2% - 4.2% - 3.2% -12% -9% -6% -3% 0% 4Q16 1Q17 2Q17 3Q17 4Q17 APUS Total Students Y/Y Change in Net Course Registrations by Total Students Key Near - Term Priorities: • Reengineering enrollment management processes • Brand building & increasing investment in target marketing • Attractive new workforce focused programs & initiatives • Expanding strategic relationships ENROLLMENT STABILIZATION AT APUS - A TOP PRIORITY
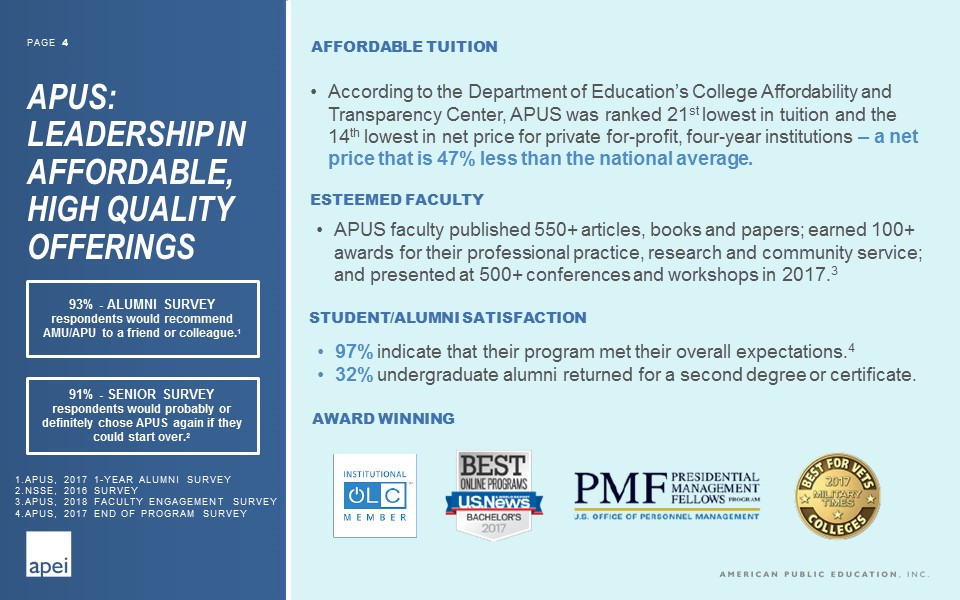
PAGE APUS: LEADERSHIP IN AFFORDABLE, HIGH QUALITY OFFERINGS AFFORDABLE TUITION 91% - SENIOR SURVEY respondents would probably or definitely chose APUS again if they could start over. 2 93% - ALUMNI SURVEY respondents would recommend AMU/APU to a friend or colleague. 1 1.APUS , 2017 1 - YEAR ALUMNI SURVEY 2.NSSE , 2016 SURVEY 3.APUS, 2018 FACULTY ENGAGEMENT SURVEY 4.APUS, 2017 END OF PROGRAM SURVEY 4 • According to the Department of Education’s College Affordability and Transparency Center, APUS was ranked 21 st lowest in tuition and the 14 th lowest in net price for private for - profit, four - year institutions – a net price that is 47% less than the national average. AWARD WINNING STUDENT/ALUMNI SATISFACTION • 97% indicate that their program met their overall expectations. 4 • 32% undergraduate alumni returned for a second degree or certificate. ESTEEMED FACULTY • APUS faculty published 550+ articles, books and papers; earned 100+ awards for their professional practice, research and community service; and presented at 500+ conferences and workshops in 2017. 3

PAGE 5 • Consolidated revenues decreased 1% to $ 78.1 million, compared to $78.6 million in the same period of 2016. • Costs and Expenses: • Instructional costs and services expenses decreased as a percentage of revenues to 36.7%, compared to 38.2% in the prior year period. • Selling and promotional expenses decreased as a percentage of revenues to 18.3%, compared to 18.4% in the prior year period. • General and administrative expenses decreased as a percentage of revenues to 22.3%, compared to 22.8% in the prior year period. • Net income increased to $8.4 million, or $ 0.51 per diluted share, compared to $6.9 million , or $ 0.42 per diluted share, in the prior year period. • Cash and cash equivalents increased to $179.2 million , compared to $146.4 million as of December 31, 2016. FINANCIAL RESULTS SUMMARY FOURTH QUARTER 2017 BETTER THAN ANTICIPATED: x NET COURSE REGISTRATIONS x CONSOLIDATED REVENUES x OPERATING INCOME x NET INCOME

PAGE APEI OUTLOOK FIRST QUARTER 2018 The following statements are based on current expectations. These statements are forward - looking and actual results may differ materially. 1 APUS Net Course Registrations represent the approximate aggregate number of courses for which students remain enrolled after the date by which they may drop a course without financial penalty . 2 HCN Student Enrollment represents the total number of students enrolled in a course after the date by which students may drop a course without financial penalty . First Quarter 2018 Approx. Y/Y Change APUS Net course registrations 1 by new students - 12% to - 9% APUS Net course registrations 1 - 5% to - 3% HCN New student enrollment 2 Approx. +11% HCN Student enrollment 2 Approx. +19% APEI Consolidated revenue - 3% to +1% APEI Consolidated net income per share $0.29 to $0.34 6

PAGE EMPOWERED TO CHANGE THE WORLD Potential catalysts for value creation: • Strong & growing market demand in key areas • Reengineering enrollment management processes • Brand building & targeting program investment • Attractive new workforce focused programs & degrees • Expanding strategic relationships COMPETITIVE STRENGTH IN AFFORDABLE, ASSESSABLE PROGRAMS DIVERSE, HIGH - DEMAND AND HIGHLY RELEVANT CURRICULUM FOCUSED ON WORKFORCE SKILLS DEVELOPMENT STRONG BALANCE SHEET AND NET CASH FROM OPERATING ACTIVITIES LARGE SATISFIED STUDENT AND ALUMNI POPULATIONS STRONG AND EXPANDING EMPLOYER RELATIONSHIPS UNYIELDING DEDICATION TO ACADEMIC QUALITY 7

PAGE We prepare working adults for leadership and service through higher education. 8 QUESTIONS & ANSWERS CONTACT: CHRIS SYMANOSKIE, IRC VP, INVESTOR RELATIONS CSYMANOSKIE@APEI.COM