Exhibit 99.2
Education that Makes a Difference Third Quarter 201 8 Results November 6, 2018 Presented by Dr. Wallace Boston President and CEO Mr. Richard Sunderland, CPA Executive VP and CFO Mr. Christopher Symanoskie, IRC Vice President of Investor Relations
PAGE SAFE HARBOR STATEMENT 1 Statements made in this presentation regarding American Public Education, Inc . , or its subsidiaries, that are not historical facts are forward - looking statements based on current expectations, assumptions, estimates and projections about American Public Education, Inc . and the industry . These forward - looking statements are subject to risks and uncertainties that could cause actual future events or results to differ materially from such statements . Forward - looking statements can be identified by words such as “anticipate,” “believe,” “seek,” “could,” “estimate,” “expect,” “intend,” “may,” “should,” “will” and “would . ” These forward - looking statements include, without limitation, statements regarding expected growth, expected registration and enrollments, expected revenues, and expected earnings . Actual results could differ materially from those expressed or implied by these forward - looking statements as a result of various factors, including the various risks described in the “Risk Factors” section and elsewhere in the Company’s Annual Report on Form 10 - K for the year ended December 31 , 2017 , Quarterly Report on Form 10 - Q for the period ended September 30 , 2018 and other filings with the SEC . The Company undertakes no obligation to update publicly any forward - looking statements for any reason, unless required by law, even if new information becomes available or other events occur in the future .
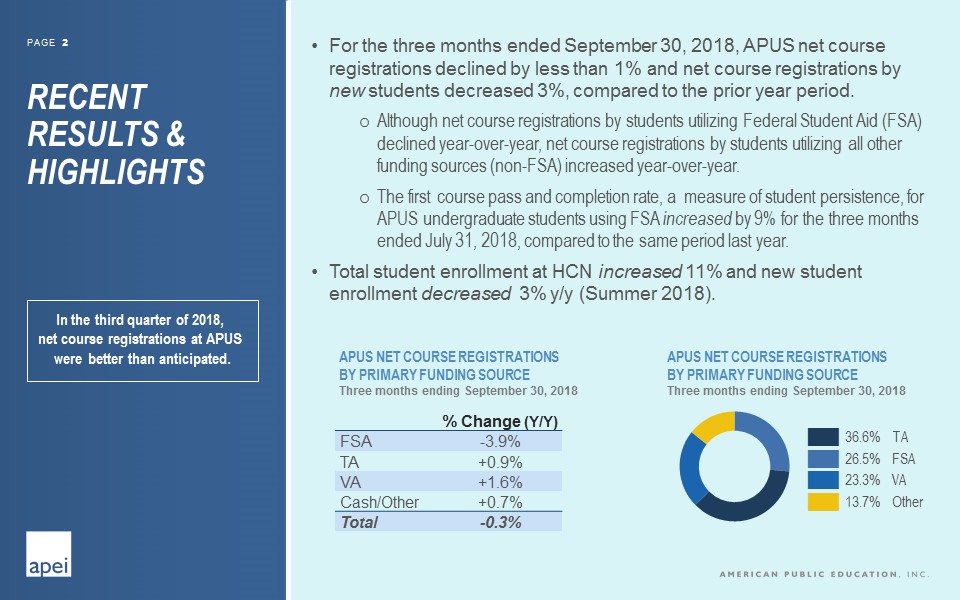
PAGE RECENT RESULTS & HIGHLIGHTS 2 • For the three months ended September 30, 2018, APUS net course registrations declined by less than 1% and net course registrations by new students decreased 3%, compared to the prior year period. o Although net course registrations by students utilizing Federal Student Aid (FSA) declined year - over - year, net course registrations by students utilizing all other funding sources (non - FSA) increased year - over - year. o The first course pass and completion rate, a measure of student persistence, for APUS undergraduate students using FSA increased by 9% for the three months ended July 31, 2018, compared to the same period last year. • Total student enrollment at HCN increased 11% and new student enrollment decreased 3% y/y (Summer 2018). % Change (Y/Y) FSA - 3.9% TA +0.9% VA +1.6% Cash/Other +0.7% Total - 0.3% APUS NET COURSE REGISTRATIONS BY PRIMARY FUNDING SOURCE Three months ending September 30, 2018 ███ 36.6% TA ███ 26.5% FSA ███ 23.3% VA ███ 13.7% Other APUS NET COURSE REGISTRATIONS BY PRIMARY FUNDING SOURCE Three months ending September 30, 2018 In the third q uarter of 2018, n et c ourse r egistrations at APUS were better than anticipated.
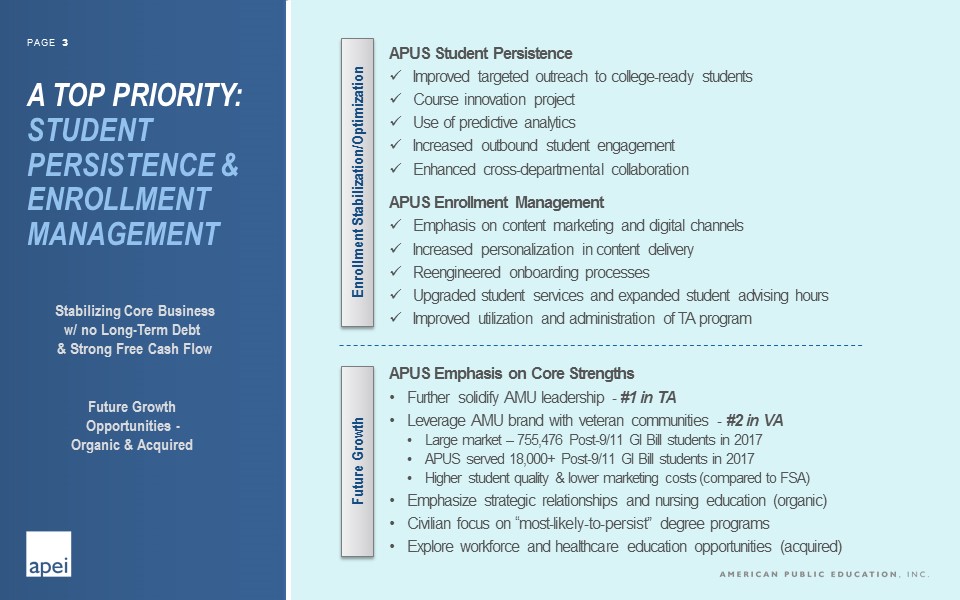
PAGE 3 APUS Student Persistence x Improved targeted outreach to college - ready students x Course innovation project x Use of predictive analytics x Increased outbound student engagement x Enhanced cross - departmental collaboration APUS Enrollment Management x Emphasis on content marketing and digital channels x Increased personalization in content delivery x Reengineered onboarding processes x Upgraded student services and expanded student advising hours x Improved utilization and administration of TA program APUS Emphasis on Core Strengths • Further solidify AMU leadership - #1 in TA • Leverage AMU brand with veteran c ommunities - #2 in VA • Large market – 755,476 Post - 9/11 GI Bill students in 2017 • APUS served 18,000+ Post - 9/11 GI Bill students in 2017 • Higher student q uality & lower m arketing c osts (compared to FSA) • Emphasize strategic r elationships and nursing e ducation (organic) • Civilian focus on “most - likely - to - persist ” d egree programs • Explore workforce and h ealthcare e ducation o pportunities (acquired) A TOP PRIORITY: STUDENT PERSISTENCE & ENROLLMENT MANAGEMENT Enrollment Stabilization/Optimization Future Growth Stabilizing Core Business w/ no Long - Term Debt & Strong Free Cash Flow Future Growth Opportunities - Organic & Acquired
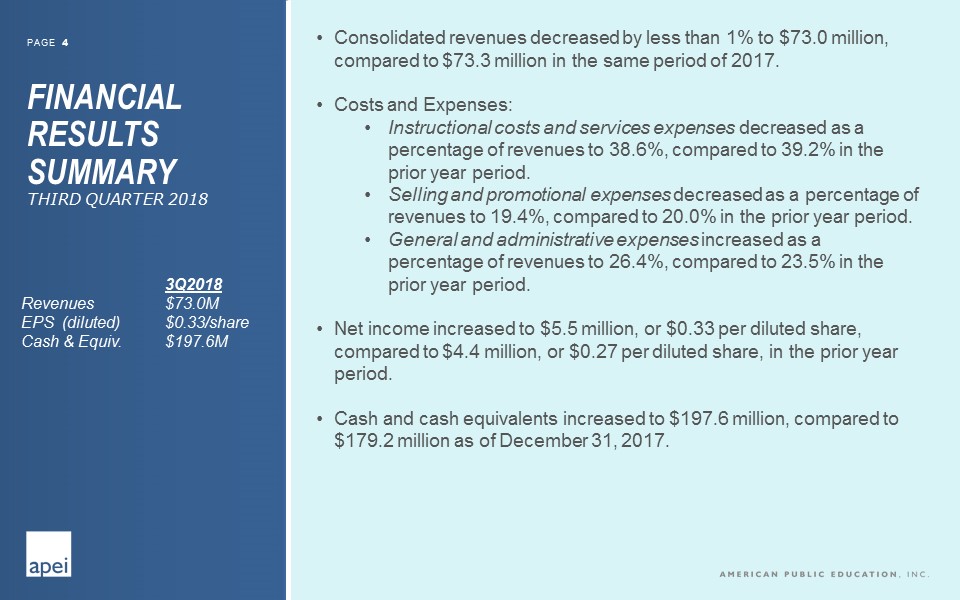
PAGE 4 • Consolidated revenues decreased by less than 1% to $ 73.0 million, compared to $73.3 million in the same period of 2017. • Costs and Expenses: • Instructional costs and services expenses decreased as a percentage of revenues to 38.6%, compared to 39.2% in the prior year period. • Selling and promotional expenses decreased as a percentage of revenues to 19.4%, compared to 20.0% in the prior year period. • General and administrative expenses increased as a percentage of revenues to 26.4%, compared to 23.5% in the prior year period. • Net income increased to $5.5 million, or $ 0.33 per diluted share, compared to $4.4 million , or $ 0.27 per diluted share, in the prior year period . • Cash and cash equivalents increased to $197.6 million , compared to $179.2 million as of December 31, 2017. FINANCIAL RESULTS SUMMARY THIRD QUARTER 2018 3Q2018 Revenues $73.0M EPS (diluted) $0.33/share Cash & Equiv. $197.6M

PAGE APEI OUTLOOK FOURTH QUARTER 2018 The following statements are based on current expectations. These statements are forward - looking and actual results may differ materially. 1 APUS Net course registrations represent the approximate aggregate number of courses for which students remain enrolled after the date by which they may drop a course without financial penalty. 2 HCN Student enrollment represents the total number of students enrolled in a course after the date by which students may drop a course without financial penalty. Fourth Quarter 2018 Approximate Y/Y Change APUS Net course registrations 1 - 4% to +1% APUS Net course registrations 1 by new students - 5% to 0% HCN Student enrollment 2 0% HCN New student enrollment 2 - 4% APEI Consolidated revenue - 4% to 0% APEI Consolidated net income per share $0.48 to $0.53 5

6 Contact : Chris Symanoskie, IRC Vice President , Investor Relations csymanoskie@apei.com We Change Lives Through Higher Education