Exhibit 99.1

William Blair 28th Annual Growth Stock Conference June 17, 2008 AMERICAN PUBLIC EDUCATION, INC.
Statements made in this presentation regarding American Public Education, or its subsidiaries, that are not historical facts are forward-looking statements based on current expectations, assumptions, estimates and projections about American Public Education and the industry. These forward-looking statements are subject to risks and uncertainties that could cause actual future events or results to differ materially from such statements. Forward-looking statements can be identified by words such as "anticipate", "believe", "could", "estimate", "expect“, "intend", "may", "should“, "will" and "would". These forward-looking statements include, without limitation, statements on the slides “Second Quarter 2008 Outlook” and “Increased Full Year 2008 Outlook” and statements regarding expected growth. Actual results could differ materially from those expressed or implied by these forward-looking statements as a result of various factors, including the various risks described in the "Risk Factors" section and elsewhere in the Company’s Annual Report on Form 10-K for the year ended December 31, 2007 as filed with the SEC. The Company undertakes no obligation to update publicly any forward-looking statements for any reason, even if new information becomes available or other events occur in the future. 2 Safe Harbor Statement
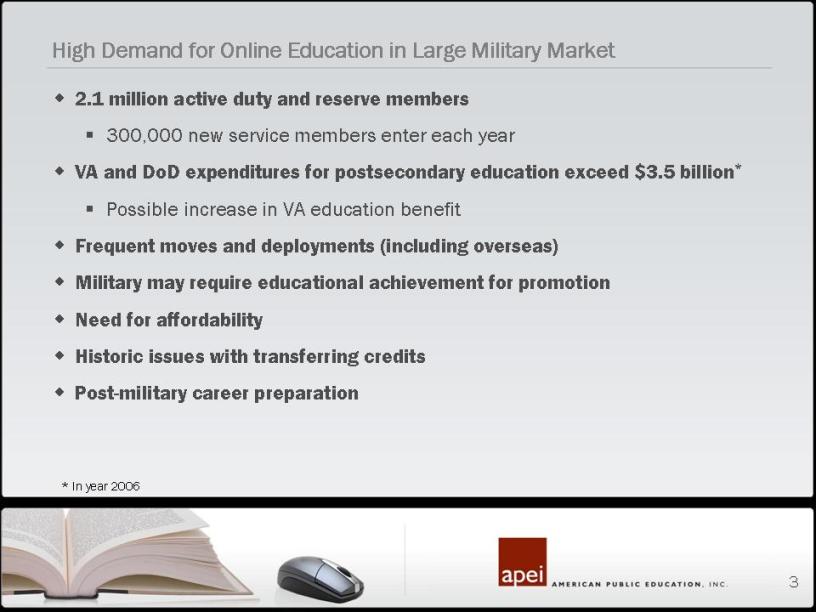
High Demand for Online Education in Large Military Market 2.1 million active duty and reserve members 300,000 new service members enter each year VA and DoD expenditures for postsecondary education exceed $3.5 billion* Possible increase in VA education benefit Frequent moves and deployments (including overseas) Military may require educational achievement for promotion Need for affordability Historic issues with transferring credits Post-military career preparation * In year 2006 3
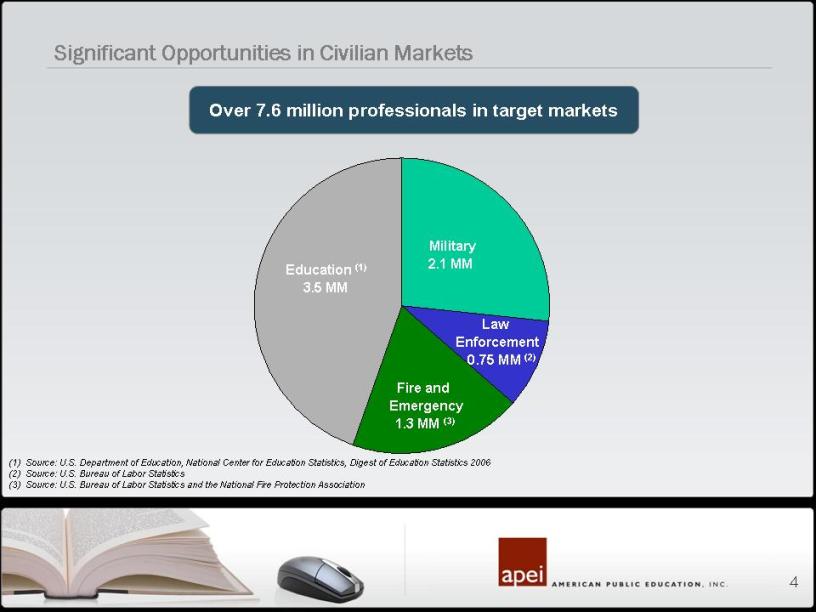
4 Significant Opportunities in Civilian Markets Education (1) 3.5 MM Military 2.1 MM Fire and Emergency 1.3 MM (3) Law Enforcement 0.75 MM (2) (1) Source: U.S. Department of Education, National Center for Education Statistics, Digest of Education Statistics 2006 (2) Source: U.S. Bureau of Labor Statistics (3) Source: U.S. Bureau of Labor Statistics and the National Fire Protection Association Over 7.6 million professionals in target markets
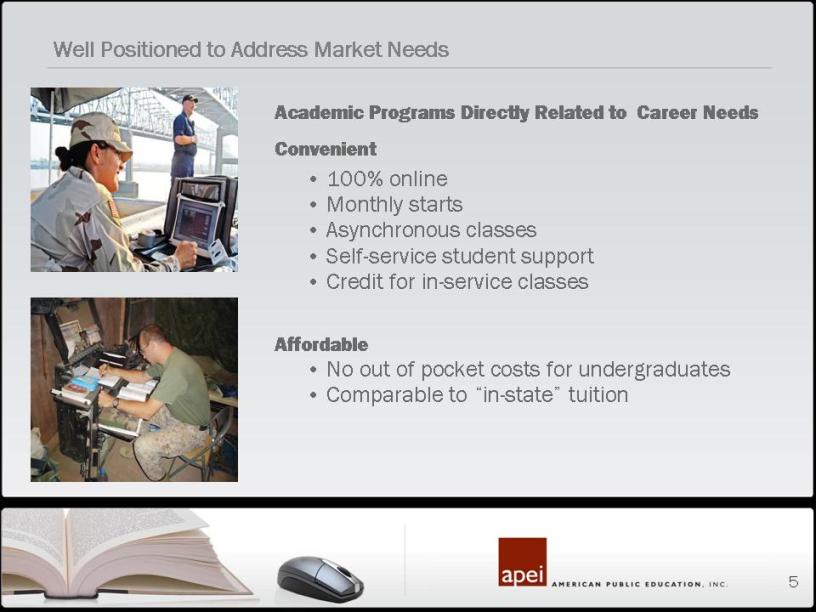
5 Academic Programs Directly Related to Career Needs Convenient 100% online Monthly starts Asynchronous classes Self-service student support Credit for in-service classes Affordable No out of pocket costs for undergraduates Comparable to “in-state” tuition Well Positioned to Address Market Needs
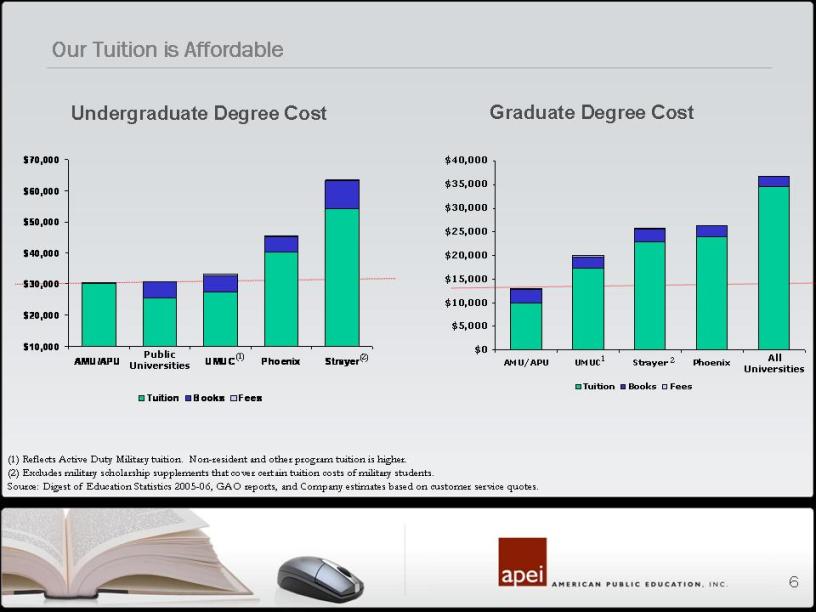
6 Our Tuition is Affordable Undergraduate Degree Cost Public Universities $10,000 $20,000 $30,000 $40,000 $50,000 $60,000 $70,000 AMU/APU UMUC Phoenix Strayer Tuition Books Fees (2) (1) Reflects Active Duty Military tuition. Non-resident and other program tuition is higher.. (2) Excludes military scholarship supplements that cover certain tuition costs of military students. Source: Digest of Education Statistics 2005-06, GAO reports, and Company estimates based on customer service quotes. (1) Graduate Degree Cost All Universities $0 $5,000 $10,000 $15,000 $20,000 $25,000 $30,000 $35,000 $40,000 AMU/APU UMUC Strayer Phoenix Tuition Books Fees 1 2
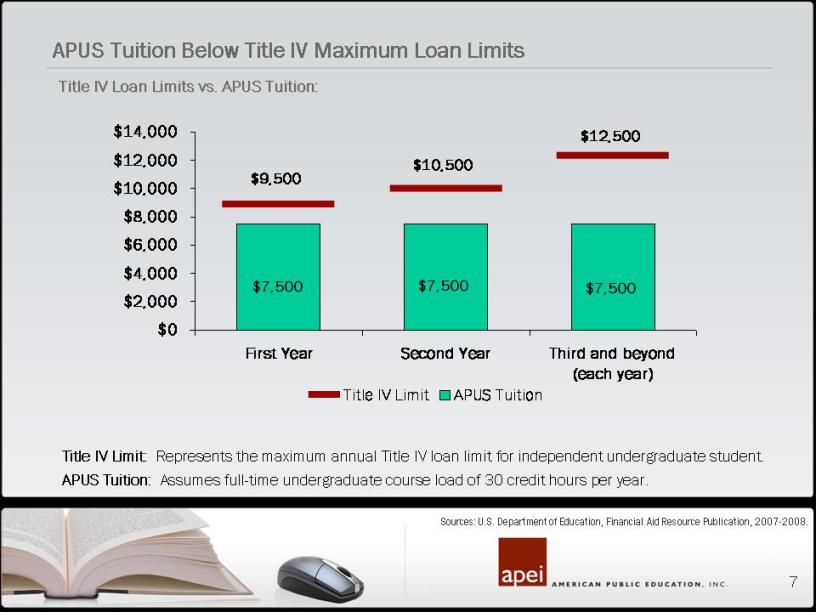
7 APUS Tuition Below Title IV Maximum Loan Limits Sources: U.S. Department of Education, Financial Aid Resource Publication, 2007-2008. $9,500 $10,500 $12,500 $7,500 $7,500 $7,500 $0 $2,000 $4,000 $6,000 $8,000 $10,000 $12,000 $14,000 First Year Second Year Third and beyond (each year) Title IV Limit APUS Tuition Title IV Limit: Represents the maximum annual Title IV loan limit for independent undergraduate student. APUS Tuition: Assumes full-time undergraduate course load of 30 credit hours per year. Title IV Loan Limits vs. APUS Tuition
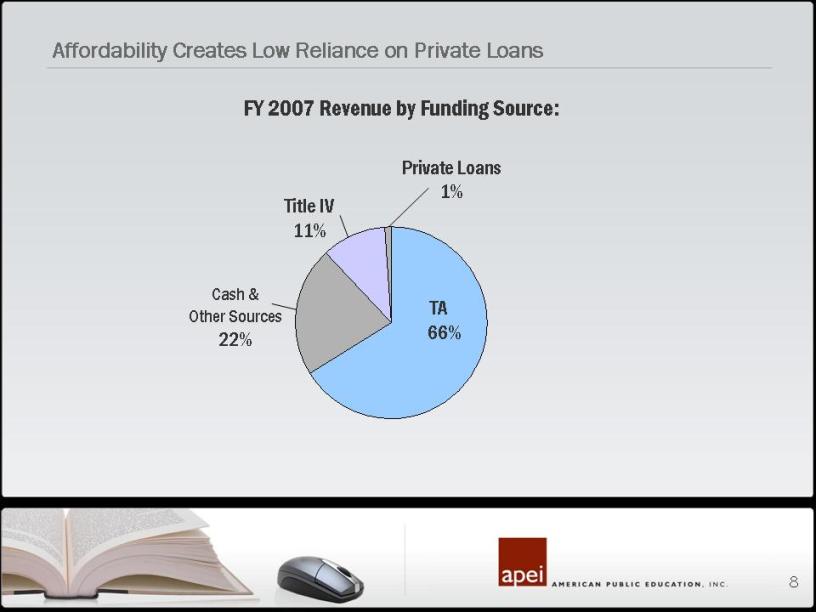
8 Affordability Creates Low Reliance on Private Loans FY 2007 Revenue by Funding Source: Cash & Other Sources 22% TA 66% Private Loans 1% Title IV 11%
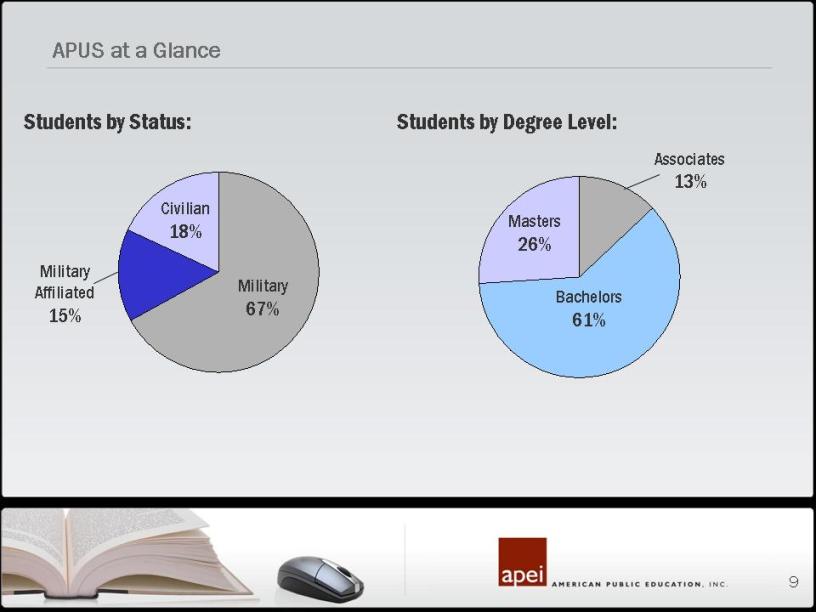
9 APUS at a Glance Students by Degree Level: Students by Status: Masters 26% Bachelors 61% Military 67% Civilian 18% Military Affiliated 15% Associates 13%
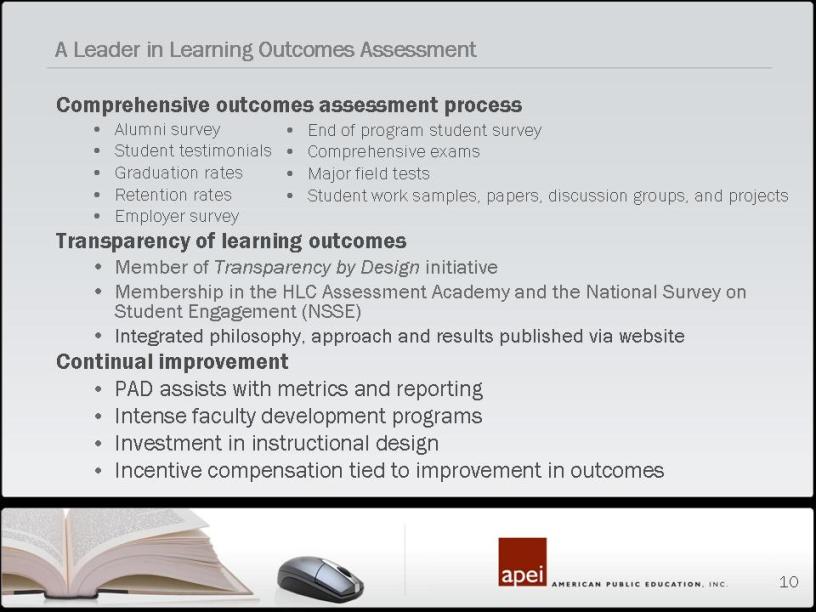
10 A Leader in Learning Outcomes Assessment Comprehensive outcomes assessment process Alumni survey Student testimonials Graduation rates Retention rates Employer survey Transparency of learning outcomes Member of Transparency by Design initiative Membership in the HLC Assessment Academy and the National Survey on Student Engagement (NSSE) Integrated philosophy, approach and results published via website Continual improvement PAD assists with metrics and reporting Intense faculty development programs Investment in instructional design Incentive compensation tied to improvement in outcomes End of program student survey Comprehensive exams Major field tests Student work samples, papers, discussion groups, and projects
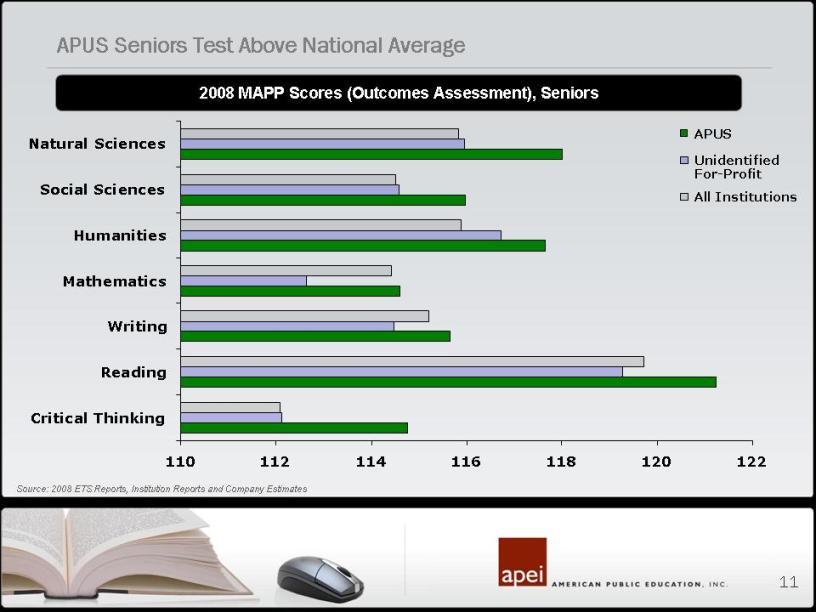
11 2008 MAPP Scores (Outcomes Assessment), Seniors Source: 2008 ETS Reports, Institution Reports and Company Estimates APUS Unidentified For-Profit All Institutions 110 112 114 116 118 120 122 Critical Thinking Reading Writing Mathematics Humanities Social Sciences Natural Sciences APUS Seniors Test Above National Average
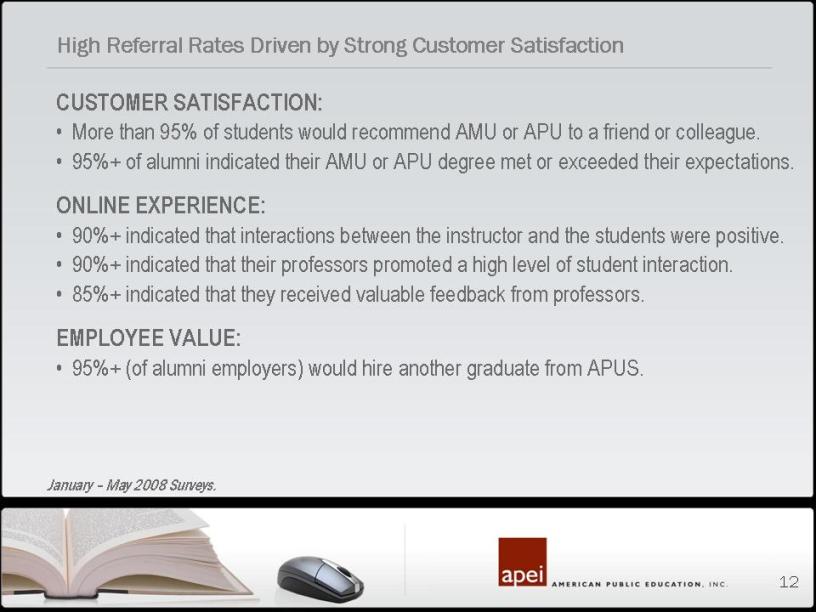
12 12 CUSTOMER SATISFACTION: More than 95% of students would recommend AMU or APU to a friend or colleague. 95%+ of alumni indicated their AMU or APU degree met or exceeded their expectations. ONLINE EXPERIENCE: 90%+ indicated that interactions between the instructor and the students were positive. 90%+ indicated that their professors promoted a high level of student interaction. 85%+ indicated that they received valuable feedback from professors. EMPLOYEE VALUE: 95%+ (of alumni employers) would hire another graduate from APUS. January – May 2008 Surveys. High Referral Rates Driven by Strong Customer Satisfaction
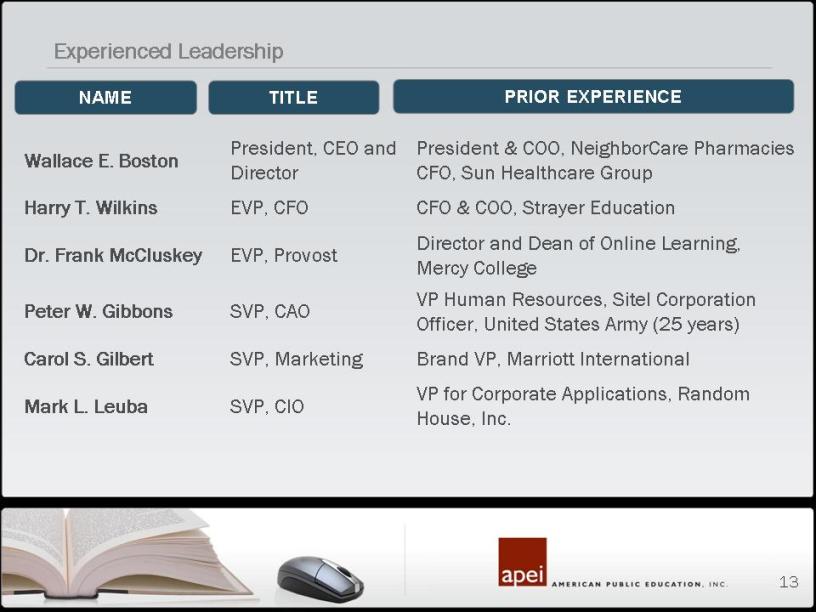
13 Experienced Leadership PRIOR EXPERIENCE TITLE NAME Wallace E. Boston President, CEO and Director President & COO, NeighborCare Pharmacies CFO, Sun Healthcare Group Harry T. Wilkins EVP, CFO CFO & COO, Strayer Education Dr. Frank McCluskey EVP, Provost Director and Dean of Online Learning, Mercy College Peter W. Gibbons SVP, CAO VP Human Resources, Sitel Corporation Officer, United States Army (25 years) Carol S. Gilbert SVP, Marketing Brand VP, Marriott International Mark L. Leuba SVP, CIO VP for Corporate Applications, Random House, Inc
14 Strong top-line growth with good visibility Tuition is paid in advance; attractive working capital dynamics High referral rates drive low student acquisition costs Limited “brick and mortar” costs Variable cost faculty model Technology platform drives scalability and long-term margin expansion Compelling Financial Attributes

15 0.0 20.0 40.0 60.0 80.0 100.0 2002 2003 2004 2005 2006 2007 Q1 2007 Q1 2008 (1) Net course registrations represent the total number of course registrations for students that have attended a portion of a course. 59% Growth CAGR 38% (in thousands) Strong Track Record for Increasing Registrations 19.0 25.6 32.6 54.8 94.8 37.5 33.1 20.9
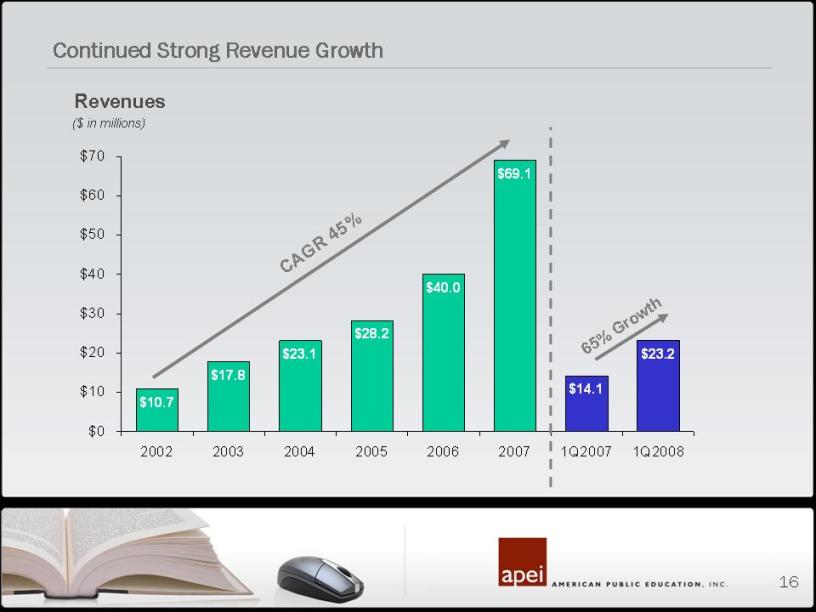
16 $23.2 $14.1 $40.0 $69.1 $28.2 $10.7 $17.8 $23.1 $0 $10 $20 $30 $40 $50 $60 $70 2002 2003 2004 2005 2006 2007 1Q2007 1Q2008 CAGR 45% Continued Strong Revenue Growth 65 % Growth ($ in millions) Revenues
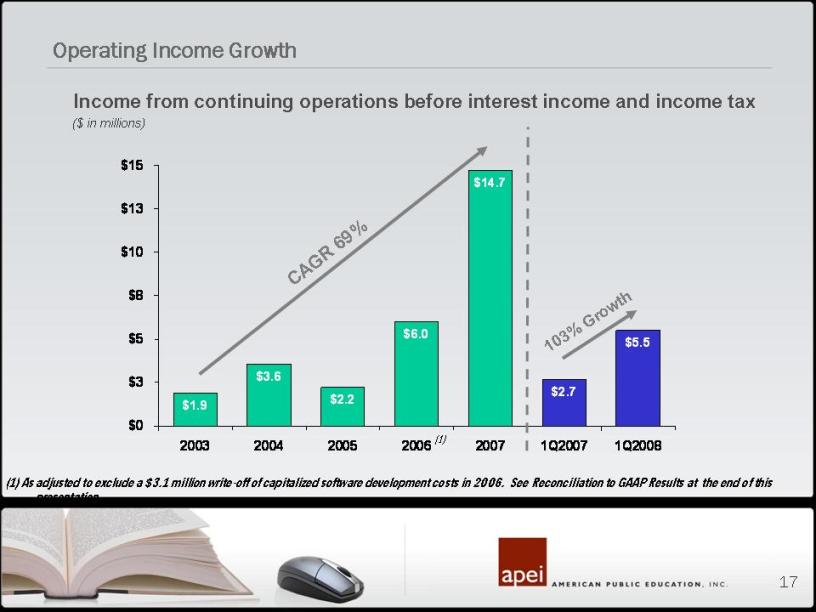
17 Operating Income Growth $0 $3 $5 $8 $10 $13 $15 2003 2004 2005 2006 2007 1Q2007 1Q2008 (1) As adjusted to exclude a $3.1 million write-off of capitalized software development costs in 2006. See Reconciliation to GAAP Results at the end of this presentation CAGR 69% 103% Growth ($ in millions) Income from continuing operations before interest income and income tax $1.9 $3.6 $2.2 $6.0 $14.7 $2.7 $5.5
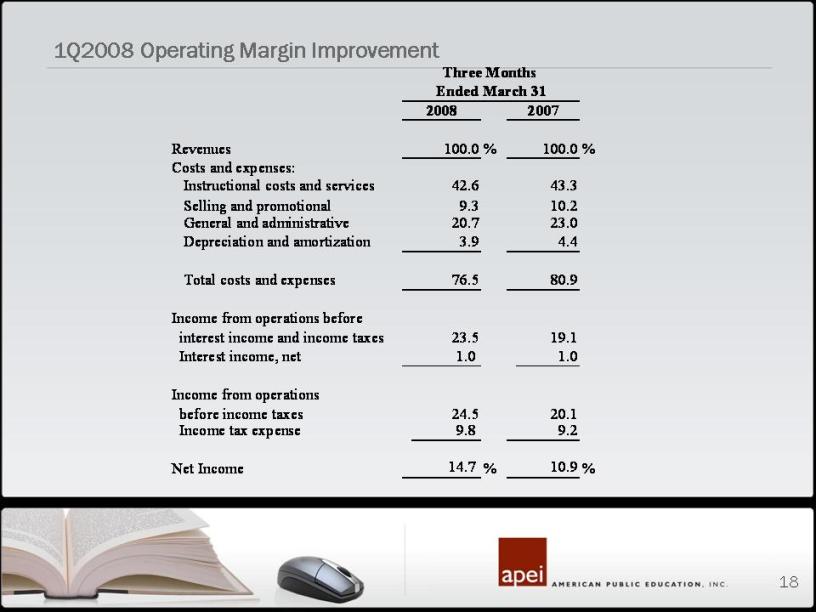
18 1Q2008 Operating Margin Improvement Revenues 100.0 % 100.0 % Costs and expenses: Instructional costs and services 42.6 43.3 Selling and promotional 9.3 10.2 General and administrative 20.7 23.0 Depreciation and amortization 3.9 4.4 Total costs and expenses 76.5 80.9 Income from operations before interest income and income taxes 23.5 19.1 Interest income, net 1.0 1.0 Income from operations before income taxes 24.5 20.1 Income tax expense 9.8 9.2 Net Income 14.7 % 10.9 % Three Months Ended March 31 2008 2007
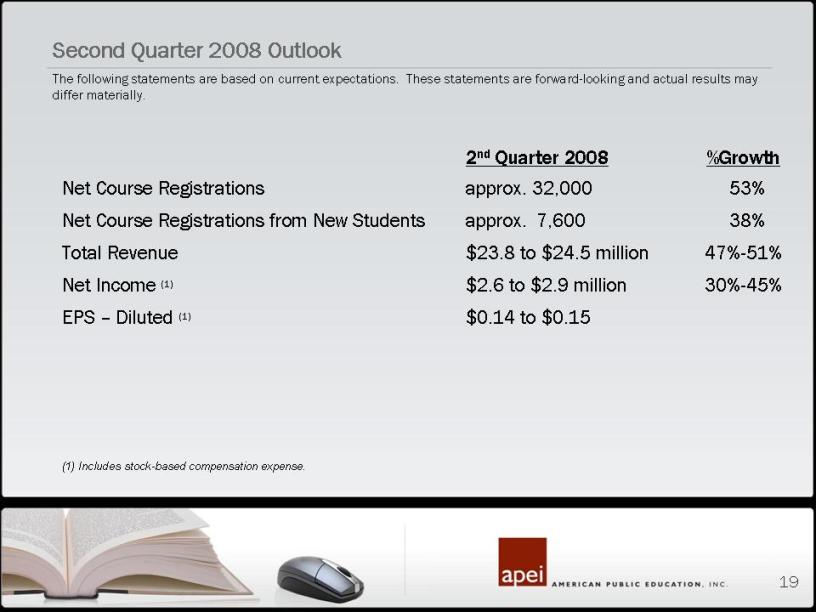
19 2nd Quarter 2008 %Growth Net Course Registrations approx. 32,000 53% Net Course Registrations from New Students approx. 7,600 38% Total Revenue $23.8 to $24.5 million 47%-51% Net Income (1) $2.6 to $2.9 million 30%-45% EPS – Diluted (1) $0.14 to $0.15 (1) Includes stock-based compensation expense. Second Quarter 2008 Outlook The following statements are based on current expectations. These statements are forward-looking and actual results may differ materially.
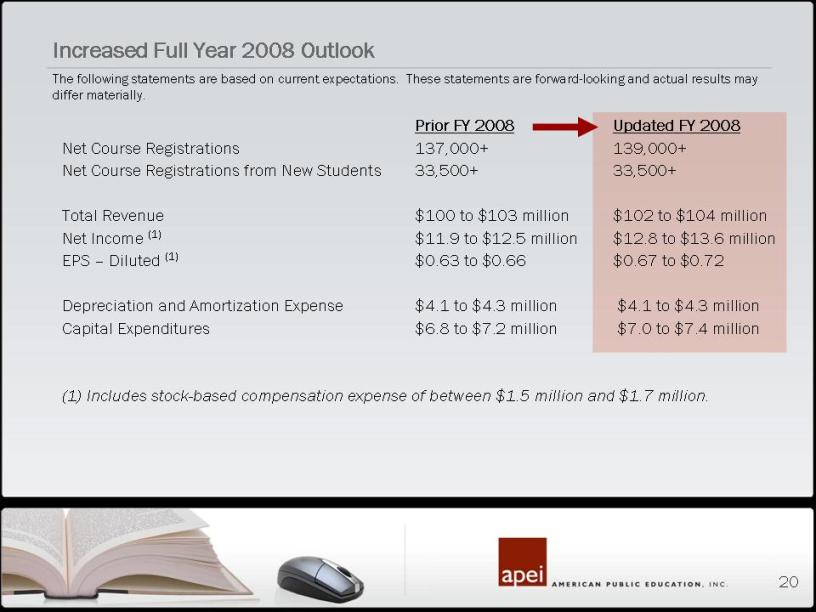
20 Prior FY 2008 Updated FY 2008 Net Course Registrations 137,000+ 139,000+ Net Course Registrations from New Students 33,500+ 33,500+ Total Revenue $100 to $103 million $102 to $104 million Net Income (1) $11.9 to $12.5 million $12.8 to $13.6 million EPS – Diluted (1) $0.63 to $0.66 $0.67 to $0.72 Depreciation and Amortization Expense $4.1 to $4.3 million $4.1 to $4.3 million Capital Expenditures $6.8 to $7.2 million $7.0 to $7.4 million (1) Includes stock-based compensation expense of between $1.5 million and $1.7 million. Increased Full Year 2008 Outlook The following statements are based on current expectations. These statements are forward-looking and actual results may differ materially.
21 Enhanced opportunities with the Navy New programs and market segments Master Degrees in Education Associate’s Degrees New degrees in development Affordability, unique programs and quality provide advantages APEI Positioned for Strong Growth in 2008

William Blair 28th Annual Growth Stock Conference June 17, 2008 AMERICAN PUBLIC EDUCATION, INC.
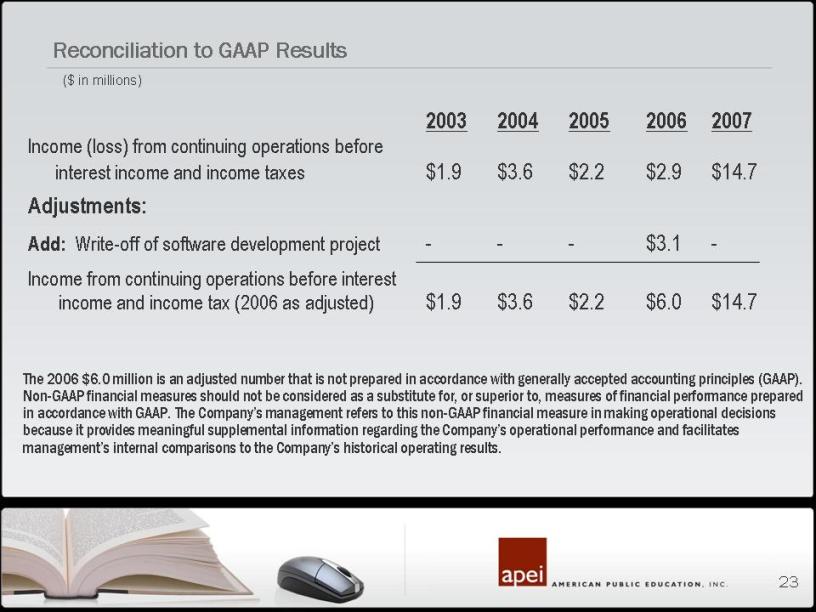
23 Reconciliation to GAAP Results ($ in millions) 2003 2004 2005 2006 2007 Income (loss) from continuing operations before interest income and income taxes $1.9 $3.6 $2.2 $2.9 $14.7 Adjustments: Add: Write-off of software development project - - - $3.1 - Income from continuing operations before interest income and income tax (2006 as adjusted) $1.9 $3.6 $2.2 $6.0 $14.7 The 2006 $6.0 million is an adjusted number that is not prepared in accordance with generally accepted accounting principles (GAAP). Non-GAAP financial measures should not be considered as a substitute for, or superior to, measures of financial performance prepared in accordance with GAAP. The Company’s management refers to this non-GAAP financial measure in making operational decisions because it provides meaningful supplemental information regarding the Company’s operational performance and facilitates management’s internal comparisons to the Company’s historical operating results.