Exhibit 99.2
Online Higher Education Built To Succeed Third Quarter 2008 Earnings Conference Call November 12, 2008
Statements made in this presentation regarding American Public Education, or its subsidiaries, that are not historical facts are forward-looking statements based on current expectations, assumptions, estimates and projections about American Public Education and the industry. These forward-looking statements are subject to risks and uncertainties that could cause actual future events or results to differ materially from such statements. Forward-looking statements can be identified by words such as "anticipate", "believe", "could", "estimate", "expect“, "intend", "may", "should“, "will" and "would". These forward-looking statements include, without limitation, statements on the slides “Fourth Quarter 2008 Outlook” and “Full Year 2008 Outlook” and statements regarding expected growth. Actual results could differ materially from those expressed or implied by these forward-looking statements as a result of various factors, including the various risks described in the "Risk Factors" section and elsewhere in the Company’s Annual Report on Form 10-K for the year ended December 31, 2007 as filed with the SEC. The Company undertakes no obligation to update publicly any forward-looking statements for any reason, even if new information becomes available or other events occur in the future. 2 Safe Harbor Statement
Wally Boston President and Chief Executive Officer Third Quarter 2008 Highlights
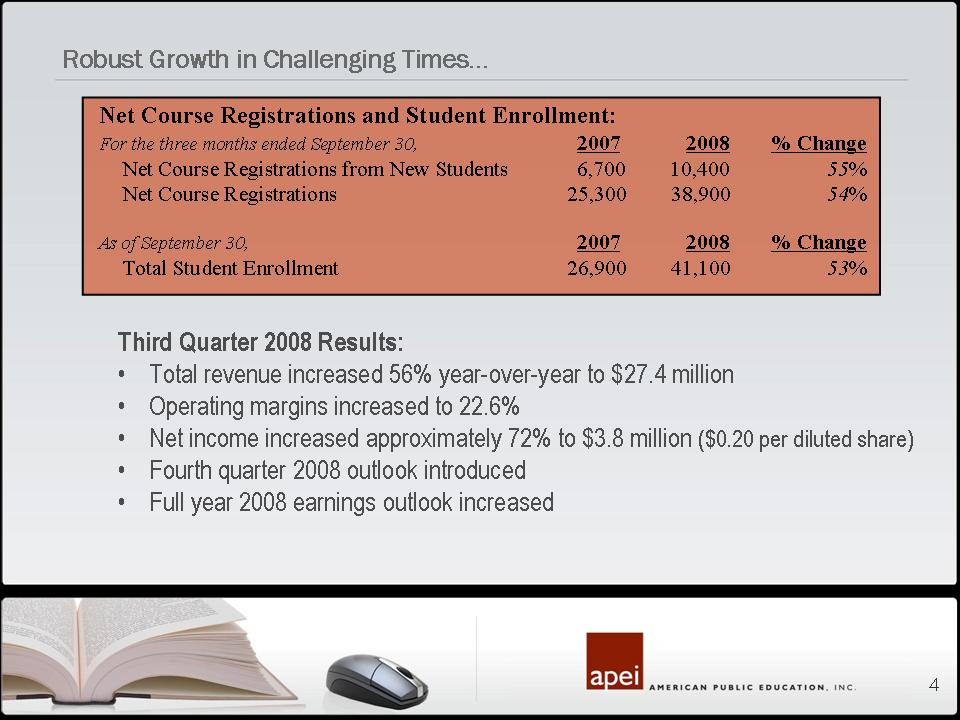
Net Course Registrations and Student Enrollment: For the three months ended September 30, 2007 2008 % Change Net Course Registrations from New Students 6,700 10,400 55% Net Course Registrations 25,300 38,900 54% As of September 30, 2007 2008 % Change Total Student Enrollment 26,900 41,100 53% Third Quarter 2008 Results: Total revenue increased 56% year-over-year to $27.4 million Operating margins increased to 22.6% Net income increased approximately 72% to $3.8 million ($0.20 per diluted share) Fourth quarter 2008 outlook introduced Full year 2008 earnings outlook increased Robust Growth in Challenging Times…
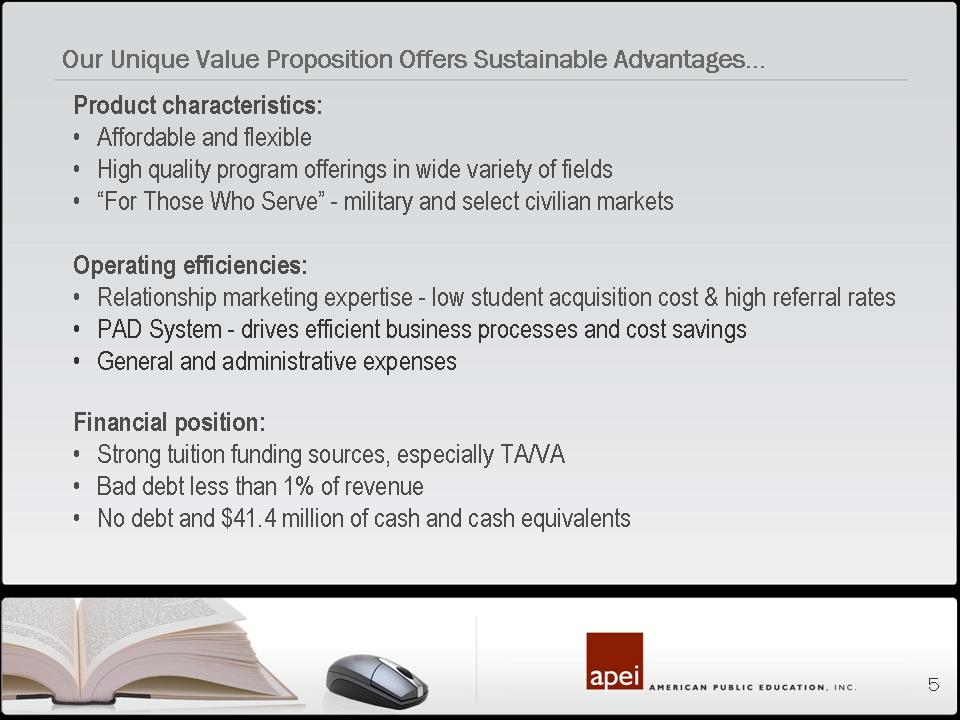
Product characteristics: Affordable and flexible High quality program offerings in wide variety of fields “For Those Who Serve” - military and select civilian markets Operating efficiencies: Relationship marketing expertise - low student acquisition cost & high referral rates PAD System - drives efficient business processes and cost savings General and administrative expenses Financial position: Strong tuition funding sources, especially TA/VA Bad debt less than 1% of revenue No debt and $41.4 million of cash and cash equivalents Our Unique Value Proposition Offers Sustainable Advantages…

Harry Wilkins EVP and Chief Financial Officer Financial Overview
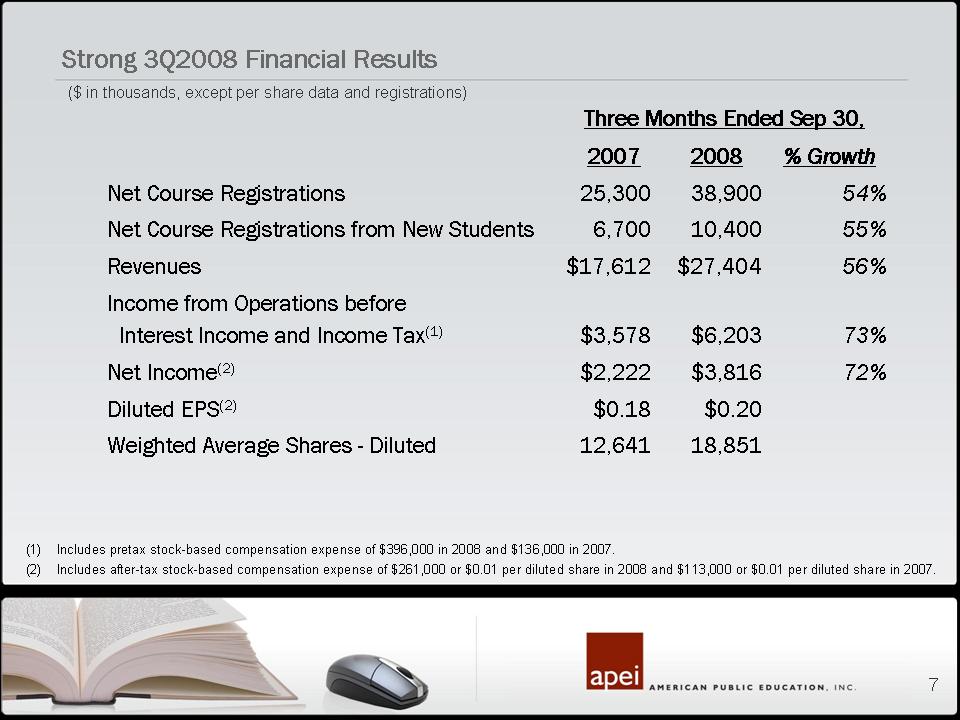
Strong 3Q2008 Financial Results ($ in thousands, except per share data and registrations) Includes pretax stock-based compensation expense of $396,000 in 2008 and $136,000 in 2007. Includes after-tax stock-based compensation expense of $261,000 or $0.01 per diluted share in 2008 and $113,000 or $0.01 per diluted share in 2007. Three Months Ended Sep 30, 2007 2008 Net Course Registrations 25,300 38,900 54% Net Course Registrations from New Students 6,700 10,400 55% Revenues $17,612 $27,404 56% Income from Operations before Interest Income and Income Tax(1) $3,578 $6,203 73% Net Income(2) $2,222 $3,816 72% Diluted EPS(2) $0.18 $0.20 Weighted Average Shares - Diluted 12,641 18,851
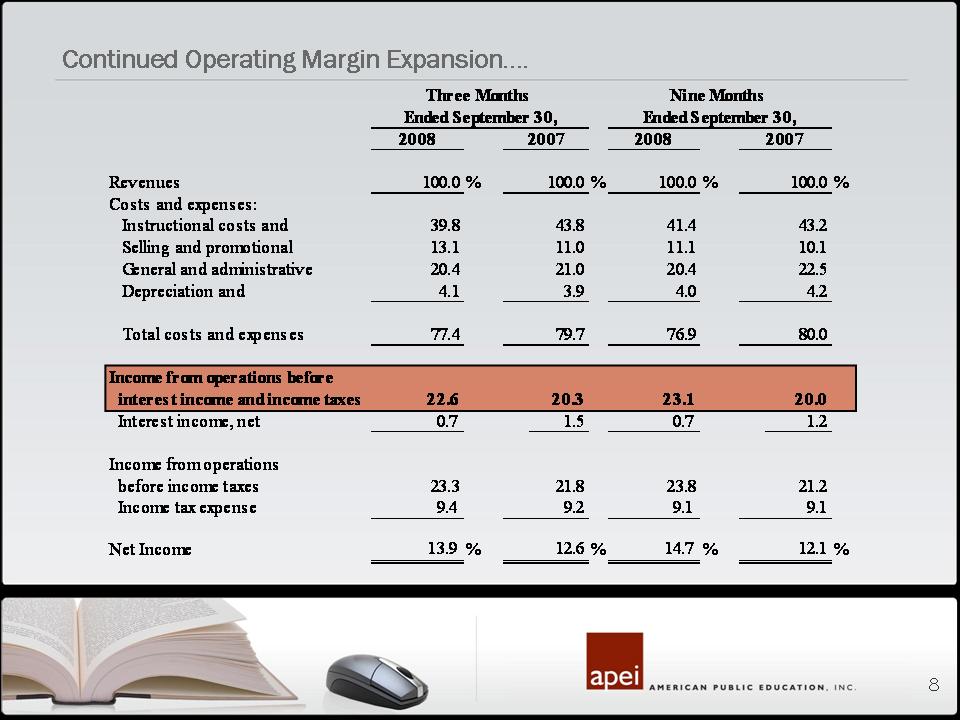
Continued Operating Margin Expansion…. Three Months Nine Months Ended September 30, Ended September 30, 2008 2007 2008 2007 Revenues 100.0 % 100.0 % 100.0 % 100.0 % Costs and expenses: Instructional costs and services 39.8 43.8 41.4 43.2 Selling and promotional 13.1 11.0 11.1 10.1 General and administrative 20.4 21.0 20.4 22.5 Depreciation and amortization 4.1 3.9 4.0 4.2 Total costs and expenses 77.4 79.7 76.9 80.0 Income from operations before interest income and income taxes 22.6 20.3 23.1 20.0 Interest income, net 0.7 1.5 0.7 1.2 Income from operations before income taxes 23.3 21.8 23.8 21.2 Income tax expense 9.4 9.2 9.1 9.1 Net Income 13.9 % 12.6 % 14.7 % 12.1 %
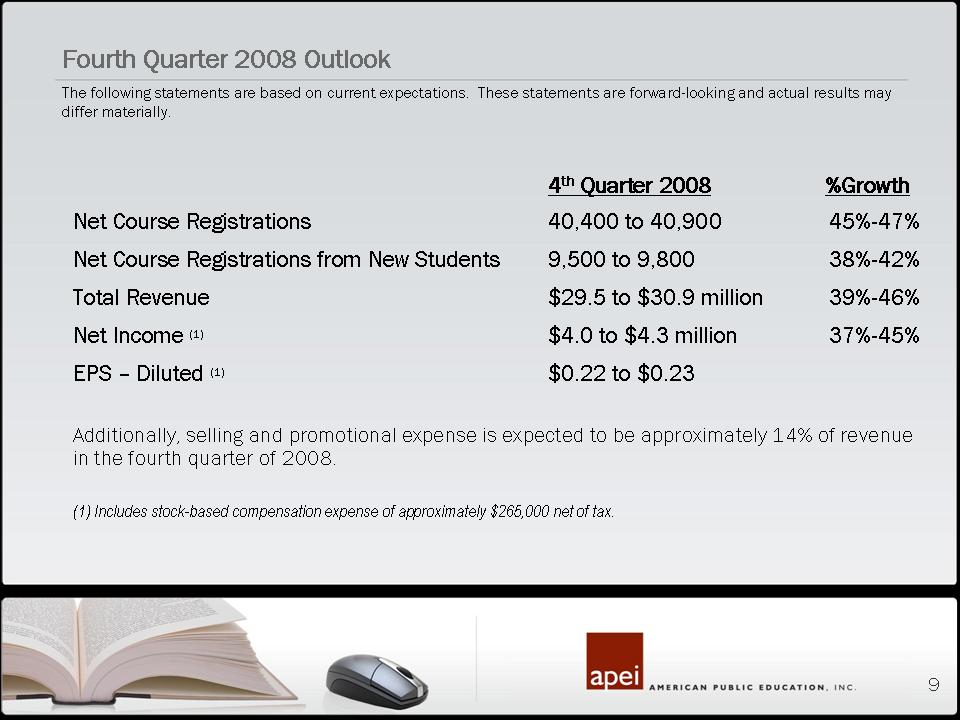
4th Quarter 2008 %Growth Net Course Registrations 40,400 to 40,900 45%-47% Net Course Registrations from New Students 9,500 to 9,800 38%-42% Total Revenue $29.5 to $30.9 million 39%-46% Net Income (1) $4.0 to $4.3 million 37%-45% EPS – Diluted (1) $0.22 to $0.23 Additionally, selling and promotional expense is expected to be approximately 14% of revenue in the fourth quarter of 2008. (1) Includes stock-based compensation expense of approximately $265,000 net of tax. Fourth Quarter 2008 Outlook The following statements are based on current expectations. These statements are forward-looking and actual results may differ materially. Updated FY 2008 %Growth Net Course Registrations 145,700+ 54% Net Course Registrations from New Students 36,300+ 47% Total Revenue $105.2 to $106.6 million 52% to 54% Net Income (1) $15.2 to $15.4 million 73% to 76% EPS – Diluted (1) $0.81 to $0.82 Depreciation and Amortization Expense $4.1 to $4.3 million Capital Expenditures $7.9 to $8.9 million (1) Includes stock-based compensation expense of approximately $1.1 million, net of tax.
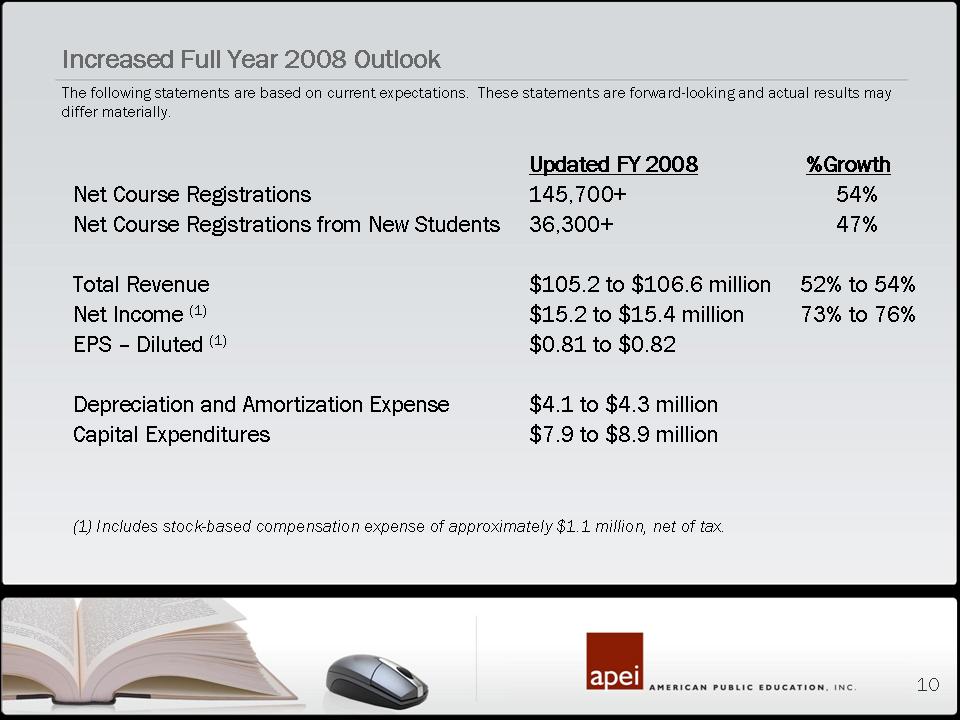
Increased Full Year 2008 Outlook The following statements are based on current expectations. These statements are forward-looking and actual results may differ materially. Updated FY 2008 %Growth Net Course Registrations 145,700 +54% Net Course Registrations from New Students 36,300+ 47% Total Revenue $105.2 to $106.6 million 52% to 54% Net Income (1) $15.2 to $15.4 million 73% to 76% EPS – Diluted (1) $0.81 to $0.82 Depreciation and Amortization Expense $4.1 to $4.3 million Capital Expenditures $7.9 to $8.9 million (1) Includes stock-based compensation expense of approximately $1.1 million, net of tax.
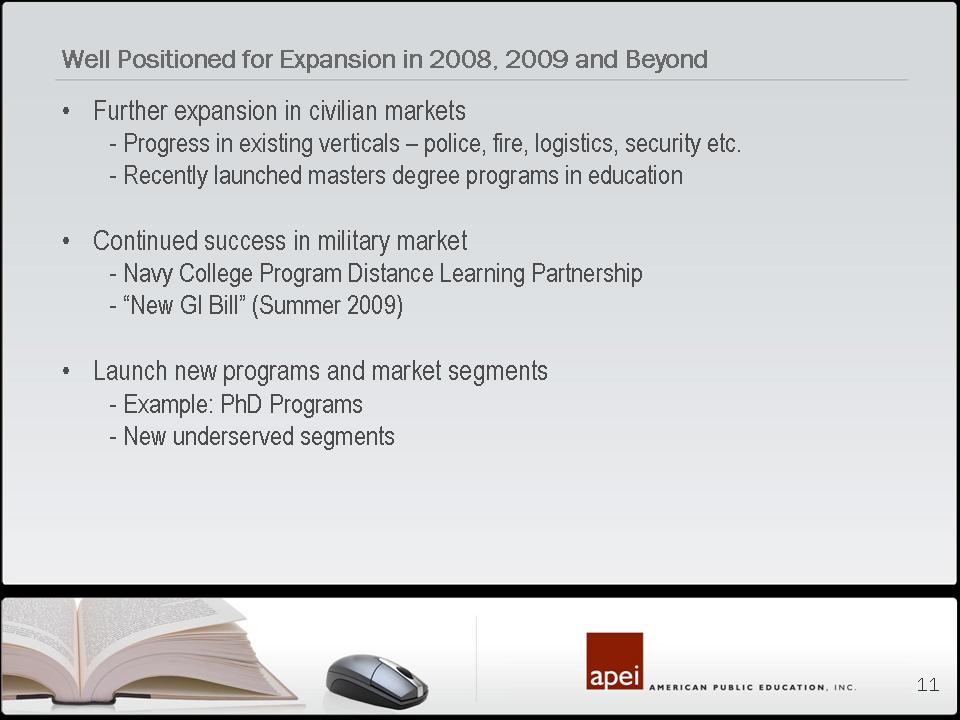
Well Positioned for Expansion in 2008, 2009 and Beyond Further expansion in civilian markets - Progress in existing verticals – police, fire, logistics, security etc. - Recently launched masters degree programs in education Continued success in military market - Navy College Program Distance Learning Partnership - “New GI Bill” (Summer 2009) Launch new programs and market segments - Example: PhD Programs - New underserved segments

Third Quarter 2008 EarningsConference Call Q&A Session