Exhibit 99.2
 Advancing the Learning Experience. Exploring New Opportunities. May 11, 2015 Recent Results and Developments First Quarter 2015
 Statements made in this presentation regarding American Public Education, Inc. or its subsidiaries, that are not historical facts are forward-looking statements based on current expectations, assumptions, estimates and projections about American Public Education and the industry. These forward-looking statements are subject to risks and uncertainties that could cause actual future events or results to differ materially from such statements. Forward-looking statements can be identified by words such as “anticipate", “believe”, “seek”, “could”, “estimate”, “expect”, “intend”, “may”, “plan”, “should”, “will” and “would”. These forward-looking statements include, without limitation, statements regarding expected growth, expected registration and enrollments, expected revenues, expected earnings. Actual results could differ materially from those expressed or implied by these forward-looking statements as a result of various factors, including the various risks described in the “Risk Factors” section and elsewhere in the Company’s Annual Report on Form 10-K for the year ended December 31, 2014, Quarterly Report on Form 10-Q for the period ended March 31, 2015 and in the Company’s other filings with the SEC. The Company undertakes no obligation to update publicly any forward-looking statements for any reason, even if new information becomes available or other events occur in the future. Advancing the Learning Experience | Exploring New Opportunities SAFE HARBOR STATEMENT
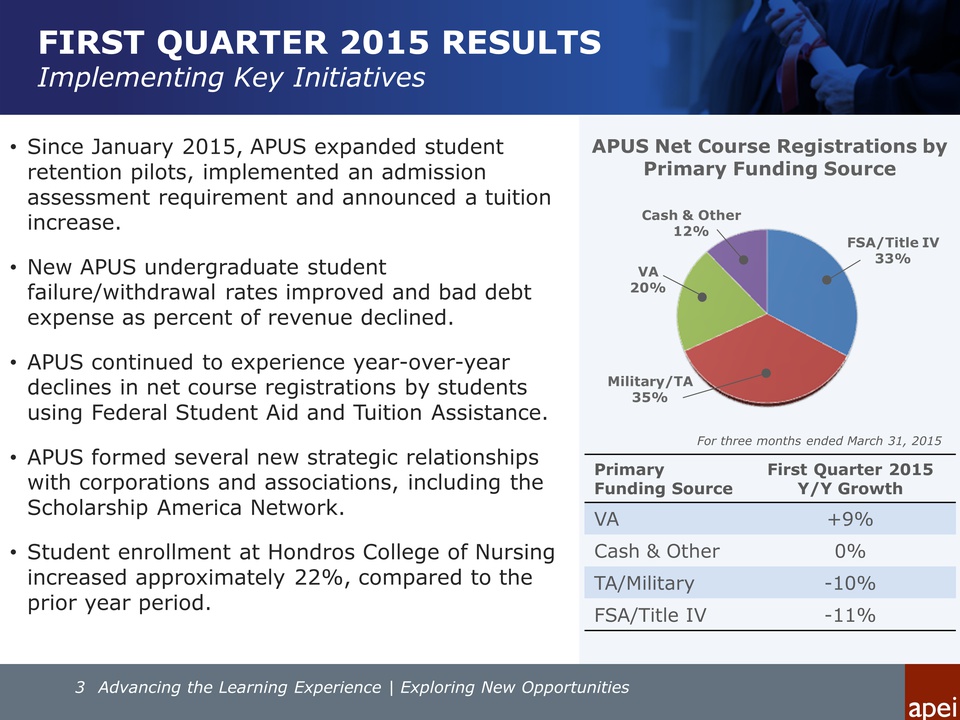 American Public Education, Inc. FIRST QUARTER 2015 RESULTS Implementing Key Initiatives Since January 2015, APUS expanded student retention pilots, implemented an admission assessment requirement and announced a tuition increase. New APUS undergraduate student failure/withdrawal rates improved and bad debt expense as percent of revenue declined. APUS continued to experience year-over-year declines in net course registrations by students using Federal Student Aid and Tuition Assistance. APUS formed several new strategic relationships with corporations and associations, including the Scholarship America Network. Student enrollment at Hondros College of Nursing increased approximately 22%, compared to the prior year period. Primary Funding Source First Quarter 2015 Y/Y Growth VA +9% Cash & Other 0% TA/Military -10% FSA/Title IV -11% For three months ended March 31, 2015 APUS Net Course Registrations by Primary Funding Source Cash & Other 12% FSA/Title IV 33% Military/TA 35% VA 20% Advancing the Learning Experience | Exploring New Opportunities
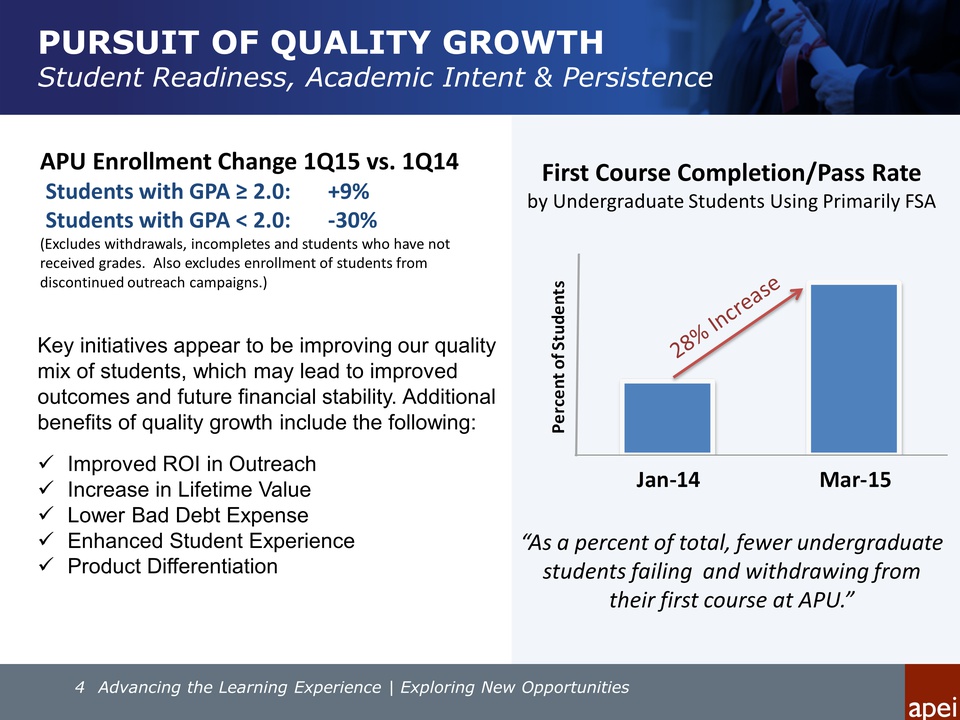 PURSUIT OF QUALITY GROWTH Student Readiness, Academic Intent & Persistence 4 Advancing the Learning Experience | Exploring New Opportunities APU Enrollment Change 1Q15 vs. 1Q14 Students with GPA ≥ 2.0: +9% Students with GPA < 2.0: -30% (Excludes withdrawals, incompletes and students who have not received grades. Also excludes enrollment of students from discontinued outreach campaigns.) Key initiatives appear to be improving our quality mix of students, which may lead to improved outcomes and future financial stability. Additional benefits of quality growth include the following: Improved ROI in Outreach Increase in Lifetime Value Lower Bad Debt Expense Enhanced Student Experience Product Differentiation “As a percent of total, fewer undergraduate students failing and withdrawing from their first course at APU.” First Course Completion/Pass Rate by Undergraduate Students Using Primarily FSA Jan-14 Mar-15 Percent of Students 28% Increase
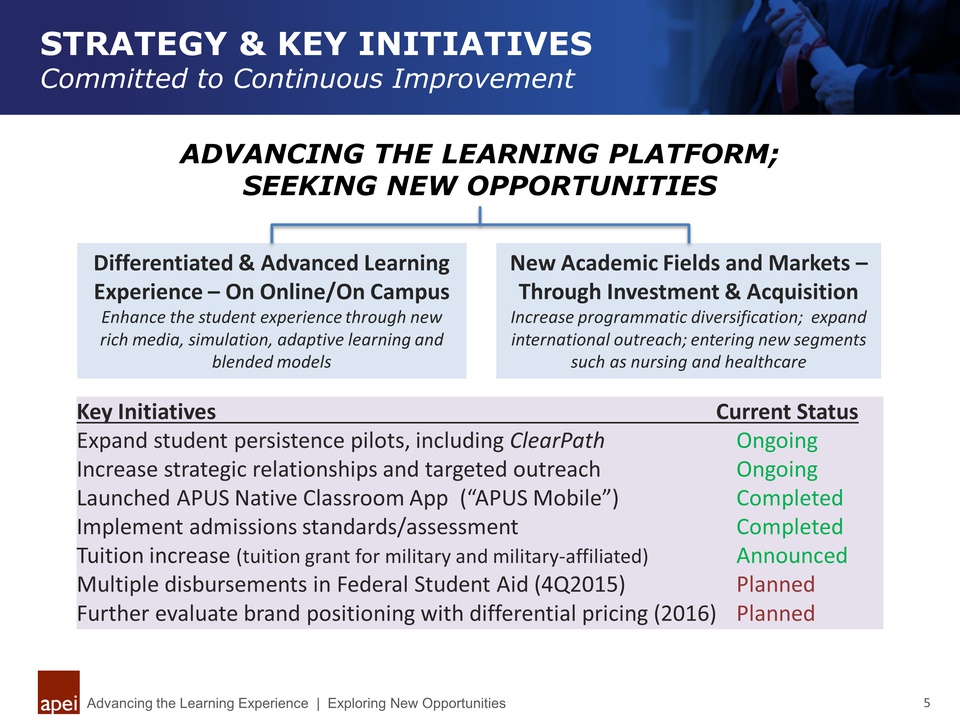 STRATEGY & KEY INITIATIVES Committed to Continuous Improvement Advancing the Learning Experience | Exploring New Opportunities ADVANCING THE LEARNING PLATFORM; SEEKING NEW OPPORTUNITIES Key Initiatives Current Status Expand student persistence pilots, including ClearPath Ongoing Increase strategic relationships and targeted outreach Ongoing Launched APUS Native Classroom App (“APUS Mobile”) Completed Implement admissions standards/assessment Completed Tuition increase (tuition grant for military and military-affiliated) Announced Multiple disbursements in Federal Student Aid (4Q2015) Planned Further evaluate brand positioning with differential pricing (2016) Planned Differentiated & Advanced Learning Experience – On Online/On Campus Enhance the student experience through new rich media, simulation, adaptive learning and blended models New Academic Fields and Markets – Through Investment & Acquisition Increase programmatic diversification; expand international outreach; entering new segments such as nursing and healthcare
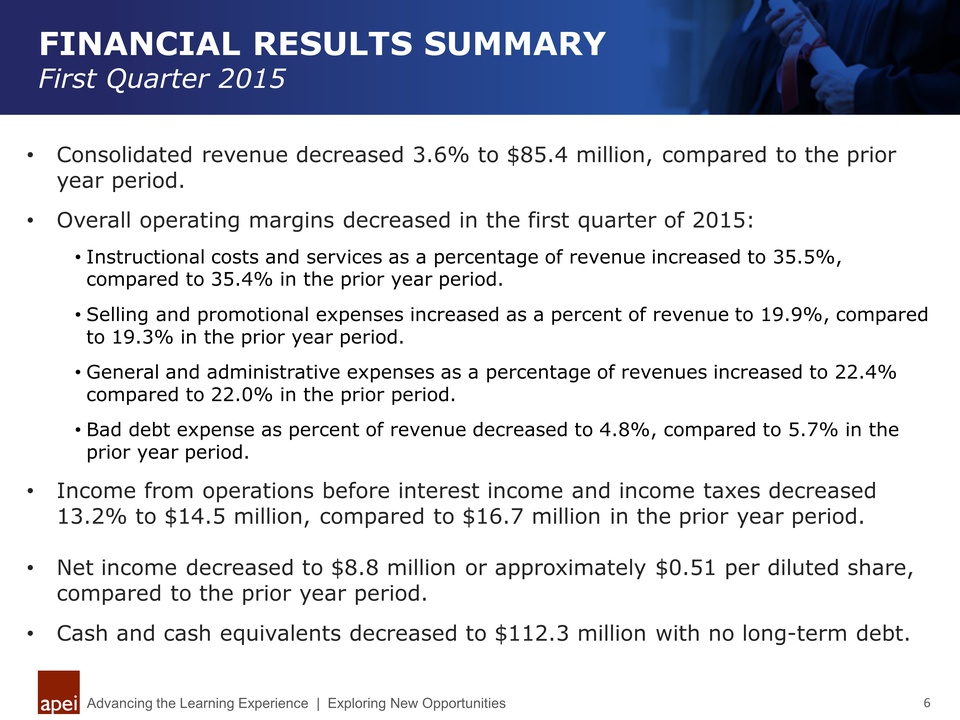 FINANCIAL RESULTS SUMMARY First Quarter 2015 Advancing the Learning Experience | Exploring New Opportunities Consolidated revenue decreased 3.6% to $85.4 million, compared to the prior year period. Overall operating margins decreased in the first quarter of 2015: Instructional costs and services as a percentage of revenue increased to 35.5%, compared to 35.4% in the prior year period. Selling and promotional expenses increased as a percent of revenue to 19.9%, compared to 19.3% in the prior year period. General and administrative expenses as a percentage of revenues increased to 22.4% compared to 22.0% in the prior period. Bad debt expense as percent of revenue decreased to 4.8%, compared to 5.7% in the prior year period. Income from operations before interest income and income taxes decreased 13.2% to $14.5 million, compared to $16.7 million in the prior year period. Net income decreased to $8.8 million or approximately $0.51 per diluted share, compared to the prior year period. Cash and cash equivalents decreased to $112.3 million with no long-term debt.
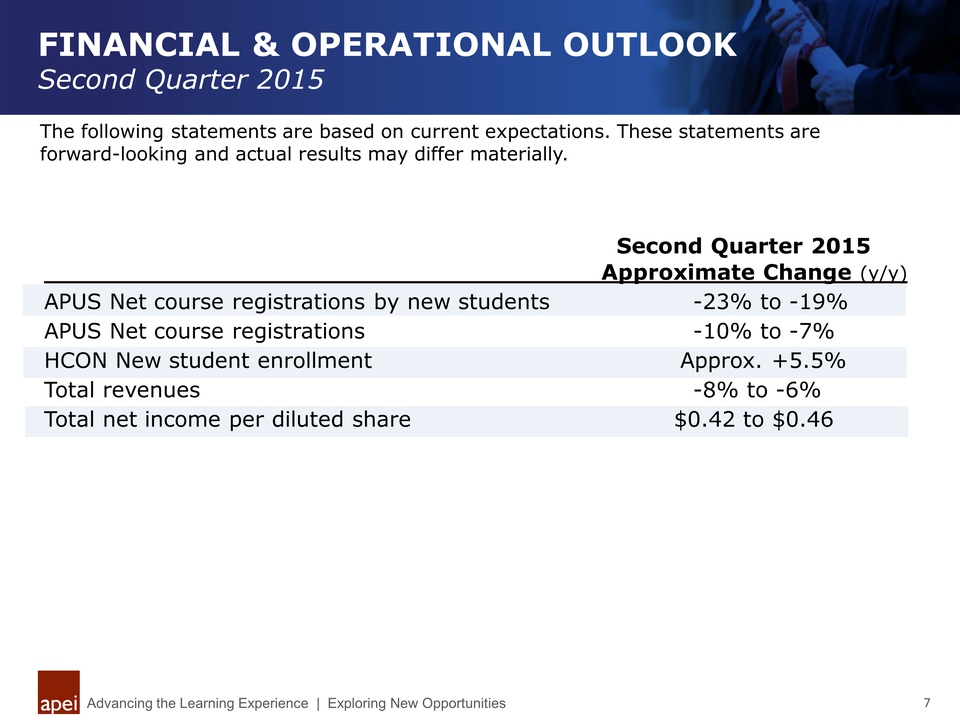 FINANCIAL & OPERATIONAL OUTLOOK Second Quarter 2015 Advancing the Learning Experience Exploring New Opportunities The following statements are based on current expectations. These statements are forward-looking and actual results may differ materially. Approximate Change (y/y) APUS Net course registrations by new students -23% to -19% APUS Net course registrations -10% to -7% HCON New student enrollment Approx. +5.5% Total revenues -8% to -6% Total net income per diluted share $0.42 to $0.46 Second Quarter 2015
 First Quarter 2015 Financial Results Conference Call May 11, 2015
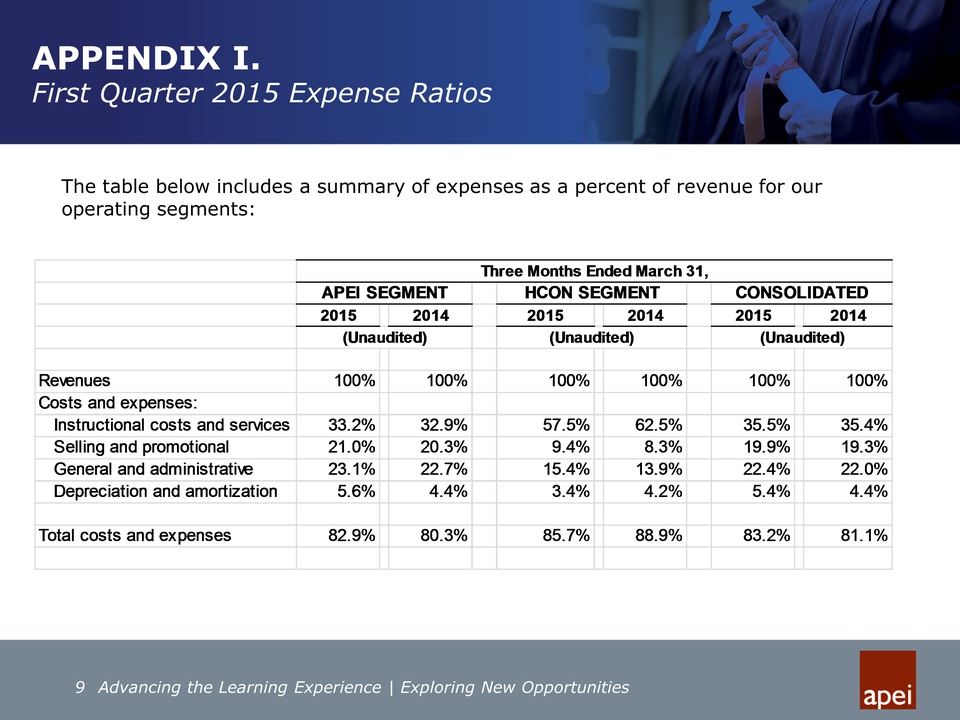 Advancing the Learning Experience Exploring New Opportunities The table below includes a summary of expenses as a percent of revenue for our operating segments: 2015 2014 2015 2014 2015 2014 Revenues 100% 100% 100% 100% 100% 100% Costs and expenses: Instructional costs and services 33.2% 32.9% 57.5% 62.5% 35.5% 35.4% Selling and promotional 21.0% 20.3% 9.4% 8.3% 19.9% 19.3% General and administrative 23.1% 22.7% 15.4% 13.9% 22.4% 22.0% Depreciation and amortization 5.6% 4.4% 3.4% 4.2% 5.4% 4.4% Total costs and expenses 82.9% 80.3% 85.7% 88.9% 83.2% 81.1% HCON SEGMENT(Unaudited) CONSOLIDATED Three Months Ended March 31,APEI SEGMENT(Unaudited)(Unaudited) APPENDIX I. First Quarter 2015 Expense Ratios