MANAGEMENT'S DISCUSSION AND ANALYSIS
OF FINANCIAL POSITION AND RESULTS OF OPERATIONS
Year Ended December 31, 2024
INDEX
| | | | | |
| Introduction | |
| About IAMGOLD | |
| Highlights | |
| Operating and Financial Results | |
| Outlook | |
| Environmental, Social and Governance | |
| |
| Operations | |
| |
| Operating and Financial Performance | |
| Côté Gold | |
| Westwood | |
| Essakane | |
| Other Projects | |
| Exploration | |
| |
| |
| |
| |
| |
| |
| Financial Condition | |
| |
| Liquidity and Capital Resources | |
| Cash Flow | |
| |
| Market Risk | |
| Related Party Transactions | |
| Shareholders’ Equity | |
| Quarterly Financial Review | |
| Disclosure Controls and Procedures and Internal Control over Financial Reporting | |
| Critical Judgments, Estimates and Assumptions | |
| Notes to Investors Regarding the Use of Resources | |
| New Accounting Standards | |
| Risks and Uncertainties | |
| Non-GAAP Financial Measures | |
| Cautionary Statement on Forward-Looking Information | |
| | | | | |
IAMGOLD CORPORATION Annual Management's Discussion and Analysis - December 31, 2024 | 1 |
INTRODUCTION
The following Management’s Discussion and Analysis (“MD&A”) of IAMGOLD Corporation (“IAMGOLD” or the “Company”), dated February 20, 2025, should be read in conjunction with IAMGOLD's audited consolidated financial statements and related notes as at and for the fiscal year ended December 31, 2024. All figures in this MD&A are in U.S. dollars and tabular dollar amounts are in millions, unless stated otherwise. Additional information on IAMGOLD can be found at www.iamgold.com. However, the information on the website is not in any way incorporated in or made a part of this MD&A. ABOUT IAMGOLD
IAMGOLD is an intermediate gold producer and developer based in Canada with three operating mines: Côté Gold (Canada), Westwood (Canada) and Essakane (Burkina Faso) (together referred to as continuing operations). Côté Gold ("Côté') commenced production on March 31, 2024. The Company has an established portfolio of early stage and advanced exploration projects within highly prospective mining districts in Canada. IAMGOLD employs approximately 3,700 people and is committed to maintaining its culture of accountable mining through high standards of Environmental, Social and Governance (“ESG”) practices, including its commitment to strive for the goal of Zero Harm®, in every aspect of its business. IAMGOLD is listed on the New York Stock Exchange (NYSE:IAG) and the Toronto Stock Exchange (TSX:IMG).
On January 31, 2023, IAMGOLD completed the sale of its interests in Rosebel to Zijin Mining Group Co. Ltd. ("Zijin"). Rosebel was accounted for as an asset held for sale until derecognition on January 31, 2023, and discontinued operation for the one month ended January 31, 2023. On December 20, 2022, the Company entered into definitive agreements to sell its interests in its development and exploration assets in West Africa (the "Bambouk Assets") and some of the transactions closed on April 25, 2023, and December 23, 2024. See "Bambouk Assets" for additional details.
HIGHLIGHTS
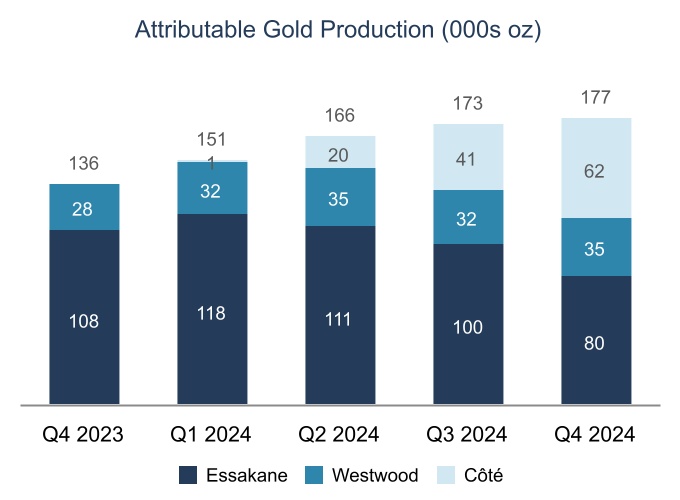
Operating and financial results •Attributable gold production for the year was 667,000 ounces, the mid-point of the Company’s increased production guidance of 625,000 to 715,000 ounces. Fourth quarter attributable production was 177,000 ounces.
•Côté produced 124,000 attributable ounces (199,000 ounces on a 100% basis) during its initial nine months of operation and 62,000 attributable ounces (96,000 ounces on a 100% basis) in the fourth quarter as it continued to ramp up to nameplate capacity, close to the bottom end of the attributable production guidance range of 130,000 to 175,000 ounces (220,000 to 290,000 ounces at 100%).
•Westwood produced 134,000 ounces for the full year and 35,000 ounces in the fourth quarter, exceeding the top end of the production guidance range of 115,000 to 130,000 ounces.
•Essakane produced 409,000 attributable ounces for the full year and 80,000 attributable ounces in the fourth quarter, achieving the top end of the attributable production guidance range of 380,000 to 410,000 ounces.
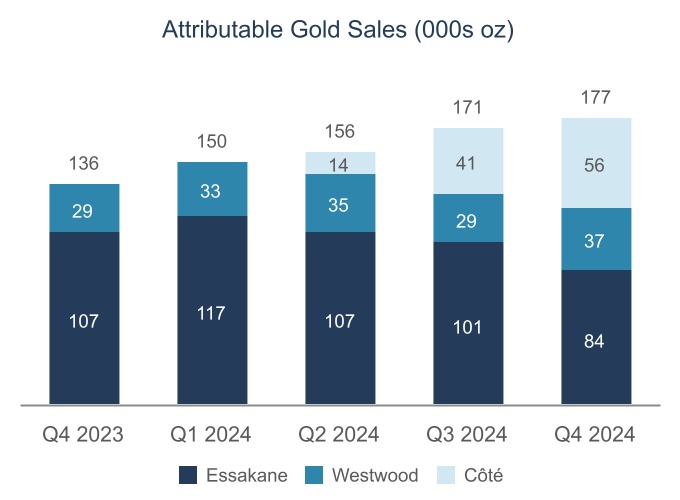
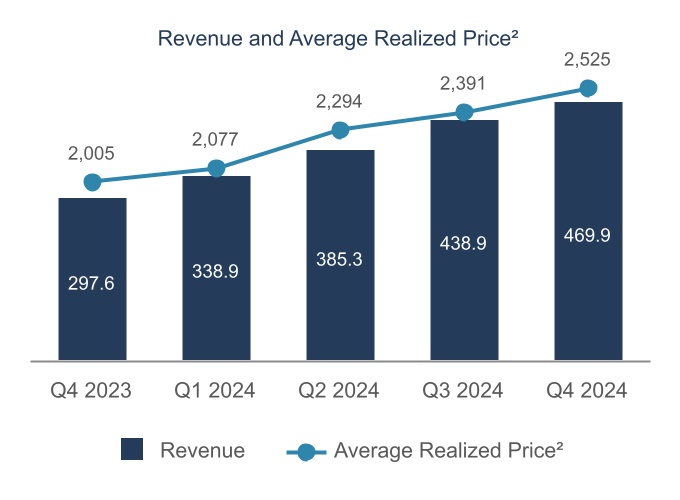
•Revenues for the year were a record of $1,633.0 million from sales of 699,000 ounces at an average realized gold price1 of $2,330 per ounce and $469.9 million from sales of 185,000 ounces at an average realized gold price of $2,525 per ounce for the quarter.
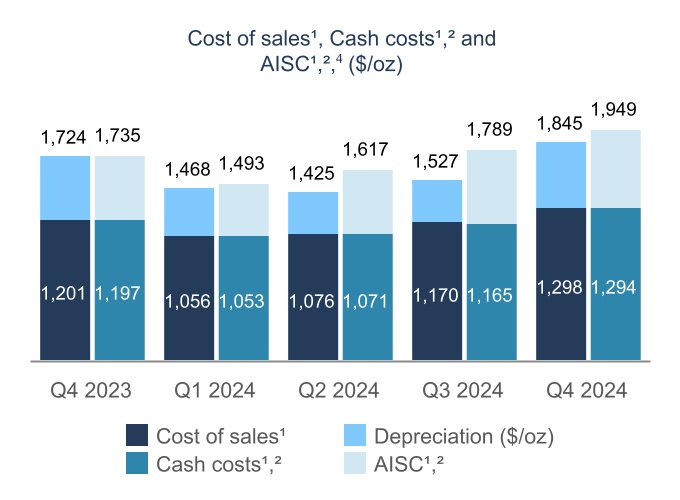
•Cost of sales per ounce sold, excluding Côté1, was $1,181 for the year, at the low end of cost guidance of $1,175 to $1,275 and $1,397 for the fourth quarter. Including Côté, cost of sales per ounce sold was $1,156 for the year and $1,298 for the fourth quarter.
•Cash cost1 per ounce sold, excluding Côté, was $1,176 for the year, at the low end of guidance range of $1,175 to $1,275 and $1,393 for the fourth quarter. Including Côté, cash cost1 per ounce sold was $1,152 for the year and $1,294 for the fourth quarter.
•AISC1 per ounce sold, excluding Côté, was $1,725 for the year, trending toward the low end of guidance range of $1,700 to $1,825 and $2,071 for the fourth quarter. Including Côté, AISC1 per ounce sold was $1,716 for the year and $1,949 for the fourth quarter.
•Net earnings and adjusted net earnings per share attributable to equity holders1 of $1.52 and $0.55 for the year, respectively; for the fourth quarter, net earnings and adjusted net earnings per share attributable to equity holders1 of $0.15 and $0.10, respectively. The 2024 net earnings were adjusted for a $455.5 million gain on the reversal of the previously recorded impairment at Westwood.
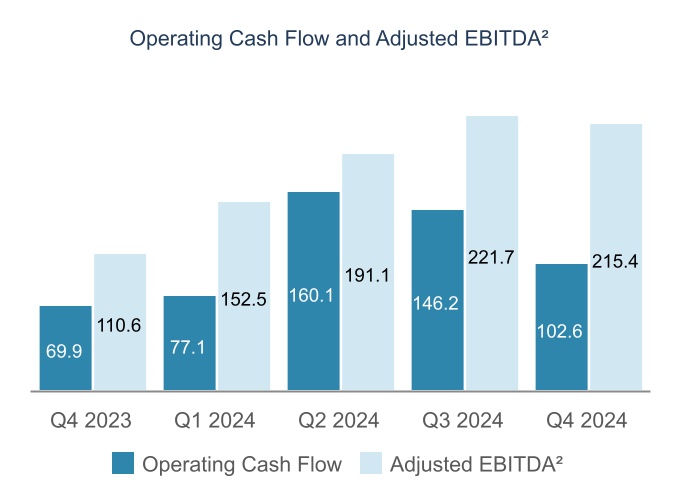
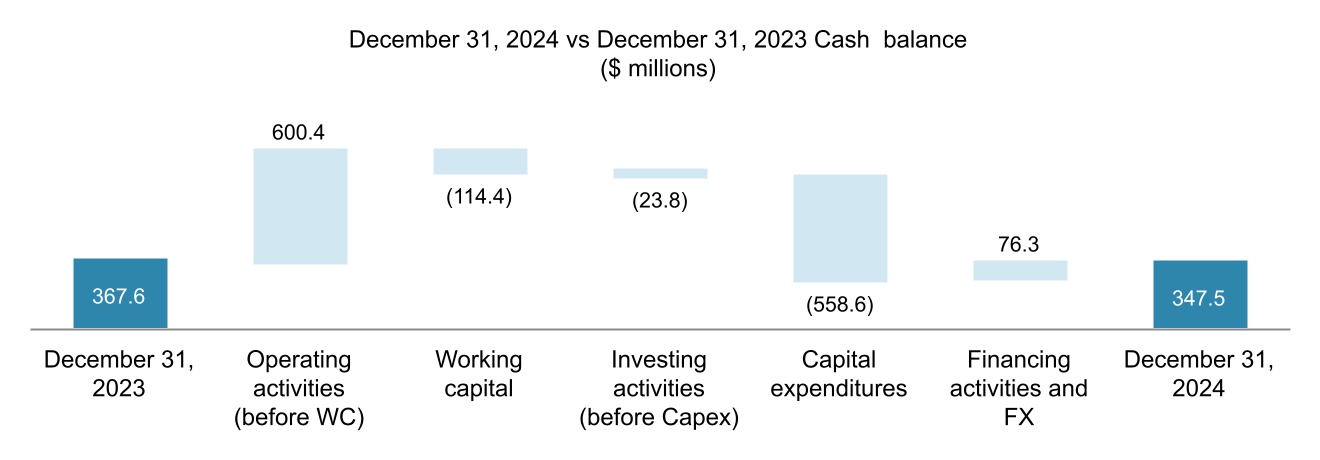
•Net cash from operating activities was $486.0 million for the year and $102.6 million for the fourth quarter. Net cash from operating activities, before movements in working capital and non-current ore stockpiles1, was $600.4 million for the year and $127.2 million for the fourth quarter.
____________________________
1.This is a non-GAAP financial measure. See “Non-GAAP Financial Measures".
| | | | | |
IAMGOLD CORPORATION Annual Management's Discussion and Analysis - December 31, 2024 | 2 |
•Earnings before interest, income taxes, depreciation and amortization (“EBITDA”)1 was $1,323.0 million for the year ($259.5 million for the fourth quarter) and adjusted EBITDA1 was $780.6 million for the year ($215.4 million for the fourth quarter). The 2024 EBITDA was adjusted for a $455.5 million gain on the reversal of the previously recorded impairment at Westwood.
•Mine-site free cash flow1, excluding Côté Gold, was $344.9 million for the year and $61.3 million for the fourth quarter. The mine-site free cash flow from Côté Gold was $40.2 million for the initial five months of commercial operations and $16.9 million during the fourth quarter.
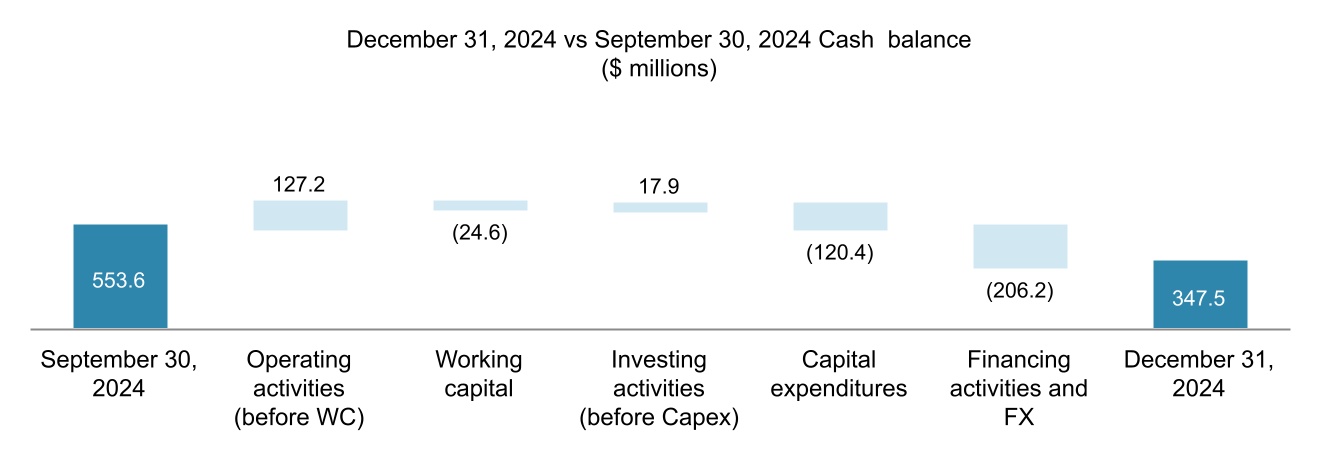
•The Company has available liquidity1 of $767.0 million, mainly comprised of cash and cash equivalents of $347.5 million and the available balance of the revolving credit facility (“Credit Facility”) of $418.5 million as at December 31, 2024.
•In health and safety, for the year ended December 31, 2024, the Company reported a TRIFR (total recordable injuries frequency rate) of 0.63, an improved trend since last year and third successive year of improvement.
Outlook
•Attributable gold production of 735,000 to 820,000 ounces, driven by the ramp-up of Côté to nameplate production later in the year and continued strong production levels from Essakane and Westwood.
•Production at Côté in its first full year, on a 100% basis, is expected to be between 360,000 to 400,000 ounces for the year (250,000 to 280,000 ounces on an attributable basis).
•Cash cost1 guidance of $1,200 to $1,350 per ounce sold and AISC1 guidance of $1,625 to $1,800 per ounce sold. Costs are expected to be lower in the second half of the year as Côté progresses towards nameplate production.
Mineral Reserves and Resources
•Proven and Probable (“P&P”) Mineral Reserves (100% basis) total 10.7 million ounces of gold in 296 million tonnes (“Mt”) at 1.12 grams per tonne gold (“g/t Au”) (8.2 million ounces attributable). P&P Mineral Reserves decreased 3%, or 367,000 ounces, from the year prior. P&P Mineral Reserves at Essakane increased 5% net of depletion, offset by a 4% decrease at Côté due to depletion.
•Measured and Indicated (“M&I”) Mineral Resources (100% basis) increased 3% to 26.7 million ounces of gold in 846 Mt at 0.98 g/t Au (21.2 million ounces attributable). Inferred Mineral Resources (100% basis) increased 27% to a total of 12.8 million ounces (11.4 million ounces attributable).
•Updated Mineral Resources for the 100%-owned Nelligan Project of 3.1 million Indicated gold ounces in 102.8 million tonnes (“Mt”) at 0.95 grams per tonne gold (“g/t Au”), and 5.2 million Inferred ounces (166.4 Mt at 0.96 g/t Au). This represents a 56% increase in Indicated ounces, or 1.1 million ounces, with an accompanying 13% increase in grade; as well as a 33% increase in Inferred ounces, or 1.3 million ounces, with a similar 14% increase in grade. Nelligan mineralization remains open along strike and at depth.
Corporate
•On December 2, 2024, the Company announced the return of its ownership in Côté to a 70% interest effective November 30, 2024, following the repurchase of the 9.7% interest of the Côté Gold Mine for $377.7 million. The interest that was transferred to Sumitomo Metal Mining Co. Ltd. (“Sumitomo” or “SMM”) as part of the JV funding and amending agreement entered into on December 19, 2022.
•On December 23, 2024, the Company announced that it executed an amendment to its secured revolving credit facility ("Credit Facility"). Under the amendment, the term has been extended to four years with a new maturity date of December 20, 2028, and the Credit Facility size has been increased from $425 million to $650 million. The Credit Facility will be available for general working capital purposes and provides flexibility as the Company looks to lower the cost of its debt and improve its capital structure in 2025.
•On December 23, 2024, the Company announced that it closed the sale of its 100% interest in the Karita Gold Project ("Karita") and associated exploration assets in Guinea (together, the "Guinea Assets") for gross cash proceeds of $35.5 million. The sale of the Guinea Assets is part of the previously announced transactions with Managem (see news release dated December 20, 2022).
•During the second half of 2024, the Company delivered 75,000 ounces into the 2022 gold prepay arrangements (37,500 ounces in the fourth quarter), and a further 12,500 ounces during January 2025, reducing the outstanding balance of all prepay arrangements to 62,500 ounces as at January 31, 2025.
•On November 26, 2024, the Company received an updated credit rating from Standard and Poor’s which upgraded the corporate credit rating from B- to B with a stable outlook. On January 13, 2025, the Company received an updated credit rating from Moody's which upgraded the corporate credit rating from B3 to B2 with a stable outlook.
•On November 20, 2024, the Company consolidated corporate functions to better align with current asset base and initiated the closure of the Brossard office in Quebec.
•On February 3, 2025, Annie Torkia Lagacé joined as the Chief Legal and Strategy Officer to lead the Legal, Business Development, and External Affairs teams. As part of this strategic realignment, two long-tenured executives, Tim Bradburn, SVP, General Counsel and Corporate Secretary and Stephen Eddy, SVP, Business Development departed IAMGOLD.
____________________________
1.This is a non-GAAP financial measure. See “Non-GAAP Financial Measures".
| | | | | |
IAMGOLD CORPORATION Annual Management's Discussion and Analysis - December 31, 2024 | 3 |
OPERATING AND FINANCIAL RESULTS For more details and the Company's overall outlook for 2025, see “Outlook”, and for individual mines performance, see “Operations”. The following table summarizes certain operating and financial results for the three months ended December 31, 2024 (Q4 2024) and December 31, 2023 (Q4 2023) and the years ended December 31 for 2024, 2023 and 2022 and certain measures of the Company's financial ("discontinued operations") position as at December 31, 2023, and December 31, 2022. Financial results of Rosebel include the one-month period ended January 31, 2023, and twelve month period ended December 31, 2022, prior to the closing of the sale to Zijin.
| | | | | | | | | | | | | | | | | |
| | | |
| | | | | |
| Q4 2024 | Q4 2023 | 2024 | 2023 | 2022 |
Key Operating Statistics ($ millions from continuing operations) | | | | | |
| Gold production – attributable (000s oz) | 177 | | 136 | | 667 | | 465 | | 499 | |
- Côté Gold1 | 62 | | — | | 124 | | — | | — | |
| - Westwood | 35 | | 28 | | 134 | | 93 | | 67 | |
| - Essakane | 80 | | 108 | | 409 | | 372 | | 432 | |
| | | | | |
| | | | | |
| | | | | |
| | | | | |
| Gold sales – attributable (000s oz) | 177 | | 136 | | 654 | | 462 | | 506 | |
- Côté Gold1 | 56 | | — | | 111 | | — | | — | |
| - Westwood | 37 | | 29 | | 134 | | 90 | | 66 | |
| - Essakane | 84 | | 107 | | 409 | | 372 | | 440 | |
| | | | | |
| | | | | |
| | | | | |
| | | | | |
Cost of sales2 ($/oz sold) – attributable | $ | 1,298 | | $ | 1,201 | | $ | 1,156 | | $ | 1,291 | | $ | 1,041 | |
- Côté Gold1 | $ | 1,083 | | $ | — | | $ | 1,035 | | $ | — | | $ | — | |
| - Westwood | $ | 1,155 | | $ | 1,446 | | $ | 1,177 | | $ | 1,600 | | $ | 2,093 | |
| - Essakane | $ | 1,504 | | $ | 1,134 | | $ | 1,182 | | $ | 1,216 | | $ | 882 | |
| | | | | |
| | | | | |
| | | | | |
| | | | | |
Cash costs3 ($/oz sold) – attributable | $ | 1,294 | | $ | 1,197 | | $ | 1,152 | | $ | 1,261 | | $ | 1,052 | |
- Côté Gold1 | $ | 1,080 | | — | | $ | 1,032 | | — | | — | |
| - Westwood | $ | 1,148 | | $ | 1,434 | | $ | 1,167 | | $ | 1,591 | | $ | 2,068 | |
| - Essakane | $ | 1,501 | | $ | 1,132 | | $ | 1,179 | | $ | 1,181 | | $ | 899 | |
| | | | | |
| | | | | |
| | | | | |
| | | | | |
AISC3 ($/oz sold) – attributable | $ | 1,949 | | $ | 1,735 | | $ | 1,716 | | $ | 1,783 | | $ | 1,508 | |
- Côté Gold1 | $ | 1,685 | | $ | — | | $ | 1,658 | | $ | — | | $ | — | |
| - Westwood | $ | 1,688 | | $ | 2,049 | | $ | 1,702 | | $ | 2,344 | | $ | 2,568 | |
| - Essakane | $ | 2,118 | | $ | 1,548 | | $ | 1,625 | | $ | 1,521 | | $ | 1,234 | |
| | | | | |
| | | | | |
| | | | | |
| | | | | |
Average realized gold price3,4 ($/oz) | $ | 2,525 | | $ | 2,005 | | $ | 2,330 | | $ | 1,955 | | $ | 1,721 | |
Key Operating Statistics ($ millions from Rosebel discontinued operation) | | | | | |
| Gold production – attributable (000s oz) | — | | — | | — | | 25 | | 214 | |
| Gold sales – attributable (000s oz) | — | | — | | — | | 24 | | 215 | |
Cost of sales3 ($/oz sold) – attributable | $ | — | | $ | — | | $ | — | | $ | 949 | | $ | 1,269 | |
Cash costs3 ($/oz sold) – attributable | $ | — | | $ | — | | $ | — | | $ | 949 | | $ | 1,243 | |
AISC3 ($/oz sold) – attributable | $ | — | | $ | — | | $ | — | | $ | 1,358 | | $ | 1,753 | |
| | | | | |
| | | | | |
| | | | | |
| | | | | |
| | | | | |
| | | | | |
| | | | | |
| | | | | |
| | | | | |
| | | | | |
| | | | | |
| | | | | |
| | | | | |
| | | | | |
| | | | | |
| | | | | |
| | | | | |
| | | | | |
| | | | | |
| | | | | |
| | | | | |
| | | | | |
| | | | | |
| | | | | |
| | | | | |
| | | | | |
| | | | | |
| | | | | |
| | | | | |
| | | | | |
| | | | | |
| | | | | |
| | | | | |
| | | | | |
| | | | | |
| | | | | |
| | | | | |
| | | | | |
| | | | | |
| | | | | |
| | | | | |
| | | | | |
| | | | | |
| | | | | |
| | | | | |
| | | | | |
| | | | | |
| | | | | |
| | | | | |
| | | | | |
| | | | | |
| | | | | |
| | | | | |
| | | | | |
| | | | | |
| | | | | |
| | | | | |
| | | | | |
| | | | | |
| | | | | |
| | | | | |
1.Attributable portion for Côté Gold is based on IAMGOLD’s ownership of 60.3% for the period of January to November 2024, increasing to 70% for December 2024. All-in sustaining cost for Côté Gold for 2024 represents the five-month period following achievement of commercial production.
2.Throughout this MD&A, cost of sales, excluding depreciation, is disclosed in the segment note in the consolidated financial statements.
3.Refer to the “Non-GAAP Financial Measures” disclosure at the end of this MD&A for a description and calculation of these measures.
4.The average realized gold price in the fourth quarter 2024, excluding the impact of the 2022 Prepay Arrangement (as defined below), was $2,664 per ounce and $2,414 per ounce for the year ended 2024.
| | | | | |
IAMGOLD CORPORATION Annual Management's Discussion and Analysis - December 31, 2024 | 4 |
| | | | | | | | | | | | | | | | | |
| Q4 2024 | Q4 2023 | 2024 | 2023 | 2022 |
Financial Results ($ millions from continuing operations) | | | | | |
| Revenues | $ | 469.9 | | $ | 297.6 | | $ | 1,633.0 | | $ | 987.1 | | $ | 958.8 | |
| | | | | |
| Gross profit | $ | 130.9 | | $ | 49.8 | | $ | 549.9 | | $ | 124.1 | | $ | 147.9 | |
EBITDA1 | $ | 259.5 | | $ | 70.2 | | $ | 1,323.0 | | $ | 381.0 | | $ | 300.4 | |
| - Continuing operations | $ | 259.5 | | $ | 70.2 | | $ | 1,323.0 | | $ | 366.6 | | $ | 292.3 | |
| - Discontinued operations | $ | — | | $ | — | | $ | — | | $ | 14.4 | | $ | 8.1 | |
Adjusted EBITDA1 | $ | 215.4 | | $ | 110.6 | | $ | 780.6 | | $ | 338.5 | | $ | 434.0 | |
| - Continuing operations | $ | 215.4 | | $ | 110.6 | | $ | 780.6 | | $ | 315.1 | | $ | 313.4 | |
| - Discontinued operations | $ | — | | $ | — | | $ | — | | $ | 23.4 | | $ | 120.6 | |
| Net earnings (loss) attributable to equity holders | $ | 86.2 | | $ | (9.4) | | $ | 819.6 | | $ | 94.3 | | $ | (70.1) | |
| - Continuing operations | $ | 86.2 | | $ | (9.4) | | $ | 819.6 | | $ | 88.7 | | $ | (55.5) | |
| - Discontinued operations | $ | — | | $ | — | | $ | — | | $ | 5.6 | | $ | (14.6) | |
Adjusted net earnings (loss) attributable to equity holders1 | $ | 57.2 | | $ | 26.8 | | $ | 296.0 | | $ | 59.3 | | $ | 22.7 | |
| - Continuing operations | $ | 57.2 | | $ | 26.8 | | $ | 296.0 | | $ | 44.7 | | $ | (35.6) | |
| - Discontinued operations | $ | — | | $ | — | | $ | — | | $ | 14.6 | | $ | 58.3 | |
| Net earnings (loss) per share attributable to equity holders – continuing operations | $ | 0.15 | | $ | (0.02) | | $ | 1.52 | | $ | 0.18 | | $ | (0.12) | |
Adjusted net earnings (loss) per share attributable to equity holders1 – continuing operations | $ | 0.10 | | $ | 0.06 | | $ | 0.55 | | $ | 0.09 | | $ | (0.07) | |
Net cash from operating activities before changes in working capital1 – continuing operations | $ | 127.2 | | $ | 52.1 | | $ | 600.4 | | $ | 158.9 | | $ | 298.2 | |
| Net cash from operating activities | $ | 102.6 | | $ | 69.9 | | $ | 486.0 | | $ | 159.4 | | $ | 408.7 | |
| - Continuing operations | $ | 102.6 | | $ | 69.9 | | $ | 486.0 | | $ | 144.0 | | $ | 257.6 | |
| - Discontinued operations | $ | — | | $ | — | | $ | — | | $ | 15.4 | | $ | 151.1 | |
Mine-site free cash flow1 | $ | 78.2 | | $ | 28.9 | | $ | 385.1 | | $ | 54.1 | | $ | 187.6 | |
| - Continuing operations | $ | 78.2 | | $ | 28.9 | | $ | 385.1 | | $ | 48.2 | | $ | 167.2 | |
| - Discontinued operations | $ | — | | — | | $ | — | | $ | 5.9 | | $ | 20.4 | |
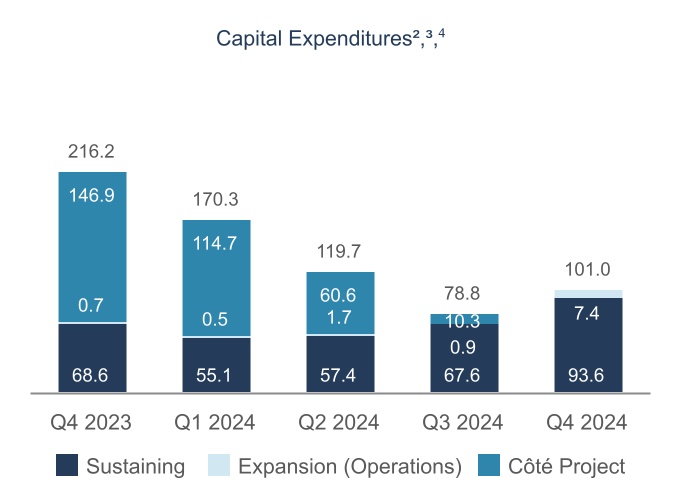
Capital expenditures1,2 – sustaining | $ | 93.6 | | $ | 68.6 | | $ | 290.8 | | $ | 200.3 | | $ | 190.4 | |
Capital expenditures1,2 – expansion | $ | 7.4 | | $ | 166.1 | | $ | 196.1 | | $ | 656.8 | | $ | 540.3 | |
| December 31 | December 31 | December 31 | December 31 | December 31 |
| 2024 | 2023 | 2024 | 2023 | 2022 |
Financial Position ($ millions) | | | | | |
| Cash and cash equivalents | $ | 347.5 | | $ | 367.1 | | $ | 347.5 | | $ | 367.1 | | $ | 407.8 | |
| Long-term debt | $ | 1,028.9 | | $ | 830.8 | | $ | 1,028.9 | | $ | 830.8 | | $ | 918.7 | |
Net cash (debt)1 | $ | (859.3) | | $ | (649.5) | | $ | (859.3) | | $ | (649.5) | | $ | (605.6) | |
| Available Credit Facility | $ | 418.5 | | $ | 387.0 | | $ | 418.5 | | $ | 387.0 | | $ | 26.6 | |
| | | | | |
| | | | | |
1.Refer to the “Non-GAAP Financial Measures” disclosure at the end of this MD&A for a description and calculation of these measures.
2.Sustaining and expansion capital expenditures represent incurred expenditures for property, plant and equipment and exploration and evaluation assets, and exclude right-of-use assets and working capital impacts. Sustaining capital expenditures for Côté Gold for 2024 represent the five-month period following achievement of commercial production.
| | | | | |
IAMGOLD CORPORATION Annual Management's Discussion and Analysis - December 31, 2024 | 5 |
____________________________
1.Cost of sales, including depreciation, cash costs and AISC are expressed on an attributable ounce sold basis (excluding the non-controlling interests of 10% at Essakane).
2.This is a non-GAAP financial measure. See “Non-GAAP Financial Measures”.
3.Côté capital expenditures reflect the proportionate interest in Côté Gold UJV on an incurred basis.
4.All-in sustaining cost and sustaining capital expenditures for the third quarter 2024 for Côté Gold represent the two-month period following achievement of commercial production.
| | | | | |
IAMGOLD CORPORATION Annual Management's Discussion and Analysis - December 31, 2024 | 6 |
OUTLOOK
Production
| | | | | | | | | | |
| | | | |
| Actual 2024 | Full Year Guidance 2025 | | |
| Côté Gold (000s oz) | 124 | 250 – 280 | | |
| Westwood (000s oz) | 134 | 125 – 140 | | |
| Essakane (000s oz) | 409 | 360 – 400 | | |
| | | | |
| | | | |
Total attributable production1 (000s oz) | 667 | 735 – 820 | | |
| | | | |
| | | | |
| | | | |
| | | | |
1.Attributable ounces account for IAMGOLD ownership interests of: Côté Gold – weighted average to account for the repurchase of the 9.7% interest effective November 30, 2024, returning IAMGOLD’s interest to 70%; Westwood – 100%; Essakane – 90%.
Total attributable production for IAMGOLD in 2025 is expected to be in the range of 735,000 to 820,000 ounces, an increase from 2024 production, driven by the ramp-up of Côté Gold to nameplate production later during 2025 and continued strong production levels from Essakane and Westwood. Production at Côté Gold in its first full year, on a 100% basis, is expected to be between 360,000 to 400,000 ounces for the year (250,000 to 280,000 ounces on an attributable basis). For further details, refer to the operations section of each mine below.
Costs
| | | | | | | | | | |
| | | | |
| Actual 2024 | Full Year Guidance 2025 | | |
| Côté Gold | | | | |
| Cash costs ($/oz sold) | $1,032 | $950 – $1,100 | | |
| AISC ($/oz sold) | $1,658 | $1,350 – $1,500 | | |
| Westwood | | | | |
| Cash costs ($/oz sold) | $1,167 | $1,175 – $1,325 | | |
| AISC ($/oz sold) | $1,702 | $1,675 – $1,825 | | |
| Essakane | | | | |
| Cash costs ($/oz sold) | $1,179 | $1,400 – $1,550 | | |
| AISC ($/oz sold) | $1,625 | $1,675 – $1,825 | | |
| Consolidated | | | | |
Cost of sales1 ($/oz sold) | $1,156 | $1,200 – $1,350 | | |
Cash costs1,2 ($/oz sold) | $1,152 | $1,200 – $1,350 | | |
AISC1,2 ($/oz sold) | $1,716 | $1,625 – $1,800 | | |
| | | |
| | | | |
| | | | |
1.Consists of Westwood and Essakane on an attributable basis of 100% and 90%, respectively. For Côté Gold, the attributable basis in 2024 is based on IAMGOLD’s ownership of 60.3% up to November 2024, thereafter, increasing to 70% for December 2024. 2024 all-in sustaining cost for Côté Gold represents the five-month period following achievement of commercial production. For 2025, the attributable basis for Côté Gold is 70% for all periods.
2.This is a non-GAAP financial measure. See "Non-GAAP Financial Measures".
Cash costs on a consolidated basis are expected to be in the range of $1,200 to $1,350 per ounce sold, a slight increase from last year primarily as a result of an increase in expected cash costs at Essakane. AISC for IAMGOLD are expected to be in the range of $1,625 and $1,800 per ounce sold, in line with last year as a result of the ramp up of Côté Gold and reduced capitalized waste stripping at Essakane.
The full year guidance is based on the following 2025 full year assumptions, before the impact of hedging: average realized gold price of $2,500 per ounce, USDCAD exchange rate of 1.35, EURUSD exchange rate of 1.11, average Brent oil price of $75 per barrel and WTI price of $70 per barrel.
Capital Expenditures
| | | | | | | | | | | | | | | | | | | | | | | |
| | | |
| Actual 20241 | Full Year Guidance 20252 | |
| ($ millions) | Sustaining | Expansion | Total | Sustaining | Expansion | Total | | | |
| Côté Gold (IMG share) | $ | 42.7 | | $ | 191.0 | | $ | 233.7 | | $ | 110 | | $ | 15 | | $ | 125 | | | | |
| Westwood | $ | 66.1 | | $ | — | | $ | 66.1 | | $ | 70 | | $ | — | | $ | 70 | | | | |
| Essakane | 180.4 | | 5.1 | | 185.5 | | 110 | | 5 | | 115 | | | | |
| $ | 289.2 | | $ | 196.1 | | $ | 485.3 | | $ | 290 | | $ | 20 | | $ | 310 | | | | |
| | | | | | | | | |
| | | | | | | | | |
| | | | | | | | | |
| Corporate | 1.6 | | — | | 1.6 | | — | | — | | — | | | | |
Total3 | $ | 290.8 | | $ | 196.1 | | $ | 486.9 | | $ | 290 | | $ | 20 | | $ | 310 | | | | |
1.100% basis, for Westwood and Essakane, and reflects IAMGOLD’s proportionate interest in Côté Gold UJV on an incurred basis.
2.Capital expenditures guidance (±5%).
3.Includes $11 million of capitalized exploration and evaluation expenditures also included in the Exploration Outlook guidance table.
| | | | | |
IAMGOLD CORPORATION Annual Management's Discussion and Analysis - December 31, 2024 | 7 |
Capital expenditures for IAMGOLD in 2025 are expected to total $310 million, of which $290 million is categorized as sustaining capital. Capital expenditures are down from the prior year, as a result of the completion of expansion capital outlays as Côté Gold construction and commissioning was completed earlier in the year. Sustaining capital estimates are expected to decline going forward, as Côté completes the construction of the full tailings dam footprint and as capitalized waste stripping declines at Essakane based on the current mine plan.
Exploration Outlook
Exploration expenditures for 2025 are expected to be approximately $38 million, the majority of which will be expensed. The largest exploration spend will be at Côté Gold of approximately $13 million attributable to IAMGOLD including the Gosselin resource delineation drilling program, Essakane at approximately $7 million, followed by Nelligan/Monster Lake at approximately $6 million.
| | | | | | | | | | | | | | | | | | | | |
| | | | | | |
| Actual 2024 | Full Year Guidance 2025 |
| ($ millions) | Capitalized | Expensed | Total | Capitalized | Expensed | Total |
| Exploration projects – greenfield | $ | 1.0 | | $ | 16.5 | | $ | 17.5 | | $ | — | | $ | 25 | | $ | 25 | |
| Exploration projects – brownfield | 6.5 | | 2.4 | | 8.9 | | 11 | | 2 | | 13 | |
| | | | | | |
| | | | | | |
| | | | | | |
| | | | | | |
| $ | 7.5 | | $ | 18.9 | | $ | 26.4 | | $ | 11 | | $ | 27 | | $ | 38 | |
Income Taxes Paid and Depreciation Outlook
The Company expects to pay cash taxes in the range of $120 to $130 million during 2025. Cash tax payments do not occur evenly by quarter, as amounts paid in a quarter can include payments of the final balance of the prior year taxes and payments of instalments for the current year, both required to be made at times as prescribed by different countries. There are no significant cash taxes expected in respect of the new global minimum top-up taxes ("GloBE"). The income taxes paid guidance does not include cash tax obligations arising as part of the Bambouk sales process. See "Bambouk Assets" for additional details.
Depreciation expense for 2025 is expected to be $450 million (±5%) with increased depreciation expense due to the increase in the value of depreciable property, plant and equipment following the completion of construction and commencement of commercial operations at Côté Gold and the impairment reversal at the Westwood cash generating unit ("CGU").
| | | | | | | | | | |
| | | | |
| ($ millions) | Actual 2024 | Full Year Guidance 2025 | | |
| | | | |
| | | | |
| | | | |
| | | | |
| | | | |
| | | | |
| | | | |
| Depreciation expense | $273.8 | $450 (±5%) | | |
| Income taxes paid | $55.4 | $120 – $130 | | |
ENVIRONMENTAL, SOCIAL AND GOVERNANCE
The Company is committed to maintaining its culture of accountable mining through high standards of Environmental, Social and Governance practices, including its commitment to strive for the goal of Zero Harm®, in every aspect of its business.
The Company reports annually on its ESG performance highlighting progress and achievements across a range of material topics and indicators and draws upon various ESG frameworks and standards and internationally recognized methodologies such as the Global Reporting Initiative (“GRI”) and Sustainability Accounting Standards Board (“SASB”) to guide its Sustainability Report. On May 15, 2024, the Company released its annual Sustainability Report, outlining the Company’s 2023 sustainability performance, and the inaugural Tailings Management Report. On December 18, 2024, the Company released its 2023 Scope 3 Emissions Report.
As a member of the Mining Association of Canada (“MAC”), the Company participates in the Towards Sustainable Mining (“TSM”) initiative at all its operations, including internationally at Essakane (Burkina Faso), which exceeds MAC’s requirements of reporting only on Canadian operations. The Company conducts an annual self-assessment at each of its operating facilities to assess the performance against the TSM Assessment Protocols, with a third-party verification every three years. Côté Gold will begin reporting publicly against the TSM Assessment Protocols in 2026 as per MAC requirements.
In the fourth quarter, the Company sought external verifications of the TSM results for the Westwood and Essakane mines. The verification report indicated an ‘A’ level or higher for all indicators within all protocols. IAMGOLD was also selected to participate in a Post-Verification Review exercise in 2025 with MAC’s Community of Interest Panel, which is part of MAC’s annual internal review process.
In 2024, the Company set and achieved most of its ESG targets set related to health and safety; equity, diversity, and inclusion; and environment, including:
•meeting or exceeding leading and lagging health and safety targets (achieve total recordable incident frequency rate (TRIFR) of 0.66 and implement the Critical Risks Protocols),
•developing a biodiversity roadmap,
•developing a water stewardship framework, and
•zero significant environmental and community incidents1.
__________________________
1.IAMGOLD defines significant incidents as those assessed as Level 4 or 5 based on the Company's risk matrix, and/or resulting in fines greater than US$100,000. The Company's risk matrix includes incident severity of environmental, health and safety, social, and financial aspects.
| | | | | |
IAMGOLD CORPORATION Annual Management's Discussion and Analysis - December 31, 2024 | 8 |
Health and Safety
Health and safety is core to the Company’s pursuit of its Zero Harm® vision. Through various prevention programs, the Company continually promotes a wellness program and a safe work environment at its sites. The TRIFR (total recordable injuries frequency rate) was 0.63 as at December 31, 2024 (compared to 0.69 as at December 31, 2023), tracking below the Company's target of 0.66.
In the fourth quarter of 2024, teams from each operation participated in workshops to review and identify the Company’s health and safety leading and lagging indicators for 2025 with a continued focus on Critical Risk Management and Visible Felt Leadership.
Environmental
In 2024, the key environmental focus areas for the Company were water and biodiversity. In the fourth quarter 2024, the Company reached the final stages of the development of a water stewardship framework that takes a catchment-based planning approach, to enhance its management capacities in this area and allow the Company to evaluate its impacts and contributions to regional watersheds. Part of this water stewardship framework included the development of a Water Management Standard and updating of the Water Policy. In 2024, the Company also expanded on the initial biodiversity assessment performed in 2022 to develop a more comprehensive roadmap to understand its dependencies and impacts on nature and evaluate the appropriateness of the Company reporting against the Taskforce on Nature-related Financial Disclosures. The Company also initiated decarbonization and energy management assessments of its sites, in support of the Company’s decarbonization aspirations.
At Essakane, the Falagountou Closure Plan was filed at the end of May 2024. The Closure Plan for the Essakane pit that was submitted in 2019 is currently being updated and the target timeline for the submission is the first quarter 2025. Essakane conducted a management review of its environmental management system. The site continued to run an environmental 'stop incident' campaign to educate and empower employees to recognize and respond to environmental risks. External audits were also performed on Tailings, Water and Health & Safety management systems at Essakane, in support of, but separate from the TSM audit.
At Westwood, external audits were performed on Tailings, Water and Health & Safety management systems. The 2021 Westwood Closure Plan was approved on June 11, 2024, and the Doyon Closure Plan was approved on July 3, 2024, by the Quebec Ministry of Natural Resources and Forestry. Westwood continues to pilot water recycling projects to reduce water withdrawal from the Bousquet River.
Côté Gold submitted its Phase 1 Environmental Effects Monitoring Report to Environment and Climate Change Canada. Côté Gold submitted its greenhouse gas emissions report for 2023 to Ontario’s Emissions Performance Standard Program, which required reasonable assurance under ISO 14064 in September 2024.
As of December 31, 2024, there were zero environmental significant incidents1.
Social Performance
In 2024, the Company reviewed its approach to community investment and initiated the development of a Community Investment Strategy. In the fourth quarter 2024, the Company began the implementation of a new Community Investment Standard that provides guidance on investments that aligns with the Company's community investment focus areas. Each operation continues to engage with their communities of interest and support community investment initiatives. At Essakane, key engagements and activities included discussions on economic, social, security, and resettlement topics, engagements with stakeholders as part of the Essakane Closure Plan and monitoring of artisanal miners. The Company continues to address legacy issues from the original Relocation Action Plan ("RAP 1") with the rebuilding of select houses. The Company is expected to complete all rebuilding efforts associated with RAP 1 within a three-year time period.
During the fourth quarter 2024, IAMGOLD entered into a partnership agreement with Project CURE to deliver two 40-foot cargo containers of medical supplies to seven health centres in the Dori and Gorom-Gorom medical districts in 2025.
Throughout the fourth quarter 2024, Côté Gold hosted: Mattagami First Nation, academic institutions and the Federal Economic Development Agency for Northern Ontario (“FedNor”) for tours of the site to share information about the mine and IAMGOLD’s approach to responsible mining. IAMGOLD and Côté Gold representatives participated in the Organization for Economic Co-operation and Development (“OECD”) Mining Regions and Cities Conference in Sudbury.
At Westwood, the team continued to meet with Abitibiwinni First Nation related to the development of an Impact Benefit Agreement.
__________________________
1.IAMGOLD defines significant incidents as those assessed as Level 4 or 5 based on the Company's risk matrix, and/or resulting in fines greater than US$100,000. The Company's risk matrix includes incident severity of environmental, health and safety, social, and financial aspects.
| | | | | |
IAMGOLD CORPORATION Annual Management's Discussion and Analysis - December 31, 2024 | 9 |
Indigenous Relations
As a Canadian business committed to responding to the Truth and Reconciliation Commission of Canada’s Calls to Action, the Company continues to take meaningful action towards reconciliation by respecting and upholding Indigenous rights, founded upon relationships that foster trust, transparency and mutual respect. In support of this commitment, during the fourth quarter we hosted an educational workshop in our Toronto office focused on the historical and current context of Indigenous relations in Canada.
Equity, Diversity and Inclusion
Guided by the value principle to conduct ourselves with respect and embrace diversity, the Company continues to uphold its commitment to Equity, Diversity and Inclusion ("EDI") and to engage, empower and support our employees, as well as our partners in the communities in which we operate. The Company recognizes that diversity exists across many dimensions and lived experiences, and a diverse workforce and an inclusive work culture can inspire creativity and innovation, promote effective decision-making and lead to stronger business outcomes.
The EDI Steering Committee, comprised of executive and senior business leaders and functional specialists, ensures that diversity efforts align with business strategy. Key prioritization for the Company is on retaining and attracting diverse talent through training and education, the improvement of working conditions and the expansion of individual growth opportunities. Additional focus is placed on the promotion of inclusive and equitable practices that enable a culture of belonging where every employee can excel both professionally and personally.
The Company has established a female representation target of 20% of overall workforce by 2030. Annual goals designed to achieve progress towards this are included as part of the ESG metric in the Company Scorecard, and progress towards goals is being tracked.
The Company is implementing the MAC TSM protocol on Equitable, Diverse and Inclusive Workplaces and also actively engages with the Mining Industry HR Council Canada, including representation on their Inclusion & Diversity Sub-Committee.
IAMGOLD continues to be recognized as a Greater Toronto Area Top 100 Employer for its efforts on various inclusion, engagement and culture work, and is a two-time Excellence Awardee in the Canadian HR Awards for financial, physical and mental wellness.
Governance
The Board of Directors of IAMGOLD (the “Board”) adopted diversity and renewal guidelines in 2021, reflecting governance best practices. Regarding diversity, the Board agreed that its membership should comprise, at a minimum, the greater of (i) two and (ii) 30% female directors. With respect to Board membership renewal, it was decided that the average tenure of the Board should not exceed ten years, and that no director should serve as the chair of the Board or the chair of any committee for more than ten consecutive years.
Currently, women represent 44% of the directors and 50% of the independent directors. The average tenure of directors on the Board is approximately two years.
| | | | | |
IAMGOLD CORPORATION Annual Management's Discussion and Analysis - December 31, 2024 | 10 |
OPERATIONS
Côté Gold, Canada
The Côté District is located 125 kilometres southwest of Timmins and 175 kilometres north of Sudbury, Ontario, Canada. The mine is being operated through an unincorporated joint venture (the "Côté Gold UJV" or "UJV") between IAMGOLD, as the operator, and Sumitomo Metal Mining Co. Ltd. (“Sumitomo” or “SMM”). The UJV is governed by the Côté Gold Joint Venture Agreement. The Company exercised the repurchase option on November 30, 2024, which returned IAMGOLD to its full 70% interest in the Côté Gold UJV (see “Funding Agreement with Sumitomo” below).
Côté Gold Mine (IAMGOLD interest – 60.3% from January to November, 70% for December)
| | | | | | | | | | | |
| | | |
| | | | | |
| Q4 2024 | | 2024 | | |
Key Operating Statistics (100% basis, unless otherwise stated) | | | | | |
| Ore mined (000s t) | 3,637 | | | 10,849 | | | |
| Grade mined (g/t) | 1.07 | | | 0.97 | | | |
| Operating waste mined (000s t) | 4,765 | | | 16,666 | | | |
| Capital waste mined (000s t) | 2,445 | | | 11,821 | | | |
| | | | | |
| Material mined (000s t) – total | 10,847 | | | 39,336 | | | |
Strip ratio1 | 2.0 | | | 2.6 | | | |
| Ore milled (000s t) | 2,433 | | | 4,948 | | | |
| Head grade (g/t) | 1.34 | | | 1.37 | | | |
| Recovery (%) | 91 | | | 92 | | | |
| Gold production (000s oz) – 100% | 96 | | | 199 | | | |
| Gold production (000s oz) – attributable | 62 | | | 124 | | | |
| Gold sales (000s oz) – 100% | 87 | | | 179 | | | |
Average realized gold price2,3 ($/oz) | $ | 2,644 | | | $ | 2,555 | | | |
Financial Results ($ millions – attributable interest) | | | | | |
Revenues4 | $ | 147.9 | | | $ | 284.3 | | | |
Cost of sales4 | 60.6 | | | 115.0 | | | |
| Production costs | 52.8 | | | 107.2 | | | |
| (Increase)/decrease in finished goods | (2.1) | | | (9.6) | | | |
Royalties5 | 9.9 | | | 17.4 | | | |
Cash costs2 | 60.4 | | | 114.7 | | | |
Sustaining capital expenditures2,6 | 25.6 | | | 42.7 | | | |
Expansion capital expenditures2,6 | 5.4 | | | 191.0 | | | |
Total sustaining and expansion capital expenditures2,6 | 31.0 | | | 233.7 | | | |
| Earnings from operations | 44.2 | | | 105.6 | | | |
Mine site free cash flow2 | 16.9 | | | 40.2 | | | |
Unit costs per tonne2 | | | | | |
| Mine costs per operating tonne mined | $ | 4.19 | | | $ | 3.90 | | | |
Mill costs per tonne milled2 | $ | 17.59 | | | $ | 17.32 | | | |
G&A costs per tonne milled2 | $ | 7.35 | | | $ | 8.49 | | | |
Operating costs per ounce7 | | | | | |
| Cost of sales excluding depreciation ($/oz sold) | $ | 1,083 | | | $ | 1,035 | | | |
Cash costs2 ($/oz sold) | $ | 1,080 | | | $ | 1,032 | | | |
AISC2,7 ($/oz sold) | $ | 1,685 | | | $ | 1,658 | | | |
1.Strip ratio is calculated as waste mined divided by ore mined.
2.This is a non-GAAP financial measure. See "Non-GAAP Financial Measures".
3.Average realized gold price excludes the impact of gold delivered into prepayment arrangements.
4.As per note 35 of the consolidated financial statements for revenues and cost of sales. Cost of sales is net of depreciation expense.
5.Includes 7.5% net profit interest payment.
6.All-in sustaining cost and sustaining capital expenditure for 2024 represents the five-month period following achievement of commercial production on August 1, 2024, and excludes working capital adjustments. Expansion capital expenditures include Project Expenditures.
7.Cost of sales, cash costs and AISC per ounce sold may not be calculated based on amounts presented in this table due to rounding.
| | | | | |
IAMGOLD CORPORATION Annual Management's Discussion and Analysis - December 31, 2024 | 11 |
Operational Insights
•Attributable gold production was 124,000 ounces (199,000 ounces on a 100% basis) in the first nine months of operations as the plant poured first gold on March 31, 2024, achieved commercial production on August 1, 2024, and completed a comprehensive mill shutdown in September to deploy key improvements to stabilize the crushing circuit and attend to areas of high wear in the plant. Attributable production in the fourth quarter 2024 was 62,000 ounces (96,000 ounces on a 100% basis), higher by 21,000 than the third quarter 2024. In November and December, Côté produced 37,000 ounces (100% basis) each month.
•Mining activity totaled 10.8 million tonnes in the fourth quarter 2024, an increase over the prior quarter and ore tonnes mined increased to 3.6 million tonnes during the period with an associated decrease in the strip ratio to 2.0:1 waste to ore. During the fourth quarter, three additional CAT 793 autonomous haul trucks were commissioned, for a total of 21 in the haulage fleet. During December, mining activities demonstrated the ability to mine at sustainable rates of 150,000 tpd over a weekly period. The average grade of mined ore was 1.07 g/t in the fourth quarter 2024, in line with the mine plan. The reconciliation between the grade control and reserve models continues in line with expected tolerances.
•Mill throughput in the fourth quarter 2024 totaled 2.4 million tonnes, approximately 49% higher than the throughput of the prior quarter. Head grades of 1.34 g/t were in line with the mine plan, which requires feed material from a combination of higher grade direct-feed ore and higher-grade stockpiles. Recoveries in the plant averaged 91% in the quarter.
•The target is to achieve the steady-state nameplate throughput rate of 36,000 tpd in the fourth quarter of 2025. In December, the plant operated at an average of 87% of the designed throughput level over a two-week period, prior to an unscheduled shutdown due to a split in a conveyor belt associated with ramp-up wear and tear. Repairs were made to the belts and replacement with a modified design was completed in January 2025. When online in December, the plant averaged 1,593 tph, or effectively 106% of nameplate, with a record daily throughput of 42,635 tonnes per day.
•Subsequent to quarter end, the HPGR rollers demonstrated accelerated wear necessitating a changeover ahead of schedule and limiting the secondary crushing capacity in January. The changeover of the HPGR rolls was completed in February 2025 with operating and maintenance procedures adjusted to maximize lifespan and optimize future changeover windows. Inside the plant, the grinding circuit was also impacted early in the quarter, due to repairs required on one of the Vertimills following a faulty start-up post-maintenance. Prevention and mitigation procedures have been put in place. Plant throughput is expected to be lower in the first quarter as a result of the impact of the timing of these maintenance issues, while operating guidance has been maintained (as discussed below).
Financial Highlights (attributable basis) – Q4 2024 and 2024
•For accounting purposes, revenue and cost of sales were recognized at 60.3% from the commencement of the first sale in April 2024 up to the repurchase of the 9.7% Transferred Interest from Sumitomo on November 30, 2024. Revenue and cost of sales were recognized in accordance with IAMGOLD's increased ownership level of 70% during December.
•Production costs of $52.8 million were incurred during the three months ended December 31, 2024, and $107.2 million incurred for the full year. Production cost for the full year is net of $33.9 million of operating expenditures incurred in the period preceding the achievement of commercial production on August 1, which relates to milling and surface operating costs that have been capitalized during commissioning and ramp-up efforts in advance of achieving commercial production.
•Mining cost was $4.19 and $3.90 per tonne mined during the three and twelve months ended December 31, 2024, respectively. Costs are higher than planned due to higher than planned rehandling of ore to achieve the required segregation of high grade material, higher maintenance costs on the drill rigs to improve availability and higher one-time contractor costs to support the ramp-up of the mine.
•Mill cost was $17.59 and $17.32 per tonne milled during the three and nine months ended December 31, 2024, respectively. Unit costs remain high as the average throughput during the quarter was below nameplate capacity while the mill is in the process of ramping up and due to the shutdown in the third quarter. Costs were also higher due to the deployment of key optimizations to improve the operating availability of the plant. Unit costs are expected to decrease as throughput increases and costs stabilize.
•G&A cost was $7.35 and $8.49 per tonne milled during the three and nine months ended December 31, 2024, respectively. Unit costs decreased during the quarter but remain higher than expected as the average throughput during the quarter was below nameplate capacity as the mill is in the process of ramping up as described above. Unit costs are expected to further decrease as throughput increases.
•Cost of sales, excluding depreciation, during the three and nine months ended December 31, 2024, totaled $60.6 million and $115.0 million, respectively, and is net of $2.1 million and $9.6 million, respectively, of the production cost related to the in-circuit inventory that was built up during the period and is recorded in inventory as finished goods. Cost of sales includes $9.9 million and $17.4 million of royalties for the three and nine months ended December 31, 2024, respectively.
Cost of sales per ounce sold, excluding depreciation, was $1,083 and $1,035 for the three and nine months ended December 31, 2024, respectively.
•Cash costs during the three and nine months ended December 31, 2024, totaled $60.4 million and $114.7 million, respectively. Cash cost per ounce sold during the three and nine months ended December 31, 2024, was $1,080 and $1,032, respectively. Cash costs exclude production costs that have been capitalized during commissioning and ramp-up efforts in advance of achieving commercial production.
| | | | | |
IAMGOLD CORPORATION Annual Management's Discussion and Analysis - December 31, 2024 | 12 |
•AISC per ounce sold was $1,685 and $1,658 for the quarter and five months following the achievement of commercial production, respectively, with the sustaining capital expenditures totaling $33.3 million and $47.0 million that includes capitalized waste stripping and projects which are sustaining in nature in line with World Gold Council guidance. Included in sustaining capital and AISC is approximately $6.5 million for the quarter ($116 per ounce sold) and $13.0 million for the five months in the period ($154 per ounce sold), respectively, in support of the construction of the full tailings dam footprint to support the life of mine; excluding this non-recurrent capital item, AISC per ounce sold was $1,569 for the quarter and $1,504 for the five months in the period following the achievement of commercial production.
•Project and capital expenditures, on an 100% and incurred basis, of $48.0 million in the fourth quarter 2024 ($382.1 million for 2024), includes:
•Capital expenditures related to operations for the fourth quarter 2024 were $48.0 million ($139.8 million for 2024), including $8.3 million of capitalized stripping ($44.8 million for 2024), $12.1 million of tailings and earthworks ($49.8 million for 2024), $1.9 million of mobile equipment ($4.1 million for 2024) and $25.7 million of capital projects related to operation improvements and ramp-up ($41.1 million for 2024).
•There were no project expenditures incurred in the fourth quarter. For the year, project expenditures totaled $186.1 million, including $151.7 million prior to the first gold pour on March 31, 2024, and $34.4 million following first gold to support the completion of commissioning and certain scopes of non-critical path earthwork and infrastructure.
•In addition to the project expenditures, approximately $56.3 million of operating expenditures related to milling and surface costs in support of the commissioning and ramp-up efforts were capitalized during the period preceding the achievement of commercial production on August 1, 2024.
•Total capital expenditures paid during the quarter, on an attributable basis, were $41.1 million ($258.5 million for 2024), which includes, on an attributable basis, the $31.0 million of sustaining and expansion capital expenditures incurred in the fourth quarter 2024 ($233.7 million for 2024) and working capital adjustments and long-term advances of $10.1 million ($24.8 million for 2024) (see “Non-GAAP Financial Measures – Sustaining and Expansion Capital Expenditures”).
2025 Outlook
Production at Côté Gold is expected to be in the range of 360,000 to 400,000 ounces on a 100% basis (250,000 to 280,000 ounces on an attributable basis). The primary focus remains to build up and achieve nameplate mill design capacity of 36,000 tpd by the fourth quarter of this year, while stabilizing operations through the implementation and improvement of operating and maintenance procedures. Mining activities are expected to be relatively stable throughout the year, averaging approximately 12 million tonnes per quarter, with a declining strip ratio throughout the year as ore mined increases. Plant throughput is expected to total approximately 12 million tonnes in 2025 and achieve the steady-state nameplate throughput rate of 36,000 tpd in the fourth quarter of this year. Processing rates are expected to increase quarter over quarter, particularly in the second quarter following the winter season and the earlier than expected maintenance required on the HPGR and Vertimill (as outlined above), as well as in the fourth quarter with the installation of the additional secondary crusher. Plant head grades are expected to average approximately 1.1 to 1.2 g/t Au, as mining and stockpiling activities shift towards a more efficient mine plan to reduce rehandling of stockpiled ore and optimized for potential future expansions. Gold production is expected to be lowest in the first quarter of the year and increase sequentially as plant throughput increases throughout the year.
Cash costs are expected to be in the range of $950 to $1,100 per ounce sold and AISC to be in the range of $1,350 to $1,500 per ounce sold. The cash cost guidance reflects the cost levels experienced in the first year of operations, including higher levels of maintenance, contractor support and continuous improvement consultants. Costs are expected to be lower in the second half of the year as targeted improvements are deployed and as production increases.
Sustaining capital expenditures guidance (±5%) attributable to IAMGOLD is approximately $110 million ($157 million on a 100% basis) and continues to be higher than the life-of-mine average as the mine progresses the completion of construction of the full tailings dam footprint and related earthworks projects and incurs higher capital waste spending of approximately $20 million ($28 million on a 100% basis) to complete the final year of the initial pit pushback. Expansion capital of $15 million ($21 million on a 100% basis) is primarily associated with the planned installation of the additional secondary crusher in the fourth quarter of this year.
Exploration
The Gosselin zone is located immediately to the northeast of the Côté zone. Approximately 35,000 metres of expansion and delineation diamond drilling was originally planned for 2024, which was increased mid-year by approximately 5,400 metres, for a total completed drilling program of approximately 40,400 metres. The 2025 drilling plan entails the continuation of the ongoing diamond drilling program targeting resource conversion of Inferred Mineral Resources to Indicated in the Gosselin zone, the testing of the southern and northeastern extensions, as well as testing the breccias at depth for a total of 45,000 metres planned. In addition, 6,500 metres is planned this year to test high potential targets along the favourable structural corridor towards the Jack Rabbit area to the north-east of the Gosselin zone and develop models and targets within the larger Côté District at Swayze West - Jerome area.
On October 15, 2024, the Company provided an update on the assay results from its delineation and expansion drilling program at Gosselin with assay highlights including: 368.8 metres grading 0.96 g/t Au in drill hole GOS23-151 from 221.2 m; 235.0 metres grading 2.70 g/t Au in drill hole GOS24-160 from 697.0 m; 357.0 metres grading 1.10 g/t Au in drill hole GOS24-166 from 864.0 m; and 18.5 metres grading 12.33 g/t Au in drill hole GOS24-177 from 262.5 m (see news release dated October 15, 2024).
| | | | | |
IAMGOLD CORPORATION Annual Management's Discussion and Analysis - December 31, 2024 | 13 |
Technical studies are progressing to advance metallurgical testing, conduct mining and infrastructure studies to review options for potential inclusion of the Gosselin deposit into a future Côté Gold LOM plan.
Funding Agreement with Sumitomo
On December 19, 2022, the Company announced it had entered into the JV Funding and Amending Agreement with SMM (“JV Funding Agreement”), whereby SMM contributed $250.0 million of the Company's funding obligations to the Côté Gold UJV and as a result, the Company transferred 9.7% of its interest in Côté Gold to SMM (the "Transferred Interests") with a right to repurchase the Transferred Interests to return to its full 70% interest in the Côté Gold Mine.
The JV Funding Agreement also provided that until the earlier of the Company repurchasing the Transferred Interests and November 30, 2026, the Company would pay a repurchase option fee to Sumitomo equal to the three-month Secured Overnight Financing Rate ("SOFR") plus 4% on the contributions made by Sumitomo due to the Transferred Interests.
On November 30, 2024, the Company exercised its right to repurchase the 9.7% interest in Côté Gold returning IAMGOLD to its full 70% interest in Côté Gold.
The repurchase price was approximately $377 million and included $23.7 million for the repurchase option fee accrued during 2023.
The total payment of the repurchase is the aggregate amounts contributed by SMM on behalf of the Company, totaling $250.0 million, plus any incremental contributions made, and less incremental gold production received by SMM based on its increased ownership, up to achieving commercial production. SMM retained the net proceeds or payments corresponding to its increased ownership from the achievement of commercial production, as defined by the UJV agreement, up to the date of repurchase of the Transferred Interests. The UJV agreement defined the start of commercial production as the first day of the month following the period in which the mill operated at an average of 60% of the expected annual throughput over 30 days. On August 2, 2024, the Company announced commercial production at Côté Gold, thereby equating to an effective commercial production date, as defined by the UJV agreement, of September 1, 2024.
For accounting purposes, the JV Funding and Amending Agreement did not meet the requirements under IFRS to recognize the dilution of the Company's interest in the Côté UJV as a sale and the Company continued to account for 70% of the assets and liabilities of the joint venture and for 60.3% of the revenues and costs up to the repurchase date of November 30, 2024.
Following the return to 70% ownership in the Côté Gold UJV on December 1, 2024, the Company will fund 70% of the operating and capital expenditures through cash calls and receive 70% of the gold production.
| | | | | |
IAMGOLD CORPORATION Annual Management's Discussion and Analysis - December 31, 2024 | 14 |
Westwood Complex, Canada
The Westwood Complex is located 35 kilometres northeast of Rouyn-Noranda and 80 kilometres west of Val d'Or in southwestern Québec, Canada. The Westwood Complex includes the Westwood underground mine and the Grand Duc open pit mine.
Westwood Complex (IAMGOLD interest – 100%)
| | | | | | | | | | | | | | | | | |
| | | |
| | | | | |
| Q4 2024 | Q4 2023 | 2024 | 2023 | 2022 |
| Key Operating Statistics | | | | | |
| Underground lateral development (metres) | 1,086 | | 1,263 | 4,591 | | 5,271 | | 4,303 | |
| Ore mined (000s t) – underground | 98 | | 77 | | 354 | | 280 | | 241 | |
| Ore mined (000s t) – open pit | 283 | | 162 | | 662 | | 742 | | 836 | |
| Ore mined (000s t) – total | 381 | | 239 | | 1,016 | | 1,022 | | 1,077 | |
| Grade mined (g/t) – underground | 9.65 | | 7.77 | | 9.19 | | 7.11 | | 5.47 | |
| Grade mined (g/t) – open pit | 1.33 | | 2.33 | | 1.75 | | 1.71 | | 1.04 | |
| Grade mined (g/t) – total | 3.47 | | 4.08 | | 4.34 | | 3.19 | | 2.03 | |
| Ore milled (000s t) | 267 | | 245 | | 1,107 | | 1,034 | | 1,118 | |
| Head grade (g/t) – underground | 9.51 | | 7.92 | | 9.17 | | 7.12 | | 5.42 | |
| Head grade (g/t) – open pit | 1.17 | | 2.02 | | 1.60 | | 1.51 | | 1.05 | |
| Head grade (g/t) – total | 4.34 | | 3.90 | | 4.04 | | 3.03 | | 1.99 | |
| Recovery (%) | 93 | | 94 | | 93 | | 93 | | 93 | |
| Gold production (000s oz) | 35 | | 28 | | 134 | | 93 | | 67 | |
| Gold sales (000s oz) | 37 | | 29 | | 134 | | 90 | | 66 | |
Average realized gold price1,2 ($/oz) | $ | 2,652 | | $ | 1,989 | | $ | 2,403 | | $ | 1,946 | | $ | 1,788 | |
Financial Results ($ millions) | | | | | |
Revenues3 | $ | 97.6 | | $ | 58.6 | | $ | 323.0 | | $ | 176.6 | | $ | 120.6 | |
Cost of sales3 | 42.3 | | 42.4 | | 157.5 | | 144.6 | | 139.2 | |
| Production costs | 39.0 | | 39.3 | | 155.3 | | 148.5 | | 145.5 | |
| (Increase)/decrease in finished goods | 3.3 | | 2.9 | | 1.9 | | (4.1) | | (6.3) | |
| Royalties | — | | 0.2 | | 0.3 | | 0.2 | | — | |
Cash costs1 | 42.2 | | 41.9 | | 156.3 | | 143.7 | | 137.5 | |
Sustaining capital expenditures1 | 18.5 | | 16.8 | | 66.1 | | 65.0 | | 30.3 | |
Expansion capital expenditures1 | (0.1) | | 0.4 | | — | | 0.6 | | 4.8 | |
Total sustaining and expansion capital expenditures1 | 18.4 | | 17.2 | | 66.1 | | 65.6 | | 35.1 | |
Earnings/(loss) from operations4 | 45.1 | | (2.4) | | 578.9 | | (9.7) | | (41.4) | |
Mine site free cash flow1 | 41.3 | | 3.7 | | 94.4 | | (42.8) | | (51.9) | |
Unit costs per tonne1 | | | | | |
| Underground mining cost per tonne mined | $ | 233.72 | | $ | 251.85 | | $ | 250.86 | | $ | 281.76 | | $ | 322.78 | |
| Open pit mining cost per operating tonne mined | $ | 6.88 | | $ | 11.25 | | $ | 8.75 | | $ | 8.86 | | $ | 7.74 | |
| Milling cost per tonne milled | $ | 28.55 | | $ | 22.66 | | $ | 24.25 | | $ | 23.56 | | $ | 22.81 | |
| G&A cost per tonne milled | $ | 19.70 | | $ | 20.20 | | $ | 18.44 | | $ | 21.30 | | $ | 21.22 | |
Operating costs per ounce5 | | | | | |
Cost of sales excluding depreciation6($/oz sold) | $ | 1,155 | | $ | 1,446 | | $ | 1,177 | | $ | 1,600 | | $ | 2,093 | |
Cash costs1 ($/oz sold) | $ | 1,148 | | $ | 1,434 | | $ | 1,167 | | $ | 1,591 | | $ | 2,068 | |
AISC1 ($/oz sold) | $ | 1,688 | | $ | 2,049 | | $ | 1,702 | | $ | 2,344 | | $ | 2,568 | |
1.This is a non-GAAP financial measure. See "Non-GAAP Financial Measures".
2.Average realized gold price excludes the impact of gold delivered into prepayment arrangements.
3.As per note 35 of the consolidated financial statements for revenues and cost of sales. Cost of sales is net of depreciation expense.
4.Included in 2024 net earnings from operations is a $455.5 million gain on the reversal of the previously recorded impairment of the Westwood CGU.
5.Cost of sales, cash costs and AISC per ounce sold may not be calculated based on amounts presented in this table due to rounding.
6.Includes non-cash ore stockpile and finished goods inventories NRV write-down of $nil for the fourth quarter 2024 (fourth quarter 2023 - $nil) and $nil for 2024 (2023 - $3.2 million, 2022 - $8.4 million), which had an impact on cost of sales, excluding depreciation, per ounce sold of $nil for the fourth quarter 2024 (fourth quarter 2023 - $nil) and $nil for 2024 (2023 - $36, 2022 - $126).
| | | | | |
IAMGOLD CORPORATION Annual Management's Discussion and Analysis - December 31, 2024 | 15 |
Operational Insights
•Westwood delivered its highest ever annual gold production of 134,000 ounces, exceeding the top end of its 2024 production guidance range of 115,000 to 130,000 ounces due to increased production from the underground mine. Production in the fourth quarter 2024 was 35,000 ounces, higher by 7,000 ounces or 25% compared with the same prior year period, primarily due to higher grades and an increased proportion of the ore feed from the underground mine compared to the prior year period.
•Mining activity in the fourth quarter 2024 of 381,000 tonnes of ore was higher by 142,000 tonnes or 59% from the same prior year period. Mining activity for the year totaled 1.02 million tonnes of ore, in line with the prior year. The underground mine averaged 1,065 tonnes per day (“tpd”) as production from the underground operation continued to increase compared to the prior year in terms of both tonnes and grade, with eight active mining zones in the quarter.
•Lateral underground development of 1,086 metres in the fourth quarter 2024 was lower by 177 metres or 14% compared to the same prior year period, as the mining crews can now prioritize the extraction of ore after sufficiently advancing underground development in prior periods, in line with the mine plan. Lateral underground development for the year totaled 4,591 metres, 680 metres or 13% lower than the prior year as the mining team continues to optimize the design and refine the amount of development activities required to support the mine plan.
•The mining team concluded the underground rehabilitation and development work program on all existing mine areas, which has provided increased operational flexibility with multiple stope sequences available to mine concurrently at different levels and sectors of the mine. The rehabilitation work program consisted of repairing and upgrading the existing underground infrastructure following the 2020 seismic event, in line with the revised rock mechanic standard, which has been developed to ensure that safe work conditions are maintained in seismic portions of the mine. This activity enabled production to safely recommence once rehabilitation work on a specific level has been completed. The rehabilitation work program will be extended for the re-opening of previously closed mining areas within the underground mine in accordance with the mine plan.
•Mill throughput in the fourth quarter 2024 was 267,000 tonnes at an average head grade of 4.34 g/t, 9% and 11% higher than the same prior year period, respectively. For the full year, mill throughput was 1.1 million tonnes at an average head grade of 4.04 g/t, 7% and 33% higher, respectively, than the prior year. The higher head grades are due to an increase in the grade from the underground mine as described above.
•The mill achieved recoveries of 93% in the fourth quarter 2024, slightly lower than the same prior year period. Plant availability in the quarter of 88% was higher than the same prior year period of 78%, with the successful completion of the annual mill shutdown in November.
•On January 10, 2025, the Company filed an updated NI 43-101 compliant technical report for the Westwood Mine complex detailing the results of certain mine optimization efforts and strategic assessments of the underground mine.
Financial Performance – Q4 2024 Compared to Q4 2023
•Production costs of $39.0 million were lower by $0.3 million or 1% than the same prior year period primarily due to increased open pit mining activity and increased mining activity in the underground mine.
•Cost of sales, excluding depreciation, of $42.3 million was in line with the same prior year period with higher milling costs resulting from repairs during November 2024 shutdown, offset by lower mining costs. Cost of sales per ounce sold, excluding depreciation, of $1,155, was lower by $291 or 20% primarily due to higher production and sales volumes.
•Cash costs of $42.2 million were in line with the prior year period. Cash costs per ounce sold of $1,148 were lower by $286 or 20%, primarily due to higher production and sales volumes.
•AISC per ounce sold of $1,688 was lower by $361 or 18%, primarily due to lower cash costs per ounce sold and higher production and sales volumes, partially offset by higher sustaining capital.
•Sustaining capital expenditures of $18.5 million included underground development and rehabilitation of $9.7 million, mill and mobile equipment of $4.7 million, and other sustaining capital projects of $4.1 million.
Financial Performance – 2024 Compared to 2023
•Production costs of $155.3 million were higher by $6.8 million or 5%, primarily due to increased underground mining activity partially offset by decreased open pit mining activity.
•Cost of sales, excluding depreciation, of $157.5 million was higher by $12.9 million or 9%, primarily due to higher production costs and the timing of sales. Cost of sales per ounce sold, excluding depreciation, of $1,177 was lower by $423 or 26%, primarily due to higher production and sales volumes, partially offset by higher production costs.
•Cash costs of $156.3 million were higher by $12.6 million or 9%, primarily due to higher production costs and the timing of sales. Cash costs per ounce sold of $1,167 were lower by $424 or 27%, primarily due to higher production and sales volumes, partially offset by higher production costs.
•AISC per ounce sold of $1,702 was lower by $642 or 27%, primarily due to lower cash costs per ounce sold and higher production and sales volumes.
•Sustaining capital expenditures of $66.1 million included underground development and rehabilitation of $35.3 million, mill and mobile equipment of $14.5 million, capitalized stripping of $5.3 million and other sustaining capital projects of $11.0 million.
| | | | | |
IAMGOLD CORPORATION Annual Management's Discussion and Analysis - December 31, 2024 | 16 |
•During the year, the Company assessed that the increase in the long-term consensus price of gold was an indicator of impairment reversal for the Westwood CGU, which includes the Doyon closed mine. As a result, a $462.3 million reversal of previously recorded impairments was recognized as the recoverable amount of the Westwood CGU exceeded the carrying value.
2025 Outlook
Westwood production is expected to be in the range of 125,000 to 140,000 ounces in 2025, as mining activities continue the underground ramp-up towards 1,000 tpd steady-state targeting multiple active mining areas while striving to maintain relatively high grades and minimize dilution. Open pit activities from Grand Duc are currently planned to be completed by the fourth quarter of 2025, though Grand Duc stockpiled material will contribute to the mill feed into 2027. There are potential options for an accretive expansion and extension of the pit, which will be investigated this year.
Cash costs at Westwood are expected to be in the range of $1,175 to $1,325 per ounce sold and AISC in the range of $1,675 to $1,825 per ounce sold. Unit costs are expected to decrease from 2024 levels, in line with increased production levels.
Capital expenditures guidance is $70 million (±5%), primarily consisting of underground development and rehabilitation in support of the 2025 mine plan, the continued renewal of the mobile fleet and equipment overhauls, and certain asset integrity projects at the Westwood mill.
Brownfield Exploration
During the three and twelve months ended December 31, 2024, approximately 6,200 metres and 24,000 metres, respectively of underground diamond drilling (including approximately 1,400 metres of geotechnical drilling) were completed to support the continued ramp-up of underground mining operations.
| | | | | |
IAMGOLD CORPORATION Annual Management's Discussion and Analysis - December 31, 2024 | 17 |
Essakane, Burkina Faso
The Essakane District is located in north-eastern Burkina Faso, West Africa approximately 330 km northeast of the capital, Ouagadougou. The Essakane District includes the Essakane Mine and the surrounding mining lease and exploration concessions totaling approximately 600 square kilometres. The Company owns a 90% interest in the Essakane mine with the remaining 10% held by the government of Burkina Faso.
Essakane Mine (IAMGOLD interest – 90%)
| | | | | | | | | | | | | | | | | |
| | | |
| | | | | |
| Q4 2024 | Q4 2023 | 2024 | 2023 | 2022 |
Key Operating Statistics1 | | | | | |
| Ore mined (000s t) | 2,170 | | 3,217 | | 9,714 | | 9,586 | | 12,585 | |
| Grade mined (g/t) | 1.14 | | 1.42 | | 1.44 | | 1.35 | | 1.20 | |
| Operating waste mined (000s t) | 4,036 | | 3,353 | | 13,315 | | 19,530 | | 12,696 | |
| Capital waste mined (000s t) | 6,168 | | 6,340 | | 23,895 | | 14,233 | | 24,404 | |
| | | | | |
| Material mined (000s t) – total | 12,374 | | 12,910 | | 46,924 | | 43,349 | | 49,685 | |
Strip ratio2 | 4.7 | | 3.0 | | 3.8 | | 3.5 | | 2.9 | |
| Ore milled (000s t) | 2,948 | | 3,116 | | 12,087 | | 11,283 | | 11,632 | |
| Head grade (g/t) | 1.07 | | 1.32 | | 1.33 | | 1.26 | | 1.44 | |
| Recovery (%) | 87 | | 91 | | 88 | | 90 | | 89 | |
| Gold production (000s oz) – 100% | 88 | | 120 | | 454 | | 413 | | 480 | |
| Gold production (000s oz) – attributable 90% | 80 | | 108 | | 409 | | 372 | | 432 | |
| Gold sales (000s oz) – 100% | 93 | | 118 | | 454 | | 413 | | 489 | |
Average realized gold price3,4 ($/oz) | $ | 2,680 | | $ | 2,009 | | $ | 2,383 | | $ | 1,957 | | $ | 1,804 | |
Financial Results ($ millions)1 | | | | | |
Revenues5 | $ | 249.3 | | $ | 238.3 | | $ | 1,083.2 | | $ | 809.6 | | $ | 883.3 | |
Cost of sales5 | 139.7 | | 134.3 | | 536.8 | | 502.4 | | 431.2 | |
| Production costs | 124.4 | | 112.2 | | 469.1 | | 458.6 | | 382.6 | |
| (Increase)/decrease in finished goods | (1.7) | | 6.3 | | (6.8) | | (0.8) | | 4.8 | |
| Royalties | 17.0 | | 15.8 | | 74.5 | | 44.6 | | 43.8 | |
Cash costs3 | 139.4 | | 134.1 | | 535.5 | | 488.0 | | 439.5 | |
Sustaining capital expenditures3 | 49.0 | | 51.7 | | 180.4 | | 134.9 | | 158.8 | |
Expansion capital expenditures3 | 2.1 | | 0.3 | | 5.1 | | 1.7 | | 3.8 | |
Total sustaining and expansion capital expenditures3 | 51.1 | | 52.0 | | 185.5 | | 136.6 | | 162.6 | |
| Earnings from operations | 77.4 | | 14.3 | | 384.4 | | 92.0 | | 219.5 | |
Mine site free cash flow3 | 20.0 | | 25.2 | | 250.5 | | 91.0 | | 219.1 | |
Unit costs per tonne3 | | | | | |
| Open pit mining cost per operating tonne mined | $ | 5.37 | | $ | 5.09 | | $ | 5.34 | | $ | 5.02 | | $ | 4.41 | |
| Milling cost per tonne milled | $ | 20.35 | | $ | 18.58 | | $ | 19.26 | | $ | 18.94 | | $ | 16.46 | |
| G&A cost per tonne milled | $ | 10.67 | | $ | 8.04 | | $ | 9.39 | | $ | 9.07 | | $ | 7.37 | |
Operating costs per ounce6 | | | | | |
| Cost of sales excluding depreciation ($/oz sold) | $ | 1,504 | | $ | 1,134 | | $ | 1,182 | | $ | 1,216 | | $ | 882 | |
Cash costs3 ($/oz sold) | $ | 1,501 | | $ | 1,132 | | $ | 1,179 | | $ | 1,181 | | $ | 899 | |
AISC3 ($/oz sold) | $ | 2,118 | | $ | 1,548 | | $ | 1,625 | | $ | 1,521 | | $ | 1,234 | |
1.100% basis, unless otherwise stated.
2.Strip ratio is calculated as waste mined divided by ore mined.
3.This is a non-GAAP financial measure. See "Non-GAAP Financial Measures".
4.Average realized gold price excludes the impact of gold delivered into prepayment arrangements.
5.As per note 35 of the consolidated financial statements for revenues and cost of sales. Cost of sales is net of depreciation expense.
6.Cost of sales, cash costs and AISC per ounce sold may not be calculated based on amounts presented in this table due to rounding.
| | | | | |
IAMGOLD CORPORATION Annual Management's Discussion and Analysis - December 31, 2024 | 18 |
Operational Insights
•Essakane delivered full year attributable production of 409,000 ounces produced, achieving the top end of the revised guidance range of 380,000 to 410,000 ounces, with fourth quarter 2024 attributable production of 80,000 ounces, in line with expectations. Full year production is an increase of 37,000 ounces, or 10%, over the prior year primarily the result of higher grades milled and increased throughput. Compared to the same prior year period, fourth quarter production decreased by 28,000 ounces or 26%, primarily due to a decrease in the grade milled and lower tonnage due to increased downtime at the mill resulting from maintenance activities.
•Mining activity totaled 12.4 million tonnes mined in the fourth quarter 2024, lower by 0.5 million tonnes or 4% compared to the same prior year period. For the full year mining activity totaled 46.9 million tonnes, 3.6 million tonnes or 8% higher than the prior year period. During the quarter, the mining fleet achieved targeted capital stripping activities intended to secure access to ore on deeper benches of Phase 7 in support of the 2025 mine plan. In the prior year period, mining activity was lower due to periodic interruptions due to supply chain constraints related to the security environment in the country.
•Mill throughput in the fourth quarter 2024 was 2.9 million tonnes at an average head grade of 1.07 g/t, 5% lower and 19% lower than the same prior year period, respectively. Mill throughput for the year totaled 12.1 million tonnes at an average head grade of 1.33 g/t, 7% and 6% higher than prior year levels. Throughput was lower due to scheduled maintenance during December. Average head grades decreased in the fourth quarter compared to the first half of the year, in line with the mine plan as mining activities prioritized waste stripping sequences in support of the 2025 production plan including the opening of the upper benches of Phase 7 resulting in increased supplementation of the mill feed from available ore stockpiles.
•The security situation in Burkina Faso continues to be a focus for the Company. Security-related incidents are still occurring in the country, the immediate region of the Essakane mine and, more broadly, the West African region. The security situation in Burkina Faso and its neighboring countries continues to apply pressures to supply chains, although with a reduced impact and there was no related business interruption during 2024. The Company continues to take proactive measures to ensure the safety and security of in-country personnel and is constantly adjusting its protocols and the activity levels at the site according to the security environment. The Company continues to invest in the security and supply chain infrastructure in the region and at the mine site. It is also incurring additional costs to bring employees, contractors, supplies and inventory to the mine.
Financial Performance – Q4 2024 Compared to Q4 2023
•Production costs of $124.4 million were higher by $12.2 million or 11%, resulting from higher mining and milling costs arising during the period due to scheduled maintenance activities, higher realized fuel prices and higher supply chain and transportation cost impacted by the security situation. While higher than levels realized in the previous year, the landed prices of key consumables, including light fuel, cyanide, grinding media and lime remained at levels experienced over the past few quarters.
•Cost of sales, excluding depreciation, of $139.7 million was higher by $5.4 million or 4% primarily due to higher production costs and higher royalties. Cost of sales per ounce sold, excluding depreciation, of $1,504 was higher by $370 or 33% primarily due to lower production and sales volumes and higher royalties. Royalties increased due to increased sales volume and higher realized gold prices.
•Cash costs of $139.4 million were higher by $5.3 million or 4%, primarily due to higher cost of sales and higher royalties. Cash costs per ounce sold of $1,501 were higher by $369 or 33%, primarily due to lower production and sales volumes and higher royalties.
•AISC per ounce sold of $2,118 was higher by $570 or 37% primarily due to lower production and sales volumes and an increase in sustaining capital expenditures compared to the prior period.
•Total capitalized stripping of $33.1 million was higher by $0.8 million or 2%, as the mine fleet operated at full capacity and continued the strategic pushback of Phase 7 in the main pit in support of the 2025 mine plan.
•Sustaining capital expenditures, excluding capitalized stripping, of $15.9 million included capital spares of $3.9 million, mobile and mill equipment of $3.3 million, tailings management of $2.7 million, resource development of $1.9 million, generator overhaul of $0.4 million, and other sustaining projects of $3.7 million. Expansion capital expenditures of $2.1 million were incurred in fulfillment of the community village resettlement commitment.
Financial Performance – 2024 Compared to 2023
•Production costs of $469.1 million were higher by $10.5 million than the prior year period. Increased mining and milling activity was offset by a higher proportion of mining cost being capitalized resulting from the pushback in Phase 7 of the main pit. The prior year period was impacted by supply chain constraints which reduced operating capacity and resulted in abnormal costs of $13.5 million and $1.0 million in production costs and depreciation, respectively. The abnormal costs were excluded from cash costs and AISC in the prior year period, reducing both metrics by $33 per ounce sold in the comparative period.
•Cost of sales, excluding depreciation, of $536.8 million was higher by $34.4 million or 7%, primarily due to an increase in royalties of $29.9 million impacted by higher gold prices and sales volumes. Cost of sales per ounce sold, excluding depreciation, of $1,182 was lower by $34 or 3%, primarily due to higher production and sales volumes, partially offset by increased royalties.
| | | | | |
IAMGOLD CORPORATION Annual Management's Discussion and Analysis - December 31, 2024 | 19 |
•Cash costs of $535.5 million were higher by $47.5 million or 10%, primarily due to increased royalties and the return to full operating capacity as described above. Cash costs per ounce sold of $1,179 were in line with the levels achieved in the prior year.
•AISC per ounce sold of $1,625 was higher by $104 per ounce or 6%, primarily due to higher sustaining capital expenditures, partially offset by higher production and sales volume.
•Total capitalized stripping of $126.1 million was higher by $52.3 million or 71%, as the mine fleet operated at full capacity and continued the strategic pushback of Phase 7 of the main pit.
•Sustaining capital expenditures, excluding capitalized stripping, of $54.3 million included capital spares of $17.0 million, tailings management of $9.7 million, mobile and mill equipment of $6.7 million, resource development of $6.5 million, generator overhaul of $3.5 million and other sustaining projects of $10.9 million. Expansion capital expenditures of $5.1 million were incurred in support of fulfilling the community village resettlement commitment.
2025 Outlook
Essakane attributable production is expected to be in the range of 360,000 to 400,000 ounces (400,000 to 440,000 ounces at 100%). Mining activities are expected to complete mining in Phase 5 in the first half of the year, with the bulk of the mined material coming from Phase 6 and Phase 7. With mining moving into the primary zones of Phase 6 and 7, capitalized waste stripping is expected to be relatively lower in 2025. The mill is expected to operate at throughput and head grades in line with the current life of mine plan as per the December 2023 43-101 Technical Report.
Cash costs at Essakane are expected to be in the range of $1,400 to $1,550 per ounce sold and AISC to be in the range of $1,675 to $1,825 per ounce sold. The cost guidance for 2025 is higher than the 2024 cost guidance ranges due to lower production and higher local spending including regional security expenditures, increased community programs, permit fees and taxes. A decrease in capitalized waste mining resulted in less waste stripping costs being capitalized and therefore in a higher proportion of costs included in cash costs with an equal reduction in capitalized waste stripping costs included in AISC.
Capital expenditures guidance is approximately $115 million (±5%), including approximately $40 million on capitalized waste stripping to progress into Phases 6 and 7, as well as the ongoing replacement of certain equipment to improve efficiency and maintenance costs at Essakane.
Continued security incidents or related concerns could have a material adverse impact on future operating performance. The Company continues to actively work with authorities and suppliers to mitigate potential impacts and manage continuity of supply due to the security situation noted above while also investing in additional infrastructure and supply inventory levels appropriate to secure operational continuity. (See "Risks and Uncertainties")
Brownfield Exploration
During the twelve months ended December 31, 2024, approximately 30,400 metres of diamond drilling were completed as part of a step-out and infill drilling program to extend known mineralization and improve resource confidence within selected areas of Essakane North, Essakane Main Zone and the Lao satellite deposit and southern extension. The deposits remain open along strike and at depth. Exploration activities on concessions surrounding the mine lease continue to be suspended due to regional security constraints.
OTHER PROJECTS
Chibougamau District, Canada
The Chibougamau District includes the Nelligan Gold Project, the Monster Lake Project and the Anik Gold Project.
Nelligan Gold Project
The Nelligan Gold Project ("Nelligan") is located approximately 45 kilometres south of the Chapais Chibougamau area in Québec. Following the transaction closed on February 13, 2024, where the Company acquired all of the issued and outstanding common shares of Vanstar Mining Resources Inc., the Company’s holds 100% interest in Nelligan.
Subsequent to quarter end, on February 20, 2025, the Company announced its updated Mineral Resources for the 100%-owned Nelligan Project of 3.1 million Indicated gold ounces in 102.8 million tonnes (“Mt”) at 0.95 grams per tonne gold (“g/t Au”), and 5.2 million Inferred ounces (166.4 Mt at 0.96 g/t Au). This represents a 56% increase in Indicated ounces, or 1.1 million ounces, with an accompanying 13% increase in grade; as well as a 33% increase in Inferred ounces, or 1.3 million ounces, with a similar 14% increase in grade. Nelligan mineralization remains open along strike and at depth.
Approximately 10,000 metres of expansion and delineation diamond drilling was initially planned for 2024, and it was increased due to positive results obtained. During the twelve months ended December 31, 2024, approximately 13,500 metres of diamond drilling were completed as part of the annual program.
In the fourth quarter 2024, the Company reported all 2024 drill results with highlights including: 46.1 metres grading 1.08 g/t Au and 48.8 metres grading 1.48 g/t Au in Zone 36; 35.2 metres grading 2.54 g/t Au and 32.9 metres grading 2.75 g/t Au in the Renard Zone; and 43.0 metres grading 2.28 g/t Au and 22.5 metres grading 3.85 g/t Au in the Footwall Zone (see news release dated October 23, 2024).
| | | | | |
IAMGOLD CORPORATION Annual Management's Discussion and Analysis - December 31, 2024 | 20 |
Monster Lake Gold Project
The Company holds a 100% interest in the Monster Lake Gold Project, which is located approximately 15 kilometres north of the Nelligan Gold Project in the Chapais Chibougamau area in Québec.
Approximately 3,000 metres of exploration diamond drilling was initially planned for 2024 and approximately 3,500 metres were completed in the first quarter 2024 testing exploration targets along the main Monster Lake Shear Zone structural corridor. Summer field programs have progressed in specific highly prospective targets to be drill tested and approximately 600 additional metres of diamond drilling were completed.
In the fourth quarter 2024, the Company reported an updated Mineral Resource Estimate of 239,000 tonnes of Indicated Mineral Resources averaging 11.0 g/t Au for 84,000 ounces of gold, and 1,053,000 tonnes of Inferred Mineral Resources averaging 14.4 g/t Au for 489,000 ounces of gold (see news release dated October 23, 2024).
During the fourth quarter, an additional drilling program of approximately 1,800 metres was initiated to test further extensions of potential zones of resources, bringing the total to 5,900 metres completed in the twelve months ended December 31, 2024.
Anik Gold Project
The Anik Gold Project is wholly owned by Kintavar Exploration Inc. (“Kintavar”) and is contiguous with Nelligan to the north and east. IAMGOLD has entered into an option agreement on May 20, 2020, to acquire 80% of the interests in this project. Approximately 3,000 metres of exploration diamond drilling was planned for 2024, of which approximately 2,300 metres were completed in the first quarter 2024 testing different target areas. Summer field programs were conducted on different parts of the project to delineate further exploration targets.
Bambouk Assets, West Africa
On December 20, 2022, the Company announced it had entered into definitive agreements with Managem S.A (CAS:MNG) (“Managem”) to sell its interests in the Bambouk Assets for total cash payments of approximately $282.0 million (pre-tax). The Bambouk assets consists of the Company’s 90% interest in the Boto Gold Project in Senegal and 100% interest in each of: Karita Gold Project and associated exploration properties in Guinea, the Diakha-Siribaya Gold Project in Mali, and the early stage exploration properties of Boto West, Senala West, Daorala and the vested interest in the Senala Option Earn-in Joint Venture, also in Senegal.
On April 25, 2023, the Company completed the sale of its 90% interest in the Boto Gold Project in Senegal and its 100% interest
in the early-stage exploration properties of Boto West, Senala West, Daorala and the vested interest in the Senala Option Earn-in
Joint Venture, also in Senegal, for aggregate gross cash proceeds of $197.6 million.
On December 23, 2024, the Company announced that it closed the sale of its 100% interest in the Karita Gold Project and associated exploration assets in Guinea for gross cash proceeds of $35.5 million. The definitive agreement to sell the Diakha-Siribaya Gold Project in Mali expired on December 31, 2024, and was not extended. The Company is pursuing alternative options for the sale of this asset.
Exploration
During the twelve months ended December 31, 2024, drilling activities on active projects and mine sites totaled approximately 128,000 metres. For additional information regarding the brownfield and greenfield exploration projects, see "Operations". The Company's exploration expenditures guidance for 2025 is $38 million.
| | | | | | | | | | | | | | | | | |
| | | |
| | | | | |
| ($ millions) | Q4 2024 | Q4 2023 | 2024 | 2023 | 2022 |
| Exploration projects – greenfield | $ | 4.7 | | $ | 1.7 | | $ | 17.5 | | $ | 11.0 | | $ | 9.8 | |
Exploration projects – brownfield1 | 2.4 | | 1.7 | | 8.9 | | 6.3 | | 8.4 | |
| Total – continuing operations | 7.1 | | 3.4 | | 26.4 | | 17.3 | | 18.2 | |
| Discontinued operations | — | | — | | — | | 0.1 | | 3.9 | |
| Total – all operations | $ | 7.1 | | $ | 3.4 | | $ | 26.4 | | $ | 17.4 | | $ | 22.1 | |
1.Exploration projects – brownfield for the fourth quarter 2024 included near-mine exploration and resource development of $2.0 million (fourth quarter 2023 - $1.3 million) and $6.5 million for 2024 (2023 - $4.4 million, 2022 - $5.4 million) which are capitalized.
FINANCIAL CONDITION
Liquidity and Capital Resources
As at December 31, 2024, the Company had $347.5 million in cash and cash equivalents and net debt of $859.3 million. The Company has $220 million drawn on the Credit Facility and approximately $418.5 million remains available, resulting in liquidity at December 31, 2024, of approximately $767.0 million.
Within cash and cash equivalents, $46.0 million (70% basis) was held by the Côté Gold UJV, $130.2 million was held by Essakane and $160.4 million was held in the corporate treasury. The Côté Gold UJV requires its joint venture partners to fund, in advance, two months of future expenditures and cash calls are made at the beginning of each month, resulting in the month end cash balance approximating the following month's expenditure.
| | | | | |
IAMGOLD CORPORATION Annual Management's Discussion and Analysis - December 31, 2024 | 21 |
On February 11, 2025, the Company completed a private placement of 0.8 million flow-through common shares of the Company (the "Flow-Through Shares") that will qualify as "flow-through shares" (within the meaning of subsection 66(15) of the Income Tax Act (Canada)). The Flow-Through shares were issued at a price of C$12.25 per Flow-Through Share for aggregate gross proceeds of C$10.0 million.
The Company uses dividends and intercompany loans to repatriate funds from its operations and the timing of dividends may impact the timing and amount of required financing at the corporate level, including the Company's drawdowns under the Credit Facility. Excess cash at Essakane is mainly repatriated through dividend payments, of which the Company will receive its 90% share, net of dividend taxes. Essakane declared a dividend during the second quarter 2024 of $180.0 million, for which the minority interest portion and withholding taxes of $28.1 million were paid during the second quarter 2024, and $136.3 million of which was received by the Company in the third quarter and the balance of $15.6 million was received in October 2024.
On November 30, 2024, the Company issued a payment of $377.7 million to complete the repurchase of the 9.7% interest of the Côté Gold Mine that was transferred to SMM through the amended Côté Gold Joint Venture Agreement, returning IAMGOLD to its full 70% interest in Côté Gold. The repurchase payment was funded through available cash balances and amounts available under the Credit Facility.
On December 23, 2024, the Company announced that it closed the sale of its 100% interest in the Karita Gold Project associated exploration assets in Guinea for gross proceeds of $35.5 million.
Restricted cash in support of environmental closure costs obligations related to Essakane, Doyon division and Côté Gold totaled $68.4 million.
The following sets out the changes in cash balance from September 30, 2024, to December 31, 2024, and December 31, 2023, to December 31, 2024:
Current assets as at December 31, 2024, were $668.3 million, down $85.4 million compared with December 31, 2023. The decrease was primarily due to decreased receivables of $36.8 million, with a portion of VAT receivable at Essakane reassessed in 2024 as a long-term receivable, lower assets held for sale of $34.6 million and lower cash and cash equivalents of $19.6 million, partially offset by higher inventories of $5.6 million.
Current liabilities as at December 31, 2024, were $550.6 million, down $80.2 million compared with December 31, 2023. The decrease was due to lower accounts payable and accrued liabilities of $52.8 million, a $89.6 million reduction in the current portion of deferred revenue, and the current portion of other obligations of $1.9 million, partially offset by an increase in income tax payable of $56.9 million and current portion of lease liabilities of $7.7 million.
| | | | | |
IAMGOLD CORPORATION Annual Management's Discussion and Analysis - December 31, 2024 | 22 |
The following table summarizes the carrying value of the Company's long-term debt:
| | | | | | | | | | | |
| December 31 | December 31 | December 31 |
($ millions)1 | 2024 | 2023 | 2022 |
| Credit Facility | $ | 220.0 | | $ | — | | $ | 455.0 | |
| 5.75% senior notes ($450 million principal outstanding) | 448.4 | | 448.0 | | 447.6 | |
| Term Loan ($400 million principal outstanding) | 358.4 | | 375.6 | | — | |
| Equipment loans | 2.1 | | 7.2 | | 16.1 | |
| $ | 1,028.9 | | $ | 830.8 | | $ | 918.7 | |
1.Long-term debt does not include leases in place at continuing operations of $124.2 million as at December 31, 2024 (December 31, 2023 - $121.3 million, December 31, 2022 - $73.8 million).
1.Includes principal for the Term Loan, 5.75% senior notes and equipment loans and does not include the repayment of the 2022 Prepay Arrangements, 2024 Q1 Prepay Arrangements or the 2024 Q2 Prepay Arrangements (defined below) which will be physically settled in 2025, and leases.
2.Excludes the amounts drawn on the credit facility, which can be repaid at any time prior to maturity in 2028.
Credit Facility
On December 23, 2024, the Company announced that the Company and its syndicate of lenders executed an amendment to its existing secured revolving Credit Facility, extending the maturity by four years now maturing on December 20, 2028, and an increase in the facility size from $425 million to $650 million in support of the Company’s requirements for a senior revolving facility for its overall business.
The Credit Facility provides for an interest rate margin above the SOFR, banker’s acceptance prime rate and base rate advances which vary, together with fees related thereto, according to the total Net Debt to EBITDA ratio of the Company. The Credit Facility is secured by certain of the Company's real assets, guarantees by certain of the Company’s subsidiaries and pledges of shares of certain of the Company's subsidiaries. The key terms of the Credit Facility include certain limitations on incremental debt, certain restrictions on distributions and financial covenants, including Net Debt to EBITDA, Interest Coverage and a minimum liquidity requirement of $150 million.
As at December 31, 2024, the Credit Facility was drawn in the amount of $220 million and the Company issued letters of credit under the Credit Facility in the amount of $7.4 million as collateral for surety bonds issued, $0.4 million as guarantees for certain environmental indemnities to government agencies, and $3.7 million as a supplier payment guarantee, with $418.5 million remaining available under the Credit Facility.
5.75% Senior notes
In September 2020, the Company completed the issuance of $450 million of senior notes at face value with an interest rate of 5.75% per annum (the "Notes"). The Notes are denominated in U.S. dollars and mature on October 15, 2028. Interest is payable in arrears in equal semi-annual installments on April 15 and October 15 of each year, beginning on April 15, 2021, in the amount of approximately $12.9 million for each payment. The Notes are guaranteed by certain of the Company's subsidiaries.
The Company incurred transaction costs of $7.5 million which have been capitalized and offset against the carrying amount of the Notes within long-term debt in the consolidated balance sheets and are being amortized using the effective interest rate method.
Term Loan
In May 2023, the Company entered into the $400.0 million Term Loan. The Term Loan has a 3% original issue discount, bears interest at a floating interest rate of either one month or three-month SOFR + 8.25% per annum and matures on May 16, 2028. The Term Loan is denominated in U.S. dollars and interest is payable upon each SOFR maturity date. The Term Loan notes are guaranteed by certain of the Company's subsidiaries, subordinated to the Credit Facility.
The Company incurred transaction costs of $11.0 million, in addition to the 3% discount, which have been capitalized and offset against the carrying amount of the Term Loan within long-term debt in the consolidated balance sheets and are being amortized using the effective interest rate method.
| | | | | |
IAMGOLD CORPORATION Annual Management's Discussion and Analysis - December 31, 2024 | 23 |
The Term Loan can be repaid in $20 million tranches at any time and has a make-whole premium if repaid in the first two years, a 104% premium if repaid after May 2025, a 101% premium if repaid after May 2026 and 100% thereafter.
The Term Loan has a minimum liquidity requirement of $150 million and an interest coverage ratio (1.5x trailing consolidated EBITDA to consolidated interest expense) covenants and has no mandatory requirements for gold or other forms of hedging, cost overrun reserves or cash sweeps.
Leases
At December 31, 2024, the Company had lease obligations of $124.2 million at a weighted average borrowing rate of 7.33%.
On April 29, 2022, the Company, on behalf of the Côté Gold UJV, entered into a master lease agreement with Caterpillar Financial Services Limited to lease certain mobile equipment, which have been delivered through 2023 and 2024, with a value of approximately $125 million. In the second and fourth quarters 2024, the master lease agreement was amended to increase the facility to $150 million and $175 million, respectively. The increase in the facility supports additional leasing of mobile equipment at Côté Gold during 2024 and 2025.
Equipment loans
At December 31, 2024, the Company had equipment loans with a carrying value of $2.1 million secured by certain mobile equipment, with interest rates at 5.3% which mature in 2026. The equipment loans are carried at amortized cost on the consolidated balance sheets.
Gold prepay arrangements
During 2021, the Company entered into gold sale prepayment arrangements (the "2022 Prepay Arrangements"). The Company received $236.0 million in 2022 and was to physically deliver 150,000 gold ounces over the course of 2024, at an average forward contract price of $1,753 per ounce on 50,000 ounces and a collar range of $1,700 to $2,100 per ounce on 100,000 ounces.
In December 2023 and April 2024, the Company entered into further gold sale prepay arrangements and amendments to certain of the 2022 Prepay Arrangements, which effectively transitioned the cash impact of the gold delivery obligations from the 2022 Prepay Arrangements out of the first and second quarters of 2024 into the first and second quarters of 2025.
•2024 Q1 Prepay Arrangements: the Company received an amount of $59.9 million during the first quarter 2024 at an effective gold price of $1,916 per ounce and is required to physically deliver 31,250 ounces of gold over the period of January 2025 to March 2025 in equal monthly amounts.
•2024 Q2 Prepay Arrangements: the Company received an amount of $59.4 million during the second quarter 2024 at an effective gold price of $1,900 per ounce and is required to physically deliver 31,250 ounces of gold over the period of April 2025 to June 2025. The arrangement includes a gold collar of $2,100 to $2,925 per ounce whereby the Company will receive a cash payment at the time of delivery of the ounces if the spot price of gold exceeds $2,100 per ounce, with the payment calculated as the difference between the spot price and $2,100 per ounce, capped at $2,925 per ounce.
•Amendment to the 2022 Prepay Arrangements: deferred the delivery of 12,500 ounces that were previously scheduled for delivery in the first half of 2024 to the first half of 2025. The Company will make a cash payment of $0.5 million in the first quarter 2025 and $0.6 million in the second quarter 2025 in consideration for the deferral. The production previously designated to be delivered into the deferred arrangements was sold at market rates in the first and second quarters of 2024.
The Company delivered 37,500 ounces under the 2022 Prepay Arrangements in the fourth quarter 2024 (137,500 ounces for the year) and received $10.0 million ($38.9 million for the year) in relation to the collar.
Surety bonds and performance bonds
As at December 31, 2024, the Company had (i) C$255.7 million ($177.5 million) of surety bonds, issued pursuant to arrangements with insurance companies, in support of environmental closure costs obligations related to the Doyon division and Côté Gold and (ii) C$32.0 million ($22.2 million) of performance bonds in support of certain obligations related to the construction of Côté Gold.
As at December 31, 2024, the total collateral provided through letters of credit and cash deposits for the surety and performance bonds was $18.3 million. The balance of $181.4 million remains uncollateralized for the surety and performance bonds.
During the quarter, the Company increased surety bonds to support the updated environmental closure cost obligations by C$40.2 million. The Company will be required to increase bonds further by C$19.0 million cumulatively during the second and third quarter of 2025 and C$19.0 million cumulatively during the second and third quarter of 2026.
Derivative contracts
In addition to the gold sale prepayment arrangements noted above, and in order to mitigate volatility in costs and protect against downside, the Company entered into certain derivative contracts in respect of exchange rates. In addition, the Company may manage certain other commodities exposure such as oil through derivatives. See “Market Risk – Summary of Foreign Currency and Commodity Derivative Contracts” for information relating to the Company’s outstanding derivative contracts, including the derivative contracts associated with Côté Gold.
| | | | | |
IAMGOLD CORPORATION Annual Management's Discussion and Analysis - December 31, 2024 | 24 |
Liquidity Outlook
At December 31, 2024, the Company had available liquidity of $767.0 million mainly comprised of $347.5 million in cash and cash equivalents and $418.5 million available under the Credit Facility. Within cash and cash equivalents, $46.0 million (70% basis) was held by Côté Gold and $130.2 million was held by Essakane. Cash at Essakane is mainly repatriated through dividend payments, of which the Company will receive its 90% share, net of dividend taxes.
The Company has considerable obligations and factors impacting its liquidity projections during the next twelve months:
•IAMGOLD will receive 70% of gold production and will fund 70% of the disbursements at Côté Gold related to the planned and unplanned costs related to the ramp-up, as well as ongoing operating and capital expenditures and working capital requirements. It is expected that Côté Gold will remain free cash flow positive, excluding the impact of gold prepay transactions. A slower than planned ramp-up or unplanned downtime would result in less gold sales and an increase in the net funding requirement.
•The Company is required to deliver 75,000 ounces under its gold prepay arrangements from January 2025 to June 30, 2025. The prepay arrangements were funded at the time of entering into the agreements. The Company will receive cash payments at the time of delivering into the gold prepay arrangement based on the amount that market price of gold at the time of delivery exceeds $2,100 per ounce, capped at $2,925 per ounce, for 31,250 ounces that will be delivered during the second quarter 2025.
The Company's liquidity position, comprised of cash and cash equivalents, short-term investments, and availability under the credit facility, together with expected cash flows from operations, is expected to be sufficient to support the Company's normal operating requirements, capital commitments, and service the prepay and debt obligations as it becomes due.
The Company’s financial results are highly dependent on the price of gold, oil and foreign exchange rates and future changes in these prices will, therefore, impact performance. The Company’s ability to draw down on the Credit Facility is dependent on its ability to meet net debt to EBITDA and interest ratio covenants.
The Company will be dependent on the cash flows generated from its operations to repay its indebtedness that was incurred to fund the construction of the Côté Gold project. Readers are encouraged to read the “Caution Regarding Forward Looking Statements” and the “Risk Factors” sections contained in the Company’s 2023 Annual Information Form, which is available on SEDAR at www.sedarplus.ca and the “Caution Regarding Forward Looking Statements” and “Risk and Uncertainties” section of the MD&A.
Contractual Obligations
As at December 31, 2024, contractual obligations from continuing operations with various maturities were approximately $1.9 billion, primarily comprising expected future contractual payments of long-term debt, including principal and interest, purchase obligations, capital expenditures obligations, asset retirement obligations and lease obligations, partially offset by cash collateralized letters of credit and restricted cash in support of environmental closure cost obligations for certain mines. The Company believes these obligations will be met through available cash resources and net cash from operating activities. The Company entered into derivative contracts for risk management purposes. These derivative contracts are not included in the contractual obligations. Details of these contracts are included in “Market Risk – Summary of Foreign Currency and Commodity Derivative Contracts”.
| | | | | | | | | | | | | | | | | | | | |
| | Payments due by period1 |
| At December 31, 2024 | | Total | <1 yr | 2-3 yrs | 4-5 yrs | >5 yrs |
| Long-term debt | | $ | 1,144.5 | | $ | 77.1 | | $ | 164.5 | | $ | 902.9 | | $ | — | |
| Equipment loan | | 2.1 | | 1.0 | | 1.1 | | — | | — | |
| Purchase obligations | | 155.0 | | 141.6 | | 6.9 | | 2.0 | | 4.5 | |
| Capital expenditure obligations | | 117.2 | | 102.3 | | 14.9 | | — | | — | |
| Lease obligations | | 142.8 | | 39.8 | | 70.1 | | 23.4 | | 9.5 | |
| Total contractual obligations | | $ | 1,561.6 | | $ | 361.8 | | $ | 257.5 | | $ | 928.3 | | $ | 14.0 | |
| Asset retirement obligations | | 373.6 | | 17.2 | | 30.6 | | 17.0 | | 308.8 | |
| | $ | 1,935.2 | | $ | 379.0 | | $ | 288.1 | | $ | 945.3 | | $ | 322.8 | |
| | | | | | |
1.Total contractual obligations exclude the 2022 Prepay Arrangements, 2024 Q1 Prepay Arrangements and the 2024 Q2 Prepay Arrangements which will be physically settled in 2025.
2.Excludes the amounts drawn on the credit facility, which can be repaid at any time prior to maturity in 2028.
| | | | | |
IAMGOLD CORPORATION Annual Management's Discussion and Analysis - December 31, 2024 | 25 |
Cash Flow
| | | | | | | | | | | | | | | | | |
| | | |
| ($ millions) | Q4 2024 | Q4 2023 | 2024 | 2023 | 2022 |
| Net cash from (used in) per consolidated financial statements: | | | | | |
| Operating activities | $ | 102.6 | | $ | 69.9 | | $ | 486.0 | | $ | 159.4 | | $ | 408.7 | |
| Investing activities | (102.5) | | (272.2) | | (582.4) | | (402.3) | | (891.9) | |
| Financing activities | (194.9) | | 16.9 | | 83.3 | | 201.7 | | 404.0 | |
| Effects of exchange rate fluctuation on cash and cash equivalents | (11.3) | | 3.6 | | (7.0) | | 1.3 | | (17.1) | |
| Increase (decrease) in cash and cash equivalents | $ | (206.1) | | $ | (181.8) | | $ | (20.1) | | $ | (39.9) | | $ | (96.3) | |
| Cash and cash equivalents, beginning of the period | 553.4 | | 548.9 | | 367.1 | | 407.8 | | 544.9 | |
| Cash and cash equivalents, end of the period – all operations | $ | 347.3 | | $ | 367.1 | | $ | 347.0 | | $ | 367.9 | | $ | 448.6 | |
| Decrease (increase) in cash and cash equivalents – held for sale | 0.2 | | — | | 0.5 | | (0.8) | | (40.8) | |
| Cash and cash equivalents, end of the period – continuing operations | $ | 347.5 | | $ | 367.1 | | $ | 347.5 | | $ | 367.1 | | $ | 407.8 | |
Operating Activities
Net cash flow from operating activities for the fourth quarter 2024 was $102.6 million, higher by $32.7 million compared to the same prior year period, primarily due to:
•Higher cash earnings of $140.2 million due to a higher realized gold price and higher sales volume, and
•A decrease in income tax paid of $5.4 million,
Offset by:
•A decrease in trade and other payables of $31.9 million due to the timing of the supplier invoices,
•An increase in supplies inventories, finished goods and ore stockpiles of $9.4 million primarily due to an increase in finished goods and ore stockpiles at Côté Gold, offset by a reduction in supplies inventories and finished goods at Essakane and Westwood,
•A negative impact of $64.4 million from deferred revenue recognized as part of the prepay arrangements, and
•A decrease in derivative settlements of $3.9 million.
Net cash flow from operating activities for the year was $486.0 million, higher by $342.0 million compared to the same prior year period, primarily due to:
•Higher cash earnings of $533.4 million due to higher realized gold price and sales volume,
•A decrease in income tax paid of $26.9 million,
•The receipt of an insurance claim of $26.7 million, and
•A net decrease in supplies inventories, finished goods and ore stockpiles of $25.2 million, primarily due to a reduction in supplies inventory and finished goods inventories at Essakane and Westwood, offset by an increase of finish goods and ore stockpiles at Côté Gold,
•Offset by:
•A negative impact of $116.4 million from deferred revenue recognized as part of the gold prepay arrangements,
•A decrease in trade and other payables of $61.1 million due to the timing of payments, and
•An increase in trade and other receivables of $56.0 million, primarily due to increased VAT receivable at Essakane.
Investing Activities
Net cash used in investing activities for the fourth quarter 2024 was $102.5 million, a decrease of $169.7 million from the same prior year period, primarily due to:
•A decrease in capital expenditures for property, plant and equipment of $130.9 million, mainly due to the completion of the Côté Gold construction phase,
•A decrease in restricted cash of $22.4 million, and
•A decrease in capitalized borrowing costs of $10.9 million.
Net cash used in investing activities for the year was $582.4 million, an increase of $188.3 million from the same prior year period, primarily due to:
•The receipt of $389.2 million in net proceeds from the sale of Rosebel and $197.6 million from the sale of the Senegal assets in the third quarter of 2023, and
•An increase in capitalized borrowing costs of $9.5 million,
Offset by:
| | | | | |
IAMGOLD CORPORATION Annual Management's Discussion and Analysis - December 31, 2024 | 26 |
•A decrease in capital expenditures for property, plant and equipment of $348.7 million, mainly due to the completion of the Côté Gold project phase,
•Proceeds of $35.5 million received from the sale of Karita and related assets, and
•A decrease in restricted cash of $24.8 million.
Financing Activities
Net cash used in financing activities for the fourth quarter 2024 was $194.9 million, a decrease of $211.8 million from the same prior year period, primarily due to:
•The payment made to SMM to affect the repurchase of the 9.7% Transferred Interest in Côté Gold totaling $376.9 million,
•A decrease in proceeds received through the SMM funding arrangement of $27.1 million,
•The cash option fee payment made to SMM in relation to the repurchase totaling $15.2 million, and
• An increase in interest paid of $12.7 million,
Offset by:
•A draw of $220.0 million to the Credit Facility in the fourth quarter 2024.
Net cash from financing activities for the year was $83.3 million, a decrease of $120.4 million from the same prior year period, primarily due to:
•The payment made to SMM to affect the repurchase of the 9.7% Transferred Interest in Côté Gold of $376.9 million,
•A decrease in proceeds received through the SMM funding arrangement of $282.7 million,
•The cash option fee payment made to SMM in relation to the repurchase totaling $32.7 million,
•$379.0 million of net proceeds received from the Term Loan in 2023, and
•An increase in interest paid of $13.8 million,
Offset by
•Net proceeds of issuing common shares of $287.5 million,
•A repayment of the Credit facility of $455.0 million in 2024 offset by a net draw in the Credit facility of $220.0 million in 2024, and
•Proceeds of issuing flow-through common shares of $5.9 million.
Market Risk
Market risk is the risk that the fair value or future cash flows of a financial instrument will fluctuate because of changes in market prices. For hedging activities, it is the risk that the fair value of a derivative might be adversely affected by a change in underlying commodity prices or currency exchange rates and that this in turn affects the Company’s financial condition. The Company establishes trading agreements with counterparties under which there is no requirement to post any collateral or make any margin calls on derivatives. Counterparties cannot require settlement solely because of an adverse change in the fair value of a derivative.
Currency Exchange Rate Risk
The Company’s functional currency is the U.S. dollar with revenues primarily denominated in U.S. dollars which creates currency exchange risk exposure primarily associated with its expenditures denominated in Canadian dollars and Euros. To manage this risk, the Company uses various hedging strategies, including holding some of its cash and cash equivalents in Canadian dollar or Euro denominated bank accounts creating a natural offset to the exposure and derivative contracts such as forwards or options.
| | | | | | | | | | | | | | | | | |
| Q4 2024 | Q4 2023 | 2024 | 2023 | 2022 |
| Average market rates | | | | | |
| USDCAD | 1.3993 | | 1.3624 | | 1.3700 | | 1.3497 | | 1.3019 | |
| EURUSD | 1.0666 | | 1.0762 | | 1.0820 | | 1.0816 | | 1.0533 | |
| Market closing rates | | | | | |
| USDCAD | 1.4384 | | 1.3205 | | 1.4384 | | 1.3205 | | 1.3533 |
| EURUSD | 1.0354 | | 1.1060 | | 1.0354 | | 1.1060 | | 1.0694 |
Oil Contracts and Fuel Market Price Risk
Brent and West Texas Intermediate (“WTI”) are components of diesel and fuel oil which are among the key inputs impacting the Company’s costs. To manage the risk associated with the fluctuation in the costs of these commodities, the Company may use various hedging strategies, such as the use of options to mitigate the risk of oil price appreciation given it is a significant input cost in the production of gold. Option contracts can be combined through the use of put option contracts and call option contracts (collar structure), within a range of expiry dates and strike prices.
| | | | | |
IAMGOLD CORPORATION Annual Management's Discussion and Analysis - December 31, 2024 | 27 |
| | | | | | | | | | | | | | | | | |
| Q4 2024 | Q4 2023 | 2024 | 2023 | 2022 |
| | | | | |
| | | | | |
| | | | | |
| | | | | |
| | | | | |
| | | | | |
| Average Brent price ($/barrel) | $ | 74 | | $ | 83 | | $ | 80 | | $ | 82 | | $ | 99 | |
| Closing Brent price ($/barrel) | $ | 75 | | $ | 77 | | $ | 75 | | $ | 77 | | $ | 86 | |
| Average WTI price ($/barrel) | $ | 70 | | $ | 79 | | $ | 76 | | $ | 78 | | $ | 94 | |
| Closing WTI price ($/barrel) | $ | 72 | | $ | 72 | | $ | 72 | | $ | 72 | | $ | 80 | |
Gold Contracts and Market Price Risk
The Company’s primary source of revenue is gold. The Company’s hedging strategy is designed to mitigate gold price risk. To manage such risk, the Company may use various hedging strategies, including the use of put and call option contracts. Option contracts can also include put option contracts and call option contracts (collar structure), within a range of expiry dates and strike prices.
| | | | | | | | | | | | | | | | | |
| | | | |
| | | | | |
| Q4 2024 | Q4 2023 | 2024 | 2023 | 2022 |
| Average market gold price ($/oz) | $ | 2,663 | | $ | 1,973 | | $ | 2,386 | | $ | 1,941 | | $ | 1,801 | |
Average realized gold price1 ($/oz), inclusive of prepay deliveries: | $ | 2,525 | | $ | 2,005 | | $ | 2,330 | | $ | 1,955 | | $ | 1,721 | |
| Average realized gold price, excluding prepay deliveries ($/oz) | $ | 2,664 | | $ | 2,005 | | $ | 2,414 | | $ | 1,955 | | $ | 1,802 | |
Average realized gold price of prepay deliveries2 ($/oz) | $ | 2,031 | | $ | — | | $ | 1,997 | | $ | — | | $ | 1,500 | |
| Closing market gold price ($/oz) | $ | 2,609 | | $ | 2,062 | | $ | 2,609 | | $ | 2,062 | | $ | 1,814 | |
1.This is a non-GAAP financial measure. See “Non-GAAP Financial Measures”.
2.The Company delivered 37,500 ounces into the 2022 Prepay Arrangements in the fourth quarter (137,500 ounces YTD). See “Gold prepay arrangements” above.
Summary of Foreign Currency, Prepay Arrangements and Commodity Derivative Contracts
At December 31, 2024, the Company’s outstanding foreign currency contracts were as follows:
| | | | | | | | | | | | | |
| | | 2025 | 2026 | | | |
Foreign Currency1 | | | | | | | |
| | | | | | | |
| Canadian dollar contracts (millions of C$) | | | 406 | 72 | | | |
| Rate range (USDCAD) | | | 1.35 — 1.44 | 1.36 — 1.44 | | | |
Hedge ratio2 | | | 36% | 7% | | | |
| | | | | | | |
| | | | | | | |
| | | | | | | |
| | | | | | | |
| | | | | | | |
| | | | | | | |
| | | | | | | |
| | | | | | | |
| | | | | | | |
| | | | | | | |
| | | | | | | |
| | | | | | | |
| | | | | | | |
| | | | | | | |
| | | | | | | |
| | | | | | | |
| | | | | | | |
| | | | | | | |
| | | | | | | |
1.Canadian dollar hedges exclude Canadian dollars on hand which functions as a natural hedge for the Company’s Canadian dollar expenditures. USDCAD hedges are CAD notional hedges.
2.The Company calculates hedge ratios based on future estimates of operating and capital expenditures such as its Canadian dollar operating and capital expenditures at Côté Gold and Westwood and its corporate office. Outstanding derivative contracts are allocated based on a specified allocation methodology.
At December 31, 2024, the Company’s outstanding gold bullion contracts, including contracts entered into as part of the gold sale prepayment arrangements (see “Liquidity and Capital Resources”) were as follows:
| | | | | | | | | | | | |
| Put/Forward | Call | | 2025 |
| Weighted average $/ounce | | Thousands of ounces |
| | | | |
| | | | |
| | | | |
| | | | |
| | | | |
| | | | |
| | | | |
| 2022 Prepay Arrangements – forward | 1,753 | — | | 13 |
| 2024 Prepay Arrangements – forward | 1,916 | — | | 31 |
| 2024 Prepay Arrangements – collar | 2,100 | 2,925 | | 31 |
| Total | — | — | | 75 |
| | | | |
| | | | |
| | | | |
| | | | |
| | | | |
| | | | |
| | | | |
| | | | |
Sensitivity Impact
The following table provides estimated cost per ounce sensitivities around certain inputs, excluding the impact of the Company’s hedging program which can affect the Company’s operating results, assuming guided 2025 production and costs levels:
| | | | | | | | | | | | | | |
| Change of | Annualized impact on Cost of Sales $/oz | Annualized impact on Cash Costs1 $/oz | Annualized impact on AISC1 $/oz |
Gold price2 | $100/oz | $7 | $7 | $7 |
| Oil price | $10/barrel | $9 | $9 | $10 |
| USDCAD | $0.10 | $37 | $37 | $58 |
| EURUSD | $0.10 | $17 | $17 | $21 |
1.This is a non-GAAP financial measure. See “Non-GAAP Financial Measures”. Cash costs and AISC per ounce of gold sold consist of Côté Gold, Westwood and Essakane on an attributable basis of 70%, 100% and 90%, respectively.
2.Gold price sensitivities include royalties and additional costs with a gold price link, which are included in total cost of sales, cash costs and AISC.
| | | | | |
IAMGOLD CORPORATION Annual Management's Discussion and Analysis - December 31, 2024 | 28 |
Compensation of Key Management Personnel
Compensation breakdown for key management personnel, comprising of the Company’s directors and executive officers, is as follows:
| | | | | | | | | | | |
| 2024 | 2023 | 2022 |
| Salaries and other benefits | $ | 5.5 | | $ | 7.2 | | $ | 5.8 | |
| Retirement benefits | 0.7 | | 2.1 | | 2.4 | |
| Share-based payments | 3.2 | | 4.2 | | 2.6 | |
| $ | 9.4 | | $ | 13.5 | | $ | 10.8 | |
Shareholders' Equity
| | | | | | | | |
| Number issued and outstanding (millions) | December 31, 2024 | February 19, 2025 |
| Common shares | 571.4 | | 572.4 | |
Options1 | 3.1 | | 2.9 | |
1.Refer to note 25 of the consolidated financial statements for all outstanding equity awards.On February 11, 2025, the Company completed a private placement of 0.8 million flow-through common shares of the Company. The Flow-Through shares were issued at a price of CAD$12.25 per Flow-Through Share for aggregate gross proceeds of approximately CAD$10.0 million.
QUARTERLY FINANCIAL REVIEW
| | | | | | | | | | | | | | | | | | | | | | | | | | |
| 2024 | 2023 |
| ($ millions, except where noted) | Q4 | Q3 | Q2 | Q1 | Q4 | Q3 | Q3 | Q2 |
| Revenues | $ | 469.9 | | $ | 438.9 | | $ | 385.3 | | $ | 338.9 | | $ | 297.6 | | $ | 224.5 | | $ | 238.8 | | $ | 226.2 | |
| Net earnings (loss) from continuing operations | $ | 91.1 | | $ | 602.5 | | $ | 92.5 | | $ | 61.7 | | $ | (7.6) | | $ | (0.8) | | $ | 95.2 | | $ | 10.7 | |
| Net earnings (loss) from discontinued operations | $ | — | | $ | — | | $ | — | | $ | — | | $ | — | | $ | — | | $ | — | | $ | 6.3 | |
| | | | | | | | |
| Net earnings (loss) attributable to equity holders | $ | 86.2 | | $ | 594.1 | | $ | 84.5 | | $ | 54.8 | | $ | (9.4) | | $ | (0.8) | | $ | 92.6 | | $ | 6.3 | |
| Basic earnings (loss) per share attributable to equity holders | $ | 0.15 | | $ | 1.04 | | $ | 0.16 | | $ | 0.11 | | $ | (0.02) | | $ | 0.00 | | $ | 0.19 | | $ | 0.01 | |
| Diluted earnings (loss) per share attributable to equity holders | $ | 0.15 | | $ | 1.03 | | $ | 0.16 | | $ | 0.11 | | $ | (0.02) | | $ | 0.00 | | $ | 0.19 | | $ | 0.01 | |
| | | | | | | | |
In the second quarter 2023, net earnings from continuing operations were higher due to a gain on sale of the Boto Gold Project.
In the third quarter 2024, net earnings from continuing operations were higher due to the reversal of previous impairments in respect of the Westwood CGU, which includes the Doyon closed mine.
Revenues
Revenues were $469.9 million in the fourth quarter 2024 from sales of 185,000 ounces at an average realized gold price of $2,525 per ounce, higher by $172.3 million or 58% than the prior year period, due to higher sales volumes at Westwood, the commencement of gold sales from the Côté Gold Mine, and a higher realized gold price, partially offset by lower sales volumes at Essakane, the impact of gold deliveries into the 2022 Prepay Arrangement (defined above), including 12,500 ounces delivered at a forward price of $1,753 per ounce, and 25,000 ounces delivered into a collar with gold price participation capped at $2,100 per ounce.
Revenues were $1,633.0 million in the year from sales of 699,000 ounces at an average realized gold price of $2,330 per ounce, higher by $645.9 million or 65% than the prior year period, due to higher sales volumes at Essakane and Westwood, the commencement of gold sales from the Côté Gold Mine, and a higher realized gold price, partially offset by the impact of gold deliveries into the 2022 Prepay Arrangement (defined above), including 37,500 ounces delivered at a forward price of $1,753 per ounce, and 100,000 ounces delivered into a collar with gold price participation capped at $2,100 per ounce.
Cost of sales
Cost of sales excluding depreciation was $242.6 million in the fourth quarter 2024, higher by $65.9 million or 37% than the prior year period, primarily due to the commencement of operations and gold sales at Côté Gold, the ramp-up of underground mining activity at the Westwood mine and increased royalty payments due to higher realized gold prices.
Cost of sales excluding depreciation was $809.3 million in the year, higher by $162.3 million or 25% than the prior year period, due to the increase in mining activity at Essakane when compared to the prior year period which experienced abnormally low operating activity due to fuel shortages in the first and third quarters 2023, the ramp-up of underground mining activity at the Westwood mine, the commencement of operations and gold sales at Côté Gold and increased royalty payments due to higher realized gold prices.
| | | | | |
IAMGOLD CORPORATION Annual Management's Discussion and Analysis - December 31, 2024 | 29 |
Depreciation expense
Depreciation expense was $96.4 million in the fourth quarter 2024, higher by $25.3 million or 36% than the prior year period primarily due to the commencement of operations and gold sales at the newly operating Côté Gold Mine, and the reversal of previous impairments for the Westwood mine complex in the third quarter, partially offset by lower production volumes and the amortization of deferred stripping assets at Essakane.
Depreciation expense was $273.8 million in the year, higher by $57.8 million or 27% than the prior year period primarily due to higher production volumes and the amortization of deferred stripping assets as the mining activity sequences through Phase 5 at Essakane, the commencement of operations and gold sales at the newly operating Côté Gold Mine, and the reversal of previous impairments for the Westwood mine complex in the third quarter.
Exploration expense
Exploration expense was $5.7 million in the fourth quarter 2024, higher by $2.1 million or 58% than the prior year period due to increased exploration expenditures at Chibougamau District and Côté Gold.
Exploration expense was $21.7 million in the year, lower by $4.6 million or 17% than the prior year period due to the decrease in exploration programs resulting from the sale of certain exploration assets.
General and administrative expense
General and administrative expense was $15.3 million in the fourth quarter 2024, higher by $3.9 million or 34% than the prior year period, primarily due to $4.9 million in restructuring costs incurred in the period, partially offset by lower salaries and accruals.
General and administrative expense was $48.9 million in the year, lower by $1.9 million or 4% than the prior year period, primarily due to reduced personnel costs and related costs in the corporate office of $3.6 million, lower consulting costs of $0.6 million, lower share-based payments of $0.6 million, offset by higher restructuring costs of $2.8 million.
Income tax expense
The Company is subject to tax in various jurisdictions, including Burkina Faso and Canada. There are a number of factors that can significantly impact the Company’s effective tax rate, including the geographic distribution of income, varying rates in different jurisdictions, the non-recognition of tax assets, mining allowances, foreign currency exchange rate movements, changes in tax laws and the impact of specific transactions and assessments. Due to the number of factors that can potentially impact the effective tax rate and the sensitivity of the tax provision to these factors, it is expected that the Company’s effective tax rate will fluctuate from one period to the next.
Income tax expense was $34.3 million in the fourth quarter 2024, higher by $33.2 million or 3018% than the prior year period. It is comprised of a current income tax expense of $25.1 million and a deferred income tax expense of $9.2 million, higher than the prior year period for current income tax expense by $10.7 million or 74% and higher for deferred income tax expense by $22.5 million or 169%, respectively. The current income tax expense was higher primarily due to higher income in Essakane. The deferred income tax expense was higher primarily due to (i) the weakening of the XOF currency, also referred to as the West African CFA franc for Essakane’s local accounting purposes and (ii) the recognition of deferred taxes related to Côté Gold mining tax.
Income tax expense was $129.4 million in the year, higher by $98.7 million or 321% than the prior year period. It is comprised of a current income tax expense of $116.4 million and a deferred income tax expense of $13.0 million, higher than the prior year period for current income tax expense by $64.5 million or 124% and higher for deferred income tax expense by $34.2 million or 161%, respectively. The current income tax expense was higher primarily due to higher income in Essakane and higher amount of withholding taxes related to intercompany dividends. The deferred income tax expense was higher primarily due to (i) the weakening of the XOF currency for Essakane’s local accounting purposes and (ii) the recognition of deferred taxes related to Côté Gold mining tax.
The combined current and deferred income tax expense of $129.4 million in respect of $977.2 million of earnings before taxes reflects a $133.6 million adjustment to the balance of unrecognized deferred tax assets largely related to the Westwood impairment reversal and the use of prior period non-capital losses.
Westwood Impairment Reversal
During the year, the Company assessed that the increase in the long-term consensus price of gold was an indicator of impairment reversal for the Westwood CGU, which includes the Doyon closed mine. As a result, a $455.5 million reversal of previously recorded impairments was recognized as the recoverable amount of Westwood exceeded the carrying value.
DISCLOSURE CONTROLS AND PROCEDURES AND INTERNAL CONTROL OVER FINANCIAL REPORTING
Disclosure Controls and Procedures
The Company’s disclosure controls and procedures are designed to provide reasonable assurance that all relevant information is communicated to senior management to allow timely decisions regarding required disclosure. An evaluation of the effectiveness of the Company’s disclosure controls and procedures, as defined under the rules of the Canadian Securities Administration, was conducted as at December 31, 2024, under the supervision of the Company’s Disclosure Committee and with the participation of management. Based on the results of that evaluation, the CEO and the CFO concluded that the Company’s disclosure controls and procedures were effective as at December 31, 2024, providing reasonable assurance that the information required to be
| | | | | |
IAMGOLD CORPORATION Annual Management's Discussion and Analysis - December 31, 2024 | 30 |
disclosed in the Company’s annual filings, interim filings or other reports filed or submitted by it under securities legislation is recorded, processed, summarized and reported in accordance with securities legislation.
Internal Control over Financial Reporting
Internal control over financial reporting is designed to provide reasonable assurance regarding the reliability of the Company’s financial reporting and the preparation of consolidated financial statements in compliance with IFRS as issued by the International Accounting Standards Board (“IASB”). The Company’s internal control over financial reporting includes policies and procedures that:
•pertain to the maintenance of records that accurately and fairly reflect the transactions of the Company;
•provide reasonable assurance that transactions are recorded as necessary to permit the preparation of consolidated financial statements in accordance with IFRS as issued by the IASB;
•ensure the Company’s receipts and expenditures are made only in accordance with authorization of management and the Company’s directors; and
•provide reasonable assurance regarding the prevention or timely detection of unauthorized transactions that could have a material effect on the consolidated financial statements.
An evaluation of the effectiveness of the Company’s internal control over financial reporting, including an evaluation of material changes that may have materially affected or are reasonably likely to have materially affected the internal control over financial reporting based on the criteria established in Internal Control – Integrated Framework (2013) issued by the Committee of Sponsoring Organizations of the Treadway Commission, was conducted as of December 31, 2024 by the Company’s management, including the CEO and the CFO. Based on this evaluation, management, including the CEO and the CFO, has concluded that the Company’s internal control over financial reporting was effective as of December 31, 2024.
There have been no material changes in the Company's internal control over financial reporting or in other factors that could affect internal controls during the fourth quarter 2024 and their design remains effective.
Limitations of Control and Procedures
The Company’s management, including the CEO and the CFO, believe that any disclosure controls and procedures and internal control over financial reporting, no matter how well designed, can have inherent limitations. Therefore, even those systems determined to be effective can provide only reasonable assurance that the objectives of the control system are met.
CRITICAL JUDGMENTS, ESTIMATES AND ASSUMPTIONS
The Company’s management makes judgments in its process of applying the Company’s accounting policies in the preparation of its consolidated financial statements. In addition, the preparation of financial data requires that the Company’s management make assumptions on, and estimates of effects of, uncertain future events on the carrying amounts of the Company’s assets and liabilities at the end of the reporting period and the reported amounts of revenues and expenses during the reporting period. Actual results may differ materially from those estimates as the estimation process is inherently uncertain. Estimates are reviewed on an ongoing basis based on historical experience and other factors that are considered to be relevant under the circumstances. Revisions to estimates and the resulting effects on the carrying amounts of the Company’s assets and liabilities are accounted for prospectively. The critical judgments, estimates and assumptions applied in the preparation of the Company's consolidated financial statements are reflected in note 3 of the Company's audited annual consolidated financial statements for the year ended December 31, 2024.
Qualified Person and Technical Information
The technical and scientific information relating to exploration activities disclosed in this document was prepared under the supervision of and verified and reviewed by Marie-France Bugnon, P.Geo., Vice President, Exploration, IAMGOLD. Ms. Bugnon is a “qualified person” as defined by NI 43-101.
Data verification involves data input and review by senior project geologists at site, scheduled weekly and monthly reporting to senior exploration management and the completion of project site visits by senior exploration management to review the status of ongoing project activities and data underlying reported results. All drilling results for exploration projects or supporting resource and reserve estimates referenced in this MD&A have been previously reported in news release disclosures either by the Company or the project operator as the case may be (see referenced news releases) and have been prepared in accordance with NI 43-101. The sampling and assay data from drilling programs are monitored through the implementation of a quality assurance – quality control (QA-QC) program designed to follow industry best practice. Drill core (HQ and NQ size) samples are selected by the project geologists and sawn in half with a diamond saw at the project site. Half of the core is typically retained at the site for reference purposes. Generally, sample intervals are 1.0 to 1.5 metres in length and reverse circulation holes are sampled at 1.0 metre intervals at the drill rig. Samples are prepared and analyzed at site for the Company's producing mines and at accredited regional laboratories for the Company's exploration projects, using analysis techniques such as standard fire assay with a 50 gram charge; fire assay with gravimetric finish, or LeachWELL rapid cyanide leach with fire assay with a 50 gram charge.
| | | | | |
IAMGOLD CORPORATION Annual Management's Discussion and Analysis - December 31, 2024 | 31 |
CAUTIONARY NOTE TO U.S. INVESTORS REGARDING DISCLOSURE OF MINERAL RESERVE AND MINERAL RESOURCE ESTIMATES
The mineral resource and reserve estimates contained in this report have been prepared in accordance with NI 43-101 and the Canadian Institute of Mining, Metallurgy and Petroleum (“CIM”) – CIM Definition Standards on Mineral Resources and Mineral Reserves, adopted by the CIM Council, as amended (the “CIM Standards”). These standards are similar to those used by the United States Securities and Exchange Commission (the “SEC”) Industry Guide No. 7, as interpreted by SEC staff (“Industry Guide 7”). However, the definitions in NI 43-101 and the CIM Standards differ in certain respects from those under Industry Guide 7. Accordingly, mineral resource and reserve information contained in this report may not be comparable to similar information disclosed by United States companies. Under Industry Guide 7, mineralization may not be classified as a "reserve" unless the determination has been made that the mineralization could be economically and legally produced or extracted at the time the reserve determination is made.
As a result of the adoption of amendments to the SEC’s disclosure rules (the “SEC Modernization Rules”), which more closely align its disclosure requirements and policies for mining properties with current industry and global regulatory practices and standards, including NI 43-101 and the CIM Standards, and which became effective on February 25, 2019, the SEC now recognizes estimates of "measured mineral resources", "indicated mineral resources" and "inferred mineral resources." In addition, the SEC has amended definitions of "proven mineral reserves" and "probable mineral reserves" in its amended rules, with definitions that are substantially similar to those used in NI 43-101 and the CIM Standards. Issuers must begin to comply with the SEC Modernization Rules in their first fiscal year beginning on or after January 1, 2021, though Canadian issuers that report in the United States using the Multijurisdictional Disclosure System ("MJDS") may still use NI 43-101 rather than the SEC Modernization Rules when using the SEC's MJDS registration statement and annual report forms.
United States investors are cautioned that while the SEC now recognizes "measured mineral resources", "indicated mineral resources" and "inferred mineral resources" under the SEC Modernization Rules, investors should not assume that any part or all of the mineral deposits in these categories will ever be converted into a higher category of mineral resources or into mineral reserves. These terms have a great amount of uncertainty as to their economic and legal feasibility. Under Canadian regulations, estimates of inferred mineral resources may not form the basis of feasibility or pre-feasibility studies, except in limited circumstances.
Investors are cautioned not to assume that any "measured mineral resources", "indicated mineral resources", or "inferred mineral resources" that the Company reports in this report are or will be economically or legally mineable. Further, "inferred mineral resources" have a great amount of uncertainty as to their existence and as to their economic and legal feasibility. It cannot be assumed that any part or all of an inferred mineral resource will ever be upgraded to a higher category.
The mineral resource estimates contained in this MD&A have been prepared in accordance with NI 43-101 and Joint Ore Reserves Committee.
Lisa Ragsdale, P.Geo (Director, Mining Geology, IAMGOLD Corporation), is the QP responsible for the review and approval of all mineral resource estimates contained herein, as at December 31, 2024. Guy Bourque, Eng. (Director, Mining, IAMGOLD Corporation), is the QP responsible for the review and approval of all mineral reserve estimates contained herein, as at December 31, 2024.
The technical information has been included herein with the consent and prior review of the above noted QPs, who have verified the data disclosed, and data underlying the information or opinions contained herein.
NEW ACCOUNTING STANDARDS
For a discussion of new accounting standards adopted and new accounting standards issued but not yet effective that may impact the Company, refer to note 3 of the Company’s consolidated financial statements.
RISKS AND UNCERTAINTIES
The Company is subject to various business, operational, geopolitical, security, market and financial risks that could materially adversely affect the Company’s future business, operations and financial condition and could cause such future business, operational and financial condition to differ materially from the forward-looking statements and information contained in this MD&A and as described under the heading “Cautionary Statement On Forward-Looking Information”. Readers of this MD&A should consider the information included or incorporated by reference in this document and the Company’s consolidated financial statements and related notes for the year ended December 31, 2024.
The inherently volatile nature of the Company’s activities, the international geographies and emerging, undeveloped economies in which it operates mean that the Company’s business, operations and financial condition are generally exposed to significant risk factors, known and unknown, stable and unstable, many of which are beyond its control. Managing these risks is a key component of the Company’s business strategy and is supported by a risk management culture and an enterprise risk management (“ERM”) system. The Company’s view of risks is not static. An important component of the ERM approach is to identify evolving or emerging key risks, manage those risks and incorporate them into existing ERM assessment, measurement, monitoring and reporting processes.
These practices are designed to ensure management is forward-looking in its assessment of risks. Identification of key risks occurs in the course of business activities, while pursuing approved strategies and as part of the execution of risk oversight
| | | | | |
IAMGOLD CORPORATION Annual Management's Discussion and Analysis - December 31, 2024 | 32 |
responsibilities at the Management and Board of Directors levels.
Risks and uncertainties to the Company’s business, operations and financial condition that were identified by management as new or elevated in the fourth quarter 2024 are described above under “Market Risk” and below. Readers are cautioned that no ERM framework or system, including that employed by the Company, can ensure that all risks to the Company, at any point in time, are accurately identified, assessed as to significance or impact, managed or effectively controlled or mitigated. As such, there may be additional new or elevated risks to the Company in the fourth quarter 2024 that are not described above under “Market Risk” or below.
For a comprehensive discussion of the risk factors that may affect the Company, its business operations and financial performance, refer to the risk disclosure contained in the Company’s latest annual information form dated March 14, 2024 (“AIF”) and supplemented by the consolidated financial statements and the MD&A for the quarters ended March 31, 2024, June 30, 2024 and September 30, 2024, as filed with Canadian securities regulatory authorities at www.sedarplus.ca and filed under Form 40-F with the United States Securities and Exchange Commission at www.sec.gov, which is hereby incorporated by reference herein.
Political and Security Risk
The political and security environments in Burkina Faso and its neighboring countries is distressed and volatility remains elevated, including in the Sahel region where the Company’s Essakane mine is located. Burkina Faso and other neighboring countries in the region experienced military coups in the past couple of years. Stability in the West African region, generally, has been upended by military coups and led to near-total suspension of military assistance from France and the U.S. and exclusion of military governments in joint military task force with other West African countries formed to prevent militant attacks and threats from further spreading in the rest of the region. In September 2023, a regional alliance between Burkina Faso, Mali and Niger was announced, but the potential impact on militant activity remains uncertain. Militant attacks on and threats to supply chains and transit routes continue to increase economic challenges for the country. The security situation in Burkina Faso and its neighboring countries continues to apply pressures to supply chains, although with a reduced impact and no major business interruption in 2024. The Company continues to adjust its operating activities in response to the continued volatile security situation, as the safety and security of the Company’s personnel and physical assets are of paramount concern. There is an elevated risk to the Company’s operations, assets, financial condition and personnel in Burkina Faso for the foreseeable future. Supply chains and transit routes in the region with neighboring countries remain particularly exposed to elevated risks of militant attacks.
The situation has placed the Government of Burkina Faso under significant financial constraint due to the high cost of funding its initiatives to defend itself against the militant attacks. The Government has not fully paid VAT refunds directly to the Company, and the Company has been selling its VAT receivables to local financial institutions, however, the Company has not been able to sell all of its VAT receivables and the inability of the Company to recover the VAT balances either through receiving VAT refunds or selling the VAT to third parties could place a significant constraint on the free cash flow produced and would limit the amount of dividends that Essakane can pay.
Given Essakane's significant contribution to the financial condition of the Company, any terrorist attack, change in legislation or ownership, problematic or adverse condition affecting mining, processing, infrastructure, equipment, labour, the supply chain, taxation, legal or reputational status could have a material adverse effect on the Company’s business, operations, liquidity and capital resources. The Company’s operations at Essakane have accounted for a significant portion of the Company’s positive mine site free cash flow year in 2024.
Liquidity and Capital Resources
The expected cash flow generated from operations and undrawn amounts under the Credit Facility are intended to be used to satisfy the Company’s currently estimated or forecasted funding requirements. Any failure to generate the cash expected from its operations, any significant disruptions in the ramp-up of Côté Gold, any unexpected limitation on the ability to access, or unavailability of, funds currently available under the Company’s Credit Facility, any unexpected disruption of cash repatriation initiatives or the ability to transfer cash or other assets between the Company and its subsidiaries, requests by local governments in the jurisdictions of the Company’s activities to sell gold to them at unfavourable terms and not to the Company’s usual counterparties in the ordinary course on commercial terms and delays in receiving VAT refunds or the inability of the Company to sell the VAT receivables to local financial institutions in Burkina Faso, could restrict the Company’s ability to fund its operations effectively, and the Company may be required to use other unanticipated sources of funds, on unattractive terms, if available, for these objectives.
The availability of new additional capital to the Company and the cost of capital are subject to general economic conditions and lender and investor interest in the Company and its projects based on the level of confidence in the Company to meet its strategic objectives. The Credit Facility has net debt to EBITDA and interest coverage financial ratio covenants that govern the amount that can be drawn under the Credit Facility. EBITDA is impacted by the performance of the Company's operations and market conditions.
The Company, in its various initiatives to increase liquidity and ensure funding to complete construction and ramp-up of Côté Gold, has incurred significant debt. The cost of the Company’s debt is linked to market interest rates and further increases in interest rates or adverse changes in the expected performance of the Company’s operations or market conditions that adversely impacts the generation or amount of cash flow or earnings from its operations could impact the ability of the Company to utilize the Credit Facility due to the impact on the foregoing financial maintenance covenants, which would reduce the available liquidity to the Company and could have materially adverse consequences to the Company. If there were a default or breach under the
| | | | | |
IAMGOLD CORPORATION Annual Management's Discussion and Analysis - December 31, 2024 | 33 |
Credit Facility because of the failure to meet its financial or other covenants, not only could the Credit Facility cease to be available to meet the liquidity needs of the Company, but such default could trigger cross-defaults under the terms of the Company’s other sources of debt and such defaults could have materially adverse consequences to the Company.
Ramp-Up of Côté Gold
Current estimate, forecast or anticipated schedule and costs to ramp-up Côté Gold project to bring it to nameplate production can be impacted by a wide variety of known and unknown, uncontrollable, factors such as unexpected production problems, ore and waste sampling, equipment unavailability, inflationary pressures, supply chain disturbances, extreme weather, contractual, labour or community disputes, the unavailability of required skilled labour and permitting delays. The expenditures and time period required to complete the ramp-up and stabilize the Côté Gold production are considerable and equipment not functioning consistently as designed or expected, changes in costs due to inflation, labour availability and productivity, the availability of equipment and materials, supply chain and logistics challenges, adverse market conditions or other events that negatively impact commissioning schedules can materially negatively affect the estimated timing of nameplate production, results of operations and the liquidity of the Company. Actual costs and economic returns from the Côté Gold Mine may differ materially from the Company’s estimates or projections and variances from expectations could have a material adverse effect on the Company’s business, financial conditions and results of operations, and liquidity.
Changes in Laws and Regulations
The Burkina Faso Government announced in March 2024 a number of upcoming changes to the Mining Code, including: (i) the enforcement of the preferential dividend that has been in the Mining Code since 2015, but never implemented; (ii) an increased interest of the State in the mining companies’ share capital, from 10% to 15%; and (iii) the opening of the mining companies’ share capital to local investors. The new Mining Code was adopted by the Government of Burkina Faso in July 2024. The new Mining Code provides that existing mining permits and the associated mining conventions remain in force for their current term (not to exceed 5 years) and continue to be governed by the laws and regulations (including the then version of the Mining Code) which were in force at the time of their issuance or entry.
Given Essakane's significant contribution to the financial condition of the Company, any additional changes in laws and regulations or in the interpretation of laws and regulations by the courts or the authorities could have a material adverse impact on the Company’s business, financial condition, and results of operations.
Equipment Malfunctions
The Company’s mines use expensive, large mining and processing equipment that requires a long time to procure, build and install. The Company’s various operations may encounter delays in or losses of production due to the delay in the delivery of equipment, key equipment or component malfunctions or breakdowns, damage to equipment through accident or misuse, including potential complete write-off of damaged units, or delay in the delivery or the lack of availability of spare parts, or lack of qualified or shortage of personnel at the regions where operations are located, which may impede maintenance activities on equipment and availability of equipment. In addition, equipment may be subject to aging if not replaced, or through inappropriate use or misuse, or improper storage conditions may become obsolete. These factors could adversely impact the Company’s operations, profitability and financial results.
Fluctuations in the Price of Gold
The Company’s revenues depend in part on the market gold prices for mine production from the Company’s producing properties. Gold prices can fluctuate widely over the course of a year and are affected by numerous factors beyond the Company’s control including: central banks’ lending rates; sales and purchases of gold; expectations of inflation; the level of demand for gold as an investment; speculative trading; the relative exchange rate of the US dollar with other major currencies; political and economic conditions and uncertainties. The aggregate effect of these factors is impossible to predict with accuracy. There can be no assurance that gold prices will remain at current levels or that such prices will improve.
A significant decline in gold prices may materially and adversely affect the Company’s financial performance, its ability to service or repay its debt, or results of operations and may result in adjustments to Mineral Reserve estimates and LOM plans. As a result, the Company may be required to materially write down certain of its investments in mining properties or incur further debt. Any of these factors could result in a material adverse effect on the Company’s results of operations, cash flows and financial position. Further, if revenue from gold sales declines, the Company may experience liquidity difficulties.
Tariffs and imposition of other restrictions on trade
In January 2025, the United States announced a 25% tariff on imports from countries including Canada. In response, the Canadian Government announced retaliatory tariffs on imports from the United States. The imposition of these broad tariffs was delayed for 30 days. In February 2025, the United States subsequently announced a 25% tariff on steel and aluminum currently scheduled to take effect on March 12, 2025. The Company is reviewing its exposure to the potential tariffs and alternatives to inputs sourced from suppliers that may be subject to the tariffs, if implemented. There is uncertainty as to whether additional tariffs or retaliatory tariffs will be implemented, the quantum of such tariffs, the goods on which they may be applied and the ultimate effect on the Company's supply chain and costs. Other countries may also adopt other protectionist measures including tariffs, trade barriers and other protectionist or retaliatory measures that could limit the Company’s ability to procure goods and services either in response to the US Government’s imposition of tariffs or otherwise. Such tariffs or retaliatory actions taken by governments could adversely impact the Company’s business, financial condition and profitability.
| | | | | |
IAMGOLD CORPORATION Annual Management's Discussion and Analysis - December 31, 2024 | 34 |
NON-GAAP1 FINANCIAL MEASURES
The Company has included certain non-GAAP financial measures to supplement its consolidated financial statements, which are presented in accordance with IFRS, including the following:
•Average realized gold price per ounce sold
•Underground mining cost per ore tonne mined, open pit net mining cost per operating tonne mined, milling cost per tonne milled, and G&A cost per tonne milled
•Cash costs, cash costs per ounce sold, all in sustaining cost and all in sustaining cost per ounce sold
•Net earnings (loss) attributable to shareholders and adjusted net earnings (loss) attributable to shareholders
•Net cash from operating activities, before movements in working capital and non-current ore stockpiles
•Earnings before interest, income taxes, depreciation and amortization (“EBITDA”)
•Mine-site free cash flow
•Sustaining and expansion capital expenditures
•Project expenditures
The Company believes that, in addition to conventional financial measures prepared in accordance with IFRS, these non-GAAP financial measures will provide investors with an improved ability to evaluate the underlying performance of the Company. Non-GAAP financial measures do not have any standardized meaning prescribed by IFRS, may not be comparable to similar measures presented by other companies and should not be considered in isolation or as a substitute for measures of performance prepared in accordance with IFRS.
Average Realized Gold Price per Ounce Sold
Average realized gold price per ounce sold is intended to enable management to understand the average realized price of gold sold in each reporting period after removing the impact of non-gold revenues and by-product credits, which, in the Company's case, are not significant and to enable investors to understand the Company’s financial performance based on the average realized proceeds of selling gold production in the reporting period.
| | | | | | | | | | | | | | | | | |
| | | |
| | | | | |
| ($ millions, continuing operations, except where noted) | Q4 2024 | Q4 2023 | 2024 | 2023 | 2022 |
| | | | | |
| Revenues | $ | 469.9 | | $ | 297.6 | | $ | 1,633.0 | | $ | 987.1 | | $ | 958.8 | |
| | | | | |
| | | | | |
| By-product credits and other revenues | (1.6) | | (1.3) | | (4.0) | | (2.6) | | (2.9) | |
| Gold revenues | $ | 468.3 | | $ | 296.3 | | $ | 1,629.0 | | $ | 984.5 | | $ | 955.9 | |
| Sales (000s oz) | 185 | | 147 | | 699 | | 503 | | 555 | |
Average realized gold price per ounce1,2,3 ($/oz) | $ | 2,525 | | $ | 2,005 | | $ | 2,330 | | $ | 1,955 | | $ | 1,721 | |
1.Average realized gold price per ounce sold may not be calculated based on amounts presented in this table due to rounding.
2.Average realized gold price per ounce sold is calculated based on sales from the Company's Côté Gold mine at 60.3% through November 2024 and 70% thereafter, and Westwood and Essakane mines at 100%.
3.Average realized gold price per ounce sold in the fourth quarter 2024 includes 37,500 ounces at $2,031 per ounce (137,500 ounces at $2,012 per ounce for the year) as delivered into the 2022 Prepay Arrangement (2023 - nil, 2022 - 150,000 ounces at $1,500 per ounce as delivered in accordance with the 2019 Prepay Arrangement).
Underground Mining Cost per Ore Tonne Mined, Open Pit Net Mining Cost per Operating Tonne Mined, Milling Cost per Tonne Milled, and G&A Cost per Tonne Milled
Underground mining cost per ore tonne mined and open pit net mining cost per operating tonne mined are defined as:
•Mining costs (as included in production costs), that exclude capitalized waste stripping for open pit mines, less changes in stockpile balances and non-production costs as these costs are not directly related to tonnes mined, divided by
•the sum of the tonnage of ore and operating waste mined.
Milling cost per tonne milled and general and administrative cost per tonne milled are defined as:
•Mill and general and administrative costs (as included in production costs), excluding selling costs and non-production costs as these costs are not directly related to tonnes milled, divided by
•the tonnage of ore milled.
IAMGOLD believes these non-GAAP financial performance measures provide further transparency and assist analysts, investors and other stakeholders of the Company in assessing the performance of mining operations by eliminating the impact of varying production levels. Management is aware, and investors should note, that these per tonne measures of performance can be affected by fluctuations in mining and/or processing levels. This inherent limitation may be partially mitigated by using this measure in conjunction with production costs and other data prepared in accordance with IFRS. These measures do not have standardized meanings under IFRS and may not be comparable to similar measures presented by other mining companies. They should not be considered in isolation or as a substitute for measures of performance prepared in accordance with IFRS.
___________________________
1.GAAP - Generally accepted accounting principle
| | | | | |
IAMGOLD CORPORATION Annual Management's Discussion and Analysis - December 31, 2024 | 35 |
Côté Gold (100% basis)
| | | | | | | | | | | |
| ($ millions, except where noted) | Q4 2024 | | 2024 | | |
| | | | | |
| | | | | |
| Production cost | $ | 83.7 | | | $ | 174.0 | | | |
| Adjust for: | | | | | |
| Increase/decrease in stockpiles | 12.9 | | | 61.8 | | | |
| Adj. operating cost | $ | 96.6 | | | $ | 235.8 | | | |
| Included in adjusted operating cost: | | | | | |
| Open pit net mining cost [A] | 35.2 | | | 107.3 | | | |
| Milling cost [B], net of capitalized operating cost | 42.8 | | | 85.7 | | | |
| G&A cost [C] | 17.8 | | | 42.0 | | | |
| Open pit ore tonnes mined (000s t) | 3,637 | | | 10,849 | | | |
| Open pit operating waste tonnes mined (000s t) | 4,765 | | | 16,666 | | | |
| Open pit ore and operating waste tonnes mined (000s t) [D] | 8,402 | | | 27,515 | | | |
| Ore milled (000s t) [E] | 2,433 | | | 4,948 | | | |
| Open pit net mining cost per operating tonne mined ($/tonne) [A/D] | $ | 4.19 | | | $ | 3.90 | | | |
Milling cost per tonne milled ($/tonne) [B/E] | $ | 17.59 | | | $ | 17.32 | | | |
| G&A cost per tonne milled ($/tonne) [C/E] | $ | 7.35 | | | $ | 8.49 | | | |
$/tonne may not re-calculate based on amounts presented in this table due to rounding.
Westwood
| | | | | | | | | | | | | | | | | |
| ($ millions, except where noted) | Q4 2024 | Q4 2023 | 2024 | 2023 | 2022 |
| | | | | |
| | | | | |
| Production cost | $ | 39.0 | | $ | 39.3 | | $ | 155.3 | | $ | 148.5 | | $ | 145.5 | |
| Adjust for: | | | | | |
| Increase/decrease in stockpiles | 1.4 | | (1.2) | | (0.1) | | 3.6 | | 2.7 | |
| Adj. operating cost | $ | 40.4 | | $ | 38.1 | | $ | 155.2 | | $ | 152.1 | | $ | 148.2 | |
| Consisting of: | | | | | |
| Underground mining cost [A] | 23.0 | | 19.2 | | 88.9 | | 78.9 | | 78.0 | |
| Open pit net mining cost [B] | 4.6 | | 8.4 | | 19.1 | | 26.9 | | 21.0 | |
| Milling cost [C] | 7.6 | | 5.6 | | 26.8 | | 24.4 | | 25.5 | |
| G&A cost [D] | 5.2 | | 4.9 | | 20.4 | | 21.9 | | 23.7 | |
| Underground ore tonnes mined (000s t) [E] | 98 | | 77 | | 354 | | 280 | | 241 | |
| Open pit ore tonnes mined (000s t) | 283 | | 162 | | 662 | | 742 | | 836 | |
| Open pit waste tonnes mined (000s t) | 389 | | 584 | | 1,522 | | 2,291 | | 1,878 | |
| Open pit ore and operating waste tonnes mined (000s t) [F] | 672 | | 746 | | 2,184 | | 3,033 | | 2,714 | |
| Ore milled (000s t) [G] | 267 | | 245 | | 1,107 | | 1,034 | | 1,118 | |
| Underground mining cost per ore tonne mined ($/tonne) [A/E] | $ | 233.72 | | $ | 251.85 | | $ | 250.86 | | $ | 281.76 | | $ | 322.78 | |
| Open pit net mining cost per operating tonne mined ($/tonne) [B/F] | $ | 6.88 | | $ | 11.25 | | $ | 8.75 | | $ | 8.86 | | $ | 7.74 | |
| Milling cost per tonne milled ($/tonne) [C/G] | $ | 28.55 | | $ | 22.66 | | $ | 24.25 | | $ | 23.56 | | $ | 22.81 | |
| G&A cost per tonne milled ($/tonne) [D/G] | $ | 19.70 | | $ | 20.20 | | $ | 18.44 | | $ | 21.30 | | $ | 21.22 | |
$/tonne may not re-calculate based on amounts presented in this table due to rounding.
| | | | | |
IAMGOLD CORPORATION Annual Management's Discussion and Analysis - December 31, 2024 | 36 |
Essakane
| | | | | | | | | | | | | | | | | |
| ($ millions, except where noted) | Q4 2024 | Q4 2023 | 2024 | 2023 | 2022 |
| | | | | |
| | | | | |
| Production cost | $ | 124.4 | | $ | 112.2 | | $ | 469.1 | | $ | 458.6 | | $ | 382.6 | |
| Adjust for: | | | | | |
| Increase/decrease in stockpiles | 0.4 | | 4.2 | | 0.2 | | 3.7 | | 6.1 | |
| Adj. operating cost | $ | 124.8 | | $ | 116.4 | | $ | 469.3 | | $ | 462.3 | | $ | 388.7 | |
| Consisting of: | | | | | |
| Open pit net mining cost [A] | 33.3 | | 33.5 | | 122.9 | | 146.2 | | 111.5 | |
| Milling cost [B] | 60.1 | | 57.9 | | 232.9 | | 213.7 | | 191.4 | |
| G&A cost [C] | 31.4 | | 25.0 | | 113.5 | | 102.4 | | 85.8 | |
| Open pit ore tonnes mined (000s t) | 2,170 | | 3,217 | | 9,714 | | 9,586 | | 12,585 | |
| Open pit operating waste tonnes mined (000s t) | 4,036 | | 3,353 | | 13,315 | | 19,530 | | 12,696 | |
| Open pit ore and operating waste tonnes mined (000s t) [D] | 6,206 | | 6,570 | | 23,029 | | 29,116 | | 25,281 | |
| Ore milled (000s t) [E] | 2,948 | | 3,116 | | 12,087 | | 11,283 | | 11,632 | |
| Open pit net mining cost per operating tonne mined ($/tonne) [A/D] | $ | 5.37 | | $ | 5.09 | | $ | 5.34 | | $ | 5.02 | | $ | 4.41 | |
| Milling cost per tonne milled ($/tonne) [B/E] | $ | 20.35 | | $ | 18.58 | | $ | 19.26 | | $ | 18.94 | | $ | 16.46 | |
| G&A cost per tonne milled ($/tonne) [C/E] | $ | 10.67 | | $ | 8.04 | | $ | 9.39 | | $ | 9.07 | | $ | 7.37 | |
$/tonne may not re-calculate based on amounts presented in this table due to rounding.
| | | | | |
IAMGOLD CORPORATION Annual Management's Discussion and Analysis - December 31, 2024 | 37 |
Cash Costs, Cash Costs per Ounce Sold, AISC and AISC per Ounce Sold
The Company reports cash costs, cash costs per ounce sold, AISC and AISC per ounce sold in order to provide investors with information about key measures used by management to monitor performance of mine sites in commercial production and its ability to generate positive cash flow.
Cash costs include mine site operating costs such as mining, processing, administration, royalties, production taxes and realized derivative gains or losses, exclusive of depreciation, reclamation, capital expenditures and exploration and evaluation costs. AISC include cost of sales exclusive of depreciation expense, sustaining capital expenditures, which are required to maintain existing operations, capitalized exploration, sustaining lease principal payments, environmental rehabilitation accretion and depreciation, by-product credits and corporate general and administrative costs. These costs are then divided by the Company’s attributable gold ounces sold by mine sites in commercial production in the period to arrive at the cash costs per ounce sold and the AISC per ounce sold.
The following tables provide a reconciliation of cash costs, AISC, cost of sales excluding depreciation per ounce sold, cash costs per ounce sold and AISC per ounce sold on an attributable basis to cost of sales as per the consolidated financial statements.
Three months ended December 31, 2024
| | | | | | | | | | | | | | | | | | | | |
| ($ millions, continuing operations, except where noted) | Côté Gold | Westwood | Essakane | Corporate | Total | Total excl. Côté |
Cost of sales1 | $ | 101.6 | | $ | 64.6 | | $ | 172.2 | | $ | 0.6 | | $ | 339.0 | | $ | 237.4 | |
Depreciation expense1 | (41.0) | | (22.3) | | (32.5) | | (0.6) | | (96.4) | | (55.6) | |
| Cost of sales, excluding depreciation expense | $ | 60.6 | | $ | 42.3 | | $ | 139.7 | | $ | — | | $ | 242.6 | | $ | 182.0 | |
| Adjust for: | | | | | | |
| Other mining costs | (0.2) | | (0.2) | | (0.2) | | — | | (0.6) | | (0.6) | |
| | | | | | |
| | | | | | |
Cost attributed to non-controlling interests2 | — | | — | | (14.0) | | — | | (14.0) | | (14.0) | |
| Cash costs – attributable | $ | 60.4 | | $ | 42.1 | | $ | 125.5 | | $ | — | | $ | 228.0 | | $ | 167.6 | |
| Adjust for: | | | | | | |
| | | | | | |
Sustaining capital expenditures3 | 32.4 | | 18.8 | | 54.2 | | 0.3 | | 105.7 | | 73.3 | |
Corporate general and administrative costs4 | — | | — | | — | | 9.7 | | 9.7 | | 9.7 | |
Other costs5 | 1.3 | | 1.1 | | 3.1 | | 0.1 | | 5.6 | | 4.3 | |
| | | | | | |
Cost attributable to non-controlling interests2 | — | | — | | (5.7) | | — | | (5.7) | | (5.7) | |
| | | | | | |
| AISC – attributable | $ | 94.1 | | $ | 62.0 | | $ | 177.1 | | $ | 10.1 | | $ | 343.3 | | $ | 249.2 | |
| Total gold sales (000 oz) – attributable | 56 | | 37 | | 84 | | — | | 177 | | 121 | |
| Total gold sales (000 oz) - attributable, with Côté Gold post-commercial production gold sales | 56 | | 37 | | 84 | | — | | 177 | | 121 | |
Cost of sales excluding depreciation6 ($/oz sold) - attributable | $ | 1,083 | | $ | 1,155 | | $ | 1,504 | | $ | — | | $ | 1,298 | | $ | 1,397 | |
Cash costs6 ($/oz sold) – attributable | $ | 1,080 | | $ | 1,148 | | $ | 1,501 | | $ | — | | $ | 1,294 | | $ | 1,393 | |
AISC6 all operations ($/oz sold) – attributable | $ | 1,685 | | $ | 1,688 | | $ | 2,118 | | $ | 57 | | $ | 1,949 | | $ | 2,071 | |
1.As per note 29 of the consolidated financial statements for cost of sales and depreciation expense.
2.Adjustments for the consolidation of Essakane (90%) to its attributable portion of cost of sales.
3.Sustaining capital expenditures are expenditures required to support current production levels at a mine site and excludes all expenditures at the Company’s development projects as well as certain expenditures at the Company’s operating sites that are deemed expansionary in nature which result in a material increase in annual or life of mine gold ounce production, net present value, or reserves. Sustaining capital expenditures are further described below.
4.Corporate general and administrative costs exclude depreciation expense and one-time material severance charges.
5.Other costs include sustaining lease principal payments and environmental rehabilitation accretion and depletion, partially offset by by-product credits.
6.Cost of sales excluding depreciation per ounce sold, cash costs per ounce sold and AISC per ounce sold may not be calculated based on amounts presented in this table due to rounding.
| | | | | |
IAMGOLD CORPORATION Annual Management's Discussion and Analysis - December 31, 2024 | 38 |
Three months ended December 31, 2023
| | | | | | | | | | | | | | |
| ($ millions, continuing operations, except where noted) | Westwood | Essakane | Corporate | Total |
Cost of sales1 | $ | 53.2 | | $ | 194.0 | | $ | 0.6 | | $ | 247.8 | |
Depreciation expense1 | (10.8) | | (59.7) | | (0.6) | | (71.1) | |
| Cost of sales, excluding depreciation expense | $ | 42.4 | | $ | 134.3 | | $ | — | | $ | 176.7 | |
| Adjust for: | | | | |
| Other mining costs | (0.5) | | (0.2) | | — | | (0.7) | |
| | | | |
| | | | |
Cost attributed to non-controlling interests2 | — | | (13.4) | | — | | (13.4) | |
| Cash costs – attributable | $ | 41.9 | | $ | 120.7 | | $ | — | | $ | 162.6 | |
| Adjust for: | | | | |
Sustaining capital expenditures3 | 17.1 | | 46.6 | | 0.2 | | 63.9 | |
Corporate general and administrative costs4 | — | | — | | 10.5 | | 10.5 | |
Other costs5 | 0.9 | | 2.9 | | 0.1 | | 3.9 | |
Cost attributable to non-controlling interests2 | — | | (5.0) | | — | | (5.0) | |
| AISC – attributable | $ | 59.9 | | $ | 165.2 | | $ | 10.8 | | $ | 235.9 | |
| Total gold sales (000 oz) – attributable | 29 | | 107 | | — | | 136 | |
Cost of sales excluding depreciation6 ($/oz sold) - attributable | $ | 1,446 | | $ | 1,134 | | $ | — | | $ | 1,201 | |
Cash costs6 ($/oz sold) – attributable | $ | 1,434 | | $ | 1,132 | | $ | — | | $ | 1,197 | |
AISC6 all operations ($/oz sold) – attributable | $ | 2,049 | | $ | 1,548 | | $ | 79 | | $ | 1,735 | |
1.As per note 29 of the consolidated financial statements for cost of sales and depreciation expense.
2.Adjustments for the consolidation of Essakane (90%) to its attributable portion of cost of sales.
3.Sustaining capital expenditures are expenditures required to support current production levels at a mine site and excludes all expenditures at the Company’s development projects as well as certain expenditures at the Company’s operating sites that are deemed expansionary in nature which result in a material increase in annual or life of mine gold ounce production, net present value, or reserves. Sustaining capital expenditures are further described below.
4.Corporate general and administrative costs exclude depreciation expense and one-time material severance charges.
5.Other costs include sustaining lease principal payments and environmental rehabilitation accretion and depletion, partially offset by by-product credits.
6.Cost of sales excluding depreciation per ounce sold, cash costs per ounce sold and AISC per ounce sold may not be calculated based on amounts presented in this table due to rounding.
| | | | | |
IAMGOLD CORPORATION Annual Management's Discussion and Analysis - December 31, 2024 | 39 |
Twelve months ended December 31, 2024
| | | | | | | | | | | | | | | | | | | | |
| ($ millions, continuing operations, except where noted) | Côté Gold | Westwood | Essakane | Corporate | Total | Total excl. Côté |
Cost of sales1 | $ | 171.7 | | $ | 211.2 | | $ | 699.1 | | $ | 1.1 | | $ | 1,083.1 | | $ | 911.4 | |
Depreciation expense1 | (56.7) | | (53.7) | | (162.3) | | (1.1) | | (273.8) | | (217.1) | |
| Cost of sales, excluding depreciation expense | $ | 115.0 | | $ | 157.5 | | $ | 536.8 | | $ | — | | $ | 809.3 | | $ | 694.3 | |
| Adjust for: | | | | | | |
| Other mining costs | (0.3) | | (1.3) | | (1.2) | | — | | (2.8) | | (2.5) | |
| | | | | | |
| | | | | | |
Cost attributed to non-controlling interests2 | — | | — | | (53.6) | | — | | (53.6) | | (53.6) | |
| Cash costs – attributable | $ | 114.7 | | $ | 156.2 | | $ | 482.0 | | $ | — | | $ | 752.9 | | $ | 638.2 | |
| Adjust for: | | | | | | |
| Exclusion of pre-production costs - Côté Gold | (22.5) | | — | | — | | — | | (22.5) | | — | |
Sustaining capital expenditures3 | 46.2 | | 66.7 | | 189.1 | | 1.2 | | 303.2 | | 257.0 | |
Corporate general and administrative costs4 | — | | — | | — | | 42.4 | | 42.4 | | 42.4 | |
Other costs5 | 1.5 | | 5.0 | | 13.0 | | 0.4 | | 19.9 | | 18.4 | |
| | | | | | |
Cost attributable to non-controlling interests2 | — | | — | | (20.2) | | — | | (20.2) | | (20.2) | |
| | | | | | |
| AISC – attributable | $ | 139.9 | | $ | 227.9 | | $ | 663.9 | | $ | 44.0 | | $ | 1,075.7 | | $ | 935.9 | |
| Total gold sales (000 oz) – attributable | 111 | | 134 | | 409 | | — | | 654 | | 543 | |
| Total gold sales (000 oz) - attributable, with Côté Gold post-commercial production gold sales | 84 | | 134 | | 409 | | — | | 627 | | 543 | |
Cost of sales excluding depreciation6 ($/oz sold) - attributable | $ | 1,035 | | $ | 1,177 | | $ | 1,182 | | $ | — | | $ | 1,156 | | $ | 1,181 | |
Cash costs6 ($/oz sold) – attributable | $ | 1,032 | | $ | 1,167 | | $ | 1,179 | | $ | — | | $ | 1,152 | | $ | 1,176 | |
AISC6 all operations ($/oz sold) – attributable | $ | 1,658 | | $ | 1,702 | | $ | 1,625 | | $ | 67 | | $ | 1,716 | | $ | 1,725 | |
1.As per note 29 of the consolidated financial statements for cost of sales and depreciation expense.
2.Adjustments for the consolidation of Essakane (90%) to its attributable portion of cost of sales.
3.Sustaining capital expenditures are expenditures required to support current production levels at a mine site and excludes all expenditures at the Company’s development projects as well as certain expenditures at the Company’s operating sites that are deemed expansionary in nature which result in a material increase in annual or life of mine gold ounce production, net present value, or reserves. Sustaining capital expenditures are further described below.
4.Corporate general and administrative costs exclude depreciation expense and one-time material severance charges.
5.Other costs include sustaining lease principal payments and environmental rehabilitation accretion and depletion, partially offset by by-product credits.
6.Cost of sales excluding depreciation per ounce sold, cash costs per ounce sold and AISC per ounce sold may not be calculated based on amounts presented in this table due to rounding.
| | | | | |
IAMGOLD CORPORATION Annual Management's Discussion and Analysis - December 31, 2024 | 40 |
Twelve months ended December 31, 2023
| | | | | | | | | | | | | | | | | | | | |
| ($ millions, continuing operations, except where noted) | Westwood | Essakane | Corporate | Total from continuing operations | Rosebel | Total |
Cost of sales1 | $ | 175.9 | | $ | 686.0 | | $ | 1.1 | | $ | 863.0 | | $ | 23.8 | | $ | 886.8 | |
Depreciation expense1 | (31.3) | | (183.6) | | (1.1) | | (216.0) | | — | | (216.0) | |
| Cost of sales, excluding depreciation expense | $ | 144.6 | | $ | 502.4 | | $ | — | | $ | 647.0 | | $ | 23.8 | | $ | 670.8 | |
| Adjust for: | | | | | | |
| Other mining costs | (0.9) | | (0.9) | | — | | (1.8) | | (0.2) | | (2.0) | |
| | | | | | |
| Abnormal portion of operating costs | — | | (13.5) | | — | | (13.5) | | — | | (13.5) | |
Cost attributed to non-controlling interests2 | — | | (48.8) | | — | | (48.8) | | (1.2) | | (50.0) | |
| Cash costs – attributable | $ | 143.7 | | $ | 439.2 | | $ | — | | $ | 582.9 | | $ | 22.4 | | $ | 605.3 | |
| Adjust for: | | | | | | |
Sustaining capital expenditures3 | 64.7 | | 130.8 | | 0.5 | | 196.0 | | 9.4 | | 205.4 | |
Corporate general and administrative costs4 | — | | — | | 45.7 | | 45.7 | | — | | 45.7 | |
Other costs5 | 3.3 | | 9.8 | | 0.5 | | 13.6 | | 0.7 | | 14.3 | |
Cost attributable to non-controlling interests2 | — | | (14.1) | | — | | (14.1) | | (0.5) | | (14.6) | |
| AISC – attributable | $ | 211.7 | | $ | 565.7 | | $ | 46.7 | | $ | 824.1 | | $ | 32.0 | | $ | 856.1 | |
| Total gold sales (000 oz) – attributable | 90 | | 372 | | — | | 462 | | 24 | | 486 | |
Cost of sales excluding depreciation6 ($/oz sold) - attributable | $ | 1,600 | | $ | 1,216 | | $ | — | | $ | 1,291 | | $ | 949 | | $ | 1,274 | |
Cash costs6 ($/oz sold) – attributable | $ | 1,591 | | $ | 1,181 | | $ | — | | $ | 1,261 | | $ | 949 | | $ | 1,246 | |
AISC6 all operations ($/oz sold) – attributable | $ | 2,344 | | $ | 1,521 | | $ | 101 | | $ | 1,783 | | $ | 1,358 | | $ | 1,762 | |
1.As per note 29 of the consolidated financial statements for cost of sales and depreciation expense.
2.Adjustments for the consolidation of Essakane (90%) to its attributable portion of cost of sales.
3.Sustaining capital expenditures are expenditures required to support current production levels at a mine site and excludes all expenditures at the Company’s development projects as well as certain expenditures at the Company’s operating sites that are deemed expansionary in nature which result in a material increase in annual or life of mine gold ounce production, net present value, or reserves. Sustaining capital expenditures are further described below.
4.Corporate general and administrative costs exclude depreciation expense and one-time material severance charges.
5.Other costs include sustaining lease principal payments and environmental rehabilitation accretion and depletion, partially offset by by-product credits.
6.Cost of sales excluding depreciation per ounce sold, cash costs per ounce sold and AISC per ounce sold may not be calculated based on amounts presented in this table due to rounding.
| | | | | |
IAMGOLD CORPORATION Annual Management's Discussion and Analysis - December 31, 2024 | 41 |
Twelve months ended December 31, 2022
| | | | | | | | | | | | | | | | | | | | |
| ($ millions, continuing operations, except where noted) | Westwood | Essakane | Corporate | Total from continuing operations | Rosebel | Total |
Cost of sales1 | $ | 159.1 | | $ | 651.4 | | $ | 0.4 | | $ | 810.9 | | $ | 330.7 | | $ | 1,141.6 | |
Depreciation expense1 | (19.9) | | (220.2) | | (0.4) | | (240.5) | | (43.9) | | (284.4) | |
| Cost of sales, excluding depreciation expense | $ | 139.2 | | $ | 431.2 | | $ | — | | $ | 570.4 | | $ | 286.8 | | $ | 857.2 | |
| Adjust for: | | | | | | |
| Other mining costs | (1.7) | | (1.1) | | — | | (2.8) | | (0.4) | | (3.2) | |
| | | | | | |
| Stockpiles and finished good adjustment | — | | 9.5 | | — | | 9.5 | | (5.8) | | 3.7 | |
Cost attributed to non-controlling interests2 | — | | (44.0) | | — | | (44.0) | | (14.0) | | (58.0) | |
| Cash costs – attributable | $ | 137.5 | | $ | 395.6 | | $ | — | | $ | 533.1 | | $ | 266.6 | | $ | 799.7 | |
| Adjust for: | | | | | | |
Sustaining capital expenditures3 | 30.3 | | 158.8 | | 1.3 | | 190.4 | | 105.2 | | 295.6 | |
Corporate general and administrative costs4 | — | | — | | 48.3 | | 48.3 | | — | | 48.3 | |
Other costs5 | 2.9 | | 4.9 | | 0.5 | | 8.3 | | 10.3 | | 18.6 | |
Cost attributable to non-controlling interests2 | — | | (16.3) | | — | | (16.3) | | (5.8) | | (22.1) | |
| AISC – attributable | $ | 170.7 | | $ | 543.0 | | $ | 50.1 | | $ | 763.8 | | $ | 376.3 | | $ | 1,140.1 | |
| Total gold sales (000 oz) – attributable | 66 | | 440 | | — | | 506 | | 215 | | 721 | |
Cost of sales excluding depreciation6 ($/oz sold) - attributable | $ | 2,093 | | $ | 882 | | $ | — | | $ | 1,041 | | $ | 1,269 | | $ | 1,109 | |
Cash costs6 ($/oz sold) – attributable | $ | 2,068 | | $ | 899 | | $ | — | | $ | 1,052 | | $ | 1,243 | | $ | 1,109 | |
AISC6 all operations ($/oz sold) – attributable | $ | 2,568 | | $ | 1,234 | | $ | 99 | | $ | 1,508 | | $ | 1,753 | | $ | 1,581 | |
1.As per note 29 of the consolidated financial statements for cost of sales and depreciation expense.
2.Adjustments for the consolidation of Essakane (90%) to its attributable portion of cost of sales.
3.Sustaining capital expenditures are expenditures required to support current production levels at a mine site and excludes all expenditures at the Company’s development projects as well as certain expenditures at the Company’s operating sites that are deemed expansionary in nature which result in a material increase in annual or life of mine gold ounce production, net present value, or reserves. Sustaining capital expenditures are further described below.
4.Corporate general and administrative costs exclude depreciation expense and one-time material severance charges.
5.Other costs include sustaining lease principal payments and environmental rehabilitation accretion and depletion, partially offset by by-product credits.
6.Cost of sales excluding depreciation per ounce sold, cash costs per ounce sold and AISC per ounce sold may not be calculated based on amounts presented in this table due to rounding.
| | | | | |
IAMGOLD CORPORATION Annual Management's Discussion and Analysis - December 31, 2024 | 42 |
Sustaining and Expansion Capital Expenditures
Sustaining capital expenditures are expenditures required to support current production levels at a mine site and exclude all expenditures at the Company’s development projects as well as certain expenditures at the Company’s operating sites that are deemed expansionary in nature which result in a material increase in annual or life of mine gold ounce production, net present value, or reserves. The distinctions between sustaining and expansion capital used by the Company align with the guidelines set out by the World Gold Council. Expansion capital is capital expenditures incurred at new projects and capital expenditures related to major projects or expansion at existing operations where these projects will materially benefit the operations. This non-GAAP financial measure provides investors with transparency regarding the capital expenditures required to support the ongoing operations at its mines, relative to its total capital expenditures.
Reconciliation of incurred capital expenditure per the segmented note in the financial statements to incurred sustaining and expansion capital for the three months ended December 31, 2024, and December 31, 2023:
| | | | | | | | | | | | | | | | | | | | | |
| | | | | | |
| | | | | | | |
| ($ millions, except where noted) | Sustaining | Expansion | Q4 2024 | Sustaining | Expansion | Q4 2023 | |
| | | | | | | |
| | | | | | | |
| Capital expenditures for property, plant and equipment | $ | 96.2 | | $ | 7.7 | | $ | 103.9 | | $ | 68.6 | | $ | 194.0 | | $ | 262.6 | | |
| Less: Côté Gold (9.7% share) | (2.6) | | (0.3) | | (2.9) | | — | | (27.9) | | (27.9) | | |
| Subtotal | $ | 93.6 | | $ | 7.4 | | $ | 101.0 | | $ | 68.6 | | $ | 166.1 | | $ | 234.7 | | |
| Côté Gold (IMG basis) | 25.6 | | 5.4 | | 31.0 | | — | | 165.4 | | 165.4 | | |
| Westwood | 18.5 | | (0.1) | | 18.4 | | 16.8 | | 0.4 | | 17.2 | | |
| Essakane | 49.0 | | 2.1 | | 51.1 | | 51.7 | | 0.3 | | 52.0 | | |
| Corporate | 0.5 | | — | | 0.5 | | 0.1 | | — | | 0.1 | | |
Reconciliation of capital expenditure per cash flow statement in the financial statements to cash payments for sustaining and expansion capital for the three months ended December 31, 2024, and December 31, 2023:
| | | | | | | | | | | | | | | | | | | | | |
| | | | | | |
| | | | | | | |
| ($ millions, except where noted) | Sustaining | Expansion | Q4 2024 | Sustaining | Expansion | Q4 2023 | |
| | | | | | | |
| | | | | | | |
| Capital expenditures for property, plant and equipment | $ | 96.2 | | $ | 7.7 | | $ | 103.8 | | $ | 68.6 | | $ | 194.0 | | $ | 262.6 | | |
| Working capital adjustments | 13.7 | | 2.8 | | 16.5 | | (4.7) | | (6.6) | | (11.3) | | |
| Capital expenditures per statement of cash flows | 109.9 | | 10.5 | | 120.3 | | 63.9 | | 187.4 | | 251.3 | | |
| Less: Côté Gold (9.7% share) | (3.3) | | (0.7) | | (4.0) | | — | | (27.9) | | (27.9) | | |
| Subtotal | $ | 106.6 | | $ | 9.8 | | $ | 116.4 | | $ | 63.9 | | $ | 159.5 | | $ | 223.4 | | |
| Côté Gold (IMG basis) | 33.3 | | 7.8 | | 41.1 | | — | | 158.8 | | 158.8 | | |
| Westwood | 18.8 | | (0.1) | | 18.7 | | 17.1 | | 0.4 | | 17.5 | | |
| Essakane | 54.2 | | 2.1 | | 56.3 | | 46.6 | | 0.3 | | 46.9 | | |
| Corporate | 0.3 | | — | | 0.3 | | 0.2 | | — | | 0.2 | | |
Reconciliation of incurred capital expenditure per the segmented note in the financial statements to incurred sustaining and expansion capital for the twelve months ended December 31, 2024, and December 31, 2023:
| | | | | | | | | | | | | | | | | | | | | |
| | | | | | |
| | | | | | | |
| ($ millions, except where noted) | Sustaining | Expansion | 2024 | Sustaining | Expansion | 2023 | |
| | | | | | | |
| | | | | | | |
| Capital expenditures for property, plant and equipment | $ | 296.2 | | $ | 225.8 | | $ | 522.0 | | $ | 200.3 | | $ | 733.9 | | $ | 934.2 | | |
Less: Côté Gold (9.7% share up to repurchase date)1 | (5.4) | | (29.7) | | (35.1) | | — | | (77.1) | | (77.1) | | |
| Subtotal | $ | 290.8 | | $ | 196.1 | | $ | 486.9 | | $ | 200.3 | | $ | 656.8 | | $ | 857.1 | | |
| Côté Gold (IMG basis) | 42.7 | | 191.0 | | 233.7 | | — | | 654.5 | | 654.5 | | |
| Westwood | 66.1 | | — | | 66.1 | | 65.0 | | 0.6 | | 65.6 | | |
| Essakane | 180.4 | | 5.1 | | 185.5 | | 134.9 | | 1.7 | | 136.6 | | |
| Corporate | 1.6 | | — | | 1.6 | | 0.4 | | — | | 0.4 | | |
1.Comparative values reflect the capital amount corresponding with the proportionate transferred interest during 2023.
| | | | | |
IAMGOLD CORPORATION Annual Management's Discussion and Analysis - December 31, 2024 | 43 |
Reconciliation of capital expenditure per cash flow statement in the financial statements to cash payments for sustaining and expansion capital for the twelve months ended December 31, 2024, and December 31, 2023:
| | | | | | | | | | | | | | | | | | | | | |
| | | | | | |
| | | | | | | |
| ($ millions, except where noted) | Sustaining | Expansion | 2024 | Sustaining | Expansion | 2023 | |
| | | | | | | |
| | | | | | | |
| Capital expenditures for property, plant and equipment | $ | 296.2 | | $ | 225.8 | | $ | 522.0 | | $ | 200.3 | | $ | 733.9 | | $ | 934.2 | | |
| Working capital adjustments | 13.3 | | 23.3 | | 36.6 | | (4.3) | | (22.6) | | (26.9) | | |
| Capital expenditures per statement of cash flows | 309.5 | | 249.1 | | 558.6 | | 196.0 | | 711.3 | | 907.3 | | |
Less: Côté Gold (9.7% share up to repurchase date)1 | (5.5) | | (32.7) | | (38.2) | | — | | (77.1) | | (77.1) | | |
| Subtotal | $ | 304.0 | | $ | 216.4 | | $ | 520.4 | | $ | 196.0 | | $ | 634.2 | | $ | 830.2 | | |
| Côté Gold (IMG basis) | 47.0 | | 211.5 | | 258.5 | | — | | 631.6 | | 631.6 | | |
| Westwood | 66.7 | | — | | 66.7 | | 64.7 | | 0.6 | | 65.3 | | |
| Essakane | 189.1 | | 4.9 | | 194.0 | | 130.8 | | 2.0 | | 132.8 | | |
| Corporate | 1.2 | | — | | 1.2 | | 0.5 | | — | | 0.5 | | |
1.Comparative values reflect the capital amount corresponding with the proportionate transferred interest during 2023.
Reconciliation of incurred capital expenditure per the segmented note in the financial statements to incurred sustaining and expansion capital for the twelve months ended December 31, 2022:
| | | | | | | | | | | | | | | |
| | | | | | |
| | | | | | | |
| ($ millions, except where noted) | | | | Sustaining | Expansion | 2022 | |
| | | | | | | |
| | | | | | | |
| Capital expenditures for property, plant and equipment | | | | $ | 190.4 | | $ | 540.3 | | $ | 730.7 | | |
| | | | | | | |
| | | | | | | |
| Côté Gold (70% basis) | | | | — | | 531.7 | | 531.7 | | |
| Westwood | | | | 30.3 | | 4.8 | | 35.1 | | |
| Essakane | | | | 158.8 | | 3.8 | | 162.6 | | |
| Corporate | | | | 1.3 | | — | | 1.3 | | |
Reconciliation of capital expenditure per cash flow statement in the financial statements to cash payments for sustaining and expansion capital for the twelve months ended December 31, 2022:
| | | | | | | | | | | | | | | |
| | | | | | |
| | | | | | | |
| ($ millions, except where noted) | | | | Sustaining | Expansion | 2022 | |
| | | | | | | |
| | | | | | | |
| Capital expenditures for property, plant and equipment | | | | $ | 190.4 | | $ | 540.3 | | $ | 730.7 | | |
| | | | | | | |
| Capital expenditures per statement of cash flows | | | | 190.4 | | 540.3 | | 730.7 | | |
| | | | | | | |
| | | | | | | |
| Côté Gold (70% basis) | | | | — | | 531.7 | | 531.7 | | |
| Westwood | | | | 30.3 | | 4.8 | | 35.1 | | |
| Essakane | | | | 158.8 | | 3.8 | | 162.6 | | |
| Corporate | | | | 1.3 | | | 1.3 | | |
Project Expenditures
Project expenditures at Côté represent all the project construction capital costs incurred during construction and commissioning phase of the project in line with the Côté Gold NI 43-101 technical report and include capital expenditures, right-of-use assets acquired through leases, and initial supplies inventory, less certain cash and non-cash corporate level adjustments included in capital expenditures.
EBITDA and Adjusted EBITDA
EBITDA (earnings before income taxes, depreciation and amortization of finance costs) is an indicator of the Company’s ability to produce operating cash flow to fund working capital needs, service debt obligations and fund capital expenditures.
Adjusted EBITDA represents EBITDA excluding certain impacts such as changes in estimates of asset retirement obligations at closed sites, unrealized (gain) loss on non-hedge derivatives, impairment charges and reversal of impairment charges, write-down of assets and foreign exchange (gain) loss which are non-cash items and certain cash items that are non-recurring or temporary in nature as such items are not indicative of recurring operating performance. Management believes this additional information is useful to investors in understanding the Company’s ability to generate operating cash flow by excluding from the calculation these non-cash amounts and cash amounts that are not indicative of the recurring performance of the underlying operations for the periods presented.
| | | | | |
IAMGOLD CORPORATION Annual Management's Discussion and Analysis - December 31, 2024 | 44 |
The following table provides a reconciliation of EBITDA and Adjusted EBITDA to the consolidated financial statements:
| | | | | | | | | | | | | | | | | | |
| ($ millions, except where noted) | Q4 2024 | Q4 2023 | 2024 | 2023 | 2022 | |
Earnings (loss) before income taxes – continuing operations | $ | 125.4 | | $ | (6.5) | | $ | 977.2 | | $ | 128.2 | | $ | 41.7 | | |
| Add: | | | | | | |
| Depreciation | 96.7 | | 71.4 | | 275.0 | | 217.4 | | 242.0 | | |
| Finance costs | 37.4 | | 5.3 | | 70.8 | | 21.0 | | 8.6 | | |
| EBITDA – continuing operations | $ | 259.5 | | $ | 70.2 | | $ | 1,323.0 | | $ | 366.6 | | $ | 292.3 | | |
| Adjusting items: | | | | | | |
| Unrealized (gain)/loss on non-hedge derivatives | (3.0) | | (8.4) | | (23.3) | | (8.7) | | (1.4) | | |
| NRV write-down/(reversal) of stockpiles/finished goods | — | | — | | — | | 3.2 | | (1.3) | | |
| Abnormal portion of operating costs at Essakane | — | | — | | — | | 13.5 | | — | | |
| Write-down of Jubilee property | — | | — | | — | | 1.3 | | — | | |
| Impairment charge (reversal) | — | | — | | (455.5) | | — | | 17.1 | | |
| Foreign exchange (gain)/loss | 4.1 | | 4.3 | | 1.0 | | 12.8 | | 5.0 | | |
| Gain on sale of Bambouk Assets | (34.1) | | — | | (34.1) | | (109.1) | | — | | |
| Insurance recoveries | — | | — | | (27.3) | | (0.6) | | (1.2) | | |
| Write-down of assets | 1.2 | | 0.1 | | 1.4 | | 1.3 | | 2.0 | | |
| Changes in estimates of asset retirement obligations at closed sites | (13.0) | | 8.0 | | (13.4) | | 9.7 | | 1.6 | | |
| Fair value of deferred consideration from sale of Sadiola | (0.4) | | 6.0 | | (1.8) | | 4.3 | | (0.7) | | |
| Gain on sale of Pitangui and Acurui Projects | — | | — | | — | | (15.5) | | — | | |
| | | | | | |
| | | | | | |
| | | | | | |
| | | | | | |
| Forfeiture of carbon fines inventory | — | | 13.5 | | — | | 13.5 | | — | | |
| Settlement of carbon fines matter | — | | 15.0 | | — | | 15.0 | | — | | |
| Severance costs | 5.4 | | 0.1 | | 5.6 | | 2.4 | | — | | |
| | | | | | |
| | | | | | |
| Other | (4.3) | | 1.8 | | 5.0 | | 5.4 | | — | | |
| Adjusted EBITDA – continuing operations | $ | 215.4 | | $ | 110.6 | | $ | 780.6 | | $ | 315.1 | | $ | 313.4 | | |
| Including discontinued operations: | | | | | | |
| EBITDA – discontinued operations | $ | — | | $ | — | | $ | — | | $ | 14.4 | | $ | 8.1 | | |
| Adjusted items: | | | | | | |
| Unrealized (gain)/loss on non-hedge derivatives | — | | — | | — | | — | | (5.5) | | |
| Write-down of stockpile/finished goods | — | | — | | — | | — | | 5.8 | | |
| Loss on sale of Rosebel | — | | — | | — | | 7.4 | | — | | |
| Severance costs | — | | — | | — | | 1.5 | | — | | |
| Foreign exchange (gain)/loss | — | | — | | — | | —�� | | (0.4) | | |
| Write-down of assets | — | | — | | — | | 0.1 | | 2.5 | | |
| | | | | | |
| | | | | | |
| Impairment charge (reversal) | — | | — | | — | | — | | 110.1 | | |
| | | | | | |
| | | | | | |
| Adjusted EBITDA from discontinued operations | $ | — | | $ | — | | $ | — | | $ | 23.4 | | $ | 120.6 | | |
EBITDA – all operations | $ | 259.5 | | $ | 70.2 | | $ | 1,323.0 | | $ | 381.0 | | $ | 300.4 | | |
Adjusted EBITDA – all operations | $ | 215.4 | | $ | 110.6 | | $ | 780.6 | | $ | 338.5 | | $ | 434.0 | | |
| | | | | | |
| | | | | | |
| | | | | | |
| | | | | | |
| | | | | | |
| | | | | | |
| | | | | | |
| | | | | | |
| | | | | |
IAMGOLD CORPORATION Annual Management's Discussion and Analysis - December 31, 2024 | 45 |
Adjusted Net Earnings (Loss) Attributable to Equity Holders
Adjusted net earnings (loss) attributable to equity holders represents net earnings (loss) attributable to equity holders excluding certain impacts, net of taxes, such as changes in estimates of asset retirement obligations at closed sites, unrealized (gain) loss on non-hedge derivatives and warrants, impairment charges and reversal of impairment charges, write-down of assets and foreign exchange (gain) loss which are non-cash items and certain cash items that are non-recurring or temporary in nature as such items are not indicative of recurring operating performance. This measure is not necessarily indicative of net earnings (loss) or cash flows as determined under IFRS. Management believes this measure better reflects the Company’s performance for the current period and is a better indication of its expected performance in future periods. As such, the Company believes that this measure is useful to investors in assessing the Company’s underlying performance.
The following table provides a reconciliation of earnings (loss) before income taxes and non-controlling interests as per the consolidated statements of earnings (loss) to adjusted net earnings (loss) attributable to equity holders of the Company.
| | | | | | | | | | | | | | | | | |
| | | |
| | | | | |
| ($ millions, except where noted) | Q4 2024 | Q4 2023 | 2024 | 2023 | 2022 |
| Earnings (loss) before income taxes and non-controlling interests – continuing operations | $ | 125.4 | | $ | (6.5) | | $ | 977.2 | | $ | 128.2 | | $ | 41.7 | |
| Adjusting items: | | | | | |
| Unrealized gain/(loss) on non-hedge derivatives | (3.0) | | (8.4) | | (23.3) | | (8.7) | | (1.4) | |
| NRV write-down/(reversal) of stockpiles/finished goods | — | | — | | — | | 3.4 | | (8.2) | |
| Abnormal portion of operating costs at Essakane | — | | — | | — | | 14.5 | | — | |
| Write-down of Jubilee property | — | | — | | — | | 1.3 | | — | |
| Gain on sale of Pitangui and Acurui Projects | — | | — | | — | | (15.5) | | — | |
| Other finance costs | 0.6 | | 1.0 | | 4.2 | | 7.9 | | — | |
| Impairment charge (reversal) | — | | — | | (455.5) | | — | | 17.1 | |
| Foreign exchange (gain)/loss | 4.1 | | 4.3 | | 1.0 | | 12.8 | | 5.0 | |
| Gain on sale of Bambouk Assets | (34.1) | | — | | (34.1) | | (109.1) | | — | |
| Insurance recoveries | — | | — | | (27.3) | | (0.6) | | (1.2) | |
| Write-down of assets | 1.2 | | 0.1 | | 1.4 | | 1.3 | | 2.0 | |
| Changes in estimates of asset retirement obligations at closed sites | (13.0) | | 8.0 | | (13.4) | | 9.7 | | 1.6 | |
| Fair value of deferred consideration from sale of Sadiola | (0.4) | | 6.0 | | (1.8) | | 4.3 | | (0.7) | |
| | | | | |
| | | | | |
| | | | | |
| | | | | |
| Forfeiture of carbon fines inventory | — | | 13.5 | | — | | 13.5 | | — | |
| Settlement of carbon fines matter | — | | 15.0 | | — | | 15.0 | | — | |
| Severance costs | 5.4 | | 0.1 | | 5.6 | | 2.4 | | — | |
| | | | | |
| | | | | |
| Other | (4.3) | | 1.8 | | 5.0 | | 5.4 | | — | |
| Adjusted earnings before income taxes and non-controlling interests – continuing operations | $ | 81.9 | | $ | 34.9 | | $ | 439.0 | | $ | 85.8 | | $ | 55.9 | |
| Income taxes | (34.3) | | (1.1) | | (129.4) | | (30.7) | | (78.1) | |
| Tax on foreign exchange translation of deferred income tax balances | 9.9 | | (5.3) | | 10.8 | | (2.2) | | 9.0 | |
| Tax impact of adjusting items | 4.6 | | 0.1 | | 3.8 | | 0.6 | | (3.3) | |
| Non-controlling interests | (4.9) | | (1.8) | | (28.2) | | (8.8) | | (19.1) | |
| Adjusted net earnings (loss) attributable to equity holders – continuing operations | $ | 57.2 | | $ | 26.8 | | $ | 296.0 | | $ | 44.7 | | $ | (35.6) | |
| Adjusted net earnings (loss) per share attributable to equity holders – continuing operations | $ | 0.10 | | $ | 0.06 | | $ | 0.55 | | $ | 0.09 | | $ | (0.07) | |
| Including discontinued operations: | | | | | |
| Net earnings (loss) before income tax and non-controlling interest – discontinued operations | $ | — | | $ | — | | $ | — | | $ | 14.3 | | $ | (37.0) | |
| Adjusted items: | | | | | |
| Unrealized (gain) on non-hedge derivatives | — | | — | | — | | — | | (5.5) | |
| NRV write-down of stockpiles/finished goods | — | | — | | — | | — | | 8.0 | |
| Loss on sale of Rosebel | — | | — | | — | | 7.4 | | — | |
| Impairment charge (reversal) | — | | — | | — | | — | | 110.1 | |
| | | | | |
IAMGOLD CORPORATION Annual Management's Discussion and Analysis - December 31, 2024 | 46 |
| | | | | | | | | | | | | | | | | |
| Severance costs | — | | — | | — | | 1.5 | | — | |
| Foreign exchange (gain) loss | — | | — | | — | | — | | (0.4) | |
| Write-down of assets | — | | — | | — | | 0.1 | | 2.5 | |
| | | | | |
| | | | | |
| | | | | |
| | | | | |
| Adjusted earnings before income taxes and non-controlling interests – discontinued operations | $ | — | | $ | — | | $ | — | | $ | 23.3 | | $ | 77.7 | |
| Income taxes | — | | — | | — | | (8.0) | | 20.6 | |
| | | | | |
| Tax impact of adjusting items | — | | — | | — | | — | | (41.8) | |
| Non-controlling interests | — | | — | | — | | (0.7) | | 1.8 | |
| Adjusted net earnings attributable to equity holders – discontinued operations | $ | — | | $ | — | | $ | — | | $ | 14.6 | | $ | 58.3 | |
| Adjusted net earnings per share attributable to equity holders – discontinued operations | $ | 0.00 | | $ | 0.00 | | $ | 0.00 | | $ | 0.03 | | $ | 0.12 | |
| Adjusted net earnings (loss) attributable to equity holders – all operations | $ | 57.2 | | $ | 26.8 | | $ | 296.0 | | $ | 59.3 | | $ | 22.7 | |
| Adjusted net earnings (loss) per share attributable to equity holders – all operations | $ | 0.10 | | $ | 0.06 | | $ | 0.55 | | $ | 0.12 | | $ | 0.05 | |
| Basic weighted average number of common shares outstanding (millions) | 571.3 | | 481.3 | | 539.8 | | 480.6 | | 478.6 | |
Net Cash from Operating Activities before Changes in Working Capital
The Company makes reference to net cash from operating activities before changes in working capital which is calculated as net cash from operating activities less working capital items and non-current ore stockpiles. Working capital can be volatile due to numerous factors, including a build-up or reduction of inventories. Management believes that this non-GAAP measure, which excludes these non-cash items, provides investors with the ability to better evaluate the operating cash flow performance of the Company.
The following table provides a reconciliation of net cash from operating activities before changes in working capital to net cash from operating activities:
| | | | | | | | | | | | | | | | | |
| | | |
| | | | | |
| ($ millions, except where noted) | Q4 2024 | Q4 2023 | 2024 | 2023 | 2022 |
| | | | | |
| | | | | |
| Net cash from operating activities – continuing operations | $ | 102.6 | | $ | 69.9 | | $ | 486.0 | | $ | 144.0 | | $ | 257.6 | |
| Adjusting items from working capital items and non-current ore stockpiles: | | | | | |
| Receivables and other current assets | 20.9 | | 19.8 | | 45.6 | | (18.0) | | 36.9 | |
| Inventories and non-current ore stockpiles | 20.3 | | 10.9 | | 51.4 | | 76.6 | | 32.6 | |
| Accounts payable and accrued liabilities | (16.6) | | (48.5) | | 17.4 | | (43.7) | | (28.9) | |
| Net cash from operating activities before changes in working capital – continuing operations | $ | 127.2 | | 52.1 | | $ | 600.4 | | 158.9 | | 298.2 | |
| Net cash from operating activities before changes in working capital – discontinued operations | $ | — | | $ | — | | $ | — | | $ | 21.9 | | $ | 120.3 | |
| Net cash from operating activities before changes in working capital | $ | 127.2 | | $ | 52.1 | | $ | 600.4 | | $ | 180.8 | | $ | 418.5 | |
| | | | | |
| | | | | |
| | | | | |
| | | | | |
| | | | | |
IAMGOLD CORPORATION Annual Management's Discussion and Analysis - December 31, 2024 | 47 |
Mine-Site Free Cash Flow
Mine-site free cash flow is calculated as cash flow from mine-site operating activities less capital expenditures from operating mine sites. The Company believes this measure is useful to investors in assessing the Company's ability to operate its mine sites without reliance on additional borrowing or usage of existing cash.
Three months ended December 31, 2024
| | | | | | | | | | | | | | | | | |
| | | |
| | | | | |
| ($ millions, except where noted) | Côté Gold | Westwood | Essakane | Corporate & other | Total |
| Net cash from operating activities – continuing operations | $ | 61.8 | | $ | 60.0 | | $ | 76.3 | | $ | (95.5) | | $ | 102.6 | |
| Add: | | | | | |
| Operating cash flow used by non-mine site activities | — | | — | | — | | 95.5 | | 95.5 | |
| Cash flow from operating mine-sites – continuing operations | 61.8 | | 60.0 | | 76.3 | | — | | 198.1 | |
| Capital expenditures – continuing operations | 44.9 | | 18.7 | | 56.3 | | 0.5 | | 120.4 | |
| Less: | | | | | |
| Capital expenditures from construction and development projects and corporate | — | | — | | — | | (0.5) | | (0.5) | |
| Capital expenditures from operating mine-sites – continuing operations | 44.9 | | 18.7 | | 56.3 | | — | | 119.9 | |
| Mine-site cash flow – continuing operations | $ | 16.9 | | $ | 41.3 | | $ | 20.0 | | $ | — | | $ | 78.2 | |
Three months ended December 31, 2023
| | | | | | | | | | | | | | |
| | |
| | | | |
| ($ millions, except where noted) | Westwood | Essakane | Corporate & Other | Total |
| Net cash from operating activities – continuing operations | $ | 21.1 | | $ | 72.1 | | $ | (23.3) | | $ | 69.9 | |
| Add: | | | | |
| Operating cash flow used by non-mine site activities | — | | — | | 23.3 | | 23.3 | |
| Cash flow from operating mine-sites – continuing operations | 21.1 | | $ | 72.1 | | — | | 93.2 | |
| Capital expenditures – continuing operations | 17.4 | | $ | 46.9 | | 187.0 | | 251.3 | |
| Less: | | | | |
| Capital expenditures from construction and development projects and corporate | — | | $ | — | | (187.0) | | (187.0) | |
| Capital expenditures from operating mine-sites – continuing operations | 17.4 | | $ | 46.9 | | — | | 64.3 | |
| Mine-site cash flow – continuing operations | $ | 3.7 | | $ | 25.2 | | $ | — | | $ | 28.9 | |
| | | | |
| | | | |
| | | | |
| | | | |
Twelve months ended December 31, 2024
| | | | | | | | | | | | | | | | | |
| | | |
| | | | | |
| ($ millions, except where noted) | Côté Gold1 | Westwood | Essakane | Corporate & other | Total |
| Net cash from operating activities – continuing operations | $ | 128.3 | | $ | 161.1 | | $ | 444.5 | | $ | (247.9) | | $ | 486.0 | |
| Add: | | | | | |
| Operating cash flow used by non-mine site activities | — | | — | | — | | 247.9 | | 247.9 | |
| Cash flow from operating mine-sites – continuing operations | 128.3 | | 161.1 | | 444.5 | | — | | 733.9 | |
| Capital expenditures – continuing operations | 88.1 | | 66.7 | | 194.0 | | 209.8 | | 558.6 | |
| Less: | | | | | |
| Capital expenditures from construction and development projects and corporate | — | | — | | — | | (209.8) | | (209.8) | |
| Capital expenditures from operating mine-sites – continuing operations | 88.1 | | 66.7 | | 194.0 | | — | | 348.8 | |
| Mine-site cash flow – continuing operations | $ | 40.2 | | $ | 94.4 | | $ | 250.5 | | $ | — | | $ | 385.1 | |
1.Represents mine site free cash flow from Côté Gold for the five months since achieving commercial production on August 1, 2024.
| | | | | |
IAMGOLD CORPORATION Annual Management's Discussion and Analysis - December 31, 2024 | 48 |
Twelve months ended December 31, 2023
| | | | | | | | | | | | | | |
| | |
| | | | |
| ($ millions, except where noted) | Westwood | Essakane | Corporate & Other | Total |
| Net cash from operating activities – continuing operations | $ | 22.5 | | $ | 223.8 | | $ | (102.3) | | $ | 144.0 | |
| Add: | | | | |
| Operating cash flow used by non-mine site activities | — | | — | | 102.3 | | 102.3 | |
| Cash flow from operating mine-sites – continuing operations | 22.5 | | 223.8 | | — | | 246.3 | |
| Capital expenditures – continuing operations | 65.3 | | 132.8 | | 709.2 | | 907.3 | |
| Less: | | | | |
| Capital expenditures from construction and development projects and corporate | — | | — | | (709.2) | | (709.2) | |
| Capital expenditures from operating mine-sites – continuing operations | 65.3 | | 132.8 | | — | | 198.1 | |
| Mine-site cash flow – continuing operations | (42.8) | | 91.0 | | — | | 48.2 | |
| Cash flow from discontinued mine-sites | — | | — | | 15.4 | | 15.4 | |
| Capital expenditures from discontinued operations | — | | — | | (9.5) | | (9.5) | |
| Mine-site cash flow – discontinued operations | — | | — | | 5.9 | | 5.9 | |
| Total mine-site free cash flow | $ | (42.8) | | $ | 91.0 | | $ | 5.9 | | $ | 54.1 | |
Twelve months ended December 31, 2022
| | | | | | | | | | | | | | |
| | |
| | | | |
| ($ millions, except where noted) | Westwood | Essakane | Corporate & other | Total |
| Net cash from operating activities – continuing operations | $ | (16.8) | | $ | 381.7 | | $ | (107.3) | | $ | 257.6 | |
| Add: | | | | |
| Operating cash flow used by non-mine site activities | — | | — | | 107.3 | | 107.3 | |
| Cash flow from operating mine-sites – continuing operations | (16.8) | | 381.7 | | — | | 364.9 | |
| Capital expenditures – continuing operations | 35.1 | | 162.6 | | 546.9 | | 744.6 | |
| Less: | | | | |
| Capital expenditures from construction and development projects and corporate | — | | — | | (546.9) | | (546.9) | |
| Capital expenditures from operating mine-sites – continuing operations | 35.1 | | 162.6 | | — | | 197.7 | |
| Mine-site cash flow – continuing operations | (51.9) | | 219.1 | | — | | 167.2 | |
| Cash flow from discontinued mine-sites | — | | — | | — | | 151.1 | |
| Capital expenditures from discontinued operations | — | | — | | — | | (130.7) | |
| Mine-site cash flow – discontinued operations | — | | — | | — | | 20.4 | |
| Total mine-site free cash flow | $ | (51.9) | | $ | 219.1 | | $ | — | | $ | 187.6 | |
Liquidity and Net Cash (Debt)
Liquidity is defined as cash and cash equivalents, short-term investments and the credit available under the Credit Facility. Net cash (debt) is calculated as cash, cash equivalents and short-term investments less long-term debt, lease liabilities and the drawn portion of the Credit Facility. The Company believes this measure provides investors with additional information regarding the liquidity position of the Company.
| | | | | |
IAMGOLD CORPORATION Annual Management's Discussion and Analysis - December 31, 2024 | 49 |
| | | | | | | | | | | |
| December 31 | December 31 | December 31 |
| ($ millions, continuing operations, except where noted) | 2024 | 2023 | 2022 |
| Cash and cash equivalents | $ | 347.5 | | $ | 367.1 | | $ | 407.8 | |
| Short-term investments | 1.0 | | — | | — | |
| Available Credit Facility | 418.5 | | 387.0 | | 26.6 | |
| Available Liquidity | $ | 767.0 | | $ | 754.1 | | $ | 434.4 | |
| | | | | | | | | | | |
| December 31 | December 31 | December 31 |
| ($ millions, continuing operations, except where noted) | 2024 | 2023 | 2022 |
| Cash and cash equivalents | $ | 347.5 | | $ | 367.1 | | $ | 407.8 | |
| Short-term investments | 1.0 | | — | | — | |
| Lease liabilities | (124.2) | | (121.3) | | (73.8) | |
Long-term debt1 | (1,072.1) | | (857.3) | | (921.2) | |
| Drawn letters of credit issued under Credit Facility | (11.5) | | (38.0) | | (18.4) | |
| Net cash (debt) | $ | (859.3) | | $ | (649.5) | | $ | (605.6) | |
1. Includes principal amount of the Notes of $450.0 million, Term Loan of $400.0 million, Credit Facility of $220 million and equipment loans of $2.1 million (December 31, 2023 – $450.0 million, $400.0 million, $nil and $7.3 million, respectively, December 31, 2022 – $450.0 million, $nil, $455.0 million, and $16.2 million, respectively). Excludes deferred transaction costs and embedded derivative on the Notes and Term Loan.
CAUTIONARY STATEMENT ON FORWARD-LOOKING INFORMATION
All information included or incorporated by reference in this MD&A, including any information as to the Company’s vision, strategy, future financial or operating performance and other statements that express management’s expectations or estimates of future performance or impact, including statements in respect of the prospects and/or development of the Company’s projects, other than statements of historical fact, constitutes forward-looking information or forward-looking statements within the meaning of applicable securities laws (collectively referred to herein as “forward-looking statements”) and such forward-looking statements are based on expectations, estimates and projections as of the date of this MD&A. Forward-looking statements are generally identifiable by the use of words such as “may”, “will”, “should”, “would”, “could”, “continue”, “expect”, “budget”, “aim”, “can”, “focus”, “forecast”, “anticipate”, “estimate”, “maintain”, “believe”, “intend”, “plan”, “schedule”, “guidance”, “outlook”, “potential”, “seek”, “targets”, “cover”, “strategy”, “during”, “ongoing”, “subject to”, “future”, “objectives”, “opportunities”, “committed”, “prospective”, “likely”, “progress”, “strive”, “sustain”, “effort”, “extend”, “remain”, “pursue”, “predict”, or “project” or the negative of these words or other variations on these words or comparable terminology. For example, forward-looking statements in this MD&A include, without limitation, those under the headings “About IAMGOLD”, “Highlights”, “Outlook”, “Environmental, Social and Governance”, “Operations”, “Financial Condition" and “Quarterly Financial Review” and include, but are not limited to, statements with respect to: the estimation of mineral reserves and mineral resources and the realization of such estimates; operational and financial performance including the Company’s guidance for and actual results of production, ESG (including environmental) performance, costs and capital and other expenditures such as exploration and including depreciation expense and effective tax rate; the updated life-of-mine plan, ramp-up assumptions and other project metrics including operating costs in respect to the Côté Gold Mine; expected production of the Côté Gold Mine, expected benefits from the operational improvements and de-risking strategies implemented or to be implemented by the Company; mine development activities; the Company's capital allocation and liquidity; the composition of the Company’s portfolio of assets including its operating mines, development and exploration projects; the sale of the Malian Assets; permitting timelines and the expected receipt of permits; inflation, including global inflation and inflationary pressures; global supply chain constraints; environmental verification, biodiversity and social development projects; plans, targets, proposals and strategies with respect to sustainability, including third party data on which the Company relies, and their implementation; commitments with respect to sustainability and the impact thereof, including the Company’s “Zero Harm” vision; commitments with respect to greenhouse gas emissions and decarbonization initiatives (eg. interim target of achieving 30% absolute reduction in Scope 1 and 2 emissions by 2030); the development of the Company’s Water Management Standard; commitments with respect to biodiversity; commitments related to social performance, including commitments in furtherance of Indigenous relations; the ability to secure alternative sources of consumables of comparable quality and on reasonable terms; workforce and contractor availability, labour costs and other labour impacts; the impacts of weather; the future price of gold and other commodities; foreign exchange rates and currency fluctuations; financial instruments; hedging strategies; impairment assessments and assets carrying values estimates; safety and security concerns in the jurisdictions in which the Company operates and the impact thereof on the Company’s operational and financial performance and financial condition; and government regulation of mining operations (including the Competition Act (Canada) and the regulations associated with the fight against climate change).
The Company cautions the reader that forward-looking statements are necessarily based upon a number of estimates and assumptions that, while considered reasonable by management, are inherently subject to significant business, financial, operational and other risks, uncertainties, contingencies and other factors, including those described below, which could cause actual results, performance or achievements of the Company to be materially different from results, performance or
| | | | | |
IAMGOLD CORPORATION Annual Management's Discussion and Analysis - December 31, 2024 | 50 |
achievements expressed or implied by such forward-looking statements and, as such, undue reliance must not be placed on them. Forward-looking statements are also based on numerous material factors and assumptions, including as described in this MD&A, including with respect to: the Company's present and future business strategies; operations performance within expected ranges; anticipated future production and cash flows; local and global economic conditions and the environment in which the Company will operate in the future; the price of precious metals, other minerals and key commodities; projected mineral grades; international exchanges rates; anticipated capital and operating costs; the availability and timing of required governmental and other approvals for the construction of the Company's projects.
Risks, uncertainties, contingencies and other factors that could cause actual results, performance or achievements of the Company to be materially different from results, performance or achievements expressed or implied by such forward-looking statements include, without limitation: the ability of the Company to sell the Malian Assets; the Company's business strategies and its ability to execute thereon; the ability of the Company to complete pending transactions; the development and execution of implementing strategies to meet the Company’s sustainability vision and targets; security risks, including civil unrest, war or terrorism and disruptions to the Company’s supply chain and transit routes as a result of such security risks, particularly in Burkina Faso and the Sahel region surrounding the Company’s Essakane mine; the availability of labour and qualified contractors; the availability of key inputs for the Company's operations and disruptions in global supply chains; the volatility of the Company's securities; litigation; contests over title to properties, particularly title to undeveloped properties; mine closure and rehabilitation risks; management of certain of the Company's assets by other companies or joint venture partners; the lack of availability of insurance covering all of the risks associated with a mining company's operations; unexpected geological conditions; competition and consolidation in the mining sector; the profitability of the Company being highly dependent on the condition and results of the mining industry as a whole, and the gold mining industry in particular; changes in the global prices for gold, and commodities used in the operation of the Company's business (included, but not limited to diesel, fuel oil and electricity); legal, litigation, legislative, political or economic risks and new developments in the jurisdictions in which the Company carries on business; changes in taxes, including mining tax regimes; the failure to obtain in a timely manner from authorities key permits, authorizations or approvals necessary for transactions, exploration, development or operation, operating or technical difficulties in connection with mining or development activities, including geotechnical difficulties and major equipment failure; the inability of the Company to participate in any gold price increase above the cap in any collar transaction entered into in conjunction with certain gold sale prepayment arrangements; the availability of capital; the level of liquidity and capital resources; access to capital markets and financing; the Company's level of indebtedness; the Company's ability to satisfy covenants under its credit facilities; changes in interest rates; adverse changes in the Company’s credit rating; the Company's choices in capital allocation; effectiveness of the Company's ongoing cost containment efforts; the Company's ability to execute on de-risking activities and measures to improve operations; availability of specific assets to meet contractual obligations; risks related to third-party contractors, including reduced control over aspects of the Company's operations and/or the failure and/or the effectiveness of contractors to perform; risks arising from holding derivative instruments; changes in U.S. dollar and other currency exchange rates or gold lease rates; capital and currency controls in foreign jurisdictions; assessment of carrying values for the Company’s assets, including the ongoing potential for material impairment and/or write-downs of such assets; the speculative nature of exploration and development, including the risks of diminishing quantities or grades of reserves; the fact that reserves and resources, expected metallurgical recoveries, capital and operating costs are estimates which may require revision; the presence of unfavourable content in ore deposits, including clay and coarse gold; inaccuracies in life of mine plans; failure to meet operational targets; equipment malfunctions; information systems security threats and cybersecurity; laws and regulations governing the protection of the environment (including greenhouse gas emission reduction and other decarbonization requirements and the uncertainty surrounding the interpretation of omnibus Bill C-59 and the related amendments to the Competition Act (Canada)); employee relations and labour disputes; the maintenance of tailings storage facilities and the potential for a major spill or failure of the tailings facilities due to uncontrollable events, lack of reliable infrastructure, including access to roads, bridges, power sources and water supplies; physical and regulatory risks related to climate change; unpredictable weather patterns and challenging weather conditions at mine sites; disruptions from weather related events resulting in limited or no productivity such as forest fires, flooding, heavy snowfall, poor air quality, and extreme heat or cold; attraction and retention of key employees and other qualified personnel; availability and increasing costs associated with mining inputs and labour, negotiations with respect to new, reasonable collective labour agreements and/or collective bargaining agreements may not be agreed to; the ability of contractors to timely complete projects on acceptable terms; the relationship with the communities surrounding the Company's operations and projects; indigenous rights or claims; illegal mining; the potential direct or indirect operational impacts resulting from external factors, including infectious diseases, pandemics, or other public health emergencies; and the inherent risks involved in the exploration, development and mining business generally. Please see the Company’s AIF or Form 40-F available on www.sedarplus.ca or www.sec.gov/edgar for a comprehensive discussion of the risks faced by the Company and which may cause actual results, performance or achievements of the Company to be materially different from results, performance or achievements expressed or implied by forward-looking statements.
Although the Company has attempted to identify important factors that could cause actual results to differ materially from those contained in forward-looking statements, there may be other factors that cause results not to be as anticipated, estimated or intended. The Company disclaims any intention or obligation to update or revise any forward-looking statements whether as a result of new information, future events or otherwise except as required by applicable law.
| | | | | |
IAMGOLD CORPORATION Annual Management's Discussion and Analysis - December 31, 2024 | 51 |