Exhibit 99.2

Supplemental Operating and Financial Data
For the Quarter Ended
March 31, 2008
Maguire Properties, Inc.
Supplemental Operating and Financial Data
First Quarter 2008
Table of Contents
| | |
| | | PAGE |
Corporate Data | | |
Quarterly Highlights | | 2 |
Investor Information | | 4 |
Common Stock Data | | 6 |
Consolidated Financial Results | | |
Financial Highlights | | 8 |
Consolidated Balance Sheets | | 9 |
Consolidated Statements of Operations | | 10 |
Consolidated Statements of Discontinued Operations | | 11 |
MMO Unconsolidated Joint Venture Statements of Operations | | 12 |
Funds from Operations | | 13 |
Adjusted Funds from Operations | | 14 |
Reconciliation of Earnings Before Interest, Taxes and Depreciation and Amortization and Adjusted Funds From Operations | | 15 |
Capital Structure | | 16 |
Debt Summary | | 17 |
MMO Joint Venture Debt Summary | | 18 |
Debt Maturities | | 19 |
MMO Joint Venture Debt Maturities | | 20 |
Portfolio Data | | |
Same Store Analysis | | 22 |
Portfolio Overview | | 23 |
Portfolio Geographic Distribution | | 27 |
Portfolio Overview — Leased Rates and Weighted Average Remaining Lease Term | | 28 |
Major Tenants — Office Properties | | 29 |
Portfolio Tenant Classification Description | | 30 |
Lease Expirations — Wholly Owned Portfolio | | 31 |
Lease Expirations — Wholly Owned Portfolio (Los Angeles County) | | 32 |
Lease Expirations — Wholly Owned Portfolio (Orange County) | | 33 |
Lease Expirations — MMO Joint Venture Portfolio | | 34 |
Leasing Activity — Total Portfolio and Effective Portfolio | | 35 |
Leasing Activity — Los Angeles Central Business District | | 36 |
Leasing Activity — Orange County | | 37 |
Tenant Improvements and Leasing Commissions | | 38 |
Historical Capital Expenditures — Office Properties | | 39 |
Hotel Performance and Hotel Historical Capital Expenditures | | 40 |
Construction in Progress | | 41 |
Development Pipeline | | 42 |
Management Statements on Non-GAAP Supplemental Measures | | 43 |
This supplemental package contains forward-looking statements within the meaning of the Private Securities Litigation Reform Act of 1995. Although we believe the expectations reflected in any forward-looking statements are based on reasonable assumptions, you should exercise caution in interpreting and relying on these statements as they involve known and unknown risks, uncertainties and other factors which are, in some cases, beyond management’s control and could materially affect actual results, performance or achievements. These factors include, without limitation: risks associated with our consideration of strategic alternatives; general risks affecting the real estate industry (including, without limitation, the inability to enter into or renew leases at favorable rates, dependence on tenants’ financial condition, and competition from other developers, owners and operators of real estate); risks associated with the availability and terms of financing and the use of debt to fund acquisitions and developments; risks associated with the potential failure to manage effectively our growth and expansion into new markets, to identify properties to acquire, to complete acquisitions or to integrate acquisitions successfully; risks and uncertainties affecting property development and construction; risks associated with downturns in the national and local economies, increases in interest rates, and volatility in the securities markets; risks associated with joint ventures; potential liability for uninsured losses and environmental contamination; risks associated with our potential failure to qualify as a REIT under the Internal Revenue Code of 1986, as amended, and possible adverse changes in tax and environmental laws; and risks associated with our dependence on key personnel whose continued service is not guaranteed.
Maguire Properties, Inc.
Supplemental Operating and Financial Data
First Quarter 2008
Corporate Data
1
Maguire Properties, Inc.
Supplemental Operating and Financial Data
First Quarter 2008
Quarterly Highlights
Maguire Properties, Inc. (the “Company”), a self-administered and self-managed real estate investment trust, is the largest owner and operator of Class A office properties in the Los Angeles central business district and is primarily focused on owning and operating high-quality office properties in the Southern California market. We are a full-service real estate company with substantial in-house expertise and resources in property management, marketing, leasing, acquisitions, development and financing. The Company’s predecessor was founded in 1965 and developed and managed over 30 million square feet of office properties nationally.
As of March 31, 2008, our office portfolio was comprised of whole or partial interests in 39 properties with approximately 21 million net rentable square feet, one 350-room hotel with 266,000 square feet, and on- and off-site structured parking plus surface parking totaling approximately 14 million square feet, which accommodates almost 47,000 vehicles. We have two projects under development that total approximately 387,000 square feet of office space and approximately 223,000 square feet of structured parking. We also own undeveloped land that we believe can support up to approximately 17 million square feet of office, hotel, retail, residential and structured parking.
This Supplemental Operating and Financial Data package supplements the information provided in our quarterly reports on Form 10-Q and annual report on Form 10-K/A filed with the Securities and Exchange Commission (SEC). For more information on Maguire Properties, visit our website at www.maguireproperties.com.
Debt:
As of March 31, 2008 and through the date of this report, we have approximately $119.7 million available to be drawn under our $130.0 million revolving credit facility. Approximately $10.3 million of the facility has been used to secure standby letters of credit, none of which have been drawn through the date of this report.
As of March 31, 2008, approximately 86% of our outstanding debt is fixed (or swapped to a fixed rate) at a weighted average interest rate of approximately 5.6% on an interest-only basis with a weighted average remaining term of approximately eight years.
On April 21, 2008, we repaid the existing $200 million mortgage loan secured by Griffin Towers, which was due to mature on May 1, 2008. The repayment was funded through the issuance of $180 million in new debt, including $35 million in new secured recourse debt issued by our Operating Partnership, and $20 million of cash on hand.
Development Activities:
During first quarter 2008, we completed construction on two of our projects: 17885 Von Karman Avenue and 2385 Northside Drive. Located in Irvine, California at the WAMU campus, 17885 Von Karman Avenue is a 151,370 square foot office building. Our property at 2385 Northside Drive is located in San Diego, California at the Mission City Corporate Center and has 88,795 square feet of office space with 128,000 square feet of structured parking.
At Lantana–East, the building core and shell work is now complete. At Lantana–South, which we estimate to be completed late in the second quarter of 2008, the building core and shell work is 75% complete. Work on the façade, main lobby and site work is still in process. We expect to begin tenant improvement work at Lantana–South in second quarter 2008 and at Lantana–East in first quarter 2009. Our development project at the Lantana Media Campus is comprised of two office buildings totaling 198,000 square feet with 223,000 square feet of structured parking located in Santa Monica, California. As of the date of this report, approximately 81% of this project has been pre-leased.
We began construction at 207 Goode during the fourth quarter of 2007. We expect to complete construction late in the second quarter of 2009. Construction activities continued during the first quarter of 2008. We completed pouring the concrete slab and completed installation of water lines and storm drains along the perimeter of the building. All storm drain lines, sewer lines and electrical conduits within the building were installed. 207 Goode is a 189,000 square foot office building located in Glendale, California.
2
Maguire Properties, Inc.
Supplemental Operating and Financial Data
First Quarter 2008
Quarterly Highlights (continued)
Leasing Activities:
During the first quarter, new leases and renewals were executed for approximately 0.4 million square feet (including our pro rata share of our joint venture properties). Cash rent on leases executed during the quarter increased 39%, while GAAP rent increased 48% during the same period. Within the Los Angeles Central Business District, cash rent growth was 49% while GAAP rent growth was 81%. Leases totaling approximately 0.6 million square feet expired during the first quarter (including our pro rata share of our joint venture properties.)
Impact of Strategic Alternatives Review on our Financial Statements:
During the first quarter of 2008, we recorded $6.4 million of costs incurred in connection with the review of strategic alternatives being conducted by a Special Committee of our board of directors. These costs are included as part of general and administrative in our consolidated statement of operations for the three months ended March 31, 2008.
3
Maguire Properties, Inc.
Supplemental Operating and Financial Data
First Quarter 2008
Investor Information
| | |
| 1733 Ocean Avenue, Suite 400 | | 355 South Grand Avenue, Suite 3300 |
| Santa Monica, CA 90401 | | Los Angeles, CA 90071 |
| Tel. (310) 857-1100 | | Tel. (213) 626-3300 |
| Fax (310) 857-1198 | | Fax (213) 687-4758 |
Senior Management
| | | | | | |
| Robert F. Maguire III | | Chairman of the Board and Chief Executive Officer | | Peggy M. Moretti | | Senior Vice President, Investor and Public Relations |
| Martin A. Griffiths | | Executive Vice President and Chief Financial Officer | | Peter K. Johnston | | Senior Vice President, Leasing |
| Mark T. Lammas | | Executive Vice President, Development | | Robert P. Goodwin | | Senior Vice President, Construction and Development |
| Paul S. Rutter | | Executive Vice President, Major Transactions | | Shant Koumriqian | | Senior Vice President, Finance and Accounting |
| Javier F. Bitar | | Senior Vice President, Senior Investment Officer | | Ted J. Bischak | | Senior Vice President, Asset Management |
| Jonathan L. Abrams | | Senior Vice President, General Counsel and Secretary | | William H. Flaherty | | Senior Vice President, Marketing |
Corporate
|
| Investor Relations Contact: Peggy M. Moretti at (213) 613-4558 |
| Please visit our corporate website at: www.maguireproperties.com |
| | | | | | | | |
| American Stock Transfer & Trust Company | | | | Quarterly results for 2008 will be announced according to the following |
| 59 Maiden Lane | | | | schedule: | | | | |
| New York, NY 10038 | | | | Second Quarter | | Early August 2008 | | |
| (718) 921-8201 | | | | Third Quarter | | Early November 2008 | | |
| www.amstock.com | | | | Fourth Quarter | | Early February 2009 | | |
4
Maguire Properties, Inc.
Supplemental Operating and Financial Data
First Quarter 2008
Investor Information (continued)
Equity Research Coverage
| | | | |
| Banc of America Securities | | Mitchell Germain | | (212) 847-5794 |
| Citigroup Global Markets Inc. | | Michael Bilerman | | (212) 816-1383 |
| Credit Suisse | | John Stewart | | (212) 538-3183 |
| Deutsche Bank Securities | | Louis Taylor | | (212) 250-4912 |
| Friedman, Billings, Ramsey Group, Inc. | | Wilkes J. Graham | | (703) 312-9737 |
| Goldman Sachs & Co. | | Jay Haberman | | (917) 343-4260 |
| Green Street Advisors | | Michael Knott | | (949) 640-8780 |
| KeyBanc Capital Markets | | Jordan Sadler | | (917) 368-2280 |
| Lehman Brothers | | David Harris | | (212) 526-1790 |
| Merrill Lynch | | Steve Sakwa | | (212) 449-0335 |
| Raymond James & Associates | | Paul Puryear | | (727) 567-2253 |
| Robert W. Baird & Company | | David Aubuchon | | (414) 765-7063 |
| Stifel, Nicolaus & Co., Inc. | | John Guinee | | (443) 224-1307 |
| Wachovia Securities | | Christopher Haley | | (443) 263-6773 |
Maguire Properties, Inc. is currently followed by the sell-side analysts listed above, with the exception of Green Street Advisors, which is an independent research firm. This list may not be complete and is subject to change as firms add or delete coverage of our company. Please note that any opinions, estimates or forecasts regarding our historical or predicted performance made by these analysts are theirs alone and do not represent opinions, forecasts or predictions of Maguire Properties, Inc. or its management. We are providing this listing as a service to our stockholders and do not by listing these firms imply our endorsement of or concurrence with such information, conclusions or recommendations. Interested persons may obtain copies of analysts’ reports on their own; we do not distribute these reports. Various of these firms may from time-to-time own our stock and/or hold other long or short positions in our stock, and may provide compensated services to us.
5
Maguire Properties, Inc.
Supplemental Operating and Financial Data
First Quarter 2008
Common Stock Data
Our common stock is traded on the New York Stock Exchange under the symbol MPG. Selected information about our common stock for the past five quarters (based on NYSE prices) is as follows:
| | | | | | | | | | | | | | | | | | | | |
| | | 2008 | | | 2007 | |
| | | 1st Quarter | | | 4th Quarter | | | 3rd Quarter | | | 2nd Quarter | | | 1st Quarter | |
High price | | $ | 29.90 | | | $ | 30.73 | | | $ | 36.00 | | | $ | 38.08 | | | $ | 44.69 | |
Low price | | $ | 12.42 | | | $ | 23.84 | | | $ | 21.95 | | | $ | 33.26 | | | $ | 34.81 | |
Closing price | | $ | 14.31 | | | $ | 29.47 | | | $ | 25.83 | | | $ | 34.33 | | | $ | 35.56 | |
Dividends per share - annualized | | $ | – | | | $ | 1.60 | | | $ | 1.60 | | | $ | 1.60 | | | $ | 1.60 | |
Closing dividend yield - annualized | | | (1 | ) | | | 5.43 | % | | | 6.19 | % | | | 4.66 | % | | | 4.50 | % |
Closing common shares and limited partnership units outstanding (in thousands) | | | 54,610 | | | | 54,592 | | | | 54,589 | | | | 54,617 | | | | 54,405 | |
Closing market value of common shares and limited partnership units outstanding (in thousands) | | .$ | 781,457 | | | $ | 1,608,813 | | | $ | 1,410,022 | | | $ | 1,875,005 | | | $ | 1,934,642 | |
| | | | | |
Dividend Information: | | | | | | | | | | | | | | | | | | | | |
| | | | | |
Common Stock | | | | | | | | | | | | | | | | | | | | |
Dividend amount per share | | | (1 | ) | | $ | 0.4000 | | | $ | 0.4000 | | | $ | 0.4000 | | | $ | 0.4000 | |
Declaration date | | | | | | | December 17, 2007 | | | | September 18, 2007 | | | | June 11, 2007 | | | | March 21, 2007 | |
Record date | | | | | | | December 31, 2007 | | | | September 28, 2007 | | | | June 29, 2007 | | | | March 30, 2007 | |
Payment date | | | | | | | January 31, 2008 | | | | October 31, 2007 | | | | July 31, 2007 | | | | April 30, 2007 | |
| | | | | |
Series A Preferred Stock | | | | | | | | | | | | | | | | | | | | |
Dividend amount per share | | $ | 0.4766 | | | $ | 0.4766 | | | $ | 0.4766 | | | $ | 0.4766 | | | $ | 0.4766 | |
Declaration date | | | April 1, 2008 | | | | December 17, 2007 | | | | September 18, 2007 | | | | June 11, 2007 | | | | March 21, 2007 | |
Record date | | | April 11, 2008 | | | | December 31, 2007 | | | | September 28, 2007 | | | | June 29, 2007 | | | | March 30, 2007 | |
Payment date | | | April 30, 2008 | | | | January 31, 2008 | | | | October 31, 2007 | | | | July 31, 2007 | | | | April 30, 2007 | |
| (1) | As of the date of this report, our board of directors has not declared a dividend on our common stock for the quarter ended March 31, 2008. There can be no assurance given that we will continue to make distributions on our common stock at historical levels or at all, unless required to maintain our REIT status. |
6
Maguire Properties, Inc.
Supplemental Operating and Financial Data
First Quarter 2008
Consolidated Financial Results
7
Maguire Properties, Inc.
Supplemental Operating and Financial Data
First Quarter 2008
Financial Highlights
(unaudited and in thousands, except share, per share, percentage and ratio amounts)
| | | | | | | | | | | | | | | | | | | | |
| | | For the Three Months Ended | |
| | | March 31, 2008 | | | December 31, 2007 | | | September 30, 2007 | | | June 30, 2007 | | | March 31, 2007 | |
Income Items: | | | | | | | | | | | | | | | | | | | | |
Revenue (1) | | $ | 147,709 | | | $ | 155,432 | | | $ | 152,926 | | | $ | 141,760 | | | $ | 97,917 | |
Straight line rent | | | 3,713 | | | | 2,907 | | | | 3,619 | | | | 3,544 | | | | 1,629 | |
Fair value lease revenue(2) | | | 8,267 | | | | 9,749 | | | | 9,810 | | | | 7,903 | | | | 1,576 | |
Lease termination fees | | | 416 | | | | 342 | | | | 2,884 | | | | – | | | | – | |
Office property operating margin(3) | | | 60.6 | % | | | 60.0 | % | | | 60.9 | % | | | 63.8 | % | | | 61.8 | % |
| | | | | |
Net (loss) income available to common stockholders | | $ | (48,591 | ) | | $ | (44,462 | ) | | $ | 81,734 | | | $ | (24,430 | ) | | $ | (12,587 | ) |
Net (loss) income available to common stockholders - basic | | | (1.03 | ) | | | (0.95 | ) | | | 1.74 | | | | (0.52 | ) | | | (0.27 | ) |
Net (loss) income available to common stockholders - diluted | | | (1.03 | ) | | | (0.95 | ) | | | 1.74 | | | | (0.52 | ) | | | (0.27 | ) |
| | | | | |
Funds from operations (FFO) available to common stockholders(4) | | $ | (678 | ) | | $ | 6,715 | | | $ | (2,727 | ) | | $ | (2,426 | ) | | $ | 17,664 | |
FFO per common share - basic (4) | | | (0.01 | ) | | | 0.14 | | | | (0.06 | ) | | | (0.05 | ) | | | 0.38 | |
FFO per common share - diluted(4) | | | (0.01 | ) | | | 0.14 | | | | (0.06 | ) | | | (0.05 | ) | | | 0.38 | |
FFO per common share before loss from early extinguishment of debt - basic(4) | | | (0.01 | ) | | | 0.16 | | | | 0.19 | | | | 0.27 | | | | 0.38 | |
FFO per common share before loss from early extinguishment of debt - diluted(4) | | | (0.01 | ) | | | 0.16 | | | | 0.19 | | | | 0.27 | | | | 0.38 | |
| | | | | |
Dividends declared per common share | | $ | – | | | $ | 0.4000 | | | $ | 0.4000 | | | $ | 0.4000 | | | $ | 0.4000 | |
Dividends declared per preferred share(5) | | | 0.4766 | | | | 0.4766 | | | | 0.4766 | | | | 0.4766 | | | | 0.4766 | |
| | | | | |
Ratios: | | | | | | | | | | | | | | | | | | | | |
Interest coverage ratio(6) | | | 1.01 | | | | 1.07 | | | | 2.96 | | | | 1.40 | | | | 1.53 | |
Interest coverage ratio before loss from early extinguishment of debt and gain on sale of real estate (7) | | | 1.01 | | | | 1.09 | | | | 1.11 | | | | 1.19 | | | | 1.53 | |
Fixed-charge coverage ratio(8) | | | 0.94 | | | | 1.01 | | | | 2.79 | | | | 1.31 | | | | 1.32 | |
Fixed-charge coverage ratio before loss from early extinguishment of debt and gain on sale of real estate (9) | | | 0.94 | | | | 1.02 | | | | 1.04 | | | | 1.11 | | | | 1.32 | |
FFO payout ratio (10) | | | – | | | | 279.4 | % | | | -666.7 | % | | | -800.0 | % | | | 105.3 | % |
FFO payout ratio before loss from early extinguishment of debt(11) | | | – | | | | 250.9 | % | | | 210.5 | % | | | 148.1 | % | | | 105.3 | % |
AFFO payout ratio (12) | | | – | | | | -104.3 | % | | | -144.1 | % | | | -242.7 | % | | | 1466.6 | % |
| | | | | |
Capitalization: | | | | | | | | | | | | | | | | | | | | |
Common stock price @ quarter end | | $ | 14.31 | | | $ | 29.47 | | | $ | 25.83 | | | $ | 34.33 | | | $ | 35.56 | |
| | | | | |
Total consolidated debt | | $ | 5,033,505 | | | $ | 5,003,341 | | | $ | 5,066,116 | | | $ | 5,350,470 | | | $ | 2,830,837 | |
Preferred stock liquidation preference | | | 250,000 | | | | 250,000 | | | | 250,000 | | | | 250,000 | | | | 250,000 | |
Common equity value @ quarter end(13) | | | 781,457 | | | | 1,608,813 | | | | 1,410,022 | | | | 1,875,005 | | | | 1,934,642 | |
| | | | | | | | | | | | | | | | | | | | |
Total consolidated market capitalization | | $ | 6,064,962 | | | $ | 6,862,154 | | | $ | 6,726,138 | | | $ | 7,475,475 | | | $ | 5,015,479 | |
| | | | | | | | | | | | | | | | | | | | |
| | | | | |
Company share of MMO joint venture debt | | | 161,846 | | | | 161,987 | | | | 162,035 | | | | 161,650 | | | | 161,650 | |
| | | | | | | | | | | | | | | | | | | | |
Total combined market capitalization | | $ | 6,226,808 | | | $ | 7,024,141 | | | $ | 6,888,173 | | | $ | 7,637,125 | | | $ | 5,177,129 | |
| | | | | | | | | | | | | | | | | | | | |
| | | | | |
Total consolidated debt / total consolidated market capitalization | | | 83.0 | % | | | 72.9 | % | | | 75.3 | % | | | 71.6 | % | | | 56.4 | % |
Total combined debt / total combined market capitalization | | | 83.4 | % | | | 73.5 | % | | | 75.9 | % | | | 72.2 | % | | | 57.8 | % |
Total consolidated debt plus liquidation preference / total consolidated market capitalization | | | 87.1 | % | | | 76.6 | % | | | 79.0 | % | | | 74.9 | % | | | 61.4 | % |
Total combined debt plus liquidation preference / total combined market capitalization | | | 87.5 | % | | | 77.1 | % | | | 79.5 | % | | | 75.4 | % | | | 62.6 | % |
| (1) | Excludes revenue from discontinued operations of approximately $3 million, $13 million and $9 million for the three months ended September 30, June 30 and March 31, 2007, respectively. |
| (2) | Represents the net adjustment for above- and below-market leases, which are being amortized over the remaining term of the respective leases from the date of acquisition. |
| (3) | Calculated as follows: (rental, tenant reimbursement and parking revenues - rental property operating and maintenance, real estate taxes and parking expenses) / (rental, tenant reimbursement and parking revenues). Lease termination fees are reported as part of interest and other revenue in the consolidated statements of operations. |
| (4) | For a definition and discussion of FFO, see page 43. For a quantitative reconciliation of the differences between FFO and net income, see page 13. |
| (5) | Preferred dividends were declared for the three months ended April 30 and January 31, 2008, and October 31, July 31 and April 30, 2007, respectively. |
| (6) | Calculated as earnings before interest, taxes and depreciation and amortization and preferred dividends, or EBITDA, of $76,028, $86,573, $236,789, $108,230 and $61,837, respectively, divided by cash interest expense of $75,084, $80,577, $79,977, $77,166 and $40,448, respectively. For a discussion of EBITDA, see page 44. For a quantitative reconciliation of the differences between EBITDA and net income, see page 15. |
| (7) | Calculated as EBITDA before loss from early extinguishment of debt and gain on sale of real estate, of $76,028, $87,459, $88,723, $91,567 and $61,837, respectively, divided by cash interest expense of $75,084, $80,577, $79,977, $77,166, and $40,448, respectively. |
| (8) | Calculated as EBITDA of $76,028, $86,573, $236,789, $108,230 and $61,837, respectively, divided by fixed charges of $80,529, $85,823, $84,978, $82,503 and $46,783, respectively. |
| (9) | Calculated as EBITDA before loss from early extinguishment of debt and gain on sale of real estate of $76,028, $87,459, $88,723, $91,567 and $61,837, respectively, divided by fixed charges of $80,529, $85,823, $84,978, $82,503 and $46,783, respectively. |
| (10) | Calculated as dividends declared per common share divided by FFO per common share – diluted. |
| (11) | Calculated as dividends declared per common share divided by FFO per common share before loss from early extinguishment of debt – diluted. |
| (12) | Calculated as common stock dividends and Operating Partnership distributions declared of $21,710, $21,715, $21,715 and $21,603 for the three months ended December 31, September 30, June 30, and March 31, 2007, respectively, divided by AFFO of ($20,822), ($15,073), ($8,947) and $1,473 for the three months ended December 31, September 30, June 30 and March 31, 2007, respectively. As of the date of this report, our board of directors has not declared a dividend on our common stock and Operating Partnership units for the quarter ended March 31, 2008. There can be no assurance given that we will continue to make distributions on our common stock at historical levels or at all, unless required to maintain our REIT status. For a definition of AFFO, see page 44. For a quantitative reconciliation of the differences between AFFO and FFO, see page 14. |
| (13) | Assuming 100% conversion of the limited partnership units in the Operating Partnership into shares of our common stock. Our limited partners have the right to redeem all or part of their Operating Partnership units at any time. At the time of redemption, we have the right to determine whether to redeem the Operating Partnership units for cash, based upon the fair market value of an equivalent number of shares of our common stock at the time of redemption, or exchange them for shares of our common stock on a one-for-one basis, subject to adjustment in the event of stock splits, stock dividends, issuance of stock rights, specified extraordinary distribution and similar events. |
8
Maguire Properties, Inc.
Supplemental Operating and Financial Data
First Quarter 2008
Consolidated Balance Sheets
(unaudited and in thousands)
| | | | | | | | | | | | | | | | | | | | |
| | | March 31, 2008 | | | December 31, 2007 | | | September 30, 2007 | | | June 30, 2007 | | | March 31, 2007 | |
Assets | | | | | | | | | | | | | | | | | | | | |
Investments in real estate | | $ | 5,490,807 | | | $ | 5,439,044 | | | $ | 5,464,836 | | | $ | 5,507,161 | | | $ | 3,444,923 | |
Less: accumulated depreciation | | | (514,454 | ) | | | (476,337 | ) | | | (441,026 | ) | | | (408,610 | ) | | | (381,617 | ) |
| | | | | | | | | | | | | | | | | | | | |
| | | 4,976,353 | | | | 4,962,707 | | | | 5,023,810 | | | | 5,098,551 | | | | 3,063,306 | |
| Assets associated with real estate held for sale | | | – | | | | – | | | | – | | | | 148,754 | | | | – | |
| | | | | | | | | | | | | | | | | | | | |
| | | 4,976,353 | | | | 4,962,707 | | | | 5,023,810 | | | | 5,247,305 | | | | 3,063,306 | |
Cash, cash equivalents and restricted cash | | | 345,384 | | | | 414,092 | | | | 474,889 | | | | 459,269 | | | | 152,628 | |
Rents, deferred rents and other receivables, net | | | 85,116 | | | | 81,454 | | | | 75,890 | | | | 77,433 | | | | 69,111 | |
Deferred charges, net | | | 217,291 | | | | 230,994 | | | | 276,575 | | | | 289,681 | | | | 176,421 | |
Other assets | | | 46,903 | | | | 42,206 | | | | 41,270 | | | | 41,426 | | | | 36,706 | |
Investment in unconsolidated joint ventures | | | 16,759 | | | | 18,325 | | | | 19,557 | | | | 21,399 | | | | 22,859 | |
| | | | | | | | | | | | | | | | | | | | |
Total assets | | $ | 5,687,806 | | | $ | 5,749,778 | | | $ | 5,911,991 | | | $ | 6,136,513 | | | $ | 3,521,031 | |
| | | | | | | | | | | | | | | | | | | | |
| | | | | |
Liabilities, minority interests and stockholders’ equity | | | | | | | | | | | | | | | | | | | | |
Mortgage and other secured loans | | $ | 5,033,505 | | | $ | 5,003,341 | | | $ | 5,066,116 | | | $ | 5,232,969 | | | $ | 2,830,837 | |
Dividends and distributions payable | | | – | | | | 24,888 | | | | 24,892 | | | | 24,934 | | | | 24,934 | |
Accounts payable, accrued interest payable and other liabilities | | | 215,632 | | | | 207,741 | | | | 199,952 | | | | 180,858 | | | | 157,870 | |
Acquired below-market leases, net | | | 145,365 | | | | 155,824 | | | | 174,680 | | | | 188,225 | | | | 69,281 | |
Obligations associated with real estate held for sale | | | – | | | | – | | | | – | | | | 119,774 | | | | – | |
| | | | | | | | | | | | | | | | | | | | |
Total liabilities | | | 5,394,502 | | | | 5,391,794 | | | | 5,465,640 | | | | 5,746,760 | | | | 3,082,922 | |
| | | | | |
Minority interests | | | 4,904 | | | | 14,670 | | | | 26,624 | | | | 18,981 | | | | 25,606 | |
| | | | | |
Stockholders’ equity | | | | | | | | | | | | | | | | | | | | |
Common and preferred stock and additional paid-in capital | | | 695,235 | | | | 692,090 | | | | 690,411 | | | | 688,454 | | | | 683,061 | |
Accumulated deficit and dividends | | | (377,149 | ) | | | (331,735 | ) | | | (268,830 | ) | | | (331,730 | ) | | | (288,505 | ) |
Accumulated other comprehensive (loss) income, net | | | (29,686 | ) | | | (17,041 | ) | | | (1,854 | ) | | | 14,048 | | | | 17,947 | |
| | | | | | | | | | | | | | | | | | | | |
Total stockholders’ equity | | | 288,400 | | | | 343,314 | | | | 419,727 | | | | 370,772 | | | | 412,503 | |
| | | | | | | | | | | | | | | | | | | | |
Total liabilities, minority interests and stockholders' equity | | $ | 5,687,806 | | | $ | 5,749,778 | | | $ | 5,911,991 | | | $ | 6,136,513 | | | $ | 3,521,031 | |
| | | | | | | | | | | | | | | | | | | | |
9
Maguire Properties, Inc.
Supplemental Operating and Financial Data
First Quarter 2008
Consolidated Statements of Operations
(unaudited and in thousands, except share and per share data)
| | | | | | | | | | | | | | | | | | | | |
| | | For the Three Months Ended | |
| | | March 31, 2008 | | | December 31, 2007 | | | September 30, 2007 | | | June 30, 2007 | | | March 31, 2007 | |
Revenue: | | | | | | | | | | | | | | | | | | | | |
Rental | | $ | 92,158 | | | $ | 96,115 | | | $ | 98,313 | | | $ | 88,425 | | | $ | 57,748 | |
Tenant reimbursements | | | 28,766 | | | | 29,161 | | | | 27,782 | | | | 27,709 | | | | 20,665 | |
Hotel operations | | | 6,881 | | | | 7,260 | | | | 6,705 | | | | 7,061 | | | | 6,188 | |
Parking | | | 14,210 | | | | 13,965 | | | | 12,889 | | | | 11,785 | | | | 10,250 | |
Management, leasing and development services | | | 1,957 | | | | 2,510 | | | | 1,716 | | | | 3,403 | | | | 1,467 | |
Interest and other | | | 3,737 | | | | 5,935 | | | | 4,605 | | | | 3,377 | | | | 1,599 | |
| | | | | | | | | | | | | | | | | | | | |
Total revenue | | | 147,709 | | | | 154,946 | | | | 152,010 | | | | 141,760 | | | | 97,917 | |
| | | | | | | | | | | | | | | | | | | | |
| | | | | |
Expenses: | | | | | | | | | | | | | | | | | | | | |
Rental property operating and maintenance | | | 34,765 | | | | 35,434 | | | | 35,625 | | | | 29,919 | | | | 23,135 | |
Hotel operating and maintenance | | | 4,415 | | | | 4,548 | | | | 4,208 | | | | 4,391 | | | | 3,999 | |
Real estate taxes | | | 14,244 | | | | 14,653 | | | | 14,467 | | | | 12,699 | | | | 7,736 | |
Parking | | | 4,265 | | | | 5,079 | | | | 3,323 | | | | 3,667 | | | | 3,005 | |
General and administrative | | | 16,674 | | | | 9,789 | | | | 8,973 | | | | 11,152 | | | | 7,763 | |
Other expense | | | 1,528 | | | | 2,050 | | | | 1,949 | | | | 1,042 | | | | 136 | |
Depreciation and amortization | | | 53,108 | | | | 56,856 | | | | 60,421 | | | | 54,919 | | | | 28,977 | |
Interest | | | 69,749 | | | | 71,708 | | | | 70,081 | | | | 62,103 | | | | 29,998 | |
Loss from early extinguishment of debt | | | – | | | | 886 | | | | 12,440 | | | | 8,336 | | | | – | |
| | | | | | | | | | | | | | | | | | | | |
Total expenses | | | 198,748 | | | | 201,003 | | | | 211,487 | | | | 188,228 | | | | 104,749 | |
| | | | | | | | | | | | | | | | | | | | |
| | | | | |
Loss from continuing operations before equity in net loss of unconsolidated joint ventures and minority interests | | | (51,039 | ) | | | (46,057 | ) | | | (59,477 | ) | | | (46,468 | ) | | | (6,832 | ) |
Equity in net loss of unconsolidated joint ventures | | | (276 | ) | | | (426 | ) | | | (485 | ) | | | (531 | ) | | | (707 | ) |
Minority interests allocated to continuing operations | | | 7,490 | | | | 6,935 | | | | 8,777 | | | | 7,034 | | | | 1,675 | |
| | | | | | | | | | | | | | | | | | | | |
Loss from continuing operations | | | (43,825 | ) | | | (39,548 | ) | | | (51,185 | ) | | | (39,965 | ) | | | (5,864 | ) |
| | | | | | | | | | | | | | | | | | | | |
| | | | | |
Discontinued Operations: | | | | | | | | | | | | | | | | | | | | |
Loss from discontinued operations before gain on sale of real estate and minority interests | | | – | | | | (171 | ) | | | (2,214 | ) | | | (10,395 | ) | | | (2,265 | ) |
Gain on sale of real estate | | | – | | | | – | | | | 161,497 | | | | 33,890 | | | | – | |
Minority interests allocated to discontinued operations | | | – | | | | 23 | | | | (21,598 | ) | | | (3,194 | ) | | | 308 | |
| | | | | | | | | | | | | | | | | | | | |
(Loss) income from discontinued operations | | | – | | | | (148 | ) | | | 137,685 | | | | 20,301 | | | | (1,957 | ) |
| | | | | | | | | | | | | | | | | | | | |
| | | | | |
Net (loss) income | | | (43,825 | ) | | | (39,696 | ) | | | 86,500 | | | | (19,664 | ) | | | (7,821 | ) |
| | | | | |
Preferred stock dividends | | | (4,766 | ) | | | (4,766 | ) | | | (4,766 | ) | | | (4,766 | ) | | | (4,766 | ) |
| | | | | | | | | | | | | | | | | | | | |
| | | | | |
Net (loss) income available to common stockholders | | $ | (48,591 | ) | | $ | (44,462 | ) | | $ | 81,734 | | | $ | (24,430 | ) | | $ | (12,587 | ) |
| | | | | | | | | | | | | | | | | | | | |
| | | | | |
Basic income (loss) per common share: | | | | | | | | | | | | | | | | | | | | |
Loss from continuing operations available to common stockholders | | $ | (1.03 | ) | | $ | (0.95 | ) | | $ | (1.20 | ) | | $ | (0.95 | ) | | $ | (0.23 | ) |
Income (loss) from discontinued operations | | | – | | | | – | | | | 2.94 | | | | 0.43 | | | | (0.04 | ) |
| | | | | | | | | | | | | | | | | | | | |
Net (loss) income available to common stockholders | | $ | (1.03 | ) | | $ | (0.95 | ) | | $ | 1.74 | | | $ | (0.52 | ) | | $ | (0.27 | ) |
| | | | | | | | | | | | | | | | | | | | |
Weighted average number of common shares outstanding | | | 46,982,531 | | | | 46,870,622 | | | | 46,870,588 | | | | 46,678,583 | | | | 46,578,064 | |
| | | | | | | | | | | | | | | | | | | | |
| | | | | |
Diluted income (loss) per common share: | | | | | | | | | | | | | | | | | | | | |
Loss from continuing operations available to common stockholders | | $ | (1.03 | ) | | $ | (0.95 | ) | | $ | (1.19 | ) | | $ | (0.95 | ) | | $ | (0.23 | ) |
Income (loss) from discontinued operations | | | – | | | | – | | | | 2.93 | | | | 0.43 | | | | (0.04 | ) |
| | | | | | | | | | | | | | | | | | | | |
Net (loss) income available to common stockholders | | $ | (1.03 | ) | | $ | (0.95 | ) | | $ | 1.74 | | | $ | (0.52 | ) | | $ | (0.27 | ) |
| | | | | | | | | | | | | | | | | | | | |
Weighted average number of common and common equivalent shares outstanding | | | 46,982,531 | | | | 46,870,622 | | | | 46,893,916 | | | | 46,678,583 | | | | 46,578,064 | |
| | | | | | | | | | | | | | | | | | | | |
10
Maguire Properties, Inc.
Supplemental Operating and Financial Data
First Quarter 2008
Consolidated Statements of Discontinued Operations
(unaudited and in thousands)
| | | | | | | | | | | | | | | | |
| | | For the Three Months Ended | |
| | | December 31, 2007 | | | September 30, 2007 | | | June 30, 2007 | | | March 31, 2007 | |
Revenue: | | | | | | | | | | | | | | | | |
Rental | | $ | 21 | | | $ | 2,544 | | | $ | 11,150 | | | $ | 7,378 | |
Tenant reimbursements | | | (4 | ) | | | 271 | | | | 1,276 | | | | 1,050 | |
Parking | | | 1 | | | | 191 | | | | 302 | | | | 187 | |
Interest and other | | | (14 | ) | | | 25 | | | | 64 | | | | 62 | |
| | | | | | | | | | | | | | | | |
Total revenue | | | 4 | | | | 3,031 | | | | 12,792 | | | | 8,677 | |
| | | | | | | | | | | | | | | | |
| | | | |
Expenses: | | | | | | | | | | | | | | | | |
Rental property operating and maintenance | | | 140 | | | | 1,635 | | | | 2,504 | | | | 1,995 | |
Real estate taxes | | | 30 | | | | 233 | | | | 1,650 | | | | 859 | |
Parking | | | 5 | | | | 63 | | | | 44 | | | | 36 | |
Depreciation and amortization | | | – | | | | 1,023 | | | | 2,124 | | | | 3,712 | |
Interest | | | – | | | | 1,300 | | | | 7,974 | | | | 4,340 | |
Loss from early extinguishment of debt | | | – | | | | 991 | | | | 8,891 | | | | – | |
| | | | | | | | | | | | | | | | |
Total expenses | | | 175 | | | | 5,245 | | | | 23,187 | | | | 10,942 | |
| | | | | | | | | | | | | | | | |
| | | | |
Loss from discontinued operations before gain on sale of real estate and minority interests | | | (171 | ) | | | (2,214 | ) | | | (10,395 | ) | | | (2,265 | ) |
Gain on sale of real estate | | | – | | | | 161,497 | | | | 33,890 | | | | – | |
Minority interest allocated to discontinued operations | | | 23 | | | | (21,598 | ) | | | (3,194 | ) | | | 308 | |
| | | | | | | | | | | | | | | | |
| | | | |
(Loss) income from discontinued operations | | $ | (148 | ) | | $ | 137,685 | | | $ | 20,301 | | | $ | (1,957 | ) |
| | | | | | | | | | | | | | | | |
11
Maguire Properties, Inc.
Supplemental Operating and Financial Data
First Quarter 2008
MMO Unconsolidated Joint Venture Statements of Operations
(unaudited and in thousands)
| | | | | | | | | | | | | | | | | | | | |
| | | For the Three Months Ended | |
| | | March 31, 2008 | | | December 31, 2007 | | | September 30, 2007 | | | June 30, 2007 | | | March 31, 2007 | |
Revenue: | | | | | | | | | | | | | | | | | | | | |
Rental | | $ | 22,110 | | | $ | 21,458 | | | $ | 21,925 | | | $ | 20,144 | | | $ | 19,581 | |
Tenant reimbursements | | | 6,972 | | | | 7,857 | | | | 6,892 | | | | 7,777 | | | | 7,574 | |
Parking | | | 2,232 | | | | 2,426 | | | | 2,099 | | | | 2,222 | | | | 2,177 | |
Interest and other | | | 66 | | | | 67 | | | | 50 | | | | 290 | | | | 75 | |
| | | | | | | | | | | | | | | | | | | | |
Total revenue | | | 31,380 | | | | 31,808 | | | | 30,966 | | | | 30,433 | | | | 29,407 | |
| | | | | | | | | | | | | | | | | | | | |
| | | | | |
Expenses: | | | | | | | | | | | | | | | | | | | | |
Rental property operating and maintenance | | | 6,119 | | | | 6,563 | | | | 6,046 | | | | 6,113 | | | | 6,260 | |
Real estate taxes | | | 3,815 | | | | 3,797 | | | | 3,738 | | | | 3,629 | | | | 3,333 | |
Parking | | | 449 | | | | 411 | | | | 504 | | | | 441 | | | | 401 | |
Depreciation and amortization | | | 11,514 | | | | 12,250 | | | | 12,172 | | | | 12,140 | | | | 12,257 | |
Interest | | | 10,917 | | | | 11,061 | | | | 11,046 | | | | 10,928 | | | | 10,814 | |
Other | | | 1,255 | | | | 1,195 | | | | 1,277 | | | | 1,038 | | | | 1,098 | |
| | | | | | | | | | | | | | | | | | | | |
Total expenses | | | 34,069 | | | | 35,277 | | | | 34,783 | | | | 34,289 | | | | 34,163 | |
| | | | | | | | | | | | | | | | | | | | |
| | | | | |
Net loss | | $ | (2,689 | ) | | $ | (3,469 | ) | | $ | (3,817 | ) | | $ | (3,856 | ) | | $ | (4,756 | ) |
| | | | | | | | | | | | | | | | | | | | |
| | | | | |
Company share | | $ | (538 | ) | | $ | (694 | ) | | $ | (764 | ) | | $ | (771 | ) | | $ | (951 | ) |
Intercompany eliminations | | | 262 | | | | 268 | | | | 279 | | | | 240 | | | | 244 | |
| | | | | | | | | | | | | | | | | | | | |
| | | | | |
Equity in net loss of unconsolidated joint venture | | $ | (276 | ) | | $ | (426 | ) | | $ | (485 | ) | | $ | (531 | ) | | $ | (707 | ) |
| | | | | | | | | | | | | | | | | | | | |
12
Maguire Properties, Inc.
Supplemental Operating and Financial Data
First Quarter 2008
Funds from Operations
(unaudited and in thousands, except share and per share data)
| | | | | | | | | | | | | | | | | | | | |
| | | For the Three Months Ended | |
| | | March 31, 2008 | | | December 31, 2007 | | | September 30, 2007 | | | June 30, 2007 | | | March 31, 2007 | |
| | | | | |
Reconciliation of net (loss) income to funds from operations: | | | | | | | | | | | | | | | | | | | | |
Net (loss) income available to common stockholders | | $ | (48,591 | ) | | $ | (44,462 | ) | | $ | 81,734 | | | $ | (24,430 | ) | | $ | (12,587 | ) |
Add: Depreciation and amortization of real estate assets | | | 52,995 | | | | 56,733 | | | | 61,353 | | | | 56,925 | | | | 32,566 | |
Depreciation and amortization of real estate assets - unconsolidated joint ventures (2) | | | 2,303 | | | | 2,451 | | | | 2,434 | | | | 2,428 | | | | 2,451 | |
Minority interests | | | (7,490 | ) | | | (6,958 | ) | | | 12,821 | | | | (3,840 | ) | | | (1,983 | ) |
Deduct: Gain on sale of real estate | | | – | | | | – | | | | 161,497 | | | | 33,890 | | | | – | |
| | | | | | | | | | | | | | | | | | | | |
| | | | | |
Funds from operations available to common stockholders and unit holders (FFO) (1) | | $ | (783 | ) | | $ | 7,764 | | | $ | (3,155 | ) | | $ | (2,807 | ) | | $ | 20,447 | |
| | | | | | | | | | | | | | | | | | | | |
Company share of FFO (3) | | $ | (678 | ) | | $ | 6,715 | | | $ | (2,727 | ) | | $ | (2,426 | ) | | $ | 17,664 | |
| | | | | | | | | | | | | | | | | | | | |
FFO per share - basic | | $ | (0.01 | ) | | $ | 0.14 | | | $ | (0.06 | ) | | $ | (0.05 | ) | | $ | 0.38 | |
| | | | | | | | | | | | | | | | | | | | |
FFO per share - diluted | | $ | (0.01 | ) | | $ | 0.14 | | | $ | (0.06 | ) | | $ | (0.05 | ) | | $ | 0.38 | |
| | | | | | | | | | | | | | | | | | | | |
Weighted average number of common shares outstanding - basic | | | 46,982,531 | | | | 46,870,622 | | | | 46,870,588 | | | | 46,678,583 | | | | 46,578,064 | |
| | | | | | | | | | | | | | | | | | | | |
Weighted average number of common and common equivalent shares outstanding - diluted | | | 47,026,291 | | | | 46,899,660 | | | | 46,893,916 | | | | 46,891,402 | | | | 47,000,722 | |
| | | | | | | | | | | | | | | | | | | | |
Weighted average diluted shares and units | | | 54,319,693 | | | | 54,305,576 | | | | 54,299,832 | | | | 54,297,318 | | | | 54,406,638 | |
| | | | | | | | | | | | | | | | | | | | |
| | | | | |
Reconciliation of FFO to FFO before loss from early extinguishment of debt: | | | | | | | | | | | | | | | | | | | | |
| | | | | |
FFO available to common stockholders and unit holders (FFO) | | $ | (783 | ) | | $ | 7,764 | | | $ | (3,155 | ) | | $ | (2,807 | ) | | $ | 20,447 | |
Add: Loss from early
extinguishment of debt
included in continuing
operations | | | – | | | | 886 | | | | 12,440 | | | | 8,336 | | | | – | |
Loss from early extinguishment of debt included in discontinued operations | | | – | | | | – | | | | 991 | | | | 8,891 | | | | – | |
| | | | | | | | | | | | | | | | | | | | |
FFO before loss from early extinguishment of debt | | $ | (783 | ) | | $ | 8,650 | | | $ | 10,276 | | | $ | 14,420 | | | $ | 20,447 | |
| | | | | | | | | | | | | | | | | | | | |
Company share of FFO before loss from early extinguishment of debt (3) | | $ | (678 | ) | | $ | 7,477 | | | $ | 8,883 | | | $ | 12,461 | | | $ | 17,664 | |
| | | | | | | | | | | | | | | | | | | | |
FFO per share before loss from early extinguishment of debt - basic | | $ | (0.01 | ) | | $ | 0.16 | | | $ | 0.19 | | | $ | 0.27 | | | $ | 0.38 | |
| | | | | | | | | | | | | | | | | | | | |
FFO per share before loss from early extinguishment of debt - diluted | | $ | (0.01 | ) | | $ | 0.16 | | | $ | 0.19 | | | $ | 0.27 | | | $ | 0.38 | |
| | | | | | | | | | | | | | | | | | | | |
| (1) | For the definition and discussion of FFO, see page 43. |
| (2) | Amount represents our 20% ownership interest in the MMO joint venture. |
| (3) | Based on a weighted average interest in our Operating Partnership of approximately 86.6% for the three months ended March 31, 2008 and 86.4% for all periods presented during 2007. |
13
Maguire Properties, Inc.
Supplemental Operating and Financial Data
First Quarter 2008
Adjusted Funds from Operations (1)
(unaudited and in thousands)
| | | | | | | | | | | | | | | | | | | |
| | | For the Three Months Ended |
| | | March 31, 2008 | | | December 31, 2007 | | | September 30, 2007 | | | June 30, 2007 | | | March 31, 2007 |
FFO | | $ | (783 | ) | | $ | 7,764 | | | $ | (3,155 | ) | | $ | (2,807 | ) | | $ | 20,447 |
Add: Non-real estate depreciation | | | 113 | | | | 123 | | | | 91 | | | | 118 | | | | 123 |
Straight line ground lease expense | | | 609 | | | | 609 | | | | 1,015 | | | | – | | | | – |
Amortization of deferred financing costs | | | 3,597 | | | | 3,321 | | | | 1,523 | | | | 1,436 | | | | 1,141 |
Non-cash stock compensation | | | 2,266 | | | | 1,653 | | | | 2,232 | | | | 2,236 | | | | 1,732 |
Loss from early extinguishment of debt (2) | | | – | | | | 886 | | | | 13,431 | | | | 17,227 | | | | – |
| | | | | |
Deduct: Accretion of interest rate swap sold | | | – | | | | – | | | | 81 | | | | 122 | | | | 122 |
Straight line rent | | | 3,713 | | | | 2,907 | | | | 3,561 | | | | 3,709 | | | | 1,779 |
Fair value lease revenue | | | 8,267 | | | | 9,749 | | | | 9,900 | | | | 8,144 | | | | 1,871 |
Capitalized payments (3) | | | 8,852 | | | | 12,173 | | | | 9,711 | | | | 7,537 | | | | 7,679 |
Non-recoverable capital expenditures (4), (5) | | | 4,470 | | | | 3,413 | | | | 3,287 | | | | 2,989 | | | | 1,638 |
Recoverable capital expenditures | | | 292 | | | | 1,133 | | | | 532 | | | | 633 | | | | 560 |
Hotel improvements, equipment upgrades and replacements | | | 45 | | | | 172 | | | | 156 | | | | 148 | | | | 237 |
2nd generation tenant improvements and leasing commissions (6), (7) | | | 3,530 | | | | 5,048 | | | | 2,292 | | | | 2,957 | | | | 7,743 |
MMO joint venture AFFO adjustments | | | 418 | | | | 583 | | | | 690 | | | | 918 | | | | 341 |
| | | | | | | | | | | | | | | | | | | |
| | | | | |
Adjusted funds from operations (AFFO) | | $ | (23,785 | ) | | $ | (20,822 | ) | | $ | (15,073 | ) | | $ | (8,947 | ) | | $ | 1,473 |
| | | | | | | | | | | | | | | | | | | |
| (1) | For the definition and computation method of AFFO, see page 44. For a quantitative reconciliation of the differences between AFFO and cash flows from operating activities, see page 15. |
| (2) | The three months ended September 30, 2007 includes approximately $8 million of prepayment costs related to the refinancing of the KPMG Tower and approximately $1 million in losses from early extinguishment of debt attributable to discontinued operations. The three months ended June 30, 2007 includes approximately $9 million in losses from early extinguishment of debt attributable to discontinued operations and $2.3 million in cash defeasance costs funded from the net proceeds of the Wells Fargo Tower refinancing. |
| (3) | Includes capital lease principal payments, capitalized leasing and development payroll, and capitalized interest. |
| (4) | Excludes $3.3 million of non-recoverable capital expenditures at KPMG Tower as a result of discretionary renovation costs for the three months ended March 31, 2008. Excludes $0.3 million of non-recoverable capital expenditures related to planned renovation at Lantana Media Campus for the three months ended March 31, 2008. |
| (5) | Excludes $1.9 million of non-recoverable capital expenditures for the three months ended December 31, 2007 at KPMG Tower as a result of discretionary renovation costs. Excludes $0.2 million, $0.7 million, $0.3 million and $0.7 million of expenditures for the three months ended December 31, September 30, June 30, and March 31, 2007, respectively, related to planned renovation at Lantana Media Campus. |
| (6) | Excludes 1st generation tenant improvements and leasing commissions of $1.1 million, $1.1 million, $8.0 million, $1.8 million and $2.2 million for the three months ended March 31, 2008, and December 31, September 30, June 30 and March 31, 2007, respectively. |
| (7) | Excludes tenant improvements and leasing commissions paid using cash reserves that were funded through loan proceeds upon acquisition or debt refinancing of $11.3 million, $14.0 million, $8.2 million, $4.4 million and $4.1 million for the three months ended March 31, 2008, and December 31, September 30, June 30 and March 31, 2007, respectively. |
14
Maguire Properties, Inc.
Supplemental Operating and Financial Data
First Quarter 2008
Reconciliation of Earnings Before Interest, Taxes and Depreciation and Amortization (1) and Adjusted Funds From Operations (2)
(unaudited and in thousands)
| | | | | | | | | | | | | | | | | | | | |
| | | For the Three Months Ended | |
| | | March 31, 2008 | | | December 31, 2007 | | | September 30, 2007 | | | June 30, 2007 | | | March 31, 2007 | |
Reconciliation of net (loss) income to earnings before interest, taxes and depreciation and amortization (EBITDA): | | | | | | | | | | | | | | | | | | | | |
| | | | | |
Net (loss) income | | $ | (43,825 | ) | | $ | (39,696 | ) | | $ | 86,500 | | | $ | (19,664 | ) | | $ | (7,821 | ) |
Add: Minority interests | | | (7,490 | ) | | | (6,958 | ) | | | 12,821 | | | | (3,840 | ) | | | (1,983 | ) |
Interest expense (3) | | | 69,749 | | | | 71,708 | | | | 71,381 | | | | 70,077 | | | | 34,338 | |
Company share of interest expense included in unconsolidated joint ventures | | | 2,183 | | | | 2,212 | | | | 2,209 | | | | 2,186 | | | | 2,163 | |
Depreciation and amortization (4) | | | 53,108 | | | | 56,856 | | | | 61,444 | | | | 57,043 | | | | 32,689 | |
Company share of depreciation and amortization included in unconsolidated joint ventures | | | 2,303 | | | | 2,451 | | | | 2,434 | | | | 2,428 | | | | 2,451 | |
| | | | | | | | | | | | | | | | | | | | |
| | | | | |
EBITDA | | $ | 76,028 | | | $ | 86,573 | | | $ | 236,789 | | | $ | 108,230 | | | $ | 61,837 | |
| | | | | | | | | | | | | | | | | | | | |
| | | | | |
EBITDA | | $ | 76,028 | | | $ | 86,573 | | | $ | 236,789 | | | $ | 108,230 | | | $ | 61,837 | |
Add: Loss from early extinguishment of debt included in continuing operations | | | – | | | | 886 | | | | 12,440 | | | | 8,336 | | | | – | |
Loss from early extinguishment of debt included in discontinued operations | | | – | | | | – | | | | 991 | | | | 8,891 | | | | – | |
Deduct: Gain on sale of real estate | | | – | | | | – | | | | 161,497 | | | | 33,890 | | | | – | |
| | | | | | | | | | | | | | | | | | | | |
EBITDA before loss from early extinguishment of debt and gain on sale of real estate | | $ | 76,028 | | | $ | 87,459 | | | $ | 88,723 | | | $ | 91,567 | | | $ | 61,837 | |
| | | | | | | | | | | | | | | | | | | | |
| | | | | |
Reconciliation of cash flows from operating activities to adjusted funds from operations (AFFO): | | | | | | | | | | | | | | | | | | | | |
| | | | | |
Cash flows from operating activities | | $ | (12,201 | ) | | $ | (11,838 | ) | | $ | 23,523 | | | $ | 24,769 | | | $ | 9,288 | |
Changes in other assets and liabilities | | | (3,247 | ) | | | 782 | | | | (32,329 | ) | | | (26,989 | ) | | | 2,363 | |
Non-recoverable capital expenditures | | | (4,470 | ) | | | (3,413 | ) | | | (3,287 | ) | | | (2,989 | ) | | | (1,638 | ) |
Recoverable capital expenditures | | | (292 | ) | | | (1,133 | ) | | | (532 | ) | | | (633 | ) | | | (560 | ) |
Hotel improvements, equipment upgrades and replacements | | | (45 | ) | | | (172 | ) | | | (156 | ) | | | (148 | ) | | | (237 | ) |
2nd generation tenant improvements and leasing commissions (5), (6) | | | (3,530 | ) | | | (5,048 | ) | | | (2,292 | ) | | | (2,957 | ) | | | (7,743 | ) |
| | | | | | | | | | | | | | | | | | | | |
| | | | | |
AFFO | | $ | (23,785 | ) | | $ | (20,822 | ) | | $ | (15,073 | ) | | $ | (8,947 | ) | | $ | 1,473 | |
| | | | | | | | | | | | | | | | | | | | |
| (1) | For the definition and discussion of EBITDA, see page 44. |
| (2) | For the definition and discussion of AFFO, see page 44. |
| (3) | Includes interest expense of $1.3 million, $8.0 million and $4.3 million for the three months ended September 30, June 30 and March 31, 2007, respectively, related to discontinued operations. |
| (4) | Includes depreciation and amortization of $1.0 million, $2.1 million and $3.7 million for the three months ended September 30, June 30 and March 31, 2007, respectively, related to discontinued operations. |
| (5) | Excludes 1st generation tenant improvements and leasing commissions of $1.1 million, $1.1 million, $8.0 million, $1.8 million and $2.2 million for the three months ended March 31, 2008, and December 31, September 30, June 30 and March 31, 2007, respectively. |
| (6) | Excludes tenant improvements and leasing commissions paid by cash reserves that were funded through loan proceeds upon acquisition or debt refinancing of $11.3 million, $14.0 million, $8.2 million, $4.4 million and $4.1 million for the three months ended March 31, 2008, and December 31, September 30, June 30 and March 31, 2007, respectively. |
15
Maguire Properties, Inc.
Supplemental Operating and Financial Data
First Quarter 2008
Capital Structure
Debt
(in thousands)
| | | |
|
| |
| | | Balance as of
March 31, 2008 |
| |
Mortgage and other secured loans payable | | $ | 5,033,505 |
Revolving credit facility | | | – |
| | | |
Total consolidated debt | | | 5,033,505 |
Company share of MMO joint venture debt | | | 161,846 |
| | | |
Total combined debt | | $ | 5,195,351 |
| | | |
Equity
(in thousands)
| | | | | |
|
| | |
| | | Shares
Outstanding | | Total Liquidation
Preference |
| | |
Preferred stock | | 10,000 | | $ | 250,000 |
| | | | | |
| | |
| | | Shares & Units
Outstanding | | Market Value (1) |
Common stock | | 47,935 | | $ | 685,944 |
| | |
Operating partnership units | | 6,675 | | | 95,513 |
| | | | | |
Total common equity | | 54,610 | | $ | 781,457 |
| | | | | |
| | |
Total consolidated market capitalization | | | | $ | 6,064,962 |
| | | | | |
| | |
Total combined market capitalization(2) | | | | $ | 6,226,808 |
| | | | | |
| | (1) | Value based on the New York Stock Exchange closing price of $14.31 on March 31, 2008. |
| | (2) | Includes our share of MMO joint venture debt. |
16
Maguire Properties, Inc.
Supplemental Operating and Financial Data
First Quarter 2008
Debt Summary
(in thousands, except percentages)
| | | | | | | | | | | |
| | | Maturity Date | | Principal
Balance as of
March 31, 2008 | | % of
Debt | | | Interest
Rate as of
March 31, 2008 (1) | |
Floating-Rate Debt | | | | | | | | | | | |
| | | | |
Construction Loans: | | | | | | | | | | | |
3161 Michelson (2), (3) | | September 28, 2008 | | $ | 211,664 | | 4.21 | % | | 5.20 | % |
Lantana Media Campus (4) | | June 13, 2009 | | | 53,774 | | 1.07 | % | | 4.20 | % |
17885 Von Karman (4) | | December 30, 2008 | | | 28,713 | | 0.57 | % | | 4.50 | % |
2385 Northside Drive (4) | | February 22, 2009 | | | 19,184 | | 0.38 | % | | 4.60 | % |
207 Goode (4), (5) | | May 1, 2010 | | | 487 | | 0.01 | % | | 7.36 | % |
| | | | | | | | | | | |
Total construction loans | | | | | 313,822 | | 6.24 | % | | 4.93 | % |
| | | | | | | | | | | |
| | | | |
Variable-Rate Mortgage Loans: | | | | | | | | | | | |
Griffin Towers (6) | | May 1, 2008 | | | 200,000 | | 3.97 | % | | 4.60 | % |
500-600 City Parkway (7) | | May 9, 2009 | | | 97,750 | | 1.94 | % | | 4.05 | % |
Brea Corporate Place (8) | | May 1, 2009 | | | 70,468 | | 1.40 | % | | 4.65 | % |
Brea Financial Commons (8) | | May 1, 2009 | | | 38,532 | | 0.77 | % | | 4.65 | % |
| | | | | | | | | | | |
Total variable-rate mortgage loans | | | | | 406,750 | | 8.08 | % | | 4.48 | % |
| | | | | | | | | | | |
| | | | |
Variable-Rate Swapped to Fixed-Rate: | | | | | | | | | | | |
KPMG Tower (9) | | October 9, 2012 | | | 379,180 | | 7.53 | % | | 7.16 | % |
| | | | | | | | | | | |
Total variable-rate swapped to fixed-rate loan | | | | | 379,180 | | 7.53 | % | | 7.16 | % |
| | | | | | | | | | | |
| | | | |
Total floating-rate debt | | | | | 1,099,752 | | 21.85 | % | | 5.54 | % |
| | | | | | | | | | | |
| | | | |
Fixed-Rate Debt | | | | | | | | | | | |
Wells Fargo Tower (Los Angeles, CA) | | April 6, 2017 | | | 550,000 | | 10.93 | % | | 5.68 | % |
Two California Plaza (10) | | May 6, 2017 | | | 465,876 | | 9.25 | % | | 5.50 | % |
Gas Company Tower | | August 11, 2016 | | | 458,000 | | 9.10 | % | | 5.10 | % |
Pacific Arts Plaza | | April 1, 2012 | | | 270,000 | | 5.36 | % | | 5.15 | % |
777 Tower (10) | | November 1, 2013 | | | 269,342 | | 5.35 | % | | 5.84 | % |
US Bank Tower | | July 1, 2013 | | | 260,000 | | 5.16 | % | | 4.66 | % |
550 South Hope Street (10) | | May 6, 2017 | | | 198,304 | | 3.94 | % | | 5.67 | % |
Park Place I | | November 1, 2014 | | | 170,000 | | 3.38 | % | | 5.64 | % |
City Tower (10) | | May 10, 2017 | | | 139,818 | | 2.78 | % | | 5.85 | % |
Glendale Center | | August 11, 2016 | | | 125,000 | | 2.48 | % | | 5.82 | % |
500 Orange Tower (10) | | May 6, 2017 | | | 109,049 | | 2.17 | % | | 5.88 | % |
2600 Michelson (10) | | May 10, 2017 | | | 109,020 | | 2.17 | % | | 5.69 | % |
City Plaza (10) | | May 10, 2017 | | | 100,011 | | 1.99 | % | | 5.80 | % |
Park Place II | | March 11, 2012 | | | 100,000 | | 1.99 | % | | 5.39 | % |
Stadium Towers Plaza (10) | | May 11, 2017 | | | 99,142 | | 1.97 | % | | 5.78 | % |
Lantana Media Campus | | January 6, 2010 | | | 98,000 | | 1.95 | % | | 4.94 | % |
1920 Main Plaza (10) | | May 10, 2017 | | | 80,154 | | 1.59 | % | | 5.51 | % |
2010 Main Plaza (10) | | May 10, 2017 | | | 79,092 | | 1.57 | % | | 5.51 | % |
801 North Brand | | April 6, 2015 | | | 75,540 | | 1.50 | % | | 5.73 | % |
Mission City Corporate Center | | April 1, 2012 | | | 52,000 | | 1.03 | % | | 5.09 | % |
The City - 3800 Chapman | | May 6, 2017 | | | 44,370 | | 0.88 | % | | 5.93 | % |
701 North Brand | | October 1, 2016 | | | 33,750 | | 0.67 | % | | 5.87 | % |
700 North Central | | April 6, 2015 | | | 27,460 | | 0.55 | % | | 5.73 | % |
18581 Teller (10) | | May 6, 2017 | | | 19,825 | | 0.39 | % | | 5.65 | % |
| | | | | | | | | | | |
| | | | |
Total fixed-rate debt | | | | | 3,933,753 | | 78.15 | % | | 5.48 | % |
| | | | | | | | | | | |
| | | | |
Total consolidated debt | | | | $ | 5,033,505 | | 100.00 | % | | 5.50 | % |
| | | | | | | | | | | |
| (1) | The March 31, 2008 one-month LIBOR rate of 2.70% was used to calculate interest on the variable-rate loans. |
| (2) | We have entered into an interest rate cap agreement with respect to this loan that limits the LIBOR rate to a maximum rate of 5.50% for 75.0% of the outstanding balance, excluding extension periods. |
| (3) | Three one-year extensions are available at our option, subject to certain conditions. |
| (4) | One one-year extension is available at our option, subject to certain conditions. |
| (5) | This loan bears interest at a rate of LIBOR plus 1.80%. We have entered into a forward-starting interest rate swap agreement to hedge this loan up to $25.0 million, which effectively fixes the LIBOR rate at 5.564%. |
| (6) | This loan was refinanced in April 2008. See discussion in the Quarterly Highlights section on page 2. |
| (7) | As required by the loan agreement, we have entered into an interest rate cap agreement with respect to this loan that limits the LIBOR portion of the interest rate to 6.00% during the loan term, excluding extension periods. Three one-year extensions are available at our option, subject to certain conditions. |
| (8) | As required by the loan agreement, we have entered into an interest rate cap agreement with respect to this loan that limits the LIBOR portion of the interest rate to 6.50% during the loan term, excluding extension periods. Three one-year extensions are available at our option, subject to certain conditions. |
| (9) | This loan bears interest at a rate of LIBOR plus 1.60%. We have entered into a forward-starting interest rate swap agreement to hedge this loan, which effectively fixes the LIBOR rate at 5.564%. |
| (10) | These loans are reflected net of the related debt discount. At March 31, 2008, the discount for all loans referenced totals approximately $15 million. |
Revolving Credit Facility (maturing on April 24, 2011)
(in thousands)
| | | | | | | | | |
| | | |
| | | Maximum Available | | Currently Available (1) | | Drawn |
As of March 31, 2008 | | $ | 130,000 | | $ | 119,718 | | $ | – |
| | | | | | | | | |
| (1) | Amount available under this facility has been reduced by $10,282,000 to secure standby letters of credit, none of which have been drawn through the date of this report. As of March 31, 2008, there were no outstanding borrowings under our revolving credit facility. |
17
Maguire Properties, Inc.
Supplemental Operating and Financial Data
First Quarter 2008
MMO Joint Venture Debt Summary
(in thousands, except percentages)
| | | | | | | | | | | |
| | | Maturity Date | | Principal
Balance as of
March 31, 2008 | | % of
Debt | | | Interest
Rate as of
March 31, 2008 | |
| | | | |
Fixed-Rate Debt | | | | | | | | | | | |
Wells Fargo Center (Denver, CO) | | April 6, 2015 | | $ | 276,000 | | 34.11 | % | | 5.26 | % |
One California Plaza (1) | | December 1, 2010 | | | 144,228 | | 17.82 | % | | 4.73 | % |
San Diego Tech Center (2) | | April 11, 2015 | | | 136,117 | | 16.82 | % | | 5.70 | % |
Washington Mutual Irvine Campus (1) | | December 11, 2011 | | | 105,885 | | 13.08 | % | | 5.07 | % |
Cerritos Corporate Center (3) | | February 1, 2016 | | | 95,000 | | 11.74 | % | | 5.54 | % |
Stadium Gateway | | February 1, 2016 | | | 52,000 | | 6.43 | % | | 5.66 | % |
| | | | | | | | | | | |
Total fixed-rate debt | | | | | 809,230 | | 100.00 | % | | 5.27 | % |
| | | | | | | | | | | |
| | | | |
Total joint venture debt | | | | $ | 809,230 | | 100.00 | % | | 5.27 | % |
| | | | | | | | | | | |
| | | | |
Our portion of joint venture debt (4) | | | | $ | 161,846 | | | | | | |
| | | | | | | | | | | |
| (1) | These loans are reflected net of the related discount. At March 31, 2008, the total discount for all loans referenced totals approximately $1 million. |
| (2) | This loan includes the related premium of approximately $3 million as of March 31, 2008. |
| (3) | All monthly debt service payments are made by the joint venture. We are the guarantor on the loan through January 4, 2009. |
| (4) | We own 20% of the MMO joint venture. |
18
Maguire Properties, Inc.
Supplemental Operating and Financial Data
First Quarter 2008
Debt Maturities
(in thousands, except percentages)
| | | | | | | | | | | | | | | | | | | | | | | | | | | | |
| | | 2008 | | | 2009 | | | 2010 | | | 2011 | | | 2012 | | | Thereafter | | | Total | |
| | | | | | | |
Floating-Rate Debt | | | | | | | | | | | | | | | | | | | | | | | | | | | | |
| | | | | | | |
Construction Loans: | | | | | | | | | | | | | | | | | | | | | | | | | | | | |
3161 Michelson (1) | | $ | 211,664 | | | $ | – | | | $ | – | | | $ | – | | | $ | – | | | $ | – | | | $ | 211,664 | |
Lantana Media Campus (2) | | | – | | | | 53,774 | | | | – | | | | – | | | | – | | | | – | | | | 53,774 | |
17885 Von Karman (2) | | | 28,713 | | | | – | | | | – | | | | – | | | | – | | | | – | | | | 28,713 | |
2385 Northside Drive (2) | | | – | | | | 19,184 | | | | – | | | | – | | | | – | | | | – | | | | 19,184 | |
207 Goode (2) | | | – | | | | – | | | | 487 | | | | – | | | | – | | | | – | | | | 487 | |
| | | | | | | | | | | | | | | | | | | | | | | | | | | | |
| | | | | | | |
Total construction loans | | | 240,377 | | | | 72,958 | | | | 487 | | | | – | | | | – | | | | – | | | | 313,822 | |
| | | | | | | | | | | | | | | | | | | | | | | | | | | | |
Variable-Rate Mortgage Loans: | | | | | | | | | | | | | | | | | | | | | | | | | | | | |
Griffin Towers (3) | | | 200,000 | | | | – | | | | – | | | | – | | | | – | | | | – | | | | 200,000 | |
500-600 City Parkway (1) | | | – | | | | 97,750 | | | | – | | | | – | | | | – | | | | – | | | | 97,750 | |
Brea Corporate Place (1) | | | – | | | | 70,468 | | | | – | | | | – | | | | – | | | | – | | | | 70,468 | |
Brea Financial Commons (1) | | | – | | | | 38,532 | | | | – | | | | – | | | | – | | | | – | | | | 38,532 | |
| | | | | | | | | | | | | | | | | | | | | | | | | | | | |
| | | | | | | |
Total variable-rate mortgage loans | | | 200,000 | | | | 206,750 | | | | – | | | | – | | | | – | | | | – | | | | 406,750 | |
| | | | | | | | | | | | | | | | | | | | | | | | | | | | |
| | | | | | | |
Variable-Rate Swapped to Fixed-Rate: | | | | | | | | | | | | | | | | | | | | | | | | | | | | |
KPMG Tower | | | – | | | | – | | | | – | | | | – | | | | 379,180 | | | | – | | | | 379,180 | |
| | | | | | | | | | | | | | | | | | | | | | | | | | | | |
Total variable-rate swapped to fixed-rate loans | | | – | | | | – | | | | – | | | | – | | | | 379,180 | | | | – | | | | 379,180 | |
| | | | | | | | | | | | | | | | | | | | | | | | | | | | |
Total floating-rate mortgage loans | | | 440,377 | | | | 279,708 | | | | 487 | | | | – | | | | 379,180 | | | | – | | | | 1,099,752 | |
| | | | | | | | | | | | | | | | | | | | | | | | | | | | |
| | | | | | | |
Fixed-Rate Debt | | | | | | | | | | | | | | | | | | | | | | | | | | | | |
Wells Fargo Tower (Los Angeles, CA) | | | – | | | | – | | | | – | | | | – | | | | – | | | | 550,000 | | | | 550,000 | |
Two California Plaza | | | – | | | | – | | | | – | | | | – | | | | – | | | | 470,000 | | | | 470,000 | |
Gas Company Tower | | | – | | | | – | | | | – | | | | – | | | | – | | | | 458,000 | | | | 458,000 | |
Pacific Arts Plaza | | | – | | | | – | | | | – | | | | – | | | | 270,000 | | | | – | | | | 270,000 | |
777 Tower | | | – | | | | – | | | | – | | | | – | | | | – | | | | 273,000 | | | | 273,000 | |
US Bank Tower | | | – | | | | – | | | | – | | | | – | | | | – | | | | 260,000 | | | | 260,000 | |
550 South Hope Street | | | – | | | | – | | | | – | | | | – | | | | – | | | | 200,000 | | | | 200,000 | |
Park Place I | | | – | | | | – | | | | 2,232 | | | | 2,361 | | | | 2,498 | | | | 162,909 | | | | 170,000 | |
City Tower | | | – | | | | – | | | | – | | | | – | | | | – | | | | 140,000 | | | | 140,000 | |
Glendale Center | | | – | | | | – | | | | – | | | | – | | | | – | | | | 125,000 | | | | 125,000 | |
500 Orange Tower | | | – | | | | – | | | | – | | | | – | | | | – | | | | 110,000 | | | | 110,000 | |
2600 Michelson | | | – | | | | – | | | | – | | | | – | | | | – | | | | 110,000 | | | | 110,000 | |
City Plaza | | | – | | | | – | | | | – | | | | – | | | | – | | | | 101,000 | | | | 101,000 | |
Park Place II | | | – | | | | – | | | | – | | | | – | | | | 100,000 | | | | – | | | | 100,000 | |
Stadium Towers Plaza | | | – | | | | – | | | | – | | | | – | | | | – | | | | 100,000 | | | | 100,000 | |
Lantana Media Campus | | | – | | | | – | | | | 98,000 | | | | – | | | | – | | | | – | | | | 98,000 | |
1920 Main Plaza | | | – | | | | – | | | | – | | | | – | | | | – | | | | 80,875 | | | | 80,875 | |
2010 Main Plaza | | | – | | | | – | | | | – | | | | – | | | | – | | | | 79,803 | | | | 79,803 | |
801 North Brand | | | – | | | | – | | | | – | | | | – | | | | – | | | | 75,540 | | | | 75,540 | |
Mission City Corporate Center | | | – | | | | – | | | | – | | | | – | | | | 52,000 | | | | – | | | | 52,000 | |
The City - 3800 Chapman | | | – | | | | – | | | | – | | | | – | | | | – | | | | 44,370 | | | | 44,370 | |
701 North Brand | | | – | | | | – | | | | – | | | | – | | | | – | | | | 33,750 | | | | 33,750 | |
700 North Central | | | – | | | | – | | | | – | | | | – | | | | – | | | | 27,460 | | | | 27,460 | |
18581 Teller | | | – | | | | – | | | | – | | | | – | | | | – | | | | 20,000 | | | | 20,000 | |
| | | | | | | | | | | | | | | | | | | | | | | | | | | | |
| | | | | | | |
Total fixed-rate debt | | | – | | | | – | | | | 100,232 | | | | 2,361 | | | | 424,498 | | | | 3,421,707 | | | | 3,948,798 | |
| | | | | | | | | | | | | | | | | | | | | | | | | | | | |
| | | | | | | |
Total consolidated debt | | | 440,377 | | | | 279,708 | | | | 100,719 | | | | 2,361 | | | | 803,678 | | | | 3,421,707 | | | | 5,048,550 | |
| | | | | | | |
Debt discount | | | – | | | | – | | | | – | | | | – | | | | – | | | | (15,045 | ) | | | (15,045 | ) |
| | | | | | | | | | | | | | | | | | | | | | | | | | | | |
| | | | | | | |
Total consolidated debt, net of discount | | $ | 440,377 | | | $ | 279,708 | | | $ | 100,719 | | | $ | 2,361 | | | $ | 803,678 | | | $ | 3,406,662 | | | $ | 5,033,505 | |
| | | | | | | | | | | | | | | | | | | | | | | | | | | | |
| | | | | | | |
Weighted average interest rate | | | 4.88 | % | | | 4.35 | % | | | 4.96 | % | | | 5.64 | % | | | 6.13 | % | | | 5.53 | % | | | 5.50 | % |
| | | | | | | | | | | | | | | | | | | | | | | | | | | | |
| (1) | Three one-year extensions are available at our option, subject to certain conditions. |
| (2) | One one-year extension is available at our option, subject to certain conditions. |
| (3) | This loan was refinanced in April 2008. See discussion in the Quarterly Highlights section on page 2. |
19
Maguire Properties, Inc.
Supplemental Operating and Financial Data
First Quarter 2008
MMO Joint Venture Debt Maturities
(in thousands, except percentages)
| | | | | | | | | | | | | | | | | | | | | | | | | | | | |
Property | | 2008 | | | 2009 | | | 2010 | | | 2011 | | | 2012 | | | Thereafter | | | Total | |
Wells Fargo Center (Denver, CO) | | $ | – | | | $ | – | | | $ | – | | | $ | – | | | $ | – | | | $ | 276,000 | | | $ | 276,000 | |
One California Plaza | | | 2,122 | | | | 2,984 | | | | 140,202 | | | | – | | | | – | | | | – | | | | 145,308 | |
San Diego Tech Center | | | – | | | | – | | | | – | | | | – | | | | – | | | | 133,000 | | | | 133,000 | |
Washington Mutual Irvine Campus | | | – | | | | – | | | | – | | | | 106,000 | | | | – | | | | – | | | | 106,000 | |
Cerritos Corporate Center | | | – | | | | – | | | | – | | | | 1,054 | | | | 1,330 | | | | 92,616 | | | | 95,000 | |
Stadium Gateway | | | – | | | | – | | | | – | | | | – | | | | – | | | | 52,000 | | | | 52,000 | |
| | | | | | | | | | | | | | | | | | | | | | | | | | | | |
| | | 2,122 | | | | 2,984 | | | | 140,202 | | | | 107,054 | | | | 1,330 | | | | 553,616 | | | | 807,308 | |
| | | | | | | |
Debt premium, net of discount | | | – | | | | – | | | | (1,080 | ) | | | (115 | ) | | | – | | | | 3,117 | | | | 1,922 | |
| | | | | | | | | | | | | | | | | | | | | | | | | | | | |
| | | | | | | |
Total joint venture debt | | $ | 2,122 | | | $ | 2,984 | | | $ | 139,122 | | | $ | 106,939 | | | $ | 1,330 | | | $ | 556,733 | | | $ | 809,230 | |
| | | | | | | | | | | | | | | | | | | | | | | | | | | | |
| | | | | | | |
Weighted average interest rate | | | 4.73 | % | | | 4.73 | % | | | 4.73 | % | | | 5.07 | % | | | 5.54 | % | | | 5.45 | % | | | 5.27 | % |
| | | | | | | | | | | | | | | | | | | | | | | | | | | | |
20
Maguire Properties, Inc.
Supplemental Operating and Financial Data
First Quarter 2008
Portfolio Data
21
Maguire Properties, Inc.
Supplemental Operating and Financial Data
First Quarter 2008
Same Store Analysis
(unaudited and in thousands, except percentages)
| | | | | | | | | | | |
| | | For the Three Months Ended March 31, (1) | |
| | | 2008 | | | 2007 | | | %
Change | |
Total Same Store Portfolio | | | | | | | | | | | |
Number of properties | | | 14 | | | | 14 | | | | |
Square feet as of March 31 | | | 10,250,029 | | | | 10,251,716 | | | | |
Percentage of Wholly Owned Office Portfolio | | | 59.7 | % | | | 89.1 | % | | | |
Weighted average leased percentage (2) | | | 84.7 | % | | | 86.4 | % | | | |
| | | |
GAAP | | | | | | | | | | | |
Breakdown of Net Operating Income: | | | | | | | | | | | |
Operating revenues | | $ | 89,613 | | | $ | 89,343 | | | 0.3 | % |
Operating expenses | | | 34,110 | | | | 33,697 | | | 1.2 | % |
Other expenses | | | 62 | | | | 62 | | | | |
| | | | | | | | | | | |
Net operating income | | $ | 55,441 | | | $ | 55,584 | | | (0.3 | )% |
| | | | | | | | | | | |
| | | |
CASH BASIS | | | | | | | | | | | |
Breakdown of Net Operating Income: | | | | | | | | | | | |
Operating revenues | | $ | 86,900 | | | $ | 86,138 | | | 0.9 | % |
Operating expenses | | | 34,117 | | | | 33,703 | | | 1.2 | % |
Other expenses | | | 62 | | | | 62 | | | | |
| | | | | | | | | | | |
Net operating income | | $ | 52,721 | | | $ | 52,373 | | | 0.7 | % |
| | | | | | | | | | | |
| (1) | Properties included in the same store analysis are all the properties in our office portfolio, with the exception of our joint venture properties, properties acquired in the Blackstone Transaction in April 2007, the Wateridge Plaza, Pacific Center and Regents Square properties that were disposed of during 2007, 130 State College which was acquired in third quarter 2007, and 3161 Michelson which was placed in service in third quarter 2007. |
| (2) | Represents weighted average leased amounts for the same store portfolio. |
22
Maguire Properties, Inc.
Supplemental Operating and Financial Data
First Quarter 2008
Portfolio Overview
| | | | | | | | | | | | | | | | | | | | | | | | | | | | |
Property by Submarket | | Ownership | | | Square Feet | | | Leased % and In-Place Rents |
Property | | Number
of
Buildings | | Number
of
Tenants | | Year Built
/
Renovated | | % | | | Net
Building
Rentable | | Effective
(1) | | % of Net
Rentable | | | %
Leased | | | Total
Annualized
Rents (2) | | Effective
Annualized
Rents (2) | | Annualized
Rent $/
RSF (3) |
| | | | | | | | | | | |
Office Properties | | | | | | | | | | | | | | | | | | | | | | | | | | | | |
Los Angeles County | | | | | | | | | | | | | | | | | | | | | | | | | | | | |
Los Angeles Central Business District: | | | | | | | | | | | | | | | | | | | | | | | | | | | | |
Gas Company Tower | | 1 | | 18 | | 1991 | | 100 | % | | 1,325,017 | | 1,325,017 | | 6.27 | % | | 90.1 | % | | $ | 32,971,221 | | $ | 32,971,221 | | $ | 27.61 |
US Bank Tower | | 1 | | 48 | | 1989 | | 100 | % | | 1,396,177 | | 1,396,177 | | 6.60 | % | | 85.0 | % | | | 32,054,920 | | | 32,054,920 | | | 27.00 |
Wells Fargo Tower | | 2 | | 68 | | 1982 | | 100 | % | | 1,395,016 | | 1,395,016 | | 6.60 | % | | 94.0 | % | | | 26,635,071 | | | 26,635,071 | | | 20.31 |
Two California Plaza | | 1 | | 63 | | 1992 | | 100 | % | | 1,328,275 | | 1,328,275 | | 6.28 | % | | 94.2 | % | | | 24,301,150 | | | 24,301,150 | | | 19.42 |
KPMG Tower | | 1 | | 21 | | 1983 | | 100 | % | | 1,140,437 | | 1,140,437 | | 5.39 | % | | 68.9 | % | | | 16,027,129 | | | 16,027,129 | | | 20.40 |
777 Tower | | 1 | | 38 | | 1991 | | 100 | % | | 1,009,844 | | 1,009,844 | | 4.77 | % | | 94.7 | % | | | 19,339,834 | | | 19,339,834 | | | 20.22 |
550 South Hope Street | | 1 | | 46 | | 1991 | | 100 | % | | 565,738 | | 565,738 | | 2.68 | % | | 91.0 | % | | | 8,475,700 | | | 8,475,700 | | | 16.47 |
One California Plaza | | 1 | | 30 | | 1985 | | 20 | % | | 992,899 | | 198,580 | | 4.70 | % | | 88.9 | % | | | 17,186,741 | | | 3,437,348 | | | 19.47 |
| | | | | | | | | | | | | | | | | | | | | | | | | | | | |
Total LACBD Submarket | | 9 | | 332 | | | | | | | 9,153,403 | | 8,359,084 | | 43.29 | % | | 88.3 | % | | | 176,991,766 | | | 163,242,373 | | | 21.89 |
| | | | | | | | | | | |
Tri-Cities Submarket | | | | | | | | | | | | | | | | | | | | | | | | | | | | |
Glendale Center | | 2 | | 4 | | 1973/1996 | | 100 | % | | 386,318 | | 386,318 | | 1.83 | % | | 100.0 | % | | | 8,495,724 | | | 8,495,724 | | | 21.99 |
801 North Brand | | 1 | | 31 | | 1987 | | 100 | % | | 285,123 | | 285,123 | | 1.35 | % | | 85.2 | % | | | 4,512,816 | | | 4,512,816 | | | 18.58 |
701 North Brand | | 1 | | 13 | | 1978 | | 100 | % | | 131,129 | | 131,129 | | 0.62 | % | | 100.0 | % | | | 2,188,384 | | | 2,188,384 | | | 16.69 |
700 North Central | | 1 | | 21 | | 1979 | | 100 | % | | 134,168 | | 134,168 | | 0.63 | % | | 94.3 | % | | | 1,987,786 | | | 1,987,786 | | | 15.71 |
Plaza Las Fuentes | | 3 | | 9 | | 1989 | | 100 | % | | 192,958 | | 192,958 | | 0.91 | % | | 100.0 | % | | | 4,853,461 | | | 4,853,461 | | | 25.15 |
| | | | | | | | | | | | | | | | | | | | | | | | | | | | |
Total Tri-Cities Submarket | | 8 | | 78 | | | | | | | 1,129,696 | | 1,129,696 | | 5.34 | % | | 95.6 | % | | | 22,038,171 | | | 22,038,171 | | | 20.41 |
| | | | | | | | | | | |
Santa Monica Professional and Entertainment Submarket | | | | | | | | | | | | | | | | | | | | | | | | | | | | |
Lantana Media Campus | | 3 | | 22 | | 1989/2001 | | 100 | % | | 331,499 | | 331,499 | | 1.57 | % | | 86.5 | % | | | 10,085,902 | | | 10,085,902 | | | 35.17 |
| | | | | | | | | | | | | | | | | | | | | | | | | | | | |
Total Entertainment Submarket | | 3 | | 22 | | | | | | | 331,499 | | 331,499 | | 1.57 | % | | 86.5 | % | | | 10,085,902 | | | 10,085,902 | | | 35.17 |
| | | | | | | | | | | |
Cerritos Office Submarket | | | | | | | | | | | | | | | | | | | | | | | | | | | | |
Cerritos – Phase I | | 1 | | 1 | | 1999 | | 20 | % | | 221,968 | | 44,394 | | 1.05 | % | | 100.0 | % | | | 5,982,038 | | | 1,196,408 | | | 26.95 |
Cerritos – Phase II | | 1 | | — | | 2001 | | 20 | % | | 104,567 | | 20,913 | | 0.49 | % | | 100.0 | % | | | 2,482,420 | | | 496,484 | | | 23.74 |
| | | | | | | | | | | | | | | | | | | | | | | | | | | | |
Total Cerritos Submarket | | 2 | | 1 | | | | | | | 326,535 | | 65,307 | | 1.54 | % | | 100.0 | % | | | 8,464,458 | | | 1,692,892 | | | 25.92 |
| | | | | | | | | | | |
Total Los Angeles County | | 22 | | 433 | | | | | | | 10,941,133 | | 9,885,586 | | 51.74 | % | | 89.4 | % | | $ | 217,580,297 | | $ | 197,059,338 | | $ | 22.25 |
| | | | | | | | | | | | | | | | | | | | | | | | | | | | |
23
Maguire Properties, Inc.
Supplemental Operating and Financial Data
First Quarter 2008
Portfolio Overview (continued)
| | | | | | | | | | | | | | | | | | | | | | | | | | | | |
Property by Submarket | | Ownership | | | Square Feet | | | Leased % and In-Place Rents |
Property | | Number of
Buildings | | Number of
Tenants | | Year
Built /
Renovated | | % | | | Net
Building
Rentable | | Effective
(1) | | % of
Net
Rentable | | | %
Leased | | | Total
Annualized
Rents (2) | | Effective
Annualized
Rents (2) | | Annualized
Rent $/
RSF (3) |
| | | | | | | | | | | |
Office Properties | | | | | | | | | | | | | | | | | | | | | | | | | | | | |
Orange County | | | | | | | | | | | | | | | | | | | | | | | | | | | | |
John Wayne Airport Submarket | | | | | | | | | | | | | | | | | | | | | | | | | | | | |
| | | | | | | | | | | |
Park Place | | 8 | | 42 | | 1977/2002 | | 100 | % | | 1,786,041 | | 1,786,041 | | 8.44 | % | | 66.4 | % | | $ | 18,563,834 | | $ | 18,563,834 | | $ | 15.66 |
3161 Michelson | | 1 | | 3 | | 2007 | | 100 | % | | 532,141 | | 532,141 | | 2.52 | % | | 32.4 | % | | | 5,086,346 | | | 5,086,346 | | | 29.49 |
2600 Michelson | | 1 | | 32 | | 1986 | | 100 | % | | 307,692 | | 307,692 | | 1.46 | % | | 88.0 | % | | | 5,068,319 | | | 5,068,319 | | | 18.72 |
1920 Main Plaza | | 3 | | 34 | | 1988 | | 100 | % | | 305,050 | | 305,050 | | 1.44 | % | | 82.8 | % | | | 5,219,119 | | | 5,219,119 | | | 20.67 |
2010 Main Plaza | | 1 | | 28 | | 1988 | | 100 | % | | 280,975 | | 280,975 | | 1.33 | % | | 67.8 | % | | | 3,450,216 | | | 3,450,216 | | | 18.11 |
18581 Teller | | 1 | | 3 | | 1983 | | 100 | % | | 86,087 | | 86,087 | | 0.41 | % | | 100.0 | % | | | 1,362,066 | | | 1,362,066 | | | 15.82 |
Washington Mutual Irvine Campus | | 4 | | 2 | | 1989/2004 | | 20 | % | | 414,595 | | 82,919 | | 1.95 | % | | 100.0 | % | | | 9,078,994 | | | 1,815,799 | | | 21.90 |
17885 Von Karman Avenue | | 1 | | – | | 2008 | | 100 | % | | 151,370 | | 151,370 | | 0.72 | % | | 0.0 | % | | | – | | | – | | | – |
| | | | | | | | | | | | | | | | | | | | | | | | | | | | |
Total Airport Submarket | | 20 | | 144 | | | | | | | 3,863,951 | | 3,532,275 | | 18.27 | % | | 66.6 | % | | | 47,828,894 | | | 40,565,699 | | | 18.59 |
| | | | | | | | | | | |
Costa Mesa Submarket | | | | | | | | | | | | | | | | | | | | | | | | | | | | |
Griffin Towers | | 2 | | 39 | | 1987 | | 100 | % | | 543,299 | | 543,299 | | 2.57 | % | | 62.8 | % | | | 5,042,178 | | | 5,042,178 | | | 14.77 |
Pacific Arts Plaza | | 8 | | 43 | | 1982 | | 100 | % | | 785,231 | | 785,231 | | 3.71 | % | | 84.4 | % | | | 14,387,268 | | | 14,387,268 | | | 21.71 |
| | | | | | | | | | | | | | | | | | | | | | | | | | | | |
Total Costa Mesa Submarket | | 10 | | 82 | | | | | | | 1,328,530 | | 1,328,530 | | 6.28 | % | | 75.6 | % | | | 19,429,446 | | | 19,429,446 | | | 19.35 |
| | | | | | | | | | | |
Central Orange Submarket | | | | | | | | | | | | | | | | | | | | | | | | | | | | |
3800 Chapman | | 1 | | 1 | | 1984 | | 100 | % | | 157,231 | | 157,231 | | 0.74 | % | | 100.0 | % | | | 2,143,143 | | | 2,143,143 | | | 13.63 |
500-600 Parkway | | 3 | | 8 | | 1978 | | 100 | % | | 457,181 | | 457,181 | | 2.16 | % | | 14.0 | % | | | 1,021,655 | | | 1,021,655 | | | 15.92 |
City Tower | | 1 | | 29 | | 1988 | | 100 | % | | 410,068 | | 410,068 | | 1.94 | % | | 89.9 | % | | | 7,467,434 | | | 7,467,434 | | | 20.26 |
City Plaza | | 1 | | 33 | | 1969/1999 | | 100 | % | | 327,003 | | 327,003 | | 1.55 | % | | 53.2 | % | | | 2,626,550 | | | 2,626,550 | | | 15.09 |
500 Orange Tower | | 3 | | 42 | | 1987 | | 100 | % | | 333,733 | | 333,733 | | 1.58 | % | | 86.9 | % | | | 5,560,724 | | | 5,560,724 | | | 19.17 |
Stadium Towers Plaza | | 1 | | 30 | | 1988 | | 100 | % | | 257,321 | | 257,321 | | 1.22 | % | | 79.4 | % | | | 3,862,387 | | | 3,862,387 | | | 18.90 |
Stadium Gateway | | 1 | | 7 | | 2001 | | 20 | % | | 272,826 | | 54,565 | | 1.29 | % | | 90.2 | % | | | 5,106,322 | | | 1,021,264 | | | 20.75 |
| | | | | | | | | | | | | | | | | | | | | | | | | | | | |
Total Central Orange Submarket | | 11 | | 150 | | | | | | | 2,215,363 | | 1,997,102 | | 10.48 | % | | 67.9 | % | | | 27,788,215 | | | 23,703,157 | | | 18.47 |
| | | | | | | | | | | |
Other | | | | | | | | | | | | | | | | | | | | | | | | | | | | |
Brea Corporate Place | | 2 | | 16 | | 1987 | | 100 | % | | 328,892 | | 328,892 | | 1.56 | % | | 46.7 | % | | | 2,376,333 | | | 2,376,333 | | | 15.46 |
Brea Financial Commons Portfolio | | 3 | | 4 | | 1987 | | 100 | % | | 164,490 | | 164,490 | | 0.78 | % | | 49.1 | % | | | 1,563,746 | | | 1,563,746 | | | 19.35 |
130 State College | | 1 | | – | | 1983 | | 100 | % | | 43,449 | | 43,449 | | 0.20 | % | | 0.0 | % | | | – | | | – | | | – |
| | | | | | | | | | | | | | | | | | | | | | | | | | | | |
Total Other | | 6 | | 20 | | | | | | | 536,831 | | 536,831 | | 2.54 | % | | 43.7 | % | | | 3,940,079 | | | 3,940,079 | | | 16.80 |
| | | | | | | | | | | |
Total Orange County | | 47 | | 396 | | | | | | | 7,944,675 | | 7,394,738 | | 37.57 | % | | 66.9 | % | | $ | 98,986,634 | | $ | 87,638,381 | | $ | 18.62 |
| | | | | | | | | | | | | | | | | | | | | | | | | | | | |
24
Maguire Properties, Inc.
Supplemental Operating and Financial Data
First Quarter 2008
Portfolio Overview (continued)
| | | | | | | | | | | | | | | | | | | | | | | | | | | | |
Property by Submarket | | Ownership | | | Square Feet | | | Leased % and In-Place Rents |
Property | | Number
of
Buildings | | Number
of
Tenants | | Year
Built /
Renovated | | % | | | Net
Building
Rentable | | Effective
(1) | | % of Net
Rentable | | | %
Leased | | | Total
Annualized
Rents (2) | | Effective
Annualized
Rents (2) | | Annualized
Rent $/
RSF (3) |
| | | | | | | | | | | |
San Diego County | | | | | | | | | | | | | | | | | | | | | | | | | | | | |
| | | | | | | | | | | |
Sorrento Mesa Submarket | | | | | | | | | | | | | | | | | | | | | | | | | | | | |
San Diego Tech Center | | 11 | | 31 | | 1984/1986 | | 20 | % | | 645,934 | | 129,187 | | 3.06 | % | | 97.3 | % | | $ | 12,134,032 | | $ | 2,426,806 | | $ | 19.32 |
| | | | | | | | | | | | | | | | | | | | | | | | | | | | |
Total Sorento Mesa Submarket | | 11 | | 31 | | | | | | | 645,934 | | 129,187 | | 3.06 | % | | 97.3 | % | | | 12,134,032 | | | 2,426,806 | | | 19.32 |
| | | | | | | | | | | |
Mission Valley Submarket | | | | | | | | | | | | | | | | | | | | | | | | | | | | |
Mission City Corporate Center | | 3 | | 13 | | 1990 | | 100 | % | | 190,634 | | 190,634 | | 0.90 | % | | 82.8 | % | | | 3,799,874 | | | 3,799,874 | | | 24.08 |
2385 Northside | | 1 | | – | | 2008 | | 100 | % | | 88,795 | | 88,795 | | 0.42 | % | | 0.0 | % | | | – | | | – | | | – |
| | | | | | | | | | | | | | | | | | | | | | | | | | | | |
Total Mission Valley Submarket | | 4 | | 13 | | | | | | | 279,429 | | 279,429 | | 1.32 | % | | 56.5 | % | | | 3,799,874 | | | 3,799,874 | | | 24.08 |
| | | | | | | | | | | |
Total San Diego County | | 15 | | 44 | | | | | | | 925,363 | | 408,616 | | 4.38 | % | | 84.9 | % | | $ | 15,933,906 | | $ | 6,226,680 | | $ | 20.27 |
| | | | | | | | | | | | | | | | | | | | | | | | | | | | |
| | | | | | | | | | | |
Other | | | | | | | | | | | | | | | | | | | | | | | | | | | | |
Denver, CO - Downtown Submarket | | | | | | | | | | | | | | | | | | | | | | | | | | | | |
Wells Fargo Center - Denver | | 1 | | 41 | | 1983 | | 20 | % | | 1,211,773 | | 242,354 | | 5.73 | % | | 95.2 | % | | | 21,860,208 | | | 4,372,042 | | | 18.95 |
| | | | | | | | | | | | | | | | | | | | | | | | | | | | |
Total Other | | 1 | | 41 | | | | | | | 1,211,773 | | 242,354 | | 5.73 | % | | 95.2 | % | | | 21,860,208 | | | 4,372,042 | | | 18.95 |
| | | | | | | | | | | |
Total Office Properties | | 85 | | 914 | | | | | | | 21,022,944 | | 17,931,294 | | 99.42 | % | | 81.0 | % | | $ | 354,361,045 | | $ | 295,296,441 | | $ | 20.81 |
| | | | | | | | | | | | | | | | | | | | | | | | | | | | |
25
Maguire Properties, Inc.
Supplemental Operating and Financial Data
First Quarter 2008
Portfolio Overview (continued)
| | | | | | | | | | | | | | | | | | | | | | | | | | | | |
Property by Submarket | | Ownership | | | Square Feet | | | Leased % and In-Place Rents |
Property | | Number
of
Buildings | | Number
of
Tenants | | Year
Built /
Renovated | | % | | | Net
Building
Rentable | | Effective
(1) | | % of
Net
Rentable | | | %
Leased | | | Total
Annualized
Rents (2) | | Effective
Annualized
Rents (2) | | Annualized
Rent $/
RSF (3) |
Retail Property | | | | | | | | | | | | | | | | | | | | | | | | | | | | |
John Wayne Airport Submarket | | | | | | | | | | | | | | | | | | | | | | | | | | | | |
| | | | | | | | | | | |
Park Place | | 8 | | 24 | | 1981 | | 100 | % | | 122,533 | | 122,533 | | 0.58 | % | | 91.8 | % | | $ | 3,388,165 | | $ | 3,388,165 | | $ | 30.11 |
| | | | | | | | | | | | | | | | | | | | | | | | | | | | |
Total Retail Properties | | 8 | | 24 | | | | | | | 122,533 | | 122,533 | | 0.58 | % | | 91.8 | % | | | 3,388,165 | | | 3,388,165 | | | 30.11 |
| | | | | | | | | | | |
Total Office and Retail Properties | | 93 | | 938 | | | | | | | 21,145,477 | | 18,053,827 | | 100.00 | % | | 81.1 | % | | $ | 357,749,210 | | $ | 298,684,606 | | $ | 20.87 |
| | | | | | | | | | | | | | | | | | | | | | | | | | | | |
Effective Office and Retail Properties | | | | | | | | | | | 18,053,827 | | | | | | | 78.8 | % | | | | | | | | $ | 21.00 |
| | | | | | | | | | | | | | | | | | | | | | | | | | | | |
| | | | | | | | | | | |
Hotel Property | | | | | | | | | | | SQFT | | Effective
SQFT | | Number
of
Rooms | | | | | | | | | | |
Westin Hotel, Pasadena, CA | | | | | | | | 100 | % | | 266,000 | | 266,000 | | 350 | | | | | | | | | | | | | |
| | | | | | | | | | | | | | | | | | | | | | | | | | | | |
Total Hotel Property | | | | | | | | | | | 266,000 | | 266,000 | | 350 | | | | | | | | | | | | | |
| | | | | | | | | | | | | | | | | | | | | | | | | | | | |
Total – Office, Retail, and Hotel | | | | | | | | | | | 21,411,477 | | 18,319,827 | | | | | | | | | | | | | | | |
| | | | | | | | | | | | | | | | | | | | | | | | | | | | |
| | | | | | | | | | | |
Parking Properties | | | | | | | | | | | SQFT | | Effective
SQFT | | Vehicle
Capacity | | | Effective
Vehicle
Capacity | | | Annualized
Parking
Revenue (4) | | Effective
Annualized
Parking
Revenue (5) | | Effective
Annualized
Parking
Revenue
per Vehicle
Capacity
(6) |
On-Site Parking | | | | | | | | | | | 12,091,000 | | 10,241,306 | | 41,054 | | | 34,676 | | | $ | 54,276,545 | | $ | 47,133,697 | | $ | 1,359 |
Off-Site Garages | | | | | | | | | | | 1,815,453 | | 1,815,453 | | 5,729 | | | 5,729 | | | | 12,456,755 | | | 12,456,755 | | | 2,174 |
| | | | | | | | | | | | | | | | | | | | | | | | | | | | |
Total Parking Properties | | | | | | | | | | | 13,906,453 | | 12,056,759 | | 46,783 | | | 40,405 | | | $ | 66,733,300 | | $ | 59,590,452 | | $ | 1,475 |
| | | | | | | | | | | | | | | | | | | | | | | | | | | | |
Total – Office, Retail, Hotel and Parking Properties | | | | | | | | | | | 35,317,930 | | 30,376,586 | | | | | | | | | | | | | | | |
| | | | | | | | | | | | | | | | | | | | | | | | | | | | |
| (1) | Includes 100% of our consolidated portfolio and 20% of our MMO joint venture portfolio. |
| (2) | Annualized rent represents the annualized monthly contractual rent under existing leases as of March 31, 2008. This amount reflects total base rent before any one-time or non-recurring rent abatements but after annually recurring rent credits and is shown on a net basis; thus, for any tenant under a partial gross lease, the expense stop, or under a fully gross lease, the current year operating expenses (which may be estimates as of such date), are subtracted from gross rent. |
| (3) | Annualized rent per rentable square foot represents annualized rent as computed above, divided by the total square footage under lease as of the same date. (4) Annualized parking revenue represents the annualized quarterly parking revenue as of March 31, 2008. |
| (5) | Effective annualized parking revenue represents the annualized quarterly parking revenue as of March 31, 2008 adjusted to include 100% of our consolidated portfolio and 20% of our MMO joint venture portfolio. |
| (6) | Effective annualized parking revenue per vehicle capacity represents the annualized parking revenue as computed above, divided by the vehicle capacity. |
26
Maguire Properties, Inc.
Supplemental Operating and Financial Data
First Quarter 2008
Portfolio Geographic Distribution (1)
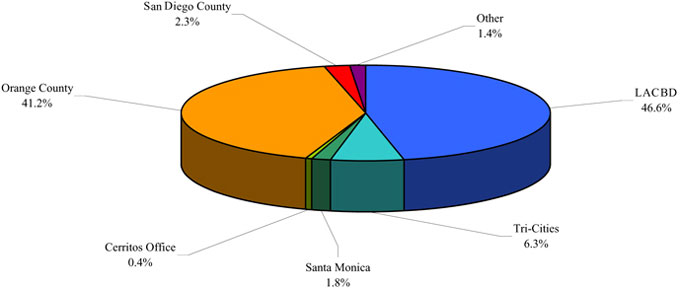
| (1) | The Portfolio Geographic Distribution is based on effective net rentable square feet for our Office Properties and includes our pro-rata share of the MMO joint venture. |
27
Maguire Properties, Inc.
Supplemental Operating and Financial Data
First Quarter 2008
Portfolio Overview — Leased Rates and Weighted Average Remaining Lease Term
| | | | | | | | | | | | | | | | | | | |
| | | Ownership
Interest
( % ) | | Weighted
Average
Remaining
Lease Term
(in years) | | % Leased
Q1 2008 | | | % Leased
Q4 2007 | | | % Leased
Q3 2007 | | | % Leased
Q2 2007 | | | % Leased
Q1 2007 | |
Gas Company Tower | | 100% | | 6.5 | | 90.1 | % | | 89.4 | % | | 86.5 | % | | 90.1 | % | | 92.2 | % |
US Bank Tower | | 100% | | 4.2 | | 85.0 | % | | 85.4 | % | | 85.3 | % | | 85.3 | % | | 85.5 | % |
Wells Fargo Tower | | 100% | | 6.1 | | 94.0 | % | | 92.8 | % | | 92.2 | % | | 93.1 | % | | 91.6 | % |
KPMG Tower | | 100% | | 7.2 | | 68.9 | % | | 69.0 | % | | 67.9 | % | | 68.1 | % | | 66.2 | % |
777 Tower | | 100% | | 5.1 | | 94.7 | % | | 94.1 | % | | 93.5 | % | | 92.4 | % | | 90.3 | % |
One California Plaza | | 20% | | 5.0 | | 88.9 | % | | 89.3 | % | | 86.2 | % | | 88.1 | % | | 87.9 | % |
Glendale Center | | 100% | | 4.0 | | 100.0 | % | | 100.0 | % | | 100.0 | % | | 100.0 | % | | 100.0 | % |
801 North Brand | | 100% | | 3.4 | | 85.2 | % | | 85.8 | % | | 86.3 | % | | 86.9 | % | | 86.8 | % |
701 North Brand | | 100% | | 6.1 | | 100.0 | % | | 100.0 | % | | 100.0 | % | | 100.0 | % | | 100.0 | % |
700 North Central | | 100% | | 3.9 | | 94.3 | % | | 92.2 | % | | 92.2 | % | | 92.2 | % | | 92.2 | % |
Plaza Las Fuentes | | 100% | | 9.9 | | 100.0 | % | | 100.0 | % | | 100.0 | % | | 100.0 | % | | 100.0 | % |
Lantana Media Campus | | 100% | | 3.8 | | 86.5 | % | | 85.8 | % | | 93.1 | % | | 94.8 | % | | 94.4 | % |
Cerritos - Phase I | | 20% | | 6.5 | | 100.0 | % | | 100.0 | % | | 100.0 | % | | 100.0 | % | | 100.0 | % |
Cerritos - Phase II | | 20% | | 3.2 | | 100.0 | % | | 100.0 | % | | 100.0 | % | | 100.0 | % | | 100.0 | % |
Park Place | | 100% | | 2.6 | | 66.4 | % | | 71.0 | % | | 80.9 | % | | 83.0 | % | | 84.9 | % |
3161 Michelson | | 100% | | 11.2 | | 32.4 | % | | 32.4 | % | | 59.9 | % | | – | | | – | |
Washington Mutual Irvine Campus | | 20% | | 4.7 | | 100.0 | % | | 100.0 | % | | 100.0 | % | | 100.0 | % | | 100.0 | % |
17885 Von Karman Avenue | | 100% | | 0.0 | | 0.0 | % | | | | | | | | | | | | |
Pacific Arts Plaza | | 100% | | 6.0 | | 84.4 | % | | 85.0 | % | | 84.9 | % | | 87.3 | % | | 90.1 | % |
Stadium Gateway | | 20% | | 4.3 | | 90.2 | % | | 91.8 | % | | 91.8 | % | | 100.0 | % | | 100.0 | % |
Mission City Corporate Center | | 100% | | 3.6 | | 82.8 | % | | 84.6 | % | | 99.0 | % | | 97.7 | % | | 97.7 | % |
2385 Northside Drive | | 100% | | 0.0 | | 0.0 | % | | | | | | | | | | | | |
San Diego Tech Center | | 20% | | 2.5 | | 97.3 | % | | 98.6 | % | | 98.7 | % | | 99.2 | % | | 98.7 | % |
Wells Fargo Center - Denver | | 20% | | 7.3 | | 95.2 | % | | 95.2 | % | | 95.2 | % | | 97.2 | % | | 96.1 | % |
Park Place - Retail | | 100% | | 6.5 | | 91.8 | % | | 95.1 | % | | 98.7 | % | | 97.4 | % | | 98.2 | % |
Two California Plaza | | 100% | | 5.6 | | 94.2 | % | | 93.1 | % | | 90.9 | % | | 90.9 | % | | – | |
550 South Hope Street | | 100% | | 5.6 | | 91.0 | % | | 91.0 | % | | 91.0 | % | | 90.4 | % | | – | |
2600 Michelson | | 100% | | 2.8 | | 88.0 | % | | 85.1 | % | | 95.0 | % | | 94.3 | % | | – | |
1920 Main Plaza | | 100% | | 2.7 | | 82.8 | % | | 81.7 | % | | 87.6 | % | | 88.6 | % | | – | |
2010 Main Plaza | | 100% | | 2.1 | | 67.8 | % | | 71.1 | % | | 72.0 | % | | 70.9 | % | | – | |
3800 Chapman | | 100% | | 3.3 | | 100.0 | % | | 100.0 | % | | 100.0 | % | | 100.0 | % | | – | |
18581 Teller | | 100% | | 2.2 | | 100.0 | % | | 100.0 | % | | 79.6 | % | | 100.0 | % | | – | |
Griffin Towers | | 100% | | 3.5 | | 62.8 | % | | 77.1 | % | | 78.1 | % | | 79.2 | % | | – | |
500-600 Parkway | | 100% | | 2.4 | | 14.0 | % | | 13.6 | % | | 13.6 | % | | 96.7 | % | | – | |
City Tower | | 100% | | 3.3 | | 89.9 | % | | 90.2 | % | | 81.8 | % | | 98.2 | % | | – | |
City Plaza | | 100% | | 1.9 | | 53.2 | % | | 56.6 | % | | 56.5 | % | | 88.5 | % | | – | |
500 Orange Tower | | 100% | | 3.7 | | 86.9 | % | | 94.4 | % | | 94.0 | % | | 93.8 | % | | – | |
Stadium Towers Plaza | | 100% | | 2.1 | | 79.4 | % | | 79.4 | % | | 92.0 | % | | 93.1 | % | | – | |
Brea Corporate Place | | 100% | | 3.2 | | 46.7 | % | | 66.8 | % | | 98.6 | % | | 99.0 | % | | – | |
Brea Financial Commons Portfolio | | 100% | | 6.2 | | 49.1 | % | | 49.1 | % | | 100.0 | % | | 100.0 | % | | – | |
130 State College | | 100% | | 0.0 | | 0.0 | % | | 0.0 | % | | 100.0 | % | | – | | | – | |
| | | | | | | |
| | | | | | | | | | | | | | | | | | | |
Total Portfolio | | | | 5.0 | | 81.1 | % | | 83.2 | % | | 85.6 | % | | 90.0 | % | | 89.9 | % |
| | | | | | | | | | | | | | | | | | | |
| | | | | | | |
Effective Portfolio (1) | | | | 4.9 | | 78.8 | % | | 81.1 | % | | 84.2 | % | | 89.0 | % | | 88.5 | % |
| | | | | | | | | | | | | | | | | | | |
| (1) | Includes 100% of our consolidated portfolio and 20% of our MMO Joint Venture portfolio. |
28
Maguire Properties, Inc.
Supplemental Operating and Financial Data
First Quarter 2008
Major Tenants — Office Properties
| | | | | | | | | | | | | | | | | |
| | | Tenant | | Number
of
Locations | | Annualized
Rent (1) | | % of Total
Annualized
Rent | | Total Leased
Square Feet | | % of
Aggregate
Leased
Square
Feet
of Existing
Portfolio | | Weighted
Average
Remaining
Lease
Term in
Months | | S & P Credit Rating /
National Recognition (2) |
| | Rated | | | | | | | | | | | | | | | |
1 | | Southern California Gas Company | | 1 | | $ | 21,283,883 | | 7.1% | | 576,516 | | 4.1% | | 43 | | A |
2 | | Sempra (Pacific Enterprises) | | 1 | | | 8,504,539 | | 2.9% | | 225,756 | | 1.6% | | 27 | | A |
3 | | Wells Fargo Bank (3) | | 4 | | | 6,609,560 | | 2.2% | | 393,765 | | 2.8% | | 78 | | AA+ |
4 | | Bank of America (3) | | 4 | | | 4,175,636 | | 1.4% | | 189,338 | | 1.3% | | 43 | | AA |
5 | | Disney Enterprises | | 1 | | | 3,706,960 | | 1.2% | | 156,215 | | 1.1% | | 39 | | A |
6 | | US Bank, National Association | | 3 | | | 3,784,704 | | 1.3% | | 162,090 | | 1.1% | | 84 | | AAA |
7 | | State Farm Mutual Auto Insurance Company | | 3 | | | 2,618,861 | | 0.9% | | 171,497 | | 1.2% | | 21 | | AA |
8 | | Washington Mutual, FA (3) | | 1 | | | 2,271,661 | | 0.8% | | 100,136 | | 0.7% | | 49 | | BBB+ |
9 | | GMAC Mortgage Corporation | | 1 | | | 2,499,091 | | 0.8% | | 130,161 | | 0.9% | | 69 | | AAA |
10 | | Home Depot | | 1 | | | 2,143,142 | | 0.7% | | 157,231 | | 1.1% | | 40 | | BBB+ |
| | | | | | | | | | | | | | | | | |
| | | | | | | | |
| | Total Rated / Weighted Average (3), (4) | | | | | 57,598,037 | | 19.3% | | 2,262,705 | | 15.9% | | 50 | | |
| | | | | | | | | | | | | | | | | |
| | | | | | | | |
| | Total Investment Grade Tenants (3) | | | | | 103,851,795 | | 34.8% | | 4,635,843 | | 32.6% | | | | |
| | | | | | | | | | | | | | | | | |
| | | | | | | | |
| | Unrated - Nationally Recognized | | | | | | | | | | | | | | | |
11 | | Latham & Watkins | | 2 | | | 9,813,441 | | 3.3% | | 382,716 | | 2.7% | | 179 | | 2nd Largest US Law Firm |
12 | | Gibson Dunn & Crutcher | | 2 | | | 8,843,741 | | 3.0% | | 354,721 | | 2.5% | | 115 | | 19th Largest US Law Firm |
13 | | Deloitte & Touche | | 1 | | | 5,216,904 | | 1.8% | | 342,094 | | 2.4% | | 84 | | Largest US Accounting Firm |
14 | | Marsh USA, Inc. | | 1 | | | 3,727,695 | | 1.2% | | 212,721 | | 1.5% | | 121 | | World’s Largest Insurance Broker |
15 | | KPMG | | 1 | | | 3,612,487 | | 1.2% | | 175,971 | | 1.3% | | 75 | | 4th Largest US Accounting Firm |
16 | | Morrison & Foerster | | 1 | | | 3,469,400 | | 1.2% | | 138,776 | | 1.0% | | 66 | | 22nd Largest US Law Firm |
17 | | Munger Tolles & Olson | | 1 | | | 3,374,322 | | 1.1% | | 160,682 | | 1.1% | | 167 | | 129th Largest US Law Firm |
18 | | PricewaterhouseCoopers | | 1 | | | 2,988,225 | | 1.0% | | 160,784 | | 1.1% | | 62 | | 3rd Largest US Accounting Firm |
19 | | Bingham McCutchen, LLP | | 1 | | | 2,442,677 | | 0.8% | | 104,712 | | 0.7% | | 58 | | 27th Largest US Law Firm |
20 | | Sidley & Austin | | 1 | | | 2,456,316 | | 0.8% | | 187,362 | | 1.3% | | 189 | | 5th Largest US Law Firm |
| | | | | | | | | | | | | | | | | |
| | | | | | | | |
| | Total Unrated / Weighted Average (3), (4) | | | | | 45,945,208 | | 15.4% | | 2,220,539 | | 15.6% | | 119 | | |
| | | | | | | | | | | | | | | | | |
| | | | | | | | |
| | Total Nationally Recognized Tenants (3) | | | | | 75,088,269 | | 25.1% | | 3,623,738 | | 25.5% | | | | |
| | | | | | | | | | | | | | | | | |
| | | | | | | | |
| | Total / Weighted Average (3), (4) | | | | $ | 103,543,245 | | 34.7% | | 4,483,244 | | 31.5% | | 84 | | |
| | | | | | | | | | | | | | | | | |
| | | | | | | | |
| | Total Investment Grade or Nationally Recognized Tenants (3) | | | | $ | 178,940,064 | | 59.9% | | 8,259,580 | | 58.1% | | | | |
| | | | | | | | | | | | | | | | | |
| (1) | Annualized base rent is calculated as monthly contractual base rent under existing leases as of March 31, 2008, multiplied by 12. For those leases where rent has not yet commenced, the first month in which rent is to be received is used to determine annualized base rent. |
| (2) | S&P credit ratings are as of March 31, 2008. Rankings of law firms are based on total gross revenue in 2006 as reported by American Lawyer Media’s LAW.com. |
| (3) | Includes 20% of annualized rent and leased square footage for our MMO joint venture properties. |
| (4) | The weighted average calculation is based on the effective net rentable square feet leased by each tenant, which reflects our pro-rata share of the MMO joint venture. |
29
Maguire Properties, Inc.
Supplemental Operating and Financial Data
First Quarter 2008
Portfolio Tenant Classification Description (1), (2)
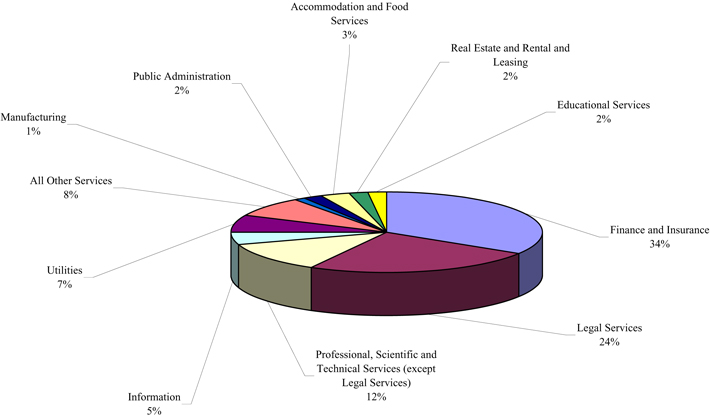
| (1) | Percentages are based upon effective leased square feet. |
| (2) | Classifications are based on the “North American Industrial Classification System” (NAICS). |
30
Maguire Properties, Inc.
Supplemental Operating and Financial Data
First Quarter 2008
Lease Expirations — Wholly Owned Portfolio
| | | | | | | | | | | | | | | | | |
Year | | Total Area in
Square Feet
Covered
by Expiring
Leases | | Percentage
of Aggregate
Square Feet | | | Annualized
Rent | | Percentage
of Total
Annualized
Rent | | | Current Rent
per Square Foot
(1) | | Rent per
Square Foot
at Expirations
(2) |
| | | | | | |
Available | | 3,787,828 | | 21.9 | % | | | | | | | | | | | | |
2008 | | 1,068,270 | | 6.2 | % | | | 19,372,573 | | 6.8 | % | | | 18.13 | | | 18.30 |
2009 | | 1,013,852 | | 5.9 | % | | | 18,637,923 | | 6.6 | % | | | 18.38 | | | 18.77 |
2010 | | 1,609,117 | | 9.3 | % | | | 36,324,811 | | 12.8 | % | | | 22.57 | | | 23.59 |
2011 | | 2,458,986 | | 14.2 | % | | | 58,318,147 | | 20.5 | % | | | 23.72 | | | 25.24 |
2012 | | 1,140,919 | | 6.6 | % | | | 23,852,801 | | 8.4 | % | | | 20.91 | | | 23.45 |
2013 | | 2,134,284 | | 12.4 | % | | | 40,252,982 | | 14.2 | % | | | 18.86 | | | 23.01 |
2014 | | 526,374 | | 3.0 | % | | | 10,341,092 | | 3.6 | % | | | 19.65 | | | 23.73 |
2015 | | 873,328 | | 5.0 | % | | | 18,157,347 | | 6.4 | % | | | 20.79 | | | 24.40 |
2016 | | 150,302 | | 0.9 | % | | | 2,958,354 | | 1.0 | % | | | 19.68 | | | 26.34 |
2017 | | 1,225,347 | | 7.1 | % | | | 25,144,539 | | 8.9 | % | | | 20.52 | | | 24.69 |
Thereafter | | 1,292,308 | | 7.5 | % | | | 30,557,886 | | 10.8 | % | | | 23.65 | | | 30.51 |
| | | | | | | | | | | | | | | | | |
Total | | 17,280,915 | | 100.0 | % | | $ | 283,918,455 | | 100.0 | % | | $ | 21.04 | | $ | 23.93 |
| | | | | | | | | | | | | | | | | |
|
| Leases Expiring in the Next 4 Quarters: |
| | | | | | |
2nd Quarter 2008 | | 433,952 | | 2.5 | % | | | 7,804,839 | | 2.7 | % | | | 17.99 | | | 17.99 |
3rd Quarter 2008 (3) | | 355,226 | | 2.1 | % | | | 6,708,022 | | 2.4 | % | | | 18.88 | | | 18.93 |
4th Quarter 2008 | | 279,092 | | 1.6 | % | | | 4,859,712 | | 1.7 | % | | | 17.41 | | | 17.51 |
1st Quarter 2009 | | 158,983 | | 0.9 | % | | | 3,203,873 | | 1.2 | % | | | 20.15 | | | 20.24 |
| | | | | | | | | | | | | | | | | |
Total | | 1,227,253 | | 7.1 | % | | $ | 22,576,446 | | 8.0 | % | | $ | 18.40 | | $ | 18.44 |
| | | | | | | | | | | | | | | | | |
| (1) | Current rent per leased square foot represents current base rent, divided by total square footage under lease as of the same date. |
| (2) | Rent per leased square foot at expiration represents base rent including any future rent steps, and thus represents the base rent that will be in place at lease expiration. |
| (3) | Includes tenants leasing on a month-to-month basis. |
31
Maguire Properties, Inc.
Supplemental Operating and Financial Data
First Quarter 2008
Lease Expirations — Wholly Owned Portfolio
Los Angeles County
| | | | | | | | | | | | | | | | | |
Year | | Total Area in
Square Feet
Covered
by Expiring
Leases | | Percentage
of Aggregate
Square Feet | | | Annualized
Rent | | Percentage
of Total
Annualized
Rent | | | Current Rent
per Square Foot
(1) | | Rent per
Square Foot
at Expiration
(2) |
| | | | | | |
Available | | 1,053,593 | | 11.0 | % | | | | | | | | | | | | |
2008 | | 348,889 | | 3.6 | % | | | 7,280,387 | | 3.8 | % | | | 20.87 | | | 21.03 |
2009 | | 303,517 | | 3.2 | % | | | 5,692,037 | | 3.0 | % | | | 18.75 | | | 19.01 |
2010 | | 953,332 | | 9.9 | % | | | 25,244,512 | | 13.2 | % | | | 26.48 | | | 27.52 |
2011 | | 1,369,387 | | 14.2 | % | | | 38,477,356 | | 19.9 | % | | | 28.10 | | | 28.88 |
2012 | | 745,624 | | 7.7 | % | | | 15,840,413 | | 8.3 | % | | | 21.24 | | | 23.91 |
2013 | | 1,396,531 | | 14.5 | % | | | 26,966,840 | | 14.1 | % | | | 19.31 | | | 22.64 |
2014 | | 434,648 | | 4.5 | % | | | 8,593,387 | | 4.5 | % | | | 19.77 | | | 24.22 |
2015 | | 768,541 | | 8.0 | % | | | 15,772,374 | | 8.2 | % | | | 20.52 | | | 24.57 |
2016 | | 149,308 | | 1.6 | % | | | 2,941,353 | | 1.5 | % | | | 19.70 | | | 26.40 |
2017 | | 1,033,391 | | 10.7 | % | | | 20,845,626 | | 10.9 | % | | | 20.17 | | | 23.93 |
Thereafter | | 1,064,938 | | 11.1 | % | | | 24,274,813 | | 12.6 | % | | | 22.79 | | | 28.26 |
| | | | | | | | | | | | | | | | | |
Total | | 9,621,699 | | 100.0 | % | | $ | 191,929,098 | | 100.0 | % | | $ | 22.40 | | $ | 25.27 |
| | | | | | | | | | | | | | | | | |
| | | | | | |
| Leases Expiring in the Next 4 Quarters: | | | | | | | | | | | | | | | | | |
| | | | | | |
2nd Quarter 2008 | | 84,914 | | 0.9 | % | | | 1,882,440 | | 1.0 | % | | | 22.17 | | | 22.17 |
3rd Quarter 2008 (3) | | 182,940 | | 1.9 | % | | | 3,789,444 | | 2.0 | % | | | 20.71 | | | 20.75 |
4th Quarter 2008 | | 81,035 | | 0.8 | % | | | 1,608,503 | | 0.8 | % | | | 19.85 | | | 19.99 |
1st Quarter 2009 | | 43,938 | | 0.5 | % | | | 836,287 | | 0.4 | % | | | 19.03 | | | 19.09 |
| | | | | | | | | | | | | | | | | |
Total | | 392,827 | | 4.1 | % | | $ | 8,116,674 | | 4.2 | % | | $ | 20.66 | | $ | 20.71 |
| | | | | | | | | | | | | | | | | |
| (1) | Current rent per leased square foot represents current base rent, divided by total square footage under lease as of the same date. |
| (2) | Rent per leased square foot at expiration represents base rent including any future rent steps, and thus represents the base rent that will be in place at lease expiration. |
| (3) | Includes tenants leasing on a month-to-month basis. |
32
Maguire Properties, Inc.
Supplemental Operating and Financial Data
First Quarter 2008
Lease Expirations — Wholly Owned Portfolio
Orange County
| | | | | | | | | | | | | | | | | |
Year | | Total Area in
Square Feet
Covered
by Expiring
Leases | | Percentage
of Aggregate
Square Feet | | | Annualized
Rent | | Percentage
of Total
Annualized
Rent | | | Current Rent
per Square Foot
(1) | | Rent per
Square Foot
at Expiration
(2) |
| | | | | | |
Available | | 2,612,622 | | 35.4 | % | | | | | | | | | | | | |
2008 | | 719,381 | | 9.7 | % | | | 12,084,204 | | 13.7 | % | | | 16.80 | | | 16.97 |
2009 | | 669,309 | | 9.1 | % | | | 11,988,342 | | 13.6 | % | | | 17.91 | | | 18.33 |
2010 | | 641,687 | | 8.7 | % | | | 10,711,410 | | 12.2 | % | | | 16.69 | | | 17.64 |
2011 | | 1,032,692 | | 14.0 | % | | | 18,506,833 | | 21.0 | % | | | 17.92 | | | 20.25 |
2012 | | 372,831 | | 5.1 | % | | | 7,489,487 | | 8.5 | % | | | 20.09 | | | 22.29 |
2013 | | 737,753 | | 10.0 | % | | | 13,265,884 | | 15.0 | % | | | 17.98 | | | 23.72 |
2014 | | 91,726 | | 1.2 | % | | | 1,747,705 | | 2.0 | % | | | 19.05 | | | 21.43 |
2015 | | 81,466 | | 1.1 | % | | | 1,796,633 | | 2.0 | % | | | 22.05 | | | 20.62 |
2016 | | 994 | | 0.0 | % | | | 17,001 | | 0.0 | % | | | 17.10 | | | 17.10 |
2017 | | 191,956 | | 2.6 | % | | | 4,298,913 | | 4.9 | % | | | 22.40 | | | 28.76 |
Thereafter | | 227,370 | | 3.1 | % | | | 6,283,071 | | 7.1 | % | | | 27.63 | | | 41.07 |
| | | | | | | | | | | | | | | | | |
Total | | 7,379,787 | | 100.0 | % | | $ | 88,189,483 | | 100.0 | % | | $ | 18.50 | | $ | 21.38 |
| | | | | | | | | | | | | | | | | |
| | | | | | |
| Leases Expiring in the Next 4 Quarters: | | | | | | | | | | | | | | | | | |
| | | | | | |
2nd Quarter 2008 | | 349,038 | | 4.7 | % | | | 5,922,399 | | 6.7 | % | | | 16.97 | | | 16.97 |
3rd Quarter 2008 (3) | | 172,286 | | 2.3 | % | | | 2,910,596 | | 3.3 | % | | | 16.89 | | | 16.95 |
4th Quarter 2008 | | 198,057 | | 2.7 | % | | | 3,251,209 | | 3.6 | % | | | 16.42 | | | 16.50 |
1st Quarter 2009 | | 115,045 | | 1.5 | % | | | 2,367,586 | | 2.8 | % | | | 20.58 | | | 20.68 |
| | | | | | | | | | | | | | | | | |
Total | | 834,426 | | 11.2 | % | | $ | 14,451,790 | | 16.4 | % | | $ | 17.32 | | $ | 17.36 |
| | | | | | | | | | | | | | | | | |
| (1) | Current rent per leased square foot represents current base rent, divided by total square footage under lease as of the same date. |
| (2) | Rent per leased square foot at expiration represents base rent including any future rent steps, and thus represents the base rent that will be in place at lease expiration. |
| (3) | Includes tenants leasing on a month-to-month basis. |
33
Maguire Properties, Inc.
Supplemental Operating and Financial Data
First Quarter 2008
Lease Expirations - MMO Joint Venture Portfolio
| | | | | | | | | | | | | | | | | |
Year | | Total Area in
Square Feet
Covered
by Expiring
Leases | | Percentage
of Aggregate
Square Feet | | | Annualized
Rent | | Percentage
of Total
Annualized
Rent | | | Current Rent
per Square Foot
(1) | | Rent per
Square Foot
at Expiration
(2) |
| | | | | | |
Available | | 213,005 | | 5.5 | % | | $ | – | | | | | | | | | |
2008 | | 164,597 | | 4.3 | % | | | 3,201,756 | | 4.3 | % | | $ | 19.45 | | $ | 19.53 |
2009 | | 516,151 | | 13.4 | % | | | 9,636,352 | | 13.0 | % | | | 18.67 | | | 19.21 |
2010 | | 446,469 | | 11.5 | % | | | 10,541,054 | | 14.3 | % | | | 23.61 | | | 25.07 |
2011 | | 470,990 | | 12.2 | % | | | 9,379,584 | | 12.7 | % | | | 19.91 | | | 21.77 |
2012 | | 346,369 | | 9.0 | % | | | 7,063,826 | | 9.6 | % | | | 20.39 | | | 21.78 |
2013 | | 257,456 | | 6.6 | % | | | 4,731,570 | | 6.4 | % | | | 18.38 | | | 21.99 |
2014 | | 726,799 | | 18.8 | % | | | 15,184,594 | | 20.6 | % | | | 20.89 | | | 24.85 |
2015 | | 105,013 | | 2.7 | % | | | 1,912,997 | | 2.6 | % | | | 18.22 | | | 22.26 |
2016 | | 81,033 | | 2.1 | % | | | 1,378,696 | | 1.9 | % | | | 17.01 | | | 23.08 |
2017 | | 37,787 | | 1.0 | % | | | 732,423 | | 1.0 | % | | | 19.38 | | | 28.52 |
Thereafter | | 498,893 | | 12.9 | % | | | 10,067,903 | | 13.6 | % | | | 20.18 | | | 27.35 |
| | | | | | | | | | | | | | | | | |
Total | | 3,864,562 | | 100.0 | % | | $ | 73,830,755 | | 100.0 | % | | $ | 20.22 | | $ | 23.03 |
| | | | | | | | | | | | | | | | | |
|
| Leases Expiring in the Next 4 Quarters: |
| | | | | | |
2nd Quarter 2008 | | 3,231 | | 0.1 | % | | | 51,795 | | 0.1 | % | | | 16.03 | | | 16.03 |
3rd Quarter 2008 (3) | | 109,433 | | 2.8 | % | | | 2,042,554 | | 2.7 | % | | | 18.66 | | | 18.71 |
4th Quarter 2008 | | 51,933 | | 1.4 | % | | | 1,107,407 | | 1.5 | % | | | 21.32 | | | 21.39 |
1st Quarter 2009 | | 26,180 | | 0.6 | % | | | 456,159 | | 0.7 | % | | | 17.42 | | | 17.78 |
| | | | | | | | | | | | | | | | | |
Total | | 190,777 | | 4.9 | % | | $ | 3,657,915 | | 5.0 | % | | $ | 19.17 | | $ | 19.27 |
| | | | | | | | | | | | | | | | | |
| (1) | Current rent per leased square foot represents current base rent, divided by total square footage under lease as of the same date. |
| (2) | Rent per leased square foot at expiration represents base rent including any future rent steps, and thus represents the base rent that will be in place at lease expiration. |
| (3) | Includes tenants leasing on a month-to-month basis. |
34
Maguire Properties, Inc.
Supplemental Operating and Financial Data
First Quarter 2008
Leasing Activity - Total Portfolio and Effective Portfolio
| | | | | | | | | | | | | |
| | | Total Portfolio | | | Effective Portfolio (1) | |
| | | For the
Three Months
Ended
March 31,
2008 | | | % Leased | | | For the
Three Months
Ended
March 31,
2008 | | | % Leased | |
| | | | |
Leased Square Feet as of December 31, 2007, as reported | | 17,385,603 | | | 83.2 | % | | 14,450,953 | | | | 81.1 | % |
| | | | |
Leased Square Feet as of December 31, 2007, as adjusted(2) | | 17,385,603 | | | 82.2 | % | | 14,450,953 | | | | 80.0 | % |
Expirations | | (666,908 | ) | | (3.1 | )% | | (623,725 | ) | | | (3.4 | )% |
New Leases | | 225,533 | | | 1.1 | % | | 208,747 | | | | 1.2 | % |
Renewals | | 200,416 | | | 0.9 | % | | 187,422 | | | | 1.0 | % |
| | | | | | | | | | | | | |
Leased Square Feet as of March 31, 2008 | | 17,144,644 | | | 81.1 | % | | 14,223,397 | | | | 78.8 | % |
| | | | | | | | | | | | | |
| | | | |
Cash Rent Growth(3), (4) | | | | | | | | | | | | | |
Expiring Rate per Square Foot | | | | | | | | | | | $ | 16.02 | |
New / Renewed Rate per Square Foot | | | | | | | | | | | $ | 22.20 | |
Percentage Change | | | | | | | | | | | | 39 | % |
| | | | |
GAAP Rent Growth(4), (5) | | | | | | | | | | | | | |
Expiring Rate per Square Foot | | | | | | | | | | | $ | 15.57 | |
New / Renewed Rate per Square Foot | | | | | | | | | | | $ | 22.97 | |
Percentage Change | | | | | | | | | | | | 48 | % |
| | | | |
Weighted Average Lease Term - New (in months) | | | | | | | | | | | | 64 | |
Weighted Average Lease Term - Renewal (in months) | | | | | | | | | | | | 55 | |
| (1) | Includes 100% of our consolidated portfolio and 20% of our MMO joint venture properties. |
| (2) | Leased square feet as of December 31, 2007, as adjusted, represents the inclusion of the recently completed development properties at 17885 Von Karman (151,370 SF) and 2385 Northside Drive (88,795 SF). |
| (3) | Represents the difference between (i) initial market rents on new and renewed leases and (ii) the cash rents on those spaces immediately prior to the expiration or termination. Excludes new and renewed leases for spaces with more than six months of downtime and early renewals commencing after March 31, 2009. |
| (4) | For newly acquired properties, cash and GAAP rent growth is excluded for spaces that expired prior to our ownership and were re-leased after acquisition. |
| (5) | Represents estimated cash rent growth adjusted for straight-line rents in accordance with GAAP. |
35
Maguire Properties, Inc.
Supplemental Operating and Financial Data
First Quarter 2008
Leasing Activity - Los Angeles Central Business District
| | | | | | | | | | | | | |
| | | Total Portfolio | | | Effective Portfolio (1) | |
| | | For the
Three Months
Ended
March 31,
2008 | | | % Leased | | | For the
Three Months
Ended
March 31,
2008 | | | % Leased | |
| | | | |
Leased Square Feet as of December 31, 2007, Los Angeles Central Business District | | 8,046,129 | | | 87.9 | % | | 7,336,629 | | | | 87.8 | % |
Expirations | | (132,689 | ) | | (1.4 | )% | | (115,411 | ) | | | (1.4 | )% |
New Leases | | 122,812 | | | 1.3 | % | | 108,781 | | | | 1.3 | % |
Renewals | | 48,121 | | | 0.5 | % | | 48,121 | | | | 0.6 | % |
| | | | | | | | | | | | | |
Leased Square Feet as of March 31, 2008, Los Angeles Central Business District | | 8,084,373 | | | 88.3 | % | | 7,378,120 | | | | 88.3 | % |
| | | | | | | | | | | | | |
| | | | |
Cash Rent Growth(2), (3) | | | | | | | | | | | | | |
Expiring Rate per Square Foot | | | | | | | | | | | $ | 16.23 | |
New / Renewed Rate per Square Foot | | | | | | | | | | | $ | 24.26 | |
Percentage Change | | | | | | | | | | | | 49 | % |
| | | | |
GAAP Rent Growth(3), (4) | | | | | | | | | | | | | |
Expiring Rate per Square Foot | | | | | | | | | | | $ | 15.15 | |
New / Renewed Rate per Square Foot | | | | | | | | | | | $ | 27.49 | |
Percentage Change | | | | | | | | | | | | 81 | % |
| | | | |
Weighted Average Lease Term - New (in months) | | | | | | | | | | | | 86 | |
Weighted Average Lease Term - Renewal (in months) | | | | | | | | | | | | 83 | |
| (1) | Includes 100% of our consolidated portfolio and 20% of our MMO joint venture properties. |
| (2) | Represents the difference between (i) initial market rents on new and renewed leases and (ii) the cash rents on those spaces immediately prior to the expiration or termination. Excludes new and renewed leases for spaces with more than six months of downtime and early renewals commencing after March 31, 2009. |
| (3) | For newly acquired properties, cash and GAAP rent growth is excluded for spaces that expired prior to our ownership and were re-leased after acquisition. |
| (4) | Represents estimated cash rent growth adjusted for straight-line rents in accordance with GAAP. |
36
Maguire Properties, Inc.
Supplemental Operating and Financial Data
First Quarter 2008
Leasing Activity - Orange County
| | | | | | | | | | | | | |
| | | Total Portfolio | | | Effective Portfolio (1) | |
| | | For the
Three Months
Ended
March 31,
2008 | | | % Leased | | | For the
Three Months
Ended
March 31,
2008 | | | % Leased | |
| | | | |
Leased Square Feet as of December 31, 2007, Orange County, as reported | | 5,698,453 | | | 72.0 | % | | 5,166,521 | | | | 70.2 | % |
| | | | |
Leased Square Feet as of December 31, 2007, Orange County, as adjusted(2) | | 5,698,453 | | | 70.6 | % | | 5,166,521 | | | | 68.7 | % |
Expirations | | (467,634 | ) | | (5.7 | )% | | (464,252 | ) | | | (6.1 | )% |
New Leases | | 81,386 | | | 1.0 | % | | 81,386 | | | | 1.1 | % |
Renewals | | 115,648 | | | 1.4 | % | | 115,648 | | | | 1.5 | % |
| | | | | | | | | | | | | |
Leased Square Feet as of March 31, 2008, Orange County | | 5,427,853 | | | 67.3 | % | | 4,899,303 | | | | 65.2 | % |
| | | | | | | | | | | | | |
| | | | |
Cash Rent Growth(3), (4) | | | | | | | | | | | | | |
Expiring Rate per Square Foot | | | | | | | | | | | $ | 14.81 | |
New / Renewed Rate per Square Foot | | | | | | | | | | | $ | 20.45 | |
Percentage Change | | | | | | | | | | | | 38 | % |
| | | | |
GAAP Rent Growth(4), (5) | | | | | | | | | | | | | |
Expiring Rate per Square Foot | | | | | | | | | | | $ | 14.86 | |
New / Renewed Rate per Square Foot | | | | | | | | | | | $ | 19.77 | |
Percentage Change | | | | | | | | | | | | 33 | % |
| | | | |
Weighted Average Lease Term - New (in months) | | | | | | | | | | | | 42 | |
Weighted Average Lease Term - Renewal (in months) | | | | | | | | | | | | 46 | |
| (1) | Includes 100% of our consolidated portfolio and 20% of our MMO joint venture properties. |
| (2) | Leased square feet as of December 31, 2007, as adjusted, represents the inclusion of the recently completed development property at 17885 Von Karman (151,370 SF). |
| (3) | Represents the difference between (i) initial market rents on new and renewed leases and (ii) the cash rents on those spaces immediately prior to the expiration or termination. Excludes new and renewed leases for spaces with more than six months of downtime and early renewals commencing after March 31, 2009. |
| (4) | For newly acquired properties, cash and GAAP rent growth is excluded for spaces that expired prior to our ownership and were re-leased after acquisition. |
| (5) | Represents estimated cash rent growth adjusted for straight-line rents in accordance with GAAP. |
37
Maguire Properties, Inc.
Supplemental Operating and Financial Data
First Quarter 2008
Tenant Improvements and Leasing Commissions (1), (2)
| | | | | | | | | | | | | | |
| | | | | | | For the Year Ended December 31, |
| | | Q1 2008 | | | | 2007 | | 2006 | | 2005 |
Renewals(3) | | | | | | | | | | | | | | |
Number of Leases | | | 40 | | | | | 152 | | | 74 | | | 67 |
Square Feet | | | 166,714 | | | | | 881,406 | | | 824,516 | | | 740,375 |
Tenant Improvement Costs per Square Foot (4) | | $ | 19.17 | | | | $ | 11.69 | | $ | 29.22 | | $ | 11.25 |
Leasing Commission Costs per Square Foot | | $ | 6.21 | | | | $ | 5.14 | | $ | 8.18 | | $ | 3.64 |
Total Tenant Improvements and Leasing Commissions | | | | | | | | | | | | | | |
Costs per Square Foot | | $ | 25.38 | | | | $ | 16.83 | | $ | 37.40 | | $ | 14.89 |
Costs per Square Foot per Year | | $ | 4.98 | | | | $ | 3.41 | | $ | 4.78 | | $ | 3.46 |
| | | | | |
New / Modified Leases(5) | | | | | | | | | | | | | | |
Number of Leases | | | 45 | | | | | 141 | | | 147 | | | 138 |
Square Feet | | | 192,785 | | | | | 893,634 | | | 1,015,192 | | | 1,047,634 |
Tenant Improvement Costs per Square Foot (4) | | $ | 26.20 | | | | $ | 22.89 | | $ | 20.93 | | $ | 24.29 |
Leasing Commission Costs per Square Foot | | $ | 6.81 | | | | $ | 6.52 | | $ | 6.34 | | $ | 5.41 |
Total Tenant Improvements and Leasing Commissions | | | | | | | | | | | | | | |
Costs per Square Foot | | $ | 33.01 | | | | $ | 29.41 | | $ | 27.27 | | $ | 29.70 |
Costs per Square Foot per Year | | $ | 5.75 | | | | $ | 5.00 | | $ | 4.33 | | $ | 4.78 |
| | | | | |
Total | | | | | | | | | | | | | | |
Number of Leases | | | 85 | | | | | 293 | | | 221 | | | 205 |
Square Feet | | | 359,500 | | | | | 1,775,040 | | | 1,839,708 | | | 1,788,009 |
Tenant Improvement Costs per Square Foot (4) | | $ | 22.94 | | | | $ | 17.33 | | $ | 24.64 | | $ | 18.89 |
Leasing Commission Costs per Square Foot | | $ | 6.53 | | | | $ | 5.84 | | $ | 7.16 | | $ | 4.68 |
Total Tenant Improvements and Leasing Commissions | | | | | | | | | | | | | | |
Costs per Square Foot | | $ | 29.47 | | | | $ | 23.17 | | $ | 31.80 | | $ | 23.57 |
Costs per Square Foot per Year | | $ | 5.41 | | | | $ | 4.28 | | $ | 4.55 | | $ | 4.36 |
| (1) | Based on leases executed during the period. Excludes leases to related parties, short-term leases less than six months, and leases for raw space. |
| (2) | Tenant improvements and leasing commission information in 2008 and 2007 reflects 100% of the consolidated portfolio and 20% of the MMO joint venture properties. Information for 2006 and 2005 reflects 100% of the consolidated portfolio and 100% of the MMO joint venture properties. |
| (3) | Does not include retained tenants that have relocated to new space or expanded into new space. |
| (4) | Tenant improvements include improvements and lease concessions. |
| (5) | Includes retained tenants that have relocated or expanded into new space and lease modifications. |
38
Maguire Properties, Inc.
Supplemental Operating and Financial Data
First Quarter 2008
Historical Capital Expenditures — Office Properties (1)
| | | | | | | | | | | | | | |
| | | | | | | For the Year Ended December 31, |
| | | Q1 2008 | | | | 2007 | | 2006 | | 2005 |
| | | | | |
Consolidated | | | | | | | | | | | | | | |
Non-recoverable capital expenditures (2), (3) | | $ | 4,469,765 | | | | $ | 11,326,800 | | $ | 2,454,126 | | $ | 4,502,547 |
Total square feet | | | 16,054,577 | | | | | 16,051,311 | | | 11,625,028 | | | 9,150,550 |
Non-recoverable capital expenditures per square foot | | $ | 0.28 | | | | $ | 0.71 | | $ | 0.21 | | $ | 0.49 |
Unconsolidated | | | | | | | | | | | | | | |
Non-recoverable capital expenditures (4) | | $ | 28,309 | | | | $ | 50,406 | | $ | 153,069 | | | |
Total square feet (5) | | | 635,556 | | | | | 624,674 | | | 622,561 | | | |
Non-recoverable capital expenditures per square foot | | $ | 0.04 | | | | $ | 0.08 | | $ | 0.25 | | | |
| | | | | |
Consolidated | | | | | | | | | | | | | | |
Recoverable capital expenditures (6), (7) | | $ | 291,527 | | | | $ | 2,857,483 | | $ | 1,329,624 | | $ | 1,553,935 |
Total square feet | | | 16,054,577 | | | | | 16,051,311 | | | 11,625,028 | | | 9,150,550 |
Recoverable capital expenditures per square foot | | $ | 0.02 | | | | $ | 0.18 | | $ | 0.11 | | $ | 0.17 |
Unconsolidated | | | | | | | | | | | | | | |
Recoverable capital expenditures (4), (6) | | $ | – | | | | $ | 5,779 | | $ | 122,149 | | | |
Total square feet (5) | | | 635,556 | | | | | 624,674 | | | 622,561 | | | |
Recoverable capital expenditures per square foot | | $ | – | | | | $ | 0.01 | | $ | 0.20 | | | |
| (1) | Historical capital expenditures for each period shown reflect properties owned for the entire period. For properties acquired during each period, the capital expenditures will be reflected in the following full period of ownership. For properties sold during each period, the capital expenditures will be excluded for that period. Any capital expenditures incurred for acquisition or disposition properties during the period of acquisition or disposition will be footnoted separately. |
| (2) | Excludes approximately $3.6 million of non-recoverable capital expenditures for the three months ended March 31, 2008 as a result of discretionary renovation costs totaling $3.3 million at KPMG Tower and $0.3 million of planned renovation costs at Lantana Media Campus. |
| (3) | Excludes approximately $3.8 million of non-recoverable capital expenditures for 2007 as a result of discretionary renovation costs of $1.9 million at KPMG Tower and $1.9 million of planned renovation costs at Lantana Media Campus. For 2006 and 2005, excludes $0.5 million and $0.6 million, respectively, of non-recoverable capital expenditures incurred at acquired properties following their acquisition. |
| (4) | Amount represents our 20% ownership interest in our joint venture with Macquarie Office Trust. |
| (5) | The square footages of Cerritos Corporate Center Phases I and II and a portion of Washington Mutual Irvine Campus are deducted from the total square feet amount as the tenants pay for all capital expenditures. |
| (6) | Recoverable capital improvements, such as equipment upgrades, are generally financed through capital leases. The annual amortization, based on each asset’s useful life, as well as any financing costs, are generally billed to tenants on an annual basis as payments are made. The amounts presented represent the total value of the improvements in the year they are made. |
| (7) | Excludes $0.5 million of recoverable capital expenditures for 2005 incurred at acquired properties following their acquisition. |
39
Maguire Properties, Inc.
Supplemental Operating and Financial Data
First Quarter 2008
Hotel Performance and Hotel Historical Capital Expenditures
Hotel Performance
| | | | | | | | | | | | | | | | | | | | |
Westin Hotel, Pasadena, CA | | Q1 2008 | | | Q1 2007 | | | Percent
Change | | | | | | | |
| | | | | |
Occupancy | | | 79.9 | % | | | 74.9 | % | | | 6.6 | % | | | | | | | | |
| | | | | |
Average daily rate | | $ | 179.90 | | | $ | 178.51 | | | | 0.8 | % | | | | | | | | |
| | | | | |
Revenue per available room (REVPAR) | | $ | 143.66 | | | $ | 133.69 | | | | 7.5 | % | | | | | | | | |
| | | | | |
Hotel net operating income | | $ | 2,375,988 | | | $ | 2,098,548 | | | | 13.2 | % | | | | | | | | |
|
| Hotel Historical Capital Expenditures | |
| | | |
| | | | | | | | | For the Year Ended December 31, | |
Westin Hotel, Pasadena, CA | | Q1 2008 | | | Q1 2007 | | | 2007 | | | 2006 | | | 2005 | |
| | | | | |
Hotel improvements and equipment replacements | | $ | 44,618 | | | $ | 236,577 | | | $ | 712,955 | | | $ | 730,531 | | | $ | 313,011 | |
| | | | | |
Total hotel revenue | | $ | 6,880,860 | | | $ | 6,187,549 | | | $ | 27,214,156 | | | $ | 27,053,648 | | | $ | 24,037,425 | |
| | | | | |
Hotel improvements as a percentage of hotel revenue | | | 0.6 | % | | | 3.8 | % | | | 2.6 | % | | | 2.7 | % | | | 1.3 | % |
| | | | | |
Renovation and upgrade costs (1) | | $ | – | | | $ | – | | | $ | – | | | $ | 164,072 | | | $ | 3,461,780 | |
| (1) | The Westin Hotel underwent a $12.2 million renovation from December 2002 through August 2005, of which $3.5 million was funded by Westin. |
40
Maguire Properties, Inc.
Supplemental Operating and Financial Data
First Quarter 2008
Construction in Progress
| | | | | | | | | | | | | | | | | | | | |
| | | | | | | | As of March 31, 2008 | | |
Property | | Location | | Percentage
Pre-Leased | | | Land
Value (1) | | Construction
Costs
Incurred | | Estimated
Cost of
Development (2) | | Developed /
Developable
Square Feet (3) | | Projected
Stabilized
NOI | | Estimated Date
of Completion |
| | | | | | | | (in millions) | | (in millions) | | (in millions) | | | | (in millions) | | |
| | | | | | | | |
Los Angeles County | | | | | | | | | | | | | | | | | | | | |
| | | | | | | | |
Lantana Media Campus | | Santa Monica, CA | | 81 | % | | $ | 17.8 | | $ | 61.9 | | $ | 66.0 | | 198,000 | | | | 2008 (4) |
Lantana Media Campus – Structured Parking | | | | | | | | – | | | – | | | 22.0 | | 223,000 | | | | |
| | | | | | | | | | | | | | | | | | | | |
| | | | | | | | 17.8 | | | 61.9 | | | 88.0 | | 421,000 | | 12.0 - 13.0 | | |
| | | | | | | | | | | | | | | | | | | | |
| | | | | | | | |
207 Goode Avenue | | Glendale, CA | | 0 | % | | | 13.7 | | | 9.7 | | | 64.5 | | 189,000 | | 7.5 - 8.0 | | Second Quarter 2009 |
| | | | | | | | | | | | | | | | | | | | |
| | Total | | | | | $ | 31.5 | | $ | 71.6 | | $ | 152.5 | | 610,000 | | | | |
| | | | | | | | | | | | | | | | | | | | |
| (1) | Land value represents the total land cost attributable to the entire project, including building and parking structure, and includes amounts capitalized for interest in excess of construction loan interest reserves and property taxes totaling approximately $2 million for 207 Goode Avenue and $3 million for Lantana Media Campus. |
| (2) | The estimated cost of development excludes land. |
| (3) | The developable square feet represent the office, retail, residential and parking square footages that we estimate can be developed on the referenced property. |
| (4) | The East building (66,000 sq ft) was completed during the first quarter of 2008. The South building (132,000 sq ft) is estimated to be completed during the second quarter of 2008. |
41
Maguire Properties, Inc.
Supplemental Operating and Financial Data
First Quarter 2008
Development Pipeline
| | | | | | |
| | | | | As of March 31, 2008 |
Property | | Location | | Developable
Square Feet (1) | | Type of
Planned Development |
| | | |
Los Angeles County | | | | | | |
755 South Figueroa | | Los Angeles, CA | | 930,000 | | Office |
| | | | 266,000 | | Structured Parking |
| | | |
Glendale Center - Phase II | | Glendale, CA | | 264,000 | | Mixed Use |
| | | | 158,000 | | Structured Parking |
| | | | | | |
| | | |
| | Total Los Angeles County | | 1,618,000 | | |
| | | | | | |
| | | |
Orange County | | | | | | |
| | | |
Stadium Tower II | | Anaheim, CA | | 282,000 | | Office |
| | | | 367,000 | | Structured Parking |
| | | |
Brea Financial Commons/Brea Corporate Place (2) | | Brea, CA | | 550,000 | | Office, Mixed-Use |
| | | | 784,000 | | Structured Parking |
| | | |
Pacific Arts Plaza | | Costa Mesa, CA | | 468,000 | | Office |
| | | | 225,000 | | Residential (3) |
| | | | 260,000 | | Structured Parking |
| | | |
Park Place | | Irvine, CA | | 1,237,000 | | Office, Retail & Hotel |
| | | | 1,048,000 | | Residential |
| | | | 2,376,000 | | Structured Parking |
| | | |
2600 Michelson (4) | | Irvine, CA | | 270,000 | | Office |
| | | | 154,000 | | Structured Parking |
| | | |
500 Orange Center (5) | | Orange, CA | | 900,000 | | Office |
| | | | 960,000 | | Structured Parking |
| | | |
605 City Parkway | | Orange, CA | | 200,000 | | Office |
| | | | 228,000 | | Structured Parking |
| | | |
City Plaza II | | Orange, CA | | 360,000 | | Office |
| | | | 387,000 | | Structured Parking |
| | | |
City Tower II (6) | | Orange, CA | | 465,000 | | Office |
| | | | 696,000 | | Structured Parking |
| | | | | | |
| | Total Orange County | | 12,217,000 | | |
| | | | | | |
| | | | | | |
| | | |
San Diego | | | | | | |
San Diego Tech Center (7), (8) | | Sorrento Mesa, CA | | 1,320,000 | | Office |
| | | | 1,674,000 | | Structured Parking |
| | | | | | |
| | Total San Diego County | | 2,994,000 | | |
| | | | | | |
| | | |
| | Total Portfolio | | 16,829,000 | | |
| | | | | | |
| (1) | The developable square feet presented represents the office, retail, hotel, residential and parking footages that we estimate can be developed on the referenced property. |
| (2) | The developable square feet presented represents management’s estimate of the development potential for the referenced property based on the allowed density under current zoning and capacity considerations for the site still under planning review. |
| (3) | The developable square feet presented represents management’s estimate of the development potential for the referenced property based on the construction of 180 residential units as contemplated under a Program EIR completed by the City of Costa Mesa for this and other surrounding properties. This residential development would replace an existing 67,450 square foot office building at Pacific Arts Plaza. |
| (4) | The developable square feet presented represents management’s estimate of the development potential for the referenced property based on an allocation of excess trips reserved from our disposition of Inwood Park, which we are currently in discussion with the City of Irvine over securing, and the potential utilization of excess trips from our other assets in the Irvine Business Complex (i.e. Park Place). |
| (5) | The developable square feet presented represents management’s estimate of the development potential for the referenced property based on the allowed density under current zoning. Approximately 60,000 square feet of the estimated development potential will require the consolidation of an adjacent remnant parcel in cooperation with the City of Orange. |
| (6) | The developable square feet presented represents management’s estimate of the development potential for the referenced property based on the allowed density under a Conditional Use Permit obtained for the property in 2001, which has since expired. |
| (7) | Land held for development was not contributed to the MMO joint venture. |
| (8) | The third phase contemplates the demolition of 120,000 square feet of existing space. |
42
Maguire Properties, Inc.
Supplemental Operating and Financial Data
First Quarter 2008
Management Statements on Non-GAAP Supplemental Measures
Funds from Operations:
Funds from Operations, or FFO, is a widely recognized measure of REIT performance. We calculate FFO as defined by the National Association of Real Estate Investment Trusts, or NAREIT. FFO represents net income (loss) (as computed in accordance with accounting principles generally accepted in the United States of America, or GAAP), excluding gains (or losses) from disposition of property, extraordinary items, real estate related-depreciation and amortization (including capitalized leasing expenses, tenant allowances or improvements and excluding amortization of deferred financing costs) and after adjustments for unconsolidated partnerships and joint ventures.
Management uses FFO as a supplemental performance measure because, in excluding real estate-related depreciation and amortization, gains (or losses) from property dispositions and extraordinary items, it provides a performance measure that, when compared year over year, captures trends in occupancy rates, rental rates and operating costs. We also believe that, as a widely recognized measure of the performance of REITs, FFO will be used by investors as a basis to compare our operating performance with that of other REITs.
Management also uses FFO before losses from the early extinguishment of debt as a supplemental performance measure because these losses create significant earnings volatility which in turn results in less comparability between reporting periods and less predictability regarding future earnings potential. The losses represent costs to extinguish debt prior to the stated maturity and the write off of unamortized loan costs on the date of extinguishment. The decision to extinguish debt prior to its maturity generally results from (i) the assumption of debt in connection with property acquisitions that is priced or structured at less than desirable terms (for example, a floating interest rate instead of a fixed interest rate), (ii) short-term bridge financing obtained in connection with the acquisition of a property or portfolio of properties until such time as the company completes its long-term financing strategy, (iii) the early repayment of debt associated with properties disposed of, or (iv) the restructuring or replacement of corporate level financing to accommodate property acquisitions. Consequently, management views these losses as costs to complete the respective acquisition or disposition of properties.
However, because FFO excludes depreciation and amortization and captures neither the changes in the value of our properties that result from use or market conditions nor the level of capital expenditures and leasing commissions necessary to maintain the operating performance of our properties, all of which have real economic effect and could materially impact our results of operations, the utility of FFO as a measure of our performance is limited. Other Equity REITs may not calculate FFO in accordance with the NAREIT definition and, accordingly, our FFO may not be comparable to such other Equity REITs’ FFO. As a result, FFO should be considered only as a supplement to net income as a measure of our performance. FFO should not be used as a measure of our liquidity, nor is it indicative of funds available to meet our cash needs, including our ability to pay dividends or make distributions. FFO also should not be used as a supplement to or substitute for cash flows from operating activities (as computed in accordance with GAAP).
43
Maguire Properties, Inc.
Supplemental Operating and Financial Data
First Quarter 2008
Management Statements on Non-GAAP Supplemental Measures (continued)
Adjusted Funds from Operations:
We calculate adjusted funds from operations, or AFFO, by adding to or subtracting from FFO (i) non-cash operating revenues and expenses, (ii) capitalized operating expenditures such as leasing payroll and interest expense, (iii) recurring and non-recurring capital expenditures required to maintain and re-tenant our properties, (iv) regular principal payments required to service our debt, and (v) 2nd generation tenant improvements and leasing commissions. Management uses AFFO as a supplemental liquidity measure because, when compared year over year, it assesses our ability to fund our dividend and distribution requirements from our operating activities. We also believe that, as a widely recognized measure of the liquidity of REITs, AFFO will be used by investors as a basis to assess our ability to fund dividend payments in comparison to other REITs.
However, because AFFO may exclude certain non-recurring capital expenditures and leasing costs, the utility of AFFO as a measure of our liquidity is limited. Additionally, other Equity REITs may not calculate AFFO using the method we do. As a result, our AFFO may not be comparable to such other Equity REITs’ AFFO. AFFO should be considered only as a supplement to cash flows from operating activities (as computed in accordance with GAAP) as a measure of our liquidity.
EBITDA:
Management uses EBITDA as an indicator of our ability to incur and service debt. We believe EBITDA is an appropriate supplemental measure for such purposes, because the amounts spent on interest are, by definition, available to pay interest, income tax expense is inversely correlated to interest expense because tax expense goes down as deductible interest expense goes up, and depreciation and amortization are non-cash charges. In addition, we believe EBITDA is frequently used by securities analysts, investors and other interested parties in the evaluation of Equity REITs. However, because EBITDA is calculated before recurring cash charges including interest expense and income taxes, and is not adjusted for capital expenditures or other recurring cash requirements of our business, its utility as a measure of our liquidity is limited. Accordingly, EBITDA should not be considered an alternative to cash flows from operating activities (as computed in accordance with GAAP) as a measure of our liquidity. EBITDA should not be considered as an alternative to net income as an indicator of our operating performance. Other Equity REITs may calculate EBITDA differently than we do. As a result, our EBITDA may not be comparable to such other Equity REITs’ EBITDA.
Management also uses EBITDA before losses from the early extinguishment of debt as a supplemental performance measure because these losses create significant earnings volatility which in turn results in less comparability between reporting periods and less predictability about future earnings potential. The losses represent costs to extinguish debt prior to the stated maturity and the write off of unamortized loan costs on the date of extinguishment. The decision to extinguish debt prior to its maturity generally results from (i) the assumption of debt in connection with property acquisitions that is priced or structured at less than desirable terms (for example, a floating interest rate instead of a fixed interest rate), (ii) short-term bridge financing obtained in connection with the acquisition of a property or portfolio of properties until such time as the company completes its long-term financing strategy, (iii) the early repayment of debt associated with properties disposed of, and (iv) the restructuring or replacement of corporate level financing to accommodate property acquisitions. Consequently, management views these losses as costs to complete the respective acquisition or disposition of properties.
44
Maguire Properties, Inc.
Supplemental Operating and Financial Data
First Quarter 2008
Management Statements on Non-GAAP Supplemental Measures (continued)
Coverage Ratios:
We present interest and fixed charge coverage ratios as supplemental liquidity measures. Management uses these ratios as indicators of our financial flexibility to service current interest expense and debt amortization from current cash net operating income. In addition, we believe that these coverage ratios represent common metrics used by securities analysts, investors and other interested parties to evaluate our ability to service fixed cash payments. However, because these ratios are derived from EBITDA, their utility is limited by the same factors that limit the usefulness of EBITDA as a liquidity measure. Accordingly, our interest coverage ratio should not be considered as an alternative to cash flows from operating activities (as computed in accordance with GAAP) as a measure of our liquidity.
45