Exhibit 99.2
Maguire Properties, Inc. FourthQuarter 2004 |
| PAGE |
| | | 4 |
| | | 5 |
| | | 6 |
| |
| | | 8 |
| | | 9 |
| | | 10 |
| | | 11 |
| | | 12 |
| | | 13 |
| | | 14 |
| | | 15 |
| | | 16 |
| |
| | | 18 |
| | | 19 |
| | | 20 |
| | | 21 |
| | | 22 |
| | | 23 |
| | | 24 |
| | | 25 |
| | | 26 |
| | | 27 |
| | | 28 |
| | | 29 |
| | | 30 |
| | | 31 |
| | | 32 |
| | | 33 |
| | | 34 |
| | | 35 |
This supplemental package contains forward-looking statements within the meaning of the Private Securities Litigation Reform Act of 1995. Although we believe the expectations reflected in any forward-looking statements are based on reasonable assumptions, you should exercise caution in interpreting and relying on these statements as they involve known and unknown risks, uncertainties and other factors which are, in some cases, beyond the Company’s control and could materially affect actual results, performance or achievements. These factors include, without limitation, the ability to enter into new leases or renew leases on favorable terms, dependence on tenants’ financial condition, the uncertainties of real estate development and acquisition activity, the ability to effectively integrate acquisitions, th e costs and availability of financing, the effects of local economic and market conditions, regulatory and tax law changes and other risks and uncertainties detailed from time to time in the Company’s filings with the Securities and Exchange Commission.
Maguire Properties, Inc. Fourth Quarter 2004 |
Maguire Properties, Inc. (the "Company"), a self-administered and self-managed real estate investment trust, is one of the largest owners, managers and developers of first-class office properties in the Los Angeles metropolitan area, with a significant presence in five submarkets: the Los Angeles Central Business District, Tri-Cities (Pasadena, Burbank and Glendale), Santa Monica, Cerritos and Orange County. The Company’s predecessor was founded in 1965 by Robert F. Maguire III and developed over 30 million square feet of office properties nationally.
On January 23, 2004, we completed the offering of 10 million shares of 7.625% Series A Cumulative Redeemable Preferred Stock (liquidation preference $25.00 per share) for total gross proceeds of $250 million, including the exercise of the underwriters’ over-allotment option.
On April 14, 2004, we completed the acquisition of the Park Place office campus in Orange County, California from an affiliate of Blackstone Real Estate Advisors. The purchase price was approximately $260 million including the assumption of existing mortgage and mezzanine financing of approximately $164 million. The remainder was funded through proceeds of the 7.625% Series A Cumulative Redeemable Preferred Stock offering.
On July 23, 2004, we completed the acquisition of Park Place II in Orange County, California. The purchase price was approximately $215 million, which was funded through a $140 million bridge loan. The remainder was funded through proceeds of the 7.625% Series A Cumulative Redeemable Preferred Stock offering.
On November 1, 2004, we completed a $210 million, seven-year mortgage refinancing for KPMG Tower bearing interest at a fixed rate of 5.14%.
On November 9, 2004, we completed a $170 million, 10-year mortgage refinancing for Park Place I bearing interest at a fixed rate of 5.64%.
On November 22, 2004, we completed the acquisition of Washington Mutual Irvine Campus, a 16-acre office campus located in Irvine, California. The purchase price was approximately $151.2 million, which was funded through a $106 million seven-year mortgage loan at a fixed interest rate of 5.07%. The remainder was funded with a seller financed note payable at 2.82%, per annum, collateralized with a letter of credit fully secured by a cash deposit.
On December 16, 2004, we completed the acquisition of Lantana Media Campus, a 12-acre campus located in Santa Monica, California. The purchase price was approximately $136.8 million, which was funded through $18.8 million cash on hand and a $98 million five-year mortgage loan at a fixed interest rate of 4.94%. The remainder was funded with $20 million from our $100 million line of credit.
On January 13, 2005, we entered into terms for a new $100 million, seven-year mortgage financing for Park Place II bearing interest at a fixed rate of 4.99%. This loan is expected to close at the end of the first quarter of 2005. The proceeds will be used to repay a portion of the $140 million Park Place II bridge loan.
On January 27, 2005, we entered into an agreement to acquire ten properties and three land parcels, located in California, Arizona, Colorado, and Texas, from CommonWealth Properties for a purchase price of approximately $1.51 billion. The purchase price will be initially funded with bridge loans. The properties total approximately 5.0 million rentable square feet with additional development parcels that we believe can support approximately 1.5 million square feet of office space.
Upon completion of the CommonWealth acquisition, the Company will own approximately 24.9 million square feet, consisting of 23 office properties with approximately 14.8 million net rentable square feet, one 350-room hotel with 266,000 square feet and total on and off-site structured parking of approximately 9.8 million square feet, plus surface parking, which in total accommodates over 31,000 vehicles. The Company will also own undeveloped land that it believes can support up to 5.0 million square feet of office, retail and residential uses.
This Supplemental Operating and Financial Data package supplements the information provided in our quarterly and annual reports filed with the Securities and Exchange Commission (SEC). Additional information about us and our properties is also available at our websitewww.maguireproperties.com.
333 South Grand Avenue
Suite 400
Los Angeles, CA 90071
(213) 626-3300
(213) 687-4758 (fax)
| Robert F. Maguire III | Chairman of the Board and Co-Chief Executive Officer | William H. Flaherty | Senior Vice President, Leasing and Marketing |
| Richard I. Gilchrist | President and Co-Chief Executive Officer | Robert P. Goodwin | Senior Vice President, Construction and Development |
| Dallas E. Lucas | Executive Vice President and Chief Financial Officer | Timothy B. Carey | Senior Vice President, Development |
| Mark T. Lammas | Senior Vice President, General Counsel | Daniel F. Gifford | Senior Vice President, Asset Management |
| Javier F. Bitar | Senior Vice President, Finance | Peggy M. Moretti | Senior Vice President, Investor and Public Relations |
- CORPORATE -
Investor Relations Contact: Peggy M. Moretti (213) 626-3300
Please visit our corporate website at:www.maguireproperties.com
| | A.G. Edwards & Sons | | David AuBuchon | (314) 955-5452 |
| | Banc of America Securities | | Ross Nussbaum | (212) 847-5677 |
| | Deutsche Bank Alex. Brown | | John Perry | (212) 250-5182 |
| | Green Street Advisors | | Jim Sullivan | (949) 640-8780 |
| | Legg Mason | | David Fick | (410) 454-5018 |
| | Lehman Brothers | | David Shulman | (212) 526-3413 |
| | Raymond James & Associates | | Paul Puryear | (727) 567-3800 |
| | RBC Capital Markets | | Jay Leupp | (415) 633-8588 |
| | Salomon Smith Barney | | Jonathan Litt | (212) 816-0231 |
| | UBS Warburg | | Keith Mills | (212) 713-3098 |
| | Wachovia Securities | | Christopher Haley | (443) 263-6773 |
| | Wells Fargo Securities | | Christopher Hartung | (415) 675-2759 |
TRANSFER AGENT
Continental Stock Transfer and Trust Company 17 Battery Place 8th Floor New York, NY 10004 (212) 845-3215 |
| Quarterly results for 2005 will be announced according to the following anticipated schedule: |
| | First Quarter | Early May |
| | Second Quarter | Early August |
| | Third Quarter | Early November |
| | Fourth Quarter | Early February 2006 |
COMMON STOCK DATA (NYSE: MPG) |
| Maguire Properties' common stock is traded primarily on the New York Stock Exchange under the symbol: MPG. MPG's common stock had the following characteristics during 2004 (based on New York Stock Exchange prices): | |
| | 4th Quarter 2004 | | 3rd Quarter 2004 | | 2nd Quarter 2004 | | 1st Quarter 2004 |
| | | | | | | | |
| High Price | $ | 27.96 | | | $ | 25.65 | | | $ | 26.51 | | | $ | 25.60 | |
| Low Price | $ | 23.35 | | | $ | 22.41 | | | $ | 20.95 | | | $ | 22.55 | |
| Closing Price | $ | 27.46 | | | $ | 24.31 | | | $ | 24.77 | | | $ | 25.60 | |
Dividends per share - Annualized | $ | 1.60 | | | $ | 1.60 | | | $ | 1.60 | | | $ | 1.60 | |
| Closing Dividend Yield - Annualized | | 5.83 | % | | | 6.58 | % | | | 6.46 | % | | | 6.25 | % |
Closing Common Shares and Limited Partnership Units Outstanding (thousands) | | 53,787 | | | | 53,787 | | | | 53,787 | | | | 53,645 | |
Closing Market Value of Common Shares and Limited Partnership Units Outstanding (thousands) | $ | 1,476,978 | | | $ | 1,307,550 | | | $ | 1,332,292 | | | $ | 1,373,315 | |
| | 4th Quarter 2004 | | 3rd Quarter 2004 | | 2nd Quarter 2004 | | 1st Quarter 2004 | |
| | | | | | | | | |
Common Stock | | | | | | | | |
| Amount | $ | 0.4000 | | $ | 0.4000 | | $ | 0.4000 | | $ | 0.4000 | |
| Declared | December 20, 2004 | | September 23, 2004 | | June 23, 2004 | | March 15, 2004 | |
| Record | December 31, 2004 | | September 30, 2004 | | June 30, 2004 | | March 31, 2004 | |
| Paid | January 28, 2005 | | October 29, 2004 | | July 30, 2004 | | April 30, 2004 | |
| | | | | | | | | |
Preferred Stock | | | | | | | | |
| Amount | $ | 0.4766 | | $ | 0.4766 | | $ | 0.4766 | | $ | 0.51892 | (1) |
| Declared | December 20, 2004 | | September 23, 2004 | | June 23, 2004 | | March 15, 2004 | |
| Record | December 31, 2004 | | September 30, 2004 | | June 30, 2004 | | March 31, 2004 | |
| Paid | January 28, 2005 | | October 29, 2004 | | July 30, 2004 | | April 30, 2004 | |
| (1) | Includes $0.04236 per preferred share covering the period from the completion of our preferred stock offering on January 23, 2004 through January 31, 2004. |
|
| (unaudited and in thousands, except per share amounts) |
| | | Three Months Ended December 31, 2004 | | Three Months Ended September 30, 2004 | | Three Months Ended June 30, 2004 | | Three Months Ended March 31, 2004 |
| | | | | | | | | |
Income Items: | | | | | | | | |
Revenue (1) | | $ | 88,334 | | | $ | 84,130 | | | $ | 81,159 | | | $ | 73,091 | |
| Straight line rent | | $ | 3,391 | | | $ | 3,240 | | | $ | 2,575 | | | $ | 1,399 | |
Fair value lease revenue (2) | | $ | 679 | | | $ | 633 | | | $ | 585 | | | $ | 598 | |
| Lease termination fees | | $ | 147 | | | $ | - | | | $ | - | | | $ | 274 | |
Office property operating margin (3) | | | 66.1 | % | | | 64.9 | % | | | 66.4 | % | | | 65.8 | % |
| Net income allocable to common shareholders | | $ | 1,624 | | | $ | 3,696 | | | $ | 4,320 | | | $ | 5,928 | |
| | | | | | | | | | | | | | | | | |
| Funds from operations (FFO) available | | | | | | | | | | | | | | | | |
to common shareholders (4) | | $ | 22,214 | | | $ | 21,707 | | | $ | 21,000 | | | $ | 19,435 | |
FFO per common share - basic (4) | | $ | 0.52 | | | $ | 0.51 | | | $ | 0.50 | | | $ | 0.46 | |
FFO per common share - diluted (4) | | $ | 0.52 | | | $ | 0.51 | | | $ | 0.49 | | | $ | 0.46 | |
| Net income per common share - basic and diluted | | $ | 0.04 | | | $ | 0.09 | | | $ | 0.10 | | | $ | 0.14 | |
| Dividends declared per common share | | $ | 0.40 | | | $ | 0.40 | | | $ | 0.40 | | | $ | 0.40 | |
Dividends declared per preferred share(5) | | $ | 0.48 | | | $ | 0.48 | | | $ | 0.48 | | | $ | 0.52 | |
| | | | | | | | | | | | | | | | | |
Ratios: | | | | | | | | | | | | | | | | |
Interest coverage ratio (6) | | | 2.75 | | | | 3.06 | | | | 3.22 | | | | 3.20 | |
Fixed-charge coverage ratio (7) | | | 2.16 | | | | 2.32 | | | | 2.39 | | | | 2.47 | |
FFO payout ratio (8) | | | 76.9 | % | | | 78.4 | % | | | 81.6 | % | | | 87.1 | % |
AFFO payout ratio (9) | | | 128.5 | % | | | 114.5 | % | | | 126.9 | % | | | 98.7 | % |
| | | | | | | | | | | | | | | | | |
Capitalization: | | | | | | | | | | | | | | | | |
| Total consolidated debt | | $ | 1,805,450 | | | $ | 1,515,250 | | | $ | 1,375,250 | | | $ | 1,211,250 | |
| Preferred stock @ quarter end | | $ | 250,000 | | | $ | 250,000 | | | $ | 250,000 | | | $ | 250,000 | |
| Common stock price @ quarter end | | $ | 27.46 | | | $ | 24.31 | | | $ | 24.77 | | | $ | 25.60 | |
Common equity value @ quarter end (10) | | $ | 1,476,978 | | | $ | 1,307,550 | | | $ | 1,332,292 | | | $ | 1,373,315 | |
| Total market capitalization | | $ | 3,532,428 | | | $ | 3,072,800 | | | $ | 2,957,542 | | | $ | 2,834,565 | |
| Debt / total market capitalization | | | 51.1 | % | | | 49.3 | % | | | 46.5 | % | | | 42.7 | % |
| Debt plus preferred stock / total market capitalization | | | 58.2 | % | | | 57.4 | % | | | 55.0 | % | | | 51.6 | % |
| (1) | Includes gross revenue from hotel operations of $5,879, $4,156, $5,285, and $5,199 for the three months ended December 31, 2004, September 30, 2004, June 30, 2004 and March 31, 2004, respectively. |
| (2) | Represents the net adjustment for above and below market leases which are being amortized over the remaining term of the respective leases from the date of acquisition. |
| (3) | Calculated as follows: (rental, tenant reimbursement and parking revenues - rental property operating and maintenance expense, real estate taxes and parking expenses) / rental, tenant reimbursement and parking revenues. |
| (4) | For a definition and discussion of FFO, see page 35. For a quantitative reconciliation of the differences between FFO and net income, see page 11. |
| (5) | Preferred dividend declared for three months ended January 31, 2005, October 31, 2004, July 31, 2004 and for the prorated period from and including the preferred stock offering closing date of January 23, 2004, to and including April 30, 2004. |
| (6) | Calculated as earnings before interest, taxes and depreciation and amortization and preferred dividends, or EBITDA, of $51,156, $48,310, $46,555, and $42,251, respectively divided by cash interest expense of $18,608, $15,801, $14,441, and $13,221, respectively, For a definition of cash interest expense, see page 15. For a discussion of EBITDA, see page 36. For a quantitative reconciliation of the differences between EBITDA and net income, see page 13. |
| (7) | Calculated as EBITDA of $51,156, $48,310, $46,555, and $42,251, respectively divided by fixed charges of $23,666, $20,852, $19,486, and $17,095. For a definition of fixed charges,see page 15. |
| (8) | Calculated as dividend declared per common share divided by FFO per common share - diluted. |
| (9) | Calculated as common stock dividends and distributions declared of $21,515, $21,515, $21,515, and $21,458, respectively, divided by AFFO of $16,748, $18,798, $16,957, and $21,735, respectively. For a definition and discussion of AFFO, see page 35. For a quantitative reconciliation of the differences between AFFO and FFO, see page 12. |
| (10) | Assuming 100% conversion of the limited partnership units in the operating partnership into shares of our common stock. |
CONSOLIDATED BALANCE SHEETS |
| (in thousands) |
| | December 31, 2004 | | September 30, 2004 | | June 30, 2004 | | March 31, 2004 |
| | | | (unaudited) | | (unaudited) | | (unaudited) |
| | | | | | | | |
Assets | | | | | | | |
| Investments in real estate | $ | 2,419,743 | | | $ | 2,158,951 | | | $ | 1,926,236 | | | $ | 1,687,247 | |
| Less: accumulated depreciation and amortization | | (199,078 | ) | | | (179,223 | ) | | | (161,594 | ) | | | (144,882 | ) |
| Net Investments in real estate | | 2,220,665 | | | | 1,979,728 | | | | 1,764,642 | | | | 1,542,365 | |
| Cash and cash equivalents including restricted cash | | 135,618 | | | | 145,477 | | | | 196,529 | | | | 309,442 | |
| Rents, deferred rents and other receivables | | 36,685 | | | | 34,766 | | | | 28,451 | | | | 26,730 | |
| Deferred charges, net | | 168,354 | | | | 132,304 | | | | 140,757 | | | | 93,686 | |
| Other assets | | 42,572 | | | | 48,634 | | | | 62,917 | | | | 54,273 | |
Total assets | $ | 2,603,894 | | | $ | 2,340,909 | | | $ | 2,193,296 | | | $ | 2,026,496 | |
| | | | | | | | | | | | | | | | |
Liabilities, minority interests and stockholders' equity | | | | | | | | | | | | | | | |
| Loans payable | $ | 1,805,450 | | | $ | 1,515,250 | | | $ | 1,375,250 | | | $ | 1,211,250 | |
| Dividends and distributions payable | | 24,692 | | | | 24,692 | | | | 24,692 | | | | 25,059 | |
| Accounts payable, accrued interest payable and other liabilities | | 82,738 | | | | 88,361 | | | | 71,075 | | | | 61,900 | |
| Acquired lease obligations | | 81,449 | | | | 83,109 | | | | 75,792 | | | | 73,415 | |
Total liabilities | | 1,994,329 | | | | 1,711,412 | | | | 1,546,809 | | | | 1,371,624 | |
| | | | | | | | | | | | | | | | |
| Minority interests | | 72,198 | | | | 77,227 | | | | 82,969 | | | | 84,917 | |
| | | | | | | | | | | | | | | | |
Stockholders' equity | | | | | | | | | | | | | | | |
| Common and preferred stock and additional paid in capital | | 653,632 | | | | 652,513 | | | | 650,296 | | | | 647,282 | |
| Accumulated deficit and dividends | | (119,033 | ) | | | (103,356 | ) | | | (89,808 | ) | | | (77,014 | ) |
| Unearned and accrued stock compensation, net | | (5,184 | ) | | | (5,573 | ) | | | (5,936 | ) | | | (3,294 | ) |
| Accumulated other comprehensive income, net | | 7,952 | | | | 8,686 | | | | 8,966 | | | | 2,981 | |
Total stockholders' equity | | 537,367 | | | | 552,270 | | | | 563,518 | | | | 569,955 | |
Total liabilities, minority interests and stockholders' equity | $ | 2,603,894 | | | $ | 2,340,909 | | | $ | 2,193,296 | | | $ | 2,026,496 | |
CONSOLIDATED STATEMENTS OF OPERATIONS(1) |
| (in thousands, except for per share amounts ) |
| (unaudited) |
| | Three Months Ended |
| | December 31, 2004 | | September 30, 2004 | | June 30, 2004 | | March 31, 2004 |
| | | | | | | | |
Revenue: | | | | | | | |
| Rental | $ | 51,888 | | | $ | 49,734 | | | $ | 47,285 | | | $ | 38,841 | |
| Tenant reimbursements | | 20,254 | | | | 20,757 | | | | 18,793 | | | | 19,860 | |
| Hotel operations | | 5,879 | | | | 4,156 | | | | 5,285 | | | | 5,199 | |
| Parking | | 9,047 | | | | 8,783 | | | | 8,324 | | | | 7,643 | |
| Management, leasing and development services to affiliates | | 357 | | | | 268 | | | | 956 | | | | 697 | |
| Other | | 909 | | | | 432 | | | | 516 | | | | 851 | |
| Total revenue | | 88,334 | | | | 84,130 | | | | 81,159 | | | | 73,091 | |
| | | | | | | | | | | | | | | | |
Expenses: | | | | | | | | | | | | | | | |
| Rental property operating and maintenance | | 17,972 | | | | 18,766 | | | | 17,212 | | | | 15,295 | |
| Hotel operating and maintenance | | 3,893 | | | | 3,319 | | | | 3,574 | | | | 3,711 | |
| Real estate taxes | | 6,917 | | | | 6,661 | | | | 5,532 | | | | 5,320 | |
| Parking expenses | | 2,603 | | | | 2,387 | | | | 2,224 | | | | 2,079 | |
| General and administrative and other | | 5,002 | | | | 4,687 | | | | 6,062 | | | | 4,436 | |
| Depreciation and amortization | | 25,734 | | | | 22,728 | | | | 21,043 | | | | 17,082 | |
| Interest | | 18,633 | | | | 16,180 | | | | 15,312 | | | | 14,110 | |
| Loss from early extinguishment of debt | | 791 | | | | - | | | | - | | | | - | |
| Total expenses | | 81,545 | | | | 74,728 | | | | 70,959 | | | | 62,033 | |
| | | | | | | | | | | | | | | | |
| Net income before minority interests | | 6,789 | | | | 9,402 | | | | 10,200 | | | | 11,058 | |
| Minority interests | | (399 | ) | | | (940 | ) | | | (1,114 | ) | | | (1,529 | ) |
Net income | | 6,390 | | | | 8,462 | | | | 9,086 | | | | 9,529 | |
| | | | | | | | | | | | | | | | |
| Preferred stock dividends | | (4,766 | ) | | | (4,766 | ) | | | (4,766 | ) | | | (3,601 | ) |
| | | | | | | | | | | | | | | | |
Net income allocable to common shareholders | $ | 1,624 | | | $ | 3,696 | | | $ | 4,320 | | | $ | 5,928 | |
| | | | | | | | | | | | | | | | |
Net income per common share - basic and diluted | $ | 0.04 | | | $ | 0.09 | | | $ | 0.10 | | | $ | 0.14 | |
| | | | | | | | | | | | | | | |
Weighted-average shares outstanding - basic | | 42,828,004 | | | | 42,514,303 | | | | 42,334,249 | | | | 42,329,921 | |
Weighted-average shares outstanding - diluted | | 43,069,428 | | | | 42,688,838 | | | | 42,487,711 | | | | 42,578,570 | |
Weighted-average fully diluted shares and units | | 53,669,201 | | | | 53,602,312 | | | | 53,487,109 | | | | 53,577,968 | |
| (1) | Certain prior period amounts have been reclassified to conform to the current period presentation. |
|
| (in thousands, except for per share amounts) |
| (unaudited) |
| | Three Months Ended December 31, 2004 | | Three Months Ended September 30, 2004 | | Three Months Ended June 30, 2004 | | Three Months Ended March 31, 2004 |
| | | | | | | | |
Reconciliation of net income to funds from operations: | | | | | | | |
| Net income available to common shareholders | $ | 1,624 | | | $ | 3,696 | | | $ | 4,320 | | | $ | 5,928 | |
| Adjustments: | | | | | | | | | | | | | | | |
| Minority interests | | 399 | | | | 940 | | | | 1,114 | | | | 1,529 | |
| Real estate depreciation and amortization | | 25,643 | | | | 22,596 | | | | 20,982 | | | | 16,991 | |
Funds from operations available to common shareholders and unitholders (FFO) | $ | 27,666 | | | $ | 27,232 | | | $ | 26,416 | | | $ | 24,448 | |
Company share of FFO (2) | $ | 22,214 | | | $ | 21,707 | | | $ | 21,000 | | | $ | 19,435 | |
| | | | | | | | | | | | | | | | |
| FFO per share - basic | $ | 0.52 | | | $ | 0.51 | | | $ | 0.50 | | | $ | 0.46 | |
| FFO per share - diluted | $ | 0.52 | | | $ | 0.51 | | | $ | 0.49 | | | $ | 0.46 | |
| | | | | | | | | | | | | | | | |
| Weighted-average shares outstanding - basic | | 42,828,004 | | | | 42,514,303 | | | | 42,334,249 | | | | 42,329,921 | |
| Weighted-average shares outstanding - diluted | | 43,069,428 | | | | 42,688,838 | | | | 42,487,711 | | | | 42,578,570 | |
| (1) | For the definition and discussion of FFO, see page 35. |
| (2) | Based on a weighted average interest in our operating partnership of 80.3%, 79.7%, 79.5% and 79.5% for the three months ended December 31, 2004, September 30, 2004, June 30, 2004 and March 31, 2004, respectively. |
|
ADJUSTED FUNDS FROM OPERATIONS(1) |
| (unaudited and in thousands) |
| | Three Months Ended December 31, 2004 | | Three Months Ended September 30, 2004 | | Three Months Ended June 30, 2004 | | Three Months Ended March 31, 2004 |
| | | | | | | | |
FFO | $ | 27,666 | | | $ | 27,232 | | | $ | 26,416 | | | $ | 24,448 | |
| Non-real estate depreciation | | 91 | | | | 132 | | | | 61 | | | | 91 | |
| Amortization of deferred financing fees | | 978 | | | | 1,055 | | | | 990 | | | | 1,014 | |
| Accretion of interest rate swap sold | | (953 | ) | | | (676 | ) | | | (119 | ) | | | (125 | ) |
| Non-cash stock compensation | | 508 | | | | 508 | | | | 181 | | | | 636 | |
| Loss from early extinguishment of debt | | 791 | | | | - | | | | - | | | | - | |
| Straight line rents | | (3,391 | ) | | | (3,240 | ) | | | (2,575 | ) | | | (1,399 | ) |
| Fair value lease revenue | | (679 | ) | | | (633 | ) | | | (585 | ) | | | (598 | ) |
| Capital lease principal payments | | (307 | ) | | | (285 | ) | | | (279 | ) | | | (273 | ) |
| Capitalized leasing payroll | | (252 | ) | | | (186 | ) | | | (93 | ) | | | (236 | ) |
| Non-recoverable capital expenditures | | (589 | ) | | | (275 | ) | | | (418 | ) | | | (237 | ) |
| Recoverable capital expenditures | | (336 | ) | | | (162 | ) | | | (656 | ) | | | (184 | ) |
Hotel improvements, equipment upgrades and replacements (2) | | - | | | | (5 | ) | | | (16 | ) | | | - | |
2nd generation tenant improvements and leasing commissions (3) (4) | | (6,779 | ) | | | (4,667 | ) | | | (5,950 | ) | | | (1,402 | ) |
| | | | | | | | | | | | | | | | |
Adjusted funds from operations (AFFO) | $ | 16,748 | | | $ | 18,798 | | | $ | 16,957 | | | $ | 21,735 | |
| (1) | For the definition and computation method of AFFO, see page 35. For a quantitative reconciliation of the differences between AFFO and cash flow from operating activities, see page 13. |
| (2) | Excludes $3.3 million, $1.1 million, $1.9 million, and $0.7 million of expenditures for the three months ended December 31, 2004, September 30, 2004, June 30, 2004, and March 31, 2004, respectively related to the renovation of the hotel. See page 33. |
| (3) | Excludes 2nd generation tenant improvements and leasing commissions of $0.8 million, $0.1 million, $4.4 million, and $6.7 million, for the three months ended December 31, 2004, September 30, 2004, June 30, 2004, and March 31, 2004, respectively, related to leases executed prior to and fully reserved ($35.2 million) at our initial public offering. Principal leases comprising the $35.2 million reserve include tenants such as US Bancorp, Wealth & Tax Advisory, Latham & Watkins, Morrison & Foerster, Gibson Dunn & Crutcher and Payden & Rygel. As of December 31, 2004, $3.1 million of this reserve remains. |
| (4) | Excludes 1st generation tenant improvements and leasing commissions of $1.0 million, $1.3 million, $2.1 million, and $0.9 million, for the three months ended December 31, 2004, September 30, 2004, June 30, 2004, and March 31, 2004, respectively. |
|
EARNINGS BEFORE INTEREST, TAXES AND DEPRECIATION AND AMORTIZATION(1) |
AND ADJUSTED FUNDS FROM OPERATIONS(2) |
| (unaudited and in thousands) |
| | Three Months Ended December 31, 2004 | | Three Months Ended September 30, 2004 | | Three Months Ended June 30, 2004 | | Three Months Ended March 31, 2004 |
| | |
Reconciliation of net income to earnings before interest, taxes and depreciation and amortization (EBITDA): | |
Net Income | $ | 6,390 | | | $ | 8,462 | | | $ | 9,086 | | | $ | 9,529 | |
| Add: Minority interest | | 399 | | | | 940 | | | | 1,114 | | | | 1,529 | |
| Interest expense | | 18,633 | | | | 16,180 | | | | 15,312 | | | | 14,110 | |
| Depreciation and amortization | | 25,734 | | | | 22,728 | | | | 21,043 | | | | 17,083 | |
EBITDA | $ | 51,156 | | | $ | 48,310 | | | $ | 46,555 | | | $ | 42,251 | |
| (1) | For the definition and discussion of EBITDA, see page 36. |
Reconciliation of cash flows from operating activities to adjusted funds from operations (AFFO): | | |
Cash flows from operating activities | $ | 25,923 | | | $ | 37,868 | | | $ | 20,882 | | | $ | 20,253 | |
| Changes in other assets and liabilities | | (1,471 | ) | | | (13,961 | ) | | | 3,115 | | | | 3,305 | |
| Non-recoverable capital expenditures | | (589 | ) | | | (275 | ) | | | (418 | ) | | | (237 | ) |
| Recoverable capital expenditures | | (336 | ) | | | (162 | ) | | | (656 | ) | | | (184 | ) |
Hotel��improvements, equipment upgrades and replacements (3) | | - | | | | (5 | ) | | | (16 | ) | | | - | |
2nd generation tenant improvements and leasing commissions (4) (5) | | (6,779 | ) | | | (4,667 | ) | | | (5,950 | ) | | | (1,402 | ) |
AFFO | $ | 16,748 | | | $ | 18,798 | | | $ | 16,957 | | | $ | 21,735 | |
| (2) | For the definition and discussion of AFFO, see page 35. |
| (3) | Excludes $3.3 million, $1.1 million, $1.9 million, and $0.7 million of expenditures for the three months ended December 31, 2004, September 30, 2004, June 30, 2004, and March 31, 2004, respectively related to the renovation of the hotel. See page 33. |
| (4) | Excludes 2nd generation tenant improvements and leasing commissions of $0.8 million, $0.1 million, $4.4 million, and $6.7 million, for the three months ended December 31, 2004, September 30, 2004, June 30, 2004, and March 31, 2004, respectively, related to leases executed prior to and fully reserved ($35.2 million) at our initial public offering. Principal leases comprising the $35.2 million reserve include tenants such as US Bancorp, Wealth & Tax Advisory, Latham & Watkins, Morrison & Foerster, Gibson Dunn & Crutcher and Payden & Rygel. As of December 31, 2004, $3.1 million of this reserve remains. |
| (5) | Excludes 1st generation tenant improvements and leasing commissions of $1.0 million, $1.3 million, $2.1 million, and $0.9 million, for the three months ended December 31, 2004, September 30, 2004, |
| | June 30, 2004, and March 31, 2004, respectively. |
|
| |
Consolidated Debt |
| (in thousands) |
| | | | Aggregate Principal December 31, 2004 |
| | | | |
| Mortgage and Other Secured Loans Payable | | | $ | 1,785,450 | |
| Secured Credit Facility | | | | 20,000 | |
| | | | | | |
Total Debt | | | $ | 1,805,450 | |
| | Shares Outstanding | | Total Liquidation Preference |
| | | | |
Preferred Stock | | 10,000 | | | | 250,000 | |
| | Shares & Units Outstanding | | Market Value (1) |
| | | | |
| Common Stock | | 43,258.5 | | | $ | 1,187,878 | |
| Operating Partnership Units | | 10,528.0 | | | | 289,100 | |
Total Common Equity | | 53,786.5 | | | $ | 1,476,978 | |
| | | | | | | | |
Total Market Capitalization | | | | | $ | 3,532,428 | |
| (1) | Value based on the New York Stock Exchange closing price of $27.46 on December 31, 2004. |
Consolidated Debt Analysis |
| (in thousands) |
| | Maturity Date | | Principal Balance as of December 31, 2004 | | % of Debt | | Interest Rate as of December 31, 2004 |
| | | | | | | | |
Floating Rate Debt | | | | | | | |
| Gas Company Tower & 808 South Olive | | | $ | 280,000 | | | | 15.91 | % | | | 3.95 | % |
| Senior Mezzanine | July 7, 2008 | (1) | | 30,000 | | | | 1.70 | % | | | 8.07 | % |
| Mortgage and Junior Mezzanine | July 6, 2007 | (2) | | 250,000 | | | | 14.21 | % | | | 3.46 | % |
| Park Place II | July 22, 2005 | | | 140,000 | | (3) | | 7.95 | % | | | 3.93 | % |
| Credit Facility | June 27, 2006 | | | 20,000 | | | | 1.14 | % | | | 4.54 | % |
Total Unhedged Floating Rate Debt | | | | 440,000 | | | | 25.00 | % | | | 3.97 | % |
| | | | | | | | | | | | | | |
Fixed Rate Debt | | | | | | | | | | | | | |
| US Bank Tower | July 1, 2013 | | | 260,000 | | | | 14.77 | % | | | 4.66 | % |
| Wells Fargo Tower | July 1, 2010 | | | 250,000 | | | | 14.20 | % | | | 4.68 | % |
| KPMG Tower | November 1, 2011 | | | 210,000 | | | | 11.93 | % | | | 5.14 | % |
| Park Place I | November 1, 2014 | | | 170,000 | | | | 9.66 | % | | | 5.64 | % |
| One California Plaza | December 1, 2010 | | | 146,250 | | | | 8.31 | % | | | 4.73 | % |
| Washington Mutual | December 11, 2011 | | | 106,000 | | | | 6.02 | % | | | 5.07 | % |
| Lantana | January 6, 2010 | | | 98,000 | | | | 5.57 | % | | | 4.94 | % |
| Glendale Center | November 1, 2013 | | | 80,000 | | | | 4.54 | % | | | 5.73 | % |
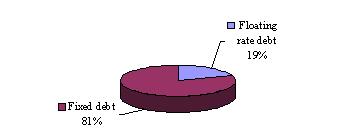
Total Fixed Rate Debt | | | | 1,320,250 | | | | 75.00 | % | | | 4.99 | % |
| | | | | | | | | | | | | | |
Total Consolidated Debt | | | $ | 1,760,250 | | (4) | | 100.00 | % | | | 4.74 | % |
| (1) | Maturity accelerated to 2007 if the $250 million Gas Company Tower & 808 South Olive mortgage and junior mezzanine debt is not extended to 2008. |
| (2) | A one-year extension available at our option. |
| (3) | The company entered into terms to refinance a portion of the $140 million Park Place II loan with a $100 million, 7-year loan bearing interest at 4.99%, which is expected to close by the end of first quarter 2005. |
| (4) | Excludes the $45.2 million note payable relating to the acquisition of the Washington Mutual Irvine Campus, which is collateralized with a letter of credit fully secured by a cash deposit. |
Credit Facility |
| (in thousands) |
| | | Maximum Available | | Currently Available | | Drawn | |
| | | | | | | | | | | | | | |
Secured Line of Credit | | $ | 100,000 | | | $ | 59,857 | | (5) | $ | 20,000 | | (6) |
| (5) | The amount available has been reduced by a $9.1 million letter of credit issued to Metropolitan Life Insurance Company. |
| (6) | The company drew an additional $30.0 million in January 2005. |
Pro Forma Floating vs Fixed Rate Debt |
as of December 31, 2004(7) |
| (7) | Reflects the above financing table except for the pro forma effect of the Park Place II loan refinancing described in (3) above. |
| Interest coverage (a) | 2.75 |
| Fixed-charge coverage (b) | 2.16 |
| Debt to total market capitalization (c) | 51.1% |
| Debt plus preferred stock to total market capitalization (d) | 58.2% |
| (a) | EBITDA divided by cash interest expense. Cash interest expense relates to indebtedness and capital leases less amortized deferred financing fees and amortization of the gain on sold interest rate swaps. | |
| (b) | Same as (a) except denominator includes scheduled debt principal payments, capital lease principal payments and preferred dividends. | |
| (c) | Mortgage debt and other loans divided by mortgage debt and other loans plus preferred stock and the market value of outstanding common stock and operating partnership units, assuming the conversion of operating partnership units into shares of our common stock. | |
| (d) | Same as (c) except numerator includes preferred stock. | |
| | | |
PRO FORMA DEBT MATURITIES |
Pro Forma Debt Maturities(1) |
| (in thousands) |
Property | | 2005 | | 2006 | | 2007 | | 2008 | | 2009 | | Thereafter | | Total |
| | | | | | | | | | | | | | | |
| US Bank Tower | | $ | - | | | $ | - | | | $ | - | | | $ | - | | | $ | - | | | $ | 260,000 | | | $ | 260,000 | |
| Gas Company Tower | | | - | | | | - | | | | - | | | | 280,000 | | (2) | | - | | | | - | | | | 280,000 | |
| Wells Fargo Tower | | | - | | | | 1,513 | | | | 3,828 | | | | 3,982 | | | | 4,206 | | | | 236,471 | | | | 250,000 | |
| KPMG Tower | | | - | | | | - | | | | - | | | | - | | | | 246 | | | | 209,754 | | | | 210,000 | |
| One California Plaza | | | - | | | | - | | | | 239 | | | | 2,825 | | | | 2,984 | | | | 140,202 | | | | 146,250 | |
| Glendale Center | | | - | | | | - | | | | - | | | | - | | | | - | | | | 80,000 | | | | 80,000 | |
| Park Place I | | | - | | | | - | | | | - | | | | - | | | | - | | | | 170,000 | | | | 170,000 | |
Park Place II (3) | | | 40,000 | | | | - | | | | - | | | | - | | | | - | | | | 100,000 | | | | 140,000 | |
| Washington Mutual | | | - | | | | - | | | | - | | | | - | | | | - | | | | 106,000 | | | | 106,000 | |
| Lantana | | | - | | | | - | | | | - | | | | - | | | | - | | | | 98,000 | | | | 98,000 | |
| Credit Facility | | | - | | | | 20,000 | | | | - | | | | - | | | | - | | | | - | | | | 20,000 | |
Total | | $ | 40,000 | | | $ | 21,513 | | | $ | 4,067 | | | $ | 286,807 | | | $ | 7,436 | | | $ | 1,400,427 | | | $ | 1,760,250 | |
| | | | | | | | | | | | | | | | | | | | | | | | | | | | | |
Weighted Average Rates | | 3.93 | % | | | 4.55 | % | | | 4.68 | % | | | 3.97 | % | | | 4.72 | % | | | 5.35 | % | | | 5.08 | % |
| (1) | Excludes the $45.2 million note payable relating to the acquisition of the Washington Mutual Irvine Campus, which is collateralized with a letter of credit fully secured by a cash deposit. |
| (2) | Assumes extension of $250 million senior mortgage, which has a stated maturity of July 6, 2007. |
| (3) | The company entered into terms to refinance a portion of the $140 million Park Place II loan with a $100 million, 7-year loan bearing interest at 4.99%, which is expected to close by the end of first quarter 2005. |
|
| (unaudited and in thousands) |
| | Three Months Ended December 31, (1) | | Twelve Months Ended December 31, (2) |
| | 2004 | | 2003 | | % Change | | 2004 | | 2003 | | % Change |
| | | | | | | | | | | | |
Total Same Store Portfolio | | | | | | | | | | | | | |
| Number of properties | | 8 | | | | 8 | | | | | | | | 6 | | | | 6 | | | | | |
Square Feet (3) | | 9,215,031 | | | | 9,198,737 | | | | | | | | 8,472,206 | | | | 8,455,912 | | | | | |
| Percent of Total Portfolio | | 62.0 | % | | | 86.6 | % | | | | | | | 57.0 | % | | | 79.6 | % | | | | |
| Weighted Average Occupancy | | 92.3 | % | | | 90.7 | % | | | | | | | 91.2 | % | | | 90.4 | % | | | | |
| | | | | | | | | | | | | | | | | | | | | | | | |
GAAP | | | | | | | | | | | | | | | | | | | | | | | |
Breakdown of Net Operating Income: | | | | | | | | | | | | | | | | | | | | | | | |
| Operating Revenues | $ | 58,491 | | | $ | 59,218 | | | | (1.2 | )% | | $ | 221,587 | | | $ | 213,483 | | | | 3.8 | % |
| Operating Expenses | | 18,568 | | | | 20,429 | | | | (9.1 | )% | | | 71,911 | | | | 74,965 | | | | (4.1 | )% |
| Other Expenses | | 284 | | | | 284 | | | | 0.0 | % | | | 608 | | | | 608 | | | | 0.0 | % |
Net Operating Income | $ | 39,639 | | | $ | 38,505 | | | | 2.9 | % | | $ | 149,068 | | | $ | 137,910 | | | | 8.1 | % |
| | | | | | | | | | | | | | | | | | | | | | | | |
CASH BASIS | | | | | | | | | | | | | | | | | | | | | | | |
Breakdown of Net Operating Income: | | | | | | | | | | | | | | | | | | | | | | | |
| Operating Revenues | $ | 56,023 | | | $ | 58,030 | | | | (3.5 | )% | | $ | 214,798 | | | $ | 210,695 | | | | 1.9 | % |
| Operating Expenses | | 18,568 | | | | 20,429 | | | | (9.1 | )% | | | 71,911 | | | | 74,965 | | | | (4.1 | )% |
| Other Expenses | | 284 | | | | 284 | | | | 0.0 | % | | | 608 | | | | 608 | | | | 0.0 | % |
Net Operating Income | $ | 37,171 | | | $ | 37,317 | | | | (0.4 | )% | | $ | 142,279 | | | $ | 135,122 | | | | 5.3 | % |
| (1) | Properties included in same store quarterly analysis are KPMG Tower, Gas Company Tower & 808 S. Olive Garage, Plaza Las Fuentes, Cerritos I & II, US Bank Tower, Wells Fargo Tower, and Glendale Center. |
| (2) | Properties included in same store annual analysis reflect a full year of 100% ownership of KPMG Tower, Gas Company Tower & 808 S. Olive Garage, Plaza Las Fuentes, US Bank Tower, Wells Fargo Tower, and Glendale Center, even though we acquired 100% ownership of US Bank Tower and Wells Fargo Tower upon consummation of our IPO on June 27, 2003 and Glendale Center on August 29, 2003. Cerritos I and II are excluded as we had no interests in these properties before consummation of our IPO. |
| (3) | Property square footage increased in 2004 compared to 2003 due to BOMA '96 remeasurement. |
PORTFOLIO OVERVIEW - SQUARE FOOTAGE |
| |
Rentable Square Feet of Office Properties by Location |
| | | | Property SF | |
| | | | | |
Los Angeles County | | | | |
| Los Angeles Central Business District | | | | |
US Bank Tower (4) (5) | | | | | | 1,379,488 | | |
Gas Company Tower & 808 South Olive (4) (5) | | | | | | 1,335,964 | | |
Wells Fargo Tower (4) (5) | | | | | | 1,381,646 | | |
KPMG Tower (4) (5) | | | | | | 1,133,563 | | |
| One California Plaza | | | | | | 984,170 | | |
| Total Los Angeles Central Business District | | | | | | 6,214,831 | | |
| | | | | | | | | |
| Santa Monica Professional and Entertainment Submarket | | | | | | | | |
| Lantana Media Campus | | | | | | 330,259 | | |
| Total Santa Monica Professional and Entertainment Submarket | | | | | | 330,259 | | |
| | | | | | | | | |
| Tri-Cities | | | | | | | | |
Pasadena - Plaza Las Fuentes (4) (5) | | | | | | 185,813 | | |
Glendale - Glendale Center (4) (5) | | | | | | 382,888 | | |
| Total Tri-Cities | | | | | | 568,701 | | |
| | | | | | | | | |
| Cerritos | | | | | | | | |
Cerritos Corporate Center - Phase I (5) | | | | | | 221,968 | | |
Cerritos Corporate Center - Phase II (5) | | | | | | 104,567 | | |
| Total Cerritos | | | | | | 326,535 | | |
| | | | | | | | | |
Total Los Angeles County | | | | | | 7,440,326 | | |
| | | | | | | | | |
Orange County | | | | | | | | |
| John Wayne Airport Submarket | | | | | | | | |
| Washington Mutual Irvine Campus | | | | | | 414,595 | | |
| Park Place I | | | | | | 1,742,833 | | |
| Park Place II | | | | | | 146,639 | | |
| Total John Wayne Airport Submarket | | | | | | 2,304,067 | | |
| | | | | | | | | |
Total Orange County | | | | | | 2,304,067 | | |
| | | | | | | | | |
Total Office Properties | | | | 9,744,393 | | (1), (3) |
Rentable Square Feet of Retail Property |
Orange County | | | | |
| John Wayne Airport Submarket | | | | |
| Park Place II | | | | | | 124,659 | | |
| Total John Wayne Airport Submarket | | | | | | 124,659 | | |
| | | | | | | | | |
Total Orange County | | | | | | 124,659 | | |
| | | | | | | | | |
Total Retail Property | | | | | | 124,659 | | |
| | Number of Rooms | | Hotel SF | |
| | | | | |
| Westin Hotel, Pasadena, CA | | 350 | | | | 266,000 | | |
| | Vehicle Capacity | | Parking SF | |
| | | | | |
| On-Site Parking | | | | |
US Bank Tower (4) (5) | | 513 | | | | 230,650 | | |
Gas Company Tower (4) (5) | | 1,161 | | | | 319,581 | | |
Wells Fargo Tower (4) (5) | | 1,418 | | | | 426,926 | | |
KPMG Tower (4) (5) | | 845 | | | | 251,313 | | |
| One California Plaza | | 1,313 | | | | 176,500 | | |
Lantana Media Campus (6) | | 952 | | | | 285,600 | | |
Washington Mutual Irvine Campus (6) | | 2,610 | | | | 783,000 | | |
Park Place II (6) | | 5,400 | | | | 1,539,000 | | |
Glendale Center (4) (5) | | 1,400 | | | | 486,287 | | |
Cerritos Corporate Center - Phase I (5) | | 769 | | | | 221,856 | | |
Cerritos Corporate Center - Phase II (5) | | 696 | | | | 194,434 | | |
| | | | | | | | | |
| Off-Site Garages | | | | | | | | |
808 South Olive Garage (4) (5) | | 928 | | | | 345,933 | | |
Westlawn Garage (4) (5) | | 1,047 | | | | 363,906 | | |
X-2 Garage (4) (5) | | 774 | | | | 248,248 | | |
| | | | | | | | | |
Total Parking | | 19,826 | | (2) | | 5,873,234 | | |
| | | | | | | |
Total Portfolio | | | | 16,008,286 | | |
(1) | Increased from 8,997,620 square feet at September 30, 2004 due to acquisition of Washington Mutual Irvine Campus and Lantana Media Campus on November 22 and December 16, 2004, respectively. The remaining difference of 1,919 square feet is attributable to remeasurement of new and renewed leases. |
| (2) | Actual vehicles under monthly contract are 21,773 due to oversell factor. |
| (3) | Total square footage includes 212,334 square feet of retail space located within the office properties. |
| (4) | Same store property for the twelve months ended December 31, 2004 and 2003. |
| (5) | Same store property for the three months ended December 31, 2004 and 2003. |
| (6) | Exact square footage of parking area is unavailable. An estimate of 300 square feet per space was used for the Lantana Media Campus and Washington Mutual Irvine Campus. An estimate of 285 square feet was used for Park Place II. |
PORTFOLIO LISTING - OCCUPANCY AND IN-PLACE RENTS |
Property | | Submarket | | Square Feet | | % Leased | | Annualized Rent (1) | | Annualized Rent $/RSF (2) |
| | | | | | | | | | | |
Office Properties | | | | | | | | | | |
| US Bank Tower | | Los Angeles Central Business District | | | 1,379,488 | | | | 89.1 | % | | $ | 34,778,921 | | | $ | 28.29 | |
| Gas Company Tower | | Los Angeles Central Business District | | | 1,335,964 | | | | 98.5 | % | | | 32,160,543 | | | | 24.43 | |
| Wells Fargo Tower | | Los Angeles Central Business District | | | 1,381,646 | | | | 85.1 | % | | | 21,924,105 | | | | 18.65 | |
| KPMG Tower | | Los Angeles Central Business District | | | 1,133,563 | | | | 91.8 | % | | | 20,118,428 | | | | 19.34 | |
| One California Plaza | | Los Angeles Central Business District | | | 984,170 | | | | 92.4 | % | | | 13,919,344 | | | | 15.30 | |
| Sub-Total LACBD | | | | | 6,214,831 | | | | 91.3 | % | | | 122,901,341 | | | | 21.67 | |
| | | | | | | | | | | | | | | | | |
| Plaza Las Fuentes | | Tri-Cities | | | 185,813 | | | | 99.7 | % | | | 3,454,230 | | | | 18.65 | |
| Glendale Center | | Tri-Cities | | | 382,888 | | | | 100.0 | % | | | 7,416,764 | | | | 19.37 | |
| Sub-Total Tri-Cities | | | | | 568,701 | | | | 99.9 | % | | | 10,870,994 | | | | 19.14 | |
| | | | | | | | | | | | | | | | | | | |
| Cerritos - Phase I | | Cerritos Office | | | 221,968 | | | | 100.0 | % | | | 5,367,540 | | | | 24.18 | |
| Cerritos - Phase II | | Cerritos Office | | | 104,567 | | | | 100.0 | % | | | 2,141,371 | | | | 20.48 | |
| Sub-Total Cerritos | | | | | 326,535 | | | | 100.0 | % | | | 7,508,911 | | | | 23.00 | |
| | | | | | | | | | | | | | | | | | | |
| Lantana Media Campus | | Santa Monica Professional & Entertainment | | | 330,259 | | | | 88.8 | % | | | 8,962,412 | | | | 30.55 | |
| | | | | | | | | | | | | | | | | | | |
Sub-Total Los Angeles County | | | 7,440,326 | | | | 92.2 | % | | | 150,243,658 | | | | 21.90 | |
| | | | | | | | | | | | | | | | | |
| Park Place I | | John Wayne Airport | | | 1,742,833 | | | | 90.2 | % | | | 20,169,115 | | | | 12.84 | |
| Park Place II | | John Wayne Airport | | | 146,639 | | | | 36.1 | % | | | 1,214,142 | | | | 22.93 | |
| Washington Mutual Irvine Campus | | John Wayne Airport | | | 414,595 | | | | 100.0 | % | | | 8,383,860 | | | | 20.22 | |
| | | | | | | | | | | | | | | | | |
Sub-Total Orange County | | | 2,304,067 | | | | 88.5 | % | | | 29,767,117 | | | | 14.60 | |
| | | | | | | | | | | | | | | | | | | |
Total/Weighted Average - Office Properties | | | 9,744,393 | | | | 91.3 | % | | $ | 180,010,775 | | | $ | 20.23 | |
| | | | | | | | | | | | | | | | | |
| | | | | | | | | | | | | | | | | |
Retail Property | | | | | | | | | | | | | | | | | | |
Park Place II(3) | | John Wayne Airport | | | 124,659 | | | | 93.7 | % | | | 3,141,065 | | | | 26.89 | |
| | | | | | | | | | | | | | | | | |
Total/Weighted Average - Retail Property | | | 124,659 | | | | 93.7 | % | | $ | 3,141,065 | | | $ | 26.89 | |
| | | | | | | | | | | | | | | | | |
| | | | | | | | | | | | | | | | | |
Total/Weighted Average - Office & Retail Properties | | | 9,869,052 | | | | 91.3 | % | | $ | 183,151,840 | | | $ | 20.32 | |
| | | Weighted Average Remaining Lease Term (in years) | | % Leased Q4 2004 | | % Leased Q3 2004 | | % Leased Q2 2004 | | % Leased Q1 2004 | | % Leased Q4 2003 |
| | | | | | | | | | | | | |
| US Bank Tower | | | 4.6 | | | | 89.1 | % | | | 89.2 | % | | | 90.0 | % | | | 90.4 | % | | | 90.4 | % |
| Gas Company Tower | | | 5.6 | | | | 98.5 | % | | | 98.5 | % | | | 98.5 | % | | | 98.2 | % | | | 96.4 | % |
| Wells Fargo Tower | | | 7.3 | | | | 85.1 | % | | | 83.5 | % | | | 82.9 | % | | | 82.8 | % | | | 83.6 | % |
| KPMG Tower | | | 7.0 | | | | 91.8 | % | | | 92.5 | % | | | 92.0 | % | | | 86.8 | % | | | 87.0 | % |
| One California Plaza | | | 5.2 | | | | 92.4 | % | | | 91.9 | % | | | 91.8 | % | | | 92.1 | % | | | 91.0 | % |
| Plaza Las Fuentes | | | 7.5 | | | | 99.7 | % | | | 96.5 | % | | | 96.5 | % | | | 89.7 | % | | | 91.3 | % |
| Glendale Center | | | 6.0 | | | | 100.0 | % | | | 100.0 | % | | | 100.0 | % | | | 100.0 | % | | | 100.0 | % |
| Cerritos - Phase I | | | 6.4 | | | | 100.0 | % | | | 100.0 | % | | | 100.0 | % | | | 100.0 | % | | | 100.0 | % |
| Cerritos - Phase II | | | 9.8 | | | | 100.0 | % | | | 100.0 | % | | | 100.0 | % | | | 100.0 | % | | | 100.0 | % |
| Park Place I | | | 5.1 | | | | 90.2 | % | | | 95.8 | % | | | 96.3 | % | | | 96.8 | % | | | 96.8 | % |
| Park Place II | | | 7.0 | | | | 62.6 | % | | | 62.9 | % | | | - | | | | - | | | | - | |
| Washington Mutual Irvine Campus | | | 7.0 | | | | 100.0 | % | | | - | | | | - | | | | - | | | | - | |
| Lantana Media Campus | | | 5.1 | | | | 88.8 | % | | | - | | | | - | | | | - | | | | - | |
| | | | | | | | | | | | | | | | | | | | | | | | | |
Total Portfolio | | | 6.0 | | | | 91.3 | % | | | 91.9 | % | | | 92.8 | % | | | 92.1 | % | | | 91.9 | % |
| (1) | Annualized rent represents the annualized monthly contractual rent under existing leases as of December 31, 2004. This amount reflects total base rent before any one-time or non-recurring rent abatements but after annually recurring rent credits and is shown on a net basis; thus, for any tenant under a partial gross lease, the expense stop, or under a fully gross lease, the current year operating expenses (which may be estimates as of such date), are subtracted from gross rent. |
| (2) | Annualized rent per rentable square foot represents annualized rent as computed above, divided by the total square footage under lease as of the same date. |
| (3) | The retail property square footage of Park Place II excludes 'The Greens,' a 20,000 rentable square foot golf course. |
MAJOR TENANTS - OFFICE PROPERTIES |
| | Tenant | | Number of Locations | | Annualized Rent (1) | | % of Total Annualized Rent | | Total Leased Square Feet | | % of Aggregate Leased Square Feet of Existing Portfolio | | Weighted Average Remaining Lease Term in Months | | S & P Credit Rating / National Recognition (3) |
| | | | | | | | | | | | | | | | |
| | Rated | | | | | | | | | | | | | | |
| 1 | Southern California Gas Company | | 1 | | $ | 16,807,927 | | | | 9.2 | % | | | 576,516 | | | | 6.4 | % | | | 82 | | | A |
| 2 | Wells Fargo Bank | | 2 | | | 10,637,252 | | | | 5.8 | % | | | 432,424 | | | | 4.8 | % | | | 62 | | | AA |
| 3 | Sempra (Pacific Enterprises) | | 1 | | | 8,504,539 | | | | 4.6 | % | | | 225,756 | | | | 2.5 | % | | | 66 | | | A |
| 4 | Washington Mutual , FA | | 1 | | | 8,383,860 | | | | 4.6 | % | | | 414,595 | | | | 4.6 | % | | | 84 | | | A |
| 5 | AT&T Wireless | | 2 | | | 7,508,911 | | | | 4.1 | % | | | 326,535 | | | | 3.6 | % | | | 104 | | | A |
| 6 | ConAgra, Inc. | | 1 | | | 4,989,050 | | | | 2.7 | % | | | 393,317 | | | | 4.4 | % | | | 68 | | | BBB+ |
| 7 | Los Angeles Unified School District | | 1 | | | 4,978,817 | | | | 2.7 | % | | | 260,498 | | | | 2.9 | % | | | 17 | | | AA- |
| 8 | Bank of America | | 2 | | | 3,485,479 | | | | 1.9 | % | | | 198,861 | | | | 2.2 | % | | | 65 | | | AA- |
| 9 | Disney Enterprises | | 1 | | | 3,085,885 | | | | 1.7 | % | | | 156,215 | | | | 1.7 | % | | | 78 | | | BBB+ |
| 10 | US Bank | | 1 | | | 2,513,129 | | | | 1.4 | % | | | 121,645 | | | | 1.4 | % | | | 126 | | | AA- |
| | | | | | | | | | | | | | | | | | | | | | | | | | |
| | Total Rated / Weighted Average (2) | | | | | 70,894,849 | | | | 38.7 | % | | | 3,106,362 | | | | 34.5 | % | | | 74 | | | |
| | | | | | | | | | | | | | | | | | | | | | | | | | |
| | Total Investment Grade Tenants | | | | | 87,937,786 | | | | 48.0 | % | | | 4,276,979 | | | | 47.4 | % | | | | | | |
| | | | | | | | | | | | | | | | | | | | | | | | | | |
| | Unrated - Nationally Recognized | | | | | | | | | | | | | | | | | | | | | | | | |
| 11 | Latham & Watkins | | 2 | | | 9,723,371 | | | | 5.3 | % | | | 361,524 | | | | 4.0 | % | | | 72 | | | 4th Largest US Law Firm |
| 12 | Gibson Dunn & Crutcher | | 1 | | | 6,103,475 | | | | 3.3 | % | | | 268,268 | | | | 3.0 | % | | | 155 | | | 14th Largest US Law Firm |
| 13 | Jones, Day, Reavis & Pogue | | 1 | | | 4,982,380 | | | | 2.7 | % | | | 152,166 | | | | 1.7 | % | | | 22 | | | 3rd Largest US Law Firm |
| 14 | Morrison & Foerster | | 1 | | | 4,365,725 | | | | 2.4 | % | | | 192,775 | | | | 2.1 | % | | | 82 | | | 22nd Largest US Law Firm |
| 15 | Munger Tolles & Olson | | 1 | | | 3,835,466 | | | | 2.1 | % | | | 160,682 | | | | 1.8 | % | | | 206 | | | Prominent Regional Law Firm |
| 16 | Bingham McCutchen | | 2 | | | 3,621,599 | | | | 2.0 | % | | | 182,393 | | | | 2.0 | % | | | 62 | | | 26th Largest US Law Firm |
| 17 | KPMG | | 1 | | | 2,943,362 | | | | 1.6 | % | | | 175,525 | | | | 1.9 | % | | | 114 | | | 4th Largest US Accounting Firm |
| 18 | White & Case | | 1 | | | 2,844,120 | | | | 1.6 | % | | | 94,804 | | | | 1.1 | % | | | 83 | | | 7th Largest US Law Firm |
| 19 | JR Motion Picture Holding Company | | 1 | | | 2,505,635 | | | | 1.4 | % | | | 62,087 | | | | 0.7 | % | | | 34 | | | Nationally Recognized Production Studio |
| 20 | Sidley Austin Brown & Wood | | 1 | | | 2,199,680 | | | | 1.2 | % | | | 147,237 | | | | 1.6 | % | | | 48 | | | 5th Largest US Law Firm |
| | | | | | | | | | | | | | | | | | | | | | | | | | |
| | Total Unrated / Weighted Average (2) | | | | | 43,124,813 | | | | 23.6 | % | | | 1,797,461 | | | | 19.9 | % | | | 94 | | | |
| | | | | | | | | | | | | | | | | | | | | | | | | | |
| | Total Nationally Recognized Tenants | | | | | 59,389,291 | | | | 32.4 | % | | | 2,891,047 | | | | 32.1 | % | | | | | | |
| | | | | | | | | | | | | | | | | | | | | | | | | | |
| | Total / Weighted Average (2) | | | | $ | 114,019,662 | | | | 62.3 | % | | | 4,903,823 | | | | 54.4 | % | | | 84 | | | |
| | | | | | | | | | | | | | | | | | | | | | | | |
| | Total Investment Grade or Nationally Recognized Tenants | | | | $ | 147,327,077 | | | | 80.4 | % | | | 7,168,026 | | | | 79.5 | % | | | | |
| (1) | Annualized base rent is calculated as monthly contractual base rent under existing leases as of December 31, 2004, multiplied by 12; for those leases where rent has not yet commenced, the first month in which rent is to be received is used to determine annualized base rent. |
| (2) | The weighted average calculation is based on the net rentable square feet leased by each tenant. |
| (3) | S&P credit ratings are as of December 31, 2004, and rankings of law firms are based on total gross revenue in 2003 as reported by American Lawyer Media's LAW.com. |
LEASE EXPIRATIONS - Total Portfolio |
Year | | Total Area in Square Feet Covered by Expiring Leases | | Percentage of Aggregate Square Feet | | Annualized Rent | | Percentage of Gross Annualized Rent | | Current Rent per Square Foot (1) | | Rent per Square Foot at Expiration (2) |
| | | | | | | | | | | | | |
| Available | | | 854,161 | | | | 8.7 | % | | | | | | | | |
| 2005 | | | 630,771 | | | | 6.4 | % | | | 14,411,806 | | | | 7.9 | % | | $ | 22.85 | | | $ | 23.22 | |
| 2006 | | | 932,844 | | | | 9.5 | % | | | 19,380,350 | | | | 10.6 | % | | | 20.78 | | | | 21.74 | |
| 2007 | | | 600,707 | | | | 6.1 | % | | | 12,265,482 | | | | 6.7 | % | | | 20.42 | | | | 21.97 | |
| 2008 | | | 605,992 | | | | 6.1 | % | | | 9,658,942 | | | | 5.3 | % | | | 15.94 | | | | 17.04 | |
| 2009 | | | 812,094 | | | | 8.2 | % | | | 17,335,051 | | | | 9.4 | % | | | 21.35 | | | | 22.68 | |
| 2010 | | | 1,031,502 | | | | 10.5 | % | | | 20,293,410 | | | | 11.1 | % | | | 19.67 | | | | 22.19 | |
| 2011 | | | 1,551,430 | | | | 15.7 | % | | | 32,696,249 | | | | 17.8 | % | | | 21.07 | | | | 26.93 | |
| 2012 | | | 464,069 | | | | 4.7 | % | | | 7,909,413 | | | | 4.3 | % | | | 17.04 | | | | 21.18 | |
| 2013 | | | 841,879 | | | | 8.5 | % | | | 15,708,936 | | | | 8.6 | % | | | 18.66 | | | | 21.81 | |
| 2014 | | | 675,085 | | | | 6.8 | % | | | 13,151,591 | | | | 7.2 | % | | | 19.48 | | | | 26.03 | |
| Thereafter | | | 868,518 | | | | 8.8 | % | | | 20,340,610 | | | | 11.1 | % | | | 23.42 | | | | 25.16 | |
Total | | | 9,869,052 | | | | 100.0 | % | | $ | 183,151,840 | | | | 100.0 | % | | $ | 20.32 | | | $ | 23.21 | |
Leases Expiring in the Next 4 Quarters: | | | | | | | | | | |
| | | | | | | | | | | | | |
| 1st Quarter 2005 | | | 193,323 | | | | 2.0 | % | | $ | 6,725,052 | | | | 3.7 | % | | $ | 34.79 | | | $ | 34.80 | |
2nd Quarter 2005 (3) | | | 196,205 | | | | 2.0 | % | | $ | 3,180,854 | | | | 1.7 | % | | $ | 16.21 | | | $ | 16.48 | |
| 3rd Quarter 2005 | | | 99,284 | | | | 1.0 | % | | $ | 2,317,932 | | | | 1.3 | % | | $ | 23.35 | | | $ | 25.13 | |
| 4th Quarter 2005 | | | 141,959 | | | | 1.4 | % | | $ | 2,187,968 | | | | 1.2 | % | | $ | 15.41 | | | $ | 15.41 | |
| | | | | | | | | | | | | |
| (1) | Current rent per leased square foot represents current base rent, divided by total square footage under lease as of the same date. |
| (2) | Rent per leased square foot at expiration represents base rent including any future rent steps, and thus represents the base rent that will be in place at lease expiration. |
| (3) | Includes tenants leasing on a month-to-month basis. |
LEASE EXPIRATIONS - Los Angeles County |
| |
Year | | Total Area in Square Feet Covered by Expiring Leases | | Percentage of Aggregate Square Feet | | Annualized Rent | | Percentage of Gross Annualized Rent | | Current Rent per Square Foot (1) | | Rent per Square Foot at Expiration (2) |
| | | | | | | | | | | | | |
| Available | | | 581,197 | | | | 7.8 | % | | | | | | | | |
| 2005 | | | 596,999 | | | | 8.0 | % | | | 13,702,960 | | | | 9.2 | % | | $ | 22.95 | | | $ | 23.34 | |
| 2006 | | | 838,476 | | | | 11.3 | % | | | 17,684,516 | | | | 11.8 | % | | | 21.09 | | | | 22.10 | |
| 2007 | | | 439,373 | | | | 5.9 | % | | | 9,399,905 | | | | 6.2 | % | | | 21.39 | | | | 23.12 | |
| 2008 | | | 381,659 | | | | 5.1 | % | | | 6,323,163 | | | | 4.2 | % | | | 16.57 | | | | 17.25 | |
| 2009 | | | 471,946 | | | | 6.3 | % | | | 11,981,829 | | | | 8.0 | % | | | 25.39 | | | | 25.88 | |
| 2010 | | | 467,989 | | | | 6.3 | % | | | 13,213,318 | | | | 8.8 | % | | | 28.23 | | | | 30.87 | |
| 2011 | | | 1,194,251 | | | | 16.1 | % | | | 27,578,781 | | | | 18.3 | % | | | 23.09 | | | | 28.99 | |
| 2012 | | | 274,703 | | | | 3.7 | % | | | 4,961,017 | | | | 3.3 | % | | | 18.06 | | | | 22.65 | |
| 2013 | | | 841,879 | | | | 11.3 | % | | | 15,708,936 | | | | 10.4 | % | | | 18.66 | | | | 21.81 | |
| 2014 | | | 532,393 | | | | 7.2 | % | | | 10,314,552 | | | | 6.9 | % | | | 21.81 | | | | 26.11 | |
| Thereafter | | | 819,461 | | | | 11.0 | % | | | 19,374,681 | | | | 12.9 | % | | | 23.69 | | | | 25.02 | |
Total | | | 7,440,326 | | | | 100.0 | % | | $ | 150,243,658 | | | | 100.0 | % | | $ | 21.90 | | | $ | 24.73 | |
Leases Expiring in the Next 4 Quarters: | | | | | | | | | | |
| | | | | | | | | | | | | |
| 1st Quarter 2005 | | | 179,853 | | | | 2.4 | % | | $ | 6,427,871 | | | | 4.3 | % | | $ | 35.74 | | | $ | 35.74 | |
2nd Quarter 2005 (3) | | | 185,441 | | | | 2.5 | % | | $ | 2,936,985 | | | | 2.0 | % | | $ | 15.84 | | | $ | 16.12 | |
| 3rd Quarter 2005 | | | 89,746 | | | | 1.2 | % | | $ | 2,150,136 | | | | 1.4 | % | | $ | 23.96 | | | $ | 25.13 | |
| 4th Quarter 2005 | | | 141,959 | | | | 1.9 | % | | $ | 2,187,968 | | | | 1.5 | % | | $ | 15.41 | | | $ | 15.41 | |
| | | | | | | | | | | | | |
| (1) | Current rent per leased square foot represents current base rent, divided by total square footage under lease as of the samedate. |
| (2) | Rent per leased square foot at expiration represents base rent including any future rent steps, and thus represents the base rent that will be in place at lease expiration. |
| (3) | Includes tenants leasing on a month-to-month basis. |
LEASE EXPIRATIONS - Orange County |
Year | | Total Area in Square Feet Covered by Expiring Leases | | Percentage of Aggregate Square Feet | | Annualized Rent | | Percentage of Gross Annualized Rent | | Current Rent per Square Foot (1) | | Rent per Square Foot at Expiration (2) |
| | | | | | | | | | | | | |
| Available | | | 272,964 | | | | 11.2 | % | | | | | | | | |
| 2005 | | | 33,772 | | | | 1.4 | % | | | 708,846 | | | | 2.2 | % | | $ | 20.99 | | | $ | 21.08 | |
| 2006 | | | 94,368 | | | | 3.9 | % | | | 1,695,834 | | | | 5.2 | % | | | 17.97 | | | | 18.47 | |
| 2007 | | | 161,334 | | | | 6.7 | % | | | 2,865,577 | | | | 8.7 | % | | | 17.76 | | | | 18.86 | |
| 2008 | | | 224,333 | | | | 9.2 | % | | | 3,335,779 | | | | 10.1 | % | | | 14.87 | | | | 16.70 | |
| 2009 | | | 340,148 | | | | 14.0 | % | | | 5,353,222 | | | | 16.3 | % | | | 15.74 | | | | 18.24 | |
| 2010 | | | 563,513 | | | | 23.2 | % | | | 7,080,092 | | | | 21.5 | % | | | 12.56 | | | | 14.97 | |
| 2011 | | | 357,179 | | | | 14.7 | % | | | 5,117,468 | | | | 15.5 | % | | | 14.33 | | | | 20.05 | |
| 2012 | | | 189,366 | | | | 7.8 | % | | | 2,948,396 | | | | 9.0 | % | | | 15.57 | | | | 19.06 | |
| 2013 | | | - | | | | 0.0 | % | | | - | | | | 0.0 | % | | | - | | | | - | |
| 2014 | | | 142,692 | | | | 5.9 | % | | | 2,837,039 | | | | 8.6 | % | | | 19.88 | | | | 25.74 | |
| Thereafter | | | 49,057 | | | | 2.0 | % | | | 965,929 | | | | 2.9 | % | | | 19.69 | | | | 27.53 | |
Total | | | 2,428,726 | | | | 100.0 | % | | $ | 32,908,182 | | | | 100.0 | % | | $ | 15.27 | | | $ | 18.40 | |
Leases Expiring in the Next 4 Quarters: | | | | | | | | | | |
| | | | | | | | | | | | | |
| 1st Quarter 2005 | | | 13,470 | | | | 0.6 | % | | $ | 297,181 | | | | 0.9 | % | | $ | 22.06 | | | $ | 22.29 | |
2nd Quarter 2005 (3) | | | 10,764 | | | | 0.4 | % | | $ | 243,869 | | | | 0.8 | % | | $ | 22.66 | | | $ | 22.66 | |
| 3rd Quarter 2005 | | | 9,538 | | | | 0.4 | % | | $ | 167,796 | | | | 0.5 | % | | $ | 17.59 | | | $ | 17.59 | |
| 4th Quarter 2005 | | | - | | | | 0.0 | % | | $ | - | | | | 0.0 | % | | $ | - | | | $ | - | |
| | | | | | | | | | | | | |
| (1) | Current rent per leased square foot represents current base rent, divided by total square footage under lease as of the same date. |
| (2) | Rent per leased square foot at expiration represents base rent including any future rent steps, and thus represents the base rent that will be in place at lease expiration. |
| (3) | Includes tenants leasing on a month-to-month basis. |
| | | For the Three Months Ended December 31, 2004 | | % Leased |
| | | | | |
Leased Square Feet as of September 30, 2004 | | | 8,380,360 | | | | 91.9 | % |
| Recent Acquisition: Lantana Media Campus | | | 293,355 | | | | | |
| Recent Acquisition: Washington Mutual Irvine Campus | | | 414,595 | | | | | |
Leased Square Feet including Lantana Media Campus & Washington Mutual | | | 9,088,310 | | | | 92.0 | % |
| Expirations | | | (208,826 | ) | | | (2.1 | )% |
| New Leases | | | 50,736 | | | | 0.5 | % |
| Renewals | | | 84,671 | | | | 0.9 | % |
Leased Square Feet as of December 31, 2004 | | | 9,014,891 | | | | 91.3 | % |
| | | | | | | | | |
Cash Rent Growth (1) | | | | | | |
| Expiring Rate per Square Foot | | | | $ | 29.95 | |
| New / Renewed Rate per Square Foot | | | | $ | 27.71 | |
| Percentage Change | | | | | (7.5 | )% |
| | | | | | | |
GAAP Rent Growth (2) | | | | | | |
| Expiring Rate per Square Foot | | | | $ | 29.58 | |
| New / Renewed Rate per Square Foot | | | | $ | 29.03 | |
| Percentage Change | | | | | (1.9 | )% |
| | | | | | | |
Weighted Average Lease Term - New (in months) | | | | | 91 | |
Weighted Average Lease Term - Renewal (in months) | | | | | 36 | |
| (1) | Represents the difference between (i) initial market rents on new and renewed leases and (ii) the cash rents on those spaces immediately prior to the expiration or termination. |
| | Excludes new and renewed leases for spaces with more than six months of downtime. |
| (2) | Represents estimated cash rent growth adjusted for straight-line rents in accordance with GAAP. |
LEASING ACTIVITY - Los Angeles Central Business District |
| | | For the Three Months Ended December 31, 2004 | | % Leased |
| | | | | |
Leased Square Feet as of September 30, 2004, Los Angeles Central Business District | | | 5,651,602 | | | | 91.0 | % |
| Expirations | | | (92,559 | ) | | | (1.5 | )% |
| New Leases | | | 29,494 | | | | 0.5 | % |
| Renewals | | | 82,651 | | | | 1.3 | % |
Leased Square Feet as of December 31, 2004, Los Angeles Central Business District | | | 5,671,188 | | | | 91.3 | % |
| | | | | | | |
Cash Rent Growth (1) | | | | | | |
| Expiring Rate per Square Foot | | | | $ | 30.75 | |
| New / Renewed Rate per Square Foot | | | | $ | 28.53 | |
| Percentage Change | | | | | (7.2 | )% |
| | | | | | | |
GAAP Rent Growth (2) | | | | | | |
| Expiring Rate per Square Foot | | | | $ | 30.54 | |
| New / Renewed Rate per Square Foot | | | | $ | 29.83 | |
| Percentage Change | | | | | (2.3 | )% |
| | | | | | | |
Weighted Average Lease Term - New (in months) | | | | | 66 | |
Weighted Average Lease Term - Renewal (in months) | | | | | 36 | |
| (1) | Represents the difference between (i) initial market rents on new and renewed leases and (ii) the cash rents on those spaces immediately prior to the expiration or termination. |
| | Excludes new and renewed leases for spaces with more than six months of downtime. |
| (2) | Represents estimated cash rent growth adjusted for straight-line rents in accordance with GAAP. |
LEASING ACTIVITY - Tri-Cities, Santa Monica and Cerritos |
| | | For the Three Months Ended December 31, 2004 | | % Leased |
| | | | | |
Leased Square Feet as of September 30, 2004, Tri-Cities and Cerritos | | | 888,339 | | | | 99.3 | % |
| Recent Acquisition: Lantana Media Campus | | | 293,355 | | | | | |
Leased Square Feet including Lantana Media Campus | | | 1,181,694 | | | | 96.4 | % |
| Expirations | | | (7,681 | ) | | | (0.6 | )% |
| New Leases | | | 11,908 | | | | 1.0 | % |
| Renewals | | | 2,020 | | | | 0.1 | % |
Leased Square Feet as of December 31, 2004, Tri-Cities, Santa Monica and Cerritos | | | 1,187,941 | | | | 96.9 | % |
| | | | | | | |
Cash Rent Growth (1) | | | | | | |
| Expiring Rate per Square Foot | | | | $ | 21.55 | |
| New / Renewed Rate per Square Foot | | | | $ | 18.13 | |
| Percentage Change | | | | | (15.9 | )% |
| | | | | | | |
GAAP Rent Growth (2) | | | | | | |
| Expiring Rate per Square Foot | | | | $ | 19.26 | |
| New / Renewed Rate per Square Foot | | | | $ | 20.11 | |
| Percentage Change | | | | | 4.4 | % |
| | | | | | | |
Weighted Average Lease Term - New (in months) | | | | | 177 | |
Weighted Average Lease Term - Renewal (in months) | | | | | 36 | |
| (1) | Represents the difference between (i) initial market rents on new and renewed leases and (ii) the cash rents on those spaces immediately prior to the expiration or termination. |
| | Excludes new and renewed leases for spaces with more than six months of downtime. |
| (2) | Represents estimated cash rent growth adjusted for straight-line rents in accordance with GAAP. |
LEASING ACTIVITY - Orange County |
| | | For the Three Months Ended December 31, 2004 | | % Leased |
| | | | | |
Leased Square Feet as of September 30, 2004, Orange County | | | 1,840,419 | | | | 91.4 | % |
| Recent Acquisition: Washington Mutual Irvine Campus | | | 414,595 | | | | | |
Leased Square Feet including Washington Mutual Irvine Campus | | | 2,255,014 | | | | 92.8 | % |
| Expirations | | | (108,586 | ) | | | (4.4 | )% |
| New Leases | | | 9,334 | | | | 0.4 | % |
| Renewals | | | - | | | | 0.0 | % |
Leased Square Feet as of December 31, 2004, Orange County | | | 2,155,762 | | | | 88.8 | % |
| | | | | | | |
Cash Rent Growth (1) | | | | | | |
| Expiring Rate per Square Foot | | | | $ | 29.82 | |
| New / Renewed Rate per Square Foot | | | | $ | 31.32 | |
| Percentage Change | | | | | 5.0 | % |
| | | | | | | |
GAAP Rent Growth (2) | | | | | | |
| Expiring Rate per Square Foot | | | | $ | 30.63 | |
| New / Renewed Rate per Square Foot | | | | $ | 31.32 | |
| Percentage Change | | | | | 2.3 | % |
| | | | | | | |
Weighted Average Lease Term - New (in months) | | | | | 60 | |
Weighted Average Lease Term - Renewal (in months) | | | | | - | |
| (1) | Represents the difference between (i) initial market rents on new and renewed leases and (ii) the cash rents on those spaces immediately prior to the expiration or termination. |
| | Excludes new and renewed leases for spaces with more than six months of downtime. |
| (2) | Represents estimated cash rent growth adjusted for straight-line rents in accordance with GAAP. |
| | | Q4 2004 | | | | 2004 | | 2003 | | 2002 | | 2001 |
| | | | | | | | | | | | | |
Renewals (2) | | | | | | | | | | | | |
| Number of Leases | | | 9 | | | | | | 29 | | | | 21 | | | | 26 | | | | 19 | |
| Square Feet | | | 82,651 | | | | | | 296,203 | | | | 249,015 | | | | 454,302 | | | | 456,516 | |
| Tenant Concession Costs per Square Foot | | $ | 12.46 | | | | | $ | 15.49 | | | $ | 14.80 | | | $ | 1.67 | | | $ | 1.11 | |
Leasing Commission Costs per Square Foot (3) | | $ | 3.93 | | | | | $ | 5.98 | | | $ | 3.29 | | | $ | 5.40 | | | $ | 2.11 | |
| Total Tenant Concession and Leasing Commission | | | | | | | | | | | | | | | | | | | | | | |
| Costs per Square Foot | | $ | 16.39 | | | | | $ | 21.47 | | | $ | 18.09 | | | $ | 7.07 | | | $ | 3.22 | |
| Costs per Square Foot per Year | | $ | 5.43 | | | | | $ | 4.31 | | | $ | 2.90 | | | $ | 1.53 | | | $ | 1.44 | |
| | | | | | | | | | | | | | | | | | | | | | | |
New / Modified Leases (4) | | | | | | | | | | | | | | | | | | | | | | |
| Number of Leases | | | 15 | | | | | | 48 | | | | 48 | | | | 27 | | | | 42 | |
| Square Feet | | | 50,736 | | | | | | 453,301 | | | | 1,185,349 | | | | 225,464 | | | | 654,179 | |
| Tenant Concession Costs per Square Foot | | $ | 25.38 | | | | | $ | 36.28 | | | $ | 40.24 | | | $ | 24.71 | | | $ | 17.27 | |
Leasing Commission Costs per Square Foot (3) | | $ | 6.14 | | | | | $ | 9.28 | | | $ | 5.56 | | | $ | 6.48 | | | $ | 7.96 | |
| Total Tenant Concession and Leasing Commission | | | | | | | | | | | | | | | | | | | | | | |
| Costs per Square Foot | | $ | 31.52 | | | | | $ | 45.56 | | | $ | 45.80 | | | $ | 31.19 | | | $ | 25.23 | |
| Costs per Square Foot per Year | | $ | 4.16 | | | | | $ | 4.26 | | | $ | 7.26 | | | $ | 4.51 | | | $ | 3.15 | |
| | | | | | | | | | | | | | | | | | | | | | | |
Total | | | | | | | | | | | | | | | | | | | | | | |
| Number of Leases | | | 24 | | | | | | 77 | | | | 69 | | | | 53 | | | | 61 | |
| Square Feet | | | 133,387 | | | | | | 749,504 | | | | 1,434,364 | | | | 679,766 | | | | 1,110,695 | |
| Tenant Concession Costs per Square Foot | | $ | 17.38 | | | | | $ | 28.06 | | | $ | 35.82 | | | $ | 9.32 | | | $ | 10.63 | |
Leasing Commission Costs per Square Foot (3) | | $ | 4.77 | | | | | $ | 7.97 | | | $ | 5.16 | | | $ | 5.76 | | | $ | 5.56 | |
| Total Tenant Concession and Leasing Commission | | | | | | | | | | | | | | | | | | | | | | |
| Costs per Square Foot | | $ | 22.15 | | | | | $ | 36.03 | | | $ | 40.98 | | | $ | 15.08 | | | $ | 16.19 | |
| Costs per Square Foot per Year | | $ | 4.66 | | | | | $ | 4.20 | | | $ | 6.51 | | | $ | 2.80 | | | $ | 2.87 | |
| (1) | Based on leases executed during the period. Excludes leases of related parties and excludes build out costs for raw space. All periods presented include historical tenant concessions for One California Plaza and Park Place, which we acquired on November 6, 2003 and April 14, 2004, respectively. |
| (2) | Does not include retained tenants that have relocated to new space or expanded into new space. |
| (3) | Leasing commission costs exclude any commission paid to related parties. |
| (4) | Includes retained tenants that have relocated or expanded into new space and lease modifications. |
| (5) | Tenant Concession and Leasing Commission information for Park Place II is unavailable for the periods prior to acquisition on July 23, 2004. |
| (6) | Tenant Concession and Leasing information for Lantana Media Campus is not available in 'new' and 'renewal' totals for periods prior to acquisition on December 16, 2004. However, annual leasing commission totals were $2,378,904, $58,002 and $71,497 for the years 2003, 2002 and 2001, respectively. Annual tenant concession totals were $2,198,242, $66,629 and $41,236 for the years 2003, 2002 and 2001, respectively. No amounts are available for 2004. |
HISTORICAL CAPITAL EXPENDITURES |
| | | Q4 2004 | | Q3 2004 | | Q2 2004 | | Q1 2004 | | 2003 | | 2002 | | 2001 |
| | | | | | | | | | | | | | | |
Non-recoverable Capital Expenditures (2) (3) | | $ | 38,428 | | | $ | 274,887 | | | $ | 417,507 | | | $ | 586,346 | | | $ | 896,688 | | | $ | 975,649 | | | $ | 2,590,102 | |
Total Square Feet (2) (4) (3) | | | 8,795,663 | | | | 8,524,446 | | | | 8,515,321 | | | | 8,504,775 | | | | 8,501,855 | | | | 8,470,554 | | | | 8,427,639 | |
| Non-recoverable Capital Expenditures per Square Foot | | $ | 0.00 | | | $ | 0.03 | | | $ | 0.05 | | | $ | 0.07 | | | $ | 0.11 | | | $ | 0.12 | | | $ | 0.31 | |
| | | | | | | | | | | | | | | | | | | | | | | | | | | | | |
Recoverable Capital Expenditures (2) (3) (5) | | $ | 335,878 | | | $ | 162,037 | | | $ | 656,098 | | | $ | 183,851 | | | $ | 1,346,274 | | | $ | 6,677,588 | | | $ | 2,620,791 | |
Total Square Feet (2) (4) (3) | | | 8,795,663 | | | | 8,524,446 | | | | 8,515,321 | | | | 8,504,775 | | | | 8,501,855 | | | | 8,470,554 | | | | 8,427,639 | |
| Recoverable Capital Expenditures per Square Foot | | $ | 0.04 | | | $ | 0.02 | | | $ | 0.08 | | | $ | 0.02 | | | $ | 0.16 | | | $ | 0.79 | | | $ | 0.31 | |
| (1) | All periods presented include historical capital expenditures for One California Plaza and Park Place, which we acquired on November 6, 2003 and April 14, 2004, respectively. |
| (2) | Historical capital expenditure information for Park Place II is unavailable for the periods prior to acquisition on July 23, 2004. Beginning Q4 2004, total square feet and non-recoverable and recoverable expenditures include information for Park Place II. |
| (3) | Historical capital expenditure information for Lantana Media Campus is not available in 'recoverable' and 'non-recoverable' totals for periods prior to acquisition on December 16, 2004. However, annual totals were $23,760,683, $191,697 and $281,882 for the years 2003, 2002 and 2001, respectively. No amounts are available for 2004. Therefore, the total square feet amounts exclude Lantana square footage. |
| (4) | The square footage of Cerritos and Washington Mutual is deducted from the total square feet amount as the tenant pays for all capital expenditure activities. |
| (5) | Recoverable capital improvements, such as equipment upgrades, are generally financed through a capital lease. The annual amortization, based on each asset's useful life, as well as any financing costs, are generally billed to tenants on an annual basis as payments are made. The amounts presented represent the total value of the improvements in the year they are made. |
| | | | | Q4 2004 | | Q3 2004 | | Q2 2004 | | Q1 2004 |
Submarket | | Lease Type (1) | | Annual Rent PSF (2) | | Direct Vacancy Rate | | Overall Vacancy Rate (3) | | Annual Rent PSF (2) | | Direct Vacancy Rate | | Overall Vacancy Rate (3) | | Annual Rent PSF (2) | | Direct Vacancy Rate | | Overall Vacancy Rate (3) | | Annual Rent PSF (2) | | Direct Vacancy Rate | | Overall Vacancy Rate (3) |
| | | | | | | | | | | | | | | | | | | | | | | | | | | |
Los Angeles County | | | | | | | | | | | | | | | | | | | | | | | | | | |
| Bunker Hill | | NNN | | | 21.34 | | | | 7.0 | % | | | 9.6 | % | | | 19.80 | | | | 8.0 | % | | | 11.1 | % | | | 19.97 | | | | 8.7 | % | | | 12.7 | % | | | 19.22 | | | | 8.2 | % | | | 11.7 | % |
| Santa Monica | | FSG | | | 38.04 | | | | 8.5 | % | | | 10.1 | % | | | 35.16 | | | | 12.5 | % | | | 14.2 | % | | | 35.40 | | | | 14.0 | % | | | 16.4 | % | | | 35.76 | | | | 14.3 | % | | | 16.5 | % |
Tri-Cities (4) | | FSG | | | 27.96 | | | | 10.3 | % | | | 11.6 | % | | | 28.14 | | | | 10.9 | % | | | 12.1 | % | | | 27.44 | | | | 12.2 | % | | | 13.6 | % | | | 26.94 | | | | 13.9 | % | | | 15.4 | % |
| Cerritos | | FSG | | | 22.20 | | | | 11.8 | % | | | 11.8 | % | | | 22.08 | | | | 11.1 | % | | | 11.4 | % | | | 23.52 | | | | 11.0 | % | | | 11.3 | % | | | 23.40 | | | | 13.0 | % | | | 13.0 | % |
| | | | | | | | | | | | | | | | | | | | | | | | | | | | | | | | | | | | | | | | | | | | | | | | | | | |
Orange County | | | | | | | | | | | | | | | | | | | | | | | | | | | | | | | | | | | | | | | | | | | | | | | | | | |
Orange County (5) | | FSG | | | 23.64 | | | | 11.4 | % | | | 12.9 | % | | | 23.52 | | | | 11.9 | % | | | 13.5 | % | | | 23.28 | | | | 13.8 | % | | | 15.5 | % | | | 23.40 | | | | 14.0 | % | | | 15.6 | % |
| John Wayne Airport | | FSG | | | 26.16 | | | | 11.2 | % | | | 13.0 | % | | | 26.04 | | | | 11.7 | % | | | 13.7 | % | | | 25.44 | | | | 14.0 | % | | | 15.9 | % | | | 25.68 | | | | 14.1 | | | | 16.1 | % |
| | | | | 2003 | | 2002 | | 2001 | | |
Submarket | | Lease Type (1) | | Annual Rent PSF (2) | | Direct Vacancy Rate | | Overall Vacancy Rate (3) | | Annual Rent PSF (2) | | Direct Vacancy Rate | | Overall Vacancy Rate (3) | | Annual Rent PSF (2) | | Direct Vacancy Rate | | Overall Vacancy Rate (3) | | | | | | |
| | | | | | | | | | | | | | | | | | | | | | | | | | | |
Los Angeles County | | | | | | | | | | | | | | | | | | | | | | | | | | |
| Bunker Hill | | NNN | | | 19.60 | | | | 7.1 | % | | | 10.5 | % | | | 20.40 | | | | 8.0 | % | | | 13.8 | % | | | 21.70 | | | | 4.8 | % | | | 8.2 | % | | | | | | | | | | | | |
| Santa Monica | | FSG | | | 35.52 | | | | 15.9 | % | | | 19.2 | % | | | 35.88 | | | | 16.1 | % | | | 19.9 | % | | | 39.12 | | | | 11.9 | % | | | 20.0 | % | | | | | | | | | | | | |
Tri-Cities (4) | | FSG | | | 27.05 | | | | 12.9 | % | | | 14.7 | % | | | 27.86 | | | | 12.1 | % | | | 18.7 | % | | | 26.83 | | | | 10.8 | % | | | 16.3 | % | | | | | | | | | | | | |
| Cerritos | | FSG | | | 24.36 | | | | 11.0 | % | | | 11.4 | % | | | 24.84 | | | | 15.4 | % | | | 16.0 | % | | | 20.88 | | | | 4.7 | % | | | 10.9 | % | | | | | | | | | | | | |
| | | | | | | | | | | | | | | | | | | | | | | | | | | | | | | | | | | | | | | | | | | | | | | | | | | |
Orange County | | | | | | | | | | | | | | | | | | | | | | | | | | | | | | | | | | | | | | | | | | | | | | | | | | |
Orange County (5) | | FSG | | | 23.16 | | | | 14.3 | % | | | 15.8 | % | | | 24.36 | | | | 15.8 | % | | | 17.5 | % | | | 26.77 | | | | 14.8 | % | | | 17.4 | % | | | | | | | | | | |
| John Wayne Airport | | FSG | | | 25.44 | | | | 14.4 | % | | | 16.4 | % | | | 27.60 | | | | 16.5 | % | | | 19.2 | % | | | 31.07 | | | | 13.3 | % | | | 16.5 | % | | | | | | | | | | |
Source: Cushman & Wakefield
| (1) | NNN = Triple Net Lease; FSG = Full Service Gross Lease |
| (2) | This data represents the weighted average asking rent per square foot for available space. |
| (3) | This data represents the overall vacancy rate which includes sublease vacancy. |
| (4) | Tri-Cities excludes North Hollywood and Pasadena East. |
| (5) | This data represents the entire Orange County market. |
Westin Hotel, Pasadena, CA (1) | | Q4 2004 (2) | | Q4 2003 | | Percent Change | | YTD December 31, 2004 (2) | | YTD December 31, 2003 | | Percent Change |
| | | | | | | | | | | | | |
| Occupancy | | | 78.3 | % | | | 75.7 | % | | | 3.4 | % | | | 74.0 | % | | | 75.8 | % | | | (2.4 | )% |
| Average Daily Rate | | $ | 147.95 | | | $ | 131.42 | | | | 12.6 | % | | $ | 142.00 | | | $ | 123.59 | | | | 14.9 | % |
| Revenue Per Available Room (REVPAR) | | $ | 115.82 | | | $ | 99.52 | | | | 16.4 | % | | $ | 105.03 | | | $ | 93.63 | | | | 12.2 | % |
Hotel Net Operating Income (3) | | $ | 1,895,412 | | | $ | 1,649,000 | | | | 14.9 | % | | $ | 5,657,958 | | | $ | 4,740,000 | | | | 19.4 | % |
HOTEL HISTORICAL CAPITAL EXPENDITURES |
Westin Hotel, Pasadena, CA (1) | | Q4 2004 | | Q3 2004 | | Q2 2004 | | Q1 2004 | | 2003 | | 2002 |
| | | | | | | | | | | | | |
| Hotel Improvements and Equipment Replacements | | $ | - | | | $ | 4,600 | | | $ | 15,836 | | | $ | - | | | $ | 440,341 | | | $ | 760,044 | |
| Total Hotel Revenue | | $ | 5,878,580 | | | $ | 4,155,681 | | | $ | 5,285,257 | | | $ | 5,199,447 | | | $ | 18,449,302 | | | $ | 20,005,000 | |
| Hotel Improvements as a Percentage of Hotel Revenue | | | 0.0 | % | | | 0.1 | % | | | 0.3 | % | | | 0.0 | % | | | 2.4 | % | | | 3.8 | % |
Renovation and Upgrade Costs (4) | | $ | 3,308,367 | | | $ | 1,059,393 | | | $ | 1,942,330 | | | $ | 727,732 | | | $ | 953,257 | | | $ | - | |
| (1) | The Westin Hotel operated under a Doubletree flag until it was rebranded on December 20, 2002. |
| (2) | The Westin Hotel was undergoing guestroom renovations from June 23, 2004 through October 4, 2004, which caused a portion of the guestrooms to be unavailable during that period. |
| (3) | Includes air space lease expense of $89,739 per quarter and excludes hotel capital expenditures reserve. |
| (4) | The Westin Hotel is undergoing certain renovations through August 2005. The re-branding, upgrading and renovation costs are estimated at $13.0 million, of which $3.5 million has been funded by Westin. |
OPTION AND UNDEVELOPED PROPERTIES |
| | | | | | | As of December 31, 2004 |
Property | | Location | | Percentage Leased | | Acreage | | Developed / Developable Square Feet | | Status |
| | | | | | | | | | | |
Option Properties (1) - | | | | | | | | | | |
| 1733 Ocean Avenue | | Santa Monica, CA | | | 40 | % | | | N/A | | | | 91,398 | | | Complete |
| Western Asset Plaza | | Pasadena, CA | | | 98 | % | | | N/A | | | | 256,987 | | | Complete |
Water's Edge I (2) | | Los Angeles, CA | | | 100 | % | | | N/A | | | | 245,530 | | | Complete |
Water's Edge II (2) | | Los Angeles, CA | | | N/A | | | | 2.0 | | | | 130,000 | | | Undeveloped |
| | | | | Total Option Properties | | | 723,915 | | | |
| | | | | | | | | | | | | |
Undeveloped Owned Properties - | | | | | | | | | | | | |
| Lantana Media Campus | | Santa Monica, CA | | | N/A | | | | N/A | | | | 194,000 | | | Undeveloped |
| Washington Mutual Campus | | Irvine, CA | | | N/A | | | | 3.6 | | | | 145,000 | | | Undeveloped |
| Park Place II | | Irvine, CA | | | N/A | | | | N/A | | | | 2,000,000 | | | Undeveloped |
| Glendale Center - Phase II | | Glendale, CA | | | N/A | | | | 2.0 | | | | 300,000 | | | Undeveloped |
| | | | | Total Undeveloped Properties | | 2,639,000 | | | |
| | | | | | | | | | | | | |
| | | | | Total | | | | | 3,362,915 | | | |
| (1) | We hold options at various terms for these properties. |
| (2) | We hold an option on a one-eighth partnership interest in these two properties. |
Funds from Operations:
We calculate funds from operations, or FFO, as defined by the National Association of Real Estate Investment Trusts, or NAREIT. FFO represents net income (loss) (computed in accordance with accounting principles generally accepted in the United States of America, or GAAP), excluding gains (or losses) from sales of property, extraordinary items, real estate related depreciation and amortization (excluding amortization of deferred financing costs) and after adjustments for unconsolidated partnerships and joint ventures.
Management uses FFO as a supplemental performance measure because, in excluding real estate related depreciation and amortization, gains (or losses) from property dispositions and extraordinary items, it provides a performance measure that, when compared year over year, captures trends in occupancy rates, rental rates and operating costs. We also believe that, as a widely recognized measure of the performance of REITs, FFO will be used by investors as a basis to compare our operating performance with that of other REITs.
However, because FFO excludes depreciation and amortization and captures neither the changes in the value of our properties that result from use or market conditions nor the level of capital expenditures and leasing commissions necessary to maintain the operating performance of our properties, all of which have real economic effect and could materially impact our results from operations, the utility of FFO as a measure of our performance is limited. Other equity REITs may not calculate FFO in accordance with the NAREIT definition and, accordingly, our FFO may not be comparable to such other equity REITs’ FFO. Accordingly, FFO should be considered only as a supplement to net income as a measure of our performance. FFO should not be used as a measure of our liquidity, nor is it indicative of funds available to f und our cash needs, including our ability to pay dividends or make distributions. FFO also should not be used as a supplement to or substitute for cash flow from operating activities (computed in accordance with GAAP).
Adjusted Funds from Operations:
We calculate adjusted funds from operations, or AFFO, by adding to or subtracting from FFO (i) non-cash operating revenues and expenses, (ii) capitalized operating expenditures such as leasing payroll and interest expense, (iii) recurring capital expenditures required to maintain and re-tenant our properties and (iv) regular principal payments required to service our debt. Management uses AFFO as a supplemental liquidity measure because, when compared year over year, it assesses our ability to fund our dividend and distribution requirements from our operating activities. We also believe that, as a widely recognized measure of the liquidity of REITs, AFFO will be used by investors as a basis to assess our ability to fund dividend payments in comparison to other REITs.
However, because AFFO may exclude certain non-recurring capital expenditures and leasing costs, the utility of AFFO as a measure of our liquidity is limited. Additionally, other equity REITs may not calculate AFFO in a consistent manner, accordingly, our AFFO may not be comparable to such other equity REITs’ AFFO. AFFO should be considered only as a supplement to cash flows from operating activities (computed in accordance with GAAP) as a measure of our liquidity.
MANAGEMENT STATEMENTS ON NON-GAAP SUPPLEMENTAL MEASURES - continued
EBITDA:
We believe that earnings before interest, income taxes, depreciation and amortization, or EBITDA, is a useful supplemental performance measure. Management uses EBITDA as an indicator of our ability to incur and service debt. We believe EBITDA is an appropriate supplemental measure for such purposes, because the amounts spent on interest are, by definition, available to pay interest, income tax expense is inversely correlated to interest expense because tax expense goes down as deductible interest expense goes up, and depreciation and amortization are non-cash charges. In addition, we believe EBITDA is frequently used by securities analysts, investors and other interested parties in the evaluation of equity REITs. However, because EBITDA is calculated before recurring cash charges including interest expense and inco me taxes, and is not adjusted for capital expenditures or other recurring cash requirements of our business, its utility as a measure of our liquidity is limited. Accordingly, EBITDA should be considered only as supplement to cash flows from operating activities (computed in accordance with GAAP) as a measure of our liquidity. EBITDA is not a measure of our financial performance and should not be considered as an alternative to net income as an indicator of our operating performance. Other equity REITs may calculate EBITDA differently than we do; accordingly, our EBITDA may not comparable to such other REITs’ EBITDA.
Coverage Ratios:
We present interest and fixed charge coverage ratios as supplemental liquidity measures. Management uses these ratios as indicators of our financial flexibility to service current interest expense and debt amortization from current cash net operating income. In addition, we believe that these coverage ratios represent common metrics used by securities analysts, investors and other interested parties to evaluate our ability to service fixed cash payments. However, because these ratios are derived from EBITDA, their utility is limited by the same factors that limit the usefulness of EBITDA as a liquidity measure. Accordingly, our interest coverage ratio should be considered only as a supplement to cash flows from operating activities (computed in accordance with GAAP) as a measure of our liquidity.