Exhibit 99.1

Investor Presentation
May 2005
Forward-Looking Statements
This presentation may contain “forward-looking statements” which include information concerning the Company’s plans, objectives, goals, strategies, future revenues or performance, capital expenditures, financing needs and other information that is not historical information. When used in this presentation, the words “estimates,” “expects,” “anticipates,” “projects,” “plans,” “intends,” “believes,” and variations of such words or similar expressions are intended to identify forward-looking statements. All forward-looking statements are based upon current expectations and beliefs and various assumptions. There can be no assurance that the Company will realize these expectations or that these beliefs will prove correct.
There are a number of risks and uncertainties that could cause actual results to differ materiallyfrom the forward-looking statements contained in this presentation. Numerous factors, many of which are beyond the Company’s control, could cause actual results to differ materially from those expressed as forward-looking statements. Certain of these risk factors are discussed in the Company’s filings with the Securities and Exchange Commission. Any forward-looking statement speaks only as of the date on which it is made, and except as required by law, the Company undertakes no obligation to update any forward-looking statements to reflect events or circumstances after the date on which it is made or to reflect the occurrence of unanticipated events or circumstances.
Non-GAAP Financial Information
This presentation includes certain “non-GAAP financial measures”, including pro forma net income per share. Information relating to these non-GAAP financial measures, including a presentation of the most directly comparable financial measure calculated and presented in accordance with GAAP and a reconciliation of the differences between the non-GAAP financial measures and the most directly comparable financial measures calculated and presented in accordance with GAAP, are included at the end of this presentation.
1
Company Overview
Bob Trussell Chief Executive Officer
2
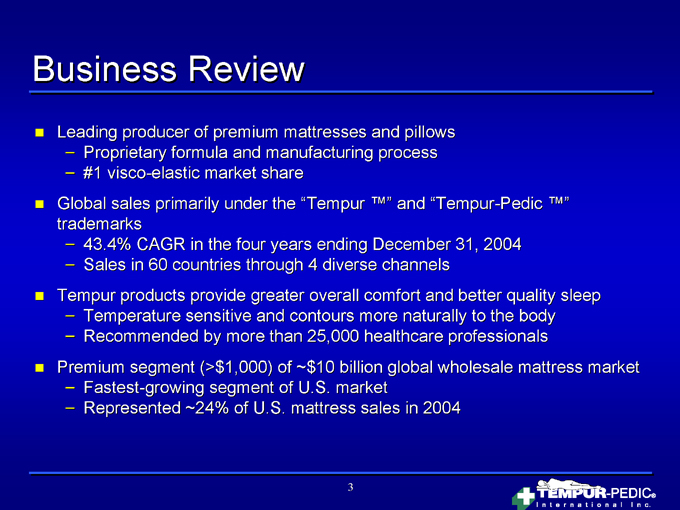
Business Review
Leading producer of premium mattresses and pillows
– Proprietary formula and manufacturing process
– #1 visco-elastic market share
Global sales primarily under the “Tempur ™” and “Tempur-Pedic ™” trademarks
– 43.4% CAGR in the four years ending December 31, 2004
– Sales in 60 countries through 4 diverse channels
Tempur products provide greater overall comfort and better quality sleep
– Temperature sensitive and contours more naturally to the body
– Recommended by more than 25,000 healthcare professionals
Premium segment (>$1,000) of ~$10 billion global wholesale mattress market
– Fastest-growing segment of U.S. market
– Represented ~24% of U.S. mattress sales in 2004
3
Investment Highlights
Global brand recognition
Superior product offering
Favorable secular demand trends Diversified business model Track record of profitable growth
4
Industry & Business Overview
Thomas Bryant President
5
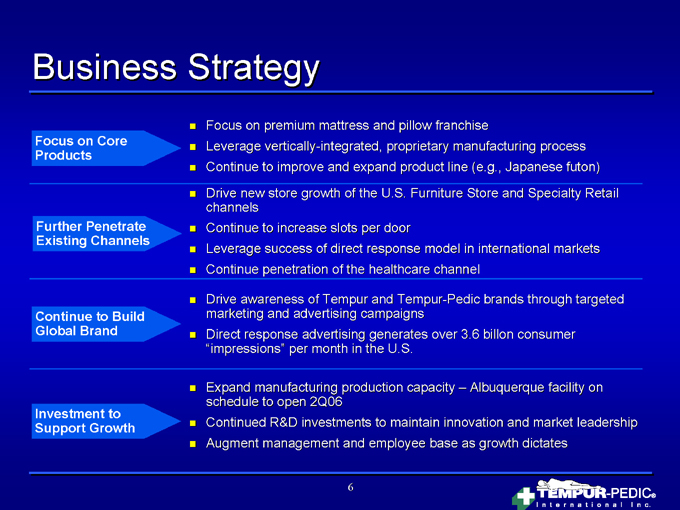
Business Strategy
Focus on Core Products
Focus on premium mattress and pillow franchise
Leverage vertically-integrated, proprietary manufacturing process Continue to improve and expand product line (e.g., Japanese futon)
Further Penetrate Existing Channels
Drive new store growth of the U.S. Furniture Store and Specialty Retail channels Continue to increase slots per door Leverage success of direct response model in international markets Continue penetration of the healthcare channel
Continue to Build Global Brand
Drive awareness of Tempur and Tempur-Pedic brands through targeted marketing and advertising campaigns Direct response advertising generates over 3.6 billon consumer “impressions” per month in the U.S.
Investment to Support Growth
Expand manufacturing production capacity – Albuquerque facility on schedule to open 2Q06 Continued R&D investments to maintain innovation and market leadership Augment management and employee base as growth dictates
6
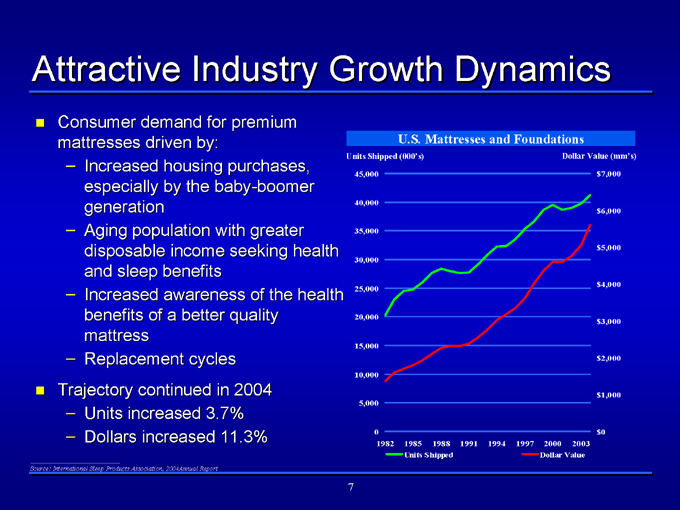
Attractive Industry Growth Dynamics
Consumer demand for premium mattresses driven by:
– Increased housing purchases, especially by the baby-boomer generation
– Aging population with greater disposable income seeking health and sleep benefits
– Increased awareness of the health benefits of a better quality mattress
– Replacement cycles Trajectory continued in 2004
– Units increased 3.7%
– Dollars increased 11.3%
U.S. Mattresses and Foundations
Units Shipped (000’s)
45,000 40,000 35,000 30,000 25,000 20,000
15,000 10,000 5,000 0
Dollar Value (mm’s)
$7,000
$6,000 $5,000 $4,000 $3,000 $2,000 $1,000 $0
1982 1985 1988 1991 1994 1997 2000 2003
Units Shipped Dollar Value
Source: International Sleep Products Association, 2004Annual Report
7
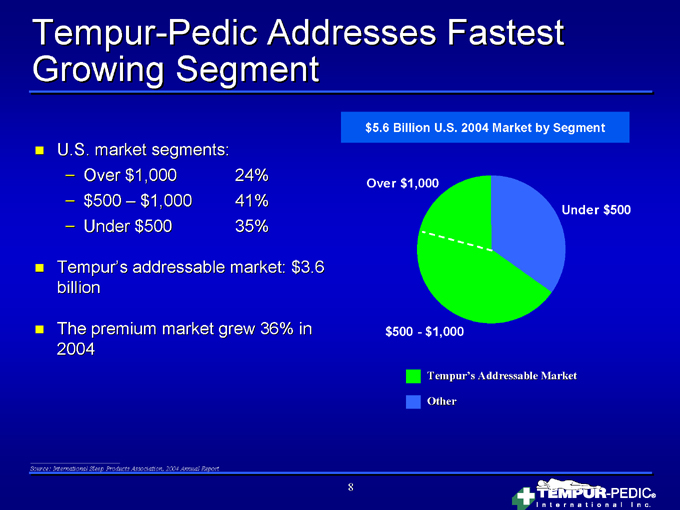
Tempur-Pedic Addresses Fastest Growing Segment
U.S. market segments:
– Over $1,000 24%
– $500 – $1,000 41%
– Under $500 35%
Tempur’s addressable market: $3.6 billion
The premium market grew 36% in 2004 $5.6 Billion U.S. 2004 Market by Segment
Over $1,000
Under $500 $500—$1,000
Tempur’s Addressable Market
Other
Source: International Sleep Products Association, 2004 Annual Report
8
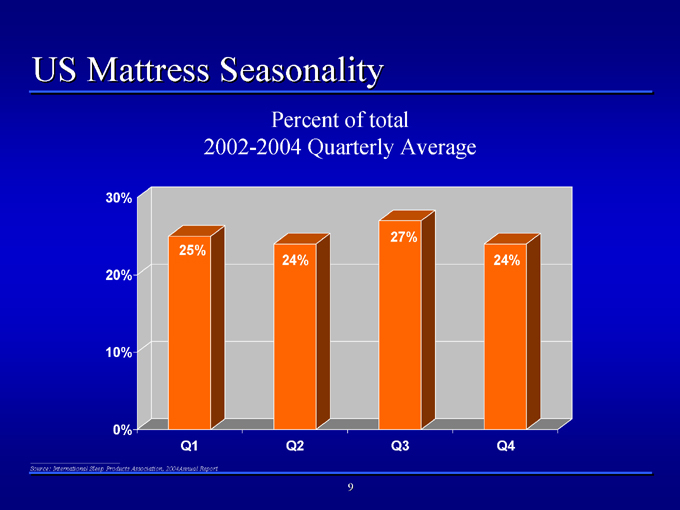
US Mattress Seasonality
Percent of total 2002-2004 Quarterly Average
30% 20% 10% 0%
27% 25%
24% 24%
Q1 Q2 Q3 Q4
Source: International Sleep Products Association, 2004Annual Report
9

Diversity Across Products
Mattresses
2004 Sales: $433.3 million (63.3% of Total) Retail Price: $1,000 – $3,000
Pillows
2004 Sales: $138.1 million (20.1% of Total) Retail Price: $70 – $165
Adjustable Beds / Other
2004 Sales: $113.5 million (16.6% of Total) Retail Price
– Adjustable Beds: $1,300 – $2,800
– Other: $35 – $150
10
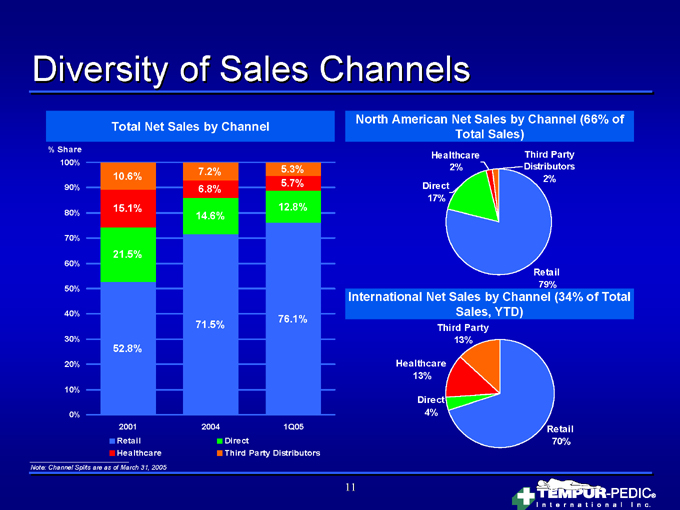
Diversity of Sales Channels
Total Net Sales by Channel
% Share 100%
90% 80% 70% 60% 50% 40% 30% 20% 10% 0%
7.2% 5.3% 10.6% 5.7% 6.8% 15.1% 12.8% 14.6%
21.5%
76.1% 71.5%
52.8%
North American Net Sales by Channel (66% of Total Sales)
Healthcare 2%
Third Party Distributors 2%
Direct 17%
Retail 79%
International Net Sales by Channel (34% of Total Sales, YTD)
Third Party 13%
Healthcare 13%
Direct 4%
Retail 70%
2001 2004 1Q05
Retail Healthcare
Direct
Third Party Distributors
Note: Channel Splits are as of March 31, 2005
11
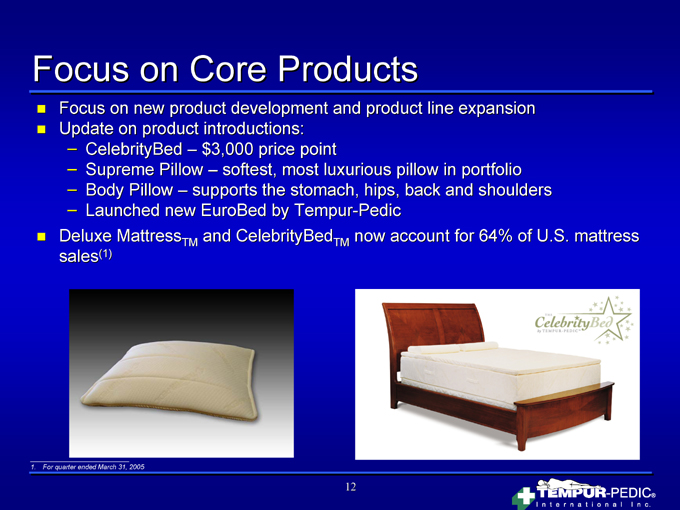
Focus on Core Products
Focus on new product development and product line expansion Update on product introductions:
– CelebrityBed – $3,000 price point
– Supreme Pillow – softest, most luxurious pillow in portfolio
– Body Pillow – supports the stomach, hips, back and shoulders
– Launched new EuroBed by Tempur-Pedic
Deluxe MattressTM and CelebrityBedTM now account for 64% of U.S. mattress
sales(1)
1. For quarter ended March 31, 2005
12
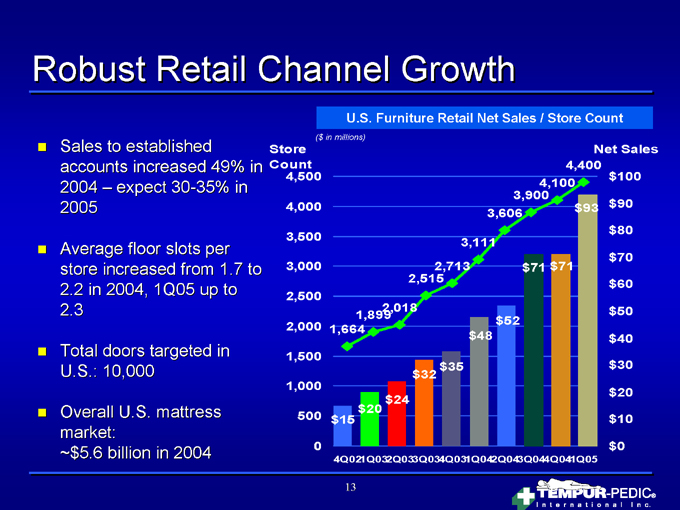
Robust Retail Channel Growth
Sales to established accounts increased 49% in 2004 – expect 30-35% in 2005
Average floor slots per store increased from 1.7 to 2.2 in 2004, 1Q05 up to 2.3
Total doors targeted in U.S.: 10,000
Overall U.S. mattress market:
~$ 5.6 billion in 2004
U.S. Furniture Retail Net Sales / Store Count
($ in millions)
Net Sales
Store Count 4,500
4,000 3,500 3,000 2,500 2,000 1,500 1,000 500 0
4,400 4,100 3,900 3,606 $93 3,111
2,713 $71 $71 2,515
1,899 2,018 $52 1,664 $48 $35 $32
$24 $20 $15 $100 $90 $80 $70 $60 $50 $40 $30 $20 $10 $0
4Q021Q032Q033Q034Q031Q042Q043Q044Q041Q05
13

Cost Effective Advertising to Build Global Brand
Tempur’s national advertising campaign drives over 3.6 billion consumer “impressions” per month
Television
Over 2.2 billion “impressions” per month
High profile events: The Apprentice, Oscar’s, Emmy’s, Grammy’s
Magazines
Over 756 million “impressions” per month
Radio
Over 581 million “impressions” per month
Includes national spots on such shows as: Bill O’Reilly, Westwood One, Dr. Laura Schlessinger, Dick Clark, Dr. Joy Browne and WOR with John Gambling
Newspapers
Over 74 million “impressions” per month
14
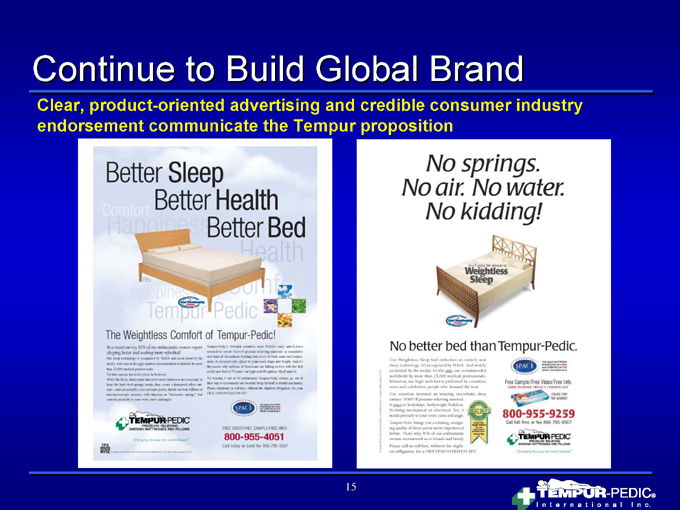
Continue to Build Global Brand
Clear, product-oriented advertising and credible consumer industry endorsement communicate the Tempur proposition
15
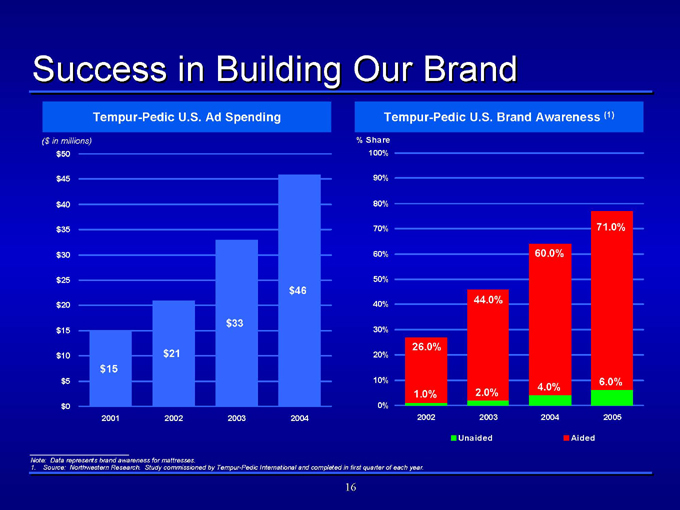
Success in Building Our Brand
Tempur-Pedic U.S. Ad Spending
($ in millions) $50
$45 $40 $35 $30 $25 $20 $15 $10 $5 $0 $46
$33
$21 $15
2001 2002 2003 2004
Tempur-Pedic U.S. Brand Awareness (1)
% Share 100%
90% 80% 70% 60% 50% 40% 30% 20% 10% 0%
71.0%
60.0%
44.0%
26.0%
6.0% 4.0% 1.0% 2.0%
2002 2003 2004 2005
Unaided Aided
Note: Data represents brand awareness for mattresses.
1. Source: Northwestern Research. Study commissioned by Tempur-Pedic International and completed in first quarter of each year.
16
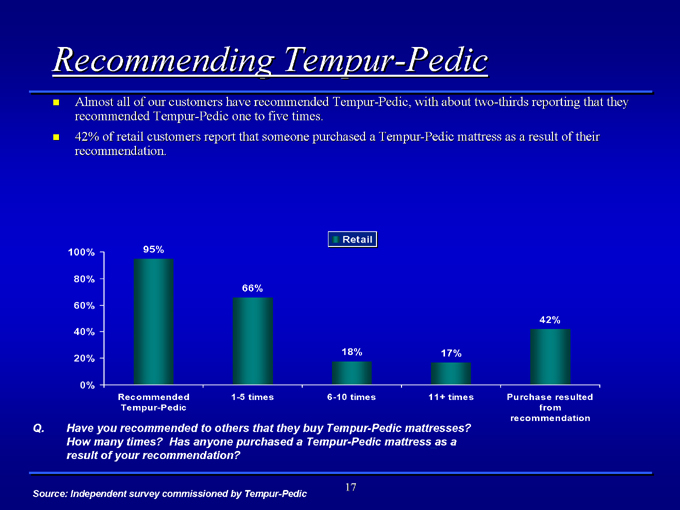
Recommending Tempur-Pedic
Almost all of our customers have recommended Tempur-Pedic, with about two-thirds reporting that they recommended Tempur-Pedic one to five times.
42% of retail customers report that someone purchased a Tempur-Pedic mattress as a result of their recommendation.
100%
80%
60%
40%
20%
0%
Retail
95%
66%
42%
18% 17%
Recommended Tempur-Pedic
1-5 times
6-10 times
11+ times
Purchase resulted from recommendation
Q. Have you recommended to others that they buy Tempur-Pedic mattresses?
How many times? Has anyone purchased a Tempur-Pedic mattress as a result of your recommendation?
Source: Independent survey commissioned by Tempur-Pedic
17
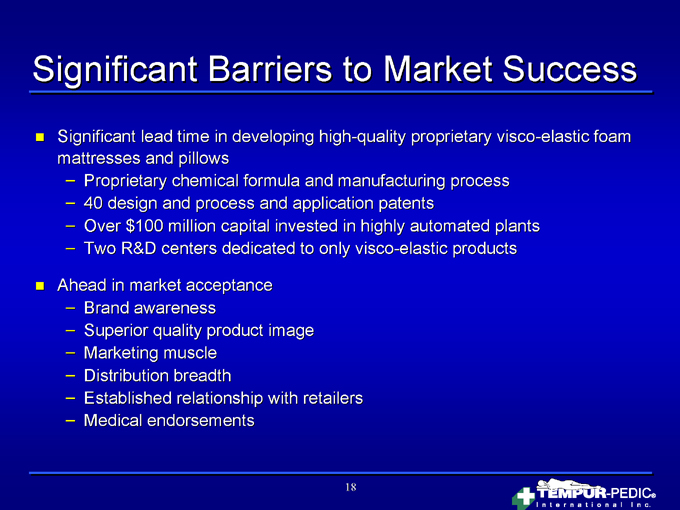
Significant Barriers to Market Success
Significant lead time in developing high-quality proprietary visco-elastic foam mattresses and pillows
– Proprietary chemical formula and manufacturing process
– 40 design and process and application patents
– Over $100 million capital invested in highly automated plants
– Two R&D centers dedicated to only visco-elastic products
Ahead in market acceptance
– Brand awareness
– Superior quality product image
– Marketing muscle
– Distribution breadth
– Established relationship with retailers
– Medical endorsements
18

Financial Review
Dale Williams
SVP and Chief Financial Officer
19
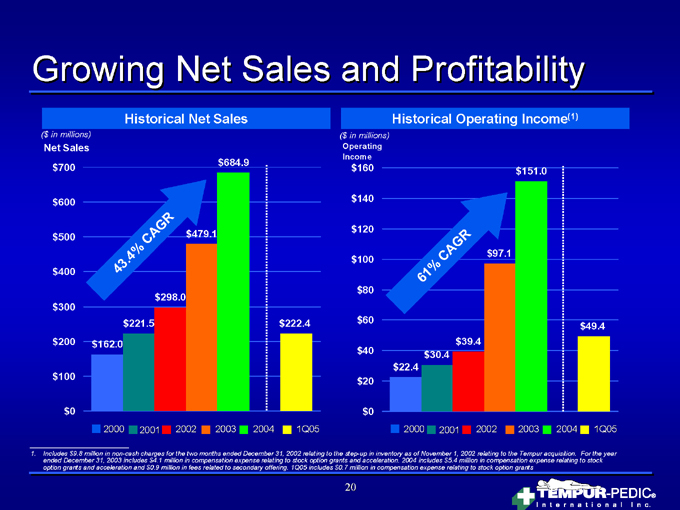
Growing Net Sales and Profitability
Historical Net Sales
($ in millions)
Net Sales $700
$600 $500 $400 $300 $200 $100 $0
43.4 % CAGR
$298.0 $221.5 $162.0 $684.9
$479.1 $222.4
2000 2001 2002 2003 2004 1Q05
Historical Operating Income(1)
($ in millions)
Operating Income
$160 $140 $120 $100 $80 $60 $40 $20 $0
61% CAGR
$151.0 $97.1 $49.4 $39.4 $30.4 $22.4
2000 2001 2002 2003 2004 1Q05
1. Includes $9.8 million in non-cash charges for the two months ended December 31, 2002 relating to the step-up in inventory as of November 1, 2002 relating to the Tempur acquisition. For the year ended December 31, 2003 includes $4.1 million in compensation expense relating to stock option grants and acceleration. 2004 includes $5.4 million in compensation expense relating to stock option grants and acceleration and $0.9 million in fees related to secondary offering. 1Q05 includes $0.7 million in compensation expense relating to stock option grants
20
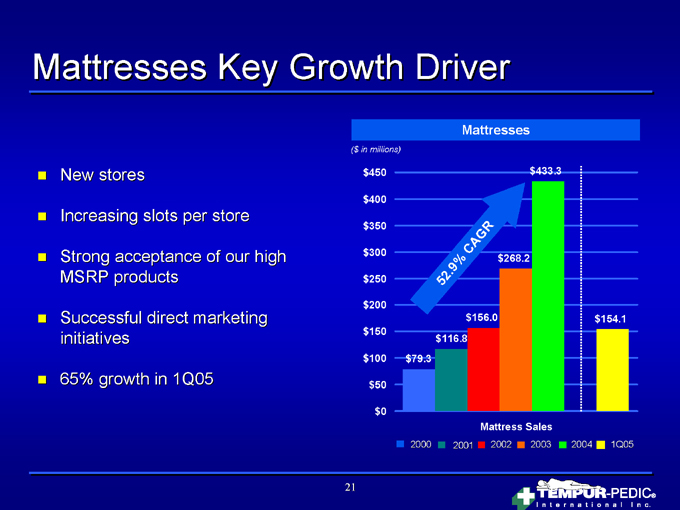
Mattresses Key Growth Driver
New stores
Increasing slots per store
Strong acceptance of our high MSRP products
Successful direct marketing initiatives
65% growth in 1Q05
Mattresses
($ in millions)
$450 $400 $350 $300 $250 $200 $150 $100 $50 $0 $433.3
52.9% CAGR
$268.2 $156.0 $154.1 $116.8 $79.3
Mattress Sales
2000 2001 2002 2003 2004 1Q05
21
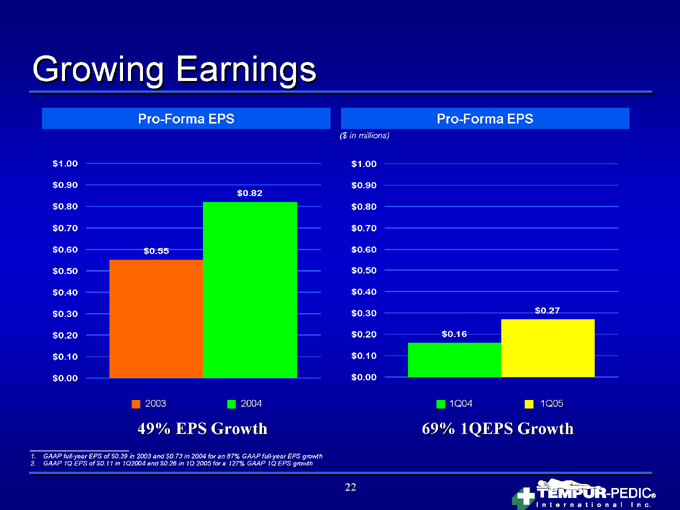
Growing Earnings
Pro-Forma EPS
$1.00 $0.90 $0.80 $0.70 $0.60 $0.50 $0.40 $0.30 $0.20 $0.10 $0.00 $0.82
$0.55
2003 2004
Pro-Forma EPS
($ in millions)
$1.00 $0.90 $0.80 $0.70 $0.60 $0.50 $0.40 $0.30 $0.20 $0.10 $0.00 $0.27
$0.16
1Q04 1Q05
49% EPS Growth
69% 1QEPS Growth
1. GAAP full-year EPS of $0.39 in 2003 and $0.73 in 2004 for an 87% GAAP full-year EPS growth
2. GAAP 1Q EPS of $0.11 in 1Q2004 and $0.26 in 1Q 2005 for a 127% GAAP 1Q EPS growth
22
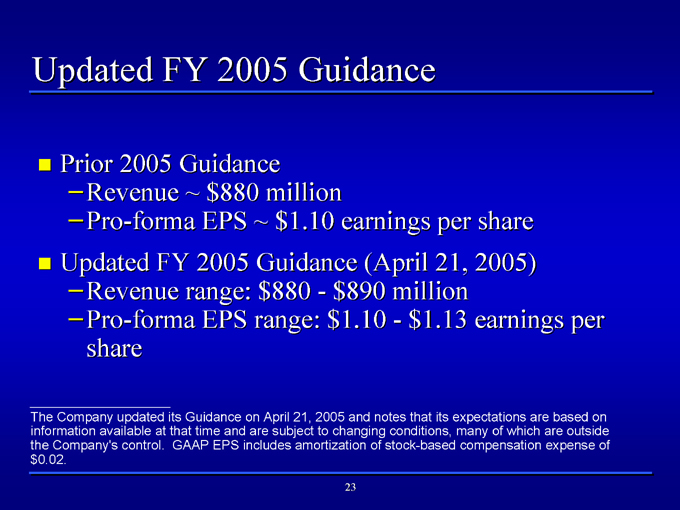
Updated FY 2005 Guidance
Prior 2005 Guidance
– Revenue ~ $880 million
–Pro-forma EPS ~ $1.10 earnings per share Updated FY 2005 Guidance (April 21, 2005)
– Revenue range: $880—$890 million
– Pro-forma EPS range: $1.10—$1.13 earnings per share
The Company updated its Guidance on April 21, 2005 and notes that its expectations are based on information available at that time and are subject to changing conditions, many of which are outside the Company’s control. GAAP EPS includes amortization of stock-based compensation expense of $0.02.
23
Investment Highlights
Global brand recognition
Superior product offering
Favorable secular demand trends Diversified business model Track record of profitable growth
24
Supplemental Information
To further provide investors useful information, pro forma net income per share is presented and represents the Company’s GAAP net income per share before non-cash stock-based compensation expense of $0.01 and $0.02 for the quarter ended March 31, 2005 and 2004, respectively, and $0.05 and $0.05 for the year ended December 31, 2004 and 2003, respectively. The Company has unearned non-cash stock-based compensation of $0.04 as of December 31, 2004 that will be recognized as expense in future periods. For the year ended December 31, 2004, GAAP net income per share includes $0.01 of secondary public offering expenses related to the registration and offering of the company’s common stock in the fourth quarter of 2004, while pro forma net income per share excludes these expenses. In addition to these pro forma adjustments, GAAP net income per share includes, and pro forma net income per share excludes, a loss on debt extinguishment totaling $0.03, net of tax, for the quarter ended March 31, 2004 and the year ended December 31, 2004 relating to the Company’s redemption in January 2004 of $52.5 million aggregate principal amount of the outstanding 10-1/4% Senior Subordinated Notes due 2010 issued by its subsidiaries Tempur-Pedic, Inc. and Tempur Production USA, Inc. For the year ended December 31, 2003, GAAP net income per share includes, and pro forma net income per share excludes, transaction related expenses totaling $0.11, net of tax, relating to the write-off of deferred financing fees, original issue discount and prepayment penalties relating to the Company’s re-capitalization in August 2003, and these amounts are included in loss on debt extinguishment, net of tax.
The Company believes that excluding secondary offering expenses, non-cash stock-based compensation expense and loss on debt extinguishment provides a measure that is more representative of ongoing costs and therefore more comparable to the Company’s historical operations.
25

Reconciliation of Net Income per Share to Pro forma Net Income per Share
(Amounts are per Share)
Year Ended Quarter Ended
December 31, 2004 December 31, 2003 March 31, 2005 March 31, 2004
GAAP Net Income per Share, Diluted $0.73 $0.39 $0.26 $0.11
Stock-based compensation expense $0.05 $0.05 $0.01 $0.02
Secondary public offering expenses $0.01 $— $— $—
Loss on debt extinguishment and transaction expenses, net of tax $0.03 $0.11 $- $0.03
Proforma Net Income per Share, Diluted $0.82 $0.55 $0.27 $0.16
1. Amounts presented represents the Company’s GAAP net income per share before non-cash stock-based compensation expense of $0.01 and $0.02 for the quarter ended March 31, 2005 and 2004, respectively, and $0.05 and $0.05 for the year ended December 31, 2004 and 2003, respectively
2. Pro forma net income also excludes secondary public offering expenses and loss on debt extinguishment, net of tax.
The Company believes that excluding secondary offering expenses, non-cash stock compensation expenses and loss on debt extinguishment provides a measure that is more representative of ongoing costs and therefore more comparable to the Company’s historical operations.
26

Investor Presentation
May 2005