Table of Contents
UNITED STATES
SECURITIES AND EXCHANGE COMMISSION
Washington, D.C. 20549
FORM N-CSR
CERTIFIED SHAREHOLDER REPORT OF REGISTERED
MANAGEMENT INVESTMENT COMPANIES
Investment Company Act file number 811- 21261
Rydex ETF Trust
(Exact name of registrant as specified in charter)
805 King Farm Boulevard, Suite 600
Rockville, Maryland 20850
(Address of principal executive offices) (Zip code)
Donald C. Cacciapaglia
Rydex ETF Trust
805 King Farm Boulevard, Suite 600
Rockville, Maryland 20850
(Name and address of agent for service)
Registrant’s telephone number, including area code: 1-301-296-5100
Date of fiscal year end: October 31
Date of reporting period: April 30, 2012
Form N-CSR is to be used by management investment companies to file reports with the Commission not later than 10 days after the transmission to stockholders of any report that is required to be transmitted to stockholders under Rule 30e-1 under the Investment Company Act of 1940 (17 CFR 270.30e-1). The Commission may use the information provided on Form N-CSR in its regulatory, disclosure review, inspection, and policymaking roles.
A registrant is required to disclose the information specified by Form N-CSR, and the Commission will make this information public. A registrant is not required to respond to the collection of information contained in Form N-CSR unless the Form displays a currently valid Office of Management and Budget (“OMB”) control number. Please direct comments concerning the accuracy of the information collection burden estimate and any suggestions for reducing the burden to Secretary, Securities and Exchange Commission, 450 Fifth Street, NW, Washington, DC 20549-0609. The OMB has reviewed this collection of information under the clearance requirements of 44 U.S.C. § 3507.
Table of Contents
Item 1. Reports to Stockholders.
Table of Contents


APRIL 30, 2012
GUGGENHEIM ETFS
SEMI-ANNUAL REPORT
XLG GUGGENHEIM RUSSELL TOP 50® ETF
RPV GUGGENHEIM S&P 500 PURE VALUE ETF
RPG GUGGENHEIM S&P 500 PURE GROWTH ETF
RFV GUGGENHEIM S&P MIDCAP 400 PURE VALUE ETF
RFG GUGGENHEIM S&P MIDCAP 400 PURE GROWTH ETF
RZV GUGGENHEIM S&P SMALLCAP 600 PURE VALUE ETF
RZG GUGGENHEIM S&P SMALLCAP 600 PURE GROWTH ETF
Table of Contents
| TABLE OF CONTENTS |
| 2 | ||||
| 4 | ||||
| 6 | ||||
| 13 | ||||
| 33 | ||||
| 35 | ||||
| 37 | ||||
| 41 | ||||
| 48 | ||||
| 53 | ||||
| 55 | ||||
| GUGGENHEIM ETFS SEMI-ANNUAL REPORT | 1 |
Table of Contents
|
To Our Shareholders:
A restructuring of Greece’s massive debt, continued accommodation by the world’s major central banks and better news on the U.S. economy helped support financial markets over the six months ended April 30, 2012. Market optimism peaked in early 2012, when several major equity indices pushed to multi-year highs. But the mood grew more cautious late in the period after first-quarter U.S. GDP came in lower than expected and the Federal Reserve suggested that it would not take any additional measures to stimulate the economy. “Operation Twist,” in which the Fed buys longer-dated Treasury securities in order to hold down long-term rates, is set to end in June, and recent history has shown that stocks struggle when stimulus ends.
U.S. equities last fall were rebounding from the loss of the U.S. AAA credit rating in August. But after touching the low for the period in mid-November, improving U.S. economic data and the European Central Bank’s injections of three-year loans into the continent’s banking system gave a boost to markets late in 2011, which carried over into a strong first quarter of 2012. The mild U.S. winter also may have pulled economic, and thus market, activity forward, a notion supported by underlying momentum in consumer spending.
Markets began to get choppy in April, and many investors remained cautious, remembering 2010 and 2011, when U.S. stocks started strong, then experienced broad-based corrections. Besides a continuation of weakness in employment and housing, adding to unsettled markets were softening economic data and concern about the “fiscal cliff” the U.S. faces in 2013 when tax rates will rise unless Congress steps in. In addition, the onset of recession in Europe is complicating that region’s efforts to manage the sovereign debt crisis. Emerging markets in the first quarter of 2012 had their best start in 20 years, but slipped in March on fears of eurozone market contagion and renewed concern that China’s economic growth might slow.
The Fed said in late April that it expected economic growth to remain moderate over coming quarters, but that the unemployment rate will subside gradually and that inflation was under control. To foster growth, the Federal Reserve has said it will leave its key interest rate close to zero at least through 2014, despite arguments by some Fed officials and investors that the Fed may have to consider raising rates much earlier than that to prevent inflation.
Signs that the U.S. economy was expanding at a slow, but sustainable, rate contributed to concern about future inflation, and both short-term and long-term Treasury yields generally moved higher over the first part of 2012. The continued accommodative stance of the Fed, combined with the slow, but stable, economic recovery, is supporting a positive outlook for U.S. fixed income, particularly among corporate issuers, as borrowing costs remain low, default rates currently hover around 2% and strong demand for primary issuance has enabled a steady wave of debt refinancing. Against an improving U.S. macroeconomic backdrop, investment-grade and high-yield corporates are expected to continue to outpace Treasuries.
Commodities, which had been slumping since mid-2011 due to slowing economic activity and the European debt crisis, rebounded in early 2012 on stronger macroeconomic data, but remain volatile. The price of a barrel of oil rose slightly over the six months ended in April, but investors have been shifting out of gold to assets with greater return potential. After peaking at above $1,900 last summer, the price per ounce has fallen back to around $1,600. The dollar strengthened slightly against a basket of other major currencies over the period, reflecting better economic performance in the U.S. versus other markets.
The U.S. economy seems to be decoupling from slowing growth in the rest of the world and from ongoing uncertainty in the European debt crisis, as well as the domestic debate over tax and spending policy. In this resiliency, we see potential in U.S. investments, including equities, high yield bonds, bank loans and other risk assets. It appears that the U.S. may have entered a period of self-sustaining, if modest, economic expansion, driven primarily by the aggressive monetary policy of the Fed and reinforced by the ECB, and is increasingly becoming the economic locomotive of the global economy.
| 2 | GUGGENHEIM ETFS SEMI-ANNUAL REPORT |
Table of Contents
LETTER TO OUR SHAREHOLDERS (concluded)
|
We look forward to continuing our service to you. Thank you for investing in our funds.
Sincerely,

Donald C. Cacciapaglia
President
Performance displayed represents past performance which is no guarantee of future results. Of course, fund performance is subject to daily market volatility and may be better or worse since the end of the last quarter. For up-to-date fund performance, call us at 800.820.0888 or visit www.rydex-sgi.com.
Read each fund’s prospectus and summary prospectus (if available) carefully before investing. It contains the fund’s investment objectives, risks, charges, expenses and other information, which should be considered carefully before investing. Obtain a prospectus and summary prospectus (if available) at www.rydex-sgi.com or call 800.820.0888
The referenced funds are distributed by Rydex Distributors, LLC. Guggenheim Investments represents the investment management business of Guggenheim Partners, LLC, which includes Security Investors, LLC, the investment advisor to the referenced funds. Rydex Distributors, LLC, is affiliated with Guggenheim Partners, LLC and Security Investors, LLC.
| GUGGENHEIM ETFS SEMI-ANNUAL REPORT | 3 |
Table of Contents
|
Shareholder Expense Example
As a shareholder of the Rydex ETF Trust, you incur transaction costs such as creation and redemption fees or brokerage charges, and ongoing costs including advisory fees, trustee fees and, if applicable, distribution fees. All other Trust expenses are paid by the advisor. This Example is intended to help you understand your ongoing costs (in dollars) of investing in a Fund and to compare these costs with the ongoing costs of investing in other mutual funds.
The example in the table is based on an investment of $1,000 invested on October 31, 2011 and held for the six months ended April 30, 2012.
Actual Expenses
The first table below provides information about actual account values and actual expenses. You may use the information in this table, together with the amount you invested, to estimate the expenses that you incurred over the period. Simply divide your account value by $1,000 (for example, an $8,600 account value divided by $1,000 = 8.6), then multiply the result by the number in the first table under the heading entitled “Expenses Paid During the Six-Month Period” to estimate the expenses attributable to your investment during this period.
Hypothetical Example for Comparison Purposes
The second table below provides information about hypothetical account values and hypothetical expenses based on a Fund’s actual expense ratio and an assumed rate of return of 5% per year before expenses, which is not a Fund’s actual return. Thus, you should not use the hypothetical account values and expenses to estimate the actual ending account balance or your expenses for the period. Rather, these figures are provided to enable you to compare the ongoing costs of investing in a Fund and other funds. To do so, compare this 5% hypothetical example with the 5% hypothetical examples that appear in the shareholder reports of other funds.
Please note that the expenses shown in the table are meant to highlight your ongoing costs only and do not reflect any transaction costs, such as creation and redemption fees, or brokerage charges. Therefore, the second table is useful in comparing ongoing costs only, and will not help you determine the relative total costs of owning different funds. In addition, if these transaction costs were included, your costs would have been higher.
| Expense Ratio | Beginning Account Value 10/31/11 | Ending Account Value 4/30/12 | Expenses Paid During Six-Month Period* 10/31/11 to 4/30/12 | |||||||||||||
Actual | ||||||||||||||||
Guggenheim Russell Top 50® ETF | 0.20% | $ | 1,000.00 | $ | 1,147.70 | $ | 1.07 | |||||||||
Guggenheim S&P 500 Pure Value ETF | 0.35% | $ | 1,000.00 | $ | 1,102.40 | $ | 1.83 | |||||||||
Guggenheim S&P 500 Pure Growth ETF | 0.35% | $ | 1,000.00 | $ | 1,101.60 | $ | 1.83 | |||||||||
Guggenheim S&P MidCap 400 Pure Value ETF | 0.35% | $ | 1,000.00 | $ | 1,154.10 | $ | 1.87 | |||||||||
Guggenheim S&P MidCap 400 Pure Growth ETF | 0.35% | $ | 1,000.00 | $ | 1,095.30 | $ | 1.82 | |||||||||
Guggenheim S&P SmallCap 600 Pure Value ETF | 0.35% | $ | 1,000.00 | $ | 1,117.60 | $ | 1.84 | |||||||||
Guggenheim S&P SmallCap 600 Pure Growth ETF | 0.35% | $ | 1,000.00 | $ | 1,101.60 | $ | 1.83 | |||||||||
Hypothetical (assuming a 5% return before expenses) |
| |||||||||||||||
Guggenheim Russell Top 50® ETF | 0.20% | $ | 1,000.00 | $ | 1,023.87 | $ | 1.01 | |||||||||
Guggenheim S&P 500 Pure Value ETF | 0.35% | $ | 1,000.00 | $ | 1,023.12 | $ | 1.76 | |||||||||
Guggenheim S&P 500 Pure Growth ETF | 0.35% | $ | 1,000.00 | $ | 1,023.12 | $ | 1.76 | |||||||||
Guggenheim S&P MidCap 400 Pure Value ETF | 0.35% | $ | 1,000.00 | $ | 1,023.12 | $ | 1.76 | |||||||||
| 4 | GUGGENHEIM ETFS SEMI-ANNUAL REPORT |
Table of Contents
FEES AND EXPENSES (Unaudited) (concluded)
|
| Expense Ratio | Beginning Account Value 10/31/11 | Ending Account Value 4/30/12 | Expenses Paid During Six-Month Period* 10/31/11 to 4/30/12 | |||||||||||||
Guggenheim S&P MidCap 400 Pure Growth ETF | 0.35% | $ | 1,000.00 | $ | 1,023.12 | $ | 1.76 | |||||||||
Guggenheim S&P SmallCap 600 Pure Value ETF | 0.35% | $ | 1,000.00 | $ | 1,023.12 | $ | 1.76 | |||||||||
Guggenheim S&P SmallCap 600 Pure Growth ETF | 0.35% | $ | 1,000.00 | $ | 1,023.12 | $ | 1.76 | |||||||||
| * | Expenses are equal to the Fund’s annualized expense ratio multiplied by the average account value over the period, multiplied by 182/366 (to reflect one-half year period). |
| GUGGENHEIM ETFS SEMI-ANNUAL REPORT | 5 |
Table of Contents
|
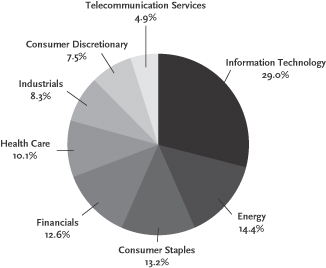
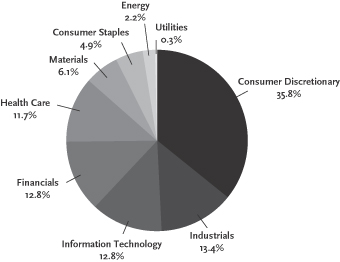
XLG GUGGENHEIM RUSSELL TOP 50® ETF
Sector Allocations*
| Top 10 Holdings* | ||||
| Description | % of Net Assets | |||
Apple, Inc. | 8.55% | |||
Exxon Mobil Corp. | 6.73% | |||
International Business Machines Corp. | 3.97% | |||
Microsoft Corp. | 3.76% | |||
Chevron Corp. | 3.39% | |||
General Electric Co. | 3.29% | |||
AT&T, Inc. | 3.09% | |||
Pfizer, Inc. | 2.87% | |||
Johnson & Johnson, Inc. | 2.82% | |||
Procter & Gamble Co. (The) | 2.81% | |||
| * | The Fund’s Top Ten Holdings are expressed as a percentage of net assets and the Sector Allocations are expressed as a percentage of the Fund’s equity investments market value. These percentages may change over time. |
| 6 | GUGGENHEIM ETFS SEMI-ANNUAL REPORT |
Table of Contents
PORTFOLIO SUMMARY (continued)
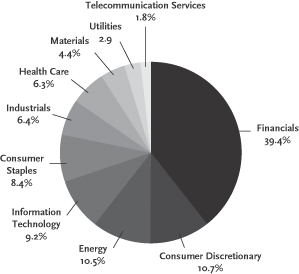
RPV GUGGENHEIM S&P 500 PURE VALUE ETF | ||
Sector Allocations*
| Top 10 Holdings* | ||||
| Description | % of Net Assets | |||
American International Group, Inc. | 3.00% | |||
Computer Sciences Corp. | 2.37% | |||
Whirlpool Corp. | 2.20% | |||
Hartford Financial Services Group, Inc. | 2.03% | |||
Valero Energy Corp. | 1.81% | |||
Sunoco, Inc. | 1.72% | |||
Lincoln National Corp. | 1.71% | |||
Marathon Oil Corp. | 1.66% | |||
Archer-Daniels-Midland Co. | 1.58% | |||
Bank of America Corp. | 1.53% | |||
| * | The Fund’s Top Ten Holdings are expressed as a percentage of net assets and the Sector Allocations are expressed as a percentage of the Fund’s equity investments market value. These percentages may change over time. |
| GUGGENHEIM ETFS SEMI-ANNUAL REPORT | 7 |
Table of Contents
PORTFOLIO SUMMARY (continued)
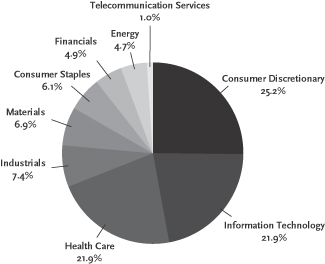
RPG GUGGENHEIM S&P 500 PURE GROWTH ETF | ||
Sector Allocations*
| Top 10 Holdings* | ||||
| Description | % of Net Assets | |||
Apple, Inc. | 1.77% | |||
Priceline.com, Inc. | 1.62% | |||
Visa, Inc. — Class A | 1.43% | |||
O’Reilly Automotive, Inc. | 1.39% | |||
Intuitive Surgical, Inc. | 1.36% | |||
Autozone, Inc. | 1.29% | |||
Ross Stores, Inc. | 1.27% | |||
Salesforce.com, Inc. | 1.27% | |||
Chipotle Mexican Grill, Inc. | 1.26% | |||
Biogen IDEC, Inc. | 1.25% | |||
| * | The Fund’s Top Ten Holdings are expressed as a percentage of net assets and the Sector Allocations are expressed as a percentage of the Fund’s equity investments market value. These percentages may change over time. |
| 8 | GUGGENHEIM ETFS SEMI-ANNUAL REPORT |
Table of Contents
PORTFOLIO SUMMARY (continued)
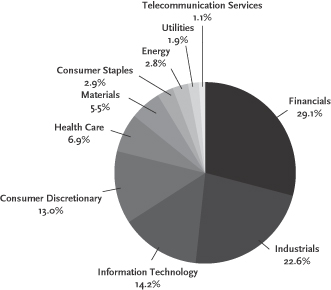
RFV GUGGENHEIM S&P MIDCAP 400 PURE VALUE ETF | ||
Sector Allocations*
| Top 10 Holdings* | ||||
| Description | % of Net Assets | |||
Exelis, Inc. | 2.98% | |||
First American Financial Corp. | 2.95% | |||
ITT Corp. | 2.88% | |||
Community Health Systems, Inc. | 2.62% | |||
Collective Brands, Inc. | 2.53% | |||
URS Corp. | 2.15% | |||
Ingram Micro, Inc. — Class A | 2.13% | |||
Protective Life Corp. | 2.10% | |||
AVNET, Inc. | 2.02% | |||
Huntington Ingalls Industries, Inc. | 1.90% | |||
| * | The Fund’s Top Ten Holdings are expressed as a percentage of net assets and the Sector Allocations are expressed as a percentage of the Fund’s equity investments market value. These percentages may change over time. |
| GUGGENHEIM ETFS SEMI-ANNUAL REPORT | 9 |
Table of Contents
PORTFOLIO SUMMARY (continued)
RFG GUGGENHEIM S&P MIDCAP 400 PURE GROWTH ETF | ||
Sector Allocations*

| Top 10 Holdings* | ||||
| Description | % of Net Assets | |||
Regeneron Pharmaceuticals, Inc. | 3.54% | |||
Catalyst Health Solutions, Inc. | 2.40% | |||
Equinix, Inc. | 2.27% | |||
ITT Educational Services, Inc. | 2.23% | |||
Alliance Data Systems Corp. | 1.78% | |||
Gen-Probe, Inc. | 1.68% | |||
Advance Auto Parts, Inc. | 1.66% | |||
Under Armour, Inc. — Class A | 1.65% | |||
Monster Beverage Corp. | 1.64% | |||
Amerigroup Corp. | 1.62% | |||
| * | The Fund’s Top Ten Holdings are expressed as a percentage of net assets and the Sector Allocations are expressed as a percentage of the Fund’s equity investments market value. These percentages may change over time. |
| 10 | GUGGENHEIM ETFS SEMI-ANNUAL REPORT |
Table of Contents
PORTFOLIO SUMMARY (continued)
RZV GUGGENHEIM S&P SMALLCAP 600 PURE VALUE ETF | ||
Sector Allocations*
| Top 10 Holdings* | ||||
| Description | % of Net Assets | |||
Voxx International Corp. | 2.21% | |||
Marriott Vacations Worldwide Corp. | 1.99% | |||
Gentiva Health Services, Inc. | 1.89% | |||
Amedisys, Inc. | 1.82% | |||
Tuesday Morning Corp. | 1.71% | |||
Perry Ellis International, Inc. | 1.66% | |||
Marinemax, Inc. | 1.63% | |||
Skechers U.S.A., Inc. — Class A | 1.57% | |||
Almost Family, Inc. | 1.44% | |||
Stewart Information Services Corp. | 1.36% | |||
| * | The Fund’s Top Ten Holdings are expressed as a percentage of net assets and the Sector Allocations are expressed as a percentage of the Fund’s equity investments market value. These percentages may change over time. |
| GUGGENHEIM ETFS SEMI-ANNUAL REPORT | 11 |
Table of Contents
PORTFOLIO SUMMARY (concluded)
RZG GUGGENHEIM S&P SMALLCAP 600 PURE GROWTH ETF | ||
Sector Allocations*

| Top 10 Holdings* | ||||
| Description | % of Net Assets | |||
Cirrus Logic, Inc. | 1.40% | |||
MWI Veterinary Supply, Inc. | 1.40% | |||
Coinstar, Inc. | 1.39% | |||
Buffalo Wild Wings, Inc. | 1.33% | |||
Veeco Instruments, Inc. | 1.24% | |||
Sturm Ruger & Co., Inc. | 1.20% | |||
Sourcefire, Inc. | 1.17% | |||
Allegiant Travel Co. | 1.16% | |||
Kulicke & Soffa Industries, Inc. | 1.07% | |||
Seacor Holdings, Inc. | 1.06% | |||
| * | The Fund’s Top Ten Holdings are expressed as a percentage of net assets and the Sector Allocations are expressed as a percentage of the Fund’s equity investments market value. These percentages may change over time. |
| 12 | GUGGENHEIM ETFS SEMI-ANNUAL REPORT |
Table of Contents
| SCHEDULE OF INVESTMENTS (Unaudited) | April 30, 2012 |
GUGGENHEIM RUSSELL TOP 50® ETF
| SHARES | MARKET VALUE | |||||||
COMMON STOCKS - 99.7% |
| |||||||
Aerospace & Defense - 2.1% |
| |||||||
Boeing Co. (The) | 56,719 | $ | 4,356,019 | |||||
United Technologies Corp. | 70,316 | 5,740,598 | ||||||
|
| |||||||
Total Aerospace & Defense | 10,096,617 | |||||||
|
| |||||||
Air Freight & Logistics - 0.9% |
| |||||||
United Parcel Service, Inc. — Class B | 56,446 | 4,410,690 | ||||||
|
| |||||||
Total Air Freight & Logistics | 4,410,690 | |||||||
|
| |||||||
Automobiles - 0.7% |
| |||||||
Ford Motor Co. | 286,253 | 3,228,934 | ||||||
|
| |||||||
Total Automobiles | 3,228,934 | |||||||
|
| |||||||
Beverages - 4.0% |
| |||||||
Coca-Cola Co. (The) | 151,778 | 11,583,697 | ||||||
PepsiCo, Inc. | 121,433 | 8,014,578 | ||||||
|
| |||||||
Total Beverages | 19,598,275 | |||||||
|
| |||||||
Biotechnology - 0.9% |
| |||||||
Amgen, Inc. | 61,152 | 4,348,519 | ||||||
|
| |||||||
Total Biotechnology | 4,348,519 | |||||||
|
| |||||||
Capital Markets - 0.9% |
| |||||||
Goldman Sachs Group, Inc. (The) | 39,775 | 4,580,091 | ||||||
|
| |||||||
Total Capital Markets | 4,580,091 | |||||||
|
| |||||||
Commercial Banks - 2.6% |
| |||||||
Wells Fargo & Co. | 377,892 | 12,632,930 | ||||||
|
| |||||||
Total Commercial Banks | 12,632,930 | |||||||
|
| |||||||
Communications Equipment - 3.4% |
| |||||||
Cisco Systems, Inc. | 422,553 | 8,514,443 | ||||||
QUALCOMM, Inc. | 128,262 | 8,188,246 | ||||||
|
| |||||||
Total Communications Equipment | 16,702,689 | |||||||
|
| |||||||
Computers & Peripherals - 10.3% |
| |||||||
Apple, Inc.* | 71,043 | 41,506,163 | ||||||
EMC Corp.* | 158,072 | 4,459,211 | ||||||
Hewlett-Packard Co. | 152,649 | 3,779,589 | ||||||
|
| |||||||
Total Computers & Peripherals | 49,744,963 | |||||||
|
| |||||||
Consumer Finance - 1.0% |
| |||||||
American Express Co. | 80,718 | 4,860,031 | ||||||
|
| |||||||
Total Consumer Finance | 4,860,031 | |||||||
|
| |||||||
Diversified Financial Services - 5.6% |
| |||||||
Bank of America Corp. | 824,465 | 6,686,411 | ||||||
Citigroup, Inc. | 223,254 | 7,376,312 | ||||||
JPMorgan Chase & Co. | 305,279 | 13,120,892 | ||||||
|
| |||||||
Total Diversified Financial Services | 27,183,615 | |||||||
|
| |||||||
Diversified Telecommunication Services - 4.9% |
| |||||||
AT&T, Inc. | 454,959 | 14,972,701 | ||||||
Verizon Communications, Inc. | 217,345 | 8,776,391 | ||||||
|
| |||||||
Total Diversified Telecommunication Services | 23,749,092 | |||||||
|
| |||||||
Energy Equipment & Services - 1.6% |
| |||||||
Schlumberger Ltd. | 104,247 | 7,728,873 | ||||||
|
| |||||||
Total Energy Equipment & Services | 7,728,873 | |||||||
|
| |||||||
| SHARES | MARKET VALUE | |||||||
Food & Staples Retailing - 1.7% |
| |||||||
Wal-Mart Stores, Inc. | 136,325 | $ | 8,030,906 | |||||
|
| |||||||
Total Food & Staples Retailing | 8,030,906 | |||||||
|
| |||||||
Food Products - 1.0% |
| |||||||
Kraft Foods, Inc. — Class A | 126,945 | 5,061,297 | ||||||
|
| |||||||
Total Food Products | 5,061,297 | |||||||
|
| |||||||
Hotels, Restaurants & Leisure - 1.6% |
| |||||||
McDonald’s Corp. | 79,712 | 7,767,934 | ||||||
|
| |||||||
Total Hotels, Restaurants & Leisure | 7,767,934 | |||||||
|
| |||||||
Household Products - 2.8% |
| |||||||
Procter & Gamble Co. (The) | 214,441 | 13,647,025 | ||||||
|
| |||||||
Total Household Products | 13,647,025 | |||||||
|
| |||||||
Industrial Conglomerates - 4.3% |
| |||||||
3M Co. | 54,590 | 4,878,162 | ||||||
General Electric Co. | 814,765 | 15,953,099 | ||||||
|
| |||||||
Total Industrial Conglomerates | 20,831,261 | |||||||
|
| |||||||
Insurance - 2.5% |
| |||||||
American International Group, Inc.* | 33,953 | 1,155,420 | ||||||
Berkshire Hathaway, Inc. — Class B* | 134,486 | 10,819,399 | ||||||
|
| |||||||
Total Insurance | 11,974,819 | |||||||
|
| |||||||
Internet & Catalog Retail - 1.3% |
| |||||||
Amazon.com, Inc.* | 27,921 | 6,474,880 | ||||||
|
| |||||||
Total Internet & Catalog Retail | 6,474,880 | |||||||
|
| |||||||
Internet Software & Services - 2.4% |
| |||||||
Google, Inc. — Class A* | 19,336 | 11,702,727 | ||||||
|
| |||||||
Total Internet Software & Services | 11,702,727 | |||||||
|
| |||||||
IT Services - 5.0% |
| |||||||
International Business Machines Corp. | 93,050 | 19,268,794 | ||||||
Visa, Inc. — Class A | 40,175 | 4,940,721 | ||||||
|
| |||||||
Total IT Services | 24,209,515 | |||||||
|
| |||||||
Machinery - 1.1% |
| |||||||
Caterpillar, Inc. | 49,529 | 5,090,095 | ||||||
|
| |||||||
Total Machinery | 5,090,095 | |||||||
|
| |||||||
Media - 2.5% |
| |||||||
Comcast Corp. — Class A | 211,876 | 6,426,199 | ||||||
Walt Disney Co. (The) | 137,500 | 5,927,625 | ||||||
|
| |||||||
Total Media | 12,353,824 | |||||||
|
| |||||||
Oil, Gas & Consumable Fuels - 12.8% |
| |||||||
Chevron Corp. | 154,437 | 16,456,807 | ||||||
ConocoPhillips | 102,005 | 7,306,618 | ||||||
Exxon Mobil Corp. | 378,448 | 32,675,200 | ||||||
Occidental Petroleum Corp. | 62,449 | 5,696,598 | ||||||
|
| |||||||
Total Oil, Gas & Consumable Fuels | 62,135,223 | |||||||
|
| |||||||
Pharmaceuticals - 9.1% |
| |||||||
Abbott Laboratories | 119,408 | 7,410,460 | ||||||
Johnson & Johnson, Inc. | 210,590 | 13,707,303 | ||||||
Merck & Co., Inc. | 237,127 | 9,304,864 | ||||||
Pfizer, Inc. | 607,006 | 13,918,648 | ||||||
|
| |||||||
Total Pharmaceuticals | 44,341,275 | |||||||
|
| |||||||
| See Notes to Financial Statements. | GUGGENHEIM ETFS SEMI-ANNUAL REPORT | 13 |
Table of Contents
| SCHEDULE OF INVESTMENTS (Unaudited) (concluded) | April 30, 2012 |
GUGGENHEIM RUSSELL TOP 50® ETF
| SHARES | MARKET VALUE | |||||||
Semiconductors & Semiconductor Equipment - 2.2% |
| |||||||
Intel Corp. | 383,819 | $ | 10,900,460 | |||||
|
| |||||||
Total Semiconductors & Semiconductor Equipment | 10,900,460 | |||||||
|
| |||||||
Software - 5.6% |
| |||||||
Microsoft Corp. | 570,107 | 18,254,826 | ||||||
Oracle Corp. | 295,081 | 8,672,431 | ||||||
|
| |||||||
Total Software | 26,927,257 | |||||||
|
| |||||||
Specialty Retail - 1.3% |
| |||||||
Home Depot, Inc. | 122,771 | 6,358,310 | ||||||
|
| |||||||
Total Specialty Retail | 6,358,310 | |||||||
|
| |||||||
Tobacco - 3.6% |
| |||||||
Altria Group, Inc. | 160,824 | 5,180,141 | ||||||
Philip Morris International, Inc. | 136,626 | 12,229,393 | ||||||
|
| |||||||
Total Tobacco | 17,409,534 | |||||||
|
| |||||||
Total Common Stocks | 484,081,661 | |||||||
|
| |||||||
SHORT TERM INVESTMENTS - 0.2% |
| |||||||
SSgA Government Money Market Fund | 764,242 | 764,242 | ||||||
|
| |||||||
Total Short Term Investments | 764,242 | |||||||
|
| |||||||
Total Investments - 99.9%a | 484,845,903 | |||||||
|
| |||||||
Other Assets and Liabilities, net - 0.1% |
| 479,739 | ||||||
|
| |||||||
Net Assets - 100.0% | $ | 485,325,642 | ||||||
|
| |||||||
| * | Non-Income Producing Security. |
| a | Unless otherwise indicated, the values of the Portfolio are determined based on Level 1 inputs. |
| 14 | GUGGENHEIM ETFS SEMI-ANNUAL REPORT | See Notes to Financial Statements. |
Table of Contents
| SCHEDULE OF INVESTMENTS (Unaudited) | April 30, 2012 |
GUGGENHEIM S&P 500 PURE VALUE ETF
| SHARES | MARKET VALUE | |||||||
COMMON STOCKS - 99.8% |
| |||||||
Aerospace & Defense - 2.4% |
| |||||||
L-3 Communications Holdings, Inc. | 13,328 | $ | 980,141 | |||||
Northrop Grumman Corp. | 14,100 | 892,248 | ||||||
Textron, Inc. | 14,982 | 399,121 | ||||||
|
| |||||||
Total Aerospace & Defense | 2,271,510 | |||||||
|
| |||||||
Airlines - 0.8% |
| |||||||
Southwest Airlines Co. | 90,174 | 746,641 | ||||||
|
| |||||||
Total Airlines | 746,641 | |||||||
|
| |||||||
Auto Components - 0.7% |
| |||||||
Goodyear Tire & Rubber Co. (The)* | 23,771 | 261,005 | ||||||
Johnson Controls, Inc. | 12,912 | 412,797 | ||||||
|
| |||||||
Total Auto Components | 673,802 | |||||||
|
| |||||||
Automobiles - 0.8% |
| |||||||
Ford Motor Co. | 68,178 | 769,048 | ||||||
|
| |||||||
Total Automobiles | 769,048 | |||||||
|
| |||||||
Beverages - 0.4% |
| |||||||
Molson Coors Brewing Co. — Class B | 8,921 | 370,935 | ||||||
|
| |||||||
Total Beverages | 370,935 | |||||||
|
| |||||||
Capital Markets - 5.7% |
| |||||||
Ameriprise Financial, Inc. | 9,421 | 510,712 | ||||||
Bank of New York Mellon Corp. (The) | 35,976 | 850,832 | ||||||
E*Trade Financial Corp.* | 87,444 | 929,530 | ||||||
Goldman Sachs Group, Inc. (The) | 8,518 | 980,848 | ||||||
Legg Mason, Inc. | 25,441 | 663,247 | ||||||
Morgan Stanley | 80,399 | 1,389,295 | ||||||
|
| |||||||
Total Capital Markets | 5,324,464 | |||||||
|
| |||||||
Chemicals - 0.5% |
| |||||||
Dow Chemical Co. (The) | 12,366 | 418,960 | ||||||
|
| |||||||
Total Chemicals | 418,960 | |||||||
|
| |||||||
Commercial Banks - 6.1% |
| |||||||
BB&T Corp. | 13,747 | 440,454 | ||||||
Comerica, Inc. | 16,874 | 540,305 | ||||||
Fifth Third Bancorp | 31,513 | 448,430 | ||||||
First Horizon National Corp. | 37,794 | 346,949 | ||||||
Huntington Bancshares, Inc. | 61,437 | 411,014 | ||||||
KeyCorp | 84,700 | 680,988 | ||||||
PNC Financial Services Group, Inc. | 7,997 | 530,361 | ||||||
Regions Financial Corp. | 118,708 | 800,092 | ||||||
SunTrust Banks, Inc. | 42,822 | 1,039,718 | ||||||
Wells Fargo & Co. | 12,091 | 404,202 | ||||||
|
| |||||||
Total Commercial Banks | 5,642,513 | |||||||
|
| |||||||
Commercial Services & Supplies - 1.8% |
| |||||||
Avery Dennison Corp. | 26,165 | 836,756 | ||||||
R.R. Donnelley & Sons Co. | 65,684 | 821,707 | ||||||
|
| |||||||
Total Commercial Services & Supplies | 1,658,463 | |||||||
|
| |||||||
Communications Equipment - 0.5% |
| |||||||
Harris Corp. | 10,814 | 492,470 | ||||||
|
| |||||||
Total Communications Equipment | 492,470 | |||||||
|
| |||||||
Computers & Peripherals - 2.2% |
| |||||||
Dell, Inc.* | 18,193 | 297,820 | ||||||
| SHARES | MARKET VALUE | |||||||
Hewlett-Packard Co. | 25,271 | $ | 625,710 | |||||
Lexmark International, Inc. — Class A | 13,362 | 402,196 | ||||||
Western Digital Corp.* | 18,247 | 708,166 | ||||||
|
| |||||||
Total Computers & Peripherals | 2,033,892 | |||||||
|
| |||||||
Construction & Engineering - 0.5% |
| |||||||
Jacobs Engineering Group, Inc.* | 11,280 | 494,402 | ||||||
|
| |||||||
Total Construction & Engineering | 494,402 | |||||||
|
| |||||||
Consumer Finance - 1.4% |
| |||||||
Capital One Financial Corp. | 17,381 | 964,298 | ||||||
SLM Corp. | 21,626 | 320,713 | ||||||
|
| |||||||
Total Consumer Finance | 1,285,011 | |||||||
|
| |||||||
Containers & Packaging - 1.7% |
| |||||||
Bemis Co., Inc. | 10,238 | 331,609 | ||||||
Owens-Illinois, Inc.* | 25,115 | 583,923 | ||||||
Sealed Air Corp. | 33,272 | 638,157 | ||||||
|
| |||||||
Total Containers & Packaging | 1,553,689 | |||||||
|
| |||||||
Diversified Financial Services - 5.8% |
| |||||||
Bank of America Corp. | 176,161 | 1,428,666 | ||||||
Citigroup, Inc. | 42,021 | 1,388,374 | ||||||
CME Group, Inc. | 1,280 | 340,249 | ||||||
JPMorgan Chase & Co. | 25,631 | 1,101,620 | ||||||
Leucadia National Corp. | 22,058 | 548,362 | ||||||
Nasdaq OMX Group, Inc. (The)* | 14,561 | 357,764 | ||||||
NYSE Euronext | 10,989 | 282,967 | ||||||
|
| |||||||
Total Diversified Financial Services | 5,448,002 | |||||||
|
| |||||||
Diversified Telecommunication Services - 0.6% |
| |||||||
CenturyLink, Inc. | 7,676 | 295,987 | ||||||
Frontier Communications Corp. | 59,411 | 240,020 | ||||||
|
| |||||||
Total Diversified Telecommunication Services | 536,007 | |||||||
|
| |||||||
Electric Utilities - 1.0% |
| |||||||
Edison International | 10,626 | 467,650 | ||||||
Pepco Holdings, Inc. | 25,221 | 477,182 | ||||||
|
| |||||||
Total Electric Utilities | 944,832 | |||||||
|
| |||||||
Electronic Equipment, Instruments & Components - 1.6% |
| |||||||
Corning, Inc. | 24,311 | 348,863 | ||||||
Jabil Circuit, Inc. | 48,527 | 1,137,958 | ||||||
|
| |||||||
Total Electronic Equipment, Instruments & Components | 1,486,821 | |||||||
|
| |||||||
Energy Equipment & Services - 0.3% |
| |||||||
Nabors Industries Ltd.* | 15,746 | 262,171 | ||||||
|
| |||||||
Total Energy Equipment & Services | 262,171 | |||||||
|
| |||||||
Food & Staples Retailing - 3.8% |
| |||||||
CVS Caremark Corp. | 12,995 | 579,837 | ||||||
Kroger Co. (The) | 38,343 | 892,241 | ||||||
Safeway, Inc. | 55,414 | 1,126,567 | ||||||
Sysco Corp. | 12,181 | 352,031 | ||||||
Walgreen Co. | 16,668 | 584,380 | ||||||
|
| |||||||
Total Food & Staples Retailing | 3,535,056 | |||||||
|
| |||||||
| See Notes to Financial Statements. | GUGGENHEIM ETFS SEMI-ANNUAL REPORT | 15 |
Table of Contents
| SCHEDULE OF INVESTMENTS (Unaudited) (continued) | April 30, 2012 |
GUGGENHEIM S&P 500 PURE VALUE ETF
| SHARES | MARKET VALUE | |||||||
Food Products - 4.2% |
| |||||||
Archer-Daniels-Midland Co. | 47,763 | $ | 1,472,533 | |||||
Dean Foods Co.* | 106,750 | 1,310,890 | ||||||
Tyson Foods, Inc. — Class A | 62,596 | 1,142,377 | ||||||
|
| |||||||
Total Food Products | 3,925,800 | |||||||
|
| |||||||
Health Care Providers & Services - 5.9% |
| |||||||
AmerisourceBergen Corp. | 22,859 | 850,583 | ||||||
Cardinal Health, Inc. | 21,376 | 903,564 | ||||||
CIGNA Corp. | 11,773 | 544,266 | ||||||
Coventry Health Care, Inc. | 28,620 | 858,314 | ||||||
McKesson Corp. | 10,251 | 937,044 | ||||||
Tenet Healthcare Corp.* | 267,939 | 1,390,603 | ||||||
|
| |||||||
Total Health Care Providers & Services | 5,484,374 | |||||||
|
| |||||||
Household Durables - 2.2% |
| |||||||
Whirlpool Corp. | 31,987 | 2,047,808 | ||||||
|
| |||||||
Total Household Durables | 2,047,808 | |||||||
|
| |||||||
Independent Power Producers & Energy |
| |||||||
NRG Energy, Inc.* | 65,408 | 1,111,936 | ||||||
|
| |||||||
Total Independent Power Producers & Energy Traders | 1,111,936 | |||||||
|
| |||||||
Insurance - 18.5% |
| |||||||
ACE Ltd. | 6,977 | 530,043 | ||||||
Allstate Corp. (The) | 38,959 | 1,298,503 | ||||||
American International Group, Inc.* | 82,256 | 2,799,172 | ||||||
Assurant, Inc. | 22,177 | 894,620 | ||||||
Cincinnati Financial Corp. | 15,522 | 552,894 | ||||||
Genworth Financial, Inc. — Class A* | 228,296 | 1,372,059 | ||||||
Hartford Financial Services Group, Inc. | 91,841 | 1,887,332 | ||||||
Lincoln National Corp. | 64,159 | 1,589,218 | ||||||
Loews Corp. | 15,137 | 622,585 | ||||||
MetLife, Inc. | 37,930 | 1,366,618 | ||||||
Principal Financial Group, Inc. | 29,975 | 829,408 | ||||||
Prudential Financial, Inc. | 20,076 | 1,215,401 | ||||||
Torchmark Corp. | 6,936 | 337,853 | ||||||
Unum Group | 40,877 | 970,420 | ||||||
XL Group PLC | 44,770 | 963,003 | ||||||
|
| |||||||
Total Insurance | 17,229,129 | |||||||
|
| |||||||
IT Services - 3.1% |
| |||||||
Computer Sciences Corp. | 78,778 | 2,210,511 | ||||||
SAIC, Inc. | 59,009 | 717,549 | ||||||
|
| |||||||
Total IT Services | 2,928,060 | |||||||
|
| |||||||
Life Sciences Tools & Services - 0.4% |
| |||||||
PerkinElmer, Inc. | 14,565 | 401,994 | ||||||
|
| |||||||
Total Life Sciences Tools & Services | 401,994 | |||||||
|
| |||||||
Machinery - 0.5% |
| |||||||
Ingersoll-Rand PLC | 11,073 | 470,824 | ||||||
|
| |||||||
Total Machinery | 470,824 | |||||||
|
| |||||||
Media - 1.7% |
| |||||||
Gannett Co., Inc. | 60,764 | 839,759 | ||||||
Washington Post Co. (The) — Class B | 1,936 | 732,137 | ||||||
|
| |||||||
Total Media | 1,571,896 | |||||||
|
| |||||||
| SHARES | MARKET VALUE | |||||||
Metals & Mining - 1.7% |
| |||||||
Alcoa, Inc. | 91,003 | $ | 885,459 | |||||
United States Steel Corp. | 26,028 | 737,373 | ||||||
|
| |||||||
Total Metals & Mining | 1,622,832 | |||||||
|
| |||||||
Multi-utilities - 0.7% |
| |||||||
DTE Energy Co. | 5,381 | 303,381 | ||||||
Integrys Energy Group, Inc. | 6,217 | 339,697 | ||||||
|
| |||||||
Total Multi-Utilities | 643,078 | |||||||
|
| |||||||
Multiline Retail - 2.1% |
| |||||||
J.C. Penney Co., Inc. | 18,597 | 670,608 | ||||||
Sears Holdings Corp.* | 23,564 | 1,267,272 | ||||||
|
| |||||||
Total Multiline Retail | 1,937,880 | |||||||
|
| |||||||
Office Electronics - 0.8% |
| |||||||
Xerox Corp. | 92,800 | 721,984 | ||||||
|
| |||||||
Total Office Electronics | 721,984 | |||||||
|
| |||||||
Oil, Gas & Consumable Fuels - 10.2% |
| |||||||
Alpha Natural Resources, Inc.* | 16,615 | 268,000 | ||||||
ConocoPhillips | 7,668 | �� | 549,259 | |||||
Hess Corp. | 11,461 | 597,576 | ||||||
Marathon Oil Corp. | 52,684 | 1,545,749 | ||||||
Marathon Petroleum Corp. | 31,183 | 1,297,525 | ||||||
Murphy Oil Corp. | 12,239 | 672,778 | ||||||
Phillips 66* | 5,770 | 196,468 | ||||||
Sunoco, Inc. | 32,445 | 1,599,214 | ||||||
Tesoro Corp.* | 47,006 | 1,092,889 | ||||||
Valero Energy Corp. | 68,231 | 1,685,306 | ||||||
|
| |||||||
Total Oil, Gas & Consumable Fuels | 9,504,764 | |||||||
|
| |||||||
Paper & Forest Products - 0.5% |
| |||||||
International Paper Co. | 14,577 | 485,560 | ||||||
|
| |||||||
Total Paper & Forest Products | 485,560 | |||||||
|
| |||||||
Real Estate Investment Trusts (REITs) - 0.4% |
| |||||||
Weyerhaeuser Co. | 18,024 | 366,969 | ||||||
|
| |||||||
Total Real Estate Investment Trusts (REITs) | 366,969 | |||||||
|
| |||||||
Road & Rail - 0.3% |
| |||||||
Ryder System, Inc. | 6,134 | 298,848 | ||||||
|
| |||||||
Total Road & Rail | 298,848 | |||||||
|
| |||||||
Semiconductors & Semiconductor |
| |||||||
Micron Technology, Inc.* | 134,312 | 885,116 | ||||||
|
| |||||||
Total Semiconductors & Semiconductor Equipment | 885,116 | |||||||
|
| |||||||
Specialty Retail - 3.2% |
| |||||||
AutoNation, Inc.* | 8,444 | 291,993 | ||||||
Best Buy Co., Inc. | 43,011 | 949,253 | ||||||
GameStop Corp. — Class A | 43,611 | 992,586 | ||||||
Staples, Inc. | 47,549 | 732,255 | ||||||
|
| |||||||
Total Specialty Retail | 2,966,087 | |||||||
|
| |||||||
Thrifts & Mortgage Finance - 1.4% |
| |||||||
Hudson City Bancorp, Inc. | 190,119 | 1,342,240 | ||||||
|
| |||||||
Total Thrifts & Mortgage Finance | 1,342,240 | |||||||
|
| |||||||
| 16 | GUGGENHEIM ETFS SEMI-ANNUAL REPORT | See Notes to Financial Statements. |
Table of Contents
| SCHEDULE OF INVESTMENTS (Unaudited) (concluded) | April 30, 2012 |
GUGGENHEIM S&P 500 PURE VALUE ETF
| SHARES | MARKET VALUE | |||||||
Wireless Telecommunication Services - 1.2% |
| |||||||
MetroPCS Communications, Inc.* | 53,839 | $ | 393,024 | |||||
Sprint Nextel Corp.* | 305,214 | 756,931 | ||||||
|
| |||||||
Total Wireless Telecommunication Services | 1,149,955 | |||||||
|
| |||||||
Total Common Stocks |
| 93,045,823 | ||||||
|
| |||||||
SHORT TERM INVESTMENTS - 0.2% |
| |||||||
SSgA Government Money Market Fund | 191,794 | 191,794 | ||||||
|
| |||||||
Total Short Term Investments | 191,794 | |||||||
|
| |||||||
Total Investments - 100.0%a |
| 93,237,617 | ||||||
|
| |||||||
Other Assets and Liabilities, net - 0.0%b |
| (36,947 | ) | |||||
|
| |||||||
Net Assets - 100.0% | $ | 93,200,670 | ||||||
|
| |||||||
| * | Non-Income Producing Security. |
| a | Unless otherwise indicated, the values of the Portfolio are determined based on Level 1 inputs. |
| b | Amount represents less than 0.05% of net assets. |
| See Notes to Financial Statements. | GUGGENHEIM ETFS SEMI-ANNUAL REPORT | 17 |
Table of Contents
| SCHEDULE OF INVESTMENTS (Unaudited) | April 30, 2012 |
GUGGENHEIM S&P 500 PURE GROWTH ETF
| SHARES | MARKET VALUE | |||||||
COMMON STOCKS - 99.9% |
| |||||||
Aerospace & Defense - 1.1% |
| |||||||
Goodrich Corp. | 10,485 | $ | 1,315,448 | |||||
Lockheed Martin Corp. | 23,399 | 2,118,546 | ||||||
|
| |||||||
Total Aerospace & Defense | 3,433,994 | |||||||
|
| |||||||
Air Freight & Logistics - 1.1% |
| |||||||
C.H. Robinson Worldwide, Inc. | 30,631 | 1,829,896 | ||||||
United Parcel Service, Inc. — Class B | 21,689 | 1,694,778 | ||||||
|
| |||||||
Total Air Freight & Logistics | 3,524,674 | |||||||
|
| |||||||
Beverages - 2.0% |
| |||||||
Brown-Forman Corp. — Class B | 15,456 | 1,334,625 | ||||||
Coca-Cola Co. (The) | 31,477 | 2,402,325 | ||||||
PepsiCo, Inc. | 42,859 | 2,828,694 | ||||||
|
| |||||||
Total Beverages | 6,565,644 | |||||||
|
| |||||||
Biotechnology - 4.3% |
| |||||||
Amgen, Inc. | 33,341 | 2,370,878 | ||||||
Biogen Idec, Inc.* | 29,984 | 4,018,156 | ||||||
Celgene Corp.* | 54,104 | 3,945,264 | ||||||
Gilead Sciences, Inc.* | 70,199 | 3,651,050 | ||||||
|
| |||||||
Total Biotechnology | 13,985,348 | |||||||
|
| |||||||
Capital Markets - 1.8% |
| |||||||
BlackRock, Inc. | 10,383 | 1,989,175 | ||||||
Franklin Resources, Inc. | 19,751 | 2,478,948 | ||||||
T. Rowe Price Group, Inc. | 21,305 | 1,344,665 | ||||||
|
| |||||||
Total Capital Markets | 5,812,788 | |||||||
|
| |||||||
Chemicals - 5.3% |
| |||||||
CF Industries Holdings, Inc. | 11,320 | 2,185,439 | ||||||
Ecolab, Inc. | 29,884 | 1,903,312 | ||||||
FMC Corp. | 21,732 | 2,400,299 | ||||||
International Flavors & Fragrances, Inc. | 35,213 | 2,120,175 | ||||||
Monsanto Co. | 14,591 | 1,111,542 | ||||||
PPG Industries, Inc. | 18,874 | 1,986,300 | ||||||
Praxair, Inc. | 13,156 | 1,522,149 | ||||||
Sherwin-Williams Co. (The) | 16,327 | 1,963,812 | ||||||
Sigma-Aldrich Corp. | 26,880 | 1,905,792 | ||||||
|
| |||||||
Total Chemicals | 17,098,820 | |||||||
|
| |||||||
Commercial Services & Supplies - 1.1% |
| |||||||
Stericycle, Inc.* | 40,345 | 3,493,877 | ||||||
|
| |||||||
Total Commercial Services & Supplies | 3,493,877 | |||||||
|
| |||||||
Communications Equipment - 2.0% |
| |||||||
F5 Networks, Inc.* | 29,396 | 3,937,006 | ||||||
QUALCOMM, Inc. | 38,676 | 2,469,076 | ||||||
|
| |||||||
Total Communications Equipment | 6,406,082 | |||||||
|
| |||||||
Computers & Peripherals - 3.0% |
| |||||||
Apple, Inc.* | 9,736 | 5,688,161 | ||||||
NetApp, Inc.* | 53,828 | 2,090,141 | ||||||
SanDisk Corp.* | 51,718 | 1,914,083 | ||||||
|
| |||||||
Total Computers & Peripherals | 9,692,385 | |||||||
|
| |||||||
| SHARES | MARKET VALUE | |||||||
Diversified Consumer Services - 1.6% |
| |||||||
Apollo Group, Inc. — Class A* | 66,793 | $ | 2,352,450 | |||||
DeVry, Inc. | 84,209 | 2,707,319 | ||||||
|
| |||||||
Total Diversified Consumer Services | 5,059,769 | |||||||
|
| |||||||
Diversified Financial Services - 1.1% |
| |||||||
IntercontinentalExchange, Inc.* | 27,139 | 3,610,573 | ||||||
|
| |||||||
Total Diversified Financial Services | 3,610,573 | |||||||
|
| |||||||
Electrical Equipment - 0.9% |
| |||||||
Rockwell Automation, Inc. | 17,285 | 1,336,822 | ||||||
Roper Industries, Inc. | 14,496 | 1,477,142 | ||||||
|
| |||||||
Total Electrical Equipment | 2,813,964 | |||||||
|
| |||||||
Electronic Equipment, Instruments & |
| |||||||
Amphenol Corp. — Class A | 37,765 | 2,195,657 | ||||||
|
| |||||||
Total Electronic Equipment, Instruments & Components | 2,195,657 | |||||||
|
| |||||||
Energy Equipment & Services - 2.0% |
| |||||||
Cameron International Corp.* | 30,081 | 1,541,651 | ||||||
Diamond Offshore Drilling, Inc. | 34,186 | 2,343,451 | ||||||
Helmerich & Payne, Inc. | 27,672 | 1,422,064 | ||||||
Schlumberger Ltd. | 16,249 | 1,204,701 | ||||||
|
| |||||||
Total Energy Equipment & Services | 6,511,867 | |||||||
|
| |||||||
Food Products - 1.6% |
| |||||||
Hershey Co. (The) | 29,208 | 1,957,228 | ||||||
Kellogg Co. | 25,748 | 1,302,076 | ||||||
Mead Johnson Nutrition Co. | 21,525 | 1,841,679 | ||||||
|
| |||||||
Total Food Products | 5,100,983 | |||||||
|
| |||||||
Health Care Equipment & Supplies - 6.9% |
| |||||||
Baxter International, Inc. | 35,963 | 1,992,710 | ||||||
Becton, Dickinson and Co. | 24,621 | 1,931,517 | ||||||
C.R. Bard, Inc. | 27,671 | 2,738,322 | ||||||
Edwards Lifesciences Corp.* | 35,199 | 2,920,461 | ||||||
Intuitive Surgical, Inc.* | 7,538 | 4,358,472 | ||||||
St Jude Medical, Inc. | 44,690 | 1,730,397 | ||||||
Stryker Corp. | 37,015 | 2,019,908 | ||||||
Varian Medical Systems, Inc.* | 36,271 | 2,300,307 | ||||||
Zimmer Holdings, Inc. | 34,529 | 2,172,910 | ||||||
|
| |||||||
Total Health Care Equipment & Supplies | 22,165,004 | |||||||
|
| |||||||
Health Care Providers & Services - 4.2% |
| |||||||
DaVita, Inc.* | 26,167 | 2,317,873 | ||||||
Express Scripts Holding Co.* | 67,687 | 3,776,258 | ||||||
Laboratory Corp. of America Holdings* | 29,446 | 2,588,009 | ||||||
Quest Diagnostics, Inc. | 32,684 | 1,885,540 | ||||||
UnitedHealth Group, Inc. | 50,448 | 2,832,655 | ||||||
|
| |||||||
Total Health Care Providers & Services | 13,400,335 | |||||||
|
| |||||||
Health Care Technology - 0.7% |
| |||||||
Cerner Corp.* | 27,344 | 2,217,325 | ||||||
|
| |||||||
Total Health Care Technology | 2,217,325 | |||||||
|
| |||||||
| 18 | GUGGENHEIM ETFS SEMI-ANNUAL REPORT | See Notes to Financial Statements. |
Table of Contents
| SCHEDULE OF INVESTMENTS (Unaudited) (continued) | April 30, 2012 |
GUGGENHEIM S&P 500 PURE GROWTH ETF
| SHARES | MARKET VALUE | |||||||
Hotels, Restaurants & Leisure - 3.7% |
| |||||||
Chipotle Mexican Grill, Inc.* | 9,766 | $ | 4,044,589 | |||||
McDonald’s Corp. | 19,188 | 1,869,870 | ||||||
Starbucks Corp. | 23,652 | 1,357,152 | ||||||
Wynn Resorts Ltd. | 18,105 | 2,415,207 | ||||||
Yum! Brands, Inc. | 30,449 | 2,214,556 | ||||||
|
| |||||||
Total Hotels, Restaurants & Leisure | 11,901,374 | |||||||
|
| |||||||
Household Products - 1.1% |
| |||||||
Colgate-Palmolive Co. | 18,616 | 1,841,867 | ||||||
Kimberly-Clark Corp. | 21,695 | 1,702,407 | ||||||
|
| |||||||
Total Household Products | 3,544,274 | |||||||
|
| |||||||
Insurance - 0.7% |
| |||||||
AFLAC, Inc. | 50,191 | 2,260,603 | ||||||
|
| |||||||
Total Insurance | 2,260,603 | |||||||
|
| |||||||
Internet & Catalog Retail - 4.0% |
| |||||||
Amazon.com, Inc.* | 16,644 | 3,859,743 | ||||||
Netflix, Inc.* | 48,720 | 3,904,421 | ||||||
priceline.com, Inc.* | 6,857 | 5,216,943 | ||||||
|
| |||||||
Total Internet & Catalog Retail | 12,981,107 | |||||||
|
| |||||||
Internet Software & Services - 1.5% |
| |||||||
Akamai Technologies, Inc.* | 43,941 | 1,432,477 | ||||||
Google, Inc. — Class A* | 5,458 | 3,303,345 | ||||||
|
| |||||||
Total Internet Software & Services | 4,735,822 | |||||||
|
| |||||||
IT Services - 6.0% |
| |||||||
Automatic Data Processing, Inc. | 31,898 | 1,774,167 | ||||||
Cognizant Technology Solutions Corp. — Class A* | 48,186 | 3,532,998 | ||||||
Fiserv, Inc.* | 29,245 | 2,055,631 | ||||||
International Business Machines Corp. | 8,460 | 1,751,897 | ||||||
Mastercard, Inc. — Class A | 6,783 | 3,067,747 | ||||||
Teradata Corp.* | 35,862 | 2,502,450 | ||||||
Visa, Inc. — Class A | 37,272 | 4,583,711 | ||||||
|
| |||||||
Total IT Services | 19,268,601 | |||||||
|
| |||||||
Life Sciences Tools & Services - 1.3% |
| |||||||
Life Technologies Corp.* | 44,727 | 2,073,544 | ||||||
Waters Corp.* | 23,731 | 1,996,014 | ||||||
|
| |||||||
Total Life Sciences Tools & Services | 4,069,558 | |||||||
|
| |||||||
Machinery - 1.4% |
| |||||||
Deere & Co. | 22,998 | 1,894,115 | ||||||
Joy Global, Inc. | 14,337 | 1,014,630 | ||||||
Pall Corp. | 28,376 | 1,691,493 | ||||||
|
| |||||||
Total Machinery | 4,600,238 | |||||||
|
| |||||||
Media - 3.7% |
| |||||||
DIRECTV — Class A* | 66,025 | 3,253,052 | ||||||
Discovery Communications, Inc. — Class A* | 71,211 | 3,875,303 | ||||||
Scripps Networks Interactive, Inc. — Class A | 58,551 | 2,940,431 | ||||||
Viacom, Inc. — Class B | 35,968 | 1,668,555 | ||||||
|
| |||||||
Total Media | 11,737,341 | |||||||
|
| |||||||
| SHARES | MARKET VALUE | |||||||
Metals & Mining - 1.6% |
| |||||||
Cliffs Natural Resources, Inc. | 35,226 | $ | 2,193,171 | |||||
Newmont Mining Corp. | 60,073 | 2,862,478 | ||||||
|
| |||||||
Total Metals & Mining | 5,055,649 | |||||||
|
| |||||||
Multiline Retail - 2.2% |
| |||||||
Dollar Tree, Inc.* | 38,909 | 3,955,489 | ||||||
Family Dollar Stores, Inc. | 44,509 | 3,006,583 | ||||||
|
| |||||||
Total Multiline Retail | 6,962,072 | |||||||
|
| |||||||
Oil, Gas & Consumable Fuels - 2.7% |
| |||||||
Cabot Oil & Gas Corp. | 27,058 | 950,818 | ||||||
EOG Resources, Inc. | 18,333 | 2,013,147 | ||||||
Peabody Energy Corp. | 57,241 | 1,780,768 | ||||||
Pioneer Natural Resources Co. | 15,538 | 1,799,611 | ||||||
Southwestern Energy Co.* | 68,262 | 2,155,714 | ||||||
|
| |||||||
Total Oil, Gas & Consumable Fuels | 8,700,058 | |||||||
|
| |||||||
Personal Products - 0.5% |
| |||||||
Estee Lauder Cos., Inc. (The) — Class A | 23,976 | 1,566,832 | ||||||
|
| |||||||
Total Personal Products | 1,566,832 | |||||||
|
| |||||||
Pharmaceuticals - 4.5% |
| |||||||
Abbott Laboratories | 42,397 | 2,631,158 | ||||||
Allergan, Inc. | 19,463 | 1,868,448 | ||||||
Johnson & Johnson, Inc. | 20,360 | 1,325,232 | ||||||
Mylan, Inc.* | 153,921 | 3,341,625 | ||||||
Perrigo Co. | 30,832 | 3,234,277 | ||||||
Watson Pharmaceuticals, Inc.* | 26,385 | 1,988,374 | ||||||
|
| |||||||
Total Pharmaceuticals | 14,389,114 | |||||||
|
| |||||||
Professional Services - 0.6% |
| |||||||
Dun & Bradstreet Corp. (The) | 24,196 | 1,881,965 | ||||||
|
| |||||||
Total Professional Services | 1,881,965 | |||||||
|
| |||||||
Real Estate Investment Trusts (REITs) - 1.2% |
| |||||||
American Tower Corp. | 42,444 | 2,783,477 | ||||||
Ventas, Inc. | 20,191 | 1,187,029 | ||||||
|
| |||||||
Total Real Estate Investment Trusts (REITs) | 3,970,506 | |||||||
|
| |||||||
Road & Rail - 0.5% |
| |||||||
Union Pacific Corp. | 14,940 | 1,679,854 | ||||||
|
| |||||||
Total Road & Rail | 1,679,854 | |||||||
|
| |||||||
Semiconductors & Semiconductor Equipment - 4.2% |
| |||||||
Altera Corp. | 72,862 | 2,591,701 | ||||||
Broadcom Corp. — Class A* | 74,358 | 2,721,503 | ||||||
First Solar, Inc.* | 87,999 | 1,619,182 | ||||||
KLA-Tencor Corp. | 51,563 | 2,689,010 | ||||||
Microchip Technology, Inc. | 60,791 | 2,148,354 | ||||||
Xilinx, Inc. | 47,223 | 1,717,973 | ||||||
|
| |||||||
Total Semiconductors & Semiconductor Equipment | 13,487,723 | |||||||
|
| |||||||
Software - 4.5% |
| |||||||
Citrix Systems, Inc.* | 29,090 | 2,490,395 | ||||||
Intuit, Inc. | 42,683 | 2,474,333 | ||||||
| See Notes to Financial Statements. | GUGGENHEIM ETFS SEMI-ANNUAL REPORT | 19 |
Table of Contents
| SCHEDULE OF INVESTMENTS (Unaudited) (concluded) | April 30, 2012 |
GUGGENHEIM S&P 500 PURE GROWTH ETF
| SHARES | MARKET VALUE | |||||||
Oracle Corp. | 60,779 | $ | 1,786,295 | |||||
Red Hat, Inc.* | 63,234 | 3,769,379 | ||||||
Salesforce.com, Inc.* | 26,129 | 4,069,069 | ||||||
|
| |||||||
Total Software | 14,589,471 | |||||||
|
| |||||||
Specialty Retail - 6.1% |
| |||||||
AutoZone, Inc.* | 10,434 | 4,133,534 | ||||||
Bed Bath & Beyond, Inc.* | 34,183 | 2,406,141 | ||||||
O’Reilly Automotive, Inc.* | 42,429 | 4,474,562 | ||||||
Ross Stores, Inc. | 66,261 | 4,081,015 | ||||||
Tiffany & Co. | 20,297 | 1,389,533 | ||||||
TJX Cos., Inc. | 72,417 | 3,020,513 | ||||||
|
| |||||||
Total Specialty Retail | 19,505,298 | |||||||
|
| |||||||
Textiles, Apparel & Luxury Goods - 3.9% |
| |||||||
Coach, Inc. | 50,057 | 3,662,170 | ||||||
Fossil, Inc.* | 27,175 | 3,550,957 | ||||||
NIKE, Inc. — Class B | 16,625 | 1,859,839 | ||||||
Ralph Lauren Corp. | 12,734 | 2,193,686 | ||||||
V.F. Corp. | 8,662 | 1,317,057 | ||||||
|
| |||||||
Total Textiles, Apparel & Luxury Goods | 12,583,709 | |||||||
|
| |||||||
Tobacco - 0.9% |
| |||||||
Philip Morris International, Inc. | 31,428 | 2,813,120 | ||||||
|
| |||||||
Total Tobacco | 2,813,120 | |||||||
|
| |||||||
Trading Companies & Distributors - 0.7% |
| |||||||
W.W. Grainger, Inc. | 11,416 | 2,372,473 | ||||||
|
| |||||||
Total Trading Companies & Distributors | 2,372,473 | |||||||
|
| |||||||
Wireless Telecommunication Services - 1.0% |
| |||||||
Crown Castle International Corp.* | 57,312 | 3,244,432 | ||||||
|
| |||||||
Total Wireless Telecommunication Services | 3,244,432 | |||||||
|
| |||||||
Total Common Stocks | 320,990,283 | |||||||
|
| |||||||
SHORT TERM INVESTMENTS - 0.1% |
| |||||||
SSgA Government Money Market Fund | 277,954 | 277,954 | ||||||
|
| |||||||
Total Short Term Investments | 277,954 | |||||||
|
| |||||||
Total Investments - 100.0%a |
| 321,268,237 | ||||||
|
| |||||||
Other Assets and Liabilities, net - 0.0%b |
| 23,522 | ||||||
|
| |||||||
Net Assets - 100.0% | $ | 321,291,759 | ||||||
|
| |||||||
| * | Non-Income Producing Security. |
| a | Unless otherwise indicated, the values of the Portfolio are determined based on Level 1 inputs. |
| b | Amount represents less than 0.05% of net assets. |
| 20 | GUGGENHEIM ETFS SEMI-ANNUAL REPORT | See Notes to Financial Statements. |
Table of Contents
| SCHEDULE OF INVESTMENTS (Unaudited) | April 30, 2012 |
GUGGENHEIM S&P MIDCAP 400 PURE VALUE ETF
| SHARES | MARKET VALUE | |||||||
COMMON STOCKS - 99.8% |
| |||||||
Aerospace & Defense - 4.9% |
| |||||||
Exelis, Inc. | 91,744 | $ | 1,057,808 | |||||
Huntington Ingalls Industries, Inc.* | 17,093 | 674,319 | ||||||
|
| |||||||
Total Aerospace & Defense | 1,732,127 | |||||||
|
| |||||||
Air Freight & Logistics - 1.0% |
| |||||||
UTi Worldwide, Inc. | 20,588 | 343,202 | ||||||
|
| |||||||
Total Air Freight & Logistics | 343,202 | |||||||
|
| |||||||
Airlines - 1.8% |
| |||||||
JetBlue Airways Corp.* | 136,531 | 648,522 | ||||||
|
| |||||||
Total Airlines | 648,522 | |||||||
|
| |||||||
Automobiles - 0.9% |
| |||||||
Thor Industries, Inc. | 9,897 | 334,816 | ||||||
|
| |||||||
Total Automobiles | 334,816 | |||||||
|
| |||||||
Capital Markets - 2.8% |
| |||||||
Apollo Investment Corp. | 39,339 | 285,208 | ||||||
Janus Capital Group, Inc. | 33,683 | 255,317 | ||||||
Jefferies Group, Inc. | 28,195 | 449,146 | ||||||
|
| |||||||
Total Capital Markets | 989,671 | |||||||
|
| |||||||
Chemicals - 1.7% |
| |||||||
Ashland, Inc. | 3,820 | 251,623 | ||||||
Cabot Corp. | 3,948 | 170,277 | ||||||
Cytec Industries, Inc. | 2,736 | 173,928 | ||||||
|
| |||||||
Total Chemicals | 595,828 | |||||||
|
| |||||||
Commercial Banks - 4.4% |
| |||||||
Associated Banc-Corp. | 16,746 | 223,224 | ||||||
BancorpSouth, Inc. | 30,250 | 407,467 | ||||||
First Niagara Financial Group, Inc. | 35,720 | 319,337 | ||||||
Fulton Financial Corp. | 13,119 | 137,618 | ||||||
International Bancshares Corp. | 10,068 | 198,642 | ||||||
TCF Financial Corp. | 25,885 | 296,901 | ||||||
|
| |||||||
Total Commercial Banks | 1,583,189 | |||||||
|
| |||||||
Commercial Services & Supplies - 0.6% |
| |||||||
Brink’s Co. (The) | 8,554 | 217,272 | ||||||
|
| |||||||
Total Commercial Services & Supplies | 217,272 | |||||||
|
| |||||||
Communications Equipment - 1.0% |
| |||||||
Tellabs, Inc. | 91,943 | 346,625 | ||||||
|
| |||||||
Total Communications Equipment | 346,625 | |||||||
|
| |||||||
Construction & Engineering - 4.1% |
| |||||||
Aecom Technology Corp.* | 19,939 | 440,054 | ||||||
KBR, Inc. | 7,604 | 257,471 | ||||||
URS Corp. | 18,486 | 763,657 | ||||||
|
| |||||||
Total Construction & Engineering | 1,461,182 | |||||||
|
| |||||||
Containers & Packaging - 0.6% |
| |||||||
Greif, Inc. — Class A | 3,858 | 206,943 | ||||||
|
| |||||||
Total Containers & Packaging | 206,943 | |||||||
|
| |||||||
Diversified Consumer Services - 1.1% |
| |||||||
Regis Corp. | 20,914 | 383,772 | ||||||
|
| |||||||
Total Diversified Consumer Services | 383,772 | |||||||
|
| |||||||
| SHARES | MARKET VALUE | |||||||
Electric Utilities - 0.9% |
| |||||||
Great Plains Energy, Inc. | 8,517 | $ | 173,917 | |||||
NV Energy, Inc. | 10,047 | 167,283 | ||||||
|
| |||||||
Total Electric Utilities | 341,200 | |||||||
|
| |||||||
Electrical Equipment - 1.7% |
| |||||||
General Cable Corp.* | 21,141 | 622,391 | ||||||
|
| |||||||
Total Electrical Equipment | 622,391 | |||||||
|
| |||||||
Electronic Equipment, Instruments & |
| |||||||
Arrow Electronics, Inc.* | 15,738 | 661,783 | ||||||
Avnet, Inc.* | 19,875 | 717,090 | ||||||
Ingram Micro, Inc. — Class A* | 38,861 | 756,235 | ||||||
Itron, Inc.* | 7,767 | 316,893 | ||||||
Tech Data Corp.* | 11,834 | 636,551 | ||||||
Vishay Intertechnology, Inc.* | 31,449 | 352,858 | ||||||
|
| |||||||
Total Electronic Equipment, Instruments & Components | 3,441,410 | |||||||
|
| |||||||
Food & Staples Retailing - 0.5% |
| |||||||
Harris Teeter Supermarkets, Inc. | 4,407 | 167,334 | ||||||
|
| |||||||
Total Food & Staples Retailing | 167,334 | |||||||
|
| |||||||
Food Products - 1.2% |
| |||||||
Smithfield Foods, Inc.* | 20,095 | 421,191 | ||||||
|
| |||||||
Total Food Products | 421,191 | |||||||
|
| |||||||
Gas Utilities - 1.0% |
| |||||||
Atmos Energy Corp. | 4,855 | 158,176 | ||||||
UGI Corp. | 6,310 | 184,126 | ||||||
|
| |||||||
Total Gas Utilities | 342,302 | |||||||
|
| |||||||
Health Care Providers & Services - 6.9% |
| |||||||
Community Health Systems, Inc.* | 38,272 | 931,540 | ||||||
Health Management Associates, Inc. — Class A* | 23,164 | 166,781 | ||||||
Health Net, Inc.* | 14,893 | 530,340 | ||||||
LifePoint Hospitals, Inc.* | 6,950 | 271,189 | ||||||
Omnicare, Inc. | 4,780 | 166,535 | ||||||
Owens & Minor, Inc. | 13,465 | 393,717 | ||||||
|
| |||||||
Total Health Care Providers & Services | 2,460,102 | |||||||
|
| |||||||
Hotels, Restaurants & Leisure - 1.0% |
| |||||||
Bob Evans Farms, Inc. | 4,717 | 180,378 | ||||||
Wendy’s Co. (The) | 37,066 | 180,512 | ||||||
|
| |||||||
Total Hotels, Restaurants & Leisure | 360,890 | |||||||
|
| |||||||
Household Durables - 1.3% |
| |||||||
KB Home | 27,431 | 238,101 | ||||||
Mohawk Industries, Inc.* | 3,265 | 218,820 | ||||||
|
| |||||||
Total Household Durables | 456,921 | |||||||
|
| |||||||
Insurance - 18.5% |
| |||||||
American Financial Group, Inc. | 9,270 | 360,788 | ||||||
Aspen Insurance Holdings Ltd. | 18,954 | 536,777 | ||||||
Everest Re Group Ltd. | 4,191 | 415,328 | ||||||
Fidelity National Financial, Inc. —Class A | 19,920 | 383,859 | ||||||
First American Financial Corp. | 62,584 | 1,048,282 | ||||||
| See Notes to Financial Statements. | GUGGENHEIM ETFS SEMI-ANNUAL REPORT | 21 |
Table of Contents
| SCHEDULE OF INVESTMENTS (Unaudited) (continued) | April 30, 2012 |
GUGGENHEIM S&P MIDCAP 400 PURE VALUE ETF
| SHARES | MARKET VALUE | |||||||
Hanover Insurance Group, Inc. (The) | 15,103 | $ | 609,557 | |||||
HCC Insurance Holdings, Inc. | 9,023 | 288,375 | ||||||
Kemper Corp. | 14,977 | 449,160 | ||||||
Old Republic International Corp. | 56,020 | 557,399 | ||||||
Protective Life Corp. | 25,451 | 744,696 | ||||||
Reinsurance Group of America, Inc. | 10,446 | 607,331 | ||||||
StanCorp Financial Group, Inc. | 11,170 | 428,705 | ||||||
W.R. Berkley Corp. | 4,198 | 158,097 | ||||||
|
| |||||||
Total Insurance | 6,588,354 | |||||||
|
| |||||||
Internet Software & Services - 0.5% |
| |||||||
Monster Worldwide, Inc.* | 19,087 | 164,721 | ||||||
|
| |||||||
Total Internet Software & Services | 164,721 | |||||||
|
| |||||||
IT Services - 0.6% |
| |||||||
CoreLogic, Inc.* | 12,319 | 205,727 | ||||||
|
| |||||||
Total IT Services | 205,727 | |||||||
|
| |||||||
Machinery - 6.6% |
| |||||||
AGCO Corp.* | 3,042 | 141,666 | ||||||
Harsco Corp. | 8,512 | 189,818 | ||||||
ITT Corp. | 45,514 | 1,022,244 | ||||||
Oshkosh Corp.* | 28,862 | 658,919 | ||||||
Terex Corp.* | 14,098 | 319,179 | ||||||
|
| |||||||
Total Machinery | 2,331,826 | |||||||
|
| |||||||
Media - 2.4% |
| |||||||
New York Times Co. (The) — Class A* | 37,256 | 235,086 | ||||||
Scholastic Corp. | 10,837 | 331,070 | ||||||
Valassis Communications, Inc.* | 14,854 | 297,080 | ||||||
|
| |||||||
Total Media | 863,236 | |||||||
|
| |||||||
Metals & Mining - 2.7% |
| |||||||
Commercial Metals Co. | 20,332 | 300,507 | ||||||
Reliance Steel & Aluminum Co. | 4,071 | 227,528 | ||||||
Steel Dynamics, Inc. | 18,683 | 238,582 | ||||||
Worthington Industries, Inc. | 11,030 | 196,775 | ||||||
|
| |||||||
Total Metals & Mining | 963,392 | |||||||
|
| |||||||
Multiline Retail - 0.6% |
| |||||||
Saks, Inc.* | 20,047 | 219,715 | ||||||
|
| |||||||
Total Multiline Retail | 219,715 | |||||||
|
| |||||||
Oil, Gas & Consumable Fuels - 2.8% |
| |||||||
Arch Coal, Inc. | 10,166 | 99,220 | ||||||
HollyFrontier Corp. | 11,006 | 339,205 | ||||||
Patriot Coal Corp.* | 15,333 | 89,391 | ||||||
Quicksilver Resources, Inc.* | 16,861 | 79,247 | ||||||
World Fuel Services Corp. | 8,870 | 390,812 | ||||||
|
| |||||||
Total Oil, Gas & Consumable Fuels | 997,875 | |||||||
|
| |||||||
Paper & Forest Products - 0.5% |
| |||||||
Louisiana-Pacific Corp.* | 20,287 | 183,597 | ||||||
|
| |||||||
Total Paper & Forest Products | 183,597 | |||||||
|
| |||||||
| SHARES | MARKET VALUE | |||||||
Professional Services - 1.0% |
| |||||||
Manpower, Inc. | 8,254 | $ | 351,620 | |||||
|
| |||||||
Total Professional Services | 351,620 | |||||||
|
| |||||||
Road & Rail - 0.9% |
| |||||||
Con-way, Inc. | 9,749 | 316,843 | ||||||
|
| |||||||
Total Road & Rail | 316,843 | |||||||
|
| |||||||
Semiconductors & Semiconductor Equipment - 2.4% |
| |||||||
Fairchild Semiconductor International, Inc.* | 10,948 | 155,133 | ||||||
International Rectifier Corp.* | 9,960 | 217,427 | ||||||
MEMC Electronic Materials, Inc.* | 138,107 | 495,804 | ||||||
|
| |||||||
Total Semiconductors & Semiconductor Equipment | 868,364 | |||||||
|
| |||||||
Specialty Retail - 5.6% |
| |||||||
Barnes & Noble, Inc.* | 21,440 | 444,880 | ||||||
Collective Brands, Inc.* | 43,318 | 899,715 | ||||||
Office Depot, Inc.* | 143,842 | 437,280 | ||||||
RadioShack Corp. | 41,855 | 216,809 | ||||||
|
| |||||||
Total Specialty Retail | 1,998,684 | |||||||
|
| |||||||
Thrifts & Mortgage Finance - 3.3% |
| |||||||
Astoria Financial Corp. | 64,901 | 628,890 | ||||||
New York Community Bancorp, Inc. | 15,577 | 210,134 | ||||||
Washington Federal, Inc. | 18,283 | 320,684 | ||||||
|
| |||||||
Total Thrifts & Mortgage Finance | 1,159,708 | |||||||
|
| |||||||
Tobacco - 1.2% |
| |||||||
Universal Corp. | 9,183 | 420,857 | ||||||
|
| |||||||
Total Tobacco | 420,857 | |||||||
|
| |||||||
Wireless Telecommunication Services - 1.1% |
| |||||||
Telephone & Data Systems, Inc. | 16,596 | 403,117 | ||||||
|
| |||||||
Total Wireless Telecommunication Services | 403,117 | |||||||
|
| |||||||
Total Common Stocks | 35,494,526 | |||||||
|
| |||||||
SHORT TERM INVESTMENTS - 0.2% |
| |||||||
SSgA Government Money Market Fund | 64,721 | 64,721 | ||||||
|
| |||||||
Total Short Term Investments | 64,721 | |||||||
|
| |||||||
Total Investments - 100.0%a | 35,559,247 | |||||||
|
| |||||||
Other Assets and Liabilities, |
| (16,056 | ) | |||||
|
| |||||||
Net Assets - 100.0% | $ | 35,543,191 | ||||||
|
| |||||||
| 22 | GUGGENHEIM ETFS SEMI-ANNUAL REPORT | See Notes to Financial Statements. |
Table of Contents
| SCHEDULE OF INVESTMENTS (Unaudited) (concluded) | April 30, 2012 |
GUGGENHEIM S&P MIDCAP 400 PURE VALUE ETF
| * | Non-Income Producing Security. |
| a | Unless otherwise indicated, the values of the Portfolio are determined based on Level 1 inputs. |
| b | Amount represents less than 0.05% of net assets. |
| See Notes to Financial Statements. | GUGGENHEIM ETFS SEMI-ANNUAL REPORT | 23 |
Table of Contents
| SCHEDULE OF INVESTMENTS (Unaudited) | April 30, 2012 |
GUGGENHEIM S&P MIDCAP 400 PURE GROWTH ETF
| SHARES | MARKET VALUE | |||||||
COMMON STOCKS - 99.9% |
| |||||||
Aerospace & Defense - 1.6% |
| |||||||
Triumph Group, Inc. | 150,829 | $ | 9,475,078 | |||||
|
| |||||||
Total Aerospace & Defense | 9,475,078 | |||||||
|
| |||||||
Airlines - 1.0% |
| |||||||
Alaska Air Group, Inc.* | 179,465 | 6,065,917 | ||||||
|
| |||||||
Total Airlines | 6,065,917 | |||||||
|
| |||||||
Auto Components - 0.3% |
| |||||||
Gentex Corp. | 72,352 | 1,589,573 | ||||||
|
| |||||||
Total Auto Components | 1,589,573 | |||||||
|
| |||||||
Beverages - 1.6% |
| |||||||
Monster Beverage Corp.* | 152,462 | 9,903,932 | ||||||
|
| |||||||
Total Beverages | 9,903,932 | |||||||
|
| |||||||
Biotechnology - 4.9% |
| |||||||
Regeneron Pharmaceuticals, Inc.* | 157,567 | 21,312,513 | ||||||
United Therapeutics Corp.* | 181,459 | 7,938,831 | ||||||
|
| |||||||
Total Biotechnology | 29,251,344 | |||||||
|
| |||||||
Chemicals - 3.0% |
| |||||||
Albemarle Corp. | 74,141 | 4,841,407 | ||||||
Intrepid Potash, Inc.* | 169,483 | 4,211,653 | ||||||
NewMarket Corp. | 40,771 | 9,100,903 | ||||||
|
| |||||||
Total Chemicals | 18,153,963 | |||||||
|
| |||||||
Commercial Banks - 1.0% |
| |||||||
Signature Bank* | 90,806 | 5,965,046 | ||||||
|
| |||||||
Total Commercial Banks | 5,965,046 | |||||||
|
| |||||||
Commercial Services & Supplies - 2.2% |
| |||||||
Clean Harbors, Inc.* | 110,660 | 7,551,439 | ||||||
Copart, Inc.* | 204,403 | 5,398,283 | ||||||
|
| |||||||
Total Commercial Services & Supplies | 12,949,722 | |||||||
|
| |||||||
Communications Equipment - 1.1% |
| |||||||
ADTRAN, Inc. | 115,761 | 3,533,026 | ||||||
Riverbed Technology, Inc.* | 164,288 | 3,241,402 | ||||||
|
| |||||||
Total Communications Equipment | 6,774,428 | |||||||
|
| |||||||
Containers & Packaging - 2.0% |
| |||||||
AptarGroup, Inc. | 85,400 | 4,655,154 | ||||||
Rock-Tenn Co. — | 117,789 | 7,341,788 | ||||||
|
| |||||||
Total Containers & Packaging | 11,996,942 | |||||||
|
| |||||||
Distributors - 1.0% |
| |||||||
LKQ Corp.* | 173,114 | 5,790,663 | ||||||
|
| |||||||
Total Distributors | 5,790,663 | |||||||
|
| |||||||
Diversified Consumer Services - 3.8% |
| |||||||
ITT Educational Services, Inc.* | 203,675 | 13,446,623 | ||||||
Strayer Education, Inc. | 97,716 | 9,642,615 | ||||||
|
| |||||||
Total Diversified Consumer Services | 23,089,238 | |||||||
|
| |||||||
Diversified Financial Services - 0.6% |
| |||||||
MSCI, Inc. — | 104,825 | 3,835,547 | ||||||
|
| |||||||
Total Diversified Financial Services | 3,835,547 | |||||||
|
| |||||||
| SHARES | MARKET VALUE | |||||||
Electrical Equipment - 0.6% |
| |||||||
AMETEK, Inc. | 74,980 | $ | 3,773,743 | |||||
|
| |||||||
Total Electrical Equipment | 3,773,743 | |||||||
|
| |||||||
Electronic Equipment, Instruments & Components - 0.4% |
| |||||||
Trimble Navigation, Ltd.* | 48,879 | 2,646,309 | ||||||
|
| |||||||
Total Electronic Equipment, Instruments & Components | 2,646,309 | |||||||
|
| |||||||
Energy Equipment & Services - 3.5% |
| |||||||
CARBO Ceramics, Inc. | 53,512 | 4,499,824 | ||||||
Dresser-Rand Group, Inc.* | 98,282 | 4,784,368 | ||||||
Dril-Quip, Inc.* | 61,507 | 4,144,957 | ||||||
Oceaneering International, Inc. | 72,297 | 3,732,694 | ||||||
Oil States International, Inc.* | 52,033 | 4,140,786 | ||||||
|
| |||||||
Total Energy Equipment & Services | 21,302,629 | |||||||
|
| |||||||
Food Products - 3.0% |
| |||||||
Corn Products International, Inc. | 98,326 | 5,610,482 | ||||||
Green Mountain Coffee Roasters, Inc.* | 153,380 | 7,477,275 | ||||||
Lancaster Colony Corp. | 76,859 | 5,011,975 | ||||||
|
| |||||||
Total Food Products | 18,099,732 | |||||||
|
| |||||||
Health Care Equipment & Supplies - 5.6% |
| |||||||
Cooper Cos., Inc. (The) | 70,598 | 6,224,626 | ||||||
Gen-Probe, Inc.* | 124,374 | 10,142,700 | ||||||
IDEXX Laboratories, Inc.* | 76,360 | 6,714,335 | ||||||
ResMed, Inc.* | 155,361 | 5,283,827 | ||||||
Thoratec Corp.* | 150,142 | 5,226,443 | ||||||
|
| |||||||
Total Health Care Equipment & Supplies | 33,591,931 | |||||||
|
| |||||||
Health Care Providers & Services - 7.2% |
| |||||||
AMERIGROUP Corp.* | 158,310 | 9,777,225 | ||||||
Catalyst Health Solutions, Inc.* | 167,618 | 14,477,167 | ||||||
Henry Schein, Inc.* | 86,290 | 6,621,895 | ||||||
HMS Holdings Corp.* | 160,519 | 3,862,087 | ||||||
Mednax, Inc.* | 125,728 | 8,831,135 | ||||||
|
| |||||||
Total Health Care Providers & Services | 43,569,509 | |||||||
|
| |||||||
Health Care Technology - 0.3% |
| |||||||
Allscripts Healthcare Solutions, Inc.* | 175,778 | 1,947,620 | ||||||
|
| |||||||
Total Health Care Technology | 1,947,620 | |||||||
|
| |||||||
Hotels, Restaurants & Leisure - 2.2% |
| |||||||
Life Time Fitness, Inc.* | 103,473 | 4,817,703 | ||||||
Panera Bread Co. — Class A* | 53,251 | 8,409,398 | ||||||
|
| |||||||
Total Hotels, Restaurants & Leisure | 13,227,101 | |||||||
|
| |||||||
Household Durables - 0.9% |
| |||||||
Tupperware Brands Corp. | 85,913 | 5,351,521 | ||||||
|
| |||||||
Total Household Durables | 5,351,521 | |||||||
|
| |||||||
Household Products - 0.5% |
| |||||||
Church & Dwight Co., Inc. | 64,645 | 3,283,966 | ||||||
|
| |||||||
Total Household Products | 3,283,966 | |||||||
|
| |||||||
| 24 | GUGGENHEIM ETFS SEMI-ANNUAL REPORT | See Notes to Financial Statements. |
Table of Contents
| SCHEDULE OF INVESTMENTS (Unaudited) (continued) | April 30, 2012 |
GUGGENHEIM S&P MIDCAP 400 PURE GROWTH ETF
| SHARES | MARKET VALUE | |||||||
Internet Software & Services - 3.8% |
| |||||||
Equinix, Inc.* | 83,283 | $ | 13,675,068 | |||||
Rackspace Hosting, Inc.* | 163,296 | 9,485,865 | ||||||
|
| |||||||
Total Internet Software & Services | 23,160,933 | |||||||
|
| |||||||
IT Services - 6.7% |
| |||||||
Alliance Data Systems Corp.* | 83,514 | 10,730,714 | ||||||
Gartner, Inc.* | 66,154 | 2,897,545 | ||||||
Global Payments, Inc. | 137,584 | 6,388,025 | ||||||
Jack Henry & Associates, Inc. | 95,627 | 3,247,493 | ||||||
NeuStar, Inc. — | 75,758 | 2,753,803 | ||||||
VeriFone Systems, Inc.* | 136,073 | 6,482,518 | ||||||
Wright Express Corp.* | 118,680 | 7,574,158 | ||||||
|
| |||||||
Total IT Services | 40,074,256 | |||||||
|
| |||||||
Leisure Equipment & Products - 1.1% |
| |||||||
Polaris Industries, Inc. | 80,850 | 6,422,724 | ||||||
|
| |||||||
Total Leisure Equipment & Products | 6,422,724 | |||||||
|
| |||||||
Life Sciences Tools & Services - 3.6% |
| |||||||
Bio-Rad Laboratories, Inc. — Class A* | 67,120 | 7,248,289 | ||||||
Covance, Inc.* | 76,401 | 3,572,510 | ||||||
Mettler-Toledo International, Inc.* | 33,187 | 5,951,093 | ||||||
Techne Corp. | 72,318 | 4,840,967 | ||||||
|
| |||||||
Total Life Sciences Tools & Services | 21,612,859 | |||||||
|
| |||||||
Machinery - 3.9% |
| |||||||
Donaldson Co., Inc. | 110,939 | 3,845,146 | ||||||
Gardner Denver, Inc. | 38,867 | 2,531,796 | ||||||
Valmont Industries, Inc. | 63,741 | 7,899,422 | ||||||
Wabtec Corp. | 62,325 | 4,847,639 | ||||||
Woodward, Inc. | 102,125 | 4,247,379 | ||||||
|
| |||||||
Total Machinery | 23,371,382 | |||||||
|
| |||||||
Metals & Mining - 1.0% |
| |||||||
Compass Minerals International, Inc. | 77,564 | 5,935,197 | ||||||
|
| |||||||
Total Metals & Mining | 5,935,197 | |||||||
|
| |||||||
Office Electronics - 0.6% |
| |||||||
Zebra Technologies Corp. — Class A* | 95,432 | 3,701,807 | ||||||
|
| |||||||
Total Office Electronics | 3,701,807 | |||||||
|
| |||||||
Oil, Gas & Consumable Fuels - 2.4% |
| |||||||
Bill Barrett Corp.* | 184,674 | 4,428,482 | ||||||
Cimarex Energy Co. | 67,617 | 4,673,011 | ||||||
Northern Oil and Gas, Inc.* | 164,323 | 3,192,796 | ||||||
SM Energy Co. | 33,501 | 2,214,751 | ||||||
|
| |||||||
Total Oil, Gas & Consumable Fuels | 14,509,040 | |||||||
|
| |||||||
Pharmaceuticals - 1.9% |
| |||||||
Endo Pharmaceuticals Holdings, Inc.* | 170,786 | 6,001,420 | ||||||
Medicis Pharmaceutical Corp. — Class A | 135,113 | 5,197,797 | ||||||
|
| |||||||
Total Pharmaceuticals | 11,199,217 | |||||||
|
| |||||||
| SHARES | MARKET VALUE | |||||||
Professional Services - 0.6% |
| |||||||
FTI Consulting, Inc.* | 96,572 | $ | 3,509,427 | |||||
|
| |||||||
Total Professional Services | 3,509,427 | |||||||
|
| |||||||
Real Estate Investment Trusts (REITs) - 2.2% |
| |||||||
Essex Property Trust, Inc. | 17,312 | 2,734,777 | ||||||
Federal Realty Investment Trust | 37,673 | 3,792,164 | ||||||
Home Properties, Inc. | 43,492 | 2,655,187 | ||||||
Taubman Centers, Inc. | 51,925 | 4,007,571 | ||||||
|
| |||||||
Total Real Estate Investment Trusts (REITs) | 13,189,699 | |||||||
|
| |||||||
Road & Rail - 0.7% |
| |||||||
JB Hunt Transport Services, Inc. | 79,874 | 4,419,428 | ||||||
|
| |||||||
Total Road & Rail | 4,419,428 | |||||||
|
| |||||||
Semiconductors & Semiconductor |
| |||||||
Lam Research Corp.* | 132,752 | 5,529,121 | ||||||
Semtech Corp.* | 180,500 | 4,920,430 | ||||||
Silicon Laboratories, Inc.* | 171,725 | 6,094,520 | ||||||
|
| |||||||
Total Semiconductors & Semiconductor Equipment | 16,544,071 | |||||||
|
| |||||||
Software - 7.7% |
| |||||||
ACI Worldwide, Inc.* | 88,596 | 3,531,437 | ||||||
Advent Software, Inc.* | 81,483 | 2,199,226 | ||||||
ANSYS, Inc.* | 93,889 | 6,297,135 | ||||||
Concur Technologies, Inc.* | 95,902 | 5,424,217 | ||||||
Factset Research Systems, Inc. | 64,527 | 6,766,301 | ||||||
Informatica Corp.* | 163,186 | 7,509,820 | ||||||
MICROS Systems, Inc.* | 69,759 | 3,964,404 | ||||||
Rovi Corp.* | 210,735 | 6,027,021 | ||||||
Solera Holdings, Inc. | 102,696 | 4,615,158 | ||||||
|
| |||||||
Total Software | 46,334,719 | |||||||
|
| |||||||
Specialty Retail - 4.3% |
| |||||||
Advance Auto Parts, Inc. | 108,665 | 9,975,447 | ||||||
PetSmart, Inc. | 114,543 | 6,673,275 | ||||||
Tractor Supply Co. | 96,960 | 9,541,834 | ||||||
|
| |||||||
Total Specialty Retail | 26,190,556 | |||||||
|
| |||||||
Textiles, Apparel & Luxury Goods - 6.4% |
| |||||||
Carter’s, Inc.* | 171,178 | 9,294,965 | ||||||
Deckers Outdoor Corp.* | 86,768 | 4,426,036 | ||||||
PVH Corp. | 101,608 | 9,022,790 | ||||||
Under Armour, Inc. — Class A* | 101,254 | 9,915,804 | ||||||
Warnaco Group, Inc.(The)* | 108,407 | 5,741,235 | ||||||
|
| |||||||
Total Textiles, Apparel & Luxury Goods | 38,400,830 | |||||||
|
| |||||||
Trading Companies & Distributors - 2.0% |
| |||||||
MSC Industrial Direct Co. — Class A | 66,145 | 4,875,548 | ||||||
Watsco, Inc. | 97,517 | 7,016,348 | ||||||
|
| |||||||
Total Trading Companies & Distributors | 11,891,896 | |||||||
|
| |||||||
Total Common Stocks | 602,103,495 | |||||||
|
| |||||||
| See Notes to Financial Statements. | GUGGENHEIM ETFS SEMI-ANNUAL REPORT | 25 |
Table of Contents
| SCHEDULE OF INVESTMENTS (Unaudited) (concluded) | April 30, 2012 |
GUGGENHEIM S&P MIDCAP 400 PURE GROWTH ETF
| SHARES | MARKET VALUE | |||||||
SHORT TERM INVESTMENTS - 0.1% |
| |||||||
SSgA Government Money Market Fund | 567,728 | $ | 567,728 | |||||
|
| |||||||
Total Short Term Investments | 567,728 | |||||||
|
| |||||||
Total Investments - 100.0%a | 602,671,223 | |||||||
|
| |||||||
Other Assets and Liabilities, |
| (111,695 | ) | |||||
|
| |||||||
Net Assets - 100.0% |
| $ | 602,559,528 | |||||
|
| |||||||
| * | Non-Income Producing Security. |
| a | Unless otherwise indicated, the values of the Portfolio are determined based on Level 1 inputs. |
| b | Amount represents less than 0.05% of net assets. |
| 26 | GUGGENHEIM ETFS SEMI-ANNUAL REPORT | See Notes to Financial Statements. |
Table of Contents
| SCHEDULE OF INVESTMENTS (Unaudited) | April 30, 2012 |
GUGGENHEIM S&P SMALLCAP 600 PURE VALUE ETF
| SHARES | MARKET VALUE | |||||||
COMMON STOCKS - 99.9% |
| |||||||
Aerospace & Defense - 0.7% |
| |||||||
AAR Corp. | 33,950 | $ | 524,527 | |||||
|
| |||||||
Total Aerospace & Defense | 524,527 | |||||||
|
| |||||||
Airlines - 1.0% |
| |||||||
SkyWest, Inc. | 86,837 | 780,665 | ||||||
|
| |||||||
Total Airlines | 780,665 | |||||||
|
| |||||||
Auto Components - 1.1% |
| |||||||
Spartan Motors, Inc. | 108,007 | 469,830 | ||||||
Superior Industries International, Inc. | 21,861 | 374,042 | ||||||
|
| |||||||
Total Auto Components | 843,872 | |||||||
|
| |||||||
Automobiles - 0.6% |
| |||||||
Winnebago Industries, Inc.* | 45,132 | 440,037 | ||||||
|
| |||||||
Total Automobiles | 440,037 | |||||||
|
| |||||||
Building Products - 2.1% |
| |||||||
Apogee Enterprises, Inc. | 18,028 | 276,910 | ||||||
Griffon Corp. | 55,402 | 549,034 | ||||||
Universal Forest Products, Inc. | 20,606 | 770,664 | ||||||
|
| |||||||
Total Building Products | 1,596,608 | |||||||
|
| |||||||
Capital Markets - 2.4% |
| |||||||
Calamos Asset Management, Inc. — Class A | 16,816 | 217,263 | ||||||
Investment Technology Group, Inc.* | 45,122 | 460,244 | ||||||
Piper Jaffray Cos.* | 28,349 | 687,463 | ||||||
Prospect Capital Corp. | 18,678 | 203,964 | ||||||
SWS Group, Inc. | 45,375 | 255,915 | ||||||
|
| |||||||
Total Capital Markets | 1,824,849 | |||||||
|
| |||||||
Chemicals - 2.4% |
| |||||||
A. Schulman, Inc. | 26,327 | 647,907 | ||||||
OM Group, Inc.* | 31,106 | 750,277 | ||||||
PolyOne Corp. | 32,286 | 447,484 | ||||||
|
| |||||||
Total Chemicals | 1,845,668 | |||||||
|
| |||||||
Commercial Banks - 3.0% |
| |||||||
First BanCorp* | 94,755 | 403,656 | ||||||
First Commonwealth Financial Corp. | 70,860 | 455,630 | ||||||
PrivateBancorp, Inc. | 20,546 | 323,189 | ||||||
Susquehanna Bancshares, Inc. | 45,514 | 471,980 | ||||||
United Community Banks, Inc.* | 31,231 | 293,884 | ||||||
Wintrust Financial Corp. | 10,455 | 377,739 | ||||||
|
| |||||||
Total Commercial Banks | 2,326,078 | |||||||
|
| |||||||
Commercial Services & Supplies - 2.0% |
| |||||||
ABM Industries, Inc. | 18,802 | 437,711 | ||||||
G&K Services, Inc. — Class A | 8,016 | 263,406 | ||||||
Geo Group, Inc. (The)* | 10,793 | 223,523 | ||||||
United Stationers, Inc. | 11,145 | 316,072 | ||||||
Viad Corp. | 16,644 | 300,923 | ||||||
|
| |||||||
Total Commercial Services & Supplies | 1,541,635 | |||||||
|
| |||||||
| SHARES | MARKET VALUE | |||||||
Communications Equipment - 1.0% |
| |||||||
Bel Fuse, Inc. — Class B | 13,751 | $ | 244,630 | |||||
Black Box Corp. | 23,749 | 536,965 | ||||||
|
| |||||||
Total Communications Equipment | 781,595 | |||||||
|
| |||||||
Computers & Peripherals - 1.3% |
| |||||||
Avid Technology, Inc.* | 31,789 | 276,246 | ||||||
Intevac, Inc.* | 58,301 | 469,906 | ||||||
Novatel Wireless, Inc.* | 96,518 | 278,937 | ||||||
|
| |||||||
Total Computers & Peripherals | 1,025,089 | |||||||
|
| |||||||
Construction & Engineering - 2.4% |
| |||||||
Aegion Corp.* | 22,578 | 412,048 | ||||||
Comfort Systems USA, Inc. | 33,946 | 359,149 | ||||||
EMCOR Group, Inc. | 7,969 | 233,651 | ||||||
Orion Marine Group, Inc.* | 118,541 | 820,304 | ||||||
|
| |||||||
Total Construction & Engineering | 1,825,152 | |||||||
|
| |||||||
Distributors - 2.2% |
| |||||||
VOXX International Corp.* | 134,063 | 1,701,259 | ||||||
|
| |||||||
Total Distributors | 1,701,259 | |||||||
|
| |||||||
Diversified Consumer Services - 3.3% |
| |||||||
Career Education Corp.* | 142,300 | 1,014,599 | ||||||
Corinthian Colleges, Inc.* | 159,398 | 612,089 | ||||||
Lincoln Educational Services Corp. | 123,945 | 909,756 | ||||||
|
| |||||||
Total Diversified Consumer Services | 2,536,444 | |||||||
|
| |||||||
Electrical Equipment - 0.7% |
| |||||||
EnerSys* | 10,962 | 383,122 | ||||||
Powell Industries, Inc.* | 5,775 | 188,323 | ||||||
|
| |||||||
Total Electrical Equipment | 571,445 | |||||||
|
| |||||||
Electronic Equipment, Instruments & Components - 7.2% |
| |||||||
Anixter International, Inc.* | 3,749 | 257,106 | ||||||
Benchmark Electronics, Inc.* | 51,724 | 821,377 | ||||||
Brightpoint, Inc.* | 39,467 | 241,538 | ||||||
Checkpoint Systems, Inc.* | 32,777 | 359,236 | ||||||
CTS Corp. | 38,345 | 411,442 | ||||||
Insight Enterprises, Inc.* | 43,897 | 891,548 | ||||||
Plexus Corp.* | 9,200 | 297,804 | ||||||
Radisys Corp.* | 108,953 | 691,852 | ||||||
Scansource, Inc.* | 10,885 | 358,770 | ||||||
SYNNEX Corp.* | 25,603 | 975,218 | ||||||
TTM Technologies, Inc.* | 22,531 | 232,745 | ||||||
|
| |||||||
Total Electronic Equipment, Instruments & Components | 5,538,636 | |||||||
|
| |||||||
Energy Equipment & Services - 1.8% |
| |||||||
Exterran Holdings, Inc.* | 55,942 | 755,777 | ||||||
Matrix Service Co.* | 45,411 | 619,860 | ||||||
|
| |||||||
Total Energy Equipment & Services | 1,375,637 | |||||||
|
| |||||||
Food & Staples Retailing - 2.6% |
| |||||||
Andersons, Inc. (The) | 12,519 | 630,957 | ||||||
Nash Finch Co. | 28,879 | 724,863 | ||||||
Spartan Stores, Inc. | 33,964 | 619,164 | ||||||
|
| |||||||
Total Food & Staples Retailing | 1,974,984 | |||||||
|
| |||||||
| See Notes to Financial Statements. | GUGGENHEIM ETFS SEMI-ANNUAL REPORT | 27 |
Table of Contents
| SCHEDULE OF INVESTMENTS (Unaudited) (continued) | April 30, 2012 |
GUGGENHEIM S&P SMALLCAP 600 PURE VALUE ETF
| SHARES | MARKET VALUE | |||||||
Food Products - 1.1% |
| |||||||
Seneca Foods Corp. — Class A* | 36,256 | $ | 844,402 | |||||
|
| |||||||
Total Food Products | 844,402 | |||||||
|
| |||||||
Gas Utilities - 0.2% |
| |||||||
Laclede Group, Inc. (The) | 4,731 | 186,307 | ||||||
|
| |||||||
Total Gas Utilities | 186,307 | |||||||
|
| |||||||
Health Care Equipment & Supplies - 1.1% |
| |||||||
Invacare Corp. | 20,390 | 323,182 | ||||||
Natus Medical, Inc.* | 22,219 | 271,961 | ||||||
Symmetry Medical, Inc.* | 30,986 | 220,310 | ||||||
|
| |||||||
Total Health Care Equipment & Supplies | 815,453 | |||||||
|
| |||||||
Health Care Providers & Services - 10.7% |
| |||||||
Almost Family, Inc.* | 45,471 | 1,108,583 | ||||||
Amedisys, Inc.* | 95,407 | 1,405,345 | ||||||
Cross Country Healthcare, Inc.* | 122,814 | 566,173 | ||||||
Gentiva Health Services, Inc.* | 176,481 | 1,461,263 | ||||||
Healthways, Inc.* | 148,923 | 993,316 | ||||||
Kindred Healthcare, Inc.* | 85,478 | 824,008 | ||||||
LHC Group, Inc.* | 41,554 | 735,921 | ||||||
Molina Healthcare, Inc.* | 26,482 | 679,263 | ||||||
PharMerica Corp.* | 37,688 | 447,357 | ||||||
|
| |||||||
Total Health Care Providers & Services | 8,221,229 | |||||||
|
| |||||||
Hotels, Restaurants & Leisure - 5.0% |
| |||||||
Boyd Gaming Corp.* | 133,809 | 1,028,991 | ||||||
Jack in the Box, Inc.* | 8,162 | 185,441 | ||||||
Marriott Vacations Worldwide Corp.* | 51,883 | 1,532,105 | ||||||
Red Robin Gourmet Burgers, Inc.* | 6,364 | 226,940 | ||||||
Ruby Tuesday, Inc.* | 92,788 | 630,959 | ||||||
Ruth’s Hospitality Group, Inc* | 39,208 | 271,319 | ||||||
|
| |||||||
Total Hotels, Restaurants & Leisure | 3,875,755 | |||||||
|
| |||||||
Household Durables - 3.0% |
| |||||||
American Greetings Corp. — Class A | 44,408 | 710,528 | ||||||
La-Z-Boy, Inc.* | 21,835 | 329,054 | ||||||
M/I Homes, Inc.* | 37,494 | 498,670 | ||||||
Standard Pacific Corp.* | 106,220 | 537,473 | ||||||
Universal Electronics, Inc.* | 13,532 | 228,961 | ||||||
|
| |||||||
Total Household Durables | 2,304,686 | |||||||
|
| |||||||
Household Products - 0.9% |
| |||||||
Central Garden and Pet Co. — Class A* | 68,173 | 728,769 | ||||||
|
| |||||||
Total Household Products | 728,769 | |||||||
|
| |||||||
Industrial Conglomerates - 0.3% |
| |||||||
Standex International Corp. | 5,283 | 232,769 | ||||||
|
| |||||||
Total Industrial Conglomerates | 232,769 | |||||||
|
| |||||||
Insurance - 6.6% |
| |||||||
Delphi Financial Group, Inc. — Class A | 11,494 | 522,057 | ||||||
| SHARES | MARKET VALUE | |||||||
Horace Mann Educators Corp. | 57,335 | $ | 1,006,229 | |||||
Meadowbrook Insurance Group, Inc. | 31,535 | 278,454 | ||||||
National Financial Partners Corp.* | 13,172 | 194,287 | ||||||
Presidential Life Corp. | 47,020 | 544,492 | ||||||
Safety Insurance Group, Inc. | 5,859 | 233,481 | ||||||
Selective Insurance Group, Inc. | 26,119 | 456,821 | ||||||
Stewart Information Services Corp. | 71,132 | 1,047,063 | ||||||
Tower Group, Inc. | 22,913 | 494,463 | ||||||
United Fire Group, Inc. | 20,698 | 356,420 | ||||||
|
| |||||||
Total Insurance | 5,133,767 | |||||||
|
| |||||||
Internet Software & Services - 0.5% |
| |||||||
United Online, Inc. | 85,493 | 405,237 | ||||||
|
| |||||||
Total Internet Software & Services | 405,237 | |||||||
|
| |||||||
IT Services - 0.7% |
| |||||||
CIBER, Inc.* | 64,800 | 269,568 | ||||||
NCI, Inc. — Class A* | 58,541 | 290,363 | ||||||
|
| |||||||
Total IT Services | 559,931 | |||||||
|
| |||||||
Leisure Equipment & Products - 1.0% |
| |||||||
Callaway Golf Co. | 94,849 | 581,424 | ||||||
Jakks Pacific, Inc. | 11,579 | 220,812 | ||||||
|
| |||||||
Total Leisure Equipment & Products | 802,236 | |||||||
|
| |||||||
Machinery - 1.2% |
| |||||||
Briggs & Stratton Corp. | 28,383 | 513,732 | ||||||
Lydall, Inc.* | 38,152 | 402,504 | ||||||
|
| |||||||
Total Machinery | 916,236 | |||||||
|
| |||||||
Media - 1.4% |
| |||||||
Digital Generation, Inc.* | 36,984 | 343,211 | ||||||
E.W. Scripps Co. — Class A* | 36,637 | 335,595 | ||||||
Harte-Hanks, Inc. | 22,898 | 192,343 | ||||||
Live Nation Entertainment, Inc.* | 24,043 | 217,830 | ||||||
|
| |||||||
Total Media | 1,088,979 | |||||||
|
| |||||||
Metals & Mining - 2.5% |
| |||||||
A.M. Castle & Co.* | 32,573 | 436,152 | ||||||
AK Steel Holding Corp. | 22,838 | 169,458 | ||||||
Century Aluminum Co.* | 34,960 | 321,632 | ||||||
Materion Corp.* | 17,450 | 431,189 | ||||||
Olympic Steel, Inc. | 18,543 | 391,814 | ||||||
SunCoke Energy, Inc.* | 13,030 | 198,317 | ||||||
|
| |||||||
Total Metals & Mining | 1,948,562 | |||||||
|
| |||||||
Multiline Retail - 2.5% |
| |||||||
Fred’s, Inc. — Class A | 40,204 | 575,721 | ||||||
Tuesday Morning Corp.* | 326,343 | 1,318,426 | ||||||
|
| |||||||
Total Multiline Retail | 1,894,147 | |||||||
|
| |||||||
Oil, Gas & Consumable Fuels - 0.4% |
| |||||||
Overseas Shipholding Group, Inc. | 29,041 | 339,780 | ||||||
|
| |||||||
Total Oil, Gas & Consumable Fuels | 339,780 | |||||||
|
| |||||||
Paper & Forest Products - 1.2% |
| |||||||
Neenah Paper, Inc. | 15,231 | 434,998 | ||||||
Wausau Paper Corp. | 53,921 | 488,524 | ||||||
|
| |||||||
Total Paper & Forest Products | 923,522 | |||||||
|
| |||||||
| 28 | GUGGENHEIM ETFS SEMI-ANNUAL REPORT | See Notes to Financial Statements. |
Table of Contents
| SCHEDULE OF INVESTMENTS (Unaudited) (concluded) | April 30, 2012 |
GUGGENHEIM S&P SMALLCAP 600 PURE VALUE ETF
| SHARES | MARKET VALUE | |||||||
Professional Services - 2.1% |
| |||||||
CDI Corp. | 38,805 | $ | 688,400 | |||||
Insperity, Inc. | 6,981 | 190,372 | ||||||
Kelly Services, Inc. — Class A | 53,826 | 753,026 | ||||||
|
| |||||||
Total Professional Services | 1,631,798 | |||||||
|
| |||||||
Real Estate Investment Trusts (REITs) - 0.7% |
| |||||||
Cedar Reality Trust, Inc. | 61,518 | 321,124 | ||||||
Parkway Properties, Inc. | 25,608 | 253,263 | ||||||
|
| |||||||
Total Real Estate Investment Trusts (REITs) | 574,387 | |||||||
|
| |||||||
Road & Rail - 0.4% |
| |||||||
Arkansas Best Corp. | 20,076 | 307,966 | ||||||
|
| |||||||
Total Road & Rail | 307,966 | |||||||
|
| |||||||
Semiconductors & Semiconductor |
| |||||||
Advanced Energy Industries, Inc.* | 22,013 | 262,835 | ||||||
Cohu, Inc. | 33,788 | 370,992 | ||||||
DSP Group, Inc.* | 30,058 | 196,580 | ||||||
Pericom Semiconductor Corp.* | 36,548 | 287,267 | ||||||
Sigma Designs, Inc.* | 79,192 | 436,348 | ||||||
|
| |||||||
Total Semiconductors & Semiconductor Equipment | 1,554,022 | |||||||
|
| |||||||
Specialty Retail - 11.6% |
| |||||||
Big 5 Sporting Goods Corp. | 67,809 | 567,561 | ||||||
Brown Shoe Co., Inc. | 90,723 | 826,487 | ||||||
Cabela’s, Inc.* | 6,544 | 247,429 | ||||||
Christopher & Banks Corp. | 157,905 | 295,282 | ||||||
Coldwater Creek, Inc.* | 376,181 | 372,419 | ||||||
Group 1 Automotive, Inc. | 10,310 | 596,743 | ||||||
Haverty Furniture Cos., Inc. | 29,091 | 349,092 | ||||||
Lithia Motors, Inc. — Class A | 17,353 | 465,581 | ||||||
MarineMax, Inc.* | 118,227 | 1,260,300 | ||||||
OfficeMax, Inc.* | 190,554 | 886,076 | ||||||
| SHARES | MARKET VALUE | |||||||
PEP Boys-Manny Moe & Jack | 48,201 | $ | 719,641 | |||||
Sonic Automotive, Inc. — Class A | 39,782 | 669,133 | ||||||
Stage Stores, Inc. | 46,458 | 709,414 | ||||||
Stein Mart, Inc.* | 107,713 | 691,517 | ||||||
Zale Corp.* | 96,455 | 264,287 | ||||||
|
| |||||||
Total Specialty Retail | 8,920,962 | |||||||
|
| |||||||
Textiles, Apparel & Luxury Goods - 4.1% |
| |||||||
Perry Ellis International, Inc.* | 68,619 | 1,283,862 | ||||||
Quiksilver, Inc.* | 193,772 | 670,451 | ||||||
Skechers U.S.A., Inc. — Class A* | 64,802 | 1,209,853 | ||||||
|
| |||||||
Total Textiles, Apparel & Luxury Goods | 3,164,166 | |||||||
|
| |||||||
Tobacco - 0.3% |
| |||||||
Alliance One International, Inc.* | 67,636 | 239,431 | ||||||
|
| |||||||
Total Tobacco | 239,431 | |||||||
|
| |||||||
Trading Companies & Distributors - 0.6% |
| |||||||
Lawson Products, Inc. | 29,878 | 435,024 | ||||||
|
| |||||||
Total Trading Companies & Distributors | 435,024 | |||||||
|
| |||||||
Total Common Stocks |
| 77,103,703 | ||||||
|
| |||||||
SHORT TERM INVESTMENTS - 0.2% |
| |||||||
SSgA Government Money Market Fund | 116,556 | 116,556 | ||||||
|
| |||||||
Total Short Term Investments | 116,556 | |||||||
|
| |||||||
Total Investments - 100.1%a |
| 77,220,259 | ||||||
|
| |||||||
Other Assets and Liabilities, |
| (76,326 | ) | |||||
|
| |||||||
Net Assets - 100.0% | $ | 77,143,933 | ||||||
|
| |||||||
| * | Non-Income Producing Security. |
| a | Unless otherwise indicated, the values of the Portfolio are determined based on Level 1 inputs. |
| See Notes to Financial Statements. | GUGGENHEIM ETFS SEMI-ANNUAL REPORT | 29 |
Table of Contents
| SCHEDULE OF INVESTMENTS (Unaudited) | April 30, 2012 |
GUGGENHEIM S&P SMALLCAP 600 PURE GROWTH ETF
| SHARES | MARKET VALUE | |||||||
COMMON STOCKS - 99.9% |
| |||||||
Aerospace & Defense - 3.1% |
| |||||||
Aerovironment, Inc.* | 8,434 | $ | 205,115 | |||||
American Science & Engineering, Inc. | 11,707 | 764,584 | ||||||
Cubic Corp. | 14,374 | 664,510 | ||||||
National Presto Industries, Inc. | 5,500 | 405,460 | ||||||
Teledyne Technologies, Inc.* | 6,569 | 424,489 | ||||||
|
| |||||||
Total Aerospace & Defense | 2,464,158 | |||||||
|
| |||||||
Air Freight & Logistics - 0.3% |
| |||||||
Forward Air Corp. | 7,417 | 250,546 | ||||||
|
| |||||||
Total Air Freight & Logistics | 250,546 | |||||||
|
| |||||||
Airlines - 1.2% |
| |||||||
Allegiant Travel Co.* | 15,706 | 922,885 | ||||||
|
| |||||||
Total Airlines | 922,885 | |||||||
|
| |||||||
Beverages - 0.8% |
| |||||||
Boston Beer Co., Inc. — Class A* | 6,472 | 668,687 | ||||||
|
| |||||||
Total Beverages | 668,687 | |||||||
|
| |||||||
Biotechnology - 2.9% |
| |||||||
ArQule, Inc.* | 68,308 | 481,571 | ||||||
Cubist Pharmaceuticals, Inc.* | 16,691 | 705,695 | ||||||
Momenta Pharmaceuticals, Inc.* | 47,361 | 752,093 | ||||||
Spectrum Pharmaceuticals, Inc.* | 33,433 | 355,393 | ||||||
|
| |||||||
Total Biotechnology | 2,294,752 | |||||||
|
| |||||||
Capital Markets - 0.6% |
| |||||||
Financial Engines, Inc.* | 21,467 | 490,306 | ||||||
|
| |||||||
Total Capital Markets | 490,306 | |||||||
|
| |||||||
Chemicals - 1.9% |
| |||||||
Balchem Corp. | 11,948 | 345,297 | ||||||
Hawkins, Inc. | 14,711 | 510,913 | ||||||
Innophos Holdings, Inc. | 12,755 | 627,164 | ||||||
|
| |||||||
Total Chemicals | 1,483,374 | |||||||
|
| |||||||
Commercial Services & Supplies - 0.9% |
| |||||||
Portfolio Recovery Associates, Inc.* | 11,024 | 758,672 | ||||||
|
| |||||||
Total Commercial Services & Supplies | 758,672 | |||||||
|
| |||||||
Communications Equipment - 0.8% |
| |||||||
Netgear, Inc.* | 8,714 | 335,489 | ||||||
ViaSat, Inc.* | 6,857 | 331,193 | ||||||
|
| |||||||
Total Communications Equipment | 666,682 | |||||||
|
| |||||||
Computers & Peripherals - 0.7% |
| |||||||
Synaptics, Inc.* | 17,436 | 535,460 | ||||||
|
| |||||||
Total Computers & Peripherals | 535,460 | |||||||
|
| |||||||
Consumer Finance - 2.7% |
| |||||||
Cash America International, Inc. | 12,609 | 589,470 | ||||||
EZCORP, Inc. — | 17,600 | 471,504 | ||||||
First Cash Financial Services, Inc.* | 8,604 | 352,420 | ||||||
World Acceptance Corp.* | 11,194 | 744,513 | ||||||
|
| |||||||
Total Consumer Finance | 2,157,907 | |||||||
|
| |||||||
| SHARES | MARKET VALUE | |||||||
Diversified Consumer Services - 3.0% |
| |||||||
American Public Education, Inc.* | 17,185 | $ | 596,663 | |||||
Capella Education Co.* | 19,827 | 648,541 | ||||||
Coinstar, Inc.* | 17,632 | 1,107,114 | ||||||
|
| |||||||
Total Diversified Consumer Services | 2,352,318 | |||||||
|
| |||||||
Diversified Telecommunication Services - 0.6% |
| |||||||
Atlantic Tele-Network, Inc. | 15,005 | 511,070 | ||||||
|
| |||||||
Total Diversified Telecommunication Services | 511,070 | |||||||
|
| |||||||
Electrical Equipment - 1.5% |
| |||||||
AZZ, Inc. | 8,165 | 422,212 | ||||||
Franklin Electric Co., Inc. | 9,340 | 468,401 | ||||||
II-VI, Inc.* | 16,315 | 332,989 | ||||||
|
| |||||||
Total Electrical Equipment | 1,223,602 | |||||||
|
| |||||||
Electronic Equipment, Instruments & |
| |||||||
Cognex Corp. | 13,059 | 525,625 | ||||||
DTS, Inc.* | 17,672 | 551,366 | ||||||
FARO Technologies, Inc.* | 5,252 | 294,007 | ||||||
Littelfuse, Inc. | 9,980 | 625,446 | ||||||
MTS Systems Corp. | 8,300 | 398,151 | ||||||
OSI Systems, Inc.* | 6,824 | 456,253 | ||||||
|
| |||||||
Total Electronic Equipment, Instruments & Components | 2,850,848 | |||||||
|
| |||||||
Energy Equipment & Services - 2.1% |
| |||||||
Lufkin Industries, Inc. | 5,291 | 406,560 | ||||||
OYO Geospace Corp.* | 3,568 | 411,105 | ||||||
SEACOR Holdings, Inc.* | 9,073 | 843,154 | ||||||
|
| |||||||
Total Energy Equipment & Services | 1,660,819 | |||||||
|
| |||||||
Food & Staples Retailing - 0.9% |
| |||||||
Casey’s General Stores, Inc. | 12,739 | 717,843 | ||||||
|
| |||||||
Total Food & Staples Retailing | 717,843 | |||||||
|
| |||||||
Food Products - 2.3% |
| |||||||
J&J Snack Foods Corp. | 9,944 | 557,461 | ||||||
Sanderson Farms, Inc. | 13,120 | 677,123 | ||||||
TreeHouse Foods, Inc.* | 10,121 | 582,059 | ||||||
|
| |||||||
Total Food Products | 1,816,643 | |||||||
|
| |||||||
Gas Utilities - 0.4% |
| |||||||
South Jersey Industries, Inc. | 6,083 | 299,588 | ||||||
|
| |||||||
Total Gas Utilities | 299,588 | |||||||
|
| |||||||
Health Care Equipment & Supplies - 5.7% |
| |||||||
Abaxis, Inc.* | 10,821 | 385,444 | ||||||
Analogic Corp. | 8,562 | 584,014 | ||||||
Cyberonics, Inc.* | 16,682 | 638,921 | ||||||
Haemonetics Corp.* | 10,637 | 761,290 | ||||||
ICU Medical, Inc.* | 15,208 | 798,268 | ||||||
Neogen Corp.* | 16,010 | 624,230 | ||||||
NuVasive, Inc.* | 43,583 | 722,170 | ||||||
|
| |||||||
Total Health Care Equipment & Supplies | 4,514,337 | |||||||
|
| |||||||
| 30 | GUGGENHEIM ETFS SEMI-ANNUAL REPORT | See Notes to Financial Statements. |
Table of Contents
| SCHEDULE OF INVESTMENTS (Unaudited) (continued) | April 30, 2012 |
GUGGENHEIM S&P SMALLCAP 600 PURE GROWTH ETF
| SHARES | MARKET VALUE | |||||||
Health Care Providers & Services - 6.7% |
| |||||||
Air Methods Corp.* | 7,509 | $ | 631,582 | |||||
Chemed Corp. | 11,111 | 670,438 | ||||||
CorVel Corp.* | 13,858 | 602,684 | ||||||
Ensign Group, Inc. (The) | 18,257 | 487,645 | ||||||
IPC The Hospitalist Co., Inc.* | 16,254 | 624,316 | ||||||
Landauer, Inc. | 10,125 | 533,790 | ||||||
Magellan Health Services, Inc.* | 15,761 | 697,897 | ||||||
MWI Veterinary Supply, Inc.* | 11,747 | 1,108,917 | ||||||
|
| |||||||
Total Health Care Providers & Services | 5,357,269 | |||||||
|
| |||||||
Health Care Technology - 2.6% |
| |||||||
Computer Programs & Systems, Inc. | 11,914 | 709,955 | ||||||
Medidata Solutions, Inc.* | 29,447 | 762,972 | ||||||
Quality Systems, Inc. | 15,942 | 596,231 | ||||||
|
| |||||||
Total Health Care Technology | 2,069,158 | |||||||
|
| |||||||
Hotels, Restaurants & Leisure - 6.1% |
| |||||||
Biglari Holdings, Inc.* | 1,769 | 718,798 | ||||||
BJ’s Restaurants, Inc.* | 14,564 | 629,019 | ||||||
Buffalo Wild Wings, Inc.* | 12,620 | 1,058,187 | ||||||
CEC Entertainment, Inc. | 15,130 | 578,269 | ||||||
DineEquity, Inc.* | 14,008 | 680,509 | ||||||
Papa John’s International, Inc.* | 9,219 | 371,341 | ||||||
Peet’s Coffee & Tea, Inc.* | 10,832 | 832,114 | ||||||
|
| |||||||
Total Hotels, Restaurants & Leisure | 4,868,237 | |||||||
|
| |||||||
Household Durables - 0.5% |
| |||||||
iRobot Corp.* | 15,469 | 365,223 | ||||||
|
| |||||||
Total Household Durables | 365,223 | |||||||
|
| |||||||
Household Products - 0.4% |
| |||||||
WD-40 Co. | 6,769 | 305,146 | ||||||
|
| |||||||
Total Household Products | 305,146 | |||||||
|
| |||||||
Insurance - 1.7% |
| |||||||
Infinity Property & Casualty Corp. | 10,972 | 586,014 | ||||||
ProAssurance Corp. | 5,312 | 467,934 | ||||||
RLI Corp. | 4,660 | 320,981 | ||||||
|
| |||||||
Total Insurance | 1,374,929 | |||||||
|
| |||||||
Internet & Catalog Retail - 0.3% |
| |||||||
Blue Nile, Inc.* | 7,415 | 224,526 | ||||||
|
| |||||||
Total Internet & Catalog Retail | 224,526 | |||||||
|
| |||||||
Internet Software & Services - 4.2% |
| |||||||
comScore, Inc.* | 14,729 | 293,402 | ||||||
InfoSpace, Inc.* | 47,525 | 528,953 | ||||||
j2 Global, Inc. | 9,903 | 255,794 | ||||||
Liquidity Services, Inc.* | 5,484 | 292,462 | ||||||
LivePerson, Inc.* | 20,986 | 333,258 | ||||||
LogMeIn, Inc.* | 16,000 | 576,160 | ||||||
OpenTable, Inc.* | 16,126 | 721,316 | ||||||
Stamps.com, Inc.* | 12,028 | 349,173 | ||||||
|
| |||||||
Total Internet Software & Services | 3,350,518 | |||||||
|
| |||||||
| SHARES | MARKET VALUE | |||||||
IT Services - 2.5% |
| |||||||
CACI International, Inc. — Class A* | 12,800 | $ | 782,464 | |||||
Forrester Research, Inc. | 7,638 | 270,767 | ||||||
Higher One Holdings, Inc.* | 20,672 | 325,998 | ||||||
MAXIMUS, Inc. | 13,353 | 590,870 | ||||||
|
| |||||||
Total IT Services | 1,970,099 | |||||||
|
| |||||||
Leisure Equipment & Products - 1.2% |
| |||||||
Sturm Ruger & Co., Inc. | 16,651 | 950,273 | ||||||
|
| |||||||
Total Leisure Equipment & Products | 950,273 | |||||||
|
| |||||||
Machinery - 1.1% |
| |||||||
Lindsay Corp. | 5,819 | 388,651 | ||||||
Toro Co. (The) | 6,480 | 463,061 | ||||||
|
| |||||||
Total Machinery | 851,712 | |||||||
|
| |||||||
Media - 0.5% |
| |||||||
Arbitron, Inc. | 9,929 | 377,798 | ||||||
|
| |||||||
Total Media | 377,798 | |||||||
|
| |||||||
Oil, Gas & Consumable Fuels - 2.2% |
| |||||||
Approach Resources, Inc.* | 10,222 | 366,765 | ||||||
Contango Oil & Gas Co.* | 11,632 | 631,152 | ||||||
GeoResources, Inc.* | 19,087 | 719,771 | ||||||
|
| |||||||
Total Oil, Gas & Consumable Fuels | 1,717,688 | |||||||
|
| |||||||
Paper & Forest Products - 1.1% |
| |||||||
Deltic Timber Corp. | 7,103 | 433,851 | ||||||
Schweitzer-Mauduit International, Inc. | 6,002 | 407,056 | ||||||
|
| |||||||
Total Paper & Forest Products | 840,907 | |||||||
|
| |||||||
Personal Products - 0.7% |
| |||||||
Medifast, Inc.* | 30,738 | 590,784 | ||||||
|
| |||||||
Total Personal Products | 590,784 | |||||||
|
| |||||||
Pharmaceuticals - 3.8% |
| |||||||
Akorn, Inc.* | 25,686 | 311,571 | ||||||
Hi-Tech Pharmacal Co., Inc.* | 21,038 | 685,628 | ||||||
Medicines Co. (The)* | 29,727 | 656,669 | ||||||
Questcor Pharmaceuticals, Inc.* | 15,091 | 677,586 | ||||||
Salix Pharmaceuticals Ltd.* | 5,922 | 292,547 | ||||||
ViroPharma, Inc.* | 17,922 | 389,804 | ||||||
|
| |||||||
Total Pharmaceuticals | 3,013,805 | |||||||
|
| |||||||
Professional Services - 1.3% |
| |||||||
Dolan Co. (The)* | 65,217 | 522,388 | ||||||
Exponent, Inc.* | 10,497 | 501,757 | ||||||
|
| |||||||
Total Professional Services | 1,024,145 | |||||||
|
| |||||||
Real Estate Investment Trusts (REITs) - 1.2% |
| |||||||
EastGroup Properties, Inc. | 5,416 | 272,425 | ||||||
Mid-America Apartment Communities, Inc. | 5,036 | 342,801 | ||||||
PS Business Parks, Inc. | 5,385 | 367,526 | ||||||
|
| |||||||
Total Real Estate Investment Trusts (REITs) | 982,752 | |||||||
|
| |||||||
| See Notes to Financial Statements. | GUGGENHEIM ETFS SEMI-ANNUAL REPORT | 31 |
Table of Contents
| SCHEDULE OF INVESTMENTS (Unaudited) (concluded) | April 30, 2012 |
GUGGENHEIM S&P SMALLCAP 600 PURE GROWTH ETF
| SHARES | MARKET VALUE | |||||||
Semiconductors & Semiconductor |
| |||||||
Cabot Microelectronics Corp. | 9,197 | $ | 316,193 | |||||
CEVA, Inc.* | 9,151 | 202,145 | ||||||
Cirrus Logic, Inc.* | 40,705 | 1,114,503 | ||||||
Cymer, Inc.* | 8,601 | 445,876 | ||||||
Entropic Communications, Inc.* | 92,653 | 391,922 | ||||||
Exar Corp.* | 85,228 | 675,006 | ||||||
GT Advanced Technologies, Inc.* | 53,436 | 347,868 | ||||||
Hittite Microwave Corp.* | 14,729 | 788,591 | ||||||
Kulicke & Soffa Industries, Inc.* | 65,056 | 852,234 | ||||||
Power Integrations, Inc. | 16,858 | 638,581 | ||||||
Rubicon Technology, Inc.* | 51,722 | 488,773 | ||||||
Veeco Instruments, Inc.* | 32,540 | 982,383 | ||||||
Volterra Semiconductor Corp.* | 20,642 | 678,915 | ||||||
|
| |||||||
Total Semiconductors & Semiconductor Equipment | 7,922,990 | |||||||
|
| |||||||
Software - 7.5% |
| |||||||
Blackbaud, Inc. | 8,920 | 276,342 | ||||||
CommVault Systems, Inc.* | 14,832 | 772,302 | ||||||
Ebix, Inc. | 22,515 | 460,432 | ||||||
Interactive Intelligence Group* | 13,306 | 394,656 | ||||||
JDA Software Group, Inc.* | 9,821 | 283,630 | ||||||
Manhattan Associates, Inc.* | 7,027 | 352,404 | ||||||
MicroStrategy, Inc. — Class A* | 4,955 | 692,610 | ||||||
Netscout Systems, Inc.* | 17,357 | 359,116 | ||||||
OPNET Technologies, Inc. | 11,366 | 263,237 | ||||||
Sourcefire, Inc.* | 18,157 | 925,825 | ||||||
Synchronoss Technologies, Inc.* | 8,735 | 273,406 | ||||||
Tyler Technologies, Inc.* | 13,937 | 556,783 | ||||||
Websense, Inc.* | 18,716 | 388,170 | ||||||
|
| |||||||
Total Software | 5,998,913 | |||||||
|
| |||||||
| SHARES | MARKET VALUE | |||||||
Specialty Retail - 6.0% |
| |||||||
Buckle, Inc. (The) | 14,861 | $ | 686,281 | |||||
Children’s Place Retail Stores, Inc. (The)* | 7,700 | 354,046 | ||||||
Genesco, Inc.* | 8,795 | 659,625 | ||||||
Hibbett Sports, Inc.* | 12,152 | 725,718 | ||||||
JOS A Bank Clothiers, Inc.* | 13,184 | 626,899 | ||||||
Monro Muffler Brake, Inc. | 13,532 | 558,330 | ||||||
Rue21, Inc.* | 20,402 | 619,201 | ||||||
Vitamin Shoppe, Inc.* | 11,190 | 526,713 | ||||||
|
| |||||||
Total Specialty Retail | 4,756,813 | |||||||
|
| |||||||
Textiles, Apparel & Luxury Goods - 1.9% |
| |||||||
Steven Madden Ltd.* | 17,314 | 748,138 | ||||||
True Religion Apparel, Inc.* | 16,330 | 443,523 | ||||||
Wolverine World Wide, Inc. | 7,287 | 305,689 | ||||||
|
| |||||||
Total Textiles, Apparel & Luxury Goods | 1,497,350 | |||||||
|
| |||||||
Water Utilities - 0.4% |
| |||||||
American States Water Co. | 8,489 | 309,339 | ||||||
|
| |||||||
Total Water Utilities | 309,339 | |||||||
|
| |||||||
Total Common Stocks | 79,360,871 | |||||||
|
| |||||||
SHORT TERM INVESTMENTS - 0.1% |
| |||||||
SSgA Government Money Market Fund | 45,037 | 45,037 | ||||||
|
| |||||||
Total Short Term Investments |
| 45,037 | ||||||
|
| |||||||
Total Investments - 100.0%a |
| 79,405,908 | ||||||
|
| |||||||
Other Assets and Liabilities, net - 0.0%b |
| (17,925 | ) | |||||
|
| |||||||
Net Assets - 100.0% | $ | 79,387,983 | ||||||
|
| |||||||
| * | Non-Income Producing Security. |
| a | Unless otherwise indicated, the values of the Portfolio are determined based on Level 1 inputs. |
| b | Amount represents less than 0.05% of net assets. |
| 32 | GUGGENHEIM ETFS SEMI-ANNUAL REPORT | See Notes to Financial Statements. |
Table of Contents
| STATEMENT OF ASSETS AND LIABILITIES (Unaudited) | April 30, 2012 |
| Guggenheim Russell Top 50® ETF | Guggenheim S&P 500 Pure Value ETF | Guggenheim S&P 500 Pure Growth ETF | Guggenheim S&P MidCap 400 Pure Value ETF | |||||||||||||
| ASSETS | ||||||||||||||||
Investments at market value* | $ | 484,845,903 | $ | 93,237,617 | $ | 321,268,237 | $ | 35,559,247 | ||||||||
Receivables: | ||||||||||||||||
Investments sold | — | 123,385 | — | 432,672 | ||||||||||||
Fund shares sold | 5,119,129 | — | — | — | ||||||||||||
Dividends | 548,255 | 63,732 | 113,989 | 12,107 | ||||||||||||
Total assets | 490,513,287 | 93,424,734 | 321,382,226 | 36,004,026 | ||||||||||||
| LIABILITIES | ||||||||||||||||
Payables: | ||||||||||||||||
Investments purchased | 5,111,014 | 197,426 | — | 449,901 | ||||||||||||
Accrued management fees | 76,631 | 26,638 | 90,467 | 10,934 | ||||||||||||
Total liabilities | 5,187,645 | 224,064 | 90,467 | 460,835 | ||||||||||||
| NET ASSETS | $ | 485,325,642 | $ | 93,200,670 | $ | 321,291,759 | $ | 35,543,191 | ||||||||
| NETASSETSCONSISTOF: | ||||||||||||||||
Paid-in capital | $ | 553,191,007 | $ | 99,858,494 | $ | 304,933,273 | $ | 36,489,125 | ||||||||
Undistributed net investment income | 739,997 | 94,108 | 62,879 | 11,475 | ||||||||||||
Accumulated net realized loss on investment securities | (67,675,096 | ) | (6,848,996 | ) | (17,505,956 | ) | (2,791,779 | ) | ||||||||
Net unrealized appreciation (depreciation) on investment securities | (930,266 | ) | 97,064 | 33,801,563 | 1,834,370 | |||||||||||
| NETASSETS | $ | 485,325,642 | $ | 93,200,670 | $ | 321,291,759 | $ | 35,543,191 | ||||||||
Shares outstanding (unlimited shares authorized), no par value | 4,750,785 | 3,002,836 | 6,550,299 | 1,000,499 | ||||||||||||
Net asset value, offering price and repurchase price per share | $102.16 | $31.04 | $49.05 | $35.53 | ||||||||||||
*Total cost of investments | $ | 485,776,169 | $ | 93,140,553 | $ | 287,466,674 | $ | 33,724,877 | ||||||||
| See Notes to Financial Statements. | GUGGENHEIM ETFS SEMI-ANNUAL REPORT | 33 |
Table of Contents
| STATEMENT OF ASSETS AND LIABILITIES (Unaudited) (concluded) | April 30, 2012 |
| Guggenheim S&P MidCap 400 Pure Growth ETF | Guggenheim S&P SmallCap 600 Pure Value ETF | Guggenheim S&P SmallCap 600 Pure Growth ETF | ||||||||||
| ASSETS | ||||||||||||
Investments at market value* | $ | 602,671,223 | $ | 77,220,259 | $ | 79,405,908 | ||||||
Receivables: | ||||||||||||
Investments sold | — | 637,821 | — | |||||||||
Dividends | 59,983 | 18,504 | 4,867 | |||||||||
Total assets | 602,731,206 | 77,876,584 | 79,410,775 | |||||||||
| LIABILITIES | ||||||||||||
Payables: | ||||||||||||
Investments purchased | — | 710,699 | — | |||||||||
Accrued management fees | 171,678 | 21,952 | 22,792 | |||||||||
Total liabilities | 171,678 | 732,651 | 22,792 | |||||||||
| NET ASSETS | $ | 602,559,528 | $ | 77,143,933 | $ | 79,387,983 | ||||||
| NETASSETSCONSISTOF: | ||||||||||||
Paid-in capital | $ | 582,703,721 | $ | 101,950,658 | $ | 77,973,174 | ||||||
Undistributed (distributions in excess) of net investment income | (31,052 | ) | 20,892 | (3,425 | ) | |||||||
Accumulated net realized loss on investment securities | (39,451,708 | ) | (24,070,952 | ) | (2,637,605 | ) | ||||||
Net unrealized appreciation (depreciation) on investment securities | 59,338,567 | (756,665 | ) | 4,055,839 | ||||||||
| NETASSETS | $ | 602,559,528 | $ | 77,143,933 | $ | 79,387,983 | ||||||
Shares outstanding (unlimited shares authorized), no par value | 6,700,021 | 1,950,040 | 1,450,004 | |||||||||
Net asset value, offering price and repurchase price per share | $89.93 | $39.56 | $54.75 | |||||||||
*Total cost of investments | $ | 543,332,656 | $ | 77,976,924 | $ | 75,350,069 | ||||||
| 34 | GUGGENHEIM ETFS SEMI-ANNUAL REPORT | See Notes to Financial Statements. |
Table of Contents
STATEMENT OF OPERATIONS (Unaudited)
|
For the Six Months Ended April 30, 2012
| Guggenheim Russell Top 50® ETF | Guggenheim S&P 500 Pure Value ETF | Guggenheim S&P 500 Pure Growth ETF | Guggenheim S&P MidCap 400 Pure Value ETF | |||||||||||||
| INVESTMENT INCOME | ||||||||||||||||
Dividends | $ | 5,489,266 | $ | 831,618 | $ | 1,576,400 | $ | 345,951 | ||||||||
Interest | 6 | 1 | 12 | — | ||||||||||||
Total income | 5,489,272 | 831,619 | 1,576,412 | 345,951 | ||||||||||||
| EXPENSES | ||||||||||||||||
Management fee | 462,860 | 147,009 | 503,039 | 69,587 | ||||||||||||
| 462,860 | 147,009 | 503,039 | 69,587 | |||||||||||||
Net investment income | 5,026,412 | 684,610 | 1,073,373 | 276,364 | ||||||||||||
| REALIZEDAND UNREALIZED GAIN (LOSS)ON INVESTMENTS | ||||||||||||||||
Net realized gain (loss) from: | ||||||||||||||||
Investments | (939,285 | ) | (304,125 | ) | (18,426,127 | ) | (1,137,920 | ) | ||||||||
In-kind Redemptions | 33,570,582 | 1,637,601 | 3,527,365 | 1,182,720 | ||||||||||||
Net realized gain (loss) | 32,631,297 | 1,333,476 | (14,898,762 | ) | 44,800 | |||||||||||
Net change in unrealized appreciation on: | ||||||||||||||||
Investment securities | 24,055,450 | 5,638,730 | 41,661,810 | 5,410,215 | ||||||||||||
Net realized and unrealized gain on investments | 56,686,747 | 6,972,206 | 26,763,048 | 5,455,015 | ||||||||||||
Net increase in net assets resulting from operations | $ | 61,713,159 | $ | 7,656,816 | $ | 27,836,421 | $ | 5,731,379 | ||||||||
| See Notes to Financial Statements. | GUGGENHEIM ETFS SEMI-ANNUAL REPORT | 35 |
Table of Contents
STATEMENT OF OPERATIONS (Unaudited) (concluded)
|
For the Six Months Ended April 30, 2012
| Guggenheim S&P MidCap 400 Pure Growth ETF | Guggenheim S&P SmallCap 600 Pure Value ETF | Guggenheim S&P SmallCap 600 Pure Growth ETF | ||||||||||
| INVESTMENT INCOME | ||||||||||||
Dividends | $ | 1,462,423 | $ | 378,069 | $ | 305,143 | ||||||
Interest | 4 | — | 1 | |||||||||
Total income | 1,462,427 | 378,069 | 305,144 | |||||||||
| EXPENSES | ||||||||||||
Management fee | 1,028,998 | 122,607 | 113,069 | |||||||||
| 1,028,998 | 122,607 | 113,069 | ||||||||||
Net investment income | 433,429 | 255,462 | 192,075 | |||||||||
| REALIZEDAND UNREALIZED GAIN (LOSS)ON INVESTMENTS | ||||||||||||
Net realized gain (loss) from: | ||||||||||||
Investments | (54,244,070 | ) | (3,073,716 | ) | (2,143,451 | ) | ||||||
In-kind redemptions | 16,979,841 | — | 437,622 | |||||||||
Net realized loss | (37,264,229 | ) | (3,073,716 | ) | (1,705,829 | ) | ||||||
Net change in unrealized appreciation on: | ||||||||||||
Investment securities | 82,735,691 | 9,759,258 | 8,152,107 | |||||||||
Net realized and unrealized gain on investments | 45,471,462 | 6,685,542 | 6,446,278 | |||||||||
Net increase in net assets resulting from operations | $ | 45,904,891 | $ | 6,941,004 | $ | 6,638,353 | ||||||
| 36 | GUGGENHEIM ETFS SEMI-ANNUAL REPORT | See Notes to Financial Statements. |
Table of Contents
| STATEMENTS OF CHANGES IN NET ASSETS |
| Guggenheim Russell Top 50® ETF | Guggenheim S&P 500 Pure Value ETF | |||||||||||||||
| Six Months Ended April 30, 2012 (Unaudited) | Year Ended October 31, 2011 | Six Months Ended April 30, 2012 (Unaudited) | Year Ended October 31, 2011 | |||||||||||||
| OPERATIONS | ||||||||||||||||
Net investment income | $ | 5,026,412 | $ | 7,875,126 | $ | 684,610 | $ | 1,288,269 | ||||||||
Net realized gain (loss) on investments | 32,631,297 | (1,000,821 | ) | 1,333,476 | 1,122,980 | |||||||||||
Net change in unrealized appreciation (depreciation) on investments | 24,055,450 | 19,318,113 | 5,638,730 | (2,290,115 | ) | |||||||||||
Net increase in net assets | 61,713,159 | 26,192,418 | 7,656,816 | 121,134 | ||||||||||||
| DISTRIBUTIONSTO SHAREHOLDERSFROM: | ||||||||||||||||
Net investment income | (5,076,826 | ) | (7,603,764 | ) | (672,022 | ) | (1,211,677 | ) | ||||||||
| SHAREHOLDER TRANSACTIONS | ||||||||||||||||
Proceeds from shares purchased | 179,271,892 | 150,183,009 | 17,479,492 | 60,757,533 | ||||||||||||
Value of shares redeemed | (204,991,871 | ) | (38,031,580 | ) | (10,813,895 | ) | (35,992,276 | ) | ||||||||
Net increase (decrease) in net assets resulting from share transactions | (25,719,979 | ) | 112,151,429 | 6,665,597 | 24,765,257 | |||||||||||
Increase in net assets | 30,916,354 | 130,740,083 | 13,650,391 | 23,674,714 | ||||||||||||
| NETASSETS | ||||||||||||||||
Beginning of period | 454,409,288 | 323,669,205 | 79,550,279 | 55,875,565 | ||||||||||||
End of period1 | $ | 485,325,642 | $ | 454,409,288 | $ | 93,200,670 | $ | 79,550,279 | ||||||||
1 Including undistributed net investment income | $ | 739,997 | $ | 790,411 | $ | 94,108 | $ | 81,520 | ||||||||
| CHANGESINSHARESOUTSTANDING: | ||||||||||||||||
Shares purchased | 1,900,000 | 1,700,000 | 550,000 | 2,000,000 | ||||||||||||
Shares redeemed | (2,200,000 | ) | (450,000 | ) | (350,000 | ) | (1,350,000 | ) | ||||||||
Shares outstanding, beginning of period | 5,050,785 | 3,800,785 | 2,802,836 | 2,152,836 | ||||||||||||
Shares outstanding, end of period | 4,750,785 | 5,050,785 | 3,002,836 | 2,802,836 | ||||||||||||
| See Notes to Financial Statements. | GUGGENHEIM ETFS SEMI-ANNUAL REPORT | 37 |
Table of Contents
| STATEMENTS OF CHANGES IN NET ASSETS (continued) |
| Guggenheim S&P 500 Pure Growth ETF | Guggenheim S&P MidCap 400 Pure Value ETF | |||||||||||||||
| Six Months Ended April 30, 2012 (Unaudited) | Year Ended October 31, 2011 | Six Months Ended April 30, 2012 (Unaudited) | Year Ended October 31, 2011 | |||||||||||||
| OPERATIONS | ||||||||||||||||
Net Investment Income | $ | 1,073,373 | $ | 1,020,216 | $ | 276,364 | $ | 588,491 | ||||||||
Net realized gain (loss) on investments | (14,898,762 | ) | 23,480,072 | 44,800 | 1,240,256 | |||||||||||
Net change in unrealized appreciation (depreciation) on investments | 41,661,810 | (23,088,187 | ) | 5,410,215 | (2,426,037 | ) | ||||||||||
Net increase (decrease) in net assets resulting from operations | 27,836,421 | 1,412,101 | 5,731,379 | (597,290 | ) | |||||||||||
| DISTRIBUTIONSTO SHAREHOLDERSFROM: | ||||||||||||||||
Net investment income | (1,025,692 | ) | (996,112 | ) | (293,225 | ) | (566,319 | ) | ||||||||
| SHAREHOLDERTRANSACTIONS | ||||||||||||||||
Proceeds from shares purchased | 55,143,833 | 259,891,376 | 3,130,358 | 10,618,563 | ||||||||||||
Value of shares redeemed | (26,551,559 | ) | (141,889,014 | ) | (8,696,285 | ) | (16,872,735 | ) | ||||||||
Net increase (decrease) in net assets resulting from share transactions | 28,592,274 | 118,002,362 | (5,565,927 | ) | (6,254,172 | ) | ||||||||||
Increase (decrease) in net assets | 55,403,003 | 118,418,351 | (127,773 | ) | (7,417,781 | ) | ||||||||||
| NETASSETS | ||||||||||||||||
Beginning of period | 265,888,756 | 147,470,405 | 35,670,964 | 43,088,745 | ||||||||||||
End of period1 | $ | 321,291,759 | $ | 265,888,756 | $ | 35,543,191 | $ | 35,670,964 | ||||||||
1 Including undistributed net investment income | $ | 62,879 | $ | 15,198 | $ | 11,475 | $ | 28,336 | ||||||||
| CHANGESINSHARESOUTSTANDING: | ||||||||||||||||
Shares purchased | 1,200,000 | 5,700,000 | 100,000 | 300,000 | ||||||||||||
Shares redeemed | (600,000 | ) | (3,400,000 | ) | (250,000 | ) | (550,000 | ) | ||||||||
Shares outstanding, beginning of period | 5,950,299 | 3,650,299 | 1,150,499 | 1,400,499 | ||||||||||||
Shares outstanding, end of period | 6,550,299 | 5,950,299 | 1,000,499 | 1,150,499 | ||||||||||||
| 38 | GUGGENHEIM ETFS SEMI-ANNUAL REPORT | See Notes to Financial Statements. |
Table of Contents
| STATEMENTS OF CHANGES IN NET ASSETS (continued) |
| Guggenheim S&P MidCap 400 Pure Growth ETF | Guggenheim S&P SmallCap 600 Pure Value ETF | |||||||||||||||
| Six Months Ended April 30, 2012 (Unaudited) | Year Ended October 31, 2011 | Six Months Ended April 30, 2012 (Unaudited) | Year Ended October 31, 2011 | |||||||||||||
| OPERATIONS | ||||||||||||||||
Net investment income | $ | 433,429 | $ | 494,420 | $ | 255,462 | $ | 444,600 | ||||||||
Net realized gain (loss) | (37,264,229 | ) | 69,090,697 | (3,073,716 | ) | 3,386,071 | ||||||||||
Net change in unrealized appreciation (depreciation) on Investments | 82,735,691 | (51,357,329 | ) | 9,759,258 | 849,778 | |||||||||||
Net increase in net assets resulting from operations | 45,904,891 | 18,227,788 | 6,941,004 | 4,680,449 | ||||||||||||
| DISTRIBUTIONSTO SHAREHOLDERSFROM: | ||||||||||||||||
Net investment income | (464,481 | ) | (494,945 | ) | (234,570 | ) | (444,287 | ) | ||||||||
| SHAREHOLDERTRANSACTIONS | ||||||||||||||||
Proceeds from shares purchased | 74,690,949 | 689,925,224 | 8,307,891 | 14,049,940 | ||||||||||||
Value of shares redeemed | (170,817,803 | ) | (346,841,356 | ) | — | (43,539,405 | ) | |||||||||
Net increase (decrease) in net assets resulting from share transactions | (96,126,854 | ) | 343,083,868 | 8,307,891 | (29,489,465 | ) | ||||||||||
Increase (decrease) in net assets | (50,686,444 | ) | 360,816,711 | 15,014,325 | (25,253,303 | ) | ||||||||||
| NETASSETS | ||||||||||||||||
Beginning of period | 653,245,972 | 292,429,261 | 62,129,608 | 87,382,911 | ||||||||||||
End of period1 | $ | 602,559,528 | $ | 653,245,972 | $ | 77,143,933 | $ | 62,129,608 | ||||||||
1 Including undistributed (distributions in excess) of net investment income | $ | (31,052 | ) | $ | — | $ | 20,892 | $ | — | |||||||
| CHANGESINSHARESOUTSTANDING: | ||||||||||||||||
Shares purchased | 900,000 | 8,250,000 | 200,000 | 350,000 | ||||||||||||
Shares redeemed | (2,150,000 | ) | (4,450,000 | ) | — | (1,150,000 | ) | |||||||||
Shares outstanding, beginning of period | 7,950,021 | 4,150,021 | 1,750,040 | 2,550,040 | ||||||||||||
Shares outstanding, end of period | 6,700,021 | 7,950,021 | 1,950,040 | 1,750,040 | ||||||||||||
| See Notes to Financial Statements. | GUGGENHEIM ETFS SEMI-ANNUAL REPORT | 39 |
Table of Contents
| STATEMENTS OF CHANGES IN NET ASSETS (concluded) |
| Guggenheim S&P SmallCap 600 Pure Growth ETF | ||||||||
| Six Months Ended April 30, 2012 (Unaudited) | Year Ended October 31, 2011 | |||||||
| OPERATIONS | ||||||||
Net investment income | $ | 192,075 | $ | 12,081 | ||||
Net realized loss on investments | (1,705,829 | ) | (1,667,405 | ) | ||||
Net change in unrealized appreciation (depreciation) on investments | 8,152,107 | (6,355,046 | ) | |||||
Net increase (decrease) in net assets resulting from operations | 6,638,353 | (8,010,370 | ) | |||||
| DISTRIBUTIONSTO SHAREHOLDERSFROM: | ||||||||
Net investment income | (195,500 | ) | (46,996 | ) | ||||
| SHAREHOLDERTRANSACTIONS | ||||||||
Proceeds from shares purchased | 40,808,973 | 103,804,934 | ||||||
Value of shares redeemed | (2,736,392 | ) | (78,204,381 | ) | ||||
Net increase in net assets resulting from share transactions | 38,072,581 | 25,600,553 | ||||||
Increase in net assets | 44,515,434 | 17,543,187 | ||||||
| NETASSETS | ||||||||
Beginning of period | 34,872,549 | 17,329,362 | ||||||
End of period1 | $ | 79,387,983 | $ | 34,872,549 | ||||
1 Including undistributed (distributions in excess) of net investment income | $ | (3,425 | ) | $ | — | |||
| CHANGESINSHARESOUTSTANDING: | ||||||||
Shares purchased | 800,000 | 1,950,000 | ||||||
Shares redeemed | (50,000 | ) | (1,650,000 | ) | ||||
Shares outstanding, beginning of period | 700,004 | 400,004 | ||||||
Shares outstanding, end of period | 1,450,004 | 700,004 | ||||||
| 40 | GUGGENHEIM ETFS SEMI-ANNUAL REPORT | See Notes to Financial Statements. |
Table of Contents
GUGGENHEIM RUSSELL TOP 50® ETF
| FINANCIAL HIGHLIGHTS |
| Six Months Ended April 30, 2012 (Unaudited) | Year Ended October 31, 2011 | Year Ended October 31, 2010 | Year Ended October 31, 2009 | Year Ended October 31, 2008 | Year Ended October 31, 2007 | |||||||||||||||||||
Per Share Operating Performance: |
| |||||||||||||||||||||||
Net asset value at beginning of period | $89.97 | $85.16 | $78.90 | $76.29 | $116.47 | $104.15 | ||||||||||||||||||
Net investment income* | 1.03 | 1.87 | 1.72 | 1.95 | 2.34 | 2.15 | ||||||||||||||||||
Net realized and unrealized gain (loss) on investments | 12.20 | 4.74 | 6.26 | 2.61 | (40.20 | ) | 12.25 | |||||||||||||||||
|
|
|
|
|
|
|
|
|
|
|
| |||||||||||||
Total from investment operations | 13.23 | 6.61 | 7.98 | 4.56 | (37.86 | ) | 14.40 | |||||||||||||||||
Distributions to shareholders from: | ||||||||||||||||||||||||
Net investment income | (1.04 | ) | (1.80 | ) | (1.72 | ) | (1.95 | ) | (2.32 | ) | (2.08 | ) | ||||||||||||
Net asset value at end of period | $102.16 | $89.97 | $85.16 | $78.90 | $76.29 | $116.47 | ||||||||||||||||||
|
|
|
|
|
|
|
|
|
|
|
| |||||||||||||
Total Return** | 14.77% | 7.80% | 10.22% | 6.35% | (32.92% | ) | 13.96% | |||||||||||||||||
Ratios/Supplemental Data: | ||||||||||||||||||||||||
Net assets at end of period (000’s omitted) | $485,326 | $454,409 | $323,669 | $315,662 | $434,878 | $681,355 | ||||||||||||||||||
Ratio to average net assets of: | ||||||||||||||||||||||||
Expenses | 0.20% | 0.20% | 0.20% | 0.20% | 0.20% | 0.20% | ||||||||||||||||||
Net investment income | 2.17% | 2.08% | 2.09% | 2.79% | 2.37% | 1.96% | ||||||||||||||||||
Portfolio turnover rate† | 1% | 6% | 9% | 12% | 10% | 8% | ||||||||||||||||||
| * | Based on average shares outstanding. |
| ** | Total investment return is calculated assuming an initial investment made at the net asset value at the beginning of the period, reinvestment of all dividends and distribution at net asset value during the period, and redemption on the last day of the period. Transaction fees are not reflected in the calculation of total investment return. Total investment return calculated for a period of less than one year is not annualized. |
| † | Portfolio turnover is not annualized and does not include securities received or delivered from processing creations or redemptions. |
| See Notes to Financial Statements. | GUGGENHEIM ETFS SEMI-ANNUAL REPORT | 41 |
Table of Contents
GUGGENHEIM S&P 500 PURE VALUE ETF
FINANCIAL HIGHLIGHTS (continued)
| Six Months Ended April 30, 2012 (Unaudited) | Year Ended October 31, 2011 | Year Ended October 31, 2010 | Year Ended October 31, 2009 | Year Ended 2008 | Year Ended October 31, | |||||||||||||||||||
Per Share Operating Performance: |
| |||||||||||||||||||||||
Net asset value at beginning of period | $28.38 | $25.95 | $21.46 | $17.98 | $34.46 | $32.66 | ||||||||||||||||||
Net investment income* | 0.24 | 0.42 | 0.35 | 0.49 | 1.00 | 0.75 | ||||||||||||||||||
Net realized and unrealized gain (loss) on investments | 2.66 | 2.40 | 4.49 | 3.53 | (16.44 | ) | 1.80 | |||||||||||||||||
|
|
|
|
|
|
|
|
|
|
|
| |||||||||||||
Total from investment operations | 2.90 | 2.82 | 4.84 | 4.02 | (15.44 | ) | 2.55 | |||||||||||||||||
Distributions to shareholders from: | ||||||||||||||||||||||||
Net investment income | (0.24 | ) | (0.39 | ) | (0.35 | ) | (0.54 | ) | (1.04 | ) | (0.75 | ) | ||||||||||||
Net asset value at end of period | $31.04 | $28.38 | $25.95 | $21.46 | $17.98 | $34.46 | ||||||||||||||||||
|
|
|
|
|
|
|
|
|
|
|
| |||||||||||||
Total Return** | 10.24% | 10.84% | 22.67% | 23.73% | (45.76% | ) | 7.79% | |||||||||||||||||
Ratios/Supplemental Data: | ||||||||||||||||||||||||
Net assets at end of period (000’s omitted) | $93,201 | $79,550 | $55,876 | $30,101 | $17,994 | $39,635 | ||||||||||||||||||
Ratio to average net assets of: | ||||||||||||||||||||||||
Expenses | 0.35% | 0.35% | 0.35% | 0.35% | 0.35% | 0.35% | ||||||||||||||||||
Net investment income | 1.63% | 1.44% | 1.38% | 2.92% | 3.63% | 2.15% | ||||||||||||||||||
Portfolio turnover rate† | 34% | 23% | 27% | 45% | 53% | 26% | ||||||||||||||||||
| * | Based on average shares outstanding. |
| ** | Total investment return is calculated assuming an initial investment made at the net asset value at the beginning of the period, reinvestment of all dividends and distribution at net asset value during the period, and redemption on the last day of the period. Transaction fees are not reflected in the calculation of total investment return. Total investment return calculated for a period of less than one year is not annualized. |
| † | Portfolio turnover is not annualized and does not include securities received or delivered from processing creations or redemptions. |
| 42 | GUGGENHEIM ETFS SEMI-ANNUAL REPORT | See Notes to Financial Statements. |
Table of Contents
GUGGENHEIM S&P 500 PURE GROWTH ETF |
FINANCIAL HIGHLIGHTS (continued)
| Six Months Ended April 30, 2012 (Unaudited) | Year Ended October 31, 2011 | Year Ended October 31, 2010 | Year Ended October 31, 2009 | Year Ended October 31, 2008 | Year Ended October 31, 2007 | |||||||||||||||||||
Per Share Operating Performance: |
| |||||||||||||||||||||||
Net asset value at beginning of period | $44.68 | $40.40 | $30.85 | $24.40 | $39.59 | $35.30 | ||||||||||||||||||
Net investment income* | 0.17 | 0.18 | 0.13 | 0.18 | 0.20 | 0.25 | ||||||||||||||||||
Net realized and unrealized gain (loss) on investments | 4.36 | 4.28 | 9.57 | 6.46 | (15.19 | ) | 4.26 | |||||||||||||||||
|
|
|
|
|
|
|
|
|
|
|
| |||||||||||||
Total from investment operations | 4.53 | 4.46 | 9.70 | 6.64 | (14.99 | ) | 4.51 | |||||||||||||||||
Distributions to shareholders from: | ||||||||||||||||||||||||
Net investment income | (0.16 | ) | (0.18 | ) | (0.15 | ) | (0.19 | ) | (0.20 | ) | (0.22 | ) | ||||||||||||
Net asset value at end of period | $49.05 | $44.68 | $40.40 | $30.85 | $24.40 | $39.59 | ||||||||||||||||||
|
|
|
|
|
|
|
|
|
|
|
| |||||||||||||
Total Return** | 10.16% | 11.06% | 31.51% | 27.41% | (38.00% | ) | 12.79% | |||||||||||||||||
Ratios/Supplemental Data: | ||||||||||||||||||||||||
Net assets at end of period (000’s omitted) | $321,292 | $265,889 | $147,470 | $38,568 | $24,398 | $63,340 | ||||||||||||||||||
Ratio to average net assets of: | ||||||||||||||||||||||||
Expenses | 0.35% | 0.35% | 0.35% | 0.35% | 0.35% | 0.35% | ||||||||||||||||||
Net investment income | 0.75% | 0.41% | 0.37% | 0.69% | 0.57% | 0.66% | ||||||||||||||||||
Portfolio turnover rate† | 34% | 21% | 31% | 27% | 30% | 24% | ||||||||||||||||||
| * | Based on average shares outstanding. |
| ** | Total investment return is calculated assuming an initial investment made at the net asset value at the beginning of the period, reinvestment of all dividends and distribution at net asset value during the period, and redemption on the last day of the period. Transaction fees are not reflected in the calculation of total investment return. Total investment return calculated for a period of less than one year is not annualized. |
| † | Portfolio turnover is not annualized and does not include securities received or delivered from processing creations or redemptions. |
| See Notes to Financial Statements. | GUGGENHEIM ETFS SEMI-ANNUAL REPORT | 43 |
Table of Contents
GUGGENHEIM S&P MIDCAP 400 PURE VALUE ETF
| FINANCIAL HIGHLIGHTS (continued) |
| Six Months Ended April 30, 2012 (Unaudited) | Year Ended October 31, 2011 | Year Ended October 31, 2010 | Year Ended October 31, 2009 | Year Ended October 31, 2008 | Year Ended October 31, 2007 | |||||||||||||||||||
Per Share Operating Performance: |
| |||||||||||||||||||||||
Net asset value at beginning of period | $31.00 | $30.77 | $24.20 | $20.24 | $35.76 | $33.27 | ||||||||||||||||||
Net investment income* | 0.23 | 0.41 | 0.36 | 0.59 | 0.87 | 0.82 | ||||||||||||||||||
Net realized and unrealized gain (loss) on investments | 4.54 | 0.22 | 6.57 | 3.92 | (15.54 | ) | 2.48 | |||||||||||||||||
|
|
|
|
|
|
|
|
|
|
|
| |||||||||||||
Total from investment operations | 4.77 | 0.63 | 6.93 | 4.51 | (14.67 | ) | 3.30 | |||||||||||||||||
Distributions to shareholders from: | ||||||||||||||||||||||||
Net investment income | (0.24 | ) | (0.40 | ) | (0.36 | ) | (0.55 | ) | (0.84 | ) | (0.81 | ) | ||||||||||||
Net asset value at end of period | $35.53 | $31.00 | $30.77 | $24.20 | $20.24 | $35.76 | ||||||||||||||||||
|
|
|
|
|
|
|
|
|
|
|
| |||||||||||||
Total Return** | 15.41% | 2.03% | 28.75% | 23.32% | (41.75% | ) | 9.94% | |||||||||||||||||
Ratios/Supplemental Data: |
| |||||||||||||||||||||||
Net assets at end of period (000’s omitted) | $35,543 | $35,671 | $43,089 | $22,997 | $10,126 | $21,458 | ||||||||||||||||||
Ratio to average net assets of: | ||||||||||||||||||||||||
Expenses | 0.35% | 0.35% | 0.35% | 0.35% | 0.35% | 0.35% | ||||||||||||||||||
Net investment income | 1.39% | 1.22% | 1.20% | 2.90% | 2.87% | 2.28% | ||||||||||||||||||
Portfolio turnover rate† | 42% | 49% | 35% | 57% | 64% | 46% | ||||||||||||||||||
| * | Based on average shares outstanding. |
| ** | Total investment return is calculated assuming an initial investment made at the net asset value at the beginning of the period, reinvestment of all dividends and distribution at net asset value during the period, and redemption on the last day of the period. Transaction fees are not reflected in the calculation of total investment return. Total investment return calculated for a period of less than one year is not annualized. |
| † | Portfolio turnover is not annualized and does not include securities received or delivered from processing creations or redemptions. |
| 44 | GUGGENHEIM ETFS SEMI-ANNUAL REPORT | See Notes to Financial Statements. |
Table of Contents
GUGGENHEIM S&P MIDCAP 400 PURE GROWTH ETF
| FINANCIAL HIGHLIGHTS (continued) |
| Six Months Ended April 30, 2012 (Unaudited) | Year Ended October 31, 2011 | Year Ended October 31, 2010 | Year Ended October 31, 2009 | Year Ended October 31, 2008 | Year Ended October 31, 2007 | |||||||||||||||||||
Per Share Operating Performance: |
| |||||||||||||||||||||||
Net asset value at beginning of period | $82.17 | $70.46 | $52.89 | $39.10 | $59.75 | $50.10 | ||||||||||||||||||
Net investment income* | 0.06 | 0.07 | 0.02 | 0.09 | 0.02 | 0.33 | ||||||||||||||||||
Net realized and unrealized gain (loss) on investments | 7.77 | 11.72 | 17.59 | 13.79 | (20.63 | ) | 9.73 | |||||||||||||||||
|
|
|
|
|
|
|
|
|
|
|
| |||||||||||||
Total from investment operations | 7.83 | 11.79 | 17.61 | 13.88 | (20.61 | ) | 10.06 | |||||||||||||||||
Distributions to shareholders from: | ||||||||||||||||||||||||
Net investment income | (0.07 | ) | (0.08 | ) | (0.04 | ) | (0.09 | ) | (0.04 | ) | (0.27 | ) | ||||||||||||
Net realized gains | — | — | — | — | — | (0.14 | ) | |||||||||||||||||
|
|
|
|
|
|
|
|
|
|
|
| |||||||||||||
Total distributions | (0.07 | ) | (0.08 | ) | (0.04 | ) | (0.09 | ) | (0.04 | ) | (0.41 | ) | ||||||||||||
Net asset value at end of period | $89.93 | $82.17 | $70.46 | $52.89 | $39.10 | $59.75 | ||||||||||||||||||
|
|
|
|
|
|
|
|
|
|
|
| |||||||||||||
Total Return** | 9.53% | 16.73% | 33.32% | 35.59% | (34.52% | ) | 20.17% | |||||||||||||||||
Ratios/Supplemental Data: | ||||||||||||||||||||||||
Net assets at end of period (000’s omitted) | $602,560 | $653,246 | $292,429 | $108,432 | $17,596 | $20,914 | ||||||||||||||||||
Ratio to average net assets of: | ||||||||||||||||||||||||
Expenses | 0.35% | 0.35% | 0.35% | 0.35% | 0.35% | 0.35% | ||||||||||||||||||
Net investment income | 0.15% | 0.09% | 0.03% | 0.19% | 0.04% | 0.60% | ||||||||||||||||||
Portfolio turnover rate† | 41% | 45% | 51% | 29% | 52% | 53% | ||||||||||||||||||
| * | Based on average shares outstanding. |
| ** | Total investment return is calculated assuming an initial investment made at the net asset value at the beginning of the period, reinvestment of all dividends and distribution at net asset value during the period, and redemption on the last day of the period. Transaction fees are not reflected in the calculation of total investment return. Total investment return calculated for a period of less than one year is not annualized. |
| † | Portfolio turnover is not annualized and does not include securities received or delivered from processing creations or redemptions. |
| See Notes to Financial Statements. | GUGGENHEIM ETFS SEMI-ANNUAL REPORT | 45 |
Table of Contents
GUGGENHEIM S&P SMALLCAP 600 PURE VALUE ETF
FINANCIAL HIGHLIGHTS (continued)
| Six Months Ended April 30, 2012 (Unaudited) | Year Ended October 31, 2011 | Year Ended October 31, 2010 | Year Ended October 31, 2009 | Year Ended October 31, 2008 | Year Ended October 31, 2007 | |||||||||||||||||||
Per Share Operating Performance: |
| |||||||||||||||||||||||
Net asset value at beginning of period | $35.50 | $34.27 | $28.50 | $23.21 | $37.38 | $40.13 | ||||||||||||||||||
Net investment income* | 0.14 | 0.20 | 0.20 | 0.32 | 0.79 | 0.74 | ||||||||||||||||||
Net realized and unrealized gain (loss) on investments | 4.04 | 1.23 | 5.78 | 5.29 | (14.26 | ) | (2.85 | ) | ||||||||||||||||
|
|
|
|
|
|
|
|
|
|
|
| |||||||||||||
Total from investment operations | 4.18 | 1.43 | 5.98 | 5.61 | (13.47 | ) | (2.11 | ) | ||||||||||||||||
Distributions to shareholders from: | ||||||||||||||||||||||||
Net investment income | (0.12 | ) | (0.20 | ) | (0.21 | ) | (0.32 | ) | (0.70 | ) | (0.62 | ) | ||||||||||||
Net realized gains | — | — | — | — | — | (0.02 | ) | |||||||||||||||||
|
|
|
|
|
|
|
|
|
|
|
| |||||||||||||
Total distributions | (0.12 | ) | (0.20 | ) | (0.21 | ) | (0.32 | ) | (0.70 | ) | (0.64 | ) | ||||||||||||
Net asset value at end of period | $39.56 | $35.50 | $34.27 | $28.50 | $23.21 | $37.38 | ||||||||||||||||||
|
|
|
|
|
|
|
|
|
|
|
| |||||||||||||
Total Return** | 11.76% | 4.16% | 21.07% | 25.00% | (36.48% | ) | (5.38% | ) | ||||||||||||||||
Ratios/Supplemental Data: | ||||||||||||||||||||||||
Net assets at end of period (000’s omitted) | $77,144 | $62,130 | $87,383 | $108,284 | $25,527 | $22,426 | ||||||||||||||||||
Ratio to average net assets of: | ||||||||||||||||||||||||
Expenses | 0.35% | 0.35% | 0.35% | 0.35% | 0.35% | 0.35% | ||||||||||||||||||
Net investment income | 0.73% | 0.53% | 0.60% | 1.18% | 2.57% | 1.78% | ||||||||||||||||||
Portfolio turnover rate† | 44% | 76% | 62% | 43% | 50% | 37% | ||||||||||||||||||
| * | Based on average shares outstanding. |
| ** | Total investment return is calculated assuming an initial investment made at the net asset value at the beginning of the period, reinvestment of all dividends and distribution at net asset value during the period, and redemption on the last day of the period. Transaction fees are not reflected in the calculation of total investment return. Total investment return calculated for a period of less than one year is not annualized. |
| † | Portfolio turnover is not annualized and does not include securities received or delivered from processing creations or redemptions. |
| 46 | GUGGENHEIM ETFS SEMI-ANNUAL REPORT | See Notes to Financial Statements. |
Table of Contents
GUGGENHEIM S&P SMALLCAP 600 PURE GROWTH ETF
| FINANCIAL HIGHLIGHTS (concluded) |
| Six Months Ended April 30, 2012 (Unaudited) | Year Ended October 31, 2011 | Year Ended October 31, 2010 | Year Ended October 31, 2009 | Year Ended October 31, 2008 | Year Ended October 31, 2007 | |||||||||||||||||||
Per Share Operating Performance: |
| |||||||||||||||||||||||
Net asset value at beginning of period | $49.82 | $43.32 | $34.13 | $29.03 | $44.92 | $39.10 | ||||||||||||||||||
Net investment income* | 0.16 | 0.02 | 0.06 | 0.06 | 0.17 | — | ||||||||||||||||||
Net realized and unrealized gain (loss) on investments | 4.90 | 6.57 | 9.18 | 5.13 | (15.87 | ) | 5.84 | |||||||||||||||||
|
|
|
|
|
|
|
|
|
|
|
| |||||||||||||
Total from investment operations | 5.06 | 6.59 | 9.24 | 5.19 | (15.70 | ) | 5.84 | |||||||||||||||||
Distributions to shareholders from: | ||||||||||||||||||||||||
Net investment income | (0.13 | ) | (0.09 | ) | (0.05 | ) | (0.09 | ) | (0.19 | ) | (0.02 | ) | ||||||||||||
Net asset value at end of period | $54.75 | $49.82 | $43.32 | $34.13 | $29.03 | $44.92 | ||||||||||||||||||
|
|
|
|
|
|
|
|
|
|
|
| |||||||||||||
Total Return** | 10.16% | 15.22% | 27.11% | 17.93% | (35.05% | ) | 14.93% | |||||||||||||||||
Ratios/Supplemental Data: | ||||||||||||||||||||||||
Net assets at end of period (000’s omitted) | $79,388 | $34,873 | $17,329 | $11,945 | $7,257 | $11,229 | ||||||||||||||||||
Ratio to average net assets of: | ||||||||||||||||||||||||
Expenses | 0.35% | 0.35% | 0.35% | 0.35% | 0.35% | 0.35% | ||||||||||||||||||
Net investment income | 0.59% | 0.03% | 0.14% | 0.21% | 0.44% | —% | ||||||||||||||||||
Portfolio turnover rate† | 42% | 33% | 55% | 46% | 63% | 51% | ||||||||||||||||||
| * | Based on average shares outstanding. |
| ** | Total investment return is calculated assuming an initial investment made at the net asset value at the beginning of the period, reinvestment of all dividends and distribution at net asset value during the period, and redemption on the last day of the period. Transaction fees are not reflected in the calculation of total investment return. Total investment return calculated for a period of less than one year is not annualized. |
| † | Portfolio turnover is not annualized and does not include securities received or delivered from processing creations or redemptions. |
| See Notes to Financial Statements. | GUGGENHEIM ETFS SEMI-ANNUAL REPORT | 47 |
Table of Contents
NOTES TO FINANCIAL STATEMENTS (Unaudited)
|
1. Organization
Rydex ETF Trust (the “Trust”) is an open-end, management investment company registered under the Investment Company Act of 1940 (the “1940 Act”). The Trust was organized as a Delaware statutory trust on November 22, 2002. As of April 30, 2012, the Trust offers twenty-six portfolios, each of which represents a separate series of beneficial interest in the Trust (each a “Fund”, and collectively, the “Funds”). The financial statements herein relate to the following Funds: Guggenheim Russell Top 50® ETF, Guggenheim S&P 500 Pure Value ETF, Guggenheim S&P 500 Pure Growth ETF, Guggenheim S&P MidCap 400 Pure Value ETF, Guggenheim S&P 400 Pure Growth ETF, Guggenheim S&P SmallCap 600 Pure Value ETF and Guggenheim S&P SmallCap 600 Pure Growth ETF. Guggenheim Russell Top 50® ETF commenced operations on May 4, 2005. Guggenheim S&P 500 Pure Value ETF, Guggenheim S&P 500 Pure Growth ETF, Guggenheim S&P MidCap 400 Pure Value ETF, Guggenheim S&P MidCap 400 Pure Growth ETF, Guggenheim S&P SmallCap 600 Pure Value ETF and Guggenheim S&P SmallCap 600 Pure Growth ETF commenced operations on March 1, 2006.
The Funds’ investment objective is to replicate as closely as possible, before fees and expenses, the daily performance of an index representing publicly traded equity securities (the “Underlying Index”). The Guggenheim Russell Top 50® ETF tracks the Russell Top 50® Index. The Guggenheim S&P 500 Pure Value ETF tracks the S&P 500 Pure Value Index, the Guggenheim S&P 500 Pure Growth ETF tracks the S&P 500 Pure Growth Index, the Guggenheim S&P MidCap 400 Pure Value ETF tracks the S&P MidCap 400 Pure Value Index, the Guggenheim S&P MidCap 400 Pure Growth ETF tracks the S&P MidCap 400 Pure Growth Index, the Guggenheim S&P SmallCap 600 Pure Value ETF tracks the S&P SmallCap 600 Pure Value Index and the Guggenheim S&P SmallCap 600 Pure Growth ETF tracks the S&P SmallCap 600 Pure Growth Index. The Funds seek to achieve their objective by investing in common stocks or ETFs, where applicable, that comprise the Underlying Index. The Funds use a “replication” strategy to track the Underlying Index. “Replication” refers to investing in substantially all of the securities in the Underlying Index in approximately the same proportions as in the Underlying Index.
The Funds operate as index funds and are not actively managed. Adverse performance of a security in the Funds’ portfolio will ordinarily not result in the elimination of the security from the Funds’ portfolio.
The Funds issue and redeem shares on a continuous basis, at Net Asset Value per share (“NAV”), only in aggregation of 50,000 shares called a “Creation Unit”. Creation Units are issued and redeemed principally in-kind for securities included in the Underlying Index.
Guggenheim Investments (“GI”) provides advisory services and Rydex Distributors, LLC (“RDL”) acts as principal underwriter for the Trust. GI and RDL are affiliated entities.
2. Significant Accounting Policies
The following significant accounting policies are in conformity with U.S. generally accepted accounting principles (“U.S. GAAP”) and are consistently followed by the Trust. This requires management to make estimates and assumptions that affect the reported amount of assets and liabilities and disclosure of contingent assets and liabilities at the date of the financial statements and the reported amounts of revenues and expenses during the reporting period. Actual results could differ from these estimates. All time references are based on Eastern Time.
A. Security Valuation
Equity securities listed on an exchange (New York Stock Exchange (“NYSE”) or American Stock Exchange) are valued at the last quoted sales price as of the close of business on the NYSE on the valuation date. Equity securities listed on the NASDAQ market system are valued at the NASDAQ Official Closing Price on the valuation date.
Investments for which market quotations are not readily available are fair valued as determined in good faith by GI under the direction of the Board of Trustees using methods established or ratified by the Board of Trustees. These methods include, but are not limited to: (i) using general information as to how these securities and assets trade; and (ii) using other information and considerations, including current values in related markets.
B. Security Transactions and Income Recognition
Security transactions are recorded on the trade date for financial reporting purposes. Realized gains and losses from securities transactions are recorded using the identified cost basis. Proceeds from lawsuits related to investment holdings are recorded as realized gains. Dividend income is recorded on the ex-dividend date, net of applicable taxes withheld by foreign countries. Taxable non-cash dividends are recorded as dividend income. Interest income, including amortization of premiums and accretion of discount, is accrued on a daily basis. Distributions received from investments in REITs are recorded as dividend income on the ex-dividend date, subject to reclassification upon notice of the character of such distribution by the issuer.
C. Repurchase Agreements
The Funds may enter into repurchase agreements with financial institutions. In a repurchase agreement, a Fund buys a security and the seller simultaneously agrees to repurchase the security on a specified future date at an agreed-upon price. The repurchase price reflects an agreed-upon interest rate during
| 48 | GUGGENHEIM ETFS SEMI-ANNUAL REPORT |
Table of Contents
| NOTES TO FINANCIAL STATEMENTS (Unaudited) (continued) |
the time the Fund’s money is invested in the security. Because the security constitutes collateral for the repurchase obligation, a repurchase agreement can be considered a collateralized loan. The Funds follow certain procedures designed to minimize the risks inherent in such agreements. These procedures include effecting repurchase transactions only with large, well-capitalized and well-established financial institutions whose condition will be continually monitored by GI. In addition, the value of the collateral underlying the repurchase agreement will always be at least equal to the repurchase price, including any accrued interest earned on the repurchase agreement. In the event of a default or bankruptcy by a selling financial institution, the Funds will seek to liquidate such collateral. However, the exercising of the Funds right to liquidate such collateral could involve certain costs or delays and, to the extent that proceeds from any sale upon a default of the obligation to repurchase were less than the repurchase price, the Funds could suffer a loss. It is the current policy of the Funds not to invest in repurchase agreements that do not mature within seven days if any such investment, together with any other illiquid assets held by the Funds, amounts to more than 15% of a Funds net assets. The investments of the Funds in repurchase agreements, at times, may be substantial when, in the view of GI, liquidity or other considerations so warrant. For the period ended April 30, 2012, the Funds had not engaged in repurchase agreement transactions.
D. Federal Income Taxes
The Funds intend to comply with the provisions of Subchapter M of the Internal Revenue Code applicable to regulated investment companies and will distribute substantially all taxable net investment income and capital gains sufficient to relieve the Funds from all, or substantially all, federal income, excise and state income taxes. Therefore, no provision for Federal or state income tax is required.
Tax positions taken or expected to be taken in the course of preparing the Funds’ tax returns are evaluated to determine whether the tax positions are “more-likely-than-not” of being sustained by the applicable tax authority. Tax positions not
deemed to meet the more-likely-than-not threshold would be recorded as a tax benefit or expense in the current year. Management has analyzed the Funds’ tax positions taken, or to be taken, on Federal income tax returns for all open tax years (fiscal years 2008-2011), and has concluded that no provision for income tax was required in the Funds’ financial statements.
The RIC Modernization Act of 2010 was signed into law on December 22, 2010 and seeks to simplify some of the tax provisions applicable to regulated investment companies and the tax reporting to their shareholders, and to improve the tax efficiency of certain fund structures. The changes are generally effective for taxable years beginning after the date of enactment.
One of the more prominent changes addresses capital loss carryforwards. Funds will be permitted to carry forward capital losses incurred in taxable years beginning after December 22, 2010 for an unlimited period. However, any losses incurred during those future taxable years will be required to be utilized prior to the losses incurred in pre-enactment taxable years. Under pre-enactment law, capital losses could be carried forward for eight years, and carried forward as short-term capital, irrespective of the character of the original loss. As a result of this ordering rule, pre-enactment capital loss carryforwards may potentially expire unused. Additionally, post-enactment capital losses that are carried forward will retain their character as either short-term or long-term capital losses rather than being considered all short-term as under previous law.
For the period ended April 30, 2012, the Funds realized net capital gains resulting from in-kind redemptions and other transactions. Because gains from in-kind redemptions are non-taxable to the Funds, and are not distributed to existing Fund shareholders, the gains are reclassified from accumulated net realized gains to paid-in-capital at the end of the Funds’ tax year. These reclassifications have no effect on net assets or NAV. The in-kind net capital gains for the period ended April 30, 2012 are disclosed in the Fund’s Statement of Operations.
At April 30, 2012, the identified cost of investments in securities owned by each Fund for Federal income tax purposes and the gross unrealized appreciation and depreciation were as follows:
| Identified Cost | Gross Unrealized Appreciation | Gross Unrealized Depreciation | Net Unrealized (Depreciation) | |||||||||||||
Guggenheim Russell Top 50® ETF | $ | 485,776,169 | $ | 46,101,517 | $ | (47,031,783 | ) | $ | (930,266 | ) | ||||||
Guggenheim S&P 500 Pure Value ETF | 93,140,553 | 6,066,868 | (5,969,804 | ) | 97,064 | |||||||||||
Guggenheim S&P 500 Pure Growth ETF | 287,466,674 | 45,557,533 | (11,755,970 | ) | 33,801,563 | |||||||||||
Guggenheim S&P Midcap 400 Pure Value ETF | 33,724,877 | 3,513,868 | (1,679,498 | ) | 1,834,370 | |||||||||||
Guggenheim S&P Midcap 400 Pure Growth ETF | 543,332,656 | 89,011,820 | (29,673,253 | ) | 59,338,567 | |||||||||||
Guggenheim S&P Smallcap 600 Pure Value ETF | 77,976,924 | 7,607,344 | (8,364,009 | ) | (756,665) | |||||||||||
Guggenheim S&P Smallcap 600 Pure Growth ETF | 75,350,069 | 7,427,762 | (3,371,923 | ) | 4,055,839 | |||||||||||
E. Fair Value Measurement
In accordance with U.S. GAAP, fair value is defined as the price that the Fund would receive to sell an investment or pay to transfer a liability in an orderly transaction with an independent buyer in the principal market, or, in the absence of a principal market, the most
| GUGGENHEIM ETFS SEMI-ANNUAL REPORT | 49 |
Table of Contents
NOTES TO FINANCIAL STATEMENTS (Unaudited) (continued)
|
advantageous market for the investment or liability. A three-tier hierarchy is utilized to distinguish between (1) inputs that reflect the assumptions market participants would use in pricing an asset or liability developed based on market data obtained from sources independent of the reporting entity (observable inputs) and (2) inputs that reflect the reporting entity’s own assumptions about the assumptions market participants would use in pricing an asset or liability developed based on the best information available in the circumstances (unobservable inputs) and to establish classification of fair value measurements for disclosure purposes. Various inputs are used in determining the value of the Funds’ investments. The inputs are summarized in the three broad levels listed below:
| Level 1 — | quoted prices in active markets for identical securities. |
| Level 2 — | other significant observable inputs (including quoted prices for similar securities, interest rates, prepayment speeds, credit risk, etc.). |
| Level 3 — | significant unobservable inputs (including the fund’s own assumptions used to determine the fair value of investments). |
The inputs or methodologies used for valuing securities are not necessarily an indication of the risk associated with investing in those securities.
The following table summarizes the inputs used to value the Funds’ net assets as of April 30, 2012:
| Fund | Level 1 Investments in Securities | Level 2 Investments in Securities | Level 3 Investments in Securities | Total | ||||||||||||
Guggenheim Russell Top 50® ETF | $ | 484,845,903 | $ | — | $ | — | $ | 484,845,903 | ||||||||
Guggenheim S&P 500 Pure Value ETF | 93,237,617 | — | — | 93,237,617 | ||||||||||||
Guggenheim S&P 500 Pure Growth ETF | 321,268,237 | — | — | 321,268,237 | ||||||||||||
Guggenheim S&P MidCap 400 Pure Value ETF | 35,559,247 | — | — | 35,559,247 | ||||||||||||
Guggenheim S&P MidCap 400 Pure Growth ETF | 602,671,223 | — | — | 602,671,223 | ||||||||||||
Guggenheim S&P SmallCap 600 Pure Value ETF | 77,220,259 | — | — | 77,220,259 | ||||||||||||
Guggenheim S&P SmallCap 600 Pure Growth ETF | 79,405,908 | — | — | 79,405,908 | ||||||||||||
For the period ended April 30, 2012, there were no transfers between levels.
F. Dividends and Distributions
Distributions of net investment income and net realized gains, if any, in all the Funds, are declared at least annually and recorded on the ex-dividend date and are determined in accordance with income tax regulations which may differ from U.S. GAAP.
G. Risk and Uncertainties
The Funds invest in various investments which are exposed to risk, such as market risk. Due to the level of risk associated with certain investments it is at least reasonably possible that changes in the values of investment securities will occur in the near term and that such changes could materially affect amounts reported in the financial statements. The Guggenheim Russell Top 50® ETF is a non-diversified fund, subjecting it to a greater risk than a fund that is diversified.
H. Risk Disclosure
Throughout the normal course of business, the Funds enter into contracts that contain a variety of representations and warranties which provide general indemnifications. The Funds’ maximum exposure under these arrangements is unknown, as this would involve future claims that may be made against the Funds and/or their affiliates that have not yet occurred. However, based on experience the Funds expect the risk of loss to be remote.
3. Advisory, Administration and Other Transactions with Affiliates
GI determines the composition of the portfolio of securities that must be delivered in exchange for the issuance of Creation Units and periodically adjusts the composition of the portfolio of the Funds to conform to changes in the composition of the relevant index. For these services, GI receives a management fee at the annual rate shown below as a percentage of the average daily net assets of the Funds.
| Advisory Fee | ||||
Guggenheim Russell Top 50® ETF | 0.20 | % | ||
Guggenheim S&P 500 Pure Value ETF | 0.35 | % | ||
Guggenheim S&P 500 Pure Growth ETF | 0.35 | % | ||
Guggenheim S&P MidCap 400 Pure Value ETF | 0.35 | % | ||
Guggenheim S&P MidCap 400 Pure Growth ETF | 0.35 | % | ||
Guggenheim S&P SmallCap 600 Pure Value ETF | 0.35 | % | ||
Guggenheim S&P SmallCap 600 Pure Growth ETF | 0.35 | % | ||
GI pays all expenses of the Funds, including the cost of transfer agency, custody, fund administration, legal, audit and other services, except: interest, taxes, distribution fees or expenses and extraordinary expenses.
Under an Administration Agreement, State Street Bank and Trust Company (the “Administrator”) provides various administrative and accounting services for the maintenance and operations of the Funds. Under a Custodian Agreement with the Trust, the Administrator maintains cash, securities and
| 50 | GUGGENHEIM ETFS SEMI-ANNUAL REPORT |
Table of Contents
| NOTES TO FINANCIAL STATEMENTS (Unaudited) (continued) |
other assets of the Funds in separate accounts for each Fund, keeps all necessary accounts and records, and provides other services. The Administrator is required, upon the order of the Trust, to deliver securities held by the Custodian and to make payments for securities purchased by the Trust for the Funds. Pursuant to a Transfer Agency and Service Agreement with the Trust, the Administrator acts as a transfer agent for the Trust’s authorized and issued shares of beneficial interest, and as dividend disbursing agent of the Trust. GI compensates the Administrator directly for the foregoing services.
The Funds have adopted a Distribution Plan (the “Plan”) that allows the Funds to pay distribution fees to RDL and other firms that provide distribution services (“Service Providers”). If a Service Provider provides distribution services, the Funds will pay distribution fees to RDL at an annual rate not to exceed 0.25% of average daily net assets, pursuant to Rule 12b-1 of the 1940 Act. RDL will, in turn, pay the Service Provider out of its fees. No such fee is currently charged to the Funds.
4. Capital
At April 30, 2012, there were an unlimited number of no par value shares of beneficial interest authorized. There is a
minimum transaction fee per transaction to those persons purchasing or redeeming Creation Units. An additional charge of up to three times the standard transaction fee may be imposed for purchases and redemptions effected outside the National Securities Clearing Corporation usual clearing process or for cash. Such transactions are generally permitted on an in-kind basis, with a balancing cash component to equate the transaction to the NAV of the Fund on the transaction date. Transaction fees are not charged to or paid by the Funds. The minimum transaction fees are:
| Minimum Transaction Fee | ||||
Guggenheim Russell Top 50® ETF | $ | 500 | ||
Guggenheim S&P 500 Pure Value ETF | 1,000 | |||
Guggenheim S&P 500 Pure Growth ETF | 1,000 | |||
Guggenheim S&P MidCap 400 Pure Value ETF | 750 | |||
Guggenheim S&P MidCap 400 Pure Growth ETF | 750 | |||
Guggenheim S&P SmallCap 600 Pure Value ETF | 1,000 | |||
Guggenheim S&P SmallCap 600 Pure Growth ETF | 1,000 | |||
5. Investment Transactions
For the period ended April 30, 2012, the Funds had investment transactions in-kind associated with subscriptions and redemptions as follows:
| Subscriptions | Redemptions | |||||||
Guggenheim Russell Top 50® ETF | 178,670,203 | 204,409,246 | ||||||
Guggenheim S&P 500 Pure Value ETF | 17,450,694 | 10,794,081 | ||||||
Guggenheim S&P 500 Pure Growth ETF | 55,121,084 | 26,521,975 | ||||||
Guggenheim S&P MidCap 400 Pure Value ETF | 3,124,192 | 8,686,567 | ||||||
Guggenheim S&P MidCap 400 Pure Growth ETF | 74,675,840 | 170,775,071 | ||||||
Guggenheim S&P SmallCap 600 Pure Value ETF | 8,290,896 | — | ||||||
Guggenheim S&P SmallCap 600 Pure Growth ETF | 40,735,432 | 2,728,541 | ||||||
Purchases and sales of investment securities (excluding short-term investments, U.S. government and government agency obligations) for the Funds were as follows:
| Purchases | Sales | |||||||
Guggenheim Russell Top 50® ETF | $ | 6,073,884 | $ | 5,638,934 | ||||
Guggenheim S&P 500 Pure Value ETF | 28,423,576 | 31,857,144 | ||||||
Guggenheim S&P 500 Pure Growth ETF | 98,320,919 | 98,031,643 | ||||||
Guggenheim S&P MidCap 400 Pure Value ETF | 16,341,131 | 17,803,075 | ||||||
Guggenheim S&P MidCap 400 Pure Growth ETF | 260,697,666 | 243,944,473 | ||||||
Guggenheim S&P SmallCap 600 Pure Value ETF | 30,865,787 | 31,042,923 | ||||||
Guggenheim S&P SmallCap 600 Pure Growth ETF | 28,939,105 | 26,998,264 | ||||||
There were no purchases or sales of U.S. government or government agency obligations for the period ended April 30, 2012.
6. Legal Proceedings
Tribune Company
Rydex ETF Trust has been named as a defendant and a putative member of the proposed defendant class of shareholders in the case entitled Official Committee of Unsecured Creditors of Tribune Co. v. FitzSimons (In re Tribune Co.), Adv. Pro. No. 10-54010 (Bankr. D. Del.), as a result of ownership of shares in the Tribune Company (“Tribune”) in 2007 by certain series of the Rydex ETF Trust when Tribune effected a leveraged buyout transaction (“LBO”) by which Tribune converted to a privately-held company. In its complaint, the Unsecured Creditors Committee (the “UCC”) has alleged that, in connection with the LBO, insiders and major shareholders were overpaid for their Tribune stock using financing that the insiders knew would, and ultimately did, leave the Tribune insolvent. The UCC
| GUGGENHEIM ETFS SEMI-ANNUAL REPORT | 51 |
Table of Contents
NOTES TO FINANCIAL STATEMENTS (Unaudited) (concluded)
|
has asserted claims against certain insiders, major shareholders, professional advisers, and others involved in the LBO, and is attempting to obtain from these individuals and entities the proceeds paid out in connection with the LBO. This adversary proceeding in the Bankruptcy Court has been stayed pending further order of the Bankruptcy Court.
In June 2011, a group of Tribune creditors, not including the UCC, filed multiple actions involving state law constructive fraudulent conveyance claims against former Tribune shareholders. Rydex ETF Trust also has been named as a defendant in one or more of these suits. These cases have been consolidated in a multidistrict litigation proceeding in the United States District Court for the Southern District of New York and have been stayed pending further order of that court or of the Bankruptcy Court.
None of these lawsuits allege any wrongdoing on the part of Rydex ETF Trust. The following series of Rydex ETF Trust held shares of Tribune and tendered these shares as part of Tribune’s LBO: Guggenheim S&P 500 Pure Value ETF (the “Fund”). The value of the proceeds received by the foregoing Funds was $197,050. At this stage of the proceedings, Rydex ETF Trust is not able to make a reliable predication as to the outcome of these lawsuits or the effect, if any, on the Fund’s net asset value.
Lyondell Chemical Company
Rydex ETF Trust has been named as a defendant in Weisfelner, as Trustee of the LB Creditor Trust v. Fund 1 (In re Lyondell Co.), Adversary Proceeding No. 10-4609 (Bankr. S.D.N.Y.). In this action, the creditors of Lyondell Chemical Company (“Lyondell”) are seeking to recover money paid in connection with a pre-bankruptcy distribution by Lyondell to its shareholders pursuant to a December 2007 merger transaction. When the merger closed on December 20, 2007, all outstanding shares of Lyondell stock were converted into the right to receive $48 in cash. The creditors allege that the merged company, LyondellBasell Industries AF S.C.A., and many of its affiliates and subsidiaries filed for bankruptcy as a direct consequence of the merger transaction. The creditors allege that the shareholder payments constituted a fraud on creditors and should be paid back, and are advancing claims of constructive fraudulent transfer and intentional fraudulent transfer under state law.
This lawsuit does not allege any wrongdoing on the part of Rydex ETF Trust. The following series of Rydex ETF Trust received cash proceeds from the merger in the following amounts: Rydex S&P Midcap 400 Pure Value ETF Fund — $572,640. At this stage of the proceedings, Rydex ETF Trust is not able to make a reliable predication as to the outcome of this lawsuit or the effect, if any, on a fund’s net asset value.
| 52 | GUGGENHEIM ETFS SEMI-ANNUAL REPORT |
Table of Contents
| OTHER INFORMATION (Unaudited) |
Proxy Voting Information
A description of the policies and procedures that the Trust uses to determine how to vote proxies relating to securities held in the Funds’ portfolios is available, without charge and upon request, by calling 1.800.820.0888. This information is also available from the EDGAR database on the SEC’s website at http://www.sec.gov.
Information regarding how the Funds voted proxies relating to portfolio securities, during the most recent 12-month period ended June 30 is available, without charge, upon request, by calling 1.800.820.0888. The information is also available from the EDGAR database on the SEC’s website at http://www.sec.gov.
At a special meeting of shareholders held on January 26, 2012, the shareholders of the Funds voted on whether to approve a new investment advisory agreement between Rydex ETF Trust and Security Investors, LLC. A description of the number of shares voted is as follows:
| Fund | Shares For | Shares Against | Shares Abstained | |||||||||
Guggenheim Russell Top 50® ETF | 2,331,830 | 13,474 | 13,969 | |||||||||
Guggenheim S&P 500 Pure Value ETF | 1,470,710 | 27,115 | 45,005 | |||||||||
Guggenheim S&P 500 Pure Growth ETF | 2,877,038 | 31,565 | 27,507 | |||||||||
Guggenheim S&P MidCap 400 Pure Value ETF | 589,707 | 11,100 | 10,030 | |||||||||
Guggenheim S&P MidCap 400 Pure Growth ETF | 2,934,561 | 40,028 | 32,740 | |||||||||
Guggenheim S&P SmallCap 600 Pure Value ETF | 100,975 | 11 | — | |||||||||
Guggenheim S&P SmallCap 600 Pure Growth ETF | 297,409 | 4,342 | 4,050 | |||||||||
At a special meeting of shareholders held on November 22, 2011, the shareholders of the Funds also voted on whether to approve the election of nominees to the Board of Trustees. A description of the number of shares voted is as follows:
| Donald C. Cacciapaglia | Corey A. Colehour | J. Kenneth Dalton | ||||||||||||||||||
For | 72,100,198 | For | 72,258,142 | For | 72,216,847 | |||||||||||||||
Withhold | 2,135,025 | Withhold | 1,977,081 | Withhold | 2,018,376 | |||||||||||||||
Total | 74,235,223 | Total | 74,235,223 | Total | 74,235,223 | |||||||||||||||
| John O. Demaret | Richard M. Goldman | Werner E. Keller | ||||||||||||||||||
For | 72,234,406 | For | 72,161,702 | For | 72,220,467 | |||||||||||||||
Withhold | 2,000,817 | Withhold | 2,073,521 | Withhold | 2,014,756 | |||||||||||||||
Total | 74,235,223 | Total | 74,235,223 | Total | 74,235,223 | |||||||||||||||
| Thomas F. Lydon | Patrick T. McCarville | Roger Somers | ||||||||||||||||||
For | 72,247,608 | For | 72,174,312 | For | 72,250,544 | |||||||||||||||
Withhold | 1,987,615 | Withhold | 2,060,911 | Withhold | 1,984,679 | |||||||||||||||
Total | 74,235,223 | Total | 74,235,223 | Total | 74,235,223 | |||||||||||||||
At a special meeting of shareholders held on January 26, 2012, the shareholders of the Funds also voted on whether to approve a “manager of managers” arrangement for each of the Funds. Although shareholder votes were placed, not enough votes were received to meet the minimum requirements to constitute a majority vote. As such, the matter was closed.
Quarterly Portfolio Schedules Information
The Trust files its complete schedule of portfolio holdings with the SEC for the first and third quarters of each fiscal year on Form N-Q; which are available on the SEC’s website at http://www.sec.gov. The Funds’ Forms N-Q may be reviewed and copied at the SEC’s Public Reference Room in Washington, DC, and that information on the operation of the Public Reference Room may be obtained by calling 1-800-SEC-0330. Copies of the portfolio holdings are also available to shareholders, without charge and upon request, by calling 1.800.820.0888.
Office Locations
The offices of Guggenheim Investments can be found in the following locations:
40 East 52nd Street
16th Floor
New York, NY 10022
(Headquarters)
Four Irvington Centre
805 King Farm Boulevard
Suite 600
Rockville, MD 20850
9401 Indian Creek Parkway
40 Corporate Woods
Suite 850
Overland Park, KS 66210
| GUGGENHEIM ETFS SEMI-ANNUAL REPORT | 53 |
Table of Contents
OTHER INFORMATION (Unaudited) (concluded)
Premium/Discount Information
Information about the differences between the daily market price on secondary markets for Shares and the NAV of each Fund can be found at www.guggenheimfunds.com.
Guggenheim Transaction
On September 20, 2011, Guggenheim Capital, LLC agreed to purchase the indirect holding company of Security Investors, LLC, the Fund’s investment manager (the “Investment Manager”) (the “Transaction”). Guggenheim Capital, LLC’s subsidiary, Guggenheim Partners, LLC (“Guggenheim”), is a global, independent, privately-held, diversified financial services firm with more than 1,500 dedicated professionals. The Transaction closed on February 29, 2012.
The Transaction should not result in material changes to the day-to-day management and operation of the Fund or any increase in fees.
In anticipation of the Transaction, the Board of Trustees of the Fund (the “Board”) called a special meeting of shareholders (the “Meeting”), at which shareholders of the Fund of record as of October 3, 2011 were asked to consider the approval of a new investment management agreement between the Fund and the Investment Manager (the “New Agreement”). This approval was necessary because, under the Investment Company Act of 1940 (the “1940 Act”), the Transaction could result in the termination of the Fund’s current investment management agreement with the Investment Manager (the “Current Agreement”). The Fund’s shareholders approved the New Agreement, the terms of which are substantially identical to the corresponding Current Agreement, except with respect to the date of execution.
Election of Board Members
The Board also approved a proposal to elect nine individuals to the Board. The Board proposed the election of the following nominees: Donald C. Cacciapaglia, Corey A. Colehour, J. Kenneth Dalton, John O. Demaret, Richard M. Goldman, Werner E. Keller, Thomas F. Lydon, Patrick T. McCarville and Roger Somers. Each of the nominees, other than Mr. Cacciapaglia, currently serves as a Trustee. In connection with the Transaction, the Board believes that expanding the Board to include Mr. Cacciapaglia, who is a member of senior management of Guggenheim’s investment management business, and who would serve on other boards in the Guggenheim Investments family of funds, would be appropriate. The Trusts’ shareholders ultimately approved the aforementioned proposal.
| 54 | GUGGENHEIM ETFS SEMI-ANNUAL REPORT |
Table of Contents
| INFORMATION ON BOARD OF TRUSTEES AND OFFICERS (Unaudited) |
A Board of Trustees oversees the Trust, as well as other trusts of GI, in which its members have no stated term of service, and continue to serve after election until resignation. The Statement of Additional Information includes further information about Fund Trustees and Officers, and can be obtained without charge by calling 800.820.0888.
All Trustees and Officers may be reached c/o Guggenheim Investments, 805 King Farm Boulevard, Suite 600, Rockville, MD 20850.
TRUSTEE AND OFFICER
Name, Position and | Length of Service | Number of | ||||||
Donald C. Cacciapaglia* | Rydex Series Funds – 2012 | 148 | ||||||
| Trustee, President (1951) | Rydex Variable Trust – 2012 | |||||||
Rydex Dynamic Funds – 2012 | ||||||||
Rydex ETF Trust – 2012 |
Principal Occupations During Past Five Years: Security Investors, LLC: President and CEO from April 2012 to present; Guggenheim Investments: President and Chief Administrative Officer from February 2010 to present; Channel Capital Group, Inc.: Chairman and CEO from April 2002 to February 2010.
INDEPENDENT TRUSTEES
Name, Position and | Length of Service | Number of | ||||||
Corey A. Colehour | Rydex Series Funds – 1993 | 148 | ||||||
| Trustee (1945) | Rydex Variable Trust – 1998 | |||||||
Rydex Dynamic Funds – 1999 | ||||||||
Rydex ETF Trust – 2003 |
Principal Occupations During Past Five Years: Retired; Member of the Audit, Governance and Nominating Committees (1995 to present)
J. Kenneth Dalton | Rydex Series Funds – 1995 | 148 | ||||||
| Trustee (1941) | Rydex Variable Trust – 1998 | |||||||
Rydex Dynamic Funds – 1999 | ||||||||
Rydex ETF Trust – 2003 |
Principal Occupations During Past Five Years: Retired; Member of the Governance and Nominating Committees (1995 to present); Chairman of the Audit Committee (1997 to present); Member of the Risk Oversight Committee (2010 to present)
John O. Demaret | Rydex Series Funds – 1997 | 148 | ||||||
| Trustee, Chairman of the | Rydex Variable Trust – 1998 | |||||||
| Board (1941) | Rydex Dynamic Funds – 1999 | |||||||
Rydex ETF Trust – 2003 |
Principal Occupations During Past Five Years: Retired; Member of the Audit Committee (1997 to present); Member of the Risk Oversight Committee (2010 to present)
Werner E. Keller | Rydex Series Funds – 2005 | 148 | ||||||
| Trustee (1940) | Rydex Variable Trust – 2005 | |||||||
Rydex Dynamic Funds – 2005 | ||||||||
Rydex ETF Trust – 2005 |
Principal Occupations During Past Five Years: Founder and President of Keller Partners, LLC (registered investment adviser) (2005 to present); Member of the Audit, Governance and Nominating Committees (2005 to present); Chairman and Member of the Risk Oversight Committee (2010 to present)
| GUGGENHEIM ETFS SEMI-ANNUAL REPORT | 55 |
Table of Contents
| INFORMATION ON BOARD OF TRUSTEES AND OFFICERS (Unaudited) (continued) |
TRUSTEE AND OFFICER – concluded
Name, Position and | Length of Service | Number of | ||||||
Thomas F. Lydon, Jr. | Rydex Series Funds – 2005 | 148 | ||||||
| Trustee (1960) | Rydex Variable Trust – 2005 | |||||||
Rydex Dynamic Funds – 2005 | ||||||||
Rydex ETF Trust – 2005 |
Principal Occupations During Past Five Years: President, Global Trends Investments (1996 to present); Member of the Audit, Governance and Nominating Committees (2005 to present)
Patrick T. McCarville | Rydex Series Funds – 1997 | 148 | ||||||
| Trustee (1942) | Rydex Variable Trust – 1998 | |||||||
Rydex Dynamic Funds – 1999 | ||||||||
Rydex ETF Trust – 2003 |
Principal Occupations During Past Five Years: CEO, Par Industries, Inc., d/b/a Par Leasing (1977 to 2010); Chairman of the Governance and Nominating Committees (1997 to present); Member of the Audit Committee (1997 to present)
Roger Somers | Rydex Series Funds – 1993 | 148 | ||||||
| Trustee (1944) | Rydex Variable Trust – 1998 | |||||||
Rydex Dynamic Funds – 1999 | ||||||||
Rydex ETF Trust – 2003 |
Principal Occupations During Past Five Years: Founder and CEO of Arrow Limousine (1965 to present); Member of the Audit, Governance and Nominating Committees (1995 to present)
EXECUTIVE OFFICERS
Name, Position and | Principal Occupations | |
Michael P. Byrum* Vice President (1970) | Current: President, Security Benefit Asset Management Holdings, LLC; Senior Vice President, Security Investors, LLC; President and Chief Investment Officer, Rydex Holdings, LLC; Director and Chairman of the Board, Advisor Research Center, Inc.; Manager, Rydex Specialized Products, LLC
Previous: Rydex Distributors, LLC (f/k/a Rydex Distributors, Inc.), Vice President (2009); Rydex Fund Services, LLC, Director (2009-2010), Secretary (2002- 2010), Executive Vice President (2002- 2006); Rydex Advisors, LLC (f/k/a PADCO Advisors, Inc.), Director (2008-2010), Chief Investment Officer (2006-2010), President (2004-2010), Secretary (2002-2010); Rydex Advisors II, LLC (f/k/a PADCO Advisors II, Inc.), Director (2008-2010), Chief Investment Officer (2006-2010), President (2004-2010), Secretary (2002-2010); Rydex Capital Partners, LLC, President and Secretary (2003-2007); Rydex Capital Partners II, LLC, (2003-2007); Rydex Holdings, LLC (f/k/a Rydex Holdings, Inc.), Secretary (2005-2008), Executive Vice President (2005-2006); Advisor Research Center, Inc., Secretary (2006-2009), Executive Vice President (2006); Rydex Specialized Products, LLC, Secretary (2005-2008) | |
| 56 | GUGGENHEIM ETFS SEMI-ANNUAL REPORT |
Table of Contents
| INFORMATION ON BOARD OF TRUSTEES AND OFFICERS (Unaudited) (concluded) |
EXECUTIVE OFFICERS – concluded
Name, Position and | Principal Occupations | |
Nikolaos Bonos* Vice President and Treasurer (1963) | Current: Senior Vice President, Security Investors, LLC; Chief Executive Officer and Manager, Rydex Specialized Products, LLC; Chief Executive Officer and President, Rydex Fund Services, LLC; Vice President, Rydex Holdings, LLC; Treasurer, SBL Fund; Security Equity Fund; Security Income Fund; Security Large Cap Value Fund and Security Mid Cap Growth Fund; Vice President, Security Benefit Asset Management Holdings, LLC
Previous: Guggenheim Investments, LLC, Senior Vice President (2010-2011); Rydex Advisors, LLC (f/k/a PADCO Advisors, Inc.) Senior Vice President (2006-2011); Rydex Fund Services, LLC (f/k/a Rydex Fund Services, Inc.), Director (2009), Senior Vice President (2003-2006); Rydex Specialized Products, LLC, Chief Financial Officer (2005-2009) | |
Elisabeth Miller* Chief Compliance Officer (1968) | Current: Chief Compliance Officer, Rydex Series Funds, Rydex Dynamic Funds, Rydex Variable Trust, Rydex ETF Trust, Security Equity Fund, Security Income Fund, Security Large Cap Value Fund, Security Mid Cap Growth Fund, SBL Fund, Security Investors, LLC, and Rydex Distributors, LLC
Previous: Senior Manager, Security Investors, LLC and Rydex Distributors, LLC (2004-2009). | |
Amy J. Lee* Vice President and Assistant Secretary (1960) | Current: Senior Vice President and Secretary, Security Investors, LLC; Secretary and Chief Compliance Officer, Security Distributors, Inc.; Vice President, Associate General Counsel and Assistant Secretary, Security Benefit Life Insurance Company and Security Benefit Corporation; Associate General Counsel, First Security Benefit Life Insurance and Annuity of New York; Vice President and Secretary, SBL Fund; Security Equity Fund; Security Income Fund; Security Large Cap Value Fund and Security Mid Cap Growth Fund; Vice President and Secretary, Rydex Holdings, LLC; Secretary, Advisor Research Center, Inc., Rydex Specialized Products, LLC, Rydex Distributors, LLC and Rydex Fund Services, LLC; Assistant Secretary, Security Benefit Clinic and Hospital
Previous: Guggenheim Investments, LLC, Senior Vice President and Secretary (2007- 2011); Rydex Advisors, LLC (f/k/a PADCO Advisors, Inc.) and Rydex Advisors II, LLC (f/k/a PADCO Advisors II, Inc.), Senior Vice President and Secretary (2010- 2011); Brecek and Young Advisors, Inc., Director (2004-2008) | |
Joseph M. Arruda* Assistant Treasurer (1966) | Current: Assistant Treasurer, SBL Fund; Security Equity Fund; Security Income Fund; Security Large Cap Value Fund and Security Mid Cap Growth Fund; Vice President, Security Investors, LLC; Chief Financial Officer and Manager, Rydex Specialized Products, LLC
Previous: Guggenheim Investments, LLC, Vice President (2010-2011); Rydex Advisors, LLC (f/k/a PADCO Advisors, Inc.) and Rydex Advisors II, LLC (f/k/a PADCO Advisors II, Inc.), Vice President (2004-2011) | |
| * | Officers of the Funds are deemed to be “interested persons” of the Trust, within the meaning of Section 2(a) (19) of the 1940 Act, inasmuch as this person is affiliated with Guggenheim Investments. |
| GUGGENHEIM ETFS SEMI-ANNUAL REPORT | 57 |
Table of Contents

805 King Farm Boulevard, Suite 600
Rockville, MD 20850
www.rydex-sgi.com
800.820.0888
ETF2-SEMI-0412x1012
Table of Contents


APRIL 30, 2012
GUGGENHEIM ETFS
SEMI-ANNUAL REPORT
XLG GUGGENHEIM RUSSELL TOP 50® ETF
RPV GUGGENHEIM S&P 500 PURE VALUE ETF
RPG GUGGENHEIM S&P 500 PURE GROWTH ETF
RFV GUGGENHEIM S&P MIDCAP 400 PURE VALUE ETF
RFG GUGGENHEIM S&P MIDCAP 400 PURE GROWTH ETF
RZV GUGGENHEIM S&P SMALLCAP 600 PURE VALUE ETF
RZG GUGGENHEIM S&P SMALLCAP 600 PURE GROWTH ETF
Table of Contents
| TABLE OF CONTENTS |
| 2 | ||||
| 4 | ||||
| 6 | ||||
| 13 | ||||
| 33 | ||||
| 35 | ||||
| 37 | ||||
| 41 | ||||
| 48 | ||||
| 53 | ||||
| 55 | ||||
| GUGGENHEIM ETFS SEMI-ANNUAL REPORT | 1 |
Table of Contents
|
To Our Shareholders:
A restructuring of Greece’s massive debt, continued accommodation by the world’s major central banks and better news on the U.S. economy helped support financial markets over the six months ended April 30, 2012. Market optimism peaked in early 2012, when several major equity indices pushed to multi-year highs. But the mood grew more cautious late in the period after first-quarter U.S. GDP came in lower than expected and the Federal Reserve suggested that it would not take any additional measures to stimulate the economy. “Operation Twist,” in which the Fed buys longer-dated Treasury securities in order to hold down long-term rates, is set to end in June, and recent history has shown that stocks struggle when stimulus ends.
U.S. equities last fall were rebounding from the loss of the U.S. AAA credit rating in August. But after touching the low for the period in mid-November, improving U.S. economic data and the European Central Bank’s injections of three-year loans into the continent’s banking system gave a boost to markets late in 2011, which carried over into a strong first quarter of 2012. The mild U.S. winter also may have pulled economic, and thus market, activity forward, a notion supported by underlying momentum in consumer spending.
Markets began to get choppy in April, and many investors remained cautious, remembering 2010 and 2011, when U.S. stocks started strong, then experienced broad-based corrections. Besides a continuation of weakness in employment and housing, adding to unsettled markets were softening economic data and concern about the “fiscal cliff” the U.S. faces in 2013 when tax rates will rise unless Congress steps in. In addition, the onset of recession in Europe is complicating that region’s efforts to manage the sovereign debt crisis. Emerging markets in the first quarter of 2012 had their best start in 20 years, but slipped in March on fears of eurozone market contagion and renewed concern that China’s economic growth might slow.
The Fed said in late April that it expected economic growth to remain moderate over coming quarters, but that the unemployment rate will subside gradually and that inflation was under control. To foster growth, the Federal Reserve has said it will leave its key interest rate close to zero at least through 2014, despite arguments by some Fed officials and investors that the Fed may have to consider raising rates much earlier than that to prevent inflation.
Signs that the U.S. economy was expanding at a slow, but sustainable, rate contributed to concern about future inflation, and both short-term and long-term Treasury yields generally moved higher over the first part of 2012. The continued accommodative stance of the Fed, combined with the slow, but stable, economic recovery, is supporting a positive outlook for U.S. fixed income, particularly among corporate issuers, as borrowing costs remain low, default rates currently hover around 2% and strong demand for primary issuance has enabled a steady wave of debt refinancing. Against an improving U.S. macroeconomic backdrop, investment-grade and high-yield corporates are expected to continue to outpace Treasuries.
Commodities, which had been slumping since mid-2011 due to slowing economic activity and the European debt crisis, rebounded in early 2012 on stronger macroeconomic data, but remain volatile. The price of a barrel of oil rose slightly over the six months ended in April, but investors have been shifting out of gold to assets with greater return potential. After peaking at above $1,900 last summer, the price per ounce has fallen back to around $1,600. The dollar strengthened slightly against a basket of other major currencies over the period, reflecting better economic performance in the U.S. versus other markets.
The U.S. economy seems to be decoupling from slowing growth in the rest of the world and from ongoing uncertainty in the European debt crisis, as well as the domestic debate over tax and spending policy. In this resiliency, we see potential in U.S. investments, including equities, high yield bonds, bank loans and other risk assets. It appears that the U.S. may have entered a period of self-sustaining, if modest, economic expansion, driven primarily by the aggressive monetary policy of the Fed and reinforced by the ECB, and is increasingly becoming the economic locomotive of the global economy.
| 2 | GUGGENHEIM ETFS SEMI-ANNUAL REPORT |
Table of Contents
LETTER TO OUR SHAREHOLDERS (concluded)
|
We look forward to continuing our service to you. Thank you for investing in our funds.
Sincerely,

Donald C. Cacciapaglia
President
Performance displayed represents past performance which is no guarantee of future results. Of course, fund performance is subject to daily market volatility and may be better or worse since the end of the last quarter. For up-to-date fund performance, call us at 800.820.0888 or visit www.rydex-sgi.com.
Read each fund’s prospectus and summary prospectus (if available) carefully before investing. It contains the fund’s investment objectives, risks, charges, expenses and other information, which should be considered carefully before investing. Obtain a prospectus and summary prospectus (if available) at www.rydex-sgi.com or call 800.820.0888
The referenced funds are distributed by Rydex Distributors, LLC. Guggenheim Investments represents the investment management business of Guggenheim Partners, LLC, which includes Security Investors, LLC, the investment advisor to the referenced funds. Rydex Distributors, LLC, is affiliated with Guggenheim Partners, LLC and Security Investors, LLC.
| GUGGENHEIM ETFS SEMI-ANNUAL REPORT | 3 |
Table of Contents
|
Shareholder Expense Example
As a shareholder of the Rydex ETF Trust, you incur transaction costs such as creation and redemption fees or brokerage charges, and ongoing costs including advisory fees, trustee fees and, if applicable, distribution fees. All other Trust expenses are paid by the advisor. This Example is intended to help you understand your ongoing costs (in dollars) of investing in a Fund and to compare these costs with the ongoing costs of investing in other mutual funds.
The example in the table is based on an investment of $1,000 invested on October 31, 2011 and held for the six months ended April 30, 2012.
Actual Expenses
The first table below provides information about actual account values and actual expenses. You may use the information in this table, together with the amount you invested, to estimate the expenses that you incurred over the period. Simply divide your account value by $1,000 (for example, an $8,600 account value divided by $1,000 = 8.6), then multiply the result by the number in the first table under the heading entitled “Expenses Paid During the Six-Month Period” to estimate the expenses attributable to your investment during this period.
Hypothetical Example for Comparison Purposes
The second table below provides information about hypothetical account values and hypothetical expenses based on a Fund’s actual expense ratio and an assumed rate of return of 5% per year before expenses, which is not a Fund’s actual return. Thus, you should not use the hypothetical account values and expenses to estimate the actual ending account balance or your expenses for the period. Rather, these figures are provided to enable you to compare the ongoing costs of investing in a Fund and other funds. To do so, compare this 5% hypothetical example with the 5% hypothetical examples that appear in the shareholder reports of other funds.
Please note that the expenses shown in the table are meant to highlight your ongoing costs only and do not reflect any transaction costs, such as creation and redemption fees, or brokerage charges. Therefore, the second table is useful in comparing ongoing costs only, and will not help you determine the relative total costs of owning different funds. In addition, if these transaction costs were included, your costs would have been higher.
| Expense Ratio | Beginning Account Value 10/31/11 | Ending Account Value 4/30/12 | Expenses Paid During Six-Month Period* 10/31/11 to 4/30/12 | |||||||||||||
Actual | ||||||||||||||||
Guggenheim Russell Top 50® ETF | 0.20% | $ | 1,000.00 | $ | 1,147.70 | $ | 1.07 | |||||||||
Guggenheim S&P 500 Pure Value ETF | 0.35% | $ | 1,000.00 | $ | 1,102.40 | $ | 1.83 | |||||||||
Guggenheim S&P 500 Pure Growth ETF | 0.35% | $ | 1,000.00 | $ | 1,101.60 | $ | 1.83 | |||||||||
Guggenheim S&P MidCap 400 Pure Value ETF | 0.35% | $ | 1,000.00 | $ | 1,154.10 | $ | 1.87 | |||||||||
Guggenheim S&P MidCap 400 Pure Growth ETF | 0.35% | $ | 1,000.00 | $ | 1,095.30 | $ | 1.82 | |||||||||
Guggenheim S&P SmallCap 600 Pure Value ETF | 0.35% | $ | 1,000.00 | $ | 1,117.60 | $ | 1.84 | |||||||||
Guggenheim S&P SmallCap 600 Pure Growth ETF | 0.35% | $ | 1,000.00 | $ | 1,101.60 | $ | 1.83 | |||||||||
Hypothetical (assuming a 5% return before expenses) |
| |||||||||||||||
Guggenheim Russell Top 50® ETF | 0.20% | $ | 1,000.00 | $ | 1,023.87 | $ | 1.01 | |||||||||
Guggenheim S&P 500 Pure Value ETF | 0.35% | $ | 1,000.00 | $ | 1,023.12 | $ | 1.76 | |||||||||
Guggenheim S&P 500 Pure Growth ETF | 0.35% | $ | 1,000.00 | $ | 1,023.12 | $ | 1.76 | |||||||||
Guggenheim S&P MidCap 400 Pure Value ETF | 0.35% | $ | 1,000.00 | $ | 1,023.12 | $ | 1.76 | |||||||||
| 4 | GUGGENHEIM ETFS SEMI-ANNUAL REPORT |
Table of Contents
FEES AND EXPENSES (Unaudited) (concluded)
|
| Expense Ratio | Beginning Account Value 10/31/11 | Ending Account Value 4/30/12 | Expenses Paid During Six-Month Period* 10/31/11 to 4/30/12 | |||||||||||||
Guggenheim S&P MidCap 400 Pure Growth ETF | 0.35% | $ | 1,000.00 | $ | 1,023.12 | $ | 1.76 | |||||||||
Guggenheim S&P SmallCap 600 Pure Value ETF | 0.35% | $ | 1,000.00 | $ | 1,023.12 | $ | 1.76 | |||||||||
Guggenheim S&P SmallCap 600 Pure Growth ETF | 0.35% | $ | 1,000.00 | $ | 1,023.12 | $ | 1.76 | |||||||||
| * | Expenses are equal to the Fund’s annualized expense ratio multiplied by the average account value over the period, multiplied by 182/366 (to reflect one-half year period). |
| GUGGENHEIM ETFS SEMI-ANNUAL REPORT | 5 |
Table of Contents
|
XLG GUGGENHEIM RUSSELL TOP 50® ETF
Sector Allocations*

| Top 10 Holdings* | ||||
| Description | % of Net Assets | |||
Apple, Inc. | 8.55% | |||
Exxon Mobil Corp. | 6.73% | |||
International Business Machines Corp. | 3.97% | |||
Microsoft Corp. | 3.76% | |||
Chevron Corp. | 3.39% | |||
General Electric Co. | 3.29% | |||
AT&T, Inc. | 3.09% | |||
Pfizer, Inc. | 2.87% | |||
Johnson & Johnson, Inc. | 2.82% | |||
Procter & Gamble Co. (The) | 2.81% | |||
| * | The Fund’s Top Ten Holdings are expressed as a percentage of net assets and the Sector Allocations are expressed as a percentage of the Fund’s equity investments market value. These percentages may change over time. |
| 6 | GUGGENHEIM ETFS SEMI-ANNUAL REPORT |
Table of Contents
PORTFOLIO SUMMARY (continued)
RPV GUGGENHEIM S&P 500 PURE VALUE ETF | ||
Sector Allocations*

| Top 10 Holdings* | ||||
| Description | % of Net Assets | |||
American International Group, Inc. | 3.00% | |||
Computer Sciences Corp. | 2.37% | |||
Whirlpool Corp. | 2.20% | |||
Hartford Financial Services Group, Inc. | 2.03% | |||
Valero Energy Corp. | 1.81% | |||
Sunoco, Inc. | 1.72% | |||
Lincoln National Corp. | 1.71% | |||
Marathon Oil Corp. | 1.66% | |||
Archer-Daniels-Midland Co. | 1.58% | |||
Bank of America Corp. | 1.53% | |||
| * | The Fund’s Top Ten Holdings are expressed as a percentage of net assets and the Sector Allocations are expressed as a percentage of the Fund’s equity investments market value. These percentages may change over time. |
| GUGGENHEIM ETFS SEMI-ANNUAL REPORT | 7 |
Table of Contents
PORTFOLIO SUMMARY (continued)
RPG GUGGENHEIM S&P 500 PURE GROWTH ETF | ||
Sector Allocations*

| Top 10 Holdings* | ||||
| Description | % of Net Assets | |||
Apple, Inc. | 1.77% | |||
Priceline.com, Inc. | 1.62% | |||
Visa, Inc. — Class A | 1.43% | |||
O’Reilly Automotive, Inc. | 1.39% | |||
Intuitive Surgical, Inc. | 1.36% | |||
Autozone, Inc. | 1.29% | |||
Ross Stores, Inc. | 1.27% | |||
Salesforce.com, Inc. | 1.27% | |||
Chipotle Mexican Grill, Inc. | 1.26% | |||
Biogen IDEC, Inc. | 1.25% | |||
| * | The Fund’s Top Ten Holdings are expressed as a percentage of net assets and the Sector Allocations are expressed as a percentage of the Fund’s equity investments market value. These percentages may change over time. |
| 8 | GUGGENHEIM ETFS SEMI-ANNUAL REPORT |
Table of Contents
PORTFOLIO SUMMARY (continued)
RFV GUGGENHEIM S&P MIDCAP 400 PURE VALUE ETF | ||
Sector Allocations*

| Top 10 Holdings* | ||||
| Description | % of Net Assets | |||
Exelis, Inc. | 2.98% | |||
First American Financial Corp. | 2.95% | |||
ITT Corp. | 2.88% | |||
Community Health Systems, Inc. | 2.62% | |||
Collective Brands, Inc. | 2.53% | |||
URS Corp. | 2.15% | |||
Ingram Micro, Inc. — Class A | 2.13% | |||
Protective Life Corp. | 2.10% | |||
AVNET, Inc. | 2.02% | |||
Huntington Ingalls Industries, Inc. | 1.90% | |||
| * | The Fund’s Top Ten Holdings are expressed as a percentage of net assets and the Sector Allocations are expressed as a percentage of the Fund’s equity investments market value. These percentages may change over time. |
| GUGGENHEIM ETFS SEMI-ANNUAL REPORT | 9 |
Table of Contents
PORTFOLIO SUMMARY (continued)
RFG GUGGENHEIM S&P MIDCAP 400 PURE GROWTH ETF | ||
Sector Allocations*
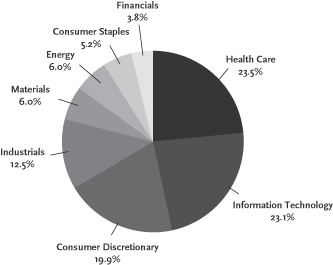
| Top 10 Holdings* | ||||
| Description | % of Net Assets | |||
Regeneron Pharmaceuticals, Inc. | 3.54% | |||
Catalyst Health Solutions, Inc. | 2.40% | |||
Equinix, Inc. | 2.27% | |||
ITT Educational Services, Inc. | 2.23% | |||
Alliance Data Systems Corp. | 1.78% | |||
Gen-Probe, Inc. | 1.68% | |||
Advance Auto Parts, Inc. | 1.66% | |||
Under Armour, Inc. — Class A | 1.65% | |||
Monster Beverage Corp. | 1.64% | |||
Amerigroup Corp. | 1.62% | |||
| * | The Fund’s Top Ten Holdings are expressed as a percentage of net assets and the Sector Allocations are expressed as a percentage of the Fund’s equity investments market value. These percentages may change over time. |
| 10 | GUGGENHEIM ETFS SEMI-ANNUAL REPORT |
Table of Contents
PORTFOLIO SUMMARY (continued)
RZV GUGGENHEIM S&P SMALLCAP 600 PURE VALUE ETF | ||
Sector Allocations*

| Top 10 Holdings* | ||||
| Description | % of Net Assets | |||
Voxx International Corp. | 2.21% | |||
Marriott Vacations Worldwide Corp. | 1.99% | |||
Gentiva Health Services, Inc. | 1.89% | |||
Amedisys, Inc. | 1.82% | |||
Tuesday Morning Corp. | 1.71% | |||
Perry Ellis International, Inc. | 1.66% | |||
Marinemax, Inc. | 1.63% | |||
Skechers U.S.A., Inc. — Class A | 1.57% | |||
Almost Family, Inc. | 1.44% | |||
Stewart Information Services Corp. | 1.36% | |||
| * | The Fund’s Top Ten Holdings are expressed as a percentage of net assets and the Sector Allocations are expressed as a percentage of the Fund’s equity investments market value. These percentages may change over time. |
| GUGGENHEIM ETFS SEMI-ANNUAL REPORT | 11 |
Table of Contents
PORTFOLIO SUMMARY (concluded)
RZG GUGGENHEIM S&P SMALLCAP 600 PURE GROWTH ETF | ||
Sector Allocations*
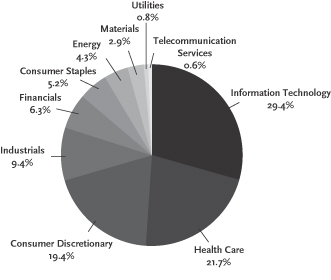
| Top 10 Holdings* | ||||
| Description | % of Net Assets | |||
Cirrus Logic, Inc. | 1.40% | |||
MWI Veterinary Supply, Inc. | 1.40% | |||
Coinstar, Inc. | 1.39% | |||
Buffalo Wild Wings, Inc. | 1.33% | |||
Veeco Instruments, Inc. | 1.24% | |||
Sturm Ruger & Co., Inc. | 1.20% | |||
Sourcefire, Inc. | 1.17% | |||
Allegiant Travel Co. | 1.16% | |||
Kulicke & Soffa Industries, Inc. | 1.07% | |||
Seacor Holdings, Inc. | 1.06% | |||
| * | The Fund’s Top Ten Holdings are expressed as a percentage of net assets and the Sector Allocations are expressed as a percentage of the Fund’s equity investments market value. These percentages may change over time. |
| 12 | GUGGENHEIM ETFS SEMI-ANNUAL REPORT |
Table of Contents
| SCHEDULE OF INVESTMENTS (Unaudited) | April 30, 2012 |
GUGGENHEIM RUSSELL TOP 50® ETF
| SHARES | MARKET VALUE | |||||||
COMMON STOCKS - 99.7% |
| |||||||
Aerospace & Defense - 2.1% |
| |||||||
Boeing Co. (The) | 56,719 | $ | 4,356,019 | |||||
United Technologies Corp. | 70,316 | 5,740,598 | ||||||
|
| |||||||
Total Aerospace & Defense | 10,096,617 | |||||||
|
| |||||||
Air Freight & Logistics - 0.9% |
| |||||||
United Parcel Service, Inc. — Class B | 56,446 | 4,410,690 | ||||||
|
| |||||||
Total Air Freight & Logistics | 4,410,690 | |||||||
|
| |||||||
Automobiles - 0.7% |
| |||||||
Ford Motor Co. | 286,253 | 3,228,934 | ||||||
|
| |||||||
Total Automobiles | 3,228,934 | |||||||
|
| |||||||
Beverages - 4.0% |
| |||||||
Coca-Cola Co. (The) | 151,778 | 11,583,697 | ||||||
PepsiCo, Inc. | 121,433 | 8,014,578 | ||||||
|
| |||||||
Total Beverages | 19,598,275 | |||||||
|
| |||||||
Biotechnology - 0.9% |
| |||||||
Amgen, Inc. | 61,152 | 4,348,519 | ||||||
|
| |||||||
Total Biotechnology | 4,348,519 | |||||||
|
| |||||||
Capital Markets - 0.9% |
| |||||||
Goldman Sachs Group, Inc. (The) | 39,775 | 4,580,091 | ||||||
|
| |||||||
Total Capital Markets | 4,580,091 | |||||||
|
| |||||||
Commercial Banks - 2.6% |
| |||||||
Wells Fargo & Co. | 377,892 | 12,632,930 | ||||||
|
| |||||||
Total Commercial Banks | 12,632,930 | |||||||
|
| |||||||
Communications Equipment - 3.4% |
| |||||||
Cisco Systems, Inc. | 422,553 | 8,514,443 | ||||||
QUALCOMM, Inc. | 128,262 | 8,188,246 | ||||||
|
| |||||||
Total Communications Equipment | 16,702,689 | |||||||
|
| |||||||
Computers & Peripherals - 10.3% |
| |||||||
Apple, Inc.* | 71,043 | 41,506,163 | ||||||
EMC Corp.* | 158,072 | 4,459,211 | ||||||
Hewlett-Packard Co. | 152,649 | 3,779,589 | ||||||
|
| |||||||
Total Computers & Peripherals | 49,744,963 | |||||||
|
| |||||||
Consumer Finance - 1.0% |
| |||||||
American Express Co. | 80,718 | 4,860,031 | ||||||
|
| |||||||
Total Consumer Finance | 4,860,031 | |||||||
|
| |||||||
Diversified Financial Services - 5.6% |
| |||||||
Bank of America Corp. | 824,465 | 6,686,411 | ||||||
Citigroup, Inc. | 223,254 | 7,376,312 | ||||||
JPMorgan Chase & Co. | 305,279 | 13,120,892 | ||||||
|
| |||||||
Total Diversified Financial Services | 27,183,615 | |||||||
|
| |||||||
Diversified Telecommunication Services - 4.9% |
| |||||||
AT&T, Inc. | 454,959 | 14,972,701 | ||||||
Verizon Communications, Inc. | 217,345 | 8,776,391 | ||||||
|
| |||||||
Total Diversified Telecommunication Services | 23,749,092 | |||||||
|
| |||||||
Energy Equipment & Services - 1.6% |
| |||||||
Schlumberger Ltd. | 104,247 | 7,728,873 | ||||||
|
| |||||||
Total Energy Equipment & Services | 7,728,873 | |||||||
|
| |||||||
| SHARES | MARKET VALUE | |||||||
Food & Staples Retailing - 1.7% |
| |||||||
Wal-Mart Stores, Inc. | 136,325 | $ | 8,030,906 | |||||
|
| |||||||
Total Food & Staples Retailing | 8,030,906 | |||||||
|
| |||||||
Food Products - 1.0% |
| |||||||
Kraft Foods, Inc. — Class A | 126,945 | 5,061,297 | ||||||
|
| |||||||
Total Food Products | 5,061,297 | |||||||
|
| |||||||
Hotels, Restaurants & Leisure - 1.6% |
| |||||||
McDonald’s Corp. | 79,712 | 7,767,934 | ||||||
|
| |||||||
Total Hotels, Restaurants & Leisure | 7,767,934 | |||||||
|
| |||||||
Household Products - 2.8% |
| |||||||
Procter & Gamble Co. (The) | 214,441 | 13,647,025 | ||||||
|
| |||||||
Total Household Products | 13,647,025 | |||||||
|
| |||||||
Industrial Conglomerates - 4.3% |
| |||||||
3M Co. | 54,590 | 4,878,162 | ||||||
General Electric Co. | 814,765 | 15,953,099 | ||||||
|
| |||||||
Total Industrial Conglomerates | 20,831,261 | |||||||
|
| |||||||
Insurance - 2.5% |
| |||||||
American International Group, Inc.* | 33,953 | 1,155,420 | ||||||
Berkshire Hathaway, Inc. — Class B* | 134,486 | 10,819,399 | ||||||
|
| |||||||
Total Insurance | 11,974,819 | |||||||
|
| |||||||
Internet & Catalog Retail - 1.3% |
| |||||||
Amazon.com, Inc.* | 27,921 | 6,474,880 | ||||||
|
| |||||||
Total Internet & Catalog Retail | 6,474,880 | |||||||
|
| |||||||
Internet Software & Services - 2.4% |
| |||||||
Google, Inc. — Class A* | 19,336 | 11,702,727 | ||||||
|
| |||||||
Total Internet Software & Services | 11,702,727 | |||||||
|
| |||||||
IT Services - 5.0% |
| |||||||
International Business Machines Corp. | 93,050 | 19,268,794 | ||||||
Visa, Inc. — Class A | 40,175 | 4,940,721 | ||||||
|
| |||||||
Total IT Services | 24,209,515 | |||||||
|
| |||||||
Machinery - 1.1% |
| |||||||
Caterpillar, Inc. | 49,529 | 5,090,095 | ||||||
|
| |||||||
Total Machinery | 5,090,095 | |||||||
|
| |||||||
Media - 2.5% |
| |||||||
Comcast Corp. — Class A | 211,876 | 6,426,199 | ||||||
Walt Disney Co. (The) | 137,500 | 5,927,625 | ||||||
|
| |||||||
Total Media | 12,353,824 | |||||||
|
| |||||||
Oil, Gas & Consumable Fuels - 12.8% |
| |||||||
Chevron Corp. | 154,437 | 16,456,807 | ||||||
ConocoPhillips | 102,005 | 7,306,618 | ||||||
Exxon Mobil Corp. | 378,448 | 32,675,200 | ||||||
Occidental Petroleum Corp. | 62,449 | 5,696,598 | ||||||
|
| |||||||
Total Oil, Gas & Consumable Fuels | 62,135,223 | |||||||
|
| |||||||
Pharmaceuticals - 9.1% |
| |||||||
Abbott Laboratories | 119,408 | 7,410,460 | ||||||
Johnson & Johnson, Inc. | 210,590 | 13,707,303 | ||||||
Merck & Co., Inc. | 237,127 | 9,304,864 | ||||||
Pfizer, Inc. | 607,006 | 13,918,648 | ||||||
|
| |||||||
Total Pharmaceuticals | 44,341,275 | |||||||
|
| |||||||
| See Notes to Financial Statements. | GUGGENHEIM ETFS SEMI-ANNUAL REPORT | 13 |
Table of Contents
| SCHEDULE OF INVESTMENTS (Unaudited) (concluded) | April 30, 2012 |
GUGGENHEIM RUSSELL TOP 50® ETF
| SHARES | MARKET VALUE | |||||||
Semiconductors & Semiconductor Equipment - 2.2% |
| |||||||
Intel Corp. | 383,819 | $ | 10,900,460 | |||||
|
| |||||||
Total Semiconductors & Semiconductor Equipment | 10,900,460 | |||||||
|
| |||||||
Software - 5.6% |
| |||||||
Microsoft Corp. | 570,107 | 18,254,826 | ||||||
Oracle Corp. | 295,081 | 8,672,431 | ||||||
|
| |||||||
Total Software | 26,927,257 | |||||||
|
| |||||||
Specialty Retail - 1.3% |
| |||||||
Home Depot, Inc. | 122,771 | 6,358,310 | ||||||
|
| |||||||
Total Specialty Retail | 6,358,310 | |||||||
|
| |||||||
Tobacco - 3.6% |
| |||||||
Altria Group, Inc. | 160,824 | 5,180,141 | ||||||
Philip Morris International, Inc. | 136,626 | 12,229,393 | ||||||
|
| |||||||
Total Tobacco | 17,409,534 | |||||||
|
| |||||||
Total Common Stocks | 484,081,661 | |||||||
|
| |||||||
SHORT TERM INVESTMENTS - 0.2% |
| |||||||
SSgA Government Money Market Fund | 764,242 | 764,242 | ||||||
|
| |||||||
Total Short Term Investments | 764,242 | |||||||
|
| |||||||
Total Investments - 99.9%a | 484,845,903 | |||||||
|
| |||||||
Other Assets and Liabilities, net - 0.1% |
| 479,739 | ||||||
|
| |||||||
Net Assets - 100.0% | $ | 485,325,642 | ||||||
|
| |||||||
| * | Non-Income Producing Security. |
| a | Unless otherwise indicated, the values of the Portfolio are determined based on Level 1 inputs. |
| 14 | GUGGENHEIM ETFS SEMI-ANNUAL REPORT | See Notes to Financial Statements. |
Table of Contents
| SCHEDULE OF INVESTMENTS (Unaudited) | April 30, 2012 |
GUGGENHEIM S&P 500 PURE VALUE ETF
| SHARES | MARKET VALUE | |||||||
COMMON STOCKS - 99.8% |
| |||||||
Aerospace & Defense - 2.4% |
| |||||||
L-3 Communications Holdings, Inc. | 13,328 | $ | 980,141 | |||||
Northrop Grumman Corp. | 14,100 | 892,248 | ||||||
Textron, Inc. | 14,982 | 399,121 | ||||||
|
| |||||||
Total Aerospace & Defense | 2,271,510 | |||||||
|
| |||||||
Airlines - 0.8% |
| |||||||
Southwest Airlines Co. | 90,174 | 746,641 | ||||||
|
| |||||||
Total Airlines | 746,641 | |||||||
|
| |||||||
Auto Components - 0.7% |
| |||||||
Goodyear Tire & Rubber Co. (The)* | 23,771 | 261,005 | ||||||
Johnson Controls, Inc. | 12,912 | 412,797 | ||||||
|
| |||||||
Total Auto Components | 673,802 | |||||||
|
| |||||||
Automobiles - 0.8% |
| |||||||
Ford Motor Co. | 68,178 | 769,048 | ||||||
|
| |||||||
Total Automobiles | 769,048 | |||||||
|
| |||||||
Beverages - 0.4% |
| |||||||
Molson Coors Brewing Co. — Class B | 8,921 | 370,935 | ||||||
|
| |||||||
Total Beverages | 370,935 | |||||||
|
| |||||||
Capital Markets - 5.7% |
| |||||||
Ameriprise Financial, Inc. | 9,421 | 510,712 | ||||||
Bank of New York Mellon Corp. (The) | 35,976 | 850,832 | ||||||
E*Trade Financial Corp.* | 87,444 | 929,530 | ||||||
Goldman Sachs Group, Inc. (The) | 8,518 | 980,848 | ||||||
Legg Mason, Inc. | 25,441 | 663,247 | ||||||
Morgan Stanley | 80,399 | 1,389,295 | ||||||
|
| |||||||
Total Capital Markets | 5,324,464 | |||||||
|
| |||||||
Chemicals - 0.5% |
| |||||||
Dow Chemical Co. (The) | 12,366 | 418,960 | ||||||
|
| |||||||
Total Chemicals | 418,960 | |||||||
|
| |||||||
Commercial Banks - 6.1% |
| |||||||
BB&T Corp. | 13,747 | 440,454 | ||||||
Comerica, Inc. | 16,874 | 540,305 | ||||||
Fifth Third Bancorp | 31,513 | 448,430 | ||||||
First Horizon National Corp. | 37,794 | 346,949 | ||||||
Huntington Bancshares, Inc. | 61,437 | 411,014 | ||||||
KeyCorp | 84,700 | 680,988 | ||||||
PNC Financial Services Group, Inc. | 7,997 | 530,361 | ||||||
Regions Financial Corp. | 118,708 | 800,092 | ||||||
SunTrust Banks, Inc. | 42,822 | 1,039,718 | ||||||
Wells Fargo & Co. | 12,091 | 404,202 | ||||||
|
| |||||||
Total Commercial Banks | 5,642,513 | |||||||
|
| |||||||
Commercial Services & Supplies - 1.8% |
| |||||||
Avery Dennison Corp. | 26,165 | 836,756 | ||||||
R.R. Donnelley & Sons Co. | 65,684 | 821,707 | ||||||
|
| |||||||
Total Commercial Services & Supplies | 1,658,463 | |||||||
|
| |||||||
Communications Equipment - 0.5% |
| |||||||
Harris Corp. | 10,814 | 492,470 | ||||||
|
| |||||||
Total Communications Equipment | 492,470 | |||||||
|
| |||||||
Computers & Peripherals - 2.2% |
| |||||||
Dell, Inc.* | 18,193 | 297,820 | ||||||
| SHARES | MARKET VALUE | |||||||
Hewlett-Packard Co. | 25,271 | $ | 625,710 | |||||
Lexmark International, Inc. — Class A | 13,362 | 402,196 | ||||||
Western Digital Corp.* | 18,247 | 708,166 | ||||||
|
| |||||||
Total Computers & Peripherals | 2,033,892 | |||||||
|
| |||||||
Construction & Engineering - 0.5% |
| |||||||
Jacobs Engineering Group, Inc.* | 11,280 | 494,402 | ||||||
|
| |||||||
Total Construction & Engineering | 494,402 | |||||||
|
| |||||||
Consumer Finance - 1.4% |
| |||||||
Capital One Financial Corp. | 17,381 | 964,298 | ||||||
SLM Corp. | 21,626 | 320,713 | ||||||
|
| |||||||
Total Consumer Finance | 1,285,011 | |||||||
|
| |||||||
Containers & Packaging - 1.7% |
| |||||||
Bemis Co., Inc. | 10,238 | 331,609 | ||||||
Owens-Illinois, Inc.* | 25,115 | 583,923 | ||||||
Sealed Air Corp. | 33,272 | 638,157 | ||||||
|
| |||||||
Total Containers & Packaging | 1,553,689 | |||||||
|
| |||||||
Diversified Financial Services - 5.8% |
| |||||||
Bank of America Corp. | 176,161 | 1,428,666 | ||||||
Citigroup, Inc. | 42,021 | 1,388,374 | ||||||
CME Group, Inc. | 1,280 | 340,249 | ||||||
JPMorgan Chase & Co. | 25,631 | 1,101,620 | ||||||
Leucadia National Corp. | 22,058 | 548,362 | ||||||
Nasdaq OMX Group, Inc. (The)* | 14,561 | 357,764 | ||||||
NYSE Euronext | 10,989 | 282,967 | ||||||
|
| |||||||
Total Diversified Financial Services | 5,448,002 | |||||||
|
| |||||||
Diversified Telecommunication Services - 0.6% |
| |||||||
CenturyLink, Inc. | 7,676 | 295,987 | ||||||
Frontier Communications Corp. | 59,411 | 240,020 | ||||||
|
| |||||||
Total Diversified Telecommunication Services | 536,007 | |||||||
|
| |||||||
Electric Utilities - 1.0% |
| |||||||
Edison International | 10,626 | 467,650 | ||||||
Pepco Holdings, Inc. | 25,221 | 477,182 | ||||||
|
| |||||||
Total Electric Utilities | 944,832 | |||||||
|
| |||||||
Electronic Equipment, Instruments & Components - 1.6% |
| |||||||
Corning, Inc. | 24,311 | 348,863 | ||||||
Jabil Circuit, Inc. | 48,527 | 1,137,958 | ||||||
|
| |||||||
Total Electronic Equipment, Instruments & Components | 1,486,821 | |||||||
|
| |||||||
Energy Equipment & Services - 0.3% |
| |||||||
Nabors Industries Ltd.* | 15,746 | 262,171 | ||||||
|
| |||||||
Total Energy Equipment & Services | 262,171 | |||||||
|
| |||||||
Food & Staples Retailing - 3.8% |
| |||||||
CVS Caremark Corp. | 12,995 | 579,837 | ||||||
Kroger Co. (The) | 38,343 | 892,241 | ||||||
Safeway, Inc. | 55,414 | 1,126,567 | ||||||
Sysco Corp. | 12,181 | 352,031 | ||||||
Walgreen Co. | 16,668 | 584,380 | ||||||
|
| |||||||
Total Food & Staples Retailing | 3,535,056 | |||||||
|
| |||||||
| See Notes to Financial Statements. | GUGGENHEIM ETFS SEMI-ANNUAL REPORT | 15 |
Table of Contents
| SCHEDULE OF INVESTMENTS (Unaudited) (continued) | April 30, 2012 |
GUGGENHEIM S&P 500 PURE VALUE ETF
| SHARES | MARKET VALUE | |||||||
Food Products - 4.2% |
| |||||||
Archer-Daniels-Midland Co. | 47,763 | $ | 1,472,533 | |||||
Dean Foods Co.* | 106,750 | 1,310,890 | ||||||
Tyson Foods, Inc. — Class A | 62,596 | 1,142,377 | ||||||
|
| |||||||
Total Food Products | 3,925,800 | |||||||
|
| |||||||
Health Care Providers & Services - 5.9% |
| |||||||
AmerisourceBergen Corp. | 22,859 | 850,583 | ||||||
Cardinal Health, Inc. | 21,376 | 903,564 | ||||||
CIGNA Corp. | 11,773 | 544,266 | ||||||
Coventry Health Care, Inc. | 28,620 | 858,314 | ||||||
McKesson Corp. | 10,251 | 937,044 | ||||||
Tenet Healthcare Corp.* | 267,939 | 1,390,603 | ||||||
|
| |||||||
Total Health Care Providers & Services | 5,484,374 | |||||||
|
| |||||||
Household Durables - 2.2% |
| |||||||
Whirlpool Corp. | 31,987 | 2,047,808 | ||||||
|
| |||||||
Total Household Durables | 2,047,808 | |||||||
|
| |||||||
Independent Power Producers & Energy |
| |||||||
NRG Energy, Inc.* | 65,408 | 1,111,936 | ||||||
|
| |||||||
Total Independent Power Producers & Energy Traders | 1,111,936 | |||||||
|
| |||||||
Insurance - 18.5% |
| |||||||
ACE Ltd. | 6,977 | 530,043 | ||||||
Allstate Corp. (The) | 38,959 | 1,298,503 | ||||||
American International Group, Inc.* | 82,256 | 2,799,172 | ||||||
Assurant, Inc. | 22,177 | 894,620 | ||||||
Cincinnati Financial Corp. | 15,522 | 552,894 | ||||||
Genworth Financial, Inc. — Class A* | 228,296 | 1,372,059 | ||||||
Hartford Financial Services Group, Inc. | 91,841 | 1,887,332 | ||||||
Lincoln National Corp. | 64,159 | 1,589,218 | ||||||
Loews Corp. | 15,137 | 622,585 | ||||||
MetLife, Inc. | 37,930 | 1,366,618 | ||||||
Principal Financial Group, Inc. | 29,975 | 829,408 | ||||||
Prudential Financial, Inc. | 20,076 | 1,215,401 | ||||||
Torchmark Corp. | 6,936 | 337,853 | ||||||
Unum Group | 40,877 | 970,420 | ||||||
XL Group PLC | 44,770 | 963,003 | ||||||
|
| |||||||
Total Insurance | 17,229,129 | |||||||
|
| |||||||
IT Services - 3.1% |
| |||||||
Computer Sciences Corp. | 78,778 | 2,210,511 | ||||||
SAIC, Inc. | 59,009 | 717,549 | ||||||
|
| |||||||
Total IT Services | 2,928,060 | |||||||
|
| |||||||
Life Sciences Tools & Services - 0.4% |
| |||||||
PerkinElmer, Inc. | 14,565 | 401,994 | ||||||
|
| |||||||
Total Life Sciences Tools & Services | 401,994 | |||||||
|
| |||||||
Machinery - 0.5% |
| |||||||
Ingersoll-Rand PLC | 11,073 | 470,824 | ||||||
|
| |||||||
Total Machinery | 470,824 | |||||||
|
| |||||||
Media - 1.7% |
| |||||||
Gannett Co., Inc. | 60,764 | 839,759 | ||||||
Washington Post Co. (The) — Class B | 1,936 | 732,137 | ||||||
|
| |||||||
Total Media | 1,571,896 | |||||||
|
| |||||||
| SHARES | MARKET VALUE | |||||||
Metals & Mining - 1.7% |
| |||||||
Alcoa, Inc. | 91,003 | $ | 885,459 | |||||
United States Steel Corp. | 26,028 | 737,373 | ||||||
|
| |||||||
Total Metals & Mining | 1,622,832 | |||||||
|
| |||||||
Multi-utilities - 0.7% |
| |||||||
DTE Energy Co. | 5,381 | 303,381 | ||||||
Integrys Energy Group, Inc. | 6,217 | 339,697 | ||||||
|
| |||||||
Total Multi-Utilities | 643,078 | |||||||
|
| |||||||
Multiline Retail - 2.1% |
| |||||||
J.C. Penney Co., Inc. | 18,597 | 670,608 | ||||||
Sears Holdings Corp.* | 23,564 | 1,267,272 | ||||||
|
| |||||||
Total Multiline Retail | 1,937,880 | |||||||
|
| |||||||
Office Electronics - 0.8% |
| |||||||
Xerox Corp. | 92,800 | 721,984 | ||||||
|
| |||||||
Total Office Electronics | 721,984 | |||||||
|
| |||||||
Oil, Gas & Consumable Fuels - 10.2% |
| |||||||
Alpha Natural Resources, Inc.* | 16,615 | 268,000 | ||||||
ConocoPhillips | 7,668 | 549,259 | ||||||
Hess Corp. | 11,461 | 597,576 | ||||||
Marathon Oil Corp. | 52,684 | 1,545,749 | ||||||
Marathon Petroleum Corp. | 31,183 | 1,297,525 | ||||||
Murphy Oil Corp. | 12,239 | 672,778 | ||||||
Phillips 66* | 5,770 | 196,468 | ||||||
Sunoco, Inc. | 32,445 | 1,599,214 | ||||||
Tesoro Corp.* | 47,006 | 1,092,889 | ||||||
Valero Energy Corp. | 68,231 | 1,685,306 | ||||||
|
| |||||||
Total Oil, Gas & Consumable Fuels | 9,504,764 | |||||||
|
| |||||||
Paper & Forest Products - 0.5% |
| |||||||
International Paper Co. | 14,577 | 485,560 | ||||||
|
| |||||||
Total Paper & Forest Products | 485,560 | |||||||
|
| |||||||
Real Estate Investment Trusts (REITs) - 0.4% |
| |||||||
Weyerhaeuser Co. | 18,024 | 366,969 | ||||||
|
| |||||||
Total Real Estate Investment Trusts (REITs) | 366,969 | |||||||
|
| |||||||
Road & Rail - 0.3% |
| |||||||
Ryder System, Inc. | 6,134 | 298,848 | ||||||
|
| |||||||
Total Road & Rail | 298,848 | |||||||
|
| |||||||
Semiconductors & Semiconductor |
| |||||||
Micron Technology, Inc.* | 134,312 | 885,116 | ||||||
|
| |||||||
Total Semiconductors & Semiconductor Equipment | 885,116 | |||||||
|
| |||||||
Specialty Retail - 3.2% |
| |||||||
AutoNation, Inc.* | 8,444 | 291,993 | ||||||
Best Buy Co., Inc. | 43,011 | 949,253 | ||||||
GameStop Corp. — Class A | 43,611 | 992,586 | ||||||
Staples, Inc. | 47,549 | 732,255 | ||||||
|
| |||||||
Total Specialty Retail | 2,966,087 | |||||||
|
| |||||||
Thrifts & Mortgage Finance - 1.4% |
| |||||||
Hudson City Bancorp, Inc. | 190,119 | 1,342,240 | ||||||
|
| |||||||
Total Thrifts & Mortgage Finance | 1,342,240 | |||||||
|
| |||||||
| 16 | GUGGENHEIM ETFS SEMI-ANNUAL REPORT | See Notes to Financial Statements. |
Table of Contents
| SCHEDULE OF INVESTMENTS (Unaudited) (concluded) | April 30, 2012 |
GUGGENHEIM S&P 500 PURE VALUE ETF
| SHARES | MARKET VALUE | |||||||
Wireless Telecommunication Services - 1.2% |
| |||||||
MetroPCS Communications, Inc.* | 53,839 | $ | 393,024 | |||||
Sprint Nextel Corp.* | 305,214 | 756,931 | ||||||
|
| |||||||
Total Wireless Telecommunication Services | 1,149,955 | |||||||
|
| |||||||
Total Common Stocks |
| 93,045,823 | ||||||
|
| |||||||
SHORT TERM INVESTMENTS - 0.2% |
| |||||||
SSgA Government Money Market Fund | 191,794 | 191,794 | ||||||
|
| |||||||
Total Short Term Investments | 191,794 | |||||||
|
| |||||||
Total Investments - 100.0%a |
| 93,237,617 | ||||||
|
| |||||||
Other Assets and Liabilities, net - 0.0%b |
| (36,947 | ) | |||||
|
| |||||||
Net Assets - 100.0% | $ | 93,200,670 | ||||||
|
| |||||||
| * | Non-Income Producing Security. |
| a | Unless otherwise indicated, the values of the Portfolio are determined based on Level 1 inputs. |
| b | Amount represents less than 0.05% of net assets. |
| See Notes to Financial Statements. | GUGGENHEIM ETFS SEMI-ANNUAL REPORT | 17 |
Table of Contents
| SCHEDULE OF INVESTMENTS (Unaudited) | April 30, 2012 |
GUGGENHEIM S&P 500 PURE GROWTH ETF
| SHARES | MARKET VALUE | |||||||
COMMON STOCKS - 99.9% |
| |||||||
Aerospace & Defense - 1.1% |
| |||||||
Goodrich Corp. | 10,485 | $ | 1,315,448 | |||||
Lockheed Martin Corp. | 23,399 | 2,118,546 | ||||||
|
| |||||||
Total Aerospace & Defense | 3,433,994 | |||||||
|
| |||||||
Air Freight & Logistics - 1.1% |
| |||||||
C.H. Robinson Worldwide, Inc. | 30,631 | 1,829,896 | ||||||
United Parcel Service, Inc. — Class B | 21,689 | 1,694,778 | ||||||
|
| |||||||
Total Air Freight & Logistics | 3,524,674 | |||||||
|
| |||||||
Beverages - 2.0% |
| |||||||
Brown-Forman Corp. — Class B | 15,456 | 1,334,625 | ||||||
Coca-Cola Co. (The) | 31,477 | 2,402,325 | ||||||
PepsiCo, Inc. | 42,859 | 2,828,694 | ||||||
|
| |||||||
Total Beverages | 6,565,644 | |||||||
|
| |||||||
Biotechnology - 4.3% |
| |||||||
Amgen, Inc. | 33,341 | 2,370,878 | ||||||
Biogen Idec, Inc.* | 29,984 | 4,018,156 | ||||||
Celgene Corp.* | 54,104 | 3,945,264 | ||||||
Gilead Sciences, Inc.* | 70,199 | 3,651,050 | ||||||
|
| |||||||
Total Biotechnology | 13,985,348 | |||||||
|
| |||||||
Capital Markets - 1.8% |
| |||||||
BlackRock, Inc. | 10,383 | 1,989,175 | ||||||
Franklin Resources, Inc. | 19,751 | 2,478,948 | ||||||
T. Rowe Price Group, Inc. | 21,305 | 1,344,665 | ||||||
|
| |||||||
Total Capital Markets | 5,812,788 | |||||||
|
| |||||||
Chemicals - 5.3% |
| |||||||
CF Industries Holdings, Inc. | 11,320 | 2,185,439 | ||||||
Ecolab, Inc. | 29,884 | 1,903,312 | ||||||
FMC Corp. | 21,732 | 2,400,299 | ||||||
International Flavors & Fragrances, Inc. | 35,213 | 2,120,175 | ||||||
Monsanto Co. | 14,591 | 1,111,542 | ||||||
PPG Industries, Inc. | 18,874 | 1,986,300 | ||||||
Praxair, Inc. | 13,156 | 1,522,149 | ||||||
Sherwin-Williams Co. (The) | 16,327 | 1,963,812 | ||||||
Sigma-Aldrich Corp. | 26,880 | 1,905,792 | ||||||
|
| |||||||
Total Chemicals | 17,098,820 | |||||||
|
| |||||||
Commercial Services & Supplies - 1.1% |
| |||||||
Stericycle, Inc.* | 40,345 | 3,493,877 | ||||||
|
| |||||||
Total Commercial Services & Supplies | 3,493,877 | |||||||
|
| |||||||
Communications Equipment - 2.0% |
| |||||||
F5 Networks, Inc.* | 29,396 | 3,937,006 | ||||||
QUALCOMM, Inc. | 38,676 | 2,469,076 | ||||||
|
| |||||||
Total Communications Equipment | 6,406,082 | |||||||
|
| |||||||
Computers & Peripherals - 3.0% |
| |||||||
Apple, Inc.* | 9,736 | 5,688,161 | ||||||
NetApp, Inc.* | 53,828 | 2,090,141 | ||||||
SanDisk Corp.* | 51,718 | 1,914,083 | ||||||
|
| |||||||
Total Computers & Peripherals | 9,692,385 | |||||||
|
| |||||||
| SHARES | MARKET VALUE | |||||||
Diversified Consumer Services - 1.6% |
| |||||||
Apollo Group, Inc. — Class A* | 66,793 | $ | 2,352,450 | |||||
DeVry, Inc. | 84,209 | 2,707,319 | ||||||
|
| |||||||
Total Diversified Consumer Services | 5,059,769 | |||||||
|
| |||||||
Diversified Financial Services - 1.1% |
| |||||||
IntercontinentalExchange, Inc.* | 27,139 | 3,610,573 | ||||||
|
| |||||||
Total Diversified Financial Services | 3,610,573 | |||||||
|
| |||||||
Electrical Equipment - 0.9% |
| |||||||
Rockwell Automation, Inc. | 17,285 | 1,336,822 | ||||||
Roper Industries, Inc. | 14,496 | 1,477,142 | ||||||
|
| |||||||
Total Electrical Equipment | 2,813,964 | |||||||
|
| |||||||
Electronic Equipment, Instruments & |
| |||||||
Amphenol Corp. — Class A | 37,765 | 2,195,657 | ||||||
|
| |||||||
Total Electronic Equipment, Instruments & Components | 2,195,657 | |||||||
|
| |||||||
Energy Equipment & Services - 2.0% |
| |||||||
Cameron International Corp.* | 30,081 | 1,541,651 | ||||||
Diamond Offshore Drilling, Inc. | 34,186 | 2,343,451 | ||||||
Helmerich & Payne, Inc. | 27,672 | 1,422,064 | ||||||
Schlumberger Ltd. | 16,249 | 1,204,701 | ||||||
|
| |||||||
Total Energy Equipment & Services | 6,511,867 | |||||||
|
| |||||||
Food Products - 1.6% |
| |||||||
Hershey Co. (The) | 29,208 | 1,957,228 | ||||||
Kellogg Co. | 25,748 | 1,302,076 | ||||||
Mead Johnson Nutrition Co. | 21,525 | 1,841,679 | ||||||
|
| |||||||
Total Food Products | 5,100,983 | |||||||
|
| |||||||
Health Care Equipment & Supplies - 6.9% |
| |||||||
Baxter International, Inc. | 35,963 | 1,992,710 | ||||||
Becton, Dickinson and Co. | 24,621 | 1,931,517 | ||||||
C.R. Bard, Inc. | 27,671 | 2,738,322 | ||||||
Edwards Lifesciences Corp.* | 35,199 | 2,920,461 | ||||||
Intuitive Surgical, Inc.* | 7,538 | 4,358,472 | ||||||
St Jude Medical, Inc. | 44,690 | 1,730,397 | ||||||
Stryker Corp. | 37,015 | 2,019,908 | ||||||
Varian Medical Systems, Inc.* | 36,271 | 2,300,307 | ||||||
Zimmer Holdings, Inc. | 34,529 | 2,172,910 | ||||||
|
| |||||||
Total Health Care Equipment & Supplies | 22,165,004 | |||||||
|
| |||||||
Health Care Providers & Services - 4.2% |
| |||||||
DaVita, Inc.* | 26,167 | 2,317,873 | ||||||
Express Scripts Holding Co.* | 67,687 | 3,776,258 | ||||||
Laboratory Corp. of America Holdings* | 29,446 | 2,588,009 | ||||||
Quest Diagnostics, Inc. | 32,684 | 1,885,540 | ||||||
UnitedHealth Group, Inc. | 50,448 | 2,832,655 | ||||||
|
| |||||||
Total Health Care Providers & Services | 13,400,335 | |||||||
|
| |||||||
Health Care Technology - 0.7% |
| |||||||
Cerner Corp.* | 27,344 | 2,217,325 | ||||||
|
| |||||||
Total Health Care Technology | 2,217,325 | |||||||
|
| |||||||
| 18 | GUGGENHEIM ETFS SEMI-ANNUAL REPORT | See Notes to Financial Statements. |
Table of Contents
| SCHEDULE OF INVESTMENTS (Unaudited) (continued) | April 30, 2012 |
GUGGENHEIM S&P 500 PURE GROWTH ETF
| SHARES | MARKET VALUE | |||||||
Hotels, Restaurants & Leisure - 3.7% |
| |||||||
Chipotle Mexican Grill, Inc.* | 9,766 | $ | 4,044,589 | |||||
McDonald’s Corp. | 19,188 | 1,869,870 | ||||||
Starbucks Corp. | 23,652 | 1,357,152 | ||||||
Wynn Resorts Ltd. | 18,105 | 2,415,207 | ||||||
Yum! Brands, Inc. | 30,449 | 2,214,556 | ||||||
|
| |||||||
Total Hotels, Restaurants & Leisure | 11,901,374 | |||||||
|
| |||||||
Household Products - 1.1% |
| |||||||
Colgate-Palmolive Co. | 18,616 | 1,841,867 | ||||||
Kimberly-Clark Corp. | 21,695 | 1,702,407 | ||||||
|
| |||||||
Total Household Products | 3,544,274 | |||||||
|
| |||||||
Insurance - 0.7% |
| |||||||
AFLAC, Inc. | 50,191 | 2,260,603 | ||||||
|
| |||||||
Total Insurance | 2,260,603 | |||||||
|
| |||||||
Internet & Catalog Retail - 4.0% |
| |||||||
Amazon.com, Inc.* | 16,644 | 3,859,743 | ||||||
Netflix, Inc.* | 48,720 | 3,904,421 | ||||||
priceline.com, Inc.* | 6,857 | 5,216,943 | ||||||
|
| |||||||
Total Internet & Catalog Retail | 12,981,107 | |||||||
|
| |||||||
Internet Software & Services - 1.5% |
| |||||||
Akamai Technologies, Inc.* | 43,941 | 1,432,477 | ||||||
Google, Inc. — Class A* | 5,458 | 3,303,345 | ||||||
|
| |||||||
Total Internet Software & Services | 4,735,822 | |||||||
|
| |||||||
IT Services - 6.0% |
| |||||||
Automatic Data Processing, Inc. | 31,898 | 1,774,167 | ||||||
Cognizant Technology Solutions Corp. — Class A* | 48,186 | 3,532,998 | ||||||
Fiserv, Inc.* | 29,245 | 2,055,631 | ||||||
International Business Machines Corp. | 8,460 | 1,751,897 | ||||||
Mastercard, Inc. — Class A | 6,783 | 3,067,747 | ||||||
Teradata Corp.* | 35,862 | 2,502,450 | ||||||
Visa, Inc. — Class A | 37,272 | 4,583,711 | ||||||
|
| |||||||
Total IT Services | 19,268,601 | |||||||
|
| |||||||
Life Sciences Tools & Services - 1.3% |
| |||||||
Life Technologies Corp.* | 44,727 | 2,073,544 | ||||||
Waters Corp.* | 23,731 | 1,996,014 | ||||||
|
| |||||||
Total Life Sciences Tools & Services | 4,069,558 | |||||||
|
| |||||||
Machinery - 1.4% |
| |||||||
Deere & Co. | 22,998 | 1,894,115 | ||||||
Joy Global, Inc. | 14,337 | 1,014,630 | ||||||
Pall Corp. | 28,376 | 1,691,493 | ||||||
|
| |||||||
Total Machinery | 4,600,238 | |||||||
|
| |||||||
Media - 3.7% |
| |||||||
DIRECTV — Class A* | 66,025 | 3,253,052 | ||||||
Discovery Communications, Inc. — Class A* | 71,211 | 3,875,303 | ||||||
Scripps Networks Interactive, Inc. — Class A | 58,551 | 2,940,431 | ||||||
Viacom, Inc. — Class B | 35,968 | 1,668,555 | ||||||
|
| |||||||
Total Media | 11,737,341 | |||||||
|
| |||||||
| SHARES | MARKET VALUE | |||||||
Metals & Mining - 1.6% |
| |||||||
Cliffs Natural Resources, Inc. | 35,226 | $ | 2,193,171 | |||||
Newmont Mining Corp. | 60,073 | 2,862,478 | ||||||
|
| |||||||
Total Metals & Mining | 5,055,649 | |||||||
|
| |||||||
Multiline Retail - 2.2% |
| |||||||
Dollar Tree, Inc.* | 38,909 | 3,955,489 | ||||||
Family Dollar Stores, Inc. | 44,509 | 3,006,583 | ||||||
|
| |||||||
Total Multiline Retail | 6,962,072 | |||||||
|
| |||||||
Oil, Gas & Consumable Fuels - 2.7% |
| |||||||
Cabot Oil & Gas Corp. | 27,058 | 950,818 | ||||||
EOG Resources, Inc. | 18,333 | 2,013,147 | ||||||
Peabody Energy Corp. | 57,241 | 1,780,768 | ||||||
Pioneer Natural Resources Co. | 15,538 | 1,799,611 | ||||||
Southwestern Energy Co.* | 68,262 | 2,155,714 | ||||||
|
| |||||||
Total Oil, Gas & Consumable Fuels | 8,700,058 | |||||||
|
| |||||||
Personal Products - 0.5% |
| |||||||
Estee Lauder Cos., Inc. (The) — Class A | 23,976 | 1,566,832 | ||||||
|
| |||||||
Total Personal Products | 1,566,832 | |||||||
|
| |||||||
Pharmaceuticals - 4.5% |
| |||||||
Abbott Laboratories | 42,397 | 2,631,158 | ||||||
Allergan, Inc. | 19,463 | 1,868,448 | ||||||
Johnson & Johnson, Inc. | 20,360 | 1,325,232 | ||||||
Mylan, Inc.* | 153,921 | 3,341,625 | ||||||
Perrigo Co. | 30,832 | 3,234,277 | ||||||
Watson Pharmaceuticals, Inc.* | 26,385 | 1,988,374 | ||||||
|
| |||||||
Total Pharmaceuticals | 14,389,114 | |||||||
|
| |||||||
Professional Services - 0.6% |
| |||||||
Dun & Bradstreet Corp. (The) | 24,196 | 1,881,965 | ||||||
|
| |||||||
Total Professional Services | 1,881,965 | |||||||
|
| |||||||
Real Estate Investment Trusts (REITs) - 1.2% |
| |||||||
American Tower Corp. | 42,444 | 2,783,477 | ||||||
Ventas, Inc. | 20,191 | 1,187,029 | ||||||
|
| |||||||
Total Real Estate Investment Trusts (REITs) | 3,970,506 | |||||||
|
| |||||||
Road & Rail - 0.5% |
| |||||||
Union Pacific Corp. | 14,940 | 1,679,854 | ||||||
|
| |||||||
Total Road & Rail | 1,679,854 | |||||||
|
| |||||||
Semiconductors & Semiconductor Equipment - 4.2% |
| |||||||
Altera Corp. | 72,862 | 2,591,701 | ||||||
Broadcom Corp. — Class A* | 74,358 | 2,721,503 | ||||||
First Solar, Inc.* | 87,999 | 1,619,182 | ||||||
KLA-Tencor Corp. | 51,563 | 2,689,010 | ||||||
Microchip Technology, Inc. | 60,791 | 2,148,354 | ||||||
Xilinx, Inc. | 47,223 | 1,717,973 | ||||||
|
| |||||||
Total Semiconductors & Semiconductor Equipment | 13,487,723 | |||||||
|
| |||||||
Software - 4.5% |
| |||||||
Citrix Systems, Inc.* | 29,090 | 2,490,395 | ||||||
Intuit, Inc. | 42,683 | 2,474,333 | ||||||
| See Notes to Financial Statements. | GUGGENHEIM ETFS SEMI-ANNUAL REPORT | 19 |
Table of Contents
| SCHEDULE OF INVESTMENTS (Unaudited) (concluded) | April 30, 2012 |
GUGGENHEIM S&P 500 PURE GROWTH ETF
| SHARES | MARKET VALUE | |||||||
Oracle Corp. | 60,779 | $ | 1,786,295 | |||||
Red Hat, Inc.* | 63,234 | 3,769,379 | ||||||
Salesforce.com, Inc.* | 26,129 | 4,069,069 | ||||||
|
| |||||||
Total Software | 14,589,471 | |||||||
|
| |||||||
Specialty Retail - 6.1% |
| |||||||
AutoZone, Inc.* | 10,434 | 4,133,534 | ||||||
Bed Bath & Beyond, Inc.* | 34,183 | 2,406,141 | ||||||
O’Reilly Automotive, Inc.* | 42,429 | 4,474,562 | ||||||
Ross Stores, Inc. | 66,261 | 4,081,015 | ||||||
Tiffany & Co. | 20,297 | 1,389,533 | ||||||
TJX Cos., Inc. | 72,417 | 3,020,513 | ||||||
|
| |||||||
Total Specialty Retail | 19,505,298 | |||||||
|
| |||||||
Textiles, Apparel & Luxury Goods - 3.9% |
| |||||||
Coach, Inc. | 50,057 | 3,662,170 | ||||||
Fossil, Inc.* | 27,175 | 3,550,957 | ||||||
NIKE, Inc. — Class B | 16,625 | 1,859,839 | ||||||
Ralph Lauren Corp. | 12,734 | 2,193,686 | ||||||
V.F. Corp. | 8,662 | 1,317,057 | ||||||
|
| |||||||
Total Textiles, Apparel & Luxury Goods | 12,583,709 | |||||||
|
| |||||||
Tobacco - 0.9% |
| |||||||
Philip Morris International, Inc. | 31,428 | 2,813,120 | ||||||
|
| |||||||
Total Tobacco | 2,813,120 | |||||||
|
| |||||||
Trading Companies & Distributors - 0.7% |
| |||||||
W.W. Grainger, Inc. | 11,416 | 2,372,473 | ||||||
|
| |||||||
Total Trading Companies & Distributors | 2,372,473 | |||||||
|
| |||||||
Wireless Telecommunication Services - 1.0% |
| |||||||
Crown Castle International Corp.* | 57,312 | 3,244,432 | ||||||
|
| |||||||
Total Wireless Telecommunication Services | 3,244,432 | |||||||
|
| |||||||
Total Common Stocks | 320,990,283 | |||||||
|
| |||||||
SHORT TERM INVESTMENTS - 0.1% |
| |||||||
SSgA Government Money Market Fund | 277,954 | 277,954 | ||||||
|
| |||||||
Total Short Term Investments | 277,954 | |||||||
|
| |||||||
Total Investments - 100.0%a |
| 321,268,237 | ||||||
|
| |||||||
Other Assets and Liabilities, net - 0.0%b |
| 23,522 | ||||||
|
| |||||||
Net Assets - 100.0% | $ | 321,291,759 | ||||||
|
| |||||||
| * | Non-Income Producing Security. |
| a | Unless otherwise indicated, the values of the Portfolio are determined based on Level 1 inputs. |
| b | Amount represents less than 0.05% of net assets. |
| 20 | GUGGENHEIM ETFS SEMI-ANNUAL REPORT | See Notes to Financial Statements. |
Table of Contents
| SCHEDULE OF INVESTMENTS (Unaudited) | April 30, 2012 |
GUGGENHEIM S&P MIDCAP 400 PURE VALUE ETF
| SHARES | MARKET VALUE | |||||||
COMMON STOCKS - 99.8% |
| |||||||
Aerospace & Defense - 4.9% |
| |||||||
Exelis, Inc. | 91,744 | $ | 1,057,808 | |||||
Huntington Ingalls Industries, Inc.* | 17,093 | 674,319 | ||||||
|
| |||||||
Total Aerospace & Defense | 1,732,127 | |||||||
|
| |||||||
Air Freight & Logistics - 1.0% |
| |||||||
UTi Worldwide, Inc. | 20,588 | 343,202 | ||||||
|
| |||||||
Total Air Freight & Logistics | 343,202 | |||||||
|
| |||||||
Airlines - 1.8% |
| |||||||
JetBlue Airways Corp.* | 136,531 | 648,522 | ||||||
|
| |||||||
Total Airlines | 648,522 | |||||||
|
| |||||||
Automobiles - 0.9% |
| |||||||
Thor Industries, Inc. | 9,897 | 334,816 | ||||||
|
| |||||||
Total Automobiles | 334,816 | |||||||
|
| |||||||
Capital Markets - 2.8% |
| |||||||
Apollo Investment Corp. | 39,339 | 285,208 | ||||||
Janus Capital Group, Inc. | 33,683 | 255,317 | ||||||
Jefferies Group, Inc. | 28,195 | 449,146 | ||||||
|
| |||||||
Total Capital Markets | 989,671 | |||||||
|
| |||||||
Chemicals - 1.7% |
| |||||||
Ashland, Inc. | 3,820 | 251,623 | ||||||
Cabot Corp. | 3,948 | 170,277 | ||||||
Cytec Industries, Inc. | 2,736 | 173,928 | ||||||
|
| |||||||
Total Chemicals | 595,828 | |||||||
|
| |||||||
Commercial Banks - 4.4% |
| |||||||
Associated Banc-Corp. | 16,746 | 223,224 | ||||||
BancorpSouth, Inc. | 30,250 | 407,467 | ||||||
First Niagara Financial Group, Inc. | 35,720 | 319,337 | ||||||
Fulton Financial Corp. | 13,119 | 137,618 | ||||||
International Bancshares Corp. | 10,068 | 198,642 | ||||||
TCF Financial Corp. | 25,885 | 296,901 | ||||||
|
| |||||||
Total Commercial Banks | 1,583,189 | |||||||
|
| |||||||
Commercial Services & Supplies - 0.6% |
| |||||||
Brink’s Co. (The) | 8,554 | 217,272 | ||||||
|
| |||||||
Total Commercial Services & Supplies | 217,272 | |||||||
|
| |||||||
Communications Equipment - 1.0% |
| |||||||
Tellabs, Inc. | 91,943 | 346,625 | ||||||
|
| |||||||
Total Communications Equipment | 346,625 | |||||||
|
| |||||||
Construction & Engineering - 4.1% |
| |||||||
Aecom Technology Corp.* | 19,939 | 440,054 | ||||||
KBR, Inc. | 7,604 | 257,471 | ||||||
URS Corp. | 18,486 | 763,657 | ||||||
|
| |||||||
Total Construction & Engineering | 1,461,182 | |||||||
|
| |||||||
Containers & Packaging - 0.6% |
| |||||||
Greif, Inc. — Class A | 3,858 | 206,943 | ||||||
|
| |||||||
Total Containers & Packaging | 206,943 | |||||||
|
| |||||||
Diversified Consumer Services - 1.1% |
| |||||||
Regis Corp. | 20,914 | 383,772 | ||||||
|
| |||||||
Total Diversified Consumer Services | 383,772 | |||||||
|
| |||||||
| SHARES | MARKET VALUE | |||||||
Electric Utilities - 0.9% |
| |||||||
Great Plains Energy, Inc. | 8,517 | $ | 173,917 | |||||
NV Energy, Inc. | 10,047 | 167,283 | ||||||
|
| |||||||
Total Electric Utilities | 341,200 | |||||||
|
| |||||||
Electrical Equipment - 1.7% |
| |||||||
General Cable Corp.* | 21,141 | 622,391 | ||||||
|
| |||||||
Total Electrical Equipment | 622,391 | |||||||
|
| |||||||
Electronic Equipment, Instruments & |
| |||||||
Arrow Electronics, Inc.* | 15,738 | 661,783 | ||||||
Avnet, Inc.* | 19,875 | 717,090 | ||||||
Ingram Micro, Inc. — Class A* | 38,861 | 756,235 | ||||||
Itron, Inc.* | 7,767 | 316,893 | ||||||
Tech Data Corp.* | 11,834 | 636,551 | ||||||
Vishay Intertechnology, Inc.* | 31,449 | 352,858 | ||||||
|
| |||||||
Total Electronic Equipment, Instruments & Components | 3,441,410 | |||||||
|
| |||||||
Food & Staples Retailing - 0.5% |
| |||||||
Harris Teeter Supermarkets, Inc. | 4,407 | 167,334 | ||||||
|
| |||||||
Total Food & Staples Retailing | 167,334 | |||||||
|
| |||||||
Food Products - 1.2% |
| |||||||
Smithfield Foods, Inc.* | 20,095 | 421,191 | ||||||
|
| |||||||
Total Food Products | 421,191 | |||||||
|
| |||||||
Gas Utilities - 1.0% |
| |||||||
Atmos Energy Corp. | 4,855 | 158,176 | ||||||
UGI Corp. | 6,310 | 184,126 | ||||||
|
| |||||||
Total Gas Utilities | 342,302 | |||||||
|
| |||||||
Health Care Providers & Services - 6.9% |
| |||||||
Community Health Systems, Inc.* | 38,272 | 931,540 | ||||||
Health Management Associates, Inc. — Class A* | 23,164 | 166,781 | ||||||
Health Net, Inc.* | 14,893 | 530,340 | ||||||
LifePoint Hospitals, Inc.* | 6,950 | 271,189 | ||||||
Omnicare, Inc. | 4,780 | 166,535 | ||||||
Owens & Minor, Inc. | 13,465 | 393,717 | ||||||
|
| |||||||
Total Health Care Providers & Services | 2,460,102 | |||||||
|
| |||||||
Hotels, Restaurants & Leisure - 1.0% |
| |||||||
Bob Evans Farms, Inc. | 4,717 | 180,378 | ||||||
Wendy’s Co. (The) | 37,066 | 180,512 | ||||||
|
| |||||||
Total Hotels, Restaurants & Leisure | 360,890 | |||||||
|
| |||||||
Household Durables - 1.3% |
| |||||||
KB Home | 27,431 | 238,101 | ||||||
Mohawk Industries, Inc.* | 3,265 | 218,820 | ||||||
|
| |||||||
Total Household Durables | 456,921 | |||||||
|
| |||||||
Insurance - 18.5% |
| |||||||
American Financial Group, Inc. | 9,270 | 360,788 | ||||||
Aspen Insurance Holdings Ltd. | 18,954 | 536,777 | ||||||
Everest Re Group Ltd. | 4,191 | 415,328 | ||||||
Fidelity National Financial, Inc. —Class A | 19,920 | 383,859 | ||||||
First American Financial Corp. | 62,584 | 1,048,282 | ||||||
| See Notes to Financial Statements. | GUGGENHEIM ETFS SEMI-ANNUAL REPORT | 21 |
Table of Contents
| SCHEDULE OF INVESTMENTS (Unaudited) (continued) | April 30, 2012 |
GUGGENHEIM S&P MIDCAP 400 PURE VALUE ETF
| SHARES | MARKET VALUE | |||||||
Hanover Insurance Group, Inc. (The) | 15,103 | $ | 609,557 | |||||
HCC Insurance Holdings, Inc. | 9,023 | 288,375 | ||||||
Kemper Corp. | 14,977 | 449,160 | ||||||
Old Republic International Corp. | 56,020 | 557,399 | ||||||
Protective Life Corp. | 25,451 | 744,696 | ||||||
Reinsurance Group of America, Inc. | 10,446 | 607,331 | ||||||
StanCorp Financial Group, Inc. | 11,170 | 428,705 | ||||||
W.R. Berkley Corp. | 4,198 | 158,097 | ||||||
|
| |||||||
Total Insurance | 6,588,354 | |||||||
|
| |||||||
Internet Software & Services - 0.5% |
| |||||||
Monster Worldwide, Inc.* | 19,087 | 164,721 | ||||||
|
| |||||||
Total Internet Software & Services | 164,721 | |||||||
|
| |||||||
IT Services - 0.6% |
| |||||||
CoreLogic, Inc.* | 12,319 | 205,727 | ||||||
|
| |||||||
Total IT Services | 205,727 | |||||||
|
| |||||||
Machinery - 6.6% |
| |||||||
AGCO Corp.* | 3,042 | 141,666 | ||||||
Harsco Corp. | 8,512 | 189,818 | ||||||
ITT Corp. | 45,514 | 1,022,244 | ||||||
Oshkosh Corp.* | 28,862 | 658,919 | ||||||
Terex Corp.* | 14,098 | 319,179 | ||||||
|
| |||||||
Total Machinery | 2,331,826 | |||||||
|
| |||||||
Media - 2.4% |
| |||||||
New York Times Co. (The) — Class A* | 37,256 | 235,086 | ||||||
Scholastic Corp. | 10,837 | 331,070 | ||||||
Valassis Communications, Inc.* | 14,854 | 297,080 | ||||||
|
| |||||||
Total Media | 863,236 | |||||||
|
| |||||||
Metals & Mining - 2.7% |
| |||||||
Commercial Metals Co. | 20,332 | 300,507 | ||||||
Reliance Steel & Aluminum Co. | 4,071 | 227,528 | ||||||
Steel Dynamics, Inc. | 18,683 | 238,582 | ||||||
Worthington Industries, Inc. | 11,030 | 196,775 | ||||||
|
| |||||||
Total Metals & Mining | 963,392 | |||||||
|
| |||||||
Multiline Retail - 0.6% |
| |||||||
Saks, Inc.* | 20,047 | 219,715 | ||||||
|
| |||||||
Total Multiline Retail | 219,715 | |||||||
|
| |||||||
Oil, Gas & Consumable Fuels - 2.8% |
| |||||||
Arch Coal, Inc. | 10,166 | 99,220 | ||||||
HollyFrontier Corp. | 11,006 | 339,205 | ||||||
Patriot Coal Corp.* | 15,333 | 89,391 | ||||||
Quicksilver Resources, Inc.* | 16,861 | 79,247 | ||||||
World Fuel Services Corp. | 8,870 | 390,812 | ||||||
|
| |||||||
Total Oil, Gas & Consumable Fuels | 997,875 | |||||||
|
| |||||||
Paper & Forest Products - 0.5% |
| |||||||
Louisiana-Pacific Corp.* | 20,287 | 183,597 | ||||||
|
| |||||||
Total Paper & Forest Products | 183,597 | |||||||
|
| |||||||
| SHARES | MARKET VALUE | |||||||
Professional Services - 1.0% |
| |||||||
Manpower, Inc. | 8,254 | $ | 351,620 | |||||
|
| |||||||
Total Professional Services | 351,620 | |||||||
|
| |||||||
Road & Rail - 0.9% |
| |||||||
Con-way, Inc. | 9,749 | 316,843 | ||||||
|
| |||||||
Total Road & Rail | 316,843 | |||||||
|
| |||||||
Semiconductors & Semiconductor Equipment - 2.4% |
| |||||||
Fairchild Semiconductor International, Inc.* | 10,948 | 155,133 | ||||||
International Rectifier Corp.* | 9,960 | 217,427 | ||||||
MEMC Electronic Materials, Inc.* | 138,107 | 495,804 | ||||||
|
| |||||||
Total Semiconductors & Semiconductor Equipment | 868,364 | |||||||
|
| |||||||
Specialty Retail - 5.6% |
| |||||||
Barnes & Noble, Inc.* | 21,440 | 444,880 | ||||||
Collective Brands, Inc.* | 43,318 | 899,715 | ||||||
Office Depot, Inc.* | 143,842 | 437,280 | ||||||
RadioShack Corp. | 41,855 | 216,809 | ||||||
|
| |||||||
Total Specialty Retail | 1,998,684 | |||||||
|
| |||||||
Thrifts & Mortgage Finance - 3.3% |
| |||||||
Astoria Financial Corp. | 64,901 | 628,890 | ||||||
New York Community Bancorp, Inc. | 15,577 | 210,134 | ||||||
Washington Federal, Inc. | 18,283 | 320,684 | ||||||
|
| |||||||
Total Thrifts & Mortgage Finance | 1,159,708 | |||||||
|
| |||||||
Tobacco - 1.2% |
| |||||||
Universal Corp. | 9,183 | 420,857 | ||||||
|
| |||||||
Total Tobacco | 420,857 | |||||||
|
| |||||||
Wireless Telecommunication Services - 1.1% |
| |||||||
Telephone & Data Systems, Inc. | 16,596 | 403,117 | ||||||
|
| |||||||
Total Wireless Telecommunication Services | 403,117 | |||||||
|
| |||||||
Total Common Stocks | 35,494,526 | |||||||
|
| |||||||
SHORT TERM INVESTMENTS - 0.2% |
| |||||||
SSgA Government Money Market Fund | 64,721 | 64,721 | ||||||
|
| |||||||
Total Short Term Investments | 64,721 | |||||||
|
| |||||||
Total Investments - 100.0%a | 35,559,247 | |||||||
|
| |||||||
Other Assets and Liabilities, |
| (16,056 | ) | |||||
|
| |||||||
Net Assets - 100.0% | $ | 35,543,191 | ||||||
|
| |||||||
| 22 | GUGGENHEIM ETFS SEMI-ANNUAL REPORT | See Notes to Financial Statements. |
Table of Contents
| SCHEDULE OF INVESTMENTS (Unaudited) (concluded) | April 30, 2012 |
GUGGENHEIM S&P MIDCAP 400 PURE VALUE ETF
| * | Non-Income Producing Security. |
| a | Unless otherwise indicated, the values of the Portfolio are determined based on Level 1 inputs. |
| b | Amount represents less than 0.05% of net assets. |
| See Notes to Financial Statements. | GUGGENHEIM ETFS SEMI-ANNUAL REPORT | 23 |
Table of Contents
| SCHEDULE OF INVESTMENTS (Unaudited) | April 30, 2012 |
GUGGENHEIM S&P MIDCAP 400 PURE GROWTH ETF
| SHARES | MARKET VALUE | |||||||
COMMON STOCKS - 99.9% |
| |||||||
Aerospace & Defense - 1.6% |
| |||||||
Triumph Group, Inc. | 150,829 | $ | 9,475,078 | |||||
|
| |||||||
Total Aerospace & Defense | 9,475,078 | |||||||
|
| |||||||
Airlines - 1.0% |
| |||||||
Alaska Air Group, Inc.* | 179,465 | 6,065,917 | ||||||
|
| |||||||
Total Airlines | 6,065,917 | |||||||
|
| |||||||
Auto Components - 0.3% |
| |||||||
Gentex Corp. | 72,352 | 1,589,573 | ||||||
|
| |||||||
Total Auto Components | 1,589,573 | |||||||
|
| |||||||
Beverages - 1.6% |
| |||||||
Monster Beverage Corp.* | 152,462 | 9,903,932 | ||||||
|
| |||||||
Total Beverages | 9,903,932 | |||||||
|
| |||||||
Biotechnology - 4.9% |
| |||||||
Regeneron Pharmaceuticals, Inc.* | 157,567 | 21,312,513 | ||||||
United Therapeutics Corp.* | 181,459 | 7,938,831 | ||||||
|
| |||||||
Total Biotechnology | 29,251,344 | |||||||
|
| |||||||
Chemicals - 3.0% |
| |||||||
Albemarle Corp. | 74,141 | 4,841,407 | ||||||
Intrepid Potash, Inc.* | 169,483 | 4,211,653 | ||||||
NewMarket Corp. | 40,771 | 9,100,903 | ||||||
|
| |||||||
Total Chemicals | 18,153,963 | |||||||
|
| |||||||
Commercial Banks - 1.0% |
| |||||||
Signature Bank* | 90,806 | 5,965,046 | ||||||
|
| |||||||
Total Commercial Banks | 5,965,046 | |||||||
|
| |||||||
Commercial Services & Supplies - 2.2% |
| |||||||
Clean Harbors, Inc.* | 110,660 | 7,551,439 | ||||||
Copart, Inc.* | 204,403 | 5,398,283 | ||||||
|
| |||||||
Total Commercial Services & Supplies | 12,949,722 | |||||||
|
| |||||||
Communications Equipment - 1.1% |
| |||||||
ADTRAN, Inc. | 115,761 | 3,533,026 | ||||||
Riverbed Technology, Inc.* | 164,288 | 3,241,402 | ||||||
|
| |||||||
Total Communications Equipment | 6,774,428 | |||||||
|
| |||||||
Containers & Packaging - 2.0% |
| |||||||
AptarGroup, Inc. | 85,400 | 4,655,154 | ||||||
Rock-Tenn Co. — | 117,789 | 7,341,788 | ||||||
|
| |||||||
Total Containers & Packaging | 11,996,942 | |||||||
|
| |||||||
Distributors - 1.0% |
| |||||||
LKQ Corp.* | 173,114 | 5,790,663 | ||||||
|
| |||||||
Total Distributors | 5,790,663 | |||||||
|
| |||||||
Diversified Consumer Services - 3.8% |
| |||||||
ITT Educational Services, Inc.* | 203,675 | 13,446,623 | ||||||
Strayer Education, Inc. | 97,716 | 9,642,615 | ||||||
|
| |||||||
Total Diversified Consumer Services | 23,089,238 | |||||||
|
| |||||||
Diversified Financial Services - 0.6% |
| |||||||
MSCI, Inc. — | 104,825 | 3,835,547 | ||||||
|
| |||||||
Total Diversified Financial Services | 3,835,547 | |||||||
|
| |||||||
| SHARES | MARKET VALUE | |||||||
Electrical Equipment - 0.6% |
| |||||||
AMETEK, Inc. | 74,980 | $ | 3,773,743 | |||||
|
| |||||||
Total Electrical Equipment | 3,773,743 | |||||||
|
| |||||||
Electronic Equipment, Instruments & Components - 0.4% |
| |||||||
Trimble Navigation, Ltd.* | 48,879 | 2,646,309 | ||||||
|
| |||||||
Total Electronic Equipment, Instruments & Components | 2,646,309 | |||||||
|
| |||||||
Energy Equipment & Services - 3.5% |
| |||||||
CARBO Ceramics, Inc. | 53,512 | 4,499,824 | ||||||
Dresser-Rand Group, Inc.* | 98,282 | 4,784,368 | ||||||
Dril-Quip, Inc.* | 61,507 | 4,144,957 | ||||||
Oceaneering International, Inc. | 72,297 | 3,732,694 | ||||||
Oil States International, Inc.* | 52,033 | 4,140,786 | ||||||
|
| |||||||
Total Energy Equipment & Services | 21,302,629 | |||||||
|
| |||||||
Food Products - 3.0% |
| |||||||
Corn Products International, Inc. | 98,326 | 5,610,482 | ||||||
Green Mountain Coffee Roasters, Inc.* | 153,380 | 7,477,275 | ||||||
Lancaster Colony Corp. | 76,859 | 5,011,975 | ||||||
|
| |||||||
Total Food Products | 18,099,732 | |||||||
|
| |||||||
Health Care Equipment & Supplies - 5.6% |
| |||||||
Cooper Cos., Inc. (The) | 70,598 | 6,224,626 | ||||||
Gen-Probe, Inc.* | 124,374 | 10,142,700 | ||||||
IDEXX Laboratories, Inc.* | 76,360 | 6,714,335 | ||||||
ResMed, Inc.* | 155,361 | 5,283,827 | ||||||
Thoratec Corp.* | 150,142 | 5,226,443 | ||||||
|
| |||||||
Total Health Care Equipment & Supplies | 33,591,931 | |||||||
|
| |||||||
Health Care Providers & Services - 7.2% |
| |||||||
AMERIGROUP Corp.* | 158,310 | 9,777,225 | ||||||
Catalyst Health Solutions, Inc.* | 167,618 | 14,477,167 | ||||||
Henry Schein, Inc.* | 86,290 | 6,621,895 | ||||||
HMS Holdings Corp.* | 160,519 | 3,862,087 | ||||||
Mednax, Inc.* | 125,728 | 8,831,135 | ||||||
|
| |||||||
Total Health Care Providers & Services | 43,569,509 | |||||||
|
| |||||||
Health Care Technology - 0.3% |
| |||||||
Allscripts Healthcare Solutions, Inc.* | 175,778 | 1,947,620 | ||||||
|
| |||||||
Total Health Care Technology | 1,947,620 | |||||||
|
| |||||||
Hotels, Restaurants & Leisure - 2.2% |
| |||||||
Life Time Fitness, Inc.* | 103,473 | 4,817,703 | ||||||
Panera Bread Co. — Class A* | 53,251 | 8,409,398 | ||||||
|
| |||||||
Total Hotels, Restaurants & Leisure | 13,227,101 | |||||||
|
| |||||||
Household Durables - 0.9% |
| |||||||
Tupperware Brands Corp. | 85,913 | 5,351,521 | ||||||
|
| |||||||
Total Household Durables | 5,351,521 | |||||||
|
| |||||||
Household Products - 0.5% |
| |||||||
Church & Dwight Co., Inc. | 64,645 | 3,283,966 | ||||||
|
| |||||||
Total Household Products | 3,283,966 | |||||||
|
| |||||||
| 24 | GUGGENHEIM ETFS SEMI-ANNUAL REPORT | See Notes to Financial Statements. |
Table of Contents
| SCHEDULE OF INVESTMENTS (Unaudited) (continued) | April 30, 2012 |
GUGGENHEIM S&P MIDCAP 400 PURE GROWTH ETF
| SHARES | MARKET VALUE | |||||||
Internet Software & Services - 3.8% |
| |||||||
Equinix, Inc.* | 83,283 | $ | 13,675,068 | |||||
Rackspace Hosting, Inc.* | 163,296 | 9,485,865 | ||||||
|
| |||||||
Total Internet Software & Services | 23,160,933 | |||||||
|
| |||||||
IT Services - 6.7% |
| |||||||
Alliance Data Systems Corp.* | 83,514 | 10,730,714 | ||||||
Gartner, Inc.* | 66,154 | 2,897,545 | ||||||
Global Payments, Inc. | 137,584 | 6,388,025 | ||||||
Jack Henry & Associates, Inc. | 95,627 | 3,247,493 | ||||||
NeuStar, Inc. — | 75,758 | 2,753,803 | ||||||
VeriFone Systems, Inc.* | 136,073 | 6,482,518 | ||||||
Wright Express Corp.* | 118,680 | 7,574,158 | ||||||
|
| |||||||
Total IT Services | 40,074,256 | |||||||
|
| |||||||
Leisure Equipment & Products - 1.1% |
| |||||||
Polaris Industries, Inc. | 80,850 | 6,422,724 | ||||||
|
| |||||||
Total Leisure Equipment & Products | 6,422,724 | |||||||
|
| |||||||
Life Sciences Tools & Services - 3.6% |
| |||||||
Bio-Rad Laboratories, Inc. — Class A* | 67,120 | 7,248,289 | ||||||
Covance, Inc.* | 76,401 | 3,572,510 | ||||||
Mettler-Toledo International, Inc.* | 33,187 | 5,951,093 | ||||||
Techne Corp. | 72,318 | 4,840,967 | ||||||
|
| |||||||
Total Life Sciences Tools & Services | 21,612,859 | |||||||
|
| |||||||
Machinery - 3.9% |
| |||||||
Donaldson Co., Inc. | 110,939 | 3,845,146 | ||||||
Gardner Denver, Inc. | 38,867 | 2,531,796 | ||||||
Valmont Industries, Inc. | 63,741 | 7,899,422 | ||||||
Wabtec Corp. | 62,325 | 4,847,639 | ||||||
Woodward, Inc. | 102,125 | 4,247,379 | ||||||
|
| |||||||
Total Machinery | 23,371,382 | |||||||
|
| |||||||
Metals & Mining - 1.0% |
| |||||||
Compass Minerals International, Inc. | 77,564 | 5,935,197 | ||||||
|
| |||||||
Total Metals & Mining | 5,935,197 | |||||||
|
| |||||||
Office Electronics - 0.6% |
| |||||||
Zebra Technologies Corp. — Class A* | 95,432 | 3,701,807 | ||||||
|
| |||||||
Total Office Electronics | 3,701,807 | |||||||
|
| |||||||
Oil, Gas & Consumable Fuels - 2.4% |
| |||||||
Bill Barrett Corp.* | 184,674 | 4,428,482 | ||||||
Cimarex Energy Co. | 67,617 | 4,673,011 | ||||||
Northern Oil and Gas, Inc.* | 164,323 | 3,192,796 | ||||||
SM Energy Co. | 33,501 | 2,214,751 | ||||||
|
| |||||||
Total Oil, Gas & Consumable Fuels | 14,509,040 | |||||||
|
| |||||||
Pharmaceuticals - 1.9% |
| |||||||
Endo Pharmaceuticals Holdings, Inc.* | 170,786 | 6,001,420 | ||||||
Medicis Pharmaceutical Corp. — Class A | 135,113 | 5,197,797 | ||||||
|
| |||||||
Total Pharmaceuticals | 11,199,217 | |||||||
|
| |||||||
| SHARES | MARKET VALUE | |||||||
Professional Services - 0.6% |
| |||||||
FTI Consulting, Inc.* | 96,572 | $ | 3,509,427 | |||||
|
| |||||||
Total Professional Services | 3,509,427 | |||||||
|
| |||||||
Real Estate Investment Trusts (REITs) - 2.2% |
| |||||||
Essex Property Trust, Inc. | 17,312 | 2,734,777 | ||||||
Federal Realty Investment Trust | 37,673 | 3,792,164 | ||||||
Home Properties, Inc. | 43,492 | 2,655,187 | ||||||
Taubman Centers, Inc. | 51,925 | 4,007,571 | ||||||
|
| |||||||
Total Real Estate Investment Trusts (REITs) | 13,189,699 | |||||||
|
| |||||||
Road & Rail - 0.7% |
| |||||||
JB Hunt Transport Services, Inc. | 79,874 | 4,419,428 | ||||||
|
| |||||||
Total Road & Rail | 4,419,428 | |||||||
|
| |||||||
Semiconductors & Semiconductor |
| |||||||
Lam Research Corp.* | 132,752 | 5,529,121 | ||||||
Semtech Corp.* | 180,500 | 4,920,430 | ||||||
Silicon Laboratories, Inc.* | 171,725 | 6,094,520 | ||||||
|
| |||||||
Total Semiconductors & Semiconductor Equipment | 16,544,071 | |||||||
|
| |||||||
Software - 7.7% |
| |||||||
ACI Worldwide, Inc.* | 88,596 | 3,531,437 | ||||||
Advent Software, Inc.* | 81,483 | 2,199,226 | ||||||
ANSYS, Inc.* | 93,889 | 6,297,135 | ||||||
Concur Technologies, Inc.* | 95,902 | 5,424,217 | ||||||
Factset Research Systems, Inc. | 64,527 | 6,766,301 | ||||||
Informatica Corp.* | 163,186 | 7,509,820 | ||||||
MICROS Systems, Inc.* | 69,759 | 3,964,404 | ||||||
Rovi Corp.* | 210,735 | 6,027,021 | ||||||
Solera Holdings, Inc. | 102,696 | 4,615,158 | ||||||
|
| |||||||
Total Software | 46,334,719 | |||||||
|
| |||||||
Specialty Retail - 4.3% |
| |||||||
Advance Auto Parts, Inc. | 108,665 | 9,975,447 | ||||||
PetSmart, Inc. | 114,543 | 6,673,275 | ||||||
Tractor Supply Co. | 96,960 | 9,541,834 | ||||||
|
| |||||||
Total Specialty Retail | 26,190,556 | |||||||
|
| |||||||
Textiles, Apparel & Luxury Goods - 6.4% |
| |||||||
Carter’s, Inc.* | 171,178 | 9,294,965 | ||||||
Deckers Outdoor Corp.* | 86,768 | 4,426,036 | ||||||
PVH Corp. | 101,608 | 9,022,790 | ||||||
Under Armour, Inc. — Class A* | 101,254 | 9,915,804 | ||||||
Warnaco Group, Inc.(The)* | 108,407 | 5,741,235 | ||||||
|
| |||||||
Total Textiles, Apparel & Luxury Goods | 38,400,830 | |||||||
|
| |||||||
Trading Companies & Distributors - 2.0% |
| |||||||
MSC Industrial Direct Co. — Class A | 66,145 | 4,875,548 | ||||||
Watsco, Inc. | 97,517 | 7,016,348 | ||||||
|
| |||||||
Total Trading Companies & Distributors | 11,891,896 | |||||||
|
| |||||||
Total Common Stocks | 602,103,495 | |||||||
|
| |||||||
| See Notes to Financial Statements. | GUGGENHEIM ETFS SEMI-ANNUAL REPORT | 25 |
Table of Contents
| SCHEDULE OF INVESTMENTS (Unaudited) (concluded) | April 30, 2012 |
GUGGENHEIM S&P MIDCAP 400 PURE GROWTH ETF
| SHARES | MARKET VALUE | |||||||
SHORT TERM INVESTMENTS - 0.1% |
| |||||||
SSgA Government Money Market Fund | 567,728 | $ | 567,728 | |||||
|
| |||||||
Total Short Term Investments | 567,728 | |||||||
|
| |||||||
Total Investments - 100.0%a | 602,671,223 | |||||||
|
| |||||||
Other Assets and Liabilities, |
| (111,695 | ) | |||||
|
| |||||||
Net Assets - 100.0% |
| $ | 602,559,528 | |||||
|
| |||||||
| * | Non-Income Producing Security. |
| a | Unless otherwise indicated, the values of the Portfolio are determined based on Level 1 inputs. |
| b | Amount represents less than 0.05% of net assets. |
| 26 | GUGGENHEIM ETFS SEMI-ANNUAL REPORT | See Notes to Financial Statements. |
Table of Contents
| SCHEDULE OF INVESTMENTS (Unaudited) | April 30, 2012 |
GUGGENHEIM S&P SMALLCAP 600 PURE VALUE ETF
| SHARES | MARKET VALUE | |||||||
COMMON STOCKS - 99.9% |
| |||||||
Aerospace & Defense - 0.7% |
| |||||||
AAR Corp. | 33,950 | $ | 524,527 | |||||
|
| |||||||
Total Aerospace & Defense | 524,527 | |||||||
|
| |||||||
Airlines - 1.0% |
| |||||||
SkyWest, Inc. | 86,837 | 780,665 | ||||||
|
| |||||||
Total Airlines | 780,665 | |||||||
|
| |||||||
Auto Components - 1.1% |
| |||||||
Spartan Motors, Inc. | 108,007 | 469,830 | ||||||
Superior Industries International, Inc. | 21,861 | 374,042 | ||||||
|
| |||||||
Total Auto Components | 843,872 | |||||||
|
| |||||||
Automobiles - 0.6% |
| |||||||
Winnebago Industries, Inc.* | 45,132 | 440,037 | ||||||
|
| |||||||
Total Automobiles | 440,037 | |||||||
|
| |||||||
Building Products - 2.1% |
| |||||||
Apogee Enterprises, Inc. | 18,028 | 276,910 | ||||||
Griffon Corp. | 55,402 | 549,034 | ||||||
Universal Forest Products, Inc. | 20,606 | 770,664 | ||||||
|
| |||||||
Total Building Products | 1,596,608 | |||||||
|
| |||||||
Capital Markets - 2.4% |
| |||||||
Calamos Asset Management, Inc. — Class A | 16,816 | 217,263 | ||||||
Investment Technology Group, Inc.* | 45,122 | 460,244 | ||||||
Piper Jaffray Cos.* | 28,349 | 687,463 | ||||||
Prospect Capital Corp. | 18,678 | 203,964 | ||||||
SWS Group, Inc. | 45,375 | 255,915 | ||||||
|
| |||||||
Total Capital Markets | 1,824,849 | |||||||
|
| |||||||
Chemicals - 2.4% |
| |||||||
A. Schulman, Inc. | 26,327 | 647,907 | ||||||
OM Group, Inc.* | 31,106 | 750,277 | ||||||
PolyOne Corp. | 32,286 | 447,484 | ||||||
|
| |||||||
Total Chemicals | 1,845,668 | |||||||
|
| |||||||
Commercial Banks - 3.0% |
| |||||||
First BanCorp* | 94,755 | 403,656 | ||||||
First Commonwealth Financial Corp. | 70,860 | 455,630 | ||||||
PrivateBancorp, Inc. | 20,546 | 323,189 | ||||||
Susquehanna Bancshares, Inc. | 45,514 | 471,980 | ||||||
United Community Banks, Inc.* | 31,231 | 293,884 | ||||||
Wintrust Financial Corp. | 10,455 | 377,739 | ||||||
|
| |||||||
Total Commercial Banks | 2,326,078 | |||||||
|
| |||||||
Commercial Services & Supplies - 2.0% |
| |||||||
ABM Industries, Inc. | 18,802 | 437,711 | ||||||
G&K Services, Inc. — Class A | 8,016 | 263,406 | ||||||
Geo Group, Inc. (The)* | 10,793 | 223,523 | ||||||
United Stationers, Inc. | 11,145 | 316,072 | ||||||
Viad Corp. | 16,644 | 300,923 | ||||||
|
| |||||||
Total Commercial Services & Supplies | 1,541,635 | |||||||
|
| |||||||
| SHARES | MARKET VALUE | |||||||
Communications Equipment - 1.0% |
| |||||||
Bel Fuse, Inc. — Class B | 13,751 | $ | 244,630 | |||||
Black Box Corp. | 23,749 | 536,965 | ||||||
|
| |||||||
Total Communications Equipment | 781,595 | |||||||
|
| |||||||
Computers & Peripherals - 1.3% |
| |||||||
Avid Technology, Inc.* | 31,789 | 276,246 | ||||||
Intevac, Inc.* | 58,301 | 469,906 | ||||||
Novatel Wireless, Inc.* | 96,518 | 278,937 | ||||||
|
| |||||||
Total Computers & Peripherals | 1,025,089 | |||||||
|
| |||||||
Construction & Engineering - 2.4% |
| |||||||
Aegion Corp.* | 22,578 | 412,048 | ||||||
Comfort Systems USA, Inc. | 33,946 | 359,149 | ||||||
EMCOR Group, Inc. | 7,969 | 233,651 | ||||||
Orion Marine Group, Inc.* | 118,541 | 820,304 | ||||||
|
| |||||||
Total Construction & Engineering | 1,825,152 | |||||||
|
| |||||||
Distributors - 2.2% |
| |||||||
VOXX International Corp.* | 134,063 | 1,701,259 | ||||||
|
| |||||||
Total Distributors | 1,701,259 | |||||||
|
| |||||||
Diversified Consumer Services - 3.3% |
| |||||||
Career Education Corp.* | 142,300 | 1,014,599 | ||||||
Corinthian Colleges, Inc.* | 159,398 | 612,089 | ||||||
Lincoln Educational Services Corp. | 123,945 | 909,756 | ||||||
|
| |||||||
Total Diversified Consumer Services | 2,536,444 | |||||||
|
| |||||||
Electrical Equipment - 0.7% |
| |||||||
EnerSys* | 10,962 | 383,122 | ||||||
Powell Industries, Inc.* | 5,775 | 188,323 | ||||||
|
| |||||||
Total Electrical Equipment | 571,445 | |||||||
|
| |||||||
Electronic Equipment, Instruments & Components - 7.2% |
| |||||||
Anixter International, Inc.* | 3,749 | 257,106 | ||||||
Benchmark Electronics, Inc.* | 51,724 | 821,377 | ||||||
Brightpoint, Inc.* | 39,467 | 241,538 | ||||||
Checkpoint Systems, Inc.* | 32,777 | 359,236 | ||||||
CTS Corp. | 38,345 | 411,442 | ||||||
Insight Enterprises, Inc.* | 43,897 | 891,548 | ||||||
Plexus Corp.* | 9,200 | 297,804 | ||||||
Radisys Corp.* | 108,953 | 691,852 | ||||||
Scansource, Inc.* | 10,885 | 358,770 | ||||||
SYNNEX Corp.* | 25,603 | 975,218 | ||||||
TTM Technologies, Inc.* | 22,531 | 232,745 | ||||||
|
| |||||||
Total Electronic Equipment, Instruments & Components | 5,538,636 | |||||||
|
| |||||||
Energy Equipment & Services - 1.8% |
| |||||||
Exterran Holdings, Inc.* | 55,942 | 755,777 | ||||||
Matrix Service Co.* | 45,411 | 619,860 | ||||||
|
| |||||||
Total Energy Equipment & Services | 1,375,637 | |||||||
|
| |||||||
Food & Staples Retailing - 2.6% |
| |||||||
Andersons, Inc. (The) | 12,519 | 630,957 | ||||||
Nash Finch Co. | 28,879 | 724,863 | ||||||
Spartan Stores, Inc. | 33,964 | 619,164 | ||||||
|
| |||||||
Total Food & Staples Retailing | 1,974,984 | |||||||
|
| |||||||
| See Notes to Financial Statements. | GUGGENHEIM ETFS SEMI-ANNUAL REPORT | 27 |
Table of Contents
| SCHEDULE OF INVESTMENTS (Unaudited) (continued) | April 30, 2012 |
GUGGENHEIM S&P SMALLCAP 600 PURE VALUE ETF
| SHARES | MARKET VALUE | |||||||
Food Products - 1.1% |
| |||||||
Seneca Foods Corp. — Class A* | 36,256 | $ | 844,402 | |||||
|
| |||||||
Total Food Products | 844,402 | |||||||
|
| |||||||
Gas Utilities - 0.2% |
| |||||||
Laclede Group, Inc. (The) | 4,731 | 186,307 | ||||||
|
| |||||||
Total Gas Utilities | 186,307 | |||||||
|
| |||||||
Health Care Equipment & Supplies - 1.1% |
| |||||||
Invacare Corp. | 20,390 | 323,182 | ||||||
Natus Medical, Inc.* | 22,219 | 271,961 | ||||||
Symmetry Medical, Inc.* | 30,986 | 220,310 | ||||||
|
| |||||||
Total Health Care Equipment & Supplies | 815,453 | |||||||
|
| |||||||
Health Care Providers & Services - 10.7% |
| |||||||
Almost Family, Inc.* | 45,471 | 1,108,583 | ||||||
Amedisys, Inc.* | 95,407 | 1,405,345 | ||||||
Cross Country Healthcare, Inc.* | 122,814 | 566,173 | ||||||
Gentiva Health Services, Inc.* | 176,481 | 1,461,263 | ||||||
Healthways, Inc.* | 148,923 | 993,316 | ||||||
Kindred Healthcare, Inc.* | 85,478 | 824,008 | ||||||
LHC Group, Inc.* | 41,554 | 735,921 | ||||||
Molina Healthcare, Inc.* | 26,482 | 679,263 | ||||||
PharMerica Corp.* | 37,688 | 447,357 | ||||||
|
| |||||||
Total Health Care Providers & Services | 8,221,229 | |||||||
|
| |||||||
Hotels, Restaurants & Leisure - 5.0% |
| |||||||
Boyd Gaming Corp.* | 133,809 | 1,028,991 | ||||||
Jack in the Box, Inc.* | 8,162 | 185,441 | ||||||
Marriott Vacations Worldwide Corp.* | 51,883 | 1,532,105 | ||||||
Red Robin Gourmet Burgers, Inc.* | 6,364 | 226,940 | ||||||
Ruby Tuesday, Inc.* | 92,788 | 630,959 | ||||||
Ruth’s Hospitality Group, Inc* | 39,208 | 271,319 | ||||||
|
| |||||||
Total Hotels, Restaurants & Leisure | 3,875,755 | |||||||
|
| |||||||
Household Durables - 3.0% |
| |||||||
American Greetings Corp. — Class A | 44,408 | 710,528 | ||||||
La-Z-Boy, Inc.* | 21,835 | 329,054 | ||||||
M/I Homes, Inc.* | 37,494 | 498,670 | ||||||
Standard Pacific Corp.* | 106,220 | 537,473 | ||||||
Universal Electronics, Inc.* | 13,532 | 228,961 | ||||||
|
| |||||||
Total Household Durables | 2,304,686 | |||||||
|
| |||||||
Household Products - 0.9% |
| |||||||
Central Garden and Pet Co. — Class A* | 68,173 | 728,769 | ||||||
|
| |||||||
Total Household Products | 728,769 | |||||||
|
| |||||||
Industrial Conglomerates - 0.3% |
| |||||||
Standex International Corp. | 5,283 | 232,769 | ||||||
|
| |||||||
Total Industrial Conglomerates | 232,769 | |||||||
|
| |||||||
Insurance - 6.6% |
| |||||||
Delphi Financial Group, Inc. — Class A | 11,494 | 522,057 | ||||||
| SHARES | MARKET VALUE | |||||||
Horace Mann Educators Corp. | 57,335 | $ | 1,006,229 | |||||
Meadowbrook Insurance Group, Inc. | 31,535 | 278,454 | ||||||
National Financial Partners Corp.* | 13,172 | 194,287 | ||||||
Presidential Life Corp. | 47,020 | 544,492 | ||||||
Safety Insurance Group, Inc. | 5,859 | 233,481 | ||||||
Selective Insurance Group, Inc. | 26,119 | 456,821 | ||||||
Stewart Information Services Corp. | 71,132 | 1,047,063 | ||||||
Tower Group, Inc. | 22,913 | 494,463 | ||||||
United Fire Group, Inc. | 20,698 | 356,420 | ||||||
|
| |||||||
Total Insurance | 5,133,767 | |||||||
|
| |||||||
Internet Software & Services - 0.5% |
| |||||||
United Online, Inc. | 85,493 | 405,237 | ||||||
|
| |||||||
Total Internet Software & Services | 405,237 | |||||||
|
| |||||||
IT Services - 0.7% |
| |||||||
CIBER, Inc.* | 64,800 | 269,568 | ||||||
NCI, Inc. — Class A* | 58,541 | 290,363 | ||||||
|
| |||||||
Total IT Services | 559,931 | |||||||
|
| |||||||
Leisure Equipment & Products - 1.0% |
| |||||||
Callaway Golf Co. | 94,849 | 581,424 | ||||||
Jakks Pacific, Inc. | 11,579 | 220,812 | ||||||
|
| |||||||
Total Leisure Equipment & Products | 802,236 | |||||||
|
| |||||||
Machinery - 1.2% |
| |||||||
Briggs & Stratton Corp. | 28,383 | 513,732 | ||||||
Lydall, Inc.* | 38,152 | 402,504 | ||||||
|
| |||||||
Total Machinery | 916,236 | |||||||
|
| |||||||
Media - 1.4% |
| |||||||
Digital Generation, Inc.* | 36,984 | 343,211 | ||||||
E.W. Scripps Co. — Class A* | 36,637 | 335,595 | ||||||
Harte-Hanks, Inc. | 22,898 | 192,343 | ||||||
Live Nation Entertainment, Inc.* | 24,043 | 217,830 | ||||||
|
| |||||||
Total Media | 1,088,979 | |||||||
|
| |||||||
Metals & Mining - 2.5% |
| |||||||
A.M. Castle & Co.* | 32,573 | 436,152 | ||||||
AK Steel Holding Corp. | 22,838 | 169,458 | ||||||
Century Aluminum Co.* | 34,960 | 321,632 | ||||||
Materion Corp.* | 17,450 | 431,189 | ||||||
Olympic Steel, Inc. | 18,543 | 391,814 | ||||||
SunCoke Energy, Inc.* | 13,030 | 198,317 | ||||||
|
| |||||||
Total Metals & Mining | 1,948,562 | |||||||
|
| |||||||
Multiline Retail - 2.5% |
| |||||||
Fred’s, Inc. — Class A | 40,204 | 575,721 | ||||||
Tuesday Morning Corp.* | 326,343 | 1,318,426 | ||||||
|
| |||||||
Total Multiline Retail | 1,894,147 | |||||||
|
| |||||||
Oil, Gas & Consumable Fuels - 0.4% |
| |||||||
Overseas Shipholding Group, Inc. | 29,041 | 339,780 | ||||||
|
| |||||||
Total Oil, Gas & Consumable Fuels | 339,780 | |||||||
|
| |||||||
Paper & Forest Products - 1.2% |
| |||||||
Neenah Paper, Inc. | 15,231 | 434,998 | ||||||
Wausau Paper Corp. | 53,921 | 488,524 | ||||||
|
| |||||||
Total Paper & Forest Products | 923,522 | |||||||
|
| |||||||
| 28 | GUGGENHEIM ETFS SEMI-ANNUAL REPORT | See Notes to Financial Statements. |
Table of Contents
| SCHEDULE OF INVESTMENTS (Unaudited) (concluded) | April 30, 2012 |
GUGGENHEIM S&P SMALLCAP 600 PURE VALUE ETF
| SHARES | MARKET VALUE | |||||||
Professional Services - 2.1% |
| |||||||
CDI Corp. | 38,805 | $ | 688,400 | |||||
Insperity, Inc. | 6,981 | 190,372 | ||||||
Kelly Services, Inc. — Class A | 53,826 | 753,026 | ||||||
|
| |||||||
Total Professional Services | 1,631,798 | |||||||
|
| |||||||
Real Estate Investment Trusts (REITs) - 0.7% |
| |||||||
Cedar Reality Trust, Inc. | 61,518 | 321,124 | ||||||
Parkway Properties, Inc. | 25,608 | 253,263 | ||||||
|
| |||||||
Total Real Estate Investment Trusts (REITs) | 574,387 | |||||||
|
| |||||||
Road & Rail - 0.4% |
| |||||||
Arkansas Best Corp. | 20,076 | 307,966 | ||||||
|
| |||||||
Total Road & Rail | 307,966 | |||||||
|
| |||||||
Semiconductors & Semiconductor |
| |||||||
Advanced Energy Industries, Inc.* | 22,013 | 262,835 | ||||||
Cohu, Inc. | 33,788 | 370,992 | ||||||
DSP Group, Inc.* | 30,058 | 196,580 | ||||||
Pericom Semiconductor Corp.* | 36,548 | 287,267 | ||||||
Sigma Designs, Inc.* | 79,192 | 436,348 | ||||||
|
| |||||||
Total Semiconductors & Semiconductor Equipment | 1,554,022 | |||||||
|
| |||||||
Specialty Retail - 11.6% |
| |||||||
Big 5 Sporting Goods Corp. | 67,809 | 567,561 | ||||||
Brown Shoe Co., Inc. | 90,723 | 826,487 | ||||||
Cabela’s, Inc.* | 6,544 | 247,429 | ||||||
Christopher & Banks Corp. | 157,905 | 295,282 | ||||||
Coldwater Creek, Inc.* | 376,181 | 372,419 | ||||||
Group 1 Automotive, Inc. | 10,310 | 596,743 | ||||||
Haverty Furniture Cos., Inc. | 29,091 | 349,092 | ||||||
Lithia Motors, Inc. — Class A | 17,353 | 465,581 | ||||||
MarineMax, Inc.* | 118,227 | 1,260,300 | ||||||
OfficeMax, Inc.* | 190,554 | 886,076 | ||||||
| SHARES | MARKET VALUE | |||||||
PEP Boys-Manny Moe & Jack | 48,201 | $ | 719,641 | |||||
Sonic Automotive, Inc. — Class A | 39,782 | 669,133 | ||||||
Stage Stores, Inc. | 46,458 | 709,414 | ||||||
Stein Mart, Inc.* | 107,713 | 691,517 | ||||||
Zale Corp.* | 96,455 | 264,287 | ||||||
|
| |||||||
Total Specialty Retail | 8,920,962 | |||||||
|
| |||||||
Textiles, Apparel & Luxury Goods - 4.1% |
| |||||||
Perry Ellis International, Inc.* | 68,619 | 1,283,862 | ||||||
Quiksilver, Inc.* | 193,772 | 670,451 | ||||||
Skechers U.S.A., Inc. — Class A* | 64,802 | 1,209,853 | ||||||
|
| |||||||
Total Textiles, Apparel & Luxury Goods | 3,164,166 | |||||||
|
| |||||||
Tobacco - 0.3% |
| |||||||
Alliance One International, Inc.* | 67,636 | 239,431 | ||||||
|
| |||||||
Total Tobacco | 239,431 | |||||||
|
| |||||||
Trading Companies & Distributors - 0.6% |
| |||||||
Lawson Products, Inc. | 29,878 | 435,024 | ||||||
|
| |||||||
Total Trading Companies & Distributors | 435,024 | |||||||
|
| |||||||
Total Common Stocks |
| 77,103,703 | ||||||
|
| |||||||
SHORT TERM INVESTMENTS - 0.2% |
| |||||||
SSgA Government Money Market Fund | 116,556 | 116,556 | ||||||
|
| |||||||
Total Short Term Investments | 116,556 | |||||||
|
| |||||||
Total Investments - 100.1%a |
| 77,220,259 | ||||||
|
| |||||||
Other Assets and Liabilities, |
| (76,326 | ) | |||||
|
| |||||||
Net Assets - 100.0% | $ | 77,143,933 | ||||||
|
| |||||||
| * | Non-Income Producing Security. |
| a | Unless otherwise indicated, the values of the Portfolio are determined based on Level 1 inputs. |
| See Notes to Financial Statements. | GUGGENHEIM ETFS SEMI-ANNUAL REPORT | 29 |
Table of Contents
| SCHEDULE OF INVESTMENTS (Unaudited) | April 30, 2012 |
GUGGENHEIM S&P SMALLCAP 600 PURE GROWTH ETF
| SHARES | MARKET VALUE | |||||||
COMMON STOCKS - 99.9% |
| |||||||
Aerospace & Defense - 3.1% |
| |||||||
Aerovironment, Inc.* | 8,434 | $ | 205,115 | |||||
American Science & Engineering, Inc. | 11,707 | 764,584 | ||||||
Cubic Corp. | 14,374 | 664,510 | ||||||
National Presto Industries, Inc. | 5,500 | 405,460 | ||||||
Teledyne Technologies, Inc.* | 6,569 | 424,489 | ||||||
|
| |||||||
Total Aerospace & Defense | 2,464,158 | |||||||
|
| |||||||
Air Freight & Logistics - 0.3% |
| |||||||
Forward Air Corp. | 7,417 | 250,546 | ||||||
|
| |||||||
Total Air Freight & Logistics | 250,546 | |||||||
|
| |||||||
Airlines - 1.2% |
| |||||||
Allegiant Travel Co.* | 15,706 | 922,885 | ||||||
|
| |||||||
Total Airlines | 922,885 | |||||||
|
| |||||||
Beverages - 0.8% |
| |||||||
Boston Beer Co., Inc. — Class A* | 6,472 | 668,687 | ||||||
|
| |||||||
Total Beverages | 668,687 | |||||||
|
| |||||||
Biotechnology - 2.9% |
| |||||||
ArQule, Inc.* | 68,308 | 481,571 | ||||||
Cubist Pharmaceuticals, Inc.* | 16,691 | 705,695 | ||||||
Momenta Pharmaceuticals, Inc.* | 47,361 | 752,093 | ||||||
Spectrum Pharmaceuticals, Inc.* | 33,433 | 355,393 | ||||||
|
| |||||||
Total Biotechnology | 2,294,752 | |||||||
|
| |||||||
Capital Markets - 0.6% |
| |||||||
Financial Engines, Inc.* | 21,467 | 490,306 | ||||||
|
| |||||||
Total Capital Markets | 490,306 | |||||||
|
| |||||||
Chemicals - 1.9% |
| |||||||
Balchem Corp. | 11,948 | 345,297 | ||||||
Hawkins, Inc. | 14,711 | 510,913 | ||||||
Innophos Holdings, Inc. | 12,755 | 627,164 | ||||||
|
| |||||||
Total Chemicals | 1,483,374 | |||||||
|
| |||||||
Commercial Services & Supplies - 0.9% |
| |||||||
Portfolio Recovery Associates, Inc.* | 11,024 | 758,672 | ||||||
|
| |||||||
Total Commercial Services & Supplies | 758,672 | |||||||
|
| |||||||
Communications Equipment - 0.8% |
| |||||||
Netgear, Inc.* | 8,714 | 335,489 | ||||||
ViaSat, Inc.* | 6,857 | 331,193 | ||||||
|
| |||||||
Total Communications Equipment | 666,682 | |||||||
|
| |||||||
Computers & Peripherals - 0.7% |
| |||||||
Synaptics, Inc.* | 17,436 | 535,460 | ||||||
|
| |||||||
Total Computers & Peripherals | 535,460 | |||||||
|
| |||||||
Consumer Finance - 2.7% |
| |||||||
Cash America International, Inc. | 12,609 | 589,470 | ||||||
EZCORP, Inc. — | 17,600 | 471,504 | ||||||
First Cash Financial Services, Inc.* | 8,604 | 352,420 | ||||||
World Acceptance Corp.* | 11,194 | 744,513 | ||||||
|
| |||||||
Total Consumer Finance | 2,157,907 | |||||||
|
| |||||||
| SHARES | MARKET VALUE | |||||||
Diversified Consumer Services - 3.0% |
| |||||||
American Public Education, Inc.* | 17,185 | $ | 596,663 | |||||
Capella Education Co.* | 19,827 | 648,541 | ||||||
Coinstar, Inc.* | 17,632 | 1,107,114 | ||||||
|
| |||||||
Total Diversified Consumer Services | 2,352,318 | |||||||
|
| |||||||
Diversified Telecommunication Services - 0.6% |
| |||||||
Atlantic Tele-Network, Inc. | 15,005 | 511,070 | ||||||
|
| |||||||
Total Diversified Telecommunication Services | 511,070 | |||||||
|
| |||||||
Electrical Equipment - 1.5% |
| |||||||
AZZ, Inc. | 8,165 | 422,212 | ||||||
Franklin Electric Co., Inc. | 9,340 | 468,401 | ||||||
II-VI, Inc.* | 16,315 | 332,989 | ||||||
|
| |||||||
Total Electrical Equipment | 1,223,602 | |||||||
|
| |||||||
Electronic Equipment, Instruments & |
| |||||||
Cognex Corp. | 13,059 | 525,625 | ||||||
DTS, Inc.* | 17,672 | 551,366 | ||||||
FARO Technologies, Inc.* | 5,252 | 294,007 | ||||||
Littelfuse, Inc. | 9,980 | 625,446 | ||||||
MTS Systems Corp. | 8,300 | 398,151 | ||||||
OSI Systems, Inc.* | 6,824 | 456,253 | ||||||
|
| |||||||
Total Electronic Equipment, Instruments & Components | 2,850,848 | |||||||
|
| |||||||
Energy Equipment & Services - 2.1% |
| |||||||
Lufkin Industries, Inc. | 5,291 | 406,560 | ||||||
OYO Geospace Corp.* | 3,568 | 411,105 | ||||||
SEACOR Holdings, Inc.* | 9,073 | 843,154 | ||||||
|
| |||||||
Total Energy Equipment & Services | 1,660,819 | |||||||
|
| |||||||
Food & Staples Retailing - 0.9% |
| |||||||
Casey’s General Stores, Inc. | 12,739 | 717,843 | ||||||
|
| |||||||
Total Food & Staples Retailing | 717,843 | |||||||
|
| |||||||
Food Products - 2.3% |
| |||||||
J&J Snack Foods Corp. | 9,944 | 557,461 | ||||||
Sanderson Farms, Inc. | 13,120 | 677,123 | ||||||
TreeHouse Foods, Inc.* | 10,121 | 582,059 | ||||||
|
| |||||||
Total Food Products | 1,816,643 | |||||||
|
| |||||||
Gas Utilities - 0.4% |
| |||||||
South Jersey Industries, Inc. | 6,083 | 299,588 | ||||||
|
| |||||||
Total Gas Utilities | 299,588 | |||||||
|
| |||||||
Health Care Equipment & Supplies - 5.7% |
| |||||||
Abaxis, Inc.* | 10,821 | 385,444 | ||||||
Analogic Corp. | 8,562 | 584,014 | ||||||
Cyberonics, Inc.* | 16,682 | 638,921 | ||||||
Haemonetics Corp.* | 10,637 | 761,290 | ||||||
ICU Medical, Inc.* | 15,208 | 798,268 | ||||||
Neogen Corp.* | 16,010 | 624,230 | ||||||
NuVasive, Inc.* | 43,583 | 722,170 | ||||||
|
| |||||||
Total Health Care Equipment & Supplies | 4,514,337 | |||||||
|
| |||||||
| 30 | GUGGENHEIM ETFS SEMI-ANNUAL REPORT | See Notes to Financial Statements. |
Table of Contents
| SCHEDULE OF INVESTMENTS (Unaudited) (continued) | April 30, 2012 |
GUGGENHEIM S&P SMALLCAP 600 PURE GROWTH ETF
| SHARES | MARKET VALUE | |||||||
Health Care Providers & Services - 6.7% |
| |||||||
Air Methods Corp.* | 7,509 | $ | 631,582 | |||||
Chemed Corp. | 11,111 | 670,438 | ||||||
CorVel Corp.* | 13,858 | 602,684 | ||||||
Ensign Group, Inc. (The) | 18,257 | 487,645 | ||||||
IPC The Hospitalist Co., Inc.* | 16,254 | 624,316 | ||||||
Landauer, Inc. | 10,125 | 533,790 | ||||||
Magellan Health Services, Inc.* | 15,761 | 697,897 | ||||||
MWI Veterinary Supply, Inc.* | 11,747 | 1,108,917 | ||||||
|
| |||||||
Total Health Care Providers & Services | 5,357,269 | |||||||
|
| |||||||
Health Care Technology - 2.6% |
| |||||||
Computer Programs & Systems, Inc. | 11,914 | 709,955 | ||||||
Medidata Solutions, Inc.* | 29,447 | 762,972 | ||||||
Quality Systems, Inc. | 15,942 | 596,231 | ||||||
|
| |||||||
Total Health Care Technology | 2,069,158 | |||||||
|
| |||||||
Hotels, Restaurants & Leisure - 6.1% |
| |||||||
Biglari Holdings, Inc.* | 1,769 | 718,798 | ||||||
BJ’s Restaurants, Inc.* | 14,564 | 629,019 | ||||||
Buffalo Wild Wings, Inc.* | 12,620 | 1,058,187 | ||||||
CEC Entertainment, Inc. | 15,130 | 578,269 | ||||||
DineEquity, Inc.* | 14,008 | 680,509 | ||||||
Papa John’s International, Inc.* | 9,219 | 371,341 | ||||||
Peet’s Coffee & Tea, Inc.* | 10,832 | 832,114 | ||||||
|
| |||||||
Total Hotels, Restaurants & Leisure | 4,868,237 | |||||||
|
| |||||||
Household Durables - 0.5% |
| |||||||
iRobot Corp.* | 15,469 | 365,223 | ||||||
|
| |||||||
Total Household Durables | 365,223 | |||||||
|
| |||||||
Household Products - 0.4% |
| |||||||
WD-40 Co. | 6,769 | 305,146 | ||||||
|
| |||||||
Total Household Products | 305,146 | |||||||
|
| |||||||
Insurance - 1.7% |
| |||||||
Infinity Property & Casualty Corp. | 10,972 | 586,014 | ||||||
ProAssurance Corp. | 5,312 | 467,934 | ||||||
RLI Corp. | 4,660 | 320,981 | ||||||
|
| |||||||
Total Insurance | 1,374,929 | |||||||
|
| |||||||
Internet & Catalog Retail - 0.3% |
| |||||||
Blue Nile, Inc.* | 7,415 | 224,526 | ||||||
|
| |||||||
Total Internet & Catalog Retail | 224,526 | |||||||
|
| |||||||
Internet Software & Services - 4.2% |
| |||||||
comScore, Inc.* | 14,729 | 293,402 | ||||||
InfoSpace, Inc.* | 47,525 | 528,953 | ||||||
j2 Global, Inc. | 9,903 | 255,794 | ||||||
Liquidity Services, Inc.* | 5,484 | 292,462 | ||||||
LivePerson, Inc.* | 20,986 | 333,258 | ||||||
LogMeIn, Inc.* | 16,000 | 576,160 | ||||||
OpenTable, Inc.* | 16,126 | 721,316 | ||||||
Stamps.com, Inc.* | 12,028 | 349,173 | ||||||
|
| |||||||
Total Internet Software & Services | 3,350,518 | |||||||
|
| |||||||
| SHARES | MARKET VALUE | |||||||
IT Services - 2.5% |
| |||||||
CACI International, Inc. — Class A* | 12,800 | $ | 782,464 | |||||
Forrester Research, Inc. | 7,638 | 270,767 | ||||||
Higher One Holdings, Inc.* | 20,672 | 325,998 | ||||||
MAXIMUS, Inc. | 13,353 | 590,870 | ||||||
|
| |||||||
Total IT Services | 1,970,099 | |||||||
|
| |||||||
Leisure Equipment & Products - 1.2% |
| |||||||
Sturm Ruger & Co., Inc. | 16,651 | 950,273 | ||||||
|
| |||||||
Total Leisure Equipment & Products | 950,273 | |||||||
|
| |||||||
Machinery - 1.1% |
| |||||||
Lindsay Corp. | 5,819 | 388,651 | ||||||
Toro Co. (The) | 6,480 | 463,061 | ||||||
|
| |||||||
Total Machinery | 851,712 | |||||||
|
| |||||||
Media - 0.5% |
| |||||||
Arbitron, Inc. | 9,929 | 377,798 | ||||||
|
| |||||||
Total Media | 377,798 | |||||||
|
| |||||||
Oil, Gas & Consumable Fuels - 2.2% |
| |||||||
Approach Resources, Inc.* | 10,222 | 366,765 | ||||||
Contango Oil & Gas Co.* | 11,632 | 631,152 | ||||||
GeoResources, Inc.* | 19,087 | 719,771 | ||||||
|
| |||||||
Total Oil, Gas & Consumable Fuels | 1,717,688 | |||||||
|
| |||||||
Paper & Forest Products - 1.1% |
| |||||||
Deltic Timber Corp. | 7,103 | 433,851 | ||||||
Schweitzer-Mauduit International, Inc. | 6,002 | 407,056 | ||||||
|
| |||||||
Total Paper & Forest Products | 840,907 | |||||||
|
| |||||||
Personal Products - 0.7% |
| |||||||
Medifast, Inc.* | 30,738 | 590,784 | ||||||
|
| |||||||
Total Personal Products | 590,784 | |||||||
|
| |||||||
Pharmaceuticals - 3.8% |
| |||||||
Akorn, Inc.* | 25,686 | 311,571 | �� | |||||
Hi-Tech Pharmacal Co., Inc.* | 21,038 | 685,628 | ||||||
Medicines Co. (The)* | 29,727 | 656,669 | ||||||
Questcor Pharmaceuticals, Inc.* | 15,091 | 677,586 | ||||||
Salix Pharmaceuticals Ltd.* | 5,922 | 292,547 | ||||||
ViroPharma, Inc.* | 17,922 | 389,804 | ||||||
|
| |||||||
Total Pharmaceuticals | 3,013,805 | |||||||
|
| |||||||
Professional Services - 1.3% |
| |||||||
Dolan Co. (The)* | 65,217 | 522,388 | ||||||
Exponent, Inc.* | 10,497 | 501,757 | ||||||
|
| |||||||
Total Professional Services | 1,024,145 | |||||||
|
| |||||||
Real Estate Investment Trusts (REITs) - 1.2% |
| |||||||
EastGroup Properties, Inc. | 5,416 | 272,425 | ||||||
Mid-America Apartment Communities, Inc. | 5,036 | 342,801 | ||||||
PS Business Parks, Inc. | 5,385 | 367,526 | ||||||
|
| |||||||
Total Real Estate Investment Trusts (REITs) | 982,752 | |||||||
|
| |||||||
| See Notes to Financial Statements. | GUGGENHEIM ETFS SEMI-ANNUAL REPORT | 31 |
Table of Contents
| SCHEDULE OF INVESTMENTS (Unaudited) (concluded) | April 30, 2012 |
GUGGENHEIM S&P SMALLCAP 600 PURE GROWTH ETF
| SHARES | MARKET VALUE | |||||||
Semiconductors & Semiconductor |
| |||||||
Cabot Microelectronics Corp. | 9,197 | $ | 316,193 | |||||
CEVA, Inc.* | 9,151 | 202,145 | ||||||
Cirrus Logic, Inc.* | 40,705 | 1,114,503 | ||||||
Cymer, Inc.* | 8,601 | 445,876 | ||||||
Entropic Communications, Inc.* | 92,653 | 391,922 | ||||||
Exar Corp.* | 85,228 | 675,006 | ||||||
GT Advanced Technologies, Inc.* | 53,436 | 347,868 | ||||||
Hittite Microwave Corp.* | 14,729 | 788,591 | ||||||
Kulicke & Soffa Industries, Inc.* | 65,056 | 852,234 | ||||||
Power Integrations, Inc. | 16,858 | 638,581 | ||||||
Rubicon Technology, Inc.* | 51,722 | 488,773 | ||||||
Veeco Instruments, Inc.* | 32,540 | 982,383 | ||||||
Volterra Semiconductor Corp.* | 20,642 | 678,915 | ||||||
|
| |||||||
Total Semiconductors & Semiconductor Equipment | 7,922,990 | |||||||
|
| |||||||
Software - 7.5% |
| |||||||
Blackbaud, Inc. | 8,920 | 276,342 | ||||||
CommVault Systems, Inc.* | 14,832 | 772,302 | ||||||
Ebix, Inc. | 22,515 | 460,432 | ||||||
Interactive Intelligence Group* | 13,306 | 394,656 | ||||||
JDA Software Group, Inc.* | 9,821 | 283,630 | ||||||
Manhattan Associates, Inc.* | 7,027 | 352,404 | ||||||
MicroStrategy, Inc. — Class A* | 4,955 | 692,610 | ||||||
Netscout Systems, Inc.* | 17,357 | 359,116 | ||||||
OPNET Technologies, Inc. | 11,366 | 263,237 | ||||||
Sourcefire, Inc.* | 18,157 | 925,825 | ||||||
Synchronoss Technologies, Inc.* | 8,735 | 273,406 | ||||||
Tyler Technologies, Inc.* | 13,937 | 556,783 | ||||||
Websense, Inc.* | 18,716 | 388,170 | ||||||
|
| |||||||
Total Software | 5,998,913 | |||||||
|
| |||||||
| SHARES | MARKET VALUE | |||||||
Specialty Retail - 6.0% |
| |||||||
Buckle, Inc. (The) | 14,861 | $ | 686,281 | |||||
Children’s Place Retail Stores, Inc. (The)* | 7,700 | 354,046 | ||||||
Genesco, Inc.* | 8,795 | 659,625 | ||||||
Hibbett Sports, Inc.* | 12,152 | 725,718 | ||||||
JOS A Bank Clothiers, Inc.* | 13,184 | 626,899 | ||||||
Monro Muffler Brake, Inc. | 13,532 | 558,330 | ||||||
Rue21, Inc.* | 20,402 | 619,201 | ||||||
Vitamin Shoppe, Inc.* | 11,190 | 526,713 | ||||||
|
| |||||||
Total Specialty Retail | 4,756,813 | |||||||
|
| |||||||
Textiles, Apparel & Luxury Goods - 1.9% |
| |||||||
Steven Madden Ltd.* | 17,314 | 748,138 | ||||||
True Religion Apparel, Inc.* | 16,330 | 443,523 | ||||||
Wolverine World Wide, Inc. | 7,287 | 305,689 | ||||||
|
| |||||||
Total Textiles, Apparel & Luxury Goods | 1,497,350 | |||||||
|
| |||||||
Water Utilities - 0.4% |
| |||||||
American States Water Co. | 8,489 | 309,339 | ||||||
|
| |||||||
Total Water Utilities | 309,339 | |||||||
|
| |||||||
Total Common Stocks | 79,360,871 | |||||||
|
| |||||||
SHORT TERM INVESTMENTS - 0.1% |
| |||||||
SSgA Government Money Market Fund | 45,037 | 45,037 | ||||||
|
| |||||||
Total Short Term Investments |
| 45,037 | ||||||
|
| |||||||
Total Investments - 100.0%a |
| 79,405,908 | ||||||
|
| |||||||
Other Assets and Liabilities, net - 0.0%b |
| (17,925 | ) | |||||
|
| |||||||
Net Assets - 100.0% | $ | 79,387,983 | ||||||
|
| |||||||
| * | Non-Income Producing Security. |
| a | Unless otherwise indicated, the values of the Portfolio are determined based on Level 1 inputs. |
| b | Amount represents less than 0.05% of net assets. |
| 32 | GUGGENHEIM ETFS SEMI-ANNUAL REPORT | See Notes to Financial Statements. |
Table of Contents
| STATEMENT OF ASSETS AND LIABILITIES (Unaudited) | April 30, 2012 |
| Guggenheim Russell Top 50® ETF | Guggenheim S&P 500 Pure Value ETF | Guggenheim S&P 500 Pure Growth ETF | Guggenheim S&P MidCap 400 Pure Value ETF | |||||||||||||
| ASSETS | ||||||||||||||||
Investments at market value* | $ | 484,845,903 | $ | 93,237,617 | $ | 321,268,237 | $ | 35,559,247 | ||||||||
Receivables: | ||||||||||||||||
Investments sold | — | 123,385 | — | 432,672 | ||||||||||||
Fund shares sold | 5,119,129 | — | — | — | ||||||||||||
Dividends | 548,255 | 63,732 | 113,989 | 12,107 | ||||||||||||
Total assets | 490,513,287 | 93,424,734 | 321,382,226 | 36,004,026 | ||||||||||||
| LIABILITIES | ||||||||||||||||
Payables: | ||||||||||||||||
Investments purchased | 5,111,014 | 197,426 | — | 449,901 | ||||||||||||
Accrued management fees | 76,631 | 26,638 | 90,467 | 10,934 | ||||||||||||
Total liabilities | 5,187,645 | 224,064 | 90,467 | 460,835 | ||||||||||||
| NET ASSETS | $ | 485,325,642 | $ | 93,200,670 | $ | 321,291,759 | $ | 35,543,191 | ||||||||
| NETASSETSCONSISTOF: | ||||||||||||||||
Paid-in capital | $ | 553,191,007 | $ | 99,858,494 | $ | 304,933,273 | $ | 36,489,125 | ||||||||
Undistributed net investment income | 739,997 | 94,108 | 62,879 | 11,475 | ||||||||||||
Accumulated net realized loss on investment securities | (67,675,096 | ) | (6,848,996 | ) | (17,505,956 | ) | (2,791,779 | ) | ||||||||
Net unrealized appreciation (depreciation) on investment securities | (930,266 | ) | 97,064 | 33,801,563 | 1,834,370 | |||||||||||
| NETASSETS | $ | 485,325,642 | $ | 93,200,670 | $ | 321,291,759 | $ | 35,543,191 | ||||||||
Shares outstanding (unlimited shares authorized), no par value | 4,750,785 | 3,002,836 | 6,550,299 | 1,000,499 | ||||||||||||
Net asset value, offering price and repurchase price per share | $102.16 | $31.04 | $49.05 | $35.53 | ||||||||||||
*Total cost of investments | $ | 485,776,169 | $ | 93,140,553 | $ | 287,466,674 | $ | 33,724,877 | ||||||||
| See Notes to Financial Statements. | GUGGENHEIM ETFS SEMI-ANNUAL REPORT | 33 |
Table of Contents
| STATEMENT OF ASSETS AND LIABILITIES (Unaudited) (concluded) | April 30, 2012 |
| Guggenheim S&P MidCap 400 Pure Growth ETF | Guggenheim S&P SmallCap 600 Pure Value ETF | Guggenheim S&P SmallCap 600 Pure Growth ETF | ||||||||||
| ASSETS | ||||||||||||
Investments at market value* | $ | 602,671,223 | $ | 77,220,259 | $ | 79,405,908 | ||||||
Receivables: | ||||||||||||
Investments sold | — | 637,821 | — | |||||||||
Dividends | 59,983 | 18,504 | 4,867 | |||||||||
Total assets | 602,731,206 | 77,876,584 | 79,410,775 | |||||||||
| LIABILITIES | ||||||||||||
Payables: | ||||||||||||
Investments purchased | — | 710,699 | — | |||||||||
Accrued management fees | 171,678 | 21,952 | 22,792 | |||||||||
Total liabilities | 171,678 | 732,651 | 22,792 | |||||||||
| NET ASSETS | $ | 602,559,528 | $ | 77,143,933 | $ | 79,387,983 | ||||||
| NETASSETSCONSISTOF: | ||||||||||||
Paid-in capital | $ | 582,703,721 | $ | 101,950,658 | $ | 77,973,174 | ||||||
Undistributed (distributions in excess) of net investment income | (31,052 | ) | 20,892 | (3,425 | ) | |||||||
Accumulated net realized loss on investment securities | (39,451,708 | ) | (24,070,952 | ) | (2,637,605 | ) | ||||||
Net unrealized appreciation (depreciation) on investment securities | 59,338,567 | (756,665 | ) | 4,055,839 | ||||||||
| NETASSETS | $ | 602,559,528 | $ | 77,143,933 | $ | 79,387,983 | ||||||
Shares outstanding (unlimited shares authorized), no par value | 6,700,021 | 1,950,040 | 1,450,004 | |||||||||
Net asset value, offering price and repurchase price per share | $89.93 | $39.56 | $54.75 | |||||||||
*Total cost of investments | $ | 543,332,656 | $ | 77,976,924 | $ | 75,350,069 | ||||||
| 34 | GUGGENHEIM ETFS SEMI-ANNUAL REPORT | See Notes to Financial Statements. |
Table of Contents
STATEMENT OF OPERATIONS (Unaudited)
|
For the Six Months Ended April 30, 2012
| Guggenheim Russell Top 50® ETF | Guggenheim S&P 500 Pure Value ETF | Guggenheim S&P 500 Pure Growth ETF | Guggenheim S&P MidCap 400 Pure Value ETF | |||||||||||||
| INVESTMENT INCOME | ||||||||||||||||
Dividends | $ | 5,489,266 | $ | 831,618 | $ | 1,576,400 | $ | 345,951 | ||||||||
Interest | 6 | 1 | 12 | — | ||||||||||||
Total income | 5,489,272 | 831,619 | 1,576,412 | 345,951 | ||||||||||||
| EXPENSES | ||||||||||||||||
Management fee | 462,860 | 147,009 | 503,039 | 69,587 | ||||||||||||
| 462,860 | 147,009 | 503,039 | 69,587 | |||||||||||||
Net investment income | 5,026,412 | 684,610 | 1,073,373 | 276,364 | ||||||||||||
| REALIZEDAND UNREALIZED GAIN (LOSS)ON INVESTMENTS | ||||||||||||||||
Net realized gain (loss) from: | ||||||||||||||||
Investments | (939,285 | ) | (304,125 | ) | (18,426,127 | ) | (1,137,920 | ) | ||||||||
In-kind Redemptions | 33,570,582 | 1,637,601 | 3,527,365 | 1,182,720 | ||||||||||||
Net realized gain (loss) | 32,631,297 | 1,333,476 | (14,898,762 | ) | 44,800 | |||||||||||
Net change in unrealized appreciation on: | ||||||||||||||||
Investment securities | 24,055,450 | 5,638,730 | 41,661,810 | 5,410,215 | ||||||||||||
Net realized and unrealized gain on investments | 56,686,747 | 6,972,206 | 26,763,048 | 5,455,015 | ||||||||||||
Net increase in net assets resulting from operations | $ | 61,713,159 | $ | 7,656,816 | $ | 27,836,421 | $ | 5,731,379 | ||||||||
| See Notes to Financial Statements. | GUGGENHEIM ETFS SEMI-ANNUAL REPORT | 35 |
Table of Contents
STATEMENT OF OPERATIONS (Unaudited) (concluded)
|
For the Six Months Ended April 30, 2012
| Guggenheim S&P MidCap 400 Pure Growth ETF | Guggenheim S&P SmallCap 600 Pure Value ETF | Guggenheim S&P SmallCap 600 Pure Growth ETF | ||||||||||
| INVESTMENT INCOME | ||||||||||||
Dividends | $ | 1,462,423 | $ | 378,069 | $ | 305,143 | ||||||
Interest | 4 | — | 1 | |||||||||
Total income | 1,462,427 | 378,069 | 305,144 | |||||||||
| EXPENSES | ||||||||||||
Management fee | 1,028,998 | 122,607 | 113,069 | |||||||||
| 1,028,998 | 122,607 | 113,069 | ||||||||||
Net investment income | 433,429 | 255,462 | 192,075 | |||||||||
| REALIZEDAND UNREALIZED GAIN (LOSS)ON INVESTMENTS | ||||||||||||
Net realized gain (loss) from: | ||||||||||||
Investments | (54,244,070 | ) | (3,073,716 | ) | (2,143,451 | ) | ||||||
In-kind redemptions | 16,979,841 | — | 437,622 | |||||||||
Net realized loss | (37,264,229 | ) | (3,073,716 | ) | (1,705,829 | ) | ||||||
Net change in unrealized appreciation on: | ||||||||||||
Investment securities | 82,735,691 | 9,759,258 | 8,152,107 | |||||||||
Net realized and unrealized gain on investments | 45,471,462 | 6,685,542 | 6,446,278 | |||||||||
Net increase in net assets resulting from operations | $ | 45,904,891 | $ | 6,941,004 | $ | 6,638,353 | ||||||
| 36 | GUGGENHEIM ETFS SEMI-ANNUAL REPORT | See Notes to Financial Statements. |
Table of Contents
| STATEMENTS OF CHANGES IN NET ASSETS |
| Guggenheim Russell Top 50® ETF | Guggenheim S&P 500 Pure Value ETF | |||||||||||||||
| Six Months Ended April 30, 2012 (Unaudited) | Year Ended October 31, 2011 | Six Months Ended April 30, 2012 (Unaudited) | Year Ended October 31, 2011 | |||||||||||||
| OPERATIONS | ||||||||||||||||
Net investment income | $ | 5,026,412 | $ | 7,875,126 | $ | 684,610 | $ | 1,288,269 | ||||||||
Net realized gain (loss) on investments | 32,631,297 | (1,000,821 | ) | 1,333,476 | 1,122,980 | |||||||||||
Net change in unrealized appreciation (depreciation) on investments | 24,055,450 | 19,318,113 | 5,638,730 | (2,290,115 | ) | |||||||||||
Net increase in net assets | 61,713,159 | 26,192,418 | 7,656,816 | 121,134 | ||||||||||||
| DISTRIBUTIONSTO SHAREHOLDERSFROM: | ||||||||||||||||
Net investment income | (5,076,826 | ) | (7,603,764 | ) | (672,022 | ) | (1,211,677 | ) | ||||||||
| SHAREHOLDER TRANSACTIONS | ||||||||||||||||
Proceeds from shares purchased | 179,271,892 | 150,183,009 | 17,479,492 | 60,757,533 | ||||||||||||
Value of shares redeemed | (204,991,871 | ) | (38,031,580 | ) | (10,813,895 | ) | (35,992,276 | ) | ||||||||
Net increase (decrease) in net assets resulting from share transactions | (25,719,979 | ) | 112,151,429 | 6,665,597 | 24,765,257 | |||||||||||
Increase in net assets | 30,916,354 | 130,740,083 | 13,650,391 | 23,674,714 | ||||||||||||
| NETASSETS | ||||||||||||||||
Beginning of period | 454,409,288 | 323,669,205 | 79,550,279 | 55,875,565 | ||||||||||||
End of period1 | $ | 485,325,642 | $ | 454,409,288 | $ | 93,200,670 | $ | 79,550,279 | ||||||||
1 Including undistributed net investment income | $ | 739,997 | $ | 790,411 | $ | 94,108 | $ | 81,520 | ||||||||
| CHANGESINSHARESOUTSTANDING: | ||||||||||||||||
Shares purchased | 1,900,000 | 1,700,000 | 550,000 | 2,000,000 | ||||||||||||
Shares redeemed | (2,200,000 | ) | (450,000 | ) | (350,000 | ) | (1,350,000 | ) | ||||||||
Shares outstanding, beginning of period | 5,050,785 | 3,800,785 | 2,802,836 | 2,152,836 | ||||||||||||
Shares outstanding, end of period | 4,750,785 | 5,050,785 | 3,002,836 | 2,802,836 | ||||||||||||
| See Notes to Financial Statements. | GUGGENHEIM ETFS SEMI-ANNUAL REPORT | 37 |
Table of Contents
| STATEMENTS OF CHANGES IN NET ASSETS (continued) |
| Guggenheim S&P 500 Pure Growth ETF | Guggenheim S&P MidCap 400 Pure Value ETF | |||||||||||||||
| Six Months Ended April 30, 2012 (Unaudited) | Year Ended October 31, 2011 | Six Months Ended April 30, 2012 (Unaudited) | Year Ended October 31, 2011 | |||||||||||||
| OPERATIONS | ||||||||||||||||
Net Investment Income | $ | 1,073,373 | $ | 1,020,216 | $ | 276,364 | $ | 588,491 | ||||||||
Net realized gain (loss) on investments | (14,898,762 | ) | 23,480,072 | 44,800 | 1,240,256 | |||||||||||
Net change in unrealized appreciation (depreciation) on investments | 41,661,810 | (23,088,187 | ) | 5,410,215 | (2,426,037 | ) | ||||||||||
Net increase (decrease) in net assets resulting from operations | 27,836,421 | 1,412,101 | 5,731,379 | (597,290 | ) | |||||||||||
| DISTRIBUTIONSTO SHAREHOLDERSFROM: | ||||||||||||||||
Net investment income | (1,025,692 | ) | (996,112 | ) | (293,225 | ) | (566,319 | ) | ||||||||
| SHAREHOLDERTRANSACTIONS | ||||||||||||||||
Proceeds from shares purchased | 55,143,833 | 259,891,376 | 3,130,358 | 10,618,563 | ||||||||||||
Value of shares redeemed | (26,551,559 | ) | (141,889,014 | ) | (8,696,285 | ) | (16,872,735 | ) | ||||||||
Net increase (decrease) in net assets resulting from share transactions | 28,592,274 | 118,002,362 | (5,565,927 | ) | (6,254,172 | ) | ||||||||||
Increase (decrease) in net assets | 55,403,003 | 118,418,351 | (127,773 | ) | (7,417,781 | ) | ||||||||||
| NETASSETS | ||||||||||||||||
Beginning of period | 265,888,756 | 147,470,405 | 35,670,964 | 43,088,745 | ||||||||||||
End of period1 | $ | 321,291,759 | $ | 265,888,756 | $ | 35,543,191 | $ | 35,670,964 | ||||||||
1 Including undistributed net investment income | $ | 62,879 | $ | 15,198 | $ | 11,475 | $ | 28,336 | ||||||||
| CHANGESINSHARESOUTSTANDING: | ||||||||||||||||
Shares purchased | 1,200,000 | 5,700,000 | 100,000 | 300,000 | ||||||||||||
Shares redeemed | (600,000 | ) | (3,400,000 | ) | (250,000 | ) | (550,000 | ) | ||||||||
Shares outstanding, beginning of period | 5,950,299 | 3,650,299 | 1,150,499 | 1,400,499 | ||||||||||||
Shares outstanding, end of period | 6,550,299 | 5,950,299 | 1,000,499 | 1,150,499 | ||||||||||||
| 38 | GUGGENHEIM ETFS SEMI-ANNUAL REPORT | See Notes to Financial Statements. |
Table of Contents
| STATEMENTS OF CHANGES IN NET ASSETS (continued) |
| Guggenheim S&P MidCap 400 Pure Growth ETF | Guggenheim S&P SmallCap 600 Pure Value ETF | |||||||||||||||
| Six Months Ended April 30, 2012 (Unaudited) | Year Ended October 31, 2011 | Six Months Ended April 30, 2012 (Unaudited) | Year Ended October 31, 2011 | |||||||||||||
| OPERATIONS | ||||||||||||||||
Net investment income | $ | 433,429 | $ | 494,420 | $ | 255,462 | $ | 444,600 | ||||||||
Net realized gain (loss) | (37,264,229 | ) | 69,090,697 | (3,073,716 | ) | 3,386,071 | ||||||||||
Net change in unrealized appreciation (depreciation) on Investments | 82,735,691 | (51,357,329 | ) | 9,759,258 | 849,778 | |||||||||||
Net increase in net assets resulting from operations | 45,904,891 | 18,227,788 | 6,941,004 | 4,680,449 | ||||||||||||
| DISTRIBUTIONSTO SHAREHOLDERSFROM: | ||||||||||||||||
Net investment income | (464,481 | ) | (494,945 | ) | (234,570 | ) | (444,287 | ) | ||||||||
| SHAREHOLDERTRANSACTIONS | ||||||||||||||||
Proceeds from shares purchased | 74,690,949 | 689,925,224 | 8,307,891 | 14,049,940 | ||||||||||||
Value of shares redeemed | (170,817,803 | ) | (346,841,356 | ) | — | (43,539,405 | ) | |||||||||
Net increase (decrease) in net assets resulting from share transactions | (96,126,854 | ) | 343,083,868 | 8,307,891 | (29,489,465 | ) | ||||||||||
Increase (decrease) in net assets | (50,686,444 | ) | 360,816,711 | 15,014,325 | (25,253,303 | ) | ||||||||||
| NETASSETS | ||||||||||||||||
Beginning of period | 653,245,972 | 292,429,261 | 62,129,608 | 87,382,911 | ||||||||||||
End of period1 | $ | 602,559,528 | $ | 653,245,972 | $ | 77,143,933 | $ | 62,129,608 | ||||||||
1 Including undistributed (distributions in excess) of net investment income | $ | (31,052 | ) | $ | — | $ | 20,892 | $ | — | |||||||
| CHANGESINSHARESOUTSTANDING: | ||||||||||||||||
Shares purchased | 900,000 | 8,250,000 | 200,000 | 350,000 | ||||||||||||
Shares redeemed | (2,150,000 | ) | (4,450,000 | ) | — | (1,150,000 | ) | |||||||||
Shares outstanding, beginning of period | 7,950,021 | 4,150,021 | 1,750,040 | 2,550,040 | ||||||||||||
Shares outstanding, end of period | 6,700,021 | 7,950,021 | 1,950,040 | 1,750,040 | ||||||||||||
| See Notes to Financial Statements. | GUGGENHEIM ETFS SEMI-ANNUAL REPORT | 39 |
Table of Contents
| STATEMENTS OF CHANGES IN NET ASSETS (concluded) |
| Guggenheim S&P SmallCap 600 Pure Growth ETF | ||||||||
| Six Months Ended April 30, 2012 (Unaudited) | Year Ended October 31, 2011 | |||||||
| OPERATIONS | ||||||||
Net investment income | $ | 192,075 | $ | 12,081 | ||||
Net realized loss on investments | (1,705,829 | ) | (1,667,405 | ) | ||||
Net change in unrealized appreciation (depreciation) on investments | 8,152,107 | (6,355,046 | ) | |||||
Net increase (decrease) in net assets resulting from operations | 6,638,353 | (8,010,370 | ) | |||||
| DISTRIBUTIONSTO SHAREHOLDERSFROM: | ||||||||
Net investment income | (195,500 | ) | (46,996 | ) | ||||
| SHAREHOLDERTRANSACTIONS | ||||||||
Proceeds from shares purchased | 40,808,973 | 103,804,934 | ||||||
Value of shares redeemed | (2,736,392 | ) | (78,204,381 | ) | ||||
Net increase in net assets resulting from share transactions | 38,072,581 | 25,600,553 | ||||||
Increase in net assets | 44,515,434 | 17,543,187 | ||||||
| NETASSETS | ||||||||
Beginning of period | 34,872,549 | 17,329,362 | ||||||
End of period1 | $ | 79,387,983 | $ | 34,872,549 | ||||
1 Including undistributed (distributions in excess) of net investment income | $ | (3,425 | ) | $ | — | |||
| CHANGESINSHARESOUTSTANDING: | ||||||||
Shares purchased | 800,000 | 1,950,000 | ||||||
Shares redeemed | (50,000 | ) | (1,650,000 | ) | ||||
Shares outstanding, beginning of period | 700,004 | 400,004 | ||||||
Shares outstanding, end of period | 1,450,004 | 700,004 | ||||||
| 40 | GUGGENHEIM ETFS SEMI-ANNUAL REPORT | See Notes to Financial Statements. |
Table of Contents
GUGGENHEIM RUSSELL TOP 50® ETF
| FINANCIAL HIGHLIGHTS |
| Six Months Ended April 30, 2012 (Unaudited) | Year Ended October 31, 2011 | Year Ended October 31, 2010 | Year Ended October 31, 2009 | Year Ended October 31, 2008 | Year Ended October 31, 2007 | |||||||||||||||||||
Per Share Operating Performance: |
| |||||||||||||||||||||||
Net asset value at beginning of period | $89.97 | $85.16 | $78.90 | $76.29 | $116.47 | $104.15 | ||||||||||||||||||
Net investment income* | 1.03 | 1.87 | 1.72 | 1.95 | 2.34 | 2.15 | ||||||||||||||||||
Net realized and unrealized gain (loss) on investments | 12.20 | 4.74 | 6.26 | 2.61 | (40.20 | ) | 12.25 | |||||||||||||||||
|
|
|
|
|
|
|
|
|
|
|
| |||||||||||||
Total from investment operations | 13.23 | 6.61 | 7.98 | 4.56 | (37.86 | ) | 14.40 | |||||||||||||||||
Distributions to shareholders from: | ||||||||||||||||||||||||
Net investment income | (1.04 | ) | (1.80 | ) | (1.72 | ) | (1.95 | ) | (2.32 | ) | (2.08 | ) | ||||||||||||
Net asset value at end of period | $102.16 | $89.97 | $85.16 | $78.90 | $76.29 | $116.47 | ||||||||||||||||||
|
|
|
|
|
|
|
|
|
|
|
| |||||||||||||
Total Return** | 14.77% | 7.80% | 10.22% | 6.35% | (32.92% | ) | 13.96% | |||||||||||||||||
Ratios/Supplemental Data: | ||||||||||||||||||||||||
Net assets at end of period (000’s omitted) | $485,326 | $454,409 | $323,669 | $315,662 | $434,878 | $681,355 | ||||||||||||||||||
Ratio to average net assets of: | ||||||||||||||||||||||||
Expenses | 0.20% | 0.20% | 0.20% | 0.20% | 0.20% | 0.20% | ||||||||||||||||||
Net investment income | 2.17% | 2.08% | 2.09% | 2.79% | 2.37% | 1.96% | ||||||||||||||||||
Portfolio turnover rate† | 1% | 6% | 9% | 12% | 10% | 8% | ||||||||||||||||||
| * | Based on average shares outstanding. |
| ** | Total investment return is calculated assuming an initial investment made at the net asset value at the beginning of the period, reinvestment of all dividends and distribution at net asset value during the period, and redemption on the last day of the period. Transaction fees are not reflected in the calculation of total investment return. Total investment return calculated for a period of less than one year is not annualized. |
| † | Portfolio turnover is not annualized and does not include securities received or delivered from processing creations or redemptions. |
| See Notes to Financial Statements. | GUGGENHEIM ETFS SEMI-ANNUAL REPORT | 41 |
Table of Contents
GUGGENHEIM S&P 500 PURE VALUE ETF
FINANCIAL HIGHLIGHTS (continued)
| Six Months Ended April 30, 2012 (Unaudited) | Year Ended October 31, 2011 | Year Ended October 31, 2010 | Year Ended October 31, 2009 | Year Ended 2008 | Year Ended October 31, | |||||||||||||||||||
Per Share Operating Performance: |
| |||||||||||||||||||||||
Net asset value at beginning of period | $28.38 | $25.95 | $21.46 | $17.98 | $34.46 | $32.66 | ||||||||||||||||||
Net investment income* | 0.24 | 0.42 | 0.35 | 0.49 | 1.00 | 0.75 | ||||||||||||||||||
Net realized and unrealized gain (loss) on investments | 2.66 | 2.40 | 4.49 | 3.53 | (16.44 | ) | 1.80 | |||||||||||||||||
|
|
|
|
|
|
|
|
|
|
|
| |||||||||||||
Total from investment operations | 2.90 | 2.82 | 4.84 | 4.02 | (15.44 | ) | 2.55 | |||||||||||||||||
Distributions to shareholders from: | ||||||||||||||||||||||||
Net investment income | (0.24 | ) | (0.39 | ) | (0.35 | ) | (0.54 | ) | (1.04 | ) | (0.75 | ) | ||||||||||||
Net asset value at end of period | $31.04 | $28.38 | $25.95 | $21.46 | $17.98 | $34.46 | ||||||||||||||||||
|
|
|
|
|
|
|
|
|
|
|
| |||||||||||||
Total Return** | 10.24% | 10.84% | 22.67% | 23.73% | (45.76% | ) | 7.79% | |||||||||||||||||
Ratios/Supplemental Data: | ||||||||||||||||||||||||
Net assets at end of period (000’s omitted) | $93,201 | $79,550 | $55,876 | $30,101 | $17,994 | $39,635 | ||||||||||||||||||
Ratio to average net assets of: | ||||||||||||||||||||||||
Expenses | 0.35% | 0.35% | 0.35% | 0.35% | 0.35% | 0.35% | ||||||||||||||||||
Net investment income | 1.63% | 1.44% | 1.38% | 2.92% | 3.63% | 2.15% | ||||||||||||||||||
Portfolio turnover rate† | 34% | 23% | 27% | 45% | 53% | 26% | ||||||||||||||||||
| * | Based on average shares outstanding. |
| ** | Total investment return is calculated assuming an initial investment made at the net asset value at the beginning of the period, reinvestment of all dividends and distribution at net asset value during the period, and redemption on the last day of the period. Transaction fees are not reflected in the calculation of total investment return. Total investment return calculated for a period of less than one year is not annualized. |
| † | Portfolio turnover is not annualized and does not include securities received or delivered from processing creations or redemptions. |
| 42 | GUGGENHEIM ETFS SEMI-ANNUAL REPORT | See Notes to Financial Statements. |
Table of Contents
GUGGENHEIM S&P 500 PURE GROWTH ETF |
FINANCIAL HIGHLIGHTS (continued)
| Six Months Ended April 30, 2012 (Unaudited) | Year Ended October 31, 2011 | Year Ended October 31, 2010 | Year Ended October 31, 2009 | Year Ended October 31, 2008 | Year Ended October 31, 2007 | |||||||||||||||||||
Per Share Operating Performance: |
| |||||||||||||||||||||||
Net asset value at beginning of period | $44.68 | $40.40 | $30.85 | $24.40 | $39.59 | $35.30 | ||||||||||||||||||
Net investment income* | 0.17 | 0.18 | 0.13 | 0.18 | 0.20 | 0.25 | ||||||||||||||||||
Net realized and unrealized gain (loss) on investments | 4.36 | 4.28 | 9.57 | 6.46 | (15.19 | ) | 4.26 | |||||||||||||||||
|
|
|
|
|
|
|
|
|
|
|
| |||||||||||||
Total from investment operations | 4.53 | 4.46 | 9.70 | 6.64 | (14.99 | ) | 4.51 | |||||||||||||||||
Distributions to shareholders from: | ||||||||||||||||||||||||
Net investment income | (0.16 | ) | (0.18 | ) | (0.15 | ) | (0.19 | ) | (0.20 | ) | (0.22 | ) | ||||||||||||
Net asset value at end of period | $49.05 | $44.68 | $40.40 | $30.85 | $24.40 | $39.59 | ||||||||||||||||||
|
|
|
|
|
|
|
|
|
|
|
| |||||||||||||
Total Return** | 10.16% | 11.06% | 31.51% | 27.41% | (38.00% | ) | 12.79% | |||||||||||||||||
Ratios/Supplemental Data: | ||||||||||||||||||||||||
Net assets at end of period (000’s omitted) | $321,292 | $265,889 | $147,470 | $38,568 | $24,398 | $63,340 | ||||||||||||||||||
Ratio to average net assets of: | ||||||||||||||||||||||||
Expenses | 0.35% | 0.35% | 0.35% | 0.35% | 0.35% | 0.35% | ||||||||||||||||||
Net investment income | 0.75% | 0.41% | 0.37% | 0.69% | 0.57% | 0.66% | ||||||||||||||||||
Portfolio turnover rate† | 34% | 21% | 31% | 27% | 30% | 24% | ||||||||||||||||||
| * | Based on average shares outstanding. |
| ** | Total investment return is calculated assuming an initial investment made at the net asset value at the beginning of the period, reinvestment of all dividends and distribution at net asset value during the period, and redemption on the last day of the period. Transaction fees are not reflected in the calculation of total investment return. Total investment return calculated for a period of less than one year is not annualized. |
| † | Portfolio turnover is not annualized and does not include securities received or delivered from processing creations or redemptions. |
| See Notes to Financial Statements. | GUGGENHEIM ETFS SEMI-ANNUAL REPORT | 43 |
Table of Contents
GUGGENHEIM S&P MIDCAP 400 PURE VALUE ETF
| FINANCIAL HIGHLIGHTS (continued) |
| Six Months Ended April 30, 2012 (Unaudited) | Year Ended October 31, 2011 | Year Ended October 31, 2010 | Year Ended October 31, 2009 | Year Ended October 31, 2008 | Year Ended October 31, 2007 | |||||||||||||||||||
Per Share Operating Performance: |
| |||||||||||||||||||||||
Net asset value at beginning of period | $31.00 | $30.77 | $24.20 | $20.24 | $35.76 | $33.27 | ||||||||||||||||||
Net investment income* | 0.23 | 0.41 | 0.36 | 0.59 | 0.87 | 0.82 | ||||||||||||||||||
Net realized and unrealized gain (loss) on investments | 4.54 | 0.22 | 6.57 | 3.92 | (15.54 | ) | 2.48 | |||||||||||||||||
|
|
|
|
|
|
|
|
|
|
|
| |||||||||||||
Total from investment operations | 4.77 | 0.63 | 6.93 | 4.51 | (14.67 | ) | 3.30 | |||||||||||||||||
Distributions to shareholders from: | ||||||||||||||||||||||||
Net investment income | (0.24 | ) | (0.40 | ) | (0.36 | ) | (0.55 | ) | (0.84 | ) | (0.81 | ) | ||||||||||||
Net asset value at end of period | $35.53 | $31.00 | $30.77 | $24.20 | $20.24 | $35.76 | ||||||||||||||||||
|
|
|
|
|
|
|
|
|
|
|
| |||||||||||||
Total Return** | 15.41% | 2.03% | 28.75% | 23.32% | (41.75% | ) | 9.94% | |||||||||||||||||
Ratios/Supplemental Data: |
| |||||||||||||||||||||||
Net assets at end of period (000’s omitted) | $35,543 | $35,671 | $43,089 | $22,997 | $10,126 | $21,458 | ||||||||||||||||||
Ratio to average net assets of: | ||||||||||||||||||||||||
Expenses | 0.35% | 0.35% | 0.35% | 0.35% | 0.35% | 0.35% | ||||||||||||||||||
Net investment income | 1.39% | 1.22% | 1.20% | 2.90% | 2.87% | 2.28% | ||||||||||||||||||
Portfolio turnover rate† | 42% | 49% | 35% | 57% | 64% | 46% | ||||||||||||||||||
| * | Based on average shares outstanding. |
| ** | Total investment return is calculated assuming an initial investment made at the net asset value at the beginning of the period, reinvestment of all dividends and distribution at net asset value during the period, and redemption on the last day of the period. Transaction fees are not reflected in the calculation of total investment return. Total investment return calculated for a period of less than one year is not annualized. |
| † | Portfolio turnover is not annualized and does not include securities received or delivered from processing creations or redemptions. |
| 44 | GUGGENHEIM ETFS SEMI-ANNUAL REPORT | See Notes to Financial Statements. |
Table of Contents
GUGGENHEIM S&P MIDCAP 400 PURE GROWTH ETF
| FINANCIAL HIGHLIGHTS (continued) |
| Six Months Ended April 30, 2012 (Unaudited) | Year Ended October 31, 2011 | Year Ended October 31, 2010 | Year Ended October 31, 2009 | Year Ended October 31, 2008 | Year Ended October 31, 2007 | |||||||||||||||||||
Per Share Operating Performance: |
| |||||||||||||||||||||||
Net asset value at beginning of period | $82.17 | $70.46 | $52.89 | $39.10 | $59.75 | $50.10 | ||||||||||||||||||
Net investment income* | 0.06 | 0.07 | 0.02 | 0.09 | 0.02 | 0.33 | ||||||||||||||||||
Net realized and unrealized gain (loss) on investments | 7.77 | 11.72 | 17.59 | 13.79 | (20.63 | ) | 9.73 | |||||||||||||||||
|
|
|
|
|
|
|
|
|
|
|
| |||||||||||||
Total from investment operations | 7.83 | 11.79 | 17.61 | 13.88 | (20.61 | ) | 10.06 | |||||||||||||||||
Distributions to shareholders from: | ||||||||||||||||||||||||
Net investment income | (0.07 | ) | (0.08 | ) | (0.04 | ) | (0.09 | ) | (0.04 | ) | (0.27 | ) | ||||||||||||
Net realized gains | — | — | — | — | — | (0.14 | ) | |||||||||||||||||
|
|
|
|
|
|
|
|
|
|
|
| |||||||||||||
Total distributions | (0.07 | ) | (0.08 | ) | (0.04 | ) | (0.09 | ) | (0.04 | ) | (0.41 | ) | ||||||||||||
Net asset value at end of period | $89.93 | $82.17 | $70.46 | $52.89 | $39.10 | $59.75 | ||||||||||||||||||
|
|
|
|
|
|
|
|
|
|
|
| |||||||||||||
Total Return** | 9.53% | 16.73% | 33.32% | 35.59% | (34.52% | ) | 20.17% | |||||||||||||||||
Ratios/Supplemental Data: | ||||||||||||||||||||||||
Net assets at end of period (000’s omitted) | $602,560 | $653,246 | $292,429 | $108,432 | $17,596 | $20,914 | ||||||||||||||||||
Ratio to average net assets of: | ||||||||||||||||||||||||
Expenses | 0.35% | 0.35% | 0.35% | 0.35% | 0.35% | 0.35% | ||||||||||||||||||
Net investment income | 0.15% | 0.09% | 0.03% | 0.19% | 0.04% | 0.60% | ||||||||||||||||||
Portfolio turnover rate† | 41% | 45% | 51% | 29% | 52% | 53% | ||||||||||||||||||
| * | Based on average shares outstanding. |
| ** | Total investment return is calculated assuming an initial investment made at the net asset value at the beginning of the period, reinvestment of all dividends and distribution at net asset value during the period, and redemption on the last day of the period. Transaction fees are not reflected in the calculation of total investment return. Total investment return calculated for a period of less than one year is not annualized. |
| † | Portfolio turnover is not annualized and does not include securities received or delivered from processing creations or redemptions. |
| See Notes to Financial Statements. | GUGGENHEIM ETFS SEMI-ANNUAL REPORT | 45 |
Table of Contents
GUGGENHEIM S&P SMALLCAP 600 PURE VALUE ETF
FINANCIAL HIGHLIGHTS (continued)
| Six Months Ended April 30, 2012 (Unaudited) | Year Ended October 31, 2011 | Year Ended October 31, 2010 | Year Ended October 31, 2009 | Year Ended October 31, 2008 | Year Ended October 31, 2007 | |||||||||||||||||||
Per Share Operating Performance: |
| |||||||||||||||||||||||
Net asset value at beginning of period | $35.50 | $34.27 | $28.50 | �� | $23.21 | $37.38 | $40.13 | |||||||||||||||||
Net investment income* | 0.14 | 0.20 | 0.20 | 0.32 | 0.79 | 0.74 | ||||||||||||||||||
Net realized and unrealized gain (loss) on investments | 4.04 | 1.23 | 5.78 | 5.29 | (14.26 | ) | (2.85 | ) | ||||||||||||||||
|
|
|
|
|
|
|
|
|
|
|
| |||||||||||||
Total from investment operations | 4.18 | 1.43 | 5.98 | 5.61 | (13.47 | ) | (2.11 | ) | ||||||||||||||||
Distributions to shareholders from: | ||||||||||||||||||||||||
Net investment income | (0.12 | ) | (0.20 | ) | (0.21 | ) | (0.32 | ) | (0.70 | ) | (0.62 | ) | ||||||||||||
Net realized gains | — | — | — | — | — | (0.02 | ) | |||||||||||||||||
|
|
|
|
|
|
|
|
|
|
|
| |||||||||||||
Total distributions | (0.12 | ) | (0.20 | ) | (0.21 | ) | (0.32 | ) | (0.70 | ) | (0.64 | ) | ||||||||||||
Net asset value at end of period | $39.56 | $35.50 | $34.27 | $28.50 | $23.21 | $37.38 | ||||||||||||||||||
|
|
|
|
|
|
|
|
|
|
|
| |||||||||||||
Total Return** | 11.76% | 4.16% | 21.07% | 25.00% | (36.48% | ) | (5.38% | ) | ||||||||||||||||
Ratios/Supplemental Data: | ||||||||||||||||||||||||
Net assets at end of period (000’s omitted) | $77,144 | $62,130 | $87,383 | $108,284 | $25,527 | $22,426 | ||||||||||||||||||
Ratio to average net assets of: | ||||||||||||||||||||||||
Expenses | 0.35% | 0.35% | 0.35% | 0.35% | 0.35% | 0.35% | ||||||||||||||||||
Net investment income | 0.73% | 0.53% | 0.60% | 1.18% | 2.57% | 1.78% | ||||||||||||||||||
Portfolio turnover rate† | 44% | 76% | 62% | 43% | 50% | 37% | ||||||||||||||||||
| * | Based on average shares outstanding. |
| ** | Total investment return is calculated assuming an initial investment made at the net asset value at the beginning of the period, reinvestment of all dividends and distribution at net asset value during the period, and redemption on the last day of the period. Transaction fees are not reflected in the calculation of total investment return. Total investment return calculated for a period of less than one year is not annualized. |
| † | Portfolio turnover is not annualized and does not include securities received or delivered from processing creations or redemptions. |
| 46 | GUGGENHEIM ETFS SEMI-ANNUAL REPORT | See Notes to Financial Statements. |
Table of Contents
GUGGENHEIM S&P SMALLCAP 600 PURE GROWTH ETF
| FINANCIAL HIGHLIGHTS (concluded) |
| Six Months Ended April 30, 2012 (Unaudited) | Year Ended October 31, 2011 | Year Ended October 31, 2010 | Year Ended October 31, 2009 | Year Ended October 31, 2008 | Year Ended October 31, 2007 | |||||||||||||||||||
Per Share Operating Performance: |
| |||||||||||||||||||||||
Net asset value at beginning of period | $49.82 | $43.32 | $34.13 | $29.03 | $44.92 | $39.10 | ||||||||||||||||||
Net investment income* | 0.16 | 0.02 | 0.06 | 0.06 | 0.17 | — | ||||||||||||||||||
Net realized and unrealized gain (loss) on investments | 4.90 | 6.57 | 9.18 | 5.13 | (15.87 | ) | 5.84 | |||||||||||||||||
|
|
|
|
|
|
|
|
|
|
|
| |||||||||||||
Total from investment operations | 5.06 | 6.59 | 9.24 | 5.19 | (15.70 | ) | 5.84 | |||||||||||||||||
Distributions to shareholders from: | ||||||||||||||||||||||||
Net investment income | (0.13 | ) | (0.09 | ) | (0.05 | ) | (0.09 | ) | (0.19 | ) | (0.02 | ) | ||||||||||||
Net asset value at end of period | $54.75 | $49.82 | $43.32 | $34.13 | $29.03 | $44.92 | ||||||||||||||||||
|
|
|
|
|
|
|
|
|
|
|
| |||||||||||||
Total Return** | 10.16% | 15.22% | 27.11% | 17.93% | (35.05% | ) | 14.93% | |||||||||||||||||
Ratios/Supplemental Data: | ||||||||||||||||||||||||
Net assets at end of period (000’s omitted) | $79,388 | $34,873 | $17,329 | $11,945 | $7,257 | $11,229 | ||||||||||||||||||
Ratio to average net assets of: | ||||||||||||||||||||||||
Expenses | 0.35% | 0.35% | 0.35% | 0.35% | 0.35% | 0.35% | ||||||||||||||||||
Net investment income | 0.59% | 0.03% | 0.14% | 0.21% | 0.44% | —% | ||||||||||||||||||
Portfolio turnover rate† | 42% | 33% | 55% | 46% | 63% | 51% | ||||||||||||||||||
| * | Based on average shares outstanding. |
| ** | Total investment return is calculated assuming an initial investment made at the net asset value at the beginning of the period, reinvestment of all dividends and distribution at net asset value during the period, and redemption on the last day of the period. Transaction fees are not reflected in the calculation of total investment return. Total investment return calculated for a period of less than one year is not annualized. |
| † | Portfolio turnover is not annualized and does not include securities received or delivered from processing creations or redemptions. |
| See Notes to Financial Statements. | GUGGENHEIM ETFS SEMI-ANNUAL REPORT | 47 |
Table of Contents
NOTES TO FINANCIAL STATEMENTS (Unaudited)
|
1. Organization
Rydex ETF Trust (the “Trust”) is an open-end, management investment company registered under the Investment Company Act of 1940 (the “1940 Act”). The Trust was organized as a Delaware statutory trust on November 22, 2002. As of April 30, 2012, the Trust offers twenty-six portfolios, each of which represents a separate series of beneficial interest in the Trust (each a “Fund”, and collectively, the “Funds”). The financial statements herein relate to the following Funds: Guggenheim Russell Top 50® ETF, Guggenheim S&P 500 Pure Value ETF, Guggenheim S&P 500 Pure Growth ETF, Guggenheim S&P MidCap 400 Pure Value ETF, Guggenheim S&P 400 Pure Growth ETF, Guggenheim S&P SmallCap 600 Pure Value ETF and Guggenheim S&P SmallCap 600 Pure Growth ETF. Guggenheim Russell Top 50® ETF commenced operations on May 4, 2005. Guggenheim S&P 500 Pure Value ETF, Guggenheim S&P 500 Pure Growth ETF, Guggenheim S&P MidCap 400 Pure Value ETF, Guggenheim S&P MidCap 400 Pure Growth ETF, Guggenheim S&P SmallCap 600 Pure Value ETF and Guggenheim S&P SmallCap 600 Pure Growth ETF commenced operations on March 1, 2006.
The Funds’ investment objective is to replicate as closely as possible, before fees and expenses, the daily performance of an index representing publicly traded equity securities (the “Underlying Index”). The Guggenheim Russell Top 50® ETF tracks the Russell Top 50® Index. The Guggenheim S&P 500 Pure Value ETF tracks the S&P 500 Pure Value Index, the Guggenheim S&P 500 Pure Growth ETF tracks the S&P 500 Pure Growth Index, the Guggenheim S&P MidCap 400 Pure Value ETF tracks the S&P MidCap 400 Pure Value Index, the Guggenheim S&P MidCap 400 Pure Growth ETF tracks the S&P MidCap 400 Pure Growth Index, the Guggenheim S&P SmallCap 600 Pure Value ETF tracks the S&P SmallCap 600 Pure Value Index and the Guggenheim S&P SmallCap 600 Pure Growth ETF tracks the S&P SmallCap 600 Pure Growth Index. The Funds seek to achieve their objective by investing in common stocks or ETFs, where applicable, that comprise the Underlying Index. The Funds use a “replication” strategy to track the Underlying Index. “Replication” refers to investing in substantially all of the securities in the Underlying Index in approximately the same proportions as in the Underlying Index.
The Funds operate as index funds and are not actively managed. Adverse performance of a security in the Funds’ portfolio will ordinarily not result in the elimination of the security from the Funds’ portfolio.
The Funds issue and redeem shares on a continuous basis, at Net Asset Value per share (“NAV”), only in aggregation of 50,000 shares called a “Creation Unit”. Creation Units are issued and redeemed principally in-kind for securities included in the Underlying Index.
Guggenheim Investments (“GI”) provides advisory services and Rydex Distributors, LLC (“RDL”) acts as principal underwriter for the Trust. GI and RDL are affiliated entities.
2. Significant Accounting Policies
The following significant accounting policies are in conformity with U.S. generally accepted accounting principles (“U.S. GAAP”) and are consistently followed by the Trust. This requires management to make estimates and assumptions that affect the reported amount of assets and liabilities and disclosure of contingent assets and liabilities at the date of the financial statements and the reported amounts of revenues and expenses during the reporting period. Actual results could differ from these estimates. All time references are based on Eastern Time.
A. Security Valuation
Equity securities listed on an exchange (New York Stock Exchange (“NYSE”) or American Stock Exchange) are valued at the last quoted sales price as of the close of business on the NYSE on the valuation date. Equity securities listed on the NASDAQ market system are valued at the NASDAQ Official Closing Price on the valuation date.
Investments for which market quotations are not readily available are fair valued as determined in good faith by GI under the direction of the Board of Trustees using methods established or ratified by the Board of Trustees. These methods include, but are not limited to: (i) using general information as to how these securities and assets trade; and (ii) using other information and considerations, including current values in related markets.
B. Security Transactions and Income Recognition
Security transactions are recorded on the trade date for financial reporting purposes. Realized gains and losses from securities transactions are recorded using the identified cost basis. Proceeds from lawsuits related to investment holdings are recorded as realized gains. Dividend income is recorded on the ex-dividend date, net of applicable taxes withheld by foreign countries. Taxable non-cash dividends are recorded as dividend income. Interest income, including amortization of premiums and accretion of discount, is accrued on a daily basis. Distributions received from investments in REITs are recorded as dividend income on the ex-dividend date, subject to reclassification upon notice of the character of such distribution by the issuer.
C. Repurchase Agreements
The Funds may enter into repurchase agreements with financial institutions. In a repurchase agreement, a Fund buys a security and the seller simultaneously agrees to repurchase the security on a specified future date at an agreed-upon price. The repurchase price reflects an agreed-upon interest rate during
| 48 | GUGGENHEIM ETFS SEMI-ANNUAL REPORT |
Table of Contents
| NOTES TO FINANCIAL STATEMENTS (Unaudited) (continued) |
the time the Fund’s money is invested in the security. Because the security constitutes collateral for the repurchase obligation, a repurchase agreement can be considered a collateralized loan. The Funds follow certain procedures designed to minimize the risks inherent in such agreements. These procedures include effecting repurchase transactions only with large, well-capitalized and well-established financial institutions whose condition will be continually monitored by GI. In addition, the value of the collateral underlying the repurchase agreement will always be at least equal to the repurchase price, including any accrued interest earned on the repurchase agreement. In the event of a default or bankruptcy by a selling financial institution, the Funds will seek to liquidate such collateral. However, the exercising of the Funds right to liquidate such collateral could involve certain costs or delays and, to the extent that proceeds from any sale upon a default of the obligation to repurchase were less than the repurchase price, the Funds could suffer a loss. It is the current policy of the Funds not to invest in repurchase agreements that do not mature within seven days if any such investment, together with any other illiquid assets held by the Funds, amounts to more than 15% of a Funds net assets. The investments of the Funds in repurchase agreements, at times, may be substantial when, in the view of GI, liquidity or other considerations so warrant. For the period ended April 30, 2012, the Funds had not engaged in repurchase agreement transactions.
D. Federal Income Taxes
The Funds intend to comply with the provisions of Subchapter M of the Internal Revenue Code applicable to regulated investment companies and will distribute substantially all taxable net investment income and capital gains sufficient to relieve the Funds from all, or substantially all, federal income, excise and state income taxes. Therefore, no provision for Federal or state income tax is required.
Tax positions taken or expected to be taken in the course of preparing the Funds’ tax returns are evaluated to determine whether the tax positions are “more-likely-than-not” of being sustained by the applicable tax authority. Tax positions not
deemed to meet the more-likely-than-not threshold would be recorded as a tax benefit or expense in the current year. Management has analyzed the Funds’ tax positions taken, or to be taken, on Federal income tax returns for all open tax years (fiscal years 2008-2011), and has concluded that no provision for income tax was required in the Funds’ financial statements.
The RIC Modernization Act of 2010 was signed into law on December 22, 2010 and seeks to simplify some of the tax provisions applicable to regulated investment companies and the tax reporting to their shareholders, and to improve the tax efficiency of certain fund structures. The changes are generally effective for taxable years beginning after the date of enactment.
One of the more prominent changes addresses capital loss carryforwards. Funds will be permitted to carry forward capital losses incurred in taxable years beginning after December 22, 2010 for an unlimited period. However, any losses incurred during those future taxable years will be required to be utilized prior to the losses incurred in pre-enactment taxable years. Under pre-enactment law, capital losses could be carried forward for eight years, and carried forward as short-term capital, irrespective of the character of the original loss. As a result of this ordering rule, pre-enactment capital loss carryforwards may potentially expire unused. Additionally, post-enactment capital losses that are carried forward will retain their character as either short-term or long-term capital losses rather than being considered all short-term as under previous law.
For the period ended April 30, 2012, the Funds realized net capital gains resulting from in-kind redemptions and other transactions. Because gains from in-kind redemptions are non-taxable to the Funds, and are not distributed to existing Fund shareholders, the gains are reclassified from accumulated net realized gains to paid-in-capital at the end of the Funds’ tax year. These reclassifications have no effect on net assets or NAV. The in-kind net capital gains for the period ended April 30, 2012 are disclosed in the Fund’s Statement of Operations.
At April 30, 2012, the identified cost of investments in securities owned by each Fund for Federal income tax purposes and the gross unrealized appreciation and depreciation were as follows:
| Identified Cost | Gross Unrealized Appreciation | Gross Unrealized Depreciation | Net Unrealized (Depreciation) | |||||||||||||
Guggenheim Russell Top 50® ETF | $ | 485,776,169 | $ | 46,101,517 | $ | (47,031,783 | ) | $ | (930,266 | ) | ||||||
Guggenheim S&P 500 Pure Value ETF | 93,140,553 | 6,066,868 | (5,969,804 | ) | 97,064 | |||||||||||
Guggenheim S&P 500 Pure Growth ETF | 287,466,674 | 45,557,533 | (11,755,970 | ) | 33,801,563 | |||||||||||
Guggenheim S&P Midcap 400 Pure Value ETF | 33,724,877 | 3,513,868 | (1,679,498 | ) | 1,834,370 | |||||||||||
Guggenheim S&P Midcap 400 Pure Growth ETF | 543,332,656 | 89,011,820 | (29,673,253 | ) | 59,338,567 | |||||||||||
Guggenheim S&P Smallcap 600 Pure Value ETF | 77,976,924 | 7,607,344 | (8,364,009 | ) | (756,665) | |||||||||||
Guggenheim S&P Smallcap 600 Pure Growth ETF | 75,350,069 | 7,427,762 | (3,371,923 | ) | 4,055,839 | |||||||||||
E. Fair Value Measurement
In accordance with U.S. GAAP, fair value is defined as the price that the Fund would receive to sell an investment or pay to transfer a liability in an orderly transaction with an independent buyer in the principal market, or, in the absence of a principal market, the most
| GUGGENHEIM ETFS SEMI-ANNUAL REPORT | 49 |
Table of Contents
NOTES TO FINANCIAL STATEMENTS (Unaudited) (continued)
|
advantageous market for the investment or liability. A three-tier hierarchy is utilized to distinguish between (1) inputs that reflect the assumptions market participants would use in pricing an asset or liability developed based on market data obtained from sources independent of the reporting entity (observable inputs) and (2) inputs that reflect the reporting entity’s own assumptions about the assumptions market participants would use in pricing an asset or liability developed based on the best information available in the circumstances (unobservable inputs) and to establish classification of fair value measurements for disclosure purposes. Various inputs are used in determining the value of the Funds’ investments. The inputs are summarized in the three broad levels listed below:
| Level 1 — | quoted prices in active markets for identical securities. |
| Level 2 — | other significant observable inputs (including quoted prices for similar securities, interest rates, prepayment speeds, credit risk, etc.). |
| Level 3 — | significant unobservable inputs (including the fund’s own assumptions used to determine the fair value of investments). |
The inputs or methodologies used for valuing securities are not necessarily an indication of the risk associated with investing in those securities.
The following table summarizes the inputs used to value the Funds’ net assets as of April 30, 2012:
| Fund | Level 1 Investments in Securities | Level 2 Investments in Securities | Level 3 Investments in Securities | Total | ||||||||||||
Guggenheim Russell Top 50® ETF | $ | 484,845,903 | $ | — | $ | — | $ | 484,845,903 | ||||||||
Guggenheim S&P 500 Pure Value ETF | 93,237,617 | — | — | 93,237,617 | ||||||||||||
Guggenheim S&P 500 Pure Growth ETF | 321,268,237 | — | — | 321,268,237 | ||||||||||||
Guggenheim S&P MidCap 400 Pure Value ETF | 35,559,247 | — | — | 35,559,247 | ||||||||||||
Guggenheim S&P MidCap 400 Pure Growth ETF | 602,671,223 | — | — | 602,671,223 | ||||||||||||
Guggenheim S&P SmallCap 600 Pure Value ETF | 77,220,259 | — | — | 77,220,259 | ||||||||||||
Guggenheim S&P SmallCap 600 Pure Growth ETF | 79,405,908 | — | — | 79,405,908 | ||||||||||||
For the period ended April 30, 2012, there were no transfers between levels.
F. Dividends and Distributions
Distributions of net investment income and net realized gains, if any, in all the Funds, are declared at least annually and recorded on the ex-dividend date and are determined in accordance with income tax regulations which may differ from U.S. GAAP.
G. Risk and Uncertainties
The Funds invest in various investments which are exposed to risk, such as market risk. Due to the level of risk associated with certain investments it is at least reasonably possible that changes in the values of investment securities will occur in the near term and that such changes could materially affect amounts reported in the financial statements. The Guggenheim Russell Top 50® ETF is a non-diversified fund, subjecting it to a greater risk than a fund that is diversified.
H. Risk Disclosure
Throughout the normal course of business, the Funds enter into contracts that contain a variety of representations and warranties which provide general indemnifications. The Funds’ maximum exposure under these arrangements is unknown, as this would involve future claims that may be made against the Funds and/or their affiliates that have not yet occurred. However, based on experience the Funds expect the risk of loss to be remote.
3. Advisory, Administration and Other Transactions with Affiliates
GI determines the composition of the portfolio of securities that must be delivered in exchange for the issuance of Creation Units and periodically adjusts the composition of the portfolio of the Funds to conform to changes in the composition of the relevant index. For these services, GI receives a management fee at the annual rate shown below as a percentage of the average daily net assets of the Funds.
| Advisory Fee | ||||
Guggenheim Russell Top 50® ETF | 0.20 | % | ||
Guggenheim S&P 500 Pure Value ETF | 0.35 | % | ||
Guggenheim S&P 500 Pure Growth ETF | 0.35 | % | ||
Guggenheim S&P MidCap 400 Pure Value ETF | 0.35 | % | ||
Guggenheim S&P MidCap 400 Pure Growth ETF | 0.35 | % | ||
Guggenheim S&P SmallCap 600 Pure Value ETF | 0.35 | % | ||
Guggenheim S&P SmallCap 600 Pure Growth ETF | 0.35 | % | ||
GI pays all expenses of the Funds, including the cost of transfer agency, custody, fund administration, legal, audit and other services, except: interest, taxes, distribution fees or expenses and extraordinary expenses.
Under an Administration Agreement, State Street Bank and Trust Company (the “Administrator”) provides various administrative and accounting services for the maintenance and operations of the Funds. Under a Custodian Agreement with the Trust, the Administrator maintains cash, securities and
| 50 | GUGGENHEIM ETFS SEMI-ANNUAL REPORT |
Table of Contents
| NOTES TO FINANCIAL STATEMENTS (Unaudited) (continued) |
other assets of the Funds in separate accounts for each Fund, keeps all necessary accounts and records, and provides other services. The Administrator is required, upon the order of the Trust, to deliver securities held by the Custodian and to make payments for securities purchased by the Trust for the Funds. Pursuant to a Transfer Agency and Service Agreement with the Trust, the Administrator acts as a transfer agent for the Trust’s authorized and issued shares of beneficial interest, and as dividend disbursing agent of the Trust. GI compensates the Administrator directly for the foregoing services.
The Funds have adopted a Distribution Plan (the “Plan”) that allows the Funds to pay distribution fees to RDL and other firms that provide distribution services (“Service Providers”). If a Service Provider provides distribution services, the Funds will pay distribution fees to RDL at an annual rate not to exceed 0.25% of average daily net assets, pursuant to Rule 12b-1 of the 1940 Act. RDL will, in turn, pay the Service Provider out of its fees. No such fee is currently charged to the Funds.
4. Capital
At April 30, 2012, there were an unlimited number of no par value shares of beneficial interest authorized. There is a
minimum transaction fee per transaction to those persons purchasing or redeeming Creation Units. An additional charge of up to three times the standard transaction fee may be imposed for purchases and redemptions effected outside the National Securities Clearing Corporation usual clearing process or for cash. Such transactions are generally permitted on an in-kind basis, with a balancing cash component to equate the transaction to the NAV of the Fund on the transaction date. Transaction fees are not charged to or paid by the Funds. The minimum transaction fees are:
| Minimum Transaction Fee | ||||
Guggenheim Russell Top 50® ETF | $ | 500 | ||
Guggenheim S&P 500 Pure Value ETF | 1,000 | |||
Guggenheim S&P 500 Pure Growth ETF | 1,000 | |||
Guggenheim S&P MidCap 400 Pure Value ETF | 750 | |||
Guggenheim S&P MidCap 400 Pure Growth ETF | 750 | |||
Guggenheim S&P SmallCap 600 Pure Value ETF | 1,000 | |||
Guggenheim S&P SmallCap 600 Pure Growth ETF | 1,000 | |||
5. Investment Transactions
For the period ended April 30, 2012, the Funds had investment transactions in-kind associated with subscriptions and redemptions as follows:
| Subscriptions | Redemptions | |||||||
Guggenheim Russell Top 50® ETF | 178,670,203 | 204,409,246 | ||||||
Guggenheim S&P 500 Pure Value ETF | 17,450,694 | 10,794,081 | ||||||
Guggenheim S&P 500 Pure Growth ETF | 55,121,084 | 26,521,975 | ||||||
Guggenheim S&P MidCap 400 Pure Value ETF | 3,124,192 | 8,686,567 | ||||||
Guggenheim S&P MidCap 400 Pure Growth ETF | 74,675,840 | 170,775,071 | ||||||
Guggenheim S&P SmallCap 600 Pure Value ETF | 8,290,896 | — | ||||||
Guggenheim S&P SmallCap 600 Pure Growth ETF | 40,735,432 | 2,728,541 | ||||||
Purchases and sales of investment securities (excluding short-term investments, U.S. government and government agency obligations) for the Funds were as follows:
| Purchases | Sales | |||||||
Guggenheim Russell Top 50® ETF | $ | 6,073,884 | $ | 5,638,934 | ||||
Guggenheim S&P 500 Pure Value ETF | 28,423,576 | 31,857,144 | ||||||
Guggenheim S&P 500 Pure Growth ETF | 98,320,919 | 98,031,643 | ||||||
Guggenheim S&P MidCap 400 Pure Value ETF | 16,341,131 | 17,803,075 | ||||||
Guggenheim S&P MidCap 400 Pure Growth ETF | 260,697,666 | 243,944,473 | ||||||
Guggenheim S&P SmallCap 600 Pure Value ETF | 30,865,787 | 31,042,923 | ||||||
Guggenheim S&P SmallCap 600 Pure Growth ETF | 28,939,105 | 26,998,264 | ||||||
There were no purchases or sales of U.S. government or government agency obligations for the period ended April 30, 2012.
6. Legal Proceedings
Tribune Company
Rydex ETF Trust has been named as a defendant and a putative member of the proposed defendant class of shareholders in the case entitled Official Committee of Unsecured Creditors of Tribune Co. v. FitzSimons (In re Tribune Co.), Adv. Pro. No. 10-54010 (Bankr. D. Del.), as a result of ownership of shares in the Tribune Company (“Tribune”) in 2007 by certain series of the Rydex ETF Trust when Tribune effected a leveraged buyout transaction (“LBO”) by which Tribune converted to a privately-held company. In its complaint, the Unsecured Creditors Committee (the “UCC”) has alleged that, in connection with the LBO, insiders and major shareholders were overpaid for their Tribune stock using financing that the insiders knew would, and ultimately did, leave the Tribune insolvent. The UCC
| GUGGENHEIM ETFS SEMI-ANNUAL REPORT | 51 |
Table of Contents
NOTES TO FINANCIAL STATEMENTS (Unaudited) (concluded)
|
has asserted claims against certain insiders, major shareholders, professional advisers, and others involved in the LBO, and is attempting to obtain from these individuals and entities the proceeds paid out in connection with the LBO. This adversary proceeding in the Bankruptcy Court has been stayed pending further order of the Bankruptcy Court.
In June 2011, a group of Tribune creditors, not including the UCC, filed multiple actions involving state law constructive fraudulent conveyance claims against former Tribune shareholders. Rydex ETF Trust also has been named as a defendant in one or more of these suits. These cases have been consolidated in a multidistrict litigation proceeding in the United States District Court for the Southern District of New York and have been stayed pending further order of that court or of the Bankruptcy Court.
None of these lawsuits allege any wrongdoing on the part of Rydex ETF Trust. The following series of Rydex ETF Trust held shares of Tribune and tendered these shares as part of Tribune’s LBO: Guggenheim S&P 500 Pure Value ETF (the “Fund”). The value of the proceeds received by the foregoing Funds was $197,050. At this stage of the proceedings, Rydex ETF Trust is not able to make a reliable predication as to the outcome of these lawsuits or the effect, if any, on the Fund’s net asset value.
Lyondell Chemical Company
Rydex ETF Trust has been named as a defendant in Weisfelner, as Trustee of the LB Creditor Trust v. Fund 1 (In re Lyondell Co.), Adversary Proceeding No. 10-4609 (Bankr. S.D.N.Y.). In this action, the creditors of Lyondell Chemical Company (“Lyondell”) are seeking to recover money paid in connection with a pre-bankruptcy distribution by Lyondell to its shareholders pursuant to a December 2007 merger transaction. When the merger closed on December 20, 2007, all outstanding shares of Lyondell stock were converted into the right to receive $48 in cash. The creditors allege that the merged company, LyondellBasell Industries AF S.C.A., and many of its affiliates and subsidiaries filed for bankruptcy as a direct consequence of the merger transaction. The creditors allege that the shareholder payments constituted a fraud on creditors and should be paid back, and are advancing claims of constructive fraudulent transfer and intentional fraudulent transfer under state law.
This lawsuit does not allege any wrongdoing on the part of Rydex ETF Trust. The following series of Rydex ETF Trust received cash proceeds from the merger in the following amounts: Rydex S&P Midcap 400 Pure Value ETF Fund — $572,640. At this stage of the proceedings, Rydex ETF Trust is not able to make a reliable predication as to the outcome of this lawsuit or the effect, if any, on a fund’s net asset value.
| 52 | GUGGENHEIM ETFS SEMI-ANNUAL REPORT |
Table of Contents
| OTHER INFORMATION (Unaudited) |
Proxy Voting Information
A description of the policies and procedures that the Trust uses to determine how to vote proxies relating to securities held in the Funds’ portfolios is available, without charge and upon request, by calling 1.800.820.0888. This information is also available from the EDGAR database on the SEC’s website at http://www.sec.gov.
Information regarding how the Funds voted proxies relating to portfolio securities, during the most recent 12-month period ended June 30 is available, without charge, upon request, by calling 1.800.820.0888. The information is also available from the EDGAR database on the SEC’s website at http://www.sec.gov.
At a special meeting of shareholders held on January 26, 2012, the shareholders of the Funds voted on whether to approve a new investment advisory agreement between Rydex ETF Trust and Security Investors, LLC. A description of the number of shares voted is as follows:
| Fund | Shares For | Shares Against | Shares Abstained | |||||||||
Guggenheim Russell Top 50® ETF | 2,331,830 | 13,474 | 13,969 | |||||||||
Guggenheim S&P 500 Pure Value ETF | 1,470,710 | 27,115 | 45,005 | |||||||||
Guggenheim S&P 500 Pure Growth ETF | 2,877,038 | 31,565 | 27,507 | |||||||||
Guggenheim S&P MidCap 400 Pure Value ETF | 589,707 | 11,100 | 10,030 | |||||||||
Guggenheim S&P MidCap 400 Pure Growth ETF | 2,934,561 | 40,028 | 32,740 | |||||||||
Guggenheim S&P SmallCap 600 Pure Value ETF | 100,975 | 11 | — | |||||||||
Guggenheim S&P SmallCap 600 Pure Growth ETF | 297,409 | 4,342 | 4,050 | |||||||||
At a special meeting of shareholders held on November 22, 2011, the shareholders of the Funds also voted on whether to approve the election of nominees to the Board of Trustees. A description of the number of shares voted is as follows:
| Donald C. Cacciapaglia | Corey A. Colehour | J. Kenneth Dalton | ||||||||||||||||||
For | 72,100,198 | For | 72,258,142 | For | 72,216,847 | |||||||||||||||
Withhold | 2,135,025 | Withhold | 1,977,081 | Withhold | 2,018,376 | |||||||||||||||
Total | 74,235,223 | Total | 74,235,223 | Total | 74,235,223 | |||||||||||||||
| John O. Demaret | Richard M. Goldman | Werner E. Keller | ||||||||||||||||||
For | 72,234,406 | For | 72,161,702 | For | 72,220,467 | |||||||||||||||
Withhold | 2,000,817 | Withhold | 2,073,521 | Withhold | 2,014,756 | |||||||||||||||
Total | 74,235,223 | Total | 74,235,223 | Total | 74,235,223 | |||||||||||||||
| Thomas F. Lydon | Patrick T. McCarville | Roger Somers | ||||||||||||||||||
For | 72,247,608 | For | 72,174,312 | For | 72,250,544 | |||||||||||||||
Withhold | 1,987,615 | Withhold | 2,060,911 | Withhold | 1,984,679 | |||||||||||||||
Total | 74,235,223 | Total | 74,235,223 | Total | 74,235,223 | |||||||||||||||
At a special meeting of shareholders held on January 26, 2012, the shareholders of the Funds also voted on whether to approve a “manager of managers” arrangement for each of the Funds. Although shareholder votes were placed, not enough votes were received to meet the minimum requirements to constitute a majority vote. As such, the matter was closed.
Quarterly Portfolio Schedules Information
The Trust files its complete schedule of portfolio holdings with the SEC for the first and third quarters of each fiscal year on Form N-Q; which are available on the SEC’s website at http://www.sec.gov. The Funds’ Forms N-Q may be reviewed and copied at the SEC’s Public Reference Room in Washington, DC, and that information on the operation of the Public Reference Room may be obtained by calling 1-800-SEC-0330. Copies of the portfolio holdings are also available to shareholders, without charge and upon request, by calling 1.800.820.0888.
Office Locations
The offices of Guggenheim Investments can be found in the following locations:
40 East 52nd Street
16th Floor
New York, NY 10022
(Headquarters)
Four Irvington Centre
805 King Farm Boulevard
Suite 600
Rockville, MD 20850
9401 Indian Creek Parkway
40 Corporate Woods
Suite 850
Overland Park, KS 66210
| GUGGENHEIM ETFS SEMI-ANNUAL REPORT | 53 |
Table of Contents
OTHER INFORMATION (Unaudited) (concluded)
Premium/Discount Information
Information about the differences between the daily market price on secondary markets for Shares and the NAV of each Fund can be found at www.guggenheimfunds.com.
Guggenheim Transaction
On September 20, 2011, Guggenheim Capital, LLC agreed to purchase the indirect holding company of Security Investors, LLC, the Fund’s investment manager (the “Investment Manager”) (the “Transaction”). Guggenheim Capital, LLC’s subsidiary, Guggenheim Partners, LLC (“Guggenheim”), is a global, independent, privately-held, diversified financial services firm with more than 1,500 dedicated professionals. The Transaction closed on February 29, 2012.
The Transaction should not result in material changes to the day-to-day management and operation of the Fund or any increase in fees.
In anticipation of the Transaction, the Board of Trustees of the Fund (the “Board”) called a special meeting of shareholders (the “Meeting”), at which shareholders of the Fund of record as of October 3, 2011 were asked to consider the approval of a new investment management agreement between the Fund and the Investment Manager (the “New Agreement”). This approval was necessary because, under the Investment Company Act of 1940 (the “1940 Act”), the Transaction could result in the termination of the Fund’s current investment management agreement with the Investment Manager (the “Current Agreement”). The Fund’s shareholders approved the New Agreement, the terms of which are substantially identical to the corresponding Current Agreement, except with respect to the date of execution.
Election of Board Members
The Board also approved a proposal to elect nine individuals to the Board. The Board proposed the election of the following nominees: Donald C. Cacciapaglia, Corey A. Colehour, J. Kenneth Dalton, John O. Demaret, Richard M. Goldman, Werner E. Keller, Thomas F. Lydon, Patrick T. McCarville and Roger Somers. Each of the nominees, other than Mr. Cacciapaglia, currently serves as a Trustee. In connection with the Transaction, the Board believes that expanding the Board to include Mr. Cacciapaglia, who is a member of senior management of Guggenheim’s investment management business, and who would serve on other boards in the Guggenheim Investments family of funds, would be appropriate. The Trusts’ shareholders ultimately approved the aforementioned proposal.
| 54 | GUGGENHEIM ETFS SEMI-ANNUAL REPORT |
Table of Contents
| INFORMATION ON BOARD OF TRUSTEES AND OFFICERS (Unaudited) |
A Board of Trustees oversees the Trust, as well as other trusts of GI, in which its members have no stated term of service, and continue to serve after election until resignation. The Statement of Additional Information includes further information about Fund Trustees and Officers, and can be obtained without charge by calling 800.820.0888.
All Trustees and Officers may be reached c/o Guggenheim Investments, 805 King Farm Boulevard, Suite 600, Rockville, MD 20850.
TRUSTEE AND OFFICER
Name, Position and | Length of Service | Number of | ||||||
Donald C. Cacciapaglia* | Rydex Series Funds – 2012 | 148 | ||||||
| Trustee, President (1951) | Rydex Variable Trust – 2012 | |||||||
Rydex Dynamic Funds – 2012 | ||||||||
Rydex ETF Trust – 2012 |
Principal Occupations During Past Five Years: Security Investors, LLC: President and CEO from April 2012 to present; Guggenheim Investments: President and Chief Administrative Officer from February 2010 to present; Channel Capital Group, Inc.: Chairman and CEO from April 2002 to February 2010.
INDEPENDENT TRUSTEES
Name, Position and | Length of Service | Number of | ||||||
Corey A. Colehour | Rydex Series Funds – 1993 | 148 | ||||||
| Trustee (1945) | Rydex Variable Trust – 1998 | |||||||
Rydex Dynamic Funds – 1999 | ||||||||
Rydex ETF Trust – 2003 |
Principal Occupations During Past Five Years: Retired; Member of the Audit, Governance and Nominating Committees (1995 to present)
J. Kenneth Dalton | Rydex Series Funds – 1995 | 148 | ||||||
| Trustee (1941) | Rydex Variable Trust – 1998 | |||||||
Rydex Dynamic Funds – 1999 | ||||||||
Rydex ETF Trust – 2003 |
Principal Occupations During Past Five Years: Retired; Member of the Governance and Nominating Committees (1995 to present); Chairman of the Audit Committee (1997 to present); Member of the Risk Oversight Committee (2010 to present)
John O. Demaret | Rydex Series Funds – 1997 | 148 | ||||||
| Trustee, Chairman of the | Rydex Variable Trust – 1998 | |||||||
| Board (1941) | Rydex Dynamic Funds – 1999 | |||||||
Rydex ETF Trust – 2003 |
Principal Occupations During Past Five Years: Retired; Member of the Audit Committee (1997 to present); Member of the Risk Oversight Committee (2010 to present)
Werner E. Keller | Rydex Series Funds – 2005 | 148 | ||||||
| Trustee (1940) | Rydex Variable Trust – 2005 | |||||||
Rydex Dynamic Funds – 2005 | ||||||||
Rydex ETF Trust – 2005 |
Principal Occupations During Past Five Years: Founder and President of Keller Partners, LLC (registered investment adviser) (2005 to present); Member of the Audit, Governance and Nominating Committees (2005 to present); Chairman and Member of the Risk Oversight Committee (2010 to present)
| GUGGENHEIM ETFS SEMI-ANNUAL REPORT | 55 |
Table of Contents
| INFORMATION ON BOARD OF TRUSTEES AND OFFICERS (Unaudited) (continued) |
TRUSTEE AND OFFICER – concluded
Name, Position and | Length of Service | Number of | ||||||
Thomas F. Lydon, Jr. | Rydex Series Funds – 2005 | 148 | ||||||
| Trustee (1960) | Rydex Variable Trust – 2005 | |||||||
Rydex Dynamic Funds – 2005 | ||||||||
Rydex ETF Trust – 2005 |
Principal Occupations During Past Five Years: President, Global Trends Investments (1996 to present); Member of the Audit, Governance and Nominating Committees (2005 to present)
Patrick T. McCarville | Rydex Series Funds – 1997 | 148 | ||||||
| Trustee (1942) | Rydex Variable Trust – 1998 | |||||||
Rydex Dynamic Funds – 1999 | ||||||||
Rydex ETF Trust – 2003 |
Principal Occupations During Past Five Years: CEO, Par Industries, Inc., d/b/a Par Leasing (1977 to 2010); Chairman of the Governance and Nominating Committees (1997 to present); Member of the Audit Committee (1997 to present)
Roger Somers | Rydex Series Funds – 1993 | 148 | ||||||
| Trustee (1944) | Rydex Variable Trust – 1998 | |||||||
Rydex Dynamic Funds – 1999 | ||||||||
Rydex ETF Trust – 2003 |
Principal Occupations During Past Five Years: Founder and CEO of Arrow Limousine (1965 to present); Member of the Audit, Governance and Nominating Committees (1995 to present)
EXECUTIVE OFFICERS
Name, Position and | Principal Occupations | |
Michael P. Byrum* Vice President (1970) | Current: President, Security Benefit Asset Management Holdings, LLC; Senior Vice President, Security Investors, LLC; President and Chief Investment Officer, Rydex Holdings, LLC; Director and Chairman of the Board, Advisor Research Center, Inc.; Manager, Rydex Specialized Products, LLC
Previous: Rydex Distributors, LLC (f/k/a Rydex Distributors, Inc.), Vice President (2009); Rydex Fund Services, LLC, Director (2009-2010), Secretary (2002- 2010), Executive Vice President (2002- 2006); Rydex Advisors, LLC (f/k/a PADCO Advisors, Inc.), Director (2008-2010), Chief Investment Officer (2006-2010), President (2004-2010), Secretary (2002-2010); Rydex Advisors II, LLC (f/k/a PADCO Advisors II, Inc.), Director (2008-2010), Chief Investment Officer (2006-2010), President (2004-2010), Secretary (2002-2010); Rydex Capital Partners, LLC, President and Secretary (2003-2007); Rydex Capital Partners II, LLC, (2003-2007); Rydex Holdings, LLC (f/k/a Rydex Holdings, Inc.), Secretary (2005-2008), Executive Vice President (2005-2006); Advisor Research Center, Inc., Secretary (2006-2009), Executive Vice President (2006); Rydex Specialized Products, LLC, Secretary (2005-2008) | |
| 56 | GUGGENHEIM ETFS SEMI-ANNUAL REPORT |
Table of Contents
| INFORMATION ON BOARD OF TRUSTEES AND OFFICERS (Unaudited) (concluded) |
EXECUTIVE OFFICERS – concluded
Name, Position and | Principal Occupations | |
Nikolaos Bonos* Vice President and Treasurer (1963) | Current: Senior Vice President, Security Investors, LLC; Chief Executive Officer and Manager, Rydex Specialized Products, LLC; Chief Executive Officer and President, Rydex Fund Services, LLC; Vice President, Rydex Holdings, LLC; Treasurer, SBL Fund; Security Equity Fund; Security Income Fund; Security Large Cap Value Fund and Security Mid Cap Growth Fund; Vice President, Security Benefit Asset Management Holdings, LLC
Previous: Guggenheim Investments, LLC, Senior Vice President (2010-2011); Rydex Advisors, LLC (f/k/a PADCO Advisors, Inc.) Senior Vice President (2006-2011); Rydex Fund Services, LLC (f/k/a Rydex Fund Services, Inc.), Director (2009), Senior Vice President (2003-2006); Rydex Specialized Products, LLC, Chief Financial Officer (2005-2009) | |
Elisabeth Miller* Chief Compliance Officer (1968) | Current: Chief Compliance Officer, Rydex Series Funds, Rydex Dynamic Funds, Rydex Variable Trust, Rydex ETF Trust, Security Equity Fund, Security Income Fund, Security Large Cap Value Fund, Security Mid Cap Growth Fund, SBL Fund, Security Investors, LLC, and Rydex Distributors, LLC
Previous: Senior Manager, Security Investors, LLC and Rydex Distributors, LLC (2004-2009). | |
Amy J. Lee* Vice President and Assistant Secretary (1960) | Current: Senior Vice President and Secretary, Security Investors, LLC; Secretary and Chief Compliance Officer, Security Distributors, Inc.; Vice President, Associate General Counsel and Assistant Secretary, Security Benefit Life Insurance Company and Security Benefit Corporation; Associate General Counsel, First Security Benefit Life Insurance and Annuity of New York; Vice President and Secretary, SBL Fund; Security Equity Fund; Security Income Fund; Security Large Cap Value Fund and Security Mid Cap Growth Fund; Vice President and Secretary, Rydex Holdings, LLC; Secretary, Advisor Research Center, Inc., Rydex Specialized Products, LLC, Rydex Distributors, LLC and Rydex Fund Services, LLC; Assistant Secretary, Security Benefit Clinic and Hospital
Previous: Guggenheim Investments, LLC, Senior Vice President and Secretary (2007- 2011); Rydex Advisors, LLC (f/k/a PADCO Advisors, Inc.) and Rydex Advisors II, LLC (f/k/a PADCO Advisors II, Inc.), Senior Vice President and Secretary (2010- 2011); Brecek and Young Advisors, Inc., Director (2004-2008) | |
Joseph M. Arruda* Assistant Treasurer (1966) | Current: Assistant Treasurer, SBL Fund; Security Equity Fund; Security Income Fund; Security Large Cap Value Fund and Security Mid Cap Growth Fund; Vice President, Security Investors, LLC; Chief Financial Officer and Manager, Rydex Specialized Products, LLC
Previous: Guggenheim Investments, LLC, Vice President (2010-2011); Rydex Advisors, LLC (f/k/a PADCO Advisors, Inc.) and Rydex Advisors II, LLC (f/k/a PADCO Advisors II, Inc.), Vice President (2004-2011) | |
| * | Officers of the Funds are deemed to be “interested persons” of the Trust, within the meaning of Section 2(a) (19) of the 1940 Act, inasmuch as this person is affiliated with Guggenheim Investments. |
| GUGGENHEIM ETFS SEMI-ANNUAL REPORT | 57 |
Table of Contents

805 King Farm Boulevard, Suite 600
Rockville, MD 20850
www.rydex-sgi.com
800.820.0888
ETF2-SEMI-0412x1012
Table of Contents


APRIL 30, 2012
GUGGENHEIM ETFS
SEMI-ANNUAL REPORT
RSU GUGGENHEIM 2x S&P 500 ETF
RSW GUGGENHEIM INVERSE 2x S&P 500 ETF
Table of Contents
|
| 2 | ||||
| 4 | ||||
| 5 | ||||
| 6 | ||||
| 7 | ||||
| 15 | ||||
| 16 | ||||
| 17 | ||||
| 18 | ||||
| 20 | ||||
| 27 | ||||
| 29 | ||||
| GUGGENHEIM ETFS SEMI-ANNUAL REPORT | 1 |
Table of Contents
|
To Our Shareholders:
A restructuring of Greece’s massive debt, continued accommodation by the world’s major central banks and better news on the U.S. economy helped support financial markets over the six months ended April 30, 2012. Market optimism peaked in early 2012, when several major equity indices pushed to multi-year highs. But the mood grew more cautious late in the period after first-quarter U.S. GDP came in lower than expected and the Federal Reserve suggested that it would not take any additional measures to stimulate the economy. “Operation Twist,” in which the Fed buys longer-dated Treasury securities in order to hold down long-term rates, is set to end in June, and recent history has shown that stocks struggle when stimulus ends.
U.S. equities last fall were rebounding from the loss of the U.S. AAA credit rating in August. But after touching the low for the period in mid-November, improving U.S. economic data and the European Central Bank’s injections of three-year loans into the continent’s banking system gave a boost to markets late in 2011, which carried over into a strong first quarter of 2012. The mild U.S. winter also may have pulled economic, and thus market, activity forward, a notion supported by underlying momentum in consumer spending.
Markets began to get choppy in April, and many investors remained cautious, remembering 2010 and 2011, when U.S. stocks started strong, then experienced broad-based corrections. Besides a continuation of weakness in employment and housing, adding to unsettled markets were softening economic data and concern about the “fiscal cliff” the U.S. faces in 2013 when tax rates will rise unless Congress steps in. In addition, the onset of recession in Europe is complicating that region’s efforts to manage the sovereign debt crisis. Emerging markets in the first quarter of 2012 had their best start in 20 years, but slipped in March on fears of eurozone market contagion and renewed concern that China’s economic growth might slow.
The Fed said in late April that it expected economic growth to remain moderate over coming quarters, but that the unemployment rate will subside gradually and that inflation was under control. To foster growth, the Federal Reserve has said it will leave its key interest rate close to zero at least through 2014, despite arguments by some Fed officials and investors that the Fed may have to consider raising rates much earlier than that to prevent inflation.
Signs that the U.S. economy was expanding at a slow, but sustainable, rate contributed to concern about future inflation, and both short-term and long-term Treasury yields generally moved higher over the first part of 2012. The continued accommodative stance of the Fed, combined with the slow, but stable, economic recovery, is supporting a positive outlook for U.S. fixed income, particularly among corporate issuers, as borrowing costs remain low, default rates currently hover around 2% and strong demand for primary issuance has enabled a steady wave of debt refinancing. Against an improving U.S. macroeconomic backdrop, investment-grade and high-yield corporates are expected to continue to outpace Treasuries.
Commodities, which had been slumping since mid-2011 due to slowing economic activity and the European debt crisis, rebounded in early 2012 on stronger macroeconomic data, but remain volatile. The price of a barrel of oil rose slightly over the six months ended in April, but investors have been shifting out of gold to assets with greater return potential. After peaking at above $1,900 last summer, the price per ounce has fallen back to around $1,600. The dollar strengthened slightly against a basket of other major currencies over the period, reflecting better economic performance in the U.S. versus other markets.
The U.S. economy seems to be decoupling from slowing growth in the rest of the world and from ongoing uncertainty in the European debt crisis, as well as the domestic debate over tax and spending policy. In this resiliency, we see potential in U.S. investments, including equities, high yield bonds, bank loans and other risk assets. It appears that the U.S. may have entered a period of self-sustaining, if modest, economic expansion, driven primarily by the aggressive monetary policy of the Fed and reinforced by the ECB, and is increasingly becoming the economic locomotive of the global economy.
| 2 | GUGGENHEIM ETFS SEMI-ANNUAL REPORT |
Table of Contents
LETTER TO OUR SHAREHOLDERS (concluded)
|
We look forward to continuing our service to you. Thank you for investing in our funds.
Sincerely,

Donald C. Cacciapaglia
President
Performance displayed represents past performance which is no guarantee of future results. Of course, fund performance is subject to daily market volatility and may be better or worse since the end of the last quarter. For up-to-date fund performance, call us at 800.820.0888 or visit www.rydex-sgi.com.
Read each fund’s prospectus and summary prospectus (if available) carefully before investing. It contains the fund’s investment objectives, risks, charges, expenses and other information, which should be considered carefully before investing. Obtain a prospectus and summary prospectus (if available) at www.rydex-sgi.com or call 800.820.0888
The referenced funds are distributed by Rydex Distributors, LLC. Guggenheim Investments represents the investment management business of Guggenheim Partners, LLC, which includes Security Investors, LLC, the investment advisor to the referenced funds. Rydex Distributors, LLC, is affiliated with Guggenheim Partners, LLC and Security Investors, LLC.
| GUGGENHEIM ETFS SEMI-ANNUAL REPORT | 3 |
Table of Contents
A BRIEF NOTE ON THE COMPOUNDING OF RETURNS (Unaudited)
|
The Funds described in this report are benchmarked daily to leveraged or inverse versions of published indices. To properly evaluate the performance of these funds, it is essential to understand the effect of mathematical compounding on their respective returns.
Because of the nonlinear effects of leverage applied over time, it is possible for a fund to perform in line with its benchmark for several individual periods in a row, yet seem to trail the benchmark over the entire period. It is also possible that a fund that performs in-line with its benchmark on a daily basis may seem to outperform its benchmark over longer periods.
An Example of Compounding
For example, consider a hypothetical fund that is designed to produce returns that correspond to 150% of an index. On the first day of a period, the index rises from a level of 100 to a level of 106, producing a 6% gain and an expectation that the fund will rise by 9%. On the same day, the fund’s Net Asset Value (“NAV”) increases from $10.00 to $10.90 for a gain of 9.0% — in line with its benchmark.
On day two, assume the index falls from 106 to 99 for a loss of about 6.6%. The fund, as expected, falls 9.9% to a price of $9.82. On each day, the fund performed exactly in line with its benchmark, but for the two-day period, the fund was down 1.8%, while the index was down only 1.0%. Without taking into account the daily compounding of returns, one would expect the fund to lose 1.5% and would see the fund as trailing by 0.3% when in fact it had performed perfectly. This example is summarized in the table below.
| Index Level | Index Performance | Fund Expectation | Fund NAV | Fund Performance | Assessment | |||||||||||||||||||
Start | 100 | $ | 10.00 | |||||||||||||||||||||
Day 1 | 106 | 6.00% | 9.00% | $ | 10.90 | 9.00% | In Line | |||||||||||||||||
Day 2 | 99 | (6.60% | ) | (9.90% | ) | $ | 9.82 | (9.90% | ) | In Line | ||||||||||||||
Cumulative | (1.00% | ) | (1.50% | ) | (1.80% | ) | (0.30% | ) | ||||||||||||||||
As illustrated by this simple example, the effect of leverage can make it difficult to form expectations or judgments about fund performance given only the returns of the unleveraged index.
Because certain funds seek to track the performance of their benchmark on a daily basis, mathematical compounding, especially with respect to those funds that use leverage as part of their investment strategy, may prevent a fund from correlating with the monthly, quarterly, annual or other period performance of its benchmark. Due to the compounding of daily returns, leveraged and inverse funds’ returns over periods other than one day will likely differ in amount and possibly direction from the benchmark return for the same period. Investors should monitor their leveraged and inverse funds’ holdings consistent with their strategies, as frequently as daily. For those funds that consistently apply leverage, the value of the fund’s shares will tend to increase or decrease more than the value of any increase or decrease in its benchmark index. For more on correlation, leverage and other risks, please read the prospectus.
In general, any change in direction in an index will produce compounding that seems to work against an investor. Were the index to move in the same direction (either up or down) for two or more periods in a row, the compounding of those returns would work in an investor’s favor, causing the fund to seemingly beat its benchmark.
As a general rule of thumb, more leverage in a fund will magnify the compounding effect, while less leverage will generally produce results that are more in line with expectations. In addition, periods of high volatility in an underlying index will also cause the effects of compounding to be more pronounced, while lower volatility will produce a more muted effect.
| 4 | GUGGENHEIM ETFS SEMI-ANNUAL REPORT |
Table of Contents
|
Shareholder Expense Example
As a shareholder of the Rydex ETF Trust, you incur transaction costs such as creation and redemption fees or brokerage charges, and ongoing costs including advisory fees, trustee fees and, if applicable, distribution fees. All other Trust expenses are paid by the advisor. This Example is intended to help you understand your ongoing costs (in dollars) of investing in a Fund and to compare these costs with the ongoing costs of investing in other mutual funds.
The example in the table is based on an investment of $1,000 invested on October 31, 2011 and held for the six months ended April 30, 2012.
Actual Expenses
The first table below provides information about actual account values and actual expenses. You may use the information in this table, together with the amount you invested, to estimate the expenses that you incurred over the period. Simply divide your account value by $1,000 (for example, an $8,600 account value divided by $1,000 = 8.6), then multiply the result by the number in the first table under the heading entitled “Expenses Paid During the Six-Month Period” to estimate the expenses attributable to your investment during this period.
Hypothetical Example for Comparison Purposes
The second table below provides information about hypothetical account values and hypothetical expenses based on a Fund’s actual expense ratio and an assumed rate of return of 5% per year before expenses, which is not a Fund’s actual return. Thus, you should not use the hypothetical account values and expenses to estimate the actual ending account balance or your expenses for the period. Rather, these figures are provided to enable you to compare the ongoing costs of investing in a Fund and other funds. To do so, compare this 5% hypothetical example with the 5% hypothetical examples that appear in the shareholder reports of other funds.
Please note that the expenses shown in the table are meant to highlight your ongoing costs only and do not reflect any transaction costs, such as creation and redemption fees, or brokerage charges. Therefore, the second table is useful in comparing ongoing costs only, and will not help you determine the relative total costs of owning different funds. In addition, if these transaction costs were included, your costs would have been higher.
| Expense Ratio | Beginning Account Value 10/31/11 | Ending Account Value 4/30/12 | Expenses 10/31/11 to 4/30/12 | |||||||||||||
Actual | ||||||||||||||||
Guggenheim 2x S&P 500 ETF | 0.71% | $ | 1,000.00 | $ | 1,247.10 | $ | 3.97 | |||||||||
Guggenheim Inverse 2x S&P 500 ETF | 0.71% | $ | 1,000.00 | $ | 750.50 | $ | 3.09 | |||||||||
Hypothetical (assuming a 5% return before expenses) | ||||||||||||||||
Guggenheim 2x S&P 500 ETF | 0.71% | $ | 1,000.00 | $ | 1,021.33 | $ | 3.57 | |||||||||
Guggenheim Inverse 2x S&P 500 ETF | 0.71% | $ | 1,000.00 | $ | 1,021.33 | $ | 3.57 | |||||||||
| * | Expenses are equal to the Fund’s annualized expense ratio multiplied by the average account value over the period, multiplied by 182/366 (to reflect one-half year period). |
| GUGGENHEIM ETFS SEMI-ANNUAL REPORT | 5 |
Table of Contents
|
| GUGGENHEIM 2x S&P 500 ETF | ||
Sector Allocations*
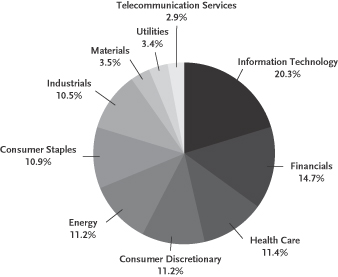
| Top 10 Holdings* | ||||
| Description | % of Net Assets | |||
Apple, Inc. | 3.57% | |||
Exxon Mobil Corp. | 2.66% | |||
International Business Machines Corp. | 1.57% | |||
Microsoft Corp. | 1.56% | |||
Chevron Corp. | 1.38% | |||
General Electric Co. | 1.36% | |||
AT&T, Inc. | 1.28% | |||
Johnson & Johnson, Inc. | 1.17% | |||
Wells Fargo & Co. | 1.15% | |||
Procter & Gamble Co. (The) | 1.15% | |||
| 6 | GUGGENHEIM ETFS SEMI-ANNUAL REPORT |
Table of Contents
| SCHEDULE OF INVESTMENTS (Unaudited) | April 30, 2012 |
GUGGENHEIM 2x S&P 500 ETF
| SHARES | MARKET VALUE | |||||||
COMMON STOCKS - 82.6% |
| |||||||
Aerospace & Defense - 2.1% |
| |||||||
Boeing Co. (The) | 3,365 | $ | 258,432 | |||||
General Dynamics Corp. | 1,610 | 108,675 | ||||||
Goodrich Corp. | 567 | 71,136 | ||||||
Honeywell International, Inc. | 3,497 | 212,128 | ||||||
L-3 Communications Holdings, Inc. | 445 | 32,725 | ||||||
Lockheed Martin Corp. | 1,202 | 108,829 | ||||||
Northrop Grumman Corp. | 1,138 | 72,013 | ||||||
Precision Castparts Corp. | 654 | 115,346 | ||||||
Raytheon Co. | 1,535 | 83,105 | ||||||
Rockwell Collins, Inc. | 672 | 37,558 | ||||||
Textron, Inc. | 1,261 | 33,593 | ||||||
United Technologies Corp. | 4,106 | 335,214 | ||||||
|
| |||||||
Total Aerospace & Defense | 1,468,754 | |||||||
|
| |||||||
Air Freight & Logistics - 0.8% |
| |||||||
C.H. Robinson Worldwide, Inc. | 736 | 43,969 | ||||||
Expeditors International of Washington, Inc. | 958 | 38,320 | ||||||
FedEx Corp. | 1,420 | 125,301 | ||||||
United Parcel Service, Inc. — Class B | 4,323 | 337,799 | ||||||
|
| |||||||
Total Air Freight & Logistics | 545,389 | |||||||
|
| |||||||
Airlines - 0.0%a |
| |||||||
Southwest Airlines Co. | 3,488 | 28,881 | ||||||
|
| |||||||
Total Airlines | 28,881 | |||||||
|
| |||||||
Auto Components - 0.2% |
| |||||||
BorgWarner, Inc.* | 493 | 38,967 | ||||||
Goodyear Tire & Rubber Co. (The)* | 1,105 | 12,133 | ||||||
Johnson Controls, Inc. | 3,071 | 98,180 | ||||||
|
| |||||||
Total Auto Components | 149,280 | |||||||
|
| |||||||
Automobiles - 0.4% |
| |||||||
Ford Motor Co. | 17,146 | 193,407 | ||||||
Harley-Davidson, Inc. | 1,031 | 53,952 | ||||||
|
| |||||||
Total Automobiles | 247,359 | |||||||
|
| |||||||
Beverages - 2.1% |
| |||||||
Beam, Inc. | 705 | 40,030 | ||||||
Brown-Forman Corp. — Class B | 447 | 38,598 | ||||||
Coca-Cola Co. (The) | 10,208 | 779,074 | ||||||
Coca-Cola Enterprises, Inc. | 1,355 | 40,813 | ||||||
Constellation Brands, Inc. — Class A* | 775 | 16,740 | ||||||
Dr Pepper Snapple Group, Inc. | 958 | 38,876 | ||||||
Molson Coors Brewing Co. — Class B | 707 | 29,397 | ||||||
PepsiCo, Inc. | 7,084 | 467,544 | ||||||
|
| |||||||
Total Beverages | 1,451,072 | |||||||
|
| |||||||
Biotechnology - 1.0% |
| |||||||
Amgen, Inc. | 3,572 | 254,005 | ||||||
Biogen Idec, Inc.* | 1,075 | 144,061 | ||||||
| SHARES | MARKET VALUE | |||||||
Celgene Corp.* | 1,979 | $ | 144,309 | |||||
Gilead Sciences, Inc.* | 3,416 | 177,666 | ||||||
|
| |||||||
Total Biotechnology | 720,041 | |||||||
|
| |||||||
Building Products - 0.0%a |
| |||||||
Masco Corp. | 1,612 | 21,246 | ||||||
|
| |||||||
Total Building Products | 21,246 | |||||||
|
| |||||||
Capital Markets - 1.6% |
| |||||||
Ameriprise Financial, Inc. | 1,000 | 54,210 | ||||||
Bank of New York Mellon Corp. (The) | 5,436 | 128,561 | ||||||
BlackRock, Inc. | 452 | 86,594 | ||||||
Charles Schwab Corp. (The) | 4,874 | 69,698 | ||||||
E*Trade Financial Corp.* | 1,145 | 12,171 | ||||||
Federated Investors, Inc. — Class B | 415 | 9,163 | ||||||
Franklin Resources, Inc. | 644 | 80,829 | ||||||
Goldman Sachs Group, Inc. (The) | 2,232 | 257,015 | ||||||
Invesco Ltd. | 2,013 | 50,003 | ||||||
Legg Mason, Inc. | 559 | 14,573 | ||||||
Morgan Stanley | 6,874 | 118,783 | ||||||
Northern Trust Corp. | 1,087 | 51,730 | ||||||
State Street Corp. | 2,199 | 101,638 | ||||||
T. Rowe Price Group, Inc. | 1,143 | 72,141 | ||||||
|
| |||||||
Total Capital Markets | 1,107,109 | |||||||
|
| |||||||
Chemicals - 1.9% |
| |||||||
Air Products & Chemicals, Inc. | 950 | 81,215 | ||||||
Airgas, Inc. | 309 | 28,317 | ||||||
CF Industries Holdings, Inc. | 297 | 57,339 | ||||||
Dow Chemical Co. (The) | 5,348 | 181,190 | ||||||
Du Pont (E.I.) de Nemours & Co. | 4,207 | 224,906 | ||||||
Eastman Chemical Co. | 616 | 33,246 | ||||||
Ecolab, Inc. | 1,313 | 83,625 | ||||||
FMC Corp. | 315 | 34,792 | ||||||
International Flavors & Fragrances, Inc. | 364 | 21,916 | ||||||
Monsanto Co. | 2,416 | 184,051 | ||||||
Mosaic Co. (The) | 1,342 | 70,884 | ||||||
PPG Industries, Inc. | 685 | 72,089 | ||||||
Praxair, Inc. | 1,346 | 155,732 | ||||||
Sherwin-Williams Co. (The) | 388 | 46,669 | ||||||
Sigma-Aldrich Corp. | 544 | 38,570 | ||||||
|
| |||||||
Total Chemicals | 1,314,541 | |||||||
|
| |||||||
Commercial Banks - 2.4% |
| |||||||
BB&T Corp. | 3,143 | 100,702 | ||||||
Comerica, Inc. | 892 | 28,562 | ||||||
Fifth Third Bancorp | 4,148 | 59,026 | ||||||
First Horizon National Corp. | 1,158 | 10,630 | ||||||
Huntington Bancshares, Inc. | 3,898 | 26,078 | ||||||
KeyCorp | 4,298 | 34,556 | ||||||
M&T Bank Corp. | 570 | 49,174 | ||||||
PNC Financial Services Group, Inc. | 2,379 | 157,775 | ||||||
Regions Financial Corp. | 5,588 | 37,663 | ||||||
| See Notes to Financial Statements. | GUGGENHEIM ETFS SEMI-ANNUAL REPORT | 7 |
Table of Contents
| SCHEDULE OF INVESTMENTS (Unaudited) (continued) | April 30, 2012 |
GUGGENHEIM 2x S&P 500 ETF
| SHARES | MARKET VALUE | |||||||
SunTrust Banks, Inc. | 2,400 | $ | 58,272 | |||||
US Bancorp | 8,621 | 277,337 | ||||||
Wells Fargo & Co. | 23,789 | 795,266 | ||||||
Zions Bancorp | 830 | 16,924 | ||||||
|
| |||||||
Total Commercial Banks | 1,651,965 | |||||||
|
| |||||||
Commercial Services & Supplies - 0.3% |
| |||||||
Avery Dennison Corp. | 479 | 15,318 | ||||||
Cintas Corp. | 499 | 19,546 | ||||||
Iron Mountain, Inc. | 771 | 23,415 | ||||||
Pitney Bowes, Inc. | 903 | 15,468 | ||||||
R.R. Donnelley & Sons Co. | 805 | 10,071 | ||||||
Republic Services, Inc. | 1,421 | 38,893 | ||||||
Stericycle, Inc.* | 384 | 33,254 | ||||||
Waste Management, Inc. | 2,083 | 71,239 | ||||||
|
| |||||||
Total Commercial Services & Supplies | 227,204 | |||||||
|
| |||||||
Communications Equipment - 1.8% |
| |||||||
Cisco Systems, Inc. | 24,297 | 489,584 | ||||||
F5 Networks, Inc.* | 359 | 48,081 | ||||||
Harris Corp. | 513 | 23,362 | ||||||
JDS Uniphase Corp.* | 1,037 | 12,600 | ||||||
Juniper Networks, Inc.* | 2,373 | 50,853 | ||||||
Motorola Mobility Holdings, Inc.* | 1,191 | 46,235 | ||||||
Motorola Solutions, Inc. | 1,328 | 67,768 | ||||||
QUALCOMM, Inc. | 7,629 | 487,035 | ||||||
|
| |||||||
Total Communications Equipment | 1,225,518 | |||||||
|
| |||||||
Computers & Peripherals - 4.7% |
| |||||||
Apple, Inc.* | 4,208 | 2,458,482 | ||||||
Dell, Inc.* | 6,888 | 112,756 | ||||||
EMC Corp.* | 9,260 | 261,225 | ||||||
Hewlett-Packard Co. | 8,917 | 220,785 | ||||||
Lexmark International, Inc. — Class A | 320 | 9,632 | ||||||
NetApp, Inc.* | 1,638 | 63,603 | ||||||
SanDisk Corp.* | 1,094 | 40,489 | ||||||
Western Digital Corp.* | 1,054 | 40,906 | ||||||
|
| |||||||
Total Computers & Peripherals | 3,207,878 | |||||||
|
| |||||||
Construction & Engineering - 0.1% |
| |||||||
Fluor Corp. | 761 | 43,948 | ||||||
Jacobs Engineering Group, Inc.* | 580 | 25,421 | ||||||
Quanta Services, Inc.* | 954 | 21,103 | ||||||
|
| |||||||
Total Construction & Engineering | 90,472 | |||||||
|
| |||||||
Construction Materials - 0.0%a |
| |||||||
Vulcan Materials Co. | 584 | 25,001 | ||||||
|
| |||||||
Total Construction Materials | 25,001 | |||||||
|
| |||||||
Consumer Finance - 0.8% |
| |||||||
American Express Co. | 4,580 | 275,762 | ||||||
Capital One Financial Corp. | 2,496 | 138,478 | ||||||
Discover Financial Services | 2,392 | 81,089 | ||||||
SLM Corp. | 2,298 | 34,079 | ||||||
|
| |||||||
Total Consumer Finance | 529,408 | |||||||
|
| |||||||
| SHARES | MARKET VALUE | |||||||
Containers & Packaging - 0.1% |
| |||||||
Ball Corp. | 702 | $ | 29,316 | |||||
Bemis Co., Inc. | 466 | 15,094 | ||||||
Owens-Illinois, Inc.* | 741 | 17,228 | ||||||
Sealed Air Corp. | 867 | 16,629 | ||||||
|
| |||||||
Total Containers & Packaging | 78,267 | |||||||
|
| |||||||
Distributors - 0.1% | ||||||||
Genuine Parts Co. | 705 | 45,670 | ||||||
|
| |||||||
Total Distributors | 45,670 | |||||||
|
| |||||||
Diversified Consumer Services - 0.1% |
| |||||||
Apollo Group, Inc. — Class A* | 506 | 17,821 | ||||||
DeVry, Inc. | 271 | 8,713 | ||||||
H&R Block, Inc. | 1,321 | 19,419 | ||||||
|
| |||||||
Total Diversified Consumer Services | 45,953 | |||||||
|
| |||||||
Diversified Financial Services - 2.6% |
| |||||||
Bank of America Corp. | 48,414 | 392,638 | ||||||
Citigroup, Inc. | 13,212 | 436,524 | ||||||
CME Group, Inc. | 301 | 80,012 | ||||||
IntercontinentalExchange, Inc.* | 329 | 43,770 | ||||||
JPMorgan Chase & Co. | 17,219 | 740,073 | ||||||
Leucadia National Corp. | 894 | 22,225 | ||||||
Moody’s Corp. | 884 | 36,200 | ||||||
Nasdaq OMX Group, Inc. | 562 | 13,808 | ||||||
NYSE Euronext | 1,164 | 29,973 | ||||||
|
| |||||||
Total Diversified Financial Services | 1,795,223 | |||||||
|
| |||||||
Diversified Telecommunication Services - 2.3% |
| |||||||
AT&T, Inc. | 26,746 | 880,211 | ||||||
CenturyLink, Inc. | 2,796 | 107,814 | ||||||
Frontier Communications Corp. | 4,490 | 18,140 | ||||||
Verizon Communications, Inc. | 12,793 | 516,581 | ||||||
Windstream Corp. | 2,646 | 29,741 | ||||||
|
| |||||||
Total Diversified Telecommunication Services | 1,552,487 | |||||||
|
| |||||||
Electric Utilities - 1.5% | ||||||||
American Electric Power Co., Inc. | 2,181 | 84,710 | ||||||
Duke Energy Corp. | 6,025 | 129,116 | ||||||
Edison International | 1,470 | 64,695 | ||||||
Entergy Corp. | 796 | 52,186 | ||||||
Exelon Corp. | 2,875 | 112,154 | ||||||
FirstEnergy Corp. | 1,885 | 88,256 | ||||||
NextEra Energy, Inc. | 1,879 | 120,914 | ||||||
Northeast Utilities | 1,411 | 51,882 | ||||||
Pepco Holdings, Inc. | 1,026 | 19,412 | ||||||
Pinnacle West Capital Corp. | 494 | 23,885 | ||||||
PPL Corp. | 2,613 | 71,465 | ||||||
Progress Energy, Inc. | 1,333 | 70,942 | ||||||
Southern Co. | 3,910 | 179,625 | ||||||
|
| |||||||
Total Electric Utilities | 1,069,242 | |||||||
|
| |||||||
Electrical Equipment - 0.5% |
| |||||||
Cooper Industries PLC | 715 | 44,738 | ||||||
| 8 | GUGGENHEIM ETFS SEMI-ANNUAL REPORT | See Notes to Financial Statements. |
Table of Contents
| SCHEDULE OF INVESTMENTS (Unaudited) (continued) | April 30, 2012 |
GUGGENHEIM 2x S&P 500 ETF
| SHARES | MARKET VALUE | |||||||
Emerson Electric Co. | 3,315 | $ | 174,170 | |||||
Rockwell Automation, Inc. | 644 | 49,807 | ||||||
Roper Industries, Inc. | 438 | 44,632 | ||||||
|
| |||||||
Total Electrical Equipment | 313,347 | |||||||
|
| |||||||
Electronic Equipment, Instruments & Components - 0.4% |
| |||||||
Amphenol Corp. — Class A | 735 | 42,733 | ||||||
Corning, Inc. | 6,866 | 98,527 | ||||||
FLIR Systems, Inc. | 696 | 15,632 | ||||||
Jabil Circuit, Inc. | 832 | 19,510 | ||||||
Molex, Inc. | 618 | 17,051 | ||||||
TE Connectivity Ltd. | 1,922 | 70,076 | ||||||
|
| |||||||
Total Electronic Equipment, Instruments & Components | 263,529 | |||||||
|
| |||||||
Energy Equipment & Services - 1.5% |
| |||||||
Baker Hughes, Inc. | 1,973 | 87,029 | ||||||
Cameron International Corp.* | 1,109 | 56,836 | ||||||
Diamond Offshore Drilling, Inc. | 313 | 21,456 | ||||||
FMC Technologies, Inc.* | 1,077 | 50,619 | ||||||
Halliburton Co. | 4,164 | 142,492 | ||||||
Helmerich & Payne, Inc. | 484 | 24,873 | ||||||
Nabors Industries Ltd.* | 1,304 | 21,712 | ||||||
National-Oilwell Varco, Inc. | 1,912 | 144,853 | ||||||
Noble Corp.* | 1,136 | 43,236 | ||||||
Rowan Cos., Inc.* | 559 | 19,303 | ||||||
Schlumberger Ltd. | 6,015 | 445,952 | ||||||
|
| |||||||
Total Energy Equipment & Services | 1,058,361 | |||||||
|
| |||||||
Food & Staples Retailing - 1.8% |
| |||||||
Costco Wholesale Corp. | 1,963 | 173,078 | ||||||
CVS Caremark Corp. | 5,873 | 262,053 | ||||||
Kroger Co. (The) | 2,594 | 60,362 | ||||||
Safeway, Inc. | 1,209 | 24,579 | ||||||
Sysco Corp. | 2,636 | 76,180 | ||||||
Wal-Mart Stores, Inc. | 7,881 | 464,270 | ||||||
Walgreen Co. | 3,941 | 138,172 | ||||||
Whole Foods Market, Inc. | 734 | 60,973 | ||||||
|
| |||||||
Total Food & Staples Retailing | 1,259,667 | |||||||
|
| |||||||
Food Products - 1.5% | ||||||||
Archer-Daniels-Midland Co. | 2,984 | 91,997 | ||||||
Campbell Soup Co. | 805 | 27,233 | ||||||
ConAgra Foods, Inc. | 1,860 | 48,025 | ||||||
Dean Foods Co.* | 831 | 10,205 | ||||||
General Mills, Inc. | 2,909 | 113,131 | ||||||
H.J. Heinz Co. | 1,444 | 76,980 | ||||||
Hershey Co. (The) | 692 | 46,371 | ||||||
Hormel Foods Corp. | 618 | 17,959 | ||||||
J.M. Smucker Co. (The) | 511 | 40,691 | ||||||
Kellogg Co. | 1,111 | 56,183 | ||||||
Kraft Foods, Inc. — Class A | 7,976 | 318,003 | ||||||
McCormick & Co., Inc. | 600 | 33,546 | ||||||
Mead Johnson Nutrition Co. | 919 | 78,630 | ||||||
Sara Lee Corp. | 2,668 | 58,803 | ||||||
| SHARES | MARKET VALUE | |||||||
Tyson Foods, Inc. — Class A | 1,314 | $ | 23,980 | |||||
|
| |||||||
Total Food Products | 1,041,737 | |||||||
|
| |||||||
Gas Utilities - 0.1% |
| |||||||
AGL Resources, Inc. | 530 | 20,898 | ||||||
Oneok, Inc. | 470 | 40,368 | ||||||
|
| |||||||
Total Gas Utilities | 61,266 | |||||||
|
| |||||||
Health Care Equipment & Supplies - 1.5% |
| |||||||
Baxter International, Inc. | 2,528 | 140,076 | ||||||
Becton, Dickinson and Co. | 948 | 74,371 | ||||||
Boston Scientific Corp.* | 6,547 | 40,984 | ||||||
C.R. Bard, Inc. | 380 | 37,605 | ||||||
CareFusion Corp.* | 1,015 | 26,299 | ||||||
Covidien PLC | 2,180 | 120,401 | ||||||
DENTSPLY International, Inc. | 642 | 26,361 | ||||||
Edwards Lifesciences Corp.* | 519 | 43,061 | ||||||
Intuitive Surgical, Inc.* | 178 | 102,920 | ||||||
Medtronic, Inc. | 4,696 | 179,387 | ||||||
St Jude Medical, Inc. | 1,447 | 56,028 | ||||||
Stryker Corp. | 1,460 | 79,672 | ||||||
Varian Medical Systems, Inc.* | 509 | 32,281 | ||||||
Zimmer Holdings, Inc. | 803 | 50,533 | ||||||
|
| |||||||
Total Health Care Equipment & Supplies | 1,009,979 | |||||||
|
| |||||||
Health Care Providers & Services - 1.6% |
| |||||||
Aetna, Inc. | 1,581 | 69,627 | ||||||
AmerisourceBergen Corp. | 1,161 | 43,201 | ||||||
Cardinal Health, Inc. | 1,561 | 65,983 | ||||||
CIGNA Corp. | 1,293 | 59,775 | ||||||
Coventry Health Care, Inc. | 638 | 19,134 | ||||||
DaVita, Inc.* | 422 | 37,381 | ||||||
Express Scripts Holding Co.* | 3,605 | 201,123 | ||||||
Humana, Inc. | 739 | 59,622 | ||||||
Laboratory Corp. of America Holdings* | 440 | 38,672 | ||||||
McKesson Corp. | 1,109 | 101,374 | ||||||
Patterson Cos., Inc. | 394 | 13,431 | ||||||
Quest Diagnostics, Inc. | 714 | 41,191 | ||||||
Tenet Healthcare Corp.* | 1,851 | 9,607 | ||||||
UnitedHealth Group, Inc. | 4,715 | 264,747 | ||||||
WellPoint, Inc. | 1,508 | 102,273 | ||||||
|
| |||||||
Total Health Care Providers & Services | 1,127,141 | |||||||
|
| |||||||
Health Care Technology - 0.1% |
| |||||||
Cerner Corp.* | 658 | 53,357 | ||||||
|
| |||||||
Total Health Care Technology | 53,357 | |||||||
|
| |||||||
Hotels, Restaurants & Leisure - 1.7% |
| |||||||
Carnival Corp. | 2,044 | 66,410 | ||||||
Chipotle Mexican Grill, Inc.* | 141 | 58,395 | ||||||
Darden Restaurants, Inc. | 580 | 29,046 | ||||||
International Game Technology | 1,341 | 20,893 | ||||||
Marriott International, Inc. — Class A | 1,205 | 47,103 | ||||||
McDonald’s Corp. | 4,595 | 447,783 | ||||||
| See Notes to Financial Statements. | GUGGENHEIM ETFS SEMI-ANNUAL REPORT | 9 |
Table of Contents
| SCHEDULE OF INVESTMENTS (Unaudited) (continued) | April 30, 2012 |
GUGGENHEIM 2x S&P 500 ETF
| SHARES | MARKET VALUE | |||||||
Starbucks Corp. | 3,400 | $ | 195,092 | |||||
Starwood Hotels & Resorts Worldwide, Inc. | 884 | 52,333 | ||||||
Wyndham Worldwide Corp. | 658 | 33,124 | ||||||
Wynn Resorts Ltd. | 360 | 48,024 | ||||||
Yum! Brands, Inc. | 2,078 | 151,133 | ||||||
|
| |||||||
Total Hotels, Restaurants & Leisure | 1,149,336 | |||||||
|
| |||||||
Household Durables - 0.2% |
| |||||||
DR Horton, Inc. | 1,257 | 20,552 | ||||||
Harman International Industries, Inc. | 317 | 15,717 | ||||||
Leggett & Platt, Inc. | 632 | 13,759 | ||||||
Lennar Corp. — Class A | 734 | 20,361 | ||||||
Newell Rubbermaid, Inc. | 1,302 | 23,696 | ||||||
Pulte Homes, Inc.* | 1,518 | 14,937 | ||||||
Whirlpool Corp. | 346 | 22,151 | ||||||
|
| |||||||
Total Household Durables | 131,173 | |||||||
|
| |||||||
Household Products - 1.7% |
| |||||||
Clorox Co. (The) | 587 | 41,149 | ||||||
Colgate-Palmolive Co. | 2,165 | 214,205 | ||||||
Kimberly-Clark Corp. | 1,775 | 139,284 | ||||||
Procter & Gamble Co. (The) | 12,424 | 790,663 | ||||||
|
| |||||||
Total Household Products | 1,185,301 | |||||||
|
| |||||||
Independent Power Producers & Energy Traders - 0.1% |
| |||||||
AES Corp. (The)* | 2,903 | 36,346 | ||||||
NRG Energy, Inc.* | 1,026 | 17,442 | ||||||
|
| |||||||
Total Independent Power Producers & Energy Traders | 53,788 | |||||||
|
| |||||||
Industrial Conglomerates - 2.1% |
| |||||||
3M Co. | 3,134 | 280,054 | ||||||
Danaher Corp. | 2,580 | 139,888 | ||||||
General Electric Co. | 47,734 | 934,632 | ||||||
Tyco International Ltd. | 2,081 | 116,806 | ||||||
|
| |||||||
Total Industrial Conglomerates | 1,471,380 | |||||||
|
| |||||||
Insurance - 2.9% |
| |||||||
ACE Ltd. | 1,521 | 115,550 | ||||||
AFLAC, Inc. | 2,109 | 94,989 | ||||||
Allstate Corp. (The) | 2,249 | 74,959 | ||||||
American International Group, Inc.* | 2,425 | 82,523 | ||||||
Aon PLC | 1,467 | 75,991 | ||||||
Assurant, Inc. | 394 | 15,894 | ||||||
Berkshire Hathaway, Inc. — Class B* | 7,932 | 638,129 | ||||||
Chubb Corp. (The) | 1,221 | 89,219 | ||||||
Cincinnati Financial Corp. | 734 | 26,145 | ||||||
Genworth Financial, Inc. — Class A* | 2,217 | 13,324 | ||||||
Hartford Financial Services Group, Inc. | 1,987 | 40,833 | ||||||
Lincoln National Corp. | 1,313 | 32,523 | ||||||
Loews Corp. | 1,378 | 56,677 | ||||||
| SHARES | MARKET VALUE | |||||||
Marsh & McLennan Cos., Inc. | 2,453 | $ | 82,053 | |||||
MetLife, Inc. | 4,781 | 172,260 | ||||||
Principal Financial Group, Inc. | 1,361 | 37,659 | ||||||
Progressive Corp. (The) | 2,759 | 58,767 | ||||||
Prudential Financial, Inc. | 2,120 | 128,345 | ||||||
Torchmark Corp. | 451 | 21,968 | ||||||
Travelers Cos., Inc. (The) | 1,772 | 113,975 | ||||||
Unum Group | 1,310 | 31,099 | ||||||
XL Group PLC | 1,422 | 30,587 | ||||||
|
| |||||||
Total Insurance | 2,033,469 | |||||||
|
| |||||||
Internet & Catalog Retail - 0.9% |
| |||||||
Amazon.com, Inc.* | 1,643 | 381,012 | ||||||
Expedia, Inc. | 428 | 18,245 | ||||||
Netflix, Inc.* | 249 | 19,955 | ||||||
priceline.com, Inc.* | 224 | 170,424 | ||||||
TripAdvisor, Inc.* | 427 | 16,017 | ||||||
|
| |||||||
Total Internet & Catalog Retail | 605,653 | |||||||
|
| |||||||
Internet Software & Services - 1.5% |
| |||||||
Akamai Technologies, Inc.* | 802 | 26,145 | ||||||
eBay, Inc.* | 5,166 | 212,065 | ||||||
Google, Inc. — Class A* | 1,143 | 691,778 | ||||||
VeriSign, Inc. | 720 | 29,599 | ||||||
Yahoo!, Inc.* | 5,474 | 85,066 | ||||||
|
| |||||||
Total Internet Software & Services | 1,044,653 | |||||||
|
| |||||||
IT Services - 3.3% | ||||||||
Accenture PLC — Class A | 2,918 | 189,524 | ||||||
Automatic Data Processing, Inc. | 2,213 | 123,087 | ||||||
Cognizant Technology Solutions Corp. — Class A* | 1,367 | 100,228 | ||||||
Computer Sciences Corp. | 701 | 19,670 | ||||||
Fidelity National Information Services, Inc. | 1,057 | 35,589 | ||||||
Fiserv, Inc.* | 624 | 43,861 | ||||||
International Business Machines Corp. | 5,227 | 1,082,407 | ||||||
Mastercard, Inc. — Class A | 478 | 216,185 | ||||||
Paychex, Inc. | 1,454 | 45,045 | ||||||
SAIC, Inc. | 1,248 | 15,176 | ||||||
Teradata Corp.* | 756 | 52,754 | ||||||
Total System Services, Inc. | 725 | 17,052 | ||||||
Visa, Inc. — Class A | 2,245 | 276,090 | ||||||
Western Union Co. (The) | 2,800 | 51,464 | ||||||
|
| |||||||
Total IT Services | 2,268,132 | |||||||
|
| |||||||
Leisure Equipment & Products - 0.1% |
| |||||||
Hasbro, Inc. | 523 | 19,215 | ||||||
Mattel, Inc. | 1,530 | 51,408 | ||||||
|
| |||||||
Total Leisure Equipment & Products | 70,623 | |||||||
|
| |||||||
Life Sciences Tools & Services - 0.4% |
| |||||||
Agilent Technologies, Inc. | 1,567 | 66,096 | ||||||
Life Technologies Corp.* | 804 | 37,273 | ||||||
PerkinElmer, Inc. | 511 | 14,104 | ||||||
| 10 | GUGGENHEIM ETFS SEMI-ANNUAL REPORT | See Notes to Financial Statements. |
Table of Contents
| SCHEDULE OF INVESTMENTS (Unaudited) (continued) | April 30, 2012 |
GUGGENHEIM 2x S&P 500 ETF
| SHARES | MARKET VALUE | |||||||
Thermo Fisher Scientific, Inc. | 1,652 | $ | 91,934 | |||||
Waters Corp.* | 402 | 33,812 | ||||||
|
| |||||||
Total Life Sciences Tools & Services | 243,219 | |||||||
|
| |||||||
Machinery - 1.7% | ||||||||
Caterpillar, Inc. | 2,920 | 300,088 | ||||||
Cummins, Inc. | 866 | 100,309 | ||||||
Deere & Co. | 1,813 | 149,319 | ||||||
Dover Corp. | 828 | 51,882 | ||||||
Eaton Corp. | 1,508 | 72,655 | ||||||
Flowserve Corp. | 244 | 28,043 | ||||||
Illinois Tool Works, Inc. | 2,182 | 125,203 | ||||||
Ingersoll-Rand PLC | 1,340 | 56,977 | ||||||
Joy Global, Inc. | 476 | 33,686 | ||||||
PACCAR, Inc. | 1,610 | 69,166 | ||||||
Pall Corp. | 521 | 31,057 | ||||||
Parker Hannifin Corp. | 680 | 59,629 | ||||||
Snap-on, Inc. | 264 | 16,511 | ||||||
Stanley Black & Decker, Inc. | 763 | 55,821 | ||||||
Xylem, Inc. | 833 | 23,224 | ||||||
|
| |||||||
Total Machinery | 1,173,570 | |||||||
|
| |||||||
Media - 2.6% | ||||||||
Cablevision Systems Corp. — Class A | 978 | 14,494 | ||||||
CBS Corp. — Class B | 2,928 | 97,649 | ||||||
Comcast Corp. — Class A | 12,162 | 368,873 | ||||||
DIRECTV — Class A* | 3,052 | 150,372 | ||||||
Discovery Communications, Inc. —Class A* | 1,165 | 63,399 | ||||||
Gannett Co., Inc. | 1,070 | 14,787 | ||||||
Interpublic Group of Cos., Inc. (The) | 2,013 | 23,774 | ||||||
McGraw-Hill Cos., Inc. (The) | 1,253 | 61,610 | ||||||
News Corp. — Class A | 9,710 | 190,316 | ||||||
Omnicom Group, Inc. | 1,230 | 63,111 | ||||||
Scripps Networks Interactive, Inc. — Class A | 431 | 21,645 | ||||||
Time Warner Cable, Inc. | 1,418 | 114,078 | ||||||
Time Warner, Inc. | 4,375 | 163,888 | ||||||
Viacom, Inc. — Class B | 2,436 | 113,006 | ||||||
Walt Disney Co. (The) | 8,084 | 348,501 | ||||||
Washington Post Co. (The) — Class B | 21 | 7,942 | ||||||
|
| |||||||
Total Media | 1,817,445 | |||||||
|
| |||||||
Metals & Mining - 0.7% | ||||||||
Alcoa, Inc. | 4,811 | 46,811 | ||||||
Allegheny Technologies, Inc. | 480 | 20,611 | ||||||
Cliffs Natural Resources, Inc. | 642 | 39,971 | ||||||
Freeport-McMoRan Copper & Gold, Inc. | 4,276 | 163,771 | ||||||
Newmont Mining Corp. | 2,232 | 106,355 | ||||||
Nucor Corp. | 1,429 | 56,031 | ||||||
Titanium Metals Corp. | 371 | 5,479 | ||||||
| SHARES | MARKET VALUE | |||||||
United States Steel Corp. | 648 | $ | 18,358 | |||||
|
| |||||||
Total Metals & Mining | 457,387 | |||||||
|
| |||||||
Multi-utilities - 1.1% | ||||||||
Ameren Corp. | 1,095 | 35,905 | ||||||
CenterPoint Energy, Inc. | 1,922 | 38,844 | ||||||
CMS Energy Corp. | 1,162 | 26,714 | ||||||
Consolidated Edison, Inc. | 1,321 | 78,533 | ||||||
Dominion Resources, Inc. | 2,570 | 134,128 | ||||||
DTE Energy Co. | 763 | 43,018 | ||||||
Integrys Energy Group, Inc. | 354 | 19,343 | ||||||
NiSource, Inc. | 1,274 | 31,404 | ||||||
PG&E Corp. | 1,858 | 82,086 | ||||||
Public Service Enterprise Group, Inc. | 2,285 | 71,178 | ||||||
SCANA Corp. | 524 | 24,167 | ||||||
Sempra Energy | 1,085 | 70,243 | ||||||
TECO Energy, Inc. | 973 | 17,533 | ||||||
Wisconsin Energy Corp. | 1,040 | 38,314 | ||||||
Xcel Energy, Inc. | 2,198 | 59,478 | ||||||
|
| |||||||
Total Multi-Utilities | 770,888 | |||||||
|
| |||||||
Multiline Retail - 0.7% | ||||||||
Big Lots, Inc.* | 297 | 10,882 | ||||||
Dollar Tree, Inc.* | 536 | 54,490 | ||||||
Family Dollar Stores, Inc. | 533 | 36,004 | ||||||
J.C. Penney Co., Inc. | 651 | 23,475 | ||||||
Kohl’s Corp. | 1,142 | 57,249 | ||||||
Macy’s, Inc. | 1,869 | 76,666 | ||||||
Nordstrom, Inc. | 722 | 40,331 | ||||||
Sears Holdings Corp.* | 173 | 9,304 | ||||||
Target Corp. | 3,028 | 175,442 | ||||||
|
| |||||||
Total Multiline Retail | 483,843 | |||||||
|
| |||||||
Office Electronics - 0.1% | ||||||||
Xerox Corp. | 6,009 | 46,750 | ||||||
|
| |||||||
Total Office Electronics | 46,750 | |||||||
|
| |||||||
Oil, Gas & Consumable Fuels - 7.7% |
| |||||||
Alpha Natural Resources, Inc.* | 991 | 15,985 | ||||||
Anadarko Petroleum Corp. | 2,250 | 164,723 | ||||||
Apache Corp. | 1,735 | 166,456 | ||||||
Cabot Oil & Gas Corp. | 946 | 33,242 | ||||||
Chesapeake Energy Corp. | 2,989 | 55,117 | ||||||
Chevron Corp. | 8,916 | 950,089 | ||||||
ConocoPhillips | 5,773 | 413,520 | ||||||
CONSOL Energy, Inc. | 1,023 | 34,005 | ||||||
Denbury Resources, Inc.* | 1,762 | 33,548 | ||||||
Devon Energy Corp. | 1,825 | 127,476 | ||||||
El Paso Corp. | 3,488 | 103,489 | ||||||
EOG Resources, Inc. | 1,215 | 133,419 | ||||||
EQT Corp. | 676 | 33,678 | ||||||
Exxon Mobil Corp. | 21,263 | 1,835,847 | ||||||
Hess Corp. | 1,363 | 71,067 | ||||||
Marathon Oil Corp. | 3,174 | 93,125 | ||||||
Marathon Petroleum Corp. | 1,567 | 65,203 | ||||||
Murphy Oil Corp. | 876 | 48,154 | ||||||
| See Notes to Financial Statements. | GUGGENHEIM ETFS SEMI-ANNUAL REPORT | 11 |
Table of Contents
| SCHEDULE OF INVESTMENTS (Unaudited) (continued) | April 30, 2012 |
GUGGENHEIM 2x S&P 500 ETF
| SHARES | MARKET VALUE | |||||||
Newfield Exploration Co.* | 597 | $ | 21,432 | |||||
Noble Energy, Inc. | 797 | 79,158 | ||||||
Occidental Petroleum Corp. | 3,660 | 333,865 | ||||||
Peabody Energy Corp. | 1,227 | 38,172 | ||||||
Pioneer Natural Resources Co. | 557 | 64,512 | ||||||
QEP Resources, Inc. | 800 | 24,648 | ||||||
Range Resources Corp. | 711 | 47,395 | ||||||
Southwestern Energy Co.* | 1,574 | 49,707 | ||||||
Spectra Energy Corp. | 2,939 | 90,345 | ||||||
Sunoco, Inc. | 481 | 23,709 | ||||||
Tesoro Corp.* | 626 | 14,555 | ||||||
Valero Energy Corp. | 2,505 | 61,874 | ||||||
Williams Cos., Inc. (The) | 2,671 | 90,894 | ||||||
WPX Energy, Inc.* | 897 | 15,760 | ||||||
|
| |||||||
Total Oil, Gas & Consumable Fuels |
| 5,334,169 | ||||||
|
| |||||||
Paper & Forest Products - 0.1% |
| |||||||
International Paper Co. | 1,970 | 65,621 | ||||||
MeadWestvaco Corp. | 771 | 24,533 | ||||||
|
| |||||||
Total Paper & Forest Products |
| 90,154 | ||||||
|
| |||||||
Personal Products - 0.2% | ||||||||
Avon Products, Inc. | 1,943 | 41,969 | ||||||
Estee Lauder Cos., Inc. (The) — Class A | 1,016 | 66,395 | ||||||
|
| |||||||
Total Personal Products | 108,364 | |||||||
|
| |||||||
Pharmaceuticals - 4.8% | ||||||||
Abbott Laboratories | 7,093 | 440,192 | ||||||
Allergan, Inc. | 1,373 | 131,808 | ||||||
Bristol-Myers Squibb Co. | 7,616 | 254,146 | ||||||
Eli Lilly & Co. | 4,608 | 190,725 | ||||||
Forest Laboratories, Inc.* | 1,197 | 41,691 | ||||||
Hospira, Inc.* | 743 | 26,094 | ||||||
Johnson & Johnson, Inc. | 12,384 | 806,075 | ||||||
Merck & Co., Inc. | 13,732 | 538,844 | ||||||
Mylan, Inc.* | 1,926 | 41,813 | ||||||
Perrigo Co. | 420 | 44,058 | ||||||
Pfizer, Inc. | 34,008 | 779,803 | ||||||
Watson Pharmaceuticals, Inc.* | 574 | 43,257 | ||||||
|
| |||||||
Total Pharmaceuticals | 3,338,506 | |||||||
|
| |||||||
Professional Services - 0.1% |
| |||||||
Dun & Bradstreet Corp. (The) | 217 | 16,878 | ||||||
Equifax, Inc. | 540 | 24,743 | ||||||
Robert Half International, Inc. | 643 | 19,161 | ||||||
|
| |||||||
Total Professional Services | 60,782 | |||||||
|
| |||||||
Real Estate Investment Trusts (REITs) - 1.7% |
| |||||||
American Tower Corp. | 1,775 | 116,405 | ||||||
Apartment Investment & Management | 547 | 14,851 | ||||||
AvalonBay Communities, Inc. | 429 | 62,377 | ||||||
Boston Properties, Inc. | 670 | 72,528 | ||||||
Equity Residential | 1,355 | 83,251 | ||||||
HCP, Inc. | 1,849 | 76,641 | ||||||
Health Care REIT, Inc. | 949 | 53,770 | ||||||
| SHARES | MARKET VALUE | |||||||
Host Hotels & Resorts, Inc. | 3,192 | $ | 53,115 | |||||
Kimco Realty Corp. | 1,836 | 35,637 | ||||||
Plum Creek Timber Co., Inc. | 730 | 30,689 | ||||||
ProLogis, Inc. | 2,071 | 74,100 | ||||||
Public Storage | 643 | 92,116 | ||||||
Simon Property Group, Inc. | 1,382 | 215,039 | ||||||
Ventas, Inc. | 1,305 | 76,721 | ||||||
Vornado Realty Trust | 835 | 71,676 | ||||||
Weyerhaeuser Co. | 2,421 | 49,292 | ||||||
|
| |||||||
Total Real Estate Investment Trusts (REITs) | 1,178,208 | |||||||
|
| |||||||
Real Estate Management & Development - 0.0%a |
| |||||||
CBRE Group, Inc.* | 1,477 | 27,782 | ||||||
|
| |||||||
Total Real Estate Management & Development | 27,782 | |||||||
|
| |||||||
Road & Rail - 0.7% | ||||||||
CSX Corp. | 4,748 | 105,928 | ||||||
Norfolk Southern Corp. | 1,489 | 108,593 | ||||||
Ryder System, Inc. | 231 | 11,254 | ||||||
Union Pacific Corp. | 2,167 | 243,657 | ||||||
|
| |||||||
Total Road & Rail | 469,432 | |||||||
|
| |||||||
Semiconductors & Semiconductor Equipment - 2.0% |
| |||||||
Advanced Micro Devices, Inc.* | 2,647 | 19,482 | ||||||
Altera Corp. | 1,453 | 51,683 | ||||||
Analog Devices, Inc. | 1,343 | 52,350 | ||||||
Applied Materials, Inc. | 5,824 | 69,830 | ||||||
Broadcom Corp. — Class A* | 2,213 | 80,996 | ||||||
First Solar, Inc.* | 266 | 4,894 | ||||||
Intel Corp. | 22,537 | 640,051 | ||||||
KLA-Tencor Corp. | 753 | 39,269 | ||||||
Linear Technology Corp. | 1,033 | 33,789 | ||||||
LSI Corp.* | 2,557 | 20,558 | ||||||
Microchip Technology, Inc. | 867 | 30,640 | ||||||
Micron Technology, Inc.* | 4,457 | 29,372 | ||||||
Novellus Systems, Inc.* | 319 | 14,913 | ||||||
NVIDIA Corp.* | 2,754 | 35,802 | ||||||
Teradyne, Inc.* | 842 | 14,491 | ||||||
Texas Instruments, Inc. | 5,165 | 164,970 | ||||||
Xilinx, Inc. | 1,182 | 43,001 | ||||||
|
| |||||||
Total Semiconductors & Semiconductor Equipment | 1,346,091 | |||||||
|
| |||||||
Software - 3.1% | ||||||||
Adobe Systems, Inc.* | 2,226 | 74,705 | ||||||
Autodesk, Inc.* | 1,021 | 40,197 | ||||||
BMC Software, Inc.* | 740 | 30,532 | ||||||
CA, Inc. | 1,644 | 43,434 | ||||||
Citrix Systems, Inc.* | 838 | 71,741 | ||||||
Electronic Arts, Inc.* | 1,495 | 22,993 | ||||||
Intuit, Inc. | 1,332 | 77,216 | ||||||
Microsoft Corp. | 33,688 | 1,078,690 | ||||||
Oracle Corp. | 17,683 | 519,703 | ||||||
Red Hat, Inc.* | 873 | 52,040 | ||||||
Salesforce.com, Inc.* | 615 | 95,774 | ||||||
| 12 | GUGGENHEIM ETFS SEMI-ANNUAL REPORT | See Notes to Financial Statements. |
Table of Contents
| SCHEDULE OF INVESTMENTS (Unaudited) (concluded) | April 30, 2012 |
GUGGENHEIM 2x S&P 500 ETF
| SHARES | MARKET VALUE | |||||||
Symantec Corp.* | 3,289 | $ | 54,334 | |||||
|
| |||||||
Total Software | 2,161,359 | |||||||
|
| |||||||
Specialty Retail - 1.8% | ||||||||
Abercrombie & Fitch Co. — Class A | 388 | 19,466 | ||||||
AutoNation, Inc.* | 203 | 7,020 | ||||||
AutoZone, Inc.* | 124 | 49,124 | ||||||
Bed Bath & Beyond, Inc.* | 1,069 | 75,247 | ||||||
Best Buy Co., Inc. | 1,278 | 28,205 | ||||||
CarMax, Inc.* | 1,021 | 31,518 | ||||||
GameStop Corp. — Class A | 617 | 14,043 | ||||||
Gap, Inc.(The) | 1,499 | 42,722 | ||||||
Home Depot, Inc. | 6,955 | 360,199 | ||||||
Limited Brands, Inc. | 1,108 | 55,068 | ||||||
Lowe’s Cos., Inc. | 5,598 | 176,169 | ||||||
O’Reilly Automotive, Inc.* | 574 | 60,534 | ||||||
Ross Stores, Inc. | 1,031 | 63,499 | ||||||
Staples, Inc. | 3,131 | 48,217 | ||||||
Tiffany & Co. | 572 | 39,159 | ||||||
TJX Cos., Inc. | 3,405 | 142,023 | ||||||
Urban Outfitters, Inc.* | 503 | 14,567 | ||||||
|
| |||||||
Total Specialty Retail | 1,226,780 | |||||||
|
| |||||||
Textiles, Apparel & Luxury Goods - 0.6% |
| |||||||
Coach, Inc. | 1,299 | 95,035 | ||||||
Fossil, Inc.* | 234 | 30,577 | ||||||
NIKE, Inc. — Class B | 1,655 | 185,145 | ||||||
Ralph Lauren Corp. | 292 | 50,303 | ||||||
V.F. Corp. | 393 | 59,755 | ||||||
|
| |||||||
Total Textiles, Apparel & Luxury Goods |
| 420,815 | ||||||
|
| |||||||
Thrifts & Mortgage Finance - 0.1% |
| |||||||
Hudson City Bancorp, Inc. | 2,379 | 16,796 | ||||||
People’s United Financial, Inc. | 1,622 | 20,015 | ||||||
|
| |||||||
Total Thrifts & Mortgage Finance |
| 36,811 | ||||||
|
| |||||||
Tobacco - 1.6% | ||||||||
Altria Group, Inc. | 9,230 | 297,298 | ||||||
Lorillard, Inc. | 594 | 80,362 | ||||||
Philip Morris International, Inc. | 7,769 | 695,403 | ||||||
Reynolds American, Inc. | 1,509 | 61,613 | ||||||
|
| |||||||
Total Tobacco | 1,134,676 | |||||||
|
| |||||||
Trading Companies & Distributors - 0.2% |
| |||||||
Fastenal Co. | 1,334 | 62,458 | ||||||
W.W. Grainger, Inc. | 273 | 56,735 | ||||||
|
| |||||||
Total Trading Companies & Distributors | 119,193 | |||||||
|
| |||||||
Wireless Telecommunication Services - 0.2% |
| |||||||
Crown Castle International Corp.* | 1,131 | 64,026 | ||||||
| SHARES | MARKET VALUE | |||||||
MetroPCS Communications, Inc.* | 1,325 | $ | 9,672 | |||||
Sprint Nextel Corp.* | 13,521 | 33,532 | ||||||
|
| |||||||
Total Wireless Telecommunication Services | 107,230 | |||||||
|
| |||||||
Total Common Stocks | 56,953,306 | |||||||
|
| |||||||
| FACE AMOUNT | ||||||||
REPURCHASE AGREEMENTS - 4.4% |
| |||||||
State Street Bank & Trust Co., 0.010%, dated 04/30/12, to be repurchased at $3,032,001 on 05/01/12 collateralized by $2,745,000 FNMA at 4.375% due 10/15/2015 with a value of $3,094,988b | $3,032,000 | 3,032,000 | ||||||
|
| |||||||
Total Repurchase Agreements | 3,032,000 | |||||||
|
| |||||||
Total Investments - 87.0%c |
| 59,985,306 | ||||||
|
| |||||||
Other Assets and Liabilities, net - 13.0% |
| 8,958,041 | ||||||
|
| |||||||
Net Assets - 100.0% | $ | 68,943,347 | ||||||
| CONTRACTS | UNREALIZED GAIN/ (LOSS) | |||||||
FUTURES CONTRACTS PURCHASED |
| |||||||
June 2012 S&P 500 Index | 362 | $ | 814,029 | |||||
| UNITS | ||||||||
EQUITY INDEX SWAP AGREEMENTS PURCHASED |
| |||||||
Credit Suisse First Boston May 2012 S&P 500 Index Swap, Terminating 05/30/2012 (Notional Market Value $42,325,248)**,b | 30,278 | $ | (167,745 | ) | ||||
Goldman Sachs International May 2012 S&P 500 Index Swap, Terminating 05/29/2012 (Notional Market Value $13,244,051)**,b | 9,474 | (19,617 | ) | |||||
|
| |||||||
(Total Notional Market Value $55,569,299) | $ | (187,362 | ) | |||||
|
| |||||||
| * | Non-Income Producing Security. |
| ** | Price return based on S&P 500 Index +/- financing at a variable rate. |
| a | Amount represents less than 0.05% of net assets. |
| b | Values determined based on Level 2 inputs. |
| c | Unless otherwise indicated, the values of the Portfolio are determined based on Level 1 inputs. |
| FNMA — Federal National Mortgage Association |
| REIT — Real Estate Investment Trust |
| See Notes to Financial Statements. | GUGGENHEIM ETFS SEMI-ANNUAL REPORT | 13 |
Table of Contents
| SCHEDULE OF INVESTMENTS (Unaudited) | April 30, 2012 |
GUGGENHEIM INVERSE 2x S&P 500 ETF
| FACE AMOUNT | MARKET VALUE | |||||||
REPURCHASE AGREEMENTS - 75.4% |
| |||||||
State Street Bank & Trust Co., 0.010%, dated 04/30/12, to be repurchased at $28,780,008 on 05/01/12 collateralized by $26,040,000 FNMA at 4.375% due 10/15/15 with a value of $29,360,100a | $ | 28,780,000 | $ | 28,780,000 | ||||
|
| |||||||
Total Repurchase Agreements | 28,780,000 | |||||||
|
| |||||||
Total Investments - 75.4%b |
| 28,780,000 | ||||||
|
| |||||||
Other Assets and Liabilities, net - 24.6% |
| 9,403,465 | ||||||
|
| |||||||
Net Assets - 100.0% | $ | 38,183,465 | ||||||
| CONTRACTS | UNREALIZED GAIN (LOSS) | |||||||
FUTURES CONTRACTS SOLD SHORT |
| |||||||
June 2012 S&P 500 Index E-Mini Futures Contracts (Aggregate Market Value of Contracts $21,228,000)b | 305 | $ | (649,847 | ) | ||||
| UNITS | ||||||||
EQUITY INDEX SWAP AGREEMENTS SOLD SHORT |
| |||||||
Credit Suisse First Boston May 2012 S&P 500 Index Swap, Terminating 05/30/2012 (Notional Market Value $46,587,210)*,a | 33,326 | $ | 177,735 | |||||
Goldman Sachs International May 2012 S&P 500 Index Swap, Terminating 05/29/2012 (Notional Market Value $8,545,452)*,a | 6,113 | 12,657 | ||||||
|
| |||||||
(Total Notional Market Value $55,132,662) | $ | 190,392 | ||||||
|
| |||||||
| * | Price return based on S&P 500 Index +/- financing at a variable rate. |
| a | Values determined based on Level 2 inputs. |
| b | Unless otherwise indicated, the values of the Portfolio are determined based on Level 1 inputs. |
| FNMA — Federal National Mortgage Association |
| 14 | GUGGENHEIM ETFS SEMI-ANNUAL REPORT | See Notes to Financial Statements. |
Table of Contents
| STATEMENT OF ASSETS AND LIABILITIES (Unaudited) | April 30, 2012 |
| Guggenheim 2x S&P 500 ETF | Guggenheim Inverse 2x S&P 500 ETF | |||||||
ASSETS | ||||||||
Investments at market value | $ | 56,953,306 | $ | — | ||||
Repurchase agreements | 3,032,000 | 28,780,000 | ||||||
Total investments* | 59,985,306 | 28,780,000 | ||||||
Cash | 456 | 49 | ||||||
Segregated cash for swaps | 7,970,972 | 8,069,862 | ||||||
Margin deposit for future contracts | 1,267,000 | 1,067,500 | ||||||
Unrealized appreciation on swap agreements | — | 190,392 | ||||||
Receivables: | ||||||||
Investments sold | 5,735 | — | ||||||
Dividends and interest | 57,541 | 8 | ||||||
Variation margin on futures contracts | — | 99,125 | ||||||
Equity index swap settlement | 1,013 | — | ||||||
Total assets | 69,288,023 | 38,206,936 | ||||||
LIABILITIES | ||||||||
Unrealized depreciation on swap agreements | 187,362 | — | ||||||
Payables: | ||||||||
Equity index swap settlement | — | 1,214 | ||||||
Variation margin on futures contracts | 117,650 | — | ||||||
Accrued management fees | 39,664 | 22,257 | ||||||
Total liabilities | 344,676 | 23,471 | ||||||
NET ASSETS | $ | 68,943,347 | $ | 38,183,465 | ||||
NETASSETSCONSISTOF: | ||||||||
Paid-in capital | $ | 46,957,387 | $ | 168,189,857 | ||||
Undistributed (distributions in excess) of net investment income | 17,790 | (160,155 | ) | |||||
Accumulated net realized gain (loss) on investment securities, futures and swaps | 7,813,131 | (129,386,782 | ) | |||||
Net unrealized appreciation (depreciation) on investment securities, futures and swaps | 14,155,039 | (459,455 | ) | |||||
NETASSETS | $ | 68,943,347 | $ | 38,183,465 | ||||
Shares outstanding (unlimited shares authorized), no par value | 1,400,002 | 1,550,000 | ||||||
Net asset value, offering price and repurchase price per share | $49.25 | $24.63 | ||||||
*Total cost of investments | $46,456,934 | $28,780,000 | ||||||
| See Notes to Financial Statements. | GUGGENHEIM ETFS SEMI-ANNUAL REPORT | 15 |
Table of Contents
| STATEMENT OF OPERATIONS (Unaudited) |
For the Six Months Ended April 30, 2012
| Guggenheim 2x S&P 500 ETF | Guggenheim Inverse 2x S&P 500 ETF | |||||||
INVESTMENT INCOME | ||||||||
Dividends, net of foreign taxes withheld | $ | 674,055 | $ | — | ||||
Interest | 217 | 2,128 | ||||||
Total income | 674,272 | 2,128 | ||||||
EXPENSES | ||||||||
Management fee | 257,941 | 159,571 | ||||||
Trustee fees | 3,003 | 2,712 | ||||||
Total expenses | 260,944 | 162,283 | ||||||
Net investment income (loss) | 413,328 | (160,155 | ) | |||||
REALIZEDAND UNREALIZED GAIN (LOSS)ON INVESTMENTS | ||||||||
Net realized gain (loss) from: | ||||||||
Investments | (324,502 | ) | — | |||||
In-kind redemptions | 7,432,038 | — | ||||||
Futures contracts | 3,769,609 | (2,773,812 | ) | |||||
Swap contracts | 6,655,670 | (9,501,092 | ) | |||||
Net realized gain (loss) | 17,532,815 | (12,274,904 | ) | |||||
Net change in unrealized appreciation (depreciation) on: | ||||||||
Investment securities | (492,338 | ) | — | |||||
Futures contracts | (641,924 | ) | 643,220 | |||||
Swap contracts | 343,653 | (1,079,198 | ) | |||||
Net change in unrealized (depreciation) | (790,609 | ) | (435,978 | ) | ||||
Net realized and unrealized gain (loss) on investments, futures and swap contracts | 16,742,206 | (12,710,882 | ) | |||||
Net increase (decrease) in net assets resulting from operations | $ | 17,155,534 | $ | (12,871,037 | ) | |||
Foreign taxes withheld | $ | (21 | ) | $ | — | |||
| 16 | GUGGENHEIM ETFS SEMI-ANNUAL REPORT | See Notes to Financial Statements. |
Table of Contents
STATEMENTS OF CHANGES IN NET ASSETS
| Guggenheim 2x S&P 500 ETF | Guggenheim Inverse 2x S&P 500 ETF | |||||||||||||||
| Six Months Ended April 30, 2012 (Unaudited) | Year Ended October 31, 2011 | Six Months Ended April 30, 2012 (Unaudited) | Year Ended October 31, 2011 | |||||||||||||
OPERATIONS | ||||||||||||||||
Net investment income (loss) | $ | 413,328 | $ | 832,050 | $ | (160,155 | ) | $ | (414,624 | ) | ||||||
Net realized gain (loss) | 17,532,815 | 7,271,159 | (12,274,904 | ) | (21,831,711 | ) | ||||||||||
Net change in unrealized appreciation (depreciation) | (790,609 | ) | 1,517,229 | (435,978 | ) | 1,679,620 | ||||||||||
Net increase (decrease) in net assets resulting from operations | 17,155,534 | 9,620,438 | (12,871,037 | ) | (20,566,715 | ) | ||||||||||
DISTRIBUTIONSTO SHAREHOLDERSFROM: | ||||||||||||||||
Net investment income | (397,864 | ) | (849,031 | ) | — | — | ||||||||||
SHAREHOLDERTRANSACTIONS | ||||||||||||||||
Proceeds from shares purchased | — | 2,087,505 | 2,590,440 | 22,017,345 | ||||||||||||
Value of shares redeemed | (27,201,702 | ) | (11,417,222 | ) | (7,337,448 | ) | (29,862,599 | ) | ||||||||
Net decrease in net assets resulting from share transactions | (27,201,702 | ) | (9,329,717 | ) | (4,747,008 | ) | (7,845,254 | ) | ||||||||
Decrease in net assets | (10,444,032 | ) | (558,310 | ) | (17,618,045 | ) | (28,411,969 | ) | ||||||||
NETASSETS | ||||||||||||||||
Beginning of period | 79,387,379 | 79,945,689 | 55,801,510 | 84,213,479 | ||||||||||||
End of period1 | $ | 68,943,347 | $ | 79,387,379 | $ | 38,183,465 | $ | 55,801,510 | ||||||||
1 Including undistributed (distributions in excess) of net investment income | $ | 17,790 | $ | 2,326 | $ | (160,155 | ) | $ | — | |||||||
CHANGESINSHARESOUTSTANDING: | ||||||||||||||||
Shares purchased | — | 50,000 | 100,000 | 600,000 | ||||||||||||
Shares redeemed | (600,000 | ) | (250,000 | ) | (250,000 | ) | (800,000 | ) | ||||||||
Shares outstanding, beginning of period | 2,000,002 | 2,200,002 | 1,700,000 | 1,900,000 | ||||||||||||
Shares outstanding, end of period | 1,400,002 | 2,000,002 | 1,550,000 | 1,700,000 | ||||||||||||
| See Notes to Financial Statements. | GUGGENHEIM ETFS SEMI-ANNUAL REPORT | 17 |
Table of Contents
GUGGENHEIM 2x S&P 500 ETF
| Six Months Ended April 30, 2012 (Unaudited) | Year Ended October 31, 2011 | Year Ended October 31, 2010 | Year Ended October 31, 2009 | Year Ended October 31, 2008* | ||||||||||||||||
Per Share Operating Performance: | ||||||||||||||||||||
Net asset value at beginning of period | $39.69 | $36.34 | $28.22 | $27.65 | $75.00 | |||||||||||||||
Net investment income** | 0.24 | 0.41 | 0.33 | 0.31 | 0.61 | |||||||||||||||
Net realized and unrealized gain (loss) on investments | 9.55 | 3.36 | 8.13 | 0.57 | (47.27 | ) | ||||||||||||||
|
|
|
|
|
|
|
|
|
| |||||||||||
Total from investment operations | 9.79 | 3.77 | 8.46 | 0.88 | (46.66 | ) | ||||||||||||||
Distributions to shareholders from: | ||||||||||||||||||||
Net investment income | (0.23 | ) | (0.42 | ) | (0.34 | ) | (0.31 | ) | (0.69 | ) | ||||||||||
Net asset value at end of period | $49.25 | $39.69 | $36.34 | $28.22 | $27.65 | |||||||||||||||
|
|
|
|
|
|
|
|
|
| |||||||||||
Total Return*** | 24.71% | 10.36% | 30.12% | 3.51% | (62.68% | ) | ||||||||||||||
Ratios/Supplemental Data: | ||||||||||||||||||||
Net assets at end of period (000’s omitted) | $68,943 | $79,387 | $79,946 | $117,126 | $113,364 | |||||||||||||||
Ratio to average net assets of: | ||||||||||||||||||||
Expenses | 0.71% | **** | 0.71% | 0.71% | 0.70% | 0.70% | **** | |||||||||||||
Net investment income | 1.12% | **** | 0.98% | 1.01% | 1.43% | 1.35% | **** | |||||||||||||
Portfolio turnover rate† | 6% | 41% | 23% | 69% | 44% | |||||||||||||||
| * | The Fund commenced operations on November 5, 2007. |
| ** | Based on average shares outstanding. |
| *** | Total investment return is calculated assuming an initial investment made at the net asset value at the beginning of the period, reinvestment of all dividends and distribution at net asset value during the period, and redemption on the last day of the period. Transaction fees are not reflected in the calculation of total investment return. Total investment return calculated for a period of less than one year is not annualized. |
| **** | Annualized. |
| † | Portfolio turnover rate is calculated without regard to instruments having a maturity of less than one year from acquisition or derivative instruments (including swap agreements and futures contracts). |
| 18 | GUGGENHEIM ETFS SEMI-ANNUAL REPORT | See Notes to Financial Statements. |
Table of Contents
GUGGENHEIM INVERSE 2x S&P 500 ETF
FINANCIAL HIGHLIGHTS (concluded)
| Six Months Ended April 30, 2012 (Unaudited) | Year Ended October 31, 2011 | Year Ended October 31, 2010 | Year Ended October 31, 2009 | Year Ended October 31, 2008* | ||||||||||||||||
Per Share Operating Performance: | ||||||||||||||||||||
Net asset value at beginning of period | $32.82 | $44.32 | $66.76 | $132.21 | $75.00 | |||||||||||||||
Net investment income (loss)** | (0.10 | ) | (0.25 | ) | (0.35 | ) | (0.61 | ) | 1.04 | |||||||||||
Net realized and unrealized gain (loss) on investments | (8.09 | ) | (11.25 | ) | (22.09 | ) | (46.79 | ) | 57.20 | |||||||||||
|
|
|
|
|
|
|
|
|
| |||||||||||
Total from investment operations | (8.19 | ) | (11.50 | ) | (22.44 | ) | (47.40 | ) | 58.24 | |||||||||||
Distributions to shareholders from: | ||||||||||||||||||||
Net investment income | — | — | — | — | (1.03 | ) | ||||||||||||||
Net realized gains | — | — | — | (18.05 | ) | — | ||||||||||||||
|
|
|
|
|
|
|
|
|
| |||||||||||
Total distributions | — | — | — | (18.05 | ) | (1.03 | ) | |||||||||||||
Net asset value at end of period | $24.63 | $32.82 | $44.32 | $66.76 | $132.21 | |||||||||||||||
|
|
|
|
|
|
|
|
|
| |||||||||||
Total Return*** | (24.95% | ) | (25.94% | ) | (33.61% | ) | (41.45% | ) | 78.27% | |||||||||||
Ratios/Supplemental Data: | ||||||||||||||||||||
Net assets at end of period (000’s omitted) | $38,183 | $55,802 | $84,213 | $103,474 | $66,106 | |||||||||||||||
Ratio to average net assets of: | ||||||||||||||||||||
Expenses | 0.71% | **** | 0.71% | 0.71% | 0.71% | 0.71% | **** | |||||||||||||
Net investment income | (0.70% | )**** | (0.68% | ) | (0.65% | ) | (0.64% | ) | 1.09% | **** | ||||||||||
Portfolio turnover rate† | —% | —% | —% | —% | —% | |||||||||||||||
| * | The Fund commenced operations on November 5, 2007. |
| ** | Based on average shares outstanding. |
| *** | Total investment return is calculated assuming an initial investment made at the net asset value at the beginning of the period, reinvestment of all dividends and distribution at net asset value during the period, and redemption on the last day of the period. Transaction fees are not reflected in the calculation of total investment return. Total investment return calculated for a period of less than one year is not annualized. |
| **** | Annualized. |
| † | Portfolio turnover rate is calculated without regard to instruments having a maturity of less than one year from acquisition or derivative instruments (including swap agreements and futures contracts). |
| See Notes to Financial Statements. | GUGGENHEIM ETFS SEMI-ANNUAL REPORT | 19 |
Table of Contents
NOTES TO FINANCIAL STATEMENTS (Unaudited)
|
1. Organization
Rydex ETF Trust (the “Trust”) is an open-end, management investment company registered under the Investment Company Act of 1940 (the “1940 Act”). The Trust was organized as a Delaware statutory trust on November 22, 2002. As of April 30, 2012, the Trust offers twenty-six portfolios, each of which represents a separate series of beneficial interest in the Trust (each a “Fund”, and collectively, the “Funds”). The financial statements herein relate to the following Funds: Guggenheim 2x S&P 500 ETF and Guggenheim Inverse 2x S&P 500 ETF. Guggenheim 2x S&P 500 ETF and Guggenheim Inverse 2x S&P 500 ETF commenced operations on November 5, 2007.
The Funds’ investment objective is to replicate as closely as possible, before fees and expenses, the daily performance of an index representing publicly traded equity securities (the “Underlying Index”). The Funds’ investment objective is to provide investment results that match the performance of a specific benchmark, before fees and expenses, on a daily basis. For Guggenheim 2x S&P 500 ETF (a “Leveraged Fund”), the Fund’s benchmark is 200% of the daily performance of an index representing publicly traded securities (the “Underlying Index”). For Guggenheim Inverse 2x S&P 500 ETF (a “Leveraged Inverse Fund”), the Fund’s benchmark is 200% of the daily inverse (opposite) performance of its Underlying Index. The Underlying Index for Guggenheim 2x S&P 500 ETF and Guggenheim Inverse 2x S&P 500 ETF is the S&P 500 Index.
The Funds operate as index funds and are not actively managed. Adverse performance of a security in the Funds’ portfolio will ordinarily not result in the elimination of the security from the Funds’ portfolio.
The Funds issue and redeem shares on a continuous basis, at Net Asset Value per share (“NAV”), only in aggregation of 50,000 shares called a “Creation Unit”. Creation Units are issued and redeemed principally in-kind for securities included in the Underlying Index.
Guggenheim Investments (“GI”) provides advisory services and Rydex Distributors, LLC (“RDL”) acts as principal underwriter for the Trust. GI and RDL are affiliated entities.
2. Significant Accounting Policies
The following significant accounting policies are in conformity with U.S. generally accepted accounting principles (“U.S. GAAP”) and are consistently followed by the Trust. This requires management to make estimates and assumptions that affect the reported amount of assets and liabilities and disclosure of contingent assets and liabilities at the date of the financial statements and the reported amounts of revenues and expenses during the reporting period. Actual results could differ from these estimates. All time references are based on Eastern Time.
A. Security Valuation
Equity securities listed on an exchange (New York Stock Exchange (“NYSE”) or American Stock Exchange) are valued at the last quoted sales price as of the close of business on the NYSE on the valuation date. Equity securities listed on the NASDAQ market system are valued at the NASDAQ Official Closing Price on the valuation date.
Investments for which market quotations are not readily available are fair valued as determined in good faith by GI under the direction of the Board of Trustees using methods established or ratified by the Board of Trustees. These methods include, but are not limited to: (i) using general information as to how these securities and assets trade; (ii) in connection with futures contracts and options thereupon, and other derivative investments, information as to how (a) these contracts and other derivative investments trade in the futures or other derivative markets, respectively, and (b) the securities underlying these contracts and other derivative investments trade in the cash market; and (iii) other information and considerations, including current values in related markets.
The value of futures contracts purchased and sold by the Funds are accounted for using the unrealized gain or loss on the contracts that is determined by marking the contracts to their current realized settlement prices. Financial futures contracts are valued at the 4:00 p.m. price on the valuation date. In the event that the exchange for a specific futures contract closes earlier than 4:00 p.m., the futures contract is valued at the Official Settlement Price of the exchange. However, the underlying securities from which the futures contract value is derived are monitored until 4:00 p.m. to determine if fair valuation would provide a more accurate valuation.
The value of swap agreements entered into by a Fund is accounted for using the unrealized gain or loss on the agreements that is determined by marking the agreements to the last quoted value of the index that the swap pertains to at the close the NYSE. The swap’s market value is then adjusted to include dividends accrued, financing charges and/or interest associated with the swap agreements.
Debt securities with a maturity of greater than 60 days at acquisition are valued at prices that reflect broker/dealer-supplied valuations or obtained from independent pricing services, which may consider the trade activity, treasury yields, yield or price of bonds of comparable quality, coupon, maturity, and type, as well as prices quoted by dealers who make markets in such securities. Short-term debt securities, with a maturity of 60 days or less at acquisition and repurchase agreements, are valued at amortized cost which approximates market value.
| 20 | GUGGENHEIM ETFS SEMI-ANNUAL REPORT |
Table of Contents
| NOTES TO FINANCIAL STATEMENTS (Unaudited) (continued) |
Certain U.S. Government and Agency Obligations are traded on a discount basis; the interest rates shown on the Schedules of Investments reflect the effective rates paid at the time of purchase by the Funds. Other securities bear interest at the rates shown, payable at fixed dates through maturity.
B. Security Transactions and Income Recognition
Security transactions are recorded on the trade date for financial reporting purposes. Realized gains and losses from securities transactions are recorded using the identified cost basis. Proceeds from lawsuits related to investment holdings are recorded as realized gains. Dividend income is recorded on the ex-dividend date, net of applicable taxes withheld by foreign countries. Taxable non-cash dividends are recorded as dividend income. Interest income, including amortization of premiums and accretion of discount, is accrued on a daily basis. Distributions received from investments in REITs are recorded as dividend income on the ex-dividend date, subject to reclassification upon notice of the character of such distribution by the issuer.
C. Repurchase Agreements
The Funds may enter into repurchase agreements with financial institutions. In a repurchase agreement, a Fund buys a security and the seller simultaneously agrees to repurchase the security on a specified future date at an agreed-upon price. The repurchase price reflects an agreed-upon interest rate during the time the Fund’s money is invested in the security. Because the security constitutes collateral for the repurchase obligation, a repurchase agreement can be considered a collateralized loan. The Funds follow certain procedures designed to minimize the risks inherent in such agreements. These procedures include effecting repurchase transactions only with large, well-capitalized and well-established financial institutions whose condition will be continually monitored by GI. In addition, the value of the collateral underlying the repurchase agreement will always be at least equal to the repurchase price, including any accrued interest earned on the repurchase agreement. In the event of a default or bankruptcy by a selling financial institution, the Funds will seek to liquidate such collateral. However, the exercising of the Funds right to liquidate such collateral could involve certain costs or delays and, to the extent that proceeds from any sale upon a default of the obligation to repurchase were less than the repurchase price, the Funds could suffer a loss. It is the current policy of the Funds not to invest in repurchase agreements that do not mature within seven days if any such investment, together with any other illiquid assets held by the Funds, amounts to more than 15% of the Funds net assets. The investments of the Funds in repurchase agreements, at times, may be substantial when, in the view of GI, liquidity or other considerations so warrant. For the period
ended April 30, 2012, the Funds had not engaged in repurchase agreement transactions.
D. Futures Contracts
Upon entering into a contract, a Fund deposits and maintains as collateral such initial margin as required by the exchange on which the transaction is effected. Pursuant to the contract, the Fund agrees to receive from or pay to the broker an amount of cash equal to the daily fluctuation in value of the contract. Such receipts or payments are known as variation margin and are recorded by the Fund as unrealized gains or losses. When the contract is closed, the Fund records a realized gain or loss equal to the difference between the value of the contract at the time it was opened and the value at the time it was closed.
E. Swap Agreements
The swap agreements are marked-to-market daily and the change, if any, is recorded as unrealized gain or loss. Payments received or made as a result of an agreement or termination of the agreement are recognized as realized gains or losses.
F. Federal Income Taxes
The Funds intend to comply with the provisions of Subchapter M of the Internal Revenue Code applicable to regulated investment companies and will distribute substantially all taxable net investment income and capital gains sufficient to relieve the Funds from all, or substantially all, federal income, excise and state income taxes. Therefore, no provision for Federal or state income tax is required.
Tax positions taken or expected to be taken in the course of preparing the Funds’ tax returns are evaluated to determine whether the tax positions are “more-likely-than-not” of being sustained by the applicable tax authority. Tax positions not deemed to meet the more-likely-than-not threshold would be recorded as a tax benefit or expense in the current year. Management has analyzed the Funds’ tax positions taken, or to be taken, on Federal income tax returns for all open tax years (fiscal years 2008 – 2011), and has concluded that no provision for income tax was required in the Funds’ financial statements.
The RIC Modernization Act of 2010 was signed into law on December 22, 2010 and seeks to simplify some of the tax provisions applicable to regulated investment companies and the tax reporting to their shareholders, and to improve the tax efficiency of certain fund structures. The changes are generally effective for taxable years beginning after the date of enactment.
| GUGGENHEIM ETFS SEMI-ANNUAL REPORT | 21 |
Table of Contents
NOTES TO FINANCIAL STATEMENTS (Unaudited) (continued)
|
One of the more prominent changes addresses capital loss carryforwards. Funds will be permitted to carry forward capital losses incurred in taxable years beginning after December 22, 2010 for an unlimited period. However, any losses incurred during those future taxable years will be required to be utilized prior to the losses incurred in pre-enactment taxable years. Under pre-enactment law, capital losses could be carried forward for eight years, and carried forward as short-term capital, irrespective of the character of the original loss. As a result of this ordering rule, pre-enactment capital loss carryforwards may potentially expire unused. Additionally, post-enactment capital losses that are carried forward will retain their character as either short-term or long-term capital losses rather than being considered all short-term as under previous law.
For the period ended April 30, 2012, the Funds realized net capital gains resulting from in-kind redemptions and other transactions. Because gains from in-kind redemptions are non-taxable to the Funds, and are not distributed to existing Fund shareholders, the gains are reclassified from accumulated net realized gains to paid-in-capital at the end of the Funds’ tax year. These reclassifications have no effect on net assets or NAV. The in-kind net capital gains for the period ended April 30, 2012 are disclosed in the Fund’s Statement of Operations.
At April 30, 2012, the identified cost of investments in securities owned by each Fund for Federal income tax purposes and the gross unrealized appreciation and depreciation were as follows:
| Identified Cost | Gross Unrealized Appreciation | Gross Unrealized Depreciation | Net Unrealized Appreciation (Depreciation) | |||||||||||||
Guggenheim 2x S&P 500 ETF | $ | 46,456,934 | $ | 14,371,452 | $ | (843,080 | ) | $ | 13,528,372 | |||||||
Guggenheim Inverse 2x S&P 500 ETF | 28,780,000 | — | — | — | ||||||||||||
G. Fair Value Measurement
In accordance with U.S. GAAP, fair value is defined as the price that the Fund would receive to sell an investment or pay to transfer a liability in an orderly transaction with an independent buyer in the principal market, or, in the absence of a principal market, the most advantageous market for the investment or liability. A three-tier hierarchy is utilized to distinguish between (1) inputs that reflect the assumptions market participants would use in pricing an asset or liability developed based on market data obtained from sources independent of the reporting entity (observable inputs) and (2) inputs that reflect the reporting entity’s own assumptions about the assumptions market participants would use in pricing an asset or liability developed based on the best information available in the circumstances (unobservable inputs) and to establish classification of fair value measurements for disclosure purposes. Various inputs are used in determining the value of the Funds’ investments. The inputs are summarized in the three broad levels listed below:
Level 1 — quoted prices in active markets for identical securities.
Level 2 — other significant observable inputs (including quoted prices for similar securities, interest rates, prepayment speeds, credit risk, etc.).
Level 3 — significant unobservable inputs (including the fund’s own assumptions used to determine the fair value of investments).
The inputs or methodologies used for valuing securities are not necessarily an indication of the risk associated with investing in those securities.
The following table summarizes the inputs used to value the Funds’ net assets as of April 30, 2012:
| Fund | Level 1 Investments in Securities | Level 1 Other Financial Instruments | Level 2 Investments in Securities | Level 2 Other Financial Instruments | Level 3 Investments in Securities | Total | ||||||||||||||||||
Assets | ||||||||||||||||||||||||
Guggenheim 2x S&P 500 ETF | $ | 56,953,306 | $ | 814,029 | $ | 3,032,000 | $ | — | $ | — | $ | 60,799,335 | ||||||||||||
Guggenheim Inverse 2x S&P 500 ETF | — | — | 28,780,000 | 190,392 | — | 28,970,392 | ||||||||||||||||||
Liabilities | ||||||||||||||||||||||||
Guggenheim 2x S&P 500 ETF | — | — | — | 187,362 | — | 187,362 | ||||||||||||||||||
Guggenheim Inverse 2x S&P 500 ETF | — | 649,847 | — | — | — | 649,847 | ||||||||||||||||||
For the period ended April 30, 2012, there were no securities transferred between any levels.
H. Dividends and Distributions
Distributions of net investment income and net realized gains, if any, in the Funds are declared at least annually and recorded on the ex-dividend date and are determined in accordance with income tax regulations which may differ from U.S. GAAP.
| 22 | GUGGENHEIM ETFS SEMI-ANNUAL REPORT |
Table of Contents
| NOTES TO FINANCIAL STATEMENTS (Unaudited) (continued) |
I. Risk and Uncertainties
The Funds invest in various investments which are exposed to risk, such as market risk. Due to the level of risk associated with certain investments it is at least reasonably possible that changes in the values of investment securities will occur in the near term and that such changes could materially affect amounts reported in the financial statements. The risk inherent in the use of futures and options contracts, and swap agreements, include i) adverse changes in the value of such instruments; ii) imperfect correlation between the price of the instruments and movements in the price of the underlying securities, indices, or futures contracts; iii) the possible absence of a liquid secondary market for any particular instrument at any time; and iv) the potential of counterparty default. The Funds have established strict counterparty credit guidelines and enter into transactions only with financial institutions of investment grade or better. The Trust monitors the counterparty credit risk.
J. Risk Disclosure
Throughout the normal course of business, the Funds enter into contracts that contain a variety of representations and warranties which provide general indemnifications. The Funds’ maximum exposure under these arrangements is unknown, as this would involve future claims that may be made against the Funds and/or their affiliates that have not yet occurred. However, based on experience the Funds expect the risk of loss to be remote.
Financial Instruments
A futures contract is an agreement to purchase (long) or sell (short) an agreed amount of securities or other instruments at a set price for delivery at a future date. There are significant risks associated with a Fund’s or an underlying fund’s use of futures contracts and related options, including (i) there may be an imperfect or no correlation between the changes in market value of the underlying asset and the prices of futures contracts; (ii) there may not be a liquid secondary market for a futures contract; (iii) trading restrictions or limitations may be imposed by an exchange; and (iv) government regulations may restrict trading in futures contracts. When investing in futures, there is minimal counterparty credit risk to the Fund because futures are exchange-traded and the exchange’s clearinghouse, as counterparty to all exchange-traded futures, guarantees against default.
A swap is an agreement that obligates two parties to exchange a series of cash flows at specified intervals based upon or calculated by reference to changes in specified prices or rates for a specified amount of an underlying asset. A credit default swap enables a Fund to buy or sell protection against a defined credit event of an issuer or a basket of securities. Generally, the seller of credit protection against an issuer or basket of securities receives a periodic payment from the buyer to compensate against potential default events. If a default event occurs, the seller must pay the buyer the full notional value of the reference obligation in exchange for the reference obligation. If no default occurs, the counterparty will pay the stream of payments and have no further obligations to the Fund selling the credit protection. A Fund bears the risk of loss of the amount expected to be received under a swap agreement in the event of the default or bankruptcy of a swap agreement counterparty, or in the case of a credit default swap in which the Fund is selling credit protection, the default of a third party issuer. Additionally, there is no guarantee that a Fund or an underlying fund could eliminate its exposure under an outstanding swap agreement by entering into an offsetting swap agreement with the same or another party.
In conjunction with the use of short sales, futures, and swap agreements, the Funds are required to maintain collateral in various forms. The Funds use, where appropriate, depending on the financial instrument utilized and the broker involved, margin deposits at the broker, cash and/or securities segregated at the custodian bank, discount notes, or the repurchase agreements allocated to each Fund.
Disclosures About Derivative Instruments and Hedging Activities
U.S. GAAP requires disclosures to enable investors to better understand how and why the Funds use derivative instruments, how these derivative instruments are accounted for and their effects on the Funds’ financial position and results of operations. None of the derivatives currently held by the Funds are being used as hedging instruments.
The Funds utilized derivatives for the following purposes:
| Fund | Index Exposure | |||
Guggenheim 2x S&P 500 ETF | X | |||
Guggenheim Inverse 2x S&P 500 ETF | X | |||
| GUGGENHEIM ETFS SEMI-ANNUAL REPORT | 23 |
Table of Contents
NOTES TO FINANCIAL STATEMENTS (Unaudited) (continued)
|
The following table represents the notional amount of derivative instruments outstanding, as an approximate percentage of the Funds’ net assets on a daily basis, while the risk to the Fund is limited to the profit earned on such derivatives.
| Approximate percentage of Fund’s net assets on a daily basis | ||||||||
| Fund | Long | Short | ||||||
Guggenheim 2x S&P 500 ETF | 115% | — | ||||||
Guggenheim Inverse 2x S&P 500 ETF | — | 200% | ||||||
The following is a summary of the location of derivative investments on the Funds’ Statements of Assets and Liabilities as of April 30, 2012:
| Location on the Statements of Assets and Liabilities | ||||
| Derivative Investment Type | Asset Derivatives | Liability Derivatives | ||
Equity Contracts | Unrealized appreciation on swap agreements | Unrealized depreciation on swap agreements | ||
| Variation margin | Variation margin | |||
The following table sets forth the fair value of the Funds’ derivative investments categorized by primary risk exposure at April 30, 2012:
| Asset Derivative Investments Value | ||||||||||||
| Portfolio | Total Value at April 30, 2012 | Swap Equity Contracts | Futures Equity Contracts* | |||||||||
Guggenheim 2x S&P 500 ETF | $ | 814,029 | $ | — | $ | 814,029 | ||||||
Guggenheim Inverse 2x S&P 500 ETF | 190,392 | 190,392 | — | |||||||||
| Liability Derivative Investments Value | ||||||||||||
| Portfolio | Total Value at April 30, 2012 | Swap Equity Contracts | Futures Equity Contracts* | |||||||||
Guggenheim 2x S&P 500 ETF | $ | 187,362 | $ | 187,362 | $ | — | ||||||
Guggenheim Inverse 2x S&P 500 ETF | 649,847 | — | 649,847 | |||||||||
| * | Includes cumulative appreciation (depreciation) of futures contracts as reported on the Schedule of Investments. Only current day’s variation margin is reported within the Statement of Assets and Liabilities. |
The following is a summary of the location of derivative investments on the Funds’ Statements of Operations for the period ended April 30, 2012:
| Derivative Investment Type | Location of Gain (Loss) on Derivatives | |
Equity Contracts | Net realized gain (loss) on swap contracts and futures contracts | |
| Net change in unrealized appreciation (depreciation) on swap contracts and futures contracts |
The following is a summary of the Funds’ realized gain (loss) and change in unrealized appreciation (depreciation) on derivative investments recognized on the Statements of Operations categorized by primary risk exposure for the period ended April 30, 2012:
| Realized Gain (Loss) on Derivative Investments Recognized in the Statement of Operations | ||||||||||||
| Portfolio | Total Value at October 31, 2011 | Swap Equity Contracts | Futures Equity Contracts | |||||||||
Guggenheim 2x S&P 500 ETF | $ | 10,425,279 | $ | 6,655,670 | $ | 3,769,609 | ||||||
Guggenheim Inverse 2x S&P 500 ETF | (12,274,904 | ) | (9,501,092 | ) | (2,773,812 | ) | ||||||
| Change in Unrealized Appreciation (Depreciation) on Derivative Investments Recognized in the Statement of Operations | ||||||||||||
| Portfolio | Total Value at October 31, 2011 | Swap Equity Contracts | Futures Equity Contracts | |||||||||
Guggenheim 2x S&P 500 ETF | $ | (298,271 | ) | $ | 343,653 | $ | (641,924 | ) | ||||
Guggenheim Inverse 2x S&P 500 ETF | (435,978 | ) | (1,079,198 | ) | 643,220 | |||||||
3. Advisory, Administration and Other Transactions with Affiliates
GI determines the composition of the portfolio of securities that must be delivered in exchange for the issuance of Creation Units and periodically adjusts the composition of the portfolio of the Funds to conform to changes in the composition of the relevant index. For
| 24 | GUGGENHEIM ETFS SEMI-ANNUAL REPORT |
Table of Contents
| NOTES TO FINANCIAL STATEMENTS (Unaudited) (continued) |
these services, GI receives a management fee at the annual rate shown below as a percentage of the average daily net assets of the Funds.
| Advisory Fee | ||||
Guggenheim 2x S&P 500 ETF | 0.70% | |||
Guggenheim Inverse 2x S&P 500 ETF | 0.70% | |||
GI pays all expenses of the Funds, including the cost of transfer agency, custody, fund administration, legal, audit and other services, except: interest, taxes, distribution fees or expenses and extraordinary expenses.
Under an Administration Agreement, State Street Bank and Trust Company (the “Administrator”) provides various administrative and accounting services for the maintenance and operations of the Funds. Under a Custodian Agreement with the Trust, the Administrator maintains cash, securities and other assets of the Funds in separate accounts for each Fund, keeps all necessary accounts and records, and provides other services. The Administrator is required, upon the order of the Trust, to deliver securities held by the Custodian and to make payments for securities purchased by the Trust for the Funds. Pursuant to a Transfer Agency and Service Agreement with the Trust, the Administrator acts as a transfer agent for the Trust’s authorized and issued shares of beneficial interest, and as dividend disbursing agent of the Trust. GI compensates the Administrator directly for the foregoing services.
The Funds have adopted a Distribution Plan (the “Plan”) that allows the Funds to pay distribution fees to RDL and other firms that provide distribution services (“Service Providers”). If a Service Provider provides distribution services, the Funds will pay distribution fees to RDL at an annual rate not to exceed 0.25% of average daily net assets, pursuant to Rule 12b-1 of the 1940 Act. RDL will, in turn, pay the Service Provider out of its fees. No such fee is currently charged to the Funds.
4. Capital
At April 30, 2012, there were an unlimited number of no par value shares of beneficial interest authorized. There is a minimum transaction fee per transaction to those persons purchasing or redeeming Creation Units. An additional charge of up to three times the standard transaction fee may be imposed for purchases and redemptions effected outside the National Securities Clearing Corporation usual clearing process or for cash. Such transactions are generally permitted on an in-kind basis, with a balancing cash component to equate the transaction to the NAV of the Fund on the transaction date. The minimum transaction fees are:
| Minimum Transaction Fee | ||||
Guggenheim 2x S&P 500 ETF | $ | 2,000 | ||
Guggenheim Inverse 2x S&P 500 ETF | 50 | |||
5. Investment Transactions
For the period ended April 30, 2012, the Funds had investment transactions in-kind associated with subscriptions and redemptions as follows:
| Subscriptions | Redemptions | |||||||
Guggenheim 2x S&P 500 ETF | $ | — | $ | 21,636,592 | ||||
Guggenheim Inverse 2x S&P 500 ETF | — | — | ||||||
Purchases and sales of investment securities (excluding short-term investments, U.S. government and government agency obligations) for the Funds were as follows:
| Purchases | Sales | |||||||
Guggenheim 2x S&P 500 ETF | $ | 10,842,697 | $ | 3,670,637 | ||||
Guggenheim Inverse 2x S&P 500 ETF | — | — | ||||||
6. Legal Proceedings
Tribune Company
Rydex ETF Trust has been named as a defendant and a putative member of the proposed defendant class of shareholders in the case entitled Official Committee of Unsecured Creditors of Tribune Co. v. FitzSimons (In re Tribune Co.), Adv. Pro. No. 10-54010 (Bankr. D. Del.), as a result of ownership of shares in the Tribune Company (“Tribune”) in 2007 by certain series of the Rydex ETF Trust when Tribune effected a leveraged buyout transaction (“LBO”) by which Tribune converted to a privately-held company. In its complaint, the Unsecured Creditors Committee (the “UCC”) has alleged that, in connection with the LBO, insiders and major shareholders were overpaid for their Tribune stock using financing that the insiders knew would, and ultimately did, leave the Tribune insolvent. The UCC has asserted claims against certain insiders, major shareholders, professional advisers, and others involved in the LBO, and is
| GUGGENHEIM ETFS SEMI-ANNUAL REPORT | 25 |
Table of Contents
NOTES TO FINANCIAL STATEMENTS (Unaudited) (concluded)
|
attempting to obtain from these individuals and entities the proceeds paid out in connection with the LBO. This adversary proceeding in the Bankruptcy Court has been stayed pending further order of the Bankruptcy Court.
In June 2011, a group of Tribune creditors, not including the UCC, filed multiple actions involving state law constructive fraudulent conveyance claims against former Tribune shareholders. Rydex ETF Trust also has been named as a defendant in one or more of these suits. These cases have been consolidated in a multidistrict litigation proceeding in the United States District Court for the Southern District of New York and have been stayed pending further order of that court or of the Bankruptcy Court.
None of these lawsuits allege any wrongdoing on the part of Rydex ETF Trust. The following series of Rydex ETF Trust held shares of Tribune and tendered these shares as part of Tribune’s LBO: Guggenheim 2x S&P 500 ETF (the “Fund”). The value of the proceeds received by the foregoing Funds was $1,699. At this stage of the proceedings, Rydex ETF Trust is not able to make a reliable predication as to the outcome of these lawsuits or the effect, if any, on the Fund’s net asset value.
| 26 | GUGGENHEIM ETFS SEMI-ANNUAL REPORT |
Table of Contents
| OTHER INFORMATION (Unaudited) |
Proxy Voting Information
A description of the policies and procedures that the Trust uses to determine how to vote proxies relating to securities held in the Funds’ portfolios is available, without charge and upon request, by calling 1.800.820.0888. This information is also available from the EDGAR database on the SEC’s website at http://www.sec.gov.
Information regarding how the Funds voted proxies relating to portfolio securities, during the most recent 12-month period ended June 30 is available, without charge, upon request, by calling 1.800.820.0888. The information is also available from the EDGAR database on the SEC’s website at http://www.sec.gov.
At a special meeting of shareholders held on January 26, 2012, the shareholders of the Funds voted on whether to approve a new investment advisory agreement between Rydex ETF Trust and Security Investors, LLC. A description of the number of shares voted is as follows:
| Fund | Shares For | Shares Against | Shares Abstained | |||||||||
Guggenheim 2x S&P 500 ETF | 720,797 | 23,279 | 31,489 | |||||||||
Guggenheim Inverse 2x S&P 500 ETF | 759,999 | 49,494 | 28,529 | |||||||||
At a special meeting of shareholders held on November 22, 2011, the shareholders of the Funds also voted on whether to approve the election of nominees to the Board of Trustees. A description of the number of shares voted is as follows:
| Donald C. Cacciapaglia | Corey A. Colehour | J. Kenneth Dalton | ||||||||||||||||||
For | 72,100,198 | For | 72,258,142 | For | 72,216,847 | |||||||||||||||
Withhold | 2,135,025 | Withhold | 1,977,081 | Withhold | 2,018,376 | |||||||||||||||
Total | 74,235,223 | Total | 74,235,223 | Total | 74,235,223 | |||||||||||||||
| John O. Demaret | Richard M. Goldman | Werner E. Keller | ||||||||||||||||||
For | 72,234,406 | For | 72,161,702 | For | 72,220,467 | |||||||||||||||
Withhold | 2,000,817 | Withhold | 2,073,521 | Withhold | 2,014,756 | |||||||||||||||
Total | 74,235,223 | Total | 74,235,223 | Total | 74,235,223 | |||||||||||||||
| Thomas F. Lydon | Patrick T. McCarville | Roger Somers | ||||||||||||||||||
For | 72,247,608 | For | 72,174,312 | For | 72,250,544 | |||||||||||||||
Withhold | 1,987,615 | Withhold | 2,060,911 | Withhold | 1,984,679 | |||||||||||||||
Total | 74,235,223 | Total | 74,235,223 | Total | 74,235,223 | |||||||||||||||
At a special meeting of shareholders held on January 26, 2012, the shareholders of the Funds also voted on whether to approve a “manager of managers” arrangement for each of the Funds. Although shareholder votes were placed, not enough votes were received to meet the minimum requirements to constitute a majority vote. As such, the matter was closed.
Quarterly Portfolio Schedules Information
The Trust files its complete schedule of portfolio holdings with the SEC for the first and third quarters of each fiscal year on Form N-Q; which are available on the SEC’s website at http://www.sec.gov. The Funds’ Forms N-Q may be reviewed and copied at the SEC’s Public Reference Room in Washington, DC, and that information on the operation of the Public Reference Room may be obtained by calling 1-800-SEC-0330. Copies of the portfolio holdings are also available to shareholders, without charge and upon request, by calling 1.800.820.0888.
Office Locations
The offices of Guggenheim Investments can be found in the following locations:
40 East 52nd Street
16th Floor
New York, NY 10022
(Headquarters)
Four Irvington Centre
805 King Farm Boulevard
Suite 600
Rockville, MD 20850
9401 Indian Creek Parkway
40 Corporate Woods
Suite 850
Overland Park, KS 66210
| GUGGENHEIM ETFS SEMI-ANNUAL REPORT | 27 |
Table of Contents
OTHER INFORMATION (Unaudited) (concluded)
Premium/Discount Information
Information about the differences between the daily market price on secondary markets for Shares and the NAV of each Fund can be found at www.guggenheimfunds.com.
Guggenheim Transaction
On September 20, 2011, Guggenheim Capital, LLC agreed to purchase the indirect holding company of Security Investors, LLC, the Fund’s investment manager (the “Investment Manager”) (the “Transaction”). Guggenheim Capital, LLC’s subsidiary, Guggenheim Partners, LLC (“Guggenheim”), is a global, independent, privately-held, diversified financial services firm with more than 1,500 dedicated professionals. The Transaction closed on February 29, 2012.
The Transaction should not result in material changes to the day-to-day management and operation of the Fund or any increase in fees.
In anticipation of the Transaction, the Board of Trustees of the Fund (the “Board”) called a special meeting of shareholders (the “Meeting”), at which shareholders of the Fund of record as of October 3, 2011 were asked to consider the approval of a new investment management agreement between the Fund and the Investment Manager (the “New Agreement”). This approval was necessary because, under the Investment Company Act of 1940 (the “1940 Act”), the Transaction could result in the termination of the Fund’s current investment management agreement with the Investment Manager (the “Current Agreement”). The Fund’s shareholders approved the New Agreement, the terms of which are substantially identical to the corresponding Current Agreement, except with respect to the date of execution.
Election of Board Members
The Board also approved a proposal to elect nine individuals to the Board. The Board proposed the election of the following nominees: Donald C. Cacciapaglia, Corey A. Colehour, J. Kenneth Dalton, John O. Demaret, Richard M. Goldman, Werner E. Keller, Thomas F. Lydon, Patrick T. McCarville and Roger Somers. Each of the nominees, other than Mr. Cacciapaglia, currently serves as a Trustee. In connection with the Transaction, the Board believes that expanding the Board to include Mr. Cacciapaglia, who is a member of senior management of Guggenheim’s investment management business, and who would serve on other boards in the Guggenheim Investments family of funds, would be appropriate. The Trusts’ shareholders ultimately approved the aforementioned proposal.
| 28 | GUGGENHEIM ETFS SEMI-ANNUAL REPORT |
Table of Contents
| INFORMATION ON BOARD OF TRUSTEES AND OFFICERS (Unaudited) |
A Board of Trustees oversees the Trust, as well as other trusts of GI, in which its members have no stated term of service, and continue to serve after election until resignation. The Statement of Additional Information includes further information about Fund Trustees and Officers, and can be obtained without charge by calling 800.820.0888.
All Trustees and Officers may be reached c/o Guggenheim Investments, 805 King Farm Boulevard, Suite 600, Rockville, MD 20850.
TRUSTEE AND OFFICER
Name, Position and | Length of Service | Number of | ||||||
Donald C. Cacciapaglia* | Rydex Series Funds – 2012 | 148 | ||||||
Trustee, President (1951) | Rydex Variable Trust – 2012 | |||||||
| Rydex Dynamic Funds – 2012 | ||||||||
| Rydex ETF Trust – 2012 |
Principal Occupations During Past Five Years: Security Investors, LLC: President and CEO from April 2012 to present; Guggenheim Investments: President and Chief Administrative Officer from February 2010 to present; Channel Capital Group, Inc.: Chairman and CEO from April 2002 to February 2010.
INDEPENDENT TRUSTEES
Name, Position and | Length of Service | Number of | ||||||
Corey A. Colehour | Rydex Series Funds – 1993 | 148 | ||||||
Trustee (1945) | Rydex Variable Trust – 1998 | |||||||
| Rydex Dynamic Funds – 1999 | ||||||||
| Rydex ETF Trust – 2003 |
Principal Occupations During Past Five Years: Retired; Member of the Audit, Governance and Nominating Committees (1995 to present)
J. Kenneth Dalton | Rydex Series Funds – 1995 | 148 | ||||||
Trustee (1941) | Rydex Variable Trust – 1998 | |||||||
| Rydex Dynamic Funds – 1999 | ||||||||
| Rydex ETF Trust – 2003 |
Principal Occupations During Past Five Years: Retired; Member of the Governance and Nominating Committees (1995 to present); Chairman of the Audit Committee (1997 to present); Member of the Risk Oversight Committee (2010 to present)
John O. Demaret | Rydex Series Funds – 1997 | 148 | ||||||
Trustee, Chairman of the | Rydex Variable Trust – 1998 | |||||||
Board (1941) | Rydex Dynamic Funds – 1999 | |||||||
| Rydex ETF Trust – 2003 |
Principal Occupations During Past Five Years: Retired; Member of the Audit Committee (1997 to present); Member of the Risk Oversight Committee (2010 to present)
Werner E. Keller | Rydex Series Funds – 2005 | 148 | ||||||
Trustee (1940) | Rydex Variable Trust – 2005 | |||||||
| Rydex Dynamic Funds – 2005 | ||||||||
| Rydex ETF Trust – 2005 |
Principal Occupations During Past Five Years: Founder and President of Keller Partners, LLC (registered investment adviser) (2005 to present); Member of the Audit, Governance and Nominating Committees (2005 to present); Chairman and Member of the Risk Oversight Committee (2010 to present)
| GUGGENHEIM ETFS SEMI-ANNUAL REPORT | 29 |
Table of Contents
| INFORMATION ON BOARD OF TRUSTEES AND OFFICERS (Unaudited) (continued) |
INDEPENDENT TRUSTEES – concluded
Name, Position and | Length of Service As Trustee (Year Began) | Number of | ||||||
Thomas F. Lydon, Jr. | Rydex Series Funds – 2005 | 148 | ||||||
Trustee (1960) | Rydex Variable Trust – 2005 | |||||||
| Rydex Dynamic Funds – 2005 | ||||||||
| Rydex ETF Trust – 2005 |
Principal Occupations During Past Five Years: President, Global Trends Investments (1996 to present); Member of the Audit, Governance and Nominating Committees (2005 to present)
Patrick T. McCarville | Rydex Series Funds – 1997 | 148 | ||||||
Trustee (1942) | Rydex Variable Trust – 1998 | |||||||
| Rydex Dynamic Funds – 1999 | ||||||||
| Rydex ETF Trust – 2003 |
Principal Occupations During Past Five Years: CEO, Par Industries, Inc., d/b/a Par Leasing (1977 to 2010); Chairman of the Governance and Nominating Committees (1997 to present); Member of the Audit Committee (1997 to present)
Roger Somers | Rydex Series Funds – 1993 | 148 | ||||||
Trustee (1944) | Rydex Variable Trust – 1998 | |||||||
| Rydex Dynamic Funds – 1999 | ||||||||
| Rydex ETF Trust – 2003 |
Principal Occupations During Past Five Years: Founder and CEO of Arrow Limousine (1965 to present); Member of the Audit, Governance and Nominating Committees (1995 to present)
EXECUTIVE OFFICERS
Name, Position and | Principal Occupations | |
Michael P. Byrum* Vice President (1970) | Current: President, Security Benefit Asset Management Holdings, LLC; Senior Vice President, Security Investors, LLC; President and Chief Investment Officer, Rydex Holdings, LLC; Director and Chairman of the Board, Advisor Research Center, Inc.; Manager, Rydex Specialized Products, LLC
Previous: Rydex Distributors, LLC (f/k/a Rydex Distributors, Inc.), Vice President (2009); Rydex Fund Services, LLC, Director (2009-2010), Secretary (2002- 2010), Executive Vice President (2002- 2006); Rydex Advisors, LLC (f/k/a PADCO Advisors, Inc.), Director (2008-2010), Chief Investment Officer (2006-2010), President (2004-2010), Secretary (2002-2010); Rydex Advisors II, LLC (f/k/a PADCO Advisors II, Inc.), Director (2008-2010), Chief Investment Officer (2006-2010), President (2004-2010), Secretary (2002-2010); Rydex Capital Partners, LLC, President and Secretary (2003-2007); Rydex Capital Partners II, LLC, (2003-2007); Rydex Holdings, LLC (f/k/a Rydex Holdings, Inc.), Secretary (2005-2008), Executive Vice President (2005-2006); Advisor Research Center, Inc., Secretary (2006-2009), Executive Vice President (2006); Rydex Specialized Products, LLC, Secretary (2005-2008) | |
Nikolaos Bonos* Vice President and Treasurer (1963) | Current: Senior Vice President, Security Investors, LLC; Chief Executive Officer and Manager, Rydex Specialized Products, LLC; Chief Executive Officer and President, Rydex Fund Services, LLC; Vice President, Rydex Holdings, LLC; Treasurer, SBL Fund; Security Equity Fund; Security Income Fund; Security Large Cap Value Fund and Security Mid Cap Growth Fund; Vice President, Security Benefit Asset Management Holdings, LLC
Previous: Guggenheim Investments, LLC, Senior Vice President (2010-2011); Rydex Advisors, LLC (f/k/a PADCO Advisors, Inc.) Senior Vice President (2006-2011); Rydex Fund Services, LLC (f/k/a Rydex Fund Services, Inc.), Director (2009), Senior Vice President (2003-2006); Rydex Specialized Products, LLC, Chief Financial Officer (2005-2009) | |
| 30 | GUGGENHEIM ETFS SEMI-ANNUAL REPORT |
Table of Contents
| INFORMATION ON BOARD OF TRUSTEES AND OFFICERS (Unaudited) (concluded) |
EXECUTIVE OFFICERS – concluded
Name, Position and | Principal Occupations | |
Elisabeth Miller* Chief Compliance Officer (1968) | Current: Chief Compliance Officer, Rydex Series Funds, Rydex Dynamic Funds, Rydex Variable Trust, Rydex ETF Trust, Security Equity Fund, Security Income Fund, Security Large Cap Value Fund, Security Mid Cap Growth Fund, SBL Fund, Security Investors, LLC, and Rydex Distributors, LLC
Previous: Senior Manager, Security Investors, LLC and Rydex Distributors, LLC (2004-2009). | |
Amy J. Lee* Vice President and Assistant Secretary (1960) | Current: Senior Vice President and Secretary, Security Investors, LLC; Secretary and Chief Compliance Officer, Security Distributors, Inc.; Vice President, Associate General Counsel and Assistant Secretary, Security Benefit Life Insurance Company and Security Benefit Corporation; Associate General Counsel, First Security Benefit Life Insurance and Annuity of New York; Vice President and Secretary, SBL Fund; Security Equity Fund; Security Income Fund; Security Large Cap Value Fund and Security Mid Cap Growth Fund; Vice President and Secretary, Rydex Holdings, LLC; Secretary, Advisor Research Center, Inc., Rydex Specialized Products, LLC, Rydex Distributors, LLC and Rydex Fund Services, LLC; Assistant Secretary, Security Benefit Clinic and Hospital
Previous: Guggenheim Investments, LLC, Senior Vice President and Secretary (2007- 2011); Rydex Advisors, LLC (f/k/a PADCO Advisors, Inc.) and Rydex Advisors II, LLC (f/k/a PADCO Advisors II, Inc.), Senior Vice President and Secretary (2010- 2011); Brecek and Young Advisors, Inc., Director (2004- 2008) | |
Joseph M. Arruda* Assistant Treasurer (1966) | Current: Assistant Treasurer, SBL Fund; Security Equity Fund; Security Income Fund; Security Large Cap Value Fund and Security Mid Cap Growth Fund; Vice President, Security Investors, LLC; Chief Financial Officer and Manager, Rydex Specialized Products, LLC
Previous: Guggenheim Investments, LLC, Vice President (2010-2011); Rydex Advisors, LLC (f/k/a PADCO Advisors, Inc.) and Rydex Advisors II, LLC (f/k/a PADCO Advisors II, Inc.), Vice President (2004-2011) | |
| * | Officers of the Funds are deemed to be “interested persons” of the Trust, within the meaning of Section 2(a) (19) of the 1940 Act, inasmuch as this person is affiliated with Guggenheim Investments. |
| GUGGENHEIM ETFS SEMI-ANNUAL REPORT | 31 |
Table of Contents

805 King Farm Boulevard, Suite 600
Rockville, MD 20850
www.rydex-sgi.com
800.820.0888
ETF3-SEMI-0412x1012
Table of Contents
Item 2. Code of Ethics.
Not applicable for a semiannual reporting period.
Item 3. Audit Committee Financial Expert.
Not applicable for a semiannual reporting period.
Item 4. Principal Accountant Fees and Services.
Not applicable for a semiannual reporting period.
Item 5. Audit Committee of Listed Registrants.
Not applicable for a semiannual reporting period.
Item 6. Schedule of Investments
Schedule of Investments is included as part of the report to shareholders filed under Item 1 of this form.
Item 7. Disclosure of Proxy Voting Policies and Procedures for Closed-End Management Investment Companies.
Not applicable.
Item 8. Portfolio Managers of Closed-End Management Investment Companies.
Not applicable.
Item 9. Purchases of Equity Securities by Closed-End Management Investment Company and Affiliated Purchasers.
Not applicable.
Item 10. Submission of Matters to a Vote of Security Holders.
Not applicable.
Table of Contents
Item 11. Controls and Procedures.
(a) The registrant’s President (principal executive officer) and Treasurer (principal financial officer) have evaluated the registrant’s disclosure controls and procedures within 90 days of this filing and have concluded that the registrant’s disclosure controls and procedures were effective, as of that date, in ensuring that information required to be disclosed by the registrant in this Form N-CSR was recorded, processed, summarized, and reported timely.
(b) The registrant’s principal executive officer and principal financial officer are aware of no change in the registrant’s internal control over financial reporting that occurred during the registrant’s second fiscal quarter covered by this report that has materially affected, or is reasonably likely to materially affect, the registrant’s internal control over financial reporting.
Item 12. Exhibits.
(a)(2) Separate certifications by the President (principal executive officer) and Treasurer (principal financial officer) of the registrant as required by Rule 30a-2(a) under the Act (17 CFR 270.30a-2(a)) are attached.
(b) A certification by the registrant’s President (principal executive officer) and Treasurer (principal financial officer) as required by Rule 30a-2(b) under the Act (17 CFR 270.30a-2(b)) is attached.
Table of Contents
SIGNATURES
Pursuant to the requirements of the Securities Exchange Act of 1934 and the Investment Company Act of 1940, the registrant has duly caused this report to be signed on its behalf by the undersigned, thereunto duly authorized.
| (Registrant) Rydex ETF Trust | ||
| By (Signature and Title)* | /s/ Donald C. Cacciapaglia | |
| Donald C. Cacciapaglia, President | ||
| Date | July 9, 2012 | |
Pursuant to the requirements of the Securities Exchange Act of 1934 and the Investment Company Act of 1940, this report has been signed below by the following persons on behalf of the registrant and in the capacities and on the dates indicated.
| By (Signature and Title)* | /s/ Donald C. Cacciapaglia | |
| Donald C. Cacciapaglia, President | ||
| Date | July 9, 2012 | |
| By (Signature and Title)* | /s/ Nikolaos Bonos | |
| Nikolaos Bonos, Vice President and Treasurer | ||
| Date | July 9, 2012 | |
| * | Print the name and title of each signing officer under his or her signature. |