Table of Contents
Filed pursuant to Rule 424(b)(3)
Registration No. 333-106263
PROSPECTUS
WMC Finance (USA) Limited Offer to Exchange US$500,000,000 Guaranteed Notes due 2013 for US$500,000,000 Guaranteed Notes due 2013 |  | |||
Offer to Exchange US$200,000,000 Guaranteed Notes due 2033 for US$200,000,000 Guaranteed notes due 2033
The Notes are fully and unconditionally guaranteed by | ||||
WMC Resources Ltd WMC (Olympic Dam Corporation) Pty Ltd WMC Fertilizers Pty Ltd | ||||
WMC Finance (USA) Limited is offering to exchange up to US$500,000,000 of its new 5.125% Guaranteed Notes due 2013 and up to US$200,000,000 of its new 6.250% Guaranteed Notes due 2033 all of which have been registered under the U.S. Securities Act of 1933 and are referred to collectively as the New Notes for any and all of its outstanding 5.125% Guaranteed Notes due 2013 and 6.250% Guaranteed Notes due 2033, respectively, which were sold previously in private placements and which are referred to collectively as the Old Notes.
See “Risk Factors” beginning on page 16 for a discussion of material risks associated with the exchange offer, our business and the New Notes.
WMC Finance (USA) Limited will exchange New Notes for all Old Notes that are validly tendered and not withdrawn before expiration of the exchange offer relating to that series of Old Notes. You may withdraw tenders of Old Notes at any time prior to the expiration of the exchange offer relating to that series of Old Notes. The exchange procedure is more fully described in “The Exchange Offers—Procedures for Tendering” beginning on page 117.
The terms of the New Notes are identical in all material respects to those of the Old Notes, except that the transfer restrictions, registration rights and provisions for special interest applicable to the Old Notes do not apply to the New Notes. See “Description of the New Notes and Guarantees” beginning on page 126 for more details on the terms of the New Notes.
We will not receive any proceeds from the exchange offers.
There is no established trading market for the New Notes or the Old Notes. However, we have applied to list the New Notes on the Luxembourg Stock Exchange.
The exchange of Old Notes for New Notes should not be a taxable event for United States federal income tax purposes. See “Material Tax Consequences—United States Taxation” on page 149.
All broker-dealers must comply with the registration and prospectus delivery requirements of the Securities Act. See “Plan of Distribution” on page 154.
Neither the Securities and Exchange Commission nor any state securities commission has approved or disapproved of these securities, or passed upon the accuracy or adequacy of this prospectus. Any representation to the contrary is a criminal offense.
Prospectus dated June 26, 2003.
Table of Contents
Information in our exchange offer registration statement is available to holders of Notes without charge upon written or oral request. Please contact The Bank of New York, attention Mr. Santino Ginocchietti, at 101 Barclay Street, 7th Floor, East, New York, New York 10286, telephone (212) 815-6331, fax (212) 815-1915 to make a request. To obtain timely delivery, any request should be made no later than five business days prior to the date you need the information.
No dealer, salesperson or other person is authorized to give any information or to represent anything not contained in this prospectus. You must not rely on any unauthorized information or representations. This prospectus is an offer to sell only the notes offered hereby, but only under circumstances and in jurisdictions where it is lawful to do so. The information contained in this prospectus is current only as of its date.
| Page | ||
| 1 | ||
| 16 | ||
| 22 | ||
| 22 | ||
Where you can find more information about the WMC Resources Group | 22 | |
| 23 | ||
| 23 | ||
| 24 | ||
| 26 | ||
| 27 | ||
| 28 | ||
| 31 | ||
| 33 | ||
| 61 | ||
Qualitative and quantitative disclosures about the market risk | 84 | |
| 95 | ||
| 108 | ||
| 109 | ||
| 112 | ||
| 115 | ||
| 126 | ||
| 144 | ||
| 145 | ||
| 154 | ||
| 154 | ||
| 154 | ||
| 155 | ||
| 158 | ||
| 159 | ||
Table of Contents
In this prospectus, the terms “we”, “our”, “us”, “WMC Resources” and “WMC Resources Group” refer to WMC Resources Ltd together with its subsidiaries (including the issuer). We refer to WMC Finance (USA) Limited as “WMC Finance (USA)” or the “issuer”. We also refer to WMC Resources Ltd as the “parent guarantor” and to WMC (Olympic Dam Corporation) Pty Ltd and WMC Fertilizers Pty Ltd as the subsidiary guarantors. We refer to the parent guarantor and the subsidiary guarantors collectively as the “guarantors”.
In this prospectus, we rely on and refer to information and statistics regarding our industry. We obtained these market data from independent industry publications or other publicly available information. Although we believe that these sources are reliable, we have not independently verified and do not guarantee the accuracy and completeness of this information.
This prospectus contains summaries believed to be accurate with respect to certain documents, but reference is made to the actual documents for complete information. All such summaries are qualified in their entirety by such reference. Copies of documents referred to herein will be made available to you upon request to us.
Table of Contents
This summary highlights selected information from this prospectus and does not contain all of the information that may be important to you. You should read this entire prospectus carefully, including the risk factors and financial statements.
We are a diversified mining and resources company involved in the discovery, development, production, processing and marketing of minerals and metals. We produce nickel, copper, uranium oxide, phosphate fertilizers and a range of other intermediate products from a portfolio of three quality businesses:
| • | Nickel Business Unit—a fully integrated nickel mining, concentrating, smelting and refining business in Western Australia, |
| • | Olympic Dam—a copper-uranium mining, smelting and refinery business in South Australia, and |
| • | Queensland Fertilizer—a high analysis fertilizer production complex and distribution business in Queensland. |
On November 21, 2001, WMC Limited announced a proposal to demerge its interest in the Alcoa World Alumina and Chemicals venture with Alcoa Inc. from its nickel, copper-uranium and fertilizer businesses and its exploration and development interests. Following approval from the WMC Limited shareholders, the demerger was effected through an Australian court-approved scheme of arrangement and associated capital reduction and dividend distribution. As a result of the demerger, WMC Limited continues to hold its interest in the Alcoa World Alumina and Chemicals venture, but changed its name to Alumina Limited, and we became an independent company, holding the nickel, copper-uranium and fertilizer businesses of, as well as the exploration and development interests previously held by, WMC Limited.
In 2002, our consolidated net loss after tax from continuing operations was A$14.7 million and our net sales revenue from continuing operations was A$2,487.2 million. After giving effect to the demerger, our pro forma consolidated net loss after tax from continuing operations for 2002 was A$3.7 million. At December 31, 2002, we had net assets of A$3,606.6 million and total assets of A$7,348.1 million.
Nickel Business Unit
Our nickel business unit is the world’s third largest producer of contained nickel based on production during 2002. It is a fully integrated nickel business, comprising mines, concentrators, a smelter and a refinery, all located in Western Australia. We operate underground and open-cut nickel mines at Leinster and a large scale open-cut nickel mine at Mount Keith. We concentrate nickel ore at both Leinster and Mount Keith. We also operate a concentrator at Kambalda, which treats nickel ore sourced from third parties in the region. We sell approximately 13% of the total nickel-in-concentrate we produce to export customers and we rail the balance of the nickel-in-concentrate we produce to our nickel smelter in Kalgoorlie. At our Kalgoorlie nickel smelter, we smelt nickel-in-concentrate into nickel matte. We export approximately 28% of the nickel matte we produce at our Kalgoorlie nickel smelter and rail the balance to our Kwinana nickel refinery, where we refine nickel matte to produce LME accredited nickel briquettes and nickel powder. Our Kwinana nickel refinery also produces a number of intermediate products, including copper-sulphide, cobalt-nickel sulphide and ammonium sulphate, which we sell to third parties. We sell nickel metal to customers in Europe, North America and Asia.
In 2002, our nickel business unit produced 106,423 tonnes of contained nickel-in-concentrate, 91,574 tonnes of nickel matte and 65,055 tonnes of nickel metal, and generated net sales revenue of A$1,314.9 million.
1
Table of Contents
Olympic Dam
Our copper-uranium business is located at our extensive Olympic Dam operations in South Australia, situated on an ore body with significant copper ore and uranium oxide deposits. Based on 2002 year end reserves, our Olympic Dam mine is the world’s eighth largest copper ore body and the world’s largest uranium oxide deposit. Our operations at Olympic Dam comprise a fully integrated mine and metallurgical complex with three shafts, major underground facilities and rail systems, a grinding and concentrating circuit, a hydrometallurgical plant incorporating solvent extraction circuits for copper and uranium oxide, a copper smelter, a copper refinery and a recovery circuit for precious metals. We produce both LME-accredited electrolytic refined copper cathode and electro-won copper, which is not yet LME accredited. We sell our copper products to customers in Europe, Australia and Asia, while we sell our uranium oxide produced under long-term contracts to electricity-generating utilities in several countries, including the United Kingdom, Finland, Sweden, Belgium, France, Japan, Canada and the United States.
We completed a major expansion project at Olympic Dam in 1999 at a cost of A$1.94 billion, which increased production capacity at the site to 200,000 tonnes of refined copper and 4,300 tonnes of uranium oxide per year. We have also completed an optimization plan at the site to further increase production capacity to 235,000 tonnes of refined copper per year and 4,500 tonnes of uranium oxide per year. Actual production has been affected in recent years, however, by two fires, one in 1999 at the copper solvent extraction plant and one in 2001 in both the copper and uranium solvent extraction plants. We are in the process of repairing the uranium solvent extraction plant and are planning to repair the damage to the copper solvent extraction plant by the end of the first quarter of 2004.
In 2002, our production at Olympic Dam was 178,120 tonnes of refined copper and 2,891 tonnes of uranium oxide and our copper-uranium business unit generated net sales revenue of A$723.3 million.
Queensland Fertilizer
Our fertilizer business unit is a vertically integrated production facility that utilizes phosphate rock from our own deposits, sulphuric acid produced from the Mount Isa smelting facilities of MIM Holdings Limited and the Korea Zinc refinery in Townsville and ammonia from natural gas. We produce both di-ammonium phosphate and mono-ammonium phosphate fertilizers. The primary market for our fertilizers is the Australian market, where 74% of our production is sold. The remaining 26% is sold in Asian markets. Our fertilizer operation is Australia’s largest fertilizer production facility and we are currently the only Australian producer of di-ammonium phosphate.
We commenced production of fertilizers at our fertilizer operations during 2001 and we have gradually increased production since. In 2002, we produced 718,287 tonnes of di-ammonium phosphate and 102,713 tonnes of mono-ammonium phosphate and our fertilizer business unit generated net sales revenue of A$420.4 million.
Regional Exploration and New Business
Regional Exploration
Our global minerals exploration program is part of our strategy to seek mineral discoveries that provide significant growth opportunities in places where we can manage the business and technical risks. In 2002, we conducted exploration in Australia, China, Mongolia, Peru, Tanzania and the United States. In Australia, we continued to test nickel, copper sulphide and platinum group metal mineralization in the West Musgrave area of Western Australia.
In 2002, we spent A$23.4 million on minerals exploration for continuing operations.
2
Table of Contents
New Business
We had increased our ownership interest to 100% in the Corridor Sands heavy minerals project in December 2002. This project is intended to exploit large, currently undeveloped titanium sands deposits in southern Mozambique. We acquired the interest from Southern Mining Corporation Limited following the completion of a bankable feasibility study on the project in 2002. The Industrial Development Corporation of South Africa exercised an option in May 2003 to acquire a 10% interest in the project, subject to completion of documentation, South African Reserve Bank approval and the completion of a number of key project milestones.
The Issuer
The issuer, WMC Finance (USA) Limited, a corporation organized under the laws of the Commonwealth of Australia, is a wholly-owned finance subsidiary of WMC Resources Ltd. WMC Finance (USA) was formed for the purpose of borrowing funds and advancing the net proceeds of such borrowings to members of the WMC Resources Group.
The principal executive offices of the issuer and each of the guarantors are located at 60 City Road, Level 16, Southbank, Victoria 3006, Australia. Our telephone number is +61-3-9685-6000.
3
Table of Contents
The Exchange Offers
On May 8, 2003, WMC Finance (USA) completed the private offering of US$500,000,000 aggregate principal amount of its 5.125% Guaranteed Notes due 2013 and US$200,000,000 aggregate principal amount of its 6.250% Guaranteed Notes due 2033. As part of that offering, the issuer and the guarantors entered into a registration rights agreement with the initial purchasers of the Old Notes in which the issuer and the guarantors agreed, among other things, to deliver this prospectus to you and to complete exchange offers for the Old Notes. Below is a summary of the exchange offers.
Old notes | 5.125% Guaranteed Notes due 2013 6.250% Guaranteed Notes due 2033 | |
New notes | Notes of the same series, the issuance of which has been registered under the Securities Act of 1933. The terms of the New Notes are identical in all material respects to those of the Old Notes, except that the transfer restrictions, registration rights and provisions for special interest, each relating to the Old Notes, do not apply to the New Notes. | |
Terms of the offers | We are offering to exchange a like amount of New Notes for our Old Notes of the same series in minimum denominations of US$1,000 in principal amount and multiples thereof. In order to be exchanged, an Old Note must be properly tendered and accepted. All Old Notes that are validly tendered and not withdrawn will be exchanged. As of the date of this prospectus, there are US$500,000,000 principal amount of 5.125% Guaranteed Notes due 2013 and US$200,000,000 principal amount of 6.250% Guaranteed Notes due 2033 outstanding. We will issue New Notes promptly after the expiration of the exchange offer relating to the particular series. | |
Expiration time | The exchange offers will expire at 5:00 P.M., New York City time, on August 8, 2003, unless extended as to one or more series. | |
Procedures for tendering | Holders of Old Notes registered in the name of a broker, dealer, commercial bank, trust company or other nominee are urged to contact such person promptly if they wish to tender Old Notes pursuant to the exchange offers. See “The Exchange Offers—Procedures for Tendering.”
To tender Old Notes, you must complete and sign a letter of transmittal in accordance with the instructions contained in it and forward it by mail, facsimile or hand delivery, together with any other documents required by the letter of transmittal, to the exchange agent, either with the Old Notes to be tendered or in compliance with the specified procedures for guaranteed delivery of Old Notes. Certain brokers, dealers, commercial banks, trust companies and other nominees may also effect tenders by book-entry transfer. | |
4
Table of Contents
| Letters of transmittal and certificates representing Old Notes should not be sent to us. Such documents should only be sent to the exchange agent. Questions regarding how to tender and requests for information should be directed to the exchange agent. See “The Exchange Offers—Exchange Agent.” | ||
| Acceptance of Old Notes for exchange; Issuance of New Notes | Subject to the conditions stated in “The Exchange Offers—Conditions to the Exchange Offers,” we will accept for exchange any and all Old Notes which are properly tendered in the exchange offer relating to that series before the expiration time for such exchange offer. The New Notes will be delivered promptly after the expiration time with respect to that series. | |
Interest payments on the New Notes | The New Notes will bear interest from the most recent date to which interest has been paid on the Old Notes. If your Old Notes are accepted for exchange, then you will receive interest on the New Notes and not on the Old Notes. | |
Withdrawal rights | You may withdraw your tender at any time before the expiration time for the series tendered. | |
Conditions to the exchange offer | The exchange offers are subject to customary conditions. We may assert or waive these conditions in our sole discretion. In addition, the letter of transmittal contains representations that you will be required to make to us before we will exchange your Old Notes for New Notes. If we materially change the terms of an exchange offer for a series, we will resolicit tenders of the Old Notes of that series. See “The Exchange Offers—Conditions to the Exchange Offers” for more information. | |
Resales of New Notes | Based on interpretations by the staff of the Securities and Exchange Commission, or the SEC, as detailed in a series of no- action letters issued by the SEC to third parties, we believe that the New Notes issued in the exchange offers may be offered for resale, resold or otherwise transferred by you without compliance with the registration and prospectus delivery requirements of the Securities Act so long as:
• you are acquiring the New Notes in the ordinary course of your business;
• you are not participating, do not intend to participate and have no arrangement or understanding with any person to participate in a distribution of the New Notes; and
• you are not an “affiliate” of ours.
You must represent that you meet the above three requirements if you wish to exchange Old Notes for New Notes in the exchange offers. | |
5
Table of Contents
If you are an affiliate of ours or are engaged in or intend to engage in or have any arrangement or understanding with any person to participate in the distribution of the New Notes:
• you cannot rely on the applicable interpretations of the staff of the SEC; and
• you must comply with the registration requirements of the Securities Act in connection with any resale transaction. | ||
Each broker or dealer that receives New Notes for its own account in exchange for Old Notes that were acquired as a result of market making or other trading activities must acknowledge that it will comply with the registration and prospectus delivery requirements of the Securities Act in connection with any offer to resell or other transfer of the New Notes issued in the exchange offers, including the delivery of a prospectus that contains information with respect to any selling security holder required by the Securities Act in connection with any resale of the New Notes.
Furthermore, any broker-dealer that acquired any of its Old Notes directly from us:
• may not rely on the applicable interpretation of the staff of the SEC; and
• must also be named as a selling security holder in connection with the registration and prospectus delivery requirements of the Securities Act relating to any resale transaction. | ||
Exchange agent | The Bank of New York is serving as the exchange agent in connection with the exchange offers. The address and telephone and facsimile numbers of the exchange agent are listed under the heading “The Exchange Offers—Exchange Agent.” | |
Use of proceeds | We will not receive any proceeds from the issuance of New Notes in the exchange offers. We will pay all expenses incident to the exchange offers. See “Use of Proceeds” and “The Exchange Offers—Fees and Expenses.” | |
Certain tax considerations | The exchange offers should not be a taxable exchange for U.S. federal income tax purposes. | |
Consequences of failure to exchange | If we complete the exchange offers and you do not participate, then:
• your Old Notes will continue to be subject to the existing restrictions upon their transfer,
• we will have no further obligation to provide for the registration under the Securities Act of those Old Notes, except under certain limited circumstances, and, following completion of the exchange offer, those Old Notes will bear interest at the same rate as the New Notes, and
• the liquidity of the market for your Old Notes is likely to be adversely affected. | |
6
Table of Contents
The New Notes
The terms of the New Notes are identical in all material respects to those of the Old Notes, except that the transfer restrictions, registration rights and provisions for special interest applicable to the Old Notes do not apply to the New Notes. The New Notes will evidence the same debt as the Old Notes and will be governed by the same indenture and supplemental indenture. Where we refer to “Notes” in this prospectus, we are referring collectively to both the Old Notes and the New Notes of both series.
Notes offered | Up to:
• US$500,000,000 principal amount of 5.125% Guaranteed Notes due 2013, called the 2013 Notes; and
• US$200,000,000 principal amount of 6.250% Guaranteed Notes due 2033, called the 2033 Notes;
all of which have been registered under the Securities Act. | |
Maturity date | 2013 Notes: May 15, 2013 2033 Notes: May 15, 2033 | |
Interest | Interest on the New Notes will accrue at the rates per annum set forth on the cover page. Interest on the New Notes will be payable semi-annually in arrears on May 15 and November 15 of each year, commencing on November 15, 2003, to holders of record on the immediately preceding May 1 and November 1. Interest on the New Notes will accrue from the most recent date to which interest has been paid on or, if no interest has been paid, from the date of original issuance of, the Old Notes. | |
Ranking | Each series of New Notes will be unsecured obligations of WMC Finance (USA) and will rank equally in right of payment with all other unsecured and unsubordinated indebtedness of WMC Finance (USA), and the new guarantees will be unsecured obligations of WMC Resources Ltd, WMC (Olympic Dam Corporation) Pty Ltd and WMC Fertilizers Pty Ltd, respectively, and will rank equally in right of payment with all other unsecured and unsubordinated indebtedness of WMC Resources Ltd, WMC (Olympic Dam Corporation) Pty Ltd and WMC Fertilizers Pty Ltd, respectively, except, in each case, indebtedness given preference by applicable law. | |
Guarantees | WMC Resources Ltd will fully and unconditionally guarantee the payment of the principal of, premium, if any, and interest on the New Notes, including any additional amounts which may be payable in respect of the New Notes, as described under “Additional Amounts”.
In addition to the parent guarantee, each series of New Notes will be unconditionally guaranteed by the subsidiary guarantors so that such series of New Notes will not be structurally subordinated to | |
7
Table of Contents
WMC Resources Ltd’s obligations under its US$600 million senior credit facility, dated November 14, 2002, or any other of its funded indebtedness in excess of A$25 million that is guaranteed, from time to time, by either of the subsidiary guarantors. If the obligations of any subsidiary guarantor under all our funded indebtedness in excess of A$25 million terminates, that subsidiary guarantor will also be released from its guarantee of the New Notes. See “Description of the New Notes and Guarantees—Guarantees.” | ||
Further Issues | We may from time to time, without notice to or the consent of the registered holders of a series of New Notes, create and issue additional debt securities having the same terms as and ranking equally and ratably with the New Notes of that series in all respects, as described more fully in “Description of the New Notes and Guarantees—Further Issues”. | |
Additional amounts | In the event that Australian withholding taxes are required to be withheld or deducted from payments on the New Notes or the related guarantees, we will, subject to certain exceptions described in this prospectus, pay such additional amounts as will result, after deduction or withholding of such taxes, in the payment of the amounts which would have been payable in respect of the New Notes or guarantees had no such withholding or deduction been required. See “Description of the New Notes and Guarantees—Special Situations—Payment of Additional Amounts”. | |
Optional redemption for tax reasons | Each of the 2013 Notes and the 2033 Notes may be redeemed at the issuer’s option in whole but not in part, at 100% of the principal amount thereof plus accrued interest and any additional amounts due on the date fixed for redemption if certain events occur that would cause the issuer or guarantors to become obligated to pay additional amounts as described under “Description of the New Notes and Guarantees—Special Situations—Optional Tax Redemption”. | |
Optional redemption | The issuer may redeem some or all of each series of New Notes at any time or from time to time at a price equal to 100% of the principal amount of the New Notes of such series plus a make- whole premium, and accrued and unpaid interest. See “Description of the New Notes and Guarantees—Special Situations—Optional Redemption”. | |
Form and denomination | The New Notes will be issued only in fully registered form without interest coupons and in minimum denominations of US$1,000. The New Notes will be evidenced by a global note for each series deposited with the trustee for the New Notes, as custodian for The Depository Trust Company, or DTC. Beneficial interests in the global notes will be shown on, and transfers of those beneficial |
8
Table of Contents
interests can only be made through, records maintained by DTC and its participants. See “Description of the New Notes and Guarantees—Global Notes”. | ||
Listing | We have applied to list both series of New Notes on the Luxembourg Stock Exchange. | |
Restrictive covenants | The issuer and the guarantors have agreed to observe covenants, including covenants as to limitation on the incurrence of liens and limitations on sale and leaseback transactions. See “Description of the New Notes and Guarantees—Restrictive Covenants”. | |
Trustee | The Bank of New York is the trustee under the indenture, as supplemented by the first supplemental indenture, both dated as of May 8, 2003. | |
United States taxation consequences | We believe that the exchange of your Old Notes for New Notes to be issued in connection with the exchange offers should not result in any gain or loss to you for United States federal income tax purposes. See “Material Tax Consequences—United States Taxation”. | |
Governing law | Each series of New Notes, the related guarantees, the indenture and the first supplemental indenture will each be governed by New York law. | |
Prescription | Under the laws of New York, claims relating to payment of principal and interest on the New Notes will be prescribed according to the applicable statute of limitations. | |
Risk factors | You should consider carefully all of the information set forth in this prospectus and, in particular, the information set forth under “Risk Factors”. |
9
Table of Contents
Summary Consolidated Financial Data
The summary financial data appearing below as at December 31, 2002 and 2001 and for the years ended December 31, 2002, 2001 and 2000 are set forth in Australian dollars (except as otherwise indicated), and are extracted, in relevant part, from our audited Consolidated Financial Statements which appear elsewhere in this prospectus. The summary financial data appearing below as at December 31, 2000 and for the year ended December 31, 1999 are extracted, in relevant part, from our audited Combined Financial Statements. The summary financial data appearing below as at December 31, 1999 and 1998 and for the year ended December 31, 1998 are derived from unaudited consolidated financial data that is not included herein. As discussed in Note 1 to our audited Consolidated Financial Statements, these financial statements reflect our statements of income and comprehensive income and balance sheets as if we were a separate consolidated group for all periods presented rather than part of the WMC Limited group. As a result, this historical financial information may not necessarily be indicative of our future financial performance and it does not necessarily reflect what our financial position and results of operations would have been had we operated as a separate, consolidated group during the periods presented. Our audited Consolidated Financial Statements have been prepared in accordance with accounting principles generally accepted in Australia (“Australian GAAP”), which differ in certain respects from accounting principles generally accepted in the United States of America (“US GAAP”). Note 45 to our audited Consolidated Financial Statements provides an explanation of these differences as they affect us and reconciles from Australian GAAP to US GAAP our net income, comprehensive income, certain balance sheet items, shareholders’ equity and cashflows.
Statement of Financial Performance
| Year ended December 31, | |||||||||||||||||||||||
| 2002(1) | 2002 | 2001 | 2000 | 1999 | 1998 | ||||||||||||||||||
| (millions, except per share amounts) | |||||||||||||||||||||||
Amounts in accordance with Australian GAAP | |||||||||||||||||||||||
Net sales revenue from continuing operations | US$ | 1,660.5 | A$ | 2,487.2 | A$ | 2,364.1 | A$ | 2,666.0 | A$ | 1,672.7 | A$ | 1,315.1 | |||||||||||
Profit/(loss) before interest and income tax from continuing operations | 78.5 | 117.6 | 71.9 | 782.5 | 86.8 | (362.1 | ) | ||||||||||||||||
Net interest expense(2) | 83.2 | 124.6 | 140.9 | 148.1 | 78.6 | 4.8 | |||||||||||||||||
Net (loss)/profit from continuing operations | (9.8 | ) | (14.7 | ) | (157.5 | ) | 327.2 | (5.7 | ) | (215.9 | ) | ||||||||||||
Net profit from discontinued operations | 25.2 | 37.7 | 283.5 | 72.7 | 89.8 | 167.4 | |||||||||||||||||
Net profit/(loss) attributable to shareholders | 15.4 | 23.0 | 126.0 | 399.9 | 84.1 | (48.5 | ) | ||||||||||||||||
Net income/(loss) from continuing operations per ordinary share ($/share)(4)(7) | US$ | (0.01 | ) | A$ | (0.01 | ) | A$ | (0.14 | ) | A$ | 0.29 | A$ | (0.01 | ) | A$ | (0.19 | ) | ||||||
Diluted net income/(loss) from continuing operations per ordinary share ($/share)(6)(7) | (0.01 | ) | (0.01 | ) | (0.14 | ) | 0.29 | (0.01 | ) | (0.19 | ) | ||||||||||||
Amounts in accordance with US GAAP | |||||||||||||||||||||||
Net sales revenue from continuing operations | US$ | 1,660.5 | A$ | 2,487.2 | A$ | 2,364.1 | A$ | 2,666.0 | A$ | 1,672.7 | A$ | 1,315.1 | |||||||||||
Net (loss)/profit from continuing operations | (81.0 | ) | (121.3 | ) | (231.5 | ) | 241.6 | (9.2 | ) | (220.8 | ) | ||||||||||||
Comprehensive income/(loss) | 57.5 | 86.2 | (804.7 | ) | 288.4 | 2.1 | (98.5 | ) | |||||||||||||||
Net income/(loss) from continuing operations per ordinary share ($/share)(4)(5)(7) | US$ | (0.09 | ) | A$ | (0.14 | ) | A$ | (0.21 | ) | A$ | 0.21 | A$ | (0.02 | ) | A$ | (0.19 | ) | ||||||
Diluted net income/(loss) from continuing operations per ordinary share ($/share)(6)(7) | (0.09 | ) | (0.14 | ) | (0.21 | ) | 0.21 | (0.02 | ) | (0.19 | ) | ||||||||||||
10
Table of Contents
Statement of Financial Position
| As at December 31, | ||||||||||||||||||
| 2002(1) | 2002 | 2001 | 2000 | 1999 | 1998 | |||||||||||||
| (millions) | ||||||||||||||||||
Amounts in accordance with Australian GAAP | ||||||||||||||||||
Total assets | US$ | 4,905.6 | A$ | 7,348.1 | A$ | 8,242.9 | A$ | 8,597.0 | A$ | 7,275.8 | A$ | 7,374.3 | ||||||
Long-term obligations | 1,141.0 | 1,709.1 | 3,476.3 | 4,304.2 | 3,053.1 | 3,592.6 | ||||||||||||
Shareholders’ equity | 2,407.8 | 3,606.6 | 3,220.3 | 3,123.8 | 3,214.3 | 3,010.8 | ||||||||||||
Amounts in accordance with US GAAP | ||||||||||||||||||
Total assets | US$ | 4,437.0 | A$ | 6,646.2 | A$ | 6,691.4 | A$ | 8,368.2 | A$ | 7,146.7 | A$ | 7,296.6 | ||||||
Long-term obligations | 1,141.0 | 1,709.1 | 3,476.3 | 4,304.2 | 3,053.1 | 3,592.6 | ||||||||||||
Shareholders’ equity | 1,721.6 | 2,578.8 | 2,068.8 | 2,888.9 | 3,071.7 | 2,893.7 | ||||||||||||
Statement of Cash Flows
| Year ended December 31, | ||||||||||||||||||||
| 2002 | 2001 | 2000 | 1999 | 1998 | ||||||||||||||||
| (millions) | ||||||||||||||||||||
Amounts in accordance with Australian GAAP | ||||||||||||||||||||
Net cash provided by operating activities | A$ | 336.7 | A$ | 577.7 | A$ | 898.1 | A$ | 164.9 | A$ | 172.3 | ||||||||||
Net cash provided by/(used in) investing activities | (381.0 | ) | 279.1 | (419.3 | ) | (624.7 | ) | (1,337.6 | ) | |||||||||||
Net cash (used in)/provided by financing activities | 15.8 | (793.7 | ) | (508.9 | ) | 485.1 | 1,128.8 | |||||||||||||
Net increase/(decrease) in cash held | (28.5 | ) | 63.1 | (30.1 | ) | 25.3 | (36.5 | ) | ||||||||||||
Other financial data
| Year ended December 31, | |||||||||||||||||||
| 2002(1) | 2002 | 2001 | 2000 | 1999 | 1998 | ||||||||||||||
| (millions) | |||||||||||||||||||
EBITDA(3) | US$ | 350.6 | A$ | 525.1 | A$ | 399.3 | A$ | 1,059.2 | A$ | 320.7 | A$ | (82.6 | ) | ||||||
Capital expenditure | 313.4 | 469.4 | 456.9 | 468.6 | 984.9 | 1,932.0 | |||||||||||||
| (1) | Australian dollar amounts have been translated into US dollars solely for the convenience of the reader at the rate of A$1.00 = US$0.6676, the Noon Buying Rate on June 16, 2003. A significant portion of the Company’s liabilities and revenues and a portion of the assets and expenses are denominated in currencies other than Australian dollars and, for the purpose of preparing the financial data for the year ended December 31, 2002 have been translated into Australian dollars using an exchange rate on December 31, 2002 of A$1.00 = US$0.5666, or average exchange rates for the 2002 fiscal year, as appropriate, as required under Australian GAAP. The convenience translation of these Australian dollar amounts into US dollars therefore does not necessarily represent the actual US dollar value of such assets and liabilities or revenues and expenses as of the dates or for the periods presented. The Noon Buying Rate on December 31, 2002 was A$1.00 = US$0.5625. See “Currency of Presentation and Exchange Rates”. |
| (2) | Net interest expense is equal to gross interest expense less interest income, such as interest income generated from interest rate swaps and cross currency swaps entered into with respect to our borrowings. It does not include capitalized interest of A$3.5 million in 2002, nil in 2001, A$24.9 million in 2000, A$61.9 million in 1999 and A$89.9 million in 1998. See Note 3 to our Consolidated Financial Statements for a reconciliation of gross interest expense to net interest expense. The net interest expense for 2002 does not |
11
Table of Contents
include one-off interest income of A$75.9 million generated from the early termination of interest rate swaps in conjunction with the demerger. Our historical gross and net interest expense was based primarily on the level of debt existing prior to the demerger. In conjunction with the demerger, our level of debt was reduced by approximately A$577 million. In addition our historical gross and net interest expense reflected debt bearing interest rates higher than the interest rates that apply to our existing debt. For 2003, we expect that our gross interest expense will be approximately A$77.4 million based on the lower level of debt following the demerger and these lower interest rates (taking into account the placement of US$700 million of the Notes, the application of the proceeds thereof and expected exchange rates for the year). |
| (3) | EBITDA is defined as profit before interest and income tax plus depreciation and amortization, and reflects only continuing operations. EBITDA should not be construed as an alternative to operating income, or net income, as determined in accordance with Australian or US GAAP, as an indicator of our operating performance, or as an alternative to cash flows from operating activities, as determined in accordance with Australian or US GAAP, as a measure of liquidity. EBITDA is presented solely as a supplemental disclosure because we believe that it is a widely used measure of operating performance and we use it to measure our internal profitability. Because all companies do not calculate EBITDA identically, the presentation of EBITDA in this prospectus is not necessarily comparable to similarly entitled measures of other companies. |
A reconciliation of EBITDA to profit before interest and income tax from continuing operations is as follows:
| Year ended December 31, | ||||||||||||||||||||
| 2002 | 2001 | 2000 | 1999 | 1998 | ||||||||||||||||
| (millions) | ||||||||||||||||||||
EBITDA | A$ | 525.1 | A$ | 399.3 | A$ | 1,059.2 | A$ | 320.7 | A$ | (82.6 | ) | |||||||||
Depreciation and amortization | (511.0 | ) | (480.9 | ) | (428.8 | ) | (318.3 | ) | (327.4 | ) | ||||||||||
Interest income | 103.5 | 153.5 | 152.1 | 84.4 | 47.9 | |||||||||||||||
Profit/(loss) before interest expense and income tax from continuing operations | 117.6 | 71.9 | 782.5 | 86.8 | (362.1 | ) | ||||||||||||||
| (4) | The number of our shares used in the 2002 basic net income per share calculation was determined on the basis of the weighted average number of outstanding WMC Limited shares for the 11 months to November 30, 2002 (the effective demerger date) and the actual number of WMC Resources Ltd shares for the month of December 2002. For prior periods, the number of our shares used in the basic net income per share calculation was determined on the basis of the weighted average number of outstanding WMC Limited shares for the periods indicated, as in the demerger each WMC Limited shareholder received one of our shares for each share in WMC Limited it held. Refer also to Notes 1(y) and 6 to the Consolidated Financial Statements. |
| (5) | On a US GAAP basis, net loss from continuing operations per share in 1999 was A$0.04 before the cumulative effect of an accounting policy change for start-up costs. On a US GAAP basis, net loss from continuing operations per share in 2002 was A$0.06 before the cumulative effect of an accounting policy change for amortization of mine development and post-production waste removal costs. |
| (6) | The number of our shares used in the 2002 diluted net income from continuing operations per share calculation was determined on the basis of the weighted average of the number of outstanding WMC Limited shares for the 11 months to November 30, 2002 (the effective demerger date) and the actual number of WMC Resources Ltd shares for the month of December 2002. For prior periods, the number of our shares used in the diluted net income from continuing operations per share calculation was determined on the basis of the weighted average of the number of outstanding WMC Limited shares for the periods indicated, including potential shares from the conversion of partly paid shares and options into shares of WMC Limited. Refer also to Notes 1(y) and 6 to the Consolidated Financial Statements. |
| (7) | The number of shares used in our per share calculations were as follows: |
Year ended December 31, | ||||||||||
2002 | 2001 | 2000 | 1999 | 1998 | ||||||
| (millions of shares) | ||||||||||
Basic | 1,115.8 | 1,103.3 | 1,127.1 | 1,146.1 | 1,140.8 | |||||
Diluted | 1,127.3 | 1,120.8 | 1,137.4 | 1,161.9 | 1,149.0 | |||||
12
Table of Contents
Summary Unaudited Pro Forma Financial Data
In December 2002, WMC Limited completed the demerger of its interests in the Alcoa World Alumina and Chemicals venture with Alcoa Inc. from its other businesses and interests. Through an Australian court-approved scheme of arrangement, WMC Limited distributed the shares it held in us to its shareholders and we became an independent consolidated group. In conjunction with the demerger, WMC Limited undertook certain internal restructuring transactions and effected certain share transfers. Thus, as part of the scheme of arrangement, we acquired from WMC Limited the shares it held in the legal entities within the WMC Limited group that held the copper-uranium and fertilizer operations and assets as well as WMC Limited’s exploration and development interests. In addition, as part of the scheme of arrangement, WMC Limited transferred some other entities to us and we replaced some of WMC Limited’s debt facilities and borrowings with new debt facilities and borrowings. Under Australian GAAP, these transfers, which included the fair value transfer of some derivative and financial instruments held in finance subsidiaries transferred to us in connection with the scheme of arrangement and demerger, were required to be at fair value on the date of the transfer. Under US GAAP, these transfers were accounted for at book value.
Our summary unaudited pro forma financial data, set forth below, was extracted in relevant part from our unaudited pro forma Consolidated Financial Statements, which appear elsewhere in this prospectus. Our unaudited pro forma Consolidated Financial Statements are derived from our historical audited Consolidated Financial Statements for the year ended December 31, 2002. The unaudited pro forma consolidated statement of income for the year ended December 31, 2002 gives pro forma effect to the demerger, as though the demerger had occurred on January 1, 2002. The unaudited pro forma financial data is presented for illustrative purposes only and does not purport to represent what our actual financial performance would have been if the demerger had occurred at January 1, 2002. Our unaudited pro forma Consolidated Financial Statements should be read in connection with, and are qualified by reference to, our historical Consolidated Financial Statements and “Operating and Financial Review and Prospects” in this prospectus.
Unaudited Pro Forma Income Statement
| Year ended December 31, 2002 | ||||||||||||||||
| Historical | Pro Forma Adjustments | Pro Forma | Pro Forma(5) | |||||||||||||
| (millions) | ||||||||||||||||
Amounts in accordance with Australian GAAP | ||||||||||||||||
Net sales revenue from continuing operations | A$ | 2,487.2 | A$ | — | A$ | 2,487.2 | US$ | 1,660.5 | ||||||||
Income/(loss) before interest and tax from continuing operations | 117.6 | (6.0 | )(1) | 111.6 | 74.5 | |||||||||||
Interest Income/(expense) (gross) | (152.2 | ) | 24.3 | (2) | (127.9 | ) | (85.4 | ) | ||||||||
Income tax credit/(expense) | 19.9 | (7.3 | )(3) | 12.6 | 8.4 | |||||||||||
Net (loss)/profit from continuing operations | (14.7 | ) | 11.0 | (3.7 | ) | (2.5 | ) | |||||||||
Basic and diluted net (loss)/profit from continuing operations, per share ($/share)(6)(7)(8) | (0.01 | ) | 0.01 | — | (9) | — | (9) | |||||||||
Amounts in accordance with US GAAP | ||||||||||||||||
Net (loss)/profit from continuing operations | (121.3 | ) | 17.0 | (4) | (104.3 | ) | (69.6 | ) | ||||||||
Basic and diluted net (loss)/profit from continuing operations, per share ($/share)(6)(7)(8) | (0.14 | ) | 0.05 | (0.09 | ) | (0.06 | ) | |||||||||
| (1) | Under Australian GAAP, our acquisition of WMC Limited’s copper-uranium and fertilizer businesses, WMC Finance Ltd and WMC Finance (USA) Ltd, as well as WMC Limited’s international exploration assets and business (other than those relating to Alcoa World Alumina and Chemicals) resulted in the assets and liabilities being transferred at fair value on the date of transfer. The fair values of the net assets of the operations transferred were calculated using discounted cash flow models. Our unaudited pro forma |
13
Table of Contents
| consolidated statement of income includes an adjustment for the difference in depreciation and amortization expense resulting from the differing carrying value of property, plant and equipment, and acquired minerals rights as if the changes in carrying value had been recorded as at January 1, 2002. |
| (2) | In conjunction with the scheme of arrangement and demerger, we obtained new credit facilities to replace the borrowings under WMC Limited’s credit facilities. Our unaudited pro forma consolidated statement of income includes an adjustment to reflect the reduced interest expense under the new debt balance for the full year. |
| (3) | Our unaudited pro forma consolidated statement of income includes an adjustment to the income tax (expense)/credit in relating to the decreased interest expense under the changed debt balance. The adjustment has been calculated at the statutory tax rate in effect during the periods presented of 30%. There is no tax effect applicable to the additional depreciation and amortization expense as these amounts are not deductible for tax purposes. |
| (4) | The proforma US GAAP adjustment comprises the interest adjustment and the consequential tax adjustment as outlined in (2) and (3) above. Under US GAAP, the demerger is similar to a pro-rata distribution of stock to shareholders and therefore the internal transfers of assets and liabilities made to effect the reorganization and demerger were accounted for at historical cost. Consequently, there is no adjustment to the US GAAP net loss from continuing operations for the difference in depreciation and amortization expense outlined in (1) above as the amortization of the fair value adjustments do not form part of the US GAAP net loss from continuing operations. |
| (5) | Australian dollar amounts have been translated into US dollars solely for the convenience of the reader at the rate of A$1.00 = US$0.6676, the Noon Buying Rate on June 16, 2003. A significant portion of the Company’s liabilities and revenues and a portion of the assets and expenses are denominated in currencies other than Australian dollars and, for the purpose of preparing the financial data for the year ended December 31, 2002 have been translated into Australian dollars using the rate on December 31, 2002 of A$1.00 = US$0.5666, or average rates for the 2002 fiscal year, as appropriate, as required under Australian GAAP. The convenience translation of these Australian dollar amounts into US dollars therefore does not necessarily represent the actual US dollar value of such assets and liabilities or revenues and expenses. The Noon Buying Rate on December 31, 2002 was A$1.00 = US$0.5625. See “Currency of Presentation and Exchange Rates”. |
| (6) | The number of our shares used in the 2002 basic net income per share calculation was determined on the basis of the weighted average number of outstanding WMC Limited shares for the 11 months to November 30, 2002 (the effective demerger date) and the actual number of WMC Resources Ltd shares for the month of December 2002. Refer also to Notes 1(y) and 6 to the Consolidated Financial Statements. |
| (7) | The number of our shares used in the 2002 diluted net income from continuing operations per share calculation was determined on the basis of the weighted average of the number of outstanding WMC Limited shares for the 11 months to November 30, 2002 (the effective demerger date) and the actual number of WMC Resources Ltd shares for the month of December 2002. Refer also to Notes 1(y) and 6 to the Consolidated Financial Statements. |
| (8) | We used 1,128.4 million shares in our 2002 per share calculations. |
| (9) | Amounts per share are less than 1 cent as amounts are rounded to the nearest whole cent. |
14
Table of Contents
Ratio of Earnings to Fixed Charges
We have shown our consolidated ratios of earnings to fixed charges for continuing operations, for each of the five years ended December 31, 2002. This information has been calculated in accordance with Australian GAAP and US GAAP.
| Year ended December 31, | ||||||||||||||
| 2002 | 2001 | 2000 | 1999 | 1998 | ||||||||||
Historical ratios | ||||||||||||||
In accordance with Australian GAAP | 0.76 | * | 0.25 | * | 2.39 | 0.37 | * | — | * | |||||
In accordance with US GAAP | — | * | — | * | 2.04 | 0.18 | * | — | * | |||||
Pro Forma ratios | ||||||||||||||
In accordance with Australian GAAP | 0.86 | * | N/A | N/A | N/A | N/A | ||||||||
In accordance with US GAAP | 0.32 | * | N/A | N/A | N/A | N/A | ||||||||
| * | During these periods, our earnings were insufficient to cover fixed charges. Where a dash appears our earnings were negative during the period. Our deficiencies to cover fixed charges in each of the periods presented were as follows: |
| Year ended December 31, | ||||||||||
| 2002 | 2001 | 2000 | 1999 | 1998 | ||||||
| A$ millions | ||||||||||
Historical | ||||||||||
In accordance with Australian GAAP | 38.1 | 223.3 | N/A | 143.1 | 507.7 | |||||
In accordance with US GAAP | 175.4 | 342.7 | N/A | 185.0 | 519.5 | |||||
Pro Forma | ||||||||||
In accordance with Australian GAAP | 19.8 | N/A | N/A | N/A | N/A | |||||
In accordance with US GAAP | 94.7 | N/A | N/A | N/A | N/A | |||||
We computed the ratio of earnings to fixed charges by dividing the amount of earnings by the amount of fixed charges. For the purposes of calculating this ratio, we have calculated earnings by adding pre-tax income from continuing operations before adjustment for minority interests in consolidated subsidiaries or income or loss from equity investees, fixed charges and distributed income of equity investees. Interest capitalized and the minority interest in pre-tax income of subsidiaries that have not incurred fixed charges were subtracted from the total of the added items. Fixed charges consist of interest costs, both expensed and capitalized, a reasonable approximation of the interest component of rental expense and pre-tax earnings required to cover any preferred stock dividend requirements.
The pro forma ratio of earnings to fixed charges was calculated by adjusting historical pre-tax income from continuing operations to give pro forma effect to the reduced interest expense arising from the May 8, 2003 private placement of US$500 million of our 5.125% Guaranteed Notes due 2013 and US$200 million of our 6.250% Guaranteed Notes due 2033 as if they had been in place since January 1, 2002.
Adjusting unaudited pro forma pre-tax income from continuing operations to give effect to the private placement of the Old Notes outlined above results in a pro forma ratio of earnings to fixed charges of 0.82 in accordance with Australian GAAP and 0.16 in accordance with US GAAP.
This prospectus relates to exchange offers being made for these Old Notes. Because the terms of the New Notes are essentially identical to those of the Old Notes, we do not expect the exchange offers to alter the ratio of earnings to fixed charges.
15
Table of Contents
Before you elect to participate in either exchange offer described in this prospectus, you should be aware of the significant risks described below. You should carefully consider these risks, together with all of the other information included in this prospectus.
Risks relating to the exchange offers
You may have difficulty selling the Old Notes you do not exchange.
If you do not exchange your Old Notes for New Notes in the exchange offers, you will continue to be subject to the restrictions on transfer of your Old Notes as described in the legend on the global notes representing the Old Notes. There are restrictions on transfer of your Old Notes because we issued the Old Notes under an exemption from, or in a transaction not subject to, the registration requirements of the Securities Act and applicable state securities laws. In general, you may only offer or sell the Old Notes if they are registered under the Securities Act and applicable state securities laws or offered and sold under an exemption from, or in a transaction not subject to, these requirements. We do not intend to register any Old Notes and, upon consummation of the exchange offer relating to a series of notes, you will not be entitled to any rights to have your untendered Old Notes registered under the Securities Act. In addition, the trading market, if any, for the remaining Old Notes will be adversely affected depending on the extent to which Old Notes are tendered and accepted in the exchange offers.
You may have difficulty selling the New Notes because there is no existing trading market for them.
The New Notes are being offered to the holders of the Old Notes, which were issued on May 8, 2003 to a small number of institutional investors. There is no existing trading market for the New Notes. Although the initial purchasers in the offering of the Old Notes have informed us that they intend to make a market in the New Notes, they are not obligated to do so and any market making activity may be discontinued at any time without notice. As a result, the market price of the New Notes could be adversely affected.
We have applied to list the New Notes on the Luxembourg Stock Exchange. The liquidity of any market for the New Notes will depend upon the number of holders of the New Notes, our performance, the market for similar securities, the interest of securities dealers in making a market in the New Notes and other factors relating to us and our business. A liquid trading market may never develop for the New Notes.
Broker-dealers may need to comply with the registration and prospectus delivery requirements of the Securities Act when dealing in the New Notes.
Any broker-dealer that (1) exchanges its Old Notes in the exchange offers for the purpose of participating in a distribution of the New Notes or (2) resells New Notes that were received by it for its own account in the exchange offers may be deemed to have received restricted securities and will be required to comply with the registration and prospectus delivery requirements of the Securities Act in connection with any resale transaction by that broker-dealer. Any profit on the resale of the New Notes and any commission or concessions received by a broker-dealer may be deemed to be underwriting compensation under the Securities Act.
You may not receive New Notes in the exchange offers if the exchange offer procedure is not followed.
We will issue the New Notes in exchange for your Old Notes only if you tender the Old Notes and deliver a properly completed and duly executed letter of transmittal and other required documents before expiration of the relevant exchange offer. You should allow sufficient time to ensure timely delivery of the necessary documents. Neither the exchange agent nor we are under any duty to give notification of defects or irregularities with respect to the tenders of Old Notes for exchange. If you are the beneficial holder of Old Notes that are registered in the
16
Table of Contents
name of your broker, dealer, commercial bank, trust company or other nominee, and you wish to tender in the exchange offers, you should promptly contact the person in whose name your Old Notes are registered and instruct that person to tender on your behalf.
Risks relating to the WMC Resources Group’s business
We believe that, because of the international scope of our operations and the industries in which we are engaged, numerous factors have an effect on our results and operations. The following describes the material risks that could affect us.
A reduction in commodity prices could materially reduce our revenues and profits.
Our revenue is derived from sales of nickel, copper, uranium, gold and fertilizers. The prices we obtain for our products are determined by, or linked to, prices in the world markets, which have historically been subject to substantial fluctuations arising from changes in supply and demand, various Australian and international macro-economic and political conditions, the cost of substitute materials, and the speculative activities of various market participants. This will have a consequent effect on the prices we can charge for our products and the revenues we receive, including under supply contracts the pricing terms of which track market prices, which consequently affects our profitability. The general trend in commodity prices has been characterized by an increase from 1999 through the end of 2000, followed by a decline over the course of 2001 into 2002. For further information about historical commodity price movements in the commodities we produce, please see the following sections “Qualitative and Quantitative Disclosures About Market Risk—Average Quarterly Prices”, “Business Description—Nickel—Markets and Competition”, “Business Description—Copper-uranium—Market and Competition” and “Business Description—Fertilizer—Markets and Competition”.
Material changes in the prices we receive for our products could have a significant effect on our results. Consequently, a sustained and uninterrupted period of unusually low prices of the products we sell could reduce our profitability and our ability to pay principal and interest on our debt, dividends, or meet our other obligations.
We expect that commodity prices may not rise until economic activity in the markets we serve starts to increase significantly. The general volatility in commodity prices makes it difficult for us to predict the extent and duration of any decline or increase in the cyclical commodity prices relating to our products. We expect that volatility in prices and in demand for most of our products will continue for the foreseeable future. We may enter into hedging transactions with respect to nickel, gold, copper and fertilizer with a view to reducing the potentially adverse effects of commodity price fluctuations. Since 2000, any new hedging activity has been limited to securing acceptable rates of return for new projects. For a statement of our current hedging activity, and movements in the selling price of nickel, gold, copper and fertilizer over the last five years, see the section entitled “Quantitative and Qualitative Disclosure about Market Risk”.
Fluctuations in foreign exchange rates could adversely affect our revenues and profits.
The products we export from Australia are predominantly sold in US dollars. In the year ended December 31, 2002, 90% of our sales revenue was denominated in or linked to US dollars. However, any dividend payments and the majority of our operating costs are denominated in Australian dollars. Therefore, in the absence of other changes, if the Australian dollar strengthens in value relative to the value of the US dollar, our financial results will be adversely affected. Conversely, a weakening of the Australian dollar relative to the US dollar will tend to have a favorable effect on our financial results. Because much of our borrowings and the majority of our receivables are denominated in US dollars, movements in the A$/US$ exchange rate will also affect our net asset value. As at December 31, 2002, we had US$824.9 million of US dollar repayment obligations and US dollars receivables of US$123.0 million. We have from time to time sought to hedge our foreign currency exchange position. See the section entitled “Quantitative and Qualitative Disclosure about Market Risk” for a more detailed discussion of our foreign exchange hedging policy.
17
Table of Contents
We may have fewer ore reserves than our estimates indicate.
There are a number of uncertainties inherent in estimating quantities of reserves, including many factors beyond our control. The reserves data included in this prospectus are estimates. The actual volume and grade of reserves recovered and our rates of production may be less than these estimates may imply.
Our reserves estimations may change substantially if new information subsequently becomes available. Such estimates are, to a large extent, based on the interpretations of geological data obtained from drill holes and other sampling techniques, and feasibility studies which derive estimates of operating costs based upon anticipated tonnage and grades of the material to be mined and processed, expected recovery rates, equipment operating costs and other factors. Further, it may take many years from the initial phase of drilling before production is possible and, during that time, the economic feasibility of exploiting a discovery may change. Fluctuations in the price of commodities, variations in operating and capital costs, different recovery rates and other factors, including but not limited to, short-term operating factors such as the need for sequential development of ore bodies and the processing of new or different ore grades, may ultimately result in our estimated reserves being revised. If such a revision were to indicate a substantial reduction in proven or probable reserves at one or more of our major projects, it could negatively affect our financial condition and prospects.
A decline in the market price of a particular metal or mineral may also render the exploitation of reserves containing relatively lower grades of mineralization uneconomical. If the price we realized for a particular commodity were to decline substantially below the price at which our ore reserves were estimated for a sustained period of time, we could experience reductions in reserves and asset write-downs. Under some such circumstances, we may discontinue the development of a project or mining at one or more properties.
An increase in our production costs could reduce our profitability.
Changes in our costs have a major impact on our profitability. Our main expense categories are salaries and wages, energy, transport, materials, and amortization and depreciation of property, plant and equipment. Some of our costs are also affected by government imposts and regulations. Our costs depend upon the efficient design and construction of mining and processing facilities and competent operation of those facilities. Changes in costs of mining and processing operations can occur as a result of unforeseen events or changes in reserve estimates.
Our energy costs represent a significant portion of the production costs for our operations. The principal sources of energy for our mining operations are purchased electricity and natural gas. Energy will continue to represent a significant portion of our production costs, and we may be adversely impacted if future energy sources are not available or energy prices increase. If we are unable to procure sufficient energy at reasonable prices in the future, it could reduce the earnings or cash flow that we otherwise might realize.
Our ability to sustain or increase our current levels of production in the medium to long term is partly dependent on the development of new projects and expansion of existing operations.
Our ability to sustain or increase our current levels of production, and, therefore, our potential revenues and profits, in the medium to long term is partly dependent on the development of new projects and on the expansion of existing operations. Planned development or expansion projects may not result in the entire planned additional production. The economics of any project is based upon, among other factors, estimates of non-reserve mineralization and reserves, recovery rates, production rates, capital and operating costs of these development projects and future commodity prices. The uncertainty and volatility of some or all of these factors contributes to the risks associated with project development and expansion activities. See “Business Description—Capitalization Expenditure and Divestiture” for a more detailed discussion of our capital expenditure and divestiture activities.
18
Table of Contents
Our business may be affected by planned and unplanned outages and other material disruptions.
Industrial disruptions, work stoppages, refurbishments, installation of new plants, accidents or sustained bad weather at our operations can result in production losses and delays in delivery of products, which may adversely affect our profitability. Production may fall below historic or estimated levels as a result of unplanned outages. For example, in 2001, we experienced a fire at both of our copper and uranium solvent extraction units at our Olympic Dam operations. We also experienced a fire in the copper solvent extraction unit in 1999. As a result, our copper and uranium production was adversely affected following these incidents.
We are exposed to regulatory, legislative and judicial action, both in Australia and in other countries in which we conduct operations.
Our operations in each of the jurisdictions in which we conduct operations could be affected by government actions, such as controls on imports, exports and prices, variations in taxation laws (including royalties), government directions, guidelines and regulations, particularly in relation to the environment and mine operations, legislation, indigenous people’s rights and court decisions, particularly those that impact on land access and freedom to conduct mining operations. Any such government action or court decisions may require increased capital or operating expenditures or both, or could prevent or delay the development of some of our operations.
Of particular relevance to our operations in Australia is the impact of pending judicial decisions and potential legislative action concerning the effect of native title in land held under mining or other leases or waters used in our operations. This is discussed in detail in “Business Description—Legal Proceedings”. We are also subject to the requirements of Australian mining law and the conditions of leases granted to us by state or territorial governments. See “Business Description—Australian Mining Law and Leases” for a more detailed discussions of these requirements. Finally, we must comply with extensive environmental regulations in Australia and the other countries where we have operations, see “Business Description—Environmental Matters”.
In addition, some of our exploration and potential projects and activities are in developing countries where political, economic and other risks may be more acute than in developed countries, including our Corridor Sands project in Mozambique. These risks include: expropriation or nationalization of property; currency fluctuations (particularly in countries with high inflation); restrictions on the ability to pay dividends offshore; risks of loss due to civil strife, acts of war, guerilla activities, insurrection and terrorism; and other risks arising out of foreign sovereignty over the areas in which operations are conducted. Consequently, our exploration, development, and future production activities outside of Australia may be adversely affected by factors beyond our control, any of which could materially adversely affect our financial position or results of operations. Furthermore, in the event of a dispute arising from such activities, we may be subject to the exclusive jurisdiction of courts outside Australia or may not be successful in subjecting persons to the jurisdiction of the courts in Australia, which could adversely affect the outcome of a dispute.
We are subject to stringent environmental laws and regulations, which impose substantial costs and subject us to significant potential liabilities.
Compliance with environmental laws and regulations imposes substantial costs and subjects us to significant potential liabilities. Our business is subject to particular risks and liabilities associated with pollution of the environment and the disposal of waste products occurring as a result of mineral exploration and production. Our operations in Australia are subject to stringent federal, state and local laws and regulations relating to improving or maintaining environmental quality. Environmental laws often require parties to pay for remedial action or to pay damages regardless of fault. Environmental laws also often impose liability with respect to divested or terminated operations, even if the operations were terminated or divested many years ago. Costs associated with environmental and regulatory compliance have increased over time. In addition, the costs of environmental obligations may exceed the reserves we have established for these liabilities. For a discussion of our significant remediation projects in Australia, see “Business Description—Environmental Matters”.
19
Table of Contents
We cannot reasonably estimate the cost of future compliance or remedial work or further investment necessitated through the introduction of further environmental regulation or by any causes of contamination, including those occurring prior to the introduction of such regulation or before or after the property in question was owned or occupied by us. Among other things, the level of these costs will be dependent upon the nature and extent of the current and future environmental regulation, the time and nature of required remedial work, the extent of any contamination, the technology available to meet the required standards, the determination of our liabilities in proportion to those of other parties and the extent to which costs are recoverable from insurance and third parties.
Native Title in Australia.
“Native Title” describes the rights and interests of Aboriginal and Torres Strait Islander people in land and waters according to their traditional laws and customs that are recognized under Australian law. There are current claimant applications for native title determinations in the Federal Court of Australia over areas that include the majority of our operations. We cannot make any assessment as to whether any of our existing assets or operations will be materially affected until court determinations are made. Court decisions and various pieces of legislation make it evident that there are complex legal and factual issues affecting our existing and future interests. Accordingly, the impact of native title is being closely monitored but cannot be determined at this time. See “Business Description—Legal Proceedings—Native Title in Australia” for a discussion of native title issues in Australia that have an impact on our operations.
Risks in Relation to the Notes
Since each series of Notes is unsecured, your right to receive payments may be adversely affected.
Each series of Notes that WMC Finance (USA) is offering for exchange in this prospectus will be unsecured. If WMC Finance (USA) defaults on either series of Notes or the guarantors default on their respective guarantees as a result of the bankruptcy, liquidation or reorganization of either WMC Finance (USA) or any of the guarantors, then, to the extent that any of the guarantors or the issuer have granted security over our assets, the assets that secure our debts will be used to satisfy the obligations under that secured debt before payment on the Notes or the guarantees can be made. In such a case, there may only be limited assets available to make payments on the Notes or the guarantees in the event of an acceleration of the Notes. If there is not enough collateral to satisfy the obligations of the secured debt then the remaining amounts on the secured debt would share equally with all unsubordinated unsecured indebtedness.
The subsidiary guarantees may be released in the future if certain events occur.
Under the terms of the indenture as supplemented by the first supplemental indenture, a subsidiary guarantor shall be automatically and unconditionally released from its guarantee upon:
| • | any sale, exchange or other disposition (including by way of consolidation or merger) to any person (other than an affiliate of ours) of all of the equity securities of such subsidiary guarantor or all or substantially all of the assets of such subsidiary guarantor, or |
| • | such subsidiary guarantor ceasing to be a restricted subsidiary under the indenture, in each case in compliance with the terms of the indenture as supplemented by the first supplemental indenture, or |
| • | such subsidiary guarantor ceasing to be a guarantor of (or co-obligor on) any funded indebtedness other than the Notes and other than funded indebtedness the related guarantee (or obligations) of which |
| • | is subject to a release provision similar to the release provision described in this paragraph, and |
| • | will be released concurrently with the release of the guarantee of such subsidiary guarantor pursuant to such release provision. |
20
Table of Contents
Currently, in order for a subsidiary guarantee to be released under the Notes, the relevant subsidiary guarantor would have to have no further guarantee obligations under our senior credit facility or other funded indebtedness in excess of A$25 million. See “Description of the New Notes and Guarantees.”
To the extent that one or both subsidiary guarantors released as described above, the parent guarantor would depend on dividends, loans or advances, or payments from the subsidiary guarantors to satisfy its financial obligations and make payments to its investors to the extent the parent guarantor could not satisfy them through its own operations and earnings. The ability of the subsidiary guarantors to pay dividends and make other payments to the parent guarantor is restricted by, among other things, applicable corporate and other laws and regulations. This ability may be further restricted in the future by agreements to which the subsidiary guarantors may be parties. Accordingly, in certain circumstances, the parent guarantor may be unable to make required payments on its debt obligations, including the guarantee of the Notes, as those obligations become due.
If WMC Finance (USA) defaults on the Notes, or any of the guarantors default on their respective guarantees, your right to receive payments on the Notes or the guarantees may be adversely affected by Australian insolvency laws.
The guarantors and WMC Finance (USA) are incorporated under the laws of Australia and, therefore, insolvency proceedings with respect to them would likely proceed under, and be governed by, Australian insolvency law. The procedural and substantive provisions of Australian insolvency laws are generally more favorable to secured creditors than comparable provisions of United States law. These provisions afford debtors and unsecured creditors only limited protection from the claims of secured creditors, and it will generally not be possible for any of the guarantors, the issuer or other unsecured creditors to prevent or delay the secured creditors from enforcing their security to repay the debts due to them.
Service of process, enforcement of judgments and bringing of original actions in the United States may be more difficult.
Since we and our officers and directors reside outside the United States and a substantial portion of our assets are located outside the United States, there is a risk that service of process, enforcement of judgments and bringing of original actions by a U.S. investor would be more difficult than it would be in the United States.
21
Table of Contents
This prospectus contains forward-looking statements, including statements regarding (i) estimated reserves, (ii) certain plans, strategies and objectives of management, (iii) scheduled closure of certain operations or facilities, (iv) scheduled refurbishment, repair, maintenance, reconstruction and recommissioning activities, (v) anticipated production or construction commencement dates, (vi) expected costs or production output, (vii) the anticipated productive lives of projects and mines and (viii) the anticipated prices and market dynamics of commodities produced. These forward-looking statements are not guarantees of future performance and involve known and unknown risks, uncertainties and other factors, many of which are beyond our control, which may cause actual results to differ materially from those expressed in such forward-looking statements.
For example, future revenues from operations, projects or mines described in this prospectus will be based in part on the market price of the minerals or metals produced, which may vary significantly from current levels. These variations, if materially adverse, may impact the timing or feasibility of the development of a particular project or the expansion of certain facilities or mines. Other factors that may affect the actual construction or production commencement dates, costs or production output and anticipated lives of operations, mines or facilities include:
| • | the ability to profitably produce and transport the minerals or metals extracted to applicable markets; |
| • | the impact of foreign currency exchange rates on the market prices of the minerals or metals produced; and |
| • | activities of governmental authorities in certain countries where such projects, facilities or mines are being explored or developed, including increases in taxes, changes in environmental and other regulations, and political uncertainty. |
We can give no assurances that the estimated reserve figures, the scheduled closure of such operations or facilities, actual production or commencement dates, cost or production output, or anticipated lives of the projects, mines and facilities discussed herein will not differ materially from the statements contained in this prospectus.
We will not receive any proceeds from the exchange offers. In exchange for issuing the New Notes as contemplated in this prospectus, we will receive Old Notes in like principal amount, the terms of which are essentially identical in all material respects to the New Notes. The Old Notes surrendered in exchange for the new Notes will be retired and cancelled and cannot be reissued. Accordingly, the issuance of the new Notes will not result in any increase in our indebtedness. Net proceeds from the private placements of the Old Notes were used to discharge a US$500 million 364 day term facility, with an effective interest rate of LIBOR plus 0.65%, to discharge US$120 million of Facility A, wth an effective interest rate of LIBOR plus 0.70%, and US$50 million of Facility B, with an effective interest rate of LIBOR plus 0.90%, both of which were incurred under our US$600 million senior credit facility and to use approximately US$24 million to close out a hedge we entered into to protect our exposure to interest rate movements in the period between the tender offer for WMC Limited’s outstanding bonds and the completion of the private placement.
WHERE YOU CAN FIND MORE INFORMATION ABOUT THE WMC RESOURCES GROUP
WMC Resources Ltd files annual and special reports and other information with the SEC. You may read and copy any document that they file at the SEC’s public reference room located at 450 Fifth Street, N.W., Washington, D.C. 20549. Please call the SEC at 1-800-SEC-0330 for further information on the public reference room. You may also access this information through the SEC’s website via the EDGAR system at www.sec.gov.
22
Table of Contents
American depositary shares representing ordinary shares of WMC Resources Ltd are listed on the New York Stock Exchange, and ordinary shares of WMC Resources Ltd are listed on the Australian Stock Exchange. You can request reports and other information about us that WMC Resources Ltd has filed pursuant to the rules of the New York Stock Exchange and the Australian Stock Exchange through those exchanges.
Information in our exchange offer registration statement is available to holders of notes without charge upon written or oral request. Please contact The Bank of New York, attention Mr. Santino Ginocchietti, at 101 Barclay Street, 7th Floor, East, New York, New York 10286, telephone (212) 815-6331, fax (212) 815-1915 to make a request. To obtain timely delivery, any request should be made no later than five business days prior to the date you need the information.
We will make available to the holders of the Notes, at the corporate trust office of the trustee under the indenture governing the Notes, copies of the indenture and the first supplemental indenture, as well as our annual reports and other periodic reports, including a review of operations, and annual audited Consolidated Financial Statements prepared in conformity with Australian GAAP. Our annual audited Consolidated Financial Statements will include a reconciliation to US GAAP, of the material variations in the generally accepted accounting principles used in Australia. We will also make available at the office of the trustee semi-annual Consolidated Financial Statements, prepared in accordance with Australian GAAP. We will make available, upon request, the annual financial statements of the issuer.
ENFORCEMENT OF CIVIL LIABILITIES
The issuer and the guarantors are each corporations organized under the laws of the Commonwealth of Australia. All the directors and officers of these companies, and some of the experts named in this document, reside outside the United States, principally in Australia. A substantial portion of the assets of these companies, and the assets of the directors, officers and experts, is located outside the United States. Therefore, you may not be able to effect service of process within the United States upon these companies or persons so that you may enforce judgments of United States courts against them based on the civil liability provisions of the United States federal securities laws. In addition, there are doubts as to the ability of an investor to bring an original action in an Australian court to enforce liabilities against us or any person based on US federal securities laws.
CURRENCY OF PRESENTATION AND EXCHANGE RATES
In this prospectus, unless otherwise specified or required by the context, references to “US$” or “US dollars” are to United States dollars and references to “A$” are to Australian dollars. For your convenience, this prospectus contains translations of certain Australian dollar amounts into US dollars at the rate or rates indicated. Unless otherwise stated, we have translated Australian dollars into US dollars at the noon buying rate in New York City for cable transfers in Australian dollars as certified for customs purposes by the Federal Reserve Bank of New York (the “noon buying rate”) on June 16, 2003 of A$1.00 = US$0.6676. These translations should not be construed as representations that the Australian dollar amounts actually represent such US dollar amounts or could be converted into US dollars at the rate indicated.
23
Table of Contents
The following table sets forth exchange rate information expressed in terms of US$ based on the noon buying rate.
Period | At Period End | Average Rate(1) | High | Low | ||||
| �� | (all figures in US$ per A$1.00) | |||||||
Year Ended December 31, 1998 | 0.6123 | 0.6300 | 0.6868 | 0.5550 | ||||
Year Ended December 31, 1999 | 0.6560 | 0.6440 | 0.6712 | 0.6179 | ||||
Year Ended December 31, 2000 | 0.5560 | 0.5757 | 0.6687 | 0.5112 | ||||
Year Ended December 31, 2001 | 0.5117 | 0.5127 | 0.5712 | 0.4828 | ||||
Year Ended December 31, 2002 | 0.5625 | 0.5447 | 0.5748 | 0.5060 | ||||
December 2002 | 0.5660 | 0.5589 | ||||||
January 2003 | 0.5922 | 0.5629 | ||||||
February 2003 | 0.6075 | 0.5843 | ||||||
March 2003 | 0.6161 | 0.5905 | ||||||
April 2003 | 0.6262 | 0.5970 | ||||||
May 2003 | 0.6585 | 0.6298 | ||||||
| (1) | The average of the noon buying rates on the last business day of each month during the financial period presented. |
The noon buying rate on June 16, 2003 was A$1.00 = US$0.6676.
The Australian dollar is convertible into US dollars at freely floating rates and there are currently no restrictions on the flow of Australian currency between Australia and the United States. Our financial statements are presented in Australian dollars.
The Australian Banking (Foreign Exchange) Regulations and other Australian legislation and regulations control the import and export of capital and remittance of payments involving non-residents of Australia. We are not restricted from receiving funds into or transferring funds from Australia to the credit of non-residents of Australia but in certain cases we are required to:
| (i) | withhold Australian taxes; |
| (ii) | obtain authorization from the Federal Reserve Bank of Australia— |
to place any sum in Australia to the credit of, or make any payment in Australia to, by order of or on behalf of:
| • | the Government of Iraq, its agencies or nationals; |
| • | certain entities related to the Federal Republic of Yugoslavia (in limited circumstances) and 81 named individuals associated with the former Milosevic regime; |
| • | certain ministers and senior officials of the Government of Zimbabwe; |
| • | the Taliban or any undertaking owned or controlled, directly or indirectly, by the Taliban or specific associated individuals, entities, agencies associated with the Taliban, Osama bin Laden, al-Qaeda or other terrorists or their sponsors; or |
to sell or purchase foreign currency or take or send from Australia any Australian currency where that transaction relates to:
| • | property, securities or funds in Australia belonging either directly or indirectly to, or other payments to, the Government of Iraq, its agencies or nationals; |
24
Table of Contents
| • | property, securities or funds belonging either directly or indirectly to certain entities related to the Federal Republic of Yugoslavia (in limited circumstances) and 81 named individuals associated with the former Milosevic regime; |
| • | property, securities or funds in Australia owned or controlled, directly or indirectly, by or otherwise relating to payments to certain ministers and senior officials of the Government of Zimbabwe; or |
| • | property, securities or funds owned or controlled directly or indirectly by, or otherwise relating to payments to, or for the benefit of, the Taliban, or any undertaking owned or controlled, directly or indirectly, by the Taliban or specific associated individuals, entitles, agencies associated with the Taliban, Osama bin Laden, al-Qaeda or other terrorists or their sponsors; and |
| (iii) | lodge a report of the transaction details. |
There are no limitations, under the laws of Australia, on the right of non-residents to acquire, hold or vote our ordinary shares, except for the Foreign Acquisitions and Takeovers Act 1975 (Cth) (the “Act”) and section 606 of the Corporations Act 2001 (Cth) (the “Corporations Act”). The Act controls the rights of non-residents to hold 15% or more of the total voting powers as outstanding shares of an Australian company, but it does not affect the rights attaching to shares that are held or acquired in accordance with its provisions.
Under the Act, any acquisition or issue of shares (including the acquisition of an option to acquire shares) which would increase or alter beyond 15% in the case of any single foreign interest, or 40% in the case of more than one foreign interest, the level of foreign ownership in a corporation that carries on an Australian business is subject to review and approval by the Treasurer of the Commonwealth of Australia.
The Act permits the Treasurer to deny or refuse proposals where such proposals would be contrary to the Australian national interest.
Section 606 of the Corporations Act provides that, subject to certain exceptions, a person must not acquire a relevant interest in shares in a company if, as a result, someone’s voting power in the company increases to more than 20%, or increases from a starting point that is above 20% and below 90%. Section 606 also prohibits a person from acquiring a legal or equitable interest in shares if, because of the acquisition, another person acquires a relevant interest in shares and someone’s voting power increases to more than 20%, or increases from a starting point that is above 20% and below 90%. Section 608 of the Corporations Act provides that a person has a “relevant interest” in shares if that person holds the shares, or has power or control over the voting rights attaching to them or their disposal, whether directly or indirectly.
The foregoing summary does not purport to be complete and is qualified in its entirety by reference to the applicable legislation and to our Constitution. A copy of our current Constitution has been previously filed with the SEC as Exhibit 1 to our Registration Statement on Form 20-F, filed on December 2, 2002 (File No. 1-31554).
25
Table of Contents
General
WMC Finance (USA) Limited, the issuer of the Notes, is a corporation organized under the laws of the Commonwealth of Australia. The issuer was incorporated in September 1993.
The issuer is a wholly-owned finance subsidiary of WMC Resources Ltd. The issuer was formed for the primary purpose of borrowing on behalf of our group and advancing the net proceeds of such borrowings to members of our group. The principal executive offices of the issuer are located at Level 16, 60 City Road, Southbank, Victoria 3006, Australia and its telephone number is +61-3-9685-6000.
Directors
The issuer’s current directors are:
Name
Bruce R. Brook
Alan K. Dundas
Andrew G. Michelmore
Michael Nossal
Greg J. Travers
All directors have a business address of Level 16, 60 City Road, Southbank, Victoria 3006, Australia.
Capitalization and Indebtedness of the issuer
The following table sets out the capitalization and indebtedness of the issuer at December 31, 2002.
At December 31, 2002 | |||
(in A$ thousands) | |||
Amounts in accordance with Australian GAAP | |||
Short-term debt | 33,915 |
| |
Long-term debt | 7,991 |
| |
Total debt | 41,906 |
| |
Shareholders’ funds: | |||
Share capital(1) | 153,354 |
| |
Accumulated losses | (105,370 | ) | |
Total capitalization(2) | 89,890 |
| |
| (1) | At December 31, 2002, the issued share capital of WMC Finance (USA) was A$153,353,641 and comprised 153,353,641 fully paid ordinary shares of A$1.00 each. |
| (2) | In the period from December 31, 2002 to March 31, 2003, the capitalization of the issuer changed by the net result for the three months, which was a loss of A$6.6 million, arising from the settlement of certain intragroup transactions. At the WMC Resources Group level, the loss eliminated entirely. |
26
Table of Contents
CAPITALIZATION AND INDEBTEDNESS
The following tables set out our capitalization at December 31, 2002, and as adjusted for the effect of the private placement of the Old Notes on May 8, 2003 and any significant events affecting our capitalization through the date of this prospectus, in accordance with Australian GAAP and US GAAP. The exchange offer extended by this prospectus will not affect our capitalization or indebtedness because the New Notes being offered carry essentially identical terms to the Old Notes that will be exchanged.
| As at December 31, 2002 | ||||||||||||
| Actual(1) | As adjusted(1)(4) | Actual | As adjusted(4) | |||||||||
| (millions) | ||||||||||||
Amounts in Accordance with Australian GAAP | ||||||||||||
Short-term debt | US$ | 859.6 | US$ | 129.1 | A$ | 1,287.6 | A$ | 193.4 | ||||
Long-term debt (unsecured) | 246.9 | 1,012.8 | 369.9 | 1,517.1 | ||||||||
Shareholders’ funds | 2,407.8 | 2,407.7 | 3,606.6 | 3,606.6 | ||||||||
Total Capitalization(2)(3) | US$ | 3,514.3 | US$ | 3,549.6 | A$ | 5,264.1 | A$ | 5,317.1 | ||||
Amounts in Accordance with US GAAP | ||||||||||||
Short-term debt | US$ | 859.6 | US$ | 129.1 | A$ | 1,287.6 | A$ | 193.4 | ||||
Long-term debt (unsecured) | 246.9 | 1,012.8 | 369.9 | 1,517.1 | ||||||||
Shareholders’ equity | 1,721.6 | 1,721.6 | 2,578.8 | 2,578.8 | ||||||||
Total Capitalization(2) | US$ | 2,828.1 | US$ | 2,863.5 | A$ | 4,236.3 | A$ | 4,289.3 | ||||
| (1) | Australian dollar amounts have been translated into US dollars solely for the convenience of the reader at the rate of A$1.00 = US$0.6676, the Noon Buying Rate on June 16, 2003. A significant portion of the Company’s liabilities and revenues and a portion of the assets and expenses are denominated in currencies other than Australian dollars and, for the purpose of preparing the financial data for the year ended December 31, 2002 have been translated into Australian dollars using the rate on December 31, 2002 of A$1.00 = US$0.5666, or average rates for the 2002 fiscal year, as appropriate. The convenience translation of these Australian dollar amounts into US dollars therefore does not necessarily represent the actual US dollar value of such assets and liabilities or revenues and expenses. The noon buying rate on December 31, 2002 was A$1.00 = US$0.5625. See “Currency of Presentation and Exchange Rates”. |
| (2) | Does not include ascertainable, unsecured contingent liabilities of A$49.3 million represented by guarantees, insurance bonds and other liabilities including performance bonds for minimum work commitments in exploration blocks. |
| (3) | There has been no material change in our capitalization or indebtedness since December 31, 2002. |
| (4) | The “as adjusted” column reflects the impact of the debt refinancing accomplished by the private placement of the Old Notes on May 8, 2003. The net proceeds from the US$700 million of guaranteed notes issued in that private placement have been translated as per footnote(1) above. |
For a discussion of the principal differences between Australian GAAP and US GAAP, and a reconciliation of net income and shareholders’ equity to US GAAP, we refer you to Note 45 to our Consolidated Financial Statements included in this prospectus.
27
Table of Contents
The selected financial data appearing below as at December 31, 2002 and 2001 and for the years ended December 31, 2002, 2001 and 2000 are set forth in Australian dollars (except as otherwise indicated), and are extracted, in relevant part, from our audited Consolidated Financial Statements which appear elsewhere herein. The selected financial data appearing below as at December 31, 2000 and for the year ended December 31, 1999 are extracted, in relevant part, from audited Combined Financial Statements. The summary financial data appearing below as at December 31, 1999 and 1998 and for the year ended December 31, 1998 are derived from unaudited consolidated financial data that is not included herein. As discussed in Note 1 to the Consolidated Financial Statements, the financial statements herein reflect the statements of financial performance and statements of financial position as if we were a separate entity for all periods presented. The historical financial information may not be indicative of our future performance and does not reflect what our financial position and results of operations would have been had we operated as a separate, stand-alone entity during the periods presented. These Consolidated Financial Statements have been prepared in accordance with Australian GAAP, which differs in certain respects from US GAAP. Note 45 to the Consolidated Financial Statements provides an explanation of these differences as they affect us and reconciliations from Australian GAAP to US GAAP of net income, comprehensive income, certain balance sheet items, shareholders’ equity and cashflows.
Statement of Financial Performance
| Year ended December 31, | |||||||||||||||||||||||
| 2002(1) | 2002 | 2001 | 2000 | 1999 | 1998 | ||||||||||||||||||
| (millions, except per share amounts) | |||||||||||||||||||||||
Amounts in accordance with Australian GAAP | |||||||||||||||||||||||
Net sales revenue from continuing operations | US$ | 1,660.5 | A$ | 2,487.2 | A$ | 2,364.1 | A$ | 2,666.0 | A$ | 1,672.7 | A$ | 1,315.1 | |||||||||||
Profit/(loss) before interest and income tax from continuing operations | 78.5 | 117.6 | 71.9 | 782.5 | 86.8 | (362.1 | ) | ||||||||||||||||
Net interest expense(2) | 83.2 | 124.6 | 140.9 | 148.1 | 78.6 | 4.8 | |||||||||||||||||
Net (loss)/profit from continuing operations | (9.8 | ) | (14.7 | ) | (157.5 | ) | 327.2 | (5.7 | ) | (215.9 | ) | ||||||||||||
Net profit from discontinued operations | 25.2 | 37.7 | 283.5 | 72.7 | 89.8 | 167.4 | |||||||||||||||||
Net profit/(loss) attributable to shareholders | 15.4 | 23.0 | 126.0 | 399.9 | 84.1 | (48.5 | ) | ||||||||||||||||
Net income/(loss) per share ($/share)(7) | US$ | 0.01 | A$ | 0.02 | A$ | 0.11 | A$ | 0.35 | A$ | 0.07 | A$ | (0.07 | ) | ||||||||||
Net income/(loss) from continuing operations per ordinary share ($/share)(4)(7) | (0.01 | ) | (0.01 | ) | (0.14 | ) | 0.29 | (0.01 | ) | (0.19 | ) | ||||||||||||
Diluted net income/(loss) from continuing operations per ordinary share ($/share)(6)(7) | (0.01 | ) | (0.01 | ) | (0.14 | ) | 0.29 | (0.01 | ) | (0.19 | ) | ||||||||||||
Amounts in accordance with US GAAP | |||||||||||||||||||||||
Net sales revenue from continuing operations | US$ | 1,660.5 | A$ | 2,487.2 | A$ | 2,364.1 | A$ | 2,666.0 | A$ | 1,672.7 | A$ | 1,315.1 | |||||||||||
Net (loss)/profit from continuing operations | (81.0 | ) | (121.3 | ) | (231.5 | ) | 241.6 | (9.2 | ) | (220.8 | ) | ||||||||||||
Net profit/(loss) attributable to shareholders | (73.1 | ) | (109.5 | ) | 37.7 | 307.6 | 52.1 | (60.1 | ) | ||||||||||||||
Comprehensive income/(loss) | 57.5 | 86.2 | (804.7 | ) | 288.4 | 2.1 | (98.5 | ) | |||||||||||||||
Net income/(loss) per share ($/share)(7) | US$ | (0.06 | ) | A$ | (0.09 | ) | A$ | 0.03 | A$ | 0.27 | A$ | 0.05 | A$ | (0.05 | ) | ||||||||
Net income/(loss) from continuing operations per ordinary share ($/share)(4)(5)(7) | (0.09 | ) | (0.14 | ) | (0.21 | ) | 0.21 | (0.02 | ) | (0.19 | ) | ||||||||||||
Diluted net income/(loss) from continuing operations per ordinary share ($/share)(6)(7) | (0.09 | ) | (0.14 | ) | (0.21 | ) | 0.21 | (0.02 | ) | (0.19 | ) | ||||||||||||
28
Table of Contents
Statement of Financial Position
| As at December 31, | ||||||||||||||||||
| 2002(1) | 2002 | 2001 | 2000 | 1999 | 1998 | |||||||||||||
| (millions) | ||||||||||||||||||
Amounts in accordance with Australian GAAP | ||||||||||||||||||
Total assets | US$ | 4,905.6 | A$ | 7,348.1 | A$ | 8,242.9 | A$ | 8,597.0 | A$ | 7,275.8 | A$ | 7,374.3 | ||||||
Long-term obligations | 1,141.0 | 1,709.1 | 3,476.3 | 4,304.2 | 3,053.1 | 3,592.6 | ||||||||||||
Shareholders’ equity | 2,407.8 | 3,606.6 | 3,220.3 | 3,123.8 | 3,214.3 | 3,010.8 | ||||||||||||
Amounts in accordance with US GAAP | ||||||||||||||||||
Total assets | US$ | 4,437.0 | A$ | 6,646.2 | A$ | 6,691.4 | A$ | 8,368.2 | A$ | 7,146.7 | A$ | 7,296.6 | ||||||
Long-term obligations | 1,141.0 | 1,709.1 | 3,476.3 | 4,304.2 | 3,053.1 | 3,592.6 | ||||||||||||
Shareholders’ equity | 1,721.6 | 2,578.8 | 2,068.8 | 2,888.9 | 3,071.7 | 2,893.7 | ||||||||||||
Statement of Cash Flows
| Year ended December 31, | ||||||||||||||||||||
| 2002 | 2001 | 2000 | 1999 | 1998 | ||||||||||||||||
| (millions) | ||||||||||||||||||||
Amounts in accordance with Australian GAAP | ||||||||||||||||||||
Net cash provided by operating activities | A$ | 336.7 | A$ | 577.7 | A$ | 898.1 | A$ | 164.9 | A$ | 172.3 | ||||||||||
Net cash provided by/(used in) investing activities | (381.0 | ) | 279.1 | (419.3 | ) | (624.7 | ) | (1,337.6 | ) | |||||||||||
Net cash (used in)/provided by financing activities | 15.8 | (793.7 | ) | (508.9 | ) | 485.1 | 1,128.8 | |||||||||||||
Net increase/(decrease) in cash held | (28.5 | ) | 63.1 | (30.1 | ) | 25.3 | (36.5 | ) | ||||||||||||
Other financial data
| Year ended December 31, | |||||||||||||||||||
| 2002 | 2002 | 2001 | 2000 | 1999 | 1998 | ||||||||||||||
| (millions) | |||||||||||||||||||
EBITDA(3) | US$ | 350.6 | A$ | 525.1 | A$ | 399.3 | A$ | 1,059.2 | A$ | 320.7 | A$ | (82.6 | ) | ||||||
Capital expenditure | 313.4 | 469.4 | 456.9 | 468.6 | 984.9 | 1,932.0 | |||||||||||||
| (1) | Australian dollar amounts have been translated into US dollars solely for the convenience of the reader at the rate of A$1.00 = US$0.6676, the Noon Buying Rate on June 16, 2003. A significant portion of the Company’s liabilities and revenues and a portion of the assets and expenses are denominated in currencies other than Australian dollars and, for the purpose of preparing the financial data for the year ended December 31, 2002 have been translated into Australian dollars using an exchange rate on December 31, 2002 of A$1.00 = US$0.5666, or average exchange rates for the 2002 fiscal year, as appropriate, as required under Australian GAAP. The convenience translation of these Australian dollar amounts into US dollars therefore does not necessarily represent the actual US dollar value of such assets and liabilities or revenues and expenses as of the dates or for the periods presented. The noon buying rate on December 31, 2002 was A$1.00 = US$0.5625. See “Currency of Presentation and Exchange Rates”. |
| (2) | Net interest expense is equal to gross interest expense less interest income, such as interest income generated from interest rate swaps and cross currency swaps entered into with respect to our borrowings. It does not include capitalized interest of A$3.5 million in 2002, A$0.0 in 2001, A$24.9 million in 2000, A$61.9 million in 1999 and A$89.9 million in 1998. See Note 3 to our Consolidated Financial Statements for a reconciliation of gross interest expense to net interest expense. The net interest expense for 2002 does not include one-off interest income of A$75.9 million generated from the early termination of interest rate |
29
Table of Contents
| swaps in conjunction with the demerger. Our historical gross and net interest expense was based primarily on the level of debt existing prior to the demerger. In conjunction with the demerger, our level of debt was reduced by approximately A$577 million. In addition, our historical gross and net interest expense reflected debt bearing interest rates higher than the interest rates that apply to our existing debt. For 2003, we expect that our gross interest expense will be approximately A$77.4 million based on the lower level of debt following the demerger and these lower interest rates (taking into account the placement of US$700 million of the Notes, the application of the proceeds thereof and expected exchange rates for the year). |
| (3) | EBITDA is defined as profit before interest and income tax plus depreciation and amortization, and reflects only continuing operations. EBITDA should not be construed as an alternative to operating income, or net income, as determined in accordance with Australian or US GAAP, as an indicator of our operating performance, or as an alternative to cash flows from operating activities, as determined in accordance with Australian or US GAAP, as a measure of liquidity. EBITDA is presented solely as supplemental disclosure because we believe that it is a widely used measure of operating performance and we use it to measure our internal profitability. Because all companies do not calculate EBITDA identically, the presentation of EBITDA in this prospectus is not necessarily comparable to similarly entitled measures of other companies. |
A reconciliation of EBITDA to profit before interest and income tax from continuing operations is as follows:
| Year ended December 31, | ||||||||||||||||||||
| 2002 | 2001 | 2000 | 1999 | 1998 | ||||||||||||||||
| (millions) | ||||||||||||||||||||
EBITDA | A$ | 525.1 | A$ | 399.3 | A$ | 1,059.2 | A$ | 320.7 | A$ | (82.6 | ) | |||||||||
Depreciation and amortization | (511.0 | ) | (480.9 | ) | (428.8 | ) | (318.3 | ) | (327.4 | ) | ||||||||||
Interest income | 103.5 | 153.5 | 152.1 | 84.4 | 47.9 | |||||||||||||||
Profit before interest expense and income tax from continuing operations | 117.6 | 71.9 | 782.5 | 86.8 | (362.1 | ) | ||||||||||||||
| (4) | The number of our shares used in the 2002 basic net income per share calculation was determined on the basis of the weighted average number of outstanding WMC Limited shares for the 11 months to November 30, 2002 (the effective demerger date) and the actual number of WMC Resources Ltd shares for the month of December 2002. For prior periods, the number of our shares used in the basic net income per share calculation was determined on the basis of the weighted average number of outstanding WMC Limited shares for the periods indicated; as in the demerger each WMC Limited shareholder received one of our shares for each share in WMC Limited it held. Refer also to Notes 1(y) and 6 to the Consolidated Financial Statements included in this prospectus. |
| (5) | On a US GAAP basis, net loss from continuing operations per share in 1999 was A$0.04 before the cumulative effect of an accounting policy change for start-up costs. On a US GAAP basis, net loss from continuing operations per share in 2002 was A$0.06 before the cumulative effect of an accounting policy change for amortization of mine development and post-production waste removal costs. |
| (6) | The number of our shares used in the 2002 diluted net income from continuing operations per share calculation was determined on the basis of the weighted average of the number of outstanding WMC Limited shares for the 11 months to November 30, 2002 (the effective demerger date) and the actual number of WMC Resources Ltd shares for the month of December 2002. For prior periods, the number of our shares used in the diluted net income from continuing operations per share calculation was determined on the basis of the weighted average of the number of outstanding WMC Limited shares for the periods indicated, including potential shares from the conversion of partly paid shares and options into shares of WMC Limited. Refer also to Notes 1(y) and 6 to the Consolidated Financial Statements. |
| (7) | The number of shares used in our per share calculations were as follows: |
Year ended December 31, | ||||||||||
2002 | 2001 | 2000 | 1999 | 1998 | ||||||
| (millions of shares) | ||||||||||
Basic | 1,115.8 | 1,103.3 | 1,127.1 | 1,146.1 | 1,140.8 | |||||
Diluted | 1,127.3 | 1,120.8 | 1,137.4 | 1,161.9 | 1,149.0 | |||||
30
Table of Contents
SELECTED UNAUDITED PRO FORMA FINANCIAL DATA
In December 2002, WMC Limited completed the demerger of its interests in the Alcoa World Alumina and Chemicals venture with Alcoa Inc. from its other businesses and interests. Through an Australian court-approved scheme of arrangement, WMC Limited distributed the shares it held in us to its shareholders and we became an independent consolidated group. In conjunction with the demerger, WMC Limited undertook some internal restructuring and effected some share transfers. Thus, as part of the scheme of arrangement, WMC Resources Ltd acquired from WMC Limited the shares it held in the legal entities within the WMC Limited group that held the copper-uranium and fertilizer operations and assets as well as WMC Limited’s exploration and development interests. In addition, as part of the scheme of arrangement, WMC Limited transferred some other entities to WMC Resources Ltd and we replaced some of WMC Limited’s debt facilities and borrowings with new debt facilities and borrowings. Under Australian GAAP, these transfers, which included the fair value transfer of some derivative and financial instruments held in finance subsidiaries transferred to WMC Resources Ltd in connection with the scheme of arrangement and demerger, were required to be at fair value on the date of the transfer. Under US GAAP, these transfers were accounted for at book value.
Our selected unaudited pro forma financial data, set forth below, was extracted in relevant part from our unaudited pro forma Consolidated Financial Statements, which appear elsewhere in this prospectus. Our unaudited pro forma Consolidated Financial Statements are derived from our historical audited Consolidated Financial Statements for the fiscal year ended December 31, 2002. The unaudited pro forma consolidated statement of income for the year ended December 31, 2002 gives pro forma effect to the demerger, as though the demerger had occurred on January 1, 2002. The unaudited pro forma financial data is presented for illustrative purposes only and does not purport to represent what our actual financial performance would have been if the demerger had occurred at January 1, 2002. Our unaudited pro forma Consolidated Financial Statements should be read in connection with, and are qualified by reference to, our historical Consolidated Financial Statements and “Operating and Financial Review and Prospects” in this prospectus.
Unaudited Pro Forma Income Statement
| Year ended December 31, 2002 | ||||||||||||||||
| Historical | Pro Forma Adjustments | Pro Forma | Pro Forma(5) | |||||||||||||
| (millions) | ||||||||||||||||
Amounts in accordance with Australian GAAP | ||||||||||||||||
Net sales revenue from continuing operations | A$ | 2,487.2 | A$ | — | A$ | 2,487.2 | US$ | 1,660.5 | ||||||||
Income (loss) before interest and tax from continuing operations | 117.6 | (6.0 | )(1) | 111.6 | 74.5 | |||||||||||
Interest (expense)/income (gross) | (152.2 | ) | 24.3 | (2) | (127.9 | ) | (85.4 | ) | ||||||||
Income tax credit/(expense) from continuing operations | 19.9 | (7.3 | )(3) | 12.6 | 8.4 | |||||||||||
Net (loss)/profit from continuing operations | (14.7 | ) | 11.0 | (3.7 | ) | (2.5 | ) | |||||||||
Basic and diluted net (loss)/profit from continuing operations, per share ($/share)(6)(7)(8) | (0.01 | ) | 0.01 | — | (9) | — | (9) | |||||||||
Amounts in accordance with US GAAP | ||||||||||||||||
Net (loss)/profit from continuing operations | (121.3 | ) | 17.0 | (4) | (104.3 | ) | (69.6 | ) | ||||||||
Basic and diluted net (loss)/profit from continuing operations, per share ($/share)(6)(7)(8) | (0.14 | ) | 0.05 | (0.09 | ) | (0.06 | ) | |||||||||
| (1) | Under Australian GAAP, our acquisition of WMC Limited’s copper-uranium and fertilizer businesses, WMC Finance Ltd and WMC Finance (USA) Ltd, as well as WMC Limited’s international exploration assets and business other than those relating to Alcoa World Alumina and Chemicals prior to the demerger resulted in the assets and liabilities being transferred at fair value on the date of transfer. The fair values of the net assets of the operations transferred were calculated using discounted cash flow models. Our unaudited pro forma consolidated statement of income includes an adjustment for the difference in |
31
Table of Contents
| depreciation and amortization expense resulting from the differing carrying value of property, plant and equipment, and acquired minerals rights as if the changes in carrying value had been recorded as at January 1, 2002. |
| (2) | In conjunction with the scheme of arrangement and demerger, we obtained new credit facilities to replace the borrowings under WMC Limited’s credit facilities. Our unaudited pro forma consolidated statement of income includes an adjustment to reflect the reduced interest expense under the new debt balance for the full year. |
| (3) | Our unaudited pro forma consolidated statement of income includes an adjustment to the income tax (expense)/credit in relating to the decreased interest expense under the changed debt balance. The adjustment has been calculated at the statutory tax rate in effect during the periods presented of 30%. There is no tax effect applicable to the additional depreciation and amortization expense as these amounts are not deductible for tax purposes. |
| (4) | The pro forma US GAAP adjustment comprises the interest adjustment and the consequential tax adjustment as outlined in (2) and (3) above. Under US GAAP, the demerger is similar to a pro-rata distribution of stock to shareholders and therefore the internal transfers of assets and liabilities made to effect the reorganization and demerger were accounted for at historical cost. Consequently, there is no adjustment of the US GAAP net loss from continuing operations for the difference in depreciation and amortization expense outlined in (1) above as the amortization of the fair value adjustments do not form part of the US GAAP net loss from continuing operations. |
| (5) | Australian dollar amounts have been translated into US dollars solely for the convenience of the reader at the rate of A$1.00 = US$0.6676, the Noon Buying Rate on June 16, 2003. A significant portion of the Company’s liabilities and revenues and a portion of the assets and expenses are denominated in currencies other than Australian dollars and, for the purpose of preparing the financial data for the year ended December 31, 2002 have been translated into Australian dollars using the rate on December 31, 2002 of A$1.00 equals US$0.5666, or average rates for the 2002 fiscal year, as appropriate, as required under Australian GAAP. The convenience translation of these Australian dollar amounts into US dollars therefore does not necessarily represent the actual US dollar value of such assets and liabilities or revenues and expenses. The Noon Buying Rate on December 31, 2002 was A$1.00 = US$0.5625. See “Currency of Presentation and Exchange Rates”. |
| (6) | The number of our shares used in the 2002 basic net income per share calculation was determined on the basis of the weighted average number of outstanding WMC Limited shares for the 11 months to November 30, 2002 (the effective demerger date) and the actual number of WMC Resources Ltd shares for the month of December 2002. Refer also to Notes 1(y) and 6 to the Consolidated Financial Statements. |
| (7) | The number of our shares used in the 2002 diluted net income from continuing operations per share calculation was determined on the basis of the weighted average of the number of outstanding WMC Limited shares for the 11 months to November 30, 2002 (the effective demerger date) and the actual number of WMC Resources Ltd shares for the month of December 2002. Refer also to the Note 1(y) and 6 to the consolidated Financial Statements. |
| (8) | We used 1,128.4 million shares in our 2002 per share calculations. |
| (9) | Amounts per share are less than 1 cent as amounts are rounded to the nearest whole cent. |
32
Table of Contents
OPERATING AND FINANCIAL REVIEW AND PROSPECTS
The following discussion of our operating performance and financial condition uses financial data prepared in accordance with Australian GAAP. The differences between US GAAP and Australian GAAP which are relevant to the preparation of our Consolidated Financial Statements are outlined in Note 45 to the Consolidated Financial Statements which appear elsewhere in this prospectus.
Demerger
We were formed as a result of the demerger of WMC Limited into two entities. Pursuant to the demerger, WMC Resources Ltd acquired the copper-uranium and fertilizer businesses, two finance vehicles, WMC Finance Limited and WMC Finance (USA) Limited, as well as exploration and development interests (other than those relating to AWAC). WMC Resources Ltd already held WMC Limited’s nickel business. WMC Limited, now renamed Alumina Limited, continues to hold the interest in AWAC, costs associated with AWAC and exploration and development interests related to AWAC.
The following discussion of our operating and financial review has been prepared, like the historical financial statements on which the discussion is based, as though we had existed as a stand-alone economic entity, consisting of the businesses and assets identified above, for each of the periods presented. This presentation includes the results of operations which have been discontinued, such as gold and talc, the proceeds from the sale of these same discontinued businesses, and the associated hedging losses incurred by them. As a result, the financial presentation does not entirely reflect our businesses and assets on an on-going basis, the latter being upon the nickel, copper/uranium and fertilizer businesses.
In addition, although the financial statements include all costs and revenues incurred by us for the reported periods, they do not necessarily reflect what the costs and revenues would have been had we existed as a separate, stand-alone economic entity during the periods presented. In particular, in order to achieve improved financial outcomes, management might have made different decisions regarding exploration, project evaluation, corporate expenditure activities and capital structure. Some of the uncertainties surrounding our operating and financial prospects are described in the section entitled “Risk Factors.”
The transactions that occurred in conjunction with the demerger and the manner in which the demerger has been implemented, will also have an affect on our results of operations and financial position in future years relative to our historical results of operations and financial position discussed in this section. In particular, as part of the demerger, WMC Resources Ltd acquired WMC Limited’s copper/uranium and fertilizer businesses and WMC Limited’s international exploration assets and businesses (other than those relating to AWAC) at their fair value as required under Australian GAAP. These internal acquisitions resulted in an increase in the reported value of our consolidated property, plant and equipment and will result in correspondingly higher depreciation and amortization expense in future years compared to historical periods. In addition, in connection with the demerger, we replaced WMC Limited’s debt facilities and borrowings with new debt facilities and borrowings. As a result, following implementation of the demerger, our level of debt was reduced by approximately A$577 million. This lower level of debt will also result in a lower level of annual interest expense associated with borrowings in future years compared to historical periods. Finally, the transfers of WMC Finance Limited and WMC Finance (USA) Limited in connection with the demerger resulted in the accounting for the derivative and financial instruments held in these entities at fair value on the date of transfer as required under Australian GAAP. As a result, our future earnings will only be impacted, in respect of these instruments, by the movement in commodity prices and exchange rates between the date of transfer and the maturity date, although future cash flows will still be impacted, in respect of these instruments, by the movement in commodity prices and exchange rates between the dates when the contracts were originally entered into and their maturity dates. For more information regarding the effect of the demerger on our results of operations and financial position, you should refer to the unaudited pro forma Consolidated Financial Statements for the year ended December 31, 2002 included in this prospectus.
33
Table of Contents
Basis of Preparation
In compliance with Australian Accounting Standards and the Corporations Act 2001, for Australian reporting purposes, we were required to prepare Australian statutory accounts for the year ending December 31, 2002 on a legal entity basis which, for these purposes, reflect the results of the nickel operations and corporate activities for the full 2002 financial year, but only include the results of the copper-uranium, fertilizer and finance activities for the month December 2002, the period from the consummation of the demerger until the end of the financial year. As the statutory presentation does not reflect the full annual financial results of all the businesses that now comprise our group, the Consolidated Financial Statements included in this prospectus have been prepared on a “carve out” basis as though we controlled the copper-uranium, fertilizer and finance activities for the full 2002 fiscal year. A reconciliation of net income on a statutory basis to net income on a “carve out” basis for the year ended December 31, 2002 has been included in “—Reconciliation between net income on a statutory basis and net income on a carve-out basis” in this prospectus.
Critical Accounting Policies
Our critical accounting policies are more fully described in Note 1 to our Consolidated Financial Statements, in respect of Australian GAAP, with differences in accounting policies for US GAAP more fully described in Note 45 to the Consolidated Financial Statements. Some of our accounting policies require the application of significant judgment by management in selecting the appropriate assumptions for calculating financial estimates. By their nature, these judgments are subject to an inherent degree of uncertainty and are based on our historical experience, terms of existing contracts, management’s view on trends in the mining industry and information from outside sources.
Our management believes the following critical accounting policies, among others, affect our more significant judgments and estimates used in the preparation of our consolidated financial statements and could potentially impact our financial results and future financial performance.
Our critical accounting policies include those discussed below.
Amortization of mine properties and mine development assets
We calculate the amortization of mine properties on a straight line basis over the estimated remaining life of those mines or the life of the specific asset, whichever is shorter. Our estimates of remaining mine lives are determined as the period of time over which proven and probable reserves determined in accordance with the SEC’s Industry Guide 7 are expected to be extracted.
We calculate the amortization of our capital cost of mine development on a units-of-production basis over the proven and probable reserves determined in accordance with the SEC’s Industry Guide 7 included in the current mine plan. In order to calculate the amortization charge, we total the costs of development, including net costs incurred to date and estimated future development costs, and divide this by the total proven and probable reserves included in the current mine plan. We calculate the annual depletion based on the units of production during the period multiplied by the per-unit cost.
Our estimate of the total expected future lives and production of our mines could be materially different from our actual production in the future and the actual lives of the mines due to changes in the factors used in determining our ore reserves, such as the commodity prices and foreign currency exchange rates. Any change in management’s estimate of the total expected future lives of our mines may impact the amortization charges we record in our consolidated financial statements in relation to mine properties and mine development. In addition, actual future costs of mine development could differ from those estimated for the purpose of determining the rate of amortization.
Where ore has been mined and subsequently stockpiled for future processing, we include it in the determination of proven and probable reserves. However, we do not include this stockpiled ore in the total
34
Table of Contents
reserves used in the amortization calculation for mine development, as this calculation only references proven and probable reserves included in our current mine plan.
For US GAAP purposes, amortization of the deferred costs of mine development is calculated on a units-of-production basis over the proven and probable reserves which relate to the particular category of development, either “life of mine plan” or reserves for which no further capital expenditure is required. No future developments costs are taken into account in calculating the amortization charge.
Life of mine plan development comprises capital expenditures that will be utilized in the extraction of all the proven and probable ore reserves in the current detailed mine plan. These expenditures are predominantly incurred up front and in advance of any ore extraction or during major expansions. The types of development included in this category are ore haulage shafts, initial decline, ore passes and chutes and underground ore crusher cavities and are intended to be used for the extraction of all ore within the current mine plan. These costs are amortized on a units-of-production basis over the total proven and probable reserves in the current mine plan.
Development which is amortized over reserves for which no further capital is required comprises capital expenditure to provide access to various areas within the mine to allow the extraction of ore to commence. The types of development included within this category are: access and perimeter drives, ventilation drives and rises, and progressive declining subsequent to initial contact with the ore body. These costs are amortized on a units-of-production basis over the proven and probable reserves that can be currently accessed without future capital development costs being incurred.
Post-production waste removal
We accumulate all costs of post-production waste removal (stripping) from open pit mines, and defer them on the balance sheet as part of the total of mine properties and mine development. These costs include the costs of drilling, blasting, loading and haulage of waste rock from the open pit to the waste pile. Consistent with the methodology described above for amortization of mine development costs, we combine these costs with expected future costs of waste removal and amortize them on a units of production basis over proven and probable reserves determined in accordance with the SEC’s Industry Guide 7 included in the current mine plan.
Variations exist in the accounting methods adopted by companies in the mining industry to account for post-production waste removal costs, and certain companies expense these costs as incurred. If we had not adopted a policy of deferring and amortizing these costs, we would have experienced greater volatility in period to period results.
For US GAAP purposes deferred waste removal costs are considered deferred production costs and classified as other non-current assets in the balance sheet, and operating cash flows in the cash flow statement. The amortization of deferred post-production waste removal costs is determined by applying a life-of-mine waste-to-metal stripping ratio. The stripping ratio is calculated by comparing the recoverable metal included in the proven and probable reserves to be extracted over the life of the mine to the total volume of waste to be extracted over the same period. This ratio is then applied to the production of metal for the period to determine the amortization charge.
Recoverable value of long-lived assets
We carry our long-lived mining assets at depreciated historical cost. Our management reviews these carrying values for impairment on a half yearly basis. Where necessary, we revalue the carrying amounts of non-current assets downwards to their recoverable amount. Our reviews are based on undiscounted projections of anticipated future cash flows to be generated by utilizing the long-lived assets.
35
Table of Contents
For US GAAP, our long-lived mining assets are reviewed for impairment annually and when events or changes in circumstances indicate that the carrying amount of an asset may not be recoverable. If we deem an asset impaired, an impairment loss is measured and recorded based on the fair value of the asset, which generally will be computed using discounted expected future cash flows.
While management believes that these estimates of future cash flows are reasonable, different assumptions regarding projected commodity prices, production costs and foreign currency exchange rates could materially affect the anticipated cash flows to be generated by the long-lived assets, thereby affecting the evaluations of the carrying values of the long-lived assets.
Deferred taxation
When determining deferred taxation, our management makes estimates as to the future recoverability of deferred tax assets. If management determines that a deferred tax asset will not be realized, we would record a charge for that portion of the deferred tax assets which is not considered recoverable. These determinations are based on the projected realization of tax allowances and tax losses. In the event that these tax assets are not realized, an adjustment would be required to income in the period that the determination was made. Likewise, should our management determine that we would be able to realize tax assets in the future in excess of the recorded amount, we would record an adjustment to increase the deferred tax asset as a credit to income in the period that the determination is made.
Under Australian GAAP, the threshold test that must be met to recognize a deferred tax asset is that recoverability must be virtually certain for tax losses and beyond reasonable doubt for timing differences. Under US GAAP, recoverability of the deferred tax asset must be considered to be more likely than not.
Environmental rehabilitation costs
We make provision for environmental rehabilitation costs and related liabilities based on our management’s interpretations of current environmental and regulatory requirements. In addition, final environmental rehabilitation obligations are estimated based on these interpretations, with provisions made over the expected lives of our operations. While our management believes that the environmental rehabilitation provisions made are adequate and that the interpretations applied are appropriate, the amounts we estimate for the future liabilities may differ materially from the costs that will actually be incurred. We reassess estimated cost of rehabilitation on a regular basis. If our management determines that we have created an insufficient rehabilitation provision, we will adjust earnings prospectively. Our rehabilitation provisions as at December 31, 2002 were in the aggregate A$101.2 million, compared to estimated total future costs of A$377.1 million.
Accounting for derivative instruments and hedging activities
We defer certain unrealized gains and losses on derivatives contracts that are used to hedge changes in cash flows from forecasted transactions, and bring these amounts to account when the hedged transaction is recognized in income. See the section entitled “Qualitative and Quantitative Disclosures about Market Risks”, as well as Note 1(w) to our Consolidated Financial Statements for an expanded discussion of our accounting policy under Australian GAAP, and Note 45 (h) for discussion under US GAAP. Our hedged forecasted transactions are based on detailed production forecasts, which are based on the mine plans, and amounts hedged are based on a portion of our reserves determined in accordance with the SEC’s Industry Guide 7, and as determined in accordance with our treasury risk management guidelines. On this basis, we consider the forecasted transactions to be probable of occurring, however changes in ore reserves due to changes in commodity prices or exchange rates could result in these transactions failing to occur, in which case, we would bring to account immediately any unrecognized gains or losses on derivative contracts.
General Factors
Our operations during the three-year period ended December 31, 2002 were characterized by a focus upon our core businesses of nickel, copper/uranium (Olympic Dam) and fertilizers (Phosphate Hill). This strategy,
36
Table of Contents
begun in the 1990s when our operations were part of WMC Limited, included: major investment and restructuring to enhance the competitiveness and quality of our assets, with an emphasis on developing fully integrated production facilities to achieve efficiency and a competitive cost base, exploring expansion opportunities at existing businesses and focusing on sites with long-life reserves. In addition, non-core businesses, such as oil and gas, talc and gold were divested. These initiatives produced generally positive results in fiscal 2000. Performance in fiscal 2001, however, was impacted by a fire in the solvent extraction plant at our Olympic Dam operations in October 2001, production difficulties associated with the setting up of the Queensland Fertilizer operations, and falling commodity prices.
Our performance in the year ended December 31, 2002 continued to be negatively influenced by the production constraints related to downtime for repairs and disruptions to production. Our Olympic Dam and Nickel businesses experienced higher per unit costs of sales during the year, although commodity prices began to recover during the period.
Our financial and operational performance and prospects are influenced by a number of factors. The following is a discussion of the key general factors which affect our business and financial performance.
Commodity prices
We sell products which are commodities and our financial performance is significantly influenced by the prices we obtain for these products. The price of a commodity is generally determined, or linked to, the price for that product in the world markets. World commodity prices are subject to changes in supply and demand, and characterized by significant fluctuations. The volatility of commodity prices means that the sales revenues and, absent mitigating factors, profit generated by sales of our products can vary considerably from period to period, even where production levels and costs remain constant. For information about commodity price movements for nickel, copper, gold and fertilizer, see the section entitled “Qualitative and Quantitative Disclosures About Market Risk—Average Quarterly Prices”.
Fluctuations in the A$/US$ Exchange Rate
The world commodity prices for the products we sell are denominated in, or linked to, the US$. By contrast, most of our costs are denominated in A$ and our accounts are prepared in A$. As a consequence, fluctuations in the rate of exchange between the US$ and A$ may have an effect on our financial results. Absent mitigating factors such as foreign currency hedging, an appreciation of the US$ relative to the A$ increases the value of sales revenues as compared to costs and has a positive impact on profit. Depreciation in the US$ compared to the A$ decreases the value of sales revenue to costs and exerts negative pressure on our profit. For information about movements in the US dollar/Australia dollar exchange rate, see the section entitled “Exchange Rates”.
Capital Expenditures
Mining is a capital intensive business, where much investment in infrastructure and plant is required. Recent major capital expenditures include the expansion and optimization projects at Olympic Dam and the development of the Phosphate Hill fertilizer operations. These are discussed in more detail below.
Nickel Operations
Our nickel operations have undergone cost reduction and production efficiency programs which were reflected in our fiscal 2000 profit. In 2001, however, lower commodity prices and higher production costs put significant negative pressure on profit. Profit improved in 2002 with higher realized prices and higher sales volumes of concentrate and nickel metal more than offsetting reduced nickel matte sales and higher cost of sales following a shutdown of the acid plant at the Kalgoorlie Nickel Smelter for repairs during the first half of the year. We are pursuing a strategy of focusing upon longer life and higher quality operations and thus have sold off
37
Table of Contents
or closed our mines at Kambalda where proven and probable reserves are nearly depleted. Movements in the exchange rate together with increased volume and price of third party feed purchases and lower than anticipated production at Mt Keith are expected to largely offset the benefits of higher nickel prices in the first half of 2003. Approximately 90% of our nickel metal sales are made under short to medium term contractual arrangements.
Olympic Dam Operations
The copper-uranium operations benefited from a major expansion of production capacity at the Olympic Dam facility and we achieved significant cost reductions and production efficiencies in 2000. A fire at the Olympic Dam operation’s solvent extraction plant in October 2001 resulted in a A$71.8 million charge for the write off of assets and reduced production in the 2001 year and a further A$97.7 million charge due to reduced production in 2002. We expect to commission the rebuild of the uranium solvent extraction plant in the first half of 2003 and complete the construction of the copper solvent extraction plant by the end of 2003, with commissioning of the copper solvent extraction plant likely to extend to the first quarter of 2004. A relining of the smelter furnace (which requires a 40 day shutdown of production), is scheduled for 2003 with an estimated total cost of A$120 million. We estimate the cash cost of relining the direct-to-blister furnace, including cooling jacket replacement and improvements, to be A$57 million. We estimate associated refurbishment and repairs to the smelter, anode furnaces, slag furnace and sulphuric acid plant, normally scheduled to coincide with each smelter reline, to cost an additional A$35 million. We will also undertake modifications to improve the capability of the gas handling system and acid plant at an estimated cost of A$28 million. We expect to spend an additional A$7 million on a project to modify the slag furnace to be undertaken during the smelter shutdown. As a consequence of these repairs and refurbishment activities and the smelter reline, we expect that refined copper production for 2003 will be approximately 185,000 tonnes. In 2002, we completed an optimization project to take the annual capacity from approximately 200,000 tonnes of refined copper to 235,000 tonnes but this level of production will not be achieved until after the smelter reline and associated works have been completed. Upon completion of the new copper solvent extraction plant and furnace relines and other repairs, we expect the Olympic Dam facility to operate at the 235,000 tonnes per annum rate. We sell approximately 90% of copper production under contracts which are negotiated annually. More than 90% of our uranium oxide production is committed under long-term sales contracts.
Queensland Fertilizer Operations
The Queensland Fertilizer Operations experienced significant hand-over delays and inconsistent production from the initial start up phase in the last quarter of 1999 until October 2000. Since then, our production rate has been increasing and we have averaged 97% of design capacity since November 2002. A decrease in fertilizer prices has affected our operations, which are not yet profitable. The Phosphate Hill site has the potential for future development but such opportunities are still in the early stages of study. We sell almost 100% of fertilizer production under contract.
Regulatory Environment
We are subject to extensive regulation in Australia and abroad. Of particular importance in Australia is the impact of native title claims on mining and other leases. See the section entitled “Business Description—Legal Proceedings—Native Title in Australia”. Furthermore, mining leases are subject to certain conditions. We are also subject to regulation on environmental matters, with special regulations applying in the context of the export and handling of uranium.
Competitive Environment
Our competitive position is based on our core longer life assets which are complemented by fully integrated production facilities, all of which are being optimized to lower costs and increase production. We also continue to engage in exploration to identify new ore bodies and development opportunities. Our competitive position is further enhanced by the fact that all of our current operations are in politically stable, low-risk jurisdictions and that we have striven to achieve a high level of environmental and health and safety compliance.
38
Table of Contents
2002 Compared to 2001
Overview
Our consolidated net loss after tax from continuing operations was A$14.7 million for the year ended December 31, 2002 compared with a net loss after tax of A$157.5 million for the year ended December 31, 2001. Our net sales revenue from continuing operations amounted to A$2,487.2 million for the year ended December 31, 2002 compared with A$2,364.1 million for the comparable previous year, an increase of 5.2%. Our net income was positively influenced by an increase in earnings from nickel, insurance revenue and a decrease in interest expense. These were partly offset by reduced production and associated sales volumes, lower copper prices and a weaker US dollar relative to the Australian dollar.
The fire which destroyed extensive parts of Olympic Dam’s solvent extraction plant in October 2001 reduced our production and subsequent sales of copper and uranium oxide in the year ended December 31, 2002, although the financial impact of the reduced sales were in part offset by the recognition of preliminary insurance claims totaling A$120 million. The total amount of insurance claims is under continuing negotiations with our insurers.
We curtailed nickel production in the first half of 2002 following a shutdown of the acid plant at the Kalgoorlie smelter for repairs to the mist precipitators following a fire. The smelter was on nil or minimal feed for a period of 27 days.
Revenues
Our sales revenue from continuing operations for the year ended December 31, 2002 increased to A$2,487.2 million, up from A$2,364.1 million in the year ended December 31, 2001. The marginal increase was driven by higher nickel prices up from an average of US$2.70 per pound in 2001 to US$3.07 per pound in 2002, offset by a weaker US dollar relative to the Australian dollar and reduced production and sales as detailed in the following table. Net foreign exchange and commodity price hedging losses of A$113.3 million in 2002 were down, however, from a loss of A$273.9 million in the comparable period in 2001 due to the weaker US dollar relative to the Australian dollar and reduced quantum of hedge positions in 2002. The following tables show our sales volume by major product category for 2002 and 2001 and the average prices for our products.
Year ended December 31, | ||||
2002 | 2001 | |||
Sales Volume Summary | ||||
Nickel (‘000 tonnes) | ||||
—Nickel in concentrate | 14.1 | 13.8 | ||
—Nickel in matte | 25.7 | 34.6 | ||
—Nickel metal | 64.8 | 61.1 | ||
Refined copper (‘000 tonnes) | 186.1 | 200.8 | ||
Uranium oxide (tonnes) | 3,888 | 4,534 | ||
Fertilizer (‘000 tonnes) | 1,254 | 1,128 | ||
—Queensland Fertilizer Operations external sales | 606 | 537 | ||
—Hi Fert sales | 648 | 591 | ||
Year ended December 31, | ||||
2002 | 2001 | |||
Prices Summary(1) | ||||
Nickel (US$/lb) | 3.07 | 2.70 | ||
Copper (US$/lb) | 0.71 | 0.72 | ||
Fertilizer (US$/tonne) | 157 | 147 | ||
| (1) | Average prices for the periods presented. |
39
Table of Contents
Costs
Our total costs from continuing operations of A$2,799.6 million for the year ended December 31, 2002 were marginally higher than the comparable period in 2001 of A$2,790.0 million. We had an increase in general and administrative costs of A$88.3 million, an increase in other expenses of A$184.5 million, although these were offset in part by a higher reduction in net borrowings costs of A$143.0 million, and lower exploration costs of A$34.9 million as a result of less exploration activity.
Depreciation and amortization from continuing operations increased from A$480.6 million to A$511.0 million. The depreciation and amortization we charged to profit overall decreased to A$511.7 million in the year ended December 31, 2002, compared with A$596.2 million for the year ended December 31, 2001 principally due to a reduction in property, plant and equipment balances arising from the sale of the gold and talc operations.
In 2002, we recognized A$75.9 million profit on the close out of interest rate swaps which, combined with a reduced level of borrowings of approximately A$665 million, reduced our net borrowing cost of A$140.9 million in 2001 to A$48.7 million in 2002.
Profit
Our consolidated net loss after tax from continuing operations was A$14.7 million for the year ended December 31, 2002 compared with a net loss after tax of A$157.5 million for the year ended December 31, 2001. The reduction in our net loss after tax was primarily attributable to increased sales revenues, exceptional income items (relating to insurance and the close out of the interest rate swaps), reduced borrowing costs offset by higher general and administrative and other expenses as set out above.
Cash flow
Our net cash inflow from operating activities for the year ended December 31, 2002 was A$336.7 million, compared to A$577.7 million for the year ended December 31, 2001. Key factors impacting net cash flow from operating activities were:
| • | receipts from customers decreased by 17.6% to A$2,455.4 million, principally due to lower copper prices, a weaker US dollar relative to the Australian dollar and reduced sales reflecting our lower production volumes for the period; |
| • | payments to suppliers and employees decreased to A$2,076.5 million from A$2,212.7 million in the year ended December 31, 2001; |
| • | proceeds we received in 2002 from the close out of an interest rate swap amounting to A$71.2 million (compared to A$11.7 million in 2001); and |
| • | payments for exploration decreased to A$23.4 million from A$76.5 million in the year ended December 31, 2001. |
Our net cash outflow from investing activities for the year ended December 31, 2002 was A$381.0 million, compared to a net cash inflow from investing activities of A$279.1 million in the year ended December 31, 2001. The key factors contributing to the outflow from our investing activities in 2002 were:
| • | proceeds from the sale of Central Norseman Gold Corporation Ltd and Gold Royalty Right (discontinued operation) of A$25.7 million in 2002 compared to receipt of A$122.2 million from the sale of equity interests in Mondo Minerals, A$432 million for the gold operation of St Ives and Agnew, and A$56.0 million for the operations of Three Springs Talc (discontinued operations) in 2001; |
| • | payments for property, plant and equipment amounted to A$464.9 million, compared to A$426.8 million in 2001; and |
40
Table of Contents
| • | payment of A$34.4 million in 2002 (2001: receipt of A$21.7 million) for close out of gold hedge contracts following the sale of the gold business in 2001. |
Net cash inflow from our financing activities was A$15.8 million, compared to a net cash outflow from financing activities of A$793.7 million for the year ended December 31, 2001, principally due to:
| • | a net repayment of borrowings of A$446.4 million in 2002 against a net repayment of A$778.3 million in 2001; |
| • | a net increase in contributed equity of A$12.4 million in 2002 (A$15.4 million decrease in 2001), reflecting the equity cashflows retained by us but incurred by WMC Limited prior to the demerger; |
| • | payment of a fee for the redemption of the Yankee Bonds of A$150.2 million; and |
| • | a transfer of A$577 million net debt (consisting of a transfer of A$600 million debt, net of A$23 million retained cash) to Alumina Limited as part of the demerger. |
Balance sheet
Our net assets increased to A$3,606.6 million from A$3,220.3 million at December 31, 2001, despite a decrease in our total assets to A$7,348.1 million from A$8,242.9 million. The increase in our net assets reflects a reduction in interest bearing liabilities from A$2,321.8 million at December 31, 2001 to A$1,657.5 million at December 31, 2002 due to the impact of the transfer of approximately A$577 million of net debt to Alumina Limited as part of the demerger and the increasing value of the Australian dollar on US dollar denominated debt. The A$894.8 million decrease in our total assets was principally due to:
| • | changes in the carrying values of assets transferred at fair value as part of the demerger as follows: |
| • | the decrease in deferred hedging losses of A$1,101.9 million due to the previous losses being fair- valued upon acquisition; |
| • | a writedown of the Queensland Fertilizer business property, plant and equipment due to a fair value adjustment of A$289.6 million; |
| • | the initial recognition of the acquired mineral rights asset upon acquisition of the Olympic Dam asset (A$1,271.5 million); and |
| • | a decrease in the value of deferred tax assets by A$226.6 million upon acquisition of the finance companies and the Queensland Fertilizer business. |
Segment Results
Nickel
Our profit before hedging, interest and tax decreased to A$270.7 million in 2002, compared with a profit before hedging, interest and tax of A$288.4 million in the comparable period of 2001. Our lower profit before hedging, interest and tax in 2002 was principally due to higher cost of sales of A$66.1 million. A fire in the mist precipitator at the Kalgoorlie nickel smelter acid plant in February 2002, reduced our production of nickel matte by approximately 2,500 tonnes in 2002. The smelter operated at below normal throughput rates in the second and third quarters of 2002. Two new mist precipitators were installed in the third quarter of 2002, which returned the smelter capacity to normal throughput rates. The average unit cost of nickel metal sales (net of by-product credits) for 2002 was A$4.17/lb, compared to A$3.74/lb in 2001, as a result of lower production from the acid
41
Table of Contents
plant outage and our increased purchases of third party concentrate feed to replace concentrate feed previously produced internally from the Kambalda mines which we have now sold. The following table provides information regarding the performance of our nickel business unit in 2002 and 2001.
Year ended December 31, | ||||||
2002 | 2001 | |||||
A$ millions | ||||||
Nickel Performance Summary | ||||||
Financial | ||||||
Profit before hedging, interest and tax(1) | 270.7 |
| 288.4 |
| ||
Commodity/currency hedging | (58.0 | ) | (141.5 | ) | ||
Profit before interest and tax | 212.7 |
| 146.9 |
| ||
Foreign currency revaluation | 9.5 |
| 0.5 |
| ||
Intra-group sales | (0.7 | ) | — |
| ||
Segment result(2) | 221.5 |
| 147.4 |
| ||
Sales revenue (net of hedging) | 1,314.9 |
| 1,200.9 |
| ||
Capital expenditure | 191.0 |
| 227.1 |
| ||
Total assets | 1,696.0 |
| 1,691.1 |
| ||
Production | ‘000 tonnes | |||||
Nickel-in-concentrate | 106.4 |
| 104.6 |
| ||
Nickel-in-matte | 91.6 |
| 96.6 |
| ||
Nickel metal | 65.1 |
| 61.3 |
| ||
Sales | ‘000 tonnes | |||||
Nickel-in-concentrate | 14.1 |
| 13.8 |
| ||
Nickel-in-matte | 25.7 |
| 34.6 |
| ||
Nickel metal | 64.8 |
| 61.1 |
| ||
| (1) | We have included information concerning profit before hedging, interest and tax in our segment results as we believe this is a useful measure of operational performance because it removes items not related to the underlying performance of the business segment and it is also commonly used by certain investors to evaluate the core results of our segments. Profit before hedging, interest and tax is not a measure of financial performance under Australian GAAP and should not be considered an alternative to, or more meaningful than, income before interest and income tax or net income/(loss) attributable to holding company shareholders. Our consolidated results as discussed herein include the results of hedging, interest and tax. |
| (2) | Segment result is segment revenues less segment expenses. Segment revenues include operating revenues from ordinary activities before tax, resulting from the operating activities of a segment that are directly attributable to a segment, and a portion of other revenues that can be allocated on a reasonable basis to the segment. Segment result does not include interest, foreign currency revaluations or intra-group sales. |
The nickel refinery at Kwinana produced 65,055 tonnes of nickel metal in 2002, up from 61,324 tonnes in 2001, following the expansion completed in 2001.
Our sales revenue increased to A$1,314.9 million in 2002 compared to A$1,200.9 million in 2001 due to our higher realized Australian dollar prices resulting from a weaker US dollar relative to the Australian dollar and higher sales volumes of concentrate and nickel metal, offset in part by reduced matte sales. Hedging losses at A$58.0 million in 2002, were 55% lower in 2002 when compared to the A$141.5 million in 2001 reflecting the weaker US dollar during 2002 and the reduced quantum of hedging contracts.
Changes to the mine plans for the Mount Keith and Harmony mines in the six months to December 31, 2002 have resulted in changes to stripping ratios which have had a net impact on profit of A$1.1 million (credit).
42
Table of Contents
Realized nickel metal prices in Australian dollars averaged A$5.55 per pound for the year ended December 31, 2002, up on the average price in the year ended December 31, 2001 of A$5.41 per pound again reflecting the weaker US dollar during 2002.
Copper/Uranium
Our profit before hedging, interest and tax decreased to A$90.4 million in 2002, compared with a profit before hedging, interest and tax of A$150.8 million in the comparable period of 2001. Our lower profit before hedging, interest and tax in 2002 was principally due to lower sales volumes from reduced production and lower copper prices of approximately US$0.01/lb.
Our production was impacted by the fire in the solvent extraction plant in October 2001. Downtime to repair cooling jackets in the smelter’s flash furnace also impacted production. As a result, refined copper production decreased by 11% to 178,100 tonnes and our uranium oxide production decreased by 34% to 2,891 tonnes in 2002. We fulfilled our uranium sales commitments through a combination of on-market purchases and uranium loans. The following table provides information regarding the performance of our copper/uranium business in 2002 and 2001.
Year ended December 31, | ||||||
2002 | 2001 | |||||
A$ millions | ||||||
Copper/Uranium Performance Summary | ||||||
Financial | ||||||
Profit before hedging, interest and tax(1) | 90.4 |
| 150.8 |
| ||
Commodity/currency hedging | (41.6 | ) | (102.9 | ) | ||
Profit before interest and tax | 48.8 |
| 47.9 |
| ||
Intra-group purchases | 5.0 |
| — |
| ||
Segment result(2) | 53.8 |
| 47.9 |
| ||
Sales revenue (net of hedging) | 723.3 |
| 810.3 |
| ||
Capital expenditure | 216.0 |
| 75.3 |
| ||
Total assets | 4,146.2 |
| 2,811.1 |
| ||
Production | ||||||
Refined copper (‘000 tonnes) | 178.1 |
| 200.5 |
| ||
Uranium oxide (tonnes) | 2,891 |
| 4,379 |
| ||
Sales | ||||||
Refined copper (‘000 tonnes) | 186.1 |
| 200.8 |
| ||
Uranium oxide (tonnes) | 3,888.0 |
| 4,534 |
| ||
| (1) | We have included information concerning profit before hedging, interest and tax in our segment results as we believe this is a useful measure of operational performance because it removes items not related to the underlying performance of the business segment and it is also commonly used by certain investors to evaluate the core results of our segments. Profit before hedging, interest and tax is not a measure of financial performance under Australian GAAP and should not be considered an alternative to, or more meaningful than, income before interest and income tax or net income/(loss) attributable to holding company shareholders. Our consolidated results as discussed herein include the results of hedging, interest and tax. |
| (2) | Segment result is segment revenues less segment expenses. Segment revenues include operating revenues from ordinary activities before tax, resulting from the operating activities of a segment that are directly attributable to a segment, and a portion of other revenues that can be allocated on a reasonable basis to the segment. Segment result does not include interest, foreign currency revaluations or intra-group sales. |
43
Table of Contents
Our sales revenue decreased to A$723.3 million in the year ended December 31, 2002, compared to A$810.3 million in the comparable period of 2001, in line with lower sales reflecting reduced production and lower Australian dollar prices received for our product because of lower copper prices in 2002 compared to 2001. In 2002, we recognized preliminary insurance claims for both business interruption (A$80 million) and material damage (A$40 million) associated with the solvent extraction plant fire totaling A$120 million.
Our sales revenue includes hedging losses of A$41.6 million in 2002, 60% lower when compared to the A$102.9 million of hedging losses in 2001.
The increase in total assets of A$1,335.1 million was primarily attributable to the recognition of an acquired mineral rights asset of A$1,271.5 million which arose upon our acquisition of the copper-uranium assets at their fair value.
We expect to commission the rebuild of the uranium solvent extraction plant in the first half of 2003 and complete the construction of the copper solvent extraction plant by the end of 2003, with commissioning of the copper solvent extraction plant likely to extend to the first quarter of 2004. During 2002 we completed the optimization project to increase our capacity to 235,000 tonnes of copper cathode on schedule and on budget. We estimate our production of refined copper to be approximately 185,000 tonnes in 2003 due to the rebuild of the copper solvent extraction circuit in the second half of 2003 and the major shutdown for the reline of the smelter furnace in the second half of 2003. The plant is targeted to operate at the rate of 235,000 tonnes per annum of refined copper in 2004.
Copper prices averaged US$0.71 per pound in 2002, down 1.4% on the average price in the year ended December 31, 2001 of US$0.72 per pound. Australian dollar prices averaged A$1.30 per pound for the year ended December 31, 2002, down 7.1% on the average price in the year ended December 31, 2001 of A$1.40 per pound, due to the weaker US dollar relative to the Australian dollar in the year ended December 31, 2002.
Fertilizer Operations
We had a loss before hedging, interest and tax of A$41.2 million in 2002, compared to a loss before hedging, interest and tax of A$59.9 million in 2001. Our loss before hedging, interest and tax in 2002 was as a result of lower realized Australian dollar prices offset in part by increased production.
Year ended December 31, | ||||||
2002 | 2001 | |||||
A$ millions | ||||||
Fertilizer Performance Summary(1) | ||||||
Financial | ||||||
(Loss) before hedging, interest and tax(2) | (41.2 | ) | (59.9 | ) | ||
Commodity/currency hedging | (12.3 | ) | (29.5 | ) | ||
(Loss) before interest and tax | (53.5 | ) | (89.4 | ) | ||
Intra-group sales | (3.9 | ) | — |
| ||
Segment result(3) | (57.4 | ) | (89.4 | ) | ||
Sales revenue (net of hedging) | 420.4 |
| 352.9 |
| ||
Capital expenditure | 50.2 |
| 42.3 |
| ||
Total assets | 720.6 |
| 1,137.3 |
| ||
Production | ‘000 tonnes | |||||
Phosphate fertilizer | 821.0 |
| 709.4 |
| ||
Sales | ‘000 tonnes | |||||
Queensland Fertilizer Operations external sales | 606 |
| 537 |
| ||
Hi-Fert sales | 648 |
| 591 |
| ||
| (1) | Includes performance of wholly owned subsidiary Hi Fert Pty Ltd. |
44
Table of Contents
| (2) | We have included information concerning loss before hedging, interest and tax in our segment results as we believe this is a useful measure of operational performance because it removes items not related to the underlying performance of the business segment and it is also commonly used by certain investors to evaluate the core results of our segments. Profit before hedging, interest and tax is not a measure of financial performance under Australian GAAP and should not be considered an alternative to, or more meaningful than, income before interest and income tax or net income/(loss) attributable to holding company shareholders. Our consolidated results as discussed herein include the results of hedging, interest and tax. |
| (3) | Segment result is segment revenues less segment expenses. Segment revenues include operating revenues from ordinary activities before tax, resulting from the operating activities of a segment that are directly attributable to a segment, and a portion of other revenues that can be allocated on a reasonable basis to the segment. Segment result does not include interest, foreign currency revaluations or intra-group sales. |
The decrease in total assets of A$416.7 million is primarily attributable to the downwards fair value adjustment of A$289.6 million which arose upon our acquisition of the fertilizer assets at their fair value.
Our production in 2002 was 821,000 tonnes of ammonium phosphate fertilizer, an increase of 15.7% from the 709,445 tonnes we produced in 2001. The plant operated at design capacity in December 2001 and January 2002, however, a shortage of sulphuric acid and a three week statutory maintenance shutdown of the acid plant we undertook in mid-2002 limited production. Since then, our production rate has been increasing and we have averaged 97% of design capacity since November 2002. A decrease in fertilizer prices has affected our operations, which are not yet profitable. The Phosphate Hill site has the potential for future development but such opportunities are still in the early stages of study.
The price of DAP averaged US$157 per tonne in 2002 compared to US$147 per tonne in 2001. The A$/US$ exchange rate increased from an average of A$1.00 = US$0.5129 in 2001 to A$1.00 = US$0.5447 in 2002.
Reconciliation between net income on a statutory basis and net income on a carve-out basis
As the demerger was consummated before December 31, 2002, WMC Resources’ financial position at December 31, 2002 presented below is the same as that reported in WMC Resources’ statutory financial statements in Australia. However, the carve-out basis of presentation differs from the statutory basis of accounting applied for the fiscal year ended December 31, 2002 in Australia. The difference principally relates to the inclusion in the carve-out of results of businesses that were not legally owned by WMC Resources until the demerger was consummated. The consolidated income statement for the year ended December 31, 2002 as reported in the statutory financial statements is summarized, and reconciled to net income as on a carve-out basis, as follows (no comparatives are presented in the statutory financial statements):
| Year ended December 31, 2002 | |||
| (A$ millions) | |||
Statutory loss after tax | (43.7 | ) | |
Include 11 months of net income/(loss) from businesses acquired in the demerger: | |||
Copper | (24.1 | ) | |
Fertilizer | (46.6 | ) | |
Nickel Hedging | (61.2 | ) | |
Corporate and other non-operational entities | (10.8 | ) | |
Regional exploration | (10.9 | ) | |
New Business | (18.0 | ) | |
Finance and other costs | (11.0 | ) | |
Net interest(1) | 356.5 | ||
Profit on sale of Central Norseman Gold Corporation | 25.1 | ||
Income tax on above | (55.5 | ) | |
Prior period tax provision(2) | (76.8 | ) | |
Consolidated Financial Statements profit after tax (carve-out basis) | 23.0 | ||
45
Table of Contents
| (1) | Relates to net inter group interest charges which would normally eliminate on consolidation. However, as the finance entities only became part of the WMC Resources Ltd group effective December 1, 2002, there is a mis-match in the current year which will not occur in subsequent years. |
| (2) | Relates to an overprovision of tax in the prior year relating to the sale of the gold business unit in 2001. This has been reversed in 2002 in the statutory result, however it eliminates on consolidation in the carve-out result. |
2001 Compared to 2000
Overview
Our consolidated net loss after tax from continuing operations was A$157.5 million for the year ended December 31, 2001 compared with a net profit after tax of A$327.2 million for the year ended December 31, 2000. Our net sales revenue from continuing operations amounted to A$2,364.1 million for the year ended December 31, 2001, compared with A$2,666.0 million for the previous year, a decrease of 11.3%. Lower commodity prices, particularly for nickel, combined with lower nickel production and higher costs at Olympic Dam due to the impact of the fire in the solvent extraction plant, and at Queensland Fertilizer Operations due to the first full year of depreciation and amortization charges following the completion of the commissioning in August 2000 were largely responsible for the A$484.7 million reduction in our profit after tax.
As a result of a fire in Olympic Dam’s solvent extraction plant in October 2001, we incurred a A$71.8 million charge for the write off of assets and reduced production of copper and uranium oxide.
The nickel business profit before hedging, interest and tax in the 12 months ended December 31, 2001 was 65% lower than the previous year, reflecting the weakness in the nickel price and reduced sales volumes. Our profit before hedging, interest and tax in 2001 for the copper/uranium business was 42.5% lower than the previous year, due to lower copper and uranium prices and the impact of the fire in the solvent extraction plant. The fertilizer business reported an operating loss before hedging, interest and tax of A$59.9 million in 2001, compared to a loss of A$52.7 million in 2000. The increased loss reflected lower average di-ammonium phosphate prices, which decreased 4% from US$154/tonne in 2001, and plant performance issues since the plant was still in the process of ramping up in fiscal 2000 and 2001. The fiscal 2000 profit included only five months of depreciation and amortization charges as we capitalized the costs up to completion of commissioning in August 2000.
In December 1999, we revised our Price Risk Management Policy to substantially reduce future hedging activity, with the exception of carry-forward hedge positions, principally for the currency exchange rate and the gold price. This policy is described in greater detail in the section entitled “Quantitative and Qualitative Disclosures About Market Risk—Quantitative Information About Market Risk—Price Risk Management Policy”. Following the change in policy, our revenue has been subject to movements in spot prices for commodities and the A$/US$ exchange rate, although these have largely been offset in net revenue terms and our liquidity position has improved, with significant debt reduction occurring over the fiscal year 2001.
46
Table of Contents
Revenues
Our sales revenues from continuing operations for 2001 decreased to A$2,364.1 million, down from A$2,666.0 million in 2000. The decrease in our revenue was driven by lower prices for all commodities as detailed in the following table. Our revenues were also impacted by net foreign exchange and commodity price- hedging losses of A$273.9 million (A$320.6 million in 2000) due to reduced hedging cover in place in 2001 compared to 2000. The following tables show our sales volume by major product category for 2001 and 2000 and the average prices for our products.
Year ended December 31, | ||||
| 2001 | 2000 | |||
Sales Volume Summary | ||||
Nickel (‘000 tonnes) | ||||
—Nickel in concentrate | 13.8 | 18.1 | ||
—Nickel in matte | 34.6 | 40.7 | ||
—Nickel metal | 61.1 | 61.6 | ||
Refined copper (‘000 tonnes) | 200.8 | 203.2 | ||
Uranium oxide (tonnes) | 4,534 | 4,353 | ||
Fertilizer (‘000 tonnes) | 1,128 | 716.2 | ||
—Queensland Fertilizer Operations external sales | 537 | 157.6 | ||
—Hi Fert sales | 591 | 558.6 | ||
| Year ended December 31, | ||||
| 2001 | 2000 | |||
Prices Summary(1) | ||||
Nickel (US$/lb) | 2.70 | 3.92 | ||
Copper (US$/lb) | 0.72 | 0.82 | ||
Fertilizer (US$/tonne) | 147 | 154 | ||
| (1) | Average prices for the periods presented. |
Costs
Our total costs from continuing operations of A$2,790.0 million for the year ended December 31, 2001 were higher than the comparable period in 2000 of A$2,462.6 million. Our cost of goods sold from continuing operations for 2001 increased to A$1,878.7 million, up from A$1,672.0 million in 2000. The higher costs were predominantly due to the impact of the fire in the solvent extraction plant at Olympic Dam of A$71.8 million, increased nickel concentrate purchased from third parties reflecting the sale of the Kambalda mines of A$6.9 million and higher operating costs of A$127.2 million at the Queensland Fertilizer plant associated with the ramp up of production. Fiscal year 2000 included only five months of depreciation and amortization charges at the Queensland Fertilizer plant as we capitalized the costs up to completion of commissioning in August 2000. We incurred exceptional general and administrative costs of A$92.5 million relating to the costs associated with the fire at the Olympic Dam solvent extraction plant and the restructuring of the service and exploration functions.
Depreciation and amortization we charged to profit for continuing operations increased to A$481.2 million in 2001, compared to A$428.8 million in 2000. The charge in 2001 reflects the first full year of depreciation for the Queensland Fertilizer Operations, compared to five months of charges in 2000.
Profit
Our net loss after tax from continuing operations was A$157.5 million, down from a net profit after tax of A$327.2 million in 2000. The loss was primarily attributable to substantially lower prices for our products and the A$71.8 million charge following the fire at Olympic Dam’s solvent extraction plant in October 2001 and the increased costs referred to above.
47
Table of Contents
Our net interest expense was A$140.9 million, compared to A$148.1 million in 2000, reflecting the benefits of lower interest rates and debt reduction. In 2000, we capitalized interest of A$24.9 million in relation to the construction of the Queensland Fertilizer Operations.
Cash flow
Our net cash inflow from operating activities for 2001 was A$577.7 million, compared to A$898.1 million in 2000. The key factor impacting our net cash flow from operating activities was an increase in payments to suppliers and employees to A$2,212.7 million from A$1,904.9 million in 2000 due mainly to higher operating costs. This was attributable to a full year of operations at Queensland Fertilizer Operations and increased nickel concentrate purchases from third parties.
Our net cash inflow from investing activities for 2001 was A$279.1 million, compared to a net cash outflow from investing activities of A$419.3 million in 2000. The key factors contributing to the inflow from our investing activities were:
| • | proceeds from the disposal of non-current assets of A$699.3 million of which A$610.2 million related to discontinued operations. This compared to proceeds of A$38 million in 2000; and |
| • | payments for property, plant and equipment was A$426.8 million, compared to A$436.0 million in 2000. |
Net cash outflow from our financing activities was A$793.7 million, compared to a net cash outflow from financing activities of A$508.9 million in 2000. Key drivers were:
| • | a net repayment of borrowings of A$778.3 million in 2001 against a net repayment of A$37.7 million in 2000; and |
| • | the absence of contributed equity relating to payments for the buyback of ordinary shares during 2001, compared to an outflow of A$417.4 million in 2000. |
Balance sheet
Our net assets increased to A$3,220.3 million in 2001 from A$3,123.8 million in 2000. Our total borrowings decreased to A$2,321.8 million in 2001 due to net repayments of A$778.3 million, offset by the impact of a weaker Australian dollar on US dollar denominated debt. Property, plant and equipment reduced by A$417.7 million due to the disposal of discontinued operations and depreciation and amortization charges exceeding capital expenditure.
Our total assets of A$8,242.9 million at December 31, 2001 decreased from A$8,597.0 million at December 31, 2000 principally due to:
| • | higher deferred tax asset balances of A$303.7 million, compared to A$181.8 million in 2000, due to an increase in tax losses brought to account; and |
| • | a decrease in the value of property, plant and equipment of A$417.7 million, reflecting the impact of depreciation and amortization charges exceeding capital expenditure of A$139.3 million and the disposal of discontinued operations of A$201.4 million. |
This was offset in part by an increase in deferred hedging losses of A$309.4 million due to the lower A$/US$ exchange rate.
Our liabilities for 2001 decreased to A$5,013.6 million, down from A$5,459.7 million in 2000. The decrease was attributable to the reduction of borrowings as discussed above, offset by an increase in hedging creditors as a result of commodity and currency price movements of A$327.1 million.
Our shareholders’ equity in 2001 increased to A$3,220.3 million, up from A$3,123.8 million in 2000. The increase was attributable to a net income of A$126.0 million offset by net foreign currency adjustments to comprehensive income of A$14.1 million and A$15.4 million of equity cashflows incurred by WMC Limited prior to the demerger and retained by us.
48
Table of Contents
Segment Results
Nickel
Our nickel business was impacted by the difficult conditions facing the nickel industry during 2001. Our profit before hedging, interest and tax decreased to A$288.4 million in 2001, compared with a profit before hedging, interest and tax of A$823.2 million in 2000. Our lower profit in 2001 was due to lower sales volumes at lower prices and higher unit cost of sales. Our average unit cost of metal sales (net of by-product credits) for 2001 increased 17.2% to A$3.74 per pound, reflecting planned increased concentrate purchased from third parties following the sale of Kambalda mines, lower smelter throughput and increased energy costs in Western Australia. Our overall amortization increased in 2001 because we commenced mining at the new Harmony mine at Leinster. Our total nickel-in-concentrate production decreased by 2.7% to 104,591 tonnes in line with weaker market conditions and planned major maintenance shutdowns at the Kalgoorlie smelter and Kwinana refinery. The following table provides information regarding the performance of our nickel business unit in 2001 and 2000.
| Year ended December 31, | ||||||
| 2001 | 2000 | |||||
| A$ millions | ||||||
Nickel Performance Summary | ||||||
Financial | ||||||
Profit before hedging, interest and tax(1) | 288.4 | 823.2 | ||||
Commodity/currency hedging | (141.5 | ) | (216.7 | ) | ||
Profit before interest and tax | 146.9 | 606.5 | ||||
Foreign currency revaluation | 0.5 | — | ||||
Significant items | — | 20.2 | (3) | |||
Intra-group sales | — | (0.6 | ) | |||
Segment result(2) | 147.4 | 626.1 | ||||
Sales revenue (net of hedging) | 1,200.9 | 1,645.4 | ||||
Capital expenditure | 227.1 | 155.5 | ||||
Total assets | 1,691.1 | 1,801.0 | ||||
| Production | ‘000 tonnes | |||||
Nickel-in-concentrate | 104.6 | 107.5 | ||||
Nickel-in-matte | 96.6 | 103.0 | ||||
Nickel metal | 61.3 | 60.5 | ||||
| Sales | ‘000 tonnes | |||||
Nickel-in-concentrate | 13.8 | 18.1 | ||||
Nickel-in-matte | 34.6 | 40.7 | ||||
Nickel metal | 61.1 | 61.6 | ||||
| (1) | We have included information concerning profit before hedging, interest and tax in our segment results as we believe this is a useful measure of operational performance because it removes items not related to the underlying performance of the business and segment and it is also commonly used by certain investors to evaluate the core results of our segments. Profit before hedging, interest and tax is not a measure of financial performance under Australian GAAP and should not be considered an alternative to, or more meaningful than, income before interest and income tax or net income/(loss) attributable to holding company shareholders. Our consolidated results as discussed herein include the results of hedging, interest and tax. |
| (2) | Segment result is segment revenues less segment expenses. Segment revenues include operating revenues from ordinary activities before tax, resulting from the operating activities of a segment that are directly attributable to a segment, and a portion of other revenues that can be allocated on a reasonable basis to the segment. Segment result does not include interest, foreign currency revaluations or intra-group sales. |
| (3) | Under US GAAP, profit from the sale of tenements at Kambalda was only recognized in 2001. See Note 45(f) to our Consolidated Financial Statements. |
49
Table of Contents
Our sales revenue decreased in line with lower production and reduced prices received for our product. Our hedging losses were reduced due to reduced hedging cover in place in 2001 compared to 2000.
We continued to optimize our nickel refinery at Kwinana in 2001. We have progressively upgraded the plant and have kept operating costs low by increasing process intensity, improving process control and targeted de-bottlenecking. In 2001, we completed the expansion of the plant by a further 10% to a capacity of 67,000 tonnes of nickel metal a year on time and on budget.
We continued to dispose of Kambalda nickel mines during 2001. We sold the Wannaway mine and North Widgiemooltha Block to third parties. We leased land containing Otter Juan and Coronet North mines under a long-term arrangement. Under the terms of these divestments, we entered into long-term agreements with the acquirers to buy the concentrates they produce. Our sales of these mines reduced Kambalda’s capital intensity. The Lanfranchi mine complex is the only mine at Kambalda we still own. We ceased mining at Lanfranchi at the end of March 2002. We anticipate that we will sell this mine over the next few years.
In February 2001, we purchased the Yakabindie Nickel Company. We expect it to have long-term potential to complement existing assets in the Mount Keith area.
Copper/Uranium
Our total profit before hedging, interest and tax for fiscal 2001 was 42.5% lower at A$150.8 million due to the A$71.8 million impact of our write off of the damaged solvent extraction plant and associated reduced production in 2001 coupled with our inclusion of A$61.4 million of insurance proceeds in 2000. Our unit cost of sales for copper (net of uranium and by-product credits) was A$1.06 per pound for 2001, up A$0.20 per pound on 2000. The increase in the unit cost of sales was primarily attributable to the impact of the fire in the solvent extraction plant in October 2001. The following table provides information regarding the performance of our copper/uranium business unit in 2001 and 2000.
| Year ended December 31, | ||||||
| 2001 | 2000 | |||||
| A$ millions | ||||||
Copper/Uranium Performance Summary | ||||||
Financial | ||||||
Profit before hedging, interest and tax(1) | 150.8 | 262.5 | ||||
Commodity/currency hedging | (102.9 | ) | (96.8 | ) | ||
Profit before interest and tax | 47.9 | 165.7 | ||||
Segment result(2) | 47.9 | 165.7 | ||||
Sales revenue (net of hedging) | 810.3 | 798.0 | ||||
Capital expenditure | 75.3 | 79.9 | ||||
Total assets | 2,811.1 | 3,098.0 | ||||
Production | ||||||
Refined copper (‘000 tonnes) | 200.5 | 200.4 | ||||
Uranium oxide (tonnes) | 4,379 | 4,539 | ||||
Sales | ||||||
Refined copper (‘000 tonnes) | 200.8 | 203.2 | ||||
Uranium oxide (tonnes) | 4,534 | 4,352 | ||||
| (1) | We have included information concerning profit before hedging, interest and tax in our segment results as we believe this is a useful measure of operational performance because it removes items not related to the underlying performance of the business segment and it is also commonly used by certain investors to evaluate the core results of our segments. Profit before hedging, interest and tax is not a measure of financial performance under Australian GAAP and should not be considered an alternative to, or more meaningful than, income before interest and income tax or net income/(loss) attributable to holding company shareholders. Our consolidated results as discussed herein include the results of hedging, interest and tax. |
50
Table of Contents
| (2) | Segment result is segment revenues less segment expenses. Segment revenues include operating revenues from ordinary activities before tax, resulting from the operating activities of a segment that are directly attributable to a segment, and a portion of other revenues that can be allocated on a reasonable basis to the segment. Segment result does not include interest, foreign currency revaluations or intra-group sales. |
The fire in late October 2001 caused considerable damage to the copper and uranium solvent extraction circuits. The previously advised estimated cost of this project across 2002 and 2003 was approximately A$300 million. This amount is under review and may increase by approximately 25%. The project returns remain robust, and the cost will be funded through operating cash flows. We expect to commission the rebuild of the uranium solvent extraction plant in the first half of 2003 and complete the construction of the copper solvent extraction plant by the end of 2003, with commissioning of the copper solvent extraction plant likely to extend to the first quarter of 2004. The rebuild costs and costs of lost production will be partially offset by insurance proceeds of more than A$120 million, consisting of at least A$80 million for business interruption and A$40 million for material damage. The total amount of insurance proceeds is under negotiation with our insurers.
Despite the production difficulties arising from the fire in the solvent extraction plant, refined copper production for the 2001 year was at design capacity at 200,523 tonnes, with uranium production of 4,379 tonnes. A record 9.3 million tonnes of ore were treated in 2001. Olympic Dam also produced a record 113,412 ounces of gold and 912,859 ounces of silver.
The average copper price during 2001 was lower at US$0.72 per pound compared to US$0.82 per pound in 2000. However, this lower price was offset by the stronger US dollar relative to the Australian dollar during 2001 (A$1.00 = US$0.5129) compared to 2000 (A$1.00 = US$0.5757).
Prices on the uranium spot market recovered in 2001 to in excess of US$9.00 per pound, compared to the spot price of US$7.10 in late December 2000. Our uranium is sold under long-term contracts with leading world power utilities. These contracts provide us a premium over spot or benchmark prices. All uranium exports are subject to bilateral safeguards agreements and must be approved by the Australian government.
The optimization project to increase our capacity to 235,000 tonnes of copper cathode was completed in the fourth quarter of 2002. The full benefit of this optimization project will not however be reflected in production until the completion of the rebuild of the copper solvent extraction circuit and the reline of the smelter furnace in the second half of 2003.
Fertilizer Operations
The Queensland Fertilizer Operations (QFO) is a fully integrated operation, with phosphate rock, phosphoric acid and ammonia production at Phosphate Hill and sulphuric acid production in Mount Isa. Our full year operating loss before hedging, interest and tax in 2001 was A$59.9 million. The loss was due to below design capacity production rates as the plant continued to ramp up to full capacity and maintain reliable and constant production and historically low di-ammonium phosphate (DAP) prices which decreased 4% from US$154/tonne in 2000 to US$147/tonne in 2001. The low production rates were attributable to plant performance issues that delayed reaching design capacity until December 2001. Our operating loss before interest, hedging and tax in 2000 of A$52.6 million included only five months of depreciation amortization charge (A$24.4 million) following the completion of the commissioning in August 2000, compared to A$66.0 million for a full year of depreciation and amortization charge in 2001. Production was 326,300 tonnes of phosphate fertilizer in 2000 compared to 709,400 tonnes in 2001. The following table provides information regarding the performance of our fertilizers business unit in 2001 and 2000.
51
Table of Contents
| Year ended December 31, | ||||||
| 2001 | 2000 | |||||
| A$ millions | ||||||
Fertilizer Performance Summary | ||||||
Financial | ||||||
Loss before hedging, interest and tax(1)(2) | (59.9 | ) | (52.6 | ) | ||
Commodity/currency hedging | (29.5 | ) | (7.2 | ) | ||
Loss before interest and tax | (89.4 | ) | (59.8 | ) | ||
Segment result(3) | (89.4 | ) | (59.8 | ) | ||
Sales revenue (net of hedging) | 352.9 | 222.6 | ||||
Capital expenditure | 42.3 | 96.2 | ||||
Total assets | 1,137.3 | 1,162.0 | ||||
| Production | ‘000 tonnes | |||||
Phosphate fertilizer | 709.4 | 326.3 | ||||
| Sales | ‘000 tonnes | |||
Queensland Fertilizer Operations external sales | 536.6 | 157.6 | ||
Hi Fert sales | 591.1 | 558.6 | ||
| (1) | We have included information concerning loss before hedging, interest and tax in our segment results as we believe this is a useful measure of operational performance because it removes items not related to the underlying performance of the business segment and it is also commonly used by certain investors to evaluate the core results of our segments. Profit before hedging, interest and tax is not a measure of financial performance under Australian GAAP and should not be considered an alternative to, or more meaningful than, income before interest and income tax or net income/(loss) attributable to holding company shareholders. Our consolidated results as discussed herein include the results of hedging, interest and tax. |
| (2) | Includes the performance of our wholly owned subsidiary Hi Fert Pty Ltd. |
| (3) | Segment result is segment revenues less segment expenses. Segment revenues include operating revenues from ordinary activities before tax, resulting from the operating activities of a segment that are directly attributable to a segment, and a portion of other revenues that can be allocated on a reasonable basis to the segment. Segment result does not include interest, foreign currency revaluations or intra-group sales. |
We rectified continuing equipment reliability issues in the first half of the 2001 year during the statutory inspection shutdown in August, 2001. We subsequently increased production. Our production in 2001 included 57,947 tonnes of high quality mono-ammonium phosphate (MAP).
Hi Fert, our wholly owned fertilizer distribution subsidiary, made significant operating changes in 2001. It has reduced costs through workforce reduction, re-structure and relocation. It has repositioned itself for further growth into the South Eastern Australian market. This has mainly involved the acquisition of profitable agents from our major competitors, thereby increasing total sales volume.
At the beginning of 2001, the price of DAP at the start of the year was US$154 per tonne fob Tampa and increased to a high of US$168 in March before falling to a low of US$133 in June. Between June and October the price ranged between US$136 and US$142 per tonne, with a rise from October taking the price to US$152 per tonne at December 31, 2001.
52
Table of Contents
New Accounting Pronouncements
Australian Accounting Standards Board
The Accounting Australian Standards Board (“AASB”) has issued or revised certain Accounting Standards which are not effective for the fiscal periods reported upon in our Consolidated Financial Statements.
AASB 1020, “Income Taxes” was issued in December 1999. It will be effective for us in 2005. We are currently assessing the impact of adopting this standard on our Consolidated Financial Statements.
AASB 1028 “Employee Benefits” was revised in June 2001. It will be effective for us in 2003. We do not expect adoption of this standard to have a significant impact on our financial position or results.
We adopted the following standards on January 1, 2002. There was no material impact on our financial statements as a result of adoption.
AASB 1005 “Segment Reporting” was revised in August 2000. It was effective for us in 2002. This standard relates to disclosure requirements.
AASB 1027 “Earnings per Share” was revised in October 2000 and further amended in June 2001. It was effective for us in 2002.
AASB 1012 “Foreign Currency Translation” was revised in November 2000. It was effective for us in 2002.
AASB 1044 “Provision, Contingent Liabilities and Contingent Assets” was issued in October 2001. It was adopted early by us effective January 1, 2002. Adoption of this standard did not have a significant impact on our financial position or results, except that a provision is not raised for any dividend declared after balance date but before directors’ adoption of the financial report. Any such declaration will be disclosed in the Notes to our Consolidated Financial Statements.
Financial Accounting Standards Board
The Financial Accounting Standards Board has issued certain Statements of Financial Accounting Standards which are not effective with respect to the fiscal years we have presented in the consolidated financial statements.
SFAS No. 143 “Accounting for Asset Retirement Obligations” was issued in 2001. It will be effective for us in 2003. The statement requires us to bring to account (calculated at a discounted present value) an asset retirement obligation and a matching asset at the initial point the liability is incurred, generally when the mine is first commenced. We must amortize the cost of the obligation over the life of a long-lived asset. Increases in the obligation as a result of the reduction of time are to be treated as interest. We are currently assessing the impact of adopting this standard.
In July 2002, the FASB issued SFAS No. 146, “Accounting for Costs Associated with Exit or Disposal Activities”. The statement requires that we recognize costs associated with exit or disposal activities when they are incurred rather than at the date of a commitment to an exit or disposal plan. Such costs include lease termination costs and certain employee severance costs associated with a restructuring, discontinued operations or other exit or disposal activity. We are currently reviewing the impact of SFAS No. 146, which is effective for exit or disposal activities initiated after December 31, 2002.
In April 2003 the Financial Accounting Standards Board (FASB) issued Statement No. 149 (“SFAS 149”), Amendment of SFAS No. 133 on Derivative Instruments and Hedging Activities. The Statement amends and clarifies accounting for derivative instruments, including certain derivative instruments embedded in other contracts, and for hedging activities under SFAS 133. In particular, it (1) clarifies under what circumstances a contract with an initial net investment meets the characteristic of a derivative as discussed in SFAS 133, (2) clarifies when a derivative contains a financing component, (3) amends the definition of an underlying to conform it to the language used in FIN 45 and (4) amends certain other existing pronouncements.
53
Table of Contents
SFAS No. 149 is effective for contracts entered into or modified after June 30, 2003, except as stated below and for hedging relationships designated after June 30, 2003.
The provisions of SFAS 149 that relate to SFAS 133 Implementation Issues that have been effective for fiscal quarters that began prior to June 15, 2003, should continue to be applied in accordance with their respective effective dates. In addition, certain provisions relating to forward purchases or sales of when-issued securities or other securities that do not yet exist, should be applied to existing contracts as well as new contracts entered into after June 30, 2003. SFAS 149 should be applied prospectively.
We do not expect that the adoption of this Statement will have a material impact on its results of operations and financial position.
In May 2003 the Financial Accounting Standards Board (FASB) issued Statement of Financial Accounting Standards No. 150 (“SFAS 150”), Accounting for Certain Financial Instruments with Characteristics of both Liabilities and Equity. SFAS 150 modifies the accounting for certain financial instruments that, under previous guidance, issuers could account for as equity. The Statement requires that those instruments be classified as liabilities in statements of financial position. SFAS 150 affects an issuer’s accounting for three types of freestanding financial instruments, namely:
| • | Mandatorily redeemable shares, which the issuing company is obligated to buy back in exchange for cash or other assets. |
| • | Financial instruments, other than outstanding shares, that do or may require the issuer to buy back some of its equity shares in exchange for cash or other assets. These instruments include put options and forward purchase contracts. |
| • | Unconditional obligations that can be settled with equity shares, the monetary value of which is fixed, tied solely or predominantly to a variable such as a market index, or varies inversely with the value of the issuer’s’ equity shares. |
SFAS 150 does not apply to features embedded in financial instruments that are not derivatives in their entirety.
In addition to its requirements for the classification and measurement of financial instruments within its scope, SFAS 150 also requires disclosures about alternative ways of settling such those instruments and the capital structure of entities, all of whose shares are mandatorily redeemable.
SFAS 150 is effective for financial instruments entered into or modified after May 31, 2003, and otherwise is effective at the beginning of the first interim period beginning after June 15, 2003. It is to be implemented by reporting the cumulative effect of a change in an accounting principle for financial instruments created before the issuance date of the Statement and still existing at the beginning of the interim period of adoption. Restatement is not permitted.
We are currently evaluating the impact of SFAS 150 on our results of operations and financial position.
We adopted the following standards on January 1, 2002. There was no material impact on our financial statements as a result of adoption.
SFAS No. 141 “Business Combinations” which addresses financial accounting and reporting for business combinations and supersedes APB Opinion No. 16, “Business Combinations”, was issued in June 2001 and is effective for business combinations initiated after June 30, 2000. It bans pooling-of-interest mergers and requires the use of the purchase method. Australian GAAP already requires the use of the purchase method in business acquisitions, so adoption of this standard did not have a significant impact on our financial position or results.
54
Table of Contents
SFAS No. 142 “Goodwill and Other Intangible Assets” which supersedes APB Opinion No. 17 was also issued in June 2001 and is effective for us in 2002. It addresses how goodwill and other intangible assets should be accounted for after they have been initially recognized in the financial statements. Amortization of goodwill and indefinite intangible assets ceases and is replaced by impairment tests. As we do not have any goodwill or indefinite intangible assets, adoption of this standard did not have a significant impact on our financial position or results of operations.
In August 2001, the FASB issued SFAS No. 144, “Accounting for the Impairment or Disposal of Long-Lived Assets.” This statement supersedes SFAS No. 121 and the accounting and reporting provisions of APB Opinion No. 30. This statement will require one accounting model be used for long-lived assets to be held and used or disposed of by sale, whether previously held and used or newly acquired, and will broaden the presentation of discontinued operations to include more disposal transactions. We adopted SFAS 144 on January 1, 2002 and it did not have a material impact on our financial position or results of operations.
In January 2003, the FASB issued FIN 46, “Consolidation of Variable Interest Entities, an Interpretation of ARB No. 51”. FIN 46 requires certain variable interest entities to be consolidated by the primary beneficiary of the entity if the equity investors in the entity do not have the characteristics of a controlling financial interest or do not have sufficient equity at risk for the entity to finance its activities without additional subordinated financial support from other parties. FIN 46 is effective for all new variable interest entities created or acquired after January 31, 2003. The Company has considered the implications of the disclosure requirements of FIN 46 and has concluded that the impact, if any, is not likely to be material.
In April 2002, the FASB issued SFAS No. 145, “Rescission of FASB Statements No. 4, 44, and 64, Amendment of FASB Statement No. 13, and Technical Corrections”. The standard rescinds FASB statements No. 4 and 64 that deal with issues relating to the extinguishment of debt. The standard also rescinds FASB Statement No. 44 that deals with intangible assets of motor carriers. The standard modifies SFAS No. 13, “Accounting for Leases,” so that certain capital lease modifications must be accounted for by lessees as sale-leaseback transactions. Additionally, the standard identifies amendments that should have been made to previously existing pronouncements and formally amends the appropriate pronouncements. SFAS No. 145 is effective for fiscal years beginning after May 15, 2002 with earlier adoption encouraged. We adopted SFAS No. 145 on January 1, 2002. The adoption of this statement did not have a material impact on our financial position or results of operations.
In November 2002, the FASB issued FASB Interpretation No. (FIN) 45, “Guarantor’s Accounting and Disclosure Requirements for Guarantees, Including Indirect Guarantees of Indebtedness of Others”. This Interpretation elaborates on the disclosures to be made by a guarantor in its interim and annual financial statements about its obligations under certain guarantees that it has issued. It also clarifies that a guarantor is required to recognize, at the inception of a guarantee, a liability for the fair value of the obligation undertaken in issuing the guarantee. This Interpretation does not prescribe a specific approach for subsequently measuring the guarantor’s recognized liability over the term of the related guarantee. This Interpretation also incorporates, without change, the guidance in FASB Interpretation No. 34, “Disclosure of Indirect Guarantees of Indebtedness of Others”, which is being superseded. The disclosure requirements are effective for fiscal year 2002 and have been included in the Consolidated Financial Statements. The provisions for initial recognition and measurement are effective on a prospective basis for guarantees that are issued or modified after December 31, 2002. The adoption of this interpretation did not have a material impact on our financial position or results of operations.
In December 2002, the FASB issued SFAS 148 “Accounting for Stock Based Compensation “. This Statement amends FASB Statement No. 123, “Accounting for Stock-Based Compensation”, to provide alternative methods of transition for a voluntary change to the fair value based method of accounting for stock-based employee compensation. In addition, this Statement amends the disclosure requirements of Statement 123 to require prominent disclosures in both annual and interim financial statements about the method of accounting
55
Table of Contents
for stock-based employee compensation and the effect of the method used on reported results. SFAS No. 148 is effective for our year ended December 31, 2002. We have not adopted fair value accounting suggested in SFAS 123/148. We continue to provide disclosures in accordance with SFAS 123.
Liquidity and Capital Resources
Our ability and the ability of our subsidiaries to generate cash internally is influenced by the following major factors:
| (i) | the levels of world commodity prices and exchange rates to which our revenue is substantially exposed; |
| (ii) | the level of expenditure required to explore and develop new ore reserves and to maintain existing production facilities; |
| (iii) | the level of capital expenditure required to develop new projects; |
| (iv) | the level of operating expenditure required for wages, salaries and consumables; and |
| (v) | the level of interest rates on borrowings. |
These factors will continue to influence our liquidity and capital resources in future years.
Our ability to pay dividends and meet other obligations is dependent in large part on, and may be limited by, the amount of cash generated by our nickel operations and the level of dividends we receive from our subsidiaries holding our copper-uranium and fertilizer businesses.
We generated funds from operations of A$336.7 million for the year ended December 31, 2002, compared with funds generated from operations of A$577.7 million for the year ended December 31, 2001. The decrease was due to a A$525.6 million reduction in our receipts from customers from marginally lower commodity prices and reduced sales volumes associated with our reduced production. This was in part offset by A$71.2 million from our closeout of interest rate swaps.
Our capital expenditure in 2002 of A$464.9 million included A$129 million on the rebuild of the copper and uranium solvent extraction circuits at Olympic Dam. The previously advised estimated cost of this project across 2002 and 2003 was approximately A$300 million. This amount is under review and may increase by approximately 25%, and commissioning of the copper solvent extraction plant is likely to extend to the first quarter of 2004. The project returns remain robust, and the cost will be funded through operating cash flows. We spent A$34 million in 2002 on the Optimization 3 project at Olympic Dam.
Our working capital was negative A$833.1 million as at December 31, 2002, due to the replacement of our borrowing facilities as part of the WMC Limited group prior to the demerger with temporary short-term facilities. Our recently completed private placement of the Old Notes on May 8, 2003 replaced US$700 million of the short-term facilities with medium- and long- term facilities. The exchange offer being made by this prospectus is intended to replace the Old Notes with the New Notes, which have essentially identical terms.
Our total borrowings were A$1,657.5 million at December 31, 2002, down from A$2,322.0 million at December 31, 2001. During the year ended December 31, 2002, our net repayment of borrowings amounted to A$446.4 million, compared with net repayments of A$778.3 million for the year ended December 31, 2001. As we discuss in the section entitled “Risk Factors” a decrease in the US$/A$ exchange rate will decrease our US$ denominated revenues in terms of A$ to the extent that they are not hedged, but will also decrease A$ funds required for repayment of our US$ denominated borrowings and other liabilities. For a description of our loan facilities, see the section entitled “Quantitative and Qualitative Disclosures About Market Risk—Interest Rate Hedging”.
56
Table of Contents
The maturity of our debt profile is outlined in Note 28 to our Consolidated Financial Statements. The maturity of our cross currency swaps is outlined in Note 36 to the Consolidated Financial Statements. The key funding principles inherent in our Treasury policies are:
| • | BBB credit rating should be our target minimum rating, although this is not an absolute constraint. |
| • | We expect to continue to maintain conservative levels of debt over the longer term to ensure that our activities and growth are not debt constrained. Our long-term target is a gearing (debt/debt + equity) level of 25 to 35%. |
| • | Our aim is to source our debt from the most competitively priced source, balanced against the need to maintain a diversity of sources and a managed maturity portfolio. |
| • | Our debt tenor and currency should reflect asset life and currency exposure. We should retain a core amount of long-term debt (around 50% of total debt) with the balance in short-term and medium-term debt due to its lower cost and repayment flexibility. |
| • | Our Risk Management Committee is responsible for managing the fixed/floating interest rate mix and the currency of debt. It has accepted recommendations that a significant portion of longer-term debt should remain fixed. |
| • | We should utilize project finance where warranted by risk management considerations and permitted by finance covenants (country or project specific). |
| • | Where we acquire foreign currency assets, we should examine the raising of debt in that currency to achieve a balance sheet hedge and reduce foreign exchange translation exposures. |
| • | We should consider asset based financing only once we have assessed the acquisition decision positively on an all equity (i.e. ungeared) basis. The decision thereafter of buy versus lease or mode of financing is then one of financing cost or risk management/transference. |
Our cash and current investments net of bank overdrafts were A$90.5 million at December 31, 2002 and A$123.9 million at December 31, 2001. Our net debt was A$1,567.0 million at December 31, 2002 and A$2,197.9 million at December 31, 2001. The decrease in net debt was principally due to the transfer of approximately A$577 million of debt to Alumina Limited as part of the demerger and a reduction in the Australian value of the US dollar denominated borrowings as a result of the weaker US dollar relative to the Australian dollar as at December 31, 2002 compared to December 31, 2001.
Our available sources of liquidity were represented by unused bank facilities at December 31, 2002 of A$336.7 million, as compared to A$718.2 million at December 31, 2001. We have designated the bank loan balances as credit standby facilities in respect of the US$ and A$ commercial paper program and therefore we have determined their use and availability in line with the outstandings under this program.
Our capital expenditure (including exploration) was A$469.4 million for the year ended December 31, 2002, A$456.9 million for the year ended December 31, 2001 and A$468.6 million for the year ended December 31, 2000. Our capital expenditure was allocated as follows:
Year ended December 31, | ||||||
2002 | 2001 | 2000 | ||||
(A$ million) | ||||||
Exploration | 4.5 | 30.1 | 8.5 | |||
Mine development | 133.9 | 221.6 | 212.8 | |||
New plant and equipment at existing operations | 306.0 | 184.5 | 224.9 | |||
Acquisition of properties | 22.6 | 19.8 | 22.0 | |||
Government facilities | 2.4 | 0.8 | 0.6 | |||
57
Table of Contents
An analysis of our contractual and commercial commitments is set out in the table below.
Amount of Commitment to December 31, 2002 | ||||||||||
Total | Less than | 1-3 years | 3-5 years | More than | ||||||
(A$ million) | ||||||||||
Contractual Obligations | ||||||||||
Short-term debt | 1,287.6 | 1,287.6 | ||||||||
Non current payables | 849.7 | — | 245.6 | 415.5 | 188.6 | |||||
Long-term debt | 369.9 | — | 361.9 | 1.3 | 6.7 | |||||
Total on-balance sheet contractual obligations | 2,507.2 | 1,287.6 | 607.5 | 416.8 | 195.3 | |||||
Capital expenditure | 77.7 | 77.7 | — | — | — | |||||
Exploration and mining titles | 158.4 | 14.7 | 23.7 | 31.0 | 89.0 | |||||
Total off-balance sheet obligations | 236.1 | 92.4 | 23.7 | 31.0 | 89.0 | |||||
Amount of Commitment on December 31, 2002 | ||||||||||
Total | Less than | 1-3 years | 3-5 years | More than | ||||||
(A$ million) | ||||||||||
Other commercial commitments | ||||||||||
Business undertaking commitments | 70.2 | 5.8 | 12.4 | 10.5 | 41.5 | |||||
Operating lease commitments | 147.9 | 18.5 | 31.2 | 35.6 | 62.6 | |||||
Other commitments | 2,065.8 | 372.1 | 118.5 | 1,047.0 | 528.2 | |||||
Total other commercial commitments | 2,283.9 | 396.4 | 162.1 | 1,093.1 | 632.3 | |||||
Our capital commitments on contracts for the purchase of assets comprising mine properties and development, property, plant and equipment were A$77.7 million at December 31, 2002 and A$35.4 million at December 31, 2001. These commitments for capital expenditure are in addition to the normal capital expenditure involved in mine development and maintenance at our existing mines.
We estimate our commitments for expenditure for exploration, evaluation and mining activities during the life of our current exploration and mining tenements and earning rights under farm-in and option entitlements as A$158.4 million at December 31, 2002 and A$375.1 million at December 31, 2001. These amounts are the maximum potential expenditure commitments for work expected to be beneficial to us and include payments to vendors in which we have earning rights. Australian mining laws generally require that certain levels of expenditure be incurred to maintain tenements in good standing. The commitments may be reduced by seeking exemption from individual commitments or by relinquishment of tenure.
Our operating lease commitments relate to the Queensland Fertilizer Operations and comprise: the GATX sulphuric acid rail wagons, certain Townsville storage and conveying assets, the Phosphate Hill camp and the Mt Isa power generation turbine, all of which we have leased from Commonwealth Bank of Australia for a period of 10 years expiring in 2009, 2010, 2009 and 2006, respectively. We also have a lease with Caterpillar Finance relating to the Solar Turbines used for power generation at Phosphate Hill and lease various office facilities both in Australia and overseas.
Our other commitments consist of commitments for payments to suppliers of gas, gas conversion, shiploading, rail transport and sulphuric acid under long-term contracts existing at reporting date but not recognized as payable.
We do not have other material off-balance sheet financing arrangements.
58
Table of Contents
Research and Development, Patents and Licenses, etc
We have continued to consolidate and prioritize our research and development activities through a combination of internal development, external research, alliances, joint ventures and targeted venture capital activities. Company-wide effort is coordinated through a lead team of technical managers. During 2001, technical managers and external consultants undertook a thorough review of technology.
Our project expenditures qualifying for Australian research and development tax concessions were:
2000 | A$22.4 million |
| |
2001 | A$37.6 million |
| |
2002 | A$40.0 million | (1) |
| (1) | The 2002 figure is the accounting provision, as tax concession amounts are not finalized until later in the year. |
These figures only apply to those expenditures on which we have applied for tax concessions. We incur additional research and development expenditure on our site operating costs due to the continuous improvement philosophy of our business, and through venture capital arrangements.
Trend Information
Industry and market trends relevant to us are discussed as a whole and for each business segment in the section entitled “Operating Results”.
Other Financial Information
Export Sales
A significant proportion of our sales are to markets outside of Australia as shown in the revenue analysis below:
Australia | 21% | |
Europe | 30% | |
Japan | 12% | |
North America | 10% | |
Taiwan | 4% | |
Other | 23% |
Dividends
Our Board determines whether there will be a payment of dividends or implementation of other capital management initiatives after taking into consideration a number of factors, including our financial results, ongoing capital expenditure requirements, future cash requirements, general business conditions, taxation considerations (including the level of franking credits available), and any contractual, legal or regulatory restrictions on our ability to pay dividends, and any other factors our Board may consider relevant. Any dividends we pay are paid in Australian dollars.
We paid no dividend in respect of the year ending December 31, 2002. For the year ending December 31, 2003, our Board expects that, if a dividend distribution is to be made by us, it will be modest. Dividend distributions by us for 2003 and beyond will be determined by our Board after taking into account various factors, including those outlined above.
59
Table of Contents
We will not be in a position to pay franked dividends (which are dividends effectively paid out of profits which have borne Australian corporate tax) until our eligible carried-forward tax losses are utilized and we pay Australian tax on its profits. The Australian Federal Government’s proposed tax consolidation regime, amongst other things, is expected to affect the rate at which our carried-forward tax losses may be utilized, as described below. Under the consolidation regime, we may elect to consolidate our corporate group at any date following the demerger. We expect that all of our wholly-owned subsidiaries will elect to form a consolidated group with effect from January 1, 2004 resulting in us and our wholly-owned subsidiaries being treated as one single income tax entity from that date.
We expect that, during the period following the demerger and up to our consolidation, we will not pay Australian income tax and, therefore, will not have sufficient franking credits available to pay fully franked dividends to our shareholders.
The proposed consolidation rules are likely to reduce the rate at which carried-forward tax losses incurred prior to the date of consolidation may be utilized after consolidation. Despite this, our profits earned after consolidating the group may remain sheltered to some extent by the utilization of tax losses from pre-consolidation years when combined with any current year tax incurred by us.
The extent to which our profits will be sheltered by tax losses and, therefore, the extent to which we will be able to pay franked dividends, will ultimately depend on our profitability. Based on our historical results, we currently believe that we may not pay income tax in the short term. Accordingly, we anticipate that over this period we may not have sufficient franking credits available to pay fully franked dividends to our shareholders.
Financing and Corporate Items
Net financing and corporate expenses for the year ended December 31, 2002 totaled A$195.2 million compared to A$230.8 million for the year ended December 31, 2001. The principal components were:
Year ended December 31, | |||||||||
2002 | 2001 | 2000 | |||||||
Loss/(Gain) on revaluation of foreign currency assets & liabilities | 14.9 |
| 20.7 |
| (2.5 | ) | |||
Interest (received)/(receivable) | (103.5 | ) | (154.3 | ) | (152.3 | ) | |||
Interest paid/payable | 152.2 |
| 295.2 |
| 300.4 |
| |||
Corporate | 131.6 |
| 69.2 |
| 43.4 |
| |||
Net interest credited to profit was A$48.7 million for the year ended December 31, 2002 compared to a charge of A$140.9 million for the year ended December 31, 2001, reflecting the decrease in borrowings, and the recognition of the gain on the close out of interest rate swaps. Corporate expenditure included A$11.5 million of redundancy costs associated with the restructuring of our service functions in the year ended December 31, 2001.
Significant Changes
No significant changes have occurred since the date of our audited Consolidated Financial Statements.
60
Table of Contents
History and Development of WMC Resources
Background
We were incorporated under the laws of the Commonwealth of Australia on March 2, 1933. Through the transactions to effect the demerger of WMC Limited’s interest in the Alcoa World Alumina and Chemicals (“AWAC”) joint venture with Alcoa Inc. from WMC Limited’s other businesses effective December 11, 2002, we became an independent diversified resources company. From 1979 until the demerger, we had been operating as a wholly-owned subsidiary of WMC Limited, holding principally the group’s nickel assets. Our main businesses consist of the discovery, development, production, processing and marketing of minerals and metals. We produce nickel, copper, phosphate fertilizers, uranium oxide, gold and a range of other intermediate products. As at December 31, 2002, we had total consolidated assets of approximately A$7.3 billion and we generated net sales revenue from operations of approximately A$2.5 billion in the year ended December 31, 2002.
We have our registered office and principal executive offices at Level 16, 60 City Road, Southbank, Victoria, 3006, Australia. Our telephone number is +61 3 9685 6000 and our facsimile number is +61 3 9685 3569.
The demerger
On November 21, 2001, WMC Limited announced a proposal to demerge its interests in AWAC from its other mineral businesses. The demerger was effected through an Australian court-approved scheme of arrangement and associated capital reduction and dividend distribution with an effective accounting date of November 30, 2002. As a result of the demerger, WMC Limited has continued to hold its interest in AWAC (but changed its name to Alumina Limited) and we hold the nickel, copper/uranium and fertilizer businesses and exploration and development interests (other than those relating to AWAC) previously held within the WMC Limited group.
Immediately prior to effecting the demerger, through a series of share sale transactions internal to the WMC Limited group, we acquired those of WMC Limited’s subsidiaries which held its copper/uranium and fertilizer businesses and exploration and development interests (other than those relating to AWAC), together with those subsidiaries which provide administrative or financial support to, or otherwise relate to activities conducted by, us. The shares of the subsidiaries were transferred to us in return for our newly issued ordinary shares. For accounting purposes, the subsidiaries were acquired in connection with the demerger at their fair value. These fair values were determined by using discounted cash flows in accordance with Australian GAAP. (Under Australian GAAP, fair value is defined as the amount for which an asset could be exchanged, or a liability settled, between knowledgeable, willing parties in an arm’s length transaction. However, in circumstances such as these where the transaction does not take place in an active market, fair value can be determined using alternative estimation techniques such as discounted cash flows.)
The demerger was effected in two simultaneous stages. First, WMC Limited reduced its share capital by a notional cash amount of A$2.78 per share and declared a notional cash dividend of A$0.73 per share. Second, under the scheme of arrangement effected by an order of the Court and binding on all WMC Limited shareholders and WMC Limited, WMC Limited shareholders agreed to purchase all of our shares utilizing as consideration their capital reduction and dividend entitlements from WMC Limited. As a result WMC Limited shareholders received our shares on a pro-rata basis in the demerger.
The amount of the capital reduction and dividend together represented our carrying value in the books of WMC Limited at November 30, 2002 after giving effect to the share transfers at fair value mentioned above. This carrying value amounted to A$4,007.5 million.
61
Table of Contents
The demerger required the approval of a majority in number of WMC Limited shareholders present and voting, and holding at least 75% of the total number of WMC Limited shares voted, at the shareholders’ meeting held to consider the demerger. The implementation of the demerger was subject to the approval of the Australian court considering the scheme of arrangement. The approval of the ASX was also required in order to admit us to the official list of the ASX.
The information about us and our operating and financial review and prospects has been presented in this prospectus as though we had existed as a stand-alone economic entity for all the periods presented.
Capital Expenditure and Divestiture
Since January 1, 2000 we have made the following principal capital expenditure and divestiture:
| • | Our divestment of our Kambalda mines is part of our nickel strategy to divest mature nickel mines and seek to participate in the benefits that a small focused operator can yield from the remaining resource. Since early 2000, we have been selling various of the mines within our Kambalda nickel operations. To the date of this prospectus, proceeds from these sales have totaled A$52.0 million in aggregate. We anticipate that our remaining mine in the Kambalda region will be sold over the next few years. |
| • | In February 2001 we purchased the Yakabindie nickel project. The Yakabindie project, situated near Mt Keith, involved an investment of A$40 million, A$25 million of which was paid at the time of acquisition with the remaining A$15 million due upon gaining approval to mine the property. While the approval process has been commenced, final approvals to mine are not expected for some years. |
| • | In 2002 we completed an optimization project to increase production capacity of copper cathode at our Olympic Dam operations in South Australia. The project has increased the refinery capacity and improved efficiency in the milling and hydro-metallurgy areas. The capital cost was approximately A$79 million. |
We currently have the following capital expenditure, asset purchase and divestiture activities in progress:
| • | Olympic Dam experienced a fire in both the copper and uranium solvent extraction circuits in 2001. The previously advised estimated cost of this project across 2002 and 2003 was approximately A$300 million. This amount is under review and may increase by approximately 25%, and commissioning of the copper solvent extraction plant is likely to extend to the first quarter of 2004. The project returns remain robust, and the cost will be funded through operating cash flows. |
| • | A relining of the Olympic Dam smelter furnace (which requires a 40 day shutdown of production) is scheduled for the second half of 2003 with an estimated total cost of A$120 million. |
| • | In January 2003, we finalized our acquisition of 100% of the Corridor Sands titanium dioxide project located in Mozambique for US$62.5 million. We will pay a final tranche of up to US$25 million in either shares or cash at our option prior to December 31, 2003. The exact amount of the second tranche is subject to, and contingent upon, any future sales by us of all or part of our equity interest in Corridor Sands, at proceeds above stipulated levels. |
Business Overview
General
Our main business is the discovery, development, production, processing, and marketing of minerals and metals. We produce nickel, copper, phosphate fertilizers, uranium oxide, gold and a range of other intermediate products. Our other activities include producing, marketing and distributing fertilizers.
During 2002 we explored in Australia, China, Peru, Mongolia, Tanzania and the USA. During 2002 we completed a feasibility study on the Corridor Sands titanium feedstock project in southern Mozambique and
62
Table of Contents
purchased 100% of this project. The Industrial Development Corporation of South Africa exercised an option in May 2003 to acquire a 10% interest in the project, subject to documentation, South African Reserve Bank approval and the completion of a number of key project milestones.
The following map shows the location of our operations and interests in Australia.
| CORPORATE OFFICES | FERTILIZER | |
1. Melbourne, VIC | 10. Mt Isa, QLD | |
2. Perth, WA
| 11. Phosphate Hill, QLD 12. Townsville, QLD
| |
| COPPER-URANIUM | EXPLORATION | |
3. Olympic Dam, SA
| 13. West Musgrave, WA | |
| NICKEL | ||
4. Kalgoorlie, WA | ||
5. Kambalda, WA | ||
6. Kwinana, WA | ||
7. Leinster, WA | ||
8. Mount Keith, WA | ||
9. Yakabindie, WA |
Segment Information
We categorize our on-going operations as follows: Nickel; Copper-Uranium (the Olympic Dam Operations which produces copper, uranium oxide, gold and silver); Fertilizers; Regional Exploration and New Business. Geographic and financial information relating to the segments of continuing operations are included under Note 7 to our Consolidated Financial Statements. The following table sets forth financial information in A$ by operating segments for each of the last three years.
63
Table of Contents
Financial Information by Segment (Continuing Operations)
| Year ended December 31, | |||||||||
| 2002 | 2001 | 2000 | |||||||
| (A$ million) | |||||||||
Sales Revenue by Operating Segments(1) | |||||||||
Nickel | 1,314.9 | 1,200.9 | 1,645.4 | ||||||
Copper-uranium | 723.3 | 810.3 | 798.0 | ||||||
Fertilizers | 420.4 | 352.9 | 222.6 | ||||||
Unallocated corporate revenues | 28.6 | — | — | ||||||
| 2,487.2 | 2,364.1 | 2,666.0 | |||||||
Consolidated Income/(loss) by Operating Segments before Income Tax | |||||||||
Nickel | 212.7 | 146.9 | 626.7 | ||||||
Copper-uranium | 48.8 | 47.9 | 165.7 | ||||||
Fertilizers | (53.5 | ) | (89.4 | ) | (59.7 | ) | |||
Unallocated result | 11.4 | (1.0 | ) | (1.2 | ) | ||||
Product Operating Income | 219.4 | 104.4 | 731.5 | ||||||
New Business | (36.5 | ) | (35.3 | ) | (6.2 | ) | |||
Regional Exploration | (22.3 | ) | (63.9 | ) | (53.8 | ) | |||
Financing/Corporate | (195.2 | ) | (228.5 | ) | (189.3 | ) | |||
| (34.6 | ) | (223.3 | ) | 482.2 | |||||
| (1) | Sales revenue includes intermediate-product sales, commodity and related currency hedging. Inter-segment sales are on a commercial basis and are not significant. All revenues are considered to be generated in Australia—see Note 7 of our Consolidated Financial Statements. |
The operations and assets of our business segments are further described in the section entitled “Business Description—Property, Plant and Equipment”.
Organizational Structure
The WMC Resources Group consists of WMC Resources, the ultimate parent company, and its subsidiaries. Our business is split into business units based on major production commodities and activities:
| • | Nickel; |
| • | Copper-Uranium; |
| • | Fertilizers; |
| • | Regional Exploration and New Business; and |
| • | Other. |
The principal companies within the WMC Resources Group are:
| • | WMC Resources Ltd—Incorporated in Australia, WMC Resources Ltd is the parent holding company as well as an operating entity that owns the nickel mining, processing and marketing operations. |
| • | WMC (Olympic Dam Corporation) Pty Ltd—Incorporated in Australia, this company owns the Olympic Dam Operations which produces high quality refined copper and uranium oxide and gold and silver as co-products. It is wholly-owned by WMC Resources Ltd. |
| • | WMC Fertilizers Pty Ltd—Incorporated in Australia, this company owns the Queensland Fertilizer Operations and fertilizer distribution arm, Hi-Fert Pty Ltd. It is wholly-owned by WMC Resources Ltd. |
64
Table of Contents
| • | WMC Finance Limited—Incorporated in Australia, this company’s principal activities are the borrowing and lending of money and other financing activities, including commodity and currency hedging and the selling of gold and silver purchased from related entities. It is wholly-owned by WMC Resources Ltd. |
| • | WMC Finance (USA) Limited—Incorporated in Australia, the principal activity of this company is to hold debt issued in the United States markets. It is wholly-owned by WMC Resources Ltd. |
For the complete list of the entities we consolidate into our Group please refer to Note 37 of our Consolidated Financial Statements.
Property, Plant and Equipment
All our assets are 100% owned, either directly or through subsidiary companies, unless otherwise stated.
Under our current life of mine plans, all reported reserves will be mined out within the period of existing leases or concessions or within the time period of assured renewal periods. All reported reserves are at sites which have all required permits and government approvals.
Nickel
Our nickel business unit is a fully integrated nickel business comprising mines, concentrators, a smelter and a refinery. We produced 106,423 tonnes of contained nickel-in-concentrate extracted from 14.3 million tonnes of ore processed in the year ended December 31, 2002. This compared with production of 104,591 tonnes of contained nickel-in-concentrate in the year ended December 31, 2001 from 13.8 million tonnes of ore processed. Purchased feed from third parties was 20,900 tonnes of recovered nickel for the year ended December 31, 2002, compared to 19,717 tonnes for the year ended December 31, 2001.
Our strategy for the nickel business unit is to:
| • | optimize the performance of our existing assets by focusing on improving margins; |
| • | increase output at minimum capital cost and reduce unit cost of production through process improvement, technology and de-bottlenecking; |
| • | maintain the business as a major low cost producer; |
| • | grow the business where commercially viable through projects such as Yakabindie and through exploration; and |
| • | continuously review our portfolio of assets |
We commenced production of nickel-in-concentrate in 1967, following the discovery of significant nickel ore reserves at Kambalda. We currently mine nickel ore from both open-cut and underground mines at our wholly owned mines at Leinster and Mount Keith. We ceased mining at Kambalda in 2002. The mill and concentrator at Kambalda are now fed with third party ore. Nickel ore is concentrated at Kambalda, Leinster and Mount Keith and then the majority of this nickel concentrate is transported to the Kalgoorlie Nickel Smelter to be smelted into nickel matte. We sell some of the Mount Keith production directly as concentrate. In the year ended December 31, 2002, we sold 28% of nickel-in-matte produced to overseas customers compared to 36% in 2001 fiscal year and refined the balance at our Kwinana Nickel Refinery to produce LME accredited nickel briquettes, nickel powder and various other intermediate products such as ammonium sulphate.
Pursuant to an agreement with Southern Cross Energy which expires in 2013, power at the Kambalda, Mount Keith and Leinster nickel operations and at the Kalgoorlie Nickel Smelter is primarily derived from on site third party gas fired turbines with power at the Kwinana Refinery being wheeled from the goldfields through
65
Table of Contents
Western Power. Under the agreement with Southern Cross Energy, we have a take or pay obligation to purchase energy. In the Goldfields region, until 2006, gas is purchased under long term contract and is sourced from North West gas fields and transported by the Goldfields Gas Pipeline. Under the gas transmission agreement, we have an 80% take or pay obligation. Since December 31, 2001 the transmission tariff has increased by approximately 30% and we are currently disputing this increase in accordance with the dispute resolution procedures under the transmission agreement. The Western Australian Independent Gas Pipeline Regulator has made a draft decision regarding tariffs payable by third parties for access to the pipeline suggesting that a lower access tariff to that currently proposed by the pipeline owners should apply. The pipeline owners have commenced proceedings in the Supreme Court of Western Australia seeking a declaration that the Regulators’ draft decision does not apply. Until 2007 gas for the Kwinana Refinery will be sourced from the North West of Western Australia and is transported by the Dampier to Bunbury natural gas pipeline, with us having a 70% take or pay obligation.
A summary of the production of nickel-in-concentrate from our mines and third parties, matte from its smelter and metal from its refinery for the last five years is set out below.
Nickel Production Summary
Year ended December 31, | ||||||||||
2002(2) | 2001 | 2000 | 1999(1) | 1998 | ||||||
(tonnes) | ||||||||||
Nickel-in-concentrate Produced | ||||||||||
Kambalda | 23,225 | 18,653 | 19,202 | 11,114 | 33,381 | |||||
Leinster | 40,006 | 38,008 | 40,724 | 35,953 | 44,313 | |||||
Mount Keith | 43,192 | 47,930 | 47,532 | 41,208 | 42,037 | |||||
Total | 106,423 | 104,591 | 107,458 | 88,275 | 119,731 | |||||
Kalgoorlie Smelter Production | ||||||||||
Concentrate treated | 640,500 | 704,330 | 737,244 | 575,219 | 722,362 | |||||
Matte produced | 134,400 | 140,432 | 148,051 | 116,299 | 145,741 | |||||
Nickel-in-matte produced | 91,574 | 96,650 | 103,019 | 79,668 | 100,071 | |||||
Kwinana Refinery Production | ||||||||||
Matte treated | 100,700 | 94,208 | 93,975 | 79,792 | 84,072 | |||||
Refined nickel produced | 65,055 | 61,324 | 60,532 | 53,009 | 53,695 | |||||
| (1) | In 1999 the Kalgoorlie Nickel Smelter was shut down for 63 days for a major furnace rebuild following a furnace leak. |
| (2) | In 2002 the Kalgoorlie Nickel Smelter was shut down for 24 days for repairs to the mist precipitators following a fire. |
The table below shows our proven and probable nickel ore reserves.
Nickel Ore Reserves(1)(2)(3)
As at December 31, 2002 | ||||||||||||||||
Type of | Proven(5) | Probable(6) | Total | Assumed | ||||||||||||
Operation | Ore (million | Grade % | Ore (million | Grade % | Ore (million | Grade % | % | |||||||||
Kambalda | u/g | — | 0.1 | 3.3 | 0.1 | 3.3 | 87 | |||||||||
Leinster | u/g | 7.1 | 1.6 | 12.0 | 1.9 | 19.1 | 1.8 | 79 | ||||||||
o/c | — | — | 1.0 | 2.5 | 1.0 | 2.5 | 76 | |||||||||
Mount Keith | o/c | 212.1 | 0.56 | 86.5 | 0.57 | 298.6 | 0.56 | 65 | ||||||||
s/p | 24.5 | 0.49 | — | — | 24.5 | 0.49 | 48 | |||||||||
| (1) | The commodity price used to estimate the 2002 nickel ore reserves was A$5.00/lb. At the 2002 average exchange rate this equates to US$2.72/lb. |
66
Table of Contents
| (2) | Ore reserves reflect tonnages recoverable from mining. The estimates include diluting materials and allowances for losses which may occur when the material is mined but do not include adjustments for metallurgical recovery. |
| (3) | We have 100% interest in all operations. |
| (4) | u/g = underground, o/c = open-cut, s/p = stockpile. |
| (5) | Approximate drill hole spacings we used to classify the proven ore reserves are: |
| • | Leinster (Perseverance Shoot)—£25m x 25m and |
| • | Mount Keith—£40m x 40m. |
| (6) | Approximate drill hole spacings we used to classify the probable ore reserves are: |
| • | Kambalda—£40m x 20m, |
| • | Leinster (Perseverance Shoot)—£50m x 50m and |
| • | Mount Keith—£80m x 80m. |
| (7) | The metallurgical recovery factors included in the tabulation represent the estimated overall nickel recovery, from run-of-mine ore feed to final saleable product, assumed in the estimation of the ore reserves. The reported factors for the nickel operations are estimated primarily on the basis of the historical concentrator, smelter and refinery performance, and do not include current planned metallurgical recovery improvements. Assumed metallurgical recoveries for the individual components of the nickel business are the following: |
Kambalda concentrator 92%, Leinster concentrator 83% (u/g ore) and 80% (o/c ore), Mount Keith concentrator 68% (o/c ore) and 51% (s/p ore), Kalgoorlie Nickel Smelter 97% and Kwinana Nickel Refinery 98%.
In 2002, we continued our exploration work at our West Musgrave nickel-copper project in Western Australia. West Musgrave is located within the Musgrave Ranges north-east of Laverton near the South Australian border. The tenements lie entirely within Aboriginal Reserve No. A17614, administered by the Ngaanyatjarra Land Council. See discussion of West Musgrave in “Business Description—Regional Exploration and New Business”.
Nickel Operations
Kambalda Nickel Operations
Our Kambalda operations are located 56 kilometers south of Kalgoorlie in Western Australia and comprise high-grade nickel sulphide mines and a concentrator. Since early 2000, we have been selling our mines at Kambalda and entering into long-term nickel purchase agreements with the purchasers for the processing of ore and the purchase of subsequent concentrate. The divestment of the mines is part of our nickel strategy to divest mature mines where proven and probable reserves are nearly depleted and reduce the capital intensity of the operation. During the first half of 2002, we ceased mining ore at Kambalda and now rely entirely on third party ore for feed through the concentrator, some of which is sourced from mines previously owned by us. The Kambalda concentrator has a capacity of 1.5 million tonnes of ore per year. The current utilization of the Kambalda concentrator is approximately 50%. The nickel concentrate, containing approximately 12% to 14% nickel, is dried at Kambalda and transported by rail to the Kalgoorlie Nickel Smelter for conversion to nickel matte.
Purchases from third parties amounted to 20,900 tonnes of recovered nickel for the year ended December 31, 2002, and 19,717 tonnes for the year ended 2001. We disposed of the lease containing the Miitel mine, previously on care-and-maintenance, in November 2000. During 2001 the Wannaway mine and North Widgiemooltha Block were sold to external parties. We leased land containing the Otter, Juan and Coronet North mines to third parties under a long term arrangement. We sold the Long Victor mine during September 2002. The Lanfranchi mine complex is the only mine at Kambalda we still own. We ceased mining at Lanfranchi at the end of March 2002. We anticipate that we will sell this remaining mine over the next few years. We have entered into long-term nickel purchase agreements with the purchasers of these mines.
67
Table of Contents
The net written down value of property and associated plant and equipment at Kambalda Nickel Operations at December 31, 2002 was A$22.9 million.
Leinster Nickel Operations
Leinster is approximately 375 kilometers north of Kalgoorlie in Western Australia. We purchased the Leinster Nickel Operations in 1988 from Mount Isa Mines and Western Selcast.
The site comprises underground and open pit mines and a concentrator and is supported by the nearby township of Leinster. The Leinster deposits consist of both medium-grade disseminated sulfide and sulfide mineralization with average grades ranging between 1.5% and 4.0%. During 2002, we sourced our Leinster production from the Perseverance underground mine and the Harmony open cut mine. The Leinster mill operating capacity is rated 2.8 million tonnes of ore per year and its utilization is currently approximately 92%. The nickel concentrate, containing approximately 12% nickel, is dried at Leinster before being delivered to our Kalgoorlie Nickel Smelter for further processing.
The net written down value of our property and associated plant and equipment at Leinster Nickel Operations at December 31, 2002 was A$301.3 million. Our reserves are equivalent to approximately ten years life at current production rates for the Perseverance underground mine.
Mount Keith Operations
Mount Keith is located in Western Australia, approximately 450 kilometers north of Kalgoorlie and 80 kilometers north of Leinster. The Mount Keith deposit is a low-grade disseminated sulphide ore body averaging some 0.6% nickel that is mined by open-cut method. The operation includes a concentrator and ancillary facilities and we officially commissioned it in January 1995.
We have an agreement to sell half of the annual production of nickel-in-concentrate from Mount Keith, up to a maximum of 14,000 tonnes of nickel-in-concentrate per year to OMG Harjavalta Nickel Oy. The contract term will expire when 140,000 tonnes in total have been delivered, which is expected to occur in the first quarter of 2005. Mount Keith concentrates, containing approximately 20% nickel, not contracted for sale are transported by road to Leinster or Kambalda for drying and blending with other concentrates and then delivered to the Kalgoorlie Nickel Smelter for smelting.
The nominal capacity of the Mount Keith concentrator is 11.2 million tonnes of ore per annum. It currently has a utilization of approximately 95%. Average nickel recoveries of around 70% were achieved in 2002. We recently completed a feasibility study which indicates that the milling capacity at Mount Keith could be increased by up to 30%.
The net written down value of our property and associated plant and equipment at Mount Keith Operations at December 31, 2002 was A$540.5 million. Our reserves included in the current mine plan will be depleted in approximately 16 years at current production rates.
Kalgoorlie Nickel Smelter
We constructed the Kalgoorlie Nickel Smelter and commenced operation in 1972 to supply nickel matte under sales contracts to overseas nickel refiners and also to supply our nickel refinery at Kwinana. The smelter receives supplies of concentrate from the Kambalda, Leinster and Mount Keith treatment plants. We use a flash smelting process to produce matte containing 66% to 75% nickel and 2% to 3% copper.
The Kalgoorlie Nickel Smelter also produces sulphuric acid. We sell most of the sulphuric acid to nickel laterite operations in the Kalgoorlie area, with some acid being used at Mount Keith and the Kwinana Nickel Refinery. In the year ended December 31, 2002, we produced 489,568 tonnes of sulphuric acid compared to 532,103 tonnes in the previous 12 months.
68
Table of Contents
In the year ended December 31, 2002 approximately 72% of the nickel-in-matte we produced, and in the year ended December 31, 2001 approximately 64% of the nickel-in-matte we produced, was sent by rail to our refinery at Kwinana where we refined it to nickel metal. We exported the remainder.
The net written down value of our property and associated plant and equipment at the Kalgoorlie Nickel Smelter at December 31, 2002 was A$236.4 million.
Kwinana Nickel Refinery
The Kwinana Nickel Refinery is 30 kilometers south of Perth in Western Australia. We constructed the refinery, which commenced operation in 1970, and use the Sherritt-Gordon ammonia leach process to convert nickel matte from the Kalgoorlie Nickel Smelter into LME grade nickel briquettes and nickel powder. A small amount of higher grade nickel concentrate from Mount Keith has on occasion been used to supplement matte as feedstock. The refinery also produces a number of intermediate products, including copper sulphide, cobalt-nickel sulphide and ammonium sulphate. The cobalt-nickel sulphide is treated by a third-party processor that separates the nickel and cobalt into metal. We receive a credit for the nickel and have the cobalt metal returned for subsequent sale.
The net written down value of our property and associated plant and equipment at the Kwinana Nickel Refinery at December 31, 2002 was A$165.4 million.
Markets and Competition
Nickel is used primarily in the production of stainless steel, low alloy steels, nickel-based alloys to impart strength, toughness and corrosion resistance. It is also used for electroplating and the production of chemicals and batteries. Stainless steel accounted for approximately 67% of world primary nickel demand in 2002 and this percentage is expected to increase as stainless steel is expected to grow faster than other nickel applications.
In the Western World, growth in demand for stainless steel has consistently outstripped growth in industrial production.
The London Metal Exchange is the central price setting market for most nickel. Nickel prices in 2002 ranged from US$2.55/lb to US$3.50/lb (average daily cash settlement). Having reached a cyclical low in 2001, nickel prices posted a modest recovery in 2002 due to higher stainless steel production, tight availability of stainless steel scrap and strong Chinese demand. We believe that the medium- to long-term outlook is positive due to limited new supply coming on-stream term and expected continued growth in stainless steel production as a result of substantial new capacity additions.
We sell nickel metal, nickel matte, nickel concentrate and various intermediate products. Most of our nickel metal sales are made under short- to medium-term contractual arrangements. We sell nickel metal to a large number of customers in Europe, North America and Asia. We also maintain websites for the sale of uncontracted nickel and cobalt metal.
Approximately 75% of our nickel-in-matte sales for the year ended December 31, 2002 were made to Sumitomo Metal and Mining Company Limited of Japan (“Sumitomo”). We have long-term contracts with Sumitomo for a total of 26,000 tonnes of nickel-in-matte per year. These contracts expire progressively between 2003 and 2005. This contractual arrangement is an extension of our long-standing relationship with Sumitomo. We have been providing Sumitomo with nickel concentrate or matte on a consistent basis since the late 1960s. We may seek to renew these agreements prior to their expiry for a total of 16,000 tonnes of nickel-in-matte per year, consistent with our past course of dealing with Sumitomo. If, for any reason, one or more of these contracts are not renewed or replaced with new contracts with Sumitomo, we will pursue other avenues for the disposition
69
Table of Contents
of our nickel matte products. We believe that ample potential purchasers are available to pick up any lost sales to Sumitomo. We have recently concluded a three year agreement, commencing in 2005, for 10,000 tonnes of nickel-in-matte per year, with Jinchuan Non-Ferrous Metals I/E Company of China.
Copper-uranium
Our Olympic Dam Operations in South Australia are a significant Australian producer of both copper and uranium oxide. Our Olympic Dam subsidiary assumed 100% ownership of the Olympic Dam Operations on March 31, 1993 after previously holding 51% in the joint venture that established operations at Olympic Dam.
During 2002, Olympic Dam completed an optimization project to increase its production capacity to 235,000 tonnes per annum of refined copper. However, we expect production in 2003 to be 185,000 tonnes due to the planned plant shutdown to reline the smelter and the rebuild of the copper and uranium solvent extraction plants.
A summary of our Olympic Dam copper, uranium oxide and gold and silver production is set out below.
Olympic Dam Production Summary
Year ended December 31, | ||||||||||||
2002 | 2001 | 2000 | 1999 | 1998 | ||||||||
Ore treated | ‘000s tonnes | 8,875 | 9,336 | 8,901 | 6,743 | 3,405 | ||||||
Grade of Ore: | ||||||||||||
Copper | % | 2.57 | 2.47 | 2.53 | 2.69 | 2.72 | ||||||
Uranium oxide concentrate | kilograms/tonne | 0.69 | 0.72 | 0.73 | 0.78 | 0.80 | ||||||
Gold | grams/tonne | 0.53 | 0.59 | 0.53 | 0.65 | 0.56 | ||||||
Metal Produced: | ||||||||||||
Refined copper | tonnes | 178,120 | 200,523 | 200,423 | 138,272 | 73,645 | ||||||
Uranium oxide concentrate | tonnes | 2,891 | 4,379 | 4,539 | 3,221 | 1,740 | ||||||
Gold | ounces | 64,293 | 113,412 | 69,967 | 30,510 | 31,590 | ||||||
In July 2002, we announced that a review of the smelting operations had identified that deterioration in excess of expectations in the furnace roof and sidewall refractory, and in adjacent taphole cooling jackets, would require increased maintenance and consequential down time that would impact copper production and might impact uranium oxide production. The review found that it would be prudent from an operating risk perspective to advance plans to reline the Olympic Dam furnace, which was previously scheduled for a smelter shutdown in the first half of 2004. We plan to bring the reline forward to the second half of 2003. We expect that relining the furnace will take approximately 40 days and will impact copper and uranium oxide production, cash generation and costs. We estimate the cash cost of relining the direct-to-blister furnace, including cooling jacket replacement and improvements, will be approximately A$57 million. We estimate associated refurbishment and repairs to the smelter, anode furnaces, slag furnace and sulphuric acid plant, normally scheduled to coincide with each smelter reline, to cost an additional estimated A$35 million. At the same time, we will also undertake modifications to improve the capability of the gas handling system and acid plant at an estimated cost of A$28 million. We expect to spend an additional A$7 million on a project to modify the slag furnace to be undertaken during the smelter shutdown.
70
Table of Contents
The table below shows our proven and probable copper, uranium oxide and gold reserves at the Olympic Dam Operations.
Olympic Dam Ore Reserves(1)(2)(3)(4)
As at December 31, 2002 | ||||||||||||||||||
Type of | Unit of Grade | Proven(6) | Probable(7) | Total | Assumed | |||||||||||||
Commodity | Ore | Grade | Ore | Grade | Ore | Grade | ||||||||||||
(million | (million | (million | % | |||||||||||||||
Copper | u/g | % | 123 | 2.3 | 587 | 1.5 | 710 | 1.6 | 93 | |||||||||
Uranium | u/g | kg/tonne | 123 | 0.6 | 587 | 0.5 | 710 | 0.5 | 72 | |||||||||
Gold | u/g | gram/tonne | 123 | 0.6 | 587 | 0.5 | 710 | 0.5 | 60 | |||||||||
| (1) | The commodity prices used to estimate the 2002 ore reserves were: A$1.42/lb for copper, A$23.33/lb for uranium and A$500/oz for gold. At the 2002 average exchange rate this equates to US$0.77/lb for copper, US$12.71/lb for uranium and US$272/oz for gold. The uranium price reflects a premium over the spot price based on long-term contracts. |
| (2) | Ore reserves at Olympic Dam contain copper, uranium and gold. The reported copper, uranium and gold grades are for the same reserve tonnage. |
| (3) | Ore reserves reflect tonnages recoverable from mining. The estimates include diluting materials and allowances for losses which may occur when the material is mined but do not include adjustments for metallurgical recovery. |
| (4) | We have a 100% interest in the Olympic Dam Operations. |
| (5) | u/g = underground. |
| (6) | Approximate drill hole spacings we used to classify the proven ore reserves are£40m x 40m. |
| (7) | Approximate drill hole spacings we used to classify the probable ore reserves are£80m x 80m. |
| (8) | The metallurgical recovery factors included in the tabulation represent the estimated overall recovery of copper, uranium and gold, from run-of-mine ore feed to final saleable product, assumed in the estimation of the ore reserves. |
Olympic Dam’s current strategic approach can be summarized as follows:
| • | in the short term, to complete the smelter reline and copper and uranium solvent extraction circuit rebuild in 2003 and achieve annual copper production of 235,000 tonnes in 2004; |
| • | to increase output at minimum capital cost and further reduce production costs through process improvement, technology and de-bottlenecking; and |
| • | to review further expansion options. |
Due to the size of the Olympic Dam ore body, there is potential to increase the size of the operation further. Work to examine a number of options is underway. However, any further expansion of Olympic Dam beyond the current optimization project will first require various regulatory and governmental approvals covering a range of operational matters.
Olympic Dam Operations
We discovered the Olympic Dam copper, uranium, gold and silver deposit in 1975, 560 kilometers north-west of Adelaide in South Australia. It comprises a large number of discrete ore zones throughout an area of several square kilometers ranging in depth from 350 meters to approximately one kilometer. The Olympic Dam underground mining operation is highly mechanized, with automated rail transportation and underground
71
Table of Contents
crushing. The primary method of ore extraction is long hole open stoping with cemented aggregate fill. This method allows for large equipment to achieve high productivity and maximum ore recovery.
Ore is hoisted to the surface where it is fed to one of two grinding circuits. After grinding, the resultant slurry passes to a flotation circuit where a series of flotation stages and a further regrinding activity produce a copper concentrate. The concentrate then passes through a leaching circuit which is principally designed to extract uranium from the copper minerals. Uranium is extracted in a solvent extraction plant, producing yellow-cake, which is subsequently calcined to produce uranium oxide concentrate and then packaged in drums for export sales.
After drying, copper concentrate is fed to an Outokumpu flash furnace smelter, which produces blister copper and flash furnace slag. Blister copper is transferred to anode furnaces for fire refining. Anode copper is transported to the refinery where the ISA electro-refining process is used to produce copper cathodes. The slimes from this process are treated separately to recover gold and silver.
Power for the Olympic Dam Operations is supplied via a 275kV power line from Adelaide, with power supplied currently under contract until July 2006 by TXU and transmitted by Electranet in accordance with the National Electricity Code and the Electricity Act 1996 (SA) (as amended). We have finalized a formal contract with TXU covering a four-year term with an option to extend for two additional terms of three years. The new contract commenced operation for the supply of electricity to Olympic Dam from July 1, 2002.
Water supply for Olympic Dam is accessed from bore fields which draw from the Great Artesian Basin in South Australia. The operation has licenses from the relevant authorities to allow a drawdown (aquifer pressure) estimated to be the equivalent of 42 megalitres per day of which 33 megalitres per day is currently used.
The Olympic Dam Operations produces both LME accredited electrolytic refined copper cathode and electro-won copper which is not LME accredited. We commenced production at Olympic Dam in 1988 at a rate of 45,000 tonnes per year of refined copper. Between 1989 and 1995, our production rate was increased, ultimately raising the ore mining capacity to approximately 3 million tonnes per year to supply a copper production capacity of approximately 85,000 tonnes per year. In 1999, we completed a major expansion of operations at Olympic Dam with production capacity increasing to approximately 200,000 tonnes of refined copper, 4,300 tonnes of uranium oxide, 75,000 ounces of refined gold and 850,000 ounces of refined silver per year. A further optimization project has taken our refined copper production capacity to 235,000 tonnes per annum. However, production in 2003 is expected to be 185,000 tonnes due to the plant shutdown to reline the smelter and the rebuild of the copper and uranium solvent extraction plants.
The Olympic Dam Operations experienced a fire in the Copper Solvent Extraction Circuit in 1999 which resulted in a loss of approximately 7,150 tonnes of copper production. We experienced a further fire in both the copper and uranium solvent extraction area in 2001. The previously advised estimated cost of this project across 2002 and 2003 was approximately A$300 million. This amount is under review and may increase by approximately 25%. The project returns remain robust, and the cost will be funded through operating cash flows. We expect to commission the rebuild of the uranium solvent extraction plant in the first half of 2003 and complete the construction of the copper solvent extraction plant by the end of 2003, with commissioning of the copper solvent extraction plant likely to extend to the first quarter of 2004. The rebuild cost and costs of lost production will be partially offset by insurance proceeds of more than A$120 million, consisting of at least A$80 million for business interruption and A$40 million for material damage. The total amount of insurance proceeds is under negotiation with our insurers.
The net written down value of our property and associated plant and equipment at Olympic Dam at December 31, 2002 was A$3.6 billion. Reserves included in our current mine plan will be depleted in approximately 20 years at current production rates.
72
Table of Contents
The Indenture Agreement
On June 21, 1982, the Government of South Australia, by an Act of the Parliament of that State, called the Roxby Downs (Indenture Ratification) Act of 1982, ratified an agreement between the State of South Australia and the then-current Olympic Dam Operations joint venturers. This Act:
| • | levies an ad valorem royalty of 3.5% on the value of the products dispatched from the mine. A second tier of additional royalty is also levied when the after-tax rate of return from the operation is greater than a threshold rate of 1.2 times the 10-year Australian government bond rate. After December 31, 2005, the royalty reverts to the royalty under the State Mining Act which, at present, is 2.5%; |
| • | confers continuing mining rights (via a Special Mining Lease) at Olympic Dam Operations until the deposit is economically mined out; |
| • | confers the right to draw water supplies; |
| • | provides Government infrastructure and services; and |
| • | permits production of up to 350,000 tonnes of copper per year. |
The Special Mining Lease relating to our Olympic Dam Operation has been granted for a period of fifty years with rights of extension for further periods of fifty years.
For information on native land claims refer to the section entitled “Business Description—Legal Proceedings—Native Title in Australia”.
Markets and Competition
Copper
Industrial usage of copper derives from its electrical and thermal conducive properties, its durability and strength. Copper has many end uses, including consumer products, transport, industrial machinery, construction and electronic products.
Copper is an internationally traded commodity, traded on the LME in London and the COMEX division of the New York Mercantile Exchange in New York.
The average copper price in 2002 was US$0.71/lb (US$1,565/tonne). Prices in 2002 remained weak due to the world economic slow down and new mine production coming on line. In response to the decline in prices, key copper producers have announced mine production cuts of 540,000 tonnes for 2003. US producers have also been impacted by the strength of the US$ and in some cases by higher energy prices.
Olympic Dam’s copper production is sold to customers in Europe, Australia and Asia under contracts which are negotiated annually. Contract prices are based on the LME cash settlement price.
Uranium Oxide—as a co-product to copper at Olympic Dam
The only significant commercial end use of uranium is as fuel for nuclear power electricity generating plants. Nuclear power currently accounts for approximately 16% of the world’s electricity requirements. Depending upon overall growth of electricity production from other sources, nuclear power’s share is expected to decline over the decade to comprise approximately 13% to 14% of total electricity production by 2010. Uranium production is spread among a number of countries with Canada and Australia being the largest producers. The industry is dominated by a small number of large producers. Worldwide annual mine production amounts to approximately 46,000 tonnes of uranium oxide.
73
Table of Contents
The rapid growth of uranium consumption in the 1970s and 1980s slowed in the 1990s with reduced construction of new power reactors. However demand has continued to strongly outstrip mine supply requiring continued draw-down of diminishing secondary stockpiles. Former Russian military uranium has been entering the commercial market in increasing quantities since 1995. The recent and expected future rate of such market entry is 24 million lbs of uranium oxide per year.
In the near term, Russian uranium will probably keep the uranium spot price lower than it would otherwise be, but in the longer term this material is expected to be needed to meet commercial demand and therefore is not expected to materially affect price. However, depending on the level of future commercial uranium prices, the presence of former Russian military uranium may result in the deferral of one or more new mine projects the development of which are price sensitive. For various reasons, it is unlikely that former US military uranium will become available to the commercial market during the next 10-year period.
Uranium oxide is not traded on an official exchange and the spot market is highly illiquid as most uranium oxide is sold under long term contract (three to ten years). In spite of this, the spot market is important as pricing under a significant portion of long term contracts is linked to the spot market. Spot prices in 2002 averaged US$9.88/lb uranium oxide.
Our objective is to match sales of uranium to production, with the bulk of production committed under long-term sales contracts with well established and reputable electricity generating utilities. In 2002, we sold uranium oxide to the United Kingdom, Finland, Sweden, Belgium, France, Japan, Canada and the United States.
Uranium is exported in accordance with Australian government regulations and the requirements of bilateral safeguards agreements between the Australian government and the recipient’s national government.
Fertilizer
We hold mining leases over two phosphate deposits in north-west Queensland. Our major phosphate resource is located at Phosphate Hill, 140 kilometers southeast of Mount Isa. The principal activities at Phosphate Hill are conducted on Mining Lease 5543 which expires on October 31, 2035. Currently, mining is from three open pits using excavators and trucks. Ore is treated through a beneficiation plant which has a four stage process of crushing, washing and de-sliming, grinding, thickening and slurry storage. We completed the construction of the Queensland Fertilizer Operation at the end of 1999, and commissioned the integrated plant during 2000.
Sulphuric acid is sourced from an acid plant we own located adjacent to MIM Holdings Limited’s Mt Isa smelter and from the Korea Zinc plant at Townsville. The acid plant has a production capacity of approximately 1.1 million tonnes of sulphuric acid per year. The agreement with MIM to convert the smelter off-gases to sulphuric acid obligates both parties on a “reasonable endeavors” basis. If for some reason sulphur dioxide gas is unavailable, the acid plant burns sulphur to produce sulphur dioxide, although production volumes and costs would be affected if the sulphur dioxide gas from the acid plant was not available for an extended period of time. We transport sulphuric acid to Phosphate Hill in specially designed rail tanker wagons.
Sulphuric acid is combined with filter cake from the beneficiation plant in a phosphoric acid plant to produce phosphoric acid and gypsum. The phosphoric acid plant at the Queensland Fertilizer Operations is a hemihydrate plant with a production capacity of 1,500 tonnes per day.
In the ammonia plant, ammonia is produced by combining hydrogen from natural gas and nitrogen from air. In the granulation plant, phosphoric acid is reacted with ammonia to form ammonium phosphate slurry which is pumped into the granulator where it forms granules of fertilizer, as either Di-ammonium phosphate or DAP or Mono-ammonium phosphate or MAP. We transport the final product by rail to handling and storage facilities in Townsville under the terms of a 20-year take or pay rail transport contract with Queensland Rail to a minimum annual tonnage of approximately one million tonnes. The Townsville storage facilities have a capacity of 90,000 tonnes.
74
Table of Contents
We store gypsum onsite at Phosphate Hill in large lined dams. Gypsum storage and disposal is a significant cost for the operation as the production process produces large quantities of gypsum. We are currently exploring longer term low cost alternatives for the storage and or use of the gypsum produced.
We source power at Phosphate Hill from on-site third party gas fired turbines. We purchase natural gas for power and ammonia production under a long term contract with Santos Ltd and others. We source this gas from the Cooper Basin gas fields in south-west Queensland via the AGL Carpentaria gas pipeline.
We source our water from a series of bores into nearby aquifers within the mining lease area. These should be adequate to meet requirements for at least 10 to 15 years. We are currently pursuing access to other identified sources.
Our current principal strategic objectives for our Queensland Fertilizer Operations are to:
| • | consolidate operating performance at or above design capacity; |
| • | optimize and improve production efficiency to reduce operating costs and obtain additional low-cost production; |
| • | develop domestic and export markets; |
| • | increase production of MAP based products; and |
| • | review further expansion options. |
Following a period of poor returns, the domestic and international fertilizer markets are undergoing consolidation. Queensland Fertilizer Operations will consider all its strategic options to participate in this process.
We are currently investigating ways to increase the percentage of MAP produced and the possible introduction of sulphur fortified MAP for which there may be increased market demand.
The table below details principal components and location of the Queensland Fertilizer Operations:
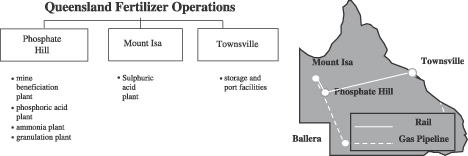
A production efficiency study is underway to investigate ways to increase annual production of phosphate fertilizer to 1.06 million tonnes. The table below shows our Phosphate Hill fertilizer production over the last four years.
Phosphate Hill Production Summary
| Year ended December 31, | ||||||||
| 2002 | 2001 | 2000 | 1999 | |||||
| (tonnes) | ||||||||
Di-ammonium phosphate (DAP) | 718,287 | 651,498 | 326,262 | 5,143 | ||||
Mono-ammonium phosphate (MAP) | 102,713 | 57,947 | — | — | ||||
75
Table of Contents
The table below shows our proven and probable phosphate ore reserves.
Phosphate Hill Ore Reserves(1)(2)(3)
As at December 31, 2002 | ||||||||||||||
Type of Reserve(4) | Proven(5) | Probable(6) | Total | Assumed Overall Metallurgical Recovery(7) % | ||||||||||
Ore | Grade | Ore (million | Grade (% | Ore (million | Grade (% | |||||||||
o/c | 28.2 | 24.5 | 62.6 | 24.3 | 90.8 | 24.4 | 77 | |||||||
s/p | 0.3 | 24.7 | — | — | 0.3 | 24.7 | 77 | |||||||
| (1) | The commodity price used to estimate the 2002 ore reserves was A$300/tonne (for DAP free-on-board Townsville). At the 2002 average exchange rate, this equated to US$163/tonne (for DAP free-on-board Townsville). |
| (2) | Ore reserves reflect tonnages recoverable from mining. The estimates include diluting materials and allowances for losses which may occur when the material is mined but do not include adjustments for metallurgical recovery. |
| (3) | We have a 100% interest in the Phosphate Hill operation. |
| (4) | o/c = open-cut, s/p = stockpile. |
| (5) | Approximate drill hole spacings used to classify the Proven ore reserves were£40m x 40m. |
| (6) | Approximate drill hole spacings used to classify the Probable ore reserves were£120m x 120m. |
| (7) | The metallurgical recovery factors included in the tabulation represent the estimated overall recovery of P2O5 from run-of-mine ore feed to final saleable product, assumed in the estimation of the ore reserves. The reported recovery refers to the combined recovery of the beneficiation plant and the phosphoric acid plant. |
The net written down value of property and associated plant and equipment at our Queensland Fertilizer Operations at December 31, 2002 was A$567.3 million. Reserves included in our current mine plan will be depleted in approximately 20 years at current production rates.
Markets and Competition
Our wholly-owned subsidiary, Hi-Fert Pty Ltd, is a distributor of fertilizers in Australia and currently has a market share of DAP sales of approximately 27% for the eastern states of Australia. During 2002, we pursued a market development strategy, supporting the continued growth in production from our fertilizer operations. Our focus for fertilizer products is the Australian market, which we believe yields good margins for these operations. We have marketing arrangements in place for our total fertilizer production based on 2002 volumes. We have supply contracts in place with major Australian fertilizer distributors for the delivery of between 440,000 and 590,000 tonnes of DAP per year, depending on customer requirements. Contracts covering domestic MAP sales of between 120,000 and 200,000 tonnes per year have become effective since commencement of commercial production and demonstration of quality compliance. We have contracted to sell to Cargill Fertilizers Incorporated 350,000 tonnes per year of high analysis fertilizer for sale into Asia. The arrangement with Cargill provides for up to 500,000 tonnes per year to be sold through Cargill if required by us.
High analysis fertilizers based on phosphoric acid are increasing their market share due to their high nutrient content and savings in storage, handling, transportation and application costs. About half of the high analysis fertilizer produced is traded internationally because production is concentrated in a small number of countries. International trade is based on the supply from the two major production regions, the US Gulf of Mexico and North Africa. The North African producers generally export to Western Europe and Asia while the North American producers generally export to Asia, South America, Australia and New Zealand.
76
Table of Contents
Most high analysis fertilizer pricing is based on US Gulf of Mexico prices. The DAP price has increased substantially during the first quarter of 2003, with a range of US$149 per tonne (fob Tampa) to US$195 per tonne. Several factors contributed to the price strength, including strong demand for product on international markets and a rapid increase in raw material costs that has forced producers to raise prices or reduce output.
As expected, prices softened slightly as seasonal demand in Europe, Latin America and Australia declined through May. Price weakness should be limited due to high raw material prices and tight margins for producers.
Regional Exploration and New Business
Minerals Exploration
Exploration is a core component of our growth management strategy. Our global minerals exploration program seeks to deliver mineral discoveries that provide significant growth opportunity in locales where we can effectively manage the business and technical risks. During 2002, we conducted exploration in Australia, China, Peru, Mongolia, Tanzania and the USA.
We spent A$23.4 million on minerals exploration for continuing operations for the year ended December 31, 2002. Our expenditure for the year ended December 31, 2001 was A$76.5 million. This annualized decrease was due to a significant recent restructuring of the exploration function. We continued to focus our exploration on greenfields, targeting and testing for deposits of nickel, copper and gold. In 2001, we detected significant nickel, copper and platinum group element mineralization through an extensive drilling program at the West Musgrave project in Western Australia.
West Musgrave, Western Australia
During 2000 and 2001, we received results from the West Musgrave area of Western Australia. We tested two prospects, 4 kilometers apart, by diamond drilling targeted on separate geophysical anomalies, with both intersecting nickel and copper sulphide mineralization. In 2001, we announced encouraging drill results from the Nebo and Babel prospects in the West Musgrave area of central Western Australia. We continued drilling on those prospects during 2002. Results have been variable, although we have drilled significant nickel, copper sulphide and platinum group metal mineralization over a strike extent of five kilometers. We are continuing assessment and interpretation of these results.
Our exploration in this area is currently focused on identifying thicker zones of mineralization at both Nebo and Babel while broader, regional exploration continues. We currently manage more than 7,600 square kilometers of granted exploration tenure in the region. We recently completed a regional electromagnetic survey covering approximately 3,200 square kilometers of prospective tenure in the region. We are still interpreting the results of this survey in preparation for ground follow-up of prospective anomalies. We have begun negotiations with the Ngaanyatjarra Land Council for a land access agreement to fly an airborne electromagnetic survey that would allow exploration access over an even broader area in the region.
New Business
Mozambique—Corridor Sands Project
The Corridor Sands heavy minerals project contemplates the exploitation of large, currently undeveloped mineral sands deposits situated in southern Mozambique. The project envisages a world-scale integrated mining, concentration and smelting operation to produce titanium dioxide slag, used to produce pigments for brightness and opacity in the manufacture of paint, paper and plastics, with planned initial production of around 400,000 tonnes per annum of titanium slag envisaged to commence in the second half of 2007. In connection with the development of the project, we may seek a joint venture partner.
77
Table of Contents
In November 2000, after an earlier due diligence investigation, we paid Southern Mining US$15 million for an exclusive option to study and acquire a controlling interest in the project. We completed a bankable feasibility study in 2002.
On December 9, 2002, we announced that we had agreed to acquire 100% of the Corridor Sands project from Southern Mining Corporation Limited. The total consideration to be paid is no greater than US$87.5 million and comprises two tranches. The first tranche was satisfied by the issue, on December 9, 2002 of 14,080,604 shares in each of WMC Resources and Alumina Limited, valued at US$62.5 million (based on the respective share prices of each company on that date). The second tranche of up to US$25 million will be paid in either cash or shares at our option by the end of 2003. The exact amount of the second tranche is subject to, and contingent upon, any future sales by us of all or part of our equity interest in Corridor Sands, at proceeds above stipulated levels. Under the terms of the agreement, the Industrial Development Corporation of South Africa (the “IDC”) exercised an option in May 2003 to acquire a 10% interest in the project, subject to documentation, South African Reserve Bank approval and the completion of a number of key project milestones.
The table below shows WMC Resources proven and probable mineral sands ore reserves.
Corridor Sands Ore Reserves(1)(2)(3)(4)
| As at December 31, 2002 | ||||||||||||||
| Proven(6) | Probable(7) | Total | Assumed % | |||||||||||
Type of Reserve(5) | ||||||||||||||
Ore (million | Grade ilmenite % | Ore (million | Grade ilmenite % | Ore (million | Grade ilmenite % | |||||||||
o/c | 685 | 4.8 | 122 | 3.7 | 807 | 4.7 | 37 | |||||||
| (1) | An ilmenite equivalent price per tonne of titanium slag, including revenue from by-products, of US$480 was assumed for ore reserve estimation. |
| (2) | Ore reserves reflect tonnages recoverable from mining. The estimates include allowances for losses which may occur when the material is mined but do not include adjustments for metallurgical recovery. |
| (3) | We have a 100% interest in the Corridor Sands project, subject to an option to acquire 10% of the project by The Industrial Development Corporation of South Africa which was exercised in May 2003, subject to documentation, South African Reserve Bank approval and the completion of a number of key project milestones. |
| (4) | The technical phase of WMC’s bankable feasibility study on the Corridor Sands project was concluded in July 2002. The ore reserves, on the basis of only a notional first-twenty-year optimal pit design for the West Block of the main deposit, are estimated at 807 million tonnes grading 4.65 per cent ilmenite, 0.17 per cent zircon and 0.02 per cent rutile. |
| (5) | o/c = open cut. |
| (6) | Approximate drill hole spacings we used to classify the proven ore reserves were<250m x 125m. |
| (7) | Approximate drill hole spacings we used to classify the probable ore reserves were<500m x<250m. |
| (8) | The reported metallurgical recovery factor represents the overall ilmenite yield from run-of-mine crude ilmenite to titanium slag. |
Environmental Matters
Our environmental policy is to achieve compatibility between economic development and the maintenance of the environment and to comply with all applicable environmental laws. Primary responsibility for environmental matters rests with local management. A corporate environmental group provides technical and professional support to the line organization in its execution of the environmental policy and co-ordinates independent environmental audits of operations. Environmental compliance is reported quarterly by each operation. Initiatives for the improved use of water and energy and other resources have been introduced, as have
78
Table of Contents
initiatives for the reduction of certain emissions to the atmosphere. An environmental management system, consistent with the requirements of ISO14001 is being implemented at all of our operations. We published our eighth annual Sustainability Report in 2003.
We have mineral-producing operations and conduct exploration in many countries. Our activities are subject to various laws governing the protection of the environment in areas such as air and water quality, emissions, waste disposal, environmental impact assessments, mine rehabilitation and access to, and use of, ground water. A failure by us to comply with the laws in relation to the above issues might result in sanctions such as fines or orders requiring that additional environmental control equipment be installed or that operations be curtailed.
We continue to invest in plant and equipment to improve the operational and environmental performance of our operations and to ensure compliance with regulatory requirements. We continue to incur operating expenditures for the recovery of ammonium sulphate from groundwater at the Baldivis tailings storage facility. To December 31, 2002, we have spent A$79.9 million (2001: A$76.0 million) on groundwater remediation at our Kwinana and Baldivis facilities. The ammonium sulphate remediation work at Kwinana has been completed and we anticipate that work at Baldivis will continue until approximately 2008, at a further cost of A$27.8 million. We have also recently detected localised soil and groundwater contamination by arsenic at our Kwinana Facility. Planning for clean up is underway. Full clean up is expected to take up to seven years using existing infrastructure. Based on current knowledge, the cost of clean-up is not expected to be material with regard to our profit or cash flows.
We have accrued and continue to accrue financial provisions for meeting environmental obligations such as mine closure and rehabilitation together with other long-term liabilities. As at December 31, 2002, we had set aside A$101.2 million for such provisions.
We cannot reasonably estimate the cost of future compliance or remedial work or further investment necessitated through the introduction of further environmental regulation or by any causes of contamination, including those occurring prior to the introduction of such regulation or before or after the property in question was owned or occupied by us. Among other things, the level of these costs will be dependent upon the nature and extent of the current and future environmental regulation, the time and nature of required remedial work, the extent of any contamination, the technology available to meet the required standards, the determination of our liabilities in proportion to those of other parties and the extent to which costs are recoverable from insurance and third parties.
Australian Mining Law and Leases
In Australia, with few exceptions, all onshore mineral rights are reserved to the Government of the relevant State or Territory. Exploration for minerals is regulated by the general mining legislation of the relevant State or Territory and controlled by the relevant State or Territory government department. Where native title has not been extinguished, native title legislation may apply to the grant of tenure and some subsequent administrative processes (please see the section entitled “Business Description—Legal Proceedings—Native Title in Australia”).
Where large-scale mining projects are involved, mining leases can also be granted pursuant to specific legislation of the State or Territory. Such mining leases involve complex agreements with State Governments on matters such as water rights, the size of the mining tenements, protection of the environment, the provision of infrastructure and the payment of royalties. In South Australia, the Olympic Dam Operations special mining lease is an example of this type of agreement (please see the section entitled “Business Description—Property, Plant and Equipment—Copper—Indenture Agreement”).
In addition, a number of mining leases pertaining to the Kambalda Nickel Operations and Leinster Nickel Operations were issued pursuant to the Nickel Refinery (Western Mining Corporation Limited) Agreement Act 1968 (WA) and the Nickel (Agnew) Agreement Act 1974 (WA), respectively.
79
Table of Contents
Our nickel operating properties are located in the State of Western Australia. Upon application to the Western Australian Department of Mineral and Petroleum Resources, the Warden may grant a prospecting license. The Warden is also responsible for providing recommendations in relation to exploration licenses to the Minister who, in turn, may grant an exploration license. Exploration or prospecting licenses generally grant exclusive rights to explore for minerals in an area for a set period, as long as the holder complies with the provisions of the relevant Mining Act relating to conditions of tenure and minimum annual expenditure.
In most Australian states, if the holder of an exploration license establishes indications of an economic mineral deposit and expends a minimum level of investment, it may apply for a mining lease. In Western Australia the maximum area of a mining lease is 10 square kilometers and the maximum initial term is 21 years. A general purpose lease may also be granted for one or more of a number of permitted purposes. These purposes include erecting, placing and operating machinery in connection with mining operations, depositing or treating minerals or tailings and using the land for any other specified purpose directly connected with mining operations.
In Western Australia, the holder of an exploration license can obtain a mining lease without establishing an economic deposit. This gives the holder exclusive mining rights on the property. The Minister for Mines of the State of Western Australia may grant or refuse a mining lease at his discretion, regardless of the Warden’s recommendations. If the applicant is the holder of an exploration license and the holder has complied with the conditions attaching to the exploration license, an application, generally, will be granted. However, a 1994 decision of the Full Court of the Supreme Court of Western Australia held that the “automatic grant” was subject to the Minister’s discretion to refuse the mining lease application on reasonable grounds in the public interest, such as major environmental issues.
Upon expiration of the initial term of a Western Australian mining lease, the holder has the right to renew the lease for a further period of 21 years. Subsequent renewals are subject to the Minister’s discretion.
Holders of mining leases must pay royalties on minerals extracted from the mining area. The amount of the royalty payable is specified in the relevant legislation. The royalty on sales of nickel in Western Australia is 2.5% of the free on board contained metal value of nickel sold.
See the section entitled “Business Description—Property, Plant and Equipment—Copper—Indenture Agreement” for the royalties payable for the Olympic Dam Operations.
In addition to the aforementioned leases, we own freehold property including mineral rights at Kambalda in Western Australia on which nickel mines are operating and the tenure underlying the Olympic Dam Operations. No royalty is payable by us to the State of Western Australia for nickel production from these mines although a royalty is payable to a prior holder of the freehold property.
80
Table of Contents
A summary of our significant leases and freehold property for Western Australian, South Australian and Queensland operations follows.
Operation | Relevant Act(s) | Term | Expiration Date of Lease(1) | Life of Approved Mine Plan | ||||
Kambalda Nickel Operations | Mining Act 1978 (WA) | Leases are currently within their initial 21-year lease period. A further 21 years is available as a right of renewal. Further renewals are at Minister’s discretion. | 2005-2006 2010-2011 2015, 2019 | 3 | ||||
Nickel Refinery (Western Mining Corporation Limited) Agreement Act 1968 (WA) | All leases have completed their initial term of 21 years. All leases had an option to be renewed for a further period of 21 years. This option has been exercised against all leases. A second renewed term is available for a further period of 21 years. However, grant of this renewal is at the Minister’s discretion. These tenements can also be replaced by WA Mining Act 1978 mining leases in which case they would become subject to the provisions of that Act. | 2007-2008 2014 2017-2018 | ||||||
Transfer of Land Act (WA) Mining on Private Property Act 1898 (WA) | In perpetuity | |||||||
Leinster Nickel Operations | Nickel (Agnew) Agreement Act 1974 (WA) | Lease has completed its initial term of 21 years. Option for a renewed term of a further period of 21 years has been exercised. Lease has unlimited rights for renewal for further periods of 21 years. This lease can also be replaced by WA Mining Act 1978 mining leases in which case they would become subject to the provisions of that Act. | 2019 | 11 | ||||
Mining Act 1978 (WA) | Leases are currently within their initial 21-year lease period. A further 21 years is available as a right of renewal. Further renewals are at Minister’s discretion. | 2004 2008-2010 2012-2013 2015 | ||||||
Mount Keith Operations | Mining Act 1978 (WA) | Leases are currently within their initial 21-year lease period. A further 21 years is available as a right of renewal. Further renewals are at Minister’s discretion. | 2008 2011-2016 | 16 | ||||
Olympic Dam Operations | Roxby Downs (Indenture Ratification) Act 1982 (SA) | 50 years plus right to renew for further periods of up to 50 years. | 2036 | 20 | ||||
Real Property Act 1886 (SA) | In perpetuity | |||||||
Phosphate Hill | Mineral Resources Act 1989 (Qld) | 40 years plus renewal periods as negotiated with Queensland Government. | 2035 | 20 | ||||
| (1) | There may be a number of lease agreements applicable for each operation |
81
Table of Contents
Legal Proceedings
At the date of this prospectus, we are a party to no pending material legal proceedings nor are we aware of any reasonably likely to be commenced against us, other than:
| • | those mentioned below; or |
| • | ordinary routine litigation or other legal proceedings incidental to our business, particularly arising out of contract mining and construction activities to which we or any of our subsidiaries is a party or of which any of our or their property is subject. |
Native Title in Australia
“Native title” describes the rights and interests of Aboriginal and Torres Strait Islander people in land and waters according to their traditional laws and customs as recognized by the common law of Australia.
Native title law has evolved through judicial decisions and the enactment of legislation. The first significant High Court decision on the subject of native title was Mabo v Queensland (No 2) (1992) 175 CLR 1 (“the Mabo decision”) in 1992, in which the Court recognized the concept of native title and said that Aboriginal and Torres Strait Islander people who have maintained their connection with their land according to their laws and customs may hold native title. Proving connection usually involves showing that traditional laws and customs have been passed down through generations of Aboriginal or Torres Strait Islander people to the present day. The native title of a particular group will depend on the traditional laws and customs of those people. Recent decisions have indicated that native title may change over time.
The Mabo decision also recognized that native title could be extinguished prior to the enactment of the Racial Discrimination Act 1975 (October 31, 1975) by government legislation or inconsistent executive action. In response to the Mabo decision, the Commonwealth Government enacted the Native Title Act, 1993 (“NTA”) which validated acts done and granted by it prior to January 1, 1994 (“past acts”) and allowed the States and Territories to enact their own validation legislation. Subsequent amendments also validated grants (“intermediate period acts”) made by the Commonwealth (and allowed the States and Territories to enact similar legislation) relating to certain freehold grants up to December 23, 1996. The NTA also created the National Native Title Tribunal, responsible for mediation of native title claims and the administration the various procedures under the NTA governing native title claims. Finally, the NTA specifies the conditions to be satisfied and the procedures to be followed in order for acts done after January 1, 1994 (“future acts”) to be valid with respect to native title.
Our land tenure that is a past act or qualifying intermediate period act has been validated with respect to native title. The current operations of our Olympic Dam operations are on freehold title which the High Court held in Fejo v Northern Territory (1998) 195 CLR 96 (“Fejo”) permanently extinguishes native title, although expansions of our operation may attract the future act requirements of the NTA if they extend to areas outside the freehold tenure.
Native title may exist in areas where it has not been extinguished (removed). Although a determination of native title does not invalidate another’s validly granted rights, the High Court decision in the Wik Peoples v Queensland (1996) 187 CLR 1 (“Wik”) case, made it clear that native title may co-exist with other forms of tenure where that tenure is not exclusive, provided the native title rights are not incompatible with the exercise of the other rights. This decision was confirmed in State of Western Australia v Ward (2002) 99 FCR 316 (“Ward”) where the High Court found that pastoral leases in Western Australia did not create the right of the pastoralist to exclusive possession and thus did not extinguish all native title rights. Pastoral leases in Western Australia are leases of Crown land under the Land Act 1875 (WA) held for pastoral or grazing purposes. We hold two nickel exploration licenses in Western Australia that may not be valid and it is possible that a claim for certain native title rights might be recognized on these grants. We do not believe that if native title rights were determined to be held over land the subject of this license they would materially affect our interests or our existing nickel
82
Table of Contents
operations. Where native title rights are inconsistent with the terms of a pastoral lease the native title rights must yield to rights of the pastoral lessee. The Wik decision also provided some clarity about the impact of native title on Queensland pastoral leases which are relevant to the our Queensland Fertilizer Operations. While the current leases on which the Queensland Fertilizer Operations are conducted are secure, any future expansions onto adjacent non-freehold land is likely to attract the future act processes of the NTA.
When it handed down its decision in Ward, the High Court held, among other things, that there could be partial extinguishment of native title rights and that WA mining and petroleum legislation extinguishes all native title rights that may have existed over minerals and petroleum. The High Court also held that a mining lease under the relevant Western Australian legislation extinguished any native title right to control access to land, or to be asked permission to use, or have access to, land but does not necessarily extinguish all native title rights. Particularly it does not extinguish those native title rights that are consistent with the rights granted to a pastoral or mining leaseholder. This decision, which provides some clarity about the impact of native title on pastoral leases and mining leases in Western Australia and the Northern Territory, is significant to us because our nickel operations are in Western Australia. However the decision also leaves many issues to be decided on a case by case basis. As a result, it is difficult at this stage for us to make any assessment of the impact of the Ward decision either specifically on our nickel operations or more generally on the current claimant applications for native title over our operations (referred to below) throughout Australia.
There are current claimant applications for native title determination in the Federal Court over areas that include the majority of our operations. The majority of our operations fall within one or more of these applications. These operations include the Olympic Dam copper/uranium businesses in South Australia, the Phosphate Hill fertilizer operation in Queensland and the Western Australian nickel operations.
The High Court decisions and the NTA described above may have provided some conceptual guidance on the issue of native title and we believe that under these decisions and legislation our economic interests in existing mining leases and tenements will generally be upheld if challenged. However, our existing assets and operations would be affected by a native title claim that is ultimately determined in a manner that is contrary to our interests.
83
Table of Contents
QUALITATIVE AND QUANTITATIVE DISCLOSURES ABOUT THE MARKET RISK
Information about Market Risk
Price Risk Management Policy
Our Price Risk Management policy provides the framework for the management of price exposures and is established by our Board. The policy details our approach to managing price exposures and delineates hedging limits and delegated management authorities. Management of exposures is delegated to the Risk Management Committee within parameters set by our Board. The Risk Management Committee is chaired by the chief executive officer and comprises the chief financial officer and several senior executives. The Risk Management Committee is responsible for strategic hedging decisions and ensuring that these are implemented.
Our Treasury group acts under the authorization of the Risk Management Committee in implementing strategic hedging decisions. In addition, our Treasury group is authorized to manage hedges held against underlying financial or commodity exposures arising from our business operations. The Risk Management Committee members receive a weekly hedge position report as well as a detailed risk management report prior to the Committee’s monthly meetings.
Due to changes to the scale, diversity and competitiveness of our operations, we revised our Risk Management Policy during 1999 to limit hedging activity to securing acceptable rates of return for new projects. Previously existing hedging contracts will remain in place, but we will not replace or renew them.
We bring to account hedging gains or losses, together with the cost of contracts when the designated sale occurs. We enter into Price Risk Management transactions with domestic and international banks and financial institutions which the board of directors has approved.
Commodity Hedging Policy
Commodity price risk relates to our exposure to changes in the commodity prices. Our revenue streams are significantly derived from the sale of commodity production and the amount of revenue will fluctuate with the moving commodity prices. Consistent with the Price Risk Management policy, we may seek to reduce our exposure to commodity price movements by entering into commodity hedging contracts for a proportion of our production. When looked at in isolation, hedging transactions could result in costs to us if:
| (a) | the commodity price at the date of maturity of the hedge contract is greater than the hedged price (either due to the requirement to expend cash to financially settle hedge contracts, or via the receipt of a hedge contract price lower that the prevailing spot price at contract maturity); or |
| (b) | a counterparty were to default and the commodity price at the date of default is less than the hedged price. |
In the case of (a), the hedging loss will be offset by a higher revenue stream from the higher commodity price relative to the prevailing prices at the date of conception of the hedge, although the net revenue we would receive would be less than we would otherwise had received had the hedge transaction not been in place.
84
Table of Contents
A table showing the movement in the selling price of nickel, gold, fertilizer and copper over the last five years is set out below.
Average Quarterly Prices
Financial Year Ended | Nickel London Metal Exchange US$/lb | Gold London Gold Market US$/oz | Fertilizer US Gulf Price US$/tonne | Copper London Metal Exchange US$/lb | ||||
December 31, 1998 | ||||||||
First Quarter | 2.46 | 294 | 194 | 0.77 | ||||
Second Quarter | 2.24 | 300 | 205 | 0.78 | ||||
Third Quarter | 1.81 | 257 | 209 | 0.73 | ||||
Fourth Quarter | 1.80 | 294 | 205 | 0.70 | ||||
December 31, 1999 | ||||||||
First Quarter | 2.11 | 287 | 199 | 0.64 | ||||
Second Quarter | 2.37 | 274 | 190 | 0.66 | ||||
Third Quarter | 2.89 | 259 | 174 | 0.76 | ||||
Fourth Quarter | 3.53 | 296 | 153 | 0.79 | ||||
December 31, 2000 | ||||||||
First Quarter | 4.29 | 291 | 148 | 0.81 | ||||
Second Quarter | 4.26 | 280 | 145 | 0.79 | ||||
Third Quarter | 3.75 | 277 | 164 | 0.85 | ||||
Fourth Quarter | 3.38 | 269 | 158 | 0.84 | ||||
December 31, 2001 | ||||||||
First Quarter | 2.97 | 259 | 162 | 0.79 | ||||
Second Quarter | 3.04 | 268 | 142 | 0.75 | ||||
Third Quarter | 2.51 | 276 | 138 | 0.67 | ||||
Fourth Quarter | 2.29 | 279 | 147 | 0.64 | ||||
December 31, 2002 | ||||||||
First Quarter | 2.80 | 291 | 152 | 0.70 | ||||
Second Quarter | 3.15 | 313 | 313 | 0.73 | ||||
Third Quarter | 3.11 | 314 | 168 | 0.69 | ||||
Fourth Quarter | 3.22 | 323 | 153 | 0.70 |
Currency Hedging Policy
Foreign currency risk relates to our exposure to changes in exchange rates. Our revenue streams are significantly derived from the sale of our commodity production in US dollars and the amount of Australian dollar revenue we will receive fluctuates with the moving A$/US$ exchange rate. Consistent with approved Board policy, we may seek to reduce our exposure to exchange rate movements by entering into foreign exchange hedging contracts for a proportion of our outstanding receivables with a view to reducing the effects of adverse currency rate fluctuations. When looked at in isolation, hedging transactions relating to the conversion of US dollar receivables to Australian dollars, they could result in losses if:
| (a) | the A$ weakens against the US$ between contract inception and maturity; or |
| (b) | a counterparty were to default and the A$ has strengthened against the US$ between contract inception and maturity. |
In the case of (a), the hedging loss will be offset by a higher Australian dollar revenue stream from the lower A$/US$ exchange rate, although the net revenue we would receive would be less than we would otherwise have received had the hedge transaction not been in place.
85
Table of Contents
Summary Hedging Results
Hedging results for 2002, 2001 and 2000 were:
Year ended December 31, | |||||||||
Hedging Results | 2002 | 2001 | 2000 | ||||||
(A$ Million Profit / (Loss)) | |||||||||
Currency—A$/US$ | (108.2 | ) | (328.1 | ) | (253.0 | ) | |||
Gold | (5.1 | ) | 64.1 |
| 91.9 |
| |||
Copper | — |
| — |
| (10.3 | ) | |||
Nickel | — |
| 2.0 |
| (96.5 | ) | |||
Total | (113.3 | ) | (262.0 | ) | (267.9 | ) | |||
These gains and losses have been allocated to the revenue and profits of individual business units.
The following information is provided in compliance with Financial Reporting Release No. 48. We have elected to disclose information in the “Tabular Presentation” set down in Item 305(a)(1)(i) of Regulation S-K.
Commodity Hedging
| (A) | Trading Purposes |
Nil.
| (B) | Non-trading (Hedging Purposes) |
As at December 31, 2002:
| (1) | Gold |
We have 615,228 ounces of gold relating to production from Olympic Dam (December 2001: 720,000 ounces) hedged at an average gold price of A$621 per ounce (December 2001: A$586 per ounce) with maturities extending to 2010 as follows:
Forward sale of Gold | |||||||
Maturity | Amount of ounces | Rate | Fair Value | ||||
A$/ounce | A$m | ||||||
2003 | 85,028 | 547 | (20.5 | ) | |||
2004 | 80,000 | 559 | (14.9 | ) | |||
2005 | 80,000 | 579 | (17.4 | ) | |||
2006 | 78,300 | 618 | (6.5 | ) | |||
2007 | 80,160 | 641 | (3.7 | ) | |||
2008-2010 | 211,740 | 684 | (9.6 | ) | |||
For comparison, we had the following gold hedge positions in place at December 31, 2001:
Forward sale of Gold | |||||||
Maturity | Amount of ounces | Rate | Fair Value | ||||
A$/ounce | A$m | ||||||
2002 | 83,000 | 525 | (1.4 | ) | |||
2003 | 80,000 | 542 | (1.3 | ) | |||
2004 | 80,000 | 561 | (1.3 | ) | |||
2005 | 80,000 | 579 | (1.9 | ) | |||
2006 | 78,300 | 618 | (0.8 | ) | |||
2007-2010 | 318,700 | 659 | (5.7 | ) | |||
The above gold contracts provide us with the option to either physically or financially settle. We have no floating interest rate or gold lease rate exposure.
86
Table of Contents
As these contracts are entered into for the purpose of hedging future production, we defer any unrealized gains and losses on the contracts, together with the cost of the contracts, until the underlying production occurs.
The fair value is based on the mark to market of the maturing forward contracts. This is the difference between the future expected market price as at December 31, 2002 and the original contract rate. The future expected market price is based on the forward price calculated on the spot rate and the gold contango (difference between US interest rates and the gold lease rate discounted using a zero coupon interest rate curve).
Currency Hedging
| (A) | Trading Purposes |
Nil.
| (B) | Non-trading (Hedging Purposes) |
As at December 31, 2002, we have US$1,640.5 million (December 2001: US$2,104.3 million) hedged at an average rate of A$/US$0.6614 (December 2001: A$/US$0.6570) at maturities extending to 2008 using a combination of forward contracts and options as detailed in the table below:
Forward sale of US$ | Bought Put Options | Written Call Options | ||||||||||||||||||
Maturity | Amount | Rate | Fair Value | Amount | Strike rate | Fair Value | Amount | Strike rate | Fair Value | |||||||||||
US$m | A$/US$ | A$m | US$m | A$/US$ | A$m | US$m | A$/US$ | A$m | ||||||||||||
2003 | 195.6 | 0.6821 | (81.8 | ) | 62.5 | 0.6479 | 0.2 | 62.5 | 0.6479 | (15.5 | ) | |||||||||
2004 | 228.4 | 0.6753 | (95.1 | ) | 72.5 | 0.6402 | 0.8 | 72.5 | 0.6402 | (19.8 | ) | |||||||||
2005 | 228.3 | 0.6887 | (112.0 | ) | 77.5 | 0.6430 | 1.4 | 77.5 | 0.6430 | (23.1 | ) | |||||||||
2006 | 155.6 | 0.6828 | (83.0 | ) | 72.5 | 0.6402 | 1.9 | 72.5 | 0.6402 | (21.6 | ) | |||||||||
2007 | 174.6 | 0.6729 | (83.5 | ) | 77.5 | 0.6430 | 2.6 | 77.5 | 0.6430 | (23.4 | ) | |||||||||
2008 | 178.5 | 0.6500 | (74.4 | ) | 117.0 | 0.5913 | 8.1 | 117.0 | 0.5913 | (25.9 | ) | |||||||||
For comparison, we had the following foreign currency hedge positions in place at December 31, 2001:
Forward sale of US$ | Bought Put Options | Written Call Options | ||||||||||||||||||
Maturity | Amount | Rate | Fair Value | Amount | Strike rate | Fair Value | Amount | Strike rate | Fair Value | |||||||||||
US$m | A$/US$ | A$m | US$m | A$/US$ | A$m | US$m | A$/US$ | A$m | ||||||||||||
2002 | 211.5 | 0.6854 | (128.0 | ) | 252.3 | 0.5875 | 1.7 | 82.5 | 0.6571 | (36.6 | ) | |||||||||
2003 | 175.6 | 0.6855 | (106.7 | ) | 82.5 | 0.6571 | 0.4 | 82.5 | 0.6571 | (37.0 | ) | |||||||||
2004 | 208.4 | 0.6817 | (117.4 | ) | 92.5 | 0.6500 | 1.1 | 92.5 | 0.6500 | (38.9 | ) | |||||||||
2005 | 213.3 | 0.6870 | (125.6 | ) | 92.5 | 0.6500 | 1.6 | 92.5 | 0.6500 | (37.1 | ) | |||||||||
2006 | 135.6 | 0.6809 | (79.9 | ) | 92.5 | 0.6500 | 2.1 | 92.5 | 0.6500 | (35.2 | ) | |||||||||
2007-2010 | 338.1 | 0.6595 | (164.6 | ) | 209.5 | 0.6173 | 8.5 | 209.5 | 0.6173 | (64.8 | ) | |||||||||
The fair value is based on the mark to market price of the maturing forward and option contracts. This is the difference between the future expected market price as at December 31 and the original contract rate. The future expected market price is based on the forward price using the forward curve (difference between the US and Australian interest rate curves discounted using the zero coupon interest rate curve).
Interest Rate Hedging
Interest rate risk refers to our exposure to movements in interest rates. We are primarily exposed to interest rate risk on our outstanding interest bearing liabilities. As interest rates fluctuate, the amount of interest payable on debt balances where the interest rate is not fixed will also fluctuate. Interest rate swaps and cross currency swaps allow us to manage our interest rate risk.
87
Table of Contents
In October and November 2002 we put in place, through our wholly-owned subsidiary, WMC Finance Limited, loan facilities totaling US$1.1 billion to repay our debt guaranteed by WMC Limited and to provide ongoing liquidity post demerger. The loan facilities, which are guaranteed by us and our major subsidiaries, are underwritten by JPMorgan, Deutsche Bank, Westpac Banking Corporation and Commonwealth Bank of Australia.
The loan facilities had two components:
| • | a US$500 million 364-day term facility (which may be extended at the discretion of the lenders) which is intended to be refinanced by a medium to long term debt capital markets issuance after the demerger is implemented; and |
| • | a US$600 million syndicated facility with 364-day and 3-year tranches. |
The periods above terminate on the relevant anniversaries of the date of the loan facility which are October 29, 2003 for the term facility and November 14, 2003 for the syndicated facility.
In May 2003 we issued US$500 million in 10 year global bonds and US$200 million in 30 year global bonds to re-establish our longer term funding profile. Following this issuance, we fully repaid the US$500 million 364-day term facility and partly repaid the US$600 million syndicated facility.
In December 2002, a 10-year Treasury Lock for US$500 million was entered into to hedge our exposure to interest rates between the time of the buy back of the WMC Limited Yankee Bonds and the issuance of the WMC Resources Ltd Global Bond. This hedge was closed out on issuance of the Global Bond.
Interest rate risk
As at December 31, 2002 we had the following debt:
| Maturing in: | ||||||||||||||
| 2003 | 2004 | 2005 | 2006 | 2007 | 2008 onwards | |||||||||
A$m debt (floating) | ||||||||||||||
Bank loans | —face value | 1,252.4 | 361.1 | — | — | — | — | |||||||
| —fair value | 1,252.4 | 361.1 | — | — | — | — | ||||||||
A$m equivalent of US$ debt (fixed) | ||||||||||||||
Yankee Bonds | —face value | 35.2 | — | — | 1.4 | — | 7.4 | |||||||
| —fair value | 35.2 | — | — | 1.5 | — | 7.5 | ||||||||
Total | —face value | 1,287.6 | 361.1 | — | 1.4 | — | 7.4 | |||||||
| —fair value | 1,287.6 | 361.1 | — | 1.5 | — | 7.5 | ||||||||
Included in the debt noted above is the following A$ debt which has been swapped to US$. The terms of the cross currency swaps are provided on page 89.
| Maturing in: | |||||||||||||
| 2003 | 2004 | 2005 | 2006 | 2007 | 2008 onwards | ||||||||
Bank loans A$855m | US$ | 480m | — | — | — | — | — | ||||||
88
Table of Contents
As at December 31, 2001
| Maturing in: | ||||||||||||||
| 2002 | 2003 | 2004 | 2005 | 2006 | 2007 onwards | |||||||||
A$m debt (floating) | ||||||||||||||
Promissory Notes | —face value | 240 | — | — | — | — | — | |||||||
| —fair value | 240 | — | — | — | — | — | ||||||||
Medium Term Bilaterals | —face value | 250 | — | — | — | — | — | |||||||
| —fair value | 250 | — | — | — | — | — | ||||||||
Bank loans | —face value | 117.3 | — | — | — | — | 50 | |||||||
| —fair value | 201.9 | — | — | — | — | 65.5 | ||||||||
A$m equivalent of US$ debt (fixed) | ||||||||||||||
Yankee Bonds | —face value | 488.9 | — | — | 391.1 | 684.4 | ||||||||
| —fair value | 507.1 | — | — | 402.7 | 672.6 | |||||||||
Total | —face value | 607.3 | 488.9 | — | — | 391.1 | 734.4 | |||||||
| —fair value | 691.9 | 507.1 | — | — | 402.7 | 738.1 | ||||||||
Included in the debt noted above is the following A$ debt which has been swapped to US$. The terms of the cross currency swaps are provided in the next section, entitled “—Interest rate and cross currency swaps”.
| Maturing in: | ||||||||||||||
| 2002 | 2003 | 2004 | 2005 | 2006 | 2007 onwards | |||||||||
Medium Term Debt A$330m | US$ | 212.0m | — | — | — | — | — | |||||||
Bank loans A$50m | — | — | — | — | — | US$ | 33.5m | |||||||
We are exposed to interest rate risk on our outstanding interest bearing liabilities and investments. Interest rate swaps and cross currency swaps allow us to manage our interest rate risk.
Interest rate and cross currency swaps
As at December 31, 2002, we had entered into a forward interest rate agreement against the 10-year US Treasury rate. US$500 million of cover was obtained, at an interest rate of 4.4225% expiring in 2003. The fair value of this contract at December 31, 2002 was A$34.4 million.
89
Table of Contents
For comparison, the group had entered into the following interest rate hedging contracts at December 31, 2001:
Interest rate | |||||||||||
Notional AUD principal | Interest swapped | Fixed | Float(1) | Maturity | Fair value | ||||||
A$m | A$m | ||||||||||
100.0 | Fixed for floating | 6.00 | 4.90 | 27/5/2002 | 0.5 |
| |||||
100.0 | |||||||||||
200.0 | Fixed for floating | 6.00 | 4.90 | 27/5/2002 | 0.5 |
| |||||
Interest rate | |||||||||||
Notional US principal | Interest swapped | Fixed | Float | Maturity | Fair value | ||||||
US$m | A$m | ||||||||||
25.0 | Floating for fixed | 7.02 | 2.01 | 15/11/2003 | (3.9 | ) | |||||
25.0 | |||||||||||
Floating for fixed | 7.10 | 2.01 | 15/11/2013 | (6.0 | ) | ||||||
50.0 | |||||||||||
25.0 | Fixed for floating | 6.50 | 1.36 | 15/11/2003 | 3.6 |
| |||||
50.0 | Fixed for floating | 6.50 | 0.93 | 15/11/2003 | 8.2 |
| |||||
25.0 | Fixed for floating | 6.75 | 1.93 | 1/12/2006 | 4.4 |
| |||||
25.0 | Fixed for floating | 6.75 | 1.91 | 1/12/2006 | 4.3 |
| |||||
25.0 | Fixed for floating | 6.75 | 1.84 | 1/12/2006 | 4.3 |
| |||||
25.0 | Fixed for floating | 6.75 | 1.83 | 1/12/2006 | 4.3 |
| |||||
25.0 | Fixed for floating | 7.55 | 1.97 | 15/11/2013 | 8.2 |
| |||||
50.0 | Fixed for floating | 7.25 | 1.94 | 15/11/2013 | 13.8 |
| |||||
40.0 | Fixed for floating | 7.25 | 1.80 | 15/11/2013 | 12.5 |
| |||||
50.0 | Fixed for floating | 7.35 | 2.77 | 1/12/2026 | 7.5 |
| |||||
25.0 | Fixed for floating | 7.35 | 2.76 | 1/12/2026 | 3.7 |
| |||||
25.0 | Fixed for floating | 7.35 | 2.80 | 1/12/2026 | 3.6 |
| |||||
50.0 | |||||||||||
440.0 | Fixed for floating | 7.35 | 3.15 | 2/12/2026 | 2.5 |
| |||||
| (1) | This is the floating rate applicable to the swap at balance date and is set using the 3 months US$ LIBOR floating base rate plus a margin. |
As at December 31, 2002, we had entered into a cross currency swap, swapping A$855 million into US$ denominated debt of US$480 million as follows:
Interest Rate | ||||||||||
Debt | US$m equivalent | A$ Debt | US$ Debt | Maturity | Fair Value | |||||
A$m | A$m | |||||||||
427.5 | 240.0 | 5.56 | 2.14 | 10/1/2003 | 5.2 | |||||
427.5 | 240.0 | 5.56 | 2.15 | 10/1/2003 | 5.2 | |||||
855.0 | 480.0 | 10.4 | ||||||||
Fair value of these cross currency swaps is based on the spot rate as at December 31, 2002. Given the short period to maturity we do not expect this to be materially different to market value.
90
Table of Contents
For comparison, we had entered into the following cross currency swaps at December 31, 2001:
Interest Rate | ||||||||||
Debt | US$m equivalent | A$ Debt | US$ Debt | Maturity | Fair Value | |||||
A$m | A$m | |||||||||
50.0 | 30.0 | 5.30 | 4.10 | 2/4/2002 | (8.7) | |||||
20.0 | 12.6 | 4.81 | 2.92 | 7/4/2002 | (4.6) | |||||
50.0 | 31.4 | 4.81 | 2.91 | 7/4/2002 | (11.5) | |||||
10.0 | 6.3 | 4.81 | 5.12 | 8/4/2002 | (2.3) | |||||
200.0 | 131.7 | 4.85 | 2.62 | 8/5/2002 | (57.5) | |||||
50.0 | 33.5 | 5.35 | 3.06 | 8/5/2009 | (15.5) | |||||
380.0 | 245.5 | |||||||||
As at December 31, 2002, we had entered into A$100 million of interest caps at 6.00% (December 2001: US$430 million at 7.14%) with maturity date of January 7, 2003. Their fair value is immaterial.
Adoption of FAS 133
We adopted Statement of Financial Accounting Standards No. 133, “Accounting for Derivative Instruments and Hedging Activities” as amended by Statement of Financial Accounting Standards No. 137, “Accounting for Derivative Instruments and Hedging Activities—Deferral of the Effective Date of FASB Statement No. 133”, an amendment of FASB Statement No. 133, and Statement of Financial Accounting Standards No. 138, “Accounting for Certain Derivative Instruments and Certain Hedging Activities”, an amendment of FASB Statement No. 133 (referred to hereafter as “FAS 133”), on January 1, 2001. In accordance with the transition provisions of FAS 133, we recorded the following net-of-tax cumulative effect adjustments in earnings as of January 1, 2001:
A$m | |||
Related to previously designated fair value hedging relationships: | |||
Fair value of hedging instruments | 36.0 |
| |
Offsetting changes in fair value of hedged items | (36.0 | ) | |
Total adjustment net of tax | — |
| |
In addition, we recorded the following net-of-tax cumulative-effect adjustments in other comprehensive income as of January 1, 2001.
A$m | |||
Related to previously designated fair value hedging relationships: | |||
Fair value of hedging instruments | 29.2 |
| |
Previously deferred hedging gains and losses | (647.9 | ) | |
Total adjustment net of tax | (618.7 | ) | |
Accounting for Derivatives and Hedging Activities
We formally document all relationships between hedging instruments and hedged items, as well as our risk-management objective and strategy for undertaking various hedge transactions. This process includes linking all derivatives that are designated as fair-value, cash flow, or foreign-currency hedges to (1) specific assets and liabilities on the balance sheet or (2) specific firm commitments or forecasted transactions. We also formally assess (both at the hedge’s inception and on an ongoing basis) whether the derivatives that are used in hedging transactions have been highly effective in offsetting changes in the fair value or cash flows of hedged items and whether those derivatives may be expected to remain highly effective in future periods. When we determine that
91
Table of Contents
a derivative is not (or has ceased to be) highly effective as a hedge, we discontinue hedge accounting prospectively, as discussed below.
We discontinue hedge accounting prospectively when (1) we determine that the derivative is no longer effective in offsetting changes in the fair value or cash flows of a hedged item (including hedged items such as firm commitments or forecasted transactions); (2) it is probable that the forecasted transaction will not occur; (3) a hedged firm commitment no longer meets the definition of a firm commitment; or (4) management determines that designating the derivative as a hedging instrument is no longer appropriate.
Fair-Value Hedges
We use interest rate swaps to convert a portion of our non-prepayable fixed-rate debt into variable-rate debt. Under the interest rate swap contracts, we agree with other parties to exchange, at specified intervals, the difference between fixed-rate and floating-rate interest amounts, which is calculated based on an agreed-upon notional amount.
Cash Flow Hedges
Our sales are denominated in US$. We enter into foreign exchange options and forward exchange contracts as hedges of anticipated sales denominated in foreign currencies. We enter into these contracts to protect ourselves against the risk that the eventual dollar-net-cash inflows resulting from direct-foreign-export sales will be adversely affected by changes in exchange rates.
As at December 31, 2002 we recognized a net loss of A$0.2 million, representing the change in time value on certain of our forward contracts that had been excluded from the assessment of hedge effectiveness. We recorded a further net loss of A$4.3 million for the ineffective portion of certain options designated as cash flow hedges.
The revaluation of foreign currency debt which is not treated as a hedge for accounting purposes under US GAAP resulted in a net gain after tax of A$94.2 million
The total of the adjustments referred to in the preceding two paragraphs on pre-tax basis was A$128.6 million.
As of December 31, 2002, we expect to reclassify A$128.3 million of deferred net losses on derivative instruments accumulated in other comprehensive income as earnings during the next twelve months.
The maximum term over which we are hedging exposures to the variability of cash flows using derivative instruments for all forecasted transactions is seven years.
We take subsequent gains and losses on cash flow hedges to other comprehensive income and reclassify to profit and loss in the same period we recognize the hedged transaction. We continue to take gains and losses on fair value hedges to profit and loss in subsequent periods, as offsetting gains and losses on hedged liabilities. In both cases, these gains and losses are not recognized under Australian GAAP until the hedged transaction is recognized.
FAS 133 requires that any component of the gain or loss which is deemed to be ineffective be taken to the Income Statement immediately. For Australian GAAP any ineffectiveness is recognized over the term of the derivative.
92
Table of Contents
Carrying amounts and estimated fair values of financial instruments
The carrying amounts and estimated fair values of our group’s financial instruments are as follows:
| Carrying amount as at December 31, 2002 | Fair value as at December 31, 2002 | Carrying amount as at December 31, 2001 | Fair value as at | |||||||||
| A$m | ||||||||||||
Recognized in the Balance Sheet | ||||||||||||
Financial Assets | ||||||||||||
Cash assets | 90.5 | 90.5 | 124.1 | 124.1 | ||||||||
Current other financial assets | 12.7 | 12.7 | 20.1 | 20.1 | ||||||||
Current receivables | 557.7 | 554.9 | 496.0 | 582.3 | ||||||||
Non-current receivables | 218.8 | 211.6 | 481.4 | 398.4 | ||||||||
Non-current other financial assets | 12.3 | 12.3 | 18.2 | 19.2 | ||||||||
Financial Liabilities | ||||||||||||
Current payables | 657.9 | 666.3 | 855.2 | 855.6 | ||||||||
Bank overdrafts | — | — | 0.2 | 0.2 | ||||||||
Short-term interest bearing liabilities | 1,287.6 | 1,287.6 | 584.1 | 584.1 | ||||||||
Other current liabilities | 17.0 | 17.0 | 15.1 | 15.1 | ||||||||
Non-current payables | 849.7 | 822.9 | 1,197.7 | 1,109.1 | ||||||||
Long-term interest bearing liabilities | 369.9 | 370.1 | 1,737.7 | 1,755.8 | ||||||||
Other non-current liabilities | 2.8 | 2.8 | 9.3 | 9.3 | ||||||||
Financial Instruments | ||||||||||||
Hedging contracts: | ||||||||||||
—forward/swaps | (567.9 | ) | (559.4 | ) | (816.5 | ) | (729.2 | ) | ||||
—options | (157.4 | ) | (157.4 | ) | (234.7 | ) | (221.0 | ) | ||||
| (725.3 | ) | (716.8 | ) | (1,051.2 | ) | (950.2 | ) | |||||
We used the following methods and assumptions to estimate the fair value of each class of financial instruments for which it is practicable to estimate a value.
Cash assets and current other financial assets
The carrying amount approximates fair value because of the short maturity of these instruments.
Non-current other financial assets
We carry the other investments at cost. We valued shares quoted on a prescribed stock exchange at the quoted market value at balance date.
Debtors and creditors
We have calculated the fair value of debtors and creditors relating to hedging contracts on a mark-to-market basis using forward prices. Other current debtors and creditors mainly represent financial obligations we incurred in exchange for goods and services provided and received by us in the normal course of our operations, net of provisions for doubtful debts. Due to the short-term nature of these financial obligations, we estimate their carrying values to equal their fair values.
Short-and long-term debt
We consider the carrying value of short-term debt and bank overdrafts to approximate the fair value due to the short maturity of the debt. Long-term debt comprises of bank loans and Yankee Bonds issues. We consider the carrying value of the long-term debt to approximate the fair value, with the exception of the Yankee Bond issue, the fair value of which was determined on a mark-to market-basis.
93
Table of Contents
Foreign currency and commodity hedging contracts
We base the carrying amounts for commodity and foreign currency hedging contracts on the revaluation of open contracts at December 31, 2002, against spot rates at that date. The fair value we disclose represents the same contracts on a mark-to-market basis using forward rates and prices.
Other Disclosures
Further disclosures relating to financial instruments are included in Notes 28 and 36 to our Consolidated Financial Statements.
Contribution of Hedging to results for 2002 year
Commodity hedging contributed a loss of A$5.1 million to our operating results. The total currency loss for the year ended December 31, 2002, was A$108.2 million. The currency losses were attributable to forward contracts, implemented in prior periods and maturing in the year ended December 31, 2002, at an average rate above the HSRA rate for the period.
Contribution of Hedging to results for 2001 year
Commodity hedging contributed a gain of A$66.1 million to our operating results. The total currency loss for the 12 months ended December 31, 2001, was A$328.1 million. The currency losses were attributable to forward contracts, implemented in prior periods and maturing in 2001, at an average rate above the HSRA rate for the period.
Contribution of Hedging to results for 2000 year
Commodity hedging contributed a loss of A$14.9 million to our operating results. The total currency loss for the 12 months was A$253.0 million. This was due to forward contracts implemented in prior periods and maturing in 2000, at an average rate above the HSRA rate for the period.
Contribution of Hedging to results for 1999 year
Commodity hedging contributed a gain of A$62.8 million to our operating results. The total currency loss for the 12 months was A$19.8 million. This was due to forward contracts implemented in prior periods and maturing in 1999, at an average rate above the HSRA rate for the period.
Contribution of Hedging to results for 1998 year
Commodity hedging contributed a gain of A$78.2 million to our operating results. The total currency loss for the 12 months was A$165.5 million. This was due to forward contracts implemented in prior periods and maturing in 1998, at an average rate above the HSRA rate for the period.
In our management’s opinion, we did not engage in any Price Risk Management transactions of a speculative nature during 2002, 2001, 2000, 1999, July 1, 1997 to December 31, 1998, and 1996-97.
Qualitative Information About Market Risk
We have included Qualitative information on price risk management, and commodity and currency hedging in the discussion above in “Information on Price Risk Management”. We discuss qualitative information on treasury management and exchange rate and interest rate risk in the section entitled “Operating and Financial Review and Prospects—Liquidity and Capital Resources”.
94
Table of Contents
DIRECTORS AND SENIOR MANAGEMENT OF WMC RESOURCES GROUP
Directors and Senior Management
Our business is managed by a board of directors which, in accordance with our constitution, may have not fewer than three nor more than 12 members.
Our directors are classified as either executive or non-executive directors, with the former being those directors engaged in full-time employment with us. The members of the audit committee are: Adrienne E. Clarke, Peter J. Knight and David E. Meiklejohn. The members of the compensation committee are: Tommie C.-E. Bergman and Ian E. Webber.
As at May 31, 2003, our directors were:
Name | Position | Summary | Initially | Age | Expiry of Current Term | |||||
Executive Directors | ||||||||||
Andrew G. Michelmore(3) | Chief Executive Officer | Chairman of the Jean Hailes Foundation for Women’s Health and the CSIRO Sector Advisory Committee, a past director of the Ian Clunies Ross Foundation and Melbourne Enterprises International Limited. Operational experience with ICI Australia, CRA and Nabalco in senior project and general management roles, before joining WMC Limited in 1993. From January 2001 was Executive General Manager—Business Strategy and Development for WMC Limited and appointed Chief Executive Officer from January 1, 2003. | August 2002 | 50 | 2007 | |||||
Alan K. Dundas(5) | Executive Director | Senior operational and management roles with various companies in Australia and Canada including Nabalco, Curragh Qld Mining and Quintette Coal. Joined WMC Limited in 1994 and held roles of General Manager—Kwinana Nickel Refinery and General Manager—Nickel Operations. From January 2001, Executive General Manager—Nickel and from December 2001, Executive General Manager—Operations. | March 2003 | 46 | 2006 | |||||
95
Table of Contents
Non-Executive Directors
Name | Position | Summary | Initially | Age | Expiry of Current Term | |||||
Tommie C-E. Bergman(1)(4) | Chairman | Director of Amcor Limited and Smorgon Steel Group Limited and Chairman of Cochlear Ltd and former Chairman and Managing Director Australasia of Asea Brown Boveri Pty Ltd | January 2001 | 57 | 2004 | |||||
Adrienne E. Clarke(2) | Director | Director of Fisher and Paykel Healthcare Corporation Limited, Woolworths Limited, and Hexima Limited. Chair of CSIRO from 1991 to 1996, a past Lieutenant-Governor of Victoria, Victoria’s Ambassador for Biotechnology, President of the International Society for Plant Molecular Biology and member of the US National Academy of Sciences. | July 1996 | 65 | 2006 | |||||
Peter J. Knight(2) | Director | Former Chairman of Central Norseman Gold Corporation Limited and a non-executive director and former managing director of Clough Limited. | August 1997 | 64 | 2004 | |||||
David E. Meiklejohn(2) | Director | Chairman of PaperlinX Limited and SPC Ardmona Limited, Deputy Chairman of GasNet Australia Limited, Director of One Steel Limited. Former Chief Financial Officer and Executive Director of Amcor Limited. Chairman of WMC Resources Audit Committee | April 2002 | 61 | 2005 | |||||
Ian E. Webber(1) | Director | Director of Santos Limited and a member of General Motors Australian Advisory Council. Former chairman of Mayne Nickless Limited. Chairman of the WMC Resources Compensation Committee. | June 1997 | 68 | 2004 | |||||
| (1) | Member of compensation committee. |
| (2) | Member of audit committee. |
| (3) | Hugh M. Morgan retired as chief executive officer and as a director January 1, 2003. On August 13, 2002, the board appointed Andrew G. Michelmore, at the time EGM—Business Strategy & Development, to succeed Mr. Morgan as chief executive officer from January 1, 2003. |
| (4) | Tommie C.-E. Bergman was appointed chairman following the retirement of Ian G.R. Burgess on May 2, 2003. |
| (5) | Alan K. Dundas was appointed as an executive director on March 12, 2003. |
96
Table of Contents
M. John Phillips retired as a director on June 18, 2002 and Donald M. Morley retired as a director on September 4, 2002. Alan K. Dundas was appointed as a director on March 12, 2003. Mr Ian G.R. Burgess retired as Chairman on May 2, 2003 and Mr. Roger A.G. Vines retired as a director on May 2, 2003.
In addition to the chief executive officer, the executive officers appointed by and reporting to the chief executive officer are responsible for the day to day running of the business. As at May 31, 2003, our executive officers were:
Name | Position in 2002 | Appointed as Executive | ||
Bruce R. Brook | Executive General Manager—Finance and Chief Financial Officer | March 2002 | ||
Alan K. Dundas(1) | Executive General Manager—Operations | January 2001 | ||
Michael Nossal | Executive General Manager—Business Strategy | March 2003 | ||
Greg J. Travers | Executive General Manager—Group Services | June 1996 |
The experience of our management team, who, with the chief executive officer, have responsibility for all operational and administrative functions of the business, is outlined below:
Executive Officer | Summary of Experience | |
Bruce R. Brook | Appointed as Executive General Manager—Finance of WMC Limited in March 2002 and Chief Financial Officer in June 2002. Mr. Brook was Deputy Chief Financial Officer at the ANZ Bank and has had substantial experience in the resources and finance sectors, having worked for Price Waterhouse; Gold Fields of South Africa, Pasminco Limited, CRA and Pacific Dunlop. | |
Alan K. Dundas | Senior operational and management roles with various companies in Australia and Canada including Nabalco, Curragh Qld Mining and Quintette Coal. Joined WMC Limited in 1994 and held roles of General Manager—Kwinana Nickel Refinery and General Manager—Nickel Operations. From January 2001, Executive General Manager—Nickel and from December 2001, Executive General Manager—Operations. | |
Michael Nossal | Appointed as Executive General Manager—Business Strategy and Development in March 2003. Fourteen years in senior management roles in the mining industry, including Normandy Mining Limited, Associate Director on the Resources Team of Macquarie Corporate Finance and Kenmare Resources Limited. Prior to joining WMC Resources, Mr. Nossal was the Chief Executive Officer of a start-up supply chain management software company based in London. | |
Greg J. Travers | Executive General Manager—Group Services for WMC Limited prior to the demerger. Experience in both operations and functional service areas, and has worked with Pratt Industries, Mount Newman Mining Company and BHP. He joined WMC Limited in 1994 as Group Manager—Training and Organisational Development. Mr. Travers is a director of Australian Mines and Metals Association and was a director of the Institute of Public Affairs until November 2001. | |
Compensation
For the year ended December 31, 2002, the aggregate amount of compensation paid and accrued to our directors and executive general managers was A$21,582,481 (compared to A$11,382,538 in 2001 and A$9,751,658 in 2000). This amount includes retirement allowances of A$9,320,258 paid to either non-executive or executive directors who retired from office during the period January 1, 2002 to December 31, 2002. This amount also includes A$452,856 (A$582,116 in 2001) in pension benefits in our superannuation scheme for directors and members of administrative, supervisory or management bodies. There are no other contingent or deferred compensation arrangements accrued for our executives or directors. The terms and conditions applicable
97
Table of Contents
to our directors and executive general managers are the same as those that applied to them in their capacities as directors and executive general managers of WMC Limited prior to the demerger (which was implemented on December 11, 2002). The remuneration of individual directors and executive general managers is presented in the tables below.
Non-executive director remuneration—January to December 2002
Non-executive directors | Director’s fee(1) | Other(2) | Total | |||
(A$) | ||||||
Tommie C-E. Bergman | 143,797 | 12,428 | 156,225 | |||
Ian G. R. Burgess(3) | 232,818 | 19,904 | 252,722 | |||
Adrienne E. Clarke | 83,000 | 7,179 | 90,179 | |||
Peter J. Knight | 83,000 | 7,353 | 90,353 | |||
David E. Meiklejohn | 61,074 | 5,454 | 66,528 | |||
M. John Phillips(4) | 38,267 | 232,249 | 270,516 | |||
Roger A. G. Vines(5) | 83,000 | 7,266 | 90,266 | |||
Ian E. Webber | 89,000 | 7,689 | 96,689 |
| (1) | Includes director and committee fees. |
| (2) | Includes superannuation, executive indemnity insurance and retirement payments. |
| (3) | Mr I.G.R. Burgess retired as Chairman from the Board on May 2, 2003. |
| (4) | Mr. J. Phillips retired from the Board on June 18, 2002. |
| (5) | Mr R.A.G. Vines retired from the Board on May 2, 2003. |
Executive director and senior executive remuneration January to December 2002 | Fixed remuneration | Other compensation | Total remuneration | |||
A$(1) | A$(2) | A$ | ||||
Executive director | ||||||
Hugh M. Morgan, Chief Executive Officer(3) | 1,647,657 | 7,944,490 | 9,592,147 | |||
Andrew G. Michelmore, Chief Executive Officer(4) | 710,000 | 1,227,624 | 1,937,624 | |||
Donald M Morley(5) | 698,333 | 3,441,886 | 4,140,219 | |||
Executive general managers | ||||||
Bruce R. Brook—Finance | 498,810 | 886,023 | 1,384,833 | |||
Alan K. Dundas—Operations | 675,000 | 915,624 | 1,590,624 | |||
John Parry—Exploration (former) | 72,174 | 272,258 | 344,432 | |||
Greg J. Travers—Group Services | 526,500 | 952,624 | 1,479,124 |
(1) Includes amounts accrued for annual leave and long service leave.
(2) Includes retirement payments and the value of shares acquired under the executive share plan.
(3) Mr. Morgan retired as CEO and Managing Director on January 1, 2003.
(4) Mr. Michelmore was appointed as CEO and Managing Director on January 1, 2003.
(5) Mr. Morley retired on September 4, 2002.
Non-executive directors with more than five years service are entitled to retirement benefits equaling the total fees paid in the three years before retirement. Directors with three to five years service receive pro rata benefits. Non-executive directors under the age of 75 receive a superannuation guarantee contribution which effective July 1, 2002 increased from 8% to 9% of their fees. It was decided at the April 2003 board meeting that retirement benefits will not accumulate for any new directors appointed to the board. New directors will be compensated entirely through their annual fee.
98
Table of Contents
All our full time Australian-based employees and expatriate employees (including executive directors and officers) and our subsidiaries are members of the WMC Superannuation Plan (formerly WMC Superannuation Fund). The WMC Superannuation Plan has three categories of membership:
| • | the defined benefit category provides lump sum benefits based on period of service, age and final average salary; |
| • | the accumulation category offers a minimum company contribution from 11.5% to 20% of basic annual salary to each member’s account in the Plan; and |
| • | the Superannuation Guarantee Category is a compulsory accumulation category for all employees under hourly paid awards. Pursuant to legislation we are required to make minimum contributions. Effective July 1, 2002, the contribution rate increased from 8% to 9% of ordinary time earnings. |
For further details of the WMC Superannuation Plan, see Note 40 of our Consolidated Financial Statements.
Board Practices
Role of the board
Our board, working with senior management, is responsible to shareholders for overall business performance. It approves company goals and directions, strategic plans and performance targets. Our board ensures that appropriate policies, procedures and systems are in place to manage risk, optimize business performance and maintain high standards of ethical behavior and legal compliance.
Since we listed in December 2002, the board has reviewed our corporate governance policies in line with the requirements of the new company. Our policies largely comply with the ASX Corporate Governance Centre’s best practice recommendations published by the Australian Stock Exchange on March 21, 2003. It is the board’s duty to ensure that we comply with its regulatory requirements and maintain ethical standards. We manage resources responsibly and maintain a high level of transparency in reporting to all stakeholders.
The board is responsible for our strategic direction and control, and it delegates responsibility for managing the company to the chief executive officer. The functions of the board include:
| • | evaluating and rewarding senior management and ensuring executive succession planning; |
| • | validating and approving corporate strategies, budgets, plans and policies; |
| • | assessing performance against strategies to monitor both the suitability of those strategies and management performance and ensuring that directors have a good understanding of the company’s state of health; |
| • | ensuring regulatory compliance and maintaining adequate risk management process; |
| • | approving policies covering the management of business risks, safety and occupational health, community and environmental issues; and |
| • | ensuring that we protect our good reputation by acting in accordance with the highest ethical standards. |
Board Meetings
Full-day board meetings are held monthly (except January) and, if required, are convened outside the scheduled meeting dates. Ad hoc board committee meetings are convened to address board issues when it is not practical to organize a full board meeting. The WMC Resources’ board members were also directors of WMC Limited (now called Alumina Limited) until December 11, 2002, and they met 16 times during 2002 up to December 11, 2002. The increase in meetings during 2002 reflects the demands and complexities associated with the demerger.
The chairman and the chief executive officer meet regularly to discuss business and strategic issues and to set board agendas.
99
Table of Contents
Access to Information
Directors are entitled to full access to information required to discharge their responsibilities. Separate from board papers, directors receive a monthly report on our performance and other significant issues from the chief executive officer. At each board meeting, senior executives make presentations to assist directors in developing an in-depth knowledge of the company’s operations, activities and issues. Most years, two board meetings are held in conjunction with visits to our operations to assist directors in their review of the businesses.
New directors are provided with a comprehensive orientation and are encouraged to visit our operations to assist them in developing an understanding of WMC Resources’ businesses and key drivers.
Directors may obtain independent legal advice at our expense, subject to prior consultation with the chairman, on matters arising in the course of their board and committee duties. Directors also have access to our senior managers and our documents at all times.
Board Composition
Our board has seven directors, five independent non-executive directors including the chairman, and two executive directors. The strength of the board comes from the collective interaction of experienced and informed directors who provide the breadth and depth of knowledge and experience to meet the company’s objectives. John Phillips, Donald Morley, Hugh Morgan, Ian Burgess and Roger Vines have retired from the board effective June 18 and September 4, 2002, January 1, 2003, May 2, 2003 and May 2, 2003 respectively. David Meiklejohn and Andrew G. Michelmore were appointed to the board during 2002. Alan K. Dundas was appointed to the board in March 2003. Ian G.R. Burgess stood down as chairman and a non-executive director at the 2003 annual general meeting on May 2, 2003. Tommie C.-E. Bergman was appointed to the position of chairman on May 2, 2003.
Our board reviews its composition and assesses nominations for new appointments from time to time to ensure it has the right balance of skills and experience.
All non-executive directors are independent, having no business or other relationship which could compromise their autonomy. The directors (other than a managing director) are subject to retirement by rotation, one-third retiring each year by order of seniority of election (or the number nearest to one-third if the number of directors is not a multiple of three), and may not continue to hold office without re-election after the third annual general meeting following their last election by the shareholders. Non-executive directors retire, by agreement, at the annual general meeting following their reaching 72 years of age. Executive directors retire at 65 years of age. After once being elected by the shareholders, a director who is appointed a managing director by the board is not required to retire by rotation. The directors may appoint a director either to fill a casual vacancy or as an addition to their numbers. Such directors hold office until the next annual general meeting and may be elected by the shareholders at such a meeting but are not taken into account in determining the number of directors who are to retire by rotation at that meeting. There are presently no maximum terms for non-executive director appointments.
Each director has the power to appoint any person approved by a majority of his co-directors to act as an alternate director in his place, whether for a stated period or periods or until the happening of a specified event or from time to time, whenever by absence or illness or otherwise he shall be unable to attend to his duties as a director.
Chairman
Our constitution provides that the directors may elect a chairman of their meetings and determine the period for which he or she is to hold office. Where there is an equality of votes on a question voted on at a meeting, the chairman has a second or casting vote (subject to the ASX Listing Rules).
100
Table of Contents
Tommie C.-E. Bergman is our non-executive chairman. He was appointed at the 2003 annual general meeting following the retirement of the former Chairman, Ian G.R. Burgess. Tommie C.-E. Bergman has been a director of the company since January 2001.
Chief Executive Officer
The directors may from time to time appoint one or more of their body to be a managing director or managing directors either for an unlimited period but not for life, a fixed term not exceeding five years, or a period terminable upon the happening of such specific events as the directors may stipulate. The directors may confer upon any managing director any of the powers exercisable under our constitution by directors as they may elect, without derogating from the exercise of those powers by the directors.
Andrew G. Michelmore is currently our sole managing director and chief executive officer. He joined us in 1993 and has held a number of senior positions before being appointed to the board as chief executive officer-elect in August 2002. He was appointed chief executive officer on January 1, 2003 following the retirement of Hugh M. Morgan. The chief executive officer is subject to annual performance reviews by the non-executive directors. The chief executive officer recommends policy and strategic direction for board approval and is responsible for managing day-to-day operations.
Board Committees
Our board has established three standing committees to assist the board in meeting its responsibilities: the audit committee, the compensation committee and the newly constituted nominations committee. These committees review matters on behalf of the board and make recommendations for consideration by the entire board.
The audit committee consists of three non-executive directors: Adrienne E. Clarke, Peter J. Knight and David E. Meiklejohn. The committee is chaired by David E. Meiklejohn. The committee meets at least four times a year and assists the board in meeting its regulatory responsibilities. It provides a direct channel of communication between the external and internal auditors and the board, and assists the board in ensuring the external audit is conducted in a thorough, objective and cost-effective manner. It also reviews the internal audit work plan. The audit committee’s terms of reference include an annual review of the external auditors’ performance, and the nature and extent of their non-audit services. The audit committee also reviews the auditors’ independence.
The chief executive officer and the chief financial officer, together with the internal and external auditors, attend meetings of the committee except when the committee wishes to meet alone. The committee also meets privately with both the internal and external auditors on a regular basis. The committee has access to professional advice inside and outside our company.
The compensation committee meets at least four times a year. It consists of two non-executive directors—Tommie C.-E. Bergman and Ian E. Webber. The committee is chaired by Ian E. Webber. It is the committee’s role to oversee our remuneration and compensation plans, policies and practices, including remuneration of the non-executive directors, the chief executive officer and senior executives, and succession planning.
The nominations committee is made up of each of the directors on the WMC Resources Board meeting as the nominations committee. The committee’s role is to establish a process for the selection and appointment of directors to the board of WMC Resources. The committee assesses the skills, experience and expertise required by the WMC Resources Board and recommends candidates for appointments.
On behalf of the board, the compensation committee considers the remuneration strategy with regard to community and industry standards and, where possible, verifies its appropriateness using external information and advice to ensure that:
| • | our employees’ interests are aligned to our corporate objectives; |
101
Table of Contents
| • | we can attract, develop and retain superior talent; and |
| • | the integrity of our reward program is maintained. |
Following the demerger, the board established a corporate policy review committee comprising the chief executive officer, the chief financial officer and the company secretary, to review and recommend to the board appropriate policies covering corporate policy and procedure.
Indemnities
During 2002, we entered into deeds of access indemnity and insurance with each director providing access to documentation, indemnifying them against liability arising out of the conduct of our and our subsidiaries’ business, and in particular each director’s participation in the demerger.
Company Policies
Our board has adopted policies in key areas, including occupational health and safety, the environment, indigenous people, respect and diversity in employment (formerly equal employment opportunity), continuous disclosure, capital investment and employee trading in our securities.
Reporting to Stakeholders
Our board is committed to keeping all stakeholders informed, in a timely manner, of all developments that affect our company. The disclosure policy is supported by a formal policy and comprehensive procedures on continuous disclosure to ensure compliance with legal obligations. All our announcements, presentations to analysts and other significant briefings are posted to our website after release to the Australian Stock Exchange.
Ethical Standards
The WMC Code of Conduct sets parameters for ethical behavior and business practices for directors, employees and contractors. A code of conduct committee regularly reviews and updates the code. The committee, comprising ten members from a cross section of our operations and functional units and chaired by an executive general manager, is also available to any employee for guidance on ethical issues.
Share Trading
Our share trading policy prohibits directors and employees from engaging in short term trading of any of our securities, or buying or selling our shares, if they possess unpublished price sensitive information. In addition, directors and senior management must not buy or sell our shares in the six to eight weeks between the end of the half or full financial year and the release of those results. Directors and senior management must also receive approval from our chairman, the chief executive officer or company secretary before buying or selling company shares.
Managing Risk
Business Risk
Our risk management policy and procedures cover safety, health, environment, property, financial reporting and internal control. Each operational site is responsible for implementing policies and procedures that address:
| • | risk identification and control; |
| • | training; |
102
Table of Contents
| • | reporting; |
| • | loss control and prevention; |
| • | crisis management and recovery; and |
| • | longer term risk reduction. |
Our internal audit plant is developed in conjunction with these risk management processes. Internal audits assess the efficiency and effectiveness of risk control across all our sites.
Financial Exposures
We have a comprehensive framework for managing financial exposure. The board’s objective for price-risk management is to provide acceptable rates of return for new projects, and to secure significant value-adding strategic objectives. Transactions that create unacceptable risk, or cannot be matched against underlying physical exposures, are not permitted.
Our price-risk management policy is approved by the board and reviewed and changed as required.
The risk management committee, chaired by the chief executive officer and including senior management, is responsible for implementing price-risk management policy. Our detailed policies for managing credit risk require board approval of all counter-parties. Price-risk management controls include:
| • | centralized treasury functions; |
| • | segregating treasury functions; |
| • | valuing exposures on a mark-to-market basis; and |
| • | a regular review of hedge positions, which are disclosed quarterly to the Australian Stock Exchange. |
As part of sound business practices, our board reviews the annual report prior to its release to the Australian Stock Exchange and to shareholders.
Employees
At December 31, 2002, we employed 2,897 people directly and hired 1,474 as contractors.
We are decentralized into divisional business or functional units where executive general managers and general managers exercise widely delegated authority and discretion within broad guidelines. Responsibility for employee relations resides with the operations with support and advice from the Human Resources Department.
Individual contracts of employment have been implemented across our operations. This move to individual contracts was effectively concluded during 1997, with the majority of employees now employed under the same form of contract.
Membership of trade unions is optional under Australian law. Industrial disputation over the past year has been minimal and confined to contractor organizations. None of our employees participated in any industrial disputation. We operate continuous shift work across many of our operations in Western Australia, South Australia and Queensland.
Local law and custom is observed as a minimum standard in determining wage and working conditions at our overseas operations. We have in place a Code of Conduct, the objective of which is to ensure fair and ethical practices within our organization, which must be observed by all directors, employees and contractors at all of our operations.
103
Table of Contents
The distribution of our employees between business segments and geographically is outlined below:
Year ended December 31, | ||||||||||||
2002 | 2001 | 2000 | ||||||||||
Permanent Staff | Contractors | Permanent Staff | Contractors | Permanent Staff | Contractors | |||||||
Copper | 960 | 366 | 988 | 314 | 1,057 | 377 | ||||||
Nickel | 950 | 667 | 1,009 | 755 | 1,044 | 820 | ||||||
Gold | — | — | 104 | 86 | 330 | 302 | ||||||
Industrial Minerals and Fertilizers | 360 | 171 | 364 | 233 | 439 | 310 | ||||||
Projects | — | — | 38 | 19 | 35 | 1 | ||||||
Ex-Div | 46 | — | 68 | 5 | 182 | 17 | ||||||
Corporate | 581 | 270 | 476 | 175 | 396 | 50 | ||||||
Total | 2,897 | 1,474 | 3,047 | 1,587 | 3,483 | 1,877 | ||||||
Australia | 2,834 | 1,458 | 2,978 | 1,582 | 3,341 | 1,863 | ||||||
North America | 42 | 9 | 46 | 3 | 76 | 6 | ||||||
South America | 13 | 7 | 16 | 2 | 53 | 8 | ||||||
Asia | 6 | — | — | — | 10 | — | ||||||
Europe | 2 | — | 2 | — | 3 | — | ||||||
South Africa | — | — | 5 | — | — | — | ||||||
Share Ownership
In connection with the demerger, we issued options to subscribe for our shares and stock appreciation plan rights.
The table set forth below shows the options we issued in connection with the demerger and the exercise price for each option. We issued these options to our employees to replicate proportionately the options over WMC Limited shares these employees had prior to the demerger. The table also shows options allocated subsequent to the demerger under the December 2002 Option Plan.
WMC Limited Option Plan | Expiry Date | WMC Resources Option Exercise Price (A$) | No. of WMC Resources Options Issued under Option Scheme on 12/11/2002 | No of WMC Resources Options Outstanding at 12/31/2002 | ||||
1997 Option Plan | December 22, 2002 | 2.27 | 451,300 | — | ||||
1997 Option Plan(1) | December 22, 2002 | 2.50 | 250,000 | — | ||||
1998 Option Plan | December 21, 2003 | 2.26 | 963,120 | 926,220 | ||||
1998 Option Plan(1) | December 21, 2003 | 2.49 | 375,000 | 375,000 | ||||
1999 Option Plan | December 20, 2004 | 3.90 | 3,868,000 | 3,748,100 | ||||
2000 Option Plan | December 18, 2005 | 3.48 | 6,007,050 | 5,918,100 | ||||
2001 Option Plan | November 30, 2006 | 4.33 | 10,060,500 | 9,981,900 | ||||
May 2002 Option Plan | November 30, 2006 | 4.33 | 600,000 | 600,000 | ||||
Dec 2002 Option Plan(2) | December 23, 2007 | 4.34 | — | 10,951,860 |
| (1) | Options granted to executive directors of WMC Limited. |
| (2) | Options issued subsequent to the demerger. |
As at December 31, 2002, the aggregate number of these options held by our directors and executive general managers was 1,712,000. All our directors and executive general managers own shares or options in WMC Resources Ltd, but none own more than three percent of any category.
104
Table of Contents
The table set forth below shows the stock appreciation plan (“SAP”) rights we issued in connection with the demerger and the allotment price for each right. The table also shows SAP rights issued subsequent to the demerger under the December 2002 SAP.
WMC Limited SAP | Expiry Date | WMC Resources SAP | Balance of WMC | Balance of | ||||
1997 SAP | December 22, 2002 | 2.27 | 50,000 | Nil | ||||
1998 SAP | December 21, 2003 | 2.26 | 59,500 | 59,500 | ||||
1999 SAP | December 20, 2004 | 3.90 | 183,400 | 183,400 | ||||
2000 SAP | December 18, 2005 | 3.48 | 309,900 | 309,900 | ||||
2001 SAP | November 30, 2006 | 4.33 | 481,300 | 481,300 | ||||
June 2002 SAP | November 30, 2006 | 4.33 | 250,000 | 250,000 | ||||
August 2002 SAP | November 30, 2006 | 4.33 | 400,000 | 400,000 | ||||
December 2002 SAP(1) | December 23, 2007 | 4.34 | — | 261,400 |
| (1) | SAP rights issued subsequent to the demerger. |
WMC Resources Employee Share Scheme
We have established the WMC Resources Employee Share Scheme (“WMC Resources ESS”). The WMC Resources ESS provides a framework for the offer by our board of our shares, or rights to or in respect of WMC Resources shares (such as options), to our employees from time to time. The WMC Resources ESS operates in substantially the same manner as the WMC ESS historically operated by WMC Limited.
Under the WMC Resources ESS, we have offered:
| • | to certain of our senior executives—shares in us under the WMC Resources Executive Share Plan, the terms of which were approved by the WMC Resources board shortly before the demerger; |
| • | to certain employees in Australia—options to acquire our shares, the terms and conditions of which were promulgated by the WMC Resources board at the time of the relevant offers (WMC Resources Option Plan); and |
| • | to certain employees outside Australia—SAP Rights, the terms and conditions of which were promulgated by the WMC Resources board at the time of the relevant offers (WMC Resources SAP). |
The WMC Resources Executive Share Plan, WMC Resources Option Plan and WMC Resources SAP (the “WMC Resources Plans”) have been designed to align the interests of our employees with those of our shareholders and are regarded as an integral component of our employee benefit and motivation strategies.
The total number of our shares, together with the total number of unexercised options over our shares, which may be issued pursuant to all WMC Resources Plans will not exceed 5% of the total number of our shares on issue from time to time.
Subject to the Listing Rules of the ASX, our directors will by resolution be able to revoke, add to, or vary all or any of the provisions of the WMC Resources Plans, or all or any of the rights or obligations of the participants in any of them, provided that the interests of the participants are not, in the opinion of our directors, materially prejudiced.
105
Table of Contents
Impact of Demerger on Plans
In conjunction with the demerger, WMC Limited and WMC Resources Ltd entered into an employee benefits agreement. This agreement covered the treatment of WMC Limited common stock options issued to WMC Limited and WMC Resources employees. According to the agreement, each WMC Limited option granted to WMC Limited and WMC Resources employees prior to December 4, 2002, that was outstanding under the WMC Limited Employee Share Scheme as of the demerger date, was adjusted. This adjustment resulted in each individual who was a holder of a WMC Limited option receiving, immediately after the demerger date, an adjusted WMC Limited option and a WMC Resources option. As part of the demerger from WMC Limited, WMC Limited option holders were granted one option for Alumina Limited and one for WMC Resources Ltd. The aggregate exercise prices of the Alumina Limited option and the WMC Resources Ltd option is equal to the exercise price of the WMC Limited option prior to demerger. The Alumina Limited option and the WMC Resources option have the same lapse date as the WMC Limited option would have had if the demerger had not proceeded—being the earlier of five years after the option was issued and 30 days after the WMC Limited option holder ceases to be employed by WMC Limited Group, WMC Resources Group or Alumina Group. The exercise price of a WMC Resources Ltd option was determined by reference to the pre-demerger exercise price of the WMC Limited option (which became an Alumina option) in respect of which the WMC Resources Ltd option was granted and the volume weighted average price of WMC Resources Ltd shares and Alumina Limited shares sold on the ASX over the first five days of trading on the ASX commencing on the listing date. The Stock Appreciation Plan was treated in the same manner as the Share Scheme as detailed above.
WMC Resources Executive Share Plan
Consistent with WMC Limited’s announcement on August 13, 2002 to suspend future option allotments to its senior management under the WMC employee share scheme, we implemented a share purchase plan for senior staff, known as the WMC Resources Executive Share Plan, which replaced option allotments for this group.
The WMC Resources Executive Share Plan provides a level of reward for senior staff based on our performance against a peer index of resources companies. Actual rewards will vary in accordance with the performance of the individual executive and our performance on a total shareholder return basis against the index.
All rewards for senior staff through this scheme are provided to participants in the form of our shares which will be purchased on-market on behalf of the participants (at no cost to the participants). Participants are not able to dispose of the shares acquired under the plan unless both prior to and after such a disposal, the participant holds shares whose value reflects a multiple of their salary (subject to certain other disposal restrictions). For the chief executive officer the multiple is 1.5 times salary, for executive general managers the multiple is 1.0 times salary and for general managers the multiple is 0.5 times salary.
Under the WMC Resources Executive Share Plan, the full value of any reward gained by senior management will be expensed and the value to the executive disclosed in accordance with our reporting obligations and practice on remuneration of executive staff.
The first acquisitions of our shares under the WMC Resource Executive Share Plan were made on December 23, 2002. In total, 1,158,303 shares were acquired for 27 senior staff, with an average acquisition price of $A4.33 per share.
WMC Resources Option Plan
In December 2002, we made our first offer of WMC Resources Options to employees, other than our senior management, under the 2002 WMC Resources Option Plan. We made the first allotment of WMC Resources Options on December 23, 2002, and in a manner consistent with the past WMC Limited Option allotments. The
106
Table of Contents
2002 WMC Resources Option Plan operates on substantially the same terms as the WMC Limited Option Plans, namely:
| • | Eligible employees were invited to apply for the grant by us of WMC Resources Options, granted at an issue price of A$0.01 per WMC Resources Option. |
| • | Each WMC Resources Option gives the holder the right to subscribe for one WMC Resources Share (subject to adjustment in accordance with the terms of the applicable WMC Resources Option Plan to reflect new issues by WMC Resources and capital reconstructions). |
| • | Subject to certain exceptions, the WMC Resources Options are not able to be exercised until after a period of 12 months from the date of allotment and will lapse on the fifth anniversary of the date of allotment. |
| • | Upon exercise of a WMC Resources Option, the holder will be obliged to pay the relevant exercise price, which was determined by reference to the weighted average sale price of our shares on the ASX on the trading day that the invitation to apply for the WMC Resources Options was made to employees. |
The allotment of WMC Resources Options under the 2002 WMC Resources Option Plan was made on December 23, 2002 and January 13, 2003 under which 10,951,860 and 322,800 WMC Resources Options were issued, respectively, with an exercise price of A$4.34 and an expiry date of December 22, 2007.
WMC Resources Stock Appreciation Plan
In December 2002, we made our first offer of WMC Resources SAP Rights to our employees located outside Australia under the 2002 WMC Resources SAP. We made the first allotment of WMC Resources SAP Rights on December 23, 2002, and in a manner consistent with the past WMC Limited SAP Right allotments. The 2002 WMC Resources SAP operates on substantially the same terms as the WMC Limited SAPs, namely:
| • | Eligible employees were invited to apply for the grant by us of WMC Resources SAP Rights. |
| • | The employees were not required to pay any amount for the grant of the WMC Resources SAP Rights, but each WMC Resources SAP Right has a notional allotment exercise price, equal to the weighted average sale price of our shares on the ASX on the trading day that the invitation to apply for the WMC Resources SAP Rights was made to the employee. |
| • | Subject to certain exceptions, the WMC Resources SAP Right will not be able to be redeemed until after a period of 12 months from the date of allotment and will lapse on the fifth anniversary of the date of allotment. |
| • | Upon redemption of a WMC Resources SAP Rights before its expiry by the holder, the holder will be entitled to a payment equal to the difference between the closing price of our shares on the ASX on the trading day immediately before redemption, and the notional allotment price (assuming the former amount is higher). |
The allotment of WMC Resources SAP Rights under the 2002 WMC Resources SAP was made on December 23, 2002 under which 261,400 WMC Resources SAP Rights were issued, with an allotment price of A$4.34 and an expiry date of December 22, 2007.
107
Table of Contents
Our issued capital is currently constituted by one class of registrable voting securities being ordinary shares.
As at May 31, 2003, we had on issue 1,129,219,547 fully paid ordinary shares, and 31,304,720 options over our ordinary shares. The share options were issued pursuant to the WMC Resources Employee Scheme and carry no voting rights.
The following table sets forth, as at May 31, 2002, information in respect of:
| (a) | any person who is known to us to be the registered owner of more than 5% of any class of our voting securities; and |
| (b) | the total amount of any class of its voting securities owned by our directors and executive general managers as a group. |
Title of class | Identity of person or group | Amount owned | % of | |||
Fully paid ordinary shares in WMC Resources Ltd | J.P. Morgan Nominees Australia Ltd | 224,051,345 | 19.84 | |||
National Nominees Ltd | 214,355,520 | 18.98 | ||||
Westpac Custodian Nominees Ltd | 158,931,697 | 14.07 | ||||
Fully paid ordinary shares(1) | Directors and Executive General Managers of WMC Resources Ltd as a group | 551,178 | 0.05 | |||
Employee Share Options | Directors and Executive General Managers of WMC Resources Ltd as a group | 1,012,000 | 3.23 |
| (1) | Includes WMC Resources Ltd’s ADSs. |
The nominee companies listed in the previous table hold these fully paid ordinary shares on behalf of numerous beneficial owners. The only beneficial owner known to have owned more than 5% of our issued and outstanding fully paid ordinary shares since listing on December 4, 2002, is the Capital Group International Inc. The history of significant changes since listing date is outlined below:
Beneficial Owner | Date | Number of | % | |||
Capital Group International Inc. | 04/16/2003 | 151,566,621 | 13.43 | |||
02/17/2003 | 139,717,091 | 12.38 | ||||
12/19/2002 | 126,179,432 | 11.34 |
All fully paid shares have the same voting rights.
There are no arrangements, known to us, the operation of which may at a subsequent date result in a change in control of us.
As at May 31, 2003, 497,270 of our fully paid ordinary shares were registered in the name of 307 residents of the United States and represented approximately 0.04% of the total number of our fully paid ordinary shares issued and outstanding. As at April 30, 2003, 1,493,817 of our ADSs were outstanding (representing 5,975,268 of our fully paid ordinary shares) and were registered in the name of 348 residents of the United States and represented approximately 0.54% of the total number of our fully paid ordinary shares issued and outstanding.
108
Table of Contents
Loans to directors
On January 1, 2000, directors of our controlled entities had outstanding secured loan balances of A$6,700 under the Employee Share Purchase Plan and the Senior Staff Share Issue. During the 2000 fiscal year, there were no additional loans made to directors and an amount of A$800 was repaid, resulting in a final outstanding balance of A$5,900.
During the 2001 fiscal year, there were no additional loans made to directors and an amount of A$1,000 was repaid, resulting in a final outstanding balance of A$4,900.
During the year ended December 31, 2002, a loan of A$93,050 was advanced to Jens Balkau, a director of one of our controlled entities. All outstanding loans (A$93,375) were repaid or forgiven (A$3,643) during the year, resulting in no outstanding loans to WMC Resources Ltd directors at December 31, 2002.
All of the loans to directors referred to above were made prior to the demerger in connection with the Employee Share Purchase Plan, the Partly Paid Share Plan and the Senior Staff Share Issue to enable them to acquire shares of WMC Limited. The share plan loans existing during 2002 were secured by shares allocated by WMC Limited under the 1988 allotment of the Employee Share Purchase Plan, the 1987 and 1988 Partly Paid Share Plan and the 1994 allotment of the Senior Staff Share Issue. The loans were interest free with repayments due in December 2002 and November 2003, although these were all repaid prior to the demerger.
Shareholding transactions of directors
Our directors are also shareholders of ours and, as such, they may purchase and/or sell our shares.
Where our directors have engaged in these transactions they have done so on a normal commercial basis, on conditions no more favorable than those available to other shareholders.
Some of our directors who were employees of the WMC Limited group prior to the demerger, were eligible to participate in the WMC Employee Share Scheme, and were issued with options, priced at market value. These transactions were conducted on a commercial basis on conditions no more beneficial than those available to other eligible employees. At the time of demerger, these options were converted into WMC Resources options (see the section entitled “Share Ownership”). As this is our first year of listing, comparatives for WMC Limited prior to the demerger, have been provided.
109
Table of Contents
Number of | Number of | |||||
Year Ended December | ||||||
Year Ended | 2001 | 2000 | ||||
The aggregate number of shares acquired by the directors of the parent entity or their director related entities as a result of the WMC Limited demerger was: | 808,407 | — | — | |||
The aggregate number of shares acquired by directors of the parent entity or their director related entities through purchase was: | 138,640 | 10,000 | 130,000 | |||
The aggregate number of options acquired by directors of the parent entity or their director related entities through participation in the WMC Employee Share Scheme was: | — | — | 320,000 | |||
The aggregate number of options allocated to directors of the parent entity or their director-related entities as a result of the WMC Limited demerger was: | 1,725,000 | N/A | N/A | |||
The aggregate number of shares and options disposed of by directors of the parent entity or their director related entities was: | ||||||
—fully paid shares | — | 11,000 | — | |||
—partly paid shares | N/A | — | 100,000 | |||
—options (lapsed) | — | — | 300,000 | |||
—options (options exercised and sold) | 300,000 | 300,000 | — | |||
Details of shares and share options held by directors of the parent entity or their director related entities at period end are as follows: | ||||||
—fully paid shares(1) | 946,957 | 434,459 | 435,459 | |||
—ordinary shares partly paid to five cents | — | 331,000 | 331,000 | |||
—options for ordinary shares(1) | 1,425,000 | 1,470,000 | 1,770,000 | |||
—Central Norseman Gold Corporation Limited, fully paid shares | N/A | 2,000 | 2,000 | |||
| (1) | At May 31, 2003 directors of the parent entity or their director related entities held 551,178 fully paid shares and 1,012,000 options for ordinary shares. |
All other transactions relating to shares and options of WMC Limited prior to the demerger, including the payment and receipt of dividends, were on the same basis as similar transactions with other shareholders.
Other transactions of directors and director related entities
A number of our directors are also directors of other public companies which may have transactions with us. These directors do not believe that they have the capacity to control or significantly influence the financial or operating policies of either of those companies or us in their dealings with one another. We therefore do not consider those companies to be director related entities.
During the year ended December 31, 2002, Hugh M. Morgan received a payment of A$890,906 from a related party to WMC Limited, Alcoa Inc., relating to his participation in the Alcoa Inc. Directors’ Deferred Fee Plan. The benefit became payable following his retirement as a director of that entity.
Legal/Financial service fees
A number of directors of our controlled entities are associated with legal and financial service firms which have provided services to us during the financial year, on an arm’s length basis. The total of those services
110
Table of Contents
amounts to A$1,511,590 for the year ended December 31, 2002. For the years ended December 31, 2001 and 2000, the amounts were: A$916,259 and A$684,733, respectively. The legal and financial services firms referred to above which provided services to us in the fiscal year ended December 31, 2002 were: Sycip Salazar Hernandez & Gatmaitan, Sampson & West, Trident Trust Company, Welborn Sullivan Meck & Tooley P.C., Stikeman Elliott (Toronto), Larrain Y Associates, Trust International Management (T.I.M.) BV., Freehills Solicitors and Brian Weihs.
Other transactions
Hughmore Securities Pty Ltd, an entity associated with Hugh M. Morgan, our chief executive officer until December 31, 2002, purchased fertilizer totaling A$14,199 for the year ended December 31, 2002. For the years ended December 31, 2001 and 2000, the amounts were: A$14,325 and A$16,898, respectively. All of the purchases were made on an arm’s length basis from an entity we control.
Interests of Experts and Counsel
Not applicable.
111
Table of Contents
DESCRIPTION OF OUR CONSTITUTION
Our corporate organization and conduct is governed by our constitution (the “Constitution”). Set forth below is a summary of the provisions of the principal terms of the Constitution.
Company Objects and Purposes
We are taken to be registered as a public company limited by shares under the Corporations Act 2001 of the Commonwealth of Australia (the “Corporations Act”) and are registered with Australian Business Number 76 004 184 598.
The Constitution was adopted on October 17, 2002. The Constitution does not specify our objects and purposes. Rather, under section 124 of the Corporations Act, we have the legal capacity and powers of an individual person.
Directors’ Powers and Qualifications
| (a) | No director is permitted to vote or be counted in the quorum as a director in respect of any contract or arrangement in which the director has a personal material interest. Subject to the Corporations Act, this prohibition can be relaxed or suspended by an ordinary resolution passed in general meeting (rule 85(b)). |
| (b) | Directors’ remuneration is to be determined by them from time to time and in such proportions and manner as they determine, provided that the aggregate remuneration paid to directors in any year must not exceed the amount approved in general meeting (rule 82). |
| (c) | In addition, every director is entitled to be paid all reasonable traveling, accommodation and other expenses incurred in attending board meetings and if any director is called upon to perform extra services or provide special professional skill for any purpose of ours, the director may be paid traveling outlays and such additional sum by way of remuneration fixed by the directors (rule 83). |
| (d) | Directors may, from time to time, at their discretion raise or borrow any sum or sums of money for our purposes with or without security (rule 47). |
| (e) | The Constitution does not contain any age limit requirement on the retirement of directors. The Corporations Act (section 201C) prescribes age limit requirements, which require directors to retire at the next annual general meeting after reaching the age of 72. |
| (f) | A director does not need to own shares in us as a qualification for office (rule 80). |
| (g) | At each annual general meeting one-third of the directors (or the nearest number to one-third) retire from the office and are subject to re-election. In any event, a director, other than the managing director, shall retire from office at the conclusion of the third annual general meeting after the general meeting at which he or she was elected or re-elected. |
Rights and Restrictions Attaching to Each Class of Shares
| (a) | We have only one class of shares, the ordinary class. The rights attached to ordinary shares include the right to dividends in the event that the directors declare them. Directors may determine that a dividend is payable, fix the amount, the date at which the entitlement accrues, date for payment and the method of payment. |
| (b) | Dividends, which have not been claimed for one year after having been declared, may be invested or otherwise made use of by the directors for our benefit until claimed or disposed of according to law (rule 125). |
| (c) | The voting right attached to ordinary shares is the right to vote in person, by representative, attorney or proxy in general meeting. |
112
Table of Contents
| (d) | On a show of hands each shareholder (regardless of the number of shares held) has one vote. On a poll each shareholder may exercise one vote for each fully paid ordinary share held. In respect of partly paid shares, the shareholder has a vote equivalent to the proportion which the amount paid up bears to the total issue price of the share at the date the poll is taken. |
| (e) | For the purposes of determining voting entitlements at a general meeting, shares will be taken to be held by those persons recorded in the register of members at the time and date determined by the directors under Corporations Regulations 7.11.37 and 7.11.38. |
| (f) | Dividends are only payable out of our profits (rule 114). |
| (g) | In the event of a winding up, ordinary shares rank equally in the division of any surplus. |
| (h) | Shareholders cannot redeem ordinary shares. |
| (i) | The holders of fully paid ordinary shares have no further liability to us in respect of those shares. The holders of partly paid shares are liable to us once a call is made for the payment of the unpaid amount. |
| (j) | There is no provision in the Constitution which discriminates against an existing or prospective shareholder as a result of that shareholder owning a substantial number of shares unless such ownership leads to a partial takeover offer (see heading “Partial Takeover Approval” below). |
| (k) | To vary or cancel the rights attached to ordinary shares, a special resolution approving the variation or cancellation must be passed at a special meeting of the holders of ordinary shares, or by consent in writing signed by the holders of at least three-fourths of the issued ordinary shares within two calendar months from the date of such special meeting (rule 11). |
General Meetings of WMC Resources
The Board may convene our general meetings to be held at such times and places and in the manner determined by the Board (rule 52). No shareholder or director may convene a general meeting unless entitled to do so under the Corporations Act.
Subject to the Corporations Act and the ASX Listing Rules, notices of general meetings convened by the Board may be given in the form and in the manner determined by the Board (rule 54).
At least 28 days’ notice must be given of a general meeting (section 249HA of the Corporations Act).
All shareholders may attend general meetings in person, or be represented by the attendance of a representative, attorney or by proxy (who need not be shareholders of ours in their own right).
The quorum for a general meeting is three members present in person, by proxy or attorney or by representative (rule 57). If within 15 minutes of the time appointed for holding the meeting a quorum is not present, the meeting, if convened by requisition, is dissolved, but in all other cases stands adjourned to the same day in the next week at the same time and place (rule 58). If at the adjourned meeting a quorum is not present within 15 minutes from the time appointed for holding the meeting, the meeting is dissolved.
Limitations on the Right to Own Securities
Our Constitution does not impose limitations on the right to own securities except those provisions relating to minimum holdings (known as an Unmarketable Parcel, as described below).
Unmarketable Parcel Rationalization Scheme
The Constitution contains a scheme whereby we can sell the shares of members who hold a parcel of our shares of less than A$500 value (an “Unmarketable Parcel”). The scheme sets out notice requirements that we must comply with prior to selling any shares and also includes the right of members (who hold an Unmarketable Parcel) to exempt their holdings from the scheme. The scheme can only be invoked once in any 12-month period with respect to any particular member.
113
Table of Contents
Other Takeover Limitations
The rights of non-resident or foreign shareholders to hold or exercise voting rights on our securities are subject to the Foreign Acquisitions and Takeovers Act 1975 (Cth). The Treasurer of the Australian Federal Government has the power to prohibit the acquisition of a controlling interest in any Australian company by a foreign person or foreign persons, if the Treasurer is of the opinion that the acquisition would be contrary to the national interest. For this purpose, a shareholding of 15% or more held by a single foreign person or 40% or more held by two or more foreign persons is deemed to constitute a controlling interest.
Section 50 of the Trade Practices Act 1974 (Cth) prohibits an acquisition of shares that would have the effect, or be likely to have the effect, of substantially lessening competition in a substantial market for goods or services, unless the acquisition is authorized by the Australian Competition and Consumer Commission.
Partial Takeover Approval
In the event that there is an offer made under a “proportional takeover bid” (within the meaning given to that expression by Chapter 6 of the Corporations Act) to acquire our shares, the registration of a transfer giving effect to a contract resulting from the acceptance of the bid, is prohibited unless and until a resolution to approve the proportional takeover bid is passed in accordance with rule 139 of our Constitution. This resolution is to be voted on at a meeting convened and conducted by us, of the persons entitled to vote on the resolution. The resolution is taken to have been passed if the proportion that the number of votes in favor of the resolution bears to the total number of votes on the resolution is greater than one-half. The provisions with respect to Partial Takeover Approval (rule 139) cease to have effect on the third anniversary of the date of their adoption or last renewal.
Disclosure of Share Ownership
The Constitution does not prescribe an ownership threshold above which shareholders must disclose their holding to us. However, Part 6C.1 of the Corporations Act imposes disclosure requirements on persons who acquire or cease to hold a substantial holding (see section 9 of the Corporations Act) in us. The disclosure must be given to us and the ASX within the prescribed time.
Changes in Share Capital
We may by resolution passed in general meeting from time to time alter our share capital in one or more of the ways provided for, and in the manner prescribed by, the Corporations Act (rule 44).
Subject to the Constitution, we may reduce our share capital (rule 46) or buy back shares (rule 141) in accordance with the Corporations Act.
114
Table of Contents
This section describes the exchange offers and the relevant provisions of the registration rights agreement, but it may not contain all of the information that is important to you. We refer you to the complete provisions of the registration rights agreement, which has been filed as an exhibit to the registration statement on Form F-4. See “Where You Can Find More Information” for instructions to obtain copies of these documents.
In this section and the section entitled “Description of the New Notes and Guarantees,” “references to “we”, “us” and “our” refer to the issuer and guarantors only.
Purpose and Effect of the Exchange Offers
In connection with the sale of the Old Notes, we entered into a registration rights agreement with the initial purchasers of the Old Notes, by which we agreed to file and to use our reasonable best efforts to cause to be declared effective by the SEC a registration statement with respect to the exchange of the Old Notes for the New Notes. We are making the exchange offers to fulfill our contractual obligations under that agreement. A copy of the registration rights agreement has been filed as an exhibit to the registration statement of which this prospectus is a part.
Pursuant to the exchange offers, we will issue the New Notes in exchange for Old Notes. The terms of the New Notes are identical in all material respects to those of the Old Notes, except that the New Notes (1) have been registered under the Securities Act and therefore will not be subject to certain restrictions on transfer applicable to the Old Notes and (2) will not have registration rights or provide for any increase in the interest rate related to the obligation to register. See “Description of the New Notes and Guarantees” and “Description of the Old Notes” for more information on the terms of the respective Notes and the differences between them.
We are not making the exchange offers to, and will not accept tenders for exchange from, holders of Old Notes in any jurisdiction in which an exchange offer or the acceptance thereof would not be in compliance with the securities or blue sky laws of such jurisdiction. Unless the context requires otherwise, the term “holder” of a series with respect to an exchange offer means any person in whose name the Old Notes of such series are registered on our books or any other person who has obtained a properly completed bond power from the registered holder, or any person whose Old Notes are held of record by DTC who desires to deliver such Old Notes by book-entry transfer at DTC.
We make no recommendation to the holders of Old Notes as to whether to tender or refrain from tendering all or any portion of their Old Notes pursuant to the exchange offers. In addition, no one has been authorized to make any such recommendation. Holders of Old Notes must make their own decision whether to tender pursuant to the exchange offers and, if so, the aggregate amount of Old Notes to tender after reading this prospectus and the letter of transmittal and consulting with their advisers, if any, based on their own financial position and requirements.
Terms of the Exchange
Upon the terms and conditions described in this prospectus and in the accompanying letter of transmittal, which together constitute the exchange offers, we will accept for exchange Old Notes of a series which are properly tendered at or before the expiration time for such series and not withdrawn as permitted below. As of the date of this prospectus, US$500,000,000 principal amount of 5.125% Guaranteed Notes due 2013 and US$200,000,000 principal amount of 6.250% Guaranteed Notes due 2033 are outstanding. This prospectus, together with the letter of transmittal, is first being sent on or about the date on the cover page of this prospectus to all holders of Old Notes known to us. Old notes tendered in the exchange offers must be in minimum denominations of US$1,000 and any integral multiple of US$1,000.
115
Table of Contents
Solely for reasons of administration, we have fixed the close of business on June 6, 2003 as the record date for the exchange offer for purposes of determining the persons to whom this prospectus and the letter of transmittal will be mailed initially. There will be no fixed record date for determining holders of the Old Notes entitled to participate in this exchange offer.
Our acceptance of the tender of Old Notes by a tendering holder will form a binding agreement between the tendering holder and us upon the terms and subject to the conditions provided in this prospectus and in the accompanying letter of transmittal.
Holders who tender Old Notes in the exchange offer will not be required to pay brokerage commissions or fees or, subject to the instructions in the letter of transmittal, transfer taxes with respect to the exchange of Old Notes in the exchange offer. We will pay all charges and expenses, other than certain applicable taxes, in connection with the exchange offer, as described under “—Fees and Expenses”.
Application has been made to have the New Notes listed on the Luxembourg Stock Exchange. In connection with the exchange offer:
| • | we will give notice to the Luxembourg newspaper, which is expected to be theLuxemburger Wort, the announcement of the beginning of the exchange offer and, following completion of such offer, the results of such offer, |
| • | we will appoint a Luxembourg exchange agent through which all relevant documents with respect to the exchange offer will be made available, and |
| • | the Luxembourg exchange agent will be able to perform all agency functions to be performed by any exchange agent, including providing a letter of transmittal and other relevant documents to you, accepting such documents on our behalf, accepting definitive Old Notes for exchange, and delivering New Notes to holders entitled hereto. |
Expiration, Extension and Amendment
The expiration time of the exchange offers is 5:00 P.M., New York City time, on August 8, 2003. However, we may, in our sole discretion, extend the period of time for which any of the exchange offers is open and set a later expiration date for such offer. The term “expiration time” as used in this prospectus means the latest time and date to which we extend the exchange offer with respect to a series. If we decide to extend the exchange offer period with respect to a series, we will then delay acceptance of any Old Notes by giving oral or written notice of an extension to the holders of Old Notes of such series as described below. During any extension period, all Old Notes previously tendered will remain subject to such exchange offer and may be accepted for exchange by us. Any Old Notes not accepted for exchange will be returned to the tendering holder after the expiration or termination of the exchange offer for that series.
Our obligation to accept Old Notes of a series for exchange in the exchange offer relating to such series is subject to the conditions described below under “—Conditions to the Exchange Offers.” We may decide to waive any of the conditions in our discretion. Furthermore, we reserve the right to amend or terminate any of the exchange offers, and to reject for exchange any Old Notes not previously accepted for exchange, upon the occurrence of any of the conditions of such exchange offer specified below under the same heading. We will give oral or written notice of any extension, amendment, non-acceptance or termination to the holders of the Old Notes as promptly as practicable. If we materially change the terms of an exchange offer, we will resolicit tenders of the Old Notes of the series to which such exchange offer applies, file a post-effective amendment to the Form F-4 registration statement and this prospectus and provide notice to you. If the change is made less than five business days before the expiration of an exchange offer, we will extend the offer so affected so that the holders have at least five business days to tender or withdraw. We will notify you of any extension by means of a press release or other public announcement no later than 9:00 A.M., New York City time, on the first business day after the previously scheduled expiration time for a series.
116
Table of Contents
Neither the indenture governing the Old Notes and the New Notes, as supplemented by the first supplemental indenture, nor the Corporations Law of Australia provide you with any appraisal or dissenters’ rights or any other right to seek monetary damages in court as a result of the exchange offer. We intend to conduct the exchange offer in accordance with the registration rights agreement and the applicable requirements of the Securities Exchange Act of 1934 and the rules and regulations of the Securities and Exchange Commission related to these offers.
Procedures for Tendering
Valid Tender
Except as described below, a tendering holder must, prior to the expiration time with respect to a series, transmit to The Bank of New York, the exchange agent, at the address listed under the heading “—Exchange Agent”:
| • | a properly completed and duly executed letter of transmittal, including all other documents required by the letter of transmittal; or |
| • | if Old Notes are tendered in accordance with the book-entry procedures listed below, an agent’s message. |
In addition, you must:
| • | deliver certificates, if any, for the Old Notes of a series to the exchange agent at or before the expiration time for that series; or |
| • | deliver a timely confirmation of book-entry transfer of the Old Notes into the exchange agent’s account at DTC, the book-entry transfer facility, along with the letter of transmittal or an agent’s message; or |
| • | comply with the guaranteed delivery procedures described below. |
The term “agent’s message” means a message, transmitted by DTC to and received by the exchange agent and forming a part of a book-entry confirmation, that states that DTC has received an express acknowledgment that the tendering holder agrees to be bound by the letter of transmittal and that we may enforce the letter of transmittal against this holder.
If the letter of transmittal is signed by a person other than the registered holder of Old Notes, the letter of transmittal must be accompanied by a written instrument of transfer or exchange in satisfactory form duly executed by the registered holder with the signature guaranteed by an eligible institution. The Old Notes must be endorsed or accompanied by appropriate powers of attorney. In either case, the Old Notes must be signed exactly as the name of any registered holder appears on the Old Notes.
If the letter of transmittal or any Old Notes or powers of attorney are signed by trustees, executors, administrators, guardians, attorneys-in-fact, officers of corporations or others acting in a fiduciary or representative capacity, these persons should so indicate when signing. Unless waived by us, proper evidence satisfactory to us of their authority to so act must be submitted.
By tendering, each holder will represent to us that, among other things, the New Notes are being acquired in the ordinary course of business of the person receiving the New Notes, whether or not that person is the holder and neither the holder nor the other person has any arrangement or understanding with any person to participate in the distribution of the New Notes. In the case of a holder that is not a broker-dealer, that holder, by tendering, will also represent to us that the holder is not engaged in and does not intend to engage in a distribution of the New Notes.
117
Table of Contents
The method of delivery of Old Notes, letters of transmittal and all other required documents is at your election and risk. If the delivery is by mail, we recommend that you use registered mail, properly insured, with return receipt requested. In all cases, you should allow sufficient time to assure timely delivery. You should not send letters of transmittal or Old Notes to us.
If you are a beneficial owner whose Old Notes are registered in the name of a broker, dealer, commercial bank, trust company or other nominee, and wish to tender, you should promptly instruct the registered holder to tender on your behalf. Any registered holder that is a participant in DTC’s book-entry transfer facility system may make book-entry delivery of the Old Notes by causing DTC to transfer the Old Notes into the exchange agent’s account.
Signature Guarantees
Signatures on a letter of transmittal or a notice of withdrawal must be guaranteed, unless the Old Notes surrendered for exchange are tendered:
| • | by a registered holder of the Old Notes who has not completed the box entitled “Special Issuance Instructions” or “Special Delivery Instructions” on the letter of transmittal, or |
| • | for the account of an “eligible institution.” |
If signatures on a letter of transmittal or a notice of withdrawal are required to be guaranteed, the guarantees must be by an “eligible institution.” An “eligible institution” is an “eligible guarantor institution” meeting the requirements of the registrar for the notes, which requirements include membership or participation in the Security Transfer Agent Medallion Program, or STAMP, or such other “signature guarantee program” as may be determined by the registrar for the notes in addition to, or in substitution for, STAMP, all in accordance with the Securities Exchange Act of 1934, as amended.
Book-Entry Transfer
The exchange agent will make a request to establish an account for each series of Old Notes at DTC for purposes of the exchange offers within two business days after the date of this prospectus. Any financial institution that is a participant in DTC’s systems must make book-entry delivery of Old Notes by causing DTC to transfer those Old Notes into the exchange agent’s account at DTC in accordance with DTC’s procedure for transfer. The participant should transmit its acceptance to DTC at or prior to the expiration time for the series of notes being tendered or comply with the guaranteed delivery procedures described below. DTC will verify this acceptance, execute a book-entry transfer of the tendered Old Notes into the exchange agent’s account at DTC and then send to the exchange agent confirmation of this book-entry transfer. The confirmation of this book-entry transfer will include an agent’s message confirming that DTC has received an express acknowledgment from this participant that this participant has received and agrees to be bound by the letter of transmittal and that we may enforce the letter of transmittal against this participant.
Delivery of New Notes issued in the exchange offers may be effected through book-entry transfer at DTC. However, the letter of transmittal or facsimile of it or an agent’s message, with any required signature guarantees and any other required documents, must:
| • | be transmitted to and received by the exchange agent at the address listed under “—Exchange Agent” at or prior to the expiration time relating to a series; or |
| • | comply with the guaranteed delivery procedures described below. |
Delivery of documents to DTC in accordance with DTC’s procedures does not constitute delivery to the exchange agent.
118
Table of Contents
Guaranteed Delivery
If a registered holder of Old Notes desires to tender the Old Notes, and the Old Notes are not immediately available, or time will not permit the holder’s Old Notes or other required documents to reach the exchange agent before the expiration time for a series, or the procedure for book-entry transfer described above cannot be completed on a timely basis, a tender may nonetheless be made if:
| • | the tender is made through an eligible institution; |
| • | prior to the expiration time for such series, the exchange agent received from an eligible institution a properly completed and duly executed notice of guaranteed delivery, substantially in the form provided by us, by facsimile transmission, mail or hand delivery: |
| • | stating the name and address of the holder of Old Notes and the amount of Old Notes tendered, |
| • | stating that the tender is being made, and |
| • | guaranteeing that within three businesses days after the expiration time for such series, the certificates for all physically tendered Old Notes, in proper form for transfer, or a book-entry confirmation, as the case may be, and a properly completed and duly executed letter of transmittal, or an agent’s message, and any other documents required by the letter of transmittal will be deposited by the eligible institution with the exchange agent; and |
| • | the certificates for all physically tendered Old Notes, in proper form for transfer, or a book-entry confirmation, as the case may be, and a properly completed and duly executed letter of transmittal, or an agent’s message, and all other documents required by the letter of transmittal, are received by the exchange agent within three business days after the expiration time for such series. |
Determination of Validity
We will determine in our sole discretion all questions as to the validity, form and eligibility of Old Notes tendered for exchange. This discretion extends to the determination of all questions concerning the timing of receipts and acceptance of tenders. These determinations will be final and binding. We reserve the right to reject any particular Old Note not properly tendered or of which our acceptance might, in our judgment or our counsel’s judgment, be unlawful. We also reserve the right to waive any defects or irregularities or conditions of the exchange offers as to any particular Old Note either before or after the applicable expiration time, including the right to waive the ineligibility of any tendering holder. Our interpretation of the terms and conditions of the exchange offers as to any particular Old Note either before or after the applicable expiration time, including the letter of transmittal and the instructions to the letter of transmittal, shall be final and binding on all parties. Unless waived, any defects or irregularities in connection with tenders of Old Notes must be cured within a reasonable period of time.
Neither we, the exchange agent nor any other person will be under any duty to give notification of any defect or irregularity in any tender of Old Notes. Moreover, neither we, the exchange agent nor any other person will incur any liability for failing to give notification of any defect or irregularity.
Acceptance of Old Notes for Exchange; Issuance of New Notes
Upon the terms and subject to the conditions of the exchange offer relating to a series of Notes, we will accept, promptly after the expiration time for such series, all Old Notes of such series properly tendered. We will issue the New Notes promptly after acceptance of the Old Notes. For purposes of an exchange offer, we will be deemed to have accepted properly tendered Old Notes for exchange when, as and if we have given oral or written notice to the exchange agent, with prompt written confirmation of any oral notice.
119
Table of Contents
In all cases, issuance of New Notes for Old Notes will be made only after timely receipt by the exchange agent of:
| • | certificates for the Old Notes, or a timely book-entry confirmation of the Old Notes, into the exchange agent’s account at the book-entry transfer facility; |
| • | a properly completed and duly executed letter of transmittal or an agent’s message; and |
| • | all other required documents. |
Unaccepted or non-exchanged Old Notes will be returned without expense to the tendering holder of the Old Notes. In the case of Old Notes tendered by book-entry transfer in accordance with the book-entry procedures described above, the non-exchanged Old Notes will be credited to an account maintained with DTC as promptly as practicable after the expiration or termination of the applicable exchange offer. For each Old Note accepted for exchange, the holder of the Old Note will receive a New Note having a principal amount equal to that of the surrendered Old Note.
Interest Payments on the New Notes
The New Notes will bear interest from the most recent date to which interest has been paid on the Old Notes for which they were exchanged. Accordingly, registered holders of New Notes on the relevant record date for the first interest payment date following the completion of the exchange offers will receive interest accruing from the most recent date to which interest has been paid for that series. Old Notes accepted for exchange will cease to accrue interest from and after the date of completion of such exchange offer. Holders of Old Notes whose Old Notes are accepted for exchange will not receive any payment for accrued interest on the Old Notes otherwise payable on any interest payment date the record date for which occurs on or after completion of the applicable exchange offer and will be deemed to have waived their rights to receive the accrued interest on the Old Notes.
Withdrawal Rights
Tenders of Old Notes of a series may be withdrawn at any time before the expiration time with respect to that series.
For a withdrawal to be effective with respect to Old Notes of a series, the exchange agent must receive a written notice of withdrawal at the address or, in the case of eligible institutions, at the facsimile number, indicated under “—Exchange Agent” before the expiration time with respect to that series. Any notice of withdrawal must:
| • | specify the name of the person, referred to as the depositor, having tendered the Old Notes to be withdrawn; |
| • | identify the Old Notes to be withdrawn, including the name of the series and certificate number or numbers and principal amount of the Old Notes; |
| • | contain a statement that the holder is withdrawing its election to have the Old Notes exchanged; |
| • | be signed by the holder in the same manner as the original signature on the letter of transmittal by which the Old Notes were tendered, including any required signature guarantees, or be accompanied by documents of transfer to have the trustee with respect to the Old Notes register the transfer of the Old Notes in the name of the person withdrawing the tender; and |
| • | specify the name in which the Old Notes are registered, if different from that of the depositor. |
If certificates for Old Notes have been delivered or otherwise identified to the exchange agent, then, prior to the release of these certificates the withdrawing holder must also submit the serial numbers of the particular certificates to be withdrawn and signed notice of withdrawal with signatures guaranteed by an eligible institution,
120
Table of Contents
unless this holder is an eligible institution. If Old Notes have been tendered in accordance with the procedure for book-entry transfer described above, any notice of withdrawal must specify the name and number of the account at the book-entry transfer facility to be credited with the withdrawn Old Notes.
Any Old Notes properly withdrawn will be deemed not to have been validly tendered for exchange. New Notes will not be issued in exchange unless the Old Notes so withdrawn are validly re-tendered. Properly withdrawn Old Notes of a series may be re-tendered by following the procedures described under “—Procedures for Tendering” above at any time at or before the expiration time with respect to that series.
We will determine all questions as to the validity, form and eligibility, including time of receipt, of notices of withdrawal.
Conditions to the Exchange Offers
Notwithstanding any other provisions of the exchange offers, or any extension of any exchange offer, we will not be required to accept for exchange, or to exchange, any Old Notes for any New Notes, and, as described below, may terminate an exchange offer with respect to any series, whether or not any Old Notes have been accepted for exchange, or may waive any conditions to or amend the exchange offer, if any of the following conditions has occurred or exists:
| • | there shall occur a change in the current interpretation by the staff of the SEC which permits the New Notes issued pursuant to such exchange offer in exchange for Old Notes to be offered for resale, resold and otherwise transferred by the holders (other than broker-dealers and any holder which is an affiliate) without compliance with the registration and prospectus delivery provisions of the Securities Act, provided that such New Notes are acquired in the ordinary course of such holders’ business and such holders have no arrangement or understanding with any person to participate in the distribution of the New Notes; |
| • | any action or proceeding shall have been instituted or threatened in any court or by or before any governmental agency or body with respect to the exchange offer which, in our judgment, would reasonably be expected to impair our ability to proceed with such exchange offer; |
| • | any law, statute, rule or regulation shall have been adopted or enacted which, in our judgment, would reasonably be expected to impair our ability to proceed with such exchange offer; or |
| • | a stop order shall have been issued by the SEC or any state securities authority suspending the effectiveness of the registration statement of which this prospectus is a part or proceedings shall have been initiated or, to our knowledge, threatened for that purpose or any governmental approval has not been obtained, which approval we shall, in our sole discretion, deem necessary for the consummation of such exchange offer; |
If we determine in our judgment that any of the conditions are not satisfied, we may:
| • | refuse to accept any Old Notes and return all tendered Old Notes to the tendering holders; |
| • | extend the exchange offer and retain all Old Notes tendered before the expiration of the exchange offer, subject, however, to the rights of holders to withdraw these Old Notes; or |
| • | waive unsatisfied conditions with respect to the exchange offer and accept all properly tendered Old Notes that have not been withdrawn. If this waiver constitutes a material change to the exchange offer, we will disclose this by means of a prospectus supplement that will be distributed to the registered holders. |
Resales of New Notes
Based on interpretations by the staff of the SEC, as described in no-action letters issued to third parties, we believe that New Notes issued in the exchange offers in exchange for Old Notes may be offered for resale, resold
121
Table of Contents
or otherwise transferred by holders of the Old Notes without compliance with the registration and prospectus delivery provisions of the Securities Act, if:
| • | the New Notes are acquired in the ordinary course of the holders’ business; |
| • | the holders have no arrangement or understanding with any person to participate in the distribution of the New Notes; and |
| • | the holders are not “affiliates” of ours within the meaning of Rule 405 under the Securities Act. |
However, the SEC has not considered the exchange offers described in this prospectus in the context of a no-action letter. We cannot assure you that the staff of the SEC would make a similar determination with respect to the exchange offers as in the other circumstances. Each holder who wishes to exchange Old Notes for New Notes will be required to represent that it meets the above three requirements.
Any holder who is an affiliate of ours or who intends to participate in any exchange offer for the purpose of distributing New Notes or any broker-dealer who purchased Old Notes directly from us to resell pursuant to Rule 144A or any other available exemption under the Securities Act:
| • | cannot rely on the applicable interpretations of the staff of the SEC mentioned above; |
| • | will not be permitted or entitled to tender in the exchange offers the Old Notes held by such holder; and |
| • | must comply with the registration and prospectus delivery requirements of the Securities Act in connection with any resale transaction. |
Each broker-dealer that receives New Notes for its own account in exchange for Old Notes must acknowledge that the Old Notes were acquired by it as a result of market making activities or other trading activities and agree that it will deliver a prospectus that meets the requirements of the Securities Act in connection with any resale of the New Notes. The letter of transmittal states that by so acknowledging and by delivering a prospectus, a broker-dealer will not be deemed to admit that it is an “underwriter” within the meaning of the Securities Act. See “Plan of Distribution.”
Exchange Agent
The Bank of New York has been appointed as the exchange agent for the exchange offers. All executed letters of transmittal and any other required documents should be directed to the exchange agent at the address or facsimile number set forth below. Questions and requests for assistance, requests for additional copies of this prospectus or of the letter of transmittal and requests for notices of guaranteed delivery should be directed to the exchange agent addressed as follows:
THE BANK OF NEW YORK
AS EXCHANGE AGENT
BY FACSIMILE FOR ELIGIBLE INSTITUTIONS: | BY MAIL/OVERNIGHT COURIER/HAND: | |
(212) 298-1915 | The Bank of New York | |
Attention: Mr. Santino Ginocchetti | Corporate Trust Operations Reorganization Unit 101 Barclay Street - 7 East New York, N.Y. 10286 | |
| Attention: Mr. Santino Ginocchetti | ||
CONFIRM BY TELEPHONE: | ||
(212) 815-6331 |
Delivery of the letter of transmittal to an address other than as set forth above or transmission of such letter of transmittal via facsimile other than as set forth above does not constitute a valid delivery of the letter of transmittal.
122
Table of Contents
Fees and Expenses
We have agreed to pay the exchange agent reasonable and customary fees for its services and will reimburse it for its reasonable out-of-pocket expenses in connection with the exchange offers. We may also pay brokerage houses and other custodians, nominees and fiduciaries the reasonable out-of-pocket expenses incurred by them in forwarding copies of this prospectus and related documents to the beneficial owners of Old Notes, and in handling or tendering for their customers. We will not make any payment to brokers, dealers or others soliciting acceptances of the exchange offers.
Holders who tender their Old Notes for exchange will not be obligated to pay any transfer taxes on the exchange. If, however, New Notes are to be delivered to, or are to be issued in the name of, any person other than the registered holder of the Old Notes tendered, or if a transfer tax is imposed for any reason other than the exchange of Old Notes in connection with the exchange offers, then the amount of any such transfer taxes (whether imposed on the registered holder or any other persons) will be payable by the tendering holder. If satisfactory evidence of payment of such taxes or exemption therefrom is not submitted with the letter of transmittal, the amount of such transfer taxes will be billed directly to such tendering holder.
Voluntary Participation
Participation in the exchange offer is voluntary and holders of Old Notes should carefully consider whether to accept the terms and conditions of this offer. Holders of the Old Notes are urged to consult their financial and tax advisors in making their own decisions on what action to take with respect to the exchange offer.
Consequences of Failure to Exchange
Holders of Old Notes who are eligible to participate in the exchange offer but who do not tender their Old Notes will not have any further registration rights with respect to the Old Notes, and their Old Notes will continue to be subject to restrictions on transfer. Accordingly, these Old Notes may be resold only:
| • | to us, upon redemption thereof or otherwise; |
| • | so long as the Old Notes are eligible for resale pursuant to Rule 144A under the Securities Act, to a person whom the seller reasonably believes is a “qualified institutional buyer” within the meaning of Rule 144A purchasing for its own account or for the account of a qualified institutional buyer in a transaction meeting the requirements of Rule 144A; |
| • | in accordance with Rule 144 under the Securities Act or another exemption from the registration requirements of the Securities Act; |
| • | outside the United States to a foreign person in accordance with the requirements of Regulation S under the Securities Act; or |
| • | pursuant to an effective registration statement under the Securities Act, |
in each case in accordance with all other applicable securities laws.
Accounting Treatment
We will record the New Notes at the same carrying value as the Old Notes, as reflected in our accounting records on the date of the exchange. Accordingly, we will not recognize any gain or loss for accounting purposes. The expenses of the exchange offers will be amortized over the term of the New Notes.
123
Table of Contents
Regulatory Approvals
There are no federal or state regulatory requirements with which we must comply or approvals which we must obtain in connection with the exchange offers.
Certain Terms of the Registration Rights Agreement
Under the registration rights agreement, we could be required to file a shelf registration statement and/or to pay special interest on the Old Notes.
Shelf Registration Statement
If:
| • | an exchange offer is not permitted due to a change in applicable law or in the policy of the Securities and Exchange Commission; or |
| • | an exchange offer is not consummated within 240 days after May 8, 2003; or |
| • | any holder of a series of Old Notes (other than an initial purchaser) is not eligible to participate in the exchange offer; |
| • | any initial purchaser so requests with respect to Old Notes of a series constituting any portion of an unsold allotment that are not eligible to be exchanged for New Notes of such series in the exchange offer and that are held by the initial purchaser subsequent to the exchange offer; or |
| • | in the case of any initial purchaser that participates in the exchange offer or acquires New Notes of a series on behalf of a third party purchaser, such initial purchaser does not receive freely tradable New Notes of such series in exchange for Old Notes of such series constituting any portion of an unsold allotment |
then we will issue a notice, which we refer to as a “shelf notice”, to holders of the Notes of each affected series and to the trustee.
Within 60 days after delivering the shelf notice we will be obligated to file with the SEC a registration statement for an offering to be made on a continuous basis (a “shelf registration statement”), covering all Old Notes not exchanged in the exchange offer, New Notes not eligible for unrestricted transfer under United States federal and state securities laws and New Notes, if any, provided by us to any holders not eligible to participate in the exchange offer in exchange for their Old Notes.
We will use our reasonable best efforts to cause the shelf registration statement to be declared effective by the Securities and Exchange Commission and to keep the shelf registration statement effective until the second anniversary of its effective date or until any earlier date by which all Notes covered by the shelf registration statement have been sold as contemplated under the shelf registration statement or by which we file a subsequent shelf registration statement.
Special Interest
We have agreed to pay, as liquidated damages, special interest on the Notes in the following amounts under the following circumstances. In the event that:
| • | either |
| • | we have not filed the exchange offer registration statement on or before August 6, 2003, or |
| • | if the resale registration statement is required due to a change in existing SEC interpretations, we have not filed the resale registration statement by November 4, 2003, or |
124
Table of Contents
| • | if the resale registration statement is requested pursuant to the terms of the registration rights agreement and we have not filed the resale registration statement within 60 days after the request is made, or |
| • | the exchange offer registration statement has not become effective or been declared effective by the SEC within 180 days after the closing date of the offering of each series of Notes, or |
| • | the exchange offer has not been completed within 60 days after the effective date of the exchange offer registration statement, or |
| • | the applicable registration statement is filed and declared effective but thereafter ceases to be effective or available (except as specifically permitted in the registration rights agreement) without being succeeded promptly by an additional registration statement filed and declared effective, |
then the annual interest rate on each series of Notes affected by such occurrences (called “Registrable Notes” under the first supplemental indenture) will increase by adding 0.25% to the interest rate otherwise payable on such series of Notes for the first 90 days from the first day on which the default occurs and by adding a maximum amount of 0.5% to the interest rate otherwise payable on such series of Notes for the remaining period of such default to but not including the first day on which no such default is continuing.
125
Table of Contents
DESCRIPTION OF THE NEW NOTES AND GUARANTEES
This prospectus relates to the New Guaranteed Notes due 2013 (the “New 2013 Notes”) and the New Guaranteed Notes due 2033 (the “New 2033 Notes” and together with the New 2013 Notes, the “New Notes”) issued by WMC Finance (USA) Limited. Unless otherwise specified, references in this section to the “Notes” mean either or both series of the Old Notes and the New Notes, collectively. We issued the Old Notes and will issue the New Notes pursuant to a document called an indenture. The indenture relating to the Notes is a contract among the issuer, the parent guarantor and The Bank of New York, as trustee, and has been supplemented by a first supplemental indenture among the issuer, the parent guarantor, the subsidiary guarantors and the trustee. References to the indenture refer to the indenture as so supplemented. As used in this section, the terms “we”, “our” and “us” refer to the issuer and guarantors only.
General
The Bank of New York, located at 101 Barclay Street, 21st Floor West, New York, NY 10286, USA, acts as the trustee under the indenture. The trustee has two principal functions:
| • | First, it can and, at the direction of a majority of the holders, it shall, enforce your rights against the issuer or the guarantors if the issuer defaults on the Notes or any of the guarantors defaults on its guarantees. However, there are some limitations on the extent to which the trustee may act on your behalf, described under “Default and Related Matters—Events of Default—Remedies If an Event of Default Occurs” below; and |
| • | Second, the trustee performs administrative functions on behalf of the issuer, such as sending you interest payments, transferring your Notes to a new buyer if you sell your Notes and sending you notices. |
WMC Resources Ltd is the parent guarantor, and WMC (Olympic Dam Corporation) Pty Ltd and WMC Fertilizers Pty Ltd are the subsidiary guarantors, of the Notes issued under the indenture. They are referred to collectively as the guarantors. The Old Notes were originally offered in two separate series, in the aggregate principal amounts set forth below and the New Notes will be issued in two separate series and will be limited to the same aggregate principal amounts set forth below. Old Notes and New Notes bearing the same maturity constitute a single series under the indenture. We may from time to time, without giving notice to or seeking the consent of the holders of the Notes of any of the series, issue Notes having the same ranking and the same interest rate, maturity and other terms as the Notes of a series. Any additional Notes having such similar terms, together with the Notes of a series offered hereby, will constitute a single series of Notes under the indenture.
Principal | ||
Notes due 2013 | US$500,000,000 | |
Notes due 2033 | US$200,000,000 | |
Maturity | ||
Notes due 2013 | May 15, 2013 | |
Notes due 2033 | May 15, 2033 | |
The indenture and its associated documents contain the full legal text of the matters described in this section. The terms of the Notes include those stated in the indenture and those made part of the indenture by reference to the Trust Indenture Act of 1939, as amended. The Notes are subject to all such terms, and you should refer to the indenture and the Trust Indenture Act for a statement thereof. The agreements to be executed in connection with this offering of Notes are the indenture, the first supplemental indenture, the Notes and the guarantees, all of which are governed by New York law. A copy of the indenture and the first supplemental indenture may be obtained from the trustee. See “Where You Can Find More Information” for information on how to obtain a copy.
126
Table of Contents
Because this section is a summary, it does not describe every aspect of the Notes or the guarantees. This summary is subject to and qualified in its entirety by reference to all the provisions of the indenture, including some of the terms used in the indenture. We describe the meaning of only the more important terms. We also include references in parentheses to some sections of the indenture. Whenever we refer to particular sections or defined terms of the indenture in this prospectus, those sections or defined terms are incorporated by reference here.
Principal and Interest
The New 2013 Notes will bear interest from May 8, 2003, and interest will be payable semi-annually in arrears on each May 15 and November 15, commencing November 15, 2003, at the rate of 5.125% per year, to the holders in whose names the Notes are registered at the close of business on the May 1 or November 1 immediately preceding the related interest payment date. The New 2033 Notes will bear interest from May 8, 2003, and interest will be payable semi-annually in arrears on each May 15 and November 15, commencing November 15, 2003, at the rate of 6.250% per year, to the holders in whose names the Notes are registered at the close of business on the May 1 or November 1 immediately preceding the related interest payment date. The principal and interest payments will be paid in US dollars. The indenture provides that Securities, as defined in the indenture, may be issued thereunder from time to time in one or more series without limitation as to aggregate principal amount. (Section 301). The issuer therefore reserves the right, from time to time, without the consent of the holders of the Notes, to issue additional Notes under the indenture.
Stated Maturity and Maturity
The day on which the principal amount of each series of Notes is scheduled to become due is called the stated maturity of the principal. The principal may become due sooner, by reason of redemption or of acceleration after a default. The day on which the principal actually becomes due, whether at the stated maturity or earlier, is called the maturity of the principal. The terms “stated maturity” and “maturity” refer to the dates when interest payments become due. For example, reference to a regular interest payment date when an installment of interest is scheduled to become due is the “stated maturity” of that installment. When reference is made to the “stated maturity” or the “maturity” of a series of Notes without specifying a particular payment, it refers to the stated maturity or maturity, as the case may be, of the principal. Each series of Notes is subject to defeasance as described below under “Defeasance and Covenant Defeasance”.
The issuer will pay interest on each series of Notes on the interest payment dates stated above, and at maturity. Each payment of interest due on an interest payment date or at maturity will include interest accrued from and including the last date to which interest has been paid or made available for payment, or from the issue date, if none has been paid or made available for payment, to but excluding the relevant payment date on each series of Notes on the basis of a 360-day year of twelve 30-day months.
How the Notes Rank Against Other Debt
Neither series of Notes will be secured by any of the issuer’s or the guarantors’ property or assets. Thus, by owning either Old Notes or New Notes of either series, holders are one of the issuer’s unsecured creditors. Neither series of Notes will be subordinated or senior to any of the issuer’s other unsecured unsubordinated debt obligations. The guarantees will be unsecured obligations of the respective guarantors and will rank equally (pari passu) as to payment with all of their other unsecured and unsubordinated debt, except debt given preference by law. These guarantees will not be subordinated or senior to any of the guarantors’ other unsecured unsubordinated debt obligations. This means that, in a bankruptcy or liquidation proceeding against the issuer or any guarantor, the issuer’s obligations under Notes of either series or the relevant guarantor’s obligations under its respective guarantees would rank equally in right of payment with all of the issuer’s or the relevant guarantor’s other unsecured and unsubordinated debt, respectively, except debt given preference by law.
127
Table of Contents
Guarantees
WMC Resources Ltd will fully and unconditionally guarantee the payment of the principal of, premium, if any, and interest on each series of Notes, including any additional amounts which may be payable in respect of such series of Notes, as described under “Payment of Additional Amounts”. WMC Resources Ltd guarantees the payment of such amounts when such amounts become due and payable, whether on an interest payment date, at the stated maturity of each series of Notes, by declaration of acceleration, call for redemption or otherwise. When referring specifically to the guarantee by WMC Resources Ltd, we refer to it as the parent guarantee.
In addition to the parent guarantee, two of WMC Resources Ltd’s wholly-owned subsidiaries, WMC (Olympic Dam Corporation) Pty Ltd and WMC Fertilizer Pty Ltd, each of which also is a guarantor of our US$600 million senior credit facility, dated November 14, 2002, have unconditionally guaranteed on a joint and several basis the payment of the principal, premium, if any, and interest with respect to each series of Notes (including any additional amounts). We refer to each of these subsidiaries as a subsidiary guarantor and to each of their guarantees as a subsidiary guarantee. Each of the subsidiary guarantees is an unsecured obligation of the subsidiary guarantor providing it will rank equally in right of payment with the guarantee provided by such subsidiary guarantor under our senior credit facility and with all existing and future unsecured debt of such subsidiary guarantor that is not, by its terms, expressly subordinated in right of payment to such guarantee.
Under the terms of the first supplemental indenture, a subsidiary guarantor shall be automatically and unconditionally released from its guarantee upon:
| • | any sale, exchange or other disposition (including by way of consolidation or merger) to any person (other than an affiliate of ours) of all of WMC Resources Ltd’s equity securities in, or all or substantially all the assets of, that subsidiary guarantor, or |
| • | that subsidiary guarantor is no longer a Restricted Subsidiary, in each case in compliance with the terms of the first supplemental indenture, or |
| • | that subsidiary guarantor ceasing to be a guarantor of (or co-obligor on) any of our funded indebtedness other than either series of Notes and other than funded indebtedness the related guarantee (or obligations) of which |
| • | is subject to a release provision similar to the release provision described in this paragraph, and |
| • | will be released concurrently with the release of the guarantee of that subsidiary guarantor pursuant to such release provision. |
Currently, in order for a subsidiary guarantee to be released under each series of Notes under this provision, the applicable subsidiary guarantor would have to have no further guarantee obligations under our senior credit facility.
The indenture also provides that if either subsidiary guarantor guarantees or becomes a co-obligor on any funded indebtedness at any time subsequent to the date on which it is released from its guarantee as described above, then we will cause that subsidiary guarantor to provide a new guarantee of each series of Notes on terms substantially identical to their initial subsidiary guarantee.
“Funded indebtedness” means all Debt (including Debt incurred under any revolving credit, letter of credit or working capital facility in excess of A$25 million) that matures by its terms, or that is renewable at the option of any obligor thereon to a date, more than one year after the date on which such indebtedness is originally incurred.
“Debt” means any indebtedness of any Person for money borrowed, including any indebtedness evidenced by notes, bonds, debentures or other similar evidences of indebtedness, and any guarantee thereof.
128
Table of Contents
Australian law permits a company to guarantee the obligations of a related company provided that its directors are not in breach of their duties to the company in deciding to issue the guarantee. Under Australian law, for the directors of a subsidiary guarantor not to be in breach of their duties in issuing a subsidiary guarantee, they must be satisfied that (a) the subsidiary guarantor was solvent (being able to pay its debts as and when they become due and payable) at the time the guarantee was issued, and (b) the guarantee would be for the commercial benefit of the subsidiary guarantor. Commercial benefit will be tested by what decision a reasonable person in the directors’ circumstances would make. This may involve an assessment of (i) the benefits, if any, and the detriment to the subsidiary guarantor of issuing the guarantee; (ii) the respective benefits to other parties involved in the issuance of the guarantee; and (iii) any other relevant matter. If the decision to issue the subsidiary guarantee is one which a reasonable director would not have made then the directors would be in breach of their duties and the guarantee might be avoided.
Legal Ownership
Street Name and Other Indirect Holders
Investors who hold either series of Notes in accounts at banks or brokers will generally not be recognized by the issuer and the guarantors as legal holders of such Notes. This is called holding in street name. Instead, the issuer and the guarantors would recognize only the bank or broker, or the financial institution the bank or broker uses to hold its Notes. These intermediary banks, brokers and other financial institutions pass along principal, interest and other payments on the Notes, either because they agree to do so in their customer agreements or because they are legally required to do so. If you are considering holding Notes in street name, you should check with your own institution to find out:
| • | how it will handle note payments and notices; |
| • | whether it will impose fees or charges; and |
| • | how it will handle voting if it were ever required; |
| • | whether and how you can instruct it to send your Notes, registered in your own name so you can be a direct holder as described below; and |
| • | how it will pursue rights under the Notes if there were a default or other event triggering the need for holders to act to protect their interests. |
Direct Holders
The issuer’s obligations, the guarantors’ obligations, as well as the obligations of the trustee and those of any third parties employed by the issuer, the guarantors or the trustee, run only to persons who are registered as holders of Notes. As noted above, the issuer and the guarantors do not have obligations to you if you hold in street name or other indirect means, either because you choose to hold Notes in that manner or because the Notes are issued in the form of global Notes as described below. For example, once the issuer or a guarantor makes payment to the registered holder, it has no further responsibility for the payment even if that holder is legally required to pass the payment along to you as a street name customer but does not do so.
Global Notes
What are Global Notes? Global Notes are a special type of indirectly held Notes, as described above under “Street Name and Other Indirect Holders”. The ultimate beneficial owners of global Notes can only be indirect holders.
The issuer and the guarantors require that the global Notes be registered in the name of a financial institution they select. In addition, the issuer and the guarantors require that the Notes included in the global Notes not be transferred to the name of any other direct holder unless the special circumstances described below
129
Table of Contents
occur. The financial institution that acts as the sole direct holder of the global Notes is called the depositary. Any person wishing to own a security must do so indirectly by virtue of an account with a broker, bank or other financial institution that in turn has an account with the depositary.
Special Investor Considerations for Global Notes. As an indirect holder, an investor’s rights relating to global Notes will be governed by the account rules of the investor’s financial institution and of the depositary, as well as general laws relating to securities transfers. Neither the issuer nor the guarantors recognize this type of investor as a holder of Notes and instead deal only with the depositary that holds global Notes. Each series of Notes offered by this prospectus will only be issued in the form of global Notes for each series except in special circumstances described below.
If you are an investor in global Notes, you should be aware that:
| • | You cannot get Notes registered in your own name. |
| • | You cannot receive physical certificates for your interest in the Notes. |
| • | You will be a street name holder and must look to your own bank or broker for payments on the Notes and protection of your legal rights relating to the Notes, as explained earlier under “Legal Ownership—Street Name and Other Indirect Holders”. |
| • | You may not be able to sell interests in the Notes to some insurance companies and other institutions that are required by law to own their Notes in the form of physical certificates. |
| • | The depositary’s policies will govern payments, transfers, exchange and other matters relating to your interest in the global Notes. The issuer, guarantors and the trustee have no responsibility for any aspect of the depositary’s actions or for its records of ownership interests in global Notes. The issuer, the guarantors and the trustee do not supervise the depositary in any way. |
| • | The depositary will require that interests in global Notes be purchased or sold within its system using same-day funds. |
Special Situations When Global Notes Will Be Terminated. In a few special situations described later, global Notes will terminate and interests in them will be exchanged for physical certificates representing Notes. After that exchange, the choice of whether to hold Notes directly or in street name will be up to the investor. Investors must consult their own bank or brokers to find out how to have their interests in Notes transferred to their own name so that they will be direct holders. The rights of street name investors and direct holders in the Notes have been previously described in the subsections entitled “Legal Ownership—Street Name and Other Indirect Holders” and “Legal Ownership—Direct Holders”.
The special situations for termination of global Notes are:
| • | When the depositary notifies the issuer or the parent guarantor that it is unwilling, unable or no longer qualified to continue as depositary. |
| • | When an event of default on the Notes has occurred and has not been cured. Defaults are discussed below under “Default and Related Matters—Events of Default”. |
When global Notes terminate, the depositary (and not the issuer, the guarantors or the trustee) is responsible for deciding the names of the institutions that will be the initial direct holders. (Section 305)
In the remainder of this description “you” means direct holders and not street name or other indirect holders of each series of Notes. Indirect holders should read the subsection entitled “Street Name and Other Indirect Holders”.
130
Table of Contents
Overview of Remainder of this Description
The remainder of this description summarizes:
| • | Additional mechanics relevant to each series of Notes under normal circumstances, such as how you transfer ownership and where the issuer makes payments. |
| • | Your rights under severalspecial situations, such as if the issuer or the guarantors merge with another company, if the issuer or the guarantors want to change a term of a given series of Notes or if the issuer or the guarantors want to redeem a series of Notes for tax or other reasons. |
| • | Your rights to receivepayment of additional amounts due to changes in the tax withholding requirements of Australia. |
| • | Covenants contained in the indenture that restrict the issuer’s and the guarantors’ ability to incur liens or enter into sale and leaseback transactions. |
| • | Your rights if the issuerdefaults in respect of its obligations under a series of Notes or experiences other financial difficulties. |
| • | Your rights if any guarantordefaults in respect of its obligations under the guarantees or experiences other financial difficulties. |
| • | The issuer’s and the guarantors’ relationship with the trustee. |
Additional Mechanics
Exchange and Transfer
Except as otherwise described herein, each series of Notes will be issued:
| • | only in fully registered form; |
| • | without interest coupons; and |
| • | in denominations that are even multiples of US$1,000. |
You may have your Notes of a given series broken into more Notes of that same series of smaller denominations or combined into fewer Notes of that same series of larger denominations, as long as the total principal amount is not changed. (Section 305). This is called an exchange.
You may exchange or transfer your Notes of a given series at the office of the trustee. The trustee acts as the issuer’s and the guarantors’ agent for registering each series of Notes in the names of holders and transferring Notes of such series. The issuer and the guarantors may change this appointment to another entity or perform the service themselves. The entity performing the role of maintaining the list of registered holders is called the security registrar. It will also register transfers of each series of Notes. (Section 305).
Form, Denomination, Transfer and Book-Entry Procedures
The New Notes of each series will be issued only in fully registered form, without interest coupons, in minimum denominations of US$1,000 and integral multiples thereof. No New Notes of either series will be issued in bearer form. The New Notes of each series will be issued at the closing of the respective exchange offers only against receipt of validly tendered Old Notes of equivalent principal amounts.
Exchange of Book-Entry Notes for Certificated Notes
You may not exchange your beneficial interest in a Global Note for a Note of a given series in certificated form unless:
| • | DTC notifies us that it is unwilling or unable to continue as depositary for the Global Note and we fail to appoint a successor depositary, |
131
Table of Contents
| • | DTC ceases to be a clearing agency registered under the Exchange Act, |
| • | we notify the trustee that we elect to issue such series of Notes in certificated form, or |
| • | an event of default has occurred and is continuing with respect to such series of Notes. |
In all cases, certificated Notes delivered in exchange for any Global Note will be registered in the names, and issued in any approved denominations, requested by the depositary. Any certificated Note issued in exchange for an interest in a Global Note must have a legend on its face which indicates the transfer restrictions of that particular Global Note. Any exchange will be made through the DWAC system and an appropriate adjustment will be made in the records of the security registrar to reflect a decrease in the principal amount of the interest in the relevant Global Note.
Exchanges Between Certificated Notes
For so long as any series of Notes are listed on the Luxembourg Stock Exchange and in accordance with the rules and regulations of the Luxembourg Stock Exchange, you may transfer or exchange a certificated Note of a given series or replace any lost, stolen, mutilated or destroyed certificated Note of a given series for a new certificated Note of the same series and of like tenor and principal amount upon surrender, at the office of the Luxembourg paying and transfer agent, of the certificated Note to be transferred, together with a form of transfer duly completed and executed and any other evidence that the Luxembourg paying and transfer agent may reasonably require; provided that all transfers, exchanges and replacements must be effected in accordance with the indenture and the first supplemental indenture. In the case of a transfer of part only of a certificated Note, a new certificated Note will be issued to the transferee in respect of the part transferred and a further new certificated Note in respect of the balance of the original certificated Note not transferred will be issued to the transferor. Each new certificated Note to be issued pursuant to these provisions will be available for delivery within three business days of receipt, by the Luxembourg paying and transfer agent at its office, of the certificated Note to be transferred, the form of transfer and any other required evidence.
Book-Entry Procedures for Global Notes
The following descriptions of the operations and procedures of DTC, Euroclear and Clearstream are provided to you solely as a matter of convenience. These operations and procedures are solely within the control of the respective settlement systems and are subject to change from time to time. We take no responsibility for these operations and procedures and urge you to contact the systems or their participants directly to discuss these matters.
DTC has advised us that it is a limited-purpose trust company created to hold securities for its participating organizations, known as participants, and to facilitate the clearance and settlement of transactions in those securities between participants through electronic book-entry changes in the accounts of its participants. The participants include securities brokers and dealers, banks, trust companies, clearing corporations and certain other organizations. Access to DTC’s system is also available to other entities such as banks, brokers, dealers and trust companies that clear through or maintain a custodial relationship with a participant, either directly or indirectly. These persons are known as indirect participants. Persons who are not participants may beneficially own securities held by or on behalf of DTC only through participants or indirect participants. The ownership interest and transfer of ownership interest of each actual purchaser of each security held by or on behalf of DTC are recorded on the records of participants and indirect participants.
DTC has also advised us that, pursuant to procedures established by it:
| • | upon deposit of the Global Notes, DTC will credit, on its internal system, the accounts of participants with portions of the principal amount of the Global Notes, and |
| • | ownership of the interests in the Global Notes will be shown on, and the transfer of ownership of the interests will be effected only through, records maintained by DTC, in the case of participants, or by participants and indirect participants, in the case of other owners of beneficial interests in the Global Notes. |
132
Table of Contents
You may hold interests in the Global Notes directly through DTC, if you are a participant in that system, or indirectly through organizations, including Euroclear and Clearstream, which are participants in that system. Euroclear and Clearstream will hold interests in the Global Notes on behalf of their participants through customers’ securities accounts in their own names on the books of their depositories. The depositories, in turn, will hold such interests in the Global Notes in customers’ securities accounts in the depositories’ names on the books of DTC. All interests in a Global Note, including those held through Euroclear or Clearstream, may be subject to the procedures and requirements of DTC. Those interests held through Euroclear or Clearstream may also be subject to the procedures and requirements of DTC. Transfers and exchange of interests in Global Notes will also be subject to the restrictions described above under “—Exchange of Book-Entry Notes for Certificated Notes.”
The laws of some states require that certain persons take physical delivery of the securities that they own. Consequently, your ability to transfer beneficial interests in a Global Note to others may be limited. Because DTC can act only on behalf of participants, which in turn act on behalf of indirect participants and certain banks, the ability of a person having beneficial interests in a Global Note to pledge such interests to persons or entities that do not participate in the depositary system, or otherwise take actions in respect of such interests, may be affected by the lack of a physical certificate evidencing such interests.
As long as DTC or its nominee is the registered holder of a Global Note, DTC or its nominee will be considered the sole owner and holder of the Notes represented by such Global Note for purposes under the indenture, the first supplemental indenture and the Notes. Except as described above, if you hold a book-entry interest in a Global Note, you:
| • | willnot have Notes registered in your name, |
| • | willnot receive physical delivery of Notes in certificated form, and |
| • | willnot be considered the registered owner or holder of the interest in the Global Note under the indenture, the first supplemental indenture or the Notes. |
DTC has advised us that it will take any action permitted to be taken by a holder of Notes:
| • | only at the direction of one or more participants to whose account with DTC interests in the Global Notes are credited, and |
| • | only in respect of such portion of the aggregate principal amount of the Notes as to which the participant in question has given such direction. |
If there is an event of default under the Notes, however, DTC reserves the right to exchange the Global Notes for legended Notes in certificated form, and to distribute these Notes to its participants.
Although we expect that DTC, Euroclear and Clearstream will follow the foregoing procedures in order to facilitate transfers of beneficial interests in the Global Notes among participants in DTC, Euroclear and Clearstream, they are under no obligation to perform or to continue to perform such procedures, and such procedures may be discontinued at any time. Neither we nor the trustee will have any responsibility for the performance by DTC, Euroclear or Clearstream or their respective participants or indirect participants of their obligations under the rules and procedures governing their operations, which may include:
| • | maintaining, supervising and reviewing the records related to payments made on account of beneficial ownership interests in Global Notes, and |
| • | any other action taken by any such depositary, participant or indirect participant. |
Special Situations
Mergers and Similar Events
The issuer and the guarantors are generally permitted to consolidate or merge with another company or firm. The issuer and the guarantors are also permitted to sell or lease substantially all of their assets to another firm or
133
Table of Contents
to buy or lease substantially all of the assets of another firm. (Section 801) However, neither the issuer nor the parent guarantor may take any of these actions unless all the following conditions are met:
| • | Where the issuer or the parent guarantor merges out of existence or sells its assets substantially as an entirety, the other entity must be duly organized and validly existing under the laws of its governing jurisdiction. If such other entity is organized under the laws of a jurisdiction other than Australia, any State thereof, the United States, any State thereof, or the District of Colombia, it must indemnify you against any governmental charge or other cost resulting from the transaction. |
| • | If the issuer or the parent guarantor merges out of existence or sells or leases its assets substantially as an entirety, the other entity must execute a supplement to the indenture, known as a supplemental indenture. In the supplemental indenture, that entity must promise to be bound by every obligation in the indenture applicable to the entity that merged or transferred its assets. |
| • | Neither the issuer nor the parent guarantor may be in default on either series of Notes or guarantee immediately prior to such action and such action must not cause a default. For purposes of this no-default test, a default would include an event of default that has occurred and not been cured, as described under “Default and Related Matters—Events of Default—What is An Event of Default?” A default for this purpose would also include any event that would be an event of default if the requirements for notice of default or existence of defaults for a specified period of time were disregarded. |
| • | The issuer or the parent guarantor, as the case may be, must deliver certain certificates and other documents to the trustee. |
It is possible that a merger or other similar transaction could be treated for U.S. federal income tax purposes as a taxable exchange by the holders of Notes for new securities, which could result in holders recognizing taxable gain or loss for U.S. federal income tax purposes. A merger or other similar transaction could also have adverse tax consequences to holders under other tax laws to which the holders are subject.
The parent guarantor or any subsidiary of the parent guarantor may also assume the issuer’s obligations on each series of Notes if:
| • | the parent guarantor or such subsidiary assumes all the obligations of the issuer under the Notes and the indenture under a supplemental indenture; |
| • | any non-Australian subsidiary assumes the issuer’s obligations under each series of Notes and the indenture as described below under “—Payment of Additional Amounts” arising from its taxing jurisdiction; |
| • | after giving effect to the transaction no event of default and no event which after notice or lapse of time would become an event of default has occurred; and |
| • | the parent guarantor or such subsidiary, as the case may be, has delivered certain certificates and other documents to the trustee. (Section 803) |
It is possible that such an assumption could be treated for U.S. federal income tax purposes as a taxable exchange by the holders of each series of Notes for new securities, which could result in holders recognizing taxable gain or loss for U.S. federal income tax purposes. Such an assumption could also have adverse tax consequences to holders under other tax laws to which the holders are subject.
134
Table of Contents
Modification and Waiver
There are three types of changes we can make to the indenture and each series of Notes.
Changes Requiring Your Approval. First, there are changes that cannot be made to your Notes of a given series without your specific approval. Following is a list of those types of changes:
| • | change the stated maturity of the principal or interest on a Note; |
| • | reduce any amounts due on a Note; |
| • | change any of the issuer’s or the guarantors’ obligations to pay additional amounts described later under “Payment of Additional Amounts”; |
| • | reduce the amount of principal payable upon acceleration of the maturity of a Note following a default; |
| • | change the place or currency of payment on a Note; |
| • | impair your right to sue for payment; |
| • | reduce the percentage of holders of Notes whose consent is needed to modify or amend the indenture; |
| • | reduce the percentage of holders of Notes whose consent is needed to waive compliance with various provisions of the indenture or the supplemental indenture or to waive various defaults; and |
| • | modify or affect, in any manner adverse to you, the obligations of the guarantors in respect of the payment of principal, premium, if any, and interest, on a Note. (Section 902) |
Changes Requiring a Majority Vote. The second type of change to the indenture, the first supplemental indenture and each series of Notes is the kind that requires a vote in favor by holders of Notes of such series owning a majority of the principal amount. Most changes fall into this category, except for clarifying changes, amendments, supplements and other changes that would not adversely affect holders of the Notes of such series in any material respect. The same vote would be required for the issuer or any of the guarantors to obtain a waiver of all or part of the covenants described below or a waiver of a past default. However, the issuer or any of the guarantors cannot obtain a waiver of a payment default or any other aspect of the indenture or supplemental indenture or the Notes listed in the first category described previously under “Changes Requiring Your Approval” unless they obtain your individual consent to the waiver. (Section 513)
Changes not Requiring Approval. The third type of change does not require any vote by holders of a given series of Notes. This type is limited to clarifications and other changes that would not adversely affect holders of the Notes of such series in any material respect. (Section 901)
Further Details Concerning Voting. When taking a vote, the issuer and the guarantors will use the following rules to decide how much principal amount to attribute to a security:
| • | For original issue discount securities, the issuer and the guarantors will use the principal amount that would be due and payable on the voting date if the maturity of the Notes of a given series were accelerated to that date because of a default. |
| • | Notes of a given series will not be considered outstanding, and therefore not eligible to vote, if the issuer or the guarantors have deposited or set aside in trust for you money for their payment or redemption. Notes of such series will also not be eligible to vote if they have been fully defeased as described later under “Restrictive Covenants—Defeasance and Discharge”. (Section 101) |
| • | The issuer and the guarantors will generally be entitled to set any day as a record date for the purpose of determining the holders of outstanding Notes of a given series that are entitled to vote or take other action under the indenture. In limited circumstances, the trustee will be entitled to set a record date for action by holders. If the issuer, the guarantors or the trustee set a record date for a vote or other action to |
135
Table of Contents
be taken by holders of Notes of such series, that vote or action may be taken only by persons who are holders of outstanding Notes of such series on the record date and must be taken within 180 days following the record date or another period that the issuer or the guarantors may specify (or as the trustee may specify, if it set the record date). The issuer and the guarantors may shorten or lengthen (but not beyond 180 days) this period from time to time. (Section 104) |
Street name and other indirect holders should consult their banks or brokers for information on how approval may be granted or denied if we seek to change the indenture or the Notes or request a waiver.
Optional Tax Redemption
Each series of Notes may be redeemed in whole but not in part due to certain tax situations described below. The redemption price for each series of Notes will be equal to the principal amount of the Notes being redeemed plus accrued interest and any additional amounts due on the date fixed for redemption. Furthermore, you must receive between 30 and 60 days’ notice before Notes of such series are redeemed.
The first situation is where, as a result of a change in, execution of or amendment to, any laws or treaties or the official application or interpretation of any laws or treaties, the issuer or the relevant guarantor, as the case may be, determines that it would be required to pay additional amounts as described later under “Payment of Additional Amounts”.
This applies only in the case of changes, executions or amendments that occur in the jurisdiction where the issuer or the relevant guarantor, as applicable, is incorporated. If the issuer or the relevant guarantor, as the case may be, has been succeeded by another entity, the applicable jurisdiction will be the jurisdiction in which such successor entity is organized, and with effect from the date the entity became a successor.
The issuer will not have the option to redeem in this case if the issuer or the relevant guarantor, as the case may be, could have avoided the payment of additional amounts or the deduction or withholding by using reasonable measures available to it.
The second situation is where, as a result of a change in, execution of or amendment to, any laws or treaties, or the official application or interpretation of any laws or treaties, one of the guarantors determines that it would have to deduct or withhold tax on any payment made to the issuer to enable it to make a payment of principal, premium, if any, or interest, on a Note.
This applies only in the case of changes, executions or amendments that occur in the jurisdiction where the issuer or the relevant guarantor, as applicable, is incorporated. If the issuer or one of the guarantors, as the case may be, has been succeeded by another entity, the applicable jurisdiction will be the jurisdiction in which such successor entity is organized, and with effect from the date the entity became a successor.
The issuer will not have the option to redeem in this case if the issuer or the relevant guarantor, as the case may be, could have avoided the payment of additional amounts or the deduction or withholding by using reasonable measures available to it.
The issuer or the relevant guarantor shall deliver to the trustee an opinion of counsel to the effect that the circumstances required for redemption exist. (Section 1108).
Payment of Additional Amounts
All payments of principal, premium, if any, and interest in respect of each series of Notes or any of the guarantees will be made free and clear of, and without withholding or deduction for, any taxes, assessments,
136
Table of Contents
duties or governmental charges of whatever nature imposed, levied or collected by or within a relevant taxing jurisdiction unless that withholding or deduction is required by law. A relevant taxing jurisdiction is any jurisdiction under the laws of which the issuer or any of the guarantors, as the case may be, or any successor entity, is organized (or any political subdivision or taxing authority of, or in, that jurisdiction having power to tax).
The indenture provides that if withholding or deduction is required by law, then the issuer or the relevant guarantor, as the case may be, must pay to the holder of any Note of a given series additional amounts as may be necessary in order that every net payment of principal, premium, if any, and interest, on that Note after deduction or other withholding for or on account of any present or future tax, assessment, duty or other governmental charge of any nature whatsoever imposed, levied or collected by or on behalf of a relevant taxing jurisdiction, will not be less than the amount then due and payable on that Note. However, the indenture also provides that the issuer or the relevant guarantor, as the case may be, will not be required to make any payment of additional amounts in any of the following circumstances:
| • | The underlying tax, assessment duty or other governmental charge: |
| • | is imposed only because the holder was or is connected to the taxing jurisdiction. These connections include where the holder: |
| • | is or has been a citizen or resident of the jurisdiction; |
| • | is or has been engaged in trade or business in the jurisdiction; or |
| • | has or had a permanent establishment in the jurisdiction. |
| • | is for a tax or charge imposed due to the presentation of a Note for payment in Australia, unless presentation is required and could not have been made elsewhere, or presentation of a Note for payment on a date more than 30 days after the Note became due or after the payment was provided for. |
| • | is an estate, inheritance, gift, sale, transfer, personal property or similar tax. |
| • | is normally payable in a manner that does not involve withholding or is a collection mechanism for such a tax. |
| • | is imposed or withheld because the holder or beneficial owner failed to comply with any of the issuer’s or the relevant guarantor’s requests in order to comply with statutes, treaties, regulations or administrative practices of the taxing jurisdiction as a precondition to exemption from all or part of such withholding: |
| • | by providing information about the nationality, residence or identity of the holder or beneficial owner; or |
| • | making a declaration or satisfying any information requirements. |
| • | The underlying withholding or deduction is required to be made pursuant to any European Union directive on the taxation of savings implementing the conclusions of ECOFIN Council meeting of November 26-27, 2000 or any law implementing or complying with, or introduced in order to conform to, such a directive. |
| • | The payment of additional amounts is for any withholding or deduction required to be made with respect to a Note presented for payment by or on behalf of a holder who would have been able to avoid such withholding or deduction by presenting the relevant Note to another paying agent in a member state of the European Union. |
| • | The holder of a Note is the Group’s “associate” (as that term is defined in the Australian tax legislation (the Australian Tax Act)) and, as a result, the Australian Tax Act requires withholding tax to be paid on interest or amounts in the nature of interest payable on the Note. |
137
Table of Contents
| • | A determination is made under the Australian Tax Act that withholding tax is payable because the holder has participated in a scheme to avoid withholding tax, provided that neither the issuer nor the relevant guarantor participated in the scheme. |
| • | The holder is a fiduciary or partnership other than the sole beneficial owner of the payment of the principal of, or any interest on, any Note, and the laws of the taxing jurisdiction require the payment to be included in the income of a beneficiary or settlor for tax purposes in the case of a fiduciary or a member of such partnership or a beneficial owner who would not have been entitled to additional amounts had it been the holder of such Note. |
| • | Any combination of the foregoing. |
These provisions will also apply to any taxes or governmental charges imposed by any jurisdiction in which a successor to the issuer or the relevant guarantor is incorporated. Additional amounts may also be payable in the event of certain consolidations, mergers, sales of assets or assumptions of obligations. For more information, see “Optional Tax Redemption”.
Optional Redemption
The issuer may, at its option, redeem some or all of each series of Notes at any time, on at least 30 days, but not more than 60 days, prior notice mailed to the registered address of each holder of such series of Notes. The redemption prices will be equal to the greater of:
| • | 100% of the principal amount of the Notes to be redeemed; and |
| • | the sum of the present values of the Remaining Scheduled Payments (as defined below) discounted to the redemption date, on a semiannual basis (assuming a 360-day year consisting of twelve 30-day months), at a rate equal to the sum of the Treasury Rate (as defined below) plus 20 basis points for the 2013 Notes and plus 25 basis points for the 2033 Notes. |
In the case of each bullet point above, accrued interest will be payable to the redemption date.
The definitions of terms used in the calculation of the redemption prices are set forth below.
| • | “Comparable Treasury Issue” means the United States Treasury security or securities selected by an Independent Investment Banker as having an actual or interpolated maturity comparable to the remaining term of the Notes to be redeemed that would be utilized, at the time of selection and in accordance with customary financial practice, in pricing new issues of corporate debt securities of a comparable maturity to the remaining term of such Notes. |
| • | “Comparable Treasury Price” means, with respect to any redemption date: |
| • | the average of the Reference Treasury Dealer Quotations for that redemption date after excluding the highest and lowest of such Reference Treasury Dealer Quotations; or |
| • | if the Independent Investment Banker obtains fewer than four such Reference Treasury Dealer Quotations, the average of all such quotations. |
| • | “Independent Investment Banker” means one of the Reference Treasury Dealers, appointed by the issuer, after first consulting with the trustee, to act as the Independent Investment Banker. |
| • | “Reference Treasury Dealer” means each of Citigroup Global Markets Inc. and J.P. Morgan Securities Inc. or their respective affiliates, plus three others to be selected by the Company, in each case, that is a primary U.S. Government securities dealer in New York City, and their respective successors. If any of the foregoing or their affiliates shall cease to be a primary U.S. Government securities dealer in New York City, the issuer will substitute another primary U.S. Government securities dealer in New York City. |
138
Table of Contents
| • | “Reference Treasury Dealer Quotations” means, with respect to each Reference Treasury Dealer and any redemption date, the average of the bid and asked prices for the Comparable Treasury Issue (expressed in each case as a percentage of its principal amount) quoted in writing to the Independent Investment Banker by such Reference Treasury Dealer at 3:30 p.m., New York City time, on the third business day preceding such redemption date. |
| • | “Remaining Scheduled Payments” means, with respect to each Note to be redeemed, the remaining scheduled payments of the principal of and interest on the Note that would be due after the related redemption date but for the redemption. If that redemption date is not an interest payment date with respect to a Note, the amount of the next succeeding scheduled interest payment on the Note will be reduced by the amount of interest accrued on the Note to that redemption date. |
| • | “Treasury Rate” means, with respect to any redemption date, the rate per annum equal to the semiannual equivalent yield to maturity or interpolation (on a day count basis) computed as of the third business day immediately preceding that redemption date, of the Comparable Treasury Issue, assuming a price for the Comparable Treasury Issue (expressed as a percentage of its principal amount) equal to the Comparable Treasury Price for such redemption date. |
The redemption price will be calculated by the Independent Investment Banker and the issuer, the Trustee and any paying agent for the Notes will be entitled to rely on that calculation.
On and after the redemption date, interest will cease to accrue on the Notes or any portion of the Notes called for redemption, unless the issuer defaults in the payment of the redemption price and accrued interest. On or before the redemption date, the issuer will deposit with a paying agent or the Trustee money sufficient to pay the redemption price of and accrued interest on the Notes to be redeemed on that date.
In the case of any partial redemption, selection of the Notes for redemption will be made by the Trustee by such method as the Trustee in its sole discretion deems to be fair and appropriate.
Since a nominee of DTC will be the registered holder of each series of Notes held as Global Notes, notice by DTC to participating institutions and by these participations to street name holders of indirect interests in each series of Notes will be made according to arrangements among them and may be subject to statutory or regulatory requirements.
Restrictive Covenants
Restrictions on Liens
Some of our property may be subject to a mortgage or other legal mechanism that gives our lenders preferential rights in that property over other lenders, including you and the other direct holders of the Notes, or over our general creditors if we fail to pay them back. These preferential rights are called liens. WMC Resources Ltd promises that it will not become obligated and will not permit the issuer or any restricted subsidiary to become obligated on any new debt for borrowed money that is secured by a lien on any of their properties, unless they grant an equivalent or higher-ranking lien on the same property to you and the other direct holders of each series of Notes. For these purposes, a restricted subsidiary means:
| • | the subsidiary guarantors; |
| • | other subsidiary of the parent guarantor; |
| • | with substantially all its property located in, or carrying on substantially all its business within, Australia; and |
| • | which owns or leases a Principal Property; and |
| • | any subsidiary of the parent guarantor engaged primarily in the business of owning or holding, directly or indirectly, securities of any other restricted subsidiary. |
139
Table of Contents
“Principal Property” means any mine, plant or other facility, the land upon which it stands and the fixtures that are part of it, (i) that is used primarily for mining and processing and is located in Australia and (ii) the net book value of which exceeds 1% of Net Tangible Assets.
None of the issuer, the parent guarantor or the restricted subsidiaries need to comply with this restriction if the amount of all debt that would be secured by liens on their properties, excluding the debt secured by the liens that are listed below, is no more than 10% of WMC Resources group’s net tangible assets. Net tangible assets is defined in the indenture as all of WMC Resources group’s assets (including acquired mineral rights), except goodwill, trademarks, patents, trade names and all other intangible assets, less balance sheet reserves for future obligations, current liabilities and minority interests, if any, in any assets of WMC Resources Ltd’s subsidiaries, all as shown in the most recent consolidated financial statements of WMC Resources prepared for purposes of filing with the SEC. (Sections 101 and 1007)
This restriction on liens applies only to liens for borrowed money. In addition, this restriction on liens also does not apply to debt secured by a number of different types of liens. These types of liens include the following:
| • | liens on property of any person existing at the time such person becomes a restricted subsidiary, provided that such liens were not entered into in contemplation of the transaction whereby such person |
| • | became a restricted subsidiary and do not extend to any assets of the issuer, the guarantors or any other restricted subsidiary other than such property; |
| • | liens to secure debt of a guarantor, the issuer or a restricted subsidiary to any of the other guarantors, the issuer or another restricted subsidiary (as applicable); |
| • | liens to secure the performance of tenders, bids, leases, statutory obligations, surety and appeal bonds, government contracts, performance and return-of-money bonds and other obligations of a like nature arising in the ordinary course of business in Australia (exclusive of obligations for the payment of borrowed money); |
| • | liens on any property existing at the time such property is acquired by any of the guarantors, the issuer or a restricted subsidiary, whether by merger, consolidation, purchase of assets or otherwise, provided that such liens were not entered into in contemplation of such merger, consolidation or purchase and do not extend to any assets of the issuer, the guarantors or any other restricted subsidiary other than such property; |
| • | liens existing as of the date of issuance of each series of Notes; |
| • | liens on any property (including any improvements thereon) acquired or constructed by a guarantor or any restricted subsidiary after the date of initial issuance of each series of Notes to secure the payment of all or any part of the purchase price or cost of construction or improvement of such property (or to secure any indebtedness incurred by such guarantor or restricted subsidiary for the purpose of financing all or any part of the purchase price thereof or cost of construction thereof or of improvements thereon) created prior to, at the time of, or within 180 days after the later of the acquisition, completion of construction or commencement of commercial operation of such property, provided that the principal moneys secured thereby do not exceed the cost of such acquisition, construction or improvement and no such lien shall extend to any other property of such guarantor or restricted subsidiary other than, in the case of any such construction or improvement, any theretofore unimproved real property on which such property so constructed, or the improvement, is located; |
| • | any attachment or judgment lien, unless the judgment it secures shall not, within 60 days after the entry thereof, have been discharged or execution thereof stayed pending appeal, or shall not have been discharged within 60 days after the expiration of any such stay; |
| • | any extension, renewal or replacement (or successive extensions, renewals or replacements), as a whole or in part, of any lien referred to above, for amounts not exceeding the principal amount of debt secured by such lien so extended, renewed or replaced, provided that such extension, renewal or replacement lien is limited to all or a part of the same property that secured the lien extended, renewed or replaced (plus improvements thereon or additions or accessions thereto); and |
140
Table of Contents
| • | in addition, the guarantor, the issuer and the restricted subsidiaries may issue, create, incur or assume any lien upon any of their respective property in order to secure debt; so long as at the time of such issuance, creation, incurrence, assumption and after giving effect thereto, debt of the guarantor, the issuer and the principal subsidiaries issued after the date of issuance of each series of Notes that is secured by liens other than the liens described above and attributable debt in respect of sale and leaseback transactions other than permitted sale and leaseback transactions described below does not exceed 10% of our “net tangible assets”. |
Restrictions on Sales and Leasebacks
The parent guarantor will not, and will not permit the issuer or any restricted subsidiary to, enter into any sale and leaseback transaction involving a property, other than as allowed by this covenant. A sale and leaseback transaction is an arrangement between the issuer, the parent guarantor or a restricted subsidiary and a third party where it or they lease a property that it or they previously owned for more than 270 days and sold to such third party to whom the lender or investor has advanced funds on the security of the principal property.
The restriction on sales and leasebacks does not apply to any sale and leaseback transaction between the issuer, the parent guarantor or a restricted subsidiary. Further, the indenture does not restrict the ability of any subsidiary (other than the issuer or a restricted subsidiary) to enter into sale and leaseback transactions. At the date of this prospectus, a portion of the parent guarantor’s consolidated assets is held directly by subsidiaries other than the issuer or a restricted subsidiary and so would not be subject to the covenant restricting sale and leaseback transactions.
The covenant allows the issuer, the parent guarantor or a restricted subsidiary to enter into sale and leaseback transactions in two additional situations. First, the issuer, the parent guarantor or a restricted subsidiary may enter into sale and leaseback transactions if such transactions, when combined with the value of the debt secured by any assets subject to liens which are not permitted above, do not exceed 10% of our net tangible assets.
Second, the issuer, the parent guarantor or a restricted subsidiary may enter into sales and leaseback transactions if, within 180 days of the transaction, the issuer, the parent guarantor or the restricted subsidiary, as the case may be, invests an amount equal to at least the net proceeds of the sale of the principal property that the issuer, the parent guarantor or the restricted subsidiary, as the case may be, leases in the transaction or the fair value of that property, whichever is greater. This amount must be invested in any of the issuer’s, the parent guarantor’s or the restricted subsidiary’s property or used to retire indebtedness for money that it borrowed, incurred or assumed that either has a maturity of 12 months or more from the date of incurrence of the indebtedness or which may be extended beyond 12 months from that date at the issuer’s, the restricted subsidiary’s or the parent guarantor’s option, as the case may be. (Section 1009).
Defeasance and Covenant Defeasance
The following discussion of defeasance and discharge will be applicable to Notes of a given series only if the issuer or the guarantors so elect. (Article 13)
Defeasance and Discharge
The issuer or the guarantors can legally release themselves from any payment or other obligations on the Notes of a given series or the guarantees, as the case may be, except for various obligations described below, if the issuer or the guarantors, in addition to other actions, put in place the following arrangements for you to be repaid:
| • | The issuer or the guarantors must deposit in trust for your benefit and the benefit of all other direct holders of the Notes of the same series a combination of money and United States government or United States government agency notes or bonds that will generate enough cash to make interest, principal and any other payments on the Notes of such series on their various due dates. |
141
Table of Contents
| • | The issuer or the guarantors must deliver to the trustee a legal opinion of the issuer’s or the guarantors’ counsel confirming that either (A) there has been a change in United States federal income tax law or (B) the issuer or the guarantors have received from, or there has been published by, the United States Internal Revenue Service a ruling, in each case to the effect that it or they may make the above deposit without causing you to be taxed on the Notes of such series any differently than if it or they did not make the deposit and just repaid the Notes of such series themselves at stated maturity. |
However, even if the issuer or the guarantors take these actions, a number of their obligations relating to each series of Notes or the guarantees, as the case may be, will remain. These include the following obligations:
| • | to register the transfer and exchange of Notes of a given series; |
| • | to replace mutilated, destroyed, lost or stolen Notes of a given series; |
| • | to maintain paying agencies; and |
| • | to hold money for payment in trust. |
Covenant Defeasance
The issuer or the guarantors can be legally released from compliance with certain covenants, including those described under “Restrictive Covenants” and including the corresponding Events of Default, if the issuer or the guarantors, as the case may be, take all the steps described above under “Defeasance and Discharge”, except that the opinion of counsel does not have to refer to a change in United States federal income tax laws or a ruling from the United States Internal Revenue Service.
Default and Related Matters
Events of Default
You will have special rights if an event of default occurs and is not cured, as described later in this subsection.
What is an Event of Default? The term event of default means any of the following:
| • | None of the issuer or any of the guarantors pays the principal or any premium on a Note of either series. |
| • | None of the issuer or any of the guarantors pays interest or any additional amounts or any sinking fund payment on a Note of either series within 30 days of its due date. |
| • | The issuer or any of the guarantors remains in breach of a covenant or any other term of the indenture or the supplemental indenture applicable to each series of Notes or the guarantees for 60 days after the issuer or the relevant guarantor, as the case may be, receives a notice of default stating the issuer or the guarantor is in breach. The notice must be sent by either the trustee or holders of 25% of the principal amount of the Notes of a series. |
| • | The issuer’s or a guarantor’s other borrowings in principal amount of at least the equivalent of US$25 million are accelerated by reason of a default and steps are taken to obtain repayment of these borrowings, without such acceleration having been rescinded or annulled within a period of 10 days. |
| • | A court of competent jurisdiction makes an order at the request or upon the application of any person for the winding up of the issuer or a guarantor or a court of competent jurisdiction, at the request or upon the application of any person or any persons holding the benefit of any encumbrance, appoints a receiver, receiver and manager, liquidator, provisional liquidator, administrator, custodian, bankruptcy trustee or similar officer to the issuer or a guarantor, and the external administrator is entitled to take control or possession of the whole or substantially the whole of the assets of the issuer or a guarantor, or any encumbrancer enters into possession of the whole or substantially the whole of the assets of the |
142
Table of Contents
| issuer or a guarantor, and the order, appointment or entry is not removed, discharged, set aside, overturned, permanently stayed, terminated or withdrawn within 60 days of the order, appointment or entry, although such an order or application for the purposes of a reconstruction, amalgamation or reorganization where the issuer or a guarantor, as the case may be, is solvent shall not be an event of default. |
| • | The issuer or a guarantor consents to the order, appointment or entry referred to in the preceding paragraph. |
| • | The issuer or a guarantor passes an effective resolution for its winding up or commences any legal proceeding or similar action or applies for its winding up or appoints or applies to any court for the appointment of any external administrator in respect of it, other than for the purposes of a reconstruction, amalgamation or reorganization where it is solvent. |
| • | The issuer or a guarantor stops payment of its debts generally or enters into any compromise, arrangement or composition or assignment for the benefit of its creditors generally, except for the purposes or as a result of any solvent reconstruction, amalgamation or reorganization where it is not the surviving entity but the surviving entity has assumed the payment of the relevant guarantor’s or the issuer’s debts. (Section 501). |
Remedies if an Event of Default Occurs. If an event of default has occurred and has not been cured, the trustee may, and at the direction of the holders of 25% in principal amount of the Notes of a series, shall declare the entire principal amount of all the Notes of such series to be due and immediately payable. This is called a declaration of acceleration of maturity. A declaration of acceleration of maturity may be cancelled by the holders of at least a majority in principal amount of the Notes of such series if the issuer or a guarantor has paid the outstanding amounts, other than amounts due because of the acceleration of maturity, and the issuer or a guarantor has satisfied certain other conditions. (Section 502)
Except in cases of default, the trustee is not required to take any action under the indenture at the request of any holders unless the holders offer the trustee reasonable protection from expenses and liability. This protection is called an indemnity. (Section 603) If indemnity in form and amount satisfactory to the trustee is provided, the holders of a majority in principal amount of the outstanding Notes of a series may direct the time, method and place of conducting any lawsuit or other formal legal action seeking any remedy available to the trustee. These majority holders may also direct the trustee in performing any other action under the indenture. (Section 512).
Before you bypass the trustee and bring your own lawsuit or other formal legal action or take other steps to enforce your rights or protect your interests relating to the Notes, the following must occur:
| • | You must give the trustee written notice that an event of default has occurred and remains uncured. |
| • | The holders of 25% in principal amount of all outstanding Notes of a series must make a written request that the trustee take action because of the default, and must offer indemnity reasonably satisfactory to the trustee against the cost and other liabilities of taking that action. |
| • | The trustee must have not taken action for 60 days after receipt of the above notice and offer of indemnity and the trustee has not received an inconsistent direction from the holders of a majority in principal amount of all outstanding Notes of a series during that period. (Section 507). |
However, such limitations do not apply to a law suit instituted by you for the enforcement of payment of the principal of or interest on a Note of a series on or after the respective due dates. (Section 508).
Street name and other indirect holders should consult their banks or brokers for information on how to give notice or direction to or make a request of the trustee and to make or cancel a declaration of acceleration.
143
Table of Contents
The issuer or the parent guarantor will furnish to the trustee every year a written statement of certain of the issuer’s or the parent guarantor’s officers certifying that, to their knowledge, the issuer and the guarantors are in compliance with the indenture and each series of Notes, or else specifying any default. In addition, the issuer shall deliver notice to the trustee if any officer of the issuer or the parent guarantor has knowledge of any default. (Section 1004).
Further Issues
We may from time to time, without notice to or the consent of the registered holders of either series of Notes offered in the exchange offers, create and issue additional debt securities having the same terms as and ranking equally and ratably with either series of Notes offered in the exchange offers in all respects (or in all respects except for the payment of interest accruing prior to the issue date of such additional debt securities or except for the first payment of interest following the issue date of such additional debt securities), so that such additional debt securities shall be consolidated and form a single series with, and shall have the same terms as to status, redemption or otherwise as, the Notes of such series.
Governing Law
The indenture, the first supplemental indenture, each series of Notes and the guarantees will be, governed by and construed in accordance with the laws of the State of New York.
Consent to Service of Process
The indenture provides that the issuer and the guarantors have each appointed Corporation Service Company as their authorized agent for service of process in any legal action or proceeding arising out of, or relating to, the indenture or each series of Notes offered under the indenture and brought in any federal or state court in the Borough of Manhattan, The City of New York, and the issuer and guarantors will irrevocably submit to the non-exclusive jurisdiction of such courts in any such legal action or proceeding.
The terms of the Old Notes are identical in all material respects to those of the New Notes, except that (1) the Old Notes have not been registered under the Securities Act, are subject to certain restrictions on transfer and are entitled to certain rights under the registration rights agreement (which rights will terminate upon consummation of the exchange offer, except under limited circumstances); and (2) the New Notes will not provide for any special interest as a result of our failure to fulfill certain registration obligations. The Old Notes provide that, in the event that the exchange offer relating to a series is not consummated within 60 business days after the date of effectiveness of the registration statement in which this prospectus is included, or, in certain limited circumstances, in the event a shelf registration statement with respect to the resale of the Old Notes is not filed within 60 days from the date on which the obligation to file such shelf registration statement arises, then special interest will accrue on the Old Notes of that series (in addition to the interest rate on the Old Notes) for the period from the occurrence of such event until the earlier of such time as the exchange offer is consummated or any required shelf registration statement is effective. During the time that the special interest is accruing continuously, the rate of such special interest shall be 0.25% per annum during the first 90-day period and shall increase by a further 0.25% per annum for the remainder of the period during which special interest is payable. The New Notes are not, and upon consummation of the exchange offer with respect to a series the Old Notes of such series will not be, entitled to any such special interest. Accordingly, holders of Old Notes should review the information set forth under “Risk Factors” and “Description of the New Notes and Guarantees.”
144
Table of Contents
The following statements with respect to taxation do not take into account all the specific circumstances that may be relevant to a particular holder and are based on advice we have received. We urge you to consult your own tax advisors concerning the consequences, in your particular circumstances, under Australian and United States federal, state and local tax laws, and the laws of any other relevant taxing jurisdiction, of the ownership of Notes.
Australian Taxation
The following is a summary of the principal Australian tax consequences generally applicable to a holder who is a resident of the United States and not a resident of Australia for Australian tax purposes. The principal Australian tax consequences summarized in this section reflect the current provisions of the Australian Income Tax Assessment Act 1936 and the Australian Income Tax Assessment Act 1997 and is the opinion of Arthur Robinson & Hedderwicks, Australian taxation legal counsel to the issuer.
The following summary is not exhaustive of all possible Australian income tax considerations that could apply to particular holders. These considerations may vary according to a holder’s individual circumstances.
Payments of Principal, Premium and Interest
Under existing Australian income tax law, non-resident holders of Notes or interests in any Global Security, other than persons holding such securities or interests as part of a business carried on at or through a permanent establishment in Australia (an “Australian Establishment”), are not subject to Australian income tax on payments of interest or amounts in the nature of interest, other than interest withholding tax (currently 10%) on interest or amounts in the nature of interest paid on the Notes. As described below, an exemption from this withholding tax applies provided certain conditions are met. The issuer expects that these will be met and, if they are met, payments of interest to non-residents would not be subject to interest withholding tax. Pursuant to Section 128F of the Australian Income Tax Assessment Act 1936 (the “Australian Tax Act”), an exemption from Australian interest withholding tax applies provided all of the following conditions are met:
| • | The issuer is a resident of Australia when the Notes are issued and when “interest”, as defined in Section 128A(1AB), is paid. |
| • | The Notes are issued in a manner that satisfies the “public offer test” of Section 128F under the Australian Tax Act (described below). |
| • | The issuer does not know, or have reasonable grounds to suspect, at the time of issue that the Notes or an interest in them is being, or would later be, acquired, directly or indirectly, by one of its “associates” (as defined in Section 128F(9) of the Australian Tax Act). |
| • | If the issuer knows or has reasonable grounds to suspect, at the time of the issue, that the Notes or an interest in them are to be acquired by an associate, then the Section 128F exemption from interest withholding tax should still apply if neither of the following applies: |
| • | the associate is a non-resident and the Notes or interest were not being, or would not be, acquired by the associate in carrying on a business in Australia at or through an Australian Establishment; or |
| • | the associate is a resident of Australia and the Notes or interest were being, or would be, acquired by the associate in carrying on a business in a country outside Australia at or through a permanent establishment of the associate in that country. |
145
Table of Contents
| • | If the issuer knows or has reasonable grounds to suspect, at the time of the issue, that the Notes or an interest in them are to be acquired by an associate, then the Section 128F exemption from interest withholding tax should still apply if the Notes or interest are acquired by the associate in the capacity of: |
| • | a dealer, manager or underwriter in relation to the placement of the Notes; or |
| • | a clearing house, custodian, funds manager or responsible entity of a registered scheme. |
| • | At the time of the payment of interest on the Notes, the issuer does not know nor does the issuer have reasonable grounds to suspect that the payee is its “associate”. |
| • | If the issuer, at the time of payment, knows or has reasonable grounds to suspect, that the interest on the Notes is paid to an associate, then the Section 128F exemption from interest withholding tax should still apply if neither of the following applies: |
| • | the associate is a non-resident and the payment is not received in respect of Notes that the associate acquired in carrying on a business in Australia at or through its Australian Establishment; nor |
| • | the associate is a resident of Australia and the payment is received in respect of Notes that the associate acquired in carrying on a business in a country outside Australia at or through a permanent establishment of the associate in that country. |
| • | If the issuer, at the time of payment, knows or has reasonable grounds to suspect, that the interest on the Notes is paid to an associate, then the Section 128F exemption from interest withholding tax should still apply if the associate receives the payment in the capacity of a clearing house, paying agent, custodian, funds manager or responsible entity of a registered scheme. |
There are five principal methods of satisfying the public offer test. In summary, the five principal methods are:
| • | offers of the relevant Notes to 10 or more professional financiers, investors or dealers who are not associates of each other; |
| • | offers of the relevant Notes to 100 or more potential investors; |
| • | offers of the relevant Notes which are listed on a stock exchange; |
| • | offers of the relevant Notes via publicly available financial markets dealing information; or |
| • | offers of the relevant Notes to dealers, managers or underwriters who offer to sell the Notes within 30 days by one of the preceding methods. |
The issuer intends to offer and sell Notes in a manner that will satisfy the requirements of Section 128F of the Australian Tax Act.
If the issuer fails to pay interest on the Notes, WMC Resources, WMC (Olympic Dam Corporation) Pty Ltd or WMC Fertilizers Pty Ltd may make payments to the noteholders under the guarantees. Whether such payments would be interest for withholding tax purposes is not clear. The Australian Taxation Office’s view, as reflected in Taxation Determination TD 1999/26, is that such payments under a guarantee would be interest for withholding tax purposes. However, that Determination also states that guarantee payments would be treated as exempt from withholding tax under section 128F if the requirements of that section are satisfied. Therefore, if the requirements of section 128F as described above are satisfied in relation to guarantee payments made by WMC Resources, WMC (Olympic Dam Corporation) Pty Ltd or WMC Fertilizers Pty Ltd, interest withholding tax should not be payable in relation to those payments.
As set out in more detail in the section entitled “Description of Notes and Guarantee—Payment of Additional Amounts”, if the issuer should at any time be compelled by law to deduct or withhold an amount in respect of any taxes, the issuer may be required, subject to the exceptions described by the issuer, to pay such
146
Table of Contents
additional amounts as may be necessary in order to ensure that the net amounts you receive in respect of the Notes after such deductions or withholding will equal the respective amounts that would have been receivable had no such deduction or withholding been required. If this occurs, the issuer may have the right to redeem the Notes.
Subject to the following, where a holder who is a United States resident makes a profit on redemption of a note which is treated as income for Australian tax purposes, the profit would not be subject to Australian income tax if the note is not held as part of an Australian Establishment, if the holder is an enterprise within the meaning of the Double Tax Agreement between Australia and the United States (the “DTA”) and if the holder is entitled to the benefits accorded by that treaty. The profits would be of an income nature if they were derived as part of an investment or trading business or if the Notes are “traditional securities” under the Australian Tax Act (i.e., if there is no issue discount or deferred return, or if there is such a discount or return but it is de minimis). If the Notes are acquired as part of any investment or trading business, or for the purpose of deriving a profit on sale or redemption, the holder should constitute an enterprise for the purposes of the treaty. If the profits on redemption were of a capital nature, no Australian tax should be payable on those profits unless the Notes were held in connection with an Australian Establishment. The profits should be of a capital nature if the Notes were not traditional securities and were held for the purposes of long-term investment. However, to the extent that any profit or redemption is treated as interest, or in the nature of interest, Australian withholding tax would apply. Discount on the issue of Notes would, for example, be treated as interest derived by the holder on redemption of the Notes. The withholding tax exemption provided by section 128F (see above) would apply to such interest if, as expected by the issuer, the requirements of that section will be satisfied.
Profits on Sale to Third Parties
Under existing Australian law, non-resident holders of Notes will not be subject to Australian income tax on profits derived from the sale or disposal of the Notes (other than by redemption), provided that the profits do not have an Australian source and the Notes are not held as part of a business carried on at or through an Australian Establishment. The source of any profit on the disposal of Notes will ordinarily depend on the factual circumstances of the actual disposal. Where the Notes are acquired and disposed of pursuant to contractual arrangements entered into and concluded outside Australia, and the seller and the purchaser are non-residents of Australia and do not have permanent establishments in Australia, the profit should not have an Australian source. Even if the profits did have an Australian source, the DTA would prevent Australia from imposing income tax if the seller is entitled to benefits under the DTA, the note is not held in connection with an Australian Establishment and the seller is an enterprise within the meaning of the DTA.
There are specific rules that can apply to treat a portion of the sales price of Notes as interest for withholding tax purposes. However, to the extent that any portion of the sales price is treated as interest, or in the nature of interest, then provided that the Notes otherwise pass the public offer test (as described above), Section 128F of the Australian Tax Act should apply and that portion will be exempt from Australian interest withholding tax.
Other Taxes
No ad valorem stamp, issue, registration or similar taxes are payable in Australia in connection with the issue of the Notes. Furthermore, a transfer of or agreement to transfer Notes, executed outside of Australia, will not be subject to Australian stamp duty.
The Commissioner of Taxation of the Commonwealth of Australia may give a direction under section 218 or section 255 of the Australian Tax Act or section 260-5 of the Taxation Administration Act of 1953 requiring the issuer to deduct from any payment to any other party (including any holder of Notes) any amount in respect of income tax payable by that other party in respect of the other party’s other Australian sourced income or sales.
Section 12-140 of the Taxation Administration Act 1953 of Australia (the “TAA”) will impose a type of withholding tax at the rate of (currently) 48.5% on the payment of interest on certain securities unless the
147
Table of Contents
relevant investor has quoted a tax file number, in certain circumstances an Australian Business Number (“ABN”) or proof of some other exception. Assuming that the Notes will at all material times be in registered form and the requirements of section 128F of the Australian Tax Act are satisfied with respect to the Notes, this rule should not apply to payments to a holder of Notes who is not a resident of Australia for tax purposes and who does not hold the Notes in connection with a business carried on through an Australian Establishment. Withholdings may be made from payments to holders of Notes who are residents of Australia who do not quote a tax file number or an ABN, or provide proof of an appropriate exemption.
Section 12-190 of the TAA imposes another type of withholding obligation such that if we make a payment to a holder of a Note for a supply the holder of the Note has made to us in the course of furtherance of an enterprise carried on in Australia by that holder, we must withhold amounts from that payment at the prescribed rate (currently 48.5%) unless that holder has quoted their ABN or another exception applies. There is some uncertainty as to the precise operation of these rules. However, these rules will not apply to payments of principal and interest by us to holders of Notes where a tax file number, ABN, or proof that a relevant exemption is applicable has been provided (in accordance with the above paragraph), or a deduction has been made by us for a failure to provide such information. Although the position is not free from doubt, on the basis that all holders of Notes will fall within Section 12-140 (discussed above), the withholding requirements in Section 12-190 of the TAA should have no residual operation.
No Notes will be subject to death, estate or succession duties imposed by Australia, or by any political subdivision therein having the power to tax, if held at the time of death.
Neither the issue of the Notes nor the payment of principal, premium (if any) and interest by the issuer in respect of the Notes would give rise to a liability to a goods and services tax in Australia.
Recent Developments
A number of significant changes to Australia’s tax laws have been effected as part of the Federal Government’s tax reform measures, including the New Business Tax System (Debt and Equity) Act 2001 (the “Debt/Equity Act”), which applies from July 1, 2001. These changes include new tests for characterizing debt (for all entities) and equity (for companies) for Australian tax purposes, including for the purposes of dividend withholding tax and interest withholding tax.
We intend to issue Notes which are to be characterized as “debt interests” for the purposes of the tests introduced by the Debt/Equity Act and the returns paid on the Notes are to be “interest” for the purpose of Section 128F of the Australian Tax Act. Accordingly, the Debt/Equity Act is unlikely to affect the Australian tax treatment of holders of Notes.
The Taxation Laws Amendment Bill (No. 4) 2003 (the “Bill”) was introduced into Federal Parliament on February 13, 2003 and, if enacted in its current form, will empower the Governor-General to make regulations requiring withholding from certain payments to non-residents after July 1, 2003. No draft regulations have been released, so it is not possible to determine what types of payments would be covered by the new rules, nor the rate of withholding. However, the bill expressly provides that the regulations will not apply to interest and other payments that are already subject to the current interest withholding tax rules or specifically exempt from those rules.
Further, regulations may only be made if the responsible minister is satisfied the specified payments are of a kind that could reasonably relate to assessable income of foreign residents. We have been advised by Arthur Robinson & Hedderwicks that they do not expect the regulations to apply to repayments of principal under the Notes, as such amounts are generally not income or gains. It is not yet known whether the regulations will apply to gains on redemption or sale of the Notes.
The Federal Government has introduced the New Business Tax System (Taxation of Financial Arrangements) Bill (No. 1) 2003 into Parliament which, among other things, sets our new rules to deal with the
148
Table of Contents
taxation consequences of foreign exchange transactions. It is possible that a United States holder may be required to account for foreign exchange gains and losses under these rules (for example, in relation to a holding of Notes as part of a business carried on at or through an Australian Establishment).
On Monday, May 12, 2003, Australia and the United States exchanged instruments of ratification for the Protocol signed on September 27, 2001 amending the Double Tax Agreement between Australia and the United States. The Protocol effectively prevents Australian interest withholding tax (whether or not the Section 128F exemption described above applies) applying to interest derived after July 1, 2003 by:
| (a) | certain United States governments and governmental authorities and agencies; and |
| (b) | certain unrelated financial institutions resident in the United States which substantially derive their profits by carrying on a business of raising and providing finance. |
Under the Protocol back-to-back loans and economically equivalent arrangements will be subject to the 10% interest withholding tax rate and the anti-avoidance provisions in the Australian Tax Act can apply.
United States Taxation
This section describes the material United States federal income tax consequences of owning the Notes and is the opinion of Sullivan & Cromwell LLP, our United States counsel. It applies to you only if you hold your Notes as capital assets for tax purposes. This section does not apply to you if you are a member of a class of holders subject to special rules, such as:
| • | a dealer in securities or currencies, |
| • | a trader in securities that elects to use a mark-to-market method of accounting for your securities holdings, |
| • | a bank, |
| • | a life insurance company, |
| • | a tax-exempt organization, |
| • | a person that owns Notes that are a hedge or that are hedged against interest rate risks, |
| • | a person that owns Notes as part of a straddle or conversion transaction for tax purposes, or |
| • | a person whose functional currency for tax purposes is not the US dollar. |
This section is based on the Internal Revenue Code of 1986, as amended, its legislative history, existing and proposed regulations under the Internal Revenue Code, published rulings and court decisions, all as currently in effect. These laws are subject to change, possibly on a retroactive basis.
We urge you to consult your own tax advisor concerning the consequences of owning these Notes in your particular circumstances under the Internal Revenue Code and the laws of any other taxing jurisdiction.
United States Holders
This subsection describes the tax consequences to a United States holder of New Notes acquired in exchange for Old Notes. You are a United States holder if you are a beneficial owner of a Note and you are:
| • | a citizen or resident of the United States, |
| • | a domestic corporation, |
149
Table of Contents
| • | an estate whose income is subject to United States federal income tax regardless of its source, or |
| • | a trust if a United States court can exercise primary supervision over the trust’s administration and one or more United States persons are authorized to control all substantial decisions of the trust. |
If you are not a United States holder, this subsection does not apply to you and you should refer to “United States Alien Holders” below.
If you are a partnership, or a partner in a partnership, for United States federal income tax purposes, special rules apply and you should consult your tax advisor as to your tax consequences.
Payments of Interest.
You will be taxed on interest on your Note, including special interest (if any), as ordinary income at the time you receive the interest or when it accrues, depending on your method of accounting for tax purposes.
If Australian tax is withheld on payments of interest you must include any tax withheld from the interest payment as ordinary income even though you don’t receive it. You may be entitled to deduct or credit this tax, subject to applicable limits. The rules governing foreign tax credits are complex and you should consult your tax advisor regarding the availability of the foreign tax credit in your situation.
Interest paid by the issuer on the Notes is income from sources outside the United States, but, with certain exceptions, will be “passive” or “financial services” income, which is treated separately from other types of income for purposes of computing the foreign tax credit allowable to a United States holder.
Market Discount
Your Note will be a market discount Note if the difference between the Note’s stated redemption price at maturity and the price you paid for your Note is equal to or greater than ¼ of 1 percent of your Note’s stated redemption price at maturity multiplied by the number of complete years to the note’s maturity.
If your Note’s stated redemption price at maturity exceeds the price you paid for the Note by less than ¼ of 1 percent multiplied by the number of complete years to the Note’s maturity, the excess constitutes de minimis market discount, and the rules discussed below are not applicable to you.
You must treat any gain you recognize on the maturity or disposition of your market discount Note as ordinary income to the extent of the accrued market discount on your note. Alternatively, you may elect to include market discount in income currently over the life of your Note. If you make this election, it will apply to all debt instruments with market discount that you acquire on or after the first day of the first taxable year to which the election applies. You may not revoke this election without the consent of the Internal Revenue Service. If you own a market discount Note and do not make this election, you will generally be required to defer deductions for interest on borrowings allocable to your Note in an amount not exceeding the accrued market discount on your note until the maturity or disposition of your note.
You will accrue market discount on your market discount Note on a straight-line basis unless you elect to accrue market discount using a constant-yield method. If you make this election, it will apply only to the Note with respect to which it is made and you may not revoke it.
Notes Purchased at a Premium
If you purchase your Note for an amount in excess of its principal amount, you may elect to treat the excess as amortizable bond premium. If you make this election, you will reduce the amount required to be included in
150
Table of Contents
your income each year with respect to interest on your Note by the amount of amortizable bond premium allocable to that year, based on your Note’s yield to maturity. If you make an election to amortize bond premium, it will apply to all debt instruments, other than debt instruments the interest on which is excludible from gross income, that you hold at the beginning of the first taxable year to which the election applies or that you thereafter acquire, and you may not revoke it without the consent of the Internal Revenue Service.
Purchase, Sale and Retirement of the Notes.
Your tax basis in your Note generally will be its cost, except to the extent that the market discount rules described above are applicable. You will generally recognize capital gain or loss on the sale or retirement of your Note equal to the difference between the amount you realize on the sale or retirement, excluding any amounts attributable to accrued but unpaid interest, and your tax basis in your Note. Capital gain of a non-corporate United States holder is generally taxed at a maximum tax rate of 15% when the property is held for more than one year and the gain is recognized before January 1, 2009.
You will generally not recognize any gain or loss if you exchange your Old Notes for New Notes pursuant to the exchange offer being made by this prospectus.
United States Alien Holders
This subsection describes the tax consequences to a United States alien holder. You are a United States alien holder if you are a beneficial owner of a Note and you are, for United States federal income tax purposes:
| • | a non-resident alien individual, |
| • | a foreign corporation, |
| • | a foreign partnership, or |
| • | an estate or trust that in either case is not subject to United States federal income tax on a net income basis on income or gain from a Note. |
If you are a United States holder, this subsection does not apply to you.
Payments of Interest.
Under United States federal income and estate tax law, and subject to the discussion of backup withholding below, if you are a United States alien holder of a Note, interest on a Note paid to you is exempt from United States federal income tax, including withholding tax, whether or not you are engaged in a trade or business in the United States, unless:
| • | you are an insurance company carrying on a United States insurance business to which the interest is attributable, within the meaning of the Internal Revenue Code, or |
| • | you both |
| • | have an office or other fixed place of business in the United States to which the interest is attributable and |
| • | derive the interest in the active conduct of a banking, financing or similar business within the United States. |
Purchase, Sale, Retirement and Other Disposition of the Notes.
If you are a United States alien holder of a Note, you generally will not be subject to United States federal income tax on gain realized on the sale, exchange, retirement or other disposition of a Note, including any redemption by the issuer, unless:
| • | the gain is effectively connected with your conduct of a trade or business in the United States or |
151
Table of Contents
| • | you are an individual, you are present in the United States for 183 or more days during the taxable year in which the gain is realized and certain other conditions exist. |
For purposes of the United States federal estate tax, the Notes will be treated as situated outside the United States and will not be includible in the gross estate of a holder who is neither a citizen nor a resident of the United States at the time of death.
Backup Withholding and Information Reporting
If you are a non-corporate United States holder, information reporting requirements, on Internal Revenue Service Form 1099, generally will apply to:
| • | payments of principal and interest on a Note within the United States, including payments made by wire transfer from outside the United States to an account you maintain in the United States, and |
| • | the payment of the proceeds from the sale of a Note effected at a United States office of a broker. |
Additionally, backup withholding will apply to such payments if you are a non-corporate United States holder that:
| • | fails to provide an accurate taxpayer identification number, |
| • | is notified by the Internal Revenue Service that you have failed to report all interest and dividends required to be shown on your federal income tax returns, or |
| • | in certain circumstances, fails to comply with applicable certification requirements. |
If you are a United States alien holder, you are generally exempt from backup withholding and information reporting requirements with respect to:
| • | payments of principal and interest made to you outside the United States by the issuer or another non-United States payor, and |
| • | other payments of principal and interest and the payment of the proceeds from the sale of a Note effected at a United States office of a broker, as long as the income associated with such payments is otherwise exempt from United States federal income tax, and: |
| • | the payor or broker does not have actual knowledge or reason to know that you are a United States person and you have furnished to the payor or broker: |
| • | an Internal Revenue Service Form W-8BEN or an acceptable substitute form upon which you certify, under penalties of perjury, that you are a non-United States person, or |
| • | other documentation upon which it may rely to treat the payments as made to a non-United States person in accordance with US Treasury regulations, or |
| • | you otherwise establish an exemption. |
Payment of the proceeds from the sale of a Note effected at a foreign office of a broker generally will not be subject to information reporting or backup withholding. However, a sale of a Note that is effected at a foreign office of a broker will be subject to information reporting and backup withholding if:
| • | the proceeds are transferred to an account maintained by you in the United States, |
| • | the payment of proceeds or the confirmation of the sale is mailed to you at a United States address, or |
| • | the sale has some other specified connection with the United States as provided in US Treasury regulations, unless the broker does not have actual knowledge or reason to know that you are a United States person and the documentation requirements described above are met or you otherwise establish an exemption. |
152
Table of Contents
In addition, a sale of a Note effected at a foreign office of a broker will be subject to information reporting if the broker is:
| • | a United States person, |
| • | a controlled foreign corporation for United States tax purposes, |
| • | a foreign person 50% or more of whose gross income is effectively connected with the conduct of a United States trade or business for a specified three-year period, or |
| • | a foreign partnership, if at any time during its tax year: |
| • | one or more of its partners are “US persons”, as defined in US Treasury regulations, who in the aggregate hold more than 50% of the income or capital interest in the partnership, or |
| • | such foreign partnership is engaged in the conduct of a United States trade or business, unless the broker does not have actual knowledge or reason to know that you are a United States person and the documentation requirements described above are met or you otherwise establish an exemption. Backup withholding will apply if the sale is subject to information reporting and the broker has actual knowledge that you are a United States person. |
In addition, a sale of a note effected at a foreign office of a broker will be subject to information reporting if the broker is:
| • | a United States person, |
| • | a controlled foreign corporation for United States tax purposes, |
| • | a foreign person 50% or more of whose gross income is effectively connected with the conduct of a United States trade or business for a specified three-year period, or |
| • | a foreign partnership, if at any time during the tax year: |
| • | one or more of its partners are “U.S. persons”, as defined in U.S. Treasury regulations, who in the aggregate hold more than 50% of the income or capital interest in the partnership, or |
| • | such foreign partnership is engaged in the conduct of a United States trade or business, |
unless the broker does not have actual knowledge or reason to know that you are a United States person and the documentation requirements described above are met or you otherwise establish an exemption. Backup withholding will apply if the sale is subject to information reporting and the broker has actual knowledge that you are a United States person.
153
Table of Contents
Each broker-dealer that receives New Notes for its own account in connection with the exchange offers must acknowledge that it will deliver a prospectus in connection with any resale of such New Notes. This prospectus, as it may be amended or supplemented from time to time, may be used by such broker-dealers during the period referred to below in connection with resales of New Notes received in exchange for Old Notes if such Old Notes were acquired by such broker-dealers for their own accounts as a result of market making activities or other trading activities. We have agreed that this prospectus, as it may be amended or supplemented from time to time, may be used by such broker-dealers in connection with resales of such New Notes for a period ending 180 days after the expiration date of the applicable exchange offer, or, if earlier, when all such New Notes of the series subject to such exchange offer have been disposed of by such broker-dealers.
We will not receive any proceeds from the issuance of New Notes in the exchange offers or from any sale of New Notes by broker-dealers. New notes received by broker-dealers for their own accounts may be sold from time to time in one or more transactions in the over-the-counter market, in negotiated transactions, through the writing of options on the New Notes or a combination of such methods of resale, at market prices prevailing at the time of resale at prices related to such prevailing market prices or at negotiated prices. Any such resale may be made directly to purchasers or to or through brokers or dealers who may receive compensation in the form of commissions or concessions from any such broker-dealer and/or the purchasers of any such New Notes. Any broker-dealer that resells New Notes that were received by it for its own account in connection with the exchange offers and any broker or dealer that participates in a distribution of such New Notes may be deemed to be an “underwriter” within the meaning of the Securities Act, and any profit on any such resale of New Notes may be deemed to be underwriting compensation under the Securities Act. The letter of transmittal states that by acknowledging that it will deliver and by delivering a prospectus, a broker-dealer will not be deemed to admit that it is an “underwriter” within the meaning of the Securities Act.
VALIDITY OF THE NEW NOTES AND GUARANTEE
Sullivan & Cromwell, United States counsel to the issuer and guarantors, will pass upon the validity of each series of New Notes and the guarantees. Arthur Robinson & Hedderwicks, Australian counsel to the issuer and guarantors, will pass upon Australian law matters.
The financial statements of WMC Resources Ltd and its controlled entities, a carved-out business of WMC Limited (as described in Note 1 to the audited Consolidated Financial Statements), as of December 31, 2002 and 2001 and for each of the three years in the period ended December 31, 2002 included in this Registration Statement have been so included in reliance on the audit report of PricewaterhouseCoopers, independent accountants, given on the authority of said firm as experts in auditing and accounting. PricewaterhouseCoopers is a member of the Australian Institute of Chartered Accountants.
154
Table of Contents
“ADR” means an American Depositary Receipt evidencing one or more ADSs.
“ADS” means an American Depositary Share.
“Alumina Limited” is the new name of WMC Limited, our parent entity prior to the demerger.
“ASX” means the Australian Stock Exchange.
“AWAC” means Alcoa World Alumina and Chemicals.
“Cash Flow Hedge” means a contract which hedges an exposure to changes in cash flows from an expected future transaction related to a forecast purchase or sale or an existing asset or liability.
“Commissioned” means the bringing into operation of plant and/or equipment at a rate approximating its design capacity.
“Consolidated” means the consolidation of entities controlled by us. Unincorporated joint ventures are consolidated on a proportionate basis.
“Counterparty Credit Risk” means the risk of financial loss arising out of holding a particular contract or portfolio of contracts as a result of one or more parties to the relevant contract(s) failing to fulfill its financial obligations under the contract.
“Cross-Currency Swap” means the exchange of cash flows in one currency for those in another, often requiring an exchange of principal.
“Currency Forward” means an agreement to exchange a specified amount of one currency for another at a future date at a certain rate.
“DAP” means di-ammonium phosphate.
“Decline” means a downwards sloping tunnel providing road access from the surface to underground mine operations.
“Demerger” means the demerger of WMC Limited’s interest in AWAC from its other operating businesses pursuant to an Australian scheme of arrangement and associated capital reduction and dividend distribution.
“Depositary” means The Bank of New York Company, Inc., 101 Barclay Street New York NY 10286.
“Derivative” means an instrument or product whose value changes with changes in one or more underlying market variables, such as equity or commodity prices, interest rates or foreign exchange rates. Basic derivatives include forwards, futures, swaps, options, warrants and convertible bonds.
“Dilution” means the incorporation of waste rock with the ore during the mining process resulting in lower grade.
“Exchange Act” means the US Securities Exchange Act of 1934, as amended, and the rules and regulations of the SEC promulgated thereunder.
“Fair Value” means, in the context of commodity, currency and interest rate hedging, the current market value (mark-to-market) of financial positions.
“Fair Value Hedge” means a contract which hedges an exposure to the change in fair value of a recognized asset, liability or an unrecognized firm commitment (or a part thereof) attributable to a particular risk.
155
Table of Contents
“Foreign Currency Hedge” means a contract which hedges the foreign exchange exposure of:
| • | an unrecognized firm commitment (fair value hedge); |
| • | an available for sale security (fair value hedge); |
| • | a forecast transaction (cash flow hedge); or |
| • | a net investment in a foreign operation. |
“Grass Roots Exploration” is exploration undertaken at new sites not related to existing operations (also known as “green fields” exploration).
“Hedge” means to reduce risk by entering into transactions that reduce exposure to market fluctuations. A hedge is also the term for the transactions made to effect this reduction.
“Hedge Accounting” means the practice of deferring accounting recognition of gains and losses on financial market hedges until the corresponding gain or loss of the underlying exposure is recognized.
“HSRA” means the Australian/US dollar Hedge Settlement Rate quoted on Reuters Screen HSRA.
“Indenture” means the agreement between the Government of South Australia and WMC (Olympic Dam Corporation) Pty Ltd, a form of which is filed herewith as Exhibit 4.A.
“Interest Rate Swap” means an agreement to exchange net future cash flows. Interest rate swaps most commonly change the basis on which liabilities are paid on a specified principal. They are also used to transform the interest basis of assets. In its commonest form, the fixed-floating swap, one counterparty pays a fixed rate and the other pays a floating rate based on a reference rate, such as LIBOR. There is no exchange of principal—the interest rate payments are made on a notional amount.
“LME” means the London Metals Exchange.
“Marking-to-Market” means to calculate the value of a financial instrument (or portfolio of such instruments) based on the current market rates or prices of the underlying instrument.
“Mineral” is a naturally occurring element or chemical compound.
“Mineralization” is a concentration of a valuable mineral or minerals.
“Nickel Matte” is the output of a nickel smelter, being predominantly nickel sulphides plus some impurities. This is typically fed to a refinery for nickel metal production. Matte can be sold as a commercial product in its own right.
“NYSE” means the New York Stock Exchange.
“Open-cut” or “Open-pit” means a mine at the earth’s surface as distinct from an underground mine.
“Option” means a contract that gives the purchaser the right, but not the obligation, to buy or sell an underlying security or instrument at a certain price (the exercise, or strike price) on or before an agreed date (the exercise period). For this right, the purchaser pays a premium to the seller. The seller (writer) of an option has a duty to buy or sell at the strike price, should the purchaser exercise his right.
“Ore” means a naturally occurring solid resource (often rock) from which a mineral or minerals can be extracted.
156
Table of Contents
“Ore Reserve” means that part of a mineral deposit which could be economically mined and legally extracted or produced at the time of the reserve determination. Ore reserve estimates in this prospectus include adjustments for dilution and mine recovery loss during the mining process but do not include adjustments for metallurgical recovery. These ore reserves comply with those prescribed by the United States Securities and Exchange Commission’s Industry Guide 7.
“Probable Ore Reserves” means reserves for which quantity and grade and/or quality are computed from information similar to that used for proven ore reserves, but the sites for inspection, sampling and measurement are farther apart or are otherwise less adequately spaced. The degree of assurance, although lower than that for proven ore reserves, is high enough to assume continuity between points of observation.
“Proven Ore Reserves” means reserves for which (a) the quantity is computed from dimensions revealed in outcrops, trenches, workings or drill holes; the grade and/or quality are computed from the results of detailed sampling and (b) the sites for inspection, sampling and measurement are spaced so closely and the geologic character is so well defined that size, shape, depth and mineral content of reserves are well established.
“SCH” means a transfer of securities on the Clearing House Electronic Subregister System operated by ASX Settlement and Transfer Corporation Pty Ltd.
“SEC” means the US Securities and Exchange Commission.
“Securities Act” means the US Securities Exchange Act of 1933, as amended, and the rules and regulations of the SEC promulgated thereunder.
“Stoping” means the extraction of ore in an underground mine, leaving behind a void.
“Sulphides” means a compound of metal elements and sulphur.
“Tailings” are the residue remaining after extraction of the valuable components from ore.
“WA Mining Act 1978” refers to legislation passed by the Government of the State of Western Australia with which all mining operations in that State must comply.
“WMC Limited” refers to the parent entity of WMC Resources prior to the demerger on December 4, 2002. WMC Limited changed its name to Alumina Limited in connection with the demerger.
“WMC Resources” means WMC Resources Ltd together with its subsidiaries. Unless indicated otherwise, references to WMC Resources prior to the effective date of the demerger, December 4, 2002, are to the assets and businesses of WMC Limited that WMC Resources owned immediately upon effectiveness of the demerger.
157
Table of Contents
Financial Terms
US equivalent | Australian equivalent | |
Stockholders’ Equity | Total Equity | |
Subscribed Capital Stock | Contributed Equity | |
Common Stock | Ordinary Shares | |
Retained Earnings Appropriated Surplus | Retained Profits Reserve, e.g. General Reserve. Forms part of Shareholders’ Equity | |
Paid-in Surplus | Share Premium Reserve | |
Reserve—can represent either part of Stockholders’ Equity, accrued liability or estimated depletion in the cost of an asset | Provision—accrued liability, i.e., not part of Total Equity | |
Property, Plant and Equipment | Property, Plant and Equipment | |
Stock Dividend | Bonus Issue | |
Subsidiary | Controlled Entity | |
Sales Revenue | Sales Revenue | |
Depreciation and depletion | Depreciation | |
Net income | Net profit attributable to members |
1 troy ounce | = | 31.103 grams | ||
1 kilogram | = | 32.15 troy ounces | ||
1 kilogram | = | 2.205 pounds | ||
1 tonne | = | 1,000 kilograms | ||
1 tonne | = | 2,205 pounds | ||
1 gram per tonne | = | 0.0292 troy ounces per (short) ton | ||
1 kilometer | = | 0.6214 miles |
Gold recovered is reported in troy ounces (expressed as “ounces” in this prospectus), the customary market unit, whereas ore production and grades are quoted in metric units, that is, tonnes and grams per tonne.
158
Table of Contents
The New Notes of each series have been accepted for clearance through the Clearstream, Luxembourg and Euroclear systems. The International Securities Identification Number for the New 2013 Notes is US92928WAF23 and for the New 2033 Notes is US92928WAH88. The CUSIP number for the New 2013 Notes is 92928WAF2 and for the New 2033 Notes is 92928WAH8.
In connection with the application to list the New Notes of each series on the Luxembourg Stock Exchange, a legal notice relating to the issue of each series of Notes and copies of the constitutional documents of WMC Finance (USA) and each of WMC Resources Ltd, WMC (Olympic Dam Corporation) Pty Ltd and WMC Fertilizers Pty Ltd will be deposited with the Chief Registrar of the District Court in Luxembourg (“Registre de Commerce et des Sociétés”) before the listing date, where such documents may be examined and copies obtained.
WMC Finance (USA) and the guarantors have obtained all necessary consents, approvals and authorizations in Australia in connection with the issue and performance of the Notes and the guarantees, respectively. The issue of the New Notes by WMC Finance (USA) was authorized by a resolution of the board of directors of WMC Finance (USA) passed on May 1, 2003 and the giving of the guarantees in respect of the New Notes by each of the guarantors was authorized by a resolution of the boards of directors of each of WMC Resources Ltd, WMC (Olympic Dam Corporation) Pty Ltd and WMC Fertilizers Pty Ltd passed on February 25, 2003, May 1, 2003 and May 1, 2003, respectively.
Except as disclosed in this prospectus, there has been no significant change in the financial or trading position of WMC Finance (USA) or any of the guarantors since December 31, 2002 and no material adverse change in the financial position or prospects of WMC Finance (USA) or any of the guarantors since December 31, 2002.
Neither WMC Finance (USA) nor any of the guarantors is involved in any legal or arbitration proceedings (including any proceedings which are pending or threatened of which WMC Finance (USA) or any of the guarantors is aware) which are material in the context of the issue of either series of Notes.
Copies of the most recently published audited annual consolidated and unaudited half-yearly interim financial statements of the WMC Resources Group as well as copies of the most recent unconsolidated entity-only financial statements of WMC Finance (USA) and the most recent unconsolidated parent-only financial statements of WMC Resources Ltd may be obtained, and copies of the indenture, the first supplemental indenture and the Notes of each series (including the guarantees) will be available from the specified office of the paying and transfer agent for the time being in Luxembourg during normal business hours, so long as any of the Notes of either series is outstanding.
Copies of the consolidated financial statements for the WMC Resources Group for the fiscal years ended December 31, 2002, 2001 and 2000, unconsolidated entity-only financial statements of WMC Finance (USA) for the fiscal years ended December 31, 2002 and 2001 and unconsolidated parent only financial statements of WMC Resources Ltd for the fiscal year ended December 31, 2002 will be made available free of charge at the specified office of our paying and transfer agent in Luxembourg. Since their respective dates of incorporation, no financial statements of WMC (Olympic Dam Corporation) Pty Ltd or WMC Fertilizers Pty Ltd have been published.
European Union Taxation
We understand that the Council of the European Union is currently considering proposals for a new directive regarding the taxation of savings income. It is proposed that, subject to some important conditions being
159
Table of Contents
met, Member States of the European Union will be required to provide to the tax authorities of another Member State information regarding payments of interest or other similar income paid by a person, including a paying agent, within its jurisdiction to an individual resident in that other member state, except that Belgium, Luxembourg and Austria will instead operate a withholding system for a transitional period in relation to those payments. These proposals are not yet final, and therefore may be subject to further amendment and/or clarification.
160
Table of Contents

WMC RESOURCES LTD
(Australian Business Number 76 004 184 598)
AND CONTROLLED ENTITIES
U.S. FINANCIAL REPORT
AS OF AND FOR THE YEAR ENDED
31 DECEMBER 2002
Prepared in accordance
with Australian generally accepted
accounting principles (Australian GAAP)
except where noted
Amounts are stated in Australian dollars (A$) except where noted
F-1
Table of Contents
REPORT OF INDEPENDENT ACCOUNTANTS
To the Board of Directors of WMC Resources Ltd
We have audited the accompanying consolidated statements of financial position of WMC Resources Ltd and its controlled entities, a carved-out business of WMC Limited (as described in Note 1 to the consolidated financial statements), as of 31 December 2002 and 2001, and the related consolidated statements of financial performance, consolidated statements of cash flows and consolidated statements of changes in shareholders’ equity for the years ended 31 December 2002, 2001 and 2000. These consolidated financial statements are the responsibility of the Company’s management. Our responsibility is to express an opinion on these financial statements based on our audits. We conducted our audits in accordance with generally accepted auditing standards in Australia and the United States of America. Those standards require that we plan and perform the audits to obtain reasonable assurance about whether the financial statements are free of material misstatement. An audit includes examining, on a test basis, evidence supporting the amounts and disclosures in the financial statements. An audit also includes assessing the accounting principles used and significant estimates made by management, as well as evaluating the overall financial statement presentation. We believe that our audits provide a reasonable basis for our opinion.
In our opinion, the consolidated financial statements referred to above present fairly, in all material respects, the financial position of WMC Resources Ltd and its controlled entities at 31 December 2002 and 2001 and the results of their operations and cash flows for the years ended 31 December 2002, 2001 and 2000, in conformity with accounting principles generally accepted in Australia and the basis of accounting described in Note 1(a).
Accounting principles generally accepted in Australia vary in certain significant respects from accounting principles generally accepted in the United States of America. The application of accounting principles generally accepted in the United States of America would have affected the determination of consolidated shareholders’ equity and financial position as of 31 December 2002 and 2001 and the determination of consolidated results of operations for the years ended 31 December 2002, 2001 and 2000, to the extent summarised in Note 45 to the consolidated financial statements.
/s/ PRICEWATERHOUSECOOPERS |
PricewaterhouseCoopers Chartered Accountants |
| Melbourne, Australia |
May 2, 2003 except for Note 47 for which the date is June 19, 2003 |
F-2
Table of Contents
WMC RESOURCES LTD AND CONTROLLED ENTITIES
Consolidated Financial Statements as of and for the year ended 31 December 2002
Contents | Page | |
| F-4 | ||
| F-5 | ||
| F-6 | ||
| F-7 | ||
| F-8 | ||
| F-20 | ||
3. Disclosures About Items Included in Operating Income/(Loss) Before Income Tax | F-21 | |
| F-22 | ||
| F-23 | ||
| F-27 | ||
| F-29 | ||
| F-36 | ||
| F-36 | ||
| F-36 | ||
| F-36 | ||
| F-37 | ||
| F-38 | ||
| F-38 | ||
| F-38 | ||
| F-39 | ||
| F-39 | ||
| F-40 | ||
| F-42 | ||
| F-43 | ||
| F-44 | ||
| F-44 | ||
| F-45 | ||
| F-45 | ||
| F-46 | ||
| F-47 | ||
| F-47 | ||
| F-47 | ||
| F-48 | ||
| F-49 | ||
| F-49 | ||
| F-49 | ||
| F-54 | ||
| F-55 | ||
| F-56 | ||
| F-57 | ||
37. Particulars Relating to Entities Consolidated in the Economic Entity | F-65 | |
| F-70 | ||
| F-71 | ||
| F-73 | ||
| F-76 | ||
| F-79 | ||
| F-80 | ||
| F-82 | ||
| F-82 | ||
| F-96 | ||
| F-98 | ||
| F-111 | ||
F-3
Table of Contents
WMC RESOURCES LTD AND CONTROLLED ENTITIES
CONSOLIDATED STATEMENTS OF FINANCIAL PERFORMANCE
| Notes | Year to 31 Dec 2002 A$m | Year to 31 Dec 2001 A$m | Year to 31 Dec 2000 A$m | |||||||||
Continuing Operations: | ||||||||||||
Net sales revenue | 2 | 2,487.2 | 2,364.1 | 2,666.0 | ||||||||
Cost of goods sold | (1,840.8 | ) | (1,878.7 | ) | (1,672.0 | ) | ||||||
Selling and distribution | (157.3 | ) | (163.4 | ) | (147.4 | ) | ||||||
General and administrative | (312.4 | ) | (224.1 | ) | (192.3 | ) | ||||||
General and administrative—exceptional items | 4 | (51.2 | ) | (92.5 | ) | (17.8 | ) | |||||
Exploration and evaluation | (37.0 | ) | (71.9 | ) | (60.8 | ) | ||||||
Other expenses | (149.0 | ) | (64.2 | ) | (71.9 | ) | ||||||
Other expenses—exceptional items | (99.7 | ) | — | — | ||||||||
Other income | 67.9 | 202.6 | 240.7 | |||||||||
Other income—exceptional items | 209.9 | — | 38.0 | |||||||||
Profit before interest and income tax | 117.6 | 71.9 | 782.5 | |||||||||
Interest expense | 3 | (b) | (152.2 | ) | (295.2 | ) | (300.4 | ) | ||||
(Loss)/profit before income taxes | (34.6 | ) | (223.3 | ) | 482.1 | |||||||
Income tax credit/(expense) | 5 | (a) | 19.9 | 65.8 | (154.9 | ) | ||||||
Net (loss)/profit from continuing operations | (14.7 | ) | (157.5 | ) | 327.2 | |||||||
Discontinued Operations: | ||||||||||||
Net sales revenue | 2 | (1.4 | ) | 452.9 | 426.0 | |||||||
Net expenses | (2.7 | ) | (395.3 | ) | (339.5 | ) | ||||||
Income tax credit/(expense) | 5 | (a) | 1.3 | (15.2 | ) | (13.8 | ) | |||||
Profit on sale of right to Gold Royalty | 4 | 15.4 | — | — | ||||||||
Profit on sale of Central Norseman Gold Corporation Limited | 4 | 25.1 | — | — | ||||||||
Profit on disposal of gold operations (net of income tax benefit of $34.4 million in December 2001) | 4 | — | 170.0 | — | ||||||||
Profit on disposal of Three Springs Talc operation (net of income tax benefit of $1.4 million at December 2001) | 4 | — | 20.0 | — | ||||||||
Profit on disposal of equity interest in Mondo Minerals (net of income tax expense of $10.1 million in December 2001) | 4 | — | 51.1 | — | ||||||||
Net profit from discontinued operations | 37.7 | 283.5 | 72.7 | |||||||||
Consolidated Operations: | ||||||||||||
Net sales revenue | 2 | 2,485.8 | 2,817.0 | 3,092.0 | ||||||||
Cost of goods sold | (1,840.8 | ) | (2,232.4 | ) | (1,953.5 | ) | ||||||
Selling and distribution | (157.3 | ) | (165.8 | ) | (149.9 | ) | ||||||
General and administrative | (315.5 | ) | (252.7 | ) | (217.8 | ) | ||||||
General and administrative—exceptional items | 4 | (51.2 | ) | (513.1 | ) | (17.8 | ) | |||||
Exploration and evaluation | (37.2 | ) | (95.1 | ) | (79.8 | ) | ||||||
Other expenses | (148.6 | ) | (52.2 | ) | (83.9 | ) | ||||||
Other expenses—exceptional items | (137.6 | ) | — | — | ||||||||
Other income | 68.1 | 204.0 | 241.7 | |||||||||
Other income—exceptional items | 288.3 | 635.2 | 38.0 | |||||||||
Profit before interest and income tax | 154.0 | 344.9 | 869.0 | |||||||||
Interest expense | 3 | (b) | (152.2 | ) | (295.2 | ) | (300.4 | ) | ||||
Profit before income taxes | 1.8 | 49.7 | 568.6 | |||||||||
Income tax credit/(expense) | 5 | (a) | 21.2 | 76.3 | (168.7 | ) | ||||||
Net profit attributable to holding company shareholders | 23.0 | 126.0 | 399.9 | |||||||||
Foreign currency adjustments | 3.1 | (14.1 | ) | (19.2 | ) | |||||||
Total changes in equity other than those resulting from transactions with owners as owners | 26.1 | 111.9 | 380.7 | |||||||||
Net earnings per share attributable to holding company shareholders (A$ per share) | ||||||||||||
Australian GAAP (basic) | 0.02 | 0.11 | 0.35 | |||||||||
Australian GAAP (diluted) | 0.02 | 0.12 | 0.35 | |||||||||
The accompanying notes form part of these consolidated financial statements.
F-4
Table of Contents
WMC RESOURCES LTD AND CONTROLLED ENTITIES
CONSOLIDATED STATEMENTS OF FINANCIAL POSITION
| Notes | As at A$m | As at A$m | ||||
Current Assets | ||||||
Cash assets | 8 | 90.5 | 124.1 | |||
Receivables | 9 | 557.7 | 496.0 | |||
Other financial assets | 10 | 12.7 | 20.1 | |||
Inventories | 11 | 468.8 | 410.2 | |||
Other | 12 | 69.6 | 230.5 | |||
Total current assets | 1,199.3 | 1,280.9 | ||||
Non-current Assets | ||||||
Receivables | 13 | 218.8 | 481.4 | |||
Investments in associates | 14 | — | — | |||
Other financial assets | 15 | 12.3 | 18.2 | |||
Inventories | 16 | 74.9 | 82.4 | |||
Exploration and evaluation | 17 | 152.7 | 64.5 | |||
Property, plant and equipment | 18 | 4,336.3 | 4,775.3 | |||
Acquired mineral rights | 19 | 1,269.3 | — | |||
Deferred tax assets | 20 | 44.6 | 303.7 | |||
Other | 21 | 39.9 | 1,236.5 | |||
Total non-current assets | 6,148.8 | 6,962.0 | ||||
Total Assets | 7,348.1 | 8,242.9 | ||||
Current Liabilities | ||||||
Payables | 22 | 657.9 | 855.2 | |||
Interest bearing liabilities | 23 | 1,287.6 | 584.3 | |||
Current tax liabilities | 24 | 3.9 | 8.0 | |||
Provisions | 25 | 66.0 | 74.7 | |||
Other | 26 | 17.0 | 15.1 | |||
Total current liabilities | 2,032.4 | 1,537.3 | ||||
Non-current Liabilities | ||||||
Payables | 27 | 849.7 | 1,197.7 | |||
Interest bearing liabilities | 28 | 369.9 | 1,737.7 | |||
Deferred tax liabilities | 29 | 377.0 | 434.6 | |||
Provisions | 30 | 109.7 | 97.0 | |||
Other | 31 | 2.8 | 9.3 | |||
Total non-current liabilities | 1,709.1 | 3,476.3 | ||||
Total Liabilities | 3,741.5 | 5,013.6 | ||||
Minority shareholders’ interest in subsidiaries | 33 | — | 9.0 | |||
Net Assets | 3,606.6 | 3,220.3 | ||||
Equity | 32 | 3,606.6 | 3,220.3 | |||
Commitments | 39 | |||||
Contingent liabilities and gains | 38 |
The accompanying notes form part of these consolidated financial statements.
F-5
Table of Contents
WMC RESOURCES LTD AND CONTROLLED ENTITIES
CONSOLIDATED STATEMENTS OF CASH FLOWS
| Notes | Year to 31 Dec 2002 A$m | Year to 31 Dec 2001 A$m | Year to 31 Dec 2000 A$m | |||||||||
Cash Flows From Operating Activities | ||||||||||||
Receipts from customers | 2,455.4 | 2,981.0 | 3,030.2 | |||||||||
Payments to suppliers and employees | (2,076.5 | ) | (2,212.7 | ) | (1,904.9 | ) | ||||||
Receipts from early close out of gold hedging book in 1998 | — | — | 7.9 | |||||||||
Interest and other items of a similar nature received | 29.5 | 51.5 | 88.0 | |||||||||
Borrowing costs | (151.3 | ) | (204.9 | ) | (246.2 | ) | ||||||
Proceeds from interest rate swap close out | 71.2 | 11.7 | — | |||||||||
Income taxes paid | (3.2 | ) | (6.7 | ) | (5.9 | ) | ||||||
Proceeds from insurance claims | 35.0 | 34.3 | 1.3 | |||||||||
Payments for: | ||||||||||||
—exploration (grassroots) | (19.7 | ) | (57.2 | ) | (51.2 | ) | ||||||
—exploration (additional, supporting existing operations) | (3.7 | ) | (19.3 | ) | (21.1 | ) | ||||||
Net cash provided by operating activities | 34 | (a) | 336.7 | 577.7 | 898.1 | |||||||
Cash Flows From Investing Activities | ||||||||||||
Payments for property, plant and equipment | (464.9 | ) | (426.8 | ) | (436.0 | ) | ||||||
Proceeds from sale of St Ives and Agnew gold operations | — | 432.0 | — | |||||||||
Proceeds from sale of Three Springs Talc operation | — | 56.0 | — | |||||||||
Proceeds from sale of equity interest in Mondo Minerals | — | 122.2 | — | |||||||||
Proceeds from sale of Central Norseman Gold Corporation Limited | 25.7 | — | — | |||||||||
Proceeds from sale of investments | — | 24.9 | 5.5 | |||||||||
Proceeds from sale of non-current assets | 67.6 | 64.2 | 32.5 | |||||||||
Proceeds from insurance claims | 27.3 | 23.6 | 17.1 | |||||||||
Proceeds from/(payments for) gold hedge close out | (34.4 | ) | 21.7 | — | ||||||||
Proceeds from/(payments for) short term investments | 2.6 | (8.6 | ) | (1.0 | ) | |||||||
Payments for research and development | (0.4 | ) | — | (0.3 | ) | |||||||
Payments for evaluation expenditure | (4.5 | ) | (4.9 | ) | (8.5 | ) | ||||||
Payment for purchase of Yakabindie Nickel Pty Limited | — | (25.2 | ) | — | ||||||||
Payment for option to conduct feasibility study | — | — | (28.6 | ) | ||||||||
Net cash (used in)/provided by investing activities | (381.0 | ) | 279.1 | (419.3 | ) | |||||||
Cash Flows From Financing Activities | ||||||||||||
Deemed equity contribution/(distribution) | 1 | (a) | 12.4 | (15.4 | ) | (471.2 | ) | |||||
Proceeds from borrowings | 2,307.9 | 277.2 | 745.0 | |||||||||
Repayments of borrowings | (2,754.3 | ) | (1,055.5 | ) | (782.7 | ) | ||||||
Proceeds from share issues | 600.0 | — | — | |||||||||
Yankee bond redemption fee | (150.2 | ) | — | — | ||||||||
Net cash provided by/(used in) financing activities | 15.8 | (793.7 | ) | (508.9 | ) | |||||||
Net (decrease)/increase in cash held | (28.5 | ) | 63.1 | (30.1 | ) | |||||||
Cash at the beginning of the financial year | 123.9 | 58.4 | 75.8 | |||||||||
Effects of exchange rate changes on foreign currency cash balances | (4.9 | ) | 2.4 | 12.7 | ||||||||
Cash at the end of the financial year | (a | ) | 90.5 | 123.9 | 58.4 | |||||||
(a) Reconciliation of cash | ||||||||||||
For the purposes of the consolidated statements of cash flows, cash represents cash on hand, at the bank and on short-term deposit (maturity of 3 months or less) less bank overdrafts: | ||||||||||||
Cash assets—US GAAP cash and cash equivalents | 8 | 90.5 | 124.1 | 62.3 | ||||||||
Bank overdrafts | 23 | — | (0.2 | ) | (3.9 | ) | ||||||
Australian GAAP cash and cash equivalents | 90.5 | 123.9 | 58.4 | |||||||||
The accompanying notes form part of these consolidated financial statements.
F-6
Table of Contents
WMC RESOURCES LTD AND CONTROLLED ENTITIES
CONSOLIDATED STATEMENTS OF CHANGES IN EQUITY
Year ended 31 December 2002 | Share capital A$m | Asset revaluation reserve A$m | Foreign currency translation reserve A$m | Retained profits A$m | Carve-out equity A$m | Total equity A$m | |||||||||
Balance at the beginning of the financial year | 3,220.3 | 3,220.3 | |||||||||||||
Net income to 30 November 2002 | (32.1 | ) | (32.1 | ) | |||||||||||
Foreign currency adjustments | (3.1 | ) | (3.1 | ) | |||||||||||
Deemed equity contribution | 12.4 | 12.4 | |||||||||||||
Balance at 30 November 2002 | — | — | — | — | 3,197.5 | 3,197.5 | |||||||||
Net adjustments resulting from demerger related transactions | 3,653.4 | 24.5 | — | (132.6 | ) | (3,197.5 | ) | 347.8 | |||||||
Net income 1 December to 31 December 2002 | — | — | — | 55.1 | — | 55.1 | |||||||||
Foreign currency adjustments | — | — | 6.2 | — | — | 6.2 | |||||||||
Balance at the end of the financial year | 3,653.4 | 24.5 | 6.2 | (77.5 | ) | — | 3,606.6 | ||||||||
Year ended 31 December 2001 | Total equity A$m | ||
Balance at the beginning of the financial year | 3,123.8 | ||
Net income | 126.0 | ||
Foreign currency adjustments | (14.1 | ) | |
Deemed equity contribution/(distribution) | (15.4 | ) | |
Balance at the end of the financial year | 3,220.3 | ||
Year ended 31 December 2000 | Total equity A$m | ||
Balance at the beginning of the financial year | 3,214.3 | ||
Net income | 399.9 | ||
Foreign currency adjustments | (19.2 | ) | |
Deemed equity contribution/(distribution) | (471.2 | ) | |
Balance at the end of the financial year | 3,123.8 | ||
The accompanying notes form part of these consolidated financial statements.
F-7
Table of Contents
WMC RESOURCES LTD AND CONTROLLED ENTITIES
NOTES TO THE CONSOLIDATED FINANCIAL STATEMENTS
1. SUMMARY OF SIGNIFICANT ACCOUNTING POLICIES
| (a) | BACKGROUND AND BASIS OF ACCOUNTING |
Background
WMC Resources Ltd and its controlled entities (“WMC Resources”) is principally engaged in the discovery, development, production, processing, and marketing of minerals and metals. WMC Resources produces nickel, copper, phosphate fertilizers, uranium oxide, gold and other minor by-products.
On 11 December 2002 WMC Limited, the former parent entity of WMC Resources, consummated the separation of WMC Limited interest in Alcoa’s World Alumina and Chemicals business (AWAC), from its other mineral businesses which now comprise WMC Resources (the “demerger”).
Prior to effecting the demerger, through a series of transactions internal to the WMC Limited Group, WMC Resources acquired WMC Limited’s shares in the legal entities which held the copper/uranium and fertilizer businesses, WMC Finance Limited, WMC Finance (USA) Limited as well as WMC Limited’s exploration and development interests other than those relating to AWAC. Under Australian GAAP, all of these acquisitions were accounted for at fair value in return for shares in WMC Resources. Under US GAAP, the internal transactions were accounted for at book value. To consummate the demerger, WMC Limited effected a capital reduction and dividend to its shareholders in an amount equivalent to the value of WMC Resources after the internal transfers were completed. The entitlement of WMC Limited’s shareholders to the capital reduction and dividend was ultimately satisfied in the demerger through the distribution to WMC Limited’s shareholders of shares in WMC Resources on a one-for-one basis.
Basis of Accounting
The accompanying consolidated financial statements have been prepared in accordance with Australian Accounting Standards and other mandatory professional reporting requirements. These standards and reporting requirements form part of generally accepted accounting principles in Australia (Australian GAAP). Where these principles differ from those generally accepted in the United States of America (US GAAP), reference is made by footnote. A reconciliation of the major differences between these principles and those applicable under US GAAP is included as Note 45.
The financial report is prepared in accordance with the historical cost convention. Unless otherwise stated, the accounting policies adopted are consistent with those of the previous year.
The demerger was given accounting effect on 30 November, 2002. Accordingly, the financial position, results of operations and cash flows of the demerged WMC Resources at and for the one month ended December 31, 2002 represent the consolidated operations of WMC Resources and its subsidiaries. The transfers of the businesses to WMC Resources (i.e. the internal transactions referred to in the background paragraph above) were effected at fair value in accordance with Australian GAAP with effect on 30 November 2002. The resulting adjustment directly impacts shareholders’ equity reflecting the internal nature of the transaction.
For fiscal 2000, 2001 and the first eleven months of fiscal 2002, the financial statements have been prepared on a carve-out basis and include the financial position, results of operations and cash flows of WMC Resources’ incumbent nickel business and of the copper/uranium and fertilizer businesses that were transferred to WMC Resources from WMC Limited in the demerger. Also reported are the discontinued gold and talc operations of WMC Limited sold during 2001. These financial statements have been principally prepared from historical accounting records of the WMC Limited Group and present substantially all of the operations of the businesses
F-8
Table of Contents
WMC RESOURCES LTD AND CONTROLLED ENTITIES
NOTES TO THE CONSOLIDATED FINANCIAL STATEMENTS—(Continued)
as if WMC Resources had been a separate economic entity inclusive of all of these businesses for all periods presented.
Changes to equity in the periods presented arise from net income or loss, other comprehensive income and other deemed contributions/distributions with WMC Limited. Deemed equity contributions/distributions represent the dividends received from AWAC, dividends paid and other capital transactions of WMC Limited net of cash retained by WMC Limited.
WMC Resources uses a centralized approach to cash management and the financing of its operations through WMC Finance. As determined in the demerger proposal, WMC Resources acquired WMC Finance and WMC Finance (USA) Limited. Therefore the balance sheet includes all of the debt and the income statement includes the interest expense previously reported by the WMC Limited Group, as the debt was used exclusively to fund WMC Resources’ projects.
WMC Resources participated in WMC Limited’s centralized risk management function. As part of this activity, derivative financial instruments were utilized to manage risks generally associated with commodity, currency and interest rate market volatility. WMC Limited did not hold or issue derivative financial instruments for trading purposes. The historical balance sheets of WMC Resources reflect the associated asset and liability positions resulting from this activity because WMC Resources assumed WMC Limited’s derivative financial instruments through its acquisition of WMC Finance. The derivative financial instruments referred to were used exclusively to manage WMC Resources’ risks in the periods presented. The historical statements of operations and statements of cash flows reflect the related gains and losses arising from these instruments.
General corporate overhead related to corporate headquarters and common support divisions has been included in these results based on amounts incurred by WMC Limited less an amount that was solely applicable to the remaining businesses of WMC Limited. Management believes these assumptions are reasonable. Subsequent to the demerger, WMC Resources has performed these functions using its own resources or purchased services and is responsible for the costs and expenses associated with the management of a public corporation.
WMC Resources’ financial statements include the costs experienced by the WMC Limited pension and post-retirement benefit plans for those employees and retirees for whom WMC Resources has assumed responsibility.
The preparation of financial statements in conformity with generally accepted accounting principles (“GAAP”) requires management to make estimates and assumptions that affect the reported amounts of assets and liabilities and disclosure of contingent assets and liabilities at the dates of the financial statements and the reported amounts of revenues and expenses during the reporting periods.
(b) PRINCIPLES OF CONSOLIDATION
The consolidated financial report is prepared for the economic entity, being WMC Resources Ltd (parent entity) and the entities it controls following the transfer of certain entities to WMC Resources as a result of the demerger (controlled entities). Australian GAAP defines entity widely including any legal, administrative or fiduciary arrangement. All material entities in the group are companies. In preparing the financial statements, the effects of all transactions between entities within the group are eliminated in full.
Where control of an entity is obtained during a financial year, its results are included in the consolidated statements of income from the date on which control commences. Where control of an entity ceases during a financial year, its results are included for that part of the year during which control existed.
F-9
Table of Contents
WMC RESOURCES LTD AND CONTROLLED ENTITIES
NOTES TO THE CONSOLIDATED FINANCIAL STATEMENTS—(Continued)
Equity accounting is applied in respect of the group’s interest in the earnings and reserves of bodies corporate, including incorporated partnerships, which the group does not control, but in which it has an equity interest of generally between 20 and 50 per cent and significant influence or joint control.
WMC Resources does not use the cost method to account for any entities for which there is a greater than 20% ownership.
| (c) | FOREIGN CURRENCY TRANSLATION |
Transactions
Foreign currency transactions are initially translated into Australian currency at the rate of exchange at the date of the transaction. The subsequent payment or receipt of funds relating to that transaction is translated at the rate applicable on the date of payment or receipt. Any such amounts outstanding at balance date are translated at the rate of exchange prevailing on the balance date.
Controlled foreign entities
Self-sustaining controlled entities which account in foreign currencies are translated into Australian currency using rates of exchange current at balance date for assets and liabilities, and actual or an average of rates ruling during the reporting period for revenues and expenses. All exchange gains and losses arising on these translations are taken to the foreign currency translation reserve as part of other comprehensive income.
The exchange gains and losses arising on those foreign currency borrowings (net of gains and losses on any related specific hedge contracts) which are designated as hedges of investments in self-sustaining controlled foreign entities are offset in the foreign currency translation reserve against the exchange gains and losses arising on the translation of the net assets of those entities. These circumstances represent an effective natural hedge.
For integrated foreign controlled entities, monetary assets and liabilities are translated into Australian currency at rates of exchange current at balance date, while non-monetary items and revenue and expense items are translated at exchange rates current when the transactions occurred. Exchange differences arising on translation are brought to account in the income statement.
| (d) | INCOME TAX |
The provision for income taxes in WMC Resources’ Consolidated financial statements has been determined on a separate-return basis. The liability method of tax-effect accounting is used, whereby the income tax expense for the year is matched with the accounting profit after allowance for permanent differences. The income tax effect of significant permanent differences on the tax expense for the year is set out in Note 5. Income tax set aside on cumulative timing differences is brought to account as either a provision for deferred income tax or an asset described as future income tax benefits at the rate of income tax applicable to the period in which the liability will become payable or the benefit will be received.
The future income tax benefit relating to tax losses is not carried forward as an asset unless the benefit can be regarded as being virtually certain of realization. The future income tax benefit relating to timing differences is not carried forward as an asset unless its realization is assured beyond any reasonable doubt.
Accounting for income taxes in Australia is substantially the same as prescribed under FAS109 ‘Accounting for Income Taxes’. US GAAP requires that all future income tax benefits are brought to account, but that a valuation allowance is raised against benefits unlikely to be recouped. These benefits and valuation allowances
F-10
Table of Contents
WMC RESOURCES LTD AND CONTROLLED ENTITIES
NOTES TO THE CONSOLIDATED FINANCIAL STATEMENTS—(Continued)
are disclosed in Note 5. Australian GAAP only allows future income tax benefits to be recognized where realization of the benefit is assured beyond any reasonable doubt. Furthermore, where these benefits comprise tax losses, the realization of these losses must be virtually certain for the benefit to be recognized (see Note 5(b)). The effects on net income are similar.
| (e) | REVENUE RECOGNITION |
Sales revenue is measured at the fair value of the consideration received, and is recognized when each of the following conditions are met:
(i) persuasive evidence of an arrangement exists, which is usually in the form of a contractual arrangement.
(ii) title in the product has transferred to the buyer, which in most cases occurs when the product passes ships rail, at the port of loading.
(iii) the seller’s price to the buyer is fixed or determinable. In the case of certain products sold by the company, including nickel concentrate, nickel matte and copper cathode, revenue is recognized on a provisional basis at the time of title transfer, based on prevailing market prices and contained metal, and is subject to final adjustment at the end of periods ranging from 30 to 90 days in most cases, for movements in market prices to the end of those periods. Revenue initially recognized is equal to the contained quantity of metal, measured at the forward price. At each subsequent period end date prior to final settlement, revenue is remeasured based on the prevailing forward price. Refer to Note 2 for details of amounts of revenue recognized subject to final settlement. Revenue is considered determinable at the recognition point, due to the existence of an actively traded and widely quoted market on the London Metals Exchange for the relevant metals. Market prices are the only aspect of recognized revenue subject to material change at the time of recognition. Final sales prices are determined based on contained metal and the market price at the relevant quotation point stipulated in each contract, which is generally on or around the end of the settlement period.
(iv) collectability is reasonably assured.
(f) RECEIVABLES
All trade debtors are recognized as the amounts receivable upon settlement. Collectability of trade debtors is reviewed on an ongoing basis. Debts that are known to be uncollectible are written off. A provision is raised when some doubt exists about collection.
| (g) INVENTORIES |
Stores
Stores represent consumable supplies and maintenance spares and are valued at weighted average cost. Provision is made for obsolescence, where items relate to units of property that are no longer used or the items themselves have been superseded.
Trading stocks and work in progress
Trading stocks represent all products which are in the form in which they are expected to be sold by the relevant business.
Work in progress, including ore stocks, consists of stocks on which further processing is required by, or on behalf of, the relevant business to convert them to trading stocks.
F-11
Table of Contents
WMC RESOURCES LTD AND CONTROLLED ENTITIES
NOTES TO THE CONSOLIDATED FINANCIAL STATEMENTS—(Continued)
Work in progress, classified as non-current, relates to costs associated with ore on heap leach pads, or in broken ore stockpiles not expected to be processed into final product and realized through sale within twelve months from the balance sheet date.
Broken ore which is above a predetermined cut-off grade is stockpiled for future processing. The processing of this ore is contemplated within each current mine plan and is dependent on commodity prices and the life of the mine. Broken ore below the cut-off grade is also stockpiled, however the costs associated with this ore are expensed as incurred, as its future processing is uncertain. Costs associated with ongoing waste removal are treated in accordance with the accounting policy relating to mine properties and mine development (refer to Note 1(l)).
Trading stocks and work in progress are valued at the lower of cost and net realizable value. Cost approximates weighted average cost and includes direct costs and an appropriate portion of fixed and variable direct overhead expenditure, including depreciation and amortization. Net realizable value is the amount estimated to be obtained from sale of the item of inventory in the normal course of business, less any anticipated costs to be incurred prior to its sale.
| (h) | RECOVERABLE AMOUNT OF NON-CURRENT ASSETS |
The recoverable amount of an asset is the net amount expected to be recovered through the cash inflows and outflows arising from its continued use and subsequent disposal.
Recoverable amounts of non-current assets are assessed based on undiscounted future net cash flows expected to be generated from the assets. Where net cash inflows are derived from a group of assets working together, recoverable amount is determined on the basis of the relevant group of assets. The values of assets are reviewed on an ongoing basis, and where the carrying amount exceeds recoverable amount, the carrying amounts of non-current assets are revalued downwards to the lower of their recoverable amount or market value. The decrement in the carrying amount is recognized as an expense in the statement of financial performance in the reporting period in which the writedown occurs.
(i) ACQUISITION OF ASSETS
The purchase method of accounting is used for all acquisitions of assets regardless of whether shares or other assets are acquired. Cost is measured as the fair value of the assets given up, shares issued or liabilities undertaken at the date of acquisition plus incidental costs directly attributable to the acquisition. Where shares are issued in an acquisition the value of the shares is the market price, or where no market price is available, an estimation of fair value is used. Transaction costs arising on the issue of shares have been recognized directly in the statement of financial performance.
(j) EXPLORATION AND EVALUATION EXPENDITURE
Exploration and evaluation expenditure is written off as incurred, except when such costs are expected to be recouped through successful development and exploitation, or sale, of an area of interest. In addition exploration assets recognised on acquisition of an entity are carried forward provided that exploration and/or evaluation activities in the area have not yet reached a stage which permits a reasonable assessment of the existence or otherwise of economically recoverable reserves, and active and significant operations in relation to the area are continuing.
F-12
Table of Contents
WMC RESOURCES LTD AND CONTROLLED ENTITIES
NOTES TO THE CONSOLIDATED FINANCIAL STATEMENTS—(Continued)
The expenditure carried forward when recovery is expected represents an accumulation of direct net exploration and evaluation costs incurred by or on behalf of WMC Resources and applicable indirect costs, in relation to separate areas of interest for which rights of tenure are current.
If it is established subsequently that economically recoverable reserves exist in a particular area of interest, resulting in the decision to develop a commercial mining operation, then in that year, the accumulated expenditure attributable to that area, to the extent that it does not exceed the recoverable amount for the area concerned, will be transferred to mine development. As such it will be subsequently amortized against production from that area. Any excess of accumulated expenditure over recoverable amounts will be written off to the income statement.
The carry forward of exploration expenditure prior to development is not consistent with US GAAP. Refer to Note 45(c) for the effect of any such expenditure.
(k) GOVERNMENT FACILITIES
These assets represent contributions towards the cost of power, water, road, railway and town service facilities owned by government or local authorities which are necessary to gain access to mineral reserves. Under US GAAP, these assets may be more appropriately described as ‘deferred costs’. These assets are amortized over the life of the related mining projects or the facility, whichever is less.
(l) MINE PROPERTIES AND MINE DEVELOPMENT
These assets represent the capital cost incurred on areas of interest for which it has been established, to the satisfaction of the directors subsequent to completion of a final feasibility study, that economically recoverable reserves exist.
Costs accumulated in respect of each area of interest represent direct and applicable indirect expenditure incurred by or on behalf of the relevant entity. Indirect expenditure principally consists of charges for depreciation of equipment used in development activities. The costs of successful exploration and evaluation and access and capital development are classified as mine development. Capital development for open pit mines includes both the initial pre-production removal of overburden and ongoing post-production waste removal. See below for further detail on post production waste removal. Capital development on underground mines includes expenditure on shaft sinking, declines, development and access drives and ventilation shafts. Utilities and facilities such as water, power and rail transport (where the Company is required to contribute to the capital cost but does not have title to the asset), pre-production administration and other costs for mineral properties are classified as mine properties. Amortization of these costs is provided separately for each mineral reserve or mine from the commencement of commercial production as follows:
(i) mine properties is calculated on a straight line basis over the estimated remaining life of those mines or the life of the specific asset, whichever is shorter; and
(ii) mine development is calculated on a units-of-production basis over the proven and probable reserves included in the current mine plan. In order to calculate the amortization, the total costs of development, including net costs incurred to date and estimated future waste removal costs are totalled and divided by the total proven and probable reserves included in the current mine plan. Annual depletion is calculated based on the units of production during the period multiplied by the per-unit cost.
Mine lives are based on the period of time over which the reserves are planned to be extracted, generally between five years and a maximum of thirty years.
F-13
Table of Contents
WMC RESOURCES LTD AND CONTROLLED ENTITIES
NOTES TO THE CONSOLIDATED FINANCIAL STATEMENTS—(Continued)
The costs of developing or constructing new property and plant include start-up and organization costs that under US GAAP must be expensed as incurred. For the effect of this refer to Note 45(e).
Post-production waste removal
All costs of post-production waste removal (stripping) from open pit mines are accumulated, and deferred on the balance sheet as part of the total of mine properties and mine development. These costs include the costs of drilling, blasting, loading and haulage of waste rock from the open pit to the waste pile. The costs are predominantly in the nature of payments to mining, blasting and other contracting companies or costs of internal labor and materials used in the process. These costs are amortized on a units-of-production basis, in accordance with the amortization policy set out for mine development at (ii) above. Based on the current mine plans, the deferred stripping asset would be expected to be extinguished during 2023 for Mount Keith and 2004 for the Harmony Mine at Leinster.
As waste removal activities are an integral part of the mining operation, the deferred stripping asset is grouped with the other assets at the mine site or other level which represents the lowest level of separately identifiable cash flows in order to assess recoverable amount (see “recoverable amount of non-current assets”).
(m) DEPRECIATION OF PROPERTY, PLANT AND EQUIPMENT
The cost of each item of property, plant and equipment is written off over its expected useful life to WMC Resources, in the establishment of which due regard is given to the life of the related area of interest. None of the lives exceed thirty years. Freehold land is not depreciated.
Assets which are depreciated or amortised on a basis other than over the life of the related area of interest typically have the following economic lives:
Plant and machinery | 5-30 years* | |
Motor vehicles and heavy mobile equipment—underground | 4 years | |
Motor vehicles and heavy mobile equipment—surface | 5 years | |
Office furniture | 8 years | |
Computers and other office equipment | 5 years |
| * | Dependent on the life of related operation. |
Certain major items of plant have significant components which suffer substantial wear and tear. These components are depreciated at an accelerated rate as they are overhauled and replaced on a cycle which exceeds one year but is significantly shorter than the life of the remainder of the plant of which they form a part. On overhaul, any remaining cost of the component is written off and the replacement is capitalized and depreciated over the effective life of the replacement.
Repairs and maintenance expenditures are treated as an operating expense in the period incurred. Major improvements and replacements which increase productivity capacity or extend the useful life of an asset are capitalized in the respective asset class.
(n) LEASED NON-CURRENT ASSETS
The company has operating lease agreements under which the lessor effectively retains substantially all risks and benefits. Operating lease payments are charged to the statement of financial performance in the periods in which they are incurred, as this represents the pattern of benefits derived from the leased assets.
F-14
Table of Contents
WMC RESOURCES LTD AND CONTROLLED ENTITIES
NOTES TO THE CONSOLIDATED FINANCIAL STATEMENTS—(Continued)
The present value of future payments for surplus leased space under non-cancellable operating leases is recognized as a liability, net of sub-leasing revenue, in the period in which it is determined that the leased space will be of no future benefit to the consolidated entity. Refer Note 1(u).
The cost of improvements to or on leasehold properties is amortized over the unexpired period of the lease or five years, whichever is the shorter.
(o) ACQUIRED MINERAL RIGHTS
When a mining entity or operation is acquired, the amount of the purchase consideration must equal its fair value. The excess of the cost of acquisition of the mining entity or operation over the fair value of its other identifiable net assets acquired, is brought to account as “acquired mineral rights”. Acquired minerals rights are amortized on a straight line basis over the period during which the benefits are expected to arise.
(p) RESEARCH AND DEVELOPMENT EXPENDITURE
Research and development expenditure is charged to income as incurred, except that when a regular evaluation of projects concludes that an individual project is expected beyond any reasonable doubt to recover its costs from subsequent use or disposal, the costs of the project for that and subsequent reporting periods are capitalized. Such deferred capital is amortized over the reporting periods which are expected to benefit from the project. In establishing this economic life due regard is given to the economic life of the related area of interest or, if this is not relevant, a maximum life of five years is applied.
The above policy is contrary to US GAAP, and the effect of this is shown in Note 45(a).
(q) CURRENT ASSETS AND CURRENT LIABILITIES
For the purposes of balance sheet classification, assets and liabilities are categorised as “current” if they are expected to be realized in cash, sold or consumed, or liquidated, as the case may be, within WMC Resources’ normal operating cycle, which does not exceed one year for any activity.
(r) TRADE AND OTHER CREDITORS
These amounts represent liabilities for goods and services provided to the group prior to the end of the financial year and which are unpaid. These amounts are unsecured and are usually paid within thirty days of recognition.
(s) EMPLOYEE ENTITLEMENTS
(i) Wages and salaries, annual leave and sick leave
Liabilities for wages and salaries and annual leave are recognized, and are measured as the amount unpaid at the reporting date at current pay rates in respect of employee’s services up to that date.
(ii) Long service leave
Long service leave is an additional form of compensated leave to which Australian employees become entitled after a qualifying period of generally ten years of continuous service. It accrues to them at the rate of 1.3 weeks leave per year of service.
F-15
Table of Contents
WMC RESOURCES LTD AND CONTROLLED ENTITIES
NOTES TO THE CONSOLIDATED FINANCIAL STATEMENTS—(Continued)
A liability for long service leave is recognized, and is measured as the present value of expected future payments to be made in respect of services provided by employees up to the reporting date. Consideration is given to expected future wages and salary levels, experience of employee departures and periods of service. Expected future payments are discounted using interest rates on national government securities with terms to maturity that match, as closely as possible, the estimated future cash outflows.
(iii) Superannuation
Prior to 27 July 2001, WMC Resources participated in the WMC Superannuation Fund. From 27 July 2001, all assets and liabilities of the WMC Superannuation Fund, future employer contributions and ongoing management of employees’ superannuation entitlements were transferred to the WMC Superannuation Plan, an independently managed sub-plan of the Plum Superannuation Fund.
WMC Resources does not account for excesses or shortfalls of the superannuation fund or plan assets over accrued membership benefits. Employer contributions to these funds are recognized as an operating cost. Further details and disclosure in accordance with US GAAP are provided in Note 40.
There are currently no Australian accounting standards concerned with the accounting for pension plans by employers other than an accounting standard relating to employee entitlements which requires the disclosure of certain information regarding defined benefit plans. The relevant disclosures required under this standard are made in Note 40.
Accounting and disclosure rules in the United States are embodied in FAS 87, “Employers’ Accounting for Pensions”, revised by FAS 132 “Employers Disclosures about Pensions and Other Post retirement Benefits”. An actuarial calculation of the status of the Australian defined benefit plan has been made as if WMC Resources complied with FAS 87 for US GAAP purposes from 1 July 1987. The effects of adopting FAS 87 and FAS 132 for US GAAP reconciliation purposes are disclosed in Notes 40 and 45.
(t) REHABILITATION
Where practicable, rehabilitation is performed progressively and charged to costs as a part of normal operating activity. In addition, an assessment is made at each operation of the undiscounted cost at balance date of any future rehabilitation work which will be incurred as a result of currently existing circumstances and a provision is accumulated for this expenditure. This provision is charged on a proportionate basis to production over the life of the operation or activity concerned, or where the applicable life concerned exceeds twenty years, on a proportionate basis to production on a twenty-year basis except Olympic Dam which is on a thirty-year basis. The estimated cost of rehabilitation is re-assessed on a regular basis. Rehabilitation costs include reclamation costs, dismantling and removal costs, removal of foundations and roads, the clean up of polluted materials, and re-vegetation of areas affected by operations, and monitoring of sites. Any changes in estimates are dealt with on a prospective basis. The time when it will be appropriate to commence significant rehabilitation work varies at different operations from the next financial year to dates well in excess of twenty years time. Over that time there is a strong possibility that the obligations for, methods of performing, and costs of performing, the rehabilitation work might alter. The estimates therefore are subject to change.
(u) PROVISIONS
Provisions are recognized where there is a legal, equitable or constructive obligation as a result of a past event and it is probable that an outflow of economic benefits will be required to settle the obligation.
F-16
Table of Contents
WMC RESOURCES LTD AND CONTROLLED ENTITIES
NOTES TO THE CONSOLIDATED FINANCIAL STATEMENTS—(Continued)
(i) Lease commitments
The present value of future payments for surplus leased space under non-cancellable operating leases which are not onerous contracts is recognized as a liability, net of sub-leasing revenue, in the period in which it is determined that the leased space will be of no future benefit to the consolidated entity. The net future lease payments are discounted using the interest rates implicit in the leases. Each lease payment is allocated between the liability and finance charges.
Liabilities for surplus leased space under non-cancellable leases which are onerous contracts are recognized when premises are leased under non-cancellable operation leases and the unavoidable costs of meeting the contractual obligations exceed the general market cost of similar leased premises.
(ii) Workers Compensation
Provision is made for amounts payable in relation to outstanding workers compensation claims when it is probable that an outflow of economic benefits will be required to settle the obligation. Amounts provided are reviewed regularly by actuaries or insurers in light of the claims outstanding.
(v) INTEREST-BEARING LIABILITIES
Loans are carried at their principal amounts which represent the present value of future cash flows associated with servicing the debt. Interest is accrued over the period it becomes due and is recorded as part of other creditors.
(w) DERIVATIVE FINANCIAL INSTRUMENTS
WMC Resources uses derivative financial instruments to hedge natural exposures to commodity prices, exchange rates and interest rates. The instruments used include spot, forward, swap and option contracts. The following accounting policies are applied to both currency and commodity based derivatives.
Hedge contracts are accounted for in the same manner as the underlying transactions. For currency contracts hedging firmly committed sales, operating purchases or capital purchases, premiums on option contracts and discounts or premiums on entering into forward currency hedging contracts are deferred in other assets or other liabilities until the underlying transaction takes place. Unrealized or realized gains and losses on the hedging contracts are deferred in other assets or other liabilities until the underlying transaction takes place. When the underlying transaction takes place, gains, losses, premiums and discounts for the hedge contract are included in the cost of the applicable asset, or taken to profit and loss as part of sales revenue or costs.
For contracts hedging exposure to commodity prices, unrealized or realized gains and losses and premiums are deferred in other assets or other liabilities until the underlying transaction takes place. When the underlying transaction takes place, gains, losses and premiums for the hedge contract are taken to profit and loss as part of sales revenue.
For contracts hedging the interest rate component of debt instruments, gains and losses are recognized as adjustments to interest expense when the underlying transaction occurs.
In the statement of cash flows, cash flows resulting from hedging contracts are included in the same category as the underlying transaction.
F-17
Table of Contents
WMC RESOURCES LTD AND CONTROLLED ENTITIES
NOTES TO THE CONSOLIDATED FINANCIAL STATEMENTS—(Continued)
All contracts are designated as hedges of underlying transactions in the economic entity’s deal-recording systems. They are reviewed regularly to ensure that they are still effective as hedges. If a contract ceases to qualify as an effective hedge of an underlying transaction then all premiums, discounts, gains and losses relating to the hedge contract are immediately recognized in profit and loss. Any subsequent gains and losses which might occur due to market movements between the time the contract ceases to be an effective hedge and the time that it is closed out would be recognized in profit and loss as they occur. If a contract which is designated as a hedge of an underlying transaction is closed out, but the underlying transaction still exists, then recognition of any gains and losses on the contract is deferred until the underlying transaction occurs.
(x) CAPITALIZED COSTS
Capitalization of interest expense
For qualifying assets under construction, which are normally major projects and where development or construction necessarily requires a substantial period of time, interest expense directly attributable to the funds invested in the project are included as a capital cost during the period until substantially all the activities necessary to prepare the qualifying asset for its intended use or sale are complete. To the extent that additional funds have been borrowed for the purpose of, and are associated with the project, the interest rate used is that applicable to those funds. The interest rate for any funds utilized in excess of specific borrowings is the weighted average rate for all other borrowings. Capitalized interest expense costs are amortized (from the commencement of commercial production) over a period not exceeding the economic life of the projects, which are subject to a maximum of thirty years.
Capitalization of internal use software
WMC Resources capitalizes the cost of external consultants and the business software acquired or developed for internal use (purchase of third party software e.g. SAP) where the project success is regarded as probable. The costs are amortized over the estimated useful life of the software. Capitalized software is assessed for impairment in accordance with the accounting policy noted in Note 1(h) “Recoverable amount of non-current assets”.
(y) EARNINGS PER SHARE
To consummate the demerger, WMC Limited effected a capital reduction and dividend to its shareholders in an amount equivalent to the value of WMC Resources after the internal transfers were completed. The entitlement of WMC Limited’s shareholders to the capital reduction and dividend was ultimately satisfied in the demerger through the distribution to WMC Limited’s shareholders of shares in WMC Resources on a pro rata basis such that existing WMC Limited shareholders received one share in WMC Resources for every WMC Limited share owned. Therefore, the unaudited pro forma basic net earnings per share for the years ended 31 December, 2002, 2001, and 2000, has been computed by dividing net earnings for the periods then ended by the weighted average number of WMC Limited shares outstanding for the years then ended. The unaudited pro forma diluted earnings per share for the years ended 31 December 2002, 2001, and 2000, takes into effect the potential ordinary shares from the conversion of partly paid shares and options as disclosed in Note 6.
(z) DISCONTINUED OPERATIONS
An operation is treated as a discontinued operation if the operation is a component of the group whose activities represent a separate major line of the business and the measurement date of a disposal is prior to the end of the reporting period. The measurement date of a disposal is the date on which the management having authority to approve the action commits itself to a formal plan to dispose of a segment of the business, whether by sale or abandonment. During the financial years included in this financial report the following operations were disposed of:
F-18
Table of Contents
WMC RESOURCES LTD AND CONTROLLED ENTITIES
NOTES TO THE CONSOLIDATED FINANCIAL STATEMENTS—(Continued)
Gold business unit
In the first quarter of 2001, the company decided to focus on its core portfolio of large low cost business in nickel, alumina, copper/uranium and fertilizer businesses. As a result, the company began a strategic evaluation of its options for the gold business. The plan was finalized on 19 September 2001 when a final decision was made to sell the gold business unit in its entirety.
The Group disposed of the majority of its gold operations in 2001. The sale of a further operation was completed in January 2002. A sale of the remaining assets is expected during 2003. The assets not sold at 31 December 2001 were included as discontinued operations at 31 December 2001 because management had approved a formal plan to dispose of the segment prior to year end. The operation sold in 2002 had a carrying value of A$17.9 million at 31 December 2001 and its result for the year ended 31 December 2002 was a loss of A$1.5 million (2001: A$6.6 million profit). The remaining assets had a carrying value of A$14.2 million at 31 December 2002 (2001: A$33.2 million) and the result for year ended 31 December 2002 was a loss of A$4.2 million (2001: A$5.8 million loss).
The company’s right to a royalty from the 2001 sale of operations, was sold in June 2002 for a profit of A$15.4 million. The only remaining assets and liabilities relating to discontinued operations of Gold at 31 December were :
| 2002 A$m | 2001 A$m | |||
Current Assets | 0.2 | 99.1 | ||
Non-Current Assets | 14.5 | 25.8 | ||
Total Assets | 14.7 | 124.9 | ||
Current Liabilities | 1.1 | 48.3 | ||
Non-Current Liabilities | — | 10.0 | ||
Total Liabilities | 1.1 | 58.3 | ||
Net Assets | 13.6 | 66.6 | ||
Upon completion of the sale of the remaining assets, WMC Resources will have fully exited the gold mining business.
Talc (formed part of Other in the segment note)
Following a decision by the directors to exit the talc business and the receipt of an offer for the 50% equity interest in the Mondo Minerals Talc joint venture, the directors approved a resolution on 14 November 2000 to dispose of both the Mondo Minerals and Three Springs Talc businesses.
On 24 January 2001, WMC Limited sold its equity interest in Mondo Minerals Talc joint venture for a profit of A$51.1 million after tax. The sale received all the necessary regulatory approvals and the transaction was settled on 8 May 2001. On 1 August 2001, WMC Limited sold its Three Springs Talc operation for a profit of A$20.0 million after tax. The sale received all the necessary regulatory approvals and the transaction was settled on 30 September 2001.
(aa) SHIPPING AND HANDLING COSTS
Shipping and handling costs in respect of purchases are recorded in cost of goods sold, and in respect of product despatched, recorded in selling and distribution costs in the statement of financial performance.
F-19
Table of Contents
WMC RESOURCES LTD AND CONTROLLED ENTITIES
NOTES TO THE CONSOLIDATED FINANCIAL STATEMENTS—(Continued)
(ab) ROUNDING OF AMOUNTS
The company is of a kind referred to in Class Order 98/0100, issued by the Australian Securities & Investments Commission, relating to the ‘rounding off’ of amounts in the financial report. Amounts in the financial report have been rounded off in accordance with Class Order to the nearest hundred thousand dollars.
| Notes | Year to 31 Dec 2002 A$m | Year to 31 Dec 2001 A$m | Year to 31 Dec 2000 A$m | |||||||||
Sales revenue from core operating activities: | ||||||||||||
Sale of goods from continuing operations | 2,487.2 | 2,364.1 | 2,666.0 | |||||||||
Sale of goods from discontinued operations | (1.4 | ) | 452.9 | 426.0 | ||||||||
Net sales revenue | 2,485.8 | 2,817.0 | 3,092.0 | |||||||||
Other income: | ||||||||||||
Interest received/receivable | 3 | (b) | 27.6 | 153.5 | 152.1 | |||||||
Profit on disposal of non-current assets-continuing operations | — | 10.6 | — | |||||||||
Insurance proceeds | 5.3 | 23.1 | 65.5 | |||||||||
Other income | 26.4 | 15.4 | 23.1 | |||||||||
Total other income from continuing operations | 59.3 | 202.6 | 240.7 | |||||||||
Other income from discontinued operations | 0.2 | 1.4 | 1.0 | |||||||||
Profit on sale of non-current assets-discontinued operations | 40.5 | 319.3 | — | |||||||||
Total other income | 100.0 | 523.3 | 241.7 | |||||||||
SUBTOTAL NET REVENUES | 2,585.8 | 3,340.3 | 3,333.7 | |||||||||
Proceeds from sale of non-current assets | 101.0 | 685.9 | 70.1 | |||||||||
Proceeds received from early termination of interest rate swaps | 4 | 75.9 | — | — | ||||||||
Insurance proceeds shown as exceptional item | 4 | 120.0 | — | — | ||||||||
Less profit on disposal of non-current assets | (40.5 | ) | (329.9 | ) | — | |||||||
OPERATING REVENUE—AUSTRALIAN GAAP | 2,842.2 | 3,696.3 | 3,403.8 | |||||||||
(i) Net sales revenue includes: | ||||||||||||
Currency hedging losses | (108.2 | ) | (328.1 | ) | (253.0 | ) | ||||||
Commodity hedging (losses)/gains | (5.1 | ) | 66.1 | (14.9 | ) | |||||||
| (113.3 | ) | (262.0 | ) | (267.9 | ) | |||||||
Amounts included in revenue which were based on provisional pricing as described in accounting policy Note 1(e) were as follows:
Year | A$m | |
2002 | 63.4 | |
2001 | 60.5 | |
2000 | 138.6 | |
F-20
Table of Contents
WMC RESOURCES LTD AND CONTROLLED ENTITIES
NOTES TO THE CONSOLIDATED FINANCIAL STATEMENTS—(Continued)
| 3. | DISCLOSURES ABOUT ITEMS INCLUDED IN OPERATING INCOME/(LOSS) BEFORE INCOME TAX |
Australian GAAP requires specific disclosure of certain items included in the calculation of income. This note does not include all costs. | Notes | Year to 31 Dec 2002 A$m | Year to 31 Dec 2001 A$m | Year to 31 Dec 2000 A$m | ||||||||
Operating income/(loss) before income tax includes the following specific expenses: | ||||||||||||
Amortization and depreciation | 3 | (a) | 511.7 | 596.2 | 510.8 | |||||||
Borrowing costs | 3 | (b) | 152.2 | 295.2 | 300.4 | |||||||
Other charges against assets: | ||||||||||||
—bad debts written off/provided for | 0.1 | — | 3.4 | |||||||||
—write down of inventories to net realizable value | 3.3 | 7.7 | 6.2 | |||||||||
Stock written off | 33.6 | 20.5 | 17.4 | |||||||||
Exploration expenditure written off: | ||||||||||||
—grassroots | 19.7 | 57.2 | 51.1 | |||||||||
—supporting existing operations | 3.7 | 19.3 | 21.1 | |||||||||
—evaluation | 13.8 | 18.6 | 7.6 | |||||||||
Government royalties on sales or production | 53.1 | 72.6 | 83.2 | |||||||||
Provision for: | ||||||||||||
—employee entitlements | 16.5 | 22.2 | 9.3 | |||||||||
—rehabilitation | 15.5 | 14.8 | 12.7 | |||||||||
—diminution in value of investments | (0.6 | ) | 0.2 | 1.2 | ||||||||
—obsolescence of stores | 6.1 | 4.0 | 3.8 | |||||||||
Research and development written off | 0.6 | 0.4 | 1.4 | |||||||||
Foreign exchange loss/(gain) | 14.9 | 20.7 | (2.5 | ) | ||||||||
Operating lease rentals | 9.8 | 12.6 | 16.3 | |||||||||
(a) Amortization and depreciation | ||||||||||||
Amortization: | ||||||||||||
—government facilities | 1.6 | 1.7 | 1.3 | |||||||||
—mine properties and mine development | 138.9 | 248.3 | 191.7 | |||||||||
—goodwill/intangibles | 17.0 | 16.1 | 14.6 | |||||||||
—research and development | 0.5 | 1.7 | (0.9 | ) | ||||||||
Depreciation: | ||||||||||||
—plant and equipment | 327.9 | 301.2 | 273.8 | |||||||||
—land and buildings | 25.8 | 27.2 | 30.3 | |||||||||
Total amortization and depreciation charged to profit | 511.7 | 596.2 | 510.8 | |||||||||
(b) Borrowing costs | ||||||||||||
Interest and finance charges paid/payable | 155.7 | 295.2 | 325.3 | |||||||||
Deferred to qualifying assets | (3.5 | ) | — | (24.9 | ) | |||||||
Interest charged to income | 152.2 | 295.2 | 300.4 | |||||||||
Interest received/receivable | ||||||||||||
—continuing operation | 2 | (27.6 | ) | (153.5 | ) | (152.1 | ) | |||||
—discontinued operations | — | (0.8 | ) | (0.2 | ) | |||||||
Interest credited to income | (27.6 | ) | (154.3 | ) | (152.3 | ) | ||||||
Add proceeds received from early termination of interest rate swaps | 4 | (75.9 | ) | — | — | |||||||
Net charge to income | 48.7 | 140.9 | 148.1 | |||||||||
F-21
Table of Contents
WMC RESOURCES LTD AND CONTROLLED ENTITIES
NOTES TO THE CONSOLIDATED FINANCIAL STATEMENTS—(Continued)
(c) Restructuring provisions
As at 31 December 2002, $A2.4 million remained as a provision yet to be paid. These costs were in relation to the restructuring of group services and the exploration functions.
Year to 31 Dec 2002 A$m | Year to 31 Dec 2001 A$m | Year to 31 Dec 2000 A$m | |||||||
(a) Gains/(Charges) | |||||||||
Continuing Operations: | |||||||||
Proceeds received from early termination of interest rate swaps | 75.9 | — | — | ||||||
Amount receivable from insurance claims in relation to the fire at the Olympic Dam solvent extraction plant | 120.0 | — | — | ||||||
Demerger costs—advisors fees and other costs | (51.2 | ) | — | — | |||||
Profit on sale of tenements at Kambalda | — | — | 20.2 | ||||||
Profit on disposal of Long / Victor nickel mines at Kambalda | 12.0 | — | — | ||||||
Costs associated with the fire at Olympic Dam solvent extraction plant(1) | (97.7 | ) | (71.8 | ) | — | ||||
Cost of redundancies and closure costs associated with the restructuring of the service and exploration functions | — | (20.7 | ) | — | |||||
Total continuing operations | 59.0 | (92.5 | ) | 20.2 | |||||
Discontinued Operations: | |||||||||
Profit on sale of Central Norseman Gold Corporation Limited | 25.1 | — | — | ||||||
Profit on sale of right to Gold Royalty | 15.4 | — | — | ||||||
Profit on disposal of St Ives and Agnew gold operations | — | 238.8 | (2) | — | |||||
Cost of redundancies and closure costs associated with the restructuring of the service and exploration functions | — | (0.8 | ) | — | |||||
Net loss on early termination of commodity and currency hedging associated with the gold business | — | (103.2 | ) | — | |||||
Profit on disposal of Three Springs Talc operation | — | 18.6 | — | ||||||
Profit on disposal of equity interest in Mondo Minerals | — | 61.2 | — | ||||||
Total discontinued operations | 40.5 | 214.6 | — | ||||||
Total exceptional items before income tax | 99.5 | 122.1 | 20.2 | ||||||
Income tax (charges)/credits on: | |||||||||
Write off of assets and costs associated with the fire at Olympic Dam solvent extraction plant(1) | 29.3 | 21.5 | — | ||||||
Income tax benefit on demerger costs | 15.4 | — | — | ||||||
Income tax expense on disposal of Long / Victor mines | (2.6 | ) | — | — | |||||
Income tax expense on insurance proceeds | (36.0 | ) | — | — | |||||
Proceeds received from early termination of Interest Rate Swaps | (22.8 | ) | — | — | |||||
Cost of redundancies and closure costs associated with the restructuring of the service and exploration functions | — | 4.8 | — | ||||||
Gain on disposal of St Ives and Agnew gold operations | — | 3.4 | — | ||||||
Net loss on the early termination of commodity and currency hedging associated with the gold business | — | 31.0 | — | ||||||
Gain on disposal of Three Springs Talc Operation | — | 1.4 | — | ||||||
Gain on disposal of equity interest in Mondo Minerals | — | (10.1 | ) | — | |||||
Profit on sale of tenements at Kambalda | — | — | 3.6 | (3) | |||||
Income tax (charge)/credit on above exceptional items: | |||||||||
—continuing operations | (16.7 | ) | 26.3 | 3.6 | |||||
—discontinued operations | — | 25.7 | — | ||||||
Gain on exceptional items after tax | 82.8 | 174.1 | 23.8 | ||||||
F-22
Table of Contents
WMC RESOURCES LTD AND CONTROLLED ENTITIES
NOTES TO THE CONSOLIDATED FINANCIAL STATEMENTS—(Continued)
| (1) | In late October 2001 the Copper/uranium business unit suffered a fire at the Olympic Dam facility which caused considerable damage to the copper and uranium solvent extraction circuits in the processing plant. The damaged plant required rebuilding and the carrying value of the impaired assets ($52.3 million) was written off as a part of exceptional items. The balance of the exceptional item for Olympic Dam was a further charge of $19.5 million incurred in relation to costs associated with lower production of copper and uranium. The entire 2002 charge related to costs associated with lower production. |
| (2) | An amount of $25 million is included in the profit on disposal relating to right to future royalties that did not comply with all the criteria under US GAAP for recognition in profit in 2001. Refer to Note 45. |
| (3) | This transaction did not comply with all criteria under US GAAP for the full accrual of profit in 2000. Refer to Note 45. |
Notes | Year to 31 Dec 2002 A$m | Year to 31 Dec 2001 A$m | Year to 31 Dec 2000 A$m | |||||||||
(a) Pre-tax operating income/(loss) | ||||||||||||
(Loss)/income from continuing operations | (34.6 | ) | (223.3 | ) | 482.1 | |||||||
(Loss)/income from discontinued operations | (4.1 | ) | 57.6 | 86.5 | ||||||||
Profit on sale of right to Gold Royalty | 15.4 | — | — | |||||||||
Gain on disposal of discontinued operations | 25.1 | 215.4 | — | |||||||||
Pre-tax operating income | 1.8 | 49.7 | 568.6 | |||||||||
Prima facie tax expense for the period at the rate of 30% (2001: 30% and 2000:34%) | (0.5 | ) | (14.9 | ) | (193.3 | ) | ||||||
The following tax effect on these items caused the total charge for income tax to vary from the above: | ||||||||||||
Investment and development allowances | — | — | 0.3 | |||||||||
Research and development | 2.4 | 0.9 | 0.5 | |||||||||
Exchange gains from return of capital | — | 2.3 | — | |||||||||
Non-taxable capital gains | 13.2 | 12.4 | 7.3 | |||||||||
Depreciation and amortization | 0.8 | 0.4 | (1.9 | ) | ||||||||
Non-deductible expenses | (2.2 | ) | (0.7 | ) | (2.2 | ) | ||||||
Non-deductible foreign expenses | (0.3 | ) | (1.5 | ) | (1.8 | ) | ||||||
Fair value adjustment arising from acquisition of entities | 93.6 | — | — | |||||||||
Future income tax benefits movements | (88.9 | ) | 69.5 | 5.8 | ||||||||
Variance between Australian and foreign tax rates | — | 0.8 | (1.8 | ) | ||||||||
Withholding tax | (0.5 | ) | — | (2.2 | ) | |||||||
Exempt income | 1.1 | 1.6 | 1.2 | |||||||||
Income tax credit/(expense) for the period | 18.7 | 70.8 | (188.4 | ) | ||||||||
Adjustment for over provision in prior years | 2.5 | 5.5 | 19.4 | |||||||||
Total income tax credit/(expense) | 21.2 | 76.3 | (168.7 | ) | ||||||||
Income tax credit/(expense) comprises: | ||||||||||||
Continuing Operations: | ||||||||||||
— Normal | 36.6 | 39.5 | (158.5 | ) | ||||||||
— Exceptional—gains and losses | 4 | (16.7 | ) | 26.3 | 3.6 | |||||||
| 19.9 | 65.8 | (154.9 | ) | |||||||||
Discontinued Operations: | ||||||||||||
— Normal | 1.3 | (15.2 | ) | (13.8 | ) | |||||||
— Exceptional—gains and losses | 4 | — | 25.7 | — | ||||||||
| 1.3 | 10.5 | (13.8 | ) | |||||||||
| 5 | (c) | 21.2 | 76.3 | (168.7 | ) | |||||||
F-23
Table of Contents
WMC RESOURCES LTD AND CONTROLLED ENTITIES
NOTES TO THE CONSOLIDATED FINANCIAL STATEMENTS—(Continued)
(b) Future income tax benefits
The income tax provision is calculated under a policy of tax-effect accounting. Under this policy, the future benefits of tax losses and timing differences are brought to account where:
(i) virtual certainty exists as to the ability of group companies to recoup such losses; or
(ii) a provision for deferred income tax exists in the group company to which the tax losses relate but only to the extent that deferred income tax has already been provided in respect of timing differences which will reverse within the period during which the tax losses will remain available as a deduction from assessable income; or
(iii) the reversal of all other timing differences comprising the balance of the account is assured beyond any reasonable doubt.
Australian GAAP differs from US GAAP in that future benefits will only be brought to account when the foregoing criteria are met whereas under US GAAP all future benefits are recognized but are subject to a valuation allowance, unless realization is more likely than not. The net impact on both income and net balance sheet amounts is identical under both methods.
As at 31 Dec 2002 A$m | As at 31 Dec 2001 A$m | As at 31 Dec 2000 A$m | ||||
At balance date the following future tax benefits not recognized under Australian GAAP would be recognized and subject to valuation allowances under US GAAP: | ||||||
Future tax benefits are attributable to: | ||||||
—income tax losses | 422.5 | 88.4 | 57.7 | |||
—income tax timing differences | 30.3 | 49.1 | 60.5 | |||
—capital losses | 128.6 | 63.9 | 63.9 | |||
| 581.4 | 201.4 | 182.1 | ||||
Realization of future benefits attributable to tax losses and timing differences will only arise in the event that:
(i) the company, or where applicable another WMC Resources company, derives future assessable income within the prescribed time limit of a nature and of an amount sufficient to enable the benefit from the deductions from the losses to be realized;
(ii) companies controlled by WMC Resources continue to comply with the conditions for deductibility imposed by the law; and
(iii) no changes in tax legislation adversely affect WMC Resources or its controlled entities in realizing the benefit from the deductions for the losses.
F-24
Table of Contents
WMC RESOURCES LTD AND CONTROLLED ENTITIES
NOTES TO THE CONSOLIDATED FINANCIAL STATEMENTS—(Continued)
| Notes | Year to 31 Dec 2002 A$m | Year to 31 Dec 2001 A$m | Year to 31 Dec 2000 A$m | |||||||||
(c) Income tax credit/(expense) is comprised of: | ||||||||||||
Current: | ||||||||||||
Australian | (5.1 | ) | (3.2 | ) | (3.8 | ) | ||||||
United States Federal | — | — | (0.1 | ) | ||||||||
Other | (2.5 | ) | (0.1 | ) | (2.1 | ) | ||||||
| (7.6 | ) | (3.3 | ) | (6.0 | ) | |||||||
Deferred income tax: | ||||||||||||
Australian | (30.2 | ) | (101.9 | ) | (334.1 | ) | ||||||
United States Federal | 0.1 | — | (0.1 | ) | ||||||||
| 5 | (d) | (30.1 | ) | (101.9 | ) | (334.2 | ) | |||||
Future income tax benefit: | ||||||||||||
Australian | 73.1 | 123.0 | 148.1 | |||||||||
United States Federal | — | — | — | |||||||||
Other | — | — | — | |||||||||
| 73.1 | 123.0 | 148.1 | ||||||||||
Tax credit/(expense) attributable to operating profit/(loss) | 35.4 | 17.8 | (192.1 | ) | ||||||||
Prior period adjustment | 2.5 | 6.5 | 19.8 | |||||||||
Income tax (expense)/credit on exceptional items | 4 | (16.7 | ) | 52.0 | 3.6 | |||||||
Total income tax credit/(expense) | 5 | (a) | 21.2 | 76.3 | (168.7 | ) | ||||||
Year to 31 Dec 2002 A$m | Year to 31 Dec 2001 A$m | Year to 31 Dec 2000 A$m | |||||||
(d) The significant timing differences included in the | |||||||||
—Accelerated depreciation | (16.6 | ) | (45.2 | ) | (90.2 | ) | |||
—Stores | 1.2 | 1.1 | (1.0 | ) | |||||
—Stock adjustment to market value | (6.5 | ) | (101.1 | ) | — | ||||
—Amounts set aside to provision accounts | 9.4 | 9.1 | (1.7 | ) | |||||
—Tax losses | 4.5 | 52.9 | (193.8 | ) | |||||
—Prepayments | 0.2 | (0.4 | ) | (0.6 | ) | ||||
— Financial instruments accruals | 13.4 | (18.5 | ) | (32.4 | ) | ||||
—Foreign exchange | (38.8 | ) | 1.3 | (6.9 | ) | ||||
—Other | 3.1 | (1.1 | ) | (7.6 | ) | ||||
| (30.1 | ) | (101.9 | ) | (334.2 | ) | ||||
F-25
Table of Contents
WMC RESOURCES LTD AND CONTROLLED ENTITIES
NOTES TO THE CONSOLIDATED FINANCIAL STATEMENTS—(Continued)
| (e) | At 31 December 2002, for income tax purposes, tax losses carried forward were A$2,192.3 million. These operating tax losses carried forward, expire as summarized below: |
| Year of Expiry | A$m | |||
Australia | Indefinitely | 1,926.5 | ||
United States | 2006 | 1.8 | ||
| 2007 | 12.3 | |||
| 2008 | 13.0 | |||
| 2009 | 16.4 | |||
| 2011 | 17.3 | |||
| 2018 | 1.8 | |||
| 2019 | 0.5 | |||
| 2020 | 2.6 | |||
| 2021 | 5.0 | |||
| 70.7 | ||||
| Year of Expiry | A$m | |||
Other countries | 2003 | 1.5 | ||
| 2004 | 2.6 | |||
| 2005 | 1.9 | |||
| 2006 | 1.2 | |||
| 2007 | 1.5 | |||
| Indefinitely | 186.4 | |||
| 195.1 | ||||
Total operating income tax losses | 2,192.3 | |||
Capital losses and timing differences relate mainly to losses which have not yet been realized or where they are realized and can be carried forward indefinitely.
| (f) | Tax consolidation regime |
During the period, most of the Australian Tax Consolidation legislation became substantively enacted for financial reporting purposes. The legislation enables an Australian group of companies to be treated as a single entity and to lodge a single return. The wholly-owned Australian resident subsidiaries within the WMC Resources Ltd group, and the Company may by election, enter the Tax Consolidation Regime. At the date of this report, no decision has been made by the company or the WMC Resources Ltd group to make the election, and it is likely any such election would be made effective no earlier than 1 January 2003. The tax consolidation regime is not expected to impact the accounts of the Company as at 31 December 2002.
Due to the single entity concept contained in the Tax Consolidation Regime, there may be an impact in subsequent years on the tax related items in the Company’s accounts and the accounts of its wholly owned Australian resident subsidiaries. Franking account balances of the Company and the wholly-owned subsidiaries may also be impacted, as the legislation provides a means for pooling group franking credits.
F-26
Table of Contents
WMC RESOURCES LTD AND CONTROLLED ENTITIES
NOTES TO THE CONSOLIDATED FINANCIAL STATEMENTS—(Continued)
Year to 31 Dec 2002 | Year to 31 Dec 2001 | Year to 31 Dec 2000 | |||||
| Cents per share | |||||||
Basic earnings per share calculated on Group equity accounted profit after income tax and minority interests(1) | 2.1 | 11.4 | 35.5 | ||||
Diluted earnings per share calculated on Group equity accounted profit after income tax and minority interests. | 2.2 | 11.9 | 35.5 | ||||
Basic earnings per share calculated on net income in accordance with US GAAP(2) | (9.8 | ) | 3.4 | 27.3 | |||
Diluted earnings per share on net income in accordance with US GAAP | (9.8 | ) | 4.0 | 27.3 | |||
Weighted per share | Potential ordinary shares from the conversion of partly paid shares and options | Weighted average number of ordinary shares outstanding during the year including potential ordinary shares used in the calculation of diluted earnings per share | ||||
Year to 31 Dec, 2002 | 1,115,784,278 | 11,557,539 | 1,127,341,817 | |||
Year to 31 Dec, 2001 | 1,103,323,901 | 17,474,000 | 1,120,797,901 | |||
Year to 31 Dec, 2000 | 1,127,115,419 | 10,262,392 | 1,137,377,811 |
Year to 31 Dec 2002 | Year to 31 Dec 2001 | Year to 31 Dec 2000 | ||||||
| Cents per share | ||||||||
(1) Australian GAAP | ||||||||
Earnings per share from continuing operations | (1.3 | ) | (14.3 | ) | 29.0 | |||
Earnings per share from discontinued operations | 3.4 | 25.7 | 6.5 | |||||
| 2.1 | 11.4 | 35.5 | ||||||
(2) US GAAP (refer Note 45) | ||||||||
Continuing operations | ||||||||
Earnings per share before cumulative effect of accounting change | 10.9 | (21.0 | ) | 21.4 | ||||
Cumulative effect of accounting change | (3.5 | ) | — | — | ||||
Discontinued operations | ||||||||
Earnings per share | 4.6 | 24.4 | 5.9 | |||||
| (9.8 | ) | 3.4 | 27.3 | |||||
(a) Information concerning classification of securities
As disclosed in Note 1(y), as a result of the demerger, existing WMC Limited shareholders received one WMC Resources share for every WMC Limited share owned. The unaudited pro forma disclosures in these carve-out financial statements are based on the number of shares and options of WMC Limited outstanding for the periods concerned.
F-27
Table of Contents
WMC RESOURCES LTD AND CONTROLLED ENTITIES
NOTES TO THE CONSOLIDATED FINANCIAL STATEMENTS—(Continued)
The partly paid shares carry the right to participate in dividends in proportion to the amount paid relative to the total issue price (for partly paid shares issued in 1987, relative to the nominal value), and to that extent they have been recognized as equivalents of ordinary shares in the determination of basic earnings per share. At balance date there were nil (December 2001: 629,000; December 2000: 771,500) partly paid shares, callable at the option of the holders and which at balance date were considered dilutive for the purpose of the calculation of diluted earnings per share. At balance date there were 32,501,180 (December 2001: 27,065,363; December 2000: 27,716,190) options which were considered potentially dilutive and therefore, were used in the calculation of diluted earnings per share.
(b) Comparative information
The basic earnings per share as presented and diluted earnings per share for the current and previous periods have been adjusted for the conversion of partly paid shares. The adjustment is in accordance with the Australian Accounting Standard AASB 1027, “Earnings Per Share”.
(c) Conversion, call, subscription or issue after 31 December 2002
There have been no material conversions to, calls of, or subscriptions for ordinary shares or issues of potential ordinary shares since the reporting date and before completion of these financial statements except those consequent to the demerger.
Year to 31 Dec 2002 A$m | Year to 31 Dec 2001 A$m | Year to A$m 2000 | |||||
(d) Reconciliation of earnings used in the calculation of earnings per share | |||||||
Net income | 23.0 | 126.0 | 399.9 | ||||
Nominal interest from the conversion of partly paid shares and options | 1.9 | 7.5 | 3.4 | ||||
Potential diluted earnings | 24.9 | 133.5 | 403.3 | ||||
Net US GAAP (loss)/earnings before cumulative effect of change in accounting principle (Note 45) | (70.0 | ) | 37.7 | 307.6 | |||
F-28
Table of Contents
WMC RESOURCES LTD AND CONTROLLED ENTITIES
NOTES TO THE CONSOLIDATED FINANCIAL STATEMENTS—(Continued)
7. FINANCIAL REPORTING BY SEGMENT
Business segments
| A$m | |||||||||||
| Year ended 31 December 2002 | |||||||||||
Group consolidation | Copper/ Uranium | Nickel | Fertilizer | Consolidated | |||||||
Revenue | |||||||||||
Segment revenues(1) | 846.9 | 1,343.2 | (2) | 422.7 | 2,612.8 | ||||||
Unallocated corporate revenues | 28.6 | ||||||||||
Less insurance proceeds received/receivable | (125.3 | ) | |||||||||
Less proceeds from disposal of non-current assets | (18.8 | ) | |||||||||
Less other sundry income | (10.1 | ) | |||||||||
Continuing operations | 2,487.2 | ||||||||||
Discontinuing operations—Gold | (1.4 | ) | |||||||||
Net sales revenue | 2,485.8 | ||||||||||
Result | |||||||||||
Segment result | 53.8 | 221.5 | (57.4 | ) | 217.9 | ||||||
Unallocated profit | 11.4 | ||||||||||
Unallocated corporate expenses: | |||||||||||
New business | (36.5 | ) | |||||||||
Regional exploration | (21.5 | ) | |||||||||
Corporate (including demerger costs) | (132.0 | ) | |||||||||
Finance and other costs | (25.2 | ) | |||||||||
Net borrowing costs | (48.7 | ) | |||||||||
Continuing operations—Loss before income tax | (34.6 | ) | |||||||||
Discontinuing operations—Gold—Profit before income tax | 36.6 | ||||||||||
Discontinuing operations—Talc – Loss before income tax | (0.2 | ) | |||||||||
Net profit before income tax | 1.8 | ||||||||||
Depreciation and amortization | 234.2 | 209.6 | 60.4 | 504.2 | |||||||
Unallocated depreciation and amortization | 6.8 | ||||||||||
Continuing operations | 511.0 | ||||||||||
Discontinuing operations—Gold | 0.7 | ||||||||||
Discontinuing operations—Talc | — | ||||||||||
| 511.7 | |||||||||||
Other non-cash expenses | |||||||||||
Continuing operations | 12.8 | 46.5 | 10.1 | 69.4 | |||||||
Discontinuing operations—Gold | 0.1 | ||||||||||
Discontinuing operations—Talc | 0.1 | ||||||||||
| (1) | Segment revenues include currency and commodity hedging, intermediate product sales, and other income. For 2002, other income comprises of A$ 123.6 million, A$ 28.3 million and A$ 2.3 million for Copper/Uranium, Nickel and Fertilizers respectively. Inter segment sales are on a commercial basis and are insignificant. |
| (2) | Includes US$ 113.3 million (A$ 208.0 million) from a significant customer. |
F-29
Table of Contents
WMC RESOURCES LTD AND CONTROLLED ENTITIES
NOTES TO THE CONSOLIDATED FINANCIAL STATEMENTS—(Continued)
| A$m | |||||||||
| Year ended 31 December 2002 | |||||||||
Group consolidation | Copper/ Uranium | Nickel | Fertilizer | Consolidated | |||||
Assets | |||||||||
Segment assets | 4,146.2 | 1,696.0 | 720.6 | 6,562.8 | |||||
Unallocated corporate assets | 759.4 | ||||||||
Consolidated total assets | 7,322.2 | (1) | |||||||
Liabilities | |||||||||
Segment liabilities | 450.0 | 286.0 | 75.9 | 811.9 | |||||
Unallocated corporate liabilities | 2,929.6 | ||||||||
Consolidated total liabilities | 3,741.5 | ||||||||
Acquisitions of non-current assets | |||||||||
Acquisitions of non-current assets | 216.0 | 191.0 | 50.2 | 457.2 | |||||
Unallocated corporate acquisitions | 12.2 | ||||||||
| 469.4 | |||||||||
| (1) | Excludes deferred losses on hedging contracts of $25.9 million. Refer Note 12. |
Geographical segments
Revenues from external customers of $2,485.8 are attributed to Australia. Total sales are sold to the following countries / regions: Australia 21%, Europe 30%, Japan 12%, North America 10%, Taiwan 4% and Other 23%.
WMC Resources Ltd’s assets are primarily located within Australia. Capital expenditure and depreciation is also incurred primarily in Australia.
F-30
Table of Contents
WMC RESOURCES LTD AND CONTROLLED ENTITIES
NOTES TO THE CONSOLIDATED FINANCIAL STATEMENTS—(Continued)
Business segments
| A$m | |||||||||||
| Year ended 31 December 2001 | |||||||||||
Group consolidation | Copper/ Uranium | Nickel | Fertilizer | Consolidated | |||||||
Revenue | |||||||||||
Segment revenues(1) | 812.8 | 1,217.4 | (2) | 379.1 | 2,409.3 | ||||||
Unallocated corporate revenues | 33.5 | ||||||||||
Less insurance proceeds received/receivable | (23.1 | ) | |||||||||
Less proceeds from disposal of non-current assets | (49.4 | ) | |||||||||
Less other sundry income | (6.2 | ) | |||||||||
Continuing operations | 2,364.1 | ||||||||||
Discontinuing operations—Gold | 433.3 | ||||||||||
Discontinuing operations—Talc | 19.6 | ||||||||||
Net sales revenue | 2,817.0 | ||||||||||
Result | |||||||||||
Segment result | 47.9 | 147.4 | (89.4 | ) | 105.9 | ||||||
Unallocated loss | (1.0 | ) | |||||||||
Unallocated corporate expenses: | |||||||||||
New business | (35.3 | ) | |||||||||
Regional exploration | (63.9 | ) | |||||||||
Corporate | (69.2 | ) | |||||||||
Finance and other costs | (18.1 | ) | |||||||||
Net borrowing costs | (141.7 | ) | |||||||||
Continuing operations—loss before income tax | (223.3 | ) | |||||||||
Discontinuing operations—Gold—profit before income tax | 192.4 | ||||||||||
Discontinuing operations—Talc—profit before income tax | 80.6 | ||||||||||
Net profit before income tax | 49.7 | ||||||||||
Depreciation and amortization | 181.9 | 222.5 | 66.0 | 470.4 | |||||||
Unallocated depreciation and amortization | 10.5 | ||||||||||
Continuing operations | 480.9 | ||||||||||
Discontinuing operations—Gold | 113.1 | ||||||||||
Discontinuing operations—Talc | 2.2 | ||||||||||
| 596.2 | |||||||||||
Other non-cash expenses | |||||||||||
Continuing operations | 77.5 | 40.3 | 19.6 | 137.4 | |||||||
Discontinuing operations—Gold | (7.5 | ) | |||||||||
Discontinuing operations—Talc | — | ||||||||||
| (1) | Segment revenues include currency and commodity hedging, intermediate product sales and other income. For 2001, other income comprises of A$2.5 million, A$16.5 million, and A$27.1 million for Copper/Uranium, Nickel and Fertilizers respectively. Inter segment sales are on a commercial basis and are insignificant. |
| (2) | Includes US$ 137.0 million (A$267.1 million) from a significant customer. |
F-31
Table of Contents
WMC RESOURCES LTD AND CONTROLLED ENTITIES
NOTES TO THE CONSOLIDATED FINANCIAL STATEMENTS—(Continued)
| A$m | |||||||||
| Year ended 31 December 2001 | |||||||||
Group consolidation | Copper/ Uranium | Nickel | Fertilizer | Consolidated | |||||
Assets | |||||||||
Segment assets | 2,811.1 | 1,691.1 | 1,137.3 | 5,639.5 | |||||
Unallocated corporate assets | 1,132.6 | ||||||||
Continuing operations | 6,772.1 | ||||||||
Discontinuing operations—Gold | 124.9 | ||||||||
Consolidated total assets | 6,897.0 | (1) | |||||||
Liabilities | |||||||||
Segment liabilities | 387.6 | 431.8 | 78.7 | 898.1 | |||||
Unallocated corporate liabilities | 4,054.0 | ||||||||
Continuing operations | 4952.1 | ||||||||
Discontinuing operations—Gold | 57.0 | ||||||||
Discontinuing operations—Talc | 4.5 | ||||||||
Consolidated total liabilities | 5,013.6 | ||||||||
Acquisitions of non-current assets | |||||||||
Acquisitions of non-current assets | 75.3 | 227.1 | 42.3 | 344.7 | |||||
Unallocated corporate acquisitions | 9.8 | ||||||||
Continuing operations | 354.5 | ||||||||
Discontinuing operations—Gold | 99.9 | ||||||||
Discontinuing operations—Talc | 2.5 | ||||||||
| 456.9 | |||||||||
| (1) | Excludes deferred losses on hedging contracts of $1,345.9 million. Refer Note 12. |
Geographical segments
Revenues from external customers of $2,817.0 are attributed to Australia. Total sales are sold to the following countries/regions: Australia 29%, Europe 28%, Japan 13%, North America 13%, Taiwan 4% and Other 13%.
WMC Resources Ltd’s assets are primarily located within Australia. Capital expenditure and depreciation is also incurred primarily in Australia.
F-32
Table of Contents
WMC RESOURCES LTD AND CONTROLLED ENTITIES
NOTES TO THE CONSOLIDATED FINANCIAL STATEMENTS—(Continued)
Business segments
| A$m | |||||||||||
| Year ended 31 December 2000 | |||||||||||
Group consolidation | Copper/ Uranium | Nickel | Fertilizer | Consolidated | |||||||
Revenue | |||||||||||
Segment revenues(1) | 867.1 | 1,687.8 | (2) | 232.3 | 2,787.2 | ||||||
Unallocated corporate revenues | 21.0 | ||||||||||
Less insurance proceeds received/receivable | (61.4 | ) | |||||||||
Less proceeds from disposal of non-current assets | (69.6 | ) | |||||||||
Less other sundry income | (11.2 | ) | |||||||||
Continuing operations | 2,666.0 | ||||||||||
Discontinuing operations—Gold | 402.6 | ||||||||||
Discontinuing operations—Talc | 23.4 | ||||||||||
Net sales revenue | 3,092.0 | ||||||||||
Result | |||||||||||
Segment result | 165.7 | 626.1 | (59.8 | ) | 732.0 | ||||||
Unallocated loss | (0.6 | ) | |||||||||
Unallocated corporate expenses: | |||||||||||
New business | (6.2 | ) | |||||||||
Regional exploration | (53.8 | ) | |||||||||
Corporate | (43.4 | ) | |||||||||
Finance and other costs | 2.4 | ||||||||||
Net borrowing costs | (148.3 | ) | |||||||||
Continuing operations—profit before income tax | 482.1 | ||||||||||
Discontinuing operations—Gold—profit before income tax | 80.1 | ||||||||||
Discontinuing operations—Talc—profit before income tax | 6.4 | ||||||||||
Net profit before income tax | 568.6 | ||||||||||
Depreciation and amortization | 190.3 | 203.8 | 26.8 | 420.9 | |||||||
Unallocated depreciation and amortization | 7.9 | ||||||||||
Continuing operations | 428.8 | ||||||||||
Discontinuing operations—Gold | 79.2 | ||||||||||
Discontinuing operations—Talc | 2.8 | ||||||||||
| 510.8 | |||||||||||
Other non-cash expenses | |||||||||||
Continuing operations | 25.2 | 36.2 | 3.8 | 65.2 | |||||||
Discontinuing operations—Gold | 15.3 | ||||||||||
Discontinuing operations—Talc | 1.0 | ||||||||||
| (1) | Segment revenues include currency and commodity hedging, intermediate product sales, and other income. For 2000, other income comprises of A$ 69.1 million, A $42.4 million, and A $9.7 million for Copper/Uranium, Nickel and Fertilizers respectively. Inter segment sales are on a commercial basis and are insignificant. |
| (2) | Includes US$ 203.0 million (A$352.6 million) from a significant customer. |
F-33
Table of Contents
WMC RESOURCES LTD AND CONTROLLED ENTITIES
NOTES TO THE CONSOLIDATED FINANCIAL STATEMENTS—(Continued)
| A$m | ||||||||||
| Year ended 31 December 2000 | ||||||||||
Group consolidation | Copper/ Uranium | Nickel | Fertilizer | Consolidated | ||||||
Assets | ||||||||||
Segment assets | 3,098.0 | 1,801.0 | 1,162.0 | 6,061.0 | ||||||
Unallocated corporate assets | 1,060.5 | |||||||||
Continuing operations | 7,121.5 | |||||||||
Discontinuing operations—Gold | 333.7 | |||||||||
Discontinuing operations–Talc | 105.3 | |||||||||
Consolidated total assets | 7,560.5 | (1) | ||||||||
Liabilities | ||||||||||
Segment liabilities | 233.3 | 424.3 | 89.0 | 746.6 | ||||||
Unallocated corporate liabilities | 4,573.8 | |||||||||
Continuing operations | 5,320.4 | |||||||||
Discontinuing operations—Gold | 133.2 | |||||||||
Discontinuing operations—Talc | 6.1 | |||||||||
Consolidated total liabilities | 5,459.7 | |||||||||
Acquisitions of non-current assets | ||||||||||
Acquisitions of non-current assets | 79.9 | 155.5 | 96.2 | (2) | 331.6 | |||||
Unallocated corporate acquisitions | 8.9 | |||||||||
Continuing operations | 340.5 | |||||||||
Discontinuing operations—Gold | 119.9 | |||||||||
Discontinuing operations—Talc | 8.2 | |||||||||
| 468.6 | ||||||||||
| (1) | Excludes deferred losses on hedging contracts of $1,036.5 million |
| (2) | Includes capitalized interest and commissioning costs of $77.3 million. The capitalization of start-up costs is contrary to US GAAP. Refer to Note 45. |
Geographical segments
Revenues from external customers of $3,092.0 are attributed to Australia. Total sales are sold to the following countries / regions: Australia 26%, Europe 26%, Japan 16%, North America 13%, Taiwan 10% and Other 9%.
WMC Resources Ltd’s assets are primarily located within Australia. Capital expenditure and depreciation is also incurred primarily in Australia.
F-34
Table of Contents
WMC RESOURCES LTD AND CONTROLLED ENTITIES
NOTES TO THE CONSOLIDATED FINANCIAL STATEMENTS—(Continued)
Basis of preparation of segment information
(a) Operating segments—WMC Resources’ activities have been segmented based on management reporting to the Chief Executive Officer as follows:
Copper/uranium | Exploration, development, mining and refining of copper, uranium, silver and gold in South Australia. | |
Nickel | Exploration, development, mining, smelting and refining of nickel in Western Australia. | |
Fertilizers | Production of fertilizer product in Phosphate Hill, Queensland and distribution of fertilizer products via Hi Fert. | |
Other activities not identifiable with the segments identified above are grouped under the heading “Corporate”. This category includes unallocated corporate overhead and disposals of corporate non-current assets. The New business segment includes identification, evaluation and implementation of new opportunities.
(b) Discontinued operations—Gold business unit and the Talc business unit
Gold business unit
During 2001, the Group disposed of the majority of its gold operations. The sale of a further operation was completed in January 2002 and the sale of the remaining assets is expected during 2003. However, the operations not sold at 31 December 2002 and 2001 were included as discontinued operations because management had approved a formal plan to dispose of these investments prior to 31 December 2001. The company’s right to a royalty from the sale of the operations sold in 2001 was sold in June 2002 for a profit of $15.4 million.
Talc business unit
On 24 January 2001, WMC Limited sold its equity interest in Mondo Minerals Talc joint venture for a profit of $51.1 million after tax. On 30 September 2001, WMC Limited sold its Three Springs Talc operation for a profit of $20.0 million after tax.
(c) Income and total assets for each segment have been calculated after taking account of combination and inter-segment eliminations, as appropriate.
(d) WMC Resources allocates its expenditure on the search for and evaluation of new or additional mineral reserves over three headings—additional exploration, regional exploration and project exploration. Additional exploration is expenditure which, if successful, will define new reserves at existing operations. These reserves will usually require new facilities for extraction, although they will probably utilise existing management and infrastructure. Exploration charges for additional exploration expenditure are allocated to the appropriate business segment although such exploration is not necessarily directly related to segment production. Regional, project and evaluation exploration which cover expenditures in new areas up to the point where a decision is made either to develop to the production stage or to abandon exploration in the area, are the responsibility of other management and are disclosed in those segments. Expenditure which extends reserves at existing operations, which would probably be extracted with existing facilities, continues to be included with mine development expenditure.
(e) The segment presentation above may differ from the disclosures in the individual financial statements of the subsidiaries which own the operations, due to certain adjustments that arise on consolidation, including, but not limited to, fair value adjustments on acquisition, financing of certain projects and the impact of intra-group transactions.
F-35
Table of Contents
WMC RESOURCES LTD AND CONTROLLED ENTITIES
NOTES TO THE CONSOLIDATED FINANCIAL STATEMENTS—(Continued)
As at 2002 A$m | As at 2001 A$m | |||
Cash at bank and on hand | 66.7 | 106.2 | ||
Short term deposits (maturity of three months or less) | 23.8 | 17.9 | ||
| 90.5 | 124.1 | |||
As at 2002 A$m | As at 2001 A$m | |||||
Trade debtors | 244.6 | 214.3 | ||||
Provision for doubtful debts | (6.1 | ) | (6.7 | ) | ||
| 238.5 | 207.6 | |||||
Other debtors | 160.6 | 107.1 | ||||
Provision for doubtful debts | (0.2 | ) | — | |||
| 160.4 | 107.1 | |||||
Debtors relating to hedging contracts | 158.8 | 181.3 | ||||
| 557.7 | 496.0 | |||||
10. CURRENT ASSETS—OTHER FINANCIAL ASSETS
As at 2002 A$m | As at 2001 A$m | |||
Short term deposits (all A$, with maturities of over three months, and up to twelve months) | 12.7 | 20.1 | ||
11. CURRENT ASSETS—INVENTORIES
| Notes | As at 2002 A$m | As at 2001 A$m | |||||||
Stores at cost | 68.0 | 71.9 | |||||||
Provision for obsolescence | (1.8 | ) | (0.8 | ) | |||||
| 66.2 | 71.1 | ||||||||
Trading stocks at cost | 163.3 | 156.8 | |||||||
Trading stocks at net realizable value | 21.0 | 34.5 | |||||||
Work in progress at cost | 213.7 | 142.1 | |||||||
Work in progress at net realizable value | 4.6 | 5.7 | |||||||
| 402.6 | 339.1 | ||||||||
Total current inventories | 11 | (a) | 468.8 | 410.2 | |||||
(a) Current inventories | 468.8 | 410.2 | |||||||
Non-current inventories | 16 | 74.9 | 82.4 | ||||||
Aggregate inventories | 543.7 | 492.6 | |||||||
F-36
Table of Contents
WMC RESOURCES LTD AND CONTROLLED ENTITIES
NOTES TO THE CONSOLIDATED FINANCIAL STATEMENTS—(Continued)
| Notes | As at 2002 A$m | As at 2001 A$m | |||||
Prepayments | 64.9 | 58.4 | |||||
Deferred losses-hedging contracts | 12 | (a) | — | 157.7 | |||
Deferred borrowing costs and premium | 4.5 | 12.6 | |||||
Other | 0.2 | 1.8 | |||||
| 69.6 | 230.5 | ||||||
| (a) | Deferred gains and losses consist of realized and unrealized gains and losses arising from commodity hedging contracts and related currency hedging contracts that are in place, but which relate to commodities to be produced and sold in future years. The deferred gains and losses will be brought to account in the year that the related production is sold. Whether the unrealized deferred balances will be realized and at what amount depends upon commodity and currency price movements until the end of the hedge contracts concerned. Upon demerger, all of the derivatives were recorded at fair value. No pre-acquisition deferred losses/gains were carried forward. |
In accordance with Australian accounting standards, the balance sheet position has been calculated using current spot prices at balance date. The amounts deferred in the balance sheet are set out below.
| Notes | As at 2002 A$m | As at 2001 A$m | |||||||
Deferred gains: | |||||||||
—Current | 26 | 7.2 | — | ||||||
—Non-current | — | — | |||||||
| 7.2 | — | ||||||||
Deferred losses: | |||||||||
—Current | — | (157.7 | ) | ||||||
—Non-current | 21 | (25.9 | ) | (1,188.2 | ) | ||||
Net position | 36 | D | (18.7 | ) | (1,345.9 | ) | |||
The net amount that has been received/(paid) or is receivable/(payable) in the following currency: | |||||||||
—US dollars | (0.8 | ) | 21.8 | ||||||
—Other | 0.2 | — | |||||||
| (0.6 | ) | 21.8 | |||||||
A$ equivalent of above currency | (1.4 | ) | 42.7 | ||||||
A$ equivalent of other items | 0.2 | 0.4 | |||||||
Payable in Australian dollars | (17.5 | ) | (1,389.0 | ) | |||||
| (18.7 | ) | (1,345.9 | ) | ||||||
Deferral of hedging gains and losses on the balance sheet is not in accordance with US GAAP, which requires hedging gains and losses to be included as part of other comprehensive income. Refer to Note 45(h).
F-37
Table of Contents
WMC RESOURCES LTD AND CONTROLLED ENTITIES
NOTES TO THE CONSOLIDATED FINANCIAL STATEMENTS—(Continued)
13. NON-CURRENT ASSETS—RECEIVABLES
As at 2002 A$m | As at 2001 A$m | ||||
Loans and debtors | 3.2 | 4.6 | |||
Provision for doubtful debts | — | (0.7 | ) | ||
| 3.2 | 3.9 | ||||
Debtors relating to hedging contracts | 215.6 | 477.5 | |||
| 218.8 | 481.4 | ||||
14. NON-CURRENT ASSETS—INVESTMENTS IN ASSOCIATES
As at 2002 A$m | As at 2001 A$m | ||||
Securities in entities which are not traded on any prescribed stock exchange | |||||
Securities at cost: Mondo Minerals Oy: | |||||
—balance brought forward | — | 46.5 | |||
—foreign currency revaluation | — | 0.5 | |||
| — | 47.0 | ||||
Equity in retained profits | — | 14.0 | |||
Sale of equity interest in Mondo Minerals* | — | (61.0 | ) | ||
Equity accounted carrying value of Mondo Minerals Oy | — | — | |||
| * | On 24 January 2001, WMC sold its 50 per cent equity interest in the Mondo Minerals Talc joint venture, effective 1 January 2001. |
15. NON-CURRENT ASSETS—OTHER FINANCIAL ASSETS
As at 2002 A$m | As at 2001 A$m | |||
Securities listed on prescribed stock exchanges | ||||
Cost | 3.7 | 0.1 | ||
Provision for diminution in value of investments | — | — | ||
Total investments in quoted companies | 3.7 | 0.1 | ||
Quoted market value | 5.2 | 1.1 | ||
Other investments at cost | 8.6 | 18.1 | ||
Total investments in unquoted entities | 8.6 | 18.1 | ||
Total investments in other entities | 12.3 | 18.2 | ||
F-38
Table of Contents
WMC RESOURCES LTD AND CONTROLLED ENTITIES
NOTES TO THE CONSOLIDATED FINANCIAL STATEMENTS—(Continued)
16. NON-CURRENT ASSETS—INVENTORIES
As at 2002 A$m | As at 2001 A$m | |||||
Stores | 48.8 | 44.9 | ||||
Provision for obsolescence | (15.3 | ) | (12.9 | ) | ||
| 33.5 | 32.0 | |||||
Stocks | ||||||
Work-in-progress at cost | 20.4 | 27.9 | ||||
Work-in-progress at net realizable value | 21.0 | 22.5 | ||||
| 41.4 | 50.4 | |||||
| 74.9 | 82.4 | |||||
17. NON-CURRENT ASSETS—EXPLORATION AND EVALUATION
As at 2002 A$m | As at 2001 A$m | |||||
Cost brought forward | 64.5 | 33.7 | ||||
—grassroots expenditure | 19.7 | 57.2 | ||||
—expenditure for additional reserves supporting existing operations | 3.7 | 19.3 | ||||
—evaluation expenditure | 15.0 | 18.6 | ||||
—write-offs | (49.9 | ) | (92.2 | ) | ||
—(disposals) | (35.5 | ) | — | |||
—transferred to mine properties and development | (2.7 | ) | — | |||
—acquisitions(1) | 137.9 | 27.1 | ||||
—foreign currency translation | — | 0.8 | ||||
Cost carried forward | 152.7 | 64.5 | ||||
(l) Acquisition details
2002—Corridor Sands
On 9 December 2002, WMC Resources announced that it had agreed to acquire 100% of the Corridor Sands titanium dioxide project from Southern Mining Corporation Limited. The net cost of the acquisition is payable in at least two tranches.
The first tranche was required under the purchase and sale agreement to be determined as a number of WMC Resources shares on the basis of the volume weighted average price of the shares in the 30 calendar days prior to entering into the agreement and has been recorded at fair value of US$62.5 million (A$111.1 million). The purchase and sale transaction was completed on 31 January 2003.
The final tranche of up to US$25 million will be paid in either shares or cash by WMC Resources. As the quantum of the second tranche payment is subject to, and contingent upon any future sales by the company of all or part of its equity interest in Corridor Sands occurring and realizing proceeds above stipulated levels. Any future payments cannot be reasonably estimated and therefore it has not been recognized in the above carrying value nor as a present obligation (liability).
F-39
Table of Contents
WMC RESOURCES LTD AND CONTROLLED ENTITIES
NOTES TO THE CONSOLIDATED FINANCIAL STATEMENTS—(Continued)
2001—Yakabindie Nickel Pty Limited
The Yakabindie Nickel Pty Limited company was acquired in 2001 for A$25 million (plus stamp duty and other minor costs of A$2.1 million). The balance sheet at acquisition consisted primarily of an exploration and evaluation asset, being the costs incurred by the company (whilst under the ownership of other mining groups) to determine the reserves of Yakabindie. In the event that mining approvals are obtained for Yakabindie, an additional A$15 million will be payable in cash to the vendor. At the date of this financial report, receipt of all mining approvals, including approval under aboriginal heritage legislation had not been obtained and accordingly this price variation has not been included in the cost of acquisition. Should this consideration become payable it will be included in the total acquisition cost at that time.
18. NON-CURRENT ASSETS—PROPERTY, PLANT AND EQUIPMENT
| Notes | As at 31 2002 A$m | As at 31 2001 A$m | ||||||
Government facilities | 18(a) | 33.2 | 32.0 | |||||
Mine properties and mine development | 18(b) | 835.9 | 850.0 | |||||
Property, land and buildings | 18(c) | 376.4 | 385.9 | |||||
Plant and equipment | 18(d) | 3,090.8 | 3,507.4 | |||||
| 4,336.3 | 4,775.3 | |||||||
(a) Government facilities: | ||||||||
Cost | 51.0 | 47.9 | ||||||
Provisions for amortization and write-off | (17.8 | ) | (15.9 | ) | ||||
| 33.2 | 32.0 | |||||||
(b) Mine properties and mine development: | ||||||||
Areas in which production has commenced: | ||||||||
Cost | 1,811.7 | 1,878.8 | ||||||
Provisions for amortization and write-off | (981.5 | ) | (1,029.3 | ) | ||||
| 830.2 | 849.5 | |||||||
Areas in which production has not yet commenced: | ||||||||
Cost | 19.6 | 14.3 | ||||||
Provisions for amortization and write-off | (13.9 | ) | (13.8 | ) | ||||
| 5.7 | 0.5 | |||||||
| 835.9 | 850.0 | |||||||
The ratio used to amortize mine development at the Mount Keith open cut mine was 691 tonnes of waste per tonne of recoverable nickel mined for 2002 (700 tonnes for 2001 and 704 tonnes for 2000). The amount amortized for 2002 was $56.3 million (2001: $52.9 million; 2000: $59.4 million).
F-40
Table of Contents
WMC RESOURCES LTD AND CONTROLLED ENTITIES
NOTES TO THE CONSOLIDATED FINANCIAL STATEMENTS—(Continued)
Included in the total of mine properties and mine development are post-production waste removal costs as follows:
2002 A$m | 2001 A$m | 2000 A$m | |||||||
Opening balance | 161.5 | 140.7 | 127.8 | ||||||
Costs capitalized | 98.3 | 102.1 | 72.5 | ||||||
Amortization charge | (73.6 | ) | (81.3 | ) | (59.6 | ) | |||
Closing balance | 186.2 | 161.5 | 140.7 | ||||||
As at 2002 A$m | As at 2001 A$m | |||||
(c) Property, land and buildings: | ||||||
Cost (including some property on mining leases) | 565.9 | 554.1 | ||||
Provisions for depreciation and write-off | (189.5 | ) | (168.2 | ) | ||
| 376.4 | 385.9 | |||||
Directors are required to disclose a current value (within the last three years) of interests in land and buildings, excluding mining tenements, leases and buildings thereon and other assets whose value is wholly dependent on those mining operations, held by entities within the Company. The value of such interests on the basis of market value for existing use was estimated by the Directors to be A$87.2 million as at 30 June 2002 compared with a net book value of A$33.2 million. As land and buildings are recorded at cost, this valuation has not been recognised in the financial statements. It should be noted that the market value of many of these properties is dependant upon the long term continuation of relevant mining operations and WMC Resources’ present employment policies.
As at 2002 A$m | As at 2001 A$m | |||||
(d) Plant and equipment: | ||||||
Cost | 4,789.7 | 4,837.4 | ||||
Provisions for depreciation and write-off | (1,975.5 | ) | (1,440.9 | ) | ||
| 2,814.2 | 3,396.5 | |||||
Construction in progress—cost | 276.6 | 110.9 | ||||
| 3,090.8 | 3,507.4 | |||||
F-41
Table of Contents
WMC RESOURCES LTD AND CONTROLLED ENTITIES
NOTES TO THE CONSOLIDATED FINANCIAL STATEMENTS—(Continued)
(e) Reconciliations
Reconciliations of the carrying amounts of each class of property, plant and equipment at the beginning and end of the current financial year are set out below.
Government A$m | Mine and mine A$m | Property, A$m | Plant and A$m | Total A$m | |||||||||||
Carrying amount at January 1, 2002 | 32.0 | 850.0 | 385.9 | 3,507.4 | 4,775.3 | ||||||||||
Additions | 2.4 | 133.9 | 22.6 | 306.0 | 464.9 | ||||||||||
Disposals | — | (13.2 | ) | (2.2 | ) | (5.2 | ) | (20.6 | ) | ||||||
Depreciation/amortization expense | (1.6 | ) | (138.9 | ) | (25.8 | ) | (327.9 | ) | (494.2 | ) | |||||
Assets written off | — | (1.8 | ) | (3.7 | ) | (8.0 | ) | (13.5 | ) | ||||||
Transfers | — | 5.9 | — | (91.9 | ) | (86.0 | ) | ||||||||
Fair value adjustment | — | — | — | (289.6 | ) | (289.6 | ) | ||||||||
Reclassifications | 0.4 | — | (0.4 | ) | — | — | |||||||||
Carrying amount at December 31, 2002 | 33.2 | 835.9 | 376.4 | 3,090.8 | 4,336.3 | ||||||||||
(f) Long lived asset held for sale
During 2001, WMC Resources reviewed its asset strategy and decided to focus on building a portfolio of long life, low cost assets. As a result, the company proposed divestment of the Kambalda nickel mines as well as the gold and talc businesses. Not all designated assets have been divested and accordingly the following long lived asset is held for sale:
2002—Lanfranchi
The Lanfranchi mine formed part of the Kambalda nickel mines. A sale of WMC Resources interest is expected during 2003. This asset is currently in the “Nickel” business segment. At 31 December 2002, Lanfranchi had a carrying value of nil. The financial result for the year ended 31 December 2002 was A$1.0 million profit.
2001—Long/Victor
The Long/Victor mine formed part of the Kambalda nickel mines. This asset was sold during 2002 for A$14 million, recognizing an after tax profit of A$9.4 million. This asset was held in the “Nickel” business segment. At 31 December 2001, Long/Victor had a carrying value of A$1.6 million. The financial result for the year ended 31 December 2001 was immaterial.
19. NON-CURRENT ASSETS—ACQUIRED MINERAL RIGHTS
As at 2002 A$m | As at 2001 A$m | ||||
Cost | 1,271.5 | — | |||
Provision for amortization | (2.2 | ) | — | ||
| 1,269.3 | — | ||||
F-42
Table of Contents
WMC RESOURCES LTD AND CONTROLLED ENTITIES
NOTES TO THE CONSOLIDATED FINANCIAL STATEMENTS—(Continued)
20. NON-CURRENT ASSETS—DEFERRED TAX ASSETS
As at 2002 A$m | As at 2001 A$m | |||||
Future income tax benefit | 44.6 | 303.7 | ||||
Future income tax benefit—US GAAP | ||||||
Future income tax benefit before valuation allowance: | ||||||
—Income tax losses | 577.4 | 378.1 | ||||
—Income tax timing differences | (80.0 | ) | 63.1 | |||
—Capital losses | 128.6 | 63.9 | ||||
| 626.0 | 505.1 | |||||
Valuation allowance: | ||||||
(Australian GAAP, Income tax benefits not brought to account) | ||||||
—Income tax losses | (422.5 | ) | (88.4 | ) | ||
—Income tax timing differences | (30.3 | ) | (49.1 | ) | ||
—Capital losses | (128.6 | ) | (63.9 | ) | ||
| (581.4 | ) | (201.4 | ) | |||
Future income tax benefit after valuation allowance: | ||||||
(Australian GAAP, future income tax benefits) | ||||||
—Income tax losses | 154.9 | 289.7 | ||||
—Income tax timing differences | (110.3 | ) | 14.0 | |||
| 44.6 | 303.7 | |||||
The timing differences represented by the net future income tax benefits are: | ||||||
Amortization and depreciation | (201.2 | ) | (64.2 | ) | ||
Prepayments | (1.2 | ) | (0.3 | ) | ||
Provisions | 43.9 | 3.0 | ||||
Stores | (9.0 | ) | (3.2 | ) | ||
Foreign exchange | (36.4 | ) | 78.9 | |||
Financial instruments | — | 0.1 | ||||
Stock | 78.3 | — | ||||
Tax losses | 154.9 | 289.7 | ||||
Other | 15.3 | (0.3 | ) | |||
| 44.6 | 303.7 | |||||
F-43
Table of Contents
WMC RESOURCES LTD AND CONTROLLED ENTITIES
NOTES TO THE CONSOLIDATED FINANCIAL STATEMENTS—(Continued)
21. NON-CURRENT ASSETS—OTHER ASSETS
| Notes | As at 2002 A$m | As at 2001 A$m | ||||||
Research and development | 21(a) | 0.3 | 0.5 | |||||
Capitalized systems upgrade | 21(b) | 6.4 | 20.5 | |||||
Deferred losses-hedging contracts | 12(a) | 25.9 | 1,188.2 | |||||
Deferred borrowing costs and premiums | 21(c) | 4.9 | 7.8 | |||||
Other | 2.4 | 19.5 | ||||||
| 39.9 | 1,236.5 | |||||||
(a) Research and development | ||||||||
(i) Cost brought forward | 7.2 | 7.4 | ||||||
—expenditure | 0.3 | — | ||||||
—write-offs | (0.6 | ) | (0.4 | ) | ||||
—transferred or sold | 0.1 | 0.2 | ||||||
Cost carried forward | 7.0 | 7.2 | ||||||
(ii) Provision brought forward | (6.7 | ) | (5.0 | ) | ||||
—charged to profit and loss | (0.5 | ) | (1.7 | ) | ||||
—reversed on sale, transfer or reclassification | 0.5 | — | ||||||
—transfers from other accounts | — | — | ||||||
Provision carried forward | (6.7 | ) | (6.7 | ) | ||||
| 0.3 | 0.5 | |||||||
(b) Capitalized systems upgrade | ||||||||
Cost of commercial systems software | 70.7 | 70.7 | ||||||
Provision for amortization | (64.3 | ) | (50.2 | ) | ||||
| 6.4 | 20.5 | |||||||
(c) Deferred borrowing costs and premiums | ||||||||
Cost | 5.0 | 45.0 | ||||||
Provision for amortization | (0.1 | ) | (37.2 | ) | ||||
| 4.9 | 7.8 | |||||||
22. CURRENT LIABILITIES—PAYABLES
As at 2002 A$m | As at 2001 A$m | |||
Trade creditors | 110.6 | 159.1 | ||
Creditors relating to hedging contracts | 300.1 | 555.7 | ||
Other creditors | 247.2 | 140.4 | ||
| 657.9 | 855.2 | |||
F-44
Table of Contents
WMC RESOURCES LTD AND CONTROLLED ENTITIES
NOTES TO THE CONSOLIDATED FINANCIAL STATEMENTS—(Continued)
23. CURRENT LIABILITIES—INTEREST BEARING LIABILITIES
| Notes | As at 31 2002 A$m | As at 31 2001 A$m | ||||
Bank overdrafts | — | 0.2 | ||||
Borrowings | 28(a) | 1,287.6 | 584.1 | |||
| 1,287.6 | 584.3 | |||||
(a) Current Liabilities—borrowings and overdrafts
Category of aggregate short term borrowings | Balance at end of year A$m | Weighted borrowings % | Maximum amount outstanding during period(i) A$m | Average amount outstanding during period(ii) A$m | Weighted average interest rate during period(iii) % | |||||
Year ended 31 December 2002 | ||||||||||
Bank overdrafts | — | — | — | — | — | |||||
Other loans | 1,287.6 | 3.36 | 1,287.6 | 597.6 | 3.84 | |||||
| 1,287.6 | ||||||||||
Year ended 31 December 2001 | ||||||||||
Bank overdrafts | 0.2 | 8.00 | 0.5 | 0.2 | 8.67 | |||||
Other loans | 584.1 | 3.20 | 1,119.5 | 752.9 | 5.28 | |||||
| 584.3 | ||||||||||
There are no significant unused committed lines of credit for short-term financing.
| (i) | Based on bank statement balances. |
| (ii) | Based on average monthly balance. |
| (iii) | Based on weighted average monthly interest rates. |
24. CURRENT LIABILITIES—CURRENT TAX
As at 2002 A$m | As at 2001 A$m | |||
Current income tax | 3.9 | 8.0 | ||
F-45
Table of Contents
WMC RESOURCES LTD AND CONTROLLED ENTITIES
NOTES TO THE CONSOLIDATED FINANCIAL STATEMENTS—(Continued)
25. CURRENT LIABILITIES—PROVISIONS
| Notes | As at 31 2002 A$m | As at 31 2001 A$m | |||||||
Employee entitlements | 30 | 41.3 | 46.8 | ||||||
Rehabilitation | 25 | (a) | 6.5 | 5.8 | |||||
Lease commitments | 25 | (b) | 5.7 | — | |||||
Workers compensation | 25 | (c) | 6.6 | 4.8 | |||||
Other | 25 | (d) | 5.9 | 17.3 | |||||
| 66.0 | 74.7 | ||||||||
(a) Rehabilitation | |||||||||
Estimates are made of the timing and extent of the rehabilitation work to be performed. Over time, these estimates may alter, and the amount settled in any particular year differ from the initial estimates. Refer Note 1(t) for further information. | |||||||||
Carrying amount at beginning of year | 5.8 | 5.3 | |||||||
Payments made during the year | (4.8 | ) | — | ||||||
Transfers from non-current | 4.6 | — | |||||||
Other adjustments | 0.9 | 0.5 | |||||||
Carrying amount at end of year | 6.5 | 5.8 | |||||||
(b) Lease commitments | |||||||||
The portion of the lease commitment provision expected to be settled in the next financial year has been classified as current. | |||||||||
Carrying amount at beginning of year | — | — | |||||||
Provisions made during the year | 5.7 | — | |||||||
Carrying amount at end of year | 5.7 | — | |||||||
(c) Workers compensation | |||||||||
Provision is made for claims expected to be settled in the next financial year. The actual timing of the settlement of the claims may extend into the following financial year. | |||||||||
Carrying amount at beginning of year | 4.8 | 2.9 | |||||||
Provisions made during the year | 0.9 | 1.8 | |||||||
Payments made during the year | (1.5 | ) | (0.1 | ) | |||||
Other adjustments | 2.4 | 0.2 | |||||||
Carrying amount at end of year | 6.6 | 4.8 | |||||||
(d) Other | |||||||||
Provisions is made for other individually immaterial obligations, all of which are expected to be settled within the next financial year. | |||||||||
Carrying amount at beginning of year | 17.3 | 17.1 | |||||||
Provisions made/(released) during the year | (4.1 | ) | 23.6 | ||||||
Payments made during the year | (6.0 | ) | (20.9 | ) | |||||
Other adjustments | (1.3 | ) | (2.5 | ) | |||||
Carrying amount at end of year | 5.9 | 17.3 | |||||||
F-46
Table of Contents
WMC RESOURCES LTD AND CONTROLLED ENTITIES
NOTES TO THE CONSOLIDATED FINANCIAL STATEMENTS—(Continued)
As at 2002 A$m | �� | As at 2001 A$m | ||
Deferred gains—hedging contracts | 7.2 | — | ||
Prepaid revenue | 2.9 | 8.0 | ||
Other | 6.9 | 7.1 | ||
| 17.0 | 15.1 | |||
27. NON-CURRENT LIABILITIES—PAYABLES
As at 2002 A$m | As at 2001 A$m | |||
Creditors relating to hedging contracts | 800.5 | 1,142.3 | ||
Other creditors | 49.2 | 55.4 | ||
| 849.7 | 1,197.7 | |||
28. NON-CURRENT LIABILITIES—INTEREST BEARING LIABILITIES
| Notes | As at 2002 A$m | As at 2001 A$m | ||||||
Borrowings | 28 | (a) | 369.9 | 1,737.7 | ||||
(a) Total borrowings | ||||||||
Disclosed as: | ||||||||
—current liabilities (due in 12 months or less) | 23 | 1,287.6 | 584.1 | |||||
—non-current liabilities (due in more than 12 months) | 369.9 | 1,737.7 | ||||||
| 1,657.5 | 2,321.8 | |||||||
(b) Description | ||||||||
Unsecured: | ||||||||
US$0.1 million Debentures at 7.35% due 1 December 2026 | 0.2 | — | ||||||
US$4.1 million Debentures at 7.25% due 15 November 2013 | 7.2 | — | ||||||
US$0.8 million Notes at 6.75% due 1 December 2006 | 1.4 | — | ||||||
US$19.9 million Notes at 6.5% due 15 November 2003 | 35.2 | — | ||||||
US$320 million bank loans at floating interest rates (weighted average rate of 2.05%) | 564.8 | — | ||||||
US$200 million Notes at 7.35% due 1 December 2026 | — | 391.1 | ||||||
US$150 million Debentures at 7.25% due 15 November 2013 | — | 293.3 | ||||||
A$50 million Note at floating interest rates applicable in Australia due 18 May 2009 | — | 50.0 | * | |||||
US$200 million Notes at 6.75% due 1 December 2006 | — | 391.1 | ||||||
US$250 million Notes at 6.5% due 15 November 2003 | — | 488.9 | ||||||
A$200 million Notes at 6.0% due 25 May 2002 | — | 200.0 | * | |||||
Promissory notes (Weighted average rate of 4.38% in 2001) | — | 240.0 | ||||||
Bank loans at floating interest rates applicable in Australia (Weighted average rate of 3.14% in 2001) | — | 230.1 | * | |||||
Bank loans at floating interest rates applicable in Australia (Weighted average rate of 5.36%—2001:-1.8%) | 1,048.7 | 37.3 | ||||||
| 1,657.5 | 2,321.8 | |||||||
| * | These amounts have been swapped to US dollars (refer to Note 36B) |
F-47
Table of Contents
WMC RESOURCES LTD AND CONTROLLED ENTITIES
NOTES TO THE CONSOLIDATED FINANCIAL STATEMENTS—(Continued)
| Notes | As at 2002 A$m | As at 2001 A$m | ||||
(c) Currencies | ||||||
US dollars | 824.9 | 1,064.5 | ||||
GB pounds | — | 0.1 | ||||
A$ equivalent of above currencies | 1,455.9 | 2,081.8 | ||||
Australian dollars | 201.6 | 240.0 | ||||
Australian dollars | 1,657.5 | 2,321.8 | ||||
(d) Exchange rates | ||||||
Exchange rates as at balance date used in translations: | ||||||
A$1 = US$ | 0.5666 | 0.5114 | ||||
A$1 = GBP | — | 0.3527 | ||||
(e) Analysis of repayments | ||||||
Current liabilities: | ||||||
In one year or less(1) | 23 | 1,287.6 | 584.1 | |||
Non-current liabilities: | ||||||
Between one and two years | 361.9 | 107.8 | ||||
Between two and three years | — | 488.9 | ||||
Between three and four years | 1.3 | — | ||||
Between four and five years | — | 391.1 | ||||
Later than five years | 6.7 | 749.9 | ||||
| 369.9 | 1,737.7 | |||||
| 1,657.5 | 2,321.8 | |||||
| (1) | The most significant items included in the 2002 balance are a US$500 million (A$882.5 million) 364 day term facility which was entered into in November 2002 and fully drawn down at 31 December 2002, and is intended to be refinanced by a medium to long-term debt capital markets issuance during 2003 and a one year US$200 million (A$380 million) will also be repaid and refinanced during 2003. |
29. NON-CURRENT LIABILITIES—DEFERRED TAX LIABILITIES
| Notes | As at 31 2002 A$m | As at 31 2001 A$m | |||||||
Deferred income tax | 29 | (a) | 377.0 | 434.6 | |||||
(a) The timing differences represented by the provision for | |||||||||
Amortization and depreciation | 388.2 | 596.2 | |||||||
Prepayments | — | 1.2 | |||||||
Employee provisions | (4.6 | ) | (16.4 | ) | |||||
Other provisions | 7.0 | (6.8 | ) | ||||||
Stores | 8.1 | 18.4 | |||||||
Stock | — | (9.0 | ) | ||||||
Foreign exchange | 30.6 | (1.7 | ) | ||||||
Financial instruments | — | 11.3 | |||||||
Other | 24.0 | 19.0 | |||||||
Tax losses | (76.3 | ) | (177.6 | ) | |||||
| 377.0 | 434.6 | ||||||||
F-48
Table of Contents
WMC RESOURCES LTD AND CONTROLLED ENTITIES
NOTES TO THE CONSOLIDATED FINANCIAL STATEMENTS—(Continued)
30. NON-CURRENT LIABILITIES—PROVISIONS
| Notes | As at 2002 A$m | As at 2001 A$m | |||||
Employee entitlements(1) | 13.0 | 12.6 | |||||
Rehabilitation | 30 | (a) | 94.7 | 83.9 | |||
Other | 30 | (b) | 2.0 | 0.5 | |||
| 109.7 | 97.0 | ||||||
| (1) | The aggregate of provisions for employee entitlements as shown in Notes 25 and 30 is $54.3 million (2001: $59.4 million). |
Reconciliations of the carrying amounts of each class of provision, except for employee entitlements are set out below. Further information on these classes of provisions can be found in Notes 1 and 25.
As at 2002 A$m | As at 2001 A$m | |||||
(a) Rehabilitation | ||||||
Carrying amount at beginning of year | 83.9 | 87.3 | ||||
Provisions made during the year | 14.2 | 0.1 | ||||
Transfer to current | (4.6 | ) | — | |||
Other adjustments | 1.2 | (3.5 | ) | |||
Carrying amount at end of year | 94.7 | 83.9 | ||||
(b) Other | ||||||
Carrying amount at beginning of year | 0.5 | 4.7 | ||||
Provisions made during the year | 1.5 | 0.6 | ||||
Reversed to profit and loss | — | (2.2 | ) | |||
Transfer to other account | — | (2.6 | ) | |||
Carrying amount at end of year | 2.0 | 0.5 | ||||
31. NON-CURRENT LIABILITIES—OTHER
As at 2002 A$m | As at 2001 A$m | |||
Prepaid rent | — | 6.6 | ||
Other | 2.8 | 2.7 | ||
| 2.8 | 9.3 | |||
As at 2002 A$m | As at 2001 A$m | |||
Shareholders’ equity(1) | 3,606.6 | 3,220.3 | ||
F-49
Table of Contents
WMC RESOURCES LTD AND CONTROLLED ENTITIES
NOTES TO THE CONSOLIDATED FINANCIAL STATEMENTS—(Continued)
| (1) | Shareholders’ equity at 31 December 2002 comprises of the following: |
Contributed equity | 3,653.4 | ||
Asset revaluation reserve | 24.5 | ||
Foreign currency translation reserve | 6.2 | ||
Accumulated losses | (77.5 | ) | |
| 3,606.6 | |||
For 2001, this represents the deemed contribution of shareholders’ equity from the demerger of WMC Limited. Consequent on the demerger, shareholders in WMC Limited have become shareholders in WMC Resources Ltd on a pro-rata basis. Set out below for information is the number of shares issued by the company for the periods concerned.
Movements in issued shares | Number of fully paid shares | Number of partly paid shares | ||||||||
| 2002 | 2001 | 2002 | 2001 | |||||||
Opening number of shares | 1,108,821,653 | 1,097,898,726 | 629,000 | 771,500 | ||||||
Issued under Employee Share Scheme | 4,819,790 | 10,780,427 | — | — | ||||||
Conversion of partly paid shares | 629,000 | 142,500 | (629,000 | ) | (142,500 | ) | ||||
Allotment for purchase of Corridor Sands | 14,080,604 | — | — | — | ||||||
Closing number of shares | 1,128,351,047 | 1,108,821,653 | — | 629,000 | ||||||
| (a) | Ordinary shares entitle the holder to participate in dividends in proportion to the number of and amounts paid on the shares held. On a show of hands every holder of ordinary shares present at a meeting in person or by proxy, is entitled to one vote, and upon a poll each share is entitled to one vote. |
| (b) | Stock-based compensation plans |
In conjunction with the demerger from WMC Limited in December 2002, WMC Resources created its Employee Share Scheme (WMC Resources ESS) which allows for the granting of stock options in WMC Resources’ common stock and a Stock Appreciation Plan (SAP).
(i) Employee Option Plan
Permanent employees of WMC Resources Ltd and its subsidiaries who are employed by the company or a subsidiary, with the exception of certain senior executives, are eligible to participate in the Employee Option Plan and be offered options for fully paid shares. At any time the aggregate of the number of options outstanding must not exceed five per cent of the total number of issued shares in the company immediately prior to the most recent issue.
Under the WMC Resources stock option plan, there were 11.6644 million common shares authorized for grant as of December 31, 2002. The exercise price of stock options granted is equal to the stock price when the option is granted. The options generally vest over one year and are exercisable up to 5 years from the date of grant. Restrictions exist for certain employees on the number of options that can be exercised in any year. If the request to convert the options to shares has not been made, the Company must make the call at the completion of five years from the date of issue or on termination of employment. Certain designated officers are not permitted to exercise options or buy and sell WMC Resources Ltd shares in the period between the end of company’s half or full financial year and the release of the respective results.
F-50
Table of Contents
WMC RESOURCES LTD AND CONTROLLED ENTITIES
NOTES TO THE CONSOLIDATED FINANCIAL STATEMENTS—(Continued)
(ii) Stock Appreciation Plan
Under the terms of the WMC Resources Stock Appreciation Plan (SAP), employees are invited to apply for the grant by WMC Resources. The employees are not required to pay any amount for the grant, but each WMC Resources SAP will have a notional allotment exercise price, equal to the weighted average sale price of WMC Resource shares on the ASX on the trading day that the invitation to apply for the WMC Resources SAP is made to the employee. Subject to certain exceptions, the WMC Resources SAP will not be able to be redeemed until after a period of 12 months from the date of allotment and will lapse on the fifth anniversary of the date of allotment. Upon redemption of a WMC Resources SAP before its expiry by the holder, the holder will be entitled to a payment equal to the difference between the closing price of WMC Resources share on the ASX on the trading day immediately before redemption, and the notional allotment price (assuming the former is higher).
Prior to the demerger from WMC Limited, employees of WMC Resources participated in the stock-based compensation plans of WMC Limited, which included stock options and stock appreciation rights granted in WMC Limited common stock. Prior to the date of the offering of WMC Resources in December 2002, WMC Limited granted approximately 11.17 million and 10.41 million WMC Limited stock options to WMC Resources employees during 2001 and 2000, respectively. The weighted-average exercise prices at the grant date for WMC Limited stock options granted to WMC Resources employees during 2001 and 2000 were $9.35 and $7.52, respectively. At December 31, 2001 and 2000, there were approximately 27.07 million and 27.72 million WMC Limited common stock options outstanding, respectively, held by WMC Resources employees at weighted average exercise prices of $8.18 and $7.20, respectively. At December 31, 2001 and 2000, there were approximately 15.90 million and 17.30 million WMC Limited common stock options exercizable, respectively, at weighted average exercise prices of $7.36 and $7.01, respectively.
Additionally, prior to the demerger, WMC Limited had granted WMC Limited Stock Appreciation Rights to WMC Resources employees. After the demerger as noted below, the SAP rights were split in to Alumina Limited and WMC Resources Ltd SAPs.
(iii) Executive Share Plan
Senior executives participate in the WMC Resources Ltd Executive Share Plan which provides rewards for senior executives based on WMC Resources Ltd’s performance against a peer index of resource companies. Actual rewards vary to reflect individual executive performance and the performance of WMC Resources Ltd on a total shareholder return basis against the index. All rewards for senior executives through this plan are directed to purchasing WMC Resources Ltd shares, with each participant required to hold shares that reflect a multiple of their salary. Shares can only be accessed once the multiple has been exceeded, and then only the shares that are over the multiple (subject to certain other disposal restrictions).
During the year 1,158,303 shares were purchased by WMC Resources Ltd under this plan at a gross cost (pre tax) of $5.0 million.
(iv) Impact of demerger on plans
In conjunction with the demerger, WMC Limited and WMC Resources Ltd entered into an employee benefits agreement. This agreement covered the treatment of WMC Limited common stock options issued to WMC Limited and WMC Resources employees. According to the agreement, each WMC Limited option granted to WMC Limited and WMC Resources employees prior to December 4, 2002, that was outstanding under the WMC Limited Employee Share Scheme as of the demerger date, was adjusted. This adjustment resulted in each individual who was a holder of a WMC Limited option receiving, immediately after the demerger date, an adjusted WMC Limited option and a WMC Resources option. As part of the demerger from WMC Limited, WMC Limited option holders were granted one option for Alumina Limited and one for WMC Resources Ltd.
F-51
Table of Contents
WMC RESOURCES LTD AND CONTROLLED ENTITIES
NOTES TO THE CONSOLIDATED FINANCIAL STATEMENTS—(Continued)
The aggregate exercise prices of the Alumina Limited option and the WMC Resources Ltd option is equal the exercise price of the WMC Limited option prior to demerger. The Alumina Limited option and the WMC Resources option have the same lapse date as the WMC Limited option would have had if the demerger had not proceeded—being the earlier of five years after the option was issued and 30 days after the WMC Limited option holder ceases to be employed by WMC Limited Group, the WMC Resources Group or Alumina Group. The exercise price of a WMC Resources option was determined by reference to the pre-demerger exercise price of the WMC Limited option (which became an Alumina option) in respect of which the WMC Resources option was granted and the volume weighted average price of WMC Resources shares and Alumina Limited shares sold on the ASX over the first five days of trading on the ASX commencing on the listing date. The Stock Appreciation Plan was treated in the same manner as the Share Scheme as detailed above.
During the financial year 22,574,970 options were granted as a consequence of the WMC Limited demerger and 10,951,860 were issued under the 2002 option plan. A total of 947,050 options were exercised (total amount receivable at 31 December 2002—$2.5 million) and 78,600 options lapsed during the period.
As at 31 December 2002, the market price per ordinary share was $4.22 and 32,501,180 options remained exercisable as follows:
Granted in 2002 | Exercised in 2002 | Outstanding as at 31 December 2002 | Exercise price | Expiry date | |||||
451,300(1) | 451,300 | Nil | $ | 2.27 | 22 December 2002 | ||||
250,000(1) | 250,000 | Nil | $ | 2.50 | 22 December 2002 | ||||
375,000(1) | — | 375,000 | $ | 2.49 | 21 December 2003 | ||||
963,120(1) | 36,900 | 926,220 | $ | 2.26 | 21 December 2003 | ||||
3,868,000(1) | 119,900 | 3,748,100 | $ | 3.90 | 20 December 2004 | ||||
6,007,050(1) | 88,950 | 5,918,100 | $ | 3.48 | 18 December 2005 | ||||
10,060,500(1) | — | 9,981,900 | $ | 4.33 | 30 November 2006 | ||||
600,000(1) | — | 600,000 | $ | 4.33 | 30 November 2006 | ||||
10,951,860 | — | 10,951,860 | $ | 4.34 | 23 December 2007 | ||||
33,526,830 | 947,050 | 32,501,180 | |||||||
| (1) | Granting of options as part of the demerger to reflect options previously held in Alumina Limited. |
These outstanding options represent 2.9 per cent of issued capital.
F-52
Table of Contents
WMC RESOURCES LTD AND CONTROLLED ENTITIES
NOTES TO THE CONSOLIDATED FINANCIAL STATEMENTS—(Continued)
Summary of WMC Resources Common Stock Options and Stock Appreciation Plan
The following table is a summary of WMC Resources stock option transactions subsequent to the demerger:
2002 | Shares in Thousands | Weighted- Average Exercise Price | ||||
Outstanding at January 1 | Nil | N/A | ||||
Movements during the year: | ||||||
Options | ||||||
—Granted | 10,952 | $ | 4.34 | |||
—Exercised | (947 | ) | $ | 2.65 | ||
—Canceled or forfeited | (78 | ) | $ | 4.33 | ||
—Options created as a result of demerger | 22,574 | $ | 3.85 | |||
SAPs | ||||||
—Created as a result of the demerger | 1,684 | $ | 4.05 | |||
— Granted | 261 | $ | 4.34 | |||
Outstanding at December 31 | ||||||
Options | 32,501 | $ | 4.05 | |||
SAPs | 1,945 | $ | 4.09 | |||
The following table summarizes information about the WMC Resources stock options and SAPs outstanding at December 31, 2002:
| Options / SAPs Outstanding | Options / SAPs Exercisable | |||||||||||
Range of Exercise Prices | Number (thousands) | Weighted- Average | Weighted- Average | Number (thousands) | Weighted- Average | |||||||
$2.49 | 375.0 | 1.0 | 2.49 | 375.0 | 2.49 | |||||||
$2.26 | 985.7 | 1.0 | 2.26 | 985.7 | 2.26 | |||||||
$3.90 | 3,931.5 | 2.0 | 3.90 | 3,931.5 | 3.90 | |||||||
$3.48 | 6,228.0 | 3.0 | 3.48 | 6,228.0 | 3.48 | |||||||
$4.33 | 11,713.2 | 3.9 | 4.33 | 11,713.2 | 4.33 | |||||||
$4.34 | 11,213.3 | 5.0 | 4.34 | — | — | |||||||
Total | 34,446.7 | 3.76 | $ | 4.05 | 23,233.4 | $ | 3.91 | |||||
Of the 34,447 thousand options and SAPs outstanding at December 31, 2002, 5,303 thousand were held by non-employees.
F-53
Table of Contents
WMC RESOURCES LTD AND CONTROLLED ENTITIES
NOTES TO THE CONSOLIDATED FINANCIAL STATEMENTS—(Continued)
| Notes | Year to 31 Dec 2002 A$m | Year to 31 Dec 2001 A$m | Year to 31 Dec 2000 A$m | ||||||||
Outside equity interest in controlled entities comprises: | |||||||||||
Share capital | — | 2.6 | 2.6 | ||||||||
Increase in value of assets | — | — | 6.7 | ||||||||
Reserves | — | 0.7 | 0.7 | ||||||||
Retained profits | 33 | (a) | — | 5.7 | 3.5 | ||||||
| — | 9.0 | 13.5 | |||||||||
(a) Retained profits reconciliation | |||||||||||
Outside equity interests in operating profit after income tax | (0.7 | ) | 2.2 | 3.2 | |||||||
Retained profits brought forward | 5.7 | 3.5 | 1.3 | ||||||||
Total available for appropriation | 5.0 | 5.7 | 4.5 | ||||||||
Dividends provided for or paid | — | — | (1.0 | ) | |||||||
Transfer to profits attributable to members of Alumina Limited on disposal | (5.0 | ) | — | — | |||||||
Retained profits at the end of the financial year | — | 5.7 | 3.5 | ||||||||
F-54
Table of Contents
WMC RESOURCES LTD AND CONTROLLED ENTITIES
NOTES TO THE CONSOLIDATED FINANCIAL STATEMENTS—(Continued)
34. NOTES TO THE STATEMENT OF CASH FLOWS
| Notes | Year to 31 Dec 2002 A$m | Year to 31 Dec 2001 A$m | Year to 31 Dec 2000 A$m | ||||||||
(a) Reconciliation of operating profit after income tax to net cash provided by operating activities | |||||||||||
Net Income before minority interests | 22.3 | 128.2 | 403.1 | ||||||||
Depreciation and amortization | 3 | 511.7 | 596.2 | 510.8 | |||||||
Borrowing costs amortization | — | (5.4 | ) | 6.1 | |||||||
Research and development written off | 0.6 | 0.4 | 1.4 | ||||||||
(Profit)/loss on disposal of non-current assets | (40.3 | ) | (275.1 | ) | 6.9 | ||||||
Provision for diminution in investments and loans | (0.6 | ) | 0.2 | 1.2 | |||||||
Unrealized exchange losses/(gains) | (4.1 | ) | 0.6 | (1.9 | ) | ||||||
Write down in value of inventory | 3 | 3.3 | 7.7 | 6.2 | |||||||
Change in assets and liabilities adjusted for (Increase)/decrease in: | |||||||||||
—inventories | (51.1 | ) | (20.8 | ) | (20.4 | ) | |||||
—receivables | 200.9 | 278.3 | (430.9 | ) | |||||||
—future income tax benefits | 9.3 | (121.9 | ) | (79.7 | ) | ||||||
—other assets | 292.3 | (194.5 | ) | (592.8 | ) | ||||||
(Decrease)/increase in: | |||||||||||
—accounts payable | (545.3 | ) | 154.7 | 858.6 | |||||||
—provision for income tax payable | (4.1 | ) | 3.3 | (1.6 | ) | ||||||
—provision for deferred income tax | (57.6 | ) | 22.7 | 219.6 | |||||||
—other operating provisions | 4.0 | 14.5 | 9.4 | ||||||||
—other liabilities | (4.6 | ) | (11.4 | ) | 2.1 | ||||||
Net cash provided by operating activities | 336.7 | 577.7 | 898.1 | ||||||||
(b) Acquisition and disposal of controlled entities
During the financial year the Company did not acquire or dispose of any material controlled entities.
(c) Non-cash financing and investing activities
Proceeds of $25 million from the sale of the St Ives and Agnew gold operations were not received as at 31 December 2001.
(d) Financing facilities
Refer to Note 35.
F-55
Table of Contents
WMC RESOURCES LTD AND CONTROLLED ENTITIES
NOTES TO THE CONSOLIDATED FINANCIAL STATEMENTS—(Continued)
The total facilities available at balance date were as follows:
As at 31 2002 A$m | As at 31 2001 A$m | |||
Bank overdrafts | — | 0.2 | ||
Bank loan facilities | — | 958.2 | ||
Short term loan facilities | 1,357.6 | 451.9 | ||
Medium term loan facilities | 617.7 | 488.9 | ||
Long term loan facilities | 8.0 | 1,141.0 | ||
| 1,983.3 | 3,040.2 | |||
Used at balance date: | ||||
Bank overdrafts | — | 0.2 | ||
Bank loan facilities | — | 240.0 | ||
Short term loan facilities | 1,268.9 | 451.9 | ||
Medium term loan facilities | 369.7 | 488.9 | ||
Long term loan facilities | 8.0 | 1,141.0 | ||
| 1,646.6 | 2,322.0 | |||
Available at balance date: | ||||
Bank loan facilities | — | 718.2 | ||
Short term loan facilities | 88.7 | — | ||
Medium term loan facilities | 248.0 | — | ||
Long term loan facilities | — | — | ||
| 336.7 | 718.2 | |||
These facilities are structured such that they may be drawn down in a currency different to the denominated currency. At 31 December 2002, amounts had been drawn against these facilities in both US$ and A$. The loan facilities are denominated in currencies as follows:—
As at 31 2002 A$m | As at 31 2001 A$m | |||
Bank loans facilities | ||||
United States dollars | — | 490.0 | ||
In some cases, these facilities may be drawn in another currency to the equivalent value of the denominated currency. | ||||
Short term facilities | ||||
Australian dollars | — | 414.7 | ||
United States dollars | 769.2 | 19.0 | ||
Medium term facilities | ||||
Australian dollars | — | — | ||
United States dollars | 350.0 | 250.0 | ||
Long term facilities | ||||
Australian dollars | — | 65.5 | ||
United States dollars | 4.5 | 550.0 | ||
F-56
Table of Contents
WMC RESOURCES LTD AND CONTROLLED ENTITIES
NOTES TO THE CONSOLIDATED FINANCIAL STATEMENTS—(Continued)
A. Hedging position
WMC Resources’ revenues will vary significantly with movements in commodity prices and the A$/US$ exchange rate. In the past these risks were managed through a hedging programme which provided management with increased assurance of revenue outcomes when planning future activities. The improved cost performance of the operations and the added diversity of revenue sources following the expansion of the Olympic Dam and the start up of the Queensland Fertilizer Operation have significantly improved expected cash flows throughout the business cycle. As a result, since December 1999, the Price Risk Management Policy has been revised to substantially reduce future hedging activity. Hedging is limited to gold revenue denominated in Australian dollars and revenue from specific projects where targeted returns can be secured.
As at 31 December 2002, WMC Resources had entered into a number of foreign exchange and commodity hedging contracts. These are explained below:
(i) Currency hedging
As at 31 December 2002, WMC Resources had the following hedge position against its currency exposures:
(a) WMC Resources subsidiary entities excluding Central Norseman Gold Corporation (CNGC)
As at 31 December 2002, US$1,640.5 million (2001: US$2,104.3 million) had been hedged at an average rate of A$/US$0.6614 (2001: 0.6570) at maturities extending to 2008 using a combination of forward contracts and options as detailed in the table below:
Maturity | Forward sale of US$ | Bought US$ Put Options | Written US$ Call Options | Rate for | ||||||||||
Amount US$m | Rate A$/US$ | Amount US$m | Strike rate A$/US$ | Strike rate A$/ | Amount US$m | |||||||||
2003 | 195.6 | 0.6821 | 62.5 | 0.6479 | 0.6479 | 62.5 | 0.5534 | |||||||
2004 | 228.4 | 0.6753 | 72.5 | 0.6402 | 0.6402 | 72.5 | 0.5448 | |||||||
2005 | 228.3 | 0.6887 | 77.5 | 0.6430 | 0.6430 | 77.5 | 0.5431 | |||||||
2006 | 155.6 | 0.6828 | 72.5 | 0.6402 | 0.6402 | 72.5 | 0.5429 | |||||||
2007 | 174.6 | 0.6729 | 77.5 | 0.6430 | 0.6430 | 77.5 | 0.5433 | |||||||
2008 | 178.5 | 0.6500 | 117.0 | 0.5913 | 0.5913 | 117.0 | 0.5405 | |||||||
For comparison, the following foreign currency hedge positions were in place at 31 December 2001:
Maturity | Forward sale of US$ | Bought US$ Put Options | Written US$ Call Options | |||||||||
Amount US$m | Rate A$/US$ | Amount US$m | Strike rate A$/ | Amount US$m | Strike rate A$/US$ | |||||||
2002 | 211.5 | 0.6854 | 252.3 | 0.5875 | 82.5 | 0.6571 | ||||||
2003 | 175.6 | 0.6855 | 82.5 | 0.6571 | 82.5 | 0.6571 | ||||||
2004 | 208.4 | 0.6817 | 92.5 | 0.6500 | 92.5 | 0.6500 | ||||||
2005 | 213.3 | 0.6870 | 92.5 | 0.6500 | 92.5 | 0.6500 | ||||||
2006 | 135.6 | 0.6809 | 92.5 | 0.6500 | 92.5 | 0.6500 | ||||||
2007-2008 | 338.1 | 0.6595 | 209.5 | 0.6173 | 209.5 | 0.6173 | ||||||
(b) CNGC
Central Norseman Gold Corporation Ltd (“CNGC”) was sold in January 2002.
F-57
Table of Contents
WMC RESOURCES LTD AND CONTROLLED ENTITIES
NOTES TO THE CONSOLIDATED FINANCIAL STATEMENTS—(Continued)
The following foreign currency hedge contracts relating to CNGC were in place at 31 December 2001:
Maturity | Forward sale of US$ | Bought US$ Put Options | Written US$ Call Options | |||||||||
Amount US$m | Rate A$/US$ | Amount US$m | Strike rate A$/ | Amount US$m | Strike rate A$/US$ | |||||||
2002 | 23.5 | 0.6289 | 0.9 | 0.6865 | 0.9 | 0.6865 | ||||||
2003 | 23.2 | 0.6275 | — | — | — | — | ||||||
(ii) Commodity hedging
As at 31 December 2002, WMC Resources had the following hedge positions against its commodity exposures:
(a) WMC Resources subsidiary entities excluding CNGC
Gold
615,228 ounces of gold (2001: 720,000 ounces) had been hedged at an average gold price of A$621 per ounce (2001: A$586 per ounce) with maturities extending to 2010 as follows:
Maturity | Forward sale of Gold | Rate for determining Profit and Loss | ||||
Amount Ounces | Rate A$/ounce | A$ | ||||
2003 | 85,028 | 547 | 580 | |||
2004 | 80,000 | 559 | 600 | |||
2005 | 80,000 | 579 | 620 | |||
2006 | 78,300 | 618 | 644 | |||
2007 | 80,160 | 641 | 668 | |||
2008-2010 | 211,740 | 684 | 717 | |||
For comparison, the following gold hedge positions were in place at 31 December 2001:
Maturity | Forward sale of Gold | |||
Amount Ounces | Rate A$/ounce | |||
2002 | 83,000 | 500 | ||
2003 | 80,000 | 509 | ||
2004 | 80,000 | 521 | ||
2005 | 80,000 | 497 | ||
2006-2010 | 397,000 | 651 | ||
As these contracts are entered into for the purpose of hedging future production, any unrealized gains and losses on the contracts, together with the cost of the contracts, are deferred until the underlying production occurs.
F-58
Table of Contents
WMC RESOURCES LTD AND CONTROLLED ENTITIES
NOTES TO THE CONSOLIDATED FINANCIAL STATEMENTS—(Continued)
(b) CNGC-Gold
CNGC was sold in January 2002.
The following gold hedge positions relating to CNGC were in at 31 December 2001:
Maturity | Forward sale of Gold | Bought Put Options | Written Call Options | |||||||||
Amount Ounces | Rate US$/ | Amount ounces | Strike rate US$/ ounce | Amount ounces | Strike US$/ | |||||||
2002 | 36,000 | 307 | 22,500 | 310 | 22,500 | 347 | ||||||
2003 | 31,800 | 307 | 22,500 | 310 | 22,500 | 347 | ||||||
Maturity | Forward sale of Gold | |||
Amount ounces | Rate A$/ounce | |||
2002 | 22,500 | 440 | ||
2003 | 22,500 | 440 | ||
As these contracts are entered into for the purpose of hedging future production, any unrealized gains and losses on the contracts, together with the cost of the contracts, are deferred until the underlying production occurs.
B. Interest rate risk
WMC Resources is exposed to interest rate risk on its outstanding interest bearing liabilities and investments. Interest rate swaps and cross currency swaps allow the economic entity to manage its interest rate risk.
(a) Interest rate and cross currency swaps
As at 31 December 2002, WMC Resources had entered into a forward interest rate agreement against the 10 year US Treasury rate. US$500 million of cover was obtained, at an interest rate of 4.4225%, expiring in 2003.
For comparison, WMC Resources had entered into the following interest rate swaps at 31 December 2001:
Notional A$ principal | Interest swapped | Interest rate | ||||||
$m | Fixed | Float | Maturity | |||||
100.0 | Fixed for floating | 6.00 | 4.90 | 27/5/2002 | ||||
100.0 | Fixed for floating | 6.00 | 4.90 | 27/5/2002 | ||||
200.0 | ||||||||
F-59
Table of Contents
WMC RESOURCES LTD AND CONTROLLED ENTITIES
NOTES TO THE CONSOLIDATED FINANCIAL STATEMENTS—(Continued)
Notional US$ principal | Interest swapped | Interest rate | Maturity | |||||
$m | Fixed | Float | ||||||
25.0 | Floating for fixed | 7.02 | 2.01 | 15/11/2003 | ||||
25.0 | Floating for fixed | 7.10 | 2.01 | 15/11/2013 | ||||
50.0 | ||||||||
25.0 | Fixed for floating | 6.50 | 1.36 | 15/11/2003 | ||||
50.0 | Fixed for floating | 6.50 | 0.93 | 15/11/2003 | ||||
25.0 | Fixed for floating | 6.75 | 1.93 | 1/12/2006 | ||||
25.0 | Fixed for floating | 6.75 | 1.91 | 1/12/2006 | ||||
25.0 | Fixed for floating | 6.75 | 1.84 | 1/12/2006 | ||||
25.0 | Fixed for floating | 6.75 | 1.83 | 1/12/2006 | ||||
25.0 | Fixed for floating | 7.55 | 1.97 | 15/11/2013 | ||||
50.0 | Fixed for floating | 7.25 | 1.94 | 15/11/2013 | ||||
40.0 | Fixed for floating | 7.25 | 1.80 | 15/11/2013 | ||||
50.0 | Fixed for floating | 7.35 | 2.77 | 1/12/2026 | ||||
25.0 | Fixed for floating | 7.35 | 2.76 | 1/12/2026 | ||||
25.0 | Fixed for floating | 7.35 | 2.80 | 1/12/2026 | ||||
50.0 | Fixed for floating | 7.35 | 3.15 | 2/12/2026 | ||||
440.0 | ||||||||
As at 31 December 2002, WMC Resources had entered into a cross currency swap, swapping A$855 million into US$ denominated debt of US$480 million as follows:
A$m | US$m | Interest Rate | Maturity | |||||
Debt | Equivalent | 2002 | 2002 | |||||
A$ Debt | US$ Debt | |||||||
427.5 | 240.0 | 5.56% | 2.1463% | 10/01/03 | ||||
427.5 | 240.0 | 5.56% | 2.1513% | 10/01/03 | ||||
855.0 | 480.0 | |||||||
For comparison, WMC Resources had entered into the following cross currency swaps at 31 December 2001:
A$m | US$m | Interest Rate | Maturity | |||||
Debt | Equivalent | 2001 | 2001 | |||||
A$ Debt | US$ Debt | |||||||
50.0 | 30.0 | 5.30 | 4.10 | 2/4/2002 | ||||
20.0 | 12.6 | 4.81 | 2.92 | 7/4/2002 | ||||
50.0 | 31.4 | 4.81 | 2.91 | 7/4/2002 | ||||
10.0 | 6.3 | 4.81 | 5.12 | 8/4/2002 | ||||
200.0 | 131.7 | 4.85 | 2.62 | 8/5/2002 | ||||
50.0 | 33.5 | 5.35 | 3.06 | 8/5/2009 | ||||
380.0 | 245.5 | |||||||
(b) Interest rate caps
As at 31 December 2002, WMC Resources had entered into A$100 million of interest caps at 6% (2001: A$430 million at 7.14%).
F-60
Table of Contents
WMC RESOURCES LTD AND CONTROLLED ENTITIES
NOTES TO THE CONSOLIDATED FINANCIAL STATEMENTS—(Continued)
(c) Interest rate risk exposure
WMC Resources’ exposure to interest rate risk and the effective weighted interest rate for classes of financial assets and liabilities is set out below:
As at 31 December 2002
| Fixed interest maturing in: | ||||||||||||||||||
A$ million | Floating interest | 1 year or less | Over 1 to 5 years | More than 5 years | Non-interest bearing | Total | ||||||||||||
Financial Assets | ||||||||||||||||||
Cash assets | 90.5 | — | — | — | — | 90.5 | ||||||||||||
Receivables | — | — | — | — | 776.5 | 776.5 | ||||||||||||
Other financial assets | — | — | — | — | 25.0 | 25.0 | ||||||||||||
Cross currency swaps* | 855.0 | — | — | — | — | 855.0 | ||||||||||||
| 945.5 | — | — | — | 801.5 | 1,747.0 | |||||||||||||
Weighted average interest rate | 5.2 | % | — | — | — | |||||||||||||
Financial Liabilities | ||||||||||||||||||
Payables | — | — | — | — | 1,507.6 | 1,507.6 | ||||||||||||
Bank loans | 1,621.4 | — | — | — | — | 1,621.4 | ||||||||||||
Yankee Bond issues—$US | — | 35.2 | 1.4 | 7.4 | — | 44.0 | ||||||||||||
Cross currency swaps* | 847.1 | — | — | — | — | 847.1 | ||||||||||||
| 2,468.5 | 35.2 | 1.4 | 7.4 | 1,507.6 | 4,020.1 | |||||||||||||
Weighted average interest rate | 3.8 | % | 6.6 | % | 6.6 | % | 6.6 | % | ||||||||||
Net financial (liabilities) | (1,523.0 | ) | (35.2 | ) | (1.4 | ) | (7.4 | ) | (706.1 | ) | (2,273.1 | ) | ||||||
As at 31 December 2001
| Fixed interest maturing in: | ||||||||||||||||||
A$ million | Floating interest | 1 year or less | Over 1 to 5 years | More than 5 years | Non-interest bearing | Total | ||||||||||||
Financial Assets | ||||||||||||||||||
Cash assets | 106.2 | 17.9 | — | — | — | 124.1 | ||||||||||||
Receivables | — | — | — | — | 977.4 | 977.4 | ||||||||||||
Other financial assets | — | — | — | — | 38.3 | 38.3 | ||||||||||||
Interest rate swaps* | 97.8 | 200.0 | 342.2 | 518.2 | — | 1,158.2 | ||||||||||||
Cross currency swaps* | 380.0 | — | — | — | — | 380.0 | ||||||||||||
| 584.0 | 217.9 | 342.2 | 518.2 | 1,015.7 | 2,678.0 | |||||||||||||
Weighted average interest rate | 4.8 | % | 6.1 | % | 6.5 | % | 6.5 | % | ||||||||||
Financial Liabilities | ||||||||||||||||||
Payables | — | — | — | — | 2,052.9 | 2,052.9 | ||||||||||||
Bank overdrafts | 0.2 | — | — | — | — | 0.2 | ||||||||||||
Bank loans | 167.3 | — | — | — | — | 167.3 | ||||||||||||
Yankee Bond issues—$US | — | — | 880.0 | 684.4 | — | 1,564.4 | ||||||||||||
Australian Promissory Notes | — | 240.0 | — | — | — | 240.0 | ||||||||||||
Medium Term Bank Bilaterals | — | 200.0 | — | 50.0 | — | 250.0 | ||||||||||||
Interest rate swaps* | 1,060.4 | — | 48.9 | 48.9 | — | 1,158.2 | ||||||||||||
Cross currency swaps* | 480.1 | — | — | — | — | 480.1 | ||||||||||||
| 1,708.0 | 440.0 | 928.9 | 783.3 | 2,052.9 | 5,913.1 | |||||||||||||
Weighted average interest rate | 3.2 | % | 5.1 | % | 6.7 | % | 6.6 | % | ||||||||||
Net financial assets/(liabilities) | (1,124.0 | ) | (222.1 | ) | (586.7 | ) | (265.1 | ) | (1,037.2 | ) | (3,235.1 | ) | ||||||
| * | Notional principal amounts |
F-61
Table of Contents
WMC RESOURCES LTD AND CONTROLLED ENTITIES
NOTES TO THE CONSOLIDATED FINANCIAL STATEMENTS—(Continued)
C. Carrying amounts and estimated fair values of financial instruments
The carrying amounts and estimated fair values of the company’s financial instruments, referred to in Note 36A and 36B above were as follows:
| Group consolidation | ||||||||||||||
| Notes | Carrying amount | Fair value 2002 | Carrying 2001 | Fair value 2001 | ||||||||||
Recognized in the statement of financial position | A$m | A$m | A$m | A$m | ||||||||||
Financial Assets | ||||||||||||||
Cash assets | 8 | 90.5 | 90.5 | 124.1 | 124.1 | |||||||||
Current other financial assets | 10 | 12.7 | 12.7 | 20.1 | 20.1 | |||||||||
Current receivables | 9 | 557.7 | 554.9 | 496.0 | 582.3 | |||||||||
Non-current receivables | 13 | 218.8 | 211.6 | 481.4 | 398.4 | |||||||||
Non-current other financial assets | 15 | 12.3 | 12.3 | 18.2 | 19.2 | |||||||||
Financial Liabilities | ||||||||||||||
Current payables | 22 | 657.9 | 666.3 | 855.2 | 855.6 | |||||||||
Bank overdrafts | 23 | — | — | 0.2 | 0.2 | |||||||||
Short term interest bearing liabilities | 23 | 1,287.6 | 1,287.6 | 584.1 | 584.1 | |||||||||
Other current liabilities | 26 | 17.0 | 17.0 | 15.1 | 15.1 | |||||||||
Non-current payables | 27 | 849.7 | 822.9 | 1,197.7 | 1,109.1 | |||||||||
Long term interest bearing liabilities | 28 | 369.9 | 370.1 | 1,737.7 | 1,755.8 | |||||||||
Other non-current liabilities | 31 | 2.8 | 2.8 | 9.3 | 9.3 | |||||||||
Financial Instruments | ||||||||||||||
Hedging contracts: | ||||||||||||||
—forwards/swaps | (567.9 | ) | (559.4 | ) | (816.5 | ) | (729.2 | ) | ||||||
—options | (157.4 | ) | (157.4 | ) | (234.7 | ) | (221.0 | ) | ||||||
| (725.3 | ) | (716.8 | ) | (1,051.2 | ) | (950.2 | ) | |||||||
The following methods and assumptions were used to estimate the fair value of each class of financial instruments for which it is practicable to estimate a value:
Cash assets and current other financial assets
The carrying amount approximates fair value because of the short maturity of these instruments.
Non current other financial assets
The investments are carried at cost.
Debtors and creditors
The fair value of debtors and creditors relating to hedging contracts has been calculated on a mark-to-market basis using forward prices. Other current debtors and creditors mainly represent financial obligations incurred in exchange for goods and services provided and received by the economic entity in the normal course of its operations, net of provisions for doubtful debts. Due to the short-term nature of these financial obligations, their carrying values are estimated to equal their fair values.
F-62
Table of Contents
WMC RESOURCES LTD AND CONTROLLED ENTITIES
NOTES TO THE CONSOLIDATED FINANCIAL STATEMENTS—(Continued)
Short and long term debt
The fair values of short-term debt and bank overdrafts is considered to approximate the carrying value due to the short maturity of the debt. The carrying value of long-term debt is considered to approximate the fair value, with the exception of the non-current portion of the Yankee Bond issue, the fair value of which was determined on a mark-to-market basis.
Foreign currency and commodity hedging contracts
Carrying amounts for commodity and foreign currency hedging contracts are based on the revaluation of open contracts at 31 December 2002 against spot rates at that date. The fair value disclosed represents the same contracts on a mark-to-market basis using forward rates and prices.
D. Deferred hedging gains and losses
As described in Note 1(w), Summary of Accounting Policies, gains and losses, premiums and discounts on hedging contracts and gains and losses associated with the revaluation of foreign denominated debt are deferred in the balance sheet until the underlying transaction takes place. Whether these deferred gains and losses will be realized and at what amount depends on commodity and currency price movements until the underlying date of the hedge contracts concerned. Upon demerger, all of the derivatives were recorded at fair value. No pre-acquisition deferred losses/gains were carried forward. The expected recognition of the deferred gains and losses based on current valuations are shown below:
Millions of dollars—31 December 2002
Years | <1 Year | 1 - 2 Years | 2 - 3 Years | 3 - 4 Years | 4 - 5 Years | More Than 5 Years | Totals | ||||||||||||||
Gains | 15.8 | 4.7 | 5.7 | 8.7 | 10.8 | 17.0 | 62.7 | ||||||||||||||
Losses | (8.6 | ) | (4.5 | ) | (8.8 | ) | (13.5 | ) | (15.0 | ) | (31.0 | ) | (81.4 | ) | |||||||
Total | 7.2 | 0.2 | (3.1 | ) | (4.8 | ) | (4.2 | ) | (14.0 | ) | (18.7 | ) | |||||||||
Total deferred on balance sheet (refer Note 12(a)) | (18.7 | ) | |||||||||||||||||||
For comparison, the following expected recognition of the deferred gains and losses based on valuations at 31 December 2001 are shown below:
Millions of dollars—31 December 2001
Years | <1 Year | 1 - 2 Years | 2 - 3 Years | 3 - 4 Years | 4 - 5 Years | More Than 5 Years | Totals | ||||||||||||||
Gains | 164.1 | 185.7 | 7.0 | 11.0 | 3.1 | 250.8 | 621.7 | ||||||||||||||
Losses | (321.8 | ) | (341.9 | ) | (170.5 | ) | (179.4 | ) | (46.3 | ) | (907.7 | ) | (1,967.6 | ) | |||||||
Total | (157.7 | ) | (156.2 | ) | (163.5 | ) | (168.4 | ) | (43.2 | ) | (656.9 | ) | (1,345.9 | ) | |||||||
Total deferred on balance sheet (refer Note 12(a)) | (1,345.9 | ) | |||||||||||||||||||
F-63
Table of Contents
WMC RESOURCES LTD AND CONTROLLED ENTITIES
NOTES TO THE CONSOLIDATED FINANCIAL STATEMENTS—(Continued)
E. Concentration of credit risk for derivative financial instruments
In the event of any counter parties failing to comply with the terms of derivative instrument contracts, the potential impact on the group would be determined by the market revaluation of any open contracts held with that counter party, except on the day of delivery in which case the potential loss for forward contracts would be the full principal amount. The group calculates credit exposures as the market revaluation plus a potential exposure amount. The potential exposure amount allows for the fact that the market revaluation of the contract may increase in the future. Exposures to any one counter party are strictly controlled by WMC Resources risk management policies relating to counter party limits. A geographical breakdown of the group’s credit risk for the derivative financial instruments is set out below.
| US$m | ||||
Location | 2002 | 2001 | ||
Australia | 88.7 | 190 | ||
United States of America | 23.5 | 138 | ||
| 112.2 | 328 | |||
When computing the concentration of credit risk it is assumed that Australian companies, which WMC Resources deals with on the basis of an overseas parent company guarantee, are classified as Australian credit risk.
F. Infrastructure Bonds
WMC Resources Ltd has off-setting liabilities and assets relating to a Direct Infrastructure Bond issued by a WMC Resources subsidiary and the right to acquire an Indirect Infrastructure Bond. There is a right of simultaneous set-off between these two bonds on maturity or termination. The transaction on which interest is accruing, effective from 22 September 1997 will, unless previously terminated, result in income statement recognition as interest for a period of ten years and a corresponding reduction in the net liability of the bond. As part of the infrastructure bond transaction agreements, funds have been placed on deposit by another WMC Resources subsidiary with one of the other parties to the agreement and are being repaid, with interest, over the period of the transaction. In the event of changes to applicable laws the parties may cancel the transaction. If this happens, the liabilities and assets will be mutually settled and interest receivable will cease to accrue.
At balance date the balances of the components were:
| A$m | ||||||
| 2002 | 2001 | |||||
Liability for Infrastructure Bond | (398.5 | ) | (370.4 | ) | ||
Right to acquire Indirect Infrastructure Bond | 331.7 | 296.5 | ||||
Funds on deposit | 63.9 | 71.2 | ||||
Net deferred revenue | (2.9 | ) | (2.7 | ) | ||
F-64
Table of Contents
WMC RESOURCES LTD AND CONTROLLED ENTITIES
NOTES TO THE CONSOLIDATED FINANCIAL STATEMENTS—(Continued)
37. PARTICULARS RELATING TO ENTITIES CONSOLIDATED IN THE ECONOMIC ENTITY
Entities Consolidated | Notes | Place of Incorporation | ||
NAME | ||||
WMC Resources Ltd | VIC, Australia | |||
All controlled entities are wholly owned, unless otherwise indicated | ||||
Controlled Entities | ||||
141 Union Company | B,a | Delaware, USA | ||
Adwest Limited Partnership | c,j | |||
Agnew Mining Company Pty. Ltd. | C | WA, Australia | ||
Carson Hill Gold Mining Corporation | B,a | Nevada USA | ||
Great Boulder Mines Pty Ltd | C | VIC, Australia | ||
Hi-Fert Distributors Pty. Ltd. | C | SA, Australia | ||
Hi-Fert Pty. Ltd. | D | SA, Australia | ||
Minera WMC Chile Exploration Ltda | Chile | |||
Mineracao Alfenus Limitada (owned ~ 100%) | B | Brazil | ||
Mineracao Ituverava Limitada (owned ~ 100%) | B | Brazil | ||
Mineracao Jenipapo S.A. (owned ~ 100%) | Brazil | |||
Mineracao Wesminas Limitada (owned ~ 100%) | B | Brazil | ||
Olympic Dam Marketing Pty. Ltd. | C | SA, Australia | ||
PT WMC Services | f | Indonesia | ||
Q.S. Mineracoa Ltda (owned ~ 100%) | Brazil | |||
Three Springs Talc Pty. Limited | VIC, Australia | |||
Wesminco Oil Pty. Ltd. | VIC, Australia | |||
Western Exploration Pty. Ltd. | C | VIC, Australia | ||
Western Hog Ranch Company | B,a | Nevada USA | ||
Western Mining Corporation Pty Ltd | C | VIC, Australia | ||
Western Mining Mongolia XXK | b | Mongolia | ||
Western Venture Inc. | B,a | Delaware, USA | ||
Westmin Talc (U.K.) Limited | a | UK | ||
Westmin Talc Pty Ltd | VIC, Australia | |||
Westminer Insurance Pte. Ltd. | A | Singapore | ||
WMC (Argentina) Inc. | B | Delaware, USA | ||
WMC (China) Pty Limited | C | VIC, Australia | ||
WMC (Kunming) Pty Limited | C | VIC, Australia | ||
WMC (Liberia) Limited | Hong Kong | |||
WMC (Mineral Sands) Limited | Jersey | |||
WMC (Olympic Dam Corporation) Pty. Ltd. | D | SA, Australia | ||
WMC (Olympic Dam Operations) Pty. Ltd. | D | VIC, Australia | ||
WMC (Overseas) Pty. Limited | C | VIC, Australia | ||
WMC (Peru) Inc. | B,d | Delaware, USA | ||
WMC (Uzbekistan) Ltd. | Jersey | |||
WMC (Yunnan) Pty Limited | C | VIC, Australia | ||
WMC (Zarmitan) Ltd. | Jersey | |||
WMC Automation Pty Ltd | C | WA, Australia | ||
F-65
Table of Contents
WMC RESOURCES LTD AND CONTROLLED ENTITIES
NOTES TO THE CONSOLIDATED FINANCIAL STATEMENTS—(Continued)
Entities Consolidated | Notes | Place of | ||
WMC Chile S.A. | d | Chile | ||
WMC Corporate Services Inc. | B,d | Delaware, USA | ||
WMC Exploration Corporation | f | Philippines | ||
WMC Exploration Inc. | B | Delaware, USA | ||
WMC Fertilizers Pty Ltd | D | VIC, Australia | ||
WMC Finance (USA) Limited | VIC, Australia | |||
WMC Finance Limited | ACT, Australia | |||
WMC Holdings Pty.Ltd. | C | VIC, Australia | ||
WMC Innovation Pty. Ltd. | C | VIC, Australia | ||
WMC International Holdings Ltd. | B,d | Canada | ||
WMC International Limited | B,a | Canada | ||
WMC Kazakstan Ltd. | Jersey | |||
WMC Mineracao Limitada (owned ~ 100%) | d | Brazil | ||
WMC N.C. SAS | g | New Caledonia | ||
WMC Nickel Sales Corporation Limited | B | UK | ||
WMC Petroleum (Malaysia) Snd. Bhd. (in liquidation) | A | Malaysia | ||
WMC Resources Exploration Pty. Ltd. | h | VIC, Australia | ||
WMC Resources International Pty. Ltd. | D | VIC, Australia | ||
WMC Securities Pty Ltd | WA, Australia | |||
WMC Services Pty. Limited | C | ACT, Australia | ||
WMC Superannuation Fund Pty Ltd (owned 50%) | VIC, Australia | |||
WMC Xinjiang Mineral Industry Services Company | i | China | ||
Yakabindie Nickel Pty. Limited | D,e | NSW, Australia | ||
Yeelirrie Development Company Pty. Ltd. | C | WA, Australia | ||
Yeelirrie Management Services Pty. Ltd. | C | WA, Australia | ||
Yeelirrie Pastoral Station Partnership |
These consolidated entities:
| A) | have not been required to prepare audited accounts as they are in voluntary liquidation; |
| B) | have not prepared audited accounts either as they are non-operating or audited accounts are not required in their country of incorporation; |
| C) | as small proprietary corporations, are not required to prepare financial reports. All information contained in the consolidated financial statements with respect to the entities noted as A, B or C was audited; |
| D) | have been granted relief from the necessity to prepare accounts pursuant to Australian Securities and Investment Commission (‘ASIC’) Class Order 98/1418. These companies with WMC Resources Ltd are all members of a “Closed Group” as defined in the Class Order and are parties to a deed of cross guarantee that has been lodged with and approved by ASIC. Under the deed of cross guarantee, each of these companies guarantees the debts of the other companies party to the deed of cross guarantee. |
| (a) | have been translated as a self-sustaining entity. |
| (b) | this company was incorporated in Mongolia on 2 July 2002. |
| (c) | although not a company, it is included as a controlled entity in compliance with AASB 1024 “Consolidated Accounts”. |
| (d) | this company has been translated as an integrated entity. |
| (e) | Yakabindie Nickel Pty Limited, a company incorporating a lease and exploration work on the Yakabindie nickel project near Mount Keith, was acquired by the purchase method on January 25, 2001. Its purchase consideration was A$40 million, A$25 million of which was paid at the time of the acquisition with the remaining A$15 million due upon gaining approval to mine the property. The results of its operations since |
F-66
Table of Contents
WMC RESOURCES LTD AND CONTROLLED ENTITIES
NOTES TO THE CONSOLIDATED FINANCIAL STATEMENTS—(Continued)
| 25 January, 2001 have been incorporated into WMC Resources. There is no goodwill arising on acquisition. No pro forma revenue has been disclosed as it is immaterial. It was converted from a public company to a proprietary company on 8 February 2002. |
| (f) | this company is in the process of being liquidated. |
| (g) | this company was incorporated in New Caledonia on 3 January 2001. |
| (h) | this company was incorporated in Victoria on 31 October 2002. |
| (i) | this company was incorporated in China on 30 August 2001. |
| (j) | WMC Resources Ltd’s interest in this partnership is currently held via Western Venture Inc. |
| (k) | WMC Resources has a 40% ownership in Agnew Pastoral Company Pty. Ltd. and Weebo Pastoral Company Pty. Ltd. which are accounted for as incorporated partnerships. |
| (l) | WMC Resources has a 80% ownership in Yunnan Hua Ao Nickel Exploration and Mining Co. Ltd and Yunnan Xin Ao Nickel Exploration and Mining Co. Ltd which are equity accounted. |
F-67
Table of Contents
WMC RESOURCES LTD AND CONTROLLED ENTITIES
NOTES TO THE CONSOLIDATED FINANCIAL STATEMENTS—(Continued)
Deed of cross guarantee
Entities that are party to a deed of cross guarantee, entered into in accordance with ASIC Class Order 98/1418, are indicated above in this note. A consolidated statement of financial position as at 31 December 2002 is set out below:
| Closed group | |||
A$m 2002 | |||
Statement of financial position of closed group | |||
Current assets | |||
Cash assets | — | ||
Receivables | 521.9 | ||
Inventories | 468.6 | ||
Other | 64.8 | ||
Total current assets | 1,055.3 | ||
Non-current assets | |||
Other financial assets | 3.6 | ||
Group investments | 255.8 | ||
Inventories | 74.9 | ||
Exploration and evaluation | 27.4 | ||
Property, plant and equipment | 4,335.0 | ||
Acquired mineral rights | 1,269.3 | ||
Deferred tax assets | 23.1 | ||
Other | 12.2 | ||
Total non-current assets | 6,001.3 | ||
Total assets | 7,056.6 | ||
Current liabilities | |||
Payables | 337.3 | ||
Interest-bearing liabilities | 9.2 | ||
Current tax liabilities | 0.2 | ||
Provisions | 65.0 | ||
Other | 18.8 | ||
Total current liabilities | 430.5 | ||
Non-current liabilities | |||
Payables | 46.4 | ||
Group payables | 2,688.1 | ||
Deferred tax liabilities | 328.3 | ||
Provisions | 109.6 | ||
Total non-current liabilities | 3,172.4 | ||
Total liabilities | 3,602.9 | ||
Net assets | 3,453.7 | ||
Equity | |||
Contributed equity | 3,653.4 | ||
Reserves | 24.5 | ||
Accumulated losses | (347.5 | ) | |
Outside equity interests in controlled entities | 123.3 | ||
Total equity | 3,453.7 | ||
F-68
Table of Contents
WMC RESOURCES LTD AND CONTROLLED ENTITIES
NOTES TO THE CONSOLIDATED FINANCIAL STATEMENTS—(Continued)
Set out below is a consolidated statement of financial performance for the closed group for the period from the date they became a controlled entity of WMC Resources Ltd (accounting effective date of 30 November 2002), until 31 December 2002:
| Closed group | |||
A$m 2002 | |||
Statement of financial performance of closed group | |||
Revenue from ordinary activities | 365.0 | ||
Cost of goods sold | (190.1 | ) | |
Selling and distribution | (7.2 | ) | |
General and administrative | (40.2 | ) | |
Exploration and evaluation | (3.5 | ) | |
Borrowing costs | (96.0 | ) | |
Other expenses from ordinary activities | (19.2 | ) | |
Profit from ordinary activities before income tax | 8.8 | ||
Income tax expense | (5.0 | ) | |
Profit from ordinary activities after income tax | 3.8 | ||
Net loss attributable to outside equity interest | 1.3 | ||
Net profit | 5.1 | ||
Total changes in equity other than those resulting from transactions with owners as owners | 5.1 | ||
Set out below is a summary of movements in consolidated retained profits of the closed group:
Accumulated losses at the beginning of year | (352.6 | ) | |
Net profit | 5.1 | ||
Dividend provided for or paid | — | ||
Accumulated losses at the end of year | (347.5 | ) | |
F-69
Table of Contents
WMC RESOURCES LTD AND CONTROLLED ENTITIES
NOTES TO THE CONSOLIDATED FINANCIAL STATEMENTS—(Continued)
38. CONTINGENT LIABILITIES AND GAINS
As at 31 2002 A$m | As at 31 2001 A$m | |||
(a) Ascertainable, unsecured | ||||
(i) Guarantees, insurance bonds and other liabilities including performance bonds for minimum work commitments in exploration blocks. | 49.3 | 57.6 | ||
(ii) Contract disputes and other legal claims, arising out of WMC Resources ongoing mining and related construction activities. The amount disclosed reflects claims made against the group. Counter claims have been lodged by the group in respect of certain matters. The net effect of these matters is not expected to materially impact the group. | 7.1 | 7.5 | ||
(iii) As disclosed in the accounting policy Note 1(t), an assessment is made at each operation for future rehabilitation work which will be incurred as a result of current existing circumstances. A provision is accumulated for this future expenditure and is charged on a proportionate basis to production over the lesser of the life of operation or twenty years (thirty years for Olympic Dam). At 31 December 2002 WMC Resources had accrued rehabilitation provisions of $101.2 million (Dec 2001: $89.7 million). The company estimates that, as at 31 December 2002, the total rehabilitation costs that would be incurred upon the disposal or abandonment of its mineral properties would be $377.1 million (Dec 2001 : $349.4 million), resulting in a contingent liability of | 275.9 | 259.7 | ||
(b) Unascertainable unsecured contingent liabilities/assets
(i)Under various joint venture production and exploration agreements.
(ii) Native Title
The majority of WMC Resources’ interests fall within one or more Applications for Native Title Determination. The applications are filed for hearing in the Federal Court of Australia. WMC Resources cannot make any assessment whether existing assets or operations will be materially affected until it is determined what rights, if any, the applicants are entitled to. Recent decisions of the High Court of Australia indicate that each claim will be decided on its facts.
Consideration of the implications of Federal Court Determinations makes it evident there are complex legal and factual issues potentially affecting existing and future WMC Resources’ interests. Accordingly, the impact of these developments cannot be determined at this time, although it is indicated that no native title rights reside in minerals where valid state legislation has placed minerals in Crown ownership.
(iii)A final tranche of up to US$25 million will be paid to Southern Mining Corporation Limited in either shares or cash, to complete the acquisition of the Corridor Sands titanium dioxide project. As the quantum of the second tranche payment is subject to, and contingent upon, sell down arrangements (if any entered into by the company) it has not been recognized in the carrying value disclosed in Note 17 nor as a present obligation (liability).
(iv) Yakabindie Nickel Pty Limited, a company incorporating a lease and exploration work on the Yakabindie nickel project near Mount Keith, was acquired by the purchase method on 25 January 2001. Its purchase consideration was $40 million, $25 million of which was paid at the time of the acquisition with
F-70
Table of Contents
WMC RESOURCES LTD AND CONTROLLED ENTITIES
NOTES TO THE CONSOLIDATED FINANCIAL STATEMENTS—(Continued)
the remaining $15 million due upon gaining approval to mine the property. As the $15 million payment is subject to gaining approval to mine the property, it has not been recognized as a present obligation liability.
(v) WMC Resources Ltd is currently the subject of a taxation audit by the Australian Taxation Office. The company does not expect any material liabilities to arise as a result of this audit.
(a) Capital expenditure contracted for:
Contracts for purchase of assets comprising mine properties and mine development, and property, plant and equipment. Payments:
As at 31 2002 A$m | As at 31 2001 A$m | |||
Within one year | 77.7 | 35.4 | ||
| 77.7 | 35.4 | |||
(b) Potential expenditure on exploration and mining titles and attached business commitments
These tables set out estimates of expenditures which may be incurred for exploration, evaluation and mining activities during the life of current WMC Resources exploration and mining tenements and earning rights under farm-in and option entitlements. These sums are commitments for work expected to be beneficial to WMC Resources and include payments to vendors in which WMC Resources has earning rights. Australian mining laws generally require that certain levels of expenditure be incurred, rather than any payment made to government, to maintain tenements in good standing. Mining laws in other jurisdictions may vary. This disclosure represents maximum potential expenditure that may be reduced by seeking exemption from individual commitments or by relinquishment of tenure.
As at 31 2002 A$m | As at 31 2001 A$m | |||
| (i) Exploration and mining titles | ||||
| Within one year | 14.7 | 19.2 | ||
| Later than one year but not later than 5 years | 54.7 | 95.4 | ||
| Later than 5 years | 89.0 | 260.5 | ||
| 158.4 | 375.1 | |||
| (ii) Business undertaking commitments | ||||
| Within one year | 5.8 | 2.9 | ||
| Later than one year but not later than 5 years | 22.9 | 12.7 | ||
| Later than 5 years | 41.5 | 15.9 | ||
| 70.2 | 31.5 | |||
F-71
Table of Contents
WMC RESOURCES LTD AND CONTROLLED ENTITIES
NOTES TO THE CONSOLIDATED FINANCIAL STATEMENTS—(Continued)
(c) Lease commitments contracted for operating leases (other than mineral and exploration leases)
The company and certain of its subsidiaries lease plant, warehouse and office facilities and motor vehicles for varying periods. Operating leases that expire generally are expected to be renewed or replaced by other leases. The following is the future minimum rental commitments.
As at 31 2002 A$m | As at 31 2001 A$m | |||
| (i) Lease commitments payable at balance date | ||||
| Within one year | 18.6 | 21.8 | ||
| Later than one year but not later than 5 years | 67.0 | 76.4 | ||
| Later than 5 years | 62.6 | 76.8 | ||
| 148.2 | 175.0 | |||
As at 31 2002 A$m | As at 31 2001 A$m | |||
| (d) Sub Leases | ||||
(i) Rental income included in profit and loss | — | 1.2 | ||
(ii) Lease commitments receivable at balance date | ||||
Within one year | 0.1 | 1.6 | ||
Later than one year but not later than 5 years | 0.2 | 4.9 | ||
| 0.3 | 6.5 | |||
| (e) Other commitments(1) | ||||
Commitments for payments to suppliers under long-term contracts existing at reporting date but not recognized as payable | ||||
Within one year | 372.1 | 59.4 | ||
Later than one year but not later than 5 years | 1,165.5 | 235.6 | ||
Later than 5 years | 528.2 | 586.4 | ||
| 2,065.8 | 881.4 | |||
| (1) | WMC Resources is party to a number of gas supply, gas conversion, shiploading, rail transport and sulphuric acid supply agreements. Under these take or pay contracts, WMC Resources is obligated to pay a minimum amount for the above commodities and services even if those commodities or services are not required for operations. Commitments related to these contracts total A$198.3 million in 2003, A$213.3 million in 2004, A$222.7 million in 2005, A$226.5 million in 2006, A$218.1 million in 2007. Expenditures under these contracts totaled A$203.5 million in 2002, $168.3 million in 2001 and A$130.0 million in 2000. |
(f) Sales contracts and commitments
WMC Resources sells nickel metal, nickel matte, nickel concentrate and various intermediate products. Approximately 75% of nickel metal sales for the year ended 31 December 2002 were made under short to medium term contractual arrangements, to a large number of customers in Europe, North America and Asia. These contracts extend through varying periods expiring between 2003 and 2004. Approximately 95% of nickel-in-matte and nickel-in-concentrate sales for the year ended 31 December 2002 were made under long term contracts expiring between 2003 and 2008. Prices in these contracts are generally not fixed, and provide for sales at prevailing market prices at the contractual settlement dates.
F-72
Table of Contents
WMC RESOURCES LTD AND CONTROLLED ENTITIES
NOTES TO THE CONSOLIDATED FINANCIAL STATEMENTS—(Continued)
Approximately 90% of Olympic Dam’s copper production for the year ended 31 December 2002 was sold to customers in Europe, Australia and Asia under contracts which are negotiated. Prices in these contracts are generally not fixed, and provide for sales at prevailing market prices at the contractual settlement dates.
More than 90% of Olympic Dam’s uranium production is committed under long-term sales contracts with well established and reputable electricity generating utilities. Sales of uranium oxide in 2002 were made to the United Kingdom, Finland, Sweden, Belgium, France, Japan, Canada and the United States. Contract prices are fixed.
In relation to the fertilizer operations, supply contracts are in place with major Australian fertilizer distributors for the delivery of between 440,000 and 590,000 tonnes of DAP per year, depending on customer requirements. These contracts expire in 2004. Contracts covering domestic MAP sales of between 120,000 and 200,000 tonnes per year will become effective once commercial production volumes are commenced. These contracts extend through varying periods expiring between 2006 and 2009. WMC Resources has also contracted to export 350,000 tonnes per year of high analysis fertilizer into Asia. The arrangement provides for up to 500,000 tonnes per year to be sold if required by WMC Resources. Prices in these contracts are generally not fixed, and provide for sales at prevailing market prices at the contractual settlement dates. These contracts expire in 2005.
All of WMC Resources’ major products are able to be purchased on a spot market in order to fulfill the sales contracts referred to above if required.
From 27 July 2001, all employer contributions and ongoing management of employee’s superannuation entitlements have been managed by the WMC Superannuation Plan (the Plan), an independently managed sub-plan of the Plum Superannuation Fund (the Fund).
Plan membership is compulsory for all Australian resident employees and Australian expatriates, and provides lump sum benefits on retirement, permanent disability, death, resignation and retrenchment. WMC does not sponsor any other defined—benefit post retirement plans. For non-Australian employees WMC Resources contributes to an appropriate accumulation plan as required by agreement or under local legislation.
The Plan has three categories of membership.
The Defined Benefit Category was closed to new members effective 1 July 1994, however, the then members had, and continue to have, the option to remain in the Defined Benefit Category or to transfer to the Accumulation Category. The Defined Benefit Category provides lump sum benefits based on period of service, age and final average salary. Members in this category make a compulsory contribution of 3.4 per cent deducted from after tax salary or 4.0 per cent deducted from before tax salary.
The Accumulation Category, which all new staff members must join, commenced on 1 July 1994. This category of membership offers a minimum company contribution (subject to certain cashing out options and legislation) of 11.5 per cent of basic annual salary to each member’s account in the Plan. Members also have the option to make voluntary contributions to their account.
The Superannuation Guarantee Category is a compulsory accumulation category for all employees under hourly paid awards. Under legislation the Group is required to make minimum contributions. Effective 1 July
F-73
Table of Contents
WMC RESOURCES LTD AND CONTROLLED ENTITIES
NOTES TO THE CONSOLIDATED FINANCIAL STATEMENTS—(Continued)
2002, the contribution rate increased to 9 per cent of ordinary time earnings. Members also have the option to make voluntary contributions to their personal account.
WMC Resources and its controlled entities contribute to the Plan as required by the Plan rules, any relevant employee agreements, or legislation.
Actuarial assessment (where appropriate) of the Plan (and previously the WMC Superannuation Fund) is made at three yearly intervals, and the last such assessment was made as at 1 July 2001, by Mr R R Codron, BSc Hons, FIA, FIAA, ASIA. Based on the calculations made as part of that assessment, the Directors of the company are of the view that as at the date of the assessment, the assets of the Plan were sufficient to satisfy all benefits that would have vested under the Plan in the event of termination of the Plan or voluntary or compulsory termination of employment of each employee.
The principal assets of the Plan are managed by external investment managers appointed by the Trustee of the Plan and are regularly monitored by the Plan’s asset consultants. External managers may use derivatives as part of normal investment and risk management practice within the terms of their appointment and in accordance with the Risk Management Statement required by legislation. Investment managers are not permitted to use derivatives to gear investments.
The following amounts are based on information from the WMC Superannuation Plan which had a financial year ended 30 June. The most recent audited information available is at 30 June 2002.
F-74
Table of Contents
WMC RESOURCES LTD AND CONTROLLED ENTITIES
NOTES TO THE CONSOLIDATED FINANCIAL STATEMENTS—(Continued)
WESTMINER SUPERANNUATION FUND
(WMC Limited’s Superannuation Fund)
Year to 31 Dec 2002 A$m | Year to 31 Dec 2001 | Year to 31 Dec 2000 | |||||||
| (a) Change in benefit obligation | |||||||||
Benefit obligation at end of prior year | 222.4 | 193.9 | 171.1 | ||||||
Service cost | 32.3 | 26.1 | 24.2 | ||||||
Interest cost | 11.8 | 10.2 | 11.0 | ||||||
Actuarial (gains) losses | (37.5 | ) | 12.9 | 5.7 | |||||
Members transferring from other funds | 8.3 | 1.7 | 3.4 | ||||||
Benefits and expenses paid | (57.6 | ) | (23.7 | ) | (23.0 | ) | |||
Plan participants contributions | 4.3 | 1.3 | 1.4 | ||||||
Benefit obligation at end of period | 184.0 | 222.4 | 193.8 | ||||||
| (b) Change in plan assets | |||||||||
Fair value of plan assets at end of prior year | 204.0 | 202.3 | 195.4 | ||||||
Actual return on plan assets | (22.5 | ) | (0.7 | ) | 24.7 | ||||
Transfers in from other funds | 8.3 | 1.7 | 3.4 | ||||||
Employer contributions | 22.4 | 23.1 | 0.3 | ||||||
Plan participants’ contributions | 4.3 | 1.3 | 1.4 | ||||||
Benefits and expenses paid | (57.6 | ) | (23.7 | ) | (22.9 | ) | |||
Fair value of plan assets at end of period | 158.9 | 204.0 | 202.3 | ||||||
| (c) Reconciliation of funded status | |||||||||
Funded status | (25.1 | ) | (18.3 | ) | 8.5 | ||||
Unrecognized net gain | (18.5 | ) | (24.3 | ) | (56.2 | ) | |||
Unamortized prior service cost | — | 0.1 | 0.3 | ||||||
Unrecognized net transition asset | — | (1.6 | ) | (4.9 | ) | ||||
Accrued pension cost | (43.6 | ) | (44.1 | ) | (52.3 | ) | |||
| (d) Components of net periodic benefit costs | |||||||||
Service cost | 32.3 | 26.1 | 24.2 | ||||||
Interest cost | 11.8 | 10.2 | 11.1 | ||||||
Expected return on plan assets | (14.2 | ) | (15.3 | ) | (14.2 | ) | |||
Amortization of prior service cost | 0.1 | 0.1 | 0.1 | ||||||
Amortization of gain | (1.3 | ) | (3.0 | ) | (2.9 | ) | |||
Amortization of unrecognized net transition asset | (1.6 | ) | (3.3 | ) | (3.3 | ) | |||
FAS 88 adjustment | (5.3 | ) | — | — | |||||
Net periodic benefit costs | 21.8 | 14.8 | 15.0 | ||||||
| (e) Weighted average assumptions | |||||||||
Discount rate | 6.0 | 6.0 | 5.5 | ||||||
Expected long-term return on plan assets | 7.0 | 7.5 | 7.5 | ||||||
Rate of compensation increase | 3.5 | 3.5 | 3.5 | ||||||
F-75
Table of Contents
WMC RESOURCES LTD AND CONTROLLED ENTITIES
NOTES TO THE CONSOLIDATED FINANCIAL STATEMENTS—(Continued)
Year to 31 Dec 2002 A$m | Year to 31 Dec 2001 | Year to 31 Dec 2000 | ||||
| (f) WMC Resources is a sponsor of defined contribution pension plans. Expenses relating to those plans were | 0.3 | 23.1 | 0.3 | |||
| (g) At balance date the plan does not hold any ordinary shares directly in WMC Resources Ltd (WMC Limited’s shares held in prior years were: Dec 2001: 81,790; Dec 2000: 237,263). | ||||||
41. RELATED PARTY TRANSACTIONS
Related parties of WMC Resources fall under the following categories:
(a) Controlling, commonly controlled and wholly owned entities
Information relating to the investment in controlled entities is set out in Note 37. Information relating to dividends and interest are set out in Notes 2 and 3 respectively.
(b) Superannuation funds
Information relating to staff superannuation funds is set out in Note 40.
(c) Directors
(i) The names of each person holding the position of director of the parent entity during the financial year are:
I G R Burgess AO (Chairman)
H M Morgan AC (Chief Executive Officer and director until 1 January 2003)
A G Michelmore (appointed a director on 13 August 2002 and Chief Executive Officer from 1 January 2003)
T C-E Bergman
Professor A E Clarke AO
P J Knight
D E Meiklejohn (appointed a director on 19 April 2002)
D M Morley (retired on 4 September 2002)
M J Phillips AM (retired on 18 June 2002)
R A G Vines
I E Webber AO
(ii) Details of directors’ remuneration, superannuation and retirement payments are set out in Note 42.
Apart from the details disclosed in this note, no director has entered into a material contract with the Company or its controlled entities since the end of the previous financial year, and there were no material contracts involving directors’ interests existing at balance date.
2002 A$’000 | 2001 A$’000 | |||
| (d) Loans to directors | ||||
(i) The directors of WMC Resources were also, prior to the demerger, directors of WMC Limited, the parent entity of WMC Resources and the other businesses carved out and transferred to WMC Resources as part of the demerger.
Loans to directors of controlled entities included in receivables comprise secured loans under the Employee Share Purchase Plan. | — | 4.9 |
F-76
Table of Contents
WMC RESOURCES LTD AND CONTROLLED ENTITIES
NOTES TO THE CONSOLIDATED FINANCIAL STATEMENTS—(Continued)
Two share plan loans to directors were repaid during the year. These related to and were secured by shares allocated by WMC Limited under the 1988 allotment of the Employee Share Purchase Plan (ESPP) (loan to R T Bills) and the 1987 and 1988 Partly Paid Share Plan (PPSP)1994 allotment of the Senior Staff Share Issue (loan to J Balkau). Both loans were interest free with repayments due in November 2003. The PPSP loan to J Balkau was repaid in full and the ESPP loan to R T Bills was reduced by a dividend repayment. The remainder of the loan was forgiven.
2002 A$’000 | 2001 A$’000 | |||||
| (ii) Reconciliation of movement in loans to directors | ||||||
Loans to directors at 1 January 2002 | 4.9 | 5.9 | ||||
New loan granted to J Balkau during the financial year (repaid in full during the year) | 93.0 | — | ||||
Loan repayments received | (93.4 | ) | (1.0 | ) | ||
Loans forgiven | (3.6 | ) | — | |||
Other movements(1) | (0.9 | ) | — | |||
Loans to directors at 31 December 2002 | — | 4.9 | ||||
| (1) | Relates to $951 which was owed by a director who retired during the year ended 31 December 2001, and thus ceased to be a related party for the current financial year. |
| (e) | Shareholding transactions of directors |
The directors of WMC Resources Ltd were also, prior to the demerger, directors of WMC Limited, the parent entity of WMC Resources and the other businesses carved out and transferred to WMC Resources as part of the demerger. The following information relates to their transactions as shareholders of WMC Limited up to the date of the demerger and to their transaction as shareholders of WMC Resources from December 2, 2002 (as shares were issued in WMC Resources on a WMC Limited one for one basis).
Where a director of WMC Resources Ltd was a shareholder in WMC Resources Ltd, and prior to the demerger in WMC Limited, their transactions include:
—the purchase and/or sale of shares; and/or
—the receipt of dividends.
All these transactions were conducted on a commercial basis, on conditions no more favourable than those available to other shareholders.
F-77
Table of Contents
WMC RESOURCES LTD AND CONTROLLED ENTITIES
NOTES TO THE CONSOLIDATED FINANCIAL STATEMENTS—(Continued)
Some directors of WMC Resources Ltd, who were also employees of the WMC Resources Ltd group, were eligible to participate in the company’s Employee Option Plan, and were issued with options, priced at market value. These transactions were conducted on a commercial basis on conditions no more beneficial than those available to other eligible employees.
| Number of Shares | ||||
| 2002 | 2001 | |||
The aggregate number of shares acquired by the directors of the parent entity or their director related entities as a result of the WMC Limited demerger was: | 808,407 | — | ||
The aggregate number of share acquired by the directors of the parent entity or their director related entities through purchases was: | 138,640 | 10,000 | ||
The aggregate number of options acquired by directors of the parent entity or their director related entities through participation in the WMC Employee Share Scheme was: | — | — | ||
The aggregate number of options allocated to directors of the parent entity or their director related entities as a result of the WMC Limited demerger was: | 1,725,000 | — | ||
The aggregate number of shares and options disposed of by directors of the parent entity or their director related entities was: —fully paid shares —partly paid shares —options (lapsed) —options (shares exercised and sold) | — — — 300,000 | 11,000 — — 300,000 | ||
| Number of Shares | ||||
| 2002 | 2001 | |||
Details of shares and share options held by directors of the parent entity or their director related entities at 31 December are as follows: | ||||
—fully paid shares | 946,957 | 434,459 | ||
—ordinary shares partly paid to five cents | — | 331,000 | ||
—options for ordinary shares | 1,425,000 | 1,470,000 | ||
—Central Norseman Gold Corporation Limited, fully paid shares | — | 2,000 | ||
All other transactions relating to shares and options of WMC Resources Ltd, including the payment and receipt of dividends, were on the same basis as similar transactions with other shareholders.
(f) Other transactions of directors and director related entities
The directors of WMC Resources were also, prior to the demerger, directors of WMC Limited, the parent entity of WMC Resources and the other businesses carved out and transferred to WMC Resources as part of the demerger. The following information relates to their transactions as shareholders of WMC Limited.
A number of the directors of WMC Resources Ltd are also directors of other public companies that may have transactions with the WMC Resources group. The relevant directors do not believe that they have the capacity to control or significantly influence the financial or operating policies of either those companies or the WMC Resources group in their dealings with one another. Those companies are therefore not considered to be director-related entities for the disclosure requirements of Accounting Standard AASB 1017: Related Party Disclosures.
F-78
Table of Contents
WMC RESOURCES LTD AND CONTROLLED ENTITIES
NOTES TO THE CONSOLIDATED FINANCIAL STATEMENTS—(Continued)
(i) Legal/financial service fees
A number of directors of WMC Resources Ltd controlled entities are associated with legal and financial service firms which have provided services to WMC Resources Ltd group companies during the financial year, on normal commercial terms and conditions. The total of those services amounts to $1,511,590 (2001: $916,259).
(ii) Other transactions
Entities associated with directors of WMC Resources Ltd controlled entities have purchased fertilizer totaling $14,199 (2001: $14,325) on normal commercial terms and conditions from a WMC Resources Ltd controlled entity.
Mr H. M. Morgan received a deferred directors fee payment of A$890,906 under the Alcoa Inc Directors Deferred Fee Plan.
The directors of WMC Resources were also, prior to the demerger, directors of WMC Limited, the parent entity of WMC Resources and the other businesses carved out and transferred to WMC Resources as part of the demerger.
The disclosures below relate to their remuneration from WMC Limited.
| Year to 31 Dec 2002 A$’000 | Year to 31 Dec 2001 A$’000 | Year to 31 Dec 2000 A$’000 | ||||
| (a) Total income received, or due and receivable from: | ||||||
Parent entity | ||||||
—Executive directors: | 13,907 | 3,480 | 2,505 | |||
—Non-executive directors: | 1,113 | 884 | 882 | |||
Controlled entities | ||||||
—Executive directors | 8,266 | 10,895 | 12,742 | |||
—Non-executive directors | 66 | 259 | 208 | |||
Consolidated total: | 23,352 | 15,518 | 16,337 | |||
The aggregate amounts listed in the above table include any retirement allowances.
(b) Certain directors may also receive options under the WMC Option Plan, refer to Note 41(e).
F-79
Table of Contents
WMC RESOURCES LTD AND CONTROLLED ENTITIES
NOTES TO THE CONSOLIDATED FINANCIAL STATEMENTS—(Continued)
(c) The number of directors of the parent entity whose income from the parent entity or related bodies corporate falls within the following bands:
| Number of Directors | |||||||
| 2002 | 2001 | 2000 | |||||
$ 60,000—$ 69,999 | 1 | — | — | ||||
$ 70,000—$ 79,999 | — | 2 | 4 | ||||
$ 80,000—$ 89,999 | — | 2 | — | ||||
$ 90,000—$ 99,999 | 4 | — | 1 | ||||
$ 100,000—$ 109,999 | — | 1 | — | ||||
$ 120,000—$ 129,999 | — | — | 1 | ||||
$ 130,000—$ 139,999 | — | 1 | — | ||||
$ 150,000—$ 159,999 | 1 | — | — | ||||
$ 180,000—$ 189,999 | — | — | 1 | ||||
$ 200,000—$ 209,999 | — | 2 | — | ||||
$ 250,000—$ 259,999 | 1 | — | 1 | ||||
$ 270,000—$ 279,999 | 1 | * | — | — | |||
$ 920,000—$ 929,999 | — | — | 1 | ||||
| $1,300,000—$1,309,999 | 1 | — | — | ||||
$1,410,000—$1,419,999 | — | 1 | — | ||||
$1,570,000—$1,579,999 | — | — | 1 | ||||
$2,060,000—$2,069,999 | — | 1 | — | ||||
$3,010,000—$3,019,999 | 1 | * | — | — | |||
$9,590,000—$9,599,999 | 1 | * | — | — | |||
| 11 | 10 | 10 | |||||
| * | Includes retirement allowances |
Executive directors do not receive director’s fees, but are remunerated on the same basis (i.e. salary and benefits) as executive officers, as indicated in Note 43.
43. REMUNERATION OF EXECUTIVES
| Year ended 31 Dec 2002 A$’000 | Year ended 31 Dec 2001 A$’000 | |||
(a) Total income received, or due and receivable, from entities in the group and related bodies corporate by all executive officers (including directors) working within Australia whose income exceeded $100,000 | 38,137 | 28,293 | ||
—ofwhich the total income received, or due and receivable, by 37 (2001:46) currently employed executive officers (including directors) whose income exceeded $100,000 was; | 20,414 | 18,216 | ||
—ofwhich the total income received or due and receivable by 13 (2001:16) former executive officers whose income exceeded $100,000 was | 17,723 | 10,077 | ||
| 38,137 | 28,293 | |||
F-80
Table of Contents
WMC RESOURCES LTD AND CONTROLLED ENTITIES
NOTES TO THE CONSOLIDATED FINANCIAL STATEMENTS—(Continued)
Number of Executive Officers Working within Australia Group | Working outside of Australia Group | |||||||||||||||
| 2002 | 2002 | 2001 | 2001 | 2002 | 2001 | |||||||||||
| Current | Former | Current | Former | |||||||||||||
| (b) The number of executive officers, (including directors based in Australia, and outside of Australia, whose income from the group and related bodies corporate falls within the following bands: | ||||||||||||||||
$140,000 | — | $149,999 | — | — | 1 | — | — | — | ||||||||
$160,000 | — | $169,999 | 1 | — | — | — | — | — | ||||||||
$180,000 | — | $189,999 | — | 1 | — | — | — | — | ||||||||
$190,000 | — | $199,999 | — | 1 | — | — | — | — | ||||||||
$210,000 | — | $219,999 | — | — | 2 | — | — | — | ||||||||
$220,000 | — | $229,999 | — | — | — | 1 | — | — | ||||||||
$240,000 | — | $249,999 | 1 | 1 | 5 | — | — | — | ||||||||
$250,000 | — | $259,999 | 3 | — | 7 | — | — | — | ||||||||
$260,000 | — | $269,999 | 3 | — | 7 | — | — | — | ||||||||
$270,000 | — | $279,999 | 4 | — | 2 | — | — | — | ||||||||
$280,000 | — | $289,999 | — | — | 2 | — | — | — | ||||||||
$290,000 | — | $299,999 | 1 | 1 | 2 | — | — | 1 | ||||||||
$310,000 | — | $319,999 | — | 1 | 2 | 1 | — | — | ||||||||
$320,000 | — | $329,999 | 1 | — | 3 | — | — | — | ||||||||
$330,000 | — | $339,999 | — | 1 | — | 1 | — | — | ||||||||
$340,000 | — | $349,999 | — | — | 1 | — | 1 | — | ||||||||
$350,000 | — | $359,999 | — | — | — | 1 | 1 | — | ||||||||
$360,000 | — | $369,999 | — | — | 1 | — | — | — | ||||||||
$370,000 | — | $379,999 | — | — | 1 | — | — | — | ||||||||
$380,000 | — | $389,999 | — | — | 1 | — | — | 1 | ||||||||
$390,000 | — | $399,999 | — | — | — | — | 1 | 1 | ||||||||
$400,000 | — | $409,999 | 1 | 1 | 2 | — | — | — | ||||||||
$410,000 | — | $419,999 | 1 | — | — | — | — | — | ||||||||
$420,000 | — | $429,999 | — | — | — | 1 | — | — | ||||||||
$430,000 | — | $439,999 | 2 | 2 | — | 1 | — | — | ||||||||
$440,000 | — | $449,999 | — | — | — | 2 | — | — | ||||||||
$450,000 | — | $459,999 | 1 | — | — | — | — | — | ||||||||
$470,000 | — | $479,999 | 4 | — | — | — | — | 1 | ||||||||
$480,000 | — | $489,999 | 1 | 1 | — | 1 | — | — | ||||||||
$500,000 | — | $509,999 | — | — | — | 1 | — | — | ||||||||
$510,000 | — | $519,999 | — | — | 1 | — | — | — | ||||||||
$520,000 | — | $529,999 | 1 | — | — | — | — | — | ||||||||
$530,000 | — | $539,999 | 1 | — | — | — | 1 | — | ||||||||
$550,000 | — | $559,999 | 1 | — | — | — | — | — | ||||||||
$560,000 | — | $569,999 | — | — | 1 | — | — | — | ||||||||
$580,000 | — | $589,999 | 1 | — | — | — | — | — | ||||||||
$630,000 | — | $639,999 | 1 | — | — | 1 | — | — | ||||||||
$650,000 | — | $659,999 | 1 | — | — | — | — | — | ||||||||
$660,000 | — | $669,999 | — | 1 | — | — | — | — | ||||||||
$690,000 | — | $699,999 | — | — | — | — | 1 | — | ||||||||
$700,000 | — | $709,999 | 1 | — | — | — | — | — | ||||||||
$720,000 | — | $729,999 | — | — | — | 1 | — | — | ||||||||
$730,000 | — | $739,999 | 1 | — | — | — | — | — | ||||||||
$750,000 | — | $759,999 | — | — | 1 | — | — | — | ||||||||
$780,000 | — | $789,999 | — | — | — | 1 | — | — | ||||||||
$800,000 | — | $809,999 | — | — | 1 | — | — | — | ||||||||
$830,000 | — | $839,999 | — | — | — | — | 1 | — | ||||||||
$880,000 | — | $889,999 | — | — | — | 1 | — | — | ||||||||
$890,000 | — | $899,999 | 1 | — | — | — | — | — | ||||||||
$1,050,000 | — | $1,059,999 | — | — | 1 | — | — | — | ||||||||
$1,320,000 | — | $1,329,999 | — | — | — | — | — | 1 | ||||||||
$1,380,000 | — | $1,389,999 | 1 | — | — | — | — | |||||||||
$1,410,000 | — | $1,419,999 | — | — | 1 | — | — | 1 | ||||||||
$1,430,000 | — | $1,439,999 | — | — | — | 1 | — | — | ||||||||
$1,440,000 | — | $1,449,999 | — | — | — | — | — | 1 | ||||||||
$1,470,000 | — | $1,479,999 | 1 | — | — | — | — | — | ||||||||
$1,590,000 | — | $1,599,999 | 1 | — | — | — | — | — | ||||||||
$1,640,000 | — | $1,649,999 | — | — | — | 1 | — | — | ||||||||
$1,930,000 | — | $1,939,999 | 1 | — | — | — | — | — | ||||||||
$2,060,000 | — | $2,069,999 | — | — | 1 | — | — | — | ||||||||
$4,140,000 | — | $4,149,999 | — | 1 | — | — | — | — | ||||||||
$9,590,000 | — | $9,599,999 | — | 1 | — | — | — | — | ||||||||
| 37 | 13 | 46 | 16 | 6 | 7 | |||||||||||
F-81
Table of Contents
WMC RESOURCES LTD AND CONTROLLED ENTITIES
NOTES TO THE CONSOLIDATED FINANCIAL STATEMENTS—(Continued)
| Year ended 31 Dec 2002 A$’000 | Year ended 31 Dec 2001 A$’000 | |||
(a) Remuneration for audit or review of the financial reports of the parent entity or any entity in the economic entity: | ||||
Auditors of parent entity:—PricewaterhouseCoopers | ||||
—parent entity | 360 | 360 | ||
—controlled entities | 169 | 524 | ||
Other member firms of PricewaterhouseCoopers International | 127 | 115 | ||
Other auditors of controlled entities | — | — | ||
| 656 | 999 | |||
(b) Remuneration for audit related services | ||||
—US registration of WMC Resources Ltd | 949 | — | ||
—Annual report on US Form 20-F | 148 | 163 | ||
| 1,097 | 163 | |||
(c) Remuneration for tax services | ||||
—Australian tax services | 232 | 239 | ||
—Overseas tax services | 181 | 211 | ||
| 413 | 450 | |||
(d) Remuneration for other services by the parent entity auditors of controlled entities. | ||||
—Independent accountants report and due diligence services in connection with the demerger of WMC Limited | 3,315 | 693 | ||
Risk management services | 684 | 120 | ||
| 3,999 | 813 | |||
TOTAL | 6,165 | 2,425 | ||
The accounting policies and accounting standards under which the consolidated financial statements of WMC Resources are prepared are in accordance with Australian GAAP. The major differences between Australian GAAP and US GAAP are summarized and reconciled below.
(a) Research and development
Expenditure incurred on research and development may be capitalized and deferred in Australia to the extent that such expenditure is expected to be recoverable. Under US GAAP, all such expenditure is expensed as incurred.
(b) Pension funds
The applicable Australian accounting standard relates only to disclosure. The accepted practice is to account for Company contributions on a cash rather than an accruals basis. WMC Resources does not account for
F-82
Table of Contents
WMC RESOURCES LTD AND CONTROLLED ENTITIES
NOTES TO THE CONSOLIDATED FINANCIAL STATEMENTS—(Continued)
excesses or shortfalls of the Superannuation Fund assets over accrued membership benefits. As this is contrary to US GAAP, WMC Resources has adopted the recognition provisions of FAS 87 “Employers Accounting for Pensions” for US GAAP reconciliation purposes. WMC Resources does not sponsor post retirement defined-benefits other than pensions.
(c) Exploration and evaluation expenditure
| • | Expenditure incurred on the exploration and evaluation of minerals properties may be capitalized and deferred in Australia to the extent that such expenditure is expected to be recoverable. Under US GAAP geological and geophysical costs and costs of carrying and retaining undeveloped properties are charged to expense as incurred. Under both Australian GAAP and US GAAP, the cost of purchasing unproven property is capitalized when incurred and either transferred to proven properties when proven or written off as impaired. |
(d) Income tax
Under Australian GAAP, deferred taxes are provided for using the liability method on a similar basis to FAS 109, therefore there has been no adjustment to the method by which income taxes have been calculated. Under US GAAP, the recognition and carry forward of future income tax benefits differs from Australian GAAP in the following areas:
| • | Tax assets and liabilities relating to temporary timing differences are all classed as non-current under Australian GAAP. Under US GAAP the future income tax benefits and liabilities would be required to be allocated in the balance sheet between current and non-current items. This allocation would not have a significant effect. |
| • | Tax assets relating to tax losses are not brought to account under Australian GAAP unless their ultimate realization is virtually certain. Under US GAAP, tax assets relating to tax losses are all brought to account and a valuation allowance raised against the asset if it is more likely than not that some portion or all of the deferred tax asset will not be realized. |
| (e) Start | up costs |
Under Statement of Position 98-5, “Reporting on the Costs of start-up activities”, the costs of start-up activities including organizational costs, are required to be expensed as incurred. Under Australian GAAP start up costs are capitalized and deferred as part of the mineral extraction or processing facilities being developed or constructed. These deferred costs are then amortized from the start of production over the life of the facilities concerned.
(f) Real estate profit recognition
Under US GAAP, real estate revenue is not recognized by the full accrual method until certain criteria are met. The sale of tenements at Kambalda did not meet all these conditions in 2000 and sales and profit was not recognized until 2001.
(g) Cash flow
Under US GAAP bank overdrafts are not considered to be part of the net cash equivalents and so changes in bank overdrafts (net) are included in cash flows from financing activities. In addition, payments for post-production waste removal costs and research and development are included in cash flows from operating activities for US GAAP, while for Australian GAAP, they are investing cash flows. Other differences in the US GAAP statement of cash flows relate to those items capitalized under Australian GAAP that would be expensed under US GAAP and would be included in the US GAAP cash flows from operating activities.
F-83
Table of Contents
WMC RESOURCES LTD AND CONTROLLED ENTITIES
NOTES TO THE CONSOLIDATED FINANCIAL STATEMENTS—(Continued)
(h) Fair value accounting for derivatives
Under Australian GAAP, effective hedges are measured at spot price and hedging gains/losses are deferred on the balance sheet as part of other liabilities and assets. Under US GAAP effective hedges are measured at fair value and gains/losses are recognized as part of other comprehensive income.
Adoption of FAS 133
The Company adopted Statement of Financial Accounting Standards No. 133, “Accounting for Derivative Instruments and Hedging Activities” as amended by Statement of Financial Accounting Standards No. 137, “Accounting for Derivative Instruments and Hedging Activities – Deferral of the Effective Date of FASB Statement No. 133”, an amendment of FASB Statement No. 133, and Statement of Financial Accounting Standards No. 138, “Accounting for Certain Derivative Instruments and Certain Hedging Activities”, an amendment of FASB Statement No. 133 (referred to hereafter as “FAS 133”), on January 1, 2001. In accordance with the transition provisions of FAS 133, the Company recorded the following net-of-tax cumulative effect adjustments in earnings as of January 1, 2001:
Related to previously designated fair value hedging relationships: | A$m | ||
Fair value of hedging instruments | 36.0 | ||
Offsetting changes in fair value of hedged items | (36.0 | ) | |
Total adjustment net of tax | — |
In addition, the Company recorded the following net-of-tax cumulative-effect adjustments in other comprehensive income as of January 1, 2001.
Related to previously designated fair value hedging relationships: | A$m | ||
Fair value of hedging instruments | 29.2 | ||
Previously deferred hedging gains and losses | (647.9 | ) | |
Total adjustment net of tax | (618.7 | ) |
Accounting for derivatives and hedging activities
WMC Resources formally documents all relationships between hedging instruments and hedged items, as well as its risk-management objective and strategy for undertaking various hedge transactions. This process includes linking all derivatives that are designated as fair-value, cash flow, or foreign-currency hedges to (1) specific assets and liabilities on the balance sheet or (2) specific firm commitments or forecasted transactions. WMC Resources also formally assesses (both at the hedge’s inception and on an ongoing basis) whether the derivatives that are used in hedging transactions have been highly effective in offsetting changes in the fair value or cash flows of hedged items and whether those derivatives may be expected to remain highly effective in future periods. When it is determined that a derivative is not (or has ceased to be) highly effective as a hedge, WMC Resources discontinues hedge accounting prospectively, as discussed below.
WMC Resources discontinues hedge accounting prospectively when (1) it determines that the derivative is no longer effective in offsetting changes in the fair value or cash flows of a hedged item (including hedged items such as firm commitments or forecasted transactions); (2) it is probable that the forecasted transaction will not occur; (3) a hedged firm commitment no longer meets the definition of a firm commitment; or (4) management determines that designating the derivative as a hedging instrument is no longer appropriate.
F-84
Table of Contents
WMC RESOURCES LTD AND CONTROLLED ENTITIES
NOTES TO THE CONSOLIDATED FINANCIAL STATEMENTS—(Continued)
Fair-value hedges
WMC Resources may use interest rate swaps to convert a portion of its non prepayable fixed-rate debt into floating-rate debt. Under the interest rate swap contracts, WMC Resources agrees with other parties to exchange, at specified intervals, the difference between fixed-rate and floating-rate interest amounts, which is calculated based on an agreed-upon notional amount.
Cash flow hedges
WMC Resources’ sales are denominated in United States dollars. WMC Resources enters into foreign-exchange options and forward-exchange contracts as hedges of anticipated sales denominated in foreign currencies. WMC Resources enters into these contracts to protect itself against the risk that the eventual dollar-net-cash inflows resulting from direct-foreign-export sales will be adversely affected by changes in exchange rates.
For US GAAP, for the year ending December 31, 2002, WMC Resources recognized a net gain after tax of $0.2 million representing the change in time value on certain of WMC Resources’ forward contracts that had been excluded from the assessment of hedge effectiveness. A net loss after tax of $4.3 million was recorded for the ineffective portion of certain options designated as cash flow hedges.
The revaluation of foreign currency debt which is not treated as a hedge for accounting purposes under US GAAP resulted in a net gain after tax of $94.2 million.
The total of the adjustments referred to in the preceding two paragraphs on a pre-tax basis was $128.6 million.
For US GAAP, as at December 31, 2002, $128.3 million of deferred net losses on derivative instruments accumulated in other comprehensive income are expected to be reclassified as earnings during the next twelve months.
The maximum term over which WMC Resources is hedging exposures to the variability of cash flows using derivative instruments for all forecasted transactions is seven years.
Subsequent gains and losses on cash flow hedges are taken to other comprehensive income and are reclassified to profit and loss in the same period the hedged transaction is recognized. Gains and losses on fair value hedges continue to be taken to profit and loss in subsequent periods, as offsetting gains and losses on hedged liabilities. In both cases, these gains and losses are not recognized under Australian GAAP until the hedged transaction is recognized.
FAS 133 requires that any component of the gain or loss which is deemed to be ineffective be taken to the Income Statement immediately. For Australian GAAP any ineffectiveness is recognized over the term of the derivative.
(i) The right to royalties received from sale of gold operations not recognized
The right to royalties received in consideration for the gold mines sold during 2001 has been recognized at fair value under Australian GAAP and included in the determination of the gain on disposal. Under US GAAP, since the right to the royalties received had not been realized at December 31, 2001, WMC Resources retained an
F-85
Table of Contents
WMC RESOURCES LTD AND CONTROLLED ENTITIES
NOTES TO THE CONSOLIDATED FINANCIAL STATEMENTS—(Continued)
amount of the carrying value of the mines on the balance sheet at December 31, 2001 in the proportion that the value of the right to the royalties bears to the total value of the consideration received. The increase in net income for US GAAP represents the difference in carrying value when the royalty was sold during the year ended December 31, 2002.
(j) Revenue from insurance proceeds
Under Australian GAAP, insurance proceeds are recognized when WMC Resources is satisfied that a valid claim exists which will be accepted, it is probable that the amount will flow to WMC Resources and the amount can be measured reliably. Under US GAAP, insurance proceeds are not recognized as revenue until realized, either through receipt of the insurance proceeds or an agreement with the insurance provider as to the amount of insurance proceeds to be received. As of December 31, 2002, WMC Resources had not yet concluded an agreement on the full amount of insurance proceeds to be received.
(k) Option payment capitalized
An option payment made in 2000 for the right to participate in the Corridor Sands bankable feasibility study and earn an interest in any resultant development was deferred and amortized over the period during which the study is undertaken. Under US GAAP the payment has been expensed when incurred.
(l) Accounting change—Depreciation and Amortization
Effective January 1, 2002 the company changed its methodology for the determination of amortization of mine development assets (including post production waste removal costs) under US GAAP. Prior to January 1, 2002 the company amortized mining development on a composite basis. Total historical capitalized costs and estimated future development costs relating to its developed and undeveloped reserves were depreciated using the units-of-production method based on total developed and undeveloped proven and probable reserves.
After considering the evolving US industry practice in this area, management decided to revise its amortization methodology prospectively. Effective January 1, 2002 US GAAP depreciation for mine development assets (including post-production waste removal costs) excludes consideration of future development costs. Refer to Note 45(m) for details of the new policy for amortization of mine development and Note 45(n) for amortization of post-production waste removal costs. The cumulative effect recorded on January 1, 2002 of changing to the new accounting policy is A$39.5 million (post-tax).
(m) Amortization of mine development and deferred post-production waste removal costs
For US GAAP purposes, amortization of the deferred costs of mine development is calculated on a units-of-production basis over the proven and probable reserves which relate to the particular category of development, either “life of mine plan” or reserves for which no further capital expenditure is required. No future development costs are taken into account in calculating the amortization charge.
Life of mine plan development comprises capital expenditures that will be utilized in the extraction of all the proven and probable ore reserves in the current detailed mine plan. These expenditures are predominantly incurred up-front and in advance of any ore extraction or during major expansions. The types of development included in this category are ore haulage shafts, initial decline, ore passes and chutes and underground ore
F-86
Table of Contents
WMC RESOURCES LTD AND CONTROLLED ENTITIES
NOTES TO THE CONSOLIDATED FINANCIAL STATEMENTS—(Continued)
crusher cavities and are intended to be used for the extraction of all ore within the current mine plan. These costs are amortized on a units-of-production basis over the total proven and probable reserves in the current mine plan.
Development which is amortized over reserves for which no further capital expenditure is required comprises capital expenditure to provide access to various areas within the mine to allow the extraction of ore to commence. The types of development included within this category are: access and perimeter drives, ventilation drives and rises, and progressive declining subsequent to initial contact with the ore body. These costs are amortized on a units-of-production basis over the proven and probable reserves that can be currently accessed without future capital development costs being incurred.
| (n) Post–production | waste removal costs |
Under Australian GAAP, expenditure incurred on post-production waste removal (stripping) is accumulated and deferred on the balance sheet as part of Mine properties and mine development. For US GAAP, these deferred production costs are classified in the balance sheet as other non-current assets. Amortization of post-production waste removal costs is included in cost of goods sold in the income statement. The US GAAP movements and closing balances of post-production waste removal costs as follows:
| 2002 A$m | 2001 A$m | 2000 A$m | |||||||
Opening balance | 161.5 | 140.7 | 127.8 | ||||||
Cumulative effect adjustment | (38.1 | ) | — | — | |||||
Costs capitalized | 98.3 | 102.1 | 72.5 | ||||||
Amortisation charge | (80.0 | ) | (81.3 | ) | (59.6 | ) | |||
Closing balance | 141.7 | 161.5 | 140.7 | ||||||
For US GAAP, the amortization of deferred post-production waste removal costs is determined by applying a life-of-mine waste-to-metal stripping ratio. The stripping ratio is calculated by comparing the recoverable metal included in the proven and probable reserves to be extracted over the life of the mine to the total volume of waste to be extracted over the same period. This ratio is then applied to the production of metal for the period to determine the amortization charge. The life of mine waste-to-metal stripping ratio used for the amortization of post production waste removal costs was: Mt Keith 2002: 691, 2001: 699, 2000: 704, Harmony 2002: 749, 2001: 662, 2000: 607. The full amount of post-production waste removal costs incurred will not be expensed until the end of the mine life. Based on the current mine plans, the deferred stripping asset would be expected to be extinguished during 2018 for Mount Keith and 2004 for the Harmony Mine at Leinster.
The accounting for stripping costs smoothes the cost of waste-rock removal over the life of the mine rather than expensing the actual waste removal cost incurred in each period. As evidenced by the table above, the deferred stripping accounting resulted in a decrease to production costs as compared to actual costs incurred for each period presented. Should actual waste removal costs to date be less than imputed life of mine costs as calculated using the life of mine stripping ratio at a particular point in time, this balance may be in credit.
There is mixed accounting practice in this area and some mining companies expense waste removal costs as incurred, which policy, if followed, may result in the reporting of greater volatility in period to period results of operations.
Stripping expenditure, which for Australian GAAP purposes is shown as an investing cash flow, is considered an operating cash flow for US GAAP.
F-87
Table of Contents
WMC RESOURCES LTD AND CONTROLLED ENTITIES
NOTES TO THE CONSOLIDATED FINANCIAL STATEMENTS—(Continued)
As waste removal activities are an integral part of the mining operation, the deferred stripping asset is grouped with the other assets at the mine site or other level which represents the lowest level of separately identifiable cash flows in order to assess recoverable amount.
(o) Lease commitments
Under Australian GAAP, a provision has been raised for the present value of future payments for surplus lease space under non-cancelable operating leases, and for leased space under non-cancelable operating leases which is to be considered subject to an onerous contract. These provisions are not allowable under US GAAP.
(p) Transfers of net assets and exchange of shares between entities under common control
Prior to effecting the demerger, through a series of transactions internal to the WMC Limited Group, WMC Resources Ltd acquired WMC Limited’s shares in the legal entities that held its copper-uranium and fertilizer businesses, WMC Finance Limited, WMC Finance (USA) Limited as well as WMC Limited’s exploration and development interests other than those relating to Alcoa World Alumina and Chemicals (AWAC). Under Australian GAAP, these acquisitions were made at the fair value of the net assets acquired, in return for shares in WMC Resources Ltd. Under US GAAP, these acquisitions are accounted for in accordance with “Financial Accounting Standard No 141 “Business Combination”, as transfers of net assets and exchanges of shares between entities under common control, which requires that all such transactions are recorded at the historic carrying amounts. Consequently, the following adjustments between Australian GAAP and US GAAP arise:
| (i) | Copper-uranium idle and inactive assets |
Under Australian GAAP certain idle and inactive assets of the copper-uranium business were acquired by WMC Resources Ltd at their fair value of nil. Under US GAAP, these assets are acquired at carrying value.
| (ii) | Copper-uranium acquired mineral rights |
For the Australian GAAP financial statements, the excess of the cost of acquisition of the copper-uranium business unit over the fair value of its other identifiable net assets acquired was brought to account as “acquired mineral rights”, which are amortized on a straight line basis over the period during which the benefits are expected to arise. Under US GAAP, the acquired mineral rights balance is not recorded as the assets are transferred at carrying value.
| (iii) | Fertilizer assets fair value adjustment |
Under Australian GAAP, the assets of the Fertilizer business were recorded at their fair values, which were lower than their book carrying values, as part of the acquisition by WMC Resources. This fair value adjustment of $289.6 million was applied against the intangible assets and property, plant and equipment of the Fertilizer operations. For US GAAP purposes the transfer is recorded at book value at the date of transfer and the assets are not considered to be impaired under US GAAP in accordance with FAS 144. Consequently, there is a difference between the carrying value of the assets and the depreciation charge on an Australian GAAP basis and a US GAAP basis. Of the total fair value adjustment of $289.6 million, $107.6 million relating to start-up costs has already been expensed for US GAAP (refer to (e) above).
| (iv) | Deferred tax balances acquired |
On acquisition, the deferred tax balances of the Fertilizer business and of WMC Finance Limited were assessed to have a fair value of nil under Australian GAAP on the basis that their recoverability was not
F-88
Table of Contents
WMC RESOURCES LTD AND CONTROLLED ENTITIES
NOTES TO THE CONSOLIDATED FINANCIAL STATEMENTS—(Continued)
virtually certain. For US GAAP, these balances were acquired at their book values, and, as mentioned in (d) above, provided for to the extent that it is more likely than not that some portion or all of the deferred tax asset will not be realized. This valuation allowance is taken through equity for US GAAP purposes as it relates to the demerger.
| (v) | Acquisition of hedge instruments |
Upon acquisition of WMC Finance Limited, all of the hedge instruments which were held by this entity were marked to market, resulting in the re-statement of deferred losses and creditors relating to hedging contracts. Net deferred losses were assigned a fair value of zero on acquisition. WMC Finance was acquired at carrying value for US GAAP purposes and therefore the fair value adjustments made under Australian GAAP are reversed for US GAAP. The profit and loss impact of subsequent transactions was based on the original book values rather than the Australian GAAP fair value. Fair value adjustments relating to deferred losses of A$1,458.9 million and deferred gains of A$357.0 million are reversed for US GAAP.
| (vi) | Repurchase of Yankee Bonds |
Upon acquisition of WMC Finance (U.S.A.) Limited, the Yankee Bonds which were held by the company were revalued to their fair value on the date of acquisition of the entity by WMC Resources. WMC Finance (U.S.A.) Limited was acquired at carrying value for US GAAP purposes and therefore the fair value adjustments are reversed for US GAAP and the profit and loss transactions recorded at their historic carrying value rather than the Australian GAAP fair value. Consequently, at December 31, 2002, additional costs of A$143.7 million are recorded as a reconciling item to US GAAP income to reflect the underlying losses on extinguishment of debt when the Yankee Bonds were repurchased during December 2002, which had been extinguished by the fair value adjustments under Australian GAAP. In addition, the remaining balance of the Yankee Bonds at December 31, 2002 is re-stated to its original book value, resulting in a reduction in liabilities under US GAAP of A$2.2 million.
| (vii) | Stamp duty |
Stamp Duty of $24.0 million paid on the transfer of assets between entities has been capitalised into the assets acquired under Australian GAAP. For US GAAP, this amount has been expensed in 2002.
| (viii) | Other fair value adjustments |
Other sundry assets were acquired from WMC Limited at their fair values for Australian GAAP. Under US GAAP, these assets are acquired at their carrying values.
(q) Asset revaluation reserve
In years prior to 1981 the Directors from time to time revalued upwards certain items of property, plant and equipment to amounts not in excess of those expected to be recouped through future operations or sale. The increments from such upward valuations, which are contrary to US GAAP, were taken to the asset revaluation reserve. The increase asset value resulted in additional depreciation in the years subsequent to the revaluations. The net impact of such upward revaluation on net income, assets and shareholders’ equity is now insignificant.
(r) Stock Options
For US GAAP purposes, WMC Resources applies APB Opinion No. 25, “Accounting for Stock Issued to Employees,” and related interpretations in accounting for its stock-based compensation plans. APB 25 utilizes the intrinsic value method to recognize compensation costs related to employee stock grants. Compensation is recognized when the quoted market price is higher than the exercise price on the measurement date which is typically the grant date to the employee. To the extent that a compensation charge is recorded, it would be
F-89
Table of Contents
WMC RESOURCES LTD AND CONTROLLED ENTITIES
NOTES TO THE CONSOLIDATED FINANCIAL STATEMENTS—(Continued)
amortized over the vesting period of the options which is typically one year. WMC Resources grants are fixed as the number of options and the exercise price are fixed on the date of grant. Accordingly, no compensation expense has been recognized other than for performance share and restricted stock units. Compensation costs charged against WMC Resources’ results of operations were nil in 2002, 2001, and 2000.
Fair value disclosures:
WMC Resources has adopted the disclosure-only provisions of SFAS No. 123, “Accounting for Stock-Based Compensation.” If WMC Resources had elected to recognize compensation costs based on the fair value at the date of grant for WMC Resources common stock and SAP awards granted subsequent to the demerger in 2002 consistent with the provisions of SFAS No. 123, net (loss)/income available to common shareholders, and the respective per share amounts would have been as follows:
| For the Year Ended December 31, 2002 | |||
Net (loss) income available to common shareholders (A$m) | |||
—As reported US GAAP | (109.5 | ) | |
—Pro forma | (129.9 | ) | |
Net (loss) income available to common shareholders per share—basic and diluted (cents): | |||
—As reported US GAAP | (9.8 | ) | |
—Pro forma | (11.6 | ) | |
Assumptions: | |||
—Risk free interest rates | 4.8 | % | |
—Dividend yield | 0 | % | |
—Volatility | 29.8 | % | |
—Expected life in years | 3.77 |
The weighted-average fair value for all WMC Resources stock options and SAPs granted during 2002 was estimated using the Black-Scholes option-pricing model. The following weighted average assumptions were applied: (i) expected dividend yield of 0%, (ii) expected volatility rate of 29.8%, (iii) expected life of 5 years, and (iv) risk-free interest rate of 4.68%.
F-90
Table of Contents
WMC RESOURCES LTD AND CONTROLLED ENTITIES
NOTES TO THE CONSOLIDATED FINANCIAL STATEMENTS—(Continued)
Year to 31 Dec 2002 A$m | Year to 31 Dec 2001 A$m | Year to 31 Dec 2000 A$m | |||||||
| INCOME AND COMPREHENSIVE INCOME STATEMENT—US GAAP RECONCILIATION | |||||||||
Net income attributable to members of the holding company as reported | 23.0 | 126.0 | 399.9 | ||||||
Adjustments required to conform with US GAAP: | |||||||||
—Research and development costs (a) | 0.2 | 1.9 | 2.5 | ||||||
—Pension funds (b) | 0.5 | 8.2 | �� | (14.6 | ) | ||||
—Exploration expenditure capitalized (c) | 2.5 | (3.7 | ) | (6.7 | ) | ||||
—Start up costs (e) | |||||||||
—capitalized cost | — | — | (53.2 | ) | |||||
—amortization written back | 6.6 | 7.0 | 3.6 | ||||||
—Real estate profit recognition (f) | |||||||||
—sale of Kambalda tenements | — | 20.2 | (20.2 | ) | |||||
—Option payment capitalized (k) | |||||||||
—capitalized cost | — | — | (28.6 | ) | |||||
—amortization written back | 11.4 | 11.4 | 2.9 | ||||||
—Fair value of accounting for derivatives (h) | 128.6 | (164.4 | ) | — | |||||
—Royalty received from the sale of gold operations (i)* | 13.6 | (13.6 | ) | — | |||||
—Lease commitments (o) | 7.7 | — | — | ||||||
—Transfers of net assets and exchanges of shares between entities under common control (p) | |||||||||
—Copper/uranium acquired mineral rights (ii) | 2.2 | — | — | ||||||
—Fertilizer assets fair value adjustment (iii) | (1.1 | ) | — | — | |||||
—Repurchase of Yankee Bonds(vi) | (143.7 | ) | — | — | |||||
—Stamp duty (vii) | (24.0 | ) | — | — | |||||
—Other fair value adjustments (viii) | (9.0 | ) | — | — | |||||
—Revenue from insurance proceeds (j) | (58.2 | ) | — | — | |||||
—Current year transitional adjustment on adoption of new policy for amortization of mine development and post-production waste removal costs (m),(n) | (4.6 | ) | — | — | |||||
— Income tax effect of above | (25.7 | ) | 44.7 | 22.0 | |||||
Total adjustments | (93.0 | ) | (88.3 | ) | (92.3 | ) | |||
| Net (loss)/income in accordance with US GAAP before cumulative effect of change in accounting principle | (70.0 | ) | 37.7 | 307.6 | |||||
| * | This reconciliation item relates to discontinued operations. |
F-91
Table of Contents
WMC RESOURCES LTD AND CONTROLLED ENTITIES
NOTES TO THE CONSOLIDATED FINANCIAL STATEMENTS—(Continued)
| Year to 31 Dec 2002 A$m | Year to 31 Dec 2001 A$m | Year to 31 Dec 2000 A$m | |||||||
| Net (loss)/income in accordance with US GAAP before cumulative effect of change in accounting principle (carried forward) | (70.0 | ) | 37.7 | 307.6 | |||||
Prior years transitional adjustment on adoption of new policy for amortization of mine development and post-production waste removal costs (post-tax) (m),(n) | (39.5 | ) | — | — | |||||
Net (loss)/ income in accordance with US GAAP | (109.5 | ) | 37.7 | 307.6 | |||||
This is represented by: | |||||||||
Continuing operations: | |||||||||
Net (loss)/income from continuing operations before cumulative effect of change in accounting principle | (121.3 | ) | (231.5 | ) | 241.6 | ||||
Prior years transitional adjustment on adoption of new policy | (39.5 | ) | — | — | |||||
Net (loss)/income from continuing operations | (160.8 | ) | (231.5 | ) | 241.6 | ||||
Net income from discontinued operations | 51.3 | 269.2 | 66.0 | ||||||
Comprehensive Income | |||||||||
Net income in accordance with US GAAP as above | (109.5 | ) | 37.7 | 307.6 | |||||
Other comprehensive income as reported | 3.1 | (14.1 | ) | (19.2 | ) | ||||
Transitional adjustment on adoption of FAS 133 (h) | — | (618.7 | ) | — | |||||
FAS 133 adjustment for current year | 192.6 | (209.6 | ) | — | |||||
Comprehensive (loss)/income in accordance with US GAAP | 86.2 | (804.7 | ) | 288.4 | |||||
F-92
Table of Contents
WMC RESOURCES LTD AND CONTROLLED ENTITIES
NOTES TO THE CONSOLIDATED FINANCIAL STATEMENTS—(Continued)
| As at 31 December | ||||||
| 2002 A$m | 2001 A$m | |||||
SHAREHOLDERS’ EQUITY—US GAAP RECONCILIATION | ||||||
Shareholders’ equity as reported | 3,606.6 | 3,220.3 | ||||
Adjustments required to conform with US GAAP: | ||||||
—Research and development costs capitalized (a) | (0.3 | ) | (0.5 | ) | ||
—Pension funds (b) | (43.6 | ) | (44.1 | ) | ||
—Exploration expenditure capitalized (c) | (14.5 | ) | (37.4 | ) | ||
—Start up costs (e) | (134.6 | ) | (141.2 | ) | ||
—Revenue from insurance proceeds (j) | (58.2 | ) | — | |||
—Option payment capitalized (k) | ||||||
—current year adjustment | — | (14.3 | ) | |||
—Fair value accounting for derivatives (h) | (943.9 | ) | (1,347.7 | ) | ||
—Royalty received from sale of gold operations (i) | — | (13.6 | ) | |||
—Amortization of mine development and post-production waste removal costs (m), (n) | (61.0 | ) | — | |||
—Lease commitments (o) | 7.7 | — | ||||
—Transfers of net assets and exchanges of shares between entities under common control (p) | ||||||
—Copper/uranium idle and inactive assets (i) | 27.2 | — | ||||
—Copper/uranium acquired mineral rights (ii) | (1,269.3 | ) | — | |||
—Fertilizer assets fair value adjustment (iii) | 289.6 | — | ||||
—Acquisition of hedge instruments (v) | 1,101.9 | — | ||||
—Repurchase of Yankee Bonds (vi) | 2.2 | — | ||||
—Other fair value adjustments (viii) | 12.7 | — | ||||
—Other | — | 1.4 | ||||
—Income tax effect | 56.3 | 445.9 | ||||
WMC Resources shareholders’ equity according to US GAAP | 2,578.8 | 2,068.8 | ||||
| 2002 A$m | 2001 A$m | |||||
Roll forward analysis of shareholders’ equity under US GAAP | ||||||
Opening WMC Resources shareholders’ equity according to US GAAP | 2,068.8 | 2,888.9 | ||||
Net (loss)/income in accordance with US GAAP | (70.0 | ) | 37.7 | |||
Transitional adjustment on adoption of new policy | (39.5 | ) | — | |||
Other comprehensive income | 195.7 | (842.4 | ) | |||
Net adjustments resulting from demerger related transactions | 411.4 | — | ||||
Deemed equity contribution/(distribution) | 12.4 | (15.4 | ) | |||
Closing WMC Resources shareholders’ equity according to US GAAP | 2,578.8 | 2,068.8 | ||||
F-93
Table of Contents
WMC RESOURCES LTD AND CONTROLLED ENTITIES
NOTES TO THE CONSOLIDATED FINANCIAL STATEMENTS—(Continued)
| As at 31 Dec 2002 A$m | As at 31 Dec 2001 A$m | |||||
TOTAL ASSETS US GAAP RECONCILIATION | ||||||
Total Assets reported using Australian GAAP | 7,348.1 | 8,242.9 | ||||
Adjustment for Research and development costs capitalized (a) | (0.3 | ) | (0.5 | ) | ||
Adjustment for Exploration expenditure capitalized (c) | (14.5 | ) | (37.4 | ) | ||
Adjustment for Start up costs (e) | (134.6 | ) | (141.2 | ) | ||
Adjustment for fair value of accounting for derivatives (h) | (952.4 | ) | (1,345.9 | ) | ||
Adjustment for Royalty received from sale of gold operations (i) | — | (13.6 | ) | |||
Adjustment for insurance proceeds (j) | (58.2 | ) | — | |||
Adjustment for Option payment capitalized (k) | — | (14.3 | ) | |||
Adjustment for mine development and post-production waste removal (m), (n) | (61.0 | ) | — | |||
Adjustments for transfers of net assets and exchange of shares between entities under common control (p) | ||||||
—Copper/uranium idle and inactive assets (i) | 27.2 | — | ||||
—Copper/uranium acquired mineral rights (ii) | (1,269.3 | ) | — | |||
—Fertilizer assets fair value adjustment (iii) | 289.6 | — | ||||
—Acquisition of hedge instruments (v) | 1,458.9 | — | ||||
—Other fair value adjustments (viii) | 12.7 | — | ||||
Other minor adjustments | — | 1.4 | ||||
Total Assets according to US GAAP | 6,646.2 | 6,691.4 | ||||
TOTAL LIABILITIES—US GAAP RECONCILIATION | ||||||
Total Liabilities reported under Australian GAAP | 3,741.5 | 5,013.6 | ||||
Adjustment for Pension funds (b) | 43.6 | 44.1 | ||||
Adjustment for fair value of accounting for derivatives (h) | (8.5 | ) | 1.8 | |||
Adjustment for lease commitments (o) | (7.7 | ) | — | |||
Adjustments for transfers of net assets and exchange of shares between entities under common control (p) | ||||||
—Acquisition of hedge instruments (v) | 357.0 | — | ||||
—Repurchase of Yankee Bonds (vi) | (2.2 | ) | — | |||
Income tax effect of US GAAP adjustments | (56.3 | ) | (445.9 | ) | ||
Total Liabilities according to US GAAP | 4,067.4 | 4,613.6 | ||||
F-94
Table of Contents
WMC RESOURCES LTD AND CONTROLLED ENTITIES
NOTES TO THE CONSOLIDATED FINANCIAL STATEMENTS—(Continued)
| Year to 31 Dec 2002 A$m | Year to 31 Dec 2001 A$m | Year to 31 Dec 2000 A$m | |||||||
STATEMENT OF CASH FLOWS—US GAAP RECONCILIATION (g) | |||||||||
Cash flows from financing activities as reported | 15.8 | (793.7 | ) | (508.9 | ) | ||||
Changes in bank overdrafts (net) | (0.2 | ) | (3.7 | ) | 3.1 | ||||
Net cash provided by/(used in) financing activities—US GAAP | 15.6 | (797.4 | ) | (505.8 | ) | ||||
Cash flows from operating activities as reported | 336.7 | 577.7 | 898.1 | ||||||
Payments for exploration expenditure expensed for US GAAP | — | (3.7 | ) | (6.7 | ) | ||||
Payments for start-up costs expensed for US GAAP | — | — | (52.4 | ) | |||||
Option payment expensed for US GAAP | — | — | (28.6 | ) | |||||
Payments for research and development | (0.4 | ) | — | (0.3 | ) | ||||
Deferred stripping expenditure reclassified from investing | (98.3 | ) | (102.1 | ) | (72.1 | ) | |||
Net cash provided by operating activities—US GAAP | 238.0 | 471.9 | 738.0 | ||||||
Cash flows from investing activities as reported | (381.0 | ) | 279.1 | (419.3 | ) | ||||
Payments for exploration expenditure expensed for US GAAP | — | 3.7 | 6.7 | ||||||
Payments for start-up costs expensed for US GAAP | — | — | 52.4 | ||||||
Option payment expensed for US GAAP | — | — | 28.6 | ||||||
Reclassification of payments for research and development to operating activities | 0.4 | — | 0.3 | ||||||
Reclassification of deferred stripping expenditure | 98.3 | 102.1 | 72.1 | ||||||
Net cash (used in)/provided by investing activities—US GAAP | (282.3 | ) | 384.9 | (259.2 | ) | ||||
Net (decrease)/increase in cash and cash equivalents | (28.7 | ) | 59.4 | (27.0 | ) | ||||
Cash and cash equivalents at the beginning of the year | 124.1 | 62.3 | 76.6 | ||||||
Effects of exchange rate changes on opening foreign currency cash balances and on cash flows during the period | (4.9 | ) | 2.4 | 12.7 | |||||
Cash and cash equivalents at the end of the financial year | 90.5 | 124.1 | 62.3 | ||||||
F-95
Table of Contents
WMC RESOURCES LTD AND CONTROLLED ENTITIES
NOTES TO THE CONSOLIDATED FINANCIAL STATEMENTS—(Continued)
46. RECENTLY ISSUED FINANCIAL ACCOUNTING STANDARDS
The Financial Accounting Standards Board has issued certain Statements of Financial Accounting Standards which are not effective with respect to the fiscal years presented in the Consolidated financial statements.
SFAS No. 143 “Accounting for Asset Retirement Obligations” was issued in 2001. It will be effective for WMC Resources in 2003. The statement requires an asset retirement obligation and a matching asset to be brought to account (calculated at a discounted present value) at the initial point the liability is incurred, generally when the mine is first commenced. The cost of the obligation is to be amortized over the life of a long-lived asset. Increases in the obligation as a result of the reduction of time are to be treated as interest. WMC Resources is currently assessing the impact of adopting this standard.
In April 2002, the FASB issued SFAS No. 145, “Rescission of FASB Statements No. 4, 44, and 64, Amendment of FASB Statement No. 13, and Technical Corrections”. The standard rescinds FASB Statements No. 4 and 64 that deal with issues relating to the extinguishment of debt. The standard also rescinds FASB Statement No. 44 that deals with intangible assets of motor carriers. The standard modifies SFAS No. 13, “Accounting for Leases”, so that certain capital lease modifications must be accounted for by lessees as sale-leaseback transactions. Additionally, the standard identifies amendments that should have been made to previously existing pronouncements and formally amends the appropriate pronouncements. SFAS No. 145 is effective for fiscal years beginning after 15 May 2002 with earlier adoption encouraged. WMC Resources adopted SFAS No. 145 on January 1, 2002. The adoption of this statement did not have a material impact on the Company’s financial position or results of operations.
In July 2002, the FASB issued SFAS No. 146, “Accounting for Costs Associated with Exit or Disposal Activities”. The statement requires that costs associated with exit or disposal activities must be recognized when they are incurred rather than at the date of a commitment to an exit or disposal plan. Such costs include lease termination costs and certain employee severance costs associated with a restructuring, discontinued operations or other exit or disposal activity. We are currently reviewing SFAS No. 146, which is effective for exit or disposal activities initiated after 31 December 2002.
In December 2002, the FASB issued SFAS 148 “Accounting for Stock based Compensation”. This Statement amends FASB Statement No. 123,Accounting for Stock-Based Compensation, to provide alternative methods of transition for a voluntary change to the fair value based method of accounting for stock-based employee compensation. In addition, this Statement amends the disclosure requirements of Statement 123 to require prominent disclosures in both annual and interim financial statements about the method of accounting for stock-based employee compensation and the effect of the method used on reported results. SFAS No. 148 is effective for the Company’s year ended December 31, 2002. The Company has not adopted fair value accounting suggested in SFAS 123/148. The Company continues to provide disclosures in accordance with SFAS 123.
In November 2002, the FASB issued FASB Interpretation No. (FIN) 45, “Guarantor’s Accounting and Disclosure Requirements for Guarantees, Including Indirect Guarantees of Indebtedness of Others”. This Interpretation elaborates on the disclosures to be made by a guarantor in its interim and annual financial statements about its obligations under certain guarantees that it has issued. It also clarifies that a guarantor is required to recognize, at the inception of a guarantee, a liability for the fair value of the obligation undertaken in issuing the guarantee. This Interpretation does not prescribe a specific approach for subsequently measuring the guarantor’s recognized liability over the term of the related guarantee. This Interpretation also incorporates, without change, the guidance in FASB Interpretation No. 34,Disclosure of Indirect Guarantees of Indebtedness of Others, which is being superseded. The disclosure requirements are effective for fiscal year 2002. The
F-96
Table of Contents
WMC RESOURCES LTD AND CONTROLLED ENTITIES
NOTES TO THE CONSOLIDATED FINANCIAL STATEMENTS—(Continued)
provisions for initial recognition and measurement are effective on a prospective basis for guarantees that are issued or modified after December 31, 2002. No additional disclosure was required upon adoption of this interpretation.
In January 2003, the FASB issued FIN 46, “consolidation of Variable Interest Entities, an Interpretation of ARB No. 51. FIN 46 requires certain variable interest entities to be consolidated by the primary beneficiary of the entity if the equity investors in the entity do not have the characteristics of a controlling financial interest or do not have sufficient equity at risk for the entity to finance its activities without additional subordinated financial support from other parties. FIN 46 is effective for all new variable interest entities created or acquired after January 31, 2003. The Company has considered the implications of the disclosure requirements of FIN 46 and has concluded that the impact, if any, is not likely to be material.
In April 2003 the Financial Accounting Standards Board (FASB) issued Statement No. 149 (“SFAS 149”), Amendment of SFAS No. 133 on Derivative Instruments and Hedging Activities. The Statement amends and clarifies accounting for derivative instruments, including certain derivative instruments embedded in other contracts, and for hedging activities under SFAS 133. In particular, it (1) clarifies under what circumstances a contract with an initial net investment meets the characteristic of a derivative as discussed in SFAS 133, (2) clarifies when a derivative contains a financing component, (3) amends the definition of an underlying to conform it to the language used in FIN 45 and (4) amends certain other existing pronouncements. SFAS No. 149 is effective for contracts entered into or modified after June 30, 2003, except as stated below and for hedging relationships designated after June 30, 2003.
The provisions of SFAS 149 that relate to SFAS 133 Implementation Issues that have been effective for fiscal quarters that began prior to June 15, 2003, should continue to be applied in accordance with their respective effective dates. In addition, certain provisions relating to forward purchases or sales of when-issued securities or other securities that do not yet exist, should be applied to existing contracts as well as new contracts entered into after June 30, 2003. SFAS 149 should be applied prospectively. The Company does not expect that the adoption of this Statement will have a material impact on its results of operations and financial position.
In May 2003 the Financial Accounting Standards Board (FASB) issued Statement of Financial Accounting Standards No. 150 (“SFAS 150”), Accounting for Certain Financial Instruments with Characteristics of both Liabilities and Equity. SFAS 150 modifies the accounting for certain financial instruments that, under previous guidance, issuers could account for as equity. The Statement requires that those instruments be classified as liabilities in statements of financial position. SFAS 150 affects an issuer’s accounting for three types of freestanding financial instruments, namely:
| • | Mandatorily redeemable shares, which the issuing company is obligated to buy back in exchange for cash or other assets. |
| • | Financial instruments, other than outstanding shares, that do or may require the issuer to buy back some of its equity shares in exchange for cash or other assets. These instruments include put options and forward purchase contracts. |
| • | Unconditional obligations that can be settled with equity shares, the monetary value of which is fixed, tied solely or predominantly to a variable such as a market index, or varies inversely with the value of the issuer’s’ equity shares. |
SFAS 150 does not apply to features embedded in financial instruments that are not derivatives in their entirety. In addition to its requirements for the classification and measurement of financial instruments within its scope, SFAS 150 also requires disclosures about alternative ways of settling such those instruments and the capital structure of entities, all of whose shares are mandatorily redeemable.
F-97
Table of Contents
WMC RESOURCES LTD AND CONTROLLED ENTITIES
NOTES TO THE CONSOLIDATED FINANCIAL STATEMENTS—(Continued)
SFAS 150 is effective for financial instruments entered into or modified after May 31, 2003, and otherwise is effective at the beginning of the first interim period beginning after June 15, 2003. It is to be implemented by reporting the cumulative effect of a change in an accounting principle for financial instruments created before the issuance date of the Statement and still existing at the beginning of the interim period of adoption. Restatement is not permitted. The Company is currently evaluating the impact of SFAS 150 on its results of operations and financial position.
The Australian Accounting Standards Board (“AASB”) has issued or revised certain accounting standards that are not effective for the fiscal periods reported upon in the consolidated financial statements.
AASB 1020, “Income Taxes” was issued in December 1999. The AASB deferred the operative date during the current year and this standard will not be effective for WMC Resources until 2005. WMC Resources is currently assessing the impact of adopting this standard on its financial report.
AASB1028, “Employee Benefits” was revised in June 2001. It will be effective for WMC Resources in 2003. Application of this standard is not expected to have a significant impact on the company’s financial position.
The Financial Reporting Council has announced that Australia will adopt international accounting standards from 1 January 2005. WMC Resources is currently reviewing the impact of adopting international accounting standards.
| 47. | SUPPLEMENTAL GUARANTOR INFORMATION |
Supplemental condensed consolidating financial information (in accordance with Australian GAAP) of the Guarantors is presented on pages F-100 through F-112. This supplemental financial information should be read in conjunction with the Consolidated Financial Statements. A reconciliation of the Group’s results and equity under Australian GAAP to US GAAP is also presented on a condensed consolidating basis below.
In accordance with SEC Rules and Regulations, the “Guarantor Parent” and “Guarantor subsidiaries” columns use the equity method to account for the results of all of the subsidiaries. The “eliminations and reclassifications” column includes the following entries: eliminations of intragroup sales, purchases and other income/expenses and all intragroup balances; elimination of intragroup investments accounted for under the equity method as required for condensed consolidating financial information; and the allocation of fair value adjustments as outlined in Note 45(p).
In respect to the guarantor entities:
| • | each subsidiary issuer or subsidiary guarantor is 100% owned by the parent entity. |
| • | all guarantees are full and unconditional |
| • | all guarantees are joint and several. |
The ability of the subsidiary guarantors to pay dividends and make other payments to the parent guarantor is restricted by, among other things, applicable corporate and other laws and regulations. This ability may be further restricted in the future by agreements to which the subsidiary guarantors may be parties. Accordingly in certain circumstances, the parent guarantor may be unable to make required payments on its debt obligations as these obligations become due.
F-98
Table of Contents
WMC RESOURCES LTD AND CONTROLLED ENTITIES
NOTES TO THE CONSOLIDATED FINANCIAL STATEMENTS—(Continued)
Supplemental Condensed Consolidating Statement of Financial Performance
For the year ended 31 December 2002
| Issuer | Guarantor (Parent) | Guarantor (subsidiaries) | Other subsidiaries | Eliminations and reclassifications | WMC Resources | |||||||||||||
| WMC Finance (USA) Limited | WMC Resources Ltd | WMC (Olympic Dam Corporation) Pty Ltd WMC Fertilizers Pty Ltd | ||||||||||||||||
Continuing operations: | ||||||||||||||||||
Net sales revenue | — | 1,323.6 | 1,041.1 | 1,330.6 | (1,208.1 | ) | 2,487.2 | |||||||||||
Cost of goods sold | — | (875.3 | ) | (844.0 | ) | (1,257.8 | ) | 1,136.3 | (1,840.8 | ) | ||||||||
Selling and distribution | — | (19.4 | ) | (39.9 | ) | (77.6 | ) | (20.4 | ) | (157.3 | ) | |||||||
General and administrative | — | (191.0 | ) | (94.3 | ) | (20.8 | ) | (6.3 | ) | (312.4 | ) | |||||||
General and administrative—exceptional items | — | (51.2 | ) | — | — | — | (51.2 | ) | ||||||||||
Exploration and evaluation | — | (12.6 | ) | — | (25.4 | ) | 1.0 | (37.0 | ) | |||||||||
Other expenses | (9.7 | ) | (79.2 | ) | (51.4 | ) | (65.2 | ) | 56.5 | (149.0 | ) | |||||||
Other expenses—exceptional items | — | (2.0 | ) | (97.7 | ) | — | — | (99.7 | ) | |||||||||
Net profit / (loss) from subsidiary entities | — | 151.2 | 37.2 | — | (188.4 | ) | — | |||||||||||
Other income | 198.0 | 536.8 | 106.6 | 857.7 | (1,631.2 | ) | 67.9 | |||||||||||
Other income—exceptional items | — | 14.0 | 130.4 | 65.5 | — | 209.9 | ||||||||||||
Profit / (loss) before interest and income tax | 188.3 | 794.9 | 188.0 | 807.0 | (1,860.6 | ) | 117.6 | |||||||||||
Interest expense | (295.3 | ) | (992.3 | ) | (80.9 | ) | (218.3 | ) | 1,434.6 | (152.2 | ) | |||||||
Profit / (loss) before income taxes | (107.0 | ) | (197.4 | ) | 107.1 | 588.7 | (426.0 | ) | (34.6 | ) | ||||||||
Income tax credit/(expense) | 2.2 | 182.7 | (17.0 | ) | (615.6 | ) | 467.6 | 19.9 | ||||||||||
Net profit / (loss) from continuing operations | (104.8 | ) | (14.7 | ) | 90.1 | (26.9 | ) | 41.6 | (14.7 | ) | ||||||||
Discontinued operations: | ||||||||||||||||||
Net sales revenue | — | — | — | (1.4 | ) | — | (1.4 | ) | ||||||||||
Net expenses | — | (2.7 | ) | — | (0.7 | ) | 0.7 | (2.7 | ) | |||||||||
Net profit / (loss) from subsidiary entities | — | (7.8 | ) | — | — | 7.8 | — | |||||||||||
Income tax credit/(expense) | — | 0.7 | — | 0.6 | — | 1.3 | ||||||||||||
Profit on sale of right to Gold Royalty | — | 15.4 | — | — | — | 15.4 | ||||||||||||
Profit on sale of Central Norseman Gold Corporation Limited | — | 32.1 | — | (7.0 | ) | — | 25.1 | |||||||||||
Net profit / (loss) from discontinued operations | — | 37.7 | — | (8.5 | ) | 8.5 | 37.7 | |||||||||||
F-99
Table of Contents
WMC RESOURCES LTD AND CONTROLLED ENTITIES
NOTES TO THE CONSOLIDATED FINANCIAL STATEMENTS—(Continued)
| Issuer | Guarantor (Parent) | Guarantor (subsidiaries) | Other subsidiaries | Eliminations and reclassifications | WMC Resources | |||||||||||||
| WMC Finance (USA) Limited | WMC Resources Ltd | WMC (Olympic Dam Corporation) Pty Ltd WMC Fertilizers Pty Ltd | ||||||||||||||||
Consolidated operations: | ||||||||||||||||||
Net sales revenue | — | 1,323.6 | 1,041.1 | 1,329.2 | (1,208.1 | ) | 2,485.8 | |||||||||||
Cost of goods sold | — | (875.3 | ) | (844.0 | ) | (1,257.8 | ) | 1,136.3 | (1,840.8 | ) | ||||||||
Selling and distribution | — | (19.4 | ) | (39.9 | ) | (77.6 | ) | (20.4 | ) | (157.3 | ) | |||||||
General and administrative | — | (193.4 | ) | (94.3 | ) | (21.5 | ) | (6.3 | ) | (315.5 | ) | |||||||
General and administrative—exceptional items | — | (51.2 | ) | — | — | — | (51.2 | ) | ||||||||||
Exploration and evaluation | — | (12.8 | ) | — | (25.4 | ) | 1.0 | (37.2 | ) | |||||||||
Other expenses | (9.7 | ) | (79.5 | ) | (51.4 | ) | (65.2 | ) | 57.2 | (148.6 | ) | |||||||
Other expenses—exceptional items | — | (32.9 | ) | (97.7 | ) | (7.0 | ) | — | (137.6 | ) | ||||||||
Net profit / (loss) from subsidiary entities | — | 143.4 | 37.2 | — | (180.6 | ) | — | |||||||||||
Other income | 198.0 | 537.0 | 106.6 | 857.7 | (1,631.2 | ) | 68.1 | |||||||||||
Other income—exceptional items | — | 92.4 | 130.4 | 65.5 | — | 288.3 | ||||||||||||
Profit / (loss) before interest and income tax | 188.3 | 831.9 | 188.0 | 797.9 | (1,852.1 | ) | 154.0 | |||||||||||
Interest expense | (295.3 | ) | (992.3 | ) | (80.9 | ) | (218.3 | ) | 1,434.6 | (152.2 | ) | |||||||
Profit / (loss) before income taxes | (107.0 | ) | (160.4 | ) | 107.1 | 579.6 | (417.5 | ) | 1.8 | |||||||||
Income tax credit/(expense) | 2.2 | 183.4 | (17.0 | ) | (615.0 | ) | 467.6 | 21.2 | ||||||||||
Net profit / (loss) attributable to holding company shareholders | (104.8 | ) | 23.0 | 90.1 | (35.4 | ) | 50.1 | 23.0 | ||||||||||
US GAAP adjustments to income | — | (132.5 | ) | 55.3 | (179.4 | ) | 124.1 | (132.5 | ) | |||||||||
Net profit / (loss) attributable to holding company shareholders in accordance with US GAAP | (104.8 | ) | (109.5 | ) | 145.4 | (214.8 | ) | 174.2 | (109.5 | ) | ||||||||
F-100
Table of Contents
WMC RESOURCES LTD AND CONTROLLED ENTITIES
NOTES TO THE CONSOLIDATED FINANCIAL STATEMENTS—(Continued)
Supplemental Condensed Consolidating Statement of Financial Position
As at 31 December 2002
| Issuer | Guarantor (Parent) | Guarantor (subsidiaries) | Other subsidiaries | Eliminations and reclassifications | WMC Resources Group | ||||||||||||
| WMC Finance (USA) Limited | WMC Resources Ltd | WMC (Olympic Dam Corporation) Pty Ltd WMC Fertilizers Pty Ltd | |||||||||||||||
Current Assets | |||||||||||||||||
Cash assets | — | — | — | 90.5 | — | 90.5 | |||||||||||
Receivables | 836.1 | 262.5 | 451.2 | 2,454.3 | (3,446.4 | ) | 557.7 | ||||||||||
Other financial assets | — | — | — | 12.7 | — | 12.7 | |||||||||||
Inventories | — | 193.2 | 210.2 | 0.2 | 65.2 | 468.8 | |||||||||||
Other | — | 9.4 | 60.6 | 4.8 | (5.2 | ) | 69.6 | ||||||||||
Total Current Assets | 836.1 | 465.1 | 722.0 | 2,562.5 | (3,386.4 | ) | 1,199.3 | ||||||||||
Non-Current Assets | |||||||||||||||||
Receivables | 773.5 | 477.6 | 306.4 | 2,956.6 | (4,295.3 | ) | 218.8 | ||||||||||
Intragroup investments | — | 2,386.8 | — | 200.0 | (2,586.8 | ) | — | ||||||||||
Other financial assets | — | 3.6 | — | 19.3 | (10.6 | ) | 12.3 | ||||||||||
Inventories | — | 52.9 | 22.0 | — | — | 74.9 | |||||||||||
Exploration and evaluation | — | 0.3 | — | 169.9 | (17.5 | ) | 152.7 | ||||||||||
Property, plant and equipment | — | 1,291.8 | 3,366.3 | 1.4 | (323.2 | ) | 4,336.3 | ||||||||||
Acquired mineral rights | — | — | — | — | 1,269.3 | 1,269.3 | |||||||||||
Deferred tax assets | — | 20.6 | 63.7 | 27.0 | (66.7 | ) | 44.6 | ||||||||||
Other | — | 121.0 | 130.0 | 96.9 | (308.0 | ) | 39.9 | ||||||||||
Total Non-Current Assets | 773.5 | 4,354.6 | 3,888.4 | 3,471.1 | (6,338.8 | ) | 6,148.8 | ||||||||||
Total Assets | 1,609.6 | 4,819.7 | 4,610.4 | 6,033.6 | (9,725.2 | ) | 7,348.1 | ||||||||||
Current Liabilities | |||||||||||||||||
Payables | 798.0 | 209.7 | 2,003.1 | 906.1 | (3,259.0 | ) | 657.9 | ||||||||||
Interest-bearing liabilities | 33.9 | — | — | 1,344.3 | (90.6 | ) | 1,287.6 | ||||||||||
Current tax liabilities | — | — | — | 3.8 | 0.1 | 3.9 | |||||||||||
Provisions | — | 42.3 | 18.4 | 4.6 | 0.7 | 66.0 | |||||||||||
Other | — | 10.4 | 10.5 | 6.0 | (9.9 | ) | 17.0 | ||||||||||
Total Current Liabilities | 831.9 | 262.4 | 2,032.0 | 2,264.8 | (3,358.7 | ) | 2,032.4 | ||||||||||
Non-Current Liabilities | |||||||||||||||||
Payables | 721.7 | 745.2 | 827.7 | 2,967.2 | (4,412.1 | ) | 849.7 | ||||||||||
Interest-bearing liabilities | 8.0 | — | — | 386.7 | (24.8 | ) | 369.9 | ||||||||||
Deferred tax liabilities | — | — | 344.9 | — | 32.1 | 377.0 | |||||||||||
Net accumulated losses of subsidiaries in excess of investments | — | — | 59.2 | — | (59.2 | ) | — | ||||||||||
Provisions | — | 82.6 | 26.1 | 0.3 | 0.7 | 109.7 | |||||||||||
Other | — | 122.9 | 130.1 | 72.2 | (322.4 | ) | 2.8 | ||||||||||
Total Non-Current Liabilities | 729.7 | 950.7 | 1,388.0 | 3,426.4 | (4,785.7 | ) | 1,709.1 | ||||||||||
Total Liabilities | 1,561.6 | 1,213.1 | 3,420.0 | 5,691.2 | (8,144.4 | ) | 3,741.5 | ||||||||||
Net Assets | 48.0 | 3,606.6 | 1,190.4 | 342.4 | (1,580.8 | ) | 3,606.6 | ||||||||||
Total Equity | 48.0 | 3,606.6 | 1,190.4 | 342.4 | (1,580.8 | ) | 3,606.6 | ||||||||||
US GAAP adjustments to equity | — | (1,027.8 | ) | (42.2 | ) | (201.3 | ) | 243.5 | (1,027.8 | ) | |||||||
Total equity in accordance with US GAAP | 48.0 | 2,578.8 | 1,148.2 | 141.1 | (1,337.3 | ) | 2,578.8 | ||||||||||
F-101
Table of Contents
WMC RESOURCES LTD AND CONTROLLED ENTITIES
NOTES TO THE CONSOLIDATED FINANCIAL STATEMENTS—(Continued)
Supplemental Condensed Consolidating Statement of Cash flows
For the year ended 31 December 2002
| Issuer | Guarantor (Parent) | Guarantor (subsidiaries) | Other subsidiaries | Eliminations and reclassifications | WMC Resources | |||||||||||||
| WMC Finance (USA) Limited | WMC Resources Ltd | WMC (Olympic Dam WMC Fertilizers Pty Ltd | ||||||||||||||||
Net cash (used in) / provided by operating activities | (1,471.2 | ) | 106.0 | 228.4 | 209.2 | 1,264.3 | 336.7 | |||||||||||
Cash flows from investing activities: | ||||||||||||||||||
Payments for property, plant and equipment | — | (196.3 | ) | (265.8 | ) | (2.8 | ) | — | (464.9 | ) | ||||||||
Proceeds from sale of CNGC | — | 33.4 | — | (7.7 | ) | — | 25.7 | |||||||||||
Proceeds from sale of Non-current assets | — | 62.7 | 1.4 | 3.5 | — | 67.6 | ||||||||||||
Proceeds from insurance claims | — | 4.9 | 27.3 | (4.9 | ) | — | 27.3 | |||||||||||
Payments for gold hedge close out | — | — | — | (34.4 | ) | — | (34.4 | ) | ||||||||||
Proceeds from short term investments | — | — | — | 2.6 | — | 2.6 | ||||||||||||
Payments for Research and development | — | (0.3 | ) | (0.1 | ) | — | — | (0.4 | ) | |||||||||
Payments for evaluation expenditure | — | (1.1 | ) | — | (3.4 | ) | — | (4.5 | ) | |||||||||
Demerger costs paid | — | (21.7 | ) | — | — | 21.7 | — | |||||||||||
Net increase / (decrease) in loans from related bodies corporate | 1,471.2 | — | — | (1,315.5 | ) | (155.7 | ) | — | ||||||||||
Increase in deposits with unrelated bodies corporate | — | — | — | 49.8 | (49.8 | ) | — | |||||||||||
Net cash (used in) / provided by investing activities | 1,471.2 | (118.4 | ) | (237.2 | ) | (1,312.8 | ) | (183.8 | ) | (381.0 | ) | |||||||
Cash flows from financing activities | ||||||||||||||||||
Deemed equity contribution | — | 12.4 | — | — | — | 12.4 | ||||||||||||
Proceeds from borrowings | — | 60.1 | 8.4 | 2,239.4 | — | 2,307.9 | ||||||||||||
Repayments of borrowings | — | (60.1 | ) | — | (1,163.9 | ) | (1,530.3 | ) | (2,754.3 | ) | ||||||||
Proceeds from share issue | — | 600.0 | — | — | — | 600.0 | ||||||||||||
Amounts advanced to controlled entities | — | (600.0 | ) | — | — | 600.0 | — | |||||||||||
Yankee bond redemption fee | — | — | — | — | (150.2 | ) | (150.2 | ) | ||||||||||
Net cash (used in) / provided by financing activities | — | 12.4 | 8.4 | 1,075.5 | (1,080.5 | ) | 15.8 | |||||||||||
Net (decrease) / increase in cash held | — | — | (0.4 | ) | (28.1 | ) | — | (28.5 | ) | |||||||||
Cash at the beginning of the financial year | — | — | 0.4 | 123.5 | — | 123.9 | ||||||||||||
Effects of exchange rate changes on foreign currency cash balances | — | — | — | (4.9 | ) | — | (4.9 | ) | ||||||||||
Cash at end of financial year | — | — | — | 90.5 | — | 90.5 | ||||||||||||
F-102
Table of Contents
WMC RESOURCES LTD AND CONTROLLED ENTITIES
NOTES TO THE CONSOLIDATED FINANCIAL STATEMENTS—(Continued)
Supplemental Condensed Consolidating Statement of Cash flows (continued)
For the year ended 31 December 2002
| Issuer | Guarantor (Parent) | Guarantor (subsidiaries) | Other subsidiaries | Eliminations and reclassifications | WMC Resources | |||||||||||||
| WMC Finance (USA) Limited | WMC Resources Ltd | WMC (Olympic Dam WMC Fertilizers Pty Ltd | ||||||||||||||||
US GAAP reconciliation of Cash flows: | ||||||||||||||||||
Cashflows from financing activities as reported | — | 12.4 | 8.4 | 1,075.5 | (1,080.5 | ) | 15.8 | |||||||||||
Changes in bank overdrafts (net) | — | — | — | (0.2 | ) | — | (0.2 | ) | ||||||||||
Net cash (used in) / provided by financing activities—US GAAP | — | 12.4 | 8.4 | 1,075.3 | (1,080.5 | ) | 15.6 | |||||||||||
Cash flows from operating activities as reported | (1,471.2 | ) | 106.0 | 228.4 | 209.2 | 1,264.3 | 336.7 | |||||||||||
US GAAP adjustment to cash flows | — | (98.7 | ) | — | — | — | (98.7 | ) | ||||||||||
Net cash (used in) / provided by operating activities—US GAAP | (1,471.2 | ) | 7.3 | 228.4 | 209.2 | 1,264.3 | 238.0 | |||||||||||
Cash flows from investing activities as reported | 1,471.2 | (118.4 | ) | (237.2 | ) | (1,312.8 | ) | (183.8 | ) | (381.0 | ) | |||||||
US GAAP adjustments to cash flows | — | 98.7 | — | — | — | 98.7 | ||||||||||||
Net cash (used in) / provided by investing activities—US GAAP | 1,471.2 | (19.7 | ) | (237.2 | ) | (1,312.8 | ) | (183.8 | ) | (282.3 | ) | |||||||
Net (decrease) / increase in cash and cash equivalents | — | — | (0.4 | ) | (28.3 | ) | — | (28.7 | ) | |||||||||
Cash and cash equivalents at the beginning of the year | — | — | 0.4 | 123.7 | — | 124.1 | ||||||||||||
Effects of exchange rate changes on foreign currency cash balances and on cash flows during the period | — | — | — | (4.9 | ) | — | (4.9 | ) | ||||||||||
Cash and cash equivalents at the end of the year | — | — | — | 90.5 | — | 90.5 | ||||||||||||
F-103
Table of Contents
WMC RESOURCES LTD AND CONTROLLED ENTITIES
NOTES TO THE CONSOLIDATED FINANCIAL STATEMENTS—(Continued)
Supplemental Condensed Consolidating Statement of Financial Performance
For the year ended 31 December 2001
| Issuer | Guarantor (Parent) | Guarantor (subsidiaries) | Other subsidiaries | Eliminations and reclassifications | WMC Resources | |||||||||||||
| WMC Finance (USA) Limited | WMC Resources Ltd | WMC (Olympic Dam WMC Fertilizers Pty Ltd | ||||||||||||||||
Continuing operations: | ||||||||||||||||||
Net sales revenue | — | 1,215.3 | 1,119.6 | 1,628.7 | (1,599.5 | ) | 2,364.1 | |||||||||||
Cost of goods sold | — | (823.8 | ) | (829.4 | ) | (1,538.1 | ) | 1,312.6 | (1,878.7 | ) | ||||||||
Selling and distribution | — | (25.5 | ) | (35.5 | ) | (87.6 | ) | (14.8 | ) | (163.4 | ) | |||||||
General and administrative | — | (125.7 | ) | (58.8 | ) | (25.1 | ) | (14.5 | ) | (224.1 | ) | |||||||
General and administrative—exceptional items | — | (20.7 | ) | (71.8 | ) | — | — | (92.5 | ) | |||||||||
Exploration and evaluation | — | (19.7 | ) | — | (52.3 | ) | 0.1 | (71.9 | ) | |||||||||
Other expenses | (0.7 | ) | (75.0 | ) | (44.8 | ) | (793.3 | ) | 849.6 | (64.2 | ) | |||||||
Other expenses—exceptional items | — | — | — | — | — | — | ||||||||||||
Net profit / (loss) from subsidiary entities | — | 28.8 | 20.9 | — | (49.7 | ) | — | |||||||||||
Other income | 156.5 | 493.8 | 113.8 | 511.0 | (1,072.5 | ) | 202.6 | |||||||||||
Other income—exceptional items | — | — | — | — | — | — | ||||||||||||
Profit / (loss) before interest and income tax | 155.8 | 647.5 | 214.0 | (356.7 | ) | (588.7 | ) | 71.9 | ||||||||||
Interest expense | (156.8 | ) | (714.1 | ) | (85.4 | ) | (283.3 | ) | 944.4 | (295.2 | ) | |||||||
Profit / (loss) before income taxes | (1.0 | ) | (66.6 | ) | 128.6 | (640.0 | ) | 355.7 | (223.3 | ) | ||||||||
Income tax credit/(expense) | 0.3 | (90.9 | ) | (13.6 | ) | 223.7 | (53.7 | ) | 65.8 | |||||||||
Net profit / (loss) from continuing operations | (0.7 | ) | (157.5 | ) | 115.0 | (416.3 | ) | 302.0 | (157.5 | ) | ||||||||
Discontinued operations: | ||||||||||||||||||
Net sales revenue | — | 389.5 | — | 63.4 | — | 452.9 | ||||||||||||
Net expenses | — | (333.8 | ) | — | (59.3 | ) | (2.2 | ) | (395.3 | ) | ||||||||
Net profit / (loss) from subsidiary entities | — | (50.9 | ) | — | — | 50.9 | — | |||||||||||
Income tax credit/(expense) | — | (14.5 | ) | — | (0.7 | ) | — | (15.2 | ) | |||||||||
Profit on disposal of gold operations (net of income tax benefit of $34.4 million) | — | 273.2 | — | (103.2 | ) | — | 170.0 | |||||||||||
Profit on disposal of Three Springs Talc operation (net of income tax benefit of $1.4 million) | — | 20.0 | — | — | — | 20.0 | ||||||||||||
Profit on disposal of equity interest in Mondo Minerals (net of income tax expense of $10.1 million) | — | — | — | 51.1 | — | 51.1 | ||||||||||||
Net profit / (loss) from discontinued operations | — | 283.5 | — | (48.7 | ) | 48.7 | 283.5 | |||||||||||
| Consolidated operations: | ||||||||||||||||||
Net sales revenue | — | 1,604.8 | 1,119.6 | 1,692.1 | (1,599.5 | ) | 2,817.0 | |||||||||||
Cost of goods sold | — | (1,123.3 | ) | (829.4 | ) | (1,592.3 | ) | 1,312.6 | (2,232.4 | ) | ||||||||
Selling and distribution | — | (25.3 | ) | (35.5 | ) | (90.2 | ) | (14.8 | ) | (165.8 | ) | |||||||
General and administrative | — | (152.5 | ) | (58.8 | ) | (26.9 | ) | (14.5 | ) | (252.7 | ) | |||||||
General and administrative—exceptional items | — | (277.1 | ) | (71.8 | ) | (164.2 | ) | — | (513.1 | ) | ||||||||
Exploration and evaluation | — | (40.7 | ) | — | (54.5 | ) | 0.1 | (95.1 | ) | |||||||||
Other expenses | (0.7 | ) | (61.6 | ) | (44.8 | ) | (792.5 | ) | 847.4 | (52.2 | ) | |||||||
Other expenses—exceptional items | — | — | — | — | — | — | ||||||||||||
Net profit / (loss) from subsidiary entities | — | (22.1 | ) | 20.9 | — | 1.2 | — | |||||||||||
Other income | 156.5 | 494.4 | 113.8 | 511.8 | (1,072.5 | ) | 204.0 | |||||||||||
Other income—exceptional items | — | 513.0 | — | 122.2 | — | 635.2 | ||||||||||||
Profit / (loss) before interest and income tax | 155.8 | 909.6 | 214.0 | (394.5 | ) | (540.0 | ) | 344.9 | ||||||||||
Interest expense | (156.8 | ) | (714.1 | ) | (85.4 | ) | (283.3 | ) | 944.4 | (295.2 | ) | |||||||
Profit (loss) before income taxes | (1.0 | ) | 195.5 | 128.6 | (677.8 | ) | 404.4 | 49.7 | ||||||||||
Income tax credit/(expense) | 0.3 | (69.5 | ) | (13.6 | ) | 212.8 | (53.7 | ) | 76.3 | |||||||||
Net profit / (loss) attributable to holding company shareholders | (0.7 | ) | 126.0 | 115.0 | (465.0 | ) | 350.7 | 126.0 | ||||||||||
US GAAP adjustments to income | — | (88.3 | ) | 4.9 | 6.2 | (11.1 | ) | (88.3 | ) | |||||||||
Net profit / (loss) attributable to holding company shareholders in accordance with US GAAP | (0.7 | ) | 37.7 | 119.9 | (458.8 | ) | 339.6 | 37.7 | ||||||||||
F-104
Table of Contents
WMC RESOURCES LTD AND CONTROLLED ENTITIES
NOTES TO THE CONSOLIDATED FINANCIAL STATEMENTS—(Continued)
Supplemental Condensed Consolidating Statement of Financial Position
As at 31 December 2001
| Issuer | Guarantor (Parent) | Guarantor (subsidiaries) | Other subsidiaries | Eliminations and reclassifications | WMC Resources | ||||||||||||
| WMC Finance (USA) Limited | WMC Resources Ltd | WMC (Olympic Dam WMC Fertilizers Pty Ltd | |||||||||||||||
Current Assets | |||||||||||||||||
Cash assets | — | — | — | 124.0 | 0.1 | 124.1 | |||||||||||
Receivables | — | 781.2 | 369.7 | 808.8 | (1,463.7 | ) | 496.0 | ||||||||||
Other financial assets | — | — | — | 20.1 | — | 20.1 | |||||||||||
Inventories | — | 159.8 | 200.7 | 3.2 | 46.5 | 410.2 | |||||||||||
Other | — | 6.8 | 47.9 | 15.9 | 159.9 | 230.5 | |||||||||||
Total Current Assets | — | 947.8 | 618.3 | 972.0 | (1,257.2 | ) | 1,280.9 | ||||||||||
Non-Current Assets | |||||||||||||||||
Receivables | 1,575.9 | 335.7 | 166.0 | 3,536.2 | (5,132.4 | ) | 481.4 | ||||||||||
Intragroup investments | — | 3,200.9 | — | 200.0 | (3,400.9 | ) | — | ||||||||||
Other financial assets | — | 0.1 | — | 18.1 | — | 18.2 | |||||||||||
Inventories | — | 59.5 | 22.7 | 0.2 | — | 82.4 | |||||||||||
Exploration and evaluation | — | 1.9 | — | 62.6 | — | 64.5 | |||||||||||
Property, plant and equipment | — | 1,311.2 | 3,385.6 | 21.5 | 57.0 | 4,775.3 | |||||||||||
Deferred tax assets | — | — | 59.3 | 639.8 | (395.4 | ) | 303.7 | ||||||||||
Other | 7.8 | 12.7 | 9.1 | 145.5 | 1,061.4 | 1,236.5 | |||||||||||
Total Non-Current Assets | 1,583.7 | 4,922.0 | 3,642.7 | 4,623.9 | (7,810.3 | ) | 6,962.0 | ||||||||||
Total Assets | 1,583.7 | 5,869.8 | 4,261.0 | 5,595.9 | (9,067.5 | ) | 8,242.9 | ||||||||||
Current Liabilities | |||||||||||||||||
Payables | 11.7 | 172.5 | 1,914.4 | 586.1 | (1,829.5 | ) | 855.2 | ||||||||||
Interest-bearing liabilities | — | — | — | 584.3 | — | 584.3 | |||||||||||
Current tax liabilities | — | — | — | 8.0 | — | 8.0 | |||||||||||
Provisions | — | 42.7 | 18.6 | 23.4 | (10.0 | ) | 74.7 | ||||||||||
Other | — | 0.5 | — | 16.1 | (1.5 | ) | 15.1 | ||||||||||
Total Current Liabilities | 11.7 | 215.7 | 1,933.0 | 1,217.9 | (1,841.0 | ) | 1,537.3 | ||||||||||
Non-Current Liabilities | |||||||||||||||||
Payables | — | 2,291.8 | 797.9 | 4,901.0 | (6,793.0 | ) | 1,197.7 | ||||||||||
Interest-bearing liabilities | 1,564.3 | — | — | 173.4 | — | 1,737.7 | |||||||||||
Deferred tax liabilities | 2.2 | 79.6 | 314.2 | 1.4 | 37.2 | 434.6 | |||||||||||
Net accumulated losses of subsidiaries in excess of investments | — | — | 96.1 | — | (96.1 | ) | — | ||||||||||
Provisions | — | 72.4 | 19.5 | 4.5 | 0.6 | 97.0 | |||||||||||
Other | — | (10.0 | ) | — | 78.2 | (58.9 | ) | 9.3 | |||||||||
Total Non-Current Liabilities | 1,566.5 | 2,433.8 | 1,227.7 | 5,158.5 | (6,910.2 | ) | 3,476.3 | ||||||||||
Total Liabilities | 1,578.2 | 2,649.5 | 3,160.7 | 6,376.4 | (8,751.2 | ) | 5,013.6 | ||||||||||
Minority shareholders’ interest in subsidiaries | — | — | — | — | 9.0 | 9.0 | |||||||||||
Net Assets | 5.5 | 3,220.3 | 1,100.3 | (780.5 | ) | (325.3 | ) | 3,220.3 | |||||||||
Total Equity | 5.5 | 3,220.3 | 1,100.3 | (780.5 | ) | (325.3 | ) | 3,220.3 | |||||||||
US GAAP adjustments to equity | — | (1,151.5 | ) | (97.7 | ) | (44.1 | ) | 141.8 | (1,151.5 | ) | |||||||
Total equity in accordance with US GAAP | 5.5 | 2,068.8 | 1,002.6 | (824.6 | ) | (183.5 | ) | 2,068.8 | |||||||||
F-105
Table of Contents
WMC RESOURCES LTD AND CONTROLLED ENTITIES
NOTES TO THE CONSOLIDATED FINANCIAL STATEMENTS—(Continued)
Supplemental Condensed Consolidating Statement of Cash flows
For the year ended 31 December 2001
| Issuer | Guarantor (Parent) | Guarantor (subsidiaries) | Other subsidiaries | Eliminations and reclassifications | WMC Resources | |||||||||||||
| WMC Finance (USA) Limited | WMC Resources Ltd | WMC (Olympic Dam WMC Fertilizers Pty Ltd | ||||||||||||||||
Net cash (used in) / provided by operating activities | 1.2 | (197.1 | ) | 87.5 | (431.4 | ) | 1,117.5 | 577.7 | ||||||||||
Cash flows from investing activities: | ||||||||||||||||||
Payments for property, plant and equipment | — | (306.7 | ) | (117.6 | ) | (2.5 | ) | — | (426.8 | ) | ||||||||
Proceeds from sale of St. Ives and Agnew gold operations | — | 432.0 | — | — | — | 432.0 | ||||||||||||
Proceeds from sale of Three Springs Talc operations | — | 56.0 | — | — | — | 56.0 | ||||||||||||
Proceeds from sale of equity interest in Mondo Minerals | — | — | — | 122.2 | — | 122.2 | ||||||||||||
Proceeds from sale of investments | — | — | — | 24.9 | — | 24.9 | ||||||||||||
Proceeds from sale of Non-current assets | — | 56.4 | 5.5 | 2.3 | — | 64.2 | ||||||||||||
Proceeds from insurance claims | — | — | 23.6 | — | — | 23.6 | ||||||||||||
Proceeds from gold hedge close out | — | — | — | — | 21.7 | 21.7 | ||||||||||||
Payments for short term investments | — | — | — | (8.6 | ) | — | (8.6 | ) | ||||||||||
Payments for evaluation expenditure | — | — | — | (4.9 | ) | — | (4.9 | ) | ||||||||||
Payments for purchase of Yakabindie Nickel Pty Ltd | — | (25.2 | ) | — | — | — | (25.2 | ) | ||||||||||
Net increase / (decrease) in loans from related bodies corporate | (1.2 | ) | — | — | 1,140.4 | (1,139.2 | ) | — | ||||||||||
Net cash (used in) / provided by investing activities | (1.2 | ) | 212.5 | (88.5 | ) | 1,273.8 | (1,117.5 | ) | 279.1 | |||||||||
Cash flows from financing activities | ||||||||||||||||||
Deemed equity distribution | — | (15.4 | ) | — | — | — | (15.4 | ) | ||||||||||
Proceeds from borrowings | — | — | — | 277.2 | — | 277.2 | ||||||||||||
Repayments of borrowings | — | — | — | (1,055.5 | ) | — | (1,055.5 | ) | ||||||||||
Net cash (used in) / provided by financing activities | — | (15.4 | ) | — | (778.3 | ) | — | (793.7 | ) | |||||||||
Net (decrease) / increase in cash held | — | — | (1.0 | ) | 64.1 | — | 63.1 | |||||||||||
Cash at the beginning of the financial year | — | — | 1.4 | 57.0 | — | 58.4 | ||||||||||||
Effects of exchange rate changes on foreign currency cash balances | — | — | — | 2.4 | — | 2.4 | ||||||||||||
Cash at end of financial year | — | — | 0.4 | 123.5 | — | 123.9 | ||||||||||||
F-106
Table of Contents
WMC RESOURCES LTD AND CONTROLLED ENTITIES
NOTES TO THE CONSOLIDATED FINANCIAL STATEMENTS—(Continued)
Supplemental Condensed Consolidating Statement of Cash flows (continued)
For the year ended 31 December 2001
| Issuer | Guarantor (Parent) | Guarantor (subsidiaries) | Other subsidiaries | Eliminations and reclassifications | WMC Resources | |||||||||||||
| WMC Finance (USA) Limited | WMC Resources Ltd | WMC (Olympic Dam WMC Fertilizers Pty Ltd | ||||||||||||||||
US GAAP reconciliation of Cash flows: | ||||||||||||||||||
Cash flows from financing activities as reported | — | (15.4 | ) | — | (778.3 | ) | — | (793.7 | ) | |||||||||
Changes in bank overdrafts (net) | — | (2.3 | ) | — | (1.4 | ) | — | (3.7 | ) | |||||||||
Net cash (used in) / provided by financing activities—US GAAP | — | (17.7 | ) | — | (779.7 | ) | — | (797.4 | ) | |||||||||
Cash flows from operating activities as reported | 1.2 | (197.1 | ) | 87.5 | (431.4 | ) | 1,117.5 | 577.7 | ||||||||||
US GAAP adjustment to cash flows | — | (104.0 | ) | — | (1.8 | ) | — | (105.8 | ) | |||||||||
Net cash (used in) / provided by operating activities—US GAAP | 1.2 | (301.1 | ) | 87.5 | (433.2 | ) | 1,117.5 | 471.9 | ||||||||||
Cash flows from investing activities as reported | (1.2 | ) | 212.5 | (88.5 | ) | 1,273.8 | (1,117.5 | ) | 279.1 | |||||||||
US GAAP adjustments to cash flows | — | 104.0 | — | 1.8 | — | 105.8 | ||||||||||||
Net cash (used in) / provided by investing activities—US GAAP | (1.2 | ) | 316.5 | (88.5 | ) | 1,275.6 | (1,117.5 | ) | 384.9 | |||||||||
Net (decrease) / increase in cash and cash equivalents | — | (2.3 | ) | (1.0 | ) | 62.7 | — | 59.4 | ||||||||||
Cash and cash equivalents at the beginning of the year | — | 2.3 | 1.4 | 58.6 | — | 62.3 | ||||||||||||
Effects of exchange rate changes on foreign currency cash balances and on cash flows during the period | — | — | — | 2.4 | — | 2.4 | ||||||||||||
Cash and cash equivalents at the end of the year | — | — | 0.4 | 123.7 | — | 124.1 | ||||||||||||
F-107
Table of Contents
WMC RESOURCES LTD AND CONTROLLED ENTITIES
NOTES TO THE CONSOLIDATED FINANCIAL STATEMENTS—(Continued)
Supplemental Condensed Consolidating Statement of Financial Performance
For the year ended 31 December 2000
| Issuer | Guarantor (Parent) | Guarantor (subsidiaries) | Other subsidiaries | Eliminations and reclassifications | WMC Resources | |||||||||||||
| WMC Finance (USA) Limited | WMC Resources Ltd | WMC (Olympic Dam WMC Fertilizers Pty Ltd | ||||||||||||||||
Continuing operations: | ||||||||||||||||||
Net sales revenue | — | 1,709.2 | 967.0 | 2,079.9 | (2,090.1 | ) | 2,666.0 | |||||||||||
Cost of goods sold | — | (821.6 | ) | (704.8 | ) | (1,983.9 | ) | 1,838.3 | (1,672.0 | ) | ||||||||
Selling and distribution | — | (21.9 | ) | (20.1 | ) | (89.8 | ) | (15.6 | ) | (147.4 | ) | |||||||
General and administrative | — | (86.1 | ) | (61.0 | ) | (19.3 | ) | (25.9 | ) | (192.3 | ) | |||||||
General and administrative—exceptional items | — | (17.8 | ) | — | — | — | (17.8 | ) | ||||||||||
Exploration and evaluation | — | (21.1 | ) | — | (35.2 | ) | (4.5 | ) | (60.8 | ) | ||||||||
Other expenses | (1.4 | ) | (74.0 | ) | (35.7 | ) | (1,440.5 | ) | 1,479.7 | (71.9 | ) | |||||||
Other expenses—exceptional items | — | — | — | — | — | — | ||||||||||||
Net profit / (loss) from subsidiary entities | — | (12.8 | ) | 5.7 | — | 7.1 | — | |||||||||||
Other income | 151.8 | 451.8 | 118.1 | 454.9 | (935.9 | ) | 240.7 | |||||||||||
Other income—exceptional items | — | 38.0 | — | — | — | 38.0 | ||||||||||||
Profit / (loss) before interest and income tax | 150.4 | 1,143.7 | 269.2 | (1,033.9 | ) | 253.1 | 782.5 | |||||||||||
Interest expense | (151.2 | ) | (668.9 | ) | (61.3 | ) | (252.2 | ) | 833.2 | (300.4 | ) | |||||||
Profit / (loss) before income taxes | (0.8 | ) | 474.8 | 207.9 | (1,286.1 | ) | 1,086.3 | 482.1 | ||||||||||
Income tax credit/(expense) | 0.6 | (147.6 | ) | (60.2 | ) | 358.6 | (306.3 | ) | (154.9 | ) | ||||||||
Net profit / (loss) from continuing operations | (0.2 | ) | 327.2 | 147.7 | (927.5 | ) | 780.0 | 327.2 | ||||||||||
Discontinued operations: | ||||||||||||||||||
Net sales revenue | — | 364.7 | — | 61.3 | — | 426.0 | ||||||||||||
Net expenses | — | (284.8 | ) | — | (51.5 | ) | (3.2 | ) | (339.5 | ) | ||||||||
Net profit/(loss) from subsidiary entities | — | 3.5 | — | — | (3.5 | ) | — | |||||||||||
Income tax credit/(expense) | — | (10.7 | ) | — | (3.1 | ) | — | (13.8 | ) | |||||||||
Net profit / (loss) from discontinued operations | — | 72.7 | — | 6.7 | (6.7 | ) | 72.7 | |||||||||||
Consolidated operations: | ||||||||||||||||||
Net sales revenue | — | 2,073.9 | 967.0 | 2,141.2 | (2,090.1 | ) | 3,092.0 | |||||||||||
Cost of goods sold | — | (1,058.4 | ) | (704.8 | ) | (2,028.6 | ) | 1,838.3 | (1,953.5 | ) | ||||||||
Selling and distribution | — | (21.9 | ) | (20.1 | ) | (92.3 | ) | (15.6 | ) | (149.9 | ) | |||||||
General and administrative | — | (110.0 | ) | (61.0 | ) | (20.9 | ) | (25.9 | ) | (217.8 | ) | |||||||
General and administrative—exceptional items | — | (17.8 | ) | — | — | — | (17.8 | ) | ||||||||||
Exploration and evaluation | — | (36.5 | ) | — | (38.8 | ) | (4.5 | ) | (79.8 | ) | ||||||||
Other expenses | (1.4 | ) | (82.8 | ) | (35.7 | ) | (1,440.5 | ) | 1,476.5 | (83.9 | ) | |||||||
Other expenses—exceptional items | — | — | — | — | — | — | ||||||||||||
Net profit / (loss) from subsidiary entities | — | (9.3 | ) | 5.7 | — | 3.6 | — | |||||||||||
Other income | 151.8 | 451.9 | 118.1 | 455.8 | (935.9 | ) | 241.7 | |||||||||||
Other income—exceptional items | — | 38.0 | — | — | — | 38.0 | ||||||||||||
Profit / (loss) before interest and income tax | 150.4 | 1,227.1 | 269.2 | (1,024.1 | ) | 246.4 | 869.0 | |||||||||||
Interest expense | (151.2 | ) | (668.9 | ) | (61.3 | ) | (252.2 | ) | 833.2 | (300.4 | ) | |||||||
Profit / (loss) before income taxes | (0.8 | ) | 558.2 | 207.9 | (1,276.3 | ) | 1,079.6 | 568.6 | ||||||||||
Income tax credit/(expense) | 0.6 | (158.3 | ) | (60.2 | ) | 355.5 | (306.3 | ) | (168.7 | ) | ||||||||
Net profit / (loss) attributable to holding company shareholders | (0.2 | ) | 399.9 | 147.7 | (920.8 | ) | 773.3 | 399.9 | ||||||||||
US GAAP adjustments to income | — | (92.3 | ) | (49.0 | ) | (21.3 | ) | 70.3 | (92.3 | ) | ||||||||
Net profit / (loss) attributable to holding company shareholders in accordance with US GAAP | (0.2 | ) | 307.6 | 98.7 | (942.1 | ) | 843.6 | 307.6 | ||||||||||
F-108
Table of Contents
WMC RESOURCES LTD AND CONTROLLED ENTITIES
NOTES TO THE CONSOLIDATED FINANCIAL STATEMENTS—(Continued)
Supplemental Condensed Consolidating Statement of Cash flows
For the year ended 31 December 2000
| Issuer | Guarantor (Parent) | Guarantor (subsidiaries) | Other subsidiaries | Eliminations and reclassifications | WMC Resources | |||||||||||||
| WMC Finance (USA) Limited | WMC Resources Ltd | WMC (Olympic Dam WMC Fertilizers Pty Ltd | ||||||||||||||||
Net cash (used in) / provided by operating activities | 0.9 | 752.6 | 126.2 | (307.8 | ) | 326.2 | 898.1 | |||||||||||
Cash flows from investing | ||||||||||||||||||
Payments for property, | — | (284.3 | ) | (151.2 | ) | (0.5 | ) | — | (436.0 | ) | ||||||||
Proceeds from sale of | — | — | — | 5.5 | — | 5.5 | ||||||||||||
Proceeds from sale of | — | 3.2 | 8.0 | 21.3 | — | 32.5 | ||||||||||||
Proceeds from insurance | — | — | 17.1 | — | — | 17.1 | ||||||||||||
Payments for short term investments | — | — | — | (1.0 | ) | — | (1.0 | ) | ||||||||||
Payments for Research and development | — | (0.3 | ) | — | — | — | (0.3 | ) | ||||||||||
Payments for evaluation expenditure | — | — | — | (8.5 | ) | — | (8.5 | ) | ||||||||||
Net increase / (decrease) | (0.9 | ) | — | — | 189.5 | (188.6 | ) | — | ||||||||||
Payments for option to | — | — | — | (28.6 | ) | — | (28.6 | ) | ||||||||||
Net cash (used in) / provided by investing activities | (0.9 | ) | (281.4 | ) | (126.1 | ) | 177.7 | (188.6 | ) | (419.3 | ) | |||||||
Cash flows from financing | ||||||||||||||||||
Deemed equity distribution | — | (471.2 | ) | — | — | — | (471.2 | ) | ||||||||||
Proceeds from borrowings | — | — | — | 882.6 | (137.6 | ) | 745.0 | |||||||||||
Repayments of borrowings | — | — | — | (782.7 | ) | — | (782.7 | ) | ||||||||||
Net cash (used in) / provided by financing activities | — | (471.2 | ) | — | 99.9 | (137.6 | ) | (508.9 | ) | |||||||||
Net (decrease) / increase in cash | — | — | 0.1 | (30.2 | ) | — | (30.1 | ) | ||||||||||
Cash at the beginning of the financial year | — | — | 1.3 | 74.5 | — | 75.8 | ||||||||||||
Effects of exchange rate | — | — | — | 12.7 | — | 12.7 | ||||||||||||
Cash at end of financial year | — | — | 1.4 | 57.0 | — | 58.4 | ||||||||||||
F-109
Table of Contents
WMC RESOURCES LTD AND CONTROLLED ENTITIES
NOTES TO THE CONSOLIDATED FINANCIAL STATEMENTS—(Continued)
Supplemental Condensed Consolidating Statement of Cash flows (continued)
For the year ended 31 December 2000
| Issuer | Guarantor (Parent) | Guarantor (subsidiaries) | Other subsidiaries | Eliminations and reclassifications | WMC Resources | |||||||||||||
| WMC Finance (USA) Limited | WMC Resources Ltd | WMC (Olympic Dam WMC Fertilizers Pty Ltd | ||||||||||||||||
US GAAP reconciliation of Cash flows: | ||||||||||||||||||
Cash flows from financing activities as reported | — | (471.2 | ) | — | 99.9 | (137.6 | ) | (508.9 | ) | |||||||||
Changes in bank overdrafts (net) | — | 2.3 | — | 0.8 | — | 3.1 | ||||||||||||
Net cash (used in) / provided by financing activities—US GAAP | — | (468.9 | ) | — | 100.7 | (137.6 | ) | (505.8 | ) | |||||||||
Cash flows from operating activities as reported | 0.9 | 752.6 | 126.2 | (307.8 | ) | 326.2 | 898.1 | |||||||||||
US GAAP adjustment to cash flows | — | (72.5 | ) | (52.4 | ) | (35.2 | ) | — | (160.1 | ) | ||||||||
Net cash (used in) / provided by operating activities—US GAAP | 0.9 | 680.1 | 73.8 | (343.0 | ) | 326.2 | 738.0 | |||||||||||
Cash flows from investing activities as reported | (0.9 | ) | (281.4 | ) | (126.1 | ) | 177.7 | (188.6 | ) | (419.3 | ) | |||||||
US GAAP adjustments to cash flows | — | 72.5 | 52.4 | 35.2 | — | 160.1 | ||||||||||||
Net cash (used in) / provided by investing activities—US GAAP | (0.9 | ) | (208.9 | ) | (73.7 | ) | 212.9 | (188.6 | ) | (259.2 | ) | |||||||
Net (decrease) / increase in cash and cash equivalents | — | 2.3 | 0.1 | (29.4 | ) | — | (27.0 | ) | ||||||||||
Cash and cash equivalents at the beginning of the year | — | — | 1.3 | 75.3 | — | 76.6 | ||||||||||||
Effects of exchange rate changes on foreign currency cash balances and on cash flows during the period | — | — | — | 12.7 | — | 12.7 | ||||||||||||
Cash and cash equivalents at the end of the year | — | 2.3 | 1.4 | 58.6 | — | 62.3 | ||||||||||||
F-110
Table of Contents
WMC RESOURCES LTD AND CONTROLLED ENTITIES
NOTES TO THE CONSOLIDATED FINANCIAL STATEMENTS—(Continued)
48. Valuation and Qualifying Accounts
Description | Balance at beginning of year A$m | Additions charged to costs and expenses A$m | Charged to other accounts A$m | Deductions A$m | Balance at end of year A$m | |||||||
| Year ended 31 December, 2002 | ||||||||||||
Future income tax benefit valuation allowance | 201.4 | 380.0 | (a) | — | — | 581.4 | ||||||
Provision for doubtful debts | 7.4 | — | — | (1.1 | ) | 6.3 | ||||||
Provision for obsolescence and loss | 13.7 | 6.1 | — | (2.7 | ) | 17.1 | ||||||
Provision for diminution in value of investment | — | — | — | — | — | |||||||
| 222.5 | 386.1 | — | (3.8 | ) | 604.8 | |||||||
| Year ended 31 December, 2001 | ||||||||||||
Future income tax benefit valuation allowance | 182.1 | 19.3 | (a) | — | — | 201.4 | ||||||
Provision for doubtful debts | 8.7 | — | — | (1.3 | ) | 7.4 | ||||||
Provision for obsolescence and loss | 12.0 | 4.0 | — | (2.3 | ) | 13.7 | ||||||
Provision for diminution in value of investment | 0.1 | — | — | (0.1 | ) | ��� | ||||||
| 202.9 | 23.3 | — | (3.7 | ) | 222.5 | |||||||
| Year ended 31 December, 2000 | ||||||||||||
Future income tax benefit valuation allowance | 149.5 | 32.6 | (a) | — | — | 182.1 | ||||||
Provision for doubtful debts | 6.9 | 1.8 | — | — | 8.7 | |||||||
Provision for obsolescence and loss | 8.3 | 3.8 | — | (0.1 | ) | 12.0 | ||||||
Provision for diminution in value of investment | 0.1 | — | — | — | 0.1 | |||||||
| 164.8 | 38.2 | — | (0.1 | ) | 202.9 | |||||||
| (a) | Charged/(Credited) to income tax expense |
F-111
Table of Contents
WMC RESOURCES LTD
(Australian Business Number 76 004 184 598)
AND CONTROLLED ENTITIES
UNAUDITED PRO FORMA CONSOLIDATED FINANCIAL STATEMENTS
FOR THE YEAR ENDED 31 DECEMBER 2002
Prepared in accordance
with Australian generally accepted
accounting principles (Australian GAAP)
except where noted
Amounts are stated in Australian dollars (A$) except where noted
Table of Contents
WMC RESOURCES LTD AND CONTROLLED ENTITIES
UNAUDITED PRO FORMA CONSOLIDATED FINANCIAL STATEMENTS
FOR THE YEAR ENDED 31 DECEMBER 2002
CONTENTS PAGE
CONSOLIDATED STATEMENT OF INCOME FOR 2002 | P-4 | |
EARNINGS RECONCILIATION TO US GAAP FOR 2002 | P-5 | |
1. BASIS OF PRESENTATION | P-6 | |
2. REORGANIZATION AND DEMERGER | P-6 | |
3. PRO FORMA ADJUSTMENTS | P-6 | |
4. RECONCILIATIONS IN ACCORDANCE WITH US GAAP | P-7 | |
P-2
Table of Contents
WMC RESOURCES LTD AND CONTROLLED ENTITIES
UNAUDITED PRO FORMA CONSOLIDATED FINANCIAL STATEMENTS
FOR THE YEAR ENDED 31 DECEMBER 2002
The unaudited pro forma consolidated financial statements are primarily derived from the historical audited consolidated financial statements of WMC Resources Ltd for the fiscal year ended 31 December 2002. The unaudited pro forma consolidated statement of income for the year ended 31 December 2002 gives pro forma effect to the demerger which includes the internal reorganization and court-approved Scheme of Arrangement through a capital reduction and dividend distribution as if the demerger had occurred on 1 January 2002. As part of the Scheme of Arrangement, WMC Resources Ltd (“WMC Resources”) acquired from WMC Limited the shares it holds in the legal entities controlling the Fertilizers and Olympic Dam mining operations in return for the issue of WMC Resources shares. In addition, certain other non-AWAC entities including WMC Finance Limited and WMC Limited’s exploration activities were transferred to WMC Resources. Under Australian GAAP, the transfers are accounted for at fair value. Under US GAAP, the transfers are accounted for at book value.
The unaudited pro forma financial information is presented for illustrative purposes only and does not purport to represent what the actual financial performance of WMC Resources Ltd would have been if the demerger had occurred at an earlier date. The pro forma adjustments are based upon currently available information and estimates and assumptions. No pro forma adjustments are made in the unaudited pro forma consolidated statement of income for non-recurring items which will not have a continuing impact on the results of the operations such as demerger costs. Actual adjustments may differ from the pro forma adjustments, and therefore the future operating results of WMC Resources Ltd may differ materially from the unaudited pro forma information.
These unaudited pro forma consolidated financial statements should be read in connection with, and are qualified by reference to, the historical consolidated financial statements and “Operating Review and Financial Prospects” located in this Annual report. For a discussion of the principal differences between generally accepted accounting principles in Australia (“Australian GAAP”) and the United States (“US GAAP”), and reconciliation to US GAAP net income and shareholders’ equity, see note 45 to the “Consolidated Financial Statements of WMC Resources for the fiscal years ended 31 December 2002, 2001, and 2000”.
P-3
Table of Contents
WMC RESOURCES LTD AND CONTROLLED ENTITIES
UNAUDITED PRO FORMA CONSOLIDATED STATEMENT OF INCOME
FOR THE YEAR ENDED 31 DECEMBER 2002
Note Ref | As reported WMC | Pro forma Adjustments | Pro forma WMC | ||||||||
| A$ million (except per share amounts) | |||||||||||
Net sales revenue | 2,487.2 | — | 2,487.2 | ||||||||
Cost of goods sold | 3(a) | (1,840.8 | ) | (6.0 | ) | (1,846.8 | ) | ||||
Selling and distribution | (157.3 | ) | — | (157.3 | ) | ||||||
General and administrative | (312.4 | ) | — | (312.4 | ) | ||||||
General and administrative—exceptional items | (51.2 | ) | — | (51.2 | ) | ||||||
| 125.5 | (6.0 | ) | 119.5 | ||||||||
Exploration and evaluation | (37.0 | ) | — | (37.0 | ) | ||||||
Other expenses | (149.0 | ) | — | (149.0 | ) | ||||||
Other expenses—exceptional items | (99.7 | ) | — | (99.7 | ) | ||||||
Other income | 67.9 | — | 67.9 | ||||||||
Other income—exceptional items | 209.9 | — | 209.9 | ||||||||
Income/(Loss) before interest and income tax | 117.6 | (6.0 | ) | 111.6 | |||||||
Interest expense | 3(b) | (152.2 | ) | 24.3 | (127.9 | ) | |||||
(Loss)/income before income tax | (34.6 | ) | 18.3 | (16.3 | ) | ||||||
Income tax credit / (expense) | 3(d) | 19.9 | (7.3 | ) | 12.6 | ||||||
Net (Loss)/Income from continuing operations | (14.7 | ) | 11.0 | (3.7 | ) | ||||||
Pro forma basic and diluted earnings per share from continuing operations—cents | 3(e) | (1.3 | ) | 1.0 | (0.3 | ) | |||||
Pro forma basic number of shares outstanding | 3(e) | 1,115,784,278 | — | 1,115,784,278 | |||||||
Pro forma diluted number of shares outstanding | 3(e) | 1,127,341,817 | — | 1,127,341,817 | |||||||
| (1) | Reported WMC Resources Ltd Consolidated Statements of Income as disclosed in the consolidated financial statements. |
The above unaudited pro forma consolidated statement of income should be read in conjunction with the accompanying notes.
P-4
Table of Contents
WMC RESOURCES LTD AND CONTROLLED ENTITIES
UNAUDITED RECONCILIATION OF AUSTRALIAN GAAP PRO FORMA EARNINGS FROM CONTINUING OPERATIONS TO US GAAP FOR THE YEAR ENDED 31 DECEMBER 2002
Note Ref | Year ended 31 December 2002 | ||||
A$ million (except per share amounts) | |||||
Pro forma loss from continuing operations in accordance with Australian GAAP | (3.7 | ) | |||
Adjustments required to conform with US GAAP: | |||||
—Research and development costs | 0.2 | ||||
—Pension funds | 0.5 | ||||
—Exploration expenditure capitalized | 2.5 | ||||
—Start up costs | |||||
—amortization written back | 6.6 | ||||
—Option payment capitalized | |||||
—amortization written back | 11.4 | ||||
—Fair value of accounting for derivatives | 128.6 | ||||
—Lease commitments | 7.7 | ||||
—Transitional adjustment on adoption of new policy for amortization of mine development and post-production waste removal costs: | |||||
—current year | (4.6 | ) | |||
—Transfers of net assets and exchanges of shares between entities under common control | |||||
—Copper-uranium acquired mineral rights | 2.2 | ||||
—Fertilizer assets fair value adjustment | (1.1 | ) | |||
—Repurchase of Yankee Bonds | (143.7 | ) | |||
—Stamp duty | (24.0 | ) | |||
—Other fair value adjustments | (9.0 | ) | |||
—Revenue from insurance proceeds | (58.2 | ) | |||
—Income tax effect of above | (25.7 | ) | |||
Total adjustments | (106.6 | ) | |||
Pro forma adjustments required to conform with US GAAP: | |||||
—Copper-uranium acquired mineral rights | 4(a) | 23.2 | |||
—Fertilizer assets fair value adjustment | 4(a) | (17.2 | ) | ||
| 6.0 | |||||
Pro forma net income in accordance with US GAAP | (104.3 | ) | |||
Pro forma basic and diluted earnings per share from continuing operations in accordance with US GAAP—cents | 3(e) | (9.3 | ) | ||
Pro forma basic number of shares outstanding | 3(e) | 1,115,784,278 | |||
Pro forma diluted number of shares outstanding | 3(e) | 1,127,341,817 |
The above unaudited reconciliation of Australian GAAP pro forma earnings to US GAAP should be read in conjunction with the accompanying notes.
P-5
Table of Contents
WMC RESOURCES LTD AND CONTROLLED ENTITIES
NOTES TO THE UNAUDITED PRO FORMA CONSOLIDATED FINANCIAL STATEMENTS
FOR THE YEAR ENDED 31 DECEMBER 2002
| 1. | Basis of presentation |
The unaudited pro forma consolidated financial statements have been prepared in accordance with Australian GAAP and are presented in Australian dollars. Australian GAAP differs in some respects from US GAAP, as they relate to WMC Resources Ltd. For a description of the differences between Australian GAAP and US GAAP and the related effect on the unaudited pro forma financial statements, see Notes 3 and 4 below.
| 2. | Reorganization and demerger |
Pursuant to the demerger, WMC Resources Ltd acquired WMC Limited’s copper/uranium and fertilizer businesses, WMC Finance Limited and WMC Finance (USA) Limited, as well as WMC Limited’s international exploration assets and business other than those relating to AWAC. The effect of the demerger was that eligible WMC Limited shareholders received one WMC Resources Ltd share for each WMC Limited share they held. WMC Resources Ltd has prepared separate unaudited pro forma financial statements which give pro forma effect to the demerger and certain other pro forma adjustments. The WMC Resources Ltd unaudited pro forma financial statements reflect the historical financial statements of WMC Resources adjusted to give pro forma effect to the acquisition of WMC Limited’s copper/uranium and fertilizer businesses, WMC Finance Limited and WMC Finance (USA) Limited, as well as WMC Limited’s international exploration assets and business other than those relating to AWAC and certain other pro forma adjustments as more fully described under Note 3 below, as if the demerger had occurred on 31 December 2001.
| 3. | WMC Resources Ltd unaudited pro forma adjustments |
(a) Property, plant and equipment and acquired mineral rights amortization and depreciation
Under Australian GAAP, the acquisition by WMC Resources Ltd of WMC Limited’s copper/uranium and fertilizer businesses, WMC Finance Limited and WMC Finance (USA) Limited, as well as WMC Limited’s international exploration assets and business other than those relating to AWAC prior to the demerger resulted in the assets and liabilities being transferred at fair value on the date of transfer. The fair values of the net assets of the operations transferred were calculated using discounted cash flow models. The unaudited pro forma consolidated statement of income includes an adjustment for the difference in depreciation and amortization expense resulting from the differing carrying value of property, plant and equipment, and acquired mineral rights under US GAAP, as if the changes in carrying value had been recorded as at 31 December 2001.
(b) Current and long-term debt and borrowing costs
In conjunction with the scheme of arrangement, WMC Resources Ltd has obtained new credit facilities to replace the debt borrowings under WMC Limited’s credit facilities. The unaudited pro forma consolidated statement of income includes an adjustment to reflect the reduced interest expense under the new debt balance for the full fiscal year. The adjustment reflects the $600 million which was injected by Alumina Limited in accordance with the demerger agreement for WMC Resources Ltd to repay debt, net of cash of $23 million which was allocated to the Alumina Limited group to fund the payment of Alumina Limited’s share of AWAC’s acquisition of Reynold Metal Company’s 5% interest in MRN and 6% interest in Halco.
No adjustment was made to reflect the impact of the debt refinancing effected in May 2003 through the 144A offering memorandum. A change of 1/8% in interest rates under the facilities would result in additional interest expense of $0.72 million for the year ending 31 December 2002.
P-6
Table of Contents
WMC RESOURCES LTD AND CONTROLLED ENTITIES
NOTES TO THE UNAUDITED PRO FORMA CONSOLIDATED FINANCIAL STATEMENTS
(c) Derivatives and hedging
Consistent with (a) above, the transfers of WMC Finance Limited and WMC Finance (USA) Limited prior to the demerger resulted in the accounting for the derivative financial instruments transferred at fair value on the date of transfer.
Under Australian GAAP, hedging and financial instruments are recognized at their fair values based on the mark to market commodity prices and exchange rates current on the date of the demerger. As a consequence, future Australian GAAP earnings will only be impacted by subsequent movements between these prices and exchange rates and the prices and exchange rates when they mature, rather than by movements between rates when the contracts were taken out and when they have matured.
No pro forma adjustment has been made to reflect the earnings impact of recognizing hedging and financial instruments at their fair value as if the demerger had occurred on 31 December 2001.
(d) Income tax (expense)/credit
The unaudited pro forma consolidated statement of income includes an adjustment to the income tax (expense)/credit in relation to the decreased interest expense under the new debt balance (see Note b above). The adjustment has been calculated at the statutory tax rate in effect during the period presented of 30%. There is no tax effect applicable to the additional depreciation and amortization expense discussed at 3(a) as these amounts are not deductible for tax purposes.
(e) Pro forma earnings per share and weighted average shares outstanding
Pursuant to the demerger, each WMC shareholder received one share in WMC Resources for every share of WMC Limited. Accordingly, the one for one exchange did not have an impact on the calculation of the pro forma weighted average number of shares outstanding.
Pursuant to the Option Offer, WMC Resources offered those employees who were WMC option holders, for each option held at the Option record date, one WMC Resources option and one Alumina SAP option. The replacement options are on identical maturity terms with the strike price split between Alumina Limited and WMC Resources Ltd. Accordingly, the issuance of the new options to replace the previously existing options exercised does not have an impact on the calculation of the pro forma diluted weighted average number of shares outstanding.
| 4. | WMC Resources reconciliation to unaudited pro forma earnings from continuing operations in accordance with US GAAP |
Under US GAAP, the demerger is similar to a pro-rata distribution of stock to shareholders and therefore the internal transfers of assets and liabilities made to effect the reorganization and demerger was accounted for at historical cost.
For an analysis of the US GAAP adjustments included in the historical WMC Resources financial statements, see Note 45 to the “Consolidated Financial Statements of WMC Resources for the Fiscal Years Ended 31 December 2002, 2001 and 2000”. Adjustments to determine unaudited pro forma earnings from
P-7
Table of Contents
WMC RESOURCES LTD AND CONTROLLED ENTITIES
NOTES TO THE UNAUDITED PRO FORMA CONSOLIDATED FINANCIAL STATEMENTS
continuing operations and unaudited pro forma shareholders’ equity in accordance with US GAAP arising in the pro forma financial statements are as follows:
(a) Property, plant and equipment and acquired mineral rights amortization and depreciation
Under US GAAP, transfers of assets and liabilities between and among subsidiaries under common control are accounted for at book value. The reconciliation includes an adjustment to reverse the difference in depreciation and amortization expense resulting from the differing carrying value of property, plant and equipment and acquired mineral rights recognized under Australian GAAP.
(b) Derivatives and Hedging
No pro forma adjustment has been made to reflect the earnings impact of recognizing hedging and financial instruments at their fair value as if the demerger had occurred on 1 January 2002. Refer discussion in note 3 (c).
P-8
Table of Contents
WMC Finance (USA) Limited
US$500,000,000 5.125% Guaranteed Notes due 2013
US$200,000,000 6.250% Guaranteed Notes due 2033
Fully and unconditionally guaranteed by
WMC Resources Ltd
WMC (Olympic Dam Corporation) Pty Ltd
WMC Fertilizers Pty Ltd

PROSPECTUS
June 26, 2003
All tendered old notes, executed letters of transmittal and other related documents should be directed to the exchange agent at the numbers and address below. Requests for assistance and for additional copies of the prospectus, the letter of transmittal and other related documents should also be directed to the exchange agent.
The exchange agent for the exchange offers is:
THE BANK OF NEW YORK
By Facsimile for Eligible Institutions:
(212) 298-1915
Attention: Mr. Santino Ginocchietti
Confirm by telephone:
(212) 815-6331
By Mail/Overnight Courier/Hand:
The Bank of New York
Corporate Trust Operation’s Reorganization Unit
101 Barclay Street – 7 East
New York, New York 10286
Attention: Mr. Santino Ginocchietti