
SECURITIES AND EXCHANGE COMMISSION
WASHINGTON, DC 20549
FORM 20-F
(Mark One)
REGISTRATION STATEMENT PURSUANT TO SECTION 12(b)
OR (g) OF THE SECURITIES EXCHANGE ACT OF 1934
OR
| x | | ANNUAL REPORT PURSUANT TO SECTION 13 OR 15(d) OF THE SECURITIES EXCHANGE ACT OF 1934 |
FOR THE FISCAL YEAR ENDED DECEMBER 31, 2003
OR
| ¨ | | TRANSITION REPORT PURSUANT TO SECTION 13 OR 15(d) OF THE SECURITIES EXCHANGE ACT OF 1934 |
Commission file number: 1-31554
WMC RESOURCES LTD
Australian Business Number 76 004 184 598
(Exact name of Registrant as specified in its charter)
COMMONWEALTH OF AUSTRALIA
(Jurisdiction of incorporation or organization)
Level 16, IBM Centre, 60 City Road, Southbank, Victoria 3006, Australia
(Address of principal executive offices)
Securities registered or to be registered pursuant to Section 12(b) of the Act.
| | |
Title of each Class
| | Name of each exchange on which registered
|
Ordinary Shares(1) | | New York Stock Exchange |
American Depositary Shares(2) | | New York Stock Exchange |
Securities registered or to be registered pursuant to Section 12(g) of the Act.
None
Securities for which there is a reporting obligation pursuant to Section 15(d) of the Act.
None
Indicate the number of outstanding shares of each of the issuer’s classes of capital or common stock as of the close of the period covered by the Annual Report.
| | |
Shares outstanding: | | |
Fully Paid Ordinary Shares: | | 1,150,070,945 |
Indicate by check mark whether the registrant (1) has filed all reports required to be filed by Section 13 or 15(d) of the Securities Exchange Act of 1934 during the preceding 12 months (or for such shorter period that the registrant was required to file such reports), and (2) has been subject to such filing requirements for the past 90 days. Yes: x No ¨
Indicate by check mark which financial statement item the registrant has elected to follow.
| (1) | | Not for trading but only in connection with the listing of the American Depositary Shares. |
| (2) | | Evidenced by American Depositary Receipts, each American Depositary Share representing four fully paid Ordinary Shares. |
CONTENTS
In this Annual Report, the terms “we”, “our”, “us”, “WMC Resources” and “WMC Resources Group” refer to WMC Resources Ltd together with its subsidiaries.
THE DEMERGER
On December 11, 2002, Alumina Limited (formerly known as WMC Limited) demerged its interest in the Alcoa World Alumina and Chemicals venture from its copper/uranium, nickel and fertilizer businesses and exploration and development interests. The demerger was effected through an Australian court-approved scheme of arrangement and associated capital reduction and dividend distribution. As a result of the demerger, Alumina Limited continues to hold its interest in AWAC, and WMC Resources now holds the nickel, copper/uranium and fertilizer businesses and exploration and development interests previously held within the WMC Limited group.
We were admitted to the official list of the Australian Stock Exchange and our shares are quoted on the stock market conducted by the Australian Stock Exchange. Our shares are also listed on the New York Stock Exchange in the form of American Depositary Receipts, or ADRs.
FORWARD-LOOKING STATEMENTS
This Annual Report contains forward-looking statements, including statements regarding (i) estimated reserves, (ii) certain plans, strategies and objectives of management, (iii) scheduled closure of certain operations or facilities, (iv) scheduled refurbishment, repair, maintenance, reconstruction and recommissioning activities, (v) anticipated production or construction commencement dates, (vi) expected costs or production output, (vii) the anticipated productive lives of projects and mines and (viii) the anticipated prices and market dynamics of commodities produced. These forward-looking statements are not guarantees of future performance and involve known and unknown risks, uncertainties and other factors, many of which are beyond our control, which may cause actual results to differ materially from those expressed in the statements contained in this Annual Report.
For example, future revenues from operations, projects or mines described in this Annual Report will be based in part on the market price of the minerals or metals produced, which may vary significantly from current levels. These variations, if materially adverse, may impact the timing or feasibility of the development of a particular project or the expansion of certain facilities or mines. Other factors that may affect the actual construction or production commencement dates, costs or production output and anticipated lives of operations, mines or facilities include:
| | • | | our ability to profitably produce and transport the minerals or metals extracted to applicable markets; |
| | • | | the impact of foreign currency exchange rates on the market prices of the minerals or metals we produce; and |
| | • | | activities of governmental authorities in certain countries where our projects, facilities or mines are being explored or developed, including increases in taxes, changes in environmental and other regulations, and political uncertainty. |
We can give no assurances that the estimated reserve figures, the scheduled closure of such operations or facilities, actual production or commencement dates, cost or production output, or anticipated lives of the projects, mines and facilities discussed herein will not differ materially from the statements contained in this Annual Report.
3
DEFINITIONS
“ADR” means an American Depositary Receipt evidencing one or more ADSs.
“ADS” means an American Depositary Share.
“ASX” means the Australian Stock Exchange.
“AWAC” means Alcoa World Alumina and Chemicals.
“Cash Flow Hedge” means a contract which hedges an exposure to changes in cash flows from an expected future transaction related to a forecast purchase or sale or an existing asset or liability.
“Combined Financial Statements” are the financial statements of WMC Limited when they incorporated both Alumina Limited and WMC Resources Ltd, prior to demerger.
“Commissioned” means the bringing into operation of plant and/or equipment at a rate approximating its design capacity.
“Consolidated” means the consolidation of entities controlled by us. Unincorporated joint ventures are consolidated on a proportionate basis.
“Counterparty Credit Risk” means the risk of financial loss arising out of holding a particular contract or portfolio of contracts as a result of one or more parties to the relevant contract(s) failing to fulfill its financial obligations under the contract.
“Cross-Currency Swap” means the exchange of cash flows in one currency for those in another, often requiring an exchange of principal.
“Currency Forward” means an agreement to exchange a specified amount of one currency for another at a future date at a certain rate.
“DAP” means di-ammonium phosphate.
“Decline” means a downwards sloping tunnel providing road access from the surface to underground mine operations.
“Demerger” means the demerger of WMC Limited’s interest in AWAC from its other operating businesses pursuant to an Australian scheme of arrangement and associated capital reduction and dividend distribution.
“Depositary” means The Bank of New York Company, Inc., 101 Barclay Street, New York, NY 10286.
“Derivative” means an instrument or product whose value changes with changes in one or more underlying market variables, such as equity or commodity prices, interest rates or foreign exchange rates. Basic derivatives include, forwards, futures, swaps, options, warrants and convertible bonds.
“Dilution” means the incorporation of waste rock with the ore during the mining process resulting in lower grade.
“Fair Value” means, in the context of commodity, currency and interest rate hedging, the current market value (mark-to-market) of financial positions.
“Fair Value Hedge” means a contract which hedges an exposure to the change in fair value of a recognized asset, liability or an unrecognized firm commitment (or a part thereof) attributable to a particular risk.
“Foreign Currency Hedge” means a contract which hedges the foreign exchange exposure of:
| | • | an unrecognized firm commitment (fair value hedge); |
| | • | an available for sale security (fair value hedge); |
| | • | a forecast transaction (cash flow hedge); or |
| | • | a net investment in a foreign operation |
4
“Grass Roots Exploration” is exploration undertaken at new sites not related to existing operations (also known as “green fields” exploration).
“Hedge” means to reduce risk by entering into transactions that reduce exposure to market fluctuations. A hedge is also the term for the transactions made to effect this reduction.
“Hedge Accounting” means the practice of deferring accounting recognition of gains and losses on financial market hedges until the corresponding gain or loss of the underlying exposure is recognized.
“HSRA” means the Australian/US dollar Hedge Settlement Rate quoted on Reuters Screen HSRA.
“Indenture” means the agreement between the Government of South Australia and WMC (Olympic Dam Corporation) Pty Ltd.
“Interest Rate Swap” means an agreement to exchange net future cash flows. Interest rate swaps most commonly change the basis on which liabilities are paid on a specified principal. They are also used to transform the interest basis of assets. In its most common form, the fixed-floating swap, one counterparty pays a fixed rate and the other pays a floating rate based on a reference rate, such as LIBOR. There is no exchange of principal – the interest rate payments are made on a notional amount.
“LME” means the London Metal Exchange.
“MAP” means mono-ammonium phosphate.
“Marking-to-Market” means to calculate the value of a financial instrument (or portfolio of such instruments) based on the current market rates or prices of the underlying instrument.
“Mineral” is a naturally occurring element or chemical compound.
“Mineralization” is a concentration of a valuable mineral or minerals.
“Nickel Matte” is the output of a nickel smelter, being predominantly nickel sulphides plus some impurities. This is typically fed to a refinery for nickel metal production. Matte can be sold as a commercial product in its own right.
“NYSE” means the New York Stock Exchange.
“Open-cut” or “Open-pit” means a mine at the earth’s surface as distinct from an underground mine.
“Option” means a contract that gives the purchaser the right, but not the obligation, to buy or sell an underlying security or instrument at a certain price (the exercise, or strike price) on or before an agreed date (the exercise period). For this right, the purchaser pays a premium to the seller. The seller (writer) of an option has a duty to buy or sell at the strike price, should the purchaser exercise his right.
“Ore” means a naturally occurring solid resource (often rock) from which a mineral or minerals can be extracted.
“Ore Reserve” means that part of a mineral deposit which could be economically mined and legally extracted or produced at the time of the reserve determination. Ore reserve estimates in this Annual Report include adjustments for dilution and mine recovery loss during the mining process but do not include adjustments for metallurgical recovery. These ore reserves comply with those prescribed by the United States Securities and Exchange Commission’s Industry Guide 7.
“Probable Ore Reserves” means reserves for which quantity and grade and/or quality are computed from information similar to that used for proven ore reserves, but the sites for inspection, sampling and measurement are farther apart or are otherwise less adequately spaced. The degree of assurance, although lower than that for proven ore reserves, is high enough to assume continuity between points of observation.
“Proven Ore Reserves” means reserves for which (a) the quantity is computed from dimensions revealed in outcrops, trenches, workings or drill holes; the grade and/or quality are computed from the results of detailed sampling and (b) the sites for inspection, sampling and measurement are spaced so closely and the geologic character is so well defined that size, shape, depth and mineral content of reserves are well-established.
“SCH” means a transfer of securities on the Clearing House Electronic Subregister System operated by ASX Settlement and Transfer Corporation Pty Ltd.
5
“SEC” means the US Securities and Exchange Commission.
“Stoping” means the extraction of ore in an underground mine, leaving behind a void.
“Sulphides” means a compound of metal elements and sulphur.
“Tailings” are the residue remaining after extraction of the valuable components from ore.
“WA Mining Act 1978” refers to legislation passed by the Government of the State of Western Australia with which all mining operations in that State must comply.
“WMC Limited” refers to the parent entity of WMC Resources prior to the demerger on December 11, 2002. WMC Limited changed its name to Alumina Limited in connection with the demerger.
“WMC Resources” means WMC Resources Ltd together with its subsidiaries. Unless indicated otherwise, references to WMC Resources prior to the effective date of the demerger are to the assets and businesses of WMC Limited that WMC Resources owned immediately upon effectiveness of the demerger.
6
WEIGHTS AND MEASURES
| | | | |
1 troy ounce | | = | | 31.103 grams |
| | |
1 kilogram | | = | | 32.15 troy ounces |
| | |
1 kilogram | | = | | 2.205 pounds |
| | |
1 tonne | | = | | 1,000 kilograms |
| | |
1 tonne | | = | | 2,205 pounds |
| | |
1 gram per tonne | | = | | 0.0292 troy ounces per (short) ton |
| | |
1 kilometer | | = | | 0.6214 miles |
Gold recovered is reported in troy ounces (expressed as “ounces” in this Annual Report), the customary market unit, whereas ore production and grades are quoted in metric units, that is tonnes and grams per tonne.
7
| | | | |
| | IDENTITY OF DIRECTORS, SENIOR MANAGEMENT AND ADVISERS | | |
ITEM 1. IDENTITY OF DIRECTORS, SENIOR MANAGEMENT AND ADVISERS
| A. | | Directors and Senior Management |
Not applicable.
Not applicable.
Not applicable.
8
| | | | |
| | OFFER STATISTICS AND EXPECTED TIMETABLE | | |
ITEM 2. OFFER STATISTICS AND EXPECTED TIMETABLE
Not applicable.
| B. | | Method and Expected Timetable |
Not applicable.
9
| | | | |
| | KEY INFORMATION | | |
ITEM 3. KEY INFORMATION
| A. | | Selected Financial Data |
The selected financial data appearing below as at December 31, 2003 and 2002 and for the years ended December 31, 2003, 2002 and 2001 are set forth in Australian dollars (except as otherwise indicated), and are extracted, in relevant part, from our audited Consolidated Financial Statements which appear elsewhere herein. The selected financial data appearing below as at December 31, 2001, 2000 and for the year ended December 31, 2000 and 1999 are extracted, in relevant part, from audited Combined Financial Statements. The summary financial data appearing below as at December 31, 1999 is derived from unaudited consolidated financial data that is not included herein. As discussed in Note 1 to the Consolidated Financial Statements, the financial statements for 2002, 2001, 2000 and 1999 herein reflect the statements of financial performance and statements of financial position as if we were a separate entity for all periods presented. The historical financial information may not be indicative of our future performance and does not reflect what our financial position and results of operations would have been had we operated as a separate, stand-alone entity during the periods presented. These Consolidated Financial Statements have been prepared in accordance with accounting principles generally accepted in Australia (“Australian GAAP”), which differ in certain respects from accounting principles generally accepted in the United States of America (“US GAAP”). Note 45 to the Consolidated Financial Statements provides an explanation of these differences as they affect us and reconciliations from Australian GAAP to US GAAP of net income, comprehensive income, certain balance sheet items, shareholders’ equity and cashflows.
Our net income under Australian GAAP was A$245.6 million for the year ended December 31, 2003 (A$23.0 million for the year ended December 31, 2002). Under US GAAP, we would have reported a net profit of A$732.4 million for the year ended December 31, 2003 (net loss of A$109.5 million for the year ended December 31, 2002). Comprehensive income under US GAAP for the year ended December 31, 2003 was a profit of A$1,420.7 million (for the year ended December 31, 2002 a profit of A$86.2 million was reported). Our Consolidated Financial Statements are prepared in accordance with Australian GAAP. The principal differences between Australian GAAP and US GAAP that affect our net income and comprehensive income, as well as our shareholders’ equity, relate to the treatment of the following items:
| | (i) | | recognition of tax losses; |
| | (ii) | | revenue from insurance proceeds; |
| | (iv) | | exploration expenditure; |
| | (vi) | | recognition of profit on real estate disposal; |
| | (vii) | | deferral of cost of option payments; |
| | (viii) | | fair value of accounting for derivatives; |
| | (ix) | | amortization of mine development and deferred post-production waste removal costs; |
| | (x) | | transfers of net assets and exchange of shares between entities under common control; and |
| | (xi) | | accounting for asset retirement obligations. |
Differences that affect the Consolidated Statement of Cash Flows are that under US GAAP, bank overdrafts are not considered to be part of net cash equivalents, and expenditure incurred on post-production waste removal cost would be classified as part of cashflows from operating activities, rather than investing activities.
10
| | | | |
| | KEY INFORMATION | | |
The following selected financial data should be read in conjunction with, and is qualified in its entirety by reference to, the Consolidated Financial Statements, including the Notes thereto.
SELECTED FINANCIAL DATA UNDER AUSTRALIAN GAAP
| | | | | | | | | | | | | |
| | | Year Ended
December 31,
2003
| | Year Ended
December 31,
2002
| | | Year Ended
December 31,
2001
| | | Year Ended
December 31, 2000
| | Year Ended
December 31,
1999
| |
| | | (A$ million, except where indicated) | |
Net Sales Revenue from Continuing Operations | | 3,001.3 | | 2,487.2 | | | 2,364.1 | | | 2,666.0 | | 1,672.7 | |
Income/(Loss) from Continuing Operations: | | 239.1 | | (14.7 | ) | | (157.5 | ) | | 327.2 | | (5.7 | ) |
Income from Operations (before tax) | | 247.9 | | 1.8 | | | 49.7 | | | 568.6 | | 23.7 | |
Net Income | | 245.6 | | 23.0 | | | 126.0 | | | 399.9 | | 84.1 | |
Comprehensive Income | | 248.8 | | 26.1 | | | 111.9 | | | 380.7 | | 79.8 | |
Net Income per Share (A$/share)(1) | | 0.22 | | 0.02 | | | 0.11 | | | 0.35 | | 0.07 | |
Net Income/(Loss) from Continuing Operations per Ordinary Share (A$/share)(1) | | 0.21 | | (0.01 | ) | | (0.14 | ) | | 0.29 | | (0.01 | ) |
Diluted Net Income/(Loss) from Continuing Operations per Ordinary Share (A$/share)(2) | | 0.21 | | (0.01 | ) | | (0.14 | ) | | 0.29 | | (0.01 | ) |
| | |
| |
|
| |
|
| |
| |
|
|
| | | | | |
| | | At December 31,
2003
| | At December 31,
2002
| | | At December 31,
2001
| | | At December 31, 2000
| | At December 31,
1999
| |
| | | (A$ million, except where indicated) | |
Total assets | | 7,560.2 | | 7,348.1 | | | 8,242.9 | | | 8,597.0 | | 7,275.8 | |
Long-term obligations | | 2,712.9 | | 1,709.1 | | | 3,476.3 | | | 4,304.2 | | 3,053.1 | |
Net assets | | 3,949.7 | | 3,606.6 | | | 3,220.3 | | | 3,123.8 | | 3,214.3 | |
| | |
| |
|
| |
|
| |
| |
|
|
Shareholders’ equity | | 3,949.7 | | 3,606.6 | | | 3,220.3 | | | 3,123.8 | | 3,214.3 | |
| | |
| |
|
| |
|
| |
| |
|
|
| | | Millions of shares | |
Number of shares | | 1,150.1 | | 1,128.4 | | | 1,108.8 | | | 1,098.0 | | 1,149.9 | |
| | |
| |
|
| |
|
| |
| |
|
|
| (1) | | The number of our shares used in the 2002 basic net income per share calculation was determined on the basis of the weighted average number of outstanding WMC Limited shares for the 11 months to November 30, 2002 (the effective demerger date for accounting purposes) and the actual number of WMC Resources shares for the month of December 2002. For prior periods, the number of our shares used in the basic net income per share calculation was determined on the basis of the weighted average number of outstanding WMC Limited shares for the periods indicated, as in the demerger each WMC Limited shareholder received one of our shares for each share in WMC Limited it held. Refer also to Notes 1(y) and 6 to the Consolidated Financial Statements. |
| (2) | | The number of our shares used in the 2002 diluted net income per share calculation was determined on the basis of the weighted average of the number of outstanding WMC Limited shares for the 11 months to November 30, 2002 (the effective demerger date for accounting purposes) and the actual number of WMC Resources shares for the month of December 2002. For prior periods, the number of our shares used in the diluted net income per share calculation was determined on the basis of the weighted average of the number of outstanding WMC Limited shares for the periods indicated, including potential shares from the conversion of partly paid shares and options into shares of WMC Limited. Refer also to Notes 1(y) and 6 to the Consolidated Financial Statements. |
11
| | | | |
| | KEY INFORMATION | | |
SELECTED FINANCIAL DATA UNDER US GAAP
| | | | | | | | | | | | | |
| | | Year Ended
December 31,
2003
| | Year Ended
December 31,
2002
| | | Year Ended
December 31,
2001
| | | Year Ended December 31, 2000
| | Year Ended
December 31,
1999
| |
| | | (A$ million, except where indicated) | |
Net Sales Revenue | | 3,001.3 | | 2,487.2 | | | 2,364.1 | | | 2,666.0 | | 1,672.7 | |
Income/(Loss) from Continuing Operations: | | 711.7 | | (160.8 | ) | | (231.5 | ) | | 241.6 | | (22.2 | ) |
Net Income/(Loss) | | 732.4 | | (109.5 | ) | | 37.7 | | | 307.6 | | 52.1 | |
Comprehensive Income/(Loss) | | 1,420.7 | | 86.2 | | | (804.7 | ) | | 288.4 | | 2.1 | |
Net Income/(Loss) from Continuing Operations per Ordinary Share (A$/share)(1)(2) | | 0.63 | | (0.14 | ) | | (0.21 | ) | | 0.21 | | (0.02 | ) |
Diluted Net Income/(Loss) from Continuing Operations per Ordinary Share (A$/share)(3) | | 0.62 | | (0.14 | ) | | (0.21 | ) | | 0.21 | | (0.02 | ) |
| | |
| |
|
| |
|
| |
| |
|
|
| | | | | |
| | | At December 31,
2003
| | At December 31,
2002
| | | At December 31,
2001
| | | At December 31, 2000
| | At December 31,
1999
| |
| | | (A$ million, except where indicated) | |
Total assets | | 6,764.0 | | 6,478.1 | | | 6,691.4 | | | 8,368.2 | | 7,146.7 | |
Long-term obligations | | 2,712.9 | | 1,709.1 | | | 3,476.3 | | | 4,304.2 | | 3,053.1 | |
Net assets | | 3,925.7 | | 2,410.7 | | | 2,068.8 | | | 2,888.9 | | 3,071.7 | |
| | |
| |
|
| |
|
| |
| |
|
|
Shareholders’ equity | | 3,925.7 | | 2,410.7 | | | 2,068.8 | | | 2,888.9 | | 3,071.7 | |
| | |
| |
|
| |
|
| |
| |
|
|
| | | Millions of shares | |
Number of Shares | | 1,150.1 | | 1,128.4 | | | 1,108.8 | | | 1,098.0 | | 1,149.9 | |
| | |
| |
|
| |
|
| |
| |
|
|
| (1) | | The number of our shares used in the 2002 basic net income per share calculation was determined on the basis of the weighted average number of outstanding WMC Limited shares for the 11 months to November 30, 2002 (the effective demerger date for accounting purposes) and the actual number of WMC Resources shares for the month of December 2002. For prior periods, the number of our shares used in the basic net income per share calculation was determined on the basis of the weighted average number of outstanding WMC Limited shares for the periods indicated; as in the demerger each WMC Limited shareholder received one of our shares for each share in WMC Limited it held. Refer also to Notes 1(y) and 6 to the Consolidated Financial Statements. |
| (2) | | In 1999, net loss per share was A$0.04 before the cumulative effect of an accounting policy change for start-up costs. In 2002, net loss per share was $0.06 before the cumulative effect of an accounting policy change for amortization of mine development and post-production waste removal costs. In 2003, net gain per share was A$0.66 before the cumulative effect of an accounting policy change for asset retirement obligations. |
| (3) | | The number of our shares used in the 2002 diluted net income per share calculation was determined on the basis of the weighted average of the number of outstanding WMC Limited shares for the 11 months to November 30, 2002 (the effective demerger date for accounting purposes) and the actual number of WMC Resources shares for the month of December 2002. For prior periods, the number of our shares used in the diluted net income per share calculation was determined on the basis of the weighted average of the number of outstanding WMC Limited shares for the periods indicated, including potential shares from the conversion of partly paid shares and options into shares of WMC Limited. Refer also to Notes 1(y) and 6 to the Consolidated Financial Statements. |
12
| | | | |
| | KEY INFORMATION | | |
Exchange Rates
We publish our Consolidated financial statements in Australian dollars (“A$” or “$”). In this Annual Report, references to “US$” are to United States dollars.
The following table sets forth, for the periods and dates indicated, certain information concerning the rates of exchange of A$1.00 into US$ based on the noon buying rate in New York City for cable transfers in Australian dollars as certified for customs purposes by the Federal Reserve Bank of New York (the “Noon Buying Rate”).
| | | | | | | | |
Period
| | At Period End
| | Average Rate(1)
| | High
| | Low
|
| | | (all figures in US$ per A$1.00) |
Year Ended December 31, 1999 | | 0.6560 | | 0.6440 | | 0.6712 | | 0.6179 |
Year Ended December 31, 2000 | | 0.5560 | | 0.5757 | | 0.6687 | | 0.5112 |
Year Ended December 31, 2001 | | 0.5117 | | 0.5127 | | 0.5712 | | 0.4828 |
Year Ended December 31, 2002 | | 0.5625 | | 0.5447 | | 0.5748 | | 0.5060 |
Year Ended December 31, 2003 | | 0.7520 | | 0.6588 | | 0.7520 | | 0.5629 |
| | | | |
November 2003 | | | | | | 0.7238 | | 0.6986 |
December 2003 | | | | | | 0.7520 | | 0.7265 |
January 2004 | | | | | | 0.7805 | | 0.7576 |
February 2004 | | | | | | 0.7979 | | 0.7566 |
March 2004 | | | | | | 0.7725 | | 0.7325 |
April 2004 | | | | | | 0.7677 | | 0.7198 |
| | |
| |
| |
| |
|
| (1) | | The average of the exchange rates on the last day of each month during the financial period. |
On May 24, 2004, the Noon Buying Rate was A$1.00 = US$0.6982
13
| | | | |
| | KEY INFORMATION | | |
| B. | | Capitalization and Indebtedness |
Not applicable.
| C. | | Reasons for the Offer and Use of Proceeds |
Not applicable.
Risks relating to our business
We believe that, because of the international scope of our operations and the industries in which we are engaged, numerous factors have an effect on our results and operations. The following describes the material risks that could affect us.
A reduction in commodity prices could materially reduce our revenues and profits.
Our revenue is derived from sales of nickel, copper, uranium, gold and fertilizers. The prices we obtain for our products are determined by, or linked to, prices in the world markets, which have historically been subject to substantial fluctuations arising from changes in supply and demand, various Australian and international macro-economic and political conditions, the cost of substitute materials, and the speculative activities of various market participants. This will have a consequent effect on the prices we can charge for our products and the revenues we receive, including under supply contracts, the pricing terms of which track market prices, which consequently affects our profitability. The general trend in commodity prices has been characterized by an increase from 1999 through the end of 2000, followed by a decline over the course of 2001 into 2002 and increases in 2003. For further information about historical commodity price movements in the commodities we produce, please see the following sections “Qualitative and Quantitative Disclosures About Market Risk—Average Quarterly Prices”, “Business Description—Nickel—Markets and Competition”, “Business Description—Copper-uranium—Market and Competition” and “Business Description—Fertilizer—Markets and Competition”.
Material changes in the prices we receive for our products could have a significant effect on our results. Consequently, a sustained and uninterrupted period of unusually low prices of the metal and other products we sell could reduce our profitability and our ability to pay principal and interest on our debt, dividends, or meet our other obligations.
In 2003, commodity prices rose due to significant increases in economic activity in the markets we serve. However, the general volatility in commodity prices makes it difficult for us to predict the extent and duration of any decline or increase in the cyclical commodity prices relating to our products. We expect that volatility in prices and in demand for most of our products will continue for the foreseeable future. We may enter into hedging transactions with respect to nickel, gold, copper and fertilizer with a view to reducing the potentially adverse effects of commodity price fluctuations. Since 2000, any new hedging activity has been limited to securing acceptable rates of return for new projects. For a statement of our current hedging activity, and movements in the selling price of nickel, gold, copper and fertilizer over the last five years, see “Quantitative and Qualitative Disclosure about Market Risk”.
Fluctuations in foreign exchange rates could adversely affect our revenues and profits.
The products we export from Australia are predominantly sold in US$. In the year ended December 31, 2003, 92.6% of our sales revenue was denominated in or linked to US$. However, any dividend payments and the majority of our operating costs are denominated in A$. Therefore, in the absence of other changes, if the A$ strengthens in value relative to the value of the US$, our financial results will be adversely affected. Conversely, a weakening of the A$ relative to the US$ will tend to have a favorable effect on our financial results. Because much of our borrowings and the majority of our receivables are denominated in US$, movements in the A$/US$ exchange rate will also affect our net asset value. As at December 31, 2003, we had US$897.4 million of US$ repayment obligations and US$ receivables of US$192.9 million. We have from time to time sought to hedge our foreign currency exchange position. See “Quantitative and Qualitative Disclosure about Market Risk” for a more detailed discussion of our foreign exchange hedging policy.
14
| | | | |
| | KEY INFORMATION | | |
Fluctuations in the A$/US$ exchange rate will also affect the US$ equivalent of the A$ price of our ordinary shares on the ASX and, as a result, are likely to affect the market price of our ADSs in the United States. Such fluctuations would also affect the US$ amounts received by holders of ADSs on conversion of any cash dividends paid in A$ on the ordinary shares underlying the ADSs.
We may have fewer ore reserves than our estimates indicate.
There are a number of uncertainties inherent in estimating quantities of reserves, including many factors beyond our control. The reserves data included in this Annual Report are estimates. The actual volume and grade of reserves recovered and our rates of production may be less than these estimates may imply.
Our reserve estimates may change substantially if new information subsequently becomes available. Such estimates are, to a large extent, based on the interpretations of geological data obtained from drill holes and other sampling techniques, and feasibility studies which derive estimates of operating costs based upon anticipated tonnage and grades of the material to be mined and processed, expected recovery rates, equipment operating costs and other factors. Further, it may take many years from the initial phase of drilling before production is possible and, during that time, the economic feasibility of exploiting a discovery may change. Fluctuations in the price of commodities, variations in operating and capital costs, different recovery rates and other factors, including, but not limited to, short-term operating factors such as the need for sequential development of ore bodies and the processing of new or different ore grades, may ultimately result in our estimated reserves being revised. If such a revision were to indicate a substantial reduction in proven or probable reserves at one or more of our major projects, it could negatively affect our financial condition and prospects.
A decline in the market price of a particular metal or mineral may also render the exploitation of reserves containing relatively lower grades of mineralization uneconomical. If the price we realized for a particular commodity were to decline substantially below the price at which our ore reserves were estimated for a sustained period of time, we could experience reductions in reserves and asset write-downs. Under some such circumstances, we may discontinue the development of a project or mining at one or more properties.
An increase in our production costs could reduce our profitability.
Changes in our costs have a major impact on our profitability. Our main expense categories are salaries and wages, energy, transport, materials, and amortization and depreciation of property, plant and equipment. Some of our costs are also affected by government imposts and regulations. Our costs depend upon the efficient design and construction of mining and processing facilities and competent operation of those facilities. Changes in costs of mining and processing operations can occur as a result of unforeseen events or changes in reserve estimates.
Our energy costs represent a significant portion of the production costs for our operations. The principal sources of energy for our mining operations are purchased electricity and natural gas. Energy will continue to represent a significant portion of our production costs, and we may be adversely impacted if future energy sources are not available or energy prices increase. If we are unable to procure sufficient energy at reasonable prices in the future, it could reduce the earnings or cash flow that we otherwise might realize.
Our ability to sustain or increase our current levels of production in the medium to long term is partly dependent on the development of new projects and expansion of existing operations.
Our ability to sustain or increase our current levels of production, and, therefore, our potential revenues and profits, in the medium to long term is partly dependent on the development of new projects and on the expansion of existing operations. Planned development or expansion projects may not result in the entire planned additional production. The economics of any project are based upon, among other factors, estimates of non-reserve mineralization and reserves, recovery rates, production rates, capital and operating costs of these development projects and future commodity prices. The uncertainty and volatility of some or all of these factors contributes to the risks associated with project development and expansion activities.
Our business may be affected by planned and unplanned outages and other material disruptions.
Industrial disruptions, work stoppages, refurbishments, installation of new plants, geotechnical issues, accidents or sustained bad weather at our operations can result in production losses and delays in delivery of products, which may adversely affect our profitability. Production may fall below historic or estimated levels as a result of unplanned outages. For example, in 2001, we experienced a fire at both of our copper and uranium solvent extraction units at our Olympic Dam operations. We also experienced a fire in the copper solvent extraction unit in 1999. Our copper and uranium production was adversely affected following these incidents, and future incidents of this nature or other incidents resulting in unplanned outages could materially affect our production and operating profits.
15
| | | | |
| | KEY INFORMATION | | |
We are exposed to regulatory, legislative and judicial action, both in Australia and in other countries in which we conduct operations.
Our operations in each of the jurisdictions where we operate could be affected by government actions, such as controls on imports, exports and prices, variations in taxation laws (including royalties), government directions, guidelines and regulations, particularly in relation to the environment and mine operations, legislation, indigenous people’s rights and court decisions, particularly those that impact on land access and freedom to conduct mining operations. Any such government action or court decisions may require increased capital or operating expenditures or both, or could prevent or delay the development of some of our operations.
We are also subject to the requirements of Australian mining law and the conditions of leases granted to us by state or territorial governments. See “Business Description – Australian Mining Law and Leases” for a more detailed discussion of these requirements.
Some of our exploration and potential projects and activities are in developing countries where political, economic and other risks may be more acute than in developed countries, including our Corridor Sands project in Mozambique. These risks include: expropriation or nationalization of property; currency fluctuations (particularly in countries with high inflation); restrictions on the ability to pay dividends offshore; risks of loss due to civil strife, acts of war, guerilla activities, insurrection and terrorism; and other risks arising out of foreign sovereignty over the areas in which operations are conducted. Consequently, our exploration, development, and future production activities outside of Australia may be adversely affected by factors beyond our control, any of which could materially adversely affect our financial position or results of operations. Furthermore, in the event of a dispute arising from such activities, we may be subject to the exclusive jurisdiction of courts outside Australia or may not be successful in subjecting persons to the jurisdiction of the courts in Australia, which could adversely affect the outcome of a dispute.
We are subject to stringent environmental laws and regulations, which impose substantial costs and subject us to significant potential liabilities.
Compliance with environmental laws and regulations imposes substantial costs and subjects us to significant potential liabilities. Our business is subject to particular risks and liabilities associated with pollution of the environment and the disposal of waste products occurring as a result of mineral exploration and production. Our operations in Australia are subject to stringent federal, state and local laws and regulations relating to improving or maintaining environmental quality. Environmental laws often require parties to pay for remedial action or to pay damages regardless of fault. Environmental laws also often impose liability with respect to divested or terminated operations, even if the operations were terminated or divested many years ago. Costs associated with environmental and regulatory compliance have increased over time. In addition, the costs of environmental obligations may exceed the reserves we have established for these liabilities. For a discussion of our significant remediation projects in Australia, see “Business Description – Environmental Matters”.
We cannot reasonably estimate the cost of future compliance or remedial work or further investment necessitated through the introduction of further environmental regulation or by any causes of contamination, including those occurring prior to the introduction of such regulation or before or after the property in question was owned or occupied by us. Among other things, the level of these costs will be dependent upon the nature and extent of the current and future environmental regulation, the time and nature of required remedial work, the extent of any contamination, the technology available to meet the required standards, the determination of our liabilities in proportion to those of other parties and the extent to which costs are recoverable from insurance and third parties.
Service of process, enforcement of judgments and bringing of original actions in the United States may be more difficult.
Since we and our officers and directors reside outside the United States and a substantial portion of our assets are located outside the United States, there is a risk that service of process, enforcement of judgments and bringing of original actions will be more difficult.
Native Title in Australia.
“Native Title” describes the rights and interests of Aboriginal and Torres Strait Islander people in land and waters according to their traditional laws and customs that are recognized under Australian law. There are current claimant applications for native title determinations in the Federal Court of Australia over areas that include the majority of our operations. We cannot make any assessment as to whether any of our existing assets or operations will be materially affected until court determinations are made. Court decisions and various pieces of legislation make it evident that there are complex legal and factual issues affecting our existing and future interests. Accordingly, the impact of native title is being closely monitored but cannot be determined at this time. See “Item 8A. Legal Proceedings – Native Title in Australia” for a discussion of native title issues in Australia that have an impact on our operations.
16
| | | | |
| | INFORMATION ON THE COMPANY | | |
ITEM 4. INFORMATION ON THE COMPANY
A. History and Development of WMC Resources
Background
We were incorporated under the laws of the Commonwealth of Australia on March 2, 1933. Through the transactions to effect the demerger of WMC Limited’s interest in the Alcoa World Alumina and Chemicals (“AWAC”) joint venture with Alcoa Inc. from WMC Limited’s other businesses effective December 11, 2002 we became an independent diversified resources company. From 1979 until the demerger, we had been operating as a wholly-owned subsidiary of WMC Limited, holding principally the group’s nickel assets. Our main businesses consist of the discovery, development, production, processing and marketing of minerals and metals. We produce nickel, copper, phosphate fertilizers, uranium oxide, gold and a range of other intermediate products. As at December 31, 2003, we had total combined assets of approximately A$7.6 billion and we generated net sales revenue from operations of approximately A$3.1 billion in the year ended December 31, 2003.
We have our registered office and principal executive offices at Level 16, 60 City Road, Southbank, Victoria, 3006, Australia. Our telephone number is +61 3 9685 6000 and our facsimile number is +61 3 9685 3569.
The demerger
On November 21, 2001, WMC Limited announced a proposal to demerge its interests in AWAC from its other mineral businesses. The demerger was effected through an Australian court-approved scheme of arrangement and associated capital reduction and dividend distribution with an effective date of December 11, 2002 (and an effective accounting date of November 30, 2002). As a result of the demerger, WMC Limited has continued to hold its interest in AWAC (but changed its name to Alumina Limited) and we hold the nickel, copper/uranium and fertilizer businesses and exploration and development interests (other than those relating to AWAC) previously held within the WMC Limited group.
Immediately prior to effecting the demerger, through a series of share sale transactions internal to the WMC Limited group, we acquired those of WMC Limited’s subsidiaries which held its copper/uranium and fertilizer businesses and exploration and development interests (other than those relating to AWAC), together with those subsidiaries which provide administrative or financial support to, or otherwise relate to activities conducted by, us. The shares of the subsidiaries were transferred to us in return for our newly issued ordinary shares. For accounting purposes, the subsidiaries were acquired in connection with the demerger at their fair value. These fair values were determined by using discounted cash flows in accordance with Australian GAAP. (Under Australian GAAP, fair value is defined as the amount for which an asset could be exchanged, or a liability settled, between knowledgeable, willing parties in an arm’s length transaction. However, in circumstances such as these where the transaction does not take place in an active market, fair value can be determined using alternative estimation techniques such as discounted cash flows.)
The demerger was effected in two simultaneous stages. First, WMC Limited reduced its share capital by a notional cash amount of A$2.78 per share and declared a notional cash dividend of A$0.73 per share. Second, under the scheme of arrangement effected by an order of the Court and binding on all WMC Limited shareholders and WMC Limited, WMC Limited shareholders agreed to purchase all of our shares utilizing as consideration their capital reduction and dividend entitlements from WMC Limited. As a result, WMC Limited shareholders received our shares on a pro-rata basis in the demerger.
The amount of the capital reduction and dividend together represented our carrying value in the books of WMC Limited at November 30, 2002 after giving effect to the share transfers at fair value mentioned above. This carrying value amounted to A$4,007.5 million.
The demerger required the approval of a majority in number of WMC Limited shareholders present and voting, and holding at least 75% of the total number of WMC Limited shares voted, at the shareholders’ meeting held to consider the demerger. The implementation of the demerger was subject to the approval of the Australian court considering the scheme of arrangement. The approval of the ASX was also required in order to admit us to the official list of the ASX.
The information about us and our operating and financial review and prospects has been presented in this Annual Report as though we had existed as a stand-alone economic entity for all the periods presented.
17
| | | | |
| | INFORMATION ON THE COMPANY | | |
Capitalization Expenditure and Divestiture
Since January 1, 2001 we have made the following principal capital expenditure and divestiture:
| | • | | Our divestment of our Kambalda mines is part of our nickel strategy to divest mature nickel mines and seek to participate in the benefits that a small focused operator can yield from the remaining resource. Since early 2000, we have been selling various mines within our Kambalda nickel operations. To the date of this Annual Report, proceeds from these sales have totalled A$52.0 million in aggregate. We anticipate that our remaining mine in the Kambalda region will be sold over the next few years. |
| | • | | In February 2001 we purchased the Yakabindie nickel project. The Yakabindie project, situated near Mt Keith, involved an investment of A$40 million, A$25 million of which was paid at the time of acquisition with the remaining A$15 million due upon gaining approval to mine the property. While the approval process has been commenced, final approvals to mine are not expected for some years. |
| | • | | In 2002, we completed an optimization project to increase production capacity of copper cathode at our Olympic Dam operations in South Australia. The project has increased the refinery capacity and improved efficiency in the milling and hydro-metallurgy areas. The capital cost was approximately A$79 million. |
| | • | | In October 2003, we merged the operating subsidiary that held our interest in the Meliadine West gold project with Comaplex Minerals Corporation, a Canadian mining company. |
| | • | | In January 2003, we finalized our acquisition of 100% of the Corridor Sands titanium dioxide project located in Mozambique for US$62.5 million. We settled the final tranche of US$25 million by issuing 6,715,123 shares in December 2003. |
We currently have the following capital expenditure, asset purchase and divestiture activities in progress:
| | • | | Olympic Dam experienced a fire in both the copper and uranium solvent extraction circuits in 2001. The expected cost of the rebuild is approximately A$375 million. |
| | • | | An extension of the Perseverance mine at Leinster. The expected cost of the extension is approximately A$179.1 million. |
B. Business Overview
General
Our main business is the discovery, development, production, processing, and marketing of minerals and metals. We produce nickel, copper, phosphate fertilizers, uranium oxide, gold and a range of other intermediate products. Our other activities include producing, marketing and distributing fertilizers.
During 2003, we explored in Australia, China, Peru, Mongolia, Tanzania, Malawi, Turkey and the USA. During 2003, we undertook further engineering studies and secured permits for improved power supply and product export options at Corridor Sands. The Industrial Development Corporation of South Africa exercised its option over 10% of the project’s equity for US$10 million. This transaction is still subject to Reserve Bank of South Africa approval. In December 2003, we made the final payment of US$25 million to acquire the Corridor Sands project from Southern Mining Corporation by issuing 6,715,123 WMC Resources shares to that corporation. The additional US$25 million was allocated to Acquired Mineral Rights.
18
| | | | |
| | INFORMATION ON THE COMPANY | | |
The following map shows the location of our operations and interests in Australia.
| | | | | | |
| | | CORPORATE OFFICES | | | | FERTILIZER |
1. | | Melbourne, VIC | | 10. | | Mt Isa, QLD |
2. | | Perth, WA | | 11. | | Phosphate Hill, QLD |
| | | | | 12. | | Townsville, QLD |
| | | |
| | | COPPER-URANIUM | | | | EXPLORATION |
3. | | Olympic Dam, SA | | 13. | | West Musgrave, WA |
| | | |
| | | NICKEL | | | | |
4. | | Kalgoorlie, WA | | | | |
5. | | Kambalda, WA | | | | |
6. | | Kwinana, WA | | | | |
7. | | Leinster, WA | | | | |
8. | | Mount Keith, WA | | | | |
9. | | Yakabindie, WA | | | | |
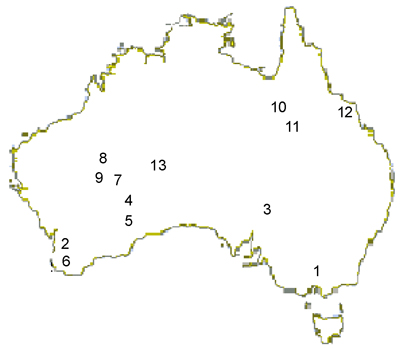
AUSTRALIA
19
| | | | |
| | INFORMATION ON THE COMPANY | | |
Segment Information
We categorize our on-going operations as follows: Nickel; Copper-Uranium (the Olympic Dam Operations which produces copper, uranium oxide, gold and silver); Fertilizers; Regional Exploration and New Business. Geographic and financial information relating to the segments of continuing operations are included under Note 7 to our Consolidated Financial Statements. The following table sets forth financial information in A$ by operating segments for each of the last three years.
FINANCIAL INFORMATION BY SEGMENT (CONTINUING OPERATIONS)
| | | | | | | | | |
| | | Year Ended
December 31,
2003
| | | Year Ended
December 31,
2002
| | | Year Ended
December 31,
2001
| |
| | | (A$ million) | |
Sales Revenue by Operating Segments(1) | | | | | | | | | |
Nickel | | 1,827.2 | | | 1,315.0 | | | 1,200.9 | |
Copper-uranium | | 719.0 | | | 723.3 | | | 810.3 | |
Fertilizers | | 428.1 | | | 420.6 | | | 352.9 | |
Unallocated corporate revenues | | 27.0 | | | 28.4 | | | — | |
| | |
|
| |
|
| |
|
|
| | | 3,001.3 | | | 2,487.3 | | | 2,364.1 | |
| | |
|
| |
|
| |
|
|
Consolidated Income/(Loss) by Operating Segments before Income Tax | | | | | | | | | |
Nickel | | 472.5 | | | 221.5 | | | 147.4 | |
Copper-uranium | | (97.5 | ) | | 53.8 | | | 47.9 | |
Fertilizers | | (25.6 | ) | | (57.4 | ) | | (89.4 | ) |
Unallocated result | | 12.7 | | | 11.4 | | | (1.0 | ) |
| | |
|
| |
|
| |
|
|
Product Operating Income | | 362.1 | | | 229.3 | | | 104.9 | |
New Business | | (19.5 | ) | | (36.5 | ) | | (35.3 | ) |
Regional Exploration | | (23.4 | ) | | (21.5 | ) | | (63.9 | ) |
Financing/Corporate | | (77.8 | ) | | (205.9 | ) | | (229.0 | ) |
| | |
|
| |
|
| |
|
|
| | | 241.4 | | | (34.6 | ) | | (223.3 | ) |
| | |
|
| |
|
| |
|
|
| (1) | | Sales revenue includes intermediate-product sales, commodity and related currency hedging. Inter-segment sales are on a commercial basis and are not significant. All revenues are considered to be generated in Australia – see Note 7 of our Consolidated Financial Statements. |
The operations and assets of our business segments are further described in Item 4D “Property, Plant and Equipment”.
20
| | | | |
| | INFORMATION ON THE COMPANY | | |
C. Organizational Structure
The WMC Resources Group consists of WMC Resources, the ultimate parent company, and its subsidiaries. Our business is split into business units based on major production commodities and activities:
| | • | | Regional Exploration and New Business; and |
The principal companies within the WMC Resources Group are:
| | • | | WMC Resources Ltd – Incorporated in Australia, WMC Resources Ltd is the parent holding company as well as an operating entity that owns the nickel mining, processing and marketing operations. |
| | • | | WMC (Olympic Dam Corporation) Pty Ltd – Incorporated in Australia, this company owns the Olympic Dam Operations which produces high quality refined copper and uranium oxide and gold and silver as co-products. It is wholly owned by WMC Resources Ltd. |
| | • | | WMC Fertilizers Pty Ltd – Incorporated in Australia, this company owns the Queensland Fertilizer Operations and fertilizer distribution arm, Hi-Fert Pty Ltd. It is wholly owned by WMC Resources Ltd. |
| | • | | WMC Finance Limited – Incorporated in Australia, this company’s principal activities are the borrowing and lending of money and other financing activities, including commodity and currency hedging and the selling of gold and silver purchased from related entities. It is wholly owned by WMC Resources Ltd. |
| | • | | WMC Finance (USA) Limited – Incorporated in Australia, the principal activity of this company is to hold debt issued in the United States markets. It is wholly owned by WMC Resources Ltd. |
D. Property, Plant and Equipment
All our assets are 100% owned, either directly or through subsidiary companies, unless otherwise stated.
Under our current life of mine plans, all reported reserves will be mined out within the period of existing leases or concessions or within the time period of assured renewal periods. All reported reserves, except for Corridor Sands, are at sites which have all required permits and government approvals. On conversion to a mining license from the existing exploration title, Corridor Sands reported reserves will be mined within the period of the mining license or within the time period of assured renewal periods.
21
| | | | |
| | INFORMATION ON THE COMPANY | | |
Our nickel business unit is a fully integrated nickel business comprising mines, concentrators, a smelter and a refinery. We produced 117,722 tonnes of contained nickel-in-concentrate extracted from 14.5 million tonnes of ore processed in the year ended December 31, 2003. This compared with production of 106,423 tonnes of contained nickel-in-concentrate in the year ended December 31, 2002 from 14.3 million tonnes of ore processed. Purchased feed from third parties was 25,940 tonnes of recovered nickel for the year ended December 31, 2003, compared to 20,900 tonnes for the year ended December 31, 2002.
Our strategy for the nickel business unit is to:
| | • | | increase output at a minimum capital cost and reduce the unit cost of production through process improvement, technology and de-bottlenecking; |
| | • | | maintain the business as a major low-cost producer; |
| | • | | pursue commercially viable growth through regional exploration in Western Australia and development of our strong resource position through projects such as Yakabindie; and |
| | • | | participate in the benefits that small, focused operators are extracting from the divested Kambalda mines. |
We commenced production of nickel-in-concentrate in 1967, following the discovery of significant nickel ore reserves at Kambalda. We currently mine nickel ore from both open-cut and underground mines at our wholly owned mines at Leinster and Mount Keith. We ceased mining at Kambalda in 2002. The mill and concentrator at Kambalda are now fed with third party ore. Nickel ore is concentrated at Kambalda, Leinster and Mount Keith and then the majority of this nickel concentrate is transported to the Kalgoorlie Nickel Smelter to be smelted into nickel matte. We sell some of the Mount Keith production directly as concentrate. In the year ended December 31, 2003, we sold 37% of nickel-in-matte produced to overseas customers compared to 28% in 2002 fiscal year and refined the balance at our Kwinana Nickel Refinery to produce LME accredited nickel briquettes, nickel powder and various other intermediate products such as ammonium sulphate.
Pursuant to an agreement with Southern Cross Energy which expires in 2013, power at the Kambalda, Mount Keith and Leinster nickel operations and at the Kalgoorlie Nickel Smelter is primarily derived from on-site third party gas fired turbines with power at the Kwinana Refinery being wheeled from the goldfields through Western Power. Under the agreement with Southern Cross Energy, we have a take or pay obligation to purchase energy. In the Goldfields region, until 2006, gas is purchased under long term contract and is sourced from North West gas fields and transported by the Goldfields Gas Pipeline. Under the gas transmission agreement, we have an 80% take or pay obligation. Since December 31, 2001 the transmission tariff has increased by approximately 30% and we are currently disputing this increase in accordance with the dispute resolution procedures under the transmission agreement. The Western Australian Independent Gas Pipeline Regulator has made a draft decision regarding tariffs payable by third parties for access to the pipeline suggesting that a lower access tariff to that currently proposed by the pipeline owners should apply. The pipeline owners have commenced proceedings in the Supreme Court of Western Australia seeking a declaration that the Regulators’ draft decision does not apply. Until 2007, gas for the Kwinana Refinery will be sourced from the north western region of Western Australia and is transported by the Dampier to Bunbury natural gas pipeline, with us having a 70% take or pay obligation.
22
| | | | |
| | INFORMATION ON THE COMPANY | | |
A summary of the production of nickel-in-concentrate from our mines and third parties, matte from its smelter and metal from its refinery for the last five years is set out below.
NICKEL PRODUCTION SUMMARY
| | | | | | | | | | |
| | | Year Ended
December 31,
2003(3)
| | Year Ended
December 31, 2002(2)
| | Year Ended
December 31,
2001
| | Year Ended
December 31,
2000
| | Year Ended
December 31,
1999(1)
|
| | | (tonnes) |
| | | Nickel-in-concentrate Produced |
Kambalda | | 25,912 | | 23,225 | | 18,653 | | 19,202 | | 11,114 |
Leinster | | 41,806 | | 40,006 | | 38,008 | | 40,724 | | 35,953 |
Mount Keith | | 50,004 | | 43,192 | | 47,930 | | 47,532 | | 41,208 |
| | |
| |
| |
| |
| |
|
Total | | 117,722 | | 106,423 | | 104,591 | | 107,458 | | 88,275 |
| | |
| |
| |
| |
| |
|
| |
| | | Kalgoorlie Smelter Production |
Concentrate treated | | 711,100 | | 640,500 | | 704,330 | | 737,244 | | 575,219 |
Matte produced | | 147,700 | | 134,400 | | 140,432 | | 148,051 | | 116,299 |
Nickel-in-matte produced | | 99,152 | | 91,574 | | 96,650 | | 103,019 | | 79,668 |
| |
| | | Kwinana Refinery Production |
Matte treated | | 92,000 | | 100,700 | | 94,208 | | 93,975 | | 79,792 |
Refined nickel produced | | 61,417 | | 65,055 | | 61,324 | | 60,532 | | 53,009 |
| | |
| |
| |
| |
| |
|
| (1) | | In 1999, the Kalgoorlie Nickel Smelter was shut down for 63 days for a major furnace rebuild following a furnace leak. |
| (2) | | In 2002, the Kalgoorlie Nickel Smelter was shut down for 24 days for repairs to the mist precipitators following a fire. |
| (3) | | In 2003, the Kwinana Nickel Refinery was shut down for 19 days for repairs following a rupture in the boiler tube. |
23
| | | | |
| | INFORMATION ON THE COMPANY | | |
The table below shows our proven and probable nickel ore reserves.
NICKEL ORE RESERVES(1), (2), (3)
As at December 31, 2003
| | | | | | | | | | | | | | | | |
Operation
| | Type of
Reserve(4)
| | Proven(5)
| | Probable(6)
| | Total
| | Assumed overall
Metallurgical
Recovery(7)
|
| | | | | Ore million tonnes
| | Grade %
| | Ore million tonnes
| | Grade %
| | Ore million tonnes
| | Grade %
| | (%)
|
Kambalda | | u/g | | — | | — | | 0.10 | | 3.30 | | 0.10 | | 3.30 | | 87 |
Leinster | | u/g | | 7.50 | | 1.80 | | 11.10 | | 1.90 | | 18.50 | | 1.80 | | 79 |
| | | o/c | | — | | — | | 0.60 | | 1.70 | | 0.60 | | 1.70 | | 76 |
| | | s/p | | 0.20 | | 1.90 | | — | | — | | 0.20 | | 1.90 | | 79 |
Mount Keith | | o/c | | 195.00 | | 0.56 | | 86.00 | | 0.57 | | 281.00 | | 0.56 | | 65 |
| | | s/p | | 27.20 | | 0.49 | | — | | — | | 27.20 | | 0.49 | | 48 |
| | | | |
| |
| |
| |
| |
| |
| |
|
| (1) | | The commodity price used to estimate the 2003 nickel ore reserves was A$5.00/lb. At the 3 year average exchange rate this equates to US$2.85/lb. |
| (2) | | Ore reserves reflect tonnages recoverable from mining. The estimates include diluting materials and allowances for losses which may occur when the material is mined but do not include adjustments for metallurgical recovery. |
| (3) | | We have a 100% interest in all operations. |
| (4) | | u/g – underground, o/c = open-cut, s/p = stockpile |
| (5) | | Approximate drill hole spacings we used to classify the proven ore reserves are: |
| | • | | Leinster (Perseverance Shoot) –£25m x 25m and |
| | • | | Mount Keith –£40m x 40m. |
| (6) | | Approximate drill hole spacings we used to classify the probable ore reserves are: |
| | • | | Leinster (Perseverance Shoot) –£50m x 50m and |
| | • | | Mount Keith –£80m x 80m. |
| (7) | | The metallurgical recovery factors included in the tabulation represent the estimated overall nickel recovery, from run-of-mine ore feed to final saleable product, assumed in the estimation of the ore reserves. The reported factors for the nickel operations are estimated primarily on the basis of the historical concentrator, smelter and refinery performance, and do not include current planned metallurgical recovery improvements. Assumed metallurgical recoveries for the individual components of the nickel business are the following: |
| | • | | Kambalda concentrator: 92%, |
| | • | | Leinster concentrator: 83% (u/g ore) and 80% (o/c ore) |
| | • | | Mount Keith concentrator: 68% (o/c ore) and 51% (s/p ore),. |
| | • | | Kalgoorlie Nickel Smelter: 97% |
| | • | | Kwinana Nickel Refinery: 98% |
In 2003, we continued our exploration work at our West Musgrave nickel-copper project in Western Australia. West Musgrave is located within the Musgrave Ranges north-east of Laverton near the South Australian border. The tenements lie entirely within Aboriginal Reserve No. A17614, administered by the Ngaanyatjarra Land Council. See discussion of West Musgrave at “Regional Exploration and New Business – Minerals Exploration – West Musgrave, Western Australia”.
Nickel Operations
Kambalda Nickel Operations
Our Kambalda operations are located 56 kilometers south of Kalgoorlie in Western Australia and comprise a concentrator and a high-grade nickel sulphide mine. Since early 2000, we have been selling our mines at Kambalda and entering into long-term nickel
24
| | | | |
| | INFORMATION ON THE COMPANY | | |
purchase agreements with the mine operators for the processing of ore and the purchase of subsequent concentrate. The divestment of the mines is part of our nickel strategy to divest mature mines where proven and probable reserves are nearly depleted and reduce the capital intensity of the operation. During the first half of 2002, we ceased mining ore at Kambalda and now rely entirely on third party ore for feed through the concentrator, some of which is sourced from mines previously owned by us. The Kambalda concentrator has a capacity of 1.5 million tonnes of ore per year. In 2003, the utilization of the Kambalda concentrator was approximately 54%. This is expected to increase to approximately 75% in 2004. The nickel concentrate, containing approximately 14% nickel, is dried at Kambalda and transported by rail to the Kalgoorlie Nickel Smelter for conversion to nickel-in-matte.
Purchases from third parties amounted to 25,940 tonnes of recovered nickel for the year ended December 31, 2003, and 20,900 tonnes for the year ended December 2002. We sold the lease containing the Miitel mine, previously on care-and-maintenance, in November 2000. During 2001 the Wannaway mine and North Widgiemooltha Block were sold to external parties. We leased land containing the Otter, Juan and Coronet North mines to third parties under a long term arrangement. We sold the Long Victor mine during September 2002. The Lanfranchi mine complex is the only mine at Kambalda we still own. We ceased mining at Lanfranchi at the end of March 2002. We anticipate that, subject to regulatory approval, we will enter into an agreement during 2004 to sublet this mine. We have entered into long-term nickel purchase agreements with the purchasers of these mines.
The net written down value of property and associated plant and equipment at Kambalda Nickel Operations at December 31, 2003 was A$15.2 million.
Leinster Nickel Operations
Leinster is approximately 375 kilometers north of Kalgoorlie in Western Australia. We purchased the Leinster Nickel Operations in 1988 from Mount Isa Mines and Western Selcast.
The site comprises underground and open pit mines and a concentrator and is supported by the nearby township of Leinster. The Leinster deposits consist of both medium-grade disseminated sulfide and sulfide mineralization with average grades of approximately 2.0%. During 2003, we sourced our Leinster production from the Perseverance underground mine and the Harmony open cut mine. The Leinster mill operating capacity is rated 2.7 million tonnes of ore per year and its utilization is currently approximately 92%. The nickel-in-concentrate, containing approximately 12% nickel, is dried at Leinster before being delivered to our Kalgoorlie Nickel Smelter for further processing.
The net written down value of our property and associated plant and equipment at Leinster Nickel Operations at December 31, 2003 was A$304.7 million. Our reserves are equivalent to approximately ten years life at current production rates.
Mount Keith Operations
Mount Keith is located in Western Australia, approximately 450 kilometers north of Kalgoorlie and 80 kilometers north of Leinster. The Mount Keith deposit is a low-grade disseminated sulphide ore body averaging some 0.6% nickel that is mined by open-cut method. The operation includes a concentrator and ancillary facilities and we officially commissioned it in January 1995.
We have an agreement to sell up to a maximum of 14,000 tonnes of nickel-in-concentrate per year to OMG Harjavalta Nickel Oy. The contract term will expire when 140,000 tonnes in total have been delivered, which is expected to occur in the first quarter of 2005. Mount Keith concentrates, containing approximately 20% nickel, not contracted for sale are transported by road to Leinster or Kambalda for drying and blending with other concentrates and then delivered to the Kalgoorlie Nickel Smelter for smelting.
The nominal capacity of the Mount Keith concentrator is 11.2 million tonnes of ore per annum. It currently has a utilization of approximately 100%. Average nickel recoveries of around 71% were achieved in 2003. We recently completed a feasibility study which indicates that the milling capacity at Mount Keith could be increased by up to 30%.
The net written down value of our property and associated plant and equipment at Mount Keith Operations at December 31, 2003 was A$531.6 million. Our reserves included in the current mine plan will be depleted in approximately 18 years at current production rates.
Kalgoorlie Nickel Smelter
We constructed the Kalgoorlie Nickel Smelter and commenced operation in 1972 to supply nickel matte under sales contracts to overseas nickel refiners and also to supply our nickel refinery at Kwinana. The smelter receives supplies of concentrate from the Kambalda, Leinster and Mount Keith treatment plants. We use a flash smelting process to produce matte containing 66% to 75% nickel and 2% to 3% copper.
25
| | | | |
| | INFORMATION ON THE COMPANY | | |
The Kalgoorlie Nickel Smelter also produces sulphuric acid. We sell most of the sulphuric acid to nickel laterite operations in the Kalgoorlie area, with some acid being used at Mount Keith and the Kwinana Nickel Refinery. In the year ended December 31, 2003, we produced 528,921 tonnes of sulphuric acid compared to 489,568 tonnes in the previous 12 months.
In the year ended December 31, 2003 approximately 63% of the nickel-in-matte we produced, and in the year ended December 31, 2002 approximately 72% of the nickel-in-matte we produced, was sent by rail to our refinery at Kwinana where we refined it to nickel metal. We exported the remainder.
The net written down value of our property and associated plant and equipment at the Kalgoorlie Nickel Smelter at December 31, 2003 was A$231.5 million.
Kwinana Nickel Refinery
The Kwinana Nickel Refinery is 30 kilometers south of Perth in Western Australia. We constructed the refinery, which commenced operation in 1970, and use the Sherritt-Gordon ammonia leach process to convert nickel matte from the Kalgoorlie Nickel Smelter into LME grade nickel briquettes and nickel powder. A small amount of higher grade nickel concentrate from Mount Keith has on occasion been used to supplement matte as feedstock. The refinery also produces a number of intermediate products, including copper sulphide, cobalt-nickel sulphide and ammonium sulphate. The cobalt-nickel sulphide is treated by a third-party processor that separates the nickel and cobalt into metal. We receive a credit for the nickel and have the cobalt metal returned for subsequent sale.
The net written down value of our property and associated plant and equipment at the Kwinana Nickel Refinery at December 31, 2003 was A$156.5 million.
Markets and Competition
Nickel is used primarily in the production of stainless steel, low alloy steels, nickel-based alloys to impart strength, toughness and corrosion resistance. It is also used for electroplating and the production of chemicals and batteries. Stainless steel accounted for approximately 67% of world primary nickel demand in 2003 and this percentage is expected to gradually increase as stainless steel is expected to grow faster than other nickel applications. In the western world, growth in demand for stainless steel has consistently outstripped growth in industrial production.
The London Metal Exchange is the central price setting market for most nickel. Having reached a cyclical low in 2001, nickel prices posted a modest recovery in 2002. Nickel prices strengthened further in 2003 due to higher stainless steel production, strong Chinese demand and tight availability of stainless steel scrap. Nickel prices in 2003 ranged from US$3.27/lb to US$7.56/lb, from a range of US$2.55/lb to US$3.50/lb in 2002 (average daily cash settlement). We believe that the medium-to long-term outlook is positive due to limited new supply coming on-stream and expected continued growth in stainless steel production as a result of substantial new capacity additions.
We sell nickel metal, nickel matte, nickel concentrate and various intermediate-products. Most of our nickel metal sales are made under short- to medium-term contractual arrangements. We sell nickel metal to a large number of customers in Europe, North America and Asia. We also maintain websites for the sale of cobalt metal.
Most of our nickel-in-matte sales are made under medium-to long-term contractual arrangements to customers in Asia and Europe. Our long-term contractual arrangements to supply 26,000 tonnes to Sumitomo progressively expires between 2003 and 2005. In 2002, we entered into a three year agreement, commencing in 2005, for 10,000 tonnes of nickel-in-matte per year with Jinchuan Non-Ferrous Metals I/E Company of China. In 2003, we concluded a second nickel-in-matte sales agreement with Jinchuan. The second contract is a six-year agreement, commencing in 2005, for 15,000 tonnes of nickel-in-matte per year.
26
| | | | |
| | INFORMATION ON THE COMPANY | | |
Our Olympic Dam Operations in South Australia are a significant Australian producer of both copper and uranium oxide. Our Olympic Dam subsidiary assumed 100% ownership of the Olympic Dam Operations on March 31, 1993 after previously holding 51% in the joint venture that established operations at Olympic Dam.
During 2002, Olympic Dam completed an optimization project to increase its production capacity to 235,000 tonnes per annum of refined copper. However, due to the rebuild of the copper and uranium solvent extraction plants, the planned reline of the smelter furnace and a failure of a heat exchanger in the acid plant, actual production in 2003 was 160,080 tonnes. We are planning production in 2004 to be approximately 230,000 tonnes of copper. Over the next two years, we will invest approximately A$50 million on the next phase of the Olympic Dam Development Study which may result in increasing copper production to in excess of 500,000 tonnes per annum.
A summary of our Olympic Dam copper, uranium oxide and gold and silver production is set out below
OLYMPIC DAM PRODUCTION SUMMARY
| | | | | | | | | | | | |
| | | | | Year Ended
December 31,
2003
| | Year Ended
December 31,
2002
| | Year Ended
December 31,
2001
| | Year Ended
December 31,
2000
| | Year Ended
December 31,
1999
|
Ore treated | | ‘000s tonnes | | 8,386 | | 8,875 | | 9,336 | | 8,901 | | 6,743 |
Grade of Ore: | | | | | | | | | | | | |
Copper | | % | | 2.42 | | 2.57 | | 2.47 | | 2.53 | | 2.69 |
Uranium oxide concentrate | | kilograms/tonne | | 0.63 | | 0.69 | | 0.72 | | 0.73 | | 0.78 |
Gold | | grams/tonne | | 0.47 | | 0.53 | | 0.59 | | 0.53 | | 0.65 |
Metal Produced: | | | | | | | | | | | | |
Refined copper | | tonnes | | 160,080 | | 178,120 | | 200,523 | | 200,423 | | 138,272 |
Uranium oxide concentrate | | tonnes | | 3,203 | | 2,891 | | 4,379 | | 4,539 | | 3,221 |
Gold | | ounces | | 86,117 | | 64,293 | | 113,412 | | 69,967 | | 30,510 |
| | | | |
| |
| |
| |
| |
|
In July 2002, we announced that a review of the smelting operations had identified that deterioration in excess of expectations in the furnace roof and sidewall refractory, and in adjacent taphole cooling jackets, would require increased maintenance and consequential down time that would impact copper production and might impact uranium oxide production. The review found that it would be prudent from an operating risk perspective to advance plans to reline the Olympic Dam furnace, which was previously scheduled for a smelter shutdown in the first half of 2004. As a result, we brought the reline forward to the second half of 2003. The shutdown was completed on October 9 over a period of 50 days and the smelter returned to capacity by the end of that month. The cost of shutdown was within the A$127 million budget. Operations were subsequently interrupted due to a foam-up of the furnace bath and failure of a heat exchanger in the acid plant. Our combined production loss was approximately 18,000 tonnes of copper and 340 tonnes of uranium oxide.
27
| | | | |
| | INFORMATION ON THE COMPANY | | |
The table below shows our proven and probable copper, uranium oxide and gold reserves at the Olympic Dam Operations.
OLYMPIC DAM ORE RESERVES(1),(2),(3),(4)
As at December 31, 2003
| | | | | | | | | | | | | | | | | | |
Commodity
| | Type of
Reserve (5)
| | Unit of Grade
| | Proven(6)
| | Probable(7)
| | Total
| | Assumed
Overall
Metallurgical
Recovery(8)
|
| | | | | | | Ore million
tonnes
| | Grade
| | Ore million tonnes
| | Grade
| | Ore million tonnes
| | Grade
| | %
|
Copper | | u/g | | % | | 115 | | 2.1 | | 615 | | 1.5 | | 730 | | 1.6 | | 93 |
Uranium | | u/g | | kg/tonne | | 115 | | 0.6 | | 615 | | 0.5 | | 730 | | 0.5 | | 72 |
Gold | | u/g | | gram/tonne | | 115 | | 0.6 | | 615 | | 0.5 | | 730 | | 0.5 | | 60 |
| | | | | | |
| |
| |
| |
| |
| |
| |
|
| (1) | | The commodity prices used to estimate the 2003 ore reserves were: A$1.42/lb for copper, A$23.33/lb for uranium and A$500/oz for gold. At the 3-year average exchange rate, this equates to US$0.81/lb for copper, US$13.32/lb for uranium and US$285/oz for gold. The uranium price reflects a premium over the spot price based on long-term contracts. |
| (2) | | Ore reserves at Olympic Dam contain copper, uranium and gold. The reported copper, uranium and gold grades are for the same reserve tonnage. |
| (3) | | Ore reserves reflect tonnages recoverable from mining. The estimates include diluting materials and allowances for losses which may occur when the material is mined but do not include adjustments for metallurgical recovery. |
| (4) | | We have a 100% interest in the Olympic Dam Operations. |
| (6) | | Approximate drill hole spacings we used to classify the proven ore reserves are£40m x 40m. |
| (7) | | Approximate drill hole spacings we used to classify the probable ore reserves are£80m x 80m. |
| (8) | | The metallurgical recovery factors included in the tabulation represent the estimated overall recovery of copper, uranium and gold, from run-of-mine ore feed to final saleable product, assumed in the estimation of the ore reserves. |
Olympic Dam’s current strategic approach can be summarized as follows:
| | • | | in the short term, complete commissioning of the copper solvent extraction circuit by the end of the first quarter and achieve annual copper production of approximately 230,000 tonnes in 2004; |
| | • | | to deliver consistent, reliable production performance |
| | • | | to increase output at minimum capital cost and reduce production costs through process improvements, technology and eliminating bottlenecks. |
Due to the size of the Olympic Dam ore body, there is potential to increase the size of the operation further. We are currently examining a number of options. However, any further expansion of Olympic Dam beyond the optimization project will first require various regulatory and governmental approvals covering a range of operational matters.
Olympic Dam Operations
We discovered the Olympic Dam copper, uranium, gold and silver deposit in 1975, 560 kilometers north-west of Adelaide in South Australia. It comprises a large number of discrete ore zones throughout an area of several square kilometers ranging in depth from 350 meters to approximately one kilometer. The Olympic Dam underground mining operation is highly mechanized, with automated rail transportation and underground crushing. The primary method of ore extraction is long hole open stoping with cemented aggregate fill. This method allows for large equipment to achieve high productivity and maximum ore recovery.
Ore is hoisted to the surface where it is fed to one of two grinding circuits. After grinding, the resultant slurry passes to a flotation circuit where a series of flotation stages and a further regrinding activity produce a copper concentrate. The concentrate then passes through a leaching circuit which is principally designed to extract uranium from the copper minerals. Uranium is extracted in a solvent extraction plant, producing yellow-cake, which is subsequently calcined to produce uranium oxide concentrate and then packaged in drums for export sales.
28
| | | | |
| | INFORMATION ON THE COMPANY | | |
After drying, copper concentrate is fed to an Outokumpu flash furnace smelter, which produces blister copper and flash furnace slag. Blister copper is transferred to anode furnaces for fire refining. Anode copper is transported to the refinery where the ISA electro-refining process is used to produce copper cathodes. The slimes from this process are treated separately to recover gold and silver.
Power for the Olympic Dam Operations is supplied via a 275kV power line from Adelaide, with power supplied currently under contract until July 2006 by TXU and transmitted by Electranet in accordance with theNational Electricity Code and theElectricity Act 1996 (SA) (as amended). We have finalized a formal contract with TXU covering a four-year term with an option to extend for two additional terms of three years. The new contract commenced operation for the supply of electricity to Olympic Dam from July 1, 2002.
Water supply for Olympic Dam is accessed from bore fields which draw from the Great Artesian Basin in South Australia. The operation has licenses from the relevant authorities to allow a drawdown (aquifer pressure) estimated to be the equivalent of 42 megalitres per day, of which 33 megalitres per day is currently used.
The Olympic Dam Operations produces both LME accredited electrolytic refined copper cathode and electro-won copper which is not LME accredited. We commenced production at Olympic Dam in 1988 at a rate of 45,000 tonnes per year of refined copper. Between 1989 and 1995, our production rate was increased, ultimately raising the ore mining capacity to approximately 3 million tonnes per year to supply a copper production capacity of approximately 85,000 tonnes per year. In 1999, we completed a major expansion of operations at Olympic Dam with production capacity increasing to approximately 200,000 tonnes of refined copper, 4,300 tonnes of uranium oxide, 75,000 ounces of refined gold and 850,000 ounces of refined silver per year. A further optimization project has taken our refined copper production capacity to 235,000 tonnes per annum. However, production in 2003 was 160,080 tonnes due to the plant shutdown to reline the smelter, the rebuild of the copper and uranium solvent extraction plants and a failure of a heat exchanger in the acid plant. We expect production in 2004 to be approximately 230,000 tonnes of refined copper.
The Olympic Dam Operations experienced a fire in the copper solvent extraction circuit in 1999 which resulted in a loss of approximately 7,150 tonnes of copper production. We experienced a further fire in both the copper and uranium solvent extraction area in 2001. We expect the total cost of the rebuild to be approximately A$375 million with the uranium circuit completed in 2003 and the copper solvent extraction plant was completed in the second half of 2003. The rebuild cost and costs of lost production will be partially offset by insurance proceeds of more than A$120 million, consisting of at least of A$80 million for business interruption and A$40 million for material damage. The total amount of insurance proceeds is under negotiation with our insurers.
The net written down value of our property and associated plant and equipment at Olympic Dam at December 31, 2003 was A$3.6 billion. Reserves included in our current mine plan will be depleted in approximately 20 years at current production rates.
The Indenture Agreement
On June 21, 1982, the Government of South Australia, by an Act of the Parliament of that State, called the Roxby Downs (Indenture Ratification) Act of 1982, ratified an agreement between the State of South Australia and the then-current Olympic Dam Operations joint venturers. This Act:
| | • | | levies an ad valorem royalty of 3.5% on the value of the products dispatched from the mine. A second tier of additional royalty is also levied when the after-tax rate of return from the operation is greater than a threshold rate of 1.2 times the 10-year Australian government bond rate. After December 31, 2005, the royalty reverts to the royalty under the State Mining Act which, at present, is 2.5% (however, the government have indicated its intention to increase this to 3.5% in the future); |
| | • | | confers continuing mining rights (via a Special Mining Lease) at Olympic Dam Operations for the deposit’s expected mine life |
| | • | | confers the right to draw water; |
| | • | | provides Government infrastructure and services; and |
| | • | | permits production of up to 350,000 tonnes of copper per year. |
The Special Mining Lease relating to our Olympic Dam Operation has been granted for a period of fifty years with rights of extension for further periods of fifty years.
For information on native land claims refer to Item 8A “Legal Proceedings”.
29
| | | | |
| | INFORMATION ON THE COMPANY | | |
Markets and Competition
Copper
Industrial usage of copper derives from its electrical and thermal conducive properties, its durability and strength. Copper has many end uses, including consumer products, transport, industrial machinery, construction and electronic products.
Copper is an internationally traded commodity, traded on the LME in London and the COMEX division of the New York Mercantile Exchange in New York.
The average copper price in 2003 was US$0.81/lb (US$1,786/tonne). Prices in 2003 improved significantly in the second half due to strong consumption growth in Asia, and China in particular.
Olympic Dam’s copper production is sold to customers in Europe, Australia and Asia under contracts which are negotiated annually. Contract prices are based on the LME cash settlement price.
Uranium Oxide – as a co-product to copper at Olympic Dam
The only significant commercial end use of uranium is as fuel for nuclear power electricity generating plants. Nuclear power currently accounts for approximately 16% of the world’s electricity requirements. Depending upon overall growth of electricity production from other sources, nuclear power’s share is expected to decline over the decade to comprise approximately 13% to 14% of total electricity production by 2010. Production is spread among a number of countries, with Canada and Australia being the largest producers. The industry is dominated by a small number of large producers. Worldwide annual mine production amounts to approximately 46,000 tonnes of uranium oxide.
The rapid growth of uranium consumption in the 1970s and 1980s slowed in the 1990s with reduced construction of new power reactors. However, demand has continued to strongly outstrip mine supply, requiring continued draw-down of diminishing secondary stockpiles. Former Russian military uranium has been entering the commercial market in increasing quantities since 1995. The recent and expected future rate of such market entry is 24 million pounds of uranium oxide per year.
In the near term, Russian uranium will probably keep the uranium spot price lower than it would otherwise be, but in the longer term this material is expected to be needed to meet commercial demand and therefore is not expected to materially affect price. However, depending on the level of future commercial uranium prices, the presence of former Russian military uranium may result in the deferral of one or more new mine projects, the development of which are price-sensitive. For various reasons, it is unlikely that former US military uranium will become available to the commercial market during the next 10-year period.
Uranium oxide is not traded on an official exchange and the spot market is highly illiquid as most uranium oxide is sold under long-term contract (three-to-ten years). In spite of this, the spot market is important as pricing under a significant portion of long-term contracts is linked to the spot market. Spot prices in 2003 averaged US$11.56/lb uranium oxide.
Our objective is to match sales of uranium to production, with the bulk of production committed under long-term sales contracts with well-established and reputable electricity generating utilities. In 2003, we sold uranium oxide to the United Kingdom, Finland, Sweden, Belgium, France, Japan, Canada and the United States.
Uranium is exported in accordance with Australian government regulations and the requirements of bilateral safeguards agreements between the Australian government and the recipient’s national government.
30
| | | | |
| | INFORMATION ON THE COMPANY | | |
We hold mining leases over two phosphate deposits in north-west Queensland. Our major phosphate resource is located at Phosphate Hill, 140 kilometers southeast of Mount Isa. The principal activities at Phosphate Hill are conducted on Mining Lease 5543, which expires on October 31, 2035. Currently, mining is from three open pits using excavators and trucks. Ore is treated through a beneficiation plant which has a four-stage process of crushing, washing and de-sliming, grinding, thickening and slurry storage. We completed the construction of the Queensland Fertilizer Operation at the end of 1999, and commissioned the integrated plant during 2000.
Sulphuric acid is sourced from an acid plant we own located adjacent to Xstrata Plc’s Mt Isa smelter and from the Korea Zinc plant at Townsville. The acid plant has a production capacity of approximately 1.1 million tonnes of sulphuric acid per year. The agreement with Xstrata to convert the smelter off-gases to sulphuric acid obligates both parties on a “reasonable endeavors” basis. If for some reason sulphur dioxide gas is unavailable, the acid plant burns sulphur to produce sulphur dioxide, although production volumes and costs would be affected if the sulphur dioxide gas from the acid plant was not available for an extended period of time. We transport sulphuric acid to Phosphate Hill in specially designed rail tanker wagons.
Sulphuric acid is combined with filter cake from the beneficiation plant in a phosphoric acid plant to produce phosphoric acid and gypsum. The phosphoric acid plant at the Queensland Fertilizer Operations is a hemihydrate plant with a production capacity of 485,000 tonnes per annum.
In the ammonia plant, ammonia is produced by combining hydrogen from natural gas and nitrogen from air. In the granulation plant, phosphoric acid is reacted with ammonia to form ammonium phosphate slurry which is pumped into the granulator where it forms granules of fertilizer, as either di-ammonium phosphate (DAP) or mono-ammonium phosphate (MAP). We transport the final product by rail to handling and storage facilities in Townsville under the terms of a 20-year take-or-pay rail transport contract with Queensland Rail to a minimum annual tonnage of approximately one million tonnes. The Townsville storage facilities have a capacity of 90,000 tonnes.
We store gypsum onsite at Phosphate Hill in large lined dams. Gypsum storage and disposal is a significant cost for the operation, as the production process produces large quantities of gypsum. We are currently exploring longer-term low-cost alternatives for the storage and/or use of the gypsum produced.
We source power at Phosphate Hill from on-site third-party gas fired turbines. We purchase natural gas for power and ammonia production under a long-term contract with Santos Ltd and others. We source this gas from the Cooper Basin gas fields in south-west Queensland via the AGL Carpentaria gas pipeline.
We source our water from a series of bores into nearby aquifers within the mining lease area. These should be adequate to meet requirements for at least 10 to 15 years. We are currently pursuing access to other identified sources.
Our current principal strategic objectives for our Queensland Fertilizer Operations are to:
| | • | | Consolidate operating performance at the annual design capacity of 960,000 tonnes; |
| | • | | Reduce operating costs and obtain additional low-cost production through plant optimization and de-bottlenecking; |
| | • | | Develop domestic and export markets; |
| | • | | Increase production of MAP-based products; |
| | • | | Increase our wholly-owned subsidiary, Hi-Fert Pty Ltd’s, market position and profitability, and |
| | • | | Improve our domestic sales volume of ammonium phosphates. |
Following a period of poor returns, the domestic and international fertilizer markets are undergoing consolidation. Queensland Fertilizer Operations will consider all its strategic options to participate in this process.
We are currently investigating ways to increase the percentage of MAP produced and the possible introduction of sulphur fortified MAP for which there may be increased market demand.
31
| | | | |
| | INFORMATION ON THE COMPANY | | |
The table below details principal components and location of the Queensland Fertilizer Operations:
Queensland Fertilizer Operations
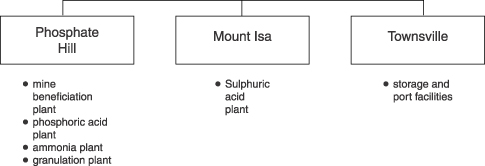
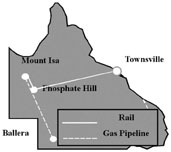
32
| | | | |
| | INFORMATION ON THE COMPANY | | |
The table below shows our Phosphate Hill fertilizer production over the last four years.
PHOSPHATE HILL PRODUCTION SUMMARY
| | | | | | | | | | |
| | | Year Ended
December 31,
2003
| | Year Ended
December 31,
2002
| | Year Ended
December 31,
2001
| | Year Ended
December 31,
2000
| | Year Ended
December 31,
1999
|
| | | (tonnes) |
Di-ammonium phosphate (DAP) | | 759,856 | | 718,287 | | 651,498 | | 326,262 | | 5,143 |
Mono-ammonium phosphate (MAP) | | 162,121 | | 102,713 | | 57,947 | | — | | — |
| | |
| |
| |
| |
| |
|
A production efficiency study to investigate ways to increase annual production of phosphate fertilizer by 15% to approximately 1.1 million tones has been completed. This is expected to be implemented over the next few years
The table below shows our proven and probable phosphate ore reserves.
PHOSPHATE HILL ORE RESERVES(1), (2), (3)
As at December 31, 2003
| | | | | | | | | | | | | | |
Type of Reserve(4)
| | Proven Ore(5)
| | Probable(6)
| | Total
| | Assumed
Overall
Metallurgical
Recovery(7)
|
| | | Ore million
of tonnes
| | Grade (% P2O5)
| | Ore million
of tonnes
| | Grade (% P2O5)
| | Ore million
of tonnes
| | Grade (% P2O5)
| | %
|
o/c | | 31.6 | | 24.2 | | 58.3 | | 24.3 | | 89.9 | | 24.3 | | 85 |
s/p | | 0.6 | | 21.8 | | — | | — | | 0.6 | | 21.8 | | 85 |
| | |
| |
| |
| |
| |
| |
| |
|
| (1) | | The commodity price used to estimate the 2003 ore reserves was A$300/tonne (for DAP free-on-board Tampa). At the 3-year average exchange rate, this equated to US$171/tonne (for DAP free-on-board Tampa). In addition to the DAP price, premiums for MAP products and the freight differential between Australia and Tampa contributed to the realized revenue. |
| (2) | | Ore reserves reflect tonnages recoverable from mining. The estimates include diluting materials and allowances for losses which may occur when the material is mined but do not include adjustments for metallurgical recovery. |
| (3) | | We have a 100% interest in the Phosphate Hill operation. |
| (4) | | O/c = open cut, s/p = stockpile |
| (5) | | Approximate drill hole spacings we used to classify the proven ore reserves were£40m x 40m. |
| (6) | | Approximate drill hole spacings we used to classify the probable ore reserves were£120m x£120m. |
| (7) | | The metallurgical recovery factors included in the tabulation represent the estimated overall recovery of P2O5 from run-of-mine ore feed to final saleable product, assumed in the estimation of the ore reserves. The reported recovery refers to the combined recovery of the beneficiation plant and the phosphoric acid plant. |
The net written down value of property and associated plant and equipment at our Queensland Fertilizer Operations at December 31, 2003 was A$540.8 million. Reserves included in our current mine plan will be depleted in approximately 30 years at current production rates.
33
| | | | |
| | INFORMATION ON THE COMPANY | | |
Markets and Competition
Our wholly-owned subsidiary, Hi-Fert Pty Ltd, is a distributor of fertilizers in Australia and currently has a market share of DAP sales of approximately 26% for the eastern states of Australia. During 2003, we continued our market development strategy, in support of ongoing growth in production from our fertilizer operations. Our focus is on delivering fertilizer products to the Australian market, which yields the best margins for our operations. In particular, we have continued to increase the domestic sales of MAP as we move toward an even production split between MAP and DAP.
We have marketing arrangements in place for our total fertilizer production based on 2003 volumes. We have supply contracts in place with major Australian fertilizer distributors for the delivery of between 440,000 and 590,000 tonnes of DAP per year and for between 120,000 and 200,000 tonnes of MAP per year. We have an export marketing agreement in place with Cargill Fertilizers Incorporated for 350,000 to 500,000 tonnes per year of ammonium phosphate fertilizers. Sales through Cargill have targeted Asian markets where our product enjoys a comparative freight advantage.
Ammonium phosphate fertilizers are increasing their share of both the global and Australian domestic phosphate fertilizer market due to their high nutrient content and savings in storage, handling, transportation and application costs. Within the Australian domestic market, MAP demand is growing at a greater rate than DAP, which supports our strategy of increasing the production of MAP.
The generally accepted benchmark for ammonium phosphate fertilizer is based on US Gulf of Mexico prices. The DAP price has increased substantially over 2003, increasing from US$149 per tonne (free-on-board Tampa) to US$204 per tonne at the end of the year. This rise has continued into the first quarter of 2004 to reach US$216 per tonne by the end of March 2004. This price strength has been driven by a combination of strong international demand, particularly in Latin America, and increased manufacturing input costs such as ammonia, which hit 28 year high price levels, forcing producers to raise prices to cover costs.
34
| | | | |
| | INFORMATION ON THE COMPANY | | |
| 4. | | REGIONAL EXPLORATION AND NEW BUSINESS |
Minerals Exploration
Exploration is a core component of our growth management strategy. Our global minerals exploration program seeks to deliver mineral discoveries that provide significant growth opportunity in locales where we can effectively manage the business and technical risks. During 2003, we conducted exploration in Australia, China, Peru, Mongolia, Tanzania, Malawi, Turkey and the USA.
We spent A$24.2 million on minerals exploration for continuing operations for the year ended December 31, 2003. Our expenditure for the year ended December 31, 2002 was A$23.4 million. We continued to focus our exploration on green fields, targeting and testing for deposits of nickel, copper and gold.
West Musgrave, Western Australia
During 2001, we received results from the West Musgrave area of Western Australia. We tested two prospects, 4 kilometers apart, by diamond-drilling targeted on separate geophysical anomalies, with both intersecting nickel and copper sulphide mineralization. In 2001, we also announced encouraging drill results from the Nebo and Babel prospects in the West Musgrave area of central Western Australia. We continued drilling on those prospects during 2002 and 2003. Results have been varied, although we have drilled significant nickel, copper sulphide and platinum group metal mineralization over a strike extending five kilometers. We are continuing to assess and interpret these results.
Our exploration in this area is currently focused on identifying thicker zones of mineralization at both Nebo and Babel while broader, regional exploration continues. We currently manage more than 7,600 square kilometers of granted exploration tenure in the region. We recently completed a regional electromagnetic survey covering approximately 3,200 square kilometers of prospective tenure in the region. We are still interpreting the results of this survey in preparation for ground follow-up of prospective anomalies. In 2003, we reached an agreement with the local communities and the Ngaanyatjarra Land Council that provides us with land access to selected exploration licences in the region. This agreement will enable us to investigate further airborne electromagnetic targets we identified during 2003.
New Business
Mozambique - Corridor Sands Project
The Corridor Sands heavy minerals project contemplates the exploitation of large, currently undeveloped mineral sands deposits situated in southern Mozambique. The project envisages a world-scale integrated mining, concentration and smelting operation to produce titanium dioxide slag, used to produce pigments for brightness and opacity in the manufacture of paint, paper and plastics. We are working towards development of the project to meet forecast demand for additional titanium dioxide slag in late 2007/early 2008.
In November 2000, after an earlier due diligence investigation, we paid Southern Mining US$15 million for an exclusive option to study and acquire a controlling interest in the project. We completed a bankable feasibility study in 2002. During 2003, we began discussions with major customers to establish firm purchase agreements.
On December 9, 2002, we announced that we had agreed to acquire 100% of the Corridor Sands project from Southern Mining Corporation Limited. The total consideration paid was US$87.5 million and comprised two tranches. The first tranche was satisfied by the issue on December 9, 2002 of 14,080,604 shares in each of WMC Resources and Alumina Limited, valued at US$62.5 million (based on the respective share prices of each company on that date). The second tranche of US$25 million was paid by issuing 6,715,123 WMC Resources shares to Southern Mining Corporation in December 2003. During 2003, the Industrial Development Corporation of South Africa exercised its option to acquire a 10% interest in the project for US$10 million. This transaction is still subject to Reserve Bank of South Africa approval. The corporation will fund its share of project activities once approval is received. We are continuing discussions regarding the possible introduction of a new partner or partners.
35
| | | | |
| | INFORMATION ON THE COMPANY | | |
The table below shows WMC Resources proven and probable mineral sands ore reserves.
CORRIDOR SANDS ORE RESERVES(1), (2),(3),(4)
As at December 31, 2003
| | | | | | | | | | | | | | |
Type of Reserve(5)
| | Proven Ore(6)
| | Probable(7)
| | Total
| | Assumed
Overall
Metallurgical
Recovery(8)
|
| | | Ore million
of tonnes
| | Grade Ilmenite %
| | Ore million
of tonnes
| | Grade Ilmenite %
| | Ore million
of tonnes
| | Grade Ilmenite %
| | %
|
o/c | | 685 | | 4.8 | | 122 | | 3.7 | | 807 | | 4.7 | | 37 |
| | |
| |
| |
| |
| |
| |
| |
|
| (1) | | An ilmenite equivalent price per tonne of titanium slag, including revenue from by-products, of US$480 was assumed for ore reserve estimation. |
| (2) | | Ore reserves reflect tonnages recoverable from mining. The estimates include allowances for losses which may occur when the material is mined but do not include adjustments for metallurgical recovery. |
| (3) | | We currently have a 100% interest in the Corridor Sands project. The Industrial Development Corporation of South Africa agreed to exercise its option to acquire a 10% interest in the Corridor Sands project. However, completion of this option exercise is still subject to approval of the Reserve Bank of South Africa. |
| (4) | | The technical phase of WMC’s bankable feasibility study on the Corridor Sands project was concluded in July 2002. The ore reserves, on the basis of only a notional first-twenty-year optimal pit design for the West Block of the main deposit, are estimated at 807 million tonnes grading 4.65 per cent ilmenite, 0.17 per cent zircon and 0.02 per cent rutile. |
| (6) | | Approximate drill hole spacings we used to classify the proven ore reserves were£250m x 125m. |
| (7) | | Approximate drill hole spacings we used to classify the probable ore reserves were£500m x£250m. |
| (8) | | The reported metallurgical recovery factor represents the overall ilmenite yield from run-of-mine crude ilmenite to titanium slag. |
Environmental Matters
Our environmental policy states our commitment to achieve compatibility between economic development and the maintenance of the environment, and to observe all applicable environmental laws. Primary responsibility for environmental matters rests with site management. A corporate environmental group provides technical and professional support to the line managers in the execution of the environmental policy and implementation of the environment health and safety management system. The management system, consistent with the requirements of ISO4001, is in place at all of our operations. Audits of conformance with the management system are undertaken internally, with external verification of conformance undertaken annually. Environmental compliance is reported monthly to the Board of Directors. Initiatives for the improved use of water and energy and other resources have been introduced, as have initiatives for the reduction of emissions to the atmosphere. We published our ninth annual Sustainability Report in 2004. Previous to 2001, these reports were published as the Environmental Progress Report. The 2002 and 2003 reports are exclusively web-based.
We have mineral-producing operations and conduct exploration in many countries. Our activities are subject to various laws governing the protection of the environment in areas such as air and water quality, emissions, waste disposal, environmental impact assessments, land rehabilitation and access to, and use of, ground water. A failure by us to comply with the laws in relation to environmental issues might result in sanctions such as: fines; orders requiring additional environmental controls; more onerous license conditions or curtailment of operations.
We continue to invest in plant and equipment to improve the reliability and environmental performance of our operations and to ensure compliance with regulatory requirements. Our principal environmental costs continue to be recovery of contaminated
36
| | | | |
| | INFORMATION ON THE COMPANY | | |
groundwater at the Baldivis tailings storage facility. To December 31, 2003, we have spent A$83.4 million (A$79.9 million as at the end of 2002) on groundwater remediation at our Kwinana and Baldivis facilities. Current remediation work at Kwinana has been completed and we anticipate that work at Baldivis will continue until approximately 2008, at a further cost of A$27.1 million.
We have accrued and continue to accrue financial provisions for meeting environmental obligations for site closure and rehabilitation across all our sites. Our basis for accruing provisions is reviewed annually by sites and undergoes independent triennial corporate reviews. As at December 31, 2003, we had set aside A$111.5 million for such provisions.
We cannot reasonably estimate the cost of future compliance or remedial work or further investment necessitated through the introduction of further environmental regulation or by any causes of contamination, including those occurring prior to the introduction of such regulation or before or after the property in question was owned or occupied by us. Among other things, the level of these costs will be dependent upon the nature and extent of the current and future environmental regulation, the time and nature of required remedial work, the extent of any contamination, the technology available to meet the required standards, the determination of our liabilities in proportion to those of other parties and the extent to which costs are recoverable from insurance and third parties.
Australian Mining Law and Leases
In Australia, with few exceptions, all onshore mineral rights are reserved to the government of the relevant State or Territory. Exploration for minerals is regulated by the general mining legislation of the relevant State or Territory and controlled by the relevant State or Territory government department. Where native title has not been extinguished, native title legislation may apply to the grant of tenure and some subsequent administrative processes (see Item 8A, “Legal Proceedings – Native Title in Australia”).
Where large-scale mining projects are involved, mining leases can also be granted pursuant to specific legislation of the State or Territory. Such mining leases involve complex agreements with State or Territory governments on matters such as water rights, the size of the mining tenements, protection of the environment, the provision of infrastructure and the payment of royalties. In South Australia, the Olympic Dam Operations special mining lease is an example of this type of agreement (see Item 4D, “Property, Plant and Equipment – Copper – Indenture Agreement”).
In addition, a number of mineral leases and mining leases pertaining to the Kambalda Nickel Operations and Leinster Nickel Operations were issued pursuant to the Nickel Refinery (Western Mining Corporation Limited) Agreement Act 1968 (WA) and the Nickel (Agnew) Agreement Act 1974 (WA), respectively.
Our nickel operating properties are located in the State of Western Australia. Upon application to the Western Australian Department of Mineral and Petroleum Resources, the mining registrar or the warden may grant a prospecting license. The warden is also responsible for providing recommendations in relation to exploration licenses to the Minister who, in turn, may grant an exploration license. Exploration or prospecting licenses generally grant exclusive rights to explore for minerals in an area for a set period, as long as the holder complies with the provisions of the relevant Mining Act relating to conditions of tenure and minimum annual expenditure.
In most Australian states, if the holder of an exploration license establishes indications of an economic mineral deposit and expends a minimum level of investment, it may apply for a mining lease. In Western Australia the maximum area of a mining lease is 10 square kilometers and the maximum initial term is 21 years. A general purpose lease may also be granted for one or more of a number of permitted purposes. These purposes include erecting, placing and operating machinery in connection with mining operations, depositing or treating minerals or tailings and using the land for any other specified purpose directly connected with mining operations.
In Western Australia, the holder of an exploration license can obtain a mining lease without establishing an economic deposit. This gives the holder exclusive mining rights on the property. The Minister for Mines of the State of Western Australia may grant or refuse a mining lease at his discretion, regardless of the warden’s recommendations. If the applicant is the holder of an exploration license and the holder has complied with the conditions attaching to the exploration license, an application, generally, will be granted. However, a 1994 decision of the Full Court of the Supreme Court of Western Australia held that the “automatic grant” was subject to the Minister’s discretion to refuse the mining lease application on reasonable grounds in the public interest, such as major environmental issues.
Upon expiration of the initial term of a Western Australian mining lease, the holder has the right to renew the lease for a further period of 21 years. Subsequent renewals are subject to the Minister’s discretion.
37
| | | | |
| | INFORMATION ON THE COMPANY | | |
Holders of mining leases must pay royalties on minerals extracted from the mining area. The amount of the royalty payable is specified in the relevant legislation. The royalty on sales of nickel in Western Australia is 2.5% of the free on board contained metal value of nickel sold.
See Item 4D “Property, Plant and Equipment – Copper – Indenture Agreement” for the royalties payable with respect to the Olympic Dam Operations.
In addition to the aforementioned leases, we own freehold property which include mineral rights at Kambalda in Western Australia and the tenure underlying the Olympic Dam Operations. No royalty is payable by us to the State of Western Australia for nickel production from the mines operated by third parties and located on the freehold land at Kambalda, although a royalty is payable to a prior holder of the freehold property.
A summary of our significant leases and freehold property for Western Australian, South Australian and Queensland operations follows.
| | | | | | | | |
Operation
| | Relevant Act(s)
| | Term
| | Expiration Date of Lease(1)
| | Life of
Approved
Mine Plan
|
Kambalda Nickel Operations | | Mining Act 1978 (WA) | | Leases are currently within their initial 21-year lease period. A further 21 years is available as a right of renewal. Further renewals are at Minister’s discretion. | | 2005-2006
2010-2011
2015, 2019 | | 3 |
| | | | |
| | | Nickel Refinery (Western Mining Corporation Limited) Agreement Act 1968 (WA) | | All leases have completed their initial term of 21 years. All leases had an option to be renewed for a further period of 21 years. This option has been exercised against all leases. A second renewed term is available for a further period of 21 years. However, grant of this renewal is at the Minister’s discretion. These tenements can also be replaced by WA Mining Act 1978 mining leases in which case they would become subject to the provisions of that Act. | | 2007-2008
2014
2017-2018 | | |
| | | | |
| | | Transfer of Land Act (WA) Mining on Private Property Act 1898 (WA) | | In perpetuity | | | | |
| | | | |
Leinster Nickel Operations | | Nickel (Agnew) Agreement Act 1974 (WA) | | Lease has completed its initial term of 21 years. Option for a renewed term of a further period of 21 years has been exercised. Lease has unlimited rights for renewal for further periods of 21 years. This lease can also be replaced by WA Mining Act 1978 mining leases in which case they would become subject to the provisions of that Act. | | 2019 | | 10 |
| | | | |
| | | Mining Act 1978 (WA) | | Leases are currently within their initial 21-year lease period. A further 21 years is available as a right of renewal. Further renewals are at Minister’s discretion. | | 2004
2008-2010
2012-2013
2015 | | |
38
| | | | |
| | INFORMATION ON THE COMPANY | | |
| | | | | | | | |
Operation
| | Relevant Act(s)
| | Term
| | Expiration Date of Lease(1)
| | Life of
Approved
Mine Plan
|
Mount Keith Operations | | Mining Act 1978 (WA) | | Leases are currently within their initial 21-year lease period. A further 21 years is available as a right of renewal. Further renewals are at Minister’s discretion. | | 2008
2011-2016 | | 18 |
| | | | |
Olympic Dam Operations | | Roxby Downs (Indenture Ratification) Act 1982 (SA) | | 50 years plus right to renew for further periods of up to 50 years | | 2036 | | 20 |
| | | | |
| | | Real Property Act 1886 (SA) | | In perpetuity | | | | |
| | | | |
Phosphate Hill | | Mineral Resources Act 1989 (Qld) | | 40 years plus renewal periods as negotiated with Queensland Government | | 2035 | | 30 |
| (1) | | There may be a number of lease agreements applicable for each operation |
39
| | | | |
| | OPERATING AND FINANCIAL REVIEW AND PROSPECTS | | |
ITEM 5. OPERATING AND FINANCIAL REVIEW AND PROSPECTS
The following discussion of our operating performance and financial condition uses financial data prepared in accordance with Australian GAAP. The differences between US GAAP and Australian GAAP which are relevant to the preparation of our Consolidated Financial Statements are discussed in Item 3A and outlined in Notes 45 and 46 to the Consolidated Financial Statements.
Demerger
We were formed as a result of the demerger of WMC Limited into two entities. Pursuant to the demerger, we acquired the copper-uranium and fertilizer businesses, two finance vehicles, WMC Finance Limited and WMC Finance (USA) Limited, as well as exploration and development interests (other than those relating to AWAC). We already held WMC Limited’s nickel business. WMC Limited, now renamed Alumina Limited, continues to hold the interest in AWAC, costs associated with AWAC and exploration and development interests related to AWAC.
The following discussion of our operating and financial review has been prepared, like the historical financial statements on which the discussion is based, as though we had existed as a stand-alone economic entity, consisting of the businesses and assets identified above, for each of the periods presented. This presentation includes the results of operations which have been discontinued, such as gold and talc, the proceeds from the sale of these same discontinued businesses and the associated hedging losses incurred by them. As a result, the financial presentation does not entirely reflect our businesses and assets on an on-going-forward basis, the latter being focused upon the nickel, copper/uranium and fertilizer businesses.
In addition, although the financial statements include all costs and revenues incurred by us for the reported periods, they do not necessarily reflect what the costs and revenues would have been had we existed as a separate, stand-alone economic entity during the periods presented. In particular, in order to achieve improved financial outcomes, management might have made different decisions regarding exploration, project evaluation, corporate expenditure activities and capital structure. Some of the uncertainties surrounding our operating and financial prospects are described in the section entitled “Risk Factors.”
The transactions that occurred in conjunction with the demerger and the manner in which the demerger has been implemented, will also have an effect on our results of operations and financial position in future years relative to our historical results of operations and financial position discussed in this section. In particular, as part of the demerger, we acquired WMC Limited’s copper/uranium and fertilizer businesses and WMC Limited’s international exploration assets and businesses (other than those relating to AWAC) at their fair value as required under Australian GAAP. These internal acquisitions resulted in an increase in the reported value of our consolidated property, plant and equipment and will result in correspondingly higher depreciation and amortization expense in future years compared to historical periods. In addition, in connection with the demerger, we replaced WMC Limited’s debt facilities and borrowings with new debt facilities and borrowings. As a result, following implementation of the demerger, our level of debt was reduced by approximately A$577 million. This lower level of debt will also result in a lower level of annual interest expense associated with borrowings in future years compared to historical periods. Finally, the transfers of WMC Finance Limited and WMC Finance (USA) Limited in connection with the demerger resulted in the accounting for the derivative and financial instruments held in these entities at fair value on the date of transfer as required under Australian GAAP. As a result, our future earnings will only be impacted, in respect of these instruments, by the movement in commodity prices and exchange rates between the date of transfer and the maturity date, although future cash flows will still be impacted in respect of these instruments by the movement in commodity prices and exchange rates between the dates when the contracts were originally entered into and their maturity dates.
40
| | | | |
| | OPERATING AND FINANCIAL REVIEW AND PROSPECTS | | |
Basis of Preparation
2003 fiscal year
The financial statements for the year ended December 31, 2003 reflect the financial performance of the operations of the WMC Resources Ltd group for the full financial year as, on a statutory basis, we controlled the copper-uranium, fertilizer and finance activities for the full 2003 fiscal year.
2002 and 2001 fiscal years
In compliance with Australian Accounting Standards and the Corporations Act 2001, for Australian reporting purposes, we were required to prepare Australian statutory accounts, for the year ending December 31, 2002 on a legal entity basis which, for these purposes, reflect the results of the nickel operations and corporate activities for the full 2002 financial year, but only include the results of the copper-uranium, fertilizer and finance activities for the month of December 2002, the period from the consummation of the demerger until the end of the financial year. As the statutory presentation does not reflect the full annual financial results of all the businesses that now comprise our group, the Consolidated Financial Statements included in this Annual Report have been prepared on a “carve out” basis as though we controlled the copper-uranium, fertilizer and finance activities for the full 2001 and 2002 fiscal years. A reconciliation of net income on a statutory basis to net income on a “carve out” basis for the year ended December 31, 2002 has been included in “Reconciliation between net income on a statutory basis and net income on a carve-out basis” in this Annual Report.
Critical Accounting Policies
Our critical accounting policies are more fully described in Note 1 to our Consolidated Financial Statements, in respect of Australian GAAP, with differences in accounting policies for US GAAP more fully described in Note 45 to the Consolidated Financial Statements. Some of our accounting policies require the application of significant judgment by management in selecting the appropriate assumptions for calculating financial estimates. By their nature, these judgments are subject to an inherent degree of uncertainty and are based on our historical experience, terms of existing contracts, management’s view on trends in the mining industry and information from outside sources.
Our management believes the following critical accounting policies, among others, affect our more significant judgments and estimates used in the preparation of our consolidated financial statements and could potentially impact our financial results and future financial performance.
Our critical accounting policies include those discussed below.
Amortization of mine properties and mine development assets
We calculate the amortization of mine properties on a straight line basis over the estimated remaining life of those mines or the life of the specific asset, whichever is shorter. Our estimates of remaining mine lives are determined as the period of time over which proven and probable reserves determined in accordance with the SEC’s Industry Guide 7 are expected to be extracted.
We calculate the amortization of our capital cost of mine development on a units-of-production basis over the proven and probable reserves determined in accordance with the SEC’s Industry Guide 7 included in the current mine plan. In order to calculate the amortization charge, we total the costs of development, including net costs, incurred to date and estimated future development costs, and divide this by the total proven and probable reserves included in the current mine plan. We calculate the annual depletion based on the units of production during the period multiplied by the per-unit cost.
Our estimate of the total expected future lives and production of our mines could be materially different from our actual production in the future and the actual lives of the mines due to changes in the factors used in determining our ore reserves, such as the commodity prices and foreign currency exchange rates. Any change in management’s estimate of the total expected future lives of our mines may impact the amortization charges we record in our consolidated financial statements in relation to mine properties and mine development. In addition, actual future costs of mine development could differ from those estimated for the purpose of determining the rate of amortization.
Where ore has been mined and subsequently stockpiled for future processing, we include it in the determination of proven and probable reserves. However, we do not include this stockpiled ore in the total reserves used in the amortization calculation for mine development, as this calculation only references proven and probable reserves included in our current mine plan.
41
| | | | |
| | OPERATING AND FINANCIAL REVIEW AND PROSPECTS | | |
For US GAAP purposes, amortization of the deferred costs of mine development is calculated on a units-of-production basis over the proven and probable reserves which relate to the particular category of development, either “life of mine plan” reserves or reserves for which no further capital expenditure is required. No future developments costs are taken into account in calculating the amortization charge.
Life of mine plan development comprises capital expenditures that will be utilized in the extraction of all the proven and probable ore reserves in the current detailed mine plan. These expenditures are predominantly incurred up front and in advance of any ore extraction or during major expansions. The types of development included in this category are ore haulage shafts, initial decline, ore passes and chutes and underground ore crusher cavities and are intended to be used for the extraction of all ore within the current mine plan. These costs are amortized on a units-of-production basis over the total proven and probable reserves in the current mine plan.
Development which is amortized over reserves for which no further capital is required comprises capital expenditure to provide access to various areas within the mine to allow the extraction of ore to commence. The types of development included within this category are: access and perimeter drives, ventilation drives and rises, and progressive declining subsequent to initial contact with the ore body. These costs are amortized on a units-of-production basis over the proven and probable reserves that can be currently accessed without future capital development costs being incurred.
Post-production waste removal
We accumulate all costs of post-production waste removal (stripping) from open pit mines, and defer them on the balance sheet as part of the total of mine properties and mine development. These costs include the costs of drilling, blasting, loading and haulage of waste rock from the open pit to the waste pile. Consistent with the methodology described above for amortization of mine development costs, we combine these costs with expected future costs of waste removal and amortize them on a units of production basis over proven and probable reserves determined in accordance with the SEC’s Industry Guide 7 included in the current mine plan.
Variations exist in the accounting methods adopted by companies in the mining industry to account for post-production waste removal costs, and certain companies expense these costs as incurred. If we had not adopted a policy of deferring and amortizing these costs, we would have experienced greater volatility in period-to-period results.
For US GAAP purposes, deferred waste removal costs are considered deferred production costs and classified as other non-current assets in the balance sheet, and operating cash flows in the cash flow statement. The amortization of deferred post-production waste removal costs is determined by applying a life-of-mine waste-to-metal stripping ratio. The stripping ratio is calculated by comparing the recoverable metal included in the proven and probable reserves to be extracted over the life of the mine to the total volume of waste to be extracted over the same period. This ratio is then applied to the production of metal for the period to determine the amortization charge.
Recoverable value of long-lived assets
We carry our long-lived mining assets at depreciated historical cost. Our management reviews these carrying values for impairment on a half-yearly basis. Where necessary, we revalue the carrying amounts of non-current assets downwards to their recoverable amount. Our reviews are based on undiscounted projections of anticipated future cash flows to be generated by utilizing the long-lived assets.
For US GAAP purposes, our long-lived mining assets are reviewed for impairment annually and when events or changes in circumstances indicate that the carrying amount of an asset may not be recoverable. If we deem an asset impaired, an impairment loss is measured and recorded based on the fair value of the asset, which generally will be computed using discounted expected future cash flows.
While management believes that these estimates of future cash flows are reasonable, different assumptions regarding projected commodity prices, production costs and foreign currency exchange rates could materially affect the anticipated cash flows to be generated by the long-lived assets, thereby affecting the evaluations of the carrying values of the long-lived assets.
Deferred taxation
When determining deferred taxation, our management makes estimates as to the future recoverability of deferred tax assets. If management determines that a deferred tax asset will not be realized, we would record a charge for that portion of the deferred tax assets which is not considered recoverable. These determinations are based on the projected realization of tax allowances and tax losses.
42
| | | | |
| | OPERATING AND FINANCIAL REVIEW AND PROSPECTS | | |
In the event that these tax losses recognized as assets are not realized, an adjustment would be required to income in the period that the determination was made. Likewise, should our management determine that we would be able to realize tax assets in the future in excess of the recorded amount, we would record an adjustment to increase the deferred tax asset as a credit to income in the period that the determination is made.
Under Australian GAAP, the threshold test that must be met to recognize a deferred tax asset is that recoverability must be virtually certain for tax losses and beyond reasonable doubt for timing differences. Under US GAAP, recoverability of the deferred tax asset must be considered to be more likely than not.
Environmental rehabilitation costs
We make provision for environmental rehabilitation costs and related liabilities based on our management’s interpretations of current environmental and regulatory requirements. In addition, final environmental rehabilitation obligations are estimated based on these interpretations, with provisions made over the expected lives of our operations. While our management believes that the environmental rehabilitation provisions made are adequate and that the interpretations applied are appropriate, the amounts we estimate for the future liabilities may differ materially from the costs that will actually be incurred. We reassess estimated cost of rehabilitation on a regular basis. If our management determines that we have created an insufficient rehabilitation provision, we will adjust earnings prospectively. Our rehabilitation provisions as at December 31, 2003 were A$111.5 million in the aggregate, compared to estimated total future costs of A$379.1 million.
For US GAAP purposes, we bring to account (calculated at a discounted present value) an asset retirement obligation and a matching asset at the initial point the liability is incurred, generally when the mine or production facility is first commenced. We amortize the cost of the obligation over the life of the related long-lived asset. Increases in the obligation as a result of the passage of time are treated as an operating expense.
Accounting for derivative instruments and hedging activities
We defer certain unrealized gains and losses on derivatives contracts that are used to hedge changes in cash flows from forecasted transactions, and bring these amounts to account when the hedged transaction is recognized in income. See item 11 “Qualitative and Quantitative Disclosures about Market Risks”, as well as Note 1(w) to our Consolidated Financial Statements for an expanded discussion of our accounting policy under Australian GAAP, and Note 45(h) for discussion under US GAAP. Our hedged forecasted transactions are based on detailed production forecasts, which are based on the mine plans, and amounts hedged are based on a portion of our reserves determined in accordance with the SEC’s Industry Guide 7, and as determined in accordance with our treasury risk management guidelines. On this basis, we consider the forecasted transactions to be probable of occurring, however changes in ore reserves due to changes in commodity prices or exchange rates could result in these transactions failing to occur, in which case, we would bring to account immediately any unrecognized gains or losses on derivative contracts.
General Factors
Our operations during the three-year period ended December 31, 2003 were characterized by a focus upon our core businesses of nickel, copper/uranium (Olympic Dam) and fertilizers (Phosphate Hill). This strategy, begun in the 1990s when our operations were part of WMC Limited, included: major investment and restructuring to enhance the competitiveness and quality of our assets, with an emphasis on developing fully integrated production facilities to achieve efficiency and a competitive cost base, exploring expansion opportunities at existing businesses and focusing on sites with long-life reserves. In addition, non-core businesses, such as oil and gas, talc and gold were divested. Performance in fiscal 2001 was impacted by a fire in the solvent extraction plant at our Olympic Dam operations in October 2001, production difficulties associated with the setting up of the Queensland Fertilizer operations, and falling commodity prices.
Our performance in the year ended December 31, 2002 continued to be negatively influenced by the production constraints related to downtime for repairs and disruptions to production. Our Olympic Dam copper/uranium and nickel businesses experienced higher per unit costs of sales during the year, although commodity prices began to recover during the period.
Performance in fiscal 2003 strengthened significantly reflecting a strong performance from the nickel business due to high nickel prices and sound operating performance. The gains from the nickel business were partially offset by the appreciating Australian dollar and production constraints at Olympic Dam.
Our financial and operational performance and prospects are influenced by a number of factors. The following is a discussion of the key general factors which affect our business and financial performance.
43
| | | | |
| | OPERATING AND FINANCIAL REVIEW AND PROSPECTS | | |
Commodity prices
We sell products which are commodities and our financial performance is significantly influenced by the prices we obtain for these products. The price of a commodity is generally determined by, or linked to, the price for that product in the world markets. World commodity prices are subject to changes in supply and demand, and characterized by significant fluctuations. The volatility of commodity prices means that the sales revenues and, absent mitigating factors, profit generated by sales of our products can vary considerably from period to period, even where production levels and costs remain constant. For information about commodity price movements for nickel, copper, gold and fertilizer, see the section entitled “Qualitative and Quantitative Disclosures About Market Risk—Average Quarterly Prices”.
Fluctuations in the A$/US$ Exchange Rate
The world commodity prices for the products we sell are denominated in, or linked to, the US$. By contrast, most of our costs are denominated in A$ and our accounts are prepared in A$. As a consequence, fluctuations in the rate of exchange between the US$ and A$ may have an effect on our financial results. Absent mitigating factors such as foreign currency hedging, an appreciation of the US$ relative to the A$ increases the value of sales revenues as compared to costs and has a positive impact on profit. Depreciation in the US$ compared to the A$ decreases the value of sales revenue to costs and exerts negative pressure on our profit. For information about movements in the US$/Australia $ exchange rate, see the section entitled “Exchange Rates”.
Capital Expenditures
Mining is a capital intensive business, where much investment in infrastructure and plant is required. Recent major capital expenditures include the rebuild of uranium and copper solvent extraction plants at Olympic Dam and the expansion of the Perseverance mine at Leinster. These are discussed in more detail below.
Nickel Operations
In 2001, our nickel operations were subject to lower commodity prices and higher production costs placing significant negative pressure on profit. Higher realised prices and higher sales volumes of concentrate and nickel metal were offset only partially by reduced nickel matte sales and higher cost of sales contributed to an improved profit for 2002. We curtailed nickel matte production in the first half of 2002 following a shutdown of the acid plant at the Kalgoorlie smelter for repairs. In 2003, our nickel business recorded stronger profits. This was due to higher realized nickel prices and the highest level of nickel-in-concentrate for five years following record production at Mount Keith. We are pursuing a strategy of focusing upon longer-life and higher quality operations and thus have sold off or closed our mines at Kambalda where proven and probable reserves are nearly depleted. In addition, we are currently expanding the Perseverance mine at Leinster at a total cost of A$179.1 million. Approximately 90% of our nickel metal sales are made under short- to medium-term contractual arrangements.
Olympic Dam Operations
A fire at the Olympic Dam operation’s solvent extraction plant in October 2001 resulted in a A$71.8 million charge for the write-off of assets and reduced production in the 2001 year, a A$97.7 million charge due to reduced production in 2002 and a further A$48.5 million charge due to reduced production in 2003. The rebuilt uranium solvent extraction plant was commissioned in the first half of 2003, and construction of the copper solvent extraction plant was completed in the second half of 2003. The scheduled relining of the furnace was completed within the forecast timeframe and budget in 2003. Operations in the last quarter of 2003 were interrupted by a foam-up of the furnace bath and the failure of a heat exchanger in the acid plant. As a consequence of these repairs, refurbishment activities and the smelter reline, refined copper production for 2003 was approximately 160,080 tonnes. In 2002, we completed an optimization project to take the annual capacity from approximately 200,000 tonnes of refined copper to 235,000 tonnes, but this level of production has not yet been achieved, although we currently expect to achieve approximately 230,000 tonnes in 2004. We sell approximately 90% of copper production under contracts which are negotiated annually. More than 90% of our uranium oxide production is committed under long-term sales contracts. Over the next two years, we will invest approximately A$50 million on the next phase of the Olympic Dam Development Study which may result in increasing copper production to in excess of 500,000 tonnes per annum.
Queensland Fertilizer Operations
The Queensland Fertilizer Operations experienced inconsistent production and historically low di-ammonium phosphate (DAP) prices in 2001. During 2002, our production rate increased and we achieved over 95% of design capacity in October 2002. This capacity, however, was offset by a decrease in fertilizer prices, resulting in a loss in 2002. In 2003, record production and higher DAP prices were offset by unfavorable exchange rate movements, resulting in a small loss. The Phosphate Hill site has the potential for future development but such opportunities are still in the early stages of study. We sell almost 100% of fertilizer production under contract.
44
| | | | |
| | OPERATING AND FINANCIAL REVIEW AND PROSPECTS | | |
Regulatory Environment
We are subject to extensive regulation in Australia and abroad. Of particular importance in Australia is the impact of native title claims on mining and other leases. See Item 8A, “Legal Proceedings – Native Title in Australia”. Furthermore, mining leases are subject to certain conditions. We are also subject to regulation on environmental matters, with special regulations applying in the context of the export and handling of uranium.
Competitive Environment
Our competitive position is based on our core longer-life assets, which are complemented by fully integrated production facilities, all of which are being optimized to lower costs and increase production. We also continue to engage in exploration to identify new ore bodies and development opportunities. Our competitive position is further enhanced by the fact that most of our operations are in politically stable, low-risk jurisdictions and that we have striven to achieve a high level of environmental and health and safety compliance.
Outlook for 2004
Group
We expect that favourable market conditions for each of our commodities will continue throughout 2004. The strength in commodity prices is expected to be partially offset by the strong appreciation of the Australian dollar relative to the US dollar.
Strong production is expected from each operation and we remain focused on delivering safe, sustained and consistent performance from each of our operations.
Nickel
Concentrate production is expected to be lower in 2004, with completion of the Harmony open cut mine at Leinster and completion of higher grade ore from the bottom of Stage E pit at Mount Keith. Mount Keith output will be constrained in 2004 by the move into the new Stage F cutback which we expect to yield lower ore grades and recoveries. Matte production at Kalgoorlie smelter is expected to be correspondingly lower (in the range of 90,000 to 95,000 tonnes).
Metal production at the Kwinana refinery is expected to be slightly higher at 62,000 tonnes with output constrained in the first half by the triannual statutory maintenance shutdown.
A key project for 2004 is the continued development of the Perseverance lower mine at Leinster. The project includes access tunnels, ventilation systems, crushing, materials handling and hoisting infrastructure to enable mining down to 1,100 metres below the surface. The majority of the project work will be completed by the end of 2005, with 2004 capital expenditure expected to be in the order of A$70 million.
Olympic Dam Operations
Copper production is expected to be at design capacity following commissioning of the copper solvent extraction plant in the first quarter of 2004. Full year production is expected to be approximately 230,000 tonnes of copper and 4,200 tonnes of uranium.
An important program in 2004 will be positioning the mine to progressively ramp up production rates to 11 million tonnes of treated ore by the end of 2005 and towards 12 million tonnes of treated ore by 2007. We expect that total capital expenditure in the mine will correspondingly increase to approximately A$80m in 2004 reflecting increased underground development, drilling, ventilation and mobile equipment. The increased mining rates will also require a reduction in the overall underground void with correspondingly higher backfill volumes and costs in the short to medium term.
The primary emphasis at Olympic Dam for 2004 remains on delivering sustained and consistent performance from all aspects of the operation.
45
| | | | |
| | OPERATING AND FINANCIAL REVIEW AND PROSPECTS | | |
Queensland Fertilizer Operations
Our Queensland Fertilizer Operation is expected to produce approximately 960,000 tonnes of fertilizer in 2004. Trials are underway at Phosphate Hill to increase the production of MAP fertilizer and to produce a sulphur-fortified MAP variation to meet customer demand.
We have also developed a program of low cost de-bottlenecking to increase annual production of DAP and MAP fertilizer by 15% to around 1.1 million tonnes per annum over the next few years.
2003 Compared to 2002
Overview
Our consolidated net profit after tax from continuing operations was A$239.1 million for the year ended December 31, 2003 compared with a net loss after tax of A$14.7 million for the year ended December 31, 2002. Our net sales revenue from continuing operations amounted to A$3,001.3 million for the year ended December 31, 2003 compared with A$2,487.2 million for the comparable previous year, an increase of 20.7%. Our net income was positively influenced by an increase in earnings from nickel, a decrease in interest expense and an improved result from our fertilizer operations. These were partly offset by reduced copper production and associated sales volumes, a weaker US dollar relative to the Australian dollar and reduced income from significant items.
Revenues
Our sales revenue from continuing operations for the year ended December 31, 2003 increased to A$3,001.3 million, up from A$2,487.2 million in the year ended December 31, 2002. The increase was driven by higher nickel prices up from an average of US$3.07 per pound in 2002 to US$4.36 per pound in 2003, offset by a weaker US dollar relative to the Australian dollar and reduced copper production and sales (as detailed in the following table). Net foreign exchange and commodity price hedging gains of A$72.1 million in 2003 were up, from a loss of A$113.3 million in the comparable period in 2002 due to the weaker US dollar relative to the Australian dollar, reduced quantum of hedge positions in 2003 and the impact of acquisition of the hedge book at fair value as part of the demerger. The following tables show our sales volume by major product category for 2003 and 2002 and the average prices for our products.
| | | | |
| | | Year ended December 31,
|
SALES VOLUME SUMMARY
| | 2003
| | 2002
|
Nickel (‘000 tonnes) | | | | |
- Nickel-in-concentrate | | 14.9 | | 14.1 |
- Nickel-in-matte | | 36.5 | | 25.7 |
- Nickel metal | | 60.9 | | 64.8 |
Refined copper (‘000 tonnes) | | 174.5 | | 186.1 |
Uranium oxide (tonnes) | | 4,575.0 | | 3,888.0 |
Fertilizer (‘000 tonnes) | | 1,244.0 | | 1,254.0 |
- Queensland Fertilizer Operations external sales | | 689.0 | | 606.0 |
- Hi Fert sales | | 555.0 | | 648.0 |
| | |
| |
|
| |
| | | Year ended December 31,
|
PRICES SUMMARY(1)
| | 2003
| | 2002
|
Nickel (US$/lb) | | 4.36 | | 3.07 |
Copper (US$/lb) | | 0.81 | | 0.71 |
Fertilizer (US$/tonne) | | 180 | | 157 |
| | |
| |
|
| (1) | | Average prices for the periods presented. |
46
| | | | |
| | OPERATING AND FINANCIAL REVIEW AND PROSPECTS | | |
Costs
Our total costs from continuing operations of A$2,801.8 million for the year ended December 31, 2003 were marginally higher than the comparable period in 2002 of A$2,799.6 million. The marginal increase was due to an increase in costs of production of A$217 million due to costs of third party ore for feed in our nickel operations and an increase in selling and distribution expenses of A$81.9 million, offset by a reduction in net borrowings costs of A$83.9 million and lower income from significant items of A$209.9 million (as a result of insurance payments of A$120.0 million and proceeds from early termination of interest rate swaps of A$75.9 million recognized in 2002).
Depreciation and amortization from continuing operations decreased to A$508.3 million from A$511.0 million in 2002.
In 2003, borrowing costs were reduced by A$83.9 million compared to 2002, due to more favourable rates on our new global bond issue. The reduction in interest costs was similar in magnitude to the A$75.9 million profit we recognized on the early termination of interest rate swaps in 2002, resulting in an overall marginal difference in our net borrowing cost of A$46.3 million in 2003 compared to A$48.7 million in 2002.
Profit
Our consolidated net profit after tax from continuing operations was A$239.1 million for the year ended December 31, 2003 compared with a net loss after tax of A$14.7 million for the year ended December 31, 2002. The significant increase in our net result after tax was primarily attributable to increased sales revenues, reduced borrowing costs and lower general and administrative and other expenses offset by non-recurring significant items recorded in 2002 of insurance income and proceeds from early termination of interest rate swaps.
Cash flow
Our net cash inflow from operating activities for the year ended December 31, 2003 was A$642.5 million, compared to A$358.4 million for the year ended December 31, 2002. Key factors impacting net cash flow from operating activities were:
| | • | | receipts from customers increased by 21.7% to A$2,987.3 million, principally due to higher nickel and copper prices partially offset by a weaker US dollar relative to the Australian dollar; |
| | • | | payments to suppliers and employees increased by 10.2% to A$2,251.8 million from A$2,043.4 million in the year ended December 31, 2002 principally due to increased production and increased costs of third party ore for feed in our nickel operations; and |
| | • | �� | proceeds we received in 2003 from the close out of the 2005 to 2008 hedge book of A$18.1 million compared to proceeds of A$71.2 million received from the close out of an interest rate swap in 2002. |
Our net cash outflow from investing activities for the year ended December 31, 2003 was A$679.9 million, compared to a net cash outflow from investing activities of A$402.7 million in the year ended December 31, 2002. The key factors contributing to the outflow from our investing activities in 2003 compared to 2002 were:
| | • | | proceeds from the sale of non-current assets of A$22.6 million compared to proceeds of A$25.7 million from the sale of Central Norseman Gold Corporation Ltd and our gold royalty right with respect to the St Ives and Agnew gold operations sold in 2001 (classified as discontinued operations) in 2002; |
| | • | | payments for property, plant and equipment amounted to A$661.9 million, compared to A$464.9 million in 2002 principally due to costs incurred on the rebuild of the copper and uranium solvent extraction plans and other major maintenance shutdowns; |
| | • | | payment of A$34.4 million in 2002 for close out of gold hedge contracts following the sale of the gold business in 2001; and |
| | • | | payment of A$45.2 million of demerger costs in 2003. |
Net cash inflow from our financing activities was A$60.3 million, compared to a net cash inflow from financing activities of A$15.8 million for the year ended December 31, 2002, principally due to:
| | • | | net proceeds of borrowings of A$53.9 million in 2003 against a net repayment of A$446.4 million in 2002; |
| | • | | proceeds from share issues of A$54.8 million in 2003; |
| | • | | a A$12.4 million net increase in contributed equity in 2002 reflecting the equity cashflows retained by us but incurred by WMC Limited prior to the demerger |
47
| | | | |
| | OPERATING AND FINANCIAL REVIEW AND PROSPECTS | | |
| | • | | payment of A$38.5 million for the close out of interest rate hedge book in 2003; |
| | • | | payment of a fee for the redemption of our Yankee Bonds of A$150.2 million in 2002; and |
| | • | | a transfer of A$577 million net debt (consisting of a transfer of A$600 million debt, net of A$23 million retained cash) to Alumina Limited as part of the demerger in 2002. |
Balance sheet
Our net assets increased by 9.5% to A$3,949.7 million from A$3,606.6 million at December 31, 2002, including an increase in our total assets to A$7,560.2 million from A$7,348.1 million. The increase in our net assets mainly reflects a reduction in interest bearing liabilities from A$1,657.5 million at December 31, 2002 to A$1,353.2 million at December 31, 2003 due to the decline in value of our US dollar denominated debt in Australian dollar terms. The A$212.1 million increase in our total assets was principally due to an increase of A$184.2 million in the value of plant and equipment to A$4,520.5 million reflecting the capitalized costs of the rebuild at Olympic Dam net of the impact of depreciation and amortization charges.
Segment Results
Nickel
Our profit before hedging, interest and tax increased to A$394.7 million in 2003, compared with a profit before hedging, interest and tax of A$270.7 million in 2002. Our higher profit before hedging, interest and tax in 2003 was principally due to higher revenue of A$410.5 million offset by reduced overall production and increased production costs. An unplanned shutdown of the Kwinana Nickel Refinery reduced overall nickel metal production by 6% compared to 2002. However, nickel-in-concentrate production was at its highest levels for five years following record production at Mt Keith, strong ouput from Leinster and increased third party feed to Kambalda. The average unit cost of nickel metal sales (net of by-product credits) for 2003 was A$4.79/lb, compared to A$4.17lb in 2002, as a result of lower production following the unplanned shutdown for repairs to the boiler at the Kwinana Nickel Refinery and increased purchases and costs (related to the higher nickel price) of third party concentrate feed. This replaced concentrate feed previously produced internally from the Kambalda mines, which we have now sold. The following table provides information regarding the performance of our nickel business unit in 2003 and 2002.
| | | | | |
| | | Year ended December 31,
| |
NICKEL PERFORMANCE SUMMARY
| | 2003
| | 2002
| |
| | | A$ millions | |
Financial | | | | | |
Profit before hedging, interest and tax(1) | | 394.7 | | 270.7 | |
Commodity/currency hedging | | 43.7 | | (58.0 | ) |
| | |
| |
|
|
Profit before interest and tax | | 438.4 | | 212.7 | |
Foreign currency revaluation | | 34.1 | | 9.5 | |
Intra-group sales | | — | | (0.7 | ) |
| | |
| |
|
|
Segment result(2) | | 472.5 | | 221.5 | |
| | |
| |
|
|
Sales revenue (net of hedging) | | 1,827.2 | | 1,314.9 | |
Capital expenditure | | 219.0 | | 191.0 | |
Total assets | | 1,823.7 | | 1,696.0 | |
| | |
| |
|
|
| | | ‘000 tonnes | |
Production | | | | | |
Nickel-in-concentrate | | 117.7 | | 106.4 | |
Nickel-in-matte | | 99.2 | | 91.6 | |
Nickel metal | | 61.4 | | 65.1 | |
| | |
| |
|
|
| | | ‘000 tonnes | |
Sales | | | | | |
Nickel-in-concentrate | | 14.9 | | 14.1 | |
Nickel-in-matte | | 36.5 | | 25.7 | |
Nickel metal | | 60.9 | | 64.8 | |
| | |
| |
|
|
| (1) | | We have included information concerning profit before hedging, interest and tax in our segment results as we believe this is a useful measure of operational performance because it removes items not related to the underlying performance of the business segment and it is also commonly used by certain investors to evaluate the core results of our segments. Profit before hedging, |
48
| | | | |
| | OPERATING AND FINANCIAL REVIEW AND PROSPECTS | | |
| | | interest and tax is not a measure of financial performance under Australian GAAP and should not be considered an alternative to, or more meaningful than, income before interest and income tax or net income/(loss) attributable to holding company shareholders. Our consolidated results as discussed herein include the results of hedging, interest and tax. |
| (2) | | Segment result is segment revenues less segment expenses. Segment revenues include operating revenues from ordinary activities before tax, resulting from the operating activities of a segment that are directly attributable to a segment, and a portion of other revenues that can be allocated on a reasonable basis to the segment. Segment result in 2003 does not include interest, foreign currency revaluations or intra-group sales. |
The nickel refinery at Kwinana produced 61,417 tonnes of nickel metal in 2003, down from 65,055 tonnes in 2002, following the unplanned shutdown for repairs to the boiler.
Our sales revenue increased to A$1,827.2 million in 2003 compared to A$1,314.9 million in 2002 due to our higher realized Australian dollar prices resulting from a weaker US dollar relative to the Australian dollar and higher sales volumes of concentrate and nickel metal, offset in part by reduced matte sales. Hedging gains at A$43.7 million in 2003, compared to the loss of A$58.0 million in 2002 reflecting the weaker US dollar during 2002 and the reduced quantum of hedging contracts.
We are continually reviewing the mine plans for our open cut mines and making changes as appropriate to reflect updated information. Changes to the mine plans for the Mount Keith and Harmony mines in the six months to December 31, 2003 have resulted in changes to stripping ratios, which have had a positive impact on profit of A$5.4 million (credit) (2002: A$1.1 million credit). Realized nickel metal prices in Australian dollars averaged A$6.70 per pound for the year ended December 31, 2003, an increase over the average price for the year ended December 31, 2002 of A$5.55 per pound again reflecting the stronger nickel commodity prices in 2003.
Copper/Uranium
Our loss before hedging, interest and tax was A$127.8 million in 2003, compared with a profit before hedging, interest and tax of A$90.4 million in 2002. Our loss before hedging, interest and tax in 2003 was principally due to lower sales volumes from reduced production, a decline in the value of the US dollar as well as insurance revenue of A$120 million recognized in 2002.
Our production continued to be impacted by the fire in the solvent extraction plant in October 2001 and the consequent rebuild of the copper and uranium solvent extraction plants. Downtime to repair a failure of a heat exchanger in the acid plant and a planned reline of the smelter furnace and a foam up in the furnace bath also impacted production. As a result, refined copper production decreased by 10% to 160,080 tonnes. Our uranium oxide production increased by 11% to 3,203 tonnes in 2003. This production however, did not completely fulfill our sales commitments. We fulfilled the balance of our uranium sales commitments through a combination of on-market purchases and uranium loans. The following table provides information regarding the performance of our copper and uranium business in 2003 and 2002.
| | | | | | |
| | | Year ended December 31,
| |
COPPER AND URANIUM PERFORMANCE SUMMARY
| | 2003
| | | 2002
| |
| | | A$ millions | |
Financial | | | | | | |
Profit before hedging, interest and tax(1) | | (127.8 | ) | | 90.4 | |
Commodity/currency hedging | | 22.7 | | | (41.6 | ) |
| | |
|
| |
|
|
Profit before interest and tax | | (105.1 | ) | | 48.8 | |
Intra-group purchases | | 7.6 | | | 5.0 | |
| | |
|
| |
|
|
Segment result(2) | | (97.5 | ) | | 53.8 | |
| | |
|
| |
|
|
Sales revenue (net of hedging) | | 719.0 | | | 723.3 | |
Capital expenditure | | 396.7 | | | 216.0 | |
Total assets | | 4,313.0 | | | 4,146.2 | |
| | |
|
| |
|
|
Production | | | | | | |
Refined copper (‘000 tonnes) | | 160.1 | | | 178.1 | |
Uranium oxide (tonnes) | | 3,203 | | | 2,891 | |
| | |
|
| |
|
|
Sales | | | | | | |
Refined copper (‘000 tonnes) | | 174.5 | | | 186.1 | |
Uranium oxide (tonnes) | | 4,575 | | | 3,888 | |
| | |
|
| |
|
|
49
| | | | |
| | OPERATING AND FINANCIAL REVIEW AND PROSPECTS | | |
| (1) | | We have included information concerning profit before hedging, interest and tax in our segment results as we believe this is a useful measure of operational performance because it removes items not related to the underlying performance of the business segment and it is also commonly used by certain investors to evaluate the core results of our segments. Profit before hedging, interest and tax is not a measure of financial performance under Australian GAAP and should not be considered an alternative to, or more meaningful than, income before interest and income tax or net income/(loss) attributable to holding company shareholders. Our consolidated results as discussed herein include the results of hedging, interest and tax. |
| (2) | | Segment result is segment revenues less segment expenses. Segment revenues include operating revenues from ordinary activities before tax, resulting from the operating activities of a segment that are directly attributable to a segment, and a portion of other revenues that can be allocated on a reasonable basis to the segment. Segment result does not include interest, foreign currency revaluations or intra-group sales. |
Our sales revenue decreased to A$719 million in the year ended December 31, 2003, compared to A$723.3 million in the comparable period of 2002, in line with lower sales reflecting reduced production and a lower realized copper price (in Australian dollar terms). In 2002, we recognized preliminary insurance claims totalling A$120 million for both business interruption (A$80 million) and material damage (A$40 million) associated with the solvent extraction plant fire.
Our sales revenue includes hedging gains of A$22.7 million in 2003, compared to the A$41.6 million of hedging losses in 2002, reflecting the weaker US dollar during 2002 and the reduced quantum of hedging contracts.
The increase in total assets of A$166.8 million was primarily attributable to the capitalized costs of the copper and uranium solvent extraction plant rebuild.
The rebuild of the solvent extraction plant continued during 2003 with the uranium circuit completed in the first half of 2003 and construction of the copper solvent extraction plant was completed in the second half of 2003. During 2002, we completed an optimization project to increase our capacity to 235,000 tonnes of copper cathode on schedule and on budget. We estimate our production of refined copper to be approximately 230,000 tonnes in 2004. The plant is targeted to operate at the rate of 235,000 tonnes per annum in 2005.
Copper prices averaged US$0.81 per pound in 2003, up 14% on the average price in the year ended December 31, 2002 of US$0.71 per pound. Australian dollar prices averaged A$1.27 per pound for the year ended December 31, 2003, down 2.3% on the average price in the year ended December 31, 2002 of A$1.30 per pound, due to the weaker US dollar relative to the Australian dollar in the year ended December 31, 2003.
Fertilizer Operations
We had a loss before hedging, interest and tax of A$23.7 million in 2003, compared to a loss before hedging, interest and tax of A$41.2 million in 2002. Our reduced loss before hedging, interest and tax in 2003 was as a result of increased production partially offset by lower realized Australian dollar prices.
50
| | | | |
| | OPERATING AND FINANCIAL REVIEW AND PROSPECTS | | |
| | | | | | |
| | | Year ended December 31,
| |
FERTILIZER PERFORMANCE SUMMARY(1)
| | 2003
| | | 2002
| |
| | | A$ millions | |
Financial | | | | | | |
(Loss) before hedging, interest and tax(2) | | (23.7 | ) | | (41.2 | ) |
Commodity/currency hedging | | 5.7 | | | (12.3 | ) |
| | |
|
| |
|
|
(Loss) before interest and tax | | (18.0 | ) | | (53.5 | ) |
Intra-group sales | | (7.6 | ) | | (3.9 | ) |
| | |
|
| |
|
|
Segment result(3) | | (25.6 | ) | | (57.4 | ) |
| | |
|
| |
|
|
Sales revenue (net of hedging) | | 428.1 | | | 420.4 | |
Capital expenditure | | 40.5 | | | 50.2 | |
Total assets | | 753.5 | | | 720.6 | |
| | |
|
| |
|
|
| | | ‘000 tonnes | |
Production | | | | | | |
Phosphate fertilizer | | 922 | | | 821.0 | |
| | |
|
| |
|
|
| | | ‘000 tonnes | |
Sales | | | | | | |
Queensland Fertilizer Operations external sales | | 689 | | | 606 | |
Hi-Fert sales | | 555 | | | 648 | |
| | |
|
| |
|
|
| (1) | | Includes performance of wholly-owned subsidiary Hi Fert Pty. Ltd. |
| (2) | | We have included information concerning loss before hedging, interest and tax in our segment results as we believe this is a useful measure of operational performance because it removes items not related to the underlying performance of the business and it is also commonly used by certain investors to evaluate the core results of our segments. Profit before hedging, interest and tax is not a measure of financial performance under Australian GAAP and should not be considered an alternative to, or more meaningful than, income before interest and income tax or net income/(loss) attributable to holding company shareholders. Our consolidated results as discussed herein include the results of hedging, interest and tax. |
| (3) | | Segment result is segment revenues less segment expenses. Segment revenues include operating revenues from ordinary activities before tax, resulting from the operating activities of a segment that are directly attributable to a segment, and a portion of other revenues that can be allocated on a reasonable basis to the segment. Segment result does not include interest, foreign currency revaluations or intra-group sales. |
The increase in total assets of A$32.9 million is primarily attributable to the recognition of additional deferred tax benefits.
Our production in 2003 was 922,000 tonnes of ammonium phosphate fertilizer, an increase of 12.3% from the 821,000 tonnes we produced in 2002 as the plant achieved full year production equivalent to 100% of design capacity (after accounting for a planned major maintenance shutdown).
The price of DAP averaged US$180 per tonne in 2003 compared to US$157 per tonne in 2002. The US$/A$ exchange rate increased from an average of 0.5447 in 2002 to 0.6588 in 2003.
2002 Compared to 2001
Overview
Our consolidated net loss after tax from continuing operations was A$14.7 million for the year ended December 31, 2002 compared with a net loss after tax of A$157.5 million for the year ended December 31, 2001. Our net sales revenue from continuing operations amounted to A$2,487.2 million for the year ended December 31, 2002 compared with A$2,364.1 million for the previous year, an increase of 5.2%. Our net income was positively influenced by an increase in earnings from nickel, insurance revenue and a decrease in interest expense. These were partly offset by reduced production and associated sales volumes, lower copper prices and a weaker US dollar relative to the Australian dollar.
51
| | | | |
| | OPERATING AND FINANCIAL REVIEW AND PROSPECTS | | |
The fire that destroyed extensive parts of Olympic Dam’s solvent extraction plant in October 2001 reduced our production and subsequent sales of copper and uranium oxide in the year ended December 31, 2002, although the financial impact of the reduced sales were in part offset by the recognition of preliminary insurance claims totalling A$120 million. The total amount of insurance claims is under continuing negotiations with our insurers.
We curtailed nickel production in the first half of 2002 following a shutdown of the acid plant at the Kalgoorlie smelter for repairs to the mist precipitators following a fire. The smelter was on nil or minimal feed for a period of 27 days.
Revenues
Our sales revenue from continuing operations for the year ended December 31, 2002 increased to A$2,487.2 million, up from A$2,364.1 million in the year ended December 31, 2001. The marginal increase was driven by higher nickel prices up from an average of US$2.70 per pound in 2001 to US$3.07 per pound in 2002, offset by a weaker US dollar relative to the Australian dollar and reduced production and sales as detailed in the following table. Net foreign exchange and commodity price hedging losses of A$113.3 million in 2002 were down, however, from a loss of A$273.9 million in the comparable period in 2001 due to the weaker US dollar relative to the Australian dollar and reduced quantum of hedge positions in 2002. The following tables show our sales volume by major product category for 2002 and 2001 and the average prices for our products.
| | | | |
| | | Year ended December 31,
|
SALES VOLUME SUMMARY
| | 2002
| | 2001
|
Nickel (‘000 tonnes) | | | | |
- Nickel-in-concentrate | | 14.1 | | 13.8 |
- Nickel-in-matte | | 25.7 | | 34.6 |
- Nickel metal | | 64.8 | | 61.1 |
Refined copper (‘000 tonnes) | | 186.1 | | 200.8 |
Uranium oxide (tonnes) | | 3,888 | | 4,534 |
Fertilizer (‘000 tonnes) | | 1,254 | | 1,128 |
- Queensland Fertilizer Operations external sales | | 606 | | 537 |
- Hi Fert sales | | 648 | | 591 |
| | |
| |
|
| |
| | | Year ended December 31,
|
PRICES SUMMARY(1)
| | 2002
| | 2001
|
Nickel (US$/lb) | | 3.07 | | 2.70 |
Copper (US$/lb) | | 0.71 | | 0.72 |
Fertilizer (US$/tonne) | | 157 | | 147 |
| | |
| |
|
| (1) | | Average prices for the periods presented. |
Costs
Our total costs from continuing operations of A$2,773.5 million for the year ended December 31, 2002 were marginally lower than the comparable period in 2001 of A$2,774.6 million. We had an increase in general and administrative costs of A$52.1 million and an increase in other expenses of A$184.5 million, although these were offset in part by a higher reduction in net borrowings costs of A$143.0 million and lower exploration costs of A$34.9 million as a result of less exploration activity.
Depreciation and amortization from continuing operations increased from A$480.6 million to A$511.0 million. The depreciation and amortization we charged to profit overall decreased to A$511.7 million in the year ended December 31, 2002, compared with A$596.2 million for the year ended December 31, 2001 principally due to a reduction in property, plant and equipment balances arising from the sale of our gold and talc operations.
In 2002, we recognized A$75.9 million profit on the early termination of interest rate swaps which, combined with a reduced level of borrowings of approximately A$665 million, reduced our net borrowing cost of A$140.9 million in 2001 to A$48.7 million in 2002.
52
| | | | |
| | OPERATING AND FINANCIAL REVIEW AND PROSPECTS | | |
Profit
Our consolidated net loss after tax from continuing operations was A$14.7 million for the year ended December 31, 2002 compared with a net loss after tax of A$157.5 million for the year ended December 31, 2001. The reduction in our net loss after tax was primarily attributable to increased sales revenues, exceptional income items (relating to insurance and the early termination of interest rate swaps), reduced borrowing costs offset by higher general and administrative and other expenses as set out above.
Cash flow
Our net cash inflow from operating activities for the year ended December 31, 2002 was A$358.4 million, compared to A$577.7 million for the year ended December 31, 2001. Key factors impacting net cash flow from operating activities were:
| | • | | receipts from customers decreased by 17.6% to A$2,455.4 million, principally due to lower copper prices, a weaker US dollar relative to the Australian dollar and reduced sales reflecting our lower production volumes for the period; |
| | • | | payments to suppliers and employees decreased to A$2,043.4 million from A$2,212.7 million in the year ended December 31, 2001; |
| | • | | proceeds we received in 2002 from the close out of an interest rate swap amounting to A$71.2 million ( compared to A$11.7 million in 2001); and |
| | • | | payments for exploration decreased to A$23.4 million from A$76.5 million in the year ended December 31, 2001. |
Our net cash outflow from investing activities for the year ended December 31, 2002 was A$402.7 million, compared to a net cash inflow from investing activities of A$279.1 million in the year ended December 31, 2001. The key factors contributing to the outflow from our investing activities in 2002 were:
| | • | | proceeds from the sale of Central Norseman Gold Corporation Ltd and our gold royalty right with respect to the St Ives and Agnew gold operations sold in 2001 (classified as discontinued operations) of A$25.7 million in 2002 compared to receipt of A$122.2 million from the sale of equity interests in Mondo Minerals, A$432 million for the gold operation of St Ives and Agnew and A$56.0 million for the operations of Three Springs Talc (classified as discontinued operations) in 2001; |
| | • | | payments for property, plant and equipment amounted to A$464.9 million, compared to A$426.8 million in 2001; and |
| | • | | payment of A$34.4 million in 2002 (2001: receipt of A$21.7 million) for the early termination of gold hedge contracts following the sale of the gold business in 2001. |
Net cash inflow from our financing activities was A$15.8 million, compared to a net cash outflow from financing activities of A$793.7 million for the year ended December 31, 2001, principally due to:
| | • | | a net repayment of borrowings of A$446.4 million in 2002 against a net repayment of A$778.3 million in 2001; |
| | • | | a net increase in contributed equity of A$12.4 million in 2002 (A$15.4 million decrease in 2001) reflecting the equity cashflows retained by us but incurred by WMC Limited prior to the demerger; |
| | • | | payment of a fee for the redemption of the Yankee Bonds of A$150.2 million; and |
| | • | | a transfer of A$577 million net debt (consisting of a transfer of A$600 million debt, net of A$23 million retained cash) to Alumina Limited as part of the demerger. |
Balance sheet
Our net assets increased to A$3,606.6 million from A$3,220.3 million at December 31, 2001, despite a decrease in our total assets to A$7,348.1 million from A$8,242.9 million. The increase in our net assets reflects a reduction in interest bearing liabilities from A$2,321.8 million at December 31, 2001 to A$1,657.5 million at December 31, 2002 due to the impact of the transfer of approximately A$577 million of net debt to Alumina Limited as part of the demerger and the decline in value of our US dollar denominated debt in Australian dollar terms. The A$894.8 million decrease in our total assets was principally due to:
| | • | | Changes in the carrying values of assets transferred at fair value as part of the demerger as follows: |
| | • | the decrease in deferred hedging losses of A$1,101.9 million due to the previous losses being fair valued upon acquisition, |
53
| | | | |
| | OPERATING AND FINANCIAL REVIEW AND PROSPECTS | | |
| | • | a writedown of the Queensland Fertilizer business property, plant and equipment due to a fair value adjustment of A$289.6 million, |
| | • | the initial recognition of the acquired mineral rights asset upon acquisition of the Olympic Dam asset (A$1,271.5 million). |
| | • | | a decrease in the value of plant and equipment of A$439.0 million reflecting the impact of depreciation and amortization charges exceeding capital expenditures |
Segment Results
Nickel
Our profit before hedging, interest and tax decreased to A$270.7 million in 2002, compared with a profit before hedging, interest and tax of A$288.4 million in the comparable period of 2001. Our lower profit before hedging, interest and tax in 2002 was principally due to higher cost of sales of A$66.1 million. A fire in the mist precipitator at the Kalgoorlie nickel smelter acid plant in February 2002, reduced our production of nickel matte by approximately 2,500 tonnes. The smelter operated at below normal throughput rates in the second and third quarters of 2002. Two new mist precipitators were installed in the third quarter of 2002. The average unit cost of nickel metal sales (net of by-product credits) for 2002 was A$4.17/lb, compared to A$3.74/lb in 2001, as a result of lower production from the acid plant outage and our increased purchases of third party concentrate feed to replace concentrate feed previously produced internally from the Kambalda mines which we have now sold. The following table provides information regarding the performance of our nickel business unit in 2002 and 2001.
| | | | | | |
| | | Year ended December 31,
| |
NICKEL PERFORMANCE SUMMARY
| | 2002
| | | 2001
| |
| | | A$ millions | |
Financial | | | | | | |
Profit before hedging, interest and tax(1) | | 270.7 | | | 288.4 | |
Commodity/currency hedging | | (58.0 | ) | | (141.5 | ) |
| | |
|
| |
|
|
Profit before interest and tax | | 212.7 | | | 146.9 | |
Foreign currency revaluation | | 9.5 | | | 0.5 | |
Intra-group sales | | (0.7 | ) | | — | |
| | |
|
| |
|
|
Segment result(2) | | 221.5 | | | 147.4 | |
| | |
|
| |
|
|
Sales revenue (net of hedging) | | 1,314.9 | | | 1,200.9 | |
Capital expenditure | | 191.0 | | | 227.1 | |
Total assets | | 1,696.0 | | | 1,691.1 | |
| | |
|
| |
|
|
| | | ‘000 tonnes | |
Production | | | | | | |
Nickel-in-concentrate | | 106.4 | | | 104.6 | |
Nickel-in-matte | | 91.6 | | | 96.6 | |
Nickel metal | | 65.1 | | | 61.3 | |
| | |
|
| |
|
|
| | | ‘000 tonnes | |
Sales | | | | | | |
Nickel-in-concentrate | | 14.1 | | | 13.8 | |
Nickel-in-matte | | 25.7 | | | 34.6 | |
Nickel metal | | 64.8 | | | 61.1 | |
| | |
|
| |
|
|
| (1) | | We have included information concerning profit before hedging, interest and tax in our segment results as we believe this is a useful measure of operational performance because it removes items not related to the underlying performance of the business segment and it is also commonly used by certain investors to evaluate the core results of our segments. Profit before hedging, interest and tax is not a measure of financial performance under Australian GAAP and should not be considered an alternative to, or more meaningful than, income before interest and income tax or net income/(loss) attributable to holding company shareholders. Our consolidated results as discussed herein include the results of hedging, interest and tax. |
54
| | | | |
| | OPERATING AND FINANCIAL REVIEW AND PROSPECTS | | |
| (2) | | Segment result is segment revenues less segment expenses. Segment revenues include operating revenues from ordinary activities before tax, resulting from the operating activities of a segment that are directly attributable to a segment, and a portion of other revenues that can be allocated on a reasonable basis to the segment. Segment result does not include interest, foreign currency revaluations or intra-group sales. |
The nickel refinery at Kwinana produced 65,055 tonnes of nickel metal in 2002, up from 61,324 tonnes in 2001, following the expansion completed in 2001.
Our sales revenue increased to A$1,314.9 million in 2002 compared to A$1,200.9 million in 2001 due to our higher realized Australian dollar prices resulting from a weaker US dollar relative to the Australian dollar and higher sales volumes of concentrate and nickel metal, offset in part by reduced nickel-in-matte sales. Hedging losses at A$58.0 million in 2002, were 55% lower in 2002 when compared to the A$141.5 million in 2001 reflecting the weaker US dollar during 2002 and the reduced quantum of hedging contracts.
Changes to the mine plans for the Mount Keith and Harmony mines in the six months to December 31, 2002 have resulted in changes to stripping ratios which have had a net impact on profit of A$1.1 million (credit). Realized nickel metal prices in Australian dollars averaged A$5.55 per pound for the year ended December 31, 2002, up on the average price for the year ended December 31, 2001 of A$5.41 per pound again reflecting the weaker US dollar during 2002.
Copper/Uranium
Our profit before hedging, interest and tax decreased to A$90.4 million in 2002, compared with a profit before hedging, interest and tax of A$150.8 million in the comparable period of 2001. Our lower profit before hedging, interest and tax in 2002 was principally due to lower sales volumes from reduced production and lower copper prices of approximately US$0.01/lb.
Our production was impacted by the fire in the solvent extraction plant in October 2001. Downtime to repair cooling jackets in the smelter’s flash furnace also impacted production. As a result, refined copper production decreased by 11% to 178,100 tonnes and our uranium oxide production decreased by 34% to 2,891 tonnes in 2002. We fulfilled our uranium sales commitments through a combination of on-market purchases and uranium loans. The following table provides information regarding the performance of our copper/uranium business in 2002 and 2001.
| | | | | | |
| | | Year ended December 31,
| |
COPPER/URANIUM PERFORMANCE SUMMARY
| | 2002
| | | 2001
| |
| | | A$ millions except as indicated | |
Financial | | | | | | |
Profit before hedging, interest and tax(1) | | 90.4 | | | 150.8 | |
Commodity/currency hedging | | (41.6 | ) | | (102.9 | ) |
| | |
|
| |
|
|
Profit before interest and tax | | 48.8 | | | 47.9 | |
Intra-group purchases | | 5.0 | | | — | |
| | |
|
| |
|
|
Segment result(2) | | 53.8 | | | 47.9 | |
| | |
|
| |
|
|
Sales revenue (net of hedging) | | 723.3 | | | 810.3 | |
Capital expenditure | | 216.0 | | | 75.3 | |
Total assets | | 4,146.2 | | | 2,811.1 | |
| | |
|
| |
|
|
Production | | | | | | |
Refined copper (‘000 tonnes) | | 178.1 | | | 200.5 | |
Uranium oxide (tonnes) | | 2,891 | | | 4,379 | |
| | |
|
| |
|
|
Sales | | | | | | |
Refined copper (‘000 tonnes) | | 186.1 | | | 200.8 | |
Uranium oxide (tonnes) | | 3,888 | | | 4,534 | |
| | |
|
| |
|
|
| (1) | | We have included information concerning profit before hedging, interest and tax in our segment results as we believe this is a useful measure of operational performance because it removes items not related to the underlying performance of the business segment and it is also commonly used by certain investors to evaluate the core results of our segments. Profit before hedging, interest and tax is not a measure of financial performance under Australian GAAP and should not be considered an alternative to, or more meaningful than, income before interest and income tax or net income/(loss) attributable to holding company shareholders. Our consolidated results as discussed herein include the results of hedging, interest and tax. |
55
| | | | |
| | OPERATING AND FINANCIAL REVIEW AND PROSPECTS | | |
| (2) | | Segment result is segment revenues less segment expenses. Segment revenues include operating revenues from ordinary activities before tax, resulting from the operating activities of a segment that are directly attributable to a segment, and a portion of other revenues that can be allocated on a reasonable basis to the segment. Segment result does not include interest, foreign currency revaluations or intra-group sales. |
Our sales revenue decreased to A$723.3 million in the year ended December 31, 2002, compared to A$810.3 million in the comparable period of 2001, in line with lower sales reflecting reduced production and lower Australian dollar prices received for our product because of lower copper prices in 2002 compared to 2001. The decline in production and prices was offset by the recognition of preliminary insurance claims totalling A$120 million for both business interruption (A$80 million) and material damage (A$40 million) associated with the solvent extraction plant fire totalling A$120 million.
Our sales revenue includes hedging losses of A$41.6 million in 2002, 60% lower when compared to the A$102.9 million of hedging losses in 2001.
The increase in total assets of A$1,335.1 million was primarily attributable to the recognition of an acquired mineral rights asset of A$1,271.5 million which arose upon our acquisition of the copper-uranium assets at their fair value as a result of the demerger.
The rebuild of the solvent extraction plant continued during 2002. During 2002, we also completed the optimization project to increase our capacity to 235,000 tonnes of copper cathode on schedule and on budget.
Copper prices averaged US$0.71 per pound in 2002, down 1.4% on the average price in the year ended December 31, 2001 of US$0.72 per pound. Australian dollar prices averaged A$1.30 per pound for the year ended December 31, 2002, down 7.1% on the average price in the year ended December 31, 2001 of A$1.40 per pound, due to the weaker US dollar relative to the Australian dollar in the year ended December 31, 2002.
Fertilizer Operations
We had a loss before hedging, interest and tax of A$41.2 million in 2002, compared to a loss before hedging, interest and tax of A$59.9 million in 2001. Our loss before hedging, interest and tax in 2002 was as a result of lower realized Australian dollar prices offset in part by increased production.
| | | | | | |
| | | Year ended December 31,
| |
FERTILIZER PERFORMANCE SUMMARY(1)
| | 2002
| | | 2001
| |
| | | A$ millions | |
Financial | | | | | | |
(Loss) before hedging, interest and tax(2) | | (41.2 | ) | | (59.9 | ) |
Commodity/currency hedging | | (12.3 | ) | | (29.5 | ) |
| | |
|
| |
|
|
(Loss) before interest and tax | | (53.5 | ) | | (89.4 | ) |
Intra-group sales | | (3.9 | ) | | — | |
| | |
|
| |
|
|
Segment result(3) | | (57.4 | ) | | (89.4 | ) |
| | |
|
| |
|
|
Sales revenue (net of hedging) | | 420.4 | | | 352.9 | |
Capital expenditure | | 50.2 | | | 42.3 | |
Total assets | | 720.6 | | | 1,137.3 | |
| | |
|
| |
|
|
| | | ‘000 tonnes | |
Production | | | | | | |
Phosphate fertilizer | | 821.0 | | | 709.4 | |
| | |
|
| |
|
|
| | | ‘000 tonnes | |
Sales | | | | | | |
Queensland Fertilizer Operations external sales | | 606 | | | 537 | |
Hi-Fert sales | | 648 | | | 591 | |
| | |
|
| |
|
|
| (1) | | Includes performance of wholly-owned subsidiary Hi Fert Pty. Ltd. |
| (2) | | We have included information concerning loss before hedging, interest and tax in our segment results as we believe this is a useful measure of operational performance because it removes items not related to the underlying performance of the business and it is also commonly used by certain investors to evaluate the core results of our segments. Profit before hedging, interest and tax is not a measure of financial performance under Australian GAAP and should not be considered an alternative to, or more meaningful than, income before interest and income tax or net income/(loss) attributable to holding company shareholders. Our consolidated results as discussed herein include the results of hedging, interest and tax. |
56
| | | | |
| | OPERATING AND FINANCIAL REVIEW AND PROSPECTS | | |
| (3) | | Segment result is segment revenues less segment expenses. Segment revenues include operating revenues from ordinary activities before tax, resulting from the operating activities of a segment that are directly attributable to a segment, and a portion of other revenues that can be allocated on a reasonable basis to the segment. Segment result does not include interest, foreign currency revaluations or intra-group sales. |
The decrease in total assets of A$416.7 million is primarily attributable to the decremental fair value adjustment of A$289.6 million which arose upon our acquisition of the fertilizer assets at their fair value.
Our production in 2002 was 821,000 tonnes of ammonium phosphate fertilizer, an increase of 15.7% from the 709,445 tonnes we produced in 2001 as the plant ramped up to, and achieved, design capacity in October 2002. The plant operated at design capacity in December 2001 and January 2002, however, a shortage of sulphuric acid and a three week statutory maintenance shutdown of the acid plant we undertook in mid-2002 limited production.
The price of DAP averaged US$157 per tonne in 2002 compared to US$147 per tonne in 2001. The US$/A$ exchange rate increased from an average of 0.5129 in 2001 to 0.5447 in 2002.
Reconciliation between net income on a statutory basis and net income on a carve-out basis
As the demerger was consummated before December 31, 2002, WMC Resources’ financial position at December 31, 2002 presented below is the same as that reported in WMC Resources’ statutory financial statements in Australia. However, the carve-out basis of presentation differs from the statutory basis of accounting applied for the fiscal year ended December 31, 2002 in Australia. The difference principally relates to the inclusion in the carve-out of results of businesses that were not legally owned by WMC Resources until the demerger was consummated. The consolidated income statement for the year ended December 31, 2002 as reported in the statutory financial statements is summarized, and reconciled to net income as on a carve-out basis, as follows (no comparatives are presented in the statutory financial statements):
| | | |
| | | Year ended December 31, 2002
| |
| | | (A$ millions) | |
Statutory loss after tax | | (43.7 | ) |
Include 11 months of net income/(loss) from businesses: | | | |
Copper | | (24.1 | ) |
Fertilizer | | (46.6 | ) |
Nickel hedging | | (61.2 | ) |
Corporate and other non-operational entities | | (10.8 | ) |
Regional exploration | | (10.9 | ) |
New Business | | (18.0 | ) |
Finance and other costs | | (11.0 | ) |
Net interest(1) | | 356.5 | |
Profit on sale of Central Norseman Gold Corporation | | 25.1 | |
Income tax on above | | (55.5 | ) |
Prior period tax provision(2) | | (76.8 | ) |
| | |
|
|
Consolidated Financial Statements profit after tax (carve-out basis) | | 23.0 | |
| | |
|
|
| (1) | | Relates to net inter-group interest charges which would normally eliminate on consolidation. However, as the finance entities only became part of the WMC Resources Ltd group effective December 1, 2002, there is a mis-match in the current year which will not occur in subsequent years. |
| (2) | | Relates to an overprovision of tax in the prior year relating to the sale of the gold business unit in 2001. This has been reversed in 2002 in the statutory result, however it eliminates on consolidation in the carve-out result. |
57
| | | | |
| | OPERATING AND FINANCIAL REVIEW AND PROSPECTS | | |
New Accounting Pronouncements
Australian Accounting Standards Board
The Australian Financial Reporting Council (FRC) has determined that Australian entities must adopt International Financial Reporting Standards (IFRS) from January 1, 2005. The adoption of IFRS will be first reflected in our financial statements for the half year ending June 30, 2005 and the year ending December 31, 2005. The significant areas expected to be affected are as follows:
| | • | Hedge accounting for financial instruments; |
| | • | Provision for environmental liabilities; |
| | • | Tax effect accounting; and |
| | • | Obligations under defined benefit superannuation plan. |
It is expected that there will be continuing developments in IFRS up to their application date of January 2005. Consequently there remains uncertainty about the impact of IFRS. We are currently evaluating the potential impact of applying IFRS on the statements of financial position and performance.
We adopted AASB 1028 “Employee Benefits” on January 1, 2003. There was no material impact on our financial statements as a result of adoption.
US GAAP Accounting Standards
The Financial Accounting Standards Board (FASB) has issued certain Statements of Financial Accounting Standards which are not effective with respect to the fiscal years we have presented in the consolidated financial statements.
In May 2003, FASB issued SFAS 150, “Accounting for Certain Financial Instruments with Characteristics of both Liabilities and Equity”, which requires financial instruments within its scope to be classified as liabilities (or assets in some circumstances). The Statement is effective for financial instruments entered into or modified after May 31, 2003, and otherwise effective at the beginning of the first interim period beginning after June 15, 2003, except for certain mandatorily redeemable financial instruments. The effective date of certain provisions of SFAS 150 for certain mandatorily redeemable financial instruments has been deferred by FSP FAS 150-3. We adopted FAS 150 in the financial year ended December 31, 2003. The adoption of the standard had no impact on our financial statements, as we have not issued any financial instruments which have characteristics of both liability and equity. It is expected any future adoptions related to this standard will not have any impact.
In May 2003, the Emerging Issues Taskforce (“EITF”) finalized its position on EITF 00-21 “Revenue Arrangements with Multiple Deliverables”. It addresses certain aspects of the accounting by a vendor for arrangements under which it will perform multiple revenue-generating activities. The Issue requires that separate contracts with the same entity or related parties that are entered into at or near the same time are presumed to have been negotiated as a package and should, therefore, be evaluated as a single arrangement in considering whether there are one or more units of accounting. That presumption may be overcome if there is sufficient evidence to the contrary. This Issue also addresses how arrangement consideration should be measured and allocated to the separate units of accounting in the arrangement. The guidance in this Issue is effective for revenue arrangements entered into in fiscal periods beginning after June 15, 2003. We are currently assessing the impact of adopting this standard. This interpretation will be effective for our revenue arrangements entered into after December 31, 2003.
In December 2003, FASB issued Financial Interpretation No. 46(R), “Consolidation of Variable Interest Entities” or FIN 46R, which replaces FASB Interpretation No. 46, “Consolidation of Variable Interest Entities”, or FIN 46. FIN 46(R) applies at different dates to different types of enterprises and entities, and special provisions apply to enterprises that have fully or partially applied FIN 46 prior to issuance of FIN 46(R). Application of FIN 46 or FIN 46(R) is required in financial statements of public entities that have interests in variable-interest entities or potential variable-interest entities commonly referred to as special-purpose entities (SPEs) for periods ending after December 15, 2003. Application by public entities for all other types of entities is required in financial statements for periods ending after March 15, 2004. In some instances, enterprises have the option of applying or continuing to apply FIN 46 for a short period of time before applying FIN 46(R). FIN 46 is effective for all new variable interest entities created or acquired after January 31, 2003. We have evaluated all SPEs and have determined that their will be no impact in the future upon final adoption of FIN 46(R) by March 31, 2004.
We adopted the following standards on January 1, 2003.
58
| | | | |
| | OPERATING AND FINANCIAL REVIEW AND PROSPECTS | | |
FASB’s FAS No. 143, “Accounting for Asset Retirement Obligations” was issued in 2001. It was effective for us in 2003. The statement requires us to bring to account (calculated at a discounted present value) an asset retirement obligation and a matching asset at the initial point the liability is incurred, generally when the mine is first commenced. We must amortize the cost of the obligation over the life of a long-lived asset. Increases in the obligation as a result of the reduction of time are to be treated as interest. Adoption of this standard has resulted in an adjustment at January 1, 2003 of A$27.3 million (debit) and of A$1.0 million (credit) for the 2003 fiscal year.
In July 2002, FASB issued FAS No. 146, “Accounting for Costs Associated with Exit or Disposal Activities”. The statement requires that we recognize costs associated with exit or disposal activities when they are incurred rather than at the date of a commitment to an exit or disposal plan. Such costs include lease termination costs and certain employee severance costs associated with a restructuring, discontinued operations or other exit or disposal activity. There was no material impact on our financial statements as a result of adoption of this standard.
In April 2003, the FASB issued SFAS No. 149, “Amendment of Statement 133 on Derivative Instruments and Hedging Activities”, which amends and clarifies financial accounting and reporting for derivative instruments, including certain derivative instruments embedded in other contracts (collectively referred to as derivatives) and for hedging activities under FAS No. 133, “Accounting for Derivative Instruments and Hedging Activities”. This Statement is effective for contracts entered into or modified after June 30, 2003, and for hedging relationships designated after June 30, 2003. There was no material impact on our financial statements as a result of adoption of this standard.
In January 2003, the FASB issued FIN 46, “Consolidation of Variable Interest Entities, an Interpretation of ARB No. 51”. FIN 46 requires certain variable interest entities to be consolidated by the primary beneficiary of the entity if the equity investors in the entity do not have the characteristics of a controlling financial interest or do not have sufficient equity at risk for the entity to finance its activities without additional subordinated financial support from other parties. We adopted FIN 46 for all SPEs and VIEs established after February 1, 2003. This has had no material impact on our financial statements.
| B. | | Liquidity and Capital Resources |
Our ability and the ability of our subsidiaries to generate cash internally is influenced by the following major factors:
| | (i) | | the levels of world commodity prices and exchange rates to which our revenue is substantially exposed; |
| | (ii) | | the level of expenditure required to explore and develop new ore reserves and to maintain existing production facilities; |
| | (iii) | | the level of capital expenditure required to develop new projects; |
| | (iv) | | the level of operating expenditure required for energy, wages, salaries and consumables; and |
| | (v) | | the level of interest rates on borrowings. |
These factors will continue to influence our liquidity and capital resources in future years.
Our ability to pay dividends and meet other obligations is dependent in large part on, and may be limited by, the amount of cash generated by our nickel operations and the level of dividends we receive from our subsidiaries holding our copper-uranium and fertilizer businesses.
We generated net cash from operating activities of A$642.5 million for the year ended December 31, 2003, compared with net cash from operating activities of A$336.7 million for the year ended December 31, 2002. The increase was due to a A$531.9 million increase in our receipts from customers from significantly higher commodity prices and increased sales volumes. This was in part offset by A$208.4 million of increased costs of production.
Our capital expenditure in 2003 of A$661.9 million included A$233.2 million on the rebuild of the copper and uranium solvent extraction circuits at Olympic Dam and A$61.9 million on the Perseverance deeps project at Leinster. The expected cost of the Olympic Dam rebuild across 2002 and 2003 is approximately A$375 million and the cost will be funded through operating cash flows. We spent A$34 million in 2002 on the optimization project at Olympic Dam.
Our working capital was positive A$280.1 million as at December 31, 2003, due to the replacement of our borrowing facilities with medium and long-term facilities. In our opinion, working capital is sufficient for our present requirements.
59
| | | | |
| | OPERATING AND FINANCIAL REVIEW AND PROSPECTS | | |
Our total borrowings were A$1,353.2 million at December 31, 2003, down from A$1,657.5 million at December 31, 2002. During the year ended December 31, 2003, our net proceeds from borrowings amounted to A$53.9 million, compared with net repayments of A$446.4 million for the year ended December 31, 2002. As we discuss in Item 3D, “Risk Factors” a decrease in the US$/A$ exchange rate will decrease our US dollar denominated revenues in terms of Australian dollars to the extent that they are not hedged, but will also decrease Australian dollar funds required for repayment of our US dollar denominated borrowings and other liabilities. For a description of our loan facilities, refer to Item 11 “Quantitative and Qualitative Disclosures About Market Risk – Interest Rate Hedging”.
The maturity of our debt profile is outlined in Note 28 to our Consolidated Financial Statements. The maturity of our cross currency swaps is outlined in Note 36B(a) to the Consolidated Financial Statements. The key funding principles inherent in our Treasury policies are:
| | • | | BBB credit rating should be our target minimum rating, although this is not an absolute constraint. |
| | • | | We expect to continue to maintain conservative levels of debt over the longer term to ensure that our activities and growth are not debt constrained. Our long-term target is a gearing (debt/debt + equity) level of 25 to 35%. |
| | • | | Our aim is to source our debt from the most competitively priced source, balanced against the need to maintain a diversity of sources and a managed maturity portfolio. |
| | • | | Our debt tenor and currency should reflect asset life and currency exposure. We should retain a core amount of long-term debt (around 50% of total debt) with the balance in short-term and medium-term debt due to its lower cost and repayment flexibility. |
| | • | | Our Risk Management Committee is responsible for managing the fixed/floating interest rate mix and the currency of debt. |
| | • | | We should utilize project finance where warranted by risk management considerations and permitted by finance covenants (country or project specific). |
| | • | | We should consider asset based financing only once we have assessed the acquisition decision positively on an all-equity (i.e. ungeared) basis. The decision thereafter of buy versus lease or mode of financing is then one of financing cost or risk management/transference. |
Our cash and current investments net of bank overdrafts were A$100.3 million at December 31, 2003 and A$90.5 million at December 31, 2002. Our net debt was A$1,252.9 million at December 31, 2003 and A$1,567.0 million at December 31, 2002. The decrease in net debt was principally due to the reduction in Australian dollar terms of our US dollar denominated borrowings as a result of the weaker US dollar relative to the Australian dollar as at December 31, 2003 compared to December 31, 2002.
Our available sources of liquidity were represented by unused bank facilities at December 31, 2003 of A$406.0 million, as compared to A$336.7 million at December 31, 2002. We have designated the bank loan balances as credit standby facilities in respect of our US dollar and Australian dollar commercial paper program and therefore we have determined their use and availability in line with the outstandings under this program.
Our capital expenditure (including capitalized exploration expenditure) was A$669.2 million for the year ended December 31, 2003, A$469.4 million for the year ended December 31, 2002 and A$456.9 million for the year ended December 31, 2001. Our capital expenditure was allocated as follows:
| | | | | | |
| | | Year ended
December 31, 2003
| | Year ended
December 31, 2002
| | Year ended December 31, 2001
|
| | | (A$ million) |
Exploration | | 7.3 | | 4.5 | | 30.1 |
Mine development | | 141.8 | | 133.9 | | 221.6 |
New plant and equipment at existing operations | | 515.5 | | 306.0 | | 184.5 |
Acquisition of properties | | 4.1 | | 22.6 | | 19.8 |
Government facilities | | 0.5 | | 2.4 | | 0.8 |
| | |
| |
| |
|
Total Capital Expenditure | | 669.2 | | 469.4 | | 456.8 |
| | |
| |
| |
|
60
| | | | |
| | OPERATING AND FINANCIAL REVIEW AND PROSPECTS | | |
Our capital commitments on contracts for the purchase of assets comprising mine properties and development, property, plant and equipment were A$44.5 million at December 31, 2003 and A$77.7 million at December 31, 2002. These commitments for capital expenditure are in addition to the normal capital expenditure involved in mine development and maintenance at our existing mines.
We estimate our commitments for expenditure for exploration, evaluation and mining activities during the life of our current exploration and mining tenements and earning rights under farm-in and option entitlements as A$76.8 million at December 31, 2003 and A$158.4 million at December 31, 2002. These amounts are the maximum potential expenditure commitments for work expected to be beneficial to us and include payments to vendors in which we have earning rights. Australian mining laws generally require that certain levels of expenditure be incurred to maintain tenements in good standing. The commitments may be reduced by seeking exemption from individual commitments or by relinquishment of tenure.
Our operating lease commitments relate to the Queensland Fertilizer Operations and comprise: the GATX sulphuric acid rail wagons, certain Townsville storage and conveying assets, the Phosphate Hill camp and the Mt Isa power generation turbine, all of which we have leased from Commonwealth Bank of Australia for a period of 10 years expiring in 2009, 2010, 2009 and 2006, respectively. We also have a lease with Caterpillar Finance relating to the Solar Turbines used for power generation at Phosphate Hill and lease various office facilities both in Australia and overseas.
Our other commitments consist of commitments for payments to suppliers of gas, gas conversion, shiploading, rail transport and sulphuric acid under long-term contracts existing at reporting date but not recognized as payable.
| C. | | Research and Development, Patents and Licenses, etc |
We have continued to consolidate and prioritize our research and development activities through a combination of internal development, external research, alliances, joint ventures and targeted venture capital activities. Company-wide effort is coordinated through a lead team of technical managers. During 2001, technical managers and external consultants undertook a thorough review of technology.
| | | | | | | |
| | | Year ended
December 31, 2003
| | | Year ended
December 31, 2002
| | Year ended December 31, 2001
|
| | | (A$ million) |
Our project expenditures qualifying for Australian research and development tax concessions were: | | 36.0 | (1) | | 40.0 | | 37.6 |
| (1) | | The 2003 figure is the accounting provision, as tax concession amounts are not finalized until later in the year. |
These figures only apply to those expenditures on which we have applied for tax concessions. We incur additional research and development expenditure on our site operating costs due to the continuous improvement philosophy of our business, and through venture capital arrangements (which are not material to the group).
Industry and market trends relevant to us are discussed as a whole and for each business segment in Item 5A “Operating Results”.
| E. | | Off-balance Sheet Arrangements |
We do not have other material off-balance sheet financing arrangements.
61
| | | | |
| | OPERATING AND FINANCIAL REVIEW AND PROSPECTS | | |
| F. | | Tabular Disclosure of Contractual Obligations |
An analysis of our contractual and commercial commitments is set out in the table below.
| | | | | | | | | | |
| | | Amount of Commitment to December 31, 2003
|
Contractual Obligations
| | Total
| | Less than 1
year
| | 1-3 years
| | 3-5 years
| | More than 5
years
|
| | | (A$ million) |
Short-term debt | | 212.0 | | 212.0 | | — | | — | | — |
Non current payables | | 379.2 | | — | | 131.8 | | 44.8 | | 202.6 |
Long-term debt | | 1,141.2 | | — | | 1.1 | | — | | 1,140.1 |
| | |
| |
| |
| |
| |
|
Total on-balance sheet contractual obligations | | 1,732.4 | | 212.0 | | 132.9 | | 44.8 | | 1,342.7 |
| | |
| |
| |
| |
| |
|
Capital expenditure | | 44.5 | | 44.5 | | — | | — | | — |
Exploration and mining titles | | 76.8 | | 12.4 | | 21.7 | | 13.6 | | 29.1 |
| | |
| |
| |
| |
| |
|
Total off-balance sheet obligations | | 121.3 | | 56.9 | | 21.7 | | 13.6 | | 29.1 |
| | |
| |
| |
| |
| |
|
| |
| | | Amount of Commitment to December 31, 2003
|
Other commercial commitments
| | Total
| | Less than 1 year
| | 1-3 years
| | 3-5 years
| | More than 5 years
|
| | | (A$ million) |
Business undertaking commitments | | 69.2 | | 5.4 | | 9.7 | | 6.3 | | 47.8 |
Operating lease commitments | | 128.5 | | 26.9 | | 36.4 | | 29.3 | | 35.9 |
Other commitments | | 2,242.4 | | 205.6 | | 429.4 | | 410.0 | | 1,197.4 |
| | |
| |
| |
| |
| |
|
Total other commercial commitments | | 2,440.1 | | 237.9 | | 475.5 | | 445.6 | | 1,281.1 |
| | |
| |
| |
| |
| |
|
62
| | | | |
| | DIRECTORS, SENIOR MANAGEMENT AND EMPLOYEES | | |
ITEM 6. DIRECTORS, SENIOR MANAGEMENT AND EMPLOYEES
A. Directors and Senior Management
Our business is managed by a board of directors which, in accordance with our constitution, may have not fewer than three nor more than 12 members.
Our directors are classified as either executive or non-executive directors, with the former being those directors engaged in full-time employment with us. The members of the audit committee are: Adrienne E. Clarke, Graeme W. McGregor and David E. Meiklejohn. The members of the compensation committee are: Tommie C.-E. Bergman, Peter J. Knight, G. John Pizzey and Ian E. Webber.
As at December 31, 2003, our directors were:
| | | | | | | | | | |
Name
| | Position
| | Summary
| | Initially
Elected or
Appointed a
Director
| | Age
| | Expiry of
Current
Term
|
Executive Directors | | | | | | | | | | |
| | | | | |
Andrew G. Michelmore | | Chief Executive Officer | | Chairman of the Jean Hailes Foundation for Womens’ Health and the CSIRO Mineral Resources Sector Advisory Committee and the Ormond College Council. A former director of the Ian Clunies Ross Foundation and Melbourne Enterprises International Limited. Operational experience with ICI Australia, CRA and Nabalco in senior project and general management roles, before joining WMC Limited in 1993. From January 2001 was Executive General Manager – Business Strategy and Development for WMC Limited; appointed Chief Executive Officer of WMC Resources Limited from January 1, 2003. | | August 2002 | | 51 | | 2007 |
| | | | | |
Alan K. Dundas(1) | | Director | | Senior operational and management roles with various companies in Australia and Canada including Nabalco, Curragh Qld Mining and Quintette Coal. Joined WMC Limited in 1994 and held roles of General Manager – Kwinana Nickel Refinery and General Manager – Nickel Operations. From January 2001, Executive General Manager – Nickel and from December 2001, EGM – Operations. | | March 2003 | | 47 | | 2006 |
Non-Executive Directors | | | | | | | | | | |
| | | | | |
Tommie C.-E. Bergman(3)(4) | | Chairman | | Former Chairman and Managing Director Australasia of Asea Brown Boveri Pty Ltd, a director of Smorgon Steel Group Limited and Chairman of Cochlear Ltd. Former director of Amcor Limited and Atlas Copco Australia Pty Ltd. | | January 2001 | | 58 | | 2005 |
63
| | | | |
| | DIRECTORS, SENIOR MANAGEMENT AND EMPLOYEES | | |
| | | | | | | | | | |
Name
| | Position
| | Summary
| | Initially Elected or
Appointed a
Director
| | Age
| | Expiry of
Current
Term
|
Adrienne E. Clarke(2) | | Director | | Director of Fisher and Paykel Healthcare Corporation Limited, Woolworths Limited, and Hexima Limited. Chair of CSIRO from 1991 to 1996, a past Lieutenant-Governor of Victoria, Victoria’s Ambassador for Biotechnology, President of the International Society for Plant Molecular Biology and member of the US National Academy of Sciences. | | July 1996 | | 66 | | 2005 |
| | | | | |
Peter J. Knight(4) | | Director | | Former Chairman of Central Norseman Gold Corporation Limited and a non-executive director and former managing director of Clough Limited. | | August 1997 | | 65 | | 2007 |
| | | | | |
David E. Meiklejohn(2) | | Director | | Chairman of PaperlinX Limited and SPC Ardmona Limited, Director of One Steel Limited. Former Chief Financial Officer and Executive Director of Amcor Limited. Chairman of WMC Resources Audit Committee. | | April 2002 | | 62 | | 2006 |
| | | | | |
Graeme W. McGregor(2)(6) | | Director | | Director of Foster’s Group Limited, Santos Limited, Nufarm Limited and Goldman Sachs JB Were Managed Funds. Former director of finance for BHP Limited where he held financial and senior management roles. | | December 2003 | | 65 | | 2006 |
| | | | | |
G. John Pizzey(4)(5) | | Director | | Chairman of ION Limited, director of Amcor Limited and Ivanhoe Grammar School. Former executive vice president of Alcoa Inc., former chairman of Alcoa of Australia Limited and the International Aluminium Institute PLC. | | December 2003 | | 58 | | 2006 |
| | | | | |
Ian E. Webber(4) | | Director | | Former Director of Santos Limited and is a member of General Motors Australian Advisory Council. Former chairman of Mayne Nickless Limited. Chairman of the WMC Resources Compensation Committee. | | June 1997 | | 68 | | 2007 |
| (1) | | Alan K. Dundas was appointed a director on March 12, 2003. |
| (2) | | Member of Audit Committee. |
| (3) | | Tommie C-E. Bergman was appointed chairman on May 2, 2003 following the retirement of Ian G. R. Burgess on that date. |
| (4) | | Member of Compensation Committee. |
| (5) | | G. John Pizzey was appointed a director on December 1, 2003. |
| (6) | | Graeme W. McGregor was appointed a director on December 1, 2003. |
Three directors retired from the board during the course of the year. Former chairman Ian G.R. Burgess and former director Roger A.G. Vines retired at the Annual General Meeting on May 2, 2003. Hugh M. Morgan retired as Chief Executive Officer and a director on January 1, 2003
64
| | | | |
| | DIRECTORS, SENIOR MANAGEMENT AND EMPLOYEES | | |
In addition to the chief executive officer, the executive officers appointed by and reporting to the chief executive officer are responsible for the day to day running of the business. As at December 31, 2003, our executive officers were:
| | | | |
Name
| | Position in 2003
| | Appointed as
Executive Officer
|
Bruce R. Brook | | Executive General Manager – Finance and Chief Financial Officer | | March 2002 |
| | |
Alan K. Dundas(1) | | Executive General Manager – Operations | | January 2001 |
| | |
Michael P.J. Nossal(2) | | Executive General Manager – Business Strategy and Development | | March 2003 |
| | |
Greg J. Travers | | Executive General Manager – Group Services | | June 1996 |
| (1) | | Alan K. Dundas was appointed a director on March 12, 2003. |
| (2) | | Michael P.J. Nossal was appointed as an Executive General Manager on March 24, 2003. |
The experience of our continuing management team, who, with the Chief Executive Officer and the EGM - Operations have responsibility for all operational and administrative functions of the business, is outlined below:
| | |
Executive Officer
| | Summary of Experience
|
Bruce R. Brook | | Appointed as Executive General Manager – Finance of WMC Limited in March 2002 and Chief Financial Officer in June 2002. Mr Brook was Deputy Chief Financial Officer at the Australian and New Zealand Banking Group Limited and has had substantial experience in the resources and finance sectors, having worked for Price Waterhouse; Gold Fields of South Africa, Pasminco Limited, CRA Limited and Pacific Dunlop. |
| |
Michael P.J. Nossal | | Appointed as Executive General Manager – Business Strategy and Development in March 2003. Fourteen years in senior management roles in the mining industry, including Normandy Mining Limited, Associate Director on the Resources Team of Macquarie Corporate Finance and Kenmare Resources Limited. Prior to joining WMC, Mr Nossal was the Chief Executive Officer of a start-up supply chain management software company based in London. |
| |
Greg J. Travers | | Executive General Manager – Group Services, is responsible for corporate affairs, community, environment, health and safety, human resource management, sustainable development, information systems, supply and various sevice centres. Experience in both operations and functional service areas, and has worked with Pratt Industries, Mount Newman Mining Company and BHP Limited. He joined WMC Limited in 1994 as Group Manager – Training and Organisational Development. Mr Travers is a director of Australian Mines and Metals Association and was a director of the Institute of Public Affairs until November 2001. |
65
| | | | |
| | DIRECTORS, SENIOR MANAGEMENT AND EMPLOYEES | | |
For the year ended December 31, 2003, the aggregate amount of compensation paid and accrued to our directors and executive general managers was A$9,898,722 (compared to A$21,582,481 in 2002 and A$11,382,538 in 2001). This amount includes retirement allowances of A$830,124 paid to either non-executive or executive directors who retired from office during the period January 1, 2003 to December 31, 2003. This amount also includes A$132,924 (A$452,856 in 2002) in pension benefits in our superannuation scheme for directors and members of administrative, supervisory or management bodies. There are no other contingent or deferred compensation arrangements accrued for our executives or directors. The terms and conditions applicable to our directors and executive general managers are the same as those that applied to them in their capacities as directors and executive general managers of WMC Limited prior to the demerger (which was implemented on December 11, 2002). The remuneration of individual directors and executive general managers is presented in the tables below.
Non-executive director remuneration – January to December 2003
| | | | | | |
| | | Director’s fee
A$(1)
| | Other A$(2)
| | Total A$
|
Tommie C.-E. Bergman | | 295,277 | | 26,174 | | 321,451 |
Ian G. R. Burgess(3) | | 112,500 | | 657,495 | | 769,995 |
Adrienne E. Clarke | | 115,000 | | 10,212 | | 125,212 |
Peter J. Knight | | 115,000 | | 10,212 | | 125,212 |
Graeme W. McGregor | | 10,833 | | 1,077 | | 11,910 |
David E. Meiklejohn | | 119,999 | | 10,669 | | 130,668 |
John Pizzey | | 0 | | 102 | | 102 |
Roger A. G. Vines(3) | | 37,500 | | 186,130 | | 223,630 |
Ian E. Webber | | 110,000 | | 9,844 | | 119,844 |
| | |
| |
| |
|
| (1) | | Includes director’s and committee fees. |
| (2) | | Includes superannuation, executive indemnity insurance and retirement payments. |
| (3) | | Ian G. R. Burgess and Roger A.G Vines retired from the board on May 2, 2003. |
Executive director remuneration and senior executive remuneration – January to December 2003
| | | | | | |
| | | Fixed remuneration A$(1)
| | Other
compensation A$(2)
| | Total
remuneration A$
|
Executive director | | | | | | |
Andrew G. Michelmore, Chief Executive Officer | | 1,000,000 | | 1,500,102 | | 2,500,102 |
Alan K. Dundas, EGM Operations(3) | | 750,000 | | 843,602 | | 1,593,602 |
Executive general managers | | | | | | |
Bruce R. Brook – Finance | | 700,000 | | 801,602 | | 1,501,602 |
Greg J. Travers – Group Services | | 600,000 | | 740,102 | | 1,340,102 |
Michael P.J. Nossal – Business Strategy and Development(4) | | 526,191 | | 609,101 | | 1,135,292 |
| | |
| |
| |
|
| (1) | | Includes amounts accrued for annual leave and long service leave. |
| (2) | | Includes short term incentive payments, executive indemnity insurance, personal financial planning advice and the value of shares issued under the executive share plan. |
| (3) | | Alan K. Dundas was appointed as an executive director on March 12, 2003. |
| (4) | | Michael P. J. Nossal was appointed as an Executive general manager, Business Strategy and Development on March 24, 2003. |
66
| | | | |
| | DIRECTORS, SENIOR MANAGEMENT AND EMPLOYEES | | |
Following a review of directors remuneration, the compensation committee approved the removal of the retirement benefit for new directors with an attendant increase in their annual basic fee to $130,000.
Non-executive directors appointed prior to April 8, 2003 and with more than five years service remain entitled to retirement benefits equaling the total fees paid during the three years before retirement. Directors in this category with three to five years service receive pro-rata benefits. Non-executive directors under the age of 75 receive a superannuation guarantee contribution which is presently 9% of their fees.
All of our full time Australian-based employees and expatriate employees (including executive directors and officers) and our subsidiaries are members of the WMC Superannuation Plan (formerly WMC Superannuation Fund). The WMC Superannuation Plan has three categories of membership:
| | • | | The defined benefit category provides lump sum benefits based on period of service, age and final average salary; |
| | • | | the accumulation category offers a minimum company contribution from 11.5% to 20% of basic annual salary to each member’s account in the Plan; and |
| | • | | the Superannuation Guarantee Category is a compulsory accumulation category for all employees under hourly paid awards. We are required by law to make a minimum contribution for each employee in this category which is presently 9% of ordinary time earnings. |
For further details of the WMC Superannuation Plan, refer to Note 39 of our Consolidated Financial Statements.
The WMC Resources board is committed to protecting and enhancing shareholder value and conducting the company’s business ethically and in accordance with the highest standards of corporate governance. In this section of the report, we set out the key corporate governance principles and practices adopted by the board. In preparing this statement, we recognize that WMC operates, and is registered in, several countries and is listed on the Australian Stock Exchange (ASX) and on the New York Stock Exchange. As different regulatory requirements and governance practices apply in each jurisdiction, we adapt our practices to reflect the highest standard across these jurisdictions.
The board supports the Principles of Good Corporate Governance and Best Practice Recommendations published by the ASX Corporate Governance Council in March 2003. While we have, for some time, had corporate governance policies and practices that substantially comply with those set out in the recommendations, we have reviewed and updated our practices in the light of the council recommendations and changes in the governance requirements overseas.
The council recommendations require Australian-listed companies to report on their compliance with ASX “best practice” recommendations, adopting an “if not why not”: approach. While we are not required to disclose compliance with these recommendations until next year, we believe it is appropriate and in the spirit of good disclosure to report on how our practices measure up. Recently, we established a corporate governance section on our website (www.wmc.com/about/governance/index.htm) which includes details of our corporate governance policies, practices and charters, along with a schedule outlining our compliance with each “best practice” recommendation. This link is an inactive link for information purposes only.
Role of the Board
The board, working with senior management, is responsible to shareholders for our overall business performance. It approves company goals and directions, strategic plans and performance targets. The board ensures that appropriate policies, procedures and systems are in place to manage risk, optimize business performance and maintain high standards of ethical behaviour and legal compliance. Its role and responsibilities are set out in the Board Charter which may be viewed on our website (www.wmc.com/about/governance/index.htm). This link is an inactive link for information purposes only.
The board ensures the company complies with regulatory requirements and maintains ethical standards. We maintain a high level of transparency in reporting to all stakeholders.
The board is responsible for strategic direction and control, and delegates responsibility for managing the company to the chief executive officer. Board functions include:
| | • | | providing strategic direction for, and approving, business strategies and objectives; |
67
| | | | |
| | DIRECTORS, SENIOR MANAGEMENT AND EMPLOYEES | | |
| | • | | approving policies for managing business risks, safety and occupational health, community and environmental matters; |
| | • | | monitoring our operational and financial position and performance; |
| | • | | identifying principal risks we face and ensuring that appropriate control and monitoring systems are in place to manage the impact of these risks; |
| | • | | ensuring that our financial and other reporting mechanisms result in adequate, accurate and timely information being provided to the board; |
| | • | | approving processes, procedures and systems to ensure that financial results are appropriately and accurately reported on a timely basis; |
| | • | | ensuring that shareholders and the financial market are informed of all material developments in relation to the company and our businesses; |
| | • | | appointing and – where appropriate – removing the chief executive officer, approving other key executive appointments and planning for executive succession; |
| | • | | overseeing and evaluating the performance of the chief executive officer and other senior executives; and |
| | • | | reviewing and approving executive remuneration. |
Board Meetings
During 2003, WMC’s board met 11 times. Usually, full-day board meetings are held monthly (except January). However, from time to time meetings are convened outside the scheduled dates to consider issues of importance. Occasionally, ad hoc board committee meetings are convened to address issues when it is not practical to organize a full board meeting.
The chairman and the chief executive officer meet regularly to discuss business and strategic issues and to agree on board agendas.
Access to Information
Directors are entitled to access all information required to discharge their responsibilities. Independent of board papers, directors receive a monthly report from the chief executive officer on the performance of the company’s businesses and other significant issues. Senior executives also make presentations at each board meeting to assist directors in developing an in-depth knowledge of the company’s operations. Two board meetings are held in conjunction with visits to company operations each year to enhance directors’ knowledge of the businesses and facilitate contact with key staff at operations.
New directors are provided with a comprehensive orientation pack and are encouraged to visit company operations to assist them to understand WMC’s businesses and key drivers.
Directors may obtain independent professional advice at the company’s expense, subject to prior consultation with the chairman, on matters arising in the course of their board and committee duties. At all times, directors have access to senior company managers and company documents.
Board Composition
WMC’s board has nine directors. Seven are non-executive directors including the chairman, and there are two executive directors. The board’s strength comes from the collective interaction of its experienced, knowledgeable and informed directors. Two directors – Ian Burgess and Roger Vines – have retired from the board since the publication of the last annual report. Three new directors – Alan Dundas, John Pizzey and Graeme McGregor – have been appointed. Ian Burgess retired as chairman at the 2003 annual meeting and Tommie Bergman was appointed chairman in his place.
From time to time, the nominations committee (see page 70) reviews the board’s composition and assesses nominations for new appointments to ensure the board has the right balance of skills and experience.
All non-executive directors are independent, having no business or other relationship with WMC that could compromise their autonomy. The company has adapted the definition of independence developed by Investment and Financial Services Association Limited in its Corporate Governance, A Guide for Fund Managers and Corporations – Blue Book. Under this definition, an independent director is a non-executive director (not a member of management) and:
| | • | | is not a substantial shareholder of the company or an officer of, or otherwise associated directly with, a substantial shareholder of the company; |
68
| | | | |
| | DIRECTORS, SENIOR MANAGEMENT AND EMPLOYEES | | |
| | • | | within the last three years has not been employed in an executive capacity by the company or another group member, or been a director after ceasing to hold any such employment; |
| | • | | within the last three years has not been a principal of a material professional adviser or a material consultant to the company or another group member, or an employee materially associated with the service provided; |
| | • | | is not a material supplier or customer of the company or other group member, or an officer of or otherwise associated directly or indirectly with, a material supplier or customer; |
| | • | | has no material contractual relationship with the company or another group member other than as a director of the company; |
| | • | | has not served on the board for a period which could, or could reasonably be perceived to, materially interfere with the director’s ability to act in the best interests of the company; and |
| | • | | is free from any interest and any business or other relationship which could, or could reasonably be perceived to, materially interfere with the director’s ability to act in the best interests of the company. |
Non-executive directors are subject to re-election by rotation at least every three years and retire by agreement at the annual meeting following their 72nd birthday. There are no maximum terms for non-executive director appointments. Newly-appointed directors must seek re-election at the first general meeting of shareholders following their appointment.
Chairman
The chairman is responsible for leading the board, ensuring that it functions effectively, and communicating the board’s views to stakeholders. WMC’s chairman, Tommie Bergman, is an independent non-executive chairman who has held the position since May 2003 and has been a director since 2001.
Chief Executive Officer
The chief executive officer is selected by the board and is subject to annual performance reviews by the non-executive directors. The chief executive officer recommends policy and strategic direction for board approval and is responsible for the day-to-day operation of the company. Andrew Michelmore was appointed Chief Executive Officer of WMC on January 1, 2003 following the retirement of Hugh Morgan on that date. Mr Michelmore joined WMC Limited in 1993 and held a number of senior positions before being appointed to the board as chief executive officer-elect in August 2002.
Board Committees
WMC’s board has established three standing committees to assist in meeting its responsibilities – the audit committee, the compensation committee and the nominations committee. These committees review matters on behalf of the board and make recommendations for consideration by the entire board. Copies of the charters of each of these committees may be accessed from our website (www.wmc.com/about/governance/index.htm). This is an inactive link for information purposes only.
The audit committee consists of three independent non-executive directors – Adrienne Clarke, Graeme McGregor and its chair, David Meiklejohn – and two have substantial financial experience. The committee meets at least four times a year and assists the board in meeting its regulatory responsibilities. It also ensures that an effective system of financial reporting, internal control and risk management is in place. The committee provides a direct channel of communication between the external and internal auditors and the board, and assists the board in ensuring that the external audit is conducted in a thorough, objective and cost-effective manner. It also reviews the internal audit annual work plan. The audit committee’s terms of reference include an annual review of the external auditors’ performance, and the nature and extent of their non-audit services.
The chief executive officer and chief financial officer, together with the internal and external auditors, usually attend committee meetings – except when the committee wishes to meet alone. The committee also has regular, private meetings with the external and internal auditors. The committee has access to professional advice inside and outside WMC.
The compensation committee meets at least four times a year. It consists of four independent non-executive directors – Tommie Bergman, Peter Knight, John Pizzey and its chair, Ian Webber. The committee’s role is to oversee company remuneration and compensation plans, policies and practices including remuneration of non-executive directors, the chief executive officer and senior executives, and succession planning. It also reviews terms and conditions for employee incentive schemes, benefit plans and share plans. The committee considers remuneration strategy, on behalf of the board, having regard to community and industry standards and, where possible, verifies its appropriateness using external information and advice to ensure that:
| | • | | employee interests are aligned to corporate objectives; |
69
| | | | |
| | DIRECTORS, SENIOR MANAGEMENT AND EMPLOYEES | | |
| | • | | the company can attract, develop and retain high-quality talent; |
| | • | | appropriate succession planning is in place for senior executive roles; and |
| | • | | the integrity of the company’s reward program is maintained. |
The nominations committee meets at least three times a year. Established in April 2003, it consists of the full board and its chair is Tommie Bergman. The committee’s role is to ensure the board is comprised of directors who are best able to discharge the board’s legal and other responsibilities, meet the company’s obligations to shareholders and do so to the highest standards of corporate governance. The nominations committee considers the board’s size and composition, along with its effectiveness and that of its committees. It also considers director eligibility criteria.
Management Committees
In addition to board committees, WMC has management committees that assist in meeting company objectives. The management committees include:
The executive committee is chaired by the chief executive officer and includes all the group’s executive general managers: Alan Dundas, Bruce Brook, Greg Travers and Michael Nossal. The committee develops company strategy and policy, and guides the operation of company businesses in accordance with the company’s strategies, policies and values.
The risk management committee is chaired by the chief executive officer and includes senior management. It is responsible for implementing financial risk management policy.
Following the demerger of late 2002, the board established a corporate policy review committee, comprising the chief executive officer, the chief financial officer and the company secretary. The committee reviews and recommends appropriate corporate policies and procedures to the board. Our policies are available on our website (www.wmc.com/about/policies.htm). This is an inactive link for information purposes only.
In December 2003 a Disclosure Committee, comprising Chief Executive Officer, Chief Financial Officer and General Manager Legal and Company Secretary, was established. The Committee’s role includes reviewing potentially discloseable corporate information, in consultation with WMC management and personnel, to determine if disclosure is required to the Australian and New York stock exchanges, and to ensure the Board is kept fully informed of the Disclosure Committee’s determinations and is involved in deliberation when appropriate.
Prior to the formal establishment of the Disclosure Committee, the Executive Committee and Legal Counsel performed the prerequisite duties.
Review of Board Performance
The board has a process for reviewing its performance and that of its committees, individual directors and executive management. The board meets once a year to consider these issues. The chairman discusses with each director his or her contribution, one-on-one. These reviews are a factor in determining nominations for re-election of directors.
Indemnities
The company has entered into deeds of access, indemnity and insurance with each director. These deeds provide access to documentation, indemnification against liability from conduct of the company’s business and subsidiaries, and directors’ and officers’ liability insurance.
Company Secretary
The company secretary advises the board on compliance and corporate governance issues and meeting procedure. All directors have access to his advice and the corporate secretariat’s services. Peter Horton, General Manager Legal and Company Secretary, was appointed as company secretary by the board on January 1, 2000.
70
| | | | |
| | DIRECTORS, SENIOR MANAGEMENT AND EMPLOYEES | | |
Company Policies
The board has adopted policies in key areas including occupational health and safety, the environment, community, indigenous people, respect and diversity in employment (formerly equal employment opportunity), continuous disclosure, capital investment and employee trading in company securities.
Reporting to Stakeholders
The board is committed to keeping shareholders and other stakeholders informed, in a timely manner, of material developments that affect the company. The company’s disclosure policy is supported by a formal policy and comprehensive procedures on continuous and periodic disclosure to ensure compliance with local and overseas stock exchange and Corporations Act obligations. A copy of the company’s disclosure policy is available from our website (www.wmc.com/about/governance/index.htm).
All company announcements, presentations to analysts and other significant briefings are posted on the company’s website after release to the Australian Stock Exchange. Copies are also made available electronically to shareholders who have elected to receive them by email. The company secretary is responsible for communications with the Australian Stock Exchange.
Ethical Standards
The WMC Resources Code of Conduct sets parameters for ethical behaviour and business practices for directors, employees and contractors. A code of conduct advisory committee regularly reviews and updates the code. The committee, comprising nine members from a cross-section of our operations and chaired by an executive general manager, is also available to any employee seeking guidance on ethical issues.
Share Trading
The company’s share trading policy prohibits directors and employees from engaging in short-term trading of any WMC Resources securities, or buying or selling WMC Resources shares if they possess unpublished price-sensitive information.
In addition, individual directors and senior management must not buy or sell WMC Resources shares in the six-to-eight weeks between the end of the half or full financial year and the release of that period’s results. Directors and senior management must receive approval from the chairman, chief executive officer or company secretary before buying or selling company shares. Directors’ share-holdings are shown on page 80 of this report.
Risk Management
Risk management is a key element of effective corporate governance. Recognising this, WMC has a risk management policy and specific, comprehensive procedures for managing the company’s financial, operational and project risk.
Executive general managers are responsible for risk management activities in their respective areas of accountability. The executive committee is responsible for establishing risk acceptance criteria and for managing critical business risks such as those associated with financial exposures and major projects. The board has overall responsibility for ensuring that management policies, procedures and controls are in place to manage the impact of significant business risk.
Directors oversee risk identification and management through the audit and executive committees.
Our risk management policy ensures explicit and systematic identification, assessment, management and communication of all risks associated with our business and operations. The policy is based on the Australian Standard for risk management (AS4360:1999), and delineates mandatory processes and specific accountabilities across the company. Our risk management program is reviewed against market practice.
Financial Risk Management
Audit
Our audit and assurance processes ensure effective risk management in critical areas. The board’s audit committee identifies areas requiring audit. Audits are conducted by independent third parties and results are presented to the audit committee. We have a critical action tracking system to ensure that any material deficiencies identified in audits are corrected.
71
| | | | |
| | DIRECTORS, SENIOR MANAGEMENT AND EMPLOYEES | | |
Group Internal Audit
Internal audit provides independent assurance of the effective design and operation of WMC’s risk and control framework. Internal audit operates under a charter from the board audit committee, giving unrestricted access to review all areas of our operations and corporate functions. International accounting firm KPMG provides contract internal audit services.
Group Internal Audit’s role, as approved by the board audit committee, is to:
| | • | | assess the design and operating effectiveness of controls governing key operational processes and business risks |
| | • | | provide the board with an assessment – independent of management – as to the adequacy of WMC’s internal operating and financial controls, systems and practices |
| | • | | assist the board in meeting its governance and regulatory responsibilities |
| | • | | provide services to management to enhance the control environment. |
Significant risks and areas of non-compliance are reported to the board audit committee.
External audit
PricewaterhouseCoopers is the company’s external auditor. The board audit committee is responsible for developing procedures for selecting and appointing the external auditor, and for rotating external audit engagement partners. The external audit engagement partner and review partner are rotated every five years. The current engagement partner was appointed in 2000.
WMC is committed to auditor independence. The audit committee reviews the independence of the external auditor on an annual basis. These reviews include confirmation from the auditor that, in its professional judgement, it is independent of the WMC Resources group.
To ensure that there is no potential conflict of interest in work undertaken by our external auditor, that firm may only provide services that are consistent with the role of the company’s auditor.
The auditor can provide non-audit services, but cannot provide such services when they are, or are perceived to be, in conflict with audit independence. All non-audit services must be pre-approved by the audit committee. In certain circumstances, that authority is delegated to the audit committee’s chairman.
An analysis of fees paid to the external auditors during 2003 – including non-audit services – is provided in Item 16C and in Note 43 to the Consolidated Financial Statements.
As part of WMC’s assurance process, during 2002 the company established an assurance council, chaired by the chief financial officer. Members of the council include senior finance, operational management and internal audit. A representative from our external auditor attends by invitation. The council assists management in meeting corporate governance requirements by helping to ensure there are effective internal systems and controls to support WMC’s risk management strategies and continuous disclosure policy. At least once a year, the council reports on the effectiveness of these control processes and procedures.
Our risk management committee is responsible for implementing policy on price risk management, funding activities, credit management and treasury operating controls. The policies ensure we have access to sufficient low-cost funding to ensure liquidity and the ability to fund growth opportunities while maintaining a sustainable approach to financial risk management.
Our price risk management procedure recognizes that while our exposures to prices are significant, we will only seek to hedge these exposures under certain circumstances. We may seek to hedge price exposures to ensure sufficient liquidity for the corporation or to support a specific project that has high costs or requires significant capital expenditure. Use of the cash-flow-at-risk model ensures our exposures to commodity prices, exchange rates and interest rates are quantified at all times.
Operational Risk Management
Operational risk management covers all risk associated with our operating sites. During late 2002, and through 2003, we deployed our “integrated operational risk management” program. This comprehensive, all-of-site approach identifies and assesses risks according to their potential impact on people, the environment, local communities and production.
The program delivers a detailed risk register for each operation. The register prioritizes risks according to their potential impacts and identifies the critical controls over these risks. Site management is responsible for ensuring that controls covering critical risks are maintained diligently.
72
| | | | |
| | DIRECTORS, SENIOR MANAGEMENT AND EMPLOYEES | | |
Project Risk Management
Project risk management targets risks associated with projects and acquisitions, and covers a broad range of issues including:
| | • | | country risk – where a project is proposed in a country other than Australia |
| | • | | commodity (pricing and demand) risk – for projects or acquisitions in new commodities or for projects that significantly increase our exposure in an existing commodity |
| | • | | technology risk – where new or innovative technologies are required |
| | • | | construction and contractor risk – where we are dependent on contractors to deliver substantial elements of a project. |
Our project risk management program also covers the design and operation of new facilities to ensure that we build and commission facilities with an acceptable level of inherent, ongoing operational risk.
At December 31, 2003, we employed 3,053 people directly and hired 1,646 as contractors.
We are decentralized into divisional business or functional units where executive general managers and general managers exercise widely delegated authority and discretion within broad guidelines. Responsibility for employee relations resides with the operations with support and advice from the Human Resources Department.
Individual contracts of employment have been implemented across our operations. This move to individual contracts was effectively concluded during 1997, with the majority of employees now employed under the same form of contract.
Membership of trade unions is optional under Australian law. Industrial dispute over the past year has been minimal and confined to contractor organizations. None of our employees participated in any industrial dispute. We operate continuous shift work across many of our operations in Western Australia, South Australia and Queensland.
Local law and custom is observed as a minimum standard in determining wage and working conditions at our overseas operations. We have in place a Code of Conduct, the objective of which is to ensure fair and ethical practices within our organization, which must be observed by all directors, employees and contractors at all of our operations.
The distribution of our employees between business segments and geographically is outlined below:
| | | | | | | | | | | | |
| | | Year ended December 31,
2003
| | Year ended December 31,
2002
| | Year ended December 31,
2001
|
| | | Permanent
Staff
| | Contractors
| | Permanent
Staff
| | Contractors
| | Permanent
Staff
| | Contractors
|
Copper | | 1,095 | | 628 | | 960 | | 366 | | 988 | | 314 |
Nickel | | 1,099 | | 611 | | 950 | | 667 | | 1,009 | | 755 |
Gold | | — | | — | | — | | — | | 104 | | 86 |
Industrial Minerals and Fertilizers | | 276 | | 159 | | 360 | | 171 | | 364 | | 233 |
Projects | | — | | — | | — | | — | | 38 | | 19 |
Exploration Division | | 42 | | 23 | | 46 | | — | | 68 | | 5 |
Corporate | | 541 | | 225 | | 581 | | 270 | | 476 | | 175 |
| | |
| |
| |
| |
| |
| |
|
Total | | 3,053 | | 1,646 | | 2,897 | | 1,474 | | 3,047 | | 1,587 |
| | |
| |
| |
| |
| |
| |
|
Australia | | 3,011 | | 1,642 | | 2,834 | | 1,458 | | 2,978 | | 1,582 |
North America | | 28 | | 2 | | 42 | | 9 | | 46 | | 3 |
South America | | 2 | | 2 | | 13 | | 7 | | 16 | | 2 |
Asia | | 6 | | — | | 6 | | — | | — | | — |
Europe | | 2 | | — | | 2 | | — | | 2 | | — |
South Africa | | 2 | | — | | — | | — | | 5 | | — |
Mozambique | | 2 | | — | | — | | — | | — | | — |
| | |
| |
| |
| |
| |
| |
|
| | | 3,053 | | 1,646 | | 2,897 | | 1,474 | | 3,047 | | 1,587 |
| | |
| |
| |
| |
| |
| |
|
73
| | | | |
| | DIRECTORS, SENIOR MANAGEMENT AND EMPLOYEES | | |
In connection with the demerger, we issued options to subscribe for our shares and stock appreciation plan rights.
The table set forth below shows the options we issued in connection with the demerger and the exercise price for each option. We issued these options to our employees to replicate proportionately the options over WMC Limited shares these employees had prior to the demerger. The table also shows options allocated subsequent to the demerger under the December 2002 Option Plan.
| | | | | | | | |
WMC Limited Option Plan
| | Expiry Date
| | WMC Resources
Option Exercise Price (A$)
| | No. of WMC
Resources Options Issued under Option Scheme on 12/11/2002
| | No of WMC
Resources
Options
Outstanding at
12/31/2003
|
1999 Option Plan | | December 20, 2004 | | 3.90 | | 3,868,000 | | 1,389,945 |
2000 Option Plan | | December 18, 2005 | | 3.48 | | 6,007,050 | | 1,798,500 |
2001 Option Plan | | November 30, 2006 | | 4.33 | | 10,060,500 | | 3,924,900 |
May 2002 Option Plan(1) | | November 30, 2006 | | 4.33 | | 600,000 | | 475,000 |
Dec 2002 Option Plan(2) | | December 23, 2007 | | 4.34 | | — | | 8,618,800 |
| | | | |
| |
| |
|
| (1) | | Options granted to executive directors of WMC Limited. |
| (2) | | Options issued subsequent to the demerger. |
On January 13, 2003, 322,800 employee options were issued at A$4.34 under the 2002 Employee Option Plan, with an expiry date of December 23, 2007.
As at December 31, 2003, the aggregate number of these options held by our directors and executive general managers was 737,000. All our directors and executive general managers own shares or options in WMC Resources Ltd, but none own more than three percent of any category.
The table set forth below shows the stock appreciation plan (“SAP”) rights we issued in connection with the demerger and the allotment price for each right. The table also shows SAP rights issued subsequent to the demerger under the December 2002 SAP.
| | | | | | | | |
WMC Limited SAP
| | Expiry Date
| | WMC
Resources
SAP Right
Allotment
Price (A$)
| | Balance of WMC
Resources SAP Rights Issued under SAP Proposal as at 12/11/2002
| | Balance of WMC
Resources SAP
Rights Issued
under SAP Right
Allotment at
12/31/2003
|
1997 SAP | | December 22, 2002 | | 2.27 | | — | | — |
1998 SAP | | December 21, 2003 | | 2.26 | | 59,500 | | — |
1999 SAP | | December 20, 2004 | | 3.90 | | 183,400 | | 22,900 |
2000 SAP | | December 18, 2005 | | 3.48 | | 309,900 | | 62,800 |
2001 SAP | | November 30, 2006 | | 4.33 | | 481,300 | | 168,500 |
June 2002 SAP | | November 30, 2006 | �� | 4.33 | | 250,000 | | Nil |
August 2002 SAP | | November 30, 2006 | | 4.33 | | 400,000 | | 400,000 |
December 2002 SAP(1) | | December 23, 2007 | | 4.34 | | 261,400 | | 242,500 |
| | | | |
| |
| |
|
| (1) | | SAP rights issued subsequent to the demerger. |
WMC Resources Employee Share Scheme
Following the demerger, we established the WMC Resources Employee Share Scheme (“WMC Resources ESS”). The WMC Resources ESS provides a framework for the offer by our board of our shares, or rights to or in respect of WMC Resources shares (such as options), to our employees from time to time. The WMC Resources ESS operates in substantially the same manner as the WMC employee share scheme historically operated by WMC Limited.
74
| | | | |
| | DIRECTORS, SENIOR MANAGEMENT AND EMPLOYEES | | |
Under the WMC Resources ESS, we have offered:
| | • | | to certain of our senior executives – shares in us under the WMC Resources Executive Share Plan, the terms of which were approved by the WMC Resources Board shortly before the demerger; |
| | • | | to certain employees in Australia – options to acquire our shares, the terms and conditions of which were promulgated by the WMC Resources Board at the time of the relevant offers (WMC Resources Option Plan); and |
| | • | | to certain employees outside Australia – SAP Rights, the terms and conditions of which were promulgated by the WMC Resources Board at the time of the relevant offers (WMC Resources SAP). |
The WMC Resources Executive Share Plan, WMC Resources Option Plan and WMC Resources SAP (the “WMC Resources Plans”) have been designed to align the interests of our employees with those of our shareholders and are regarded as an integral component of our employee benefit and motivation strategies.
The total number of our shares, together with the total number of unexercised options over our shares, which may be issued pursuant to all WMC Resources Plans will not exceed 5% of the total number of our shares on issue from time to time.
Subject to the Listing Rules of the ASX, our directors will by resolution be able to revoke, add to, or vary all or any of the provisions of the WMC Resources Plans, or all or any of the rights or obligations of the participants or any of them, provided that the interests of the participants are not, in the opinion of our directors, materially prejudiced.
Impact of demerger on plans
In conjunction with the demerger, WMC Limited and WMC Resources Ltd entered into an employee benefits agreement. This agreement covered the treatment of WMC Limited common stock options issued to WMC Limited and WMC Resources employees. According to the agreement, each WMC Limited option granted to WMC Limited and WMC Resources employees prior to December 4, 2002, that was outstanding under the WMC Limited Employee Share Scheme as of the demerger date, was adjusted. This adjustment resulted in each individual who was a holder of a WMC Limited option receiving, immediately after the demerger date, an adjusted WMC Limited option and a WMC Resources option. As part of the demerger from WMC Limited, WMC Limited option holders were granted one option for Alumina Limited and one for WMC Resources Ltd. The aggregate exercise prices of the Alumina Limited option and the WMC Resources Ltd option is equal to the exercise price of the WMC Limited option prior to demerger. The Alumina Limited option and the WMC Resources Ltd option have the same lapse date as the WMC Limited option would have had if the demerger had not proceeded — being the earlier of five years after the option was issued and 30 days after the WMC Limited option holder ceases to be employed by WMC Limited Group, WMC Resources Group or Alumina Group. The exercise price of a WMC Resources Ltd option was determined by reference to the pre-demerger exercise price of the WMC Limited option (which became an Alumina option) in respect of which the WMC Resources Ltd option was granted and the volume weighted average price of WMC Resources shares and Alumina Limited shares sold on the ASX over the first five days of trading on the ASX commencing on the listing date. The Stock Appreciation Plan was treated in the same manner as the Share Scheme as detailed above.
WMC Resources Executive Share Plan
Consistent with WMC Limited’s announcement on August 13, 2002 to suspend future option allotments to its senior management under the WMC employee share scheme, we implemented a share purchase plan for senior staff, known as the WMC Resources Executive Share Plan, which replaced option allotments for this group.
The WMC Resources Executive Share Plan provides a level of reward for senior staff based on our performance against a peer index of resources companies. Actual rewards will vary in accordance with the performance of the individual executive and our performance on a total shareholder return basis against the index.
All rewards for senior staff through this scheme are provided to participants in the form of our shares which will be purchased on-market on behalf of the participants (at no cost to the participants). Participants are not able to dispose of the shares acquired under the plan unless both prior to and after such a disposal, the participant holds shares whose value reflects a multiple of their salary (subject to certain other disposal restrictions). For the chief executive officer the multiple is 1.5 times salary, for executive general managers the multiple is 1.0 times salary and for general managers the multiple is 0.5 times salary.
75
| | | | |
| | DIRECTORS, SENIOR MANAGEMENT AND EMPLOYEES | | |
Under the WMC Resources Executive Share Plan, the full value of any reward gained by senior management will be expensed and the value to the executive disclosed in accordance with our reporting obligations and practice on remuneration of executive staff.
The first acquisitions of our shares under the WMC Resource Executive Share Plan were made on December 23, 2002. In total, 1,158,303 shares were acquired for 27 senior staff, with an average acquisition price of $A4.33 per share.
No shares were purchased by WMC Resources Ltd under this plan during 2003. Under the plan, 1,270,133 shares were purchased on behalf of 29 senior staff between 27 January and 2 February 2004 in respect of the 2003 year.
WMC Resources Option Plan
In December 2002, we made our first offer of WMC Resources Options to employees, other than our senior management, under the 2002 WMC Resources Option Plan. We made the first allotment of WMC Resources Options on December 23, 2002, and in a manner consistent with the past WMC Limited Option allotments. The 2002 WMC Resources Option Plan operates on substantially the same terms as the WMC Limited Option Plans, namely:
| | • | | Eligible employees were invited to apply for the grant by us of WMC Resources Options, granted at an issue price of A$0.01 per WMC Resources Option. |
| | • | | Each WMC Resources Option gives the holder the right to subscribe for one WMC Resources Share (subject to adjustment in accordance with the terms of the applicable WMC Resources Option Plan to reflect new issues by WMC Resources and capital reconstructions). |
| | • | | Subject to certain exceptions, the WMC Resources Options are not able to be exercised until after a period of 12 months from the date of allotment and will lapse on the fifth anniversary of the date of allotment. |
| | • | | Upon exercise of a WMC Resources Option, the holder will be obliged to pay the relevant exercise price, which was determined by reference to the weighted average sale price of our shares on the ASX on the trading day that the invitation to apply for the WMC Resources Options was made to employees. |
An allotment of WMC Resources Options under the 2002 WMC Resources Option Plan was made on January 13, 2003 under which 322,800 WMC Resources Options were issued with an exercise price of A$4.34 and an expiry date of December 23, 2007.
During 2002, WMC Resources discontinued the executive option plan for senior managers, and during 2003 discontinued option plans for employees generally. This decision reflects the board’s concern to ensure full transparency in the value of employee rewards, and had regard for governance concerns in respect of option valuation and the diluting effect of options on shareholders. The new equity plans provide employees with company shares purchased on market.
WMC Resources Employee Share Scheme
In 2003 two new share plans were introduced for all employees other than for senior executives. The share plans replaced the WMC Option Plan which is no longer offered to employees.
The WMC Resources Staff Share Plan provides all Australian based permanent full time and permanent part time staff with up to A$ 1000 worth of the company’s shares which may be received on a tax free basis. Participants can only dispose of the shares acquired under the plan after they have held them for three years or left the company.
The other share plan, the WMC Resources Performance Share Plan was offered to all Australia based permanent full time and permanent part time staff in professional and managerial roles. Under this Plan participants could acquire company shares equal in value to a predetermined percentage of their base salary. Actual rewards under the Plan vary in accordance with the performance of the individual staff member and the company’s relative performance on a total shareholder return basis against a peer index of resource companies. Participants can only dispose of the shares acquired under the plan after they have held them for ten years or left the company.
Shares provided to participants under both the Staff Share Plan and the Performance Share Plan are purchased on-market on behalf of participants (at no cost to participants). The first acquisitions of shares under the plans were made between January 27 and February 4, 2004, when 1,317,425 shares were purchased at a gross cost (pre-tax) of A$6.9 million.
76
| | | | |
| | DIRECTORS, SENIOR MANAGEMENT AND EMPLOYEES | | |
WMC Resources Stock Appreciation Plan
In December 2002, we made our first offer of WMC Resources SAP Rights to our employees located outside Australia under the 2002 WMC Resources SAP. We made the first allotment of WMC Resources SAP Rights on December 23, 2002, and in a manner consistent with the past WMC Limited SAP Right allotments, namely:
| | • | | Eligible employees were invited to apply for the grant by us of WMC Resources SAP Rights. |
| | • | | The employees were not required to pay any amount for the grant of the WMC Resources SAP Rights, but each WMC Resources SAP Right has a notional allotment exercise price, equal to the weighted average sale price of our shares on the ASX on the trading day that the invitation to apply for the WMC Resources SAP Rights was made to the employee. |
| | • | | Subject to certain exceptions, the WMC Resources SAP Right will not be able to be redeemed until after a period of 12 months from the date of allotment and will lapse on the fifth anniversary of the date of allotment. |
| | • | | Upon redemption of a WMC Resources SAP Right before its expiry by the holder, the holder will be entitled to a payment equal to the difference between the closing price of our shares on the ASX on the trading day immediately before redemption, and the notional allotment price (assuming the former amount is higher). |
During 2003, WMC Resources decided to discontinue the issuing of SAP Rights previously offered to its employees located outside Australia and therefore no SAP Rights were issued during 2003.
77
| | | | |
| | MAJOR SHAREHOLDERS AND RELATED PARTY TRANSACTIONS | | |
ITEM 7. MAJOR SHAREHOLDERS AND RELATED PARTY TRANSACTIONS
Our issued capital is currently constituted by one class of registrable voting securities being ordinary shares.
As at April 30, 2004, we had on issue 1,157,405,781 fully paid ordinary shares, and 13,764,237 options over our ordinary shares. The share options were issued pursuant to the WMC Resources Employee Scheme and carry no voting rights.
The following table sets forth, as at April 30, 2004, information in respect of:
(i) any person who is known to us to be the registered owner of more than 5% of any class of our voting securities; and
(ii) the total amount of any class of its voting securities owned by our Directors and Executive General Managers as a group.
| | | | | | |
Title of class
| | Identity of person or group
| | Amount owned(1)
| | % of class
|
Fully paid ordinary shares in WMC Resources Ltd | | J. P. Morgan Nominees Australia Ltd | | 225,106,406 | | 19.45 |
| | | Westpac Custodian Nominees Ltd | | 224,175,018 | | 19.37 |
| | | National Nominees Limited | | 186,994,778 | | 16.16 |
| | | Citicorp Nominees Pty Ltd | | 71,786,879 | | 6.20 |
| | | | |
| |
|
| | | |
Fully paid ordinary shares | | Directors and Executive General Managers of WMC Resources Ltd as a group | | 1,133,878 | | 0.10 |
| | | | |
| |
|
| | | |
Employee Share Options | | Directors and Executive General Managers of WMC Resources Ltd as a group | | 737,000 | | 5.35 |
| | | | |
| |
|
| (1) | | Includes WMC Resources Ltd’s ADSs. |
The nominee companies listed in the previous table hold these fully paid ordinary shares on behalf of numerous beneficial owners. The only beneficial owner known to have owned more than 5% of our issued and outstanding fully-paid ordinary shares since listing on December 4, 2002 is the Capital Group International Inc. The history of significant changes since listing date is outlined below:
| | | | | | | |
Beneficial Owner
| | Date
| | Number of Shares
| | % Shareholding
| |
Capital Group International Inc. | | 04/16/2003 | | 151,566,621 | | 13.43 | % |
| | | 02/17/2003 | | 139,717,091 | | 12.38 | % |
| | | 12/19/2002 | | 126,179,432 | | 11.34 | % |
| | |
| |
| |
|
|
All fully paid shareholders have the same voting rights.
There are no arrangements, known to us, the operation of which may at a subsequent date result in a change in control of us.
| B. | | Related Party Transactions |
Loans to directors
During the 2001 fiscal year, there were no additional loans made to directors and an amount of A$1,000 was repaid, resulting in an outstanding balance of A$4,900 at December 31, 2001.
During the year ended December 31, 2002, a loan of A$93,050 was advanced to Jens Balkau, a director of one of our controlled entities. All outstanding loans (A$93,375) were repaid or forgiven (A$3,643) during the year, resulting in no outstanding loans to WMC Resources Ltd directors at December 31, 2002.
78
| | | | |
| | MAJOR SHAREHOLDERS AND RELATED PARTY TRANSACTIONS | | |
All of the loans to directors referred to above were made prior to the demerger in connection with the Employee Share Purchase Plan, the Partly Paid Share Plan and the Senior Staff Share Issue to enable them to acquire shares of WMC Limited. The share plan loans existing during the 2002 fiscal year were secured by shares allocated by WMC Limited under the 1988 allotment of the Employee Share Purchase Plan, the 1987 and 1988 Partly Paid Share Plan and the 1994 allotment of the Senior Staff Share Issue. The loans were interest free with repayments due in December 2002 and November 2003, although these were all repaid prior to the demerger.
During the 2003 fiscal year, there were no loans made to directors and no outstanding loans at the end of the year.
Shareholding transactions of directors
Our directors are also shareholders of ours and, as such, they may purchase and/or sell our shares.
Where our directors have engaged in these transactions they have done so on a normal commercial basis, on conditions no more favourable than those available to other shareholders.
Some of our directors who were employees of the WMC Limited group prior to the demerger, were eligible to participate in the WMC Employee Share Scheme, and were issued with options, priced at market value. These transactions were conducted on a commercial basis on conditions no more beneficial than those available to other eligible employees. At the time of demerger, these options were converted into WMC Resources options (see Item 6E. “Share Ownership”). As this is our second year of listing, comparatives for WMC Limited prior to the demerger have been provided.
79
| | | | |
| | MAJOR SHAREHOLDERS AND RELATED PARTY TRANSACTIONS | | |
| | | | | | |
| | | 2003
| | 2002
| | 2001
|
| | | Number of
WMC Resources Ltd shares
| | Number of WMC Limited shares
|
| The aggregate number of shares acquired by the directors of the parent entity or their director related entities as a result of the WMC Limited demerger was: | | — | | 808,317 | | — |
| | | |
| The aggregate number of shares acquired by directors of the parent entity or their director related entities other than as a result of the demerger was: | | | | | | |
| | | |
- purchases by director | | 50,000 | | — | | 10,000 |
- acquisitions through the senior executive share plan | | — | | 138,640 | | — |
| | | |
| The aggregate number of options allocated to directors of the parent entity or their director-related entities as a result of the WMC Limited demerger was: | | — | | 1,725,000 | | — |
| | | |
| The aggregate number of shares and options disposed of by directors of the parent entity or their director related entities was: | | | | | | |
| | | |
- fully paid shares | | — | | — | | 11,000 |
- options (options exercised and shares sold) | | 50,000 | | 300,000 | | 300,000 |
| | | |
| Details of shares and share options held by directors of the parent entity or their director related entities at period end are as follows: | | | | | | |
| | | |
- fully paid shares | | 378,310 | | 946,957 | | 434,459 |
- ordinary shares partly paid to five cents | | — | | — | | 331,000 |
- options for ordinary shares | | 482,000 | | 1,425,000 | | 1,470,000 |
- Central Norseman Gold Corporation Limited, fully paid shares | | N/A | | N/A | | 2,000 |
| | |
| |
| |
|
All other transactions relating to shares and options of WMC Limited prior to the demerger, including the payment and receipt of dividends, were on the same basis as similar transactions with other shareholders.
Other transactions of directors and director related entities
A number of our directors are also directors of other public companies which may have transactions with us. These directors do not believe that they have the capacity to control or significantly influence the financial or operating policies of either of those companies or us in their dealings with one another. We therefore do not consider those companies to be director related entities.
During the year ended December 31, 2002, Hugh M. Morgan received a payment of A$890,906 from a related party to WMC Limited, Alcoa Inc., relating to his participation in the Alcoa Inc. Directors’ Deferred Fee Plan. The benefit became payable following his retirement as a director of that entity.
In addition, Hughmore Securities Pty Ltd, an entity associated with Hugh M. Morgan, our chief executive officer until December 31, 2002, purchased fertilizer totalling A$14,199. For the year ended December 31, 2001 the amount was A$14,325. All of the purchases were made on an arm’s length basis from an entity we control.
Legal/Financial service fees
A number of directors of our controlled entities are associated with legal and financial service suppliers which have provided services to us during the financial year, on an arm’s length basis. The total of those services amounts to A$1,413,459 for the year ended December 31, 2003. For the years ended December 31, 2002 and 2001, the amounts were: A$1,511,590 and A$916,259, respectively. The legal and financial services suppliers referred to above which provided services to us in the fiscal year ended December 31, 2003 were: Sycip Salazar Hernandez & Gatmaitan, Sampson & West, Trident Trust Company, Welborn Sullivan Meck & Tooley P.C., Stikeman Elliott (Toronto), Larrain Y Associates, Marsh Management Services Singapore Pte Ltd, Segdwick Management Services (Singapore) Pte Ltd, Freehills Solicitors, Paul Thomson, Daniel DaSilva, Margarida Castel-Branco and Terence Gardner.
80
| | | | |
| | MAJOR SHAREHOLDERS AND RELATED PARTY TRANSACTIONS | | |
| C. | | Interests of Experts and Counsel |
Not applicable.
81
| | | | |
| | FINANCIAL INFORMATION | | |
ITEM 8. FINANCIAL INFORMATION
Our consolidated financial statements are included as Item 18.
Legal Proceedings
At the date of this Annual Report, we are a party to no pending legal proceedings nor are we aware of any reasonably likely to be commenced against us, other than:
| | • | | those mentioned below; or |
| | • | | ordinary routine litigation or other legal proceedings incidental to our business, particularly arising out of contract mining and construction activities to which we or any of our subsidiaries is a party or of which any of our or their property is subject. |
Native Title in Australia
“Native title” describes the rights and interests of Aboriginal and Torres Strait Islander people in land and waters according to their traditional laws and customs as recognized by the common law of Australia.
Native title law has evolved through judicial decisions and the enactment of legislation. The first significant High Court decision on the subject of native title was Mabo v Queensland (No 2) (1992) 175 CLR 1 (“the Mabo decision”) in 1992, in which the Court recognized the concept of native title and said that Aboriginal and Torres Strait Islander people who have maintained their connection with their land according to their laws and customs may hold native title. Proving connection usually involves showing that traditional laws and customs have been passed down through generations of Aboriginal or Torres Strait Islander people to the present day. The native title rights and interests (if any) of a particular group will depend on the traditional laws and customs of those people. Recent decisions have indicated that native title may change over time.
The Mabo decision also recognized that native title could be extinguished prior to the enactment of the Racial Discrimination Act 1975 (October 31, 1975) by government legislation or inconsistent executive action. In response to the Mabo decision, the Commonwealth Government enacted the Native Title Act, 1993 (“NTA”) which validated acts done and granted by it prior to January 1, 1994 (“past acts”) and allowed the States and Territories to enact their own validation legislation. Subsequent amendments also validated grants (“intermediate period acts”) made by the Commonwealth (and allowed the States and Territories to enact similar legislation) relating to certain freehold grants up to December 23, 1996. The NTA also created the National Native Title Tribunal, responsible for mediation of native title claims and the administration of the various procedures under the NTA governing native title claims. Finally, the NTA specifies the conditions to be satisfied and the procedures to be followed in order for acts done after January 1, 1994 (“future acts”) to be valid with respect to native title.
Our land tenure that is a past act or qualifying intermediate period act has been validated with respect to native title. The current operations of our Olympic Dam operations are on freehold title which the High Court held in Fejo v Northern Territory (1998) 195 CLR 96 “Fejo” permanently extinguishes native title, although expansions of our operation may attract the future act requirements of the NTA if they extend to areas outside the freehold tenure.
Native title may exist in areas where it has not been extinguished (removed). Although a determination of native title does not invalidate another’s validly granted, the High Court decision in the Wik Peoples v Queensland (1996) 187 CLR 1 “Wik” case, made it clear that native title may co-exist with other forms of tenure where that tenure is not exclusive, provided the native title rights are not incompatible with the exercise of the other rights. The decision was confirmed in Western Australia v Ward (2000) 99 FCR 316 where the High Court found that pastoral leases in Western Australia did not create the right of the pastoralist to exclusive possession and thus did not extinguish all native title rights. Pastoral leases in WA are leases of Crown Land under the Land Act 1933 (WA) held for pastoral and grazing purposes.
Where native title rights are inconsistent with the terms of a pastoral lease the native title rights must yield to rights of the pastoral lessee. The Wik decision provided some clarity about the impact of native title on Queensland pastoral leases which are relevant to the our Queensland Fertilizer Operations. While the current leases on which the Queensland Fertilizer Operations are conducted are secure, any future expansions onto adjacent non-freehold land is likely to attract the future act processes of the NTA.
82
| | | | |
| | FINANCIAL INFORMATION | | |
When it handed down its decision in Ward, the High Court held, among other things, that there could be partial extinguishment of native title rights and that WA mining and petroleum legislation extinguishes all native title rights that may have existed over minerals and petroleum. The High Court also held that a mining lease under the relevant Western Australian legislation extinguished any native title right to control access to land, or to be asked permission to use, or have access to, land but does not necessarily extinguish all native title rights. Particularly it does not extinguish those native title rights that are consistent with the rights granted to a pastoral or mining leaseholder. This decision, which provides some clarity about the impact of native title on pastoral leases and mining leases in Western Australia and the Northern Territory, is significant to us because our nickel operations are in Western Australia. However the decision also leaves many issues to be decided on a case by case basis. As a result, it is difficult at this stage for us to make any assessment of the impact of the Ward decision either specifically on our nickel operations or more generally on the current claimant applications for native title over our operations (referred to below) throughout Australia.
There are current claimant applications for native title determination in the Federal Court over areas of land and waters that impact the majority of our operations. The majority of our operations or related infrastructure fall within one or more of these applications. These operations include the Olympic Dam copper/uranium businesses in South Australia, the Phosphate Hill fertilizer operation in Queensland and the Western Australian nickel operations.
The High Court and Federal Court decisions and the NTA described above may have provided some conceptual guidance on the issue of native title and we believe that under these decisions and legislation our economic interests in existing mining leases and tenements will generally be upheld if challenged. However, our existing assets and operations could be affected by any native title claim that is ultimately determined in a manner that is contrary to our interests.
Other Financial Information
Export Sales
A significant proportion of our sales are to markets outside of Australia as shown in the revenue analysis below:
Australia – 17%
Europe – 33%
Japan – 14%
North America – 13%
Other – 23%
Dividends
Our board determines whether there will be a payment of dividends or implementation of other capital management initiatives after taking into consideration a number of factors, including our financial results, strategic objectives, ongoing capital expenditure requirements, general business conditions, taxation considerations (including the level of franking credits available), and any contractual, legal or regulatory restrictions on our ability to pay dividends, and any other factors our board may consider relevant. Any dividends we pay are paid in Australian dollars.
We paid a dividend of six cents per share in respect of the year ending December 31, 2003. For the years ending December 31, 2004 and beyond, our board has determined a target range for dividend payments of between 40 to 60 per cent of profit after tax, after taking into account various factors, including those outlined above.
We will not be in a position to pay franked dividends (which are dividends effectively paid out of profits which have borne Australian corporate tax) until our eligible carried-forward tax losses are utilized and we pay Australian tax on our profits. The Australian Federal Government’s proposed tax consolidation regime, amongst other things, is expected to affect the rate at which our carried-forward tax losses may be utilized, as described below. Under the consolidation regime, we may elect to consolidate our corporate group at any date following the demerger. We expect that all of our wholly owned subsidiaries will elect to form a consolidated group with effect from January 1, 2004 resulting in us and our wholly owned subsidiaries being treated as one single income tax entity from that date.
We expect that, during the period following the demerger and up to our consolidations, we will not pay Australian income tax and, therefore, will not have sufficient franking credits available to pay fully franked dividends to our shareholders.
The proposed consolidation rules are likely to reduce the rate at which carried-forward tax losses incurred prior to the date of consolidation may be utilized after consolidation. Despite this, our profits earned after consolidating the group may remain sheltered to some extent by the utilization of tax losses from pre-consolidation years when combined with any current year tax incurred by us.
83
| | | | |
| | FINANCIAL INFORMATION | | |
The extent to which our profits will be sheltered by tax losses and, therefore, the extent to which we will be able to pay franked dividends, will ultimately depend on our profitability. Based on our historical results, it is currently believed that we may not pay income tax in the short term. Accordingly, we anticipate that over this period we may not have sufficient franking credits available to pay fully franked dividends to our shareholders.
Financing and Corporate Items
Net financing and corporate expenses for the year ended December 31, 2003 totalled A$69.4 million compared to A$195.2 million for the year ended December 31, 2002. The principal components were:
| | | | | | | | | |
| | | Year Ended December 31, 2003
| | | Year Ended December 31, 2002
| | | Year Ended December 31, 2001
| |
| | | A$ million | | | A$ million | | | A$ million | |
Loss on revaluation of foreign currency assets & liabilities | | 2.5 | | | 14.9 | | | 20.7 | |
Interest (received)/(receivable) | | (22.0 | ) | | (103.5 | ) | | (154.3 | ) |
Interest paid/payable | | 68.3 | | | 152.2 | | | 295.2 | |
Corporate expenditure | | 20.6 | | | 131.6 | | | 69.2 | |
| | |
|
| |
|
| |
|
|
Net interest charged to profit was A$46.3 million for the year ended December 31, 2003 compared to a charge of A$48.7 million for the year ended December 31, 2002, reflecting the lower interest rates attributable to the new Global Bonds. Corporate expenditure was A$20.6 million compared to A$131.6 million for the year ended December 31, 2002 primarily due to the demerger costs incurred in 2002.
No significant changes have occurred since the date of our audited Consolidated Financial Statements.
84
| | | | |
| | THE OFFER AND LISTING | | |
ITEM 9. THE OFFER AND LISTING
| A. | | Offer and Listing Details |
Market Prices
| | • | | The following table sets forth, for the periods indicated, the highest and lowest closing sale prices of our fully paid ordinary shares based upon information provided by the ASX and the highest and lowest bid prices for our American Depository Shares (ADSs) based on information provided by the NYSE. In the United States, ADSs evidenced by American Depository Receipts (ADRs) represent our fully paid ordinary shares. Each ADR represents four of our fully paid ordinary shares. |
| | | | | | | | |
| | | Ordinary Shares
| | American Depository Shares
|
| Period | | A$ High | | A$ Low | | US$ High | | US$ Low |
Month ended April 30, 2004 | | 5.26 | | 4.63 | | 16.02 | | 13.30 |
Quarter ended March 31, 2004 | | 5.98 | | 4.81 | | 18.66 | | 13.80 |
Month ended March 31, 2004 | | 5.30 | | 4.81 | | 16.49 | | 13.80 |
Month ended February 29, 2004 | | 5.57 | | 5.11 | | 17.90 | | 15.38 |
Month ended January 31, 2004 | | 5.98 | | 5.08 | | 18.66 | | 15.24 |
Month ended December 31, 2003 | | 5.63 | | 4.92 | | 17.14 | | 14.25 |
Quarter ended December 31, 2003 | | 5.63 | | 4.32 | | 17.14 | | 11.95 |
Month ended November 30, 2003 | | 5.44 | | 4.57 | | 15.87 | | 12.94 |
Quarter ended September 30, 2003 | | 4.66 | | 3.28 | | 12.79 | | 9.05 |
Quarter ended June 30, 2003 | | 4.13 | | 3.40 | | 10.90 | | 8.75 |
Quarter ended March 31, 2003 | | 4.41 | | 3.59 | | 10.20 | | 8.45 |
Year ended December 31,2002 | | 4.36 | | 3.80 | | 9.90 | | 8.25 |
| | |
| |
| |
| |
|
| | • | | The closing price of our fully paid ordinary shares on December 31, 2003 was A$5.63 and on April 30, 2004 was A$4.79. The closing price of our ADRs on December 31, 2003 was US$17.10 and on April 30, 2004 was US$14.09. |
Not applicable.
Ordinary Shares
All of our fully paid ordinary shares are listed on the ASX which presently constitutes the principal trading market for our ordinary shares. The ASX is a nationally operated stock exchange with trading being carried out on automatic computer trading systems (SEATS). Our fully paid ordinary shares are also listed on the New York Stock Exchange (NYSE) (traded as American Depositary Receipts(ADRs)).
American Depositary Shares
In the United States, American Depositary Shares (ADSs) evidenced by ADRs represent our fully paid ordinary shares. Each ADR represents four of our fully paid ordinary shares. The ADRs are issued pursuant to a Deposit Agreement, dated December 3, 2002, between us and The Bank of New York, as Depositary. On December 4, 2002, trading of our ADSs commenced on the NYSE under the symbol “WMC”.
As at December 31, 2003, 479,819 of our fully paid ordinary shares were registered in the name of 299 residents of the United States and represented approximately 0.04% of the total number of our fully paid ordinary shares issued and outstanding. As at December 31, 2003, 1,735,961 of our ADSs were outstanding (representing 6,943,844 of our fully paid ordinary shares) and were registered in the name of 338 residents of the United States and represented approximately 0.60% of the total number of our fully paid ordinary shares issued and outstanding.
85
| | | | |
| | THE OFFER AND LISTING | | |
As at April 30, 2004, 488,880 of our fully paid ordinary shares were registered in the name of 254 residents of the United States and represented approximately 0.04% of the total number of our fully paid ordinary shares issued and outstanding. As at April 30, 2004, 2,356,304 of our ADRs were outstanding (representing 9,425,216 of our fully paid ordinary shares) and were registered in the name of 327 residents of the United States and represented approximately 0.81% of the total number of our fully paid ordinary shares issued and outstanding.
Not applicable.
Not applicable.
Not applicable.
86
| | | | |
| | ADDITIONAL INFORMATION | | |
ITEM 10. ADDITIONAL INFORMATION
Not applicable
Our corporate organization and conduct is governed by our constitution (the “Constitution”). Set forth below is a summary of the provisions of the principal terms of the Constitution.
Company Objects and Purposes
We are taken to be registered as a public company limited by shares under the Corporations Act 2001 of the Commonwealth of Australia (the Corporations Act) and are registered with Australian Business Number 76 004 184 598.
The Constitution was adopted on October 17, 2002. The Constitution does not specify our objects and purposes. Rather, under section 124 of the Corporations Act, we have the legal capacity and powers of an individual person.
Directors’ Powers and Qualifications
| (a) | | No director is permitted to vote or be counted in the quorum as a director in respect of any contract or arrangement in which the director has a personal material interest. Subject to the Corporations Act, this prohibition can be relaxed or suspended by an ordinary resolution passed in general meeting (rule 85(b)). |
| (b) | | Directors’ remuneration is to be determined by them from time to time and in such proportions and manner as they determine, provided that the aggregate remuneration paid to directors in any year must not exceed the amount approved by shareholders in general meeting (rule 82). |
| (c) | | In addition, every director is entitled to be paid all reasonable travelling, accommodation and other expenses incurred in attending board meetings and if any director is called upon to perform extra services or provide special professional skill for any purpose of ours, the director may be paid travelling outlays and such additional sum by way of remuneration fixed by the directors (rule 83). |
| (d) | | Directors may, from time to time, at their discretion raise or borrow any sum or sums of money for our purposes with or without security (rule 47). |
| (e) | | The Constitution does not contain any age limit requirement on the retirement of directors. |
| (f) | | A director does not need to own shares in us as a qualification for office (rule 80). |
| (g) | | At each Annual General Meeting one third of the directors (or the nearest number to one third) retire from the office and are subject to re-election. In any event, a director, other than the managing director, shall retire from office at the conclusion of the third Annual General Meeting after the general meeting at which he or she was elected or re-elected. |
Rights and Restrictions Attaching to Each Class of Shares
| (a) | | We have only one class of shares, the ordinary class. The rights attached to ordinary shares include the right to dividends in the event that the directors declare them. Directors may determine that a dividend is payable, fix the amount, the date at which the entitlement accrues, date for payment and the method of payment. |
| (b) | | Dividends, which have not been claimed for one year after having been declared, may be invested or otherwise made use of by the directors for our benefit until claimed or disposed of according to law (rule 125). |
| (c) | | The voting right attached to ordinary shares is the right to vote in person, by representative, attorney or proxy in general meeting. |
| (d) | | On a show of hands each shareholder (regardless of the number of shares held) has one vote. On a poll each shareholder may exercise one vote for each fully paid ordinary share held. In respect of partly paid shares, the shareholder has a vote equivalent to the proportion which the amount paid up bears to the total issue price of the share at the date the poll is taken. |
87
| | | | |
| | ADDITIONAL INFORMATION | | |
| (e) | | For the purposes of determining voting entitlements at a general meeting, shares will be taken to be held by those persons recorded in the register of members at the time and date determined by the directors under Corporations Regulations 7.11.37 and 7.11.38. |
| (f) | | Dividends are only payable out of our profits (rule 114). |
| (g) | | In the event of a winding up, ordinary shares rank equally in the division of any surplus. |
| (h) | | Shareholders cannot redeem ordinary shares. |
| (i) | | The holders of fully paid ordinary shares have no further liability to us in respect of those shares. The holders of partly paid shares are liable to us once a call is made for the payment of the unpaid amount. |
| (j) | | There is no provision in the Constitution which discriminates against an existing or prospective shareholder as a result of that shareholder owning a substantial number of shares unless such ownership leads to a partial takeover offer (see heading “Partial Takeover Approval” below). |
| (k) | | To vary or cancel the rights attached to ordinary shares, a special resolution approving the variation or cancellation must be passed at a special meeting of the holders of ordinary shares, or by consent in writing signed by the holders of a least three-fourths of the issued ordinary shares within two calendar months from the date of such special meeting (rule 11). |
General Meetings of WMC Resources
The Board may convene our general meetings to be held at such times and places and in the manner determined by the Board (rule 52). No shareholder or director may convene a general meeting unless entitled to do so under the Corporations Act.
Subject to the Corporations Act and the ASX Listing Rules, notices of a general meetings convened by the Board may be given in the form and in the manner determined by the Board (rule 54).
At least 28 days notice must be given of a general meeting (section 249HA of the Corporations Act).
All shareholders may attend general meetings in person, or be represented by the attendance of a representative, attorney or by proxy (who need not be shareholders of ours in their own right).
The quorum for a general meeting is three members present in person, by proxy or attorney or by representative (rule 57). If within 15 minutes of the time appointed for holding the meeting a quorum is not present, the meeting, if convened by requisition, is dissolved, but in all other cases stands adjourned to the same day in the next week at the same time and place (rule 58). If at the adjourned meeting a quorum is not present within 15 minutes from the time appointed for holding the meeting, the meeting is dissolved.
Limitations on the Right to Own Securities
Our Constitution does not impose limitations on the right to own securities except those provisions relating to minimum holdings (known as an Unmarketable Parcel, as described below).
Unmarketable Parcel Rationalization Scheme
The Constitution contains a scheme whereby we can sell the shares of members who hold a parcel of our shares of less than A$500 value (an Unmarketable Parcel). The scheme sets out notice requirements that we must comply with prior to selling any shares and also includes the right of members (who hold an Unmarketable Parcel) to exempt their holdings from the scheme. The scheme can only be invoked once in any 12-month period with respect to any particular member.
Other Takeover Limitations
The rights of non-resident or foreign shareholders to hold or exercise voting rights on our securities are subject to theForeign Acquisitions and Takeovers Act 1975 (Cth). The Treasurer of the Australian Federal Government has the power to prohibit the
88
| | | | |
| | ADDITIONAL INFORMATION | | |
acquisition of a controlling interest in any Australian company by a foreign person or foreign persons, if the Treasurer is of the opinion that the acquisition would be contrary to the national interest. For this purpose, a shareholding of 15% or more held by a single foreign person or 40% or more held by two or more foreign persons is deemed to constitute a controlling interest.
Section 50 of theTrade Practices Act 1974 (Cth)prohibits an acquisition of shares that would have the effect, or be likely to have the effect, of substantially lessening competition in a substantial market for goods or services, unless the acquisition is authorized by the Australian Competition and Consumer Commission.
Partial Takeover Approval
In the event that there is an offer made under a “proportional takeover bid” (within the meaning given to that expression by Chapter 6 of the Corporations Act) to acquire our shares, the registration of a transfer giving effect to a contract resulting from the acceptance of the bid, is prohibited unless and until a resolution to approve the proportional takeover bid is passed in accordance with rule 139 of our Constitution. This resolution is to be voted on at a meeting convened and conducted by us, of the persons entitled to vote on the resolution. The resolution is taken to have been passed if the proportion that the number of votes in favor of the resolution bears to the total number of votes on the resolution is greater than one-half. The provisions with respect to Partial Takeover Approval (rule 139) cease to have effect on the third anniversary of the date of their adoption or last renewal.
Disclosure of Share Ownership
The Constitution does not prescribe an ownership threshold above which shareholders must disclose their holding to us. However, Part 6C.1 of the Corporations Act imposes disclosure requirements on persons who acquire or cease to hold a substantial holding (see section 9 of the Corporations Act) in us. The disclosure must be given to us and the ASX within the prescribed time.
Changes in Share Capital
We may, by resolution passed in general meeting from time to time, alter our share capital in one or more of the ways provided for, and in the manner prescribed by, the Corporations Act (rule 44).
Subject to the Constitution, we may reduce our share capital (rule 46) or buy back shares (rule 141) in accordance with the Corporations Act.
Indenture (Roxby Downs (Indenture Ratification) Act of 1982)
For a description of the Indenture, see page 30.
Demerger Deed
(a) Nature of contract
In connection with the demerger, we and Alumina Limited entered into the Demerger Deed. The Demerger Deed deals with transitional and miscellaneous commercial and legal issues arising in connection with our legal and economic separation from Alumina Limited.
(b) Key terms
(i) Fundamental demerger principle
The fundamental principle of our separation from Alumina Limited is that, following the demerger, we have the entire economic benefit, risk and liabilities of all of our businesses, companies and assets as if we had owned and operated those businesses, companies and assets at all times. Alumina Limited continues to have the entire economic benefit, risk and liabilities of its companies and assets following the demerger.
(ii) Acknowledgement
Consistent with the fundamental demerger principle outlined above, we and Alumina Limited acknowledged in the Deed that once the demerger was complete, we would not have any rights against Alumina Limited, and Alumina Limited would not have any rights against us, except in specified circumstances. Neither we nor Alumina Limited has any right to make a claim for loss or damage
89
| | | | |
| | ADDITIONAL INFORMATION | | |
arising directly or indirectly in relation to the demerger, our internal restructure and the operation our businesses prior to the demerger, unless expressly permitted by the Demerger Deed or any other document or agreement between the parties (such as the Transitional Services Agreement or other ongoing commercial arrangements).
(iii) Business restructure
Alumina Limited’s non-AWAC business and companies have been substantially restructured pursuant to a series of separate restructure agreements prior to the demerger so that an identifiable corporate group has come into existence comprising the companies that constitute our assets and our businesses. The Demerger Deed makes provision for:
| | • | | the approach to be adopted by the parties to the restructure of WMC’s non-AWAC businesses and companies prior to the demerger; |
| | • | | the practical, economic and legal effect of our separation from Alumina Limited; |
| | • | | the mechanism under which we and Alumina Limited can transfer to the other group any asset or contract which a group member owns or holds after the demerger date but which at the demerger date was most directly used in the other group’s business, or was incorrectly transferred as part of the restructure of WMC Limited’s non-AWAC businesses; and |
| | • | | if any asset or share transfers required to establish our group were not completed prior to the date of execution of the Demerger Deed, the principles in accordance with which the parties are to conduct their arrangements pending each transfer, so as to ensure that, to the extent possible, each transferee gets the benefit and all risks of the asset or company being transferred as from the accounting effective date; |
(iv) Accounting separation
The Demerger Deed confirms that, for accounting purposes, Alumina Limited and WMC Resources will be treated as being demerged as from November 30, 2002, or on such other date as may be agreed between us and Alumina Limited, with the intention that it be the date of the closest month end preceding the effective date of the demerger;
(v) Access to records
Records held by each of us and Alumina Limited at the effective date of the demerger that relate to the other are to be maintained. Each of us and Alumina Limited must allow the other to access those records and must notify the other prior to any destruction of those records so that they can be copied or retrieved;
(vi) Financial and tax assistance
We and Alumina Limited will assist each other in relation to future and past financial and tax matters and each will allow the other access to financial and other records in connection with the preparation of tax returns or tax audits by the Australian Taxation Office of either us or Alumina Limited;
(vii) Employees and superannuation
The Demerger Deed addresses matters relating to the transfer of certain of our employees to Alumina Limited. Alumina Limited is obliged to indemnify us against all costs and expenses (including claims) relating to the transfer. We and Alumina Limited are each obliged to indemnify the other against all costs and expenses (including claims) relating to any redundancy, retrenchment or termination of a former Alumina Limited employee or employee of ours (as applicable);
In accordance with the fundamental demerger principle, each of WMC Resources and Alumina Limited are required to meet all costs relating to the provision of retirement savings or retirement income benefits and other related benefits for our employees. The Demerger Deed also requires Alumina Limited to assume responsibility for the superannuation arrangements of those employees transferring to it from us;
(viii) Use of intellectual property
The Demerger Deed sets out the general principles that determine ownership of intellectual property by us and Alumina Limited (other than trade marks and business names). The Demerger Deed also sets out the restrictions on the use of jointly-owned intellectual property;
90
| | | | |
| | ADDITIONAL INFORMATION | | |
Under the Demerger Deed, Alumina Limited is required as soon as practicable, and in any event within one month, after the demerger date to cease the use of the “WMC” name (and derivatives) and the “WMC” logo and to arrange for the change of Alumina Limited group company names including the “WMC” name (or derivatives);
(ix) Litigation management
We and Alumina Limited will assist each other in relation to the management of current and new litigation matters involving us (other than in respect of litigation between us and Alumina Limited). Each of us and Alumina Limited indemnifies the other in respect of liability or loss suffered in connection with a claim where that liability relates to the business of the other; and
(x) Insurance
We are to provide our own group business insurance and insurance for our directors and officers from the effective date of the demerger. However, we and our directors and officers will have access to the existing directors’ and officers’ insurance policy maintained by Alumina Limited for the remaining life of that policy in respect of matters which occurred on or before the effective date of the demerger.
Transitional Services Agreement
(a) Nature of contract
In connection with the demerger, we and Alumina Limited entered into the Transitional Services Agreement. Under the agreement, we will provide, or will procure the provision of, certain services to the Alumina Limited group for a period of up to 6 months after the demerger date.
(b) Services
We will provide the following services to Alumina Limited and to members of the Alumina Limited group:
| | • | General corporate services |
| | • | Legal and company secretariat |
(c) Charges for Services
We will charge Alumina Limited a fixed fee of $360,000 for providing, or procuring the provision of, the services described above.
(d) Protection of information
The agreement imposes obligations on each of us and Alumina Limited to protect all information, records, reports and other data and other agreements or documents relating to or used in connection with the agreement.
(e) Indemnity
We must indemnify Alumina Limited against all claims and losses (as defined in the agreement) which may be made or brought against Alumina Limited or incurred or suffered by Alumina Limited as a result of our wilful misconduct (as defined in the Agreement) or the misconduct of our directors, employees, officers, agents or contractors.
WMC Resources Loan Facility
(a) Nature of contract
91
| | | | |
| | ADDITIONAL INFORMATION | | |
Prior to the demerger, WMC Limited put in place the WMC Resources Loan Facility (the “Loan Facility”) through its wholly owned subsidiary, WMC Finance Limited, for the purposes of effecting certain debt refinancing associated with the demerger. The facility is a US$1.1 billion loan note facility arranged and underwritten by Commonwealth Bank of Australia, Deutsche Bank, JP Morgan and Westpac Banking Corporation as joint lead arrangers.
(b) Key terms
(i) Components
The WMC Resources Loan Facility consists of a US$600 million syndicated revolving facility with a 364-day term (which may be extended at the discretion of the lenders) and a two year tranche
The periods above terminate on the relevant anniversary of the date of execution of the Loan Facility, which is November 14, 2004 for the syndicated facility.
(ii) Guarantors
The Loan Facility was initially guaranteed by us and the entities that became our principal subsidiaries upon demerger, together representing no less than 85% (by EBITDA and tangible assets) of our group, and by WMC Limited. Following the implementation of the demerger, WMC Limited (Alumina Limited, as it has been renamed) ceased to be a guarantor of the Loan Facility.
(iii) Pricing
The pricing of the Loan Facility is generally consistent with that which a BBB rated entity might obtain for a facility of this size and nature.
(iv) Undertakings
The Loan Facility contains undertakings given by us and our subsidiaries that are customary for a facility of this nature, including negative pledges and guarantees provided by us and our guaranteeing subsidiaries.
(v) Events of default
The Loan Facility contains events of default and review events that are customary for a facility of this nature.
Global Bond Indenture
(a) Nature of contract
In 2003, WMC Finance (USA) Limited, a finance subsidiary of WMC (“WMC Finance”), issued US$700,000,000 in bonds (the “Global Bonds”), guaranteed by us and two of our subsidiaries. The Global Bonds were issued under an indenture (the “Bond Indenture”) between WMC Finance, as issuer, WMC, and the two subsidiaries mentioned above as guarantors and The Bank of New York, as trustee. The Global Bonds were registered under the Securities Act and issued in exchange for bonds of WMC Finance sold previously in private placements.
(b) Key terms
(i) Components
The Global Bonds were issued under the Bond Indenture in two series. One is the US$500,000,000 5.125% Guaranteed Notes due 2013. The other is the US$200,000 6.250% Guaranteed Notes due 2033.
(ii) Guarantors
Notes of WMC Finance issued under the Bond Indenture are guaranteed by WMC Olympic Dam, WMC Fertilizers and us.
(iii) Ranking
The Global Bonds and the respective guarantees of WMC us and our guaranteeing subsidiaries each rank equally in right of payment will all other unsecured and unsubordinated indebtedness of WMC Finance, us and our guaranteeing subsidiaries.
92
| | | | |
| | ADDITIONAL INFORMATION | | |
(iv) Undertakings
The Bond Indenture contains undertakings given by us and our subsidiaries that are customary for a facility of this nature, including negative pledges, limitations on the incurrence of liens and limitations on sale and leaseback transactions and guarantees provided by us and our guaranteeing subsidiaries.
(v) Events of default
The Bond Indenture contains events of default and review events that are customary for an indenture of this nature.
The Australian Banking (Foreign Exchange) Regulations and other Australian legislation and regulations control the import and export of capital and remittance of payments involving non-residents of Australia. We are not restricted from receiving funds into or transferring funds from Australia to the credit of non-residents of Australia but in certain cases we are required to:
| | (i) | | withhold Australian taxes; |
| | (ii) | | obtain the Reserve Bank’s authority - |
to place any sum in Australia to the credit of, or make any payment in Australia to, by order of or on behalf of:
| | • | the Government of Iraq, its agencies or nationals; |
| | • | certain entities related to the Federal Republic of Yugoslavia (in limited circumstances) and 81 named individuals associated with the former Milosevic regime; |
| | • | certain ministers and senior officials of the Government of Zimbabwe; |
| | • | the Taliban or any undertaking owned or controlled, directly or indirectly, by the Taliban or specific associated individuals, entities, agencies associated with the Taliban, Osama bin Laden, al-Qaeda or other terrorists or their sponsors; or |
to sell or purchase foreign currency or take or send from Australia any Australian currency where that transaction relates to:
| | • | property, securities or funds in Australia belonging either directly or indirectly to, or other payments to, the Government of Iraq, its agencies or nationals; |
| | • | property, securities or funds belonging either directly or indirectly to certain entities related to the Federal Republic of Yugoslavia (in limited circumstances) and 81 named individuals associated with the former Milosevic regime; |
| | • | property, securities or funds in Australia owned or controlled, directly or indirectly, by or otherwise relating to payments to certain ministers and senior officials of the Government of Zimbabwe; or |
| | • | property, securities or funds owned or controlled directly or indirectly by, or otherwise relating to payments to, or for the benefit of, the Taliban, or any undertaking owned or controlled, directly or indirectly, by the Taliban or specific associated individuals, entitles, agencies associated with the Taliban, Osama bin Laden, al-Qaeda or other terrorists or their sponsors; and |
| | (iii) | | Lodge a report of the transaction details. |
There are no limitations, under the laws of Australia, on the right of non-residents to acquire, hold or vote our ordinary shares, except for the Foreign Acquisitions and Takeovers Act 1975 (Cth) (the “Act”) and section 606 of the Corporations Act 2001 (Cth) (the “Corporations Act”). The Act controls the rights of non-residents to hold 15% or more of the total voting powers as outstanding shares of an Australian company, but it does not affect the rights attaching to shares that are held or acquired in accordance with its provisions.
Under the Act, any acquisition or issue of shares (including the acquisition of an option to acquire shares) which would increase or alter beyond 15% in the case of any single foreign interest, or 40% in the case of more than one foreign interest, the level of foreign ownership in a corporation that carries on an Australian business is subject to review and approval by the Treasurer of the Commonwealth of Australia.
93
| | | | |
| | ADDITIONAL INFORMATION | | |
The Act permits the Treasurer to deny or refuse proposals where such proposals would be contrary to the Australian national interest.
Section 606 of the Corporations Act provides that, subject to certain exceptions, a person must not acquire a relevant interest in shares in a company if, as a result, someone’s voting power in the company increases to more than 20%, or increases from a starting point that is above 20% and below 90%. Section 606 also prohibits a person acquiring a legal or equitable interest in shares if, because of the acquisition, another person acquires a relevant interest in shares and someone’s voting power increases to more than 20%, or increases from a starting point that is above 20% and below 90%. Section 608 of the Corporations Act provides that a person has a “relevant interest” in shares if that person holds the shares, or has power or control over the voting rights attaching to them or their disposal, whether directly or indirectly.
The foregoing summary does not purport to be complete and is qualified in its entirety by reference to the applicable legislation and to our Constitution. A copy of our current Constitution has been previously filed with the SEC as Exhibit 1 to our registration statement on Form 20-F, filed on December 2, 2002 (File No. 1-31554).
The following is a summary of the principal Australian and United States federal income tax consequences to United States holders (as defined below) of the ownership of ADSs or Ordinary Shares and is based on the laws in force as at the date of this Annual Report. Holders are advised to consult their own tax advisers concerning the overall tax consequences of the acquisition, ownership and disposition of ADSs or Ordinary Shares in their particular circumstances. This discussion relies in part on representations by the Depositary in the Deposit Agreement and related documents.
Commonwealth of Australia Taxation
Dividends
With effect from July 1, 2002, Australia introduced a new dividend imputation system relating to company tax.
Broadly, the new dividend imputation system rewrites the old dividend system. It is intended to produce a similar tax outcome as the old system with some noted differences. The dividend imputation system of company tax relieves double taxation on dividends paid by Australian resident corporations. Under this system, companies are required to identify dividends paid as either franked or unfranked dividends. Franked dividends are those paid out of profits which have borne Australian corporate tax (i.e., to which franking credits have been allocated) while unfranked dividends are paid out of untaxed profits. The Australian corporate tax rate is 30%. Franked dividends paid to non-residents are exempt from withholding tax but unfranked (or partly franked) dividends are subject to withholding tax, generally at 15% on the unfranked amount. Notices are provided to shareholders which specify the amount (if any) of dividend withholding tax deducted.
The current Australian tax rules require taxpayers to hold shares “at risk” for certain periods before obtaining the benefit of the dividend imputation system. The minimum period for holding ordinary shares “at risk” is currently 45 days, but the Australian Government is considering a proposal to reduce the minimum period. Failure to satisfy these requirements may result in the deduction of Australian withholding tax from dividends paid to non-residents of Australia. There is an exemption from these rules for defined “small” transactions.
The tax rules classify interests which satisfy a financial arrangements test as either debt or equity. An interest that is classified as equity will be frankable, whereas an interest that is classified as debt will not be frankable. ADSs and Ordinary Shares are likely to be classified as equity on the basis that the return is contingent on our performance or at our discretion.
Prior to July 1, 2003, under the provisions of the current Convention between the Government of the United States of America and the Government of Australia for the Avoidance of Double Taxation and the Prevention of Fiscal Evasion with Respect to Taxes on Income (the “Treaty”), the Australian tax withheld on unfranked dividends paid by us to which a resident of the United States is beneficially entitled is limited to 15%. However, where the recipient’s shareholding is effectively connected with a permanent establishment in Australia or a fixed base in Australia from which independent personal services are carried out, the recipient will generally be subject to ordinary income tax for dividends received under the Australian tax rules. From July 1, 2003, Australia and the United States agreed to reduce the withholding tax rate to 5% for holders of more than 10% of the shares in a company and 0% for holders of 80% or more of the shares in a company. In all other cases the 15% rate limit will continue to apply.
94
| | | | |
| | ADDITIONAL INFORMATION | | |
Capital Gains Tax
A United States citizen who is resident in Australia, or a United States corporation that is resident in Australia (by reason of carrying on business in Australia and being managed or controlled in Australia or having its voting power controlled by shareholders who are residents of Australia) holding ADSs or ordinary shares as capital assets, may be liable for Australian capital gains tax (“CGT”) on the disposal of our ADSs or ordinary shares.
In calculating the amount of a capital gain that may be subject to Australian CGT, special rules apply to individuals, trusts, certain superannuation funds and shareholders of certain listed investment companies. For ADSs or ordinary shares acquired after September 21, 1999 and held for at least 12 months, individuals and trusts will pay tax on half (two thirds of the gain for certain superannuation funds) of the gain calculated in nominal terms after allowing for any offsetting capital losses which are applied against the whole nominal gain. For ADSs or ordinary shares acquired before that time and held for at least 12 months, individuals, trusts and certain superannuation funds may choose between paying CGT on half of the gain (or two-thirds of the gain for certain superannuation funds), or paying CGT on all of the gain with the gain being calculated on the basis of the cost of the ADSs or shares being indexed for inflation up to September 30, 1999. For all types of taxpayers, the legislation freezes the indexation (for inflation) of the cost of ADSs and Ordinary Shares as at September 30, 1999, and abolishes such indexation for ADSs and ordinary shares acquired after September 21, 1999.
Under current Australian law, no income or other tax is payable on any profit on disposal of the ADSs or ordinary shares held by persons who are residents of the United States within the meaning of the Treaty except:
| | (a) | | if the person (together with associates, if any) owns or owned ADSs and/or ordinary shares at any time during the period of five years preceding the disposal, representing 10% or more of our issued share capital (excluding share capital carrying no right to participate beyond a specified amount in distribution of profits or capital). However, in these circumstances there may be relief from Australian tax for residents of the United States under the Treaty; or |
| | (b) | | if the ADSs or ordinary shares have been used by the person in carrying on a trade or business wholly or partly at or through a permanent establishment in Australia. |
Different rules will apply to persons and corporations which are not residents of the United States.
Australia does not impose gift, estate or inheritance taxes in relation to gifts of shares or upon the death of a shareholder.
Neither the issue or transfer of an ADS or our ordinary shares or the payment of a dividend will give rise to a liability to goods and services tax in Australia.
Australian Stamp Duty
No Australian stamp duty will be payable on the issue or transfer of an ADS or the transfer of our ordinary shares.
United States Federal Income Tax Consequences
The following discussion is a summary of the material United States federal income tax consequences of owning ordinary shares or ADSs. The discussion below, except where specifically noted, does not address the effects of any state, local or non-United States tax laws. In addition, it applies to you only if you hold your ordinary shares or ADSs as a capital asset, and does not address the tax consequences that may be relevant to you in light of your particular circumstances. Moreover, it does not apply to you if you are not a U.S. person, as defined below, or if you are subject to special treatment under the United States federal income tax laws, including if you are:
| | • | | a dealer in securities or currencies; |
| | • | | a trader in securities if you elect to use a mark-to-market method of accounting for your securities holdings; |
| | • | | a financial institution; |
95
| | | | |
| | ADDITIONAL INFORMATION | | |
| | • | | a tax-exempt organization; |
| | • | | a person liable for alternative minimum tax; |
| | • | | a person that holds ordinary shares or ADSs as part of a straddle or a hedging or conversion transaction; |
| | • | | a person that actually or constructively owns 10% or more of the voting stock of WMC Resources; or |
| | • | | a person whose “functional currency” is not the United States dollar. |
This discussion is based on the Internal Revenue Code of 1986, as amended (the “Code”), existing and proposed regulations, published rulings and court decisions, all as currently in effect, as well as the Convention Between the Government of the United States of America and the Government of Australia for the Avoidance of Double Taxation and the Prevention of Fiscal Evasion with Respect to Taxes on Income (the “Treaty”). These laws are subject to change, possibly on a retroactive basis.
You are a United States person if you are:
| | • | | a citizen or resident of the United States; |
| | • | | a domestic corporation; |
| | • | | an estate, the income of which is subject to United States federal income taxation regardless of its source; or |
| | • | | a trust if a United States court can exercise primary supervision over the trust’s administration and one or more United States persons are authorized to control all substantial decisions of the trust. |
In general, and taking into account the earlier assumptions, for United States federal income tax purposes, if you hold ADRs evidencing ADSs, you will be treated as the owner of the ordinary shares represented by those ADRs. Exchanges of ordinary shares for ADRs, and ADRs for ordinary shares, generally will not be subject to United States federal income tax.
Distributions
Subject to the passive foreign investment company rules discussed below, the gross amount of any dividend we pay out of our current or accumulated earnings and profits (as determined for United States federal income tax purposes) is subject tot United States federal income taxation. If you are a noncorporate U.S. holder, dividends paid to you in taxable years beginning after December 31, 2002 and before January 1, 2009 that constitute qualified dividend income will be taxable to you at a maximum rate of 15% provided that you hold the shares or ADSs for more than 60 days during the 120-day period beginning 60 days before the ex-dividend date and meet other holding period requirements.
The IRS has announced that it will permit taxpayers to apply a proposed legislative change to the holding period requirement described in the preceding sentence as if such change were already effective. This legislative “technical correction” would change the minimum required holding period, retroactive to January 1, 2003, to more than 60 days during the 121-day period beginning 60 days before the ex-dividend date. Dividends we pay with respect to the shares or ADSs generally will be qualified dividend income.
You must include any Australian tax withheld from the dividend payment in this gross amount even though you do not in fact receive it. The dividend is taxable to you when you, in the case of shares, or the Depositary, in the case of ADSs, receive the dividend, actually or constructively. The dividend will not be eligible for the dividends-received deduction generally allowed to United States corporations in respect of dividends received from other United States corporations. The amount of the dividend distribution that you must include in your income as a U.S. holder will be the U.S. dollar value of the Australian dollar payments made, determined at the spot Australian dollar/U.S. dollar rate on the date the dividend distribution is includible in your income, regardless of whether the payment is in fact converted into U.S. dollars. Generally, any gain or loss resulting from currency exchange fluctuations during the period from the date you include the dividend payment in income to the date you convert the payment into U.S. dollars will be treated as ordinary income or loss and will not be eligible for the special tax rate applicable to qualified dividend income. The gain or loss generally will be income from sources within the United States for foreign tax credit limitation purposes. Distributions in excess of current and accumulated earnings and profits, as determined for United States federal income tax purposes, will be treated as a non-taxable return of capital to the extent of your basis in the shares or ADSs and thereafter as capital gain.
96
| | | | |
| | ADDITIONAL INFORMATION | | |
Subject to certain limitations, the Australian tax withheld in accordance with the Treaty and paid over to Australia will be creditable against your United States federal income tax liability. Special rules apply in determining the foreign tax credit limitation with respect to dividends that are subject to the maximum 15% tax rate.
To the extent a refund of the tax withheld is available to you under Australian law, the amount of tax withheld that is refundable will not be eligible for credit against your United States federal income tax liability.
Dividends will be income from sources outside the United States, but generally will be “passive income” or “financial services income” which is treated separately from other types of income for purposes of computing the foreign tax credit allowable to you.
Disposition
Subject to the passive foreign investment company rules discussed below, any gain or loss you realize on the sale, exchange or other taxable disposition of ordinary shares or ADSs will be subject to United States federal income taxation as a capital gain or loss in an amount equal to the difference between the US dollar value of the amount that you realize on that sale, exchange or other disposition and your adjusted tax basis, determined in US dollars, in the ordinary shares or ADSs surrendered. Capital gain of a noncorporate U.S. holder that is recognized on or after May 6, 2003 and before January 1, 2009 is generally taxed at a maximum rate of 15% where the holder has a holding period greater than one year. The gain or loss will generally be income or loss from sources within the United States for foreign tax credit limitation purposes. Your ability to deduct capital losses is subject to limitations.
Passive Foreign Investment Company Rules
We believe that it is more likely than not that ordinary shares or ADSs will not be treated as stock of a passive foreign investment company, or “PFIC,” for United States federal income tax purposes, but this conclusion is a factual determination that is made annually and thus may be subject to change. Moreover, the application of the PFIC rules to a corporation such as us that is primarily engaged in the active business of mining and processing metals is not entirely clear.
In general, if you are a U.S. holder, we will be a PFIC with respect to you if for any taxable year in which you held our ADSs or ordinary shares:
| | • | | at least 75% of our gross income for the taxable year is passive income or |
| | • | | at least 50% of the value, determined on the basis of a quarterly average, of our assets is attributable to assets that produce or are held for the production of passive income. |
Passive income generally includes dividends, interest, royalties, rents (other than certain rents and royalties derived in the active conduct of a trade or business), annuities and gains from assets that produce passive income. If a foreign corporation owns at least 25% by value of the stock of another corporation, the foreign corporation is treated for purposes of the PFIC tests as owning its proportionate share of the assets of the other corporation, and as receiving directly its proportionate share of the other corporation’s income.
If we are treated as a PFIC, and you are a U.S. holder that did not make a mark-to-market election, as described below, you will be subject to special rules with respect to:
| | • | | any gain you realize on the sale or other disposition of your ordinary shares or ADSs and |
| | • | | any excess distribution that we make to you (generally, any distributions to you during a single taxable year that are greater than 125% of the average annual distributions received by you in respect of the ordinary shares or ADSs during the three preceding taxable years or, if shorter, your holding period for the ordinary shares or ADSs). |
Under these rules:
| | • | | the gain or excess distribution will be allocated ratably over your holding period for the ordinary shares or ADSs, |
| | • | | the amount allocated to the taxable year in which you realized the gain or excess distribution will be taxed as ordinary income, |
97
| | | | |
| | ADDITIONAL INFORMATION | | |
| | • | | the amount allocated to each prior year, with certain exceptions, will be taxed at the highest tax rate in effect for that year, and |
| | • | | the interest charge generally applicable to underpayments of tax will be imposed in respect of the tax attributable to each such year. |
Special rules apply for calculating the amount of the foreign tax credit with respect to excess distributions by a PFIC.
If you own ordinary shares or ADSs in a PFIC that are treated as marketable stock, you may also make a mark-to-market election. If you make this election, you will not be subject to the PFIC rules described above. Instead, in general, you will include as ordinary income each year the excess, if any, of the fair market value of your ordinary shares or ADSs at the end of the taxable year over your adjusted basis in your ordinary shares or ADSs. These amounts of ordinary income will not be eligible for the favourable tax rates applicable to qualified dividend income or long-term capital gains. You will also be allowed to take an ordinary loss in respect of the excess, if any, of the adjusted basis of your ordinary shares or ADSs over their fair market value at the end of the taxable year (but only to the extent of the net amount of previously included income as a result of the mark-to-market election). Your basis in the ordinary shares or ADSs will be adjusted to reflect any such income or loss amounts. In addition, notwithstanding any election you make with regard to the shares or ADSs, dividends that you receive from us will not constitute qualified dividend income to you if we are a PFIC either in the taxable year of the distribution or the preceding taxable year. Dividends that you receive that do not constitute qualified dividend income are not eligible for taxation at the 15% maximum rate applicable to qualified dividend income. Instead, you must include the gross amount of any such dividend paid by us out of our accumulated earnings and profits (as determined for United States federal income tax purposes) in your gross income, and it will be subject tot tax at rates applicable to ordinary income.
If you own ordinary shares or ADSs during any year that we are a PFIC, you must file Internal Revenue Service Form 8621.
| F. | | Dividends and Paying Agents |
Not applicable.
Not applicable.
It is possible to read and copy documents referred to in this Annual Report on Form 20-F that have been filed with the Securities and Exchange Commission (“SEC”) at the SEC’s public reference room located at 450 Fifth Street, NW, Washington DC 20549. Please telephone the SEC at 1-800-SEC-0330 or access the SEC website (www.sec.gov) for further information.
98
| | | | |
| | ADDITIONAL INFORMATION | | |
| I. | | Subsidiary Information |
All controlled entities are wholly owned by us, unless otherwise indicated. Our significant subsidiaries are described in Item 4C—“Key Information—Organizational Structure”. The following is a list of all entities controlled by us at December 31, 2003:
| | | | |
Controlled Entities
| | Notes
| | Place of Incorporation
|
141 Union Company | | c,h | | USA |
Agnew Mining Company Pty. Ltd. | | b | | Australia |
Carson Hill Gold Mining Corporation | | c,h | | USA |
Corridor Sands Limitada | | d,h,k | | Mozambique |
Great Boulder Mines Pty Ltd | | b | | Australia |
Hi-Fert Distributors Pty. Ltd. | | b | | Australia |
Hi-Fert Pty. Ltd. | | a | | Australia |
JMM Sub, Inc | | c,e,h | | USA |
Minera WMC Chile Exploration Ltda | | h,i | | Chile |
Mineracao Alfenus Limitada (owned 100%) | | c,f,h | | Brazil |
Mineracao Ituverava Limitada (owned 100%) | | c,h,i | | Brazil |
Mineracao Jenipapo S.A. (owned 100%) | | c,h | | Brazil |
Mineracao Wesminas Limitada (owned 100%) | | c,h | | Brazil |
Olympic Dam Marketing Pty. Ltd. | | b | | Australia |
PT WMC Services | | h | | Indonesia |
Q.S. Mineracao Ltda (owned 100%) | | c,h | | Brazil |
Three Springs Talc Pty. Limited | | b | | Australia |
Wesminco Oil Pty. Ltd. | | | | Australia |
Western Exploration Pty. Ltd. | | b | | Australia |
Western Hog Ranch Company | | c,g | | USA |
Western Mining Corporation Pty Ltd | | b | | Australia |
Western Mining Mongolia XXK | | c,h | | Mongolia |
Western Venture Inc. | | c,g | | USA |
Westmin Talc (U.K.) Limited | | g | | UK |
Westmin Talc Pty Ltd | | b | | Australia |
Westminer Insurance Pte. Ltd. | | h | | Singapore |
WMC (Argentina) Inc. | | c,h | | USA |
WMC (China) Pty Limited | | b,h | | Australia |
WMC (Kunming) Pty Limited | | b,h | | Australia |
WMC (Liberia) Limited | | h | | Hong Kong |
WMC (Mineral Sands) Limited | | c,h | | Jersey |
WMC (Olympic Dam Corporation) Pty. Ltd. | | a | | Australia |
WMC (Olympic Dam Operations) Pty. Ltd. | | a | | Australia |
WMC (Overseas) Pty. Limited | | b | | Australia |
WMC (Peru) Inc. | | c,h | | USA |
WMC (Uzbekistan) Ltd. | | c,h | | Jersey |
WMC (Yunnan) Pty Limited | | b | | Australia |
WMC (Zarmitan) Ltd. | | c,h | | Jersey |
WMC Automation Pty Ltd | | b | | Australia |
WMC Chile S.A. | | h | | Chile |
WMC Corporate Services Inc. | | c,h | | USA |
WMC Exploration Corporation | | h | | Philippines |
WMC Exploration Inc. | | c,h | | USA |
WMC Fertilizers Pty Ltd | | a | | Australia |
WMC Finance (USA) Limited | | | | Australia |
99
| | | | |
| | ADDITIONAL INFORMATION | | |
| | | | |
Controlled Entities
| | Notes
| | Place of Incorporation
|
WMC Finance Limited | | | | Australia |
WMC Holdings Pty. Ltd. | | b | | Australia |
WMC Innovation Pty. Ltd. | | b | | Australia |
WMC International Limited | | c,i | | Canada |
WMC Kazakstan Ltd. | | c,h | | Jersey |
WMC Mineracao Limitada (owned 100%) | | i | | Brazil |
WMC N.C. SAS | | h,i | | New Caledonia |
WMC Participaces Limitada | | h,i | | Brazil |
WMC Petroleum (Malaysia) Snd. Bhd.(in liquidation) | | c,h | | Malaysia |
WMC Resources Exploration Pty. Ltd. | | b | | Australia |
WMC Resources International Pty. Ltd. | | a | | Australia |
WMC Resources International (RSA) Pty. Ltd | | b | | Australia |
WMC Resources Marketing Limited | | h,k | | Canada |
WMC Resources Marketing (UK) Limited | | c,h,l | | UK |
WMC Securities Pty Ltd | | b | | Australia |
WMC Services Pty. Limited | | b | | Australia |
WMC Superannuation Fund Pty Ltd (owned 50%) | | b | | Australia |
WMC Xinjiang Mineral Industry Services Company | | c,h | | China |
Yakabindie Nickel Pty. Limited | | a,m | | Australia |
Yeelirrie Development Company Pty. Ltd. | | b | | Australia |
Yeelirrie Management Services Pty. Ltd. | | b | | Australia |
These controlled entities:
| (a) | | have been granted relief from the necessity to prepare accounts pursuant to Australian and Securities Investment Commission (ASIC) Class Order 98/1418. |
| (b) | | is a small proprietary corporation, not required to prepare financial reports |
| (c) | | have not prepared audited accounts, either it is non-operating or audited accounts are not required in its country of incorporation. |
| (d) | | have prepared audited financial accounts. |
| (e) | | became part of the economic entity during 2002. |
| (f) | | ceased to be part of the economic entity during 2002. |
| (g) | | translated as a self-sustaining entity. |
| (h) | | translated as an integrated entity. |
| (i) | | ceased to be part of the economic entity during 2003. |
| (j) | | became part of the economic entity during 2003. |
| (k) | | changed its name from WMC International Holdings Ltd to WMC Resources Marketing Limited on 24 September 2003. |
| (l) | | changed its name from WMC Nickel Sales Corporation Limited to WMC Resources Marketing (UK) Limited on 1 October 2003. |
| (m) | | Yakabindie Nickel Pty Limited, a company incorporating a lease and exploration work on the Yakabindie nickel project near Mount Keith, was acquired by the purchase method on January 25, 2001. Its purchase consideration was A$40 million, A$25 million of which was paid at the time of the acquisition with the remaining A$15 million due upon gaining approval to mine the property. The results of its operations since 25 January, 2001 have been incorporated into WMC Resources. There is no goodwill arising on acquisition. No pro forma revenue has been disclosed as it is immaterial. It was converted from a public company to a proprietary company on 8 February 2002. |
| (n) | | WMC Resources has a 40% ownership in Agnew Pastoral Company Pty. Ltd. and Weebo Pastoral Company Pty. Ltd. which are accounted for as incorporated partnerships. |
| (o) | | WMC Resources has a 80% ownership in Yunnan Hua Ao Nickel Exploration and Mining Co. Ltd and Yunnan Xin Ao Nickel Exploration and Mining Co. Ltd which are equity accounted. |
| J. | | Enforcement of Civil Liabilities |
We are a corporation organized under the laws of the Commonwealth of Australia. All of our directors and officers reside outside the United States, principally in Australia. A substantial portion of our assets, and the assets of our directors and officers, are located outside the United States. Therefore, you may not be able to affect service of process within the United States upon us or our officers and directors so that you may enforce judgments of United States courts against as and them based on the civil liability provisions of the United States federal securities laws. In addition, you may have difficulty bringing an original action in an Australian court to enforce liabilities against us or any of our officers and directors based on U.S. federal securities laws.
100
| | | | |
| | QUANTITATIVE AND QUALITATIVE DISCLOSURES ABOUT MARKET RISK | | |
ITEM 11. QUANTITATIVE AND QUALITATIVE DISCLOSURES ABOUT MARKET RISK
Information about Market Risk
Price Risk Management Policy
Our Price Risk Management policy provides the framework for the management of price exposures and is established by our Board. The policy details our approach to managing price exposures and delineates hedging limits and delegated management authorities. Management of exposures is delegated to the Risk Management Committee within parameters set by our Board. The Risk Management Committee is chaired by the chief executive officer and comprises the chief financial officer and several senior executives. The Risk Management Committee is responsible for strategic hedging decisions and ensuring that these are implemented.
Our Treasury group acts under the authorization of the Risk Management Committee in implementing strategic hedging decisions. In addition, our Treasury group is authorized to manage hedges held against underlying financial or commodity exposures arising from our business operations. The Risk Management Committee members receive a monthly hedge position report as well as a detailed risk management report prior to the Committee’s monthly meetings.
Due to changes to the scale, diversity and competitiveness of our operations, we revised our Risk Management Policy during 1999 to limit hedging activity to securing acceptable returns for new projects, to avoid financial distress and to enable large capital exposure programs. Previously existing hedging contracts will remain in place, but we will not replace or renew them. During 2003, WMC closed out all gold hedges maturing between 2006 and 2010 and all foreign currency hedges maturing between 2005 and 2008.
We bring to account hedging gains or losses, together with the cost of contracts when the designated sale occurs. We enter into Price Risk Management transactions with domestic and international banks and financial institutions which the Board of Directors has approved.
Commodity Hedging Policy
Commodity price risk relates to our exposure to changes in the commodity prices. Our revenue streams are significantly derived from the sale of commodity production and the amount of revenue will fluctuate with the moving commodity prices. Consistent with the Price Risk Management policy, we may seek to reduce our exposure to commodity price movements by entering into commodity hedging contracts for a proportion of our production. When looked at in isolation, hedging transactions could result in costs to us if:
| | (a) | | the commodity price at the date of maturity of the hedge contract is greater than the hedged price (either due to the requirement to expend cash to financially settle hedge contracts, or via the receipt of a hedge contract price lower that the prevailing spot price at contract maturity); or |
| | (b) | | a counterparty were to default and the commodity price at the date of default is less than the hedged price. |
In the case of (a), the hedging loss will be offset by a higher revenue stream from the higher commodity price relative to the prevailing prices at the date of conception of the hedge, although the net revenue we would receive would be less than we would otherwise had received had the hedge transaction not been in place.
101
| | | | |
| | QUANTITATIVE AND QUALITATIVE DISCLOSURES ABOUT MARKET RISK | | |
A table showing the movement in the selling price of nickel, gold, fertilizer and copper over the last five years is set out below.
AVERAGE QUARTERLY PRICES
| | | | | | | | |
Financial Year Ended
| | Nickel London Metal Exchange US$/lb
| | Gold London Gold Market US$/oz
| | Fertilizer US Gulf
Price US$/tonne
| | Copper London Metal Exchange US$/lb
|
December 31, 1999 First Quarter Second Quarter Third Quarter Fourth Quarter | | 2.11
2.37
2.89
3.53 | | 287
274
259
296 | | 199
190
174
153 | | 0.64
0.66
0.76
0.79 |
| | | | |
December 31, 2000 First Quarter Second Quarter Third Quarter Fourth Quarter | | 4.29
4.26
3.75
3.38 | | 291
280
277
269 | | 148
145
164
158 | | 0.81
0.79
0.85
0.84 |
| | | | |
December 31, 2001 First Quarter Second Quarter Third Quarter Fourth Quarter | | 2.97
3.04
2.51
2.29 | | 259
268
276
279 | | 162
142
138
147 | | 0.79
0.75
0.67
0.64 |
| | | | |
December 31, 2002 First Quarter Second Quarter Third Quarter Fourth Quarter | | 2.80
3.15
3.11
3.22 | | 291
313
314
323 | | 152
157
168
153 | | 0.70
0.73
0.69
0.70 |
| | | | |
December 31, 2003 First Quarter Second Quarter Third Quarter Fourth Quarter | | 3.77
3.79
4.24
5.57 | | 352
348
363
392 | | 169
181
180
184 | | 0.75
0.74
0.79
0.93 |
Currency Hedging Policy
Foreign currency risk relates to our exposure to changes in exchange rates. Our revenue streams are significantly derived from the sale of our commodity production in US dollars and the amount of Australian dollar revenue we will receive fluctuates with the moving A$/US$ exchange rate. Consistent with approved Board policy, we may seek to reduce our exposure to exchange rate movements by entering into foreign exchange hedging contracts for a proportion of our outstanding receivables with a view to reducing the effects of adverse currency rate fluctuations. When looked at in isolation, hedging transactions relating to the conversion of US dollar receivables to Australian dollars, they could result in losses if:
| | (a) | | the A$ weakens against the US$ between contract inception and maturity; or |
| | (b) | | a counterparty were to default and the A$ has strengthened against the US$ between contract inception and maturity. |
In the case of (a), the hedging loss will be offset by a higher Australian dollar revenue stream from the lower A$/US$ exchange rate, although the net revenue we would receive would be less than we would otherwise have received had the hedge transaction not been in place.
102
| | | | |
| | QUANTITATIVE AND QUALITATIVE DISCLOSURES ABOUT MARKET RISK | | |
Summary Hedging Results
Hedging results for 2003, 2002 and 2001 were:
A$ million profit / (loss)
| | | | | | | | |
| | | Year ended December 31,
| |
Hedging Results
| | 2003
| | 2002
| | | 2001
| |
Currency – A$/US$ | | 70.2 | | (108.2 | ) | | (328.1 | ) |
Gold | | 1.9 | | (5.1 | ) | | 64.1 | |
Copper | | — | | — | | | — | |
Nickel | | — | | — | | | 2.0 | |
| | |
| |
|
| |
|
|
Total | | 72.1 | | (113.3 | ) | | (262.0 | ) |
| | |
| |
|
| |
|
|
These gains and losses have been allocated to the revenue and profits of individual business units.
The following information is provided in compliance with US Financial Reporting Release No. 48. We have elected to disclose information in the “Tabular Presentation” set down in s305(a)(I)(i).
Commodity Hedging
(A) Trading Purposes
Nil.
(B) Non-trading (Hedging Purposes)
As at December 31, 2003:
(1) Gold
We had 44,600 ounces of gold relating to production from Olympic Dam (December 2002: 615,228 ounces) hedged at an average gold price of A$569 per ounce (December 2002: A$621 per ounce) with maturities extending to 2005 as follows:
| | | | | | | |
| | | Forward sale of Gold
| |
Maturity
| | Amount of ounces
| | Rate A$/ounce
| | Fair Value A$m
| |
2005 | | 44,600 | | 573 | | (1.3 | ) |
| | |
| |
| |
|
|
For comparison we had the following gold hedge positions in place at December 31, 2002:
| | | | | | | |
| | | Forward sale of Gold
| |
Maturity
| | Amount of ounces
| | Rate A$/ounce
| | Fair Value A$m
| |
2003 | | 85,028 | | 547 | | (20.5 | ) |
2004 | | 80,000 | | 559 | | (14.9 | ) |
2005 | | 80,000 | | 579 | | (17.4 | ) |
2006 | | 78,300 | | 618 | | (6.5 | ) |
2007 | | 80,160 | | 641 | | (3.7 | ) |
2008-2010 | | 211,740 | | 684 | | (9.6 | ) |
| | |
| |
| |
|
|
The above gold contracts provide us with the option to either physically or financially settle. We have no floating interest rate or gold lease rate exposure.
As these contracts are entered into for the purpose of hedging future production, we defer any unrealized gains and losses on the contracts, together with the cost of the contracts, until the underlying production occurs.
The fair value is based on the mark to market of the maturing forward contracts. This is the difference between the future expected market price as at December 31, 2003 and the original contract rate. The future expected market price is based on the forward price calculated on the spot rate and the gold contango (difference between US interest rates and the gold lease rate discounted using a zero coupon interest rate curve).
103
| | | | |
| | QUANTITATIVE AND QUALITATIVE DISCLOSURES ABOUT MARKET RISK | | |
Currency Hedging
(A) Trading Purposes
Nil
(B) Non-trading (Hedging Purposes)
As at December 31, 2003, we had US$300.9 million (December 2002: US$1,640.5 million) hedged at an average rate of A$/US$0.6665 (December 2002: US$0.6614) at maturities extending to December 31, 2004 using a combination of forward contracts and options as detailed in the table below:
| | | | | | | | | | | | | | | | | | | |
| | | Forward sale of US$
| | Bought Put Options
| | Written Call Options
| |
Maturity
| | Amount US$m
| | Rate A$/US$
| | Fair value A$m
| | Amount US$m
| | Strike rate A$/US$
| | Fair value A$m
| | Amount US$m
| | Strike rate A$/US$
| | Fair value A$m
| |
2004 | | 228.4 | | 0.6753 | | 25.7 | | 72.5 | | 0.6402 | | 14.4 | | 20.0 | | 0.6772 | | (0.2 | ) |
| | |
| |
| |
| |
| |
| |
| |
| |
| |
|
|
For comparison, we had the following foreign currency hedge positions in place at December 31, 2002:
| | | | | | | | | | | | | | | | | | | | |
| | | Forward sale of US$
| | | Bought Put Options
| | Written Call Options
| |
Maturity
| | Amount US$m
| | Rate A$/US$
| | Fair Value A$m
| | | Amount US$m
| | Strike rate A$/US$
| | Fair Value A$m
| | Amount US$m
| | Strike rate A$/US$
| | Fair Value A$m
| |
2003 | | 195.6 | | 0.6821 | | (81.8 | ) | | 62.5 | | 0.6479 | | 0.2 | | 62.5 | | 0.6479 | | (15.5 | ) |
2004 | | 228.4 | | 0.6753 | | (95.1 | ) | | 72.5 | | 0.6402 | | 0.8 | | 72.5 | | 0.6402 | | (19.8 | ) |
2005 | | 228.3 | | 0.6887 | | (112.0 | ) | | 77.5 | | 0.6430 | | 1.4 | | 77.5 | | 0.6430 | | (23.1 | ) |
2006 | | 155.6 | | 0.6828 | | (83.0 | ) | | 72.5 | | 0.6402 | | 1.9 | | 72.5 | | 0.6402 | | (21.6 | ) |
2007 | | 174.6 | | 0.6729 | | (83.5 | ) | | 77.5 | | 0.6430 | | 2.6 | | 77.5 | | 0.6430 | | (23.4 | ) |
2008 | | 178.5 | | 0.6500 | | (74.4 | ) | | 117.0 | | 0.5913 | | 8.1 | | 117.0 | | 0.5913 | | (25.9 | ) |
| | |
| |
| |
|
| |
| |
| |
| |
| |
| |
|
|
The fair value is based on the differential between US and Australian interest rate curves discounted using the zero coupon interest rate curve.
Interest Rate Hedging
Interest rate risk refers to our exposure to movements in interest rates. We are primarily exposed to interest rate risk on our outstanding interest bearing liabilities. As interest rates fluctuate, the amount of interest payable on debt balances where the interest rate is not fixed will also fluctuate. Interest rate swaps and cross currency swaps allow us to manage our interest rate risk.
In May 2003 we issued, through our wholly owned subsidiary WMC Finance (USA) Limited, a total of US$700 million worth of global bonds to provide ongoing liquidity. The bonds were sold in the United States. They effectively refinance a US$500 million 364-day facility, which was put in place to bridge the period between the repurchase of US$776.3 million worth of Yankee bonds on December 10, 2002 and the current global bond issue.
The Global Bond issue was made up of two components:
| | • | | a US$500 million issue at 5.125% which matures on May 15, 2013. |
| | • | | a US$200 million issue at 6.25% which matures on May 15, 2033. |
The global bonds, in substance, replaced loan facilities totaling US$1.1 billion put in place in October and November 2002 through our wholly owned subsidiary, WMC Finance Limited to repay our debt guaranteed by WMC Limited and to provide ongoing liquidity post demerger. The loan facilities, which were guaranteed by us and our major subsidiaries, were underwritten by JPMorgan, Deutsche Bank, Westpac Banking Corporation and Commonwealth Bank of Australia.
The periods above terminate on the relevant anniversary of the date of the loan facility which are October 29, 2003 for the term facility and November 14, 2003 for the syndicated facility.
104
| | | | |
| | QUANTITATIVE AND QUALITATIVE DISCLOSURES ABOUT MARKET RISK | | |
Interest rate risk
As at December 31, 2003 we had the following debt:
| | | | | | | | | | | | | | |
| | | | | Maturing in:
|
| | | | | 2004
| | 2005
| | 2006
| | 2007
| | 2008
| | 2009 onwards
|
A$m debt (floating) | | | | | | | | | | | | |
Bank loans | | - face value - fair value | | 212.0
212.0 | | 200.3
200.3 | | —
— | | —
— | | —
— | | —
— |
A$m equivalent of US$ debt (fixed) | | | | | | | | | | | | |
Global Bonds | | - face value - fair value | | —
— | | —
— | | —
— | | —
— | | —
— | | 934.8
884.8 |
Yankee Bonds | | - face value - fair value | | —
— | | —
— | | 1.0
1.1 | | —
— | | —
— | | 5.1
5.8 |
| | | | |
| |
| |
| |
| |
| |
|
Total | | - face value - fair value | | 212.0
212.0 | | 200.3
200.3 | | 1.0
1.1 | | —
— | | —
— | | 939.9
890.6 |
| | | | |
| |
| |
| |
| |
| |
|
Included in the debt noted above is the following fixed US$ debt which was swapped to floating. The terms of the interest rate swaps are provided on page 106.
| | | | | | | | | | | | |
| | | Maturing in:
|
| | | 2004
| | 2005
| | 2006
| | 2007
| | 2008
| | 2009 onwards
|
US$ Debt | | — | | — | | — | | — | | — | | 500m |
| | |
| |
| |
| |
| |
| |
|
Subsequent to the above swap, we entered into the following swap which re-fixed the US$ debt from floating. The terms of the interest rate swaps are provided on page 106.
| | | | | | | | | | | | |
| | | Maturing in:
|
| | | 2004
| | 2005
| | 2006
| | 2007
| | 2008
| | 2009 onwards
|
US$ Debt | | — | | 500m | | — | | — | | — | | — |
| | |
| |
| |
| |
| |
| |
|
We are exposed to interest rate risk on our outstanding interest bearing liabilities and investments. Interest rate swaps and cross currency swaps allow us to manage our interest rate risk.
As at December 31, 2002 we had the following debt:
| | | | | | | | | | | | | | |
| | | | | Maturing in:
|
| | | | | 2003
| | 2004
| | 2005
| | 2006
| | 2007
| | 2008 onwards
|
A$m debt (floating) | | | | | | | | | | | | |
Bank loans | | - face value - fair value | | 1,252.4
1,252.4 | | 361.1
361.1 | | —
— | | —
— | | —
— | | —
— |
A$ million equivalent of US$ debt (fixed) | | | | | | | | | | | | |
Yankee Bonds | | - face value - fair value | | 35.2
35.2 | | —
— | | —
— | | 1.4
1.5 | | —
— | | 7.4
7.5 |
| | | | |
| |
| | | |
| | | |
|
Total | | - face value - fair value | | 1,287.6
1,287.6 | | 361.1
361.1 | | —
— | | 1.4
1.5 | | —
— | | 7.4
7.5 |
| | | | |
| |
| | | |
| | | |
|
105
| | | | |
| | QUANTITATIVE AND QUALITATIVE DISCLOSURES ABOUT MARKET RISK | | |
Included in the debt noted above is the following A$ debt which has been swapped to US$. The terms of the cross currency swaps are provided on page 113.
| | | | | | | | | | | | | |
| | | Maturing in:
|
| | | 2003
| | 2004
| | 2005
| | 2006
| | 2007
| | 2008 onwards
|
Bank loans A$855m | | US$ | 480m | | — | | — | | — | | — | | — |
| | |
|
| |
| |
| |
| |
| |
|
Interest rate and cross currency swaps
As at December 31, 2003 we had entered into the following interest rate swaps. The fair value of these contracts at December 31, 2003 was A$7.4 million.
| | | | | | | | | | | |
| | | | | Interest rate
| | Maturity
| | Fair value A$m
| |
Notional A$ principal A$m
| | Interest swapped
| | Fixed
| | Float(1)
| | |
500 | | Fixed for floating | | 5.125 | | 1.585 | | 15/05/2013 | | (10.5m | ) |
500 | | Floating for fixed | | 1.7348 | | 1.585 | | 15/11/2005 | | 17.9m | |
| | | | | | | | | | | |
1,000 | | | | | | | | | | | |
| | | | | | | | | | | |
| | | | | | | | | | | | |
| (1) | | This is the floating rate applicable to the swap at balance date and is set using the 3 months US$ LIBOR floating base rate plus a margin. |
As at December 31, 2002, we had entered into a forward interest rate agreement against the 10-year US Treasury rate. US$500 million of cover was obtained, at an interest rate of 4.4225% expiring in 2003. The fair value of this contract at December 31, 2002 was A$34.4 million (loss).
As at December 31, 2002, we had entered into a cross currency swap, swapping A$855 million into US$ denominated debt of US$480 million as follows:
| | | | | | | | | | |
| | | US$m equivalent
| | Interest Rate
| | Maturity
| | Fair Value A$m
|
A$m Debt
| | | A$
Debt
| | US$
Debt
| | |
427.5 | | 240 | | 5.56 | | 2.14 | | 10/1/2003 | | 5.2 |
427.5 | | 240 | | 5.56 | | 2.15 | | 10/1/2003 | | 5.2 |
| |
| | | | | | | |
|
855.0 | | 480 | | | | | | | | 10.4 |
| |
| | | | | | | |
|
Fair value of these cross currency swaps is based on the spot rate as at December 31, 2002. Given the short period to maturity we do not expect this to be materially different to market value.
As at December 31, 2002, we had entered into A$100 million of interest caps at 6.00% (December 2001: US$430 million at 7.14%) with maturity date of January 7, 2003. Their fair value is immaterial.
Adoption of FAS 133
We adopted Statement of Financial Accounting Standards No. 133, “Accounting for Derivative Instruments and Hedging Activities” as amended by Statement of Financial Accounting Standards No. 137, “Accounting for Derivative Instruments and Hedging Activities – Deferral of the Effective Date of FASB Statement No. 133”, an amendment of FASB Statement No. 133, and
106
| | | | |
| | QUANTITATIVE AND QUALITATIVE DISCLOSURES ABOUT MARKET RISK | | |
Statement of Financial Accounting Standards No. 138, “Accounting for Certain Derivative Instruments and Certain Hedging Activities”, an amendment of FASB Statement No. 133 (referred to hereafter as “FAS 133”), on January 1, 2001. In accordance with the transition provisions of FAS 133, we recorded the following net-of-tax cumulative effect adjustments in earnings as of January 1, 2001:
| | | |
| | | A$m
| |
Related to previously designated fair value hedging relationships: | | | |
Fair value of hedging instruments | | 36.0 | |
Offsetting changes in fair value of hedged items | | (36.0 | ) |
| | |
|
|
Total adjustment net of tax | | — | |
| | |
|
|
In addition, we recorded the following net-of-tax cumulative-effect adjustments in other comprehensive income as of January 1, 2001.
| | | |
| | | A$m
| |
Related to previously designated fair value hedging relationships: | | | |
Fair value of hedging instruments | | 29.2 | |
Previously deferred hedging gains and losses | | (647.9 | ) |
| | |
|
|
Total adjustment net of tax | | (618.7 | ) |
| | |
|
|
Accounting for Derivatives and Hedging Activities
We formally document all relationships between hedging instruments and hedged items, as well as our risk-management objective and strategy for undertaking various hedge transactions. This process includes linking all derivatives that are designated as fair-value, cash flow, or foreign-currency hedges to (1) specific assets and liabilities on the balance sheet or (2) specific firm commitments or forecasted transactions. We also formally assess (both at the hedge’s inception and on an ongoing basis) whether the derivatives that are used in hedging transactions have been highly effective in offsetting changes in the fair value or cash flows of hedged items and whether those derivatives may be expected to remain highly effective in future periods. When we determine that a derivative is not (or has ceased to be) highly effective as a hedge, we discontinue hedge accounting prospectively, as discussed below.
We discontinue hedge accounting prospectively when (1) we determine that the derivative is no longer effective in offsetting changes in the fair value or cash flows of a hedged item (including hedged items such as firm commitments or forecasted transactions); (2) it is probable that the forecasted transaction will not occur; (3) a hedged firm commitment no longer meets the definition of a firm commitment; or (4) management determines that designating the derivative as a hedging instrument is no longer appropriate.
Fair-Value Hedges
We use interest rate swaps to convert a portion of our non prepayable fixed-rate debt into floating-rate debt. Under the interest rate swap contracts, we agree with other parties to exchange, at specified intervals, the difference between fixed-rate and floating-rate interest amounts, which is calculated based on an agreed-upon notional amount.
For USGAAP, for the year ending December 31, 2003 we recognized a net gain after tax of A$12.5 million, representing the change in time value on floating-for-fixed rate swaps excluded from the assessment of hedge effectiveness. The total of this adjustment on a pre-tax basis is A$17.9 million.
Cash Flow Hedges
Over 90% of sales are denominated in or linked to US$. We enter into foreign-exchange options and forward-exchange contracts as hedges of anticipated sales denominated in foreign currencies. We enter into these contracts to protect ourselves against the risk that the eventual dollar-net-cash inflows resulting from direct-foreign-export sales will be adversely affected by changes in exchange rates.
As at December 31, 2003 we recognized a net gain after tax of A$13.9 million, for the ineffective portion of certain options designated as cash flow hedges. A further gain of A$2.5 million was recognized, representing the change in time value of certain forward contracts excluded from the assessment of hedge effectiveness.
107
| | | | |
| | QUANTITATIVE AND QUALITATIVE DISCLOSURES ABOUT MARKET RISK | | |
The revaluation of foreign currency debt which is not treated as a hedge for accounting purposes under US GAAP resulted in a net gain after tax of A$231.7 million.
The total of the adjustments referred to in the preceding two paragraphs on a pre-tax basis was A$354.5 million.
As of December 31, 2003, we reclassified A$20.4 million of deferred net gains on derivative instruments accumulated in other comprehensive income as earnings during the next twelve months.
The maximum term over which we are hedging exposures to the variability of cash flows using derivative instruments for all forecasted transactions is ten years.
We take subsequent gains and losses on cash flow hedges to other comprehensive income and reclassify to profit and loss in the same period we recognize the hedged transaction. We continue to take gains and losses on fair value hedges to profit and loss in subsequent periods, as offsetting gains and losses on hedged liabilities. In both cases, these gains and losses are not recognized under Australian GAAP until the hedged transaction is recognized.
FAS 133 requires that any component of the gain or loss which is deemed to be ineffective be taken to the Income Statement immediately. For Australian GAAP any ineffectiveness is recognized over the term of the derivative.
Carrying amounts and estimated fair values of financial instruments
The carrying amounts and estimated fair values of our group’s financial instruments are as follows:
| | | | | | | | | | | | |
| | | A$m
| |
| | | Carrying amount as at December 31, 2003
| | | Fair value as at December 31, 2003
| | | Carrying amount as at December 31, 2002
| | | Fair value as at December 31, 2002
| |
Recognized in the Balance Sheet | | | | | | | | | | | | |
Financial Assets | | | | | | | | | | | | |
Cash assets | | 100.3 | | | 100.3 | | | 90.5 | | | 90.5 | |
Current other financial assets | | 13.1 | | | 13.1 | | | 12.7 | | | 12.7 | |
Current receivables | | 450.4 | | | 455.1 | | | 557.7 | | | 554.9 | |
Non-current receivables | | 277.3 | | | 149.7 | | | 218.8 | | | 211.6 | |
Non-current other financial assets | | 21.3 | | | 21.3 | | | 12.3 | | | 12.3 | |
Financial Liabilities | | | | | | | | | | | | |
Current payables | | 432.2 | | | 438.9 | | | 657.9 | | | 666.3 | |
Short-term interest bearing liabilities | | 212.0 | | | 212.0 | | | 1,287.6 | | | 1,287.6 | |
Other current liabilities | | 9.3 | | | 9.3 | | | 9.8 | | | 9.8 | |
Non-current payables | | 379.2 | | | 252.8 | | | 849.7 | | | 822.9 | |
Long-term interest bearing liabilities | | 1,141.2 | | | 1,092.0 | | | 369.9 | | | 370.1 | |
Other non-current liabilities | | 4.1 | | | 4.1 | | | 2.8 | | | 2.8 | |
Financial Instruments | | | | | | | | | | | | |
Hedging contracts: | | | | | | | | | | | | |
- forward/swaps | | (74.6 | ) | | (84.0 | ) | | (567.9 | ) | | (559.4 | ) |
- options | | 4.2 | | | 4.2 | | | (157.4 | ) | | (157.4 | ) |
- interest rate swaps | | — | | | 7.4 | | | — | | | — | |
| | |
|
| |
|
| |
|
| |
|
|
| | | (70.4 | ) | | (72.4 | ) | | (725.3 | ) | | (716.8 | ) |
| | |
|
| |
|
| |
|
| |
|
|
We used the following methods and assumptions to estimate the fair value of each class of financial instruments for which it is practicable to estimate a value.
Cash assets and current other financial assets
The carrying amount approximates fair value because of the short maturity of these instruments.
108
| | | | |
| | QUANTITATIVE AND QUALITATIVE DISCLOSURES ABOUT MARKET RISK | | |
Non-current other financial assets
We carry the other investments at cost. We valued shares quoted on a prescribed stock exchange at the quoted market value at balance date.
Debtors and creditors
We have calculated the fair value of debtors and creditors relating to hedging contracts on a mark-to-market basis using forward prices. Other current debtors and creditors mainly represent financial obligations we incurred in exchange for goods and services provided and received by us in the normal course of our operations, net of provisions for doubtful debts. Due to the short term nature of these financial obligations, we estimate their carrying values to equal their fair values.
Short- and long-term debt
We consider the carrying value of short-term debt and bank overdrafts to approximate the fair value due to the short maturity of the debt. Long-term debt comprises of bank loans and Yankee Bonds issues. We consider the carrying value of the long-term debt to approximate the fair value, with the exception of the Global Bond issue and the Yankee Bond issue, the fair value of which we have determined on a mark-to-market basis.
Foreign currency and commodity hedging contracts
We base the carrying amounts for commodity and foreign currency hedging contracts on the revaluation of open contracts at December 31, 2002 against spot rates at that date. The fair value we disclose represents the same contracts on a mark-to-market basis using forward rates and prices.
Other Disclosures
Further disclosures relating to financial instruments are included in Notes 28 and 35 to our Consolidated Financial Statements.
Contribution of Hedging to results for 2003 year
Commodity hedging contributed a gain of A$1.9 million to our operating results. The total currency gain for the year ended December 31, 2003 was A$70.2 million. The currency gains were attributable to forward contracts, implemented in prior periods and maturing in the year ended December 31, 2003, at an average rate above the HSRA rate for the period.
Contribution of Hedging to results for 2002 year
Commodity hedging contributed a loss of A$5.1 million to our operating results. The total currency loss for the year ended December 31, 2002 was A$108.2 million. The currency losses were attributable to forward contracts, implemented in prior periods and maturing in the year ended December 31, 2002, at an average rate above the HSRA rate for the period.
Contribution of Hedging to results for 2001 year
Commodity hedging contributed a gain of A$66.1 million to our operating results. The total currency loss for the 12 months ended December 31, 2001 was A$328.1 million. The currency losses were attributable to forward contracts, implemented in prior periods and maturing in 2001, at an average rate above the HSRA rate for the period.
Contribution of Hedging to results for 2000 year
Commodity hedging contributed a loss of A$14.9 million to our operating results. The total currency loss for the 12 months ended December 31, 2000 was A$253.0 million. This was due to forward contracts implemented in prior periods and maturing in 2000, at an average rate above the HSRA rate for the period.
Contribution of Hedging to results for 1999 year
Commodity hedging contributed a gain of A$62.8 million to our operating results. The total currency loss for the 12 months was A$19.8 million. This was due to forward contracts implemented in prior periods and maturing in 1999, at an average rate above the HSRA rate for the period.
109
| | | | |
| | QUANTITATIVE AND QUALITATIVE DISCLOSURES ABOUT MARKET RISK | | |
Qualitative Information About Market Risk
We have included Qualitative information on price risk management, and commodity and currency hedging in the discussion above in Item 11 “Quantitative Information on Price Risk Management”. We discuss qualitative information on treasury management and exchange rate and interest rate risk in Item 5B “Operating and Financial Review and Prospects—Liquidity and Capital Resources”.
110
| | | | |
| | DESCRIPTION OF SECURITIES OTHER THAN EQUITY SECURITIES | | |
ITEM 12. DESCRIPTION OF SECURITIES OTHER THAN EQUITY SECURITIES
Not applicable.
111
PART II
ITEM 13. DEFAULTS, DIVIDEND ARREARAGES AND DELINQUENCIES
Not applicable.
ITEM 14. MATERIAL MODIFICATIONS TO THE RIGHTS OF SECURITY HOLDERS AND USE OF PROCEEDS
Not applicable.
ITEM 15. CONTROLS AND PROCEDURES
Evaluation of Disclosure Controls and Procedures
Our management, including our chief executive officer and chief financial officer have reviewed and evaluated the effectiveness of our disclosure controls and procedures at the end of the period that this annual report relates to. Based on that review and evaluation, the chief executive officer and chief financial officer have concluded that our disclosure controls and procedures are effective in providing them with all material information required to be disclosed in this annual report on a timely basis.
Internal Controls
In connection with the preparation of our annual report, we have identified an internal control weakness relating to the reconciliation of our financial statements prepared in accordance with Australian GAAP to US GAAP, and in particular our calculation of a US GAAP adjustment related to the reversal of a demerger fair value balance in relation to derivatives. Essentially the procedures we used in 2002 failed to detect an error in the US GAAP fair value reversal adjustment which resulted in an overstatement of our total US GAAP equity and total US GAAP assets in 2002 by A$168.2 million. The error did not affect US GAAP net income in 2002. The restatement is described more fully in Note 45 to our Consolidated Financial Statements. We have adopted a number of measures to minimize the risk of such an error reoccurring in the future, including:
| | • | | Greater review time than allowed for 2002; |
| | • | | Complete documentation of all adjustments and process for calculations; and |
| | • | | Improved review process. |
ITEM 16A. AUDIT COMMITTEE FINANCIAL EXPERT
The Board has determined that Mr David Meiklejohn and Mr Graeme McGregor are audit committee financial experts and are independent as defined in the listing rules of the New York Stock Exchange. Although the board of directors has determined that Mr Meiklejohn and Mr McGregor have the requisite attributes defined under the rules of the Securities and Exchange Commission, their responsibilities are the same as those of the other audit committee members. Mr Meiklejohn and Mr McGregor are not auditors or accountants of WMC Resources, do not perform ‘field work’ with respect to WMC Resources Ltd and are not full-time employees of WMC Resources Ltd. The SEC has determined that an audit committee member who is designated as an audit committee financial expert will not be deemed to be an ‘expert’ for any purpose as a result of being identified as an audit committee financial expert. The audit committee is responsible for oversight of management in the preparation of our financial statements and financial disclosures. The audit committee relies on the information provided by management and the independent auditors. The audit committee does not have the duty to plan or conduct audits or determine that our financial statements and disclosures are complete and accurate. Our audit committee charter provides that these are the responsibility of management and the independent auditors.
112
ITEM 16B. CODE OF ETHICS
See Item 6C “Board Practices – Ethical Standards” for a description of our Code of Conduct.
ITEM 16C. PRINCIPAL ACCOUNTANT FEES AND SERVICES
| | | | |
| | | Year Ended December 31, 2003
| | Year Ended December, 2002
|
| | | A$ thousand |
(a) Remuneration for audit or review of the financial reports of the parent entity or any entity in the consolidated entity: | | | | |
Auditors of parent entity – PricewaterhouseCoopers1 | | | | |
- parent entity | | 1,403 | | 360 |
- controlled entities | | 27 | | 169 |
| | |
| |
|
| | | 1,430 | | 529 |
Other member firms of PricewaterhouseCoopers International | | 126 | | 127 |
| | |
| |
|
| | | 1,556 | | 656 |
| | |
| |
|
(b) Remuneration for audit-related services | | | | |
US registration of WMC Resource Ltd | | — | | 949 |
Annual report | | | | |
- prior year | | 378 | | — |
- current year | | 302 | | 148 |
Form 144A Bond Issue offering document | | 533 | | — |
| | |
| |
|
| | | 1,213 | | 1,097 |
| | |
| |
|
(c) Remuneration for tax services | | | | |
Australian tax services | | 460 | | 232 |
Overseas tax services | | 487 | | 181 |
| | |
| |
|
| | | 947 | | 413 |
| | |
| |
|
(d) Remuneration for other services | | | | |
Independent accountants report and other due diligence services in connection with the demerger of WMC Limited | | — | | 3,315 |
Risk management services | | 488 | | 684 |
Other assurance services | | 133 | | — |
| | |
| |
|
| | | 621 | | 3,999 |
| | |
| |
|
Total | | 4,337 | | 6,165 |
| | |
| |
|
Pre-Approval Policy
The following pre-approval policy was adopted with effect from May 2003;
| | 1. | | The Audit Committee must pre-approve all audit, review, and attest services and all other permissible non-audit services to be rendered by the external audit firm. |
| | 2. | | Approval must be granted prior to PricewaterhouseCoopers being engaged to render a service. |
113
| | 3. | | The Chairman of the Audit Committee is authorized to pre-approve services to be provided by our external auditors, on behalf of the Audit Committee, where: |
| | • | | the fees for those services falls below $250,000; |
| | • | | the services fall under one of the following categories: |
| | • | | audit and review services |
| | • | | accounting and reporting research and consultations |
| | • | | services related to regulatory filings |
| | • | | fraud and forensic investigations |
| | • | | risk management and internal control services |
| | • | | project assurance services |
| | • | | the services do not result in: |
| | • | | the auditor auditing their own work |
| | • | | the auditor assuming a management function within WMCR, or |
| | • | | the auditor acting as an advocate for WMCR. |
| | 4. | | All assurance services greater than $250,000 must be subjected to competitive tender with requirement for CFO, CEO and Audit Committee Chairman approval of inclusion of PricewaterhouseCoopers in tender list. |
| | 5. | | All services provided by our external auditors with fees greater than $250,000, or which are not within the categories detailed above, must be pre-approved by a majority of the Audit Committee. |
| | 6. | | All services undertaken by PricewaterhouseCoopers to be reported to the Audit Committee at each meeting. |
| | 7. | | Restricted Services to be documented and all services monitored. The General Manager – Finance to review all work undertaken and to immediately advise the CFO and Chairman of the Audit Committee if it is noted that PricewaterhouseCoopers has performed any restricted service. The CFO and Chairman of the Audit Committee to immediately discuss with the Engagement Partner. |
Our Audit Committee approved 3.9% of services described in categories (b) through (d) above pursuant to paragraph (c)(7)(i)(C) of Regulation S-X Rule 2-01.
ITEM 16D. EXEMPTION FROM LISTING STANDARDS FOR AUDIT COMMITTEES
Not applicable.
114
PART III
ITEM 17. FINANCIAL STATEMENTS
Not applicable, as we comply with Item 18.
ITEM 18. FINANCIAL STATEMENTS
Financial Statements and Financial Statement Schedules
Consolidated Financial Statements as of and for the year ended December 31, 2003.
The attached financial statements and financial statement schedules, pages F-1 to F-101 with a full index on page F-3, together with the Reports of Independent Accountants thereon, are filed as part of this annual report.
115
ITEM 19. EXHIBITS
Exhibit 1 – Constitution of WMC Resources, dated October 17, 2002 (incorporated by reference into our registration statement on Form 20-F filed on December 2, 2002).
Exhibit 4 – Material contracts
| | |
| |
| A. | | Roxby Downs (Indenture Ratification) Act of 1982, came into operation on June 21, 1982 (incorporated by reference into our registration statement on Form 20-F filed on December 2, 2002). |
| |
| B. | | Transitional Services Agreement between WMC Resources and Alumina Limited (formerly WMC Limited), dated on or about December 11, 2002 (incorporated by reference to our annual report on Form 20-F for the year ended December 31, 2002, filed on May 2, 2003). |
| |
| C. | | Demerger Deed between WMC Resources and Alumina Limited (formerly WMC Limited), dated March 5, 2003 (incorporated by reference to our annual report on Form 20-F for the year ended December 31, 2002, filed on May 2, 2003). |
| |
| D. | | Subscription Agreement (Term Loan Facility) dated October 29, 2002 (incorporated by reference into our registration statement on Form 20-F filed on December 2, 2002). |
| |
| E. | | Subscription Agreement (Syndicated Revolving Facility) dated November 14, 2002 (incorporated by reference into our registration statement on Form 20-F filed on December 2, 2002). |
| |
| F. | | Indenture dated as of May 8, 2003 (incorporated by reference to our registration statement on Form F-4 filed on June 19, 2003). |
| |
| G. | | First Supplemental Indenture dated May 8, 2003 (incorporated by reference to our registration statement on Form F-4 filed on June 19, 2003). |
| |
| H. | | Letter of Offer and Contract of Employment between WMC Limited and Bruce R. Brook, dated January 18, 2002 (incorporated by reference to our annual report on Form 20-F for the year ended December 31, 2002, filed on May 2, 2003). |
| |
| I. | | Letter of Offer and Contract of Employment between WMC Resources Ltd and Andrew G. Michelmore, dated August 19, 2002 (incorporated by reference to our annual report on Form 20-F for the year ended December 31, 2002, filed on May 2, 2003). |
| |
| J. | | WMC Resources Executive Share Plan, dated November 28, 2002. (incorporated by reference to our annual report on Form 20-F for the year ended December 31, 2002, filed on May 2, 2003). |
| |
| K. | | Letter of Offer and Contract of Employment between WMC Resources Ltd and Michael P.J. Nossal, dated March 4, 2003. Indenture dated as of May 8, 2003. (incorporated by reference to our registration statement on Form F-4 filed on June 19, 2003). |
Exhibit 8 – Significant Subsidiaries (incorporated by reference to our annual report on Form 20-F for the year ended December 31, 2002, filed on May 2, 2003).
Exhibit 12 – Certifications pursuant to Rule 15d-14a under the US Securities Exchange Act of 1934
Exhibit 13 – Certifications pursuant to Rule 15d-14b under the US Securities Exchange Act of 1934
116
Pursuant to the requirements of Section 12 of the Securities Exchange Act of 1934, the Registrant certifies it meets all of the requirements for filing on Form 20-F and has duly caused this Annual Report to be signed on its behalf by the undersigned, thereunto duly authorized.
| | |
WMC RESOURCES LTD |
|
/s/ Bruce R. Brook
|
Name: | | Bruce R. Brook |
Title: | | Chief Financial Officer |
Date: May 28, 2004
117

WMC RESOURCES LTD
(Australian Business Number 76 004 184 598)
AND CONTROLLED ENTITIES
U.S. FINANCIAL REPORT
AS OF AND FOR THE YEAR ENDED
31 DECEMBER 2003
Prepared in accordance
with Australian generally accepted
accounting principles (Australian GAAP)
except where noted
Amounts are stated in Australian dollars (A$) except where noted
F-1
REPORT OF INDEPENDENT AUDITORS
To the Board of Directors of
WMC Resources Ltd
We have audited the accompanying consolidated statements of financial position of WMC Resources Ltd and its controlled entities as of 31 December 2003 and 2002, and the related consolidated statements of financial performance, consolidated statements of cash flows and consolidated statements of changes in shareholder’s equity for each of the three years in the period ended 31 December 2003, which have been prepared on the basis of accounting principles generally accepted in Australia. These financial statements are the responsibility of the Company’s management. Our responsibility is to express an opinion on these financial statements based on our audits.
We conducted our audits in accordance with auditing standards generally accepted in Australia and the standards of the Public Company Accounting Oversight Board (United States). Those standards require that we plan and perform the audit to obtain reasonable assurance about whether the financial statements are free of material misstatement. An audit includes examining, on a test basis, evidence supporting the amounts and disclosures in the financial statements. An audit also includes assessing the accounting principles used and significant estimates made by management, as well as evaluating the overall financial statement presentation. We believe that our audits provide a reasonable basis for our opinion.
In our opinion, the consolidated financial statements referred to above present fairly, in all material respects, the financial position of WMC Resources Ltd and its controlled entities at 31 December 2003 and 2002, and the results of their operations and their cash flows for the three years then ended in conformity with accounting principles generally accepted in Australia.
Accounting principles generally accepted in Australia vary in certain significant respects from accounting principles generally accepted in the United States of America. The application of the latter would have affected the determination of consolidated net income for each of the three years in the period ended December 31, 2003 and the determination of consolidated shareholders’ equity at December 31, 2003 and 2002 to the extent summarized in Note 45, as restated to the consolidated financial statements.
| | |
| PricewaterhouseCoopers | | Melbourne, Australia May 28, 2004 |
F-2
WMC RESOURCES LTD AND CONTROLLED ENTITIES
Consolidated Financial Statements as of and for the year ended 31 December 2003
CONTENTS PAGE
F-3
WMC RESOURCES LTD AND CONTROLLED ENTITIES
CONSOLIDATED STATEMENTS OF FINANCIAL PERFORMANCE
| | | | | | | | | | | |
| | | Notes
| | Year to 31 Dec 2003 A$m
| | | Year to 31 Dec 2002 A$m
| | | Year to 31 Dec 2001 A$m
| |
Continuing operations: | | | | | | | | | | | |
Net sales revenue | | 2 | | 3,001.3 | | | 2,487.2 | | | 2,364.1 | |
Cost of goods sold | | | | (2,083.4 | ) | | (1,866.3 | ) | | (1,878.7 | ) |
Selling and distribution expenses | | | | (239.2 | ) | | (157.3 | ) | | (163.4 | ) |
General and administrative expenses | | | | (220.7 | ) | | (260.8 | ) | | (208.7 | ) |
General and administrative expenses—significant items | | 4 | | (8.4 | ) | | (51.2 | ) | | (92.5 | ) |
Exploration and evaluation expenses | | | | (24.2 | ) | | (37.0 | ) | | (71.9 | ) |
Other expenses | | | | (106.8 | ) | | (149.0 | ) | | (64.2 | ) |
Other expenses—significant items | | 4 | | (48.5 | ) | | (99.7 | ) | | — | |
Other income | | | | 39.6 | | | 41.8 | | | 187.2 | |
Other income—significant items | | | | — | | | 209.9 | | | — | |
| | | | |
|
| |
|
| |
|
|
Profit before interest and income tax | | | | 309.7 | | | 117.6 | | | 71.9 | |
Interest expense | | 3(b) | | (68.3 | ) | | (152.2 | ) | | (295.2 | ) |
| | | | |
|
| |
|
| |
|
|
Profit/(loss) before income taxes | | | | 241.4 | | | (34.6 | ) | | (223.3 | ) |
Income tax (expense)/credit | | 5(a) | | (2.3 | ) | | 19.9 | | | 65.8 | |
| | | | |
|
| |
|
| |
|
|
Net profit/(loss) from continuing operations | | | | 239.1 | | | (14.7 | ) | | (157.5 | ) |
| | | | |
|
| |
|
| |
|
|
Discontinued operations: | | | | | | | | | | | |
Net sales revenue | | 2 | | — | | | (1.4 | ) | | 452.9 | |
Net expenses | | | | (3.8 | ) | | (2.7 | ) | | (395.3 | ) |
Income tax credit/(expense) | | 5(a) | | — | | | 1.3 | | | (15.2 | ) |
Profit on Meliadine transaction | | 4 | | 10.3 | | | — | | | — | |
Profit on sale of right to gold royalty | | 4 | | — | | | 15.4 | | | — | |
Profit on sale of Central Norseman Gold Corporation Limited | | 4 | | — | | | 25.1 | | | — | |
Profit on disposal of gold operations (net of income tax benefit of A$34.4 million in December 2001) | | 4 | | — | | | — | | | 170.0 | |
Profit on disposal of Three Springs Talc operation (net of income tax benefit of A$1.4 million in December 2001) | | 4 | | — | | | — | | | 20.0 | |
Profit on disposal of equity interest in Mondo Minerals (net of income tax expense of A$10.1 million in December 2001) | | 4 | | — | | | — | | | 51.1 | |
| | | | |
|
| |
|
| |
|
|
Net profit from discontinued operations | | | | 6.5 | | | 37.7 | | | 283.5 | |
| | | | |
|
| |
|
| |
|
|
Consolidated operations: | | | | | | | | | | | |
Net sales revenue | | 2 | | 3,001.3 | | | 2,485.8 | | | 2,817.0 | |
Cost of goods sold | | | | (2,083.4 | ) | | (1,866.3 | ) | | (2,232.4 | ) |
Selling and distribution expenses | | | | (239.2 | ) | | (157.3 | ) | | (165.8 | ) |
General and administrative expenses | | | | (220.7 | ) | | (263.9 | ) | | (236.7 | ) |
General and administrative expenses—significant items | | 4 | | (8.4 | ) | | (51.2 | ) | | (513.1 | ) |
Exploration and evaluation expenses | | | | (28.0 | ) | | (37.2 | ) | | (95.1 | ) |
Other expenses | | | | (106.8 | ) | | (148.6 | ) | | (52.2 | ) |
Other expenses—significant items | | | | (62.0 | ) | | (137.6 | ) | | — | |
Other income | | | | 39.6 | | | 42.0 | | | 188.0 | |
Other income—significant items | | | | 23.8 | | | 288.3 | | | 635.2 | |
| | | | |
|
| |
|
| |
|
|
Profit before interest and income tax | | | | 316.2 | | | 154.0 | | | 344.9 | |
Interest expense | | 3(b) | | (68.3 | ) | | (152.2 | ) | | (295.2 | ) |
| | | | |
|
| |
|
| |
|
|
Profit before income taxes | | | | 247.9 | | | 1.8 | | | 49.7 | |
Income tax (expense)/credit | | 5(a) | | (2.3 | ) | | 21.2 | | | 76.3 | |
| | | | |
|
| |
|
| |
|
|
Net profit attributable to members of WMC Resources Ltd | | | | 245.6 | | | 23.0 | | | 126.0 | |
| | | | |
|
| |
|
| |
|
|
Transfer of revaluation reserve to retained earnings | | | | (24.5 | ) | | — | | | — | |
Net exchange differences recognized directly in equity | | | | (3.7 | ) | | 3.1 | | | (14.1 | ) |
Net transfers to retained earnings | | | | 31.4 | | | — | | | — | |
| | | | |
|
| |
|
| |
|
|
Total changes in equity other than those resulting from transactions with owners as owners | | | | 248.8 | | | 26.1 | | | 111.9 | |
| | | | |
|
| |
|
| |
|
|
Net earnings per share attributable to members of WMC Resources Ltd (Australian cents per share) | | | | | | | | | | | |
Australian GAAP (basic) | | 6 | | 21.7 | | | 2.1 | | | 11.4 | |
Australian GAAP (diluted) | | 6 | | 21.7 | | | 2.2 | | | 11.9 | |
The accompanying notes form part of these consolidated financial statements.
F-4
WMC RESOURCES LTD AND CONTROLLED ENTITIES
CONSOLIDATED STATEMENTS OF FINANCIAL POSITION
| | | | | | | |
| | | Notes
| | As at 31
December 2003 A$m
| | As at 31
December 2002 A$m
| |
CURRENT ASSETS | | | | | | | |
Cash assets | | 9 | | 100.3 | | 90.5 | |
Receivables | | 10 | | 450.4 | | 557.7 | |
Other financial assets | | 11 | | 13.1 | | 12.7 | |
Inventories | | 12 | | 545.8 | | 468.8 | |
Other | | 13 | | 68.1 | | 69.6 | |
| | | | |
| |
|
|
Total current assets | | | | 1,177.7 | | 1,199.3 | |
| | | | |
| |
|
|
NON-CURRENT ASSETS | | | | | | | |
Receivables | | 14 | | 277.3 | | 218.8 | |
Other financial assets | | 15 | | 21.3 | | 12.3 | |
Inventories | | 16 | | 71.2 | | 74.9 | |
Exploration and evaluation | | 17 | | 68.5 | | 152.7 | |
Property, plant and equipment | | 18 | | 4,520.5 | | 4,336.3 | |
Acquired mineral rights | | 19 | | 1,354.8 | | 1,269.3 | |
Deferred tax assets | | 20 | | 46.0 | | 44.6 | |
Other | | 21 | | 22.9 | | 39.9 | |
| | | | |
| |
|
|
Total non-current assets | | | | 6,382.5 | | 6,148.8 | |
| | | | |
| |
|
|
TOTAL ASSETS | | | | 7,560.2 | | 7,348.1 | |
| | | | |
| |
|
|
CURRENT LIABILITIES | | | | | | | |
Payables | | 22 | | 432.2 | | 657.9 | |
Interest bearing liabilities | | 23 | | 212.0 | | 1,287.6 | |
Current tax liabilities | | 24 | | 1.3 | | 3.9 | |
Provisions | | 25 | | 67.7 | | 66.0 | |
Other | | 26 | | 184.4 | | 17.0 | |
| | | | |
| |
|
|
Total current liabilities | | | | 897.6 | | 2,032.4 | |
| | | | |
| |
|
|
NON-CURRENT LIABILITIES | | | | | | | |
Payables | | 27 | | 379.2 | | 849.7 | |
Interest bearing liabilities | | 28 | | 1,141.2 | | 369.9 | |
Deferred tax liabilities | | 29 | | 382.0 | | 377.0 | |
Provisions | | 30 | | 121.8 | | 109.7 | |
Other | | 31 | | 688.7 | | 2.8 | |
| | | | |
| |
|
|
Total non-current liabilities | | | | 2,712.9 | | 1,709.1 | |
| | | | |
| |
|
|
TOTAL LIABILITIES | | | | 3,610.5 | | 3,741.5 | |
| | | | |
| |
|
|
NET ASSETS | | | | 3,949.7 | | 3,606.6 | |
| | | | |
| |
|
|
EQUITY | | | | | | | |
Contributed equity | | 32 | | 3,747.7 | | 3,653.4 | |
Reserves | | 33 | | 2.5 | | 30.7 | |
Retained profits/(accumulated losses) | | 33(c) | | 199.5 | | (77.5 | ) |
| | | | |
| |
|
|
TOTAL EQUITY | | | | 3,949.7 | | 3,606.6 | |
| | | | |
| |
|
|
Contingent liabilities | | 37 | | | | | |
Commitments for expenditure | | 38 | | | | | |
The accompanying notes form part of these consolidated financial statements.
F-5
WMC RESOURCES LTD AND CONTROLLED ENTITIES
CONSOLIDATED STATEMENTS OF CASH FLOWS
| | | | | | | | | | | |
| | | Notes
| | Year to
31 Dec
2003 A$m
| | | Year to
31 Dec
2002 A$m
| | | Year to
31 Dec
2001 A$m
| |
CASH FLOWS FROM OPERATING ACTIVITIES | | | | | | | | | | | |
Receipts from customers | | | | 2,987.3 | | | 2,455.4 | | | 2,981.0 | |
Payments to suppliers and employees | | | | (2,251.8 | ) | | (2,043.4 | ) | | (1,966.1 | ) |
Payments on settlement of hedge contracts | | | | (46.9 | ) | | (11.4 | ) | | (246.6 | ) |
Receipts on early close out of legacy foreign exchange contracts | | | | 18.6 | | | — | | | — | |
Receipts on early close out of commodity hedge contracts | | | | 2.7 | | | — | | | — | |
Interest and other items of a similar nature received | | | | 20.3 | | | 29.5 | | | 51.5 | |
Borrowing costs | | | | (71.1 | ) | | (151.3 | ) | | (204.9 | ) |
Proceeds from interest rate swap close out | | | | — | | | 71.2 | | | 11.7 | |
Income taxes paid | | | | (2.9 | ) | | (3.2 | ) | | (6.7 | ) |
Proceeds from insurance claims (business interruption) | | | | 10.5 | | | 35.0 | | | 34.3 | |
Payments for: | | | | | | | | | | | |
-exploration (grassroots) | | | | (20.7 | ) | | (19.7 | ) | | (57.2 | ) |
-exploration (additional, supporting existing operations) | | | | (3.5 | ) | | (3.7 | ) | | (19.3 | ) |
| | | | |
|
| |
|
| |
|
|
Net cash provided by operating activities | | 34(a) | | 642.5 | | | 358.4 | | | 577.7 | |
| | | | |
|
| |
|
| |
|
|
CASH FLOWS FROM INVESTING ACTIVITIES | | | | | | | | | | | |
Payments for property, plant and equipment | | | | (661.9 | ) | | (464.9 | ) | | (426.8 | ) |
Demerger costs paid | | | | (45.2 | ) | | (21.7 | ) | | — | |
Proceeds from sale of St Ives and Agnew gold operations | | | | — | | | — | | | 432.0 | |
Proceeds from sale of Three Springs Talc operation | | | | — | | | — | | | 56.0 | |
Proceeds from sale of equity interest in Mondo Minerals | | | | — | | | — | | | 122.2 | |
Proceeds from sale of Central Norseman Gold Corporation Limited | | | | — | | | 25.7 | | | — | |
Proceeds from sale of investments | | | | — | | | — | | | 24.9 | |
Proceeds from sale of non-current assets | | | | 22.6 | | | 67.6 | | | 64.2 | |
Proceeds from insurance claims (material damage) | | | | 12.0 | | | 27.3 | | | 23.6 | |
Proceeds from/(payments for) gold hedge close out | | | | — | | | (34.4 | ) | | 21.7 | |
Proceeds from/(payments for) short term investments | | | | — | | | 2.6 | | | (8.6 | ) |
Payments for research and development | | | | (0.1 | ) | | (0.4 | ) | | — | |
Payments for evaluation expenditure | | | | (7.3 | ) | | (4.5 | ) | | (4.9 | ) |
Payment for purchase of Yakabindie Nickel Pty Limited | | | | — | | | — | | | (25.2 | ) |
| | | | |
|
| |
|
| |
|
|
Net cash (used in)/provided by investing activities | | | | (679.9 | ) | | (402.7 | ) | | 279.1 | |
| | | | |
|
| |
|
| |
|
|
CASH FLOWS FROM FINANCING ACTIVITIES | | | | | | | | | | | |
Deemed equity contribution/(distribution) | | 1(a) | | — | | | 12.4 | | | (15.4 | ) |
Proceeds from borrowings | | | | 1,086.5 | | | 2,307.9 | | | 277.2 | |
Repayments of borrowings | | | | (1,032.6 | ) | | (2,754.3 | ) | | (1,055.5 | ) |
Proceeds from issues of shares | | | | 54.8 | | | 600.0 | | | — | |
Payment on close-out of interest rate hedge | | | | (38.5 | ) | | — | | | — | |
Global bond issues costs paid | | | | (9.9 | ) | | — | | | — | |
Redemption costs on Yankee Bonds | | | | — | | | (150.2 | ) | | — | |
| | | | |
|
| |
|
| |
|
|
Net cash provided by/(used in) financing activities | | | | 60.3 | | | 15.8 | | | (793.7 | ) |
| | | | |
|
| |
|
| |
|
|
Net (decrease)/increase in cash held | | | | 22.9 | | | (28.5 | ) | | 63.1 | |
Cash at the beginning of the financial year | | | | 90.5 | | | 123.9 | | | 58.4 | |
Effects of exchange rate changes on opening foreign currency cash balances | | | | (13.1 | ) | | (4.9 | ) | | 2.4 | |
| | | | |
|
| |
|
| |
|
|
Cash at the end of the financial year | | | | 100.3 | | | 90.5 | | | 123.9 | |
| | | | |
|
| |
|
| |
|
|
The accompanying notes form part of these consolidated financial statements.
F-6
WMC RESOURCES LTD AND CONTROLLED ENTITIES
CONSOLIDATED STATEMENTS OF CHANGES IN EQUITY
| | | | | | | | | | | | | | | | |
| | | | | Share
capital A$m
| | Asset
revaluation
reserve A$m
| | | Foreign
currency
translation
reserve A$m
| | | Retained
profits A$m
| | | Total equity A$m
| |
Year ended 31 December 2003 | | | | | | | | | | | | | | | | |
Balance at the beginning of the financial year | | | | 3,653.4 | | 24.5 | | | 6.2 | | | (77.5 | ) | | 3,606.6 | |
Net income | | | | — | | — | | | — | | | 245.6 | | | 245.6 | |
Shares issued on conversion of options | | | | 60.6 | | — | | | — | | | — | | | 60.6 | |
Shares issued for final contractual payment for the acquisition of Corridor Sands | | | | 33.7 | | — | | | — | | | — | | | 33.7 | |
Foreign currency adjustments | | | | — | | — | | | 3.2 | | | — | | | 3.2 | |
Reserve transfers | | | | — | | (24.5 | ) | | (6.9 | ) | | 31.4 | | | — | |
| | | | |
| |
|
| |
|
| |
|
| |
|
|
Balance at the end of the financial year | | | | 3,747.7 | | — | | | 2.5 | | | 199.5 | | | 3,949.7 | |
| | | | |
| |
|
| |
|
| |
|
| |
|
|
| | | | | | |
| | | Share
capital A$m
| | Asset
revaluation
reserve A$m
| | Foreign
currency
translation
reserve A$m
| | | Retained
profits A$m
| | | Carve-out
equity A$m
| | | Total equity A$m
| |
Year ended 31 December 2002 | | | | | | | | | | | | | | | | |
Balance at the beginning of the financial year | | | | | | | | | | | | 3,220.3 | | | 3,220.3 | |
Net income to 30 November 2002 | | | | | | | | | | | | (32.1 | ) | | (32.1 | ) |
Foreign currency adjustments | | | | | | | | | | | | (3.1 | ) | | (3.1 | ) |
Deemed equity contribution | | | | | | | | | | | | 12.4 | | | 12.4 | |
| | | | | | | | | | | | |
|
| |
|
|
Balance at 30 November 2002 | | | | | | | | | | | | 3,197.5 | | | 3,197.5 | |
| | | | | | | | | | | | |
|
| |
|
|
Net adjustments resulting from demerger related transactions | | 3,653.4 | | 24.5 | �� | — | | | (132.6 | ) | | (3,197.5 | ) | | 347.8 | |
Net income 1 December to 31 December 2002 | | — | | — | | — | | | 55.1 | | | — | | | 55.1 | |
Foreign currency adjustments | | — | | — | | 6.2 | | | — | | | — | | | 6.2 | |
| | |
| |
| |
|
| |
|
| |
|
| |
|
|
Balance at the end of the financial year | | 3,653.4 | | 24.5 | | 6.2 | | | (77.5 | ) | | — | | | 3,606.6 | |
| | |
| |
| |
|
| |
|
| |
|
| |
|
|
| | | | | | |
| | | | | | | | | | | | | Carve-out
equity A$m
| | | Total equity A$m
| |
Year ended 31 December 2001 | | | | | | | | | | | | | | | | |
Balance at the beginning of the financial year | | | | | | | | | | | | 3,123.8 | | | 3,123.8 | |
Net income | | | | | | | | | | | | 126.0 | | | 126.0 | |
Foreign currency adjustments | | | | | | | | | | | | (14.1 | ) | | (14.1 | ) |
Deemed equity contribution/(distribution) | | | | | | | | | | | | (15.4 | ) | | (15.4 | ) |
| | | | | | | | | | | | |
|
| |
|
|
Balance at the end of the financial year | | | | | | | | | | | | 3,220.3 | | | 3,220.3 | |
| | | | | | | | | | | | |
|
| |
|
|
The accompanying notes form part of these consolidated financial statements.
F-7
WMC RESOURCES LTD AND CONTROLLED ENTITIES
NOTES TO THE CONSOLIDATED FINANCIAL STATEMENTS
| 1. | | SUMMARY OF SIGNIFICANT ACCOUNTING POLICIES |
| (a) | | BACKGROUND AND BASIS OF ACCOUNTING |
Background
WMC Resources Ltd and its controlled entities (“WMC Resources”) is principally engaged in the discovery, development, production, processing, and marketing of minerals and metals. WMC Resources produces nickel, copper, phosphate fertilizers, uranium oxide, gold and other minor by-products.
On December 11, 2002 WMC Limited, the former parent entity of WMC Resources, consummated the separation of WMC Limited’s interest in Alcoa’s World Alumina and Chemicals business (AWAC), from its other mineral businesses which now comprise WMC Resources (the “demerger”).
Prior to effecting the demerger, through a series of transactions internal to the WMC Limited Group, WMC Resources Ltd acquired WMC Limited’s shares in the legal entities which held the copper-uranium and fertilizer businesses, WMC Finance Limited, WMC Finance (USA) Limited as well as WMC Limited’s exploration and development interests other than those relating to AWAC. Under generally accepted accounting principles in Australia (Australian GAAP), all of these acquisitions were accounted for at fair value in return for shares in WMC Resources Ltd. Under US GAAP, the internal transactions were accounted for at book value. To consummate the demerger, WMC Limited effected a capital reduction and dividend to its shareholders in an amount equivalent to the value of WMC Resources Ltd after the internal transfers were completed. The entitlement of WMC Limited’s shareholders to the capital reduction and dividend was ultimately satisfied in the demerger through the distribution to WMC Limited’s shareholders of shares in WMC Resources Ltd on a one-for-one basis.
Basis of Preparation
The accompanying consolidated financial statements have been prepared in accordance with Australian Accounting Standards and other mandatory professional reporting requirements. These standards and reporting requirements form part of Australian GAAP. A reconciliation of the major differences between these principles and those generally accepted in the United States of America (US GAAP) is included as Notes 45 and 46.
The financial report is prepared in accordance with the historical cost convention. Unless otherwise stated, the accounting policies adopted are consistent with those of the previous year.
The preparation of financial statements in conformity with generally accepted accounting principles requires management to make estimates and assumptions that affect the reported amounts of assets and liabilities and disclosure of contingent assets and liabilities at the dates of the financial statements and the reported amounts of revenues and expenses during the reporting periods.
Basis of Accounting - 2003 Fiscal Year
The financial statements for the year ended December 31, 2003 reflect the financial performance of the operations of the WMC Resources Ltd group for the full year as, on a statutory basis, WMC Resources Ltd controlled the copper-uranium, fertilizer and finance activities for the full 2003 fiscal year.
Basis of Accounting - 2002 & 2001 Fiscal Years
The demerger was given accounting effect on November 30, 2002. Accordingly, the financial position, results of operations and cash flows of the demerged WMC Resources Ltd at and for the one month ended December 31, 2002 represent the consolidated operations of WMC Resources Ltd and its subsidiaries. The transfers of the businesses to WMC Resources Ltd (via the internal transactions referred to in the background paragraph above) were effected at fair value in accordance with Australian GAAP with effect on November 30, 2002. The resulting adjustment directly impacts shareholders’ equity reflecting the internal nature of the transaction.
For fiscal 2001 and the first eleven months of fiscal 2002, the financial statements have been prepared on a carve-out basis and include the financial position, results of operations and cash flows of WMC Resources Ltd’s incumbent nickel business and of the copper-uranium and fertilizer businesses that were transferred to WMC Resources Ltd from WMC Limited in the demerger. Also reported are the discontinued gold and talc operations of WMC Limited sold during 2001. These financial statements have been principally prepared from historical accounting records of the WMC Limited Group and present substantially all of the operations of the businesses as if WMC Resources Ltd had been a separate economic entity inclusive of all of these businesses for all periods presented.
Changes to equity in the periods presented arise from net income or loss, other comprehensive income and other deemed contributions/distributions with WMC Limited. Deemed equity contributions/distributions represent the dividends received from AWAC, dividends paid and other capital transactions of WMC Limited, net of cash retained by WMC Limited.
F-8
WMC RESOURCES LTD AND CONTROLLED ENTITIES
NOTES TO THE CONSOLIDATED FINANCIAL STATEMENTS—(Continued)
| 1. | | SUMMARY OF SIGNIFICANT ACCOUNTING POLICIES (Continued) |
| (a) | | BACKGROUND AND BASIS OF ACCOUNTING (continued) |
WMC Resources Ltd uses a centralized approach to cash management and the financing of its operations through WMC Finance Limited. As determined in the demerger proposal, WMC Resources Ltd acquired WMC Finance Limited and WMC Finance (USA) Limited. Therefore the balance sheet includes all of the debt and the income statement includes the interest expense previously reported by the WMC Limited Group, as the debt was used exclusively to fund WMC Resources Ltd’s projects.
WMC Resources Ltd participated in WMC Limited’s centralized risk management function. As part of this activity, derivative financial instruments were utilized to manage risks generally associated with commodity, currency and interest rate market volatility. WMC Limited did not hold or issue derivative financial instruments for trading purposes. The historical balance sheets of WMC Resources Ltd reflect the associated asset and liability positions resulting from this activity because WMC Resources Ltd assumed WMC Limited’s derivative financial instruments through its acquisition of WMC Finance Limited. The derivative financial instruments referred to were used exclusively to manage WMC Resources Ltd’s risks in the periods presented. The historical statements of operations and statements of cash flows reflect the related gains and losses arising from these instruments.
General corporate overhead related to corporate headquarters and common support divisions has been included in these results based on amounts incurred by WMC Limited less an amount that was solely applicable to the remaining businesses of WMC Limited. Management believes these assumptions are reasonable. Subsequent to the demerger, WMC Resources Ltd has performed these functions using its own resources or purchased services and is responsible for the costs and expenses associated with the management of a public corporation.
WMC Resources Ltd’s financial statements include the costs experienced by the WMC Limited pension and post-retirement benefit plans for those employees and retirees for whom WMC Resources Ltd has assumed responsibility.
| (b) | | PRINCIPLES OF CONSOLIDATION |
The consolidated financial report is prepared on a consolidated entity basis for WMC Resources Ltd (parent entity) and the entities it controls (controlled entities). Australian GAAP defines entity widely, including any legal, administrative or fiduciary arrangement. All material entities in the consolidated entity are companies. The economic entity consisting of WMC Resources Ltd and its controlled entities is referred to in the financial report as ‘the group’. In preparing the financial statements, the effects of all transactions between entities within the group are eliminated in full, including unrealized profits and losses on transactions with associates accounted for on an equity basis.
The allocation of profits, reserves and capital to outside equity interests is disclosed separately without any adjustments being made, except where the allocation of the outside equity share of losses would exceed the outside equity interest in capital and other reserves. In this case, the excess is borne by the parent entity shareholders until it is considered likely that the outside equity interest will make good the losses.
Where control of an entity is obtained during a financial year, its results are included in the consolidated statement of financial performance from the date on which control commences. Where control of an entity ceases during a financial year, its results are included for that part of the year during which control existed.
Interests in companies which the group does not control or exercise significant influence over are included in the accounts as investments, initially recorded at cost. Dividends are taken into profits of the investing entity when received.
The liability method of tax effect accounting is used, whereby the income tax expense for the year is matched with the accounting profit after allowance for permanent differences. The income tax effect of significant permanent differences on the tax expense for the year is set out in Note 5. Income tax on cumulative timing differences is set aside to the deferred income tax or the future income tax benefit accounts at the rates which are expected to apply when those timing differences reverse.
The future income tax benefit relating to tax losses is not carried forward as an asset unless the benefit can be regarded as being virtually certain of realization. The future income tax benefit relating to timing differences is not carried forward as an asset unless its realization is assured beyond any reasonable doubt.
Provision is made for the amount of any dividend declared, determined or publicly recommended by the directors on or before the end of the year but not distributed at balance date.
F-9
WMC RESOURCES LTD AND CONTROLLED ENTITIES
NOTES TO THE CONSOLIDATED FINANCIAL STATEMENTS—(Continued)
| 1. | | SUMMARY OF SIGNIFICANT ACCOUNTING POLICIES (Continued) |
| (e) | | FOREIGN CURRENCY TRANSLATION |
Transactions
Foreign currency transactions are initially translated into Australian currency at the rate of exchange at the date of the transaction. The subsequent payment or receipt of funds relating to that transaction is translated at the rate applicable on the date of payment or receipt. At balance date amounts payable and receivable in foreign currencies are translated to Australian currency at rates of exchange current at that date. Resulting exchange differences are recognized in determining the profit or loss for the year, except as stated below for differences arising on foreign currency borrowings included in borrowing costs. The accounting for forward foreign exchange contracts is in accordance with Note 1(f).
Controlled foreign entities
Where a foreign controlled entity is self-sustaining, its assets and liabilities are translated into Australian currency at rates of exchange current at balance date, while its revenues and expenses are translated at actual or an average of rates ruling during the reporting period. Exchange differences arising on translation are taken to the foreign currency translation reserve. Upon disposal of a self-sustaining foreign operation the balance of the foreign currency translation reserve relating to the operation is transferred to retained profits.
The exchange gains and losses arising on those foreign currency borrowings (net of gains and losses on any related specific hedge contracts) that are designated as hedges of investments in self-sustaining controlled foreign entities are offset in the foreign currency translation reserve against the exchange gains and losses arising on the translation of the net assets of those entities. These circumstances represent an effective natural hedge.
For integrated foreign controlled entities, monetary assets and liabilities are translated into Australian currency at rates of exchange current at balance date, while non-monetary assets and liabilities and equity items including revenue and expenses are translated using historic rates of exchange. Exchange differences arising on translation are recorded as revenue or expense by the group.
| (f) | | DERIVATIVE FINANCIAL INSTRUMENTS |
The group uses derivative financial instruments to specifically hedge natural exposures to commodity prices, exchange rates and interest rates. The instruments used include spot, forward, swap and option contracts.
For currency contracts hedging firmly committed sales, operating purchases or capital purchases, premiums or discounts on entering into forward currency hedging contracts, together with the subsequent exchange gains or losses resulting from those transactions, are deferred in other assets or other liabilities until the underlying transaction takes place. When the underlying transaction takes place, gains, losses, premiums and discounts for the hedge contract are included in the cost of the applicable asset, or taken to profit and loss as part of sales revenue or costs.
For contracts hedging exposure to commodity prices, unrealized or realized gains and losses and premiums are deferred in other assets or other liabilities until the underlying transaction takes place. When the underlying transaction takes place, gains, losses and premiums for the hedge contract are taken to profit and loss as part of sales revenue or costs.
For contracts hedging the interest rate component of debt instruments, gains and losses are recognized as adjustments to interest expense when the underlying transaction occurs.
All contracts are designated as hedges of underlying transactions in the group’s deal-recording systems. They are reviewed regularly to ensure that they are still effective as hedges. If a contract ceases to qualify as an effective hedge of an underlying transaction then all premiums, discounts, gains and losses relating to the hedge contract are immediately recognized in profit and loss. Any subsequent gains and losses that might occur due to market movements between the time the contract ceases to be an effective hedge and the time that it is closed out would be recognized in profit and loss as they occur. If a contract that is designated as a hedge of an underlying transaction is closed out, but the underlying transaction still exists, then recognition of any gains and losses on the contract is deferred until the underlying transaction occurs.
F-10
WMC RESOURCES LTD AND CONTROLLED ENTITIES
NOTES TO THE CONSOLIDATED FINANCIAL STATEMENTS—(Continued)
| 1. | | SUMMARY OF SIGNIFICANT ACCOUNTING POLICIES (Continued) |
Sales revenue is measured at the fair value of the consideration received, and is recognized when each of the following conditions are met:
| | (i) | | Persuasive evidence of an arrangement exists, which is usually in the form of a contractual arrangement. |
| | (ii) | | Title in the product has transferred to the buyer, which in most cases occurs when the product passes the ship’s rail, at the port of loading. |
| | (iii) | | The seller’s price to the buyer is fixed or determinable. In the case of certain products sold by the company, including nickel-concentrate, nickel-matte and a portion of copper cathode, revenue is recognized on a provisional basis at the time of title transfer, based on prevailing market prices and contained metal, and is subject to final adjustment at the end of periods ranging from 30 to 90 days in most cases, for movements in market prices to the end of those periods. Revenue initially recognized is equal to the contained quantity of payable metal, measured at the forward price. At each subsequent period end date prior to final settlement, revenue is remeasured based on the prevailing forward price. Revenue is considered determinable at the recognition point, due to the existence of an actively traded and widely quoted market on the London Metal Exchange for the relevant metals. Market prices are the only aspect of recognized revenue subject to material change at the time of recognition. Final sales prices are determined based on payable contained metal and the market price at the relevant quotation point stipulated in each contract that is generally on or around the end of the settlement period. |
| | (iv) | | Collectability is reasonably assured. |
All trade debtors are recognized as the amounts receivable upon settlement. Collectability of trade debtors is reviewed on an ongoing basis. Debts that are known to be uncollectible are written off. A provision is raised when some doubt exists about collection.
Stores
Stores represent consumable supplies and maintenance spares and are valued at weighted average cost. Provision is made for obsolescence where items relate to units of property that are no longer used or the items themselves have been superseded.
Trading stocks and work in progress
Trading stocks represent all products that are in the form in which they are expected to be sold by the relevant business.
Work in progress, including ore stocks, consists of stocks on which further processing is required by, or on behalf of, the relevant business to convert them to trading stocks.
Work in progress, classified as non-current, relates to costs associated with ore on heap leach pads, or in broken ore stockpiles not expected to be processed into final product and realized through sale within twelve months from the balance sheet date.
Broken ore that is above a predetermined cut-off grade is stockpiled for future processing. The processing of this ore is contemplated within each current mine plan and is dependent on commodity prices and the life of the mine. Broken ore below the cut-off grade is also stockpiled, however the costs associated with this ore are expensed as incurred, as its future processing is uncertain. Costs associated with ongoing waste removal are treated in accordance with the accounting policy relating to mine properties and mine development.
Trading stocks and work in progress are valued at the lower of cost and net realizable value. Cost approximates weighted average cost and includes direct costs and an appropriate portion of fixed and variable direct overhead expenditure, including depreciation and amortization. Net realizable value is the amount estimated to be obtained from sale of the item of inventory in the normal course of business, less any anticipated costs to be incurred prior to its sale.
| (j) | | RECOVERABLE AMOUNT OF NON-CURRENT ASSETS |
The recoverable amount of an asset is the net amount expected to be recovered through the cash inflows and outflows arising from its continued use and subsequent disposal.
Recoverable amounts of non-current assets are assessed based on undiscounted future net cash flows expected to be generated from the assets. Where net cash inflows are derived from a group of assets working together, recoverable amount is determined on the basis of the relevant group of assets. The values of assets are reviewed on an ongoing basis and, where the carrying amount exceeds recoverable amount, the carrying amounts of non-current assets are written down to the lower of their recoverable amount or market value. The decrement in the carrying amount is recognized as an expense in the statement of financial performance in the reporting period in which the write-down occurs.
F-11
WMC RESOURCES LTD AND CONTROLLED ENTITIES
NOTES TO THE CONSOLIDATED FINANCIAL STATEMENTS—(Continued)
| 1. | | SUMMARY OF SIGNIFICANT ACCOUNTING POLICIES (Continued) |
| (k) | | ACQUISITION OF ASSETS |
The purchase method of accounting is used for all acquisitions of assets regardless of whether equity instruments or other assets are acquired. Cost is measured as the fair value of the assets given up, shares issued or liabilities undertaken at the date of acquisition plus incidental costs directly attributable to the acquisition. Where equity instruments are issued in an acquisition the value of the instruments is the market price as at the acquisition date, or where no market price is available, an estimate of fair value is used. Transaction costs arising on the issue of equity instruments are recognized directly in equity.
| (l) | | EXPLORATION AND EVALUATION EXPENDITURE |
Exploration and evaluation expenditures are written off as incurred, except when such costs are expected to be recouped through successful development and exploitation, or sale, of an area of interest. In addition, exploration assets recognized on acquisition of an entity are carried forward provided that exploration and/or evaluation activities in the area have not yet reached a stage that permits a reasonable assessment of the existence or otherwise of economically recoverable reserves, and active and significant operations in relation to the area are continuing.
The expenditure carried forward when recovery is expected represents an accumulation of direct net exploration and evaluation costs incurred by, or on behalf of, the group and applicable indirect costs, in relation to separate areas of interest for which rights of tenure are current.
If it is established subsequently that economically recoverable reserves exist in a particular area of interest, resulting in the decision to develop a commercial mining operation, then in that year the accumulated expenditure attributable to that area, to the extent that it does not exceed the recoverable amount for the area concerned, will be transferred to mine development. As such it will be subsequently amortized against production from that area. Any excess of accumulated expenditure over recoverable amounts will be written off to the statement of financial performance.
| (m) | | GOVERNMENT FACILITIES |
These assets represent contributions towards the cost of power, water, road, railway and town service facilities owned by government or local authorities. These assets are amortized over the life of the related mining projects.
| (n) | | MINE PROPERTIES AND MINE DEVELOPMENT |
These assets represent the capital cost incurred on areas of interest for which it has been established, to the satisfaction of the directors, that economically recoverable reserves exist.
Costs accumulated in respect of each area of interest represent direct and applicable indirect expenditure incurred by, or on behalf of, the relevant entity. Indirect expenditure principally consists of charges for depreciation of equipment used in development activities. The costs of successful exploration and evaluation and access and capital development are classified as mine development.
Capital development for open pit mines includes both the initial pre-production removal of overburden and ongoing post-production waste removal (see below for further detail on post-production waste removal). Capital development on underground mines includes expenditure on shaft sinking, declines, development and access drives and ventilation shafts. Utilities and facilities such as water, power and rail transport (where the company is required to contribute to the capital cost but does not have title to the asset), pre-production administration and other costs for mineral properties are classified as mine properties. Amortization of these costs is provided separately for each mineral reserve or mine from the commencement of commercial production as follows:
| | (i) | | Mine properties’ amortization is calculated on a straight line basis over the estimated remaining life of those mines or the life of the specific asset, whichever is shorter; and |
| | (ii) | | Mine development amortization is calculated on a units-of-production basis over the estimated recoverable reserves included in the current mine plan. In order to calculate the amortization, the total costs of development, including net costs incurred to date and estimated future waste removal costs are totaled and divided by the total proven and probable reserves included in the current mine plan. Annual depletion is calculated based on the units of production during the period multiplied by the per unit cost. |
Mine lives are based on the period of time over which the reserves are planned to be extracted, generally between five years and a maximum of thirty years.
Post-production waste removal
All costs of post-production waste removal (stripping) from open pit mines are accumulated, and deferred on the statement of financial position as part of the total of mine properties and mine development. These costs include the costs of drilling, blasting, loading and haulage of waste rock from the open pit to the waste pile. The costs are predominantly in the nature of payments to mining, blasting and other contracting companies or costs of internal labor and materials used in the process.
F-12
WMC RESOURCES LTD AND CONTROLLED ENTITIES
NOTES TO THE CONSOLIDATED FINANCIAL STATEMENTS—(Continued)
| 1. | | SUMMARY OF SIGNIFICANT ACCOUNTING POLICIES (Continued) |
| (n) | | MINE PROPERTIES AND MINE DEVELOPMENT (continued) |
These costs are amortized on a units-of-production basis, in accordance with the amortization policy set out for mine development at (ii) above. Based on the current mine plans, the deferred stripping asset would be expected to be extinguished during 2023 for Mt Keith and 2004 for the Harmony mine at Leinster.
Amortization of post-production waste removal costs is included in cost of goods sold in the statement of financial performance. Cash spent on waste removal is included in cash flows from investing activities in the cash flow statement.
As waste removal activities are an integral part of the mining operation, the deferred stripping asset is grouped with the other assets at the mine site or other level which represents the lowest level of separately identifiable cash flows in order to assess recoverable amount (refer to Note 1(j) for accounting policy on recoverable amount of non-current assets).
| (o) | | CAPITALISATION OF BORROWING COSTS |
For qualifying assets under construction, which are normally major projects and where development or construction necessarily requires a substantial period of time, borrowing costs directly attributable to the funds invested in the project are included as a capital cost during the period until substantially all the activities necessary to prepare the qualifying asset for its intended use or sale are complete. To the extent that additional funds have been borrowed for the purpose of, and are associated with, the project, the interest rate used is that applicable to those funds. The interest rate for any funds utilized in excess of specific borrowings is the weighted average rate for all other borrowings. Capitalised borrowing costs are amortized (from the commencement of commercial production) over a period not exceeding the economic life of the projects, subject to a maximum of thirty years.
| (p) | | DEPRECIATION OF PROPERTY, PLANT AND EQUIPMENT |
The cost of each item of property, plant and equipment is written off on a straight line basis over its expected useful life to the group, in the establishment of which, due regard is given to the life of the related area of interest. None of the lives exceed 30 years. Freehold land is not depreciated.
Assets that are depreciated or amortized on a basis other than life of the related area of interest typically have the following expected useful lives:
| | | | |
Plant and machinery | | | | 5-30 years* |
| | |
Motor vehicles and heavy mobile equipment | | - underground | | 4 years |
| | | - surface | | 5 years |
| | |
Office furniture | | | | 8 years |
| | |
Computers and other office equipment | | | | 5 years |
| * | | Dependent on the expected useful life of the item of plant and equipment and/or the life of the related operation. |
Certain major items of plant have significant components that suffer substantial wear and tear. These components are depreciated at an accelerated rate as they are overhauled and replaced on a cycle that exceeds one year but is significantly shorter than the life of the remaining plant of which they form a part. On overhaul, any remaining cost of the component is written off and the replacement is capitalized and depreciated over the effective life of the replacement.
Repair and maintenance expenditures are charged to operations. Major improvements and replacements that increase productive capacity or extend the useful life of an asset are capitalized in the respective asset class.
| (q) | | LEASED NON-CURRENT ASSETS |
The company has operating lease agreements under which the lessor effectively retains substantially all risks and benefits of ownership. Operating lease payments are charged to the statement of financial performance in the periods in which they are incurred, as this represents the pattern of benefits derived from the leased assets.
The present value of future payments for surplus leased space under non-cancelable operating leases is recognized as a liability, net of sub-leasing revenue, in the period in which it is determined that the leased space will be of no future benefit to the consolidated entity. Refer Note 1(w).
The cost of improvements to or on leasehold properties is amortized over the unexpired period of the lease or five years, whichever is the shorter.
F-13
WMC RESOURCES LTD AND CONTROLLED ENTITIES
NOTES TO THE CONSOLIDATED FINANCIAL STATEMENTS—(Continued)
| 1. | | SUMMARY OF SIGNIFICANT ACCOUNTING POLICIES (Continued) |
| (r) | | ACQUIRED MINERAL RIGHTS |
When a mining entity or operation is acquired, the amount of the purchase consideration must equal its fair value. The excess of the cost of acquisition of the mining entity or operation over the fair value of its other identifiable net assets acquired, is brought to account as “acquired mineral rights”. Acquired minerals rights are amortized from the commencement of commercial production on a straight line basis over the period during which the benefits are expected to arise.
| (s) | | EXPENDITURE CARRIED FORWARD |
| | (i) | | Research and development expenditure |
Research and development expenditure is charged against profit and loss as incurred, except that when a regular evaluation of projects concludes that an individual project is expected beyond any reasonable doubt to recover its costs from subsequent use or disposal, the costs of the project for that and subsequent reporting periods are capitalized. Such deferred capital is amortized over the reporting periods that are expected to benefit from the project. In establishing this economic life, due regard is given to the economic life of the related area of interest or, if this is not relevant, a maximum life of five years is applied.
| | (ii) | | Capitalisation of internal use software |
The group capitalizes the cost of external consultants and the business software acquired or developed for internal use (purchase of third party software e.g. SAP) where the project success is regarded as probable. The costs are amortized over the estimated useful life of the software. Capitalised software is assessed for impairment in accordance with the accounting policy Note 1(j) recoverable amount of non-current assets.
| (t) | | TRADE AND OTHER CREDITORS |
These amounts represent liabilities for goods and services provided to the group prior to the end of the financial year and which are unpaid. These amounts are unsecured and are usually paid within thirty days of recognition.
| (u) | | EMPLOYEE ENTITLEMENTS |
| | (i) | | Wages and salaries, annual leave and sick leave |
Liabilities for wages and salaries and annual leave are recognized in respect of employees’ services up to that date, and are measured as the amounts expected to be paid when the liabilities are settled.
Long service leave is an additional form of compensated leave to which Australian employees become entitled after a qualifying period of generally ten years of continuous service. It accrues to them at the rate of 1.3 weeks leave per year of service.
A liability for long service leave is recognized, and is measured as the present value of expected future payments to be made in respect of services provided by employees up to the reporting date. Consideration is given to expected future wages and salary levels, experience of employee departures and periods of service. Expected future payments are discounted using interest rates on national government securities with terms to maturity that match as closely as possible the estimated future cash outflows.
Since 27 July 2001, all employer contributions and ongoing management of employees’ superannuation entitlements have been managed by the WMC Superannuation Plan, an independently managed sub-plan of the Plum Superannuation Fund.
The group does not account for excesses or shortfalls of the superannuation fund or plan assets over accrued membership benefits. Employer contributions to these funds are recognized as an operating cost. Further details are provided in Note 39.
The company has employee share plans for senior management and all staff. The plans provide rewards based on company and individual performance. All rewards through the plans are currently satisfied by on-market purchase of WMC Resources Ltd shares. Access to shares is subject to certain restrictions. Details in respect of the share plans are set out in Note 32(b). The estimated cost of purchasing the shares to meet the 2003 plan entitlements has been accrued against 2003 profit.
F-14
WMC RESOURCES LTD AND CONTROLLED ENTITIES
NOTES TO THE CONSOLIDATED FINANCIAL STATEMENTS—(Continued)
| 1. | | SUMMARY OF SIGNIFICANT ACCOUNTING POLICIES (Continued) |
| (v) | | REHABILITATION EXPENDITURE |
Where practicable, rehabilitation is performed progressively and charged to costs as a part of normal operating activity. In addition, an assessment is made at each operation, of the undiscounted cost at balance date of any future rehabilitation work that will be incurred as a result of currently existing circumstances, and a provision is accumulated for this expenditure. This provision is charged on a proportionate basis to production over the life of the operation or activity concerned, or where the applicable life concerned exceeds 30 years, on a proportionate basis to production on a 30 year basis. The estimated cost of rehabilitation is re-assessed on a regular basis. Rehabilitation costs include reclamation costs, dismantling and removal costs, removal of foundations and roads, the clean up of polluted materials, revegetation of areas affected by operations, and monitoring of sites. Any changes in estimates are dealt with on a prospective basis. The time when it will be appropriate to commence significant rehabilitation work varies at different operations, from the next financial year to dates well in excess of 20 years time. Over that time there is a strong possibility that the obligations for, and methods and costs of, performing the rehabilitation work might alter. The estimates therefore are subject to change. Further details are provided in Note 37(a)(iii).
Provisions are recognised where there is a legal, equitable or constructive obligation as a result of a past event and it is probable that an outflow of economic benefits will be required to settle the obligation.
The present value of future payments for surplus leased space under non-cancellable operating leases which are not onerous contracts is recognised as a liability, net of sub-leasing revenue, in the period in which it is determined that the leased space will be of no future benefit to the consolidated entity. The net future lease payments are discounted using the interest rates implicit in the leases. Each lease payment is allocated between the liability and finance charges.
Liabilities for surplus leased space under non-cancellable leases which are onerous contracts are recognised when premises are leased under non-cancellable operating leases and the unavoidable costs of meeting the contractual obligations exceed the general market cost of similar leased premises.
| | (ii) | | Workers compensation |
Provision is made for amounts payable in relation to outstanding workers compensation claims when it is probable that an outflow of economic benefits will be required to settle the obligation. Amounts provided are reviewed regularly by actuaries or insurers in light of the claims outstanding.
| (x) | | INTEREST- BEARING LIABILITIES |
Loans are carried at their principal amounts that represent the present value of future cash flows associated with servicing the debt. Interest is accrued over the period it becomes due and is recorded as part of other creditors.
| | (i) | | Basic earnings per share |
Basic earnings per share is determined by dividing net profit after income tax attributable to members of the company, excluding any costs of servicing equity other than ordinary shares, by the weighted average number of ordinary shares outstanding during the financial year.
| | (ii) | | Diluted earnings per share |
Diluted earnings per share adjusts the figures used in the determination of basic earnings per share to take into account the after income tax effect of interest and other financing costs associated with dilutive potential ordinary shares and the weighted average number of shares assumed to have been issued for no consideration in relation to dilutive potential ordinary shares.
F-15
WMC RESOURCES LTD AND CONTROLLED ENTITIES
NOTES TO THE CONSOLIDATED FINANCIAL STATEMENTS—(Continued)
| 1. | | SUMMARY OF SIGNIFICANT ACCOUNTING POLICIES (Continued) |
| (y) | | EARNINGS PER SHARE (continued) |
| | (iii) | | Unaudited proforma earnings per share for 2002, and 2001 |
To consummate the demerger, WMC Limited effected a capital reduction and dividend to its shareholders in an amount equivalent to the value of WMC Resources after the internal transfers were completed. The entitlement of WMC Limited’s shareholders to the capital reduction and dividend was ultimately satisfied in the demerger through the distribution to WMC Limited’s shareholders of shares in WMC Resources on a pro rata basis such that existing WMC Limited shareholders received one share in WMC Resources for every WMC Limited share owned. Therefore, the unaudited pro forma basic net earnings per share for the years ended December 31, 2002, and 2001, has been computed by dividing net earnings for the periods then ended by the weighted average number of WMC Limited shares outstanding for the years then ended. The unaudited pro forma diluted earnings per share for the years ended December 31, 2002, and 2001, takes into effect the potential ordinary shares from the conversion of partly paid shares and options as disclosed in Note 6.
| (z) | | CURRENT ASSETS AND CURRENT LIABILITIES |
For the purposes of balance sheet classification, assets and liabilities are categorized as “current” if they are expected to be realized in cash, sold or consumed, or liquidated, as the case may be, within WMC Resources’ normal operating cycle, which does not exceed one year for any activity.
The company is of a kind referred to in Class Order 98/0100, issued by the Australian Securities & Investments Commission, relating to the ‘rounding off’ of amounts in the financial report. Amounts in the financial report have been rounded off in accordance with that Class Order to the nearest hundred thousand dollars.
| (bb) | | SHIPPING AND HANDLING COSTS |
Shipping and handling costs in respect of purchases are recorded in cost of goods sold, and in respect of product dispatched, recorded in selling and distribution costs in the statement of financial performance.
| (cc) | | DISCONTINUED OPERATIONS |
An operation is treated as a discontinued operation if the operation is a component of the group whose activities represent a separate major line of the business and the measurement date of a disposal is prior to the end of the reporting period. The measurement date of a disposal is the date on which the management having authority to approve the action commits itself to a formal plan to dispose of a segment of the business, whether by sale or abandonment. During the financial years included in this financial report the following operations were disposed of:
Gold business unit
In the first quarter of 2001, the company decided to focus on its core portfolio of large low cost business in nickel, copper-uranium and fertilizer businesses. As a result, the company began a strategic evaluation of its options for the gold business. The plan was finalized on 19 September 2001 when a final decision was made to sell the gold business unit in its entirety.
The Group disposed of the majority of its gold operations in 2001. The sale of a further operation was completed in January 2002, and the exit from the remaining gold assets occurred during 2003. The assets not sold at 31 December 2001 were included as discontinued operations at 31 December 2001 because management had approved a formal plan to dispose of the segment prior to year end.
During 2003, the operating subsidiary that held the remaining gold assets merged with a Canadian mining junior, resulting in the recognition of a net profit of A$10.3 million. These remaining assets had a carrying value of A$14.2 million at 31 December 2002 (2001: A$33.2 million) and the result for period up until the merger was a loss of A$3.8 million (2002: A$4.2 million loss, 2001: A$5.8 million loss).
The operation sold in 2002 had a carrying value of A$17.9 million at 31 December 2001. Its result for the year ended 31 December 2002 was a loss of A$1.5 million (2001: A$6.6 million profit).
F-16
WMC RESOURCES LTD AND CONTROLLED ENTITIES
NOTES TO THE CONSOLIDATED FINANCIAL STATEMENTS—(Continued)
| 1. | | SUMMARY OF SIGNIFICANT ACCOUNTING POLICIES (Continued) |
| (cc) | | DISCONTINUED OPERATIONS (Continued) |
The company’s right to a royalty from the 2001 sale of operations, was sold in June 2002 for a profit of A$15.4 million. There were no remaining assets and liabilities relating to discontinued operations of the gold business unit at December 31, 2003. The remaining assets and liabilities relating to discontinued operations of the gold business unit for comparative periods were :-
| | | | |
| | | 2002
A$m
| | 2001
A$m
|
Current Assets | | 0.2 | | 99.1 |
Non-Current Assets | | 14.5 | | 25.8 |
| | |
| |
|
Total Assets | | 14.7 | | 124.9 |
| | |
| |
|
Current Liabilities | | 1.1 | | 48.3 |
Non-Current Liabilities | | — | | 10.0 |
| | |
| |
|
Total Liabilities | | 1.1 | | 58.3 |
| | |
| |
|
Net Assets | | 13.6 | | 66.6 |
| | |
| |
|
Upon the completion of the sale of the remaining assets during the year, WMC Resources has fully exited the gold mining business.
Talc
Following a decision by the directors to exit the talc business and the receipt of an offer for the 50% equity interest in the Mondo Minerals Talc joint venture, the directors approved a resolution on 14 November 2000 to dispose of both the Mondo Minerals and Three Springs Talc businesses.
On 24 January 2001, WMC Limited sold its equity interest in Mondo Minerals Talc joint venture for a profit of A$51.1 million after tax. The sale received all the necessary regulatory approvals and the transaction was settled on 8 May 2001. On 1 August 2001, WMC Limited sold its Three Springs Talc operation for a profit of A$20.0 million after tax. The sale received all the necessary regulatory approvals and the transaction was settled on 30 September 2001.
F-17
WMC RESOURCES LTD AND CONTROLLED ENTITIES
NOTES TO THE CONSOLIDATED FINANCIAL STATEMENTS—(Continued)
| | | | | | | | | | | |
| | | Notes
| | Year to 31 Dec 2003 A$m
| | | Year to 31 Dec 2002 A$m
| | | Year to 31 Dec 2001 A$m
| |
Sales revenue from core operating activities: | | | | | | | | | | | |
Sale of goods from continuing operations | | | | 3,001.3 | | | 2,487.2 | | | 2,364.1 | |
Sale of goods from discontinued operations | | | | — | | | (1.4 | ) | | 452.9 | |
| | | | |
|
| |
|
| |
|
|
Net sales revenue | | | | 3,001.3 | | | 2,485.8 | | | 2,817.0 | |
| | | | |
|
| |
|
| |
|
|
Other income: | | | | | | | | | | | |
Interest received/receivable | | 3(b) | | 22.0 | | | 27.6 | | | 153.5 | |
Profit on disposal of non-current assets-continuing operations | | | | 2.3 | | | — | | | 10.6 | |
Insurance proceeds received / receivable | | | | 3.6 | | | 5.3 | | | 23.1 | |
Other income | | | | 0.6 | | | 0.5 | | | — | |
| | | | |
|
| |
|
| |
|
|
Total other income from continuing operations | | | | 28.5 | | | 33.4 | | | 187.2 | |
Other income from discontinued operations | | | | — | | | — | | | 0.8 | |
Profit on sale of non-current assets—discontinued operations | | | | 10.3 | | | 40.5 | | | 319.3 | |
| | | | |
|
| |
|
| |
|
|
Total other income | | | | 38.8 | | | 73.9 | | | 507.3 | |
| | | | |
|
| |
|
| |
|
|
SUBTOTAL NET REVENUES | | | | 3,040.1 | | | 2,559.7 | | | 3,324.3 | |
| | | | |
|
| |
|
| |
|
|
Proceeds from sale of non-current assets | | | | 37.2 | | | 101.0 | | | 685.9 | |
Proceeds received from early termination of interest rate swaps | | 4 | | — | | | 75.9 | | | — | |
Insurance proceeds shown as significant item | | 4 | | — | | | 120.0 | | | — | |
Less profit on disposal of non-current assets | | | | (12.6 | ) | | (40.5 | ) | | (329.9 | ) |
| | | | |
|
| |
|
| |
|
|
OPERATING REVENUE—AUSTRALIAN GAAP | | | | 3,064.7 | | | 2,816.1 | | | 3,680.3 | |
| | | | |
|
| |
|
| |
|
|
| (i) | | Net sales revenue includes: |
| | | | | | | | | | |
Currency hedging gains/(losses) | | | | 70.2 | | (108.2 | ) | | (328.1 | ) |
Commodity hedging gains/(losses) | | | | 1.9 | | (5.1 | ) | | 66.1 | |
| | | | |
| |
|
| |
|
|
| | | | | 72.1 | | (113.3 | ) | | (262.0 | ) |
| | | | |
| |
|
| |
|
|
F-18
WMC RESOURCES LTD AND CONTROLLED ENTITIES
NOTES TO THE CONSOLIDATED FINANCIAL STATEMENTS—(Continued)
Profit/(loss) from ordinary activities before income tax includes the following specific expenses:
This note does not include all costs.
| | | | | | | | | | | |
| | | Notes
| | Year to 31 Dec 2003 A$m
| | | Year to 31 Dec 2002 A$m
| | | Year to 31 Dec
2001 A$m
| |
Amortization and depreciation | | 3(a) | | 508.3 | | | 511.7 | | | 596.2 | |
Borrowing costs | | 3(b) | | 68.3 | | | 152.2 | | | 295.2 | |
Bad debts written off/provided for | | | | 1.6 | | | 0.1 | | | — | |
Write down of inventories to net realizable value | | | | (3.0 | ) | | 3.3 | | | 7.7 | |
Stock written off | | | | 19.5 | | | 33.6 | | | 20.5 | |
Exploration expenditure written off: | | | | | | | | | | | |
- grassroots | | | | 20.7 | | | 19.7 | | | 57.2 | |
- supporting existing operations | | | | 3.5 | | | 3.7 | | | 19.3 | |
- evaluation | | | | 3.8 | | | 13.8 | | | 18.6 | |
Government royalties on sales or production | | | | 56.3 | | | 53.1 | | | 72.6 | |
Provision for: | | | | | | | | | | | |
- employee entitlements | | | | 24.8 | | | 16.5 | | | 22.2 | |
- rehabilitation | | | | 15.8 | | | 15.5 | | | 14.8 | |
- diminution in value of investments | | | | 2.0 | | | (0.6 | ) | | 0.2 | |
- obsolescence of stores | | | | 5.8 | | | 6.1 | | | 4.0 | |
Research and development written off | | | | 0.5 | | | 0.6 | | | 0.4 | |
Foreign exchange loss | | | | 2.5 | | | 14.9 | | | 20.7 | |
Share plan costs | | | | 15.1 | | | 5.8 | | | — | |
Idle capacity costs | | | | 109.1 | | | 99.6 | | | 11.0 | |
Operating lease rentals | | | | 24.6 | | | 9.8 | | | 12.6 | |
| | | | |
|
| |
|
| |
|
|
(a) Amortization and depreciation | | | | | | | | | | | |
Amortization: | | | | | | | | | | | |
- government facilities | | | | 1.3 | | | 1.6 | | | 1.7 | |
- mine properties and mine development | | | | 184.8 | | | 138.9 | | | 248.3 | |
- acquired mineral rights | | | | 25.4 | | | 2.2 | | | — | |
- goodwill/intangibles | | | | 5.7 | | | 14.8 | | | 16.1 | |
- research and development | | | | 0.1 | | | 0.5 | | | 1.7 | |
Depreciation: | | | | | | | | | | | |
- plant and equipment | | | | 269.9 | | | 327.9 | | | 301.2 | |
- land and buildings | | | | 21.1 | | | 25.8 | | | 27.2 | |
| | | | |
|
| |
|
| |
|
|
Total amortization and depreciation charged to profit | | | | 508.3 | | | 511.7 | | | 596.2 | |
| | | | |
|
| |
|
| |
|
|
(b) Borrowing costs | | | | | | | | | | | |
Interest and finance charges paid/payable | | | | 77.4 | | | 155.7 | | | 295.2 | |
Capitalized to qualifying assets | | | | (9.1 | ) | | (3.5 | ) | | — | |
| | | | |
|
| |
|
| |
|
|
Interest charged to income | | | | 68.3 | | | 152.2 | | | 295.2 | |
| | | | |
|
| |
|
| |
|
|
Interest received/receivable | | | | | | | | | | | |
- continuing operation | | 2 | | (22.0 | ) | | (27.6 | ) | | (153.5 | ) |
- discontinued operations | | | | — | | | — | | | (0.8 | ) |
| | | | |
|
| |
|
| |
|
|
Interest credited to income | | | | (22.0 | ) | | (27.6 | ) | | (154.3 | ) |
| | | | |
|
| |
|
| |
|
|
Proceeds received from early termination of interest rate swaps | | 4 | | — | | | (75.9 | ) | | — | |
| | | | |
|
| |
|
| |
|
|
Net charge to income | | | | 46.3 | | | 48.7 | | | 140.9 | |
| | | | |
|
| |
|
| |
|
|
F-19
WMC RESOURCES LTD AND CONTROLLED ENTITIES
NOTES TO THE CONSOLIDATED FINANCIAL STATEMENTS—(Continued)
Profit/(loss) from ordinary activities after income tax, includes the following revenues and expenses whose disclosure is relevant in explaining the financial performance of the entity due to their size or nature:
| | | | | | | | | |
| | | Year to 31 Dec 2003 A$m
| | | Year to 31 Dec 2002 A$m
| | | Year to 31 Dec 2001 A$m
| |
Continuing operations: | | | | | | | | | |
Proceeds received from early termination of interest rate swaps | | — | | | 75.9 | | | — | |
Costs associated with the fire at Olympic Dam solvent extraction plant(1) | | (48.5 | ) | | (97.7 | ) | | (71.8 | ) |
Amount receivable from insurance claims in relation to the fire at the Olympic Dam solvent extraction plant | | — | | | 120.0 | | | — | |
Demerger costs—advisors fees and other costs | | — | | | (51.2 | ) | | — | |
Profit on disposal of Long/Victor nickel mines at Kambalda | | — | | | 12.0 | | | — | |
Corporate restructure costs | | (8.4 | ) | | — | | | (20.7 | ) |
| | |
|
| |
|
| |
|
|
Total continuing operations | | (56.9 | ) | | 59.0 | | | (92.5 | ) |
| | |
|
| |
|
| |
|
|
Discontinued operations: | | | | | | | | | |
Profit on Meliadine transaction | | 10.3 | | | — | | | — | |
Profit on sale of Central Norseman Gold Corporation Limited | | — | | | 25.1 | | | — | |
Profit on sale of right to gold royalty | | — | | | 15.4 | | | — | |
Profit on disposal of St Ives and Agnew gold operations(2) | | — | | | — | | | 238.8 | |
Cost of redundancies and closure costs associated with the restructuring of the service and exploration functions | | — | | | — | | | (0.8 | ) |
Net loss on early termination of commodity and currency hedging associated with the gold business | | | | | — | | | (103.2 | ) |
Profit on disposal of Three Springs Talc operation | | — | | | — | | | 18.6 | |
Profit on disposal of equity interest in Mondo Minerals | | — | | | — | | | 61.2 | |
| | |
|
| |
|
| |
|
|
Total discontinued operations | | 10.3 | | | 40.5 | | | 214.6 | |
| | |
|
| |
|
| |
|
|
Total significant items before income tax | | (46.6 | ) | | 99.5 | | | 122.1 | |
| | |
|
| |
|
| |
|
|
Income tax (charges)/credits on: | | | | | | | | | |
Write off of assets and costs associated with the fire at Olympic Dam solvent extraction plant(1) | | 14.5 | | | 29.3 | | | 21.5 | |
Tax benefit not previously brought to account | | 39.2 | | | — | | | — | |
Tax benefit on corporate restructure costs | | 2.6 | | | — | | | — | |
Tax expense on Meliadine transaction | | — | | | — | | | — | |
Income tax benefit on demerger costs | | — | | | 15.4 | | | — | |
Income tax expense on disposal of Long/Victor mines | | — | | | (2.6 | ) | | — | |
Income tax expense on insurance proceeds | | — | | | (36.0 | ) | | — | |
Proceeds received from early termination of Interest Rate Swaps | | — | | | (22.8 | ) | | — | |
Cost of redundancies and closure costs associated with the restructuring of the service and exploration functions | | — | | | — | | | 4.8 | |
Gain on disposal of St Ives and Agnew gold operations | | — | | | — | | | 3.4 | |
Net loss on the early termination of commodity and currency hedging associated with the gold business | | — | | | — | | | 31.0 | |
Gain on disposal of Three Springs Talc Operation | | — | | | — | | | 1.4 | |
Gain on disposal of equity interest in Mondo Minerals | | — | | | — | | | (10.1 | ) |
| | |
|
| |
|
| |
|
|
Income tax (charge)/credit on above significant items: | | | | | | | | | |
- continuing operations | | 56.3 | | | (16.7 | ) | | 26.3 | |
- discontinued operations | | — | | | — | | | 25.7 | |
| | |
|
| |
|
| |
|
|
Significant items after tax | | 9.7 | | | 82.8 | | | 174.1 | |
| | |
|
| |
|
| |
|
|
| (1) | | In October 2001 the copper-uranium business unit suffered a fire at the Olympic Dam facility which caused considerable damage to the copper and uranium solvent extraction circuits in the processing plant. The damaged plant required rebuilding and the carrying value of the impaired assets (A$52.3 million) was written off as a part of significant items. The balance of the significant item for Olympic Dam was a further charge of A$19.5 million incurred in relation to costs associated with lower production of copper and uranium. The entire 2002 and 2003 charges related to costs associated with lower production. |
| (2) | | An amount of A$25 million is included in the profit on disposal relating to right to future royalties that did not comply with all the criteria under US GAAP for recognition in profit in 2001. Refer to Note 45. |
F-20
WMC RESOURCES LTD AND CONTROLLED ENTITIES
NOTES TO THE CONSOLIDATED FINANCIAL STATEMENTS—(Continued)
| | | | | | | | | | | |
| | | Notes
| | Year to
31 Dec
2003
A$m
| | | Year to 31 Dec 2002
A$m
| | | Year to 31 Dec 2001
A$m
| |
(a) Pre-tax operating income/(loss) | | | | | | | | | | | |
| | | | |
Income/(loss) from continuing operations | | | | 241.4 | | | (34.6 | ) | | (223.3 | ) |
(Loss)/income from discontinued operations | | | | (3.8 | ) | | (4.1 | ) | | 57.6 | |
Profit on sale of right to Gold Royalty | | | | — | | | 15.4 | | | — | |
Profit on disposal of discontinued operations | | | | — | | | 25.1 | | | 215.4 | |
Profit on Meliadine transaction | | | | 10.3 | | | — | | | — | |
| | | | |
|
| |
|
| |
|
|
Pre-tax operating income | | | | 247.9 | | | 1.8 | | | 49.7 | |
| | | | |
|
| |
|
| |
|
|
Prima facie tax expense for the period at the rate of 30% | | | | (74.4 | ) | | (0.5 | ) | | (14.9 | ) |
The following tax effect on these items caused the total charge for income tax to vary from the above: | | | | | | | | | | | |
Adjustment for impact of hedging contracts fair valued at demerger | | | | 35.6 | | | 3.2 | | | — | |
Fair value adjustment arising from acquisition of entities | | | | (3.1 | ) | | 91.0 | | | — | |
Non-deductible depreciation and amortization | | | | (7.6 | ) | | (0.9 | ) | | (0.4 | ) |
Non-taxable capital gains | | | | 2.7 | | | 13.2 | | | 12.4 | |
Future income tax benefits recognized / (not brought to account)—overseas | | | | (4.3 | ) | | 2.5 | | | 0.6 | |
Future income tax benefits recognized / (not brought to account—Australia | | | | 39.2 | | | (91.4 | ) | | 68.9 | |
Other | | | | 1.1 | | | 1.6 | | | 4.2 | |
Over provision of tax in prior years | | | | 8.5 | | | 2.5 | | | 5.5 | |
| | | | |
|
| |
|
| |
|
|
Consequent variation in income tax expense / credit | | | | 72.1 | | | 21.7 | | | 91.2 | |
| | | | |
|
| |
|
| |
|
|
Income tax (expense)/credit | | | | (2.3 | ) | | 21.2 | | | 76.3 | |
| | | | |
|
| |
|
| |
|
|
Income tax (expense)/credit comprises: | | | | | | | | | | | |
Continuing operations: | | | | | | | | | | | |
- Normal | | | | (58.6 | ) | | 36.6 | | | 39.5 | |
- Significant—gains and losses | | 4 | | 56.3 | | | (16.7 | ) | | 26.3 | |
| | | | |
|
| |
|
| |
|
|
| | | | | (2.3 | ) | | 19.9 | | | 65.8 | |
| | | | |
|
| |
|
| |
|
|
Discontinued operations: | | | | | | | | | | | |
- Normal | | | | — | | | 1.3 | | | (15.2 | ) |
- Significant—gains and losses | | 4 | | — | | | — | | | 25.7 | |
| | | | |
|
| |
|
| |
|
|
| | | | | — | | | 1.3 | | | 10.5 | |
| | | | |
|
| |
|
| |
|
|
| | | | | (2.3 | ) | | 21.2 | | | 76.3 | |
| | | | |
|
| |
|
| |
|
|
| (b) | | Future income tax benefits |
The income tax provision is calculated under a policy of tax-effect accounting. Under this policy, the future benefits of tax losses and timing differences are brought to account where:
| | (i) | | virtual certainty exists as to the ability of group companies to recoup such losses; or |
| | (ii) | | a provision for deferred income tax exists in the group company to which the tax losses relate but only to the extent that deferred income tax has already been provided in respect of timing differences which will reverse within the period during which the tax losses will remain available as a deduction from assessable income; or |
| | (iii) | | the reversal of all other timing differences comprising the balance of the account is assured beyond any reasonable doubt. |
F-21
WMC RESOURCES LTD AND CONTROLLED ENTITIES
NOTES TO THE CONSOLIDATED FINANCIAL STATEMENTS—(Continued)
| 5. | | INCOME TAX (Continued) |
| (b) | | Future income tax benefits (continued) |
Realization of future benefits attributable to tax losses and timing differences will only arise in the event that:
| | (i) | | the company, or where applicable another WMC Resources company, derives future assessable income within the prescribed time limit of a nature and of an amount sufficient to enable the benefit from the deductions from the losses to be realized; |
| | (ii) | | companies controlled by WMC Resources continue to comply with the conditions for deductibility imposed by the law; and |
| | (iii) | | no changes in tax legislation adversely affect WMC Resources or its controlled entities in realizing the benefit from the deductions for the losses. |
| (c) | | Tax consolidation regime |
The Australian Tax Consolidation legislation came into effect on 1 July 2002. The wholly-owned Australian resident subsidiaries within the WMC Resources Ltd group, and the company may by election, enter the tax consolidation regime. At the date of this report no decision has been made by the company or the WMC Resources Ltd group to make the election. It is likely any such election would be made effective no earlier than 1 January 2004.The tax consolidation regime is not expected to impact the accounts of the Company as at 31 December 2003.
Due to the single entity concept contained in the tax consolidation regime, there may be an impact in subsequent years on the tax-related items reported in the company’s financial statements and those of its wholly owned Australian resident subsidiaries. Franking account balances of the company and the wholly-owned subsidiaries may also be impacted.
| | | | | | |
| | | Australian cents per share
|
| | | Year to 31 Dec 2003
| | Year to 31 Dec 2002
| | Year to 31 Dec 2001
|
Basic earnings per share calculated on profit after income tax. | | 21.7 | | 2.1 | | 11.4 |
| | |
| |
| |
|
Diluted earnings per share calculated on profit after income tax. | | 21.7 | | 2.2 | | 11.9 |
| | |
| |
| |
|
| |
| | | Number of shares
|
| | | 2003
| | 2002
| | 2001
|
(a) Weighted average number of shares used in the
calculation of earnings per share | | | | | | |
Number for basic earnings per share | | 1,131,654,938 | | 1,115,784,278 | | 1,103,323,901 |
Effect of share options on issue | | 663,679 | | 11,557,539 | | 17,474,000 |
| | |
| |
| |
|
Number for diluted earnings per share | | 1,132,318,617 | | 1,127,341,817 | | 1,120,797,901 |
| | |
| |
| |
|
F-22
WMC RESOURCES LTD AND CONTROLLED ENTITIES
NOTES TO THE CONSOLIDATED FINANCIAL STATEMENTS—(Continued)
| 6. | | EARNINGS PER SHARE (Continued) |
| (a) | | Information concerning classification of securities |
As disclosed in Note 1(y), as a result of the demerger, existing WMC Limited shareholders received one WMC Resources share for every WMC Limited share owned. The unaudited pro forma disclosures for 2002 and 2001 are based on the number of shares and options of WMC Limited outstanding for the periods concerned.
The partly paid shares carry the right to participate in dividends in proportion to the amount paid relative to the total issue price (for partly paid shares issued in 1987, relative to the nominal value), and to that extent they have been recognized as equivalents of ordinary shares in the determination of basic earnings per share. At balance date there were nil (December 2002: nil, December 2001: 629,000) partly paid shares, callable at the option of the holders and which at balance date were considered dilutive for the purpose of the calculation of diluted earnings per share. At balance date there were 16,207,145 (December 2002: 32,501,180, December 2001: 27,065,363) options which were considered potentially dilutive and therefore, were used in the calculation of diluted earnings per share.
| (b) | | Comparative information |
The basic earnings per share as presented and diluted earnings per share for 2002 and 2001 have been adjusted for the conversion of partly paid shares. The adjustment is in accordance with the Australian Accounting Standard AASB 1027, “Earnings Per Share”.
| (c) | | Conversion, call, subscription or issue after 31 December 2003 |
In the period from 31 December 2003 to 31 March 2004 the following movements in share capital and options on issue have taken place:
| | | | |
| | | Number of
options/shares
| | Exercise Price
|
Options exercised | | 2,348,408 | | Various |
Options issued | | — | | N/A |
Options lapsed | | 2,600 | | N/A |
Shares issued | | — | | N/A |
| (a) | | Description of business segments |
| | |
Copper-uranium | | Exploration, development, mining, smelting and refining of copper, and extraction of uranium in South Australia. |
| |
Nickel | | Exploration, development, mining, smelting and refining of nickel in Western Australia. |
| |
Fertilizer | | Exploration, development and mining of fertilizer product in Phosphate Hill, Queensland and distribution of fertilizer products via Hi-Fert. |
F-23
WMC RESOURCES LTD AND CONTROLLED ENTITIES
NOTES TO THE CONSOLIDATED FINANCIAL STATEMENTS—(Continued)
7. SEGMENT INFORMATION (Continued)
(b) Information for the year ended 31 December 2003
(i) Business segments
| | | | | | | | | | | | | | |
| | | Copper- uranium
A$m
| | | Nickel3
A$m
| | Fertilizer
A$m
| | | Elimination
A$m
| | | Consolidated
A$m
| |
Revenue | | | | | | | | | | | | | | |
Sales revenue1 | | 696.3 | | | 1,783.5 | | 414.8 | | | — | | | 2,894.6 | |
Inter-segment sales revenue | | — | | | — | | 7.6 | | | (7.6 | ) | | — | |
| | |
|
| |
| |
|
| |
|
| |
|
|
Total sales revenue from operations | | 696.3 | | | 1,783.5 | | 422.4 | | | (7.6 | ) | | 2,894.6 | |
Unallocated sales revenue | | | | | | | | | | | | | 34.6 | |
| | | | | | | | | | | | | |
|
|
Revenue before hedging | | | | | | | | | | | | | 2,929.2 | |
Hedging | | 22.7 | | | 43.7 | | 5.7 | | | — | | | 72.1 | |
| | | | | | | | | | | | | |
|
|
Revenue from operating activities | | | | | | | | | | | | | 3,001.3 | |
Proceeds from disposal of non-current assets: | | | | | | | | | | | | | | |
Business segments | | 0.4 | | | 6.5 | | 0.2 | | | — | | | 7.1 | |
Unallocated | | — | | | — | | — | | | — | | | 6.3 | |
Insurance proceeds received/receivable | | — | | | 3.6 | | — | | | — | | | 3.6 | |
Other income | | — | | | 0.4 | | 0.2 | | | — | | | 0.6 | |
| | |
|
| |
| |
|
| | | | | | |
Segment revenues | | 719.4 | | | 1,837.7 | | 428.5 | | | | | | | |
| | |
|
| |
| |
|
| | | | | | |
Interest received/receivable | | | | | | | | | | | | | 22.0 | |
| | | | | | | | | | | | | |
|
|
Continuing operations | | | | | | | | | | | | | 3,040.9 | |
Discontinuing operations—Gold | | | | | | | | | | | | | 23.8 | |
| | | | | | | | | | | | | |
|
|
| | | | | | | | | | | | | | 3,064.7 | |
| | | | | | | | | | | | | |
|
|
Result | | | | | | | | | | | | | | |
Earnings before allocation of hedging result | | (120.2 | ) | | 428.8 | | (31.3 | ) | | — | | | 277.3 | |
Unallocated profits2 | | | | | | | | | | | | | 12.7 | |
| | | | | | | | | | | | | |
|
|
| | | | | | | | | | | | | | 290.0 | |
Hedging | | 22.7 | | | 43.7 | | 5.7 | | | — | | | 72.1 | |
| | |
|
| |
| |
|
| | | | | | |
Segment result | | (97.5 | ) | | 472.5 | | (25.6 | ) | | | | | | |
| | |
|
| |
| |
|
| | | | |
|
|
Earnings from operations | | | | | | | | | | | | | 362.1 | |
Unallocated corporate expenses: | | | | | | | | | | | | | | |
New business | | | | | | | | | | | | | (19.5 | ) |
Regional exploration | | | | | | | | | | | | | (23.4 | ) |
Corporate | | | | | | | | | | | | | (20.6 | ) |
Corporate restructuring costs | | | | | | | | | | | | | (8.4 | ) |
Finance and other costs | | | | | | | | | | | | | (2.5 | ) |
Net borrowing costs | | | | | | | | | | | | | (46.3 | ) |
| | | | | | | | | | | | | |
|
|
Profit from before income tax expense—Continuing operations | | | | | | 241.4 | |
Profit from before income tax expense—Discontinuing operations—Gold | | | | | | 6.5 | |
| | | | | | | | | | | | | |
|
|
| | | | | | | | | | | | | | 247.9 | |
Income tax expense—Continuing operations | | | | | | | | | | | | | (2.3 | ) |
Income tax expense—Discontinuing operations—Gold | | | | | | | | | | | | | — | |
| | | | | | | | | | | | | |
|
|
Net profit after tax | | | | | | | | | | | | | 245.6 | |
| | | | | | | | | | | | | |
|
|
| 1 | | Sales revenue includes intermediate product sales. Segment revenues, expenses and results include transfers between segments. Such transfers are priced on an arm’s-length basis and are eliminated on consolidation. |
| 2 | | Unallocated profit is largely matched by costs in business segments with minimal net contribution to group earnings. |
| 3 | | Includes sales of US$229.7 million (A$ 352.5 million) to a significant customer |
F-24
WMC RESOURCES LTD AND CONTROLLED ENTITIES
NOTES TO THE CONSOLIDATED FINANCIAL STATEMENTS—(Continued)
| 7. | | SEGMENT INFORMATION (Continued) |
| (b) | | Information for the year ended 31 December 2003 (continued) |
| (i) | | Business segments (continued) |
| | | | | | | | |
| | | Copper- uranium
A$m
| | Nickel
A$m
| | Fertilizer
A$m
| | Consolidated
A$m
|
Depreciation and amortization | | 218.0 | | 242.7 | | 43.1 | | 503.8 |
Unallocated depreciation and amortization | | | | | | | | 4.5 |
| | | | | | | | |
|
Total depreciation and amortization—Continuing operations | | | | | | | | 508.3 |
| | | | | | | | |
|
Other non-cash expenses—Continuing operations | | 15.6 | | 36.0 | | 1.4 | | 53.0 |
| | |
| |
| |
| |
|
Assets | | | | | | | | |
Segment assets | | 4,313.0 | | 1,823.7 | | 753.5 | | 6,890.2 |
Unallocated corporate assets | | | | | | | | 670.0 |
| | | | | | | | |
|
Consolidated total assets | | | | | | | | 7,560.2 |
| | | | | | | | |
|
Liabilities | | | | | | | | |
Segment liabilities | | 443.8 | | 328.8 | | 85.6 | | 858.2 |
Unallocated corporate liabilities1 | | | | | | | | 2,752.3 |
| | | | | | | | |
|
Consolidated total liabilities | | | | | | | | 3,610.5 |
| | | | | | | | |
|
Acquisitions of non-current assets2 | | 396.7 | | 219.0 | | 40.5 | | 656.2 |
Unallocated corporate acquisitions3 | | | | | | | | 55.8 |
| | | | | | | | |
|
Total acquisitions of non-current assets | | | | | | | | 712.0 |
| | | | | | | | |
|
| 1 | | Includes deferred gains on hedging contracts of $859.7 million. Refer Note 26. |
| 2 | | Comprises acquisitions of property, plant and equipment, exploration and evaluation expenditure, mine properties under development and acquired mineral rights. |
| 3 | | Includes final contractual payment for acquisition of Corridor Sands, satisfied by the issue of 6,715,123 shares in WMC Resources Ltd (A$33.7 million), and capitalized interest (A$9.1 million). |
| (ii) | | Geographical segments |
Revenues from external customers of A$3,001.3 million are attributed to Australia. Total sales represent sales to the following countries / regions: Australia 17%, Europe 33%, Japan 14%, North America 13%, Taiwan 2% and Other 21%.
WMC Resources Ltd’s assets are primarily located within Australia. Capital expenditure and depreciation is also incurred on assets located primarily in Australia
F-25
WMC RESOURCES LTD AND CONTROLLED ENTITIES
NOTES TO THE CONSOLIDATED FINANCIAL STATEMENTS—(Continued)
7. SEGMENT INFORMATION (Continued)
| (c) | | Information for the year ended 31 December 2002 |
| | | | | | | | | | | | | | | |
| | | Copper- uranium
A$m
| | | Nickel3
A$m
| | | Fertilizer
A$m
| | | Elimination
A$m
| | | Consolidated
A$m
| |
Revenue | | | | | | | | | | | | | | | |
Sales revenue1 | | 765.0 | | | 1,372.9 | | | 432.9 | | | — | | | 2,570.8 | |
Inter-segment sales revenue | | — | | | 0.1 | | | — | | | (0.1 | ) | | — | |
| | |
|
| |
|
| |
|
| |
|
| |
|
|
Total sales revenue from operations | | 765.0 | | | 1,373.0 | | | 432.9 | | | (0.1 | ) | | 2,570.8 | |
Unallocated sales revenue | | | | | | | | | | | | | | 28.4 | |
| | | | | | | | | | | | | | |
|
|
Revenue before hedging | | | | | | | | | | | | | | 2,599.2 | |
Hedging | | (41.7 | ) | | (58.0 | ) | | (12.3 | ) | | — | | | (112.0 | ) |
| | | | | | | | | | | | | | |
|
|
Revenue from operating activities—Continuing | | | | | | | | | | | | | | 2,487.2 | |
Revenue from operating activities—Discontinuing operations—Gold | | — | | | — | | | — | | | — | | | (1.4 | ) |
| | | | | | | | | | | | | | |
|
|
| | | | | | | | | | | | | | | 2,485.8 | |
Proceeds from disposal of non-current assets: | | | | | | | | | | | | | | | |
Business segments | | 0.6 | | | 17.6 | | | 0.4 | | | — | | | 18.6 | |
Unallocated | | — | | | — | | | — | | | — | | | 4.0 | |
Insurance proceeds received/receivable | | 120.4 | | | 4.9 | | | — | | | — | | | 125.3 | |
Other income | | — | | | — | | | 0.3 | | | — | | | 0.3 | |
| | |
|
| |
|
| |
|
| | | | | | |
Segment revenues | | 844.3 | | | 1,337.5 | | | 421.3 | | | | | | | |
| | |
|
| |
|
| |
|
| | | | | | |
Other unallocated revenues—Continuing operations | | | | | | | | | | | | | | 75.9 | |
Other unallocated revenues—Discontinuing operations—Gold | | | | | | | | | | | | | | 78.6 | |
Interest received/receivable—Continuing operations | | | | | | | | | | | | | | 27.6 | |
| | | | | | | | | | | | | | |
|
|
Total Revenues | | | | | | | | | | | | | | 2,816.1 | |
| | | | | | | | | | | | | | |
|
|
Result | | | | | | | | | | | | | | | |
Earnings before allocation of hedging result | | 95.5 | | | 279.5 | | | (45.1 | ) | | — | | | 329.9 | |
Unallocated profits2 | | — | | | — | | | — | | | — | | | 11.4 | |
Hedging | | (41.7 | ) | | (58.0 | ) | | (12.3 | ) | | — | | | (112.0 | ) |
| | |
|
| |
|
| |
|
| | | | | | |
Segment result | | 53.8 | | | 221.5 | | | (57.4 | ) | | | | | | |
| | |
|
| |
|
| |
|
| | | | |
|
|
Earnings from operations | | | | | | | | | | | | | | 229.3 | |
Unallocated corporate expenses: | | | | | | | | | | | | | | | |
New business | | | | | | | | | | | | | | (36.5 | ) |
Regional exploration | | | | | | | | | | | | | | (21.5 | ) |
Corporate (including demerger costs) | | | | | | | | | | | | | | (132.0 | ) |
Finance and other costs | | | | | | | | | | | | | | (25.2 | ) |
Net borrowing costs | | | | | | | | | | | | | | (48.7 | ) |
| | | | | | | | | | | | | | |
|
|
Loss before income tax expense—Continuing operations | | | | | | | | | | | | | | (34.6 | ) |
Profit before income tax expense—Discontinuing operations—Gold | | | | | | | | | | | | | | 36.6 | |
Loss before income tax expense—Discontinuing operations—Talc | | | | | | | | | | | | | | (0.2 | ) |
| | | | | | | | | | | | | | |
|
|
| | | | | | | | | | | | | | | 1.8 | |
Income tax credit—Continuing operations | | | | | | | | | | | | | | 19.9 | |
Income tax credit—Discontinuing operations—Gold | | | | | | | | | | | | | | 1.3 | |
| | | | | | | | | | | | | | |
|
|
Net profit after tax | | | | | | | | | | | | | | 23.0 | |
| | | | | | | | | | | | | | |
|
|
F-26
WMC RESOURCES LTD AND CONTROLLED ENTITIES
NOTES TO THE CONSOLIDATED FINANCIAL STATEMENTS—(Continued)
| 7. | | SEGMENT INFORMATION (Continued) |
| (c) | | Information for the year ended 31 December 2002 (continued) |
| (i) | | Business segments (continued) |
| 1 | | Sales revenue includes intermediate product sales. Segment revenues, expenses and results include transfers between segments. Such transfers are priced on an arm’s-length basis and are eliminated on consolidation. |
| 2 | | Unallocated profit is largely matched by costs in business segments with minimal net contribution to group earnings. |
| 3 | | Includes sales of US$ 113.3 million (A$ 208.0 million) to a significant customer |
| | | | | | | | |
| | | Copper- uranium
A$m
| | Nickel
A$m
| | Fertilizer
A$m
| | Consolidated
A$m
|
Depreciation and amortization | | 234.2 | | 209.6 | | 60.4 | | 504.2 |
Unallocated depreciation and amortization | | | | | | | | 6.8 |
| | | | | | | | |
|
Continuing operations | | | | | | | | 511.0 |
Discontinuing operations—Gold | | | | | | | | 0.7 |
Discontinuing operations—Talc | | | | | | | | — |
| | | | | | | | |
|
| | | | | | | | | 511.7 |
| | | | | | | | |
|
Other non-cash expenses | | | | | | | | |
Continuing operations | | 12.8 | | 46.5 | | 10.1 | | 69.4 |
Discontinuing operations—Gold | | | | | | | | 0.1 |
Discontinuing operations—Talc | | | | | | | | 0.1 |
| | |
| |
| |
| |
|
Assets | | | | | | | | |
Segment assets | | 4,146.2 | | 1,696.0 | | 720.6 | | 6,562.8 |
Unallocated corporate assets1 | | | | | | | | 785.3 |
| | | | | | | | |
|
Consolidated total assets | | | | | | | | 7,348.1 |
| | | | | | | | |
|
Liabilities | | | | | | | | |
Segment liabilities | | 450.0 | | 286.0 | | 75.9 | | 811.9 |
Unallocated corporate liabilities2 | | | | | | | | 2,929.6 |
| | | | | | | | |
|
Consolidated total liabilities | | | | | | | | 3,741.5 |
| | | | | | | | |
|
Acquisitions of non-current assets | | | | | | | | |
Acquisitions of non-current assets | | 216.0 | | 191.0 | | 50.2 | | 457.2 |
Unallocated corporate acquisitions | | | | | | | | 12.2 |
| | | | | | | | |
|
| | | | | | | | | 469.4 |
| | | | | | | | |
|
| 1 | | Includes deferred losses on hedging contracts of A$25.9 million. Refer Note 26. |
| 2 | | Includes deferred gains on hedging contracts of A$7.2 million. Refer Note 26. |
| (ii) | | Geographical segments |
Revenues from external customers of A$2,485.8 are attributed to Australia. Total sales represent sales to the following countries / regions: Australia 21%, Europe 30%, Japan 12%, North America 10%, Taiwan 4% and Other 23%.
WMC Resources Ltd’s assets are primarily located within Australia. Capital expenditure and depreciation is also incurred on assets primarily located in Australia.
F-27
WMC RESOURCES LTD AND CONTROLLED ENTITIES
NOTES TO THE CONSOLIDATED FINANCIAL STATEMENTS—(Continued)
| 7. | | SEGMENT INFORMATION (Continued) |
| (d) | | Information for the year ended 31 December 2001 |
| | | | | | | | | | | | | | |
| | | Copper- uranium
A$m
| | | Nickel2
A$m
| | | Fertilizer
A$m
| | | Eliminations
A$m
| | Consolidated
A$m
| |
Revenue | | | | | | | | | | | | | | |
Sales revenue1 | | 913.3 | | | 1,342.3 | | | 382.4 | | | — | | 2,638.0 | |
Inter-segment sales revenue | | — | | | — | | | — | | | — | | — | |
| | |
|
| |
|
| |
|
| |
| |
|
|
Total sales revenue from operations | | 913.3 | | | 1,342.4 | | | 382.4 | | | — | | 2,638.0 | |
Unallocated sales revenue | | | | | | | | | | | | | — | |
| | | | | | | | | | | | | |
|
|
Revenue before hedging | | | | | | | | | | | | | 2,638.0 | |
Hedging | | (102.9 | ) | | (141.5 | ) | | (29.5 | ) | | | | (273.9 | ) |
| | | | | | | | | | | | | |
|
|
Revenue from operating activities—Continuing operations | | | | | | | | | | | | | 2,364.1 | |
Revenue from operating activities— Discontinuing operations—Gold | | | | | | | | | | | | | 433.3 | |
Revenue from operating activities— Discontinuing operations—Talc | | | | | | | | | | | | | 19.6 | |
| | | | | | | | | | | | | |
|
|
| | | | | | | | | | | | | | 2,817.0 | |
Proceeds from disposal of non-current assets: | | | | | | | | | | | | | | |
Business segments | | 1.7 | | | 13.8 | | | 0.4 | | | — | | 15.9 | |
Unallocated | | — | | | — | | | — | | | — | | 33.8 | |
Insurance proceeds received/receivable | | 0.6 | | | — | | | 22.5 | | | — | | 23.1 | |
| | |
|
| |
|
| |
|
| | | | | |
Segment revenues | | 812.7 | | | 1,214.7 | | | 375.8 | | | | | | |
| | |
|
| |
|
| |
|
| | | | | |
Other unallocated revenues—Continuing operations | | | | | | | | | | | | | — | |
Other unallocated revenues—Discontinuing operations—Gold | | | | | | | | | | | | | 458.0 | |
Other unallocated revenues—Discontinuing operations—Talc | | | | | | | | | | | | | 178.2 | |
Interest received/receivable—Continuing operations | | | | | | | | | | | | | 153.5 | |
Interest received/receivable—discontinuing operations | | | | | | | | | | | | | 0.8 | |
| | | | | | | | | | | | | |
|
|
Total Revenues | | | | | | | | | | | | | 3,680.3 | |
| | | | | | | | | | | | | |
|
|
Result | | | | | | | | | | | | | | |
Earnings before allocation of hedging result | | 150.8 | | | 288.9 | | | (59.9 | ) | | — | | 379.8 | |
Unallocated loss | | | | | | | | | | | | | (1.0 | ) |
Hedging | | (102.9 | ) | | (141.5 | ) | | (29.5 | ) | | | | (273.9 | ) |
| | |
|
| |
|
| |
|
| | | |
|
|
Segment result | | 47.9 | | | 147.4 | | | (89.4 | ) | | | | | |
Earnings from operations | | | | | | | | | | | | | 104.9 | |
Unallocated corporate expenses: | | | | | | | | | | | | | | |
New business | | | | | | | | | | | | | (35.3 | ) |
Regional exploration | | | | | | | | | | | | | (63.9 | ) |
Corporate | | | | | | | | | | | | | (69.2 | ) |
Finance and other costs | | | | | | | | | | | | | (18.1 | ) |
Net borrowing costs | | | | | | | | | | | | | (141.7 | ) |
| | | | | | | | | | | | | |
|
|
Loss before income tax expense Continuing operations | | | | | | | | | | | | | (223.3 | ) |
F-28
WMC RESOURCES LTD AND CONTROLLED ENTITIES
NOTES TO THE CONSOLIDATED FINANCIAL STATEMENTS—(Continued)
| 7. | | SEGMENT INFORMATION (Continued) |
| (d) | | Information for the year ended 31 December 2001 (continued) |
| (i) | | Business segments (continued) |
| | | | | | | | | | |
| | | Copper- uranium
A$m
| | Nickel2
A$m
| | Fertilizer
A$m
| | Eliminations
A$m
| | Consolidated
A$m
|
Profit before income tax expense—Discontinuing operations—Gold | | | | | | | | | | 192.4 |
Loss before income tax expense—Discontinuing operations—Talc | | | | | | | | | | 80.6 |
| | | | | | | | | | |
|
| | | | | | | | | | | 49.7 |
Income tax credit—Continuing operations | | | | | | | | | | 65.8 |
Income tax credit—Discontinuing operations | | | | | | | | | | 10.5 |
| | | | | | | | | | |
|
Net profit after tax | | | | | | | | | | 126.0 |
| | | | | | | | | | |
|
| | | | | | | | | | |
1 Segment revenues include currency and commodity hedging, intermediate product sales, and other income. For 2001, other income comprises of A$2.5 million, A$16.5 million, and A$27.1 million for Copper/uranium, Nickel and Fertilizers respectively. Inter segment sales are on a commercial basis and are insignificant. |
2 Includes sales of US$ 137.0 million (A$267.1 million) to a significant customer. |
| | | | | | | | | | | |
| | | | | |
Depreciation and amortization | | 181.9 | | 222.5 | | 66.0 | | — | | 470.4 | |
Unallocated depreciation and amortization | | | | | | | | | | 10.5 | |
| | | | | |
Continuing operations | | | | | | | | | | 480.9 | |
Discontinuing operations—Gold | | | | | | | | | | 113.1 | |
Discontinuing operations—Talc | | | | | | | | | | 2.2 | |
| | | | | | | | | | |
|
|
| | | | | | | | | | | 596.2 | |
| | | | | | | | | | |
|
|
Other non-cash expenses | | | | | | | | | | | |
Continuing operations | | 77.5 | | 40.3 | | 19.6 | | — | | 137.4 | |
Discontinuing operations—Gold | | | | | | | | | | (7.5 | ) |
Discontinuing operations—Talc | | | | | | | | | | — | |
| | | | | | | | | | |
|
|
F-29
WMC RESOURCES LTD AND CONTROLLED ENTITIES
NOTES TO THE CONSOLIDATED FINANCIAL STATEMENTS—(Continued)
| 7. | | SEGMENT INFORMATION (Continued) |
| (d) | | Information for the year ended 31 December 2001 (continued) |
| (i) | | Business segments (continued) |
| | | | | | | | |
| | | Copper-
uranium A$m
| | Nickel A$m
| | Fertilizer A$m
| | Consolidated A$m
|
Assets | | | | | | | | |
Segment assets | | 2,811.1 | | 1,691.1 | | 1,137.3 | | 5,639.5 |
Unallocated corporate assets1 | | | | | | | | 2,478.5 |
| | | | | | | | |
|
Continuing operations | | | | | | | | 8,118.0 |
Discontinuing operations—Gold | | | | | | | | 124.9 |
| | | | | | | | |
|
Consolidated total assets | | | | | | | | 8,242.9 |
| | | | | | | | |
|
Liabilities | | | | | | | | |
Segment liabilities | | 387.6 | | 431.8 | | 78.7 | | 898.1 |
Unallocated corporate liabilities | | | | | | | | 4,054.0 |
| | | | | | | | |
|
Continuing operations | | | | | | | | 4,952.1 |
Discontinuing operations—Gold | | | | | | | | 57.0 |
Discontinuing operations—Talc | | | | | | | | 4.5 |
| | | | | | | | |
|
Consolidated total liabilities | | | | | | | | 5,013.6 |
| | | | | | | | |
|
Acquisitions of non-current assets | | | | | | | | |
Acquisitions of non-current assets | | 75.3 | | 227.1 | | 42.3 | | 344.7 |
Unallocated corporate acquisitions | | | | | | | | 9.8 |
| | | | | | | | |
|
Continuing operations | | | | | | | | 354.5 |
Discontinuing operations—Gold | | | | | | | | 99.9 |
Discontinuing operations—Talc | | | | | | | | 2.5 |
| | | | | | | | |
|
| | | | | | | | | 456.9 |
| | | | | | | | |
|
| 1 | | Includes deferred losses on hedging contracts of A$1,345.9M. |
| (ii) | | Geographical segments |
Revenues from external customers of A$2,817.0 are attributed to Australia. Total sales represent sales to the following countries/regions: Australia 29%, Europe 28%, Japan 13%, North America 13%, Taiwan 4% and Other 13%.
WMC Resources Ltd’s assets are primarily located within Australia. Capital expenditure and depreciation is also incurred on assets primarily located in Australia.
F-30
WMC RESOURCES LTD AND CONTROLLED ENTITIES
NOTES TO THE CONSOLIDATED FINANCIAL STATEMENTS—(Continued)
| 7. | | FINANCIAL REPORTING BY SEGMENT (Continued) |
| (d) | | Basis of preparation of segment information |
| (i) | | Income and total assets for each segment have been calculated after taking account of combination and inter-segment eliminations, as appropriate. |
| (ii) | | “New business” includes identification, evaluation and implementation of new opportunities. “Corporate��� includes other activities not separately identifiable, including unallocated corporate overheads. |
| (iii) | | WMC Resources Ltd allocates its expenditure on the search for and evaluation of new or additional mineral reserves over three headings—additional exploration, regional exploration and project exploration. Additional exploration is expenditure which, if successful, will define new reserves at existing operations. These reserves will usually require new facilities for extraction, although they will probably utilize existing management and infrastructure. Exploration charges for additional exploration expenditure are allocated to the appropriate business segment although such exploration is not necessarily directly related to segment production. Regional, project and evaluation exploration which cover expenditures in new areas up to the point where a decision is made either to develop to the production stage or to abandon exploration in the area, are the responsibility of other management and are disclosed in those segments. Expenditure which extends reserves at existing operations, which would probably be extracted with existing facilities, continues to be included with mine development expenditure. |
| (iv) | | The segment presentation above may differ from the disclosures in the individual financial statements of the subsidiaries which own the operations, due to certain adjustments that arise on consolidation, including, but not limited to, fair value adjustments on acquisition, financing of certain projects and the impact of intra-group transactions. |
F-31
WMC RESOURCES LTD AND CONTROLLED ENTITIES
NOTES TO THE CONSOLIDATED FINANCIAL STATEMENTS—(Continued)
8. DIVIDENDS
On 11 February 2004, the directors declared an unfranked dividend of six cents per share, payable on 15 April 2004. In accordance with Accounting Standards this dividend has not been accrued in the 2003 financial statements. The dividend (A$69 million) will be reflected in the 2004 financial statements and cash flows.
9. CURRENT ASSETS—CASH ASSETS
| | | | |
| | | 2003 A$m
| | 2002 A$m
|
Cash at bank and on hand | | 62.7 | | 66.7 |
Short term deposits (maturity of three months or less) | | 37.6 | | 23.8 |
| | |
| |
|
| | | 100.3 | | 90.5 |
| | |
| |
|
(a) Restrictions on cash
Cash totaling A$23.9 million (2002: A$16.2 million) has restrictions on use as follows:
| | - | | A$5.3 million (2002: A$5.0 million) of cash deposits are unable to be repatriated to Australia due to foreign government restrictions. |
| | - | | A$18.6 million (2002: A$11.2 million) of cash reserves are retained to satisfy regulatory requirements. |
10. CURRENT ASSETS—RECEIVABLES
| | | | | | |
Trade debtors | | 258.6 | | | 244.6 | |
Provision for doubtful debts | | (5.6 | ) | | (6.1 | ) |
| | |
|
| |
|
|
| | | 253.0 | | | 238.5 | |
| | |
|
| |
|
|
Other debtors | | 112.2 | | | 160.6 | |
Provision for doubtful debts | | (1.7 | ) | | (0.2 | ) |
| | |
|
| |
|
|
| | | 110.5 | | | 160.4 | |
| | |
|
| |
|
|
Debtors relating to hedging contracts | | 86.9 | | | 158.8 | |
| | |
|
| |
|
|
| | | 450.4 | | | 557.7 | |
| | |
|
| |
|
|
| 11. CURRENT ASSETS—OTHER FINANCIAL ASSETS | | | | | | |
| | |
Short term deposits (all A$ denominated, with maturities of over three and up to 12 months) | | 13.1 | | | 12.7 | |
| | |
|
| |
|
|
The above deposits earn interest at floating rates averaging 5.4% (2002: 7.38%). | | | | | | |
F-32
WMC RESOURCES LTD AND CONTROLLED ENTITIES
NOTES TO THE CONSOLIDATED FINANCIAL STATEMENTS—(Continued)
12. CURRENT ASSETS—INVENTORIES
| | | | | | | | |
| | | Notes
| | 2003 A$m
| | | 2002 A$m
| |
Stores at cost | | | | 79.6 | | | 68.0 | |
Provision for obsolescence | | | | — | | | (1.8 | ) |
| | | | |
|
| |
|
|
| | | | | 79.6 | | | 66.2 | |
| | | | |
|
| |
|
|
Trading stocks at cost | | | | 165.8 | | | 163.3 | |
Trading stocks at net realizable value | | | | 4.5 | | | 21.0 | |
Work in progress at cost | | | | 295.9 | | | 213.7 | |
Work in progress at net realizable value | | | | — | | | 4.6 | |
| | | | |
|
| |
|
|
| | | | | 466.2 | | | 402.6 | |
| | | | |
|
| |
|
|
| | | | | 545.8 | | | 468.8 | |
| | | | |
|
| |
|
|
Aggregate carrying amount of inventories: | | | | | | | | |
Current inventories—as above | | | | 545.8 | | | 468.8 | |
Non-current inventories | | 16 | | 71.2 | | | 74.9 | |
| | | | |
|
| |
|
|
| | | | | 617.0 | | | 543.7 | |
| | | | |
|
| |
|
|
| 13. CURRENT ASSETS—OTHER | | | | | | | | |
| | | |
Prepayments | | | | 64.3 | | | 64.9 | |
Deferred borrowing costs and premium | | | | — | | | 4.5 | |
Other | | | | 3.8 | | | 0.2 | |
| | | | |
|
| |
|
|
| | | | | 68.1 | | | 69.6 | |
| | | | |
|
| |
|
|
| 14. NON-CURRENT ASSETS—RECEIVABLES | | | | | | | | |
| | | |
Loans and debtors | | | | 0.4 | | | 3.2 | |
Debtors relating to hedging contracts | | | | 276.9 | | | 215.6 | |
| | | | |
|
| |
|
|
| | | | | 277.3 | | | 218.8 | |
| | | | |
|
| |
|
|
| 15. NON-CURRENT ASSETS—OTHER FINANCIAL ASSETS | | | | | | | | |
| | | |
Investments | | 15(a) | | 21.3 | | | 12.3 | |
| | | | |
|
| |
|
|
| | | | | 21.3 | | | 12.3 | |
| | | | |
|
| |
|
|
(a) Other investments | | | | | | | | |
Cost | | | | 21.8 | | | 14.5 | |
Provision for diminution in value of investments | | | | (0.5 | ) | | (2.2 | ) |
| | | | |
|
| |
|
|
| | | | | 21.3 | | | 12.3 | |
| | | | |
|
| |
|
|
F-33
WMC RESOURCES LTD AND CONTROLLED ENTITIES
NOTES TO THE CONSOLIDATED FINANCIAL STATEMENTS—(Continued)
16. NON-CURRENT ASSETS—INVENTORIES
| | | | | | | | |
| | | Notes
| | 2003 A$m
| | | 2002 A$m
| |
Stores | | | | 51.9 | | | 48.8 | |
Provision for obsolescence | | | | (22.0 | ) | | (15.3 | ) |
| | | | |
|
| |
|
|
| | | | | 29.9 | | | 33.5 | |
| | | | |
|
| |
|
|
Work-in-progress at cost | | | | 21.8 | | | 20.4 | |
Work-in-progress at net realizable value | | | | 19.5 | | | 21.0 | |
| | | | |
|
| |
|
|
| | | | | 41.3 | | | 41.4 | |
| | | | |
|
| |
|
|
| | | | | 71.2 | | | 74.9 | |
| | | | |
|
| |
|
|
| | | |
| 17. NON-CURRENT ASSETS—EXPLORATION AND EVALUATION | | | | | | | | |
| | | |
Carrying amount at beginning of year | | | | 152.7 | | | 29.0 | |
| | | |
Corridor Sands1 | | | | | | | | |
- Evaluation expenditure capitalized | | | | 7.3 | | | — | |
- Transferred to acquired mineral rights | | 19 | | (77.2 | ) | | — | |
- Acquisition of entities | | | | — | | | 111.1 | |
| | | |
Other evaluation expenditure | | | | — | | | 1.2 | |
Acquisition/(disposal) of entities | | | | (13.6 | ) | | 14.1 | |
Foreign currency exchange differences | | | | (0.7 | ) | | — | |
Transferred to mine properties and development | | | | — | | | (2.7 | ) |
| | | | |
|
| |
|
|
Carrying amount at end of year | | | | 68.5 | | | 152.7 | |
| | | | |
|
| |
|
|
| | | | | | |
1 In 2002, WMC Limited acquired 100% of the Corridor Sands titanium dioxide project from Southern Mining Corporation Limited. Under the Purchase and Sale Agreement, the net cost of the acquisition was paid in two tranches. The first tranche of US$62.5 million was satisfied by the issue of WMC Limited shares. On demerger, WMC Limited’s interest in Corridor Sands was transferred to WMC Resources Ltd. During 2003, upon finalization of the acquisition of Corridor Sands, the excess of purchase consideration over the fair value of other identifiable net assets acquired has been transferred from exploration & evaluation to acquired mineral rights (refer Note 19). |
F-34
WMC RESOURCES LTD AND CONTROLLED ENTITIES
NOTES TO THE CONSOLIDATED FINANCIAL STATEMENTS—(Continued)
18. NON-CURRENT ASSETS–PROPERTY, PLANT AND EQUIPMENT
| | | | | | |
| | | Notes
| | 2003 A$m
| | 2002 A$m
|
Government facilities | | 18(a) | | 31.1 | | 37.4 |
Mine properties and mine development | | 18(b) | | 787.5 | | 831.7 |
Property, land and buildings | | 18(c) | | 320.3 | | 376.4 |
Plant and equipment | | 18(d) | | 3,381.6 | | 3,090.8 |
| | | | |
| |
|
| | | | | 4,520.5 | | 4,336.3 |
| | | | |
| |
|
| (a) Government facilities | | | | | | |
Cost | | | | 57.5 | | 57.0 |
Provision for amortization | | | | (26.4) | | (19.6) |
| | | | |
| |
|
| | | | | 31.1 | | 37.4 |
| | | | |
| |
|
| (b) Mine properties and mine development | | | | | | |
Areas in which production has commenced | | | | | | |
Cost | | | | 1,965.6 | | 1,805.7 |
Provision for amortization | | | | (1,179.9) | | (979.7) |
| | | | |
| |
|
| | | | | 785.7 | | 826.0 |
| | | | |
| |
|
Areas in which production has not yet commenced | | | | | | |
Cost | | | | 15.6 | | 19.6 |
Provision for amortization | | | | (13.8) | | (13.9) |
| | | | |
| |
|
| | | | | 1.8 | | 5.7 |
| | | | |
| |
|
| | | | | 787.5 | | 831.7 |
| | | | |
| |
|
| (c) Property, land and buildings | | | | | | |
Cost (including some property on mining leases) | | | | 554.0 | | 565.9 |
Provision for depreciation | | | | (233.7) | | (189.5) |
| | | | |
| |
|
| | | | | 320.3 | | 376.4 |
| | | | |
| |
|
|
Directors are required to disclose a current value (within the last three years) of interests in land and buildings excluding mining tenements, leases and buildings thereon and other assets whose value is wholly dependent on those mining operations, held by entities within the group. The value of such interests on the basis of market value for existing use was estimated by the directors to be A$87.2 million as at 30 June 2002 compared with a net book value of A$33.2 million. As land and buildings are recorded at cost, this valuation has not been recognized in the financial statements. |
| | | |
| (d) Plant and equipment | | | | | | |
Cost | | | | 5,245.9 | | 4,789.7 |
Provision for depreciation | | | | (2,150.0) | | (1,975.5) |
| | | | |
| |
|
| | | | | 3,095.9 | | 2,814.2 |
Construction in progress—cost | | | | 285.7 | | 276.6 |
| | | | |
| |
|
| | | | | 3,381.6 | | 3,090.8 |
| | | | |
| |
|
F-35
WMC RESOURCES LTD AND CONTROLLED ENTITIES
NOTES TO THE CONSOLIDATED FINANCIAL STATEMENTS—(Continued)
18. NON-CURRENT ASSETS—PROPERTY, PLANT AND EQUIPMENT (Continued)
(e) Reconciliations
Reconciliations of the carrying amounts of each class of property, plant and equipment at the beginning and end of the current financial year are set out below.
| | | | | | | | | | | | | | | |
| | | A$m
| |
| | | Government
facilities
| | | Mine
properties
and mine
development
| | | Property,
land and
buildings
| | | Plant and
equipment
| | | Total
| |
Carrying amount at 1 January 2003 | | 37.4 | | | 831.7 | | | 376.4 | | | 3,090.8 | | | 4,336.3 | |
Additions | | 0.5 | | | 163.3 | | | 4.0 | | | 494.1 | | | 661.9 | |
Capitalised borrowing costs | | — | | | — | | | — | | | 9.1 | | | 9.1 | |
Disposals/write-offs | | — | | | — | | | (0.6 | ) | | (6.9 | ) | | (7.5 | ) |
Depreciation/amortization expense | | (1.3 | ) | | (184.8 | ) | | (21.1 | ) | | (269.9 | ) | | (477.1 | ) |
Transfers | | (5.5 | ) | | (24.0 | ) | | (38.4 | ) | | 65.7 | | | (2.2 | ) |
Capitalised depreciation | | — | | | 1.3 | | | — | | | (1.3 | ) | | — | |
| | |
|
| |
|
| |
|
| |
|
| |
|
|
Carrying amount at 31 December 2003 | | 31.1 | | | 787.5 | | | 320.3 | | | 3,381.6 | | | 4,520.5 | |
| | |
|
| |
|
| |
|
| |
|
| |
|
|
19. NON-CURRENT ASSETS—ACQUIRED MINERAL RIGHTS
| | | | | | | | |
| | | Notes
| | 2003
A$m
| | | 2002
A$m
| |
Cost | | | | 1,382.4 | | | 1,271.5 | |
Provision for amortization | | | | (27.6 | ) | | (2.2 | ) |
| | | | |
|
| |
|
|
| | | 19(a) | | 1,354.8 | | | 1,269.3 | |
| | | | |
|
| |
|
|
(a) Reconciliation
Details of the movement in carrying amounts of acquired mineral rights are set out below.
| | | | | | | | |
Carrying amount at beginning of year | | | | 1,269.3 | | | — | |
Arising upon acquisition of entities | | | | — | | | 1,271.5 | |
Amortization expense—Olympic Dam | | | | (25.4 | ) | | (2.2 | ) |
Transfer from exploration and evaluation | | | | 77.2 | | | — | |
Final payment for acquisition of Corridor Sands1 | | | | 33.7 | | | — | |
| | | | |
|
| |
|
|
Carrying amount at end of year | | | | 1,354.8 | | | 1,269.3 | |
| | | | |
|
| |
|
|
Represented by: | | | | | | | | |
- Olympic Dam - Corridor Sands | | | | 1,243.9
110.9 |
| | 1,269.3
— |
|
| | | | |
|
| |
|
|
Total | | | | 1,354.8 | | | 1,269.3 | |
| | | | |
|
| |
|
|
| 1 | | During December 2003, WMC Resources made the final contractual payment for the acquisition of Corridor Sands. The final payment was made by the issue of 6,715,123 WMC Resources Ltd shares. This amount has been treated as acquired mineral rights in accordance with WMC’s accounting policy (Note 1(r)). |
F-36
WMC RESOURCES LTD AND CONTROLLED ENTITIES
NOTES TO THE CONSOLIDATED FINANCIAL STATEMENTS—(Continued)
| | | | | | | | |
| 20. NON-CURRENT ASSETS—DEFERRED TAX ASSETS | | | | | | | | |
| | | | | 2003 A$m
| | | 2002 A$m
| |
Future income tax benefit | | | | 46.0 | | | 44.6 | |
| | | | |
|
| |
|
|
The future income tax benefit comprises: | | | | | | | | |
- Timing differences | | | | (7.4 | ) | | (110.5 | ) |
- Tax losses | | | | 53.4 | | | 155.1 | |
| | | | |
|
| |
|
|
| | | | | 46.0 | | | 44.6 | |
| | | | |
|
| |
|
|
21. NON-CURRENT ASSETS—OTHER
| | | | | | | | | |
Research and development | | 21 | (a) | | 0.6 | | | 0.3 | |
Capitalised systems upgrade | | 21 | (b) | | 0.7 | | | 6.4 | |
Deferred borrowing costs and premiums | | 21 | (c) | | 11.2 | | | 4.9 | |
Deferred losses—hedging contracts | | 26 | (b) | | — | | | 25.9 | |
Prepayments | | | | | 8.4 | | | — | |
Other | | | | | 2.0 | | | 2.4 | |
| | | | | |
|
| |
|
|
| | | | | | 22.9 | | | 39.9 | |
| | | | | |
|
| |
|
|
| (a) Research and development | | | | | | | | | |
(i) Cost brought forward | | | | | 7.0 | | | 5.9 | |
Expenditure | | | | | 0.1 | | | 0.3 | |
Write-offs | | | | | (0.5 | ) | | (0.4 | ) |
Increase through acquisition of entities | | | | | — | | | 1.0 | |
Transfer to other balance sheet accounts, sale or reclassification | | | | | 0.8 | | | 0.2 | |
| | | | | |
|
| |
|
|
Cost carried forward | | | | | 7.4 | | | 7.0 | |
| | | | | |
|
| |
|
|
(ii) Provision brought forward | | | | | (6.7 | ) | | (5.4 | ) |
Charged to profit and loss | | | | | (0.1 | ) | | (0.5 | ) |
Increase through acquisition of entities | | | | | — | | | (0.9 | ) |
Transfer to other balance sheet accounts, sale or reclassification | | | | | — | | | 0.1 | |
| | | | | |
|
| |
|
|
Provision carried forward | | | | | (6.8 | ) | | (6.7 | ) |
| | | | | |
|
| |
|
|
| | | | | | 0.6 | | | 0.3 | |
| | | | | |
|
| |
|
|
| (b) Capitalised systems upgrade | | | | | | | | | |
Cost of commercial systems software | | | | | 70.7 | | | 70.7 | |
Provision for amortization | | | | | (70.0 | ) | | (64.3 | ) |
| | | | | |
|
| |
|
|
| | | | | | 0.7 | | | 6.4 | |
| | | | | |
|
| |
|
|
| (c) Deferred borrowing costs and premiums | | | | | | | | | |
Cost | | | | | 13.4 | | | 5.0 | |
Provision for amortization | | | | | (2.2 | ) | | (0.1 | ) |
| | | | | |
|
| |
|
|
| | | | | | 11.2 | | | 4.9 | |
| | | | | |
|
| |
|
|
F-37
WMC RESOURCES LTD AND CONTROLLED ENTITIES
NOTES TO THE CONSOLIDATED FINANCIAL STATEMENTS—(Continued)
22. CURRENT LIABILITIES—PAYABLES
| | | | | | | | |
| | | Notes
| | 2003 A$m
| | | 2002 A$m
| |
Trade creditors | | | | 92.7 | | | 110.6 | |
Creditors relating to hedging contracts | | | | 76.1 | | | 300.1 | |
Other creditors | | | | 263.4 | | | 247.2 | |
| | | | |
|
| |
|
|
| | | | | 432.2 | | | 657.9 | |
| | | | |
|
| |
|
|
| | | |
| 23. CURRENT LIABILITIES—INTEREST-BEARING LIABILITIES | | | | | | | | |
| | | |
Borrowings | | 28(a) | | 212.0 | | | 1,287.6 | |
| | | | |
|
| |
|
|
| | | |
| 24. CURRENT LIABILITIES—CURRENT TAX LIABILITIES | | | | | | | | |
| | | |
Income tax | | | | 1.3 | | | 3.9 | |
| | | | |
|
| |
|
|
| | | |
| 25. CURRENT LIABILITIES—PROVISIONS | | | | | | | | |
| | | |
Employee entitlements | | | | 40.6 | | | 41.3 | |
Rehabilitation | | 25(a) | | 5.6 | | | 6.5 | |
Lease commitments | | 25(b) | | 5.7 | | | 5.7 | |
Workers compensation | | 25(c) | | 8.5 | | | 6.6 | |
Other | | 25(d) | | 7.3 | | | 5.9 | |
| | | | |
|
| |
|
|
| | | | | 67.7 | | | 66.0 | |
| | | | |
|
| |
|
|
Additional information, including reconciliations of the carrying amounts of each class of provision, except for employee entitlements, is set out below: | | | | | | | | |
| (a) Rehabilitation | | | | | | | | |
| | | |
Estimates are made of the timing and extent of the rehabilitation work to be performed. Over time, these estimates may alter, and the amount settled in any particular year differ from the initial estimates. Refer Note 1(v) for further information. | | | | | | | | |
| | | |
Carrying amount at beginning of year | | | | 6.5 | | | 3.3 | |
Increase through acquisition of entities | | | | — | | | 2.4 | |
Payments made during the year | | | | (4.5 | ) | | (4.8 | ) |
Transfers from non-current | | 30(a) | | 3.6 | | | 4.6 | |
Other adjustments | | | | — | | | 1.0 | |
| | | | |
|
| |
|
|
Carrying amount at end of year | | | | 5.6 | | | 6.5 | |
| | | | |
|
| |
|
|
| (b) Lease commitments | | | | | | | | |
| | | |
The portion of the lease commitment provision expected to be settled in the next financial year has been classified as current. | | | | | | | | |
| | | |
Carrying amount at beginning of year | | | | 5.7 | | | — | |
Provisions made during the year | | | | — | | | 5.7 | |
Transfer from non-current | | 30(b) | | 0.5 | | | — | |
Provisions released during the year | | | | (0.5 | ) | | — | |
| | | | |
|
| |
|
|
Carrying amount at end of year | | | | 5.7 | | | 5.7 | |
| | | | |
|
| |
|
|
F-38
WMC RESOURCES LTD AND CONTROLLED ENTITIES
NOTES TO THE CONSOLIDATED FINANCIAL STATEMENTS—(Continued)
25. CURRENT LIABILITIES—PROVISIONS (Continued)
| | | | | | | | |
| | | | | 2003 A$m
| | | 2002 A$m
| |
| (c) Workers compensation | | | | | | | | |
| | | |
Provision is made for claims which are expected to be settled in the next financial year. The actual timing of the settlement of the claims may extend into the following financial year. | | | | | | | | |
| | | |
Carrying amount at beginning of year | | | | 6.6 | | | 1.2 | |
Increase through acquisition of entities | | | | — | | | 5.6 | |
Provisions made during the year | | | | 3.2 | | | 0.9 | |
Payments made during the year | | | | (1.3 | ) | | (1.5 | ) |
Other adjustments | | | | — | | | 0.4 | |
| | | | |
|
| |
|
|
Carrying amount at end of year | | | | 8.5 | | | 6.6 | |
| | | | |
|
| |
|
|
| (d) Other | | | | | | | | |
| | | |
Provision is made for other individually immaterial obligations, all of which are expected to be settled within the next financial year. | | | | | | | | |
| | | |
Carrying amount at beginning of year | | | | 5.9 | | | 9.6 | |
Increase through acquisition of entities | | | | — | | | 7.5 | |
Provisions made/(released) during the year | | | | 2.6 | | | (4.1 | ) |
Payments made during the year | | | | (2.4 | ) | | (6.0 | ) |
Transfers from other balance sheet accounts | | | | 1.2 | | | (1.1 | ) |
| | | | |
|
| |
|
|
Carrying amount at end of year | | | | 7.3 | | | 5.9 | |
| | | | |
|
| |
|
|
| | | |
| 26. CURRENT LIABILITIES—OTHER | | | | | | | | |
Deferred gains | | 26(b) | | 175.1 | | | 7.2 | |
Other | | | | 9.3 | | | 9.8 | |
| | | | |
|
| |
|
|
| | | | | 184.4 | | | 17.0 | |
| | | | |
|
| |
|
|
| | | | | | |
(a) Deferred gains and losses mainly consist of realized and unrealized gains and losses arising from revaluations of foreign denominated debt and commodity and currency hedging contracts that relate to commodities to be produced and sold in future years. The deferred gains and losses will be brought to account in the year that the related production is sold. During 2003, the close out of the 2005-2008 legacy foreign exchange and commodity contracts has realized a large amount of these gains (refer Note 35(d)). Whether the unrealized deferred balances will be realized and at what amount depends upon commodity and currency price movements until the maturity of the debt or hedge contracts concerned. |
F-39
WMC RESOURCES LTD AND CONTROLLED ENTITIES
NOTES TO THE CONSOLIDATED FINANCIAL STATEMENTS—(Continued)
26. CURRENT LIABILITIES—OTHER (Continued)
| (b) | | In accordance with Accounting Standards, the balance sheet position has been calculated using current spot prices at balance date. Total deferred gains and losses in the balance sheet are set out below. |
| | | | | | | |
| | | Notes
| | 2003 A$m
| | 2002 A$m
| |
Deferred gains: | | | | | | | |
- Current (as above) | | | | 175.1 | | 7.2 | |
- Non-current | | 31 | | 684.6 | | — | |
| | | | |
| |
|
|
| | | | | 859.7 | | 7.2 | |
Deferred losses: | | | | | | | |
- Current | | | | — | | — | |
- Non-current | | 21 | | — | | (25.9 | ) |
| | | | |
| |
|
|
| | | | | — | | (25.9 | ) |
| | | | |
| |
|
|
Net deferred gains/(losses) | | 35(d) | | 859.7 | | (18.7 | ) |
| | | | |
| |
|
|
Deferred gains/(losses) are in the following currencies: | | | | | | | |
- US dollars | | | | — | | (0.8 | ) |
- Other | | | | — | | 0.2 | |
| | | | |
| |
|
|
| | | | | — | | (0.6 | ) |
| | | | |
| |
|
|
Australian dollar equivalent of US dollar items | | | | — | | (1.4 | ) |
Australian dollar equivalent of other currency items | | | | — | | 0.2 | |
Australian dollars | | | | 859.7 | | (17.5 | ) |
| | | | |
| |
|
|
| | | | | 859.7 | | (18.7 | ) |
| | | | |
| |
|
|
27. NON-CURRENT LIABILITIES—PAYABLES
| | | | | | |
Creditors relating to hedging contracts | | | | 343.8 | | 800.5 |
Other creditors | | | | 35.4 | | 49.2 |
| | | | |
| |
|
| | | | | 379.2 | | 849.7 |
| | | | |
| |
|
F-40
WMC RESOURCES LTD AND CONTROLLED ENTITIES
NOTES TO THE CONSOLIDATED FINANCIAL STATEMENTS—(Continued)
28. NON-CURRENT LIABILITIES—INTEREST- BEARING LIABILITIES
| | | | | | | |
| | | Notes
| | | 2003 A$m
| | 2002 A$m
|
Borrowings | | 28 | (a) | | 1,141.2 | | 369.9 |
| | | |
| (a) Total borrowings | | | | | | | |
Disclosed as: | | | | | | | |
Current liabilities (due in 12 months or less) | | 23 | | | 212.0 | | 1,287.6 |
Non-current liabilities (due in more than 12 months) | | | | | 1,141.2 | | 369.9 |
| | | | | |
| |
|
| | | | | | 1,353.2 | | 1,657.5 |
| | | | | |
| |
|
| (b) Description1 | | | | | | | |
Unsecured: | | | | | | | |
US$0.1 million Debentures at 7.35% due 1 December 2026 (2002: US$0.1 million) | | | | | 0.1 | | 0.2 |
US$3.6 million Debentures at 7.25% due 15 November 2013 (2002: US$4.1 million) | | | | | 4.8 | | 7.2 |
US$0.8 million Notes at 6.75% due 1 December 2006 (2002: US$0.8 million) | | | | | 1.1 | | 1.4 |
Bank Loans at floating interest rates applicable in Australia (weighted average rate of 6.95%) | | | | | 17.0 | | — |
A$50 million Syndicated Facility at 5.98% | | | | | 50.0 | | — |
Promissory Notes (Weighted average rate of 5.45%) | | | | | 145.0 | | — |
US$150 million Syndicated Facility at 1.76% | | | | | 200.3 | | — |
US$200 million Notes at 6.25% due 15 May 2033 | | | | | 267.1 | | — |
US$500 million Notes at 5.125% due 15 May 20132 | | | | | 667.8 | | — |
US$19.9 million Notes at 6.5% due 15 November 2003 | | | | | — | | 35.2 |
US$320 million bank loans at floating interest rates (weighted average rate of 2.05%) | | | | | — | | 564.8 |
A$1,048.7 million bank loans at floating interest rates applicable in Australia (weighted average rate of 5.36%)3 | | | | | — | | 1,048.7 |
| | | | | |
| |
|
| | | | | | 1,353.2 | | 1,657.5 |
| | | | | |
| |
|
1 For 2002 the value of the interest bearing liabilities reflects the fact that they were acquired by WMC Resources Ltd at their fair value on date of acquisition. 2 The fixed-rate exposure has been swapped to a fixed exposure for 2004 and 2005, followed by a floating interest rate for the remainder of the bond. Refer Note 35(b)(i). 3 A$855 million of this amount was swapped to US$480 million (book value at 31 December 2002 A$847.1 million). |
| | | | |
| (c) Currencies | | | | |
The above borrowings are due in the following currencies: | | | | |
US dollars | | 854.5 | | 824.9 |
| | |
| |
|
Australian dollar equivalent of foreign currency denominated borrowings | | 1,141.2 | | 1,455.9 |
Australian dollars | | 212.0 | | 201.6 |
| | |
| |
|
| | | 1,353.2 | | 1,657.5 |
| | |
| |
|
| (d) Exchange rates | | | | |
Exchange rates at balance date used in translations (A$/US$): | | 0.7488 | | 0.5666 |
F-41
WMC RESOURCES LTD AND CONTROLLED ENTITIES
NOTES TO THE CONSOLIDATED FINANCIAL STATEMENTS—(Continued)
28. NON-CURRENT LIABILITIES–INTEREST- BEARING LIABILITIES (Continued)
| | | | | | |
| | | 2003 A$m
| | 2002 A$m
|
| (e) Analysis of repayments | | | | | | |
Current liabilities: | | | | | | |
Within one year | | | 212.0 | | | 1,287.6 |
Non-current liabilities: | | | | | | |
Later than one year but not later than five years | | | 201.4 | | | 361.9 |
Later than five years | | | 939.8 | | | 8.0 |
| | |
|
| |
|
|
| | | | 1,141.2 | | | 369.9 |
| | |
|
| |
|
|
| | | | 1,353.2 | | | 1,657.5 |
| | |
|
| |
|
|
In May 2003, WMC Resources Ltd, via its wholly owned subsidiary WMC Finance (USA) Limited, completed a two tranche debt issue in the US Bond market. US$500 million 10-year notes and US$200 million 30-year notes were issued. The notes are guaranteed by WMC Resources Ltd and its subsidiaries, WMC (Olympic Dam Corporation) Pty Ltd and WMC Fertilizers Pty Ltd. The net proceeds from the offering were used to retire short-term debt. | | | | | | |
| | |
| (f) Financing facilities | | | | | | |
| | |
The total facilities available at balance date were as follows: | | | | | | |
| | |
Short-term loan facilities | | | 333.9 | | | 1,357.6 |
Medium-term loan facilities | | | 468.5 | | | 617.7 |
Long-term loan facilities | | | 939.8 | | | 8.0 |
| | |
|
| |
|
|
| | | | 1,742.2 | | | 1,983.3 |
| | |
|
| |
|
|
Used at balance date: | | | | | | |
Short-term loan facilities | | | 195.0 | | | 1,268.9 |
Medium-term loan facilities | | | 201.4 | | | 369.7 |
Long-term loan facilities | | | 939.8 | | | 8.0 |
| | |
|
| |
|
|
| | | | 1,336.2 | | | 1,646.6 |
| | |
|
| |
|
|
Available at balance date: | | | | | | |
Short-term loan facilities | | | 138.9 | | | 88.7 |
Medium-term loan facilities | | | 267.1 | | | 248.0 |
Long-term loan facilities | | | — | | | — |
| | |
|
| |
|
|
| | | | 406.0 | | | 336.7 |
| | |
|
| |
|
|
These facilities are structured such that they may be drawn down in a currency different to the denominated currency. | | | | | | |
| | |
At 31 December 2003, amounts had been drawn down against these facilities in both US$ and A$ (refer Note 28(b)). | | | | | | |
|
The loan facilities are denominated in currencies as follows: |
| | |
Short-term loan facilities | | | | | | |
US dollars (millions) | | US$ | 250.0 | | US$ | 769.2 |
| | |
|
| |
|
|
| | |
Medium-term loan facilities | | | | | | |
US dollars (millions) | | US$ | 350.8 | | US$ | 350.0 |
| | |
|
| |
|
|
| | |
Long-term loan facilities | | | | | | |
US dollars (millions) | | US$ | 703.7 | | US$ | 4.5 |
| | |
|
| |
|
|
F-42
WMC RESOURCES LTD AND CONTROLLED ENTITIES
NOTES TO THE CONSOLIDATED FINANCIAL STATEMENTS—(Continued)
29. NON-CURRENT LIABILITIES—DEFERRED TAX LIABILITIES
| | | | | | | | |
| | | Notes
| | 2003 A$m
| | | 2002 A$m
| |
Deferred tax liability | | 29(a) | | 382.0 | | | 377.0 | |
| | | | |
|
| |
|
|
(a) The deferred tax liability comprises: | | | | | | | | |
- Timing differences | | | | 460.7 | | | 453.4 | |
- Tax losses | | | | (78.7 | ) | | (76.4 | ) |
| | | | |
|
| |
|
|
| | | | | 382.0 | | | 377.0 | |
| | | | |
|
| |
|
|
30. NON-CURRENT LIABILITIES—PROVISIONS
| | | | | | |
Employee entitlements | | | | 14.4 | | 13.0 |
Rehabilitation | | 30(a) | | 105.9 | | 94.7 |
Lease commitment | | 30(b) | | 1.5 | | 2.0 |
| | | | |
| |
|
| | | | | 121.8 | | 109.7 |
| | | | |
| |
|
The aggregate of provisions as shown in Notes 25 and 30 are: | | | | | | |
Employee entitlements | | | | 55.0 | | 54.3 |
Rehabilitation | | | | 111.5 | | 101.2 |
Lease commitment | | | | 7.2 | | 7.7 |
|
Reconciliations of the carrying amounts of each class of provision, except for employee entitlements are set out below, further information on these classes of provisions can be found in Notes 1 and 25. |
| | | | | | | | |
| (a) Rehabilitation | | | | | | | | |
Carrying amount at beginning of year | | | | 94.7 | | | 65.4 | |
Increase through acquisition of entities | | | | — | | | 20.0 | |
Provisions made during the year | | | | 15.8 | | | 14.2 | |
Transfer to current | | 25(a) | | (3.6 | ) | | (4.6 | ) |
Other adjustments | | | | (1.0 | ) | | (0.3 | ) |
| | | | |
|
| |
|
|
Carrying amount at end of year | | | | 105.9 | | | 94.7 | |
| | | | |
|
| |
|
|
| | | | | | | |
| (b) Lease commitment | | | | | | | |
Carrying amount at beginning of year | | | | 2.0 | | | — |
Provisions made during the year | | | | — | | | 2.0 |
Transfer to current | | 25(b) | | (0.5 | ) | | — |
| | | | |
|
| |
|
Carrying amount at end of year | | | | 1.5 | | | 2.0 |
| | | | |
|
| |
|
F-43
WMC RESOURCES LTD AND CONTROLLED ENTITIES
NOTES TO THE CONSOLIDATED FINANCIAL STATEMENTS—(Continued)
31. NON-CURRENT LIABILITIES—OTHER
| | | | | | |
| | | Notes
| | 2003 A$m
| | 2002 A$m
|
Deferred gains | | 26(b) | | 684.6 | | — |
Other | | | | 4.1 | | 2.8 |
| | | | |
| |
|
| | | | | 688.7 | | 2.8 |
| | | | |
| |
|
| | | |
| 32. CONTRIBUTED EQUITY | | | | | | |
| | | |
Share capital issued and fully paid | | | | | | |
Balance brought forward | | | | 3,653.4 | | — |
Shares issued on conversion of options | | | | 60.6 | | — |
Net adjustments resulting from demerger related transactions | | | | — | | 3,653.4 |
Shares issued for final contractual payment for the acquisition of Corridor Sands | | | | 33.7 | | — |
| | | | |
| |
|
Total issued capital | | | | 3,747.7 | | 3,653.4 |
| | | | |
| |
|
Set out below for information is the number of shares issued by the company for the periods concerned.
| | | | | | | | | |
| | | Number of fully paid shares
| | Number of partly
paid shares
| |
Movements in issued shares
| | 2003
| | 2002
| | 2003
| | 2002
| |
Opening number of shares | | 1,128,351,047 | | 1,108,821,653 | | — | | 629,000 | |
Issued under Employee Share Scheme | | 15,004,775 | | 4,819,790 | | — | | — | |
Conversion of partly paid shares | | — | | 629,000 | | — | | (629,000 | ) |
Allotment for purchase of Corridor Sands | | 6,715,123 | | 14,080,604 | | — | | — | |
| | |
| |
| |
| |
|
|
Closing number of shares | | 1,150,070,945 | | 1,128,351,047 | | — | | — | |
| | |
| |
| |
| |
|
|
| (a) | | Ordinary shares entitle the holder to participate in dividends in proportion to the number of and amounts paid on the shares held. On a show of hands every holder of ordinary shares present at a meeting in person or by proxy, is entitled to one vote, and upon a poll each share is entitled to one vote. |
| (b) | | Stock-based compensation plans |
In conjunction with the demerger from WMC Limited in December 2002, WMC Resources created its Employee Share Scheme (WMC Resources ESS) which allows for the granting of stock options in WMC Resources Ltd’s common stock and a Stock Appreciation Plan (SAP).
(i) Employee share plans
In 2003, two new share plans replaced the WMC option plan for all employees (excluding senior executives). The plans provide rewards based on WMC Resources Ltd’s performance against a peer index of resource companies. Actual rewards vary to reflect individual employee performance and the performance of WMC Resources Ltd on a total shareholder return basis against the index. All rewards through this plan are directed to purchasing WMC Resources Ltd shares. Shares can only be accessed once certain time restrictions have passed, or the employee has left the company. No shares were purchased by the company during 2003. Under the plans, 1,317,425 shares were purchased at a gross cost (pre-tax) of A$6.9 million between 27 January and 2 February 2004. The amount was accrued at 31 December 2003.
F-44
WMC RESOURCES LTD AND CONTROLLED ENTITIES
NOTES TO THE CONSOLIDATED FINANCIAL STATEMENTS—(Continued)
| 32. | | CONTRIBUTED EQUITY (Continued) |
| (b) | | Employee share schemes (continued) |
| | (ii) | | Executive share plan |
Senior executives participate in the WMC Resources Ltd executive share plan which provides rewards for senior executives based on WMC Resources Ltd’s performance against a peer index of resource companies. Actual rewards vary to reflect individual executive performance and the performance of WMC Resources Ltd on a total shareholder return basis against the index. All rewards for senior executives through this plan are directed to purchasing WMC Resources Ltd shares, with each participant required to hold shares that reflect a multiple of their salary. Shares can only be accessed once the multiple has been exceeded, and then only the shares that are over the multiple (subject to certain other disposal restrictions). No shares were purchased by WMC Resources Ltd under this plan during 2003 (2002: 1,158,303 shares). Under the plan, 1,270,133 shares were purchased between 27 January and 2 February 2004 in respect of the 2003 year at a gross cost (pre-tax) of A$6.6 million (2002: A$5.0 million). The amount was accrued at 31 December 2003.
| | (iii) | | Employee option plan |
During 2003 the company decided to discontinue allotment of options under the employee option plan. The employee option plan has now been replaced by two employee share plans and an executive share plan. The options currently outstanding remain exercisable under the applicable employee option plan rules.
Permanent employees of WMC Resources Ltd and its subsidiaries who are employed by the company or a subsidiary, with the exception of certain senior executives, were eligible to participate in the Employee Option Plan and be offered options for fully paid shares. At any time the aggregate of the number of options outstanding must not exceed five per cent of the total number of issued shares in the company immediately prior to the most recent issue.
The exercise price of stock options granted is equal to the stock price when the option is granted. The options generally vest over one year and are exercisable up to 5 years from the date of grant. Restrictions exist for certain employees on the number of options that can be exercised in any year. If the request to convert the options to shares has not been made, the Company must make the call at the completion of five years from the date of issue or on termination of employment. Certain designated officers are not permitted to exercise options or buy and sell WMC Resources Ltd shares in the period between the end of company’s half or full financial year and the release of the respective results.
| | (iv) | | Stock appreciation plan |
Under the terms of the WMC Resources Stock Appreciation Plan (SAP), employees are invited to apply for the grant by WMC Resources. The employees are not required to pay any amount for the grant, but each WMC Resources SAP will have a notional allotment exercise price, equal to the weighted average sale price of WMC Resource shares on the ASX on the trading day that the invitation to apply for the WMC Resources SAP is made to the employee. Subject to certain exceptions, the WMC Resources SAP will not be able to be redeemed until after a period of 12 months from the date of allotment and will lapse on the fifth anniversary of the date of allotment. Upon redemption of a WMC Resources SAP before its expiry by the holder, the holder will be entitled to a payment equal to the difference between the closing price of WMC Resources share on the ASX on the trading day immediately before redemption, and the notional allotment price (assuming the former is higher).
| | (iv) | | Impact of demerger on plans |
Prior to the demerger from WMC Limited, employees of WMC Resources participated in the stock-based compensation plans of WMC Limited, which included stock options and stock appreciation rights granted in WMC Limited common stock. Prior to the date of the offering of WMC Resources in December 2002, WMC Limited granted approximately 11.17 million WMC Limited stock options to WMC Resources employees during 2001. The weighted-average exercise price at the grant date for WMC Limited stock options granted to WMC Resources employees during 2001 was A$9.35. At December 31, 2001, there were approximately 27.07 million WMC Limited common stock options outstanding, held by WMC Resources employees at a weighted average exercise price of A$8.18. At December 31, 2001, there were approximately 15.90 million WMC Limited common stock options exercisable, at a weighted average exercise price of A$7.36.
Additionally, prior to the demerger, WMC Limited had granted WMC Limited Stock Appreciation Rights to WMC Resources employees. After the demerger as noted below, the SAP rights were split in to Alumina Limited and WMC Resources Ltd SAPs.
F-45
WMC RESOURCES LTD AND CONTROLLED ENTITIES
NOTES TO THE CONSOLIDATED FINANCIAL STATEMENTS—(Continued)
| 32. | | CONTRIBUTED EQUITY (Continued) |
| (b) | | Stock-based compensation plans (continued) |
| | (iv) | | Impact of demerger on plans (continued) |
In conjunction with the demerger, WMC Limited and WMC Resources Ltd entered into an employee benefits agreement. This agreement covered the treatment of WMC Limited common stock options issued to WMC Limited and WMC Resources Ltd employees. According to the agreement, each WMC Limited option granted to WMC Limited and WMC Resources Ltd employees prior to December 4, 2002, that was outstanding under the WMC Limited Employee Share Scheme as of the demerger date, was adjusted. This adjustment resulted in each individual who was a holder of a WMC Limited option receiving, immediately after the demerger date, an adjusted WMC Limited option and a WMC Resources option. As part of the demerger from WMC Limited, WMC Limited option holders were granted one option for Alumina Limited and one for WMC Resources Ltd. The aggregate exercise prices of the Alumina Limited option and the WMC Resources Ltd option is equal the exercise price of the WMC Limited option prior to demerger. The Alumina Limited option and the WMC Resources Ltd option have the same lapse date as the WMC Limited option would have had if the demerger had not proceeded—being the earlier of five years after the option was issued and 30 days after the WMC Limited option holder ceases to be employed by WMC Limited Group, the WMC Resources Ltd Group or Alumina Limited Group. The exercise price of a WMC Resources Ltd option was determined by reference to the pre-demerger exercise price of the WMC Limited option (which became an Alumina option) in respect of which the WMC Resources Ltd option was granted and the volume weighted average price of WMC Resources Ltd shares and Alumina Limited shares sold on the ASX over the first five days of trading on the ASX commencing on the listing date. The Stock Appreciation Plan was treated in the same manner as the Share Scheme as detailed above.
Summary of WMC Resources Ltd Common Stock Options and Stock Appreciation Plan
During the financial year 322,800 options were issued under the 2002 option plan. A total of 15,004,775 options were exercised (total amount receivable at 31 December 2003 - A$5.8 million) and 1,612,060 options lapsed during the period.
As at 31 December 2003, the market price per ordinary share was A$5.63 and 16,207,145 options remained exercisable as follows:
| | | | | | |
Exercised in 2003
| | Outstanding as
at 31 December 2003
| | Exercise price
| | Expiry date
|
| 926,220 | | — | | $2.26 | | 21 December 2003 |
| 375,000 | | — | | $2.49 | | 21 December 2003 |
| 2,203,655 | | 1,389,945 | | $3.90 | | 20 December 2004 |
| 4,028,200 | | 1,798,500 | | $3.48 | | 18 December 2005 |
| 5,675,800 | | 4,399,900 | | $4.33 | | 30 November 2006 |
| 1,795,900 | | 8,618,800 | | $4.34 | | 23 December 2007 |
| |
| | | | |
| 15,004,775 | | 16,207,145 | | | | |
| |
| | | | |
These outstanding options represent 1.4 per cent of issued capital.
The following table is a summary of WMC Resources stock option and SAP transactions during the year:
| | | | | |
| | | Shares in Thousands
| | | Weighted - Average
Exercise Price
|
Outstanding at January 1 | | | | | |
- Options | | 32,501 | | | $4.05 |
- SAPs | | 1,945 | | | $4.09 |
Movements during the year: | | | | | |
Options | | | | | |
- Granted | | 323 | | | $4.34 |
- Exercised | | (15,005 | ) | | $3.87 |
- Canceled or forfeited | | (1,612 | ) | | $4.25 |
SAPs | | | | | |
- Exercised | | (1,077 | ) | | $3.82 |
- Lapsed | | (15 | ) | | $4.28 |
Outstanding at December 31 | | | | | |
Options | | 16,207 | | | $4.20 |
SAPs | | 853 | | | $4.27 |
F-46
WMC RESOURCES LTD AND CONTROLLED ENTITIES
NOTES TO THE CONSOLIDATED FINANCIAL STATEMENTS���(Continued)
32. CONTRIBUTED EQUITY (Continued)
| (b) | | Stock-based compensation plans (continued) |
The following table summarizes information about the WMC Resources stock options and SAPs outstanding at December 31, 2003:
| | | | | | | |
Options/SAPs outstanding
|
Exercise Prices (A$)
| | Number Outstanding at Dec. 31, 2003 (thousands)
| | Weighted - Average Remaining Contractual Life (years)
| | Weighted - Average Exercise Price (A$)
|
$3.90 | | 1,412.8 | | 0.97 | | $ | 3.90 |
$3.48 | | 1,851.2 | | 1.97 | | $ | 3.48 |
$4.33 | | 4,948.3 | | 2.92 | | $ | 4.33 |
$4.34 | | 8,847.9 | | 3.98 | | $ | 4.34 |
| | |
| |
| |
|
|
Total | | 17,060.2 | | 3.20 | | $ | 4.21 |
All options and SAPs outstanding at 31 December 2003 are exercisable.
Of the 17,060,195 options and SAPs outstanding at December 31, 2003, 4,473,080 were held by non-employees.
33. RESERVES AND RETAINED PROFITS
| | | | | | | | | |
| | | | | | 2003 A$m
| | | 2002 A$m
| |
Asset revaluation reserve | | | | | — | | | 24.5 | |
Foreign currency translation reserve | | | | | 2.5 | | | 6.2 | |
| | | | | |
|
| |
|
|
| | | | | | 2.5 | | | 30.7 | |
| | | | | |
|
| |
|
|
(a) Asset revaluation reserve | | | | | | | | | |
Balance brought forward | | | | | 24.5 | | | — | |
Net adjustments resulting from demerger related transactions | | | | | — | | | 24.5 | |
Transfer to retained earnings | | | | | (24.5 | ) | | — | |
| | | | | |
|
| |
|
|
Balance carried forward | | | | | — | | | 24.5 | |
| | | | | |
|
| |
|
|
(b) Foreign currency translation reserve | | | | | | | | | |
Balance brought forward | | | | | 6.2 | | | — | |
| | | | | |
|
| |
|
|
Transfer to retained earnings | | 33 | (c) | | (6.9 | ) | | — | |
Difference on translation of self-sustaining foreign entities | | | | | (0.7 | ) | | 3.4 | |
Revaluation of naturally hedged net monetary liabilities | | | | | 3.9 | | | 2.8 | |
| | | | | |
|
| |
|
|
Net movement | | | | | (3.7 | ) | | 6.2 | |
| | | | | |
|
| |
|
|
Balance carried forward | | | | | 2.5 | | | 6.2 | |
| | | | | |
|
| |
|
|
(c) Retained profits/(accumulated losses) | | | | | | | | | |
Accumulated losses at beginning of year | | | | | (77.5 | ) | | — | |
Net adjustments resulting from demerger related transactions | | | | | — | | | (132.6 | ) |
Net profit attributable to the members of WMC Resources Ltd | | | | | 245.6 | | | 55.1 | |
Transfer from asset revaluation reserve | | | | | 24.5 | | | — | |
Transfer from foreign currency translation reserve | | | | | 6.9 | | | — | |
| | | | | |
|
| |
|
|
Retained profits/(accumulated losses) at end of year | | | | | 199.5 | | | (77.5 | ) |
| | | | | |
|
| |
|
|
F-47
WMC RESOURCES LTD AND CONTROLLED ENTITIES
NOTES TO THE CONSOLIDATED FINANCIAL STATEMENTS—(Continued)
33. RESERVES AND RETAINED PROFITS (Continued)
| (d) | | Outside equity interest in retained profits: |
| | | | | | | |
| | | 31 Dec 2003 A$m
| | 31 Dec 2002 A$m
| | | 31 Dec 2001 A$m
|
Outside equity interests in operating profit after income tax | | — | | (0.7 | ) | | 2.2 |
Retained profits brought forward | | — | | 5.7 | | | 3.5 |
| | |
| |
|
| |
|
Total available for appropriation | | — | | 5.0 | | | 5.7 |
Dividends provided for or paid | | — | | — | | | — |
Transfer to profits attributable to members of Alumina Limited on disposal | | — | | (5.0 | ) | | — |
| | |
| |
|
| |
|
Retained profits at the end of the financial year | | — | | — | | | 5.7 |
| | |
| |
|
| |
|
| | | |
Outside equity interest comprises: | | | | | | | |
Share capital | | — | | — | | | 2.6 |
Increase in value of assets | | — | | — | | | — |
Reserves | | — | | — | | | 0.7 |
Retained profits | | — | | — | | | 5.7 |
| | |
| |
|
| |
|
| | | — | | — | | | 9.0 |
| | |
| |
|
| |
|
| | | | | | | | | | | |
| 34. NOTES TO THE STATEMENTS OF CASH FLOWS | | | | | | | | | | | |
| | | | |
(a) Reconciliation of operating profit after income tax to net cash provided by operating activities: | | | | | | | | | | | |
| | | | |
Net income before minority interests | | | | 245.6 | | | 22.3 | | | 128.2 | |
Depreciation and amortization | | 3 | | 508.3 | | | 511.7 | | | 596.2 | |
Borrowing costs amortization | | | | — | | | — | | | (5.4 | ) |
Research and development written off | | | | 0.5 | | | 0.6 | | | 0.4 | |
(Profit)/loss on disposal of non-current assets | | | | (12.6 | ) | | (40.3 | ) | | (275.1 | ) |
Provision for diminution in investments and loans | | | | 2.0 | | | (0.6 | ) | | 0.2 | |
Demerger costs | | | | — | | | 21.7 | | | — | |
Unrealized exchange losses/(gains) | | | | 0.5 | | | (4.1 | ) | | 0.6 | |
Interest capitalized | | | | 9.1 | | | 3.5 | | | — | |
Write down in value of inventory | | 3 | | 16.5 | | | 3.3 | | | 7.7 | |
Change in assets and liabilities adjusted for (Increase)/decrease in: | | | | | | | | | | | |
- inventories | | | | (73.3 | ) | | (51.1 | ) | | (20.8 | ) |
- receivables | | | | 48.8 | | | 200.9 | | | 278.3 | |
- deferred tax assets | | | | (1.4 | ) | | 9.3 | | | (121.9 | ) |
- other assets | | | | (92.5 | ) | | 292.3 | | | (194.5 | ) |
(Decrease)/increase in: | | | | | | | | | | | |
- accounts payable | | | | (21.8 | ) | | (548.8 | ) | | 154.7 | |
- provision for income tax payable | | | | (2.7 | ) | | (4.1 | ) | | 3.3 | |
- deferred tax liability | | | | 5.0 | | | (57.6 | ) | | 22.7 | |
- other operating provisions | | | | 13.8 | | | 4.0 | | | 14.5 | |
- other liabilities | | | | (3.3 | ) | | (4.6 | ) | | (11.4 | ) |
| | | | |
|
| |
|
| |
|
|
Net cash provided by operating activities | | | | 642.5 | | | 358.4 | | | 577.7 | |
| | | | |
|
| |
|
| |
|
|
| (b) | | Acquisition and disposal of controlled entities |
During the financial year the Company did not acquire or dispose of any material controlled entities.
| (c) | | Non-cash financing and investing activities |
In December 2003, WMC Resources Ltd made the final contractual payment for the acquisition of the Corridor Sands project from a subsidiary of Southern Mining Corporation Limited (SMC). WMC acquired Corridor Sands from SMC in December 2002. The final payment was made by the issue to the SMC subsidiary of 6,715,123 WMC Resources Ltd shares.
Proceeds of A$25 million from the sale of the St Ives and Agnew gold operations were not received as at 31 December 2001.
Details of financing facilities are set out in Note 28(f).
F-48
WMC RESOURCES LTD AND CONTROLLED ENTITIES
NOTES TO THE CONSOLIDATED FINANCIAL STATEMENTS—(Continued)
35. FINANCIAL INSTRUMENTS
The company’s revenues will vary significantly with movements in commodity prices and the A$/US$ exchange rate. In the past these risks were managed through a hedging program that provided management with increased assurance of revenue outcomes when planning future activities.
In December 1999, the price risk management policy of WMC Limited was revised to substantially reduce future hedging activity. This revised policy was adopted by WMC Resources Ltd. During 2003, WMC closed out the majority of both its currency and commodity hedge book as detailed below.
The acquisition of WMC Finance Limited by WMC Resources Ltd prior to the demerger of WMC Limited in December 2002 required the hedge book held in WMC Finance Limited to be revalued to its fair value. Subsequent to the demerger, the profit and loss for each hedge is determined by the difference between the particular hedge’s fair value and the spot price at the date of maturity. The following disclosures show both the rates at which the hedge transactions are contracted with third parties to determine the cash flow impact for each hedge, and the rate for determining the profit and loss impact.
Following the close out of the 2005 to 2008 legacy currency hedge positions and the majority of the gold hedge positions, the following hedges remain as at 31 December 2003:
| (i) | | Currency hedging contracts at 31 December 2003 |
US$300.9 million is hedged at an average rate of A$/US$0.6665 at maturities during 2004 using a combination of forward contracts and options as detailed in the table below:
| | | | | | | | | | | | | | |
Maturity
| | Forward sale of US$
| | Bought US$ put
options
| | Written US$ call
options
| | Rate for determining
Profit and Loss
|
| | Amount
US$m
| | Rate
A$/US$
| | Amount
US$m
| | Strike rate
A$/US$
| | Amount
US$m
| | Strike rate
A$/US$
| |
2004 | | 228.4 | | 0.6753 | | 72.5 | | 0.6402 | | 20.0 | | 0.6772 | | 0.5302 |
The 2005 to 2008 legacy currency hedge positions were closed out during 2003 as outlined in Note 35(d).
For comparison, the following foreign currency hedge positions were in place at 31 December 2002:
| | | | | | | | | | | | | | |
Maturity
| | Forward sale of US$
| | Bought US$ put
options
| | Written US$ call
options
| | Rate for determining
Profit and Loss
|
| | Amount
US$m
| | Rate
A$/US$
| | Amount
US$m
| | Strike rate
A$/US$
| | Amount
US$m
| | Strike rate
A$/US$
| |
2003 | | 195.6 | | 0.6821 | | 62.5 | | 0.6479 | | 62.5 | | 0.6479 | | 0.5534 |
2004 | | 228.4 | | 0.6753 | | 72.5 | | 0.6402 | | 72.5 | | 0.6402 | | 0.5448 |
2005 | | 228.3 | | 0.6887 | | 77.5 | | 0.6430 | | 77.5 | | 0.6430 | | 0.5431 |
2006 | | 155.6 | | 0.6828 | | 72.5 | | 0.6402 | | 72.5 | | 0.6402 | | 0.5429 |
2007 | | 174.6 | | 0.6729 | | 77.5 | | 0.6430 | | 77.5 | | 0.6430 | | 0.5433 |
2008 | | 178.5 | | 0.6500 | | 117.0 | | 0.5913 | | 117.0 | | 0.5913 | | 0.5405 |
F-49
WMC RESOURCES LTD AND CONTROLLED ENTITIES
NOTES TO THE CONSOLIDATED FINANCIAL STATEMENTS—(Continued)
| 35. | | FINANCIAL INSTRUMENTS (Continued) |
| (a) | | Hedging position (continued) |
| (ii) | | Commodity hedging contracts at 31 December 2003 |
44,600 ounces (2002: 615,228 ounces) of gold are hedged at an average gold price of A$573 per ounce (2002: A$621 per ounce) with maturities in 2005 using a combination of forward contracts and options as follows:
| | | | | | |
Maturity
| | Forward sale of gold
| | Rate for determining
Profit and Loss
|
| | Amount
ounces
| | Rate
A$/ounce
| | A$/ounce
|
2005 | | 44,600 | | 573 | | 622 |
As outlined in note 35(d), the majority of the gold hedge positions were closed out during 2003. Additionally during January 2004, the remaining 44,600 ounces of gold hedges were closed out resulting in a cash outflow of A$0.6 million and a deferred gain of A$1.6 million.
For comparison, the following gold hedge positions were in place at 31 December 2002:
| | | | | | |
Maturity
| | Forward sale of gold
| | Rate for determining
Profit and Loss
|
| | Amount
ounces
| | Rate
A$/ounce
| | A$/ounce
|
2003 | | 85,028 | | 547 | | 580 |
2004 | | 80,000 | | 559 | | 600 |
2005 | | 80,000 | | 579 | | 620 |
2006 | | 78,300 | | 618 | | 644 |
2007 | | 80,160 | | 641 | | 668 |
2008 to 2010 | | 211,740 | | 684 | | 717 |
As these contracts are entered into for the purpose of hedging future production, any realized and unrealized gains and losses on the contracts, together with the cost of the contracts, are deferred until the underlying production occurs.
WMC Resources Ltd is exposed to interest rate risk on its outstanding interest bearing liabilities and investments. Interest rate swaps and cross currency swaps allow the group to manage its interest rate risk.
| (i) | | Interest rate and cross currency swaps |
As at 31 December 2003, the group had entered into the following interest rate swaps:
| | | | | | | | | | | | |
Notional US$ Principal (m)
| | Interest Swapped
| | Interest Rate
| | | Commenced
| | Maturity
|
| | | Fixed
| | | Floating
| | | |
500 | | Fixed for Floating | | 5.125 | % | | 1.585 | % | | 15/11/2003 | | 15/05/2013 |
500 | | Floating for Fixed | | 1.735 | % | | 1.585 | % | | 15/11/2003 | | 15/11/2005 |
At 31 December 2002 the group had entered into the following cross currency swap:
| | | | | | | | | | |
A$m debt
| | US$m
equivalent
| | Interest Rate 2002
| | | Maturity
|
| | | A$ debt
| | | US$ debt
| | |
427.5 | | 240.0 | | 5.56 | % | | 2.146 | % | | 10/01/2003 |
427.5 | | 240.0 | | 5.56 | % | | 2.151 | % | | 10/01/2003 |
| (ii) | | Forward rate agreements |
As at 31 December 2002, WMC Resources Ltd had entered into a forward interest rate agreement against the 10-year US Treasury rate. US$500 million of cover was obtained, at an interest rate of 4.4225 per cent, expiring in 2003. These positions matured in 2003.
F-50
WMC RESOURCES LTD AND CONTROLLED ENTITIES
NOTES TO THE CONSOLIDATED FINANCIAL STATEMENTS—(Continued)
| 35. | | FINANCIAL INSTRUMENTS (Continued) |
| (b) | | Interest rate risk (continued) |
As at 31 December 2002, WMC Resources Ltd had entered into US$100 million of interest rate caps at six per cent. These positions were closed out in 2003.
| (iv) | | Interest rate risk exposure |
WMC Resources Ltd’s exposure to interest rate risk and the effective weighted interest rate for classes of financial assets and liabilities is set out below:
| | | | | | | | | | | | | | | | |
| | | Fixed interest maturing in:
|
| | | Floating
interest
rate
| | | Less
than 1
year
| | | 1 - 5
years
| | | More
than 5
years
| | | Non- interest
bearing
| | Total
|
| | | A$m |
As at 31 December 2003 | | | | | | | | | | | | | | | | |
| | | | | | |
Financial assets | | | | | | | | | | | | | | | | |
Cash assets | | 100.3 | | | — | | | — | | | — | | | — | | 100.3 |
Receivables | | — | | | — | | | — | | | — | | | 727.7 | | 727.7 |
Other financial assets | | — | | | — | | | — | | | — | | | 34.4 | | 34.4 |
| | |
|
| |
|
| |
|
| |
|
| |
| |
|
| | | 100.3 | | | — | | | — | | | — | | | 762.1 | | 862.4 |
| | |
|
| |
|
| |
|
| |
|
| |
| |
|
Weighted average interest rate | | 3.14 | % | | — | | | — | | | — | | | — | | — |
| | | | | | |
Financial liabilities | | | | | | | | | | | | | | | | |
Payables | | — | | | — | | | — | | | — | | | 811.4 | | 811.4 |
Bank loans | | 412.3 | | | — | | | — | | | — | | | — | | 412.3 |
Yankee Bond issues—US$ | | — | | | — | | | 1.1 | | | 4.9 | | | — | | 6.0 |
Global Bond issues—US$ | | — | | | — | | | — | | | 934.9 | | | — | | 934.9 |
US$ interest rate swap: | | | | | | | | | | | | | | | | |
Fixed to floating | | 667.8 | | | — | | | — | | | (667.8 | ) | | — | | — |
US$ interest rate swap: | | | | | | | | | | | | | | | | |
Floating to fixed | | (667.8 | ) | | — | | | 667.8 | | | — | | | — | | — |
| | |
|
| |
|
| |
|
| |
|
| |
| |
|
| | | 412.3 | | | — | | | 668.9 | | | 272.0 | | | 811.4 | | 2,164.6 |
| | |
|
| |
|
| |
|
| |
|
| |
| |
|
Weighted average interest rate | | 3.79 | % | | — | | | 1.74 | % | | 6.27 | % | | — | | — |
| | |
|
| |
|
| |
|
| |
|
| |
| |
|
Net financial liabilities | | 312.0 | | | — | | | 668.9 | | | 272.0 | | | 49.3 | | 1,302.2 |
| | |
|
| |
|
| |
|
| |
|
| |
| |
|
As at 31 December 2002 | | | | | | | | | | | | | | | | |
| | | | | | |
Financial assets | | | | | | | | | | | | | | | | |
Cash assets | | 90.5 | | | — | | | — | | | — | | | — | | 90.5 |
Receivables | | — | | | — | | | — | | | — | | | 776.5 | | 776.5 |
Other financial assets | | — | | | — | | | — | | | — | | | 25.0 | | 25.0 |
Cross currency swaps | | 855.0 | | | — | | | — | | | — | | | — | | 855.0 |
| | |
|
| |
|
| |
|
| |
|
| |
| |
|
| | | 945.5 | | | — | | | — | | | — | | | 801.5 | | 1,747.0 |
| | |
|
| |
|
| |
|
| |
|
| |
| |
|
Weighted average interest rate | | 5.2 | % | | — | | | — | | | — | | | — | | — |
| | | | | | |
Financial liabilities | | | | | | | | | | | | | | | | |
Payables | | — | | | — | | | — | | | — | | | 1,507.6 | | 1,507.6 |
Bank loans | | 1,621.4 | | | — | | | — | | | — | | | — | | 1,621.4 |
Yankee Bond issues—US$ | | — | | | 35.2 | | | 1.4 | | | 7.4 | | | — | | 44.0 |
Cross currency swaps | | 847.1 | | | — | | | — | | | — | | | — | | 847.1 |
| | |
|
| |
|
| |
|
| |
|
| |
| |
|
| | | 2,468.5 | | | 35.2 | | | 1.4 | | | 7.4 | | | 1,507.6 | | 4,020.1 |
| | |
|
| |
|
| |
|
| |
|
| |
| |
|
Weighted average interest rate | | 3.8 | % | | 6.6 | % | | 6.6 | % | | 6.6 | % | | — | | — |
| | |
|
| |
|
| |
|
| |
|
| |
| |
|
Net financial liabilities | | 1,523.0 | | | 35.2 | | | 1.4 | | | 7.4 | | | 706.1 | | 2,273.1 |
| | |
|
| |
|
| |
|
| |
|
| |
| |
|
F-51
WMC RESOURCES LTD AND CONTROLLED ENTITIES
NOTES TO THE CONSOLIDATED FINANCIAL STATEMENTS—(Continued)
| 35. | | FINANCIAL INSTRUMENTS (Continued) |
| (c) | | Carrying amounts and estimated fair values of financial instruments |
The carrying amounts and estimated fair values of the group’s financial instruments, referred to in Note 35(a) and 35(b) were as follows:
| | | | | | | | | | | | | | |
| | | Notes
| | A$m
| |
| | | Carrying
amount
2003
| | | Fair
value
2003
| | | Carrying
amount
2002
| | | Fair value
2002
| |
Recognized in the statement of financial position | | | | | | | | | | | | | | |
Financial assets | | | | | | | | | | | | | | |
Cash assets | | 9 | | 100.3 | | | 100.3 | | | 90.5 | | | 90.5 | |
Current receivables | | 10 | | 450.4 | | | 455.1 | | | 557.7 | | | 554.9 | |
Current other financial assets | | 11 | | 13.1 | | | 13.1 | | | 12.7 | | | 12.7 | |
Non-current receivables | | 14 | | 277.3 | | | 149.7 | | | 218.8 | | | 211.6 | |
Non-current other financial assets | | 15 | | 21.3 | | | 21.3 | | | 12.3 | | | 12.3 | |
| | | | | |
Financial liabilities | | | | | | | | | | | | | | |
Current payables | | 22 | | 432.2 | | | 438.9 | | | 657.9 | | | 666.3 | |
Short-term interest bearing liabilities | | 23 | | 212.0 | | | 212.0 | | | 1,287.6 | | | 1,287.6 | |
Other current liabilities | | 26 | | 9.3 | | | 9.3 | | | 9.8 | | | 9.8 | |
Non-current payables | | 27 | | 379.2 | | | 252.8 | | | 849.7 | | | 822.9 | |
Long-term interest bearing liabilities | | 28 | | 1,141.2 | | | 1,092.0 | | | 369.9 | | | 370.1 | |
Other non-current liabilities | | 31 | | 4.1 | | | 4.1 | | | 2.8 | | | 2.8 | |
| | | | | |
Financial instruments | | | | | | | | | | | | | | |
Hedging contracts: | | | | | | | | | | | | | | |
- forward/swaps | | | | (74.6 | ) | | (84.0 | ) | | (567.9 | ) | | (559.4 | ) |
- options | | | | 4.2 | | | 4.2 | | | (157.4 | ) | | (157.4 | ) |
- interest rate swap | | | | — | | | 7.4 | | | — | | | — | |
| | | | |
|
| |
|
| |
|
| |
|
|
| | | | | (70.4 | ) | | (72.4 | ) | | (725.3 | ) | | (716.8 | ) |
| | | | |
|
| |
|
| |
|
| |
|
|
The following methods and assumptions were used to estimate the fair value of each class of financial instruments for which it is practicable to estimate a value:
Cash assets and current other financial assets
The carrying amount approximates fair value because of the short maturity of these instruments.
Non-current other financial assets
The investments are carried at cost or recoverable amount.
Debtors and creditors
The fair value of debtors and creditors relating to hedging contracts has been calculated on a mark-to-market basis using forward prices. Other current debtors and creditors mainly represent financial obligations incurred in exchange for goods and services provided and received by the group in the normal course of its operations, net of provisions for doubtful debts. Due to the short-term nature of these financial obligations, their carrying values are estimated to equal their fair values.
Short and long-term debt
The fair value of short-term debt is considered to approximate the carrying value due to the short maturity of the debt. The carrying value of long-term debt is considered to approximate the fair value, with the exception of the non-current portion of the Yankee Bond and Global Bond issues, the fair value of which was determined on a mark-to-market basis.
Foreign currency and commodity hedging contracts
Carrying amounts for commodity and foreign currency hedging contracts are based on the revaluation of open contracts at 31 December 2003 against spot rates at that date (or mark to market in respect to certain specific contracts). The fair value disclosed represents all contracts on a mark-to-market basis using forward rates and prices.
F-52
WMC RESOURCES LTD AND CONTROLLED ENTITIES
NOTES TO THE CONSOLIDATED FINANCIAL STATEMENTS—(Continued)
| 35. | | FINANCIAL INSTRUMENTS (Continued) |
| (d) | | Deferred hedging gains and losses |
As described in Note 1(f), gains and losses, premiums and discounts on hedging contracts and gains and losses associated with the revaluation of foreign denominated debt are deferred in the statement of financial position until the underlying transaction takes place. Whether these deferred gains and losses will be realized and at what amount depends on the commodity and currency price at the date the underlying transaction matures or when the debt is repaid. The expected recognition of the deferred gains and losses based on current valuations are shown below:
| (i) | | Deferred hedging gains and losses as at 31 December 2003 |
| | | | | | | | | | | | | | | | | | | | | |
| | | A$m
| |
Years
| | Less
than 1
Year
| | | 1 to 2
Years
| | | 2 to 3
Years
| | | 3 to 4
Years
| | | 4 to 5
Years
| | | More
than 5
Years
| | | Total
| |
Deferred gains | | 185.1 | | | 149.3 | | | 236.0 | | | 112.6 | | | 123.5 | | | 540.5 | | | 1,347.0 | |
Deferred losses | | (10.0 | ) | | (19.6 | ) | | (139.9 | ) | | (10.4 | ) | | (13.3 | ) | | (294.1 | ) | | (487.3 | ) |
| | |
|
| |
|
| |
|
| |
|
| |
|
| |
|
| |
|
|
Total | | 175.1 | | | 129.7 | | | 96.1 | | | 102.2 | | | 110.2 | | | 246.4 | | | 859.7 | |
| | |
|
| |
|
| |
|
| |
|
| |
|
| |
|
| |
|
|
Total deferred on statement of financial position (refer Note 26(b)) | | | 859.7 | |
| | | | | | | | | | | | | | | | | | | | |
|
|
Close out of 2005 - 2008 foreign currency hedge book during 2003
Included in the above, is a realized gain of A$366.9 million in relation to foreign currency hedges maturing between 2005 and 2008 which were closed-out during 2003. US$300.9 million of currency hedging contracts remain in place for 2004, refer Note 35(a). In accordance with Australian Accounting Standards, the gains will be deferred as outlined in Note 1(f). The expected timing of recognition of the deferred gains is shown below:
| | | | | | | | | | | | | | |
| | | A$m
|
Years
| | Less than
1 Year
| | 1 to 2
Years
| | 2 to 3
Years
| | 3 to 4
Years
| | 4 to 5
Years
| | More than
5 Years
| | Total
|
Net deferred gains | | — | | 114.7 | | 79.1 | | 82.6 | | 90.5 | | — | | 366.9 |
| | |
| |
| |
| |
| |
| |
| |
|
Close out of gold hedges during 2003
Included in the above net deferred gains is a gain of A$18.9 million in relation to gold hedges which were closed out during 2003. 44,600 ounces of commodity hedging contracts remain in place for 2005, refer Note 35(a). All gold hedges maturing between 2006 and 2010 were closed-out, realizing a net cash inflow of A$2.7 million and net gain of A$14.1 million, and offsetting deals for all gold hedges maturing in 2004 and 35,600 ounces of gold hedges maturing in 2005 were entered into, providing a deferred cash inflow of A$0.5 million and a net profit of A$4.8 million. In accordance with Australian Accounting Standards, the gains will be deferred as outlined in Note 1(f). The expected timing of recognition of the deferred gains is shown below:
| | | | | | | | | | | | | | |
| | | A$m
|
Years
| | Less than
1 Year
| | 1 to 2
Years
| | 2 to 3
Years
| | 3 to 4
Years
| | 4 to 5
Years
| | More than
5 Years
| | Total
|
Net deferred gains | | 3.6 | | 1.2 | | 2.5 | | 2.8 | | 2.6 | | 6.2 | | 18.9 |
| | |
| |
| |
| |
| |
| |
| |
|
| (ii) | | As at 31 December 2002 |
For comparison, the following expected timing of recognition of the deferred gains and losses based on valuations at 31 December 2002 is shown below:
| | | | | | | | | | | | | | | | | | | | | |
| | | A$m
| |
Years
| | Less than
1 Year
| | | 1 to 2
Years
| | | 2 to 3
Years
| | | 3 to 4
Years
| | | 4 to 5
Years
| | | More than
5 Years
| | | Total
| |
Deferred gains | | 15.8 | | | 4.7 | | | 5.7 | | | 8.7 | | | 10.8 | | | 17.0 | | | 62.7 | |
Deferred losses | | (8.6 | ) | | (4.5 | ) | | (8.8 | ) | | (13.5 | ) | | (15.0 | ) | | (31.0 | ) | | (81.4 | ) |
| | |
|
| |
|
| |
|
| |
|
| |
|
| |
|
| |
|
|
Total | | 7.2 | | | 0.2 | | | (3.1 | ) | | (4.8 | ) | | (4.2 | ) | | (14.0 | ) | | (18.7 | ) |
| | |
|
| |
|
| |
|
| |
|
| |
|
| |
|
| |
|
|
Total deferred on statement of financial position (refer Note 26(b)) | | | (18.7 | ) |
| | | | | | | | | | | | | | | | | | | | |
|
|
F-53
WMC RESOURCES LTD AND CONTROLLED ENTITIES
NOTES TO THE CONSOLIDATED FINANCIAL STATEMENTS—(Continued)
| 35. | | FINANCIAL INSTRUMENTS (Continued) |
| (e) | | Concentration of credit risk for derivative financial instruments |
In the event of any counter parties failing to comply with the terms of derivative instrument contracts, the potential impact on the group would be determined by the market revaluation of any open contracts held with that counter party, except on the day of delivery in which case the potential loss for forward contracts would be the full principal amount. The group calculates credit exposures as the market revaluation plus a potential exposure amount. The potential exposure amount allows for the fact that the market revaluation of the contract may increase in the future. Exposures to any one counter party are strictly controlled by WMC Resources Ltd risk management policies relating to counter party limits. A geographical breakdown of the group’s credit risk for the derivative financial instruments is set out below:
| | | | |
Location
| | US$ millions 2003
| | US$ millions 2002
|
Australia | | 253.5 | | 88.7 |
Singapore | | 11.3 | | — |
Switzerland | | 11.5 | | — |
United States of America | | 23.1 | | 23.5 |
| | |
| |
|
| | | 299.4 | | 112.2 |
| | |
| |
|
When computing the concentration of credit risk it is assumed that Australian companies that WMC Resources Ltd deals with on the basis of an overseas parent company guarantee are classified as Australian credit risk.
WMC Resources Ltd has off-setting liabilities and assets relating to a Direct Infrastructure Bond issued by a WMC Resources Ltd subsidiary and the right to acquire an Indirect Infrastructure Bond. There is a right of simultaneous set-off between these two bonds on maturity or termination. The transaction on which interest is accruing, effective from 22 September 1997 will, unless previously terminated, result in income statement recognition as interest for a period of 10 years and a corresponding reduction in the net liability of the bond. As part of the infrastructure bond transaction agreements, funds have been placed on deposit by another WMC Resources Ltd subsidiary with one of the other parties to the agreement and are being repaid, with interest, over the period of the transaction. In the event of changes to applicable laws the parties may cancel the transaction. If this happens, the liabilities and assets will be mutually settled and interest receivable will cease to accrue.
At balance date the balances of the components were:
| | | | | | |
| | | A$m
| |
| | | 2003
| | | 2002
| |
Liability for infrastructure bond | | (428.9 | ) | | (398.5 | ) |
Right to acquire Indirect infrastructure bond | | 370.9 | | | 331.7 | |
Funds on deposit | | 54.8 | | | 63.9 | |
| | |
|
| |
|
|
Net deferred revenue | | (3.2 | ) | | (2.9 | ) |
| | |
|
| |
|
|
F-54
WMC RESOURCES LTD AND CONTROLLED ENTITIES
NOTES TO THE CONSOLIDATED FINANCIAL STATEMENTS—(Continued)
36. PARTICULARS RELATING TO CONSOLIDATED ENTITIES
| | | | |
Entities consolidated
| | Notes
| | Place of incorporation
|
WMC Resources Ltd | | | | Australia |
| | |
All controlled entities are wholly owned, unless otherwise indicated | | | | |
Agnew Mining Company Pty. Ltd. | | b | | Australia |
Carson Hill Gold Mining Corporation | | c,i | | USA |
Corridor Sands Limitada | | d,i,k | | Mozambique |
Great Boulder Mines Pty. Ltd. | | b | | Australia |
Hi-Fert Distributors Pty. Ltd. | | b | | Australia |
Hi-Fert Pty. Ltd. | | a | | Australia |
JMM Sub, Inc. | | c,e,i | | USA |
Minera WMC Chile Exploration Ltda | | i,j | | Chile |
Mineracao Alfenus Limitada (owned ≈100%) | | c,f,i | | Brazil |
Mineracao Ituverava Limitada (owned ≈ 100%) | | c,i,j | | Brazil |
Mineracao Jenipapo S.A. (owned ≈100%) | | c,i | | Brazil |
Mineracao Wesminas Limitada (owned ≈ 100%) | | c,i | | Brazil |
Olympic Dam Marketing Pty. Ltd. | | b | | Australia |
PT WMC Services | | i | | Indonesia |
Q.S. Mineracoa Ltda (owned ≈ 100%) | | c,i | | Brazil |
Three Springs Talc Pty. Limited | | b | | Australia |
Wesminco Oil Pty. Ltd. | | | | Australia |
Western Exploration Pty. Ltd. | | b | | Australia |
Western Hog Ranch Company | | c,h | | USA |
Western Mining Corporation Pty. Ltd. | | b | | Australia |
Western Mining Mongolia XXK | | c,i | | Mongolia |
Western Venture Inc. | | c,h | | USA |
Westmin Talc (U.K.) | | h | | UK |
Westmin Talc Pty. Ltd. | | b | | Australia |
Westminer Insurance Pte. Ltd. | | i | | Singapore |
WMC (Argentina) Inc. | | c,i | | USA |
WMC (China) Pty. Limited | | b,i | | Australia |
WMC (Kunming) Pty. Limited | | b,i | | Australia |
WMC (Liberia) Limited | | i | | Hong Kong |
WMC (Mineral Sands) Limited | | c,i | | Jersey |
WMC (Olympic Dam Corporation) Pty. Ltd. | | a | | Australia |
WMC (Olympic Dam Operations) Pty. Ltd. | | a | | Australia |
WMC (Overseas) Pty. Limited | | b | | Australia |
WMC (Peru) Inc. | | c,i | | USA |
WMC (Uzbekistan) Ltd. | | c,i | | Jersey |
WMC (Yunnan) Pty. Limited | | b | | Australia |
WMC (Zarmitan) Ltd. | | c,i | | Jersey |
WMC Automation Pty. Ltd. | | b | | Australia |
WMC Chile S.A. | | i | | Chile |
WMC Corporate Services Inc. | | c,i | | USA |
WMC Exploration Corporation | | i | | Philippines |
WMC Exploration Inc. | | c,i | | USA |
F-55
WMC RESOURCES LTD AND CONTROLLED ENTITIES
NOTES TO THE CONSOLIDATED FINANCIAL STATEMENTS—(Continued)
| 36. | | PARTICULARS RELATING TO CONSOLIDATED ENTITIES (Continued) |
| | | | |
Entities consolidated Controlled entities (continued)
| | Notes
| | Place of incorporation
|
WMC Fertilizers Pty. Ltd. | | a | | Australia |
WMC Finance (USA) Limited | | | | Australia |
WMC Finance Limited | | | | Australia |
WMC Holdings Pty. Ltd. | | b | | Australia |
WMC Innovation Pty. Ltd. | | b | | Australia |
WMC International Limited | | c,j | | Canada |
WMC Kazakstan Ltd. | | c,i | | Jersey |
WMC Mineracao Limitada (owned ≈ 100%) | | h | | Brazil |
WMC N.C. SAS | | i,j | | New Caledonia |
WMC Participaces Limitada | | i,j | | Brazil |
WMC Petroleum (Malaysia) Snd. Bhd.(in liquidation) | | c,i | | Malaysia |
WMC Resources Exploration Pty. Ltd. | | b | | Australia |
WMC Resources International Pty. Ltd. | | a | | Australia |
WMC Resources International (RSA) Pty. Ltd. | | b | | Australia |
WMC Resources Marketing Limited | | i,l | | Canada |
WMC Resources Marketing (UK) Limited | | c,i,m | | UK |
WMC Securities Pty. Ltd. | | b | | Australia |
WMC Services Pty. Limited | | b | | Australia |
WMC Superannuation Fund Pty. Ltd. (owned 50%) | | b | | Australia |
WMC Xinjiang Mineral Industry Service Company Limited | | c,i | | China |
Yakabindie Nickel Pty. Ltd | | a | | Australia |
Yeelirrie Development Company Pty. Ltd. | | b | | Australia |
Yeelirrie Management Services Pty. Ltd. | | b | | Australia |
Yunnan Hua Ao Nickel Exploration and Mining Co. Ltd. (owned 80%) | | d,g | | China |
Yunnan Xin Ao Nickel Exploration and Mining Co. Ltd. (owned 80%) | | d,g | | China |
141 Union Company | | c,i | | USA |
This controlled entity:
| a | | has been granted relief from the necessity to prepare accounts pursuant to Australian and Securities Investment Commission (ASIC) Class Order 98/1418. The aggregate assets and liabilities of these companies, and its aggregate net profits after tax (after eliminating inter-company investments and other inter-company transactions) are set out in the table overleaf. |
| b | | is a small proprietary corporation, not required to prepare financial reports. |
| c | | has not prepared audited accounts, either it is are non-operating or audited accounts are not required in its country of incorporation. |
| d | | has prepared audited financial accounts. |
| e | | became part of the economic entity during 2002. |
| f | | ceased to be part of the economic entity during 2002. |
| g | | the investment in this entity is equity accounted due to insufficient capacity of WMC Resources Ltd to control the entity. |
| h | | translated as a self-sustaining entity. |
| i | | translated as an integrated entity. |
| j | | ceased to be part of the economic entity during 2003. |
| k | | became part of the economic entity during 2003. |
| l | | changed its name from WMC International Holdings Ltd to WMC Resources Marketing Limited on 24 September 2003. |
| m | | changed its name from WMC Nickel Sales Corporation Limited to WMC Resources Marketing (UK) Limited on 1 October 2003. |
F-56
WMC RESOURCES LTD AND CONTROLLED ENTITIES
NOTES TO THE CONSOLIDATED FINANCIAL STATEMENTS—(Continued)
| 36. | | PARTICULARS RELATING TO CONSOLIDATED ENTITIES (Continued) |
Deed of cross guarantee
Entities that are party to a deed of cross guarantee, entered into in accordance with ASIC Class Order 98/1418, are indicated above in this note. These companies, which are also referred to in the Directors’ Declaration are, with WMC Resources Ltd, all members of a Closed Group as defined in the Class Order and are parties to a deed of cross guarantee that has been lodged with and approved by ASIC. Under the deed of cross guarantee, each of these companies guarantees the debts of the other companies party to the deed of cross guarantee. A consolidated statement of financial position as at 31 December is set out below:
| | | | | | |
| | | Closed group
| |
| | | 2003 A$m
| | | 2002 A$m
| |
Statement of financial position of the closed group | | | | | | |
CURRENT ASSETS | | | | | | |
Receivables | | 499.5 | | | 521.9 | |
Inventories | | 545.7 | | | 468.6 | |
Other | | 62.9 | | | 64.8 | |
| | |
|
| |
|
|
Total current assets | | 1,108.1 | | | 1,055.3 | |
| | |
|
| |
|
|
NON-CURRENT ASSETS | | | | | | |
Other financial assets | | 0.4 | | | 3.6 | |
Group investments | | 57.3 | | | 255.8 | |
Inventories | | 71.2 | | | 74.9 | |
Exploration and evaluation | | 27.4 | | | 27.4 | |
Property, plant and equipment | | 4,520.1 | | | 4,335.0 | |
Acquired mineral rights | | 1,243.9 | | | 1,269.3 | |
Deferred tax assets | | 88.6 | | | 23.1 | |
Other | | 11.6 | | | 12.2 | |
| | |
|
| |
|
|
Total non-current assets | | 6,020.5 | | | 6,001.3 | |
| | |
|
| |
|
|
TOTAL ASSETS | | 7,128.6 | | | 7,056.6 | |
| | |
|
| |
|
|
CURRENT LIABILITIES | | | | | | |
Payables | | 334.3 | | | 338.1 | |
Interest-bearing liabilities | | 17.3 | | | 8.4 | |
Current tax liabilities | | — | | | 0.2 | |
Provisions | | 65.6 | | | 65.0 | |
Other | | 180.9 | | | 18.8 | |
| | |
|
| |
|
|
Total current liabilities | | 598.1 | | | 430.5 | |
| | |
|
| |
|
|
NON-CURRENT LIABILITIES | | | | | | |
Payables | | 35.9 | | | 46.4 | |
Group payables | | 1,970.4 | | | 2,688.1 | |
Deferred tax liabilities | | 301.4 | | | 328.3 | |
Provisions | | 121.7 | | | 109.6 | |
Other | | 518.3 | | | — | |
| | |
|
| |
|
|
Total non-current liabilities | | 2,947.7 | | | 3,172.4 | |
| | |
|
| |
|
|
TOTAL LIABILITIES | | 3,545.8 | | | 3,602.9 | |
| | |
|
| |
|
|
NET ASSETS | | 3,582.8 | | | 3,453.7 | |
| | |
|
| |
|
|
EQUITY | | | | | | |
Contributed equity | | 3,747.7 | | | 3,653.4 | |
Reserves | | — | | | 24.5 | |
Accumulated losses | | (272.5 | ) | | (347.5 | ) |
Outside equity interests in controlled entities | | 107.6 | | | 123.3 | |
| | |
|
| |
|
|
TOTAL EQUITY | | 3,582.8 | | | 3,453.7 | |
| | |
|
| |
|
|
F-57
WMC RESOURCES LTD AND CONTROLLED ENTITIES
NOTES TO THE CONSOLIDATED FINANCIAL STATEMENTS—(Continued)
| 36. | | PARTICULARS RELATING TO CONSOLIDATED ENTITIES (Continued) |
Set out below is a consolidated statement of financial performance for the closed group for the year ended 31 December 2003. Comparative information for 2002 is for the period from the date the entities became controlled entities of WMC Resources Ltd (accounting effective date of 30 November 2002), until 31 December 2002:
| | | | | | |
| | | Closed group
| |
| | | 2003 A$m
| | | 2002 A$m
| |
Statement of financial performance of the closed group | | | | | | |
Revenue from ordinary activities | | 3,068.2 | | | 365.8 | |
Cost of goods sold | | (2,082.9 | ) | | (192.5 | ) |
Selling and distribution expenses | | (79.5 | ) | | (7.2 | ) |
General and administrative expenses | | (239.8 | ) | | (38.0 | ) |
Exploration and evaluation expenses | | (19.0 | ) | | (3.5 | ) |
Borrowing costs | | (423.3 | ) | | (96.0 | ) |
Other expenses from ordinary activities | | (265.6 | ) | | (19.8 | ) |
| | |
|
| |
|
|
Profit/(loss) from ordinary activities before income tax | | (41.9 | ) | | 8.8 | |
Income tax credit/(expense) | | 76.7 | | | (5.0 | ) |
| | |
|
| |
|
|
Profit from ordinary activities after income tax | | 34.8 | | | 3.8 | |
Net loss attributable to outside equity interest | | 15.7 | | | 1.3 | |
| | |
|
| |
|
|
Net profit | | 50.5 | | | 5.1 | |
| | |
|
| |
|
|
Total changes in equity other than those resulting from transactions with owners as owners | | 50.5 | | | 5.1 | |
| | |
|
| |
|
|
Set out below is a summary of movements in consolidated accumulated losses of the closed group:
| | | | | | |
Accumulated losses at the beginning of year | | (347.5 | ) | | (352.6 | ) |
Net profit | | 50.5 | | | 5.1 | |
Transfer from asset revaluation reserve | | 24.5 | | | — | |
| | |
|
| |
|
|
Accumulated losses at the end of year | | (272.5 | ) | | (347.5 | ) |
| | |
|
| |
|
|
F-58
WMC RESOURCES LTD AND CONTROLLED ENTITIES
NOTES TO THE CONSOLIDATED FINANCIAL STATEMENTS—(Continued)
37. CONTINGENT LIABILITIES
| | | | |
| | | 2003 A$m
| | 2002 A$m
|
(a) Ascertainable, unsecured | | | | |
(i) Guarantees, insurance bonds and other liabilities including performance bonds for minimum work commitments in exploration blocks | | 61.8 | | 49.3 |
| | |
(ii) Contract disputes and other legal claims, arising out of WMC Resources Ltd’s ongoing mining and related construction. The sum disclosed reflects claims made against the group. Counter claims have been lodged by the group in respect of certain matters. The net effect of these matters is not expected to materially impact the group. | | 4.0 | | 7.1 |
| | |
(iii) As disclosed in the accounting policy Note 1(v), an assessment is made at each operation for future rehabilitation work that will be incurred as a result of current existing circumstances. A provision is accumulated for this future expenditure and is charged on a proportionate basis to production over the lesser of the life of operation or 30 years. At 31 December 2003, WMC Resources Ltd had accrued rehabilitation provisions of A$111.5 million (2002: A$101.2 million). The company estimates that, as at 31 December 2003, the total rehabilitation costs that would be incurred upon the disposal or abandonment of its mineral properties would be A$379.1 million, (2002: A$377.1 million) resulting in a contingent liability of: | | 267.6 | | 275.9 |
| | |
(iv) Yakabindie Nickel Pty Limited, a company incorporating a lease and exploration work on the Yakabindie nickel project near Mt Keith, was acquired by the purchase method on 25 January 2001. Its purchase consideration was A$40 million, A$25 million of which was paid at the time of the acquisition with the remaining A$15 million due upon gaining approval to mine the property. As the A$15 million payment is subject to gaining approval to mine the property, it has not been recognized as a present obligation (liability). | | 15.0 | | 15.0 |
| | |
| |
|
| | (b) | | Unascertainable unsecured contingent liabilities/assets |
| | (i) | | Under various joint venture production and exploration agreements. |
The majority of the WMC Resources group’s interests fall within one or more of Applications for Native Title Determination. The applications are filed for hearing in the Federal Court of Australia. The group cannot make any assessment whether existing assets or operations will be materially affected until it is determined what rights, if any, the applicants are entitled to. Recent decisions of the High Court of Australia indicate that each claim will be decided on its facts.
Consideration of the implications of Federal Court Determinations make it evident there are complex legal and factual issues potentially affecting existing and future WMC Resources Ltd interests. Accordingly, the impact of these developments cannot be determined at this time, although it is indicated that no native title rights reside in minerals where valid state legislation has placed minerals in Crown ownership.
F-59
WMC RESOURCES LTD AND CONTROLLED ENTITIES
NOTES TO THE CONSOLIDATED FINANCIAL STATEMENTS—(Continued)
38. COMMITMENTS FOR EXPENDITURE
| | | | |
| | | 2003 A$m
| | 2002 A$m
|
| | |
(a) Capital expenditure contracted for | | | | |
| | |
Contracts for purchase of assets comprising mine properties and mine development, and property, plant and equipment. | | | | |
Payments: | | | | |
Within one year | | 44.5 | | 77.7 |
| | |
| |
|
| | | 44.5 | | 77.7 |
| | |
| |
|
(b) Potential expenditure on exploration and mining titles and attached business commitments | | | | |
|
These tables set out estimates of expenditures that may be incurred for exploration, evaluation and mining activities during the life of current WMC Resources Ltd exploration and mining tenements and earning rights under farm-in and option entitlements. These sums are commitments for work expected to be beneficial to WMC Resources Ltd and include payments to vendors in which WMC Resources Ltd has earning rights. Australian mining laws generally require that certain levels of expenditure be incurred, rather than any payment made to government, to maintain tenements in good standing. Mining laws in other jurisdictions may vary. This disclosure represents maximum potential expenditure that may be reduced by seeking exemption from individual commitments or by relinquishment of tenure. |
| | |
(i) Exploration and mining titles | | | | |
| | |
Within one year | | 12.4 | | 14.7 |
Later than one year but not later than five years | | 35.3 | | 54.7 |
Later than five years | | 29.1 | | 89.0 |
| | |
| |
|
| | | 76.8 | | 158.4 |
| | |
| |
|
(ii) Business undertaking commitments | | | | |
| | |
Within one year | | 5.4 | | 5.8 |
Later than one year but not later than five years | | 16.0 | | 22.9 |
Later than five years | | 47.8 | | 41.5 |
| | |
| |
|
| | | 69.2 | | 70.2 |
| | |
| |
|
(c) Lease commitments contracted for operating leases other than mineral and exploration leases | | | | |
The company and certain of its subsidiaries lease plant, warehouse and office facilities and motor vehicles for varying periods. Operating leases that expire generally are expected to be renewed or replaced by other leases. The rental expense is disclosed in Note 3. The future minimum rental commitments are as follows: | | | | |
| | |
Lease commitments payable at balance date: | | | | |
Within one year | | 26.9 | | 18.6 |
Later than one year but not later than five years | | 65.7 | | 67.0 |
Later than five years | | 35.9 | | 62.6 |
| | |
| |
|
| | | 128.5 | | 148.2 |
| | |
| |
|
(d) Other commitments | | | | |
| | |
Commitments for payments to suppliers under long-term contracts existing at reporting date but not recognized as payable: | | | | |
Within one year | | 205.6 | | 198.1 |
Later than one year but not later than five years | | 839.4 | | 870.9 |
Later than five years | | 1,197.4 | | 1,423.2 |
| | |
| |
|
| | | 2,242.4 | | 2,492.2 |
| | |
| |
|
F-60
WMC RESOURCES LTD AND CONTROLLED ENTITIES
NOTES TO THE CONSOLIDATED FINANCIAL STATEMENTS—(Continued)
39. SUPERANNUATION BENEFITS
Employer contributions and employees’ superannuation entitlements are managed by the WMC Superannuation Plan (the Plan), an independently managed sub-plan of the Plum Superannuation Fund.
Plan membership is compulsory for all Australian resident employees and Australian expatriates, and provides lump sum benefits on retirement, permanent disability, death, resignation and retrenchment.
The Plan has three categories of membership.
The Defined Benefit Category was closed to new members effective 1 July 1994, however, the then members had, and continue to have, the option to remain in the Defined Benefit Category or to transfer to the Accumulation Category. The Defined Benefit Category provides lump sum benefits based on period of service, age and final average salary. Members in this category make a compulsory contribution of 3.4 per cent deducted from after tax salary or 4.0 per cent deducted from before tax salary.
The Accumulation Category, which all new staff members must join, commenced on 1 July 1994. This category of membership offers a minimum company contribution (subject to certain cashing out options and legislation) of 11.5 per cent of basic annual salary to each member’s account in the Plan. Members also have the option to make voluntary contributions to their account.
The Superannuation Guarantee Category is a compulsory accumulation category for all employees under hourly paid awards. Under legislation, the company is required to make minimum contributions. Effective 1 July 2002, the contribution rate is 9 per cent of ordinary time earnings. Members also have the option to make voluntary contributions to their personal account.
Entities in the group contribute to the Plan as required by the Plan rules, any relevant employee agreements or legislation.
Actuarial assessment (where appropriate) of the Plan (and previously the WMC Superannuation Fund) is made at three-yearly intervals, and the last such assessment was made as at 1 July 2001, by Mr. R R Codron, BScHons FIA FIAA ASIA. Based on the calculations made as part of that assessment, the directors of the company are of the view that as at the date of the assessment, the assets of the Plan were sufficient to satisfy all benefits that would have vested under the Plan in the event of termination of the Plan or voluntary or compulsory termination of employment of each employee.
The principal assets of the Plan are managed by external investment managers appointed by the Trustee of the Plan and are regularly monitored by the Plan’s asset consultants. External managers may use derivatives as part of normal investment and risk management practice within the terms of their appointment and in accordance with the Risk Management Statement required by legislation. Investment managers are not permitted to use derivatives to gear investments.
The following amounts are based on information from the WMC Superannuation Plan, which had a financial year ended 30 June. The most recent audited information available is at 30 June 2003.
| | | | |
| Latest Audited Fund Information: | | 30 June 2003 A$m
| | 30 June 2002 A$m
|
Present value of employees’ accrued benefits1 | | 207.2 | | 207.2 |
| Net market value of assets held by the Plan to meet future benefit payments1 | | 207.6 | | 207.6 |
| | |
| |
|
| Excess of assets held to meet future benefit payments over the present value of employees’ accrued benefits1 | | 0.4 | | 0.4 |
| | |
| |
|
| | |
| Vested benefits: | | 30 June 2003 A$m
| | 30 June 2002 A$m
|
Vested benefits2 | | 155.3 | | 163.4 |
Net assets2 | | 150.8 | | 163.6 |
| 1 | | These amounts were measured as at 1 July 2001 when the most recent actuarial valuation of the plan was conducted. |
| 2 | | Vested benefits and net assets are at 30 June 2003 and 30 June 2002 respectively. Vested benefits are benefits which are not conditional upon continued membership of the Plan (or any factor other than resignation from the Plan) and include benefits which members were entitled to receive had they terminated their Plan membership as at the reporting date. |
F-61
WMC RESOURCES LTD AND CONTROLLED ENTITIES
NOTES TO THE CONSOLIDATED FINANCIAL STATEMENTS—(Continued)
39. SUPERANNUATION BENEFITS (Continued)
| | | Updated information as at 31 December 2003: |
In accordance with Australian Accounting Standards, WMC are required to disclose updated information on the WMC Superannuation Fund at the most recent date the information is available. The following amounts are based on unaudited management reports of the WMC Superannuation Fund as at 31 December 2003.
| | |
| | | 31 December 2003 A$m
|
Employer contributions: | | |
Employer contributions to the plan during the year | | 26.4 |
| |
Vested Benefits: | | |
Vested benefits1 | | 170.4 |
Net assets1,2 | | 166.03 |
| 1 | | Vested benefits and net assets are at 31 December 2003 and are sourced from unaudited management reports. Vested benefits are benefits which are not conditional upon continued membership of the Plan (or any factor other than resignation from the Plan) and include benefits which members were entitled to receive had they terminated their Plan membership as at the reporting date. |
| 2 | | The company has a plan to make additional monthly contributions over the next 27 months to address the deficiency between net assets and vested benefits. |
| 3 | | The Australian GAAP financial statements which were signed on February 11, 2004 and lodged with the Australian Securities and Investments Commission (ASIC) disclosed a net asset position of the fund A$167.8 million. The latest available unaudited information of the plan as at 31 December 2003 indicates that the net assets of the fund are A$1.8 million lower than the previous number reported in the financial statements lodged on February 11, 2004. Since the publication of the 2003 financial statements, the company has made a one-off contribution of A$2.1 million to address the additional deficit identified. As outlined in footnote 2 above, further periodic contributions have continued to be made to address the remaining current deficiency. |
40. RELATED PARTY TRANSACTIONS
Related parties of the group fall under the following categories:
During the year, WMC Resources Ltd, in the normal course of business, entered into transactions with commonly controlled entities in the WMC Resources Ltd group, (refer Note 36 for details of controlled entities). The transactions and balances fall into the following categories:
| | (i) | | Interest revenue and expense—refer Note 3(b). |
| | (ii) | | Aggregate amounts receivable from and payable to controlled entities. |
| | (iii) | | External payments—WMC Resources Ltd also administers and settles most of the payments external to the group, including salaries on behalf of the group companies, via a shared services arrangement. These transactions are recovered from the respective entities on a cost basis, and are settled through the intercompany accounts described in (ii) above. |
| | (iv) | | Hedging transactions—WMC Resources Ltd, WMC (Olympic Dam Corporation) Pty Ltd and WMC Fertilizers Pty Ltd, hold a series of foreign exchange call options with WMC Finance Limited. |
In line with the close out of the 2005-2008 external currency hedging during 2003, the 2005-2008 options were closed out crystallizing gains as follows :
| | |
| | | A$m
|
WMC (Olympic Dam Corporation) Pty Ltd | | 203.7 |
WMC Resources Ltd | | 250.1 |
WMC Fertilizers Pty Ltd | | 64.6 |
| | |
|
| | | 518.4 |
| | |
|
These gains will be deferred and recognized over the period of the original transactions. The options for 2004 remain in place.
F-62
WMC RESOURCES LTD AND CONTROLLED ENTITIES
NOTES TO THE CONSOLIDATED FINANCIAL STATEMENTS—(Continued)
40. RELATED PARTY TRANSACTIONS (Continued)
| (a) | | Controlled entities (continued) |
Premiums paid for all options are amortized over the life of the option. 2003 amortization was as follows :
| | |
WMC (Olympic Dam Corporation) Pty Ltd | | 36.1 |
WMC Resources Ltd | | 46.3 |
WMC Fertilizers Pty Ltd | | 11.3 |
| | |
|
| | | 93.7 |
| | |
|
Premiums paid for all options are carried at amortized original cost as follows :
| | |
| | | A$m
|
WMC (Olympic Dam Corporation) Pty Ltd | | 58.8 |
WMC Resources Ltd | | 71.4 |
WMC Fertilizers Pty Ltd | | 18.5 |
| | |
|
| | | 148.7 |
| | |
|
(v) Remuneration—remuneration paid to directors and executives of other related parties—refer Note 41.
(vi) Dividends—there were no dividends paid or received by WMC Resources Ltd by or from wholly owned entities or commonly controlled entities.
(vii) Subscriptions for new ordinary shares by controlling entity—refer Note 32.
Information relating to the group’s superannuation funds is set out in Note 39.
| | |
(i) The names of each person holding the position of director of the parent entity during the financial year are: |
| |
Tommie C-E Bergman | | (deputy chairman until 2 May 2003 when Mr. Bergman was appointed Chairman) |
Andrew G Michelmore | | (appointed Chief Executive Officer on 1 January 2003) |
Ian G R Burgess AO | | (retired as a director and chairman on 2 May 2003) |
Adrienne E Clarke AC | | |
Alan K Dundas | | (appointed a director on 12 March 2003) |
Peter J Knight | | |
Graeme W McGregor AO | | (appointed a director on 1 December 2003) |
David E Meiklejohn | | |
Hugh M Morgan AC | | (retired as Chief Executive Officer and director on 1 January 2003) |
John Pizzey | | (appointed a director on 1 December 2003) |
Roger A G Vines | | (retired as a director on 2 May 2003) |
Ian E Webber AO | | |
|
(ii) Details of directors’ remuneration, superannuation and retirement payments are set out in Note 41. |
|
Apart from the details disclosed in this note, no director has entered into a material contract with the company or the group since the end of the previous financial year, and there were no material contracts involving directors’ interests existing at balance date. |
| | | | | |
| | | Thousands of A$
| |
| | | 2003
| | 2002
| |
(d) Loans to directors | | | | | |
There were no new loans paid to directors during the year. | | | | | |
| | |
Reconciliation of movement in loans to directors | | | | | |
Loans to directors at the beginning of the year | | — | | 4.9 | |
New loans granted during the year | | — | | 93.0 | |
Loan repayments received | | — | | (93.4 | ) |
Loans forgiven | | — | | (3.6 | ) |
Other movements1 | | — | | (0.9 | ) |
| | |
| |
|
|
Loans to directors at the end of the year | | — | | — | |
| | |
| |
|
|
| | | | |
1 Relates to A$951 which was owed by a director who retired during the year ended 31 December 2001, and thus ceased to be a related party for 2002. |
F-63
WMC RESOURCES LTD AND CONTROLLED ENTITIES
NOTES TO THE CONSOLIDATED FINANCIAL STATEMENTS—(Continued)
| 40. | | RELATED PARTY TRANSACTIONS (Continued) |
| (e) | | Shareholding transactions of directors |
Where a director of WMC Resources Ltd was a shareholder in WMC Resources Ltd, their transactions included:
| | – | | the purchase and/or sale of shares; and/or |
| | – | | the receipt of dividends. |
All these transactions were conducted on a commercial basis, on conditions no more favorable than those available to other shareholders.
In 2002 and 2003 certain executive directors of controlled entities were entitled to participate in the senior executive share plan and shares were allotted to them in December 2002 and January 2004 respectively. Further details are included in Note 32(b).
During 2002, certain executive directors were eligible to participate in the company’s employee option plan, and were issued with options, priced at market value (refer Note 32(b) for details of the employee option plan). In 2002 the company decided to discontinue the issue of options to senior executives of the company who were also directors of the company and/or controlled entities under the employee option plan and to establish a senior executive share plan in its place. These transactions were conducted on a commercial basis on conditions no more beneficial than those available to other eligible employees.
| | | | |
| | | Number of shares
|
| | | 2003
| | 2002
|
(i) The aggregate number of shares acquired by directors of the parent entity or their director-related entities was: - purchases by directors - acquisitions through senior executive share plan | | 50,000
— | | —
138,640 |
(ii) The aggregate number of shares acquired by the directors of the parent entity or their director-related entities as a result of the WMC Limited demerger was: | | — | | 808,317 |
(iii) The aggregate number of options allocated to directors of the parent entity or their director-related entities as a result of the WMC Limited demerger was: | | — | | 1,725,000 |
(iv) The aggregate number of shares and options disposed of by directors of the parent entity or their director-related entities was: - fully paid shares - options lapsed - options exercised and shares sold on expiry of option plan | | —
—
50,000 | | —
—
300,000 |
| | |
| |
|
| (f) | | Shareholdings of directors |
| | | | |
| Details of shares and share options held by directors of the parent entity or their director-related entities at 31 December 2003 are as follows: | | | | |
- fully paid shares | | 378,310 | | 946,957 |
- options | | 482,000 | | 1,425,000 |
|
| All other transactions relating to shares and options of WMC Resources Ltd, including the payment and receipt of dividends, were on the same basis as similar transactions with other shareholders. |
| (g) | | Other transactions of directors and director-related entities |
A number of the directors of WMC Resources Ltd are also directors of other public companies which may have transactions with the WMC Resources Ltd group. The relevant directors do not believe that they have the capacity to control or significantly influence the financial or operating policies of either those companies or the WMC Resources Ltd group in their dealings with one another. Those companies are therefore not considered to be director-related entities for the disclosure requirements of Accounting Standard AASB 1017: Related Party Disclosures.
| | (i) | | Legal/financial service fees |
A number of directors of WMC Resources Ltd’s controlled entities are associated with legal and financial service firms that have provided services to WMC Resources Ltd group companies during the financial year, on normal commercial terms and conditions. The total of those services amounts to A$1,413,459 (2002: A$1,511,590).
Entities associated with directors of WMC Resources Ltd’s controlled entities have purchased fertilizer totaling nil (2002: A$14,199) on normal commercial terms and conditions from a WMC Resources Ltd controlled entity.
F-64
WMC RESOURCES LTD AND CONTROLLED ENTITIES
NOTES TO THE CONSOLIDATED FINANCIAL STATEMENTS—(Continued)
41. REMUNERATION OF DIRECTORS
| | | | |
| | | Thousands of A$
|
| | | 2003
| | 2002
|
(a) Total income paid, payable or otherwise made available by: | | | | |
Parent entity | | | | |
- Executive directors | | 3,788 | | 13,907 |
- Non-executive directors | | 1,828 | | 1,113 |
Controlled entities | | | | |
- Executive directors | | 3,591 | | 8,266 |
- Non-executive directors | | 58 | | 66 |
| | |
| |
|
CONSOLIDATED TOTAL | | 9,265 | | 23,352 |
| | |
| |
|
|
The aggregate amounts listed in the above table include any retirement allowances. |
| | | | | | |
| | | Number of directors
| |
| | | 2003
| | | 2002
| |
(b) The number of directors of the parent entity whose income from the parent entity or related bodies corporate falls within the following bands: | | | | | | |
$ 0 - $ 9,999 | | 2 | | | — | |
$ 10,000 - $ 19,999 | | 1 | | | — | |
$ 60,000 - $ 69,999 | | — | | | 1 | |
$ 90,000 - $ 99,999 | | — | | | 4 | |
$ 110,000 - $ 119,999 | | 1 | | | — | |
$ 120,000 - $ 129,999 | | 2 | | | — | |
$ 130,000 - $ 139,999 | | 1 | | | — | |
$ 150,000 - $ 159,999 | | — | | | 1 | |
$ 220,000 - $ 229,999 | | 1 | * | | — | |
$ 250,000 - $ 259,999 | | — | | | 1 | |
$ 270,000 - $ 279,999 | | — | | | 1 | * |
$ 320,000 - $ 329,999 | | 1 | | | — | |
$ 760,000 - $ 769,999 | | 1 | * | | — | |
$1,280,000 - $1,289,999 | | 1 | | | — | |
$1,300,000 - $1,309,999 | | — | | | 1 | |
$2,500,000 - $2,509,999 | | 1 | | | — | |
$3,010,000 - $3,019,999 | | — | | | 1 | * |
$9,590,000 - $9,599,999 | | — | | | 1 | * |
| | |
|
| |
|
|
| | | 12 | | | 11 | |
| | |
|
| |
|
|
* Includes retirement allowances paid during the year. | | | | | | |
|
| Executive directors do not receive director’s fees, but are remunerated on the same basis (i.e. salary and benefits) as executive officers, as indicated in Note 42. | |
42. REMUNERATION OF EXECUTIVES
| | | | |
| | | Thousands of A$
|
| | | 2003
| | 2002
|
(a) Total income received, or due and receivable, from entities in the group and related bodies corporate by all executive officers (including directors) working within Australia whose income exceeded A$100,000 | | 22,679 | | 38,137 |
| | |
| |
|
- of which the total income received, or due and receivable, by 29 (2002:37) currently employed executive officers (including directors) whose income exceeded A$100,000 was; | | 21,126 | | 20,414 |
- of which the total income received or due and receivable by 5 (2002:13) former executive officers whose income exceeded A$100,000 was | | 1,553 | | 17,723 |
| | |
| |
|
| | | 22,679 | | 38,137 |
| | |
| |
|
(b) Following a revision of the executive management structure during 2003, Executive Officer is defined as incorporating the roles of General Manager, Executive General Manager and Chief Executive Officer. The previous management structure, for 2002 and prior years, included a broader range of roles within the definition of Executive Officer. |
F-65
WMC RESOURCES LTD AND CONTROLLED ENTITIES
NOTES TO THE CONSOLIDATED FINANCIAL STATEMENTS—(Continued)
| 42. | | REMUNERATION OF EXECUTIVES (Continued) |
| (c) | | The number of executive officers, (including directors) based in Australia, and outside of Australia, whose income from the group and related bodies corporate falls within the following bands: |
| | | | | | | | | | | | | | | | | | | |
| | | Number of executive officers
|
| | | Working within Australia
| | | Working outside of Australia
|
| | | Group Consolidation and Parent
| | | Group Consolidation and Parent
|
| | | 2003
Current
| | 2003
Former
| | | 2002
Current
| | 2002
Former
| | | 2003
Current
| | 2003
Former
| | | 2002
Current
| | 2002
Former
|
A$140,000 - A$149,999 | | — | | 1 | | | — | | — | | | — | | — | | | — | | — |
A$160,000 - A$169,999 | | — | | — | | | 1 | | — | | | — | | — | | | — | | — |
A$180,000 - A$189,999 | | — | | — | | | — | | 1 | | | — | | — | | | — | | — |
A$190,000 - A$199,999 | | — | | — | | | — | | 1 | | | — | | — | | | — | | — |
A$210,000 - A$219,999 | | — | | 1 | | | — | | — | | | — | | — | | | — | | — |
A$240,000 - A$249,999 | | — | | — | | | 1 | | 1 | | | — | | — | | | — | | — |
A$250,000 - A$259,999 | | — | | — | | | 3 | | — | | | — | | — | | | — | | — |
A$260,000 - A$269,999 | | — | | — | | | 3 | | — | | | — | | — | | | — | | — |
A$270,000 - A$279,999 | | — | | — | | | 4 | | — | | | — | | — | | | — | | — |
A$290,000 - A$299,999 | | — | | 1 | | | 1 | | 1 | | | — | | — | | | — | | — |
A$300,000 - A$309,999 | | 1 | | 1 | | | — | | — | | | — | | — | | | — | | — |
A$310,000 - A$319,999 | | — | | — | | | — | | 1 | | | — | | — | | | — | | — |
A$320,000 - A$329,999 | | — | | — | | | 1 | | — | | | — | | — | | | — | | — |
A$330,000 - A$339,999 | | — | | — | | | — | | 1 | | | — | | — | | | — | | — |
A$340,000 - A$349,999 | | — | | — | | | — | | — | | | — | | — | | | — | | 1 |
A$350,000 - A$359,999 | | 1 | | — | | | — | | — | | | — | | — | | | 1 | | — |
A$390,000 - A$399,999 | | 1 | | — | | | — | | — | | | — | | — | | | 1 | | — |
A$400,000 - A$409,999 | | — | | — | | | 1 | | 1 | | | — | | — | | | — | | — |
A$410,000 - A$419,000 | | — | | — | | | 1 | | — | | | — | | — | | | — | | — |
A$420,000 - A$429,999 | | 1 | | — | | | — | | — | | | — | | — | | | — | | — |
A$430,000 - A$439,999 | | — | | — | | | 2 | | 2 | | | — | | — | | | — | | — |
A$450,000 - A$459,999 | | 2 | | — | | | 1 | | — | | | — | | — | | | — | | — |
A$460,000 - A$469,999 | | 2 | | — | | | — | | — | | | 1 | | — | | | — | | — |
A$470,000 - A$479,999 | | 2 | | — | | | 4 | | — | | | — | | — | | | — | | — |
A$480,000 - A$489,999 | | — | | — | | | 1 | | 1 | | | — | | — | | | — | | — |
A$490,000 - A$499,999 | | 1 | | — | | | — | | — | | | — | | — | | | — | | — |
A$510,000 - A$519,999 | | 2 | | — | | | — | | — | | | — | | — | | | — | | — |
A$520,000 - A$529,999 | | 1 | | — | | | 1 | | — | | | — | | — | | | — | | — |
A$530,000 - A$539,999 | | 1 | | — | | | 1 | | — | | | — | | — | | | 1 | | — |
A$540,000 - A$549,999 | | 1 | | — | | | — | | — | | | — | | — | | | — | | — |
A$550,000 - A$559,999 | | 1 | | — | | | 1 | | — | | | — | | — | | | — | | — |
A$580,000 - A$589,999 | | 1 | | — | | | 1 | | — | | | — | | — | | | — | | — |
A$590,000 - A$599,999 | | — | | 1 | | | — | | — | | | — | | — | | | — | | — |
A$610,000 - A$619,999 | | 1 | | — | | | — | | — | | | — | | — | | | — | | — |
A$630,000 - A$639,999 | | — | | — | | | 1 | | — | | | — | | — | | | — | | — |
A$640,000 - A$649,999 | | — | | — | | | — | | — | | | 1 | | — | | | — | | — |
A$650,000 - A$659,999 | | 1 | | — | | | 1 | | — | | | — | | — | | | — | | — |
A$660,000 - A$669,999 | | — | | — | | | — | | 1 | | | — | | — | | | — | | — |
A$680,000 - A$689,999 | | 1 | | — | | | — | | — | | | — | | — | | | — | | — |
A$690,000 - A$699,999 | | — | | — | | | — | | — | | | — | | — | | | 1 | | — |
A$700,000 - A$709,999 | | — | | — | | | 1 | | — | | | — | | — | | | — | | — |
A$720,000 - A$729,999 | | — | | — | | | — | | — | | | — | | 1 | | | — | | — |
A$730,000 - A$739,999 | | — | | — | | | 1 | | — | | | — | | — | | | — | | — |
A$830,000 - A$839,999 | | — | | — | | | — | | — | | | — | | — | | | 1 | | — |
A$840,000 - A$849,999 | | 2 | | — | | | — | | — | | | — | | — | | | — | | — |
A$880,000 - A$889,000 | | 1 | | — | | | — | | — | | | — | | — | | | — | | — |
A$890,000 - A$899,000 | | — | | — | | | 1 | | — | | | — | | — | | | — | | — |
A$1,130,000 - A$1,139,999 | | 1 | | — | | | — | | — | | | — | | — | | | — | | — |
A$1,340,000 - A$1,349,999 | | 1 | | — | | | — | | — | | | — | | — | | | — | | — |
A$1,380,000 - A$1,389,999 | | — | | — | | | 1 | | — | | | — | | — | | | — | | — |
A$1,470,000 - A$1,479,999 | | — | | — | | | 1 | | — | | | — | | — | | | — | | — |
A$1,500,000 - A$1,509,999 | | 1 | | — | | | — | | — | | | — | | — | | | — | | — |
A$1,590,000 - A$1,599,999 | | 1 | | — | | | 1 | | — | | | — | | — | | | — | | — |
A$1,930,000 - A$1,939,999 | | — | | — | | | 1 | | — | | | — | | — | | | — | | — |
A$2,500,000 - A$2,509,999 | | 1 | | — | | | — | | — | | | — | | — | | | — | | — |
A$2,510,000 - A$2,519,999 | | — | | — | | | — | | — | | | 1 | | — | | | — | | — |
A$4,140,000 - A$4,149,999 | | — | | — | | | — | | 1 | | | — | | — | | | — | | — |
A$9,590,000 - A$9,599,999 | | — | | — | | | — | | 1 | | | — | | — | | | — | | — |
| | |
| |
|
| |
| |
|
| |
| |
|
| |
| |
|
| | | 29 | | 5 | | | 37 | | 13 | | | 3 | | 1 | | | 5 | | 1 |
F-66
WMC RESOURCES LTD AND CONTROLLED ENTITIES
NOTES TO THE CONSOLIDATED FINANCIAL STATEMENTS—(Continued)
43. REMUNERATION OF AUDITORS
| | | | |
| | | Thousands of A$
|
| | | 2003
| | 2002
|
(a) Remuneration for audit or review of the financial reports of the parent entity or any entity in the consolidated entity: | | | | |
Auditors of parent entity—PricewaterhouseCoopers1 | | | | |
- parent entity | | 1,403 | | 360 |
- controlled entities | | 27 | | 169 |
| | |
| |
|
| | | 1,430 | | 529 |
| | |
| |
|
Other member firms of PricewaterhouseCoopers International | | 126 | | 127 |
| | |
| |
|
| | | 1,556 | | 656 |
| | |
| |
|
| (b) Remuneration for audit-related services | | | | |
- US registration of WMC Resources Ltd | | — | | 949 |
- Annual report on US Form 20-F: | | | | |
- prior year | | 378 | | — |
- current year | | 302 | | 148 |
- Form 144A Bond Issue offering document | | 533 | | — |
| | |
| |
|
| | | 1,213 | | 1,097 |
| | |
| |
|
| (c) Remuneration for tax services | | | | |
- Australian tax services | | 460 | | 232 |
- Overseas tax services | | 487 | | 181 |
| | |
| |
|
| | | 947 | | 413 |
| | |
| |
|
| (d) Remuneration for other services | | | | |
- Independent accountants report and other due diligence services in connection with the demerger of WMC Limited | | — | | 3,315 |
- Risk management services | | 488 | | 684 |
- Other assurance services | | 133 | | — |
| | |
| |
|
| | | 621 | | 3,999 |
| | |
| |
|
Total | | 4,337 | | 6,165 |
| | |
| |
|
| 1 | | The 2002 audit fee disclosed above is not representative of the full audit cost as a large proportion of the total 2002 actual audit fee was borne by Alumina Limited prior to demerger. |
44. EVENTS SUBSEQUENT TO BALANCE DATE
There has not arisen in the interval between the end of the year and the date of this report, any item, transaction or event of a material or unusual nature which has or may significantly affect the operations of the group, the results of those operations, or the state of affairs of the group in future periods.
F-67
WMC RESOURCES LTD AND CONTROLLED ENTITIES
NOTES TO THE CONSOLIDATED FINANCIAL STATEMENTS—(Continued)
45. RECONCILIATION TO US GAAP
The accounting policies and accounting standards under which the consolidated financial statements of WMC Resources Ltd are prepared are in accordance with Australian GAAP. The reconciliations and analyses presented in this note represent the financial information which would be required if US GAAP had been applied instead of Australian GAAP.
INCOME AND COMPREHENSIVE INCOME STATEMENT—US GAAP RECONCILIATION
The following is a summary of the adjustments to net income for the years ended 31 December 2003, 2002 and 2001 that would be required if US GAAP had been applied instead of Australian GAAP.
| | | | | | | | | | | |
| | | Notes
| | Year to 31 Dec 2003 A$m
| | | Year to 31 Dec 2002 A$m
| | | Year to 31 Dec 2001 A$m
| |
| Net income attributable to members of WMC Resources Ltd as reported in accordance with Australian GAAP | | | | 245.6 | | | 23.0 | | | 126.0 | |
| | | | |
|
| |
|
| |
|
|
Adjustments required to conform with US GAAP: | | | | | | | | | | | |
- Research and development expenditure capitalized | | 45(a) | | (0.3 | ) | | 0.2 | | | 1.9 | |
- Exploration and evaluation expenditure capitalized | | 45(b) | | (7.3 | ) | | 2.5 | | | (3.7 | ) |
- Start up cost amortization written back | | 45(c) | | 1.2 | | | 6.6 | | | 7.0 | |
- Real estate profit recognition | | 45(d) | | — | | | — | | | 20.2 | |
- Royalty received from the sale of gold operations* | | 45(e) | | — | | | 13.6 | | | (13.6 | ) |
- Revenue from insurance proceeds | | 45(f) | | 19.5 | | | (58.2 | ) | | — | |
- Option payment amortization written back | | 45(g) | | — | | | 11.4 | | | 11.4 | |
- Amortization of mine development and post-production waste removal costs | | 45(i), (j) | | 8.7 | | | (4.6 | ) | | — | |
- Lease commitments | | 45(k) | | (0.5 | ) | | 7.7 | | | — | |
- Asset retirement obligations | | 45(l) | | 1.0 | | | — | | | — | |
- Fair value accounting for derivatives | | 45(m), 45(o)(v) | | 284.7 | | | 128.6 | | | (164.4 | ) |
- Pension funds | | 45(n) | | 4.9 | | | 0.5 | | | 8.2 | |
- Transfers of net assets and exchanges of shares between entities under common control: | | 45(o) | | | | | | | | | |
- Copper-uranium idle and inactive assets | | 45(o)(i) | | (10.0 | ) | | — | | | — | |
- Copper-uranium acquired mineral rights | | 45(o)(ii) | | 25.4 | | | 2.2 | | | — | |
- Fertilizer assets fair value adjustment | | 45(o)(iii) | | (12.3 | ) | | (1.1 | ) | | — | |
- Repurchase of Yankee Bonds | | 45(o)(vi) | | (1.3 | ) | | (143.7 | ) | | — | |
- Stamp duty | | 45(o)(vii) | | — | | | (24.0 | ) | | — | |
- Other fair value adjustments | | 45(o)(viii) | | — | | | (9.0 | ) | | — | |
- Adjustment to stock valuation | | 45(p) | | (5.0 | ) | | — | | | — | |
- Meliadine transaction profit * | | 45(q) | | 14.2 | | | — | | | — | |
- Provisional pricing adjustment | | 45(s) | | 18.0 | | | — | | | — | |
- Realized net exchange gains/(losses) | | 45(t) | | 6.9 | | | — | | | — | |
- Recognition of tax balances | | 45(u) | | 287.4 | | | — | | | — | |
- Income tax effect of US GAAP adjustments | | | | (129.3 | ) | | (25.7 | ) | | 44.7 | |
| | | | |
|
| |
|
| |
|
|
Total adjustments | | | | 505.9 | | | (93.0 | ) | | (88.3 | ) |
| | | | |
|
| |
|
| |
|
|
| Net income/(loss) in accordance with US GAAP before cumulative effect of change in accounting principle | | | | 751.5 | | | (70.0 | ) | | 37.7 | |
| | | | |
|
| |
|
| |
|
|
| Transitional adjustment on adoption of new policy for asset retirement obligations (post-tax) | | 45(l) | | (19.1 | ) | | — | | | — | |
| Transitional adjustment on adoption of new policy for amortization of mine development and post-production waste removal costs (post-tax) | | 45(i), (j) | | — | | | (39.5 | ) | | — | |
| | | | |
|
| |
|
| |
|
|
Net income/(loss) in accordance with US GAAP | | | | 732.4 | | | (109.5 | ) | | 37.7 | |
| | | | |
|
| |
|
| |
|
|
| * | | This reconciliation item relates to discontinued operations. |
F-68
WMC RESOURCES LTD AND CONTROLLED ENTITIES
NOTES TO THE CONSOLIDATED FINANCIAL STATEMENTS—(Continued)
| 45. | | RECONCILIATION TO US GAAP (Continued) |
| | | | | | | | | | | |
| | | Notes
| | Year to 31 Dec 2003 A$m
| | | Year to 31 Dec 2002 A$m
| | | Year to 31 Dec 2001 A$m
| |
Net income/(loss) in accordance with US GAAP is represented by: | | | | | | | | | | | |
Net income/(loss) from continuing operations before cumulative effect of change in accounting principle | | | | 730.8 | | | (121.3 | ) | | (231.5 | ) |
Prior year transitional adjustment on adoption of new policy | | | | (19.1 | ) | | (39.5 | ) | | — | |
| | | | |
|
| |
|
| |
|
|
Net income/(loss) from continuing operations | | | | 711.7 | | | (160.8 | ) | | (231.5 | ) |
Net income from discontinued operations | | | | 20.7 | | | 51.3 | | | 269.2 | |
| | | | |
|
| |
|
| |
|
|
| | | | | 732.4 | | | (109.5 | ) | | 37.7 | |
| | | | |
|
| |
|
| |
|
|
COMPREHENSIVE INCOME | | | | | | | | | | | |
Net income in accordance with US GAAP as above | | | | 732.4 | | | (109.5 | ) | | 37.7 | |
Foreign currency translation adjustments | | | | (3.7 | ) | | 3.1 | | | (14.1 | ) |
Transitional adjustment on adoption of FAS 133 | | 45(m) | | — | | | — | | | (618.7 | ) |
Unrealized gains on available for sale investments | | 45(r) | | 11.1 | | | — | | | — | |
Recognition of tax balances | | 45(u) | | 272.4 | | | — | | | — | |
FAS 133 adjustment for current year | | 45(m) | | 408.5 | | | 192.6 | | | (209.6 | ) |
| | | | |
|
| |
|
| |
|
|
Comprehensive income/(loss) in accordance with US GAAP | | | | 1,420.7 | | | 86.2 | | | (804.7 | ) |
| | | | |
|
| |
|
| |
|
|
Related tax benefit / (expense) of other comprehensive income / (loss)included in above movements: | | | | | | | | | | | |
Foreign currency translation adjustments | | | | — | | | — | | | — | |
Transitional adjustment on adoption of FAS 133 | | | | — | | | — | | | 265.0 | |
Unrealized gains on available for sale investments | | | | — | | | — | | | — | |
FAS 133 adjustment for current year | | | | (175.1 | ) | | (82.5 | ) | | 89.8 | |
| | | | |
|
| |
|
| |
|
|
| | | | | (175.1 | ) | | (82.5 | ) | | 354.8 | |
| | | | |
|
| |
|
| |
|
|
F-69
WMC RESOURCES LTD AND CONTROLLED ENTITIES
NOTES TO THE CONSOLIDATED FINANCIAL STATEMENTS—(Continued)
| 45. | | RECONCILIATION TO US GAAP (Continued) |
SHAREHOLDERS’ EQUITY—US GAAP RECONCILIATION
The following is a summary of the adjustments to shareholders’ equity as at 31 December 2003 and 2002 that would be required if US GAAP had been applied instead of Australian GAAP.
| | | | | | | | |
| | | Notes
| | As at 31 Dec 2003 A$m
| | | As at 31 Dec 2002 A$m As restated1
| |
Shareholders’ equity as reported in accordance with Australian GAAP | | | | 3,949.7 | | | 3,606.6 | |
| | | | |
|
| |
|
|
Adjustments required to conform with US GAAP: | | | | | | | | |
- Research and development expenditure capitalized | | 45(a) | | (0.6 | ) | | (0.3 | ) |
- Exploration and evaluation expenditure capitalized | | 45(b) | | (7.6 | ) | | (14.5 | ) |
- Start up costs capitalized | | 45(c) | | (25.7 | ) | | (26.9 | ) |
- Revenue from insurance proceeds | | 45(f) | | (38.7 | ) | | (58.2 | ) |
- Amortization of mine development and post-production waste removal costs | | 45(i), (j) | | (52.3 | ) | | (61.0 | ) |
- Lease commitments | | 45(k) | | 7.2 | | | 7.7 | |
- Asset retirement obligations | | 45(l) | | (26.3 | ) | | — | |
- Fair value accounting for derivatives | | 45(m) | | 12.1 | | | (943.9 | ) |
- Pension funds | | 45(n) | | (38.7 | ) | | (43.6 | ) |
- Transfers of net assets and exchanges of shares between entities under common control: | | 45(o) | | | | | | |
- Copper-uranium idle and inactive assets | | 45(o)(i) | | 17.2 | | | 27.2 | |
- Copper-uranium acquired mineral rights | | 45(o)(ii) | | (1,243.9 | ) | | (1,269.3 | ) |
- Fertilizer assets fair value adjustment | | 45(o)(iii) | | 169.7 | | | 182.0 | |
- Acquisition of hedge instruments1 | | 45(o)(v) | | 846.1 | | | 933.7 | |
- Repurchase of Yankee Bonds | | 45(o)(vi) | | 0.9 | | | 2.2 | |
- Other fair value adjustments | | 45(o)(viii) | | 12.7 | | | 12.7 | |
- Adjustment to stock valuation | | 45(p) | | (5.0 | ) | | — | |
- Valuation of listed investments | | 45(r) | | 11.1 | | | — | |
- Provisional pricing adjustment | | 45(s) | | 18.0 | | | — | |
- Recognition of tax balances | | 45(u) | | 559.9 | | | — | |
- Income tax effect of US GAAP adjustments | | | | (240.1 | ) | | 56.3 | |
| | | | |
|
| |
|
|
WMC Resources shareholders’ equity according to US GAAP | | | | 3,925.7 | | | 2,410.7 | |
| | | | |
|
| |
|
|
ROLL FORWARD ANALYSIS OF SHAREHOLDERS’ EQUITY UNDER US GAAP | | | | | | | | |
| | | |
Opening shareholders’ equity according to US GAAP | | | | 2,410.7 | | | 2,068.8 | |
Net income /(loss) in accordance with US GAAP | | | | 751.5 | | | (70.0 | ) |
Transitional adjustment on adoption of new policy for amortization of mine development and post-production waste removal costs | | 45(i), (j) | | — | | | (39.5 | ) |
Transitional adjustment on adoption of new policy for asset retirement obligations | | 45(l) | | (19.1 | ) | | — | |
Other comprehensive income | | | | 688.3 | | | 195.7 | |
Shares issued on conversion of options | | 32 | | 60.6 | | | — | |
Shares issued for final contractual payment for the acquisition of Corridor Sands | | 32 | | 33.7 | | | — | |
Net adjustments resulting from demerger related transactions (as restated)1 | | | | — | | | 243.3 | |
Deemed equity contribution | | | | — | | | 12.4 | |
| | | | |
|
| |
|
|
Closing shareholders’ equity according to US GAAP | | | | 3,925.7 | | | 2,410.7 | |
| | | | |
|
| |
|
|
| 1 | | In our previously published financial statements, the USGAAP adjustment for the acquisition of hedge instruments was incorrectly stated by A$168.2 million as at December 31, 2002. This error arose as a result of losses on Gold Business Unit (GBU) contracts which had already been taken to profit under both Australian GAAP and US GAAP as part of the GBU sale in 2001. These were correctly included in the Australian GAAP fair value calculation at demerger but incorrectly included in the USGAAP adjustment. The restated balances of total assets to A$6,478.1 million and equity to A$2,410.7 million (equity was originally reported as A$2,578.8 million before the adjustment of A$168.2 million) reflect the correction of the previously overstated position as at December 31, 2002. This error had no effect on any of income before extraordinary items, net income or related per share amounts. |
F-70
WMC RESOURCES LTD AND CONTROLLED ENTITIES
NOTES TO THE CONSOLIDATED FINANCIAL STATEMENTS—(Continued)
| 45. | | RECONCILIATION TO US GAAP (Continued) |
BALANCE SHEET- US GAAP RECONCILIATION
The following are the variations in total assets and total liabilities as at 31 December 2003 and 2002 that would be required if US GAAP had been applied instead of Australian GAAP.
| | | | | | | | |
| | | Notes
| | As at 31 Dec 2003 A$m
| | | As at 31 Dec 2002 A$m As restated1
| |
TOTAL ASSETS—US GAAP RECONCILIATION | | | | | | | | |
Total assets in accordance with Australian GAAP | | | | 7,560.2 | | | 7,348.1 | |
| | | | |
|
| |
|
|
Adjustments required to conform with US GAAP: | | | | | | | | |
- Research and development expenditure capitalized | | 45(a) | | (0.6 | ) | | (0.3 | ) |
- Exploration expenditure capitalized | | 45(b) | | (7.6 | ) | | (14.5 | ) |
- Start up costs capitalized | | 45(c) | | (25.7 | ) | | (26.9 | ) |
- Insurance proceeds | | 45(f) | | (38.7 | ) | | (58.2 | ) |
- Mine development and post-production waste removal costs | | 45(i), (j) | | (52.3 | ) | | (61.0 | ) |
- Asset retirement obligations | | 45(l) | | 36.0 | | | — | |
- Fair value accounting for derivatives | | 45(m) | | — | | | (952.4 | ) |
- Transfers of net assets and exchange of shares between entities under common control: | | 45(o) | | | | | | |
- Copper-uranium idle and inactive assets | | 45(o)(i) | | 17.2 | | | 27.2 | |
- Copper-uranium acquired mineral rights | | 45(o)(ii) | | (1,243.9 | ) | | (1,269.3 | ) |
- Fertilizer assets fair value adjustment | | 45(o)(iii) | | 169.7 | | | 182.0 | |
- Acquisition of hedge instruments1 | | 45(o)(v) | | 0.5 | | | 1,290.7 | |
- Other fair value adjustments | | 45(o)(viii) | | 12.7 | | | 12.7 | |
- Adjustment to stock valuation | | 45(p) | | (5.0 | ) | | — | |
- Valuation of listed investments | | 45(r) | | 11.1 | | | — | |
- Provisional pricing adjustment | | 45(s) | | 18.0 | | | — | |
- Recognition of tax balances | | 45(u) | | 312.4 | | | — | |
| | | | |
|
| |
|
|
Total assets in accordance with US GAAP | | | | 6,764.0 | | | 6,478.1 | |
| | | | |
|
| |
|
|
TOTAL LIABILITIES—US GAAP RECONCILIATION | | | | | | | | |
Total liabilities in accordance with Australian GAAP | | | | 3,610.5 | | | 3,741.5 | |
| | | | |
|
| |
|
|
Adjustments required to conform with US GAAP: | | | | | | | | |
- Lease commitments | | 45(k) | | (7.2 | ) | | (7.7 | ) |
- Asset retirement obligations | | 45(l) | | 62.3 | | | — | |
- Fair value accounting for derivatives | | 45(m) | | (12.1 | ) | | (8.5 | ) |
- Pension funds | | 45(n) | | 38.7 | | | 43.6 | |
- Transfers of net assets and exchange of shares between entities under common control: | | 45(o) | | | | | | |
- Acquisition of hedge instruments | | 45(o)(v) | | (845.6 | ) | | 357.0 | |
- Repurchase of Yankee Bonds | | 45(o)(vi) | | (0.9 | ) | | (2.2 | ) |
- Recognition of tax balances | | 45(u) | | (247.5 | ) | | — | |
- Income tax effect of US GAAP adjustments | | | | 240.1 | | | (56.3 | ) |
| | | | |
|
| |
|
|
Total liabilities in accordance with US GAAP | | | | 2,838.3 | | | 4,067.4 | |
| | | | |
|
| |
|
|
| 1 | | Refer footnote on page F-70 |
F-71
WMC RESOURCES LTD AND CONTROLLED ENTITIES
NOTES TO THE CONSOLIDATED FINANCIAL STATEMENTS—(Continued)
| 45. | | RECONCILIATION TO US GAAP (Continued) |
STATEMENT OF CASH FLOWS—US GAAP RECONCILIATION
The WMC Resources Ltd Consolidated Statement of Cash Flows has been prepared in accordance with Australian Accounting Standard AASB 1026, the objectives and principles of which are similar to those set out in US accounting standard SFAS 95 ‘Statement of Cash Flows’. The principle differences between the standards relate to the classification of items within the cash flow statement as well as the definition of cash and cash equivalents:
| | – | | Under US GAAP bank overdrafts are not considered to be part of the net cash equivalents and so changes in bank overdrafts (net) are included in cash flows from financing activities. |
| | – | | Under US GAAP cash and cash equivalents which are subject to restrictions on use are not considered to be part of cash and cash equivalents and so these cash flows are excluded. |
| | – | | Payments for post-production waste removal costs and research and development are included in cash flows from operating activities for US GAAP, while for Australian GAAP, they are investing cash flows. |
| | – | | Other differences in the US GAAP statement of cash flows relate to those items capitalized under Australian GAAP that would be expensed under US GAAP and would be included in the US GAAP cash flows from operating activities. |
The statement below shows the adjustments to be made to the Australian GAAP cash flow statement to reclassify it to comply with US GAAP for the years ended 31 December 2003, 2002 and 2001.
| | | | | | | | | | | |
| | | Notes
| | Year to 31 Dec 2003 A$m
| | | Year to 31 Dec 2002 A$m
| | | Year to 31 Dec 2001 A$m
| |
Cash flows from financing activities as reported—Australian GAAP | | | | 60.3 | | | 15.8 | | | (793.7 | ) |
Changes in bank overdrafts (net) | | | | — | | | (0.2 | ) | | (3.7 | ) |
| | | | |
|
| |
|
| |
|
|
Net cash provided by/(used in) financing activities—US GAAP | | | | 60.3 | | | 15.6 | | | (797.4 | ) |
| | | | |
|
| |
|
| |
|
|
Cash flows from operating activities as reported—Australian GAAP | | | | 642.5 | | | 358.4 | | | 577.7 | |
Reclassification of payments for exploration expenditure expensed for US GAAP | | 45(b) | | (7.3 | ) | | — | | | (3.7 | ) |
Reclassification of payments for research and development expensed for US GAAP | | 45(a) | | (0.3 | ) | | (0.4 | ) | | — | |
Reclassification of deferred stripping expenditure | | 45(j) | | (85.9 | ) | | (98.3 | ) | | (102.1 | ) |
Movements in restricted cash not classified as cash and cash equivalents for US GAAP | | | | (7.7 | ) | | (11.1 | ) | | (0.1 | ) |
| | | | |
|
| |
|
| |
|
|
Net cash provided by operating activities—US GAAP | | | | 541.3 | | | 248.6 | | | 471.8 | |
| | | | |
|
| |
|
| |
|
|
Cash flows from investing activities as reported—Australian GAAP | | | | (679.9 | ) | | (402.7 | ) | | 279.1 | |
Reclassification of payments for exploration expenditure expensed for US GAAP | | | | 7.3 | | | — | | | 3.7 | |
Reclassification of payments for research and development expensed for US GAAP | | 45(a) | | 0.3 | | | 0.4 | | | — | |
Reclassification of deferred stripping expenditure | | 45(j) | | 85.9 | | | 98.3 | | | 102.1 | |
| | | | |
|
| |
|
| |
|
|
Net cash (used in)/provided by investing activities—US GAAP | | | | (586.4 | ) | | (304.0 | ) | | 384.9 | |
| | | | |
|
| |
|
| |
|
|
Net (decrease)/increase in cash and cash equivalents—US GAAP | | | | 15.2 | | | (39.8 | ) | | 59.3 | |
Cash and cash equivalents at the beginning of the year—US GAAP | | | | 74.3 | | | 119.0 | | | 57.3 | |
Effects of exchange rate changes on opening foreign currency cash balances—US GAAP | | | | (13.1 | ) | | (4.9 | ) | | 2.4 | |
| | | | |
|
| |
|
| |
|
|
Cash and cash equivalents at the end of the financial year—US GAAP | | | | 76.4 | | | 74.3 | | | 119.0 | |
| | | | |
|
| |
|
| |
|
|
Reconciliation of cash and cash equivalents for US GAAP: | | | | | | | | | | | |
Cash and cash equivalents as reported—Australian GAAP | | 9 | | 100.3 | | | 90.5 | | | 124.1 | |
Restricted cash excluded from cash and cash equivalents for US GAAP | | 9 | | (23.9 | ) | | (16.2 | ) | | (5.1 | ) |
| | | | |
|
| |
|
| |
|
|
Cash and cash equivalents in accordance with US GAAP | | | | 76.4 | | | 74.3 | | | 119.0 | |
| | | | |
|
| |
|
| |
|
|
F-72
WMC RESOURCES LTD AND CONTROLLED ENTITIES
NOTES TO THE CONSOLIDATED FINANCIAL STATEMENTS—(Continued)
| 45. | | RECONCILIATION TO US GAAP (Continued) |
The major differences between Australian GAAP and US GAAP are summarized below.
| (a) | | Research and development expenditure capitalized |
Expenditure incurred on research and development may be capitalized and deferred in Australia to the extent that such expenditure is expected to be recoverable. Under US GAAP, all such expenditure is expensed as incurred.
| (b) | | Exploration and evaluation expenditure capitalized |
Expenditure incurred on the exploration and evaluation of minerals properties may be capitalized and deferred in Australia to the extent that such expenditure is expected to be recoverable. Under US GAAP geological and geophysical costs and costs of carrying and retaining undeveloped properties are charged to expense as incurred. Under both Australian GAAP and US GAAP, the cost of purchasing unproven property is capitalized when incurred and either transferred to proven properties when proven or written off as impaired.
Under Statement of Position 98-5, “Reporting on the Costs of start-up activities”, the costs of start-up activities including organizational costs, are required to be expensed as incurred. Under Australian GAAP start up costs are capitalized and deferred as part of the mineral extraction or processing facilities being developed or constructed. These deferred costs are then amortized from the start of production over the life of the facilities concerned. This adjustment has been reclassified for 2002 to exclude the assets of the Fertilizer business which were fair valued to nil under Australian GAAP at demerger, the Fertilizer fair value adjustment (Note 45(o)(iii)) was also amended to reflect this reclassification.
| (d) | | Real estate profit recognition |
Under US GAAP, real estate revenue is not recognized by the full accrual method until certain criteria are met. The sale of tenements at Kambalda did not meet all these conditions in 2000 and the sales and profit was not recognized until 2001 for US GAAP.
| (e) | | The right to royalties received from sale of gold operations not recognized |
The right to royalties received in consideration for the gold mines sold during 2001 has been recognized at fair value under Australian GAAP and included in the determination of the gain on disposal. Under US GAAP, since the right to the royalties received had not been realized at December 31, 2001, WMC Resources retained an amount of the carrying value of the mines on the balance sheet at December 31, 2001 in the proportion that the value of the right to the royalties bears to the total value of the consideration received. The increase in net income for US GAAP in 2002 represents the difference in carrying value when the royalty was sold during the year ended December 31, 2002.
| (f) | | Revenue from insurance proceeds |
Under Australian GAAP, insurance proceeds are recognized when WMC Resources is satisfied that a valid claim exists which will be accepted, it is probable that the amount will flow to WMC Resources and the amount can be measured reliably. Under US GAAP, insurance proceeds are not recognized as revenue until realized, either through receipt of the insurance proceeds or an agreement with the insurance provider as to the amount of insurance proceeds to be received. As of December 31, 2002, WMC Resources recorded insurance proceeds receivable of A$58.2 million under Australian GAAP. As WMC Resources had not yet concluded an agreement on the full amount of insurance proceeds to be received, this amount was reversed for US GAAP. During 2003, A$19.5 million of the receivable booked in 2002 was received and is therefore recorded as income under US GAAP during 2003. As at December 31, 2003, an agreement on the remaining amount of insurance proceeds to be received had not been concluded, and is therefore not recorded as income in 2003 for US GAAP.
| (g) | | Option payment capitalized |
An option payment made in 2000 for the right to participate in the Corridor Sands bankable feasibility study and earn an interest in any resultant development was deferred and amortized over the period during which the study is undertaken. Under US GAAP the payment was expensed when incurred. Following the acquisition of Corridor Sands in 2002, the remaining option payment was written off for Australian GAAP. Consequently, for 2003, there is no difference between the Australian GAAP and US GAAP treatment.
F-73
WMC RESOURCES LTD AND CONTROLLED ENTITIES
NOTES TO THE CONSOLIDATED FINANCIAL STATEMENTS—(Continued)
| 45. | | RECONCILIATION TO US GAAP (Continued) |
| (h) | | Accounting change—depreciation and amortization |
Effective January 1, 2002 the company changed its methodology for the determination of amortization of mine development assets (including post production waste removal costs) under US GAAP. Prior to January 1, 2002 the company amortized mining development on a composite basis. Total historical capitalized costs and estimated future development costs relating to its developed and undeveloped reserves were depreciated using the units-of-production method based on total developed and undeveloped proven and probable reserves.
After considering the evolving US industry practice in this area, management decided to revise its amortization methodology prospectively. Effective January 1, 2002 US GAAP depreciation for mine development assets (including post-production waste removal costs) excludes consideration of future development costs. Refer to Note 45(i) for details of the new policy for amortization of mine development and Note 45(j) for amortization of post-production waste removal costs. The cumulative effect recorded on January 1, 2002 of changing to the new accounting policy was A$39.5 million (post-tax).
| (i) | | Amortization of mine development |
For US GAAP purposes, amortization of the deferred costs of mine development is calculated on a units-of-production basis over the proven and probable reserves which relate to the particular category of development, either “life of mine plan” or reserves for which no further capital expenditure is required. No future development costs are taken into account in calculating the amortization charge. The adjustment to US GAAP income for 2003 was an increase of A$7.9 million before tax (2002: increase of A$1.8 million).
Life of mine plan development comprises capital expenditures that will be utilized in the extraction of all the proven and probable ore reserves in the current detailed mine plan. These expenditures are predominantly incurred up-front and in advance of any ore extraction or during major expansions. The types of development included in this category are ore haulage shafts, initial decline, ore passes and chutes and underground ore crusher cavities and are intended to be used for the extraction of all ore within the current mine plan. These costs are amortized on a units-of-production basis over the total proven and probable reserves in the current mine plan.
Development which is amortized over reserves for which no further capital expenditure is required comprises capital expenditure to provide access to various areas within the mine to allow the extraction of ore to commence. The types of development included within this category are: access and perimeter drives, ventilation drives and rises, and progressive declining subsequent to initial contact with the ore body. These costs are amortized on a units-of-production basis over the proven and probable reserves that can be currently accessed without future capital development costs being incurred.
| (j) | | Post-production waste removal costs |
Under Australian GAAP, expenditure incurred on post-production waste removal (stripping) is accumulated and deferred on the balance sheet as part of Mine properties and mine development. For US GAAP, these deferred production costs are classified in the balance sheet as other non-current assets. Amortization of post-production waste removal costs is included in cost of goods sold in the income statement.
The Australian GAAP opening balances, movements and closing balances of post-production waste removal costs are as follows:
| | | | | | | | | |
| | | 2003 A$m
| | | 2002 A$m
| | | 2001 A$m
| |
Opening balance | | 186.2 | | | 161.5 | | | 140.7 | |
Costs capitalized | | 85.9 | | | 98.3 | | | 102.1 | |
Amortization charge | | (112.0 | ) | | (73.6 | ) | | (81.3 | ) |
| | |
|
| |
|
| |
|
|
Closing balance | | 160.1 | | | 186.2 | | | 161.5 | |
| | |
|
| |
|
| |
|
|
The US GAAP movements and closing balances of post-production waste removal costs are as follows:
| | | | | | | | | |
| | | 2003 A$m
| | | 2002 A$m
| | | 2001 A$m
| |
Opening balance | | 141.7 | | | 161.5 | | | 140.7 | |
Cumulative effect adjustment | | — | | | (38.1 | ) | | — | |
Costs capitalized | | 85.9 | | | 98.3 | | | 102.1 | |
Amortization charge | | (111.2 | ) | | (80.0 | ) | | (81.3 | ) |
| | |
|
| |
|
| |
|
|
Closing balance | | 116.4 | | | 141.7 | | | 161.5 | |
| | |
|
| |
|
| |
|
|
F-74
WMC RESOURCES LTD AND CONTROLLED ENTITIES
NOTES TO THE CONSOLIDATED FINANCIAL STATEMENTS—(Continued)
| 45. | | RECONCILIATION TO US GAAP (Continued) |
| (j) | | Post-production waste removal costs (continued) |
For US GAAP, the amortization of deferred post-production waste removal costs is determined by applying a life-of-mine waste-to-metal stripping ratio. The stripping ratio is calculated by comparing the recoverable metal included in the proven and probable reserves to be extracted over the life of the mine to the total volume of waste to be extracted over the same period. This ratio is then applied to the production of metal for the period to determine the amortization charge. The life of mine waste-to-metal stripping ratio used for the amortization of post production waste removal costs was: Mt Keith 672 tonnes of waste-to-metal (2002: 691, 2001: 699), Harmony: 836 tonnes of waste-to-metal (2002: 749, 2001: 662). For Australian GAAP, the amount amortized for 2003 was: Mt Keith A$61.7 million (2002: A$56.3 million, 2001: A$52.9 million), Harmony: A$58.5 million (2002: A$22.8 million, 2001: A$36.3 million). The full amount of post-production waste removal costs incurred will not be expensed until the end of the mine life. Based on the current mine plans, the deferred stripping asset would be expected to be extinguished during 2024 for Mt Keith and 2004 for the Harmony Mine at Leinster.
The accounting for stripping costs smoothes the cost of waste-rock removal over the life of the mine rather than expensing the actual waste removal cost incurred in each period.
There is mixed accounting practice in this area and some mining companies expense waste removal costs as incurred, which, if followed, may result in the reporting of greater volatility in period to period results of operations.
Stripping expenditure, which for Australian GAAP purposes is shown as an investing cash flow, is considered an operating cash flow for US GAAP.
As waste removal activities are an integral part of the mining operation, the deferred stripping asset is grouped with the other assets at the mine site or other level, which represents the lowest level of separately identifiable cash flows in order to assess recoverable amount.
Under Australian GAAP, a provision has been raised for the present value of future payments for surplus lease space under non-cancelable operating leases, and for leased space under non-cancelable operating leases which is to be considered subject to an onerous contract. These provisions are not allowable under US GAAP.
| (l) | | Asset retirement obligations |
Accounting Change—Provision for Asset Retirement Obligations (Rehabilitation)
Effective January 1, 2003 the company adopted FAS 143 ‘Accounting for Asset Retirement Obligations’ in accordance with US GAAP. FAS 143 requires that the fair value of a liability for an asset retirement obligation be recognized in the period in which it is incurred. Prior to the adoption of FAS 143, no GAAP adjustments were required for rehabilitation obligations.
For Australian GAAP purposes, the asset retirement obligations (rehabilitation liabilities) are recognized progressively over the life of the operations. The total undiscounted close down and restoration costs for each operation are estimated and charged on a proportionate basis to production over the life of the operation or activity concerned.
Adoption of the US GAAP approach has resulted in a cumulative-effect adjustment of A$27.3 million for the Group.
There would be no material impact on pro forma net income and earnings per share under US GAAP for the years December 31, 2002 and 2001, assuming the adoption of SFAS No. 143 as of 1 January 2001.
Provision for Asset Retirement Obligations (Rehabilitation)
For US GAAP purposes, a provision and related disturbance asset are recognized in the accounting period in which the environmental disturbance occurs. The measurement of the liability and asset is based on the net present value of the estimated restoration costs. In each subsequent year, a charge to the profit and loss is recognized (accretion expense) to adjust for the increase in the present value of the provision.
Restoration costs include reclamation costs, dismantling and removal costs, removal of foundations and roads, the clean up of polluted materials, and revegetation of areas affected by the operations, and monitoring of sites in line with Australian legal requirements, for disturbances as at balance date. WMC assesses the cash flow estimates and timing associated with the asset retirement obligations (AROs) on an annual basis, or earlier if necessary. The discount rate applied to the cash flows represents the credit-adjusted risk-free rate that existed when the liability, or portion thereof, was initially measured.
F-75
WMC RESOURCES LTD AND CONTROLLED ENTITIES
NOTES TO THE CONSOLIDATED FINANCIAL STATEMENTS—(Continued)
| 45. | | RECONCILIATION TO US GAAP (Continued) |
| (l) | | Asset retirement obligations (continued) |
WMC recognizes the disturbance asset associated with the ARO as an increase in the carrying value of the related long-lived assets and depreciates the additional amount on a straight-line basis in line with the estimated useful lives of those assets to which the amount has been assigned.
Reconciliation of Asset Retirement Obligations:
| | | | | |
| | | 2003
A$m
| | | 2002
Pro forma
A$m
|
Opening balance | | 145.9 | | | 129.0 |
Accretion expense | | 9.9 | | | 9.0 |
Current disturbances capitalized | | 1.5 | | | 7.9 |
Liabilities settled / disposed of | | (1.1 | ) | | — |
| | |
|
| |
|
Closing balance | | 156.2 | | | 145.9 |
| | |
|
| |
|
| (m) | | Fair value accounting for derivatives |
Under Australian GAAP, effective hedges are measured at spot price and hedging gains/losses are deferred on the balance sheet as part of other liabilities and assets. Under US GAAP effective hedges are measured at fair value and gains/losses are recognized as part of other comprehensive income.
Adoption of FAS 133
The Company adopted Statement of Financial Accounting Standards No. 133, “Accounting for Derivative Instruments and Hedging Activities” as amended by Statement of Financial Accounting Standards No. 137, “Accounting for Derivative Instruments and Hedging Activities-Deferral of the Effective Date of FASB Statement No. 133”, an amendment of FASB Statement No. 133, and Statement of Financial Accounting Standards No. 138, “Accounting for Certain Derivative Instruments and Certain Hedging Activities”, an amendment of FASB Statement No. 133 (referred to hereafter as “FAS 133”), on January 1, 2001. In accordance with the transition provisions of FAS 133, the Company recorded the following net-of-tax cumulative effect adjustments in earnings as of January 1, 2001:
| | | |
| | | A$m
| |
Related to previously designated fair value hedging relationships: | | | |
Fair value of hedging instruments | | 36.0 | |
Offsetting changes in fair value of hedged items | | (36.0 | ) |
| | |
|
|
Total adjustment net of tax | | — | |
In addition, the Company recorded the following net-of-tax cumulative-effect adjustments in other comprehensive income as of January 1, 2001.
| | | |
| | | A$m
| |
Related to previously designated fair value hedging relationships: | | | |
Fair value of hedging instruments | | 29.2 | |
Previously deferred hedging gains and losses | | (647.9 | ) |
| | |
|
|
Total adjustment net of tax | | (618.7 | ) |
Accounting for derivatives and hedging activities
WMC Resources formally documents all relationships between hedging instruments and hedged items, as well as its risk-management objective and strategy for undertaking various hedge transactions. This process includes linking all derivatives that are designated as fair-value, cash flow, or foreign-currency hedges to:
| | (1) | | specific assets and liabilities on the balance sheet; or |
| | (2) | | specific firm commitments or forecasted transactions. |
WMC Resources also formally assesses (both at the hedge’s inception and on an ongoing basis) whether the derivatives that are used in hedging transactions have been highly effective in offsetting changes in the fair value or cash flows of hedged items and whether those derivatives may be expected to remain highly effective in future periods. When it is determined that a derivative is not (or has ceased to be) highly effective as a hedge, WMC Resources discontinues hedge accounting prospectively, as discussed below.
WMC Resources discontinues hedge accounting prospectively when:
| | (1) | | it determines that the derivative is no longer effective in offsetting changes in the fair value or cash flows of a hedged item (including hedged items such as firm commitments or forecasted transactions); |
| | (2) | | it is probable that the forecasted transaction will not occur; |
| | (3) | | a hedged firm commitment no longer meets the definition of a firm commitment; or |
| | (4) | | management determines that designating the derivative as a hedging instrument is no longer appropriate. |
F-76
WMC RESOURCES LTD AND CONTROLLED ENTITIES
NOTES TO THE CONSOLIDATED FINANCIAL STATEMENTS—(Continued)
| 45. | | RECONCILIATION TO US GAAP (Continued) |
| (m) | | Fair value accounting for derivatives (continued) |
Fair-value hedges
WMC Resources may use interest rate swaps to convert a portion of its non prepayable fixed-rate debt into floating-rate debt. Under the interest rate swap contracts, WMC Resources agrees with other parties to exchange, at specified intervals, the difference between fixed-rate and floating-rate interest amounts, which is calculated based on an agreed-upon notional amount.
For US GAAP, for the year ended December 31, 2003, WMC Resources recognized a net gain after tax of A$12.5 million, representing the change in time value on floating-for-fixed rate swaps excluded from the assessment of hedge effectiveness.
The total of the adjustment referred to in the previous paragraph on a pre-tax basis is A$17.9 million.
Cash flow hedges
WMC Resources’ sales are predominantly denominated in United States dollars. WMC Resources enters into foreign-exchange options and forward-exchange contracts as hedges of anticipated sales denominated in foreign currencies. WMC Resources enters into these contracts to protect itself against the risk that the eventual dollar-net-cash inflows resulting from direct-foreign-export sales will be adversely affected by changes in exchange rates.
For US GAAP, for the year ending December 31, 2003, WMC Resources recognized a net gain after tax of A$13.9 million for the ineffective portion of certain options designated as cash flow hedges. A further gain of A$2.5 million was recognized, representing the change in time value on certain forward contracts excluded from the assessment of hedge effectiveness.
The revaluation of foreign currency debt which is not treated as a hedge for accounting purposes under US GAAP resulted in a net gain after tax of A$231.7 million.
The total of the adjustments referred to in the preceding two paragraphs on a pre-tax basis was A$354.4 million.
For US GAAP, as at December 31, 2003, A$20.4 million of deferred net gains on derivative instruments accumulated in other comprehensive income are expected to be reclassified as earnings during the next twelve months.
The maximum term over which WMC Resources is hedging exposures to the variability of cash flows using derivative instruments for all forecasted transactions is ten years.
Subsequent gains and losses on cash flow hedges are taken to other comprehensive income and are reclassified to profit and loss in the same period the hedged transaction is recognized. Gains and losses on fair value hedges continue to be taken to profit and loss in subsequent periods, as offsetting gains and losses on hedged liabilities. In both cases, these gains and losses are not recognized under Australian GAAP until the hedged transaction is recognized.
FAS 133 requires that any component of the gain or loss which is deemed to be ineffective be taken to the Income Statement immediately. For Australian GAAP any ineffectiveness is recognized over the term of the derivative.
The WMC Resources Group’s pension plans are discussed in Note 39. The applicable Australian accounting standard relates only to disclosure. The accepted practice is to account for Company contributions on a cash rather than an accruals basis. WMC Resources does not account for excesses or shortfalls of the Superannuation Fund assets over accrued membership benefits. As this is contrary to US GAAP, WMC Resources has adopted the recognition provisions of FAS 87 “Employers Accounting for Pensions” for US GAAP reconciliation purposes. WMC Resources does not sponsor post retirement defined-benefits other than pensions. Further disclosure requirements of FAS 87 are shown in Note 46(j).
F-77
WMC RESOURCES LTD AND CONTROLLED ENTITIES
NOTES TO THE CONSOLIDATED FINANCIAL STATEMENTS—(Continued)
| 45. | | RECONCILIATION TO US GAAP (Continued) |
| (o) | | Transfers of net assets and exchange of shares between entities under common control |
Prior to effecting the demerger in December 2002, through a series of transactions internal to the WMC Limited Group, WMC Resources Ltd acquired WMC Limited’s shares in the legal entities that held its copper-uranium and fertilizer businesses, WMC Finance Limited, WMC Finance (USA) Limited as well as WMC Limited’s exploration and development interests other than those relating to Alcoa World Alumina and Chemicals (AWAC). Under Australian GAAP, these acquisitions were made at the fair value of the net assets acquired, in return for shares in WMC Resources Ltd. Under US GAAP, these acquisitions are accounted for in accordance with “Financial Accounting Standard No 141 “Business Combination”, as transfers of net assets and exchanges of shares between entities under common control, which requires that all such transactions are recorded at the historic carrying amounts. Consequently, the following adjustments between Australian GAAP and US GAAP arise:
| | (i) | | Copper-uranium idle and inactive assets |
Under Australian GAAP certain idle and inactive assets of the copper-uranium business were acquired by WMC Resources Ltd at their fair value. Under US GAAP, these assets were acquired at carrying value. Consequently, there is a difference between the carrying value of the assets and the depreciation charge on an Australian GAAP basis and a US GAAP basis. Where assets included in this adjustment are identified as having no further use to the business, there is a resulting charge to the US GAAP income statement.
| | (ii) | | Copper-uranium acquired mineral rights |
For the Australian GAAP financial statements, the excess of the cost of acquisition of the copper-uranium business unit over the fair value of its other identifiable net assets acquired was brought to account as “acquired mineral rights”, which are amortized on a straight line basis over the period during which the benefits are expected to arise. Under US GAAP, the acquired mineral rights balance is not recorded as the assets are transferred at carrying value. The carrying value and amortization charge under Australian GAAP is therefore reversed for US GAAP.
| | (iii) | | Fertilizer assets fair value adjustment |
Under Australian GAAP, the assets of the Fertilizer business were recorded at their fair values, which were lower than their book carrying values, as part of the acquisition by WMC Resources. This fair value adjustment was applied against the intangible assets and property, plant and equipment of the Fertilizer operations. For US GAAP purposes the transfer is recorded at book value at the date of transfer and the assets are not considered to be impaired under US GAAP in accordance with FAS 144. Consequently, there is a difference between the carrying value of the assets and the depreciation charge on an Australian GAAP basis and a US GAAP basis.
As at 31 December 2002, of the total fair value adjustment of A$289.6 million, A$107.6 million relating to start-up costs has already been expensed for US GAAP (refer to (c) above), resulting in a net US GAAP difference of A$182.0 million, including additional depreciation under US GAAP of A$1.1 million.
As at December 31, 2003, additional depreciation of A$12.3 million is recorded in net income under US GAAP, representing the depreciation on assets with a net book value of A$169.7 million which are recorded in the US GAAP balance sheet.
| | (iv) | | Deferred tax balances acquired |
On acquisition, the deferred tax balances of the Fertilizer business and of WMC Finance Limited were assessed to have a fair value of nil under Australian GAAP on the basis that their recoverability was not virtually certain. For US GAAP, these balances were acquired at their book values, and, as mentioned in Note 46(b)(ii), provided for to the extent that it is more likely than not that some portion or all of the deferred tax asset will not be realized. This valuation allowance is taken through equity for US GAAP purposes as it relates to the demerger.
| | (v) | | Acquisition of hedge instruments |
Upon acquisition of WMC Finance Limited, all of the hedge instruments which were held by this entity were marked to market, resulting in the re-statement of deferred losses and creditors relating to hedging contracts. Net deferred losses were assigned a fair value of zero on acquisition. WMC Finance was acquired at carrying value for US GAAP purposes and therefore the fair value adjustments of A$933.7 million made under Australian GAAP are reversed for US GAAP. The profit and loss impact of subsequent transactions is based on the original book values rather than the Australian GAAP fair value. For the 2003 financial year, this profit and loss impact is A$87.6 million loss before tax, and consequently, at the reporting date, fair value adjustments relating to deferred losses of A$846.1 million are reversed for US GAAP.
F-78
WMC RESOURCES LTD AND CONTROLLED ENTITIES
NOTES TO THE CONSOLIDATED FINANCIAL STATEMENTS—(Continued)
| 45. | | RECONCILIATION TO US GAAP (Continued) |
| (o) | | Transfers of net assets and exchange of shares between entities under common control (continued) |
| | (vi) | | Repurchase of Yankee Bonds |
Upon acquisition of WMC Finance (U.S.A.) Limited, the Yankee Bonds which were held by the company were revalued to their fair value on the date of acquisition of the entity by WMC Resources. WMC Finance (U.S.A.) Limited was acquired at carrying value for US GAAP purposes and therefore the fair value adjustments are reversed for US GAAP and the profit and loss transactions recorded at their historic carrying value rather than the Australian GAAP fair value. Consequently, at December 31, 2002, additional costs of A$143.7 million are recorded as a reconciling item to US GAAP income to reflect the underlying losses on extinguishment of debt when the Yankee Bonds were repurchased during December 2002, which had been extinguished by the fair value adjustments under Australian GAAP. In addition, the remaining balance of the Yankee Bonds at December 31 is re-stated to its original book value, resulting in a reduction in liabilities under US GAAP of A$0.9 million (2002: A$2.2 million).
Stamp Duty of A$24.0 million in relation to the transfer of assets between entities has been capitalized into the assets acquired under Australian GAAP. For US GAAP, this amount was expensed in 2002.
| | (viii) | | Other fair value adjustments |
Other sundry assets were acquired from WMC Limited at their fair values for Australian GAAP. Under US GAAP, these assets are acquired at their carrying values.
| (p) | | Stock valuation adjustment |
A number of the above US GAAP adjustments result in changes to direct production related costs. As outlined in Note 1(i), direct costs and an appropriate proportion of fixed and variable direct overhead expenditure, including depreciation and amortization are included in the cost of inventories. Consequently, the full impact of the above adjustments would not all be recorded in income on a US GAAP basis as some of the costs or savings would be deferred in the value of inventories at the end of the fiscal year. This adjustment defers the relevant portion of the following US GAAP adjustments into the value of inventories as at the end of the fiscal year:
(c) Start up costs
(l) Asset retirement obligations
(o)(ii) Copper-uranium acquired mineral rights
(o)(iii) Fertilizer fair value adjustment
(i)(j) Amortization of post production waste removal costs
| (q) | | Meliadine transaction profit |
During 2003, WMC Resources merged the subsidiary which owned its interest in the Meliadine West gold exploration project with Comaplex Corp., a Canadian mining junior. Under Australian GAAP, costs of A$14.2 million which were capitalized as Exploration assets in relation to Meliadine were disposed of as part of this transaction. As these costs had been expensed as incurred under US GAAP, there is an increase in net income for 2003 under US GAAP which represents additional profit on the Meliadine transaction.
| (r) | | Valuation of listed investments |
Under Australian GAAP, investments in listed and unlisted securities are recorded at cost, less provision for permanent diminutions in value. Under US GAAP, listed investments categorized as “available for sale” in accordance with FAS 115 ,”Accounting for certain investments in debt and equity securities”, are valued at their market value at year end, with any adjustments being taken through Other Comprehensive Income (OCI).
| (s) | | Provisional pricing adjustment |
For US and Australian GAAP, provisionally priced invoices are normally revalued using LME forward prices at balance date. At 31 December 2003, the company made an assessment that the LME forward price did not accurately reflect the future settlement price due to short term market conditions. As a result, the company’s estimate of the forward price was substituted, resulting in a decrease in recorded revenue. For US GAAP, the applicable prevailing LME forward price at period end is required to be used in all circumstances.
F-79
WMC RESOURCES LTD AND CONTROLLED ENTITIES
NOTES TO THE CONSOLIDATED FINANCIAL STATEMENTS—(Continued)
45. RECONCILIATION TO US GAAP (Continued)
| (t) | | Realized net exchange gains/(losses) |
Under Australian GAAP, net exchange gains or losses reported in shareholders’ equity, can be transferred to retained earnings under certain circumstances. US GAAP requires that all net exchange gains or losses be recognized in the profit and loss account and not as direct transfers, reflecting that they have, in substance, been realized.
| (u) | | Recognition of tax balances |
The recoverability of off balance sheet tax benefits was reviewed under Australian GAAP during 2003 following a favourable tax ruling in respect of prior period tax losses and the close out of the legacy foreign exchange contracts. Under US GAAP, a credit arises relating to the re-assessment of the valuation allowance for future income tax benefits relating to timing differences and tax losses. As outlined in Note 46(b)(ii), Australian GAAP requires that timing differences are recognized only when their recovery is considered probable and, in the case of companies which incur losses, future income tax benefits arising from tax losses are recognized only when there is virtual certainty that future taxable amounts would be sufficient to allow the benefit to be realized. For USGAAP, a valuation allowance must be established for deferred tax assets when it is more likely than not that they will not be realized.
F-80
WMC RESOURCES LTD AND CONTROLLED ENTITIES
NOTES TO THE CONSOLIDATED FINANCIAL STATEMENTS—(Continued)
46. OTHER US GAAP DISCLOSURES
Set out below are additional disclosures which are required in order to comply with US GAAP.
| (a) | | Provisionally priced revenues. |
WMC Resources Ltd’s revenues are disclosed in Note 2. US GAAP requires the disclosure of amounts included in revenue which were based on provisional pricing as described in accounting policy Note 1(g). The amounts of provisionally priced revenues for 2003, 2002 and 2001 were as follows:
| | |
Year
| | A$m
|
2003 | | 133.1 |
2002 | | 63.4 |
2001 | | 60.5 |
Under Australian GAAP, deferred taxes are provided for using the liability method on a similar basis to FAS 109, therefore there has been no adjustment to the method by which income taxes have been calculated.
Information relating to income tax expense and deferred taxes in accordance with Australian GAAP is shown in Note 5 (income tax expense), and Notes 20 and 29 (deferred tax balances). The following information is prepared in accordance with US GAAP:
| (i) | | Income tax expense / credit |
| | | | | | | | | | | |
| | | | | Year to 31 Dec 2003 A$m
| | | Year to 31 Dec 2002 A$m
| | | Year to 31 Dec 2001 A$m
| |
Income tax credit/(expense) is comprised of: | | | | | | | | | | | |
Current: | | | | | | | | | | | |
Australian | | | | 0.2 | | | (5.1 | ) | | (3.2 | ) |
United States Federal | | | | — | | | — | | | — | |
Other | | | | (2.5 | ) | | (2.5 | ) | | (0.1 | ) |
| | | | |
|
| |
|
| |
|
|
| | | | | (2.3 | ) | | (7.6 | ) | | (3.3 | ) |
| | | | |
|
| |
|
| |
|
|
Deferred income tax: | | | | | | | | | | | |
Australian | | | | (192.3 | ) | | (30.2 | ) | | (101.9 | ) |
United States Federal | | | | — | | | 0.1 | | | — | |
| | | | |
|
| |
|
| |
|
|
| | | | | (192.3 | ) | | (30.1 | ) | | (101.9 | ) |
| | | | |
|
| |
|
| |
|
|
Future income tax benefit: | | | | | | | | | | | |
Australian | | | | 127.5 | | | 73.1 | | | 123.0 | |
United States Federal | | | | — | | | — | | | — | |
Other | | | | — | | | — | | | — | |
| | | | |
|
| |
|
| |
|
|
| | | | | 127.5 | | | 73.1 | | | 123.0 | |
| | | | |
|
| |
|
| |
|
|
Tax credit/(expense) attributable to operating profit/(loss) | | | | (67.1 | ) | | 35.4 | | | 17.8 | |
Prior period adjustment | | | | 8.5 | | | 2.5 | | | 6.5 | |
Income tax (expense)/credit on significant items | | 4 | | 56.3 | | | (16.7 | ) | | 52.0 | |
| | | | |
|
| |
|
| |
|
|
Total income tax credit/(expense) | | 5(a) | | (2.3 | ) | | 21.2 | | | 76.3 | |
| | | | |
|
| |
|
| |
|
|
F-81
WMC RESOURCES LTD AND CONTROLLED ENTITIES
NOTES TO THE CONSOLIDATED FINANCIAL STATEMENTS—(Continued)
| 46. | | OTHER US GAAP DISCLOSURES (Continued) |
| (b) | | Income tax (continued) |
| | | | | | | | | |
| | | Year to
31 Dec
2003
A$m
| | | Year to
31 Dec
2002
A$m
| | | Year to
31 Dec
2001
A$m
| |
The significant timing differences included in the deferred income tax credit/(expense) were: | | | | | | | | | |
- Accelerated depreciation | | 17.2 | | | (16.6 | ) | | (45.2 | ) |
- Stores | | (2.0 | ) | | 1.2 | | | 1.1 | |
- Stock adjustment to market value | | 15.6 | | | (6.5 | ) | | (101.1 | ) |
- Amounts set aside to provision accounts | | 21.7 | | | 9.4 | | | 9.1 | |
- Tax losses | | (193.8 | ) | | 4.5 | | | 52.9 | |
- Prepayments | | — | | | 0.2 | | | (0.4 | ) |
- Financial instruments accruals | | 4.3 | | | 13.4 | | | (18.5 | ) |
- Foreign exchange | | (51.5 | ) | | (38.8 | ) | | 1.3 | |
- Other | | (3.8 | ) | | 3.1 | | | (1.1 | ) |
| | |
|
| |
|
| |
|
|
| | | (192.3 | ) | | (30.1 | ) | | (101.9 | ) |
| | |
|
| |
|
| |
|
|
Under US GAAP, the recognition and carry forward of future income tax benefits differs from Australian GAAP in the following areas:
| | • | | Tax assets and liabilities relating to temporary timing differences are all classed as non-current under Australian GAAP. Under US GAAP the future income tax benefits and liabilities would be required to be allocated in the balance sheet between current and non-current items. This allocation would not have a significant effect. |
| | • | | Tax assets relating to tax losses are not brought to account under Australian GAAP unless their ultimate realization is virtually certain. Under US GAAP, tax assets relating to tax losses are all brought to account and a valuation allowance raised against the asset if it is more likely than not that some portion or all of the deferred tax asset will not be realized. An adjustment is made to the tax assets recognized for US GAAP in Note 45(u) above. |
The following are the disclosures which would be required if US GAAP had been applied instead of Australian GAAP:
| | | | | | | | |
| | | Notes
| | 31 Dec 2003 A$m
| | | 31 Dec 2002 A$m
| |
Deferred tax assets: | | | | | | | | |
Future income tax benefit | | 20 | | 46.0 | | | 44.6 | |
| | | | |
|
| |
|
|
The timing differences represented by the net future income tax benefits are: | | | | | | | | |
Amortization and depreciation | | | | (194.0 | ) | | (201.2 | ) |
Prepayments | | | | (0.3 | ) | | (1.2 | ) |
Provisions | | | | 50.8 | | | 43.9 | |
Stores | | | | (13.3 | ) | | (9.0 | ) |
Foreign exchange | | | | 1.3 | | | (36.4 | ) |
Financial instruments | | | | 35.7 | | | — | |
Stock | | | | 109.7 | | | 78.3 | |
Tax losses | | | | 53.4 | | | 154.9 | |
Other | | | | 2.7 | | | 15.3 | |
| | | | |
|
| |
|
|
| | | | | 46.0 | | | 44.6 | |
| | | | |
|
| |
|
|
At balance date, the following future tax benefits are not recognized under Australian GAAP. These would be recognized and subject to valuation allowances under US GAAP where the US GAAP realization test is not met: | | | | | | | | |
- Income tax losses | | | | 360.3 | | | 422.5 | |
- Income tax timing differences | | | | 83.7 | | | 30.3 | |
- Capital losses | | | | 126.5 | | | 128.6 | |
| | | | |
|
| |
|
|
| | | | | 570.5 | | | 581.4 | |
| | | | |
|
| |
|
|
F-82
WMC RESOURCES LTD AND CONTROLLED ENTITIES
NOTES TO THE CONSOLIDATED FINANCIAL STATEMENTS—(Continued)
| 46. | | OTHER US GAAP DISCLOSURES (Continued) |
| (b) | | Income tax (continued) |
At 31 December 2003, for income tax purposes, tax losses carried forward were A$1,666.0 million. These operating tax losses carried forward, expire as summarized below:
| | | | |
| | | Year of
Expiry
| | A$m
|
Australia | | Indefinitely | | 1,493.3 |
| | |
United States | | 2006 | | 0.2 |
| | | 2007 | | 9.3 |
| | | 2008 | | 9.8 |
| | | 2009 | | 12.4 |
| | | 2011 | | 13.1 |
| | | 2018 | | 1.4 |
| | | 2019 | | 0.4 |
| | | 2020 | | 2.0 |
| | | 2021 | | 4.4 |
| | | | |
|
| | | | | 53.0 |
| | | | |
|
| | |
| | | Year of
Expiry
| | A$m
|
Other countries | | 2004 | | 1.5 |
| | | 2005 | | 1.4 |
| | | 2006 | | 1.4 |
| | | 2007 | | 0.5 |
| | | Indefinitely | | 114.9 |
| | | | |
|
| | | | | 119.7 |
| | | | |
|
Total operating income tax losses | | | | 1,666.0 |
| | | | |
|
Capital losses and timing differences relate mainly to losses which have not yet been realized or where they are realized and can be carried forward indefinitely.
| (iii) | | Deferred tax liabilities |
| | | | | | | | |
| | | Notes
| | As at 31
December 2003 A$m
| | | As at 31
December 2002 A$m
| |
Deferred Tax Liabilities | | | | | | | | |
Deferred income tax | | 29 | | 382.0 | | | 377.0 | |
| | | | |
|
| |
|
|
The timing differences represented by the provision for deferred income tax are: | | | | | | | | |
Amortization and depreciation | | | | 384.7 | | | 388.2 | |
Prepayments | | | | — | | | — | |
Employee provisions | | | | (5.1 | ) | | (4.6 | ) |
Other provisions | | | | 28.6 | | | 7.0 | |
Stores | | | | 8.9 | | | 8.1 | |
Stock | | | | — | | | — | |
Foreign exchange | | | | 56.2 | | | 30.6 | |
Financial instruments | | | | (23.6 | ) | | — | |
Other | | | | 11.0 | | | 24.0 | |
Tax losses | | | | (78.7 | ) | | (76.3 | ) |
| | | | |
|
| |
|
|
| | | | | 382.0 | | | 377.0 | |
| | | | |
|
| |
|
|
F-83
WMC RESOURCES LTD AND CONTROLLED ENTITIES
NOTES TO THE CONSOLIDATED FINANCIAL STATEMENTS—(Continued)
| 46. | | OTHER US GAAP DISCLOSURES (Continued) |
Earnings per share under Australian GAAP is reported in Note 6. Additional information concerning earnings per share in accordance with US GAAP is disclosed below:
| | | | | | | | |
| | | Year to 31 Dec 2003
| | | Year to 31 Dec 2002
| | | Year to 31 Dec 2001
|
| | | Australian cents per share |
Basic earnings per share calculated on net income in accordance with US GAAP(2) | | | | | | | | |
-before cumulative effect of accounting change | | 66.4 | | | (6.3 | ) | | 3.4 |
-accounting change | | (1.7 | ) | | (3.5 | ) | | — |
| | |
|
| |
|
| |
|
Basic earnings per share | | 64.7 | | | (9.8 | ) | | 3.4 |
| | |
|
| |
|
| |
|
Diluted earnings per share | | 64.0 | | | (9.8 | ) | | 3.4 |
| | |
|
| |
|
| |
|
| | | | | | |
| | | Number of shares
|
| | | 2003
| | 2002
| | 2001
|
Weighted average number of shares used in the calculation of earnings per share (US GAAP) | | | | | | |
Number for basic earnings per share | | 1,131,790,533 | | 1,115,784,278 | | 1,103,323,901 |
Effect of share options on issue | | 12,260,537 | | 3,952,914 | | 8,313,340 |
| | |
| |
| |
|
Number for diluted earnings per share | | 1,144,051,070 | | 1,119,737,192 | | 1,111,637,241 |
| | |
| |
| |
|
| | | | | | | | |
| | | Year to 31 Dec 2003
| | Year to 31 Dec 2002
| | | Year to 31 Dec 2001
| |
| | | Australian cents per share | |
(1) Australian GAAP | | | | | | | | |
Earnings per share from continuing operations | | 21.1 | | (1.3 | ) | | (14.3 | ) |
Earnings per share from discontinued operations | | 0.6 | | 3.4 | | | 25.7 | |
| | |
| |
|
| |
|
|
| | | 21.7 | | 2.1 | | | 11.4 | |
| | |
| |
|
| |
|
|
(2) US GAAP | | | | | | | | |
Earnings per share from continuing operations | | 62.9 | | (14.4 | ) | | (21.0 | ) |
Earnings per share from discontinued operations | | 1.8 | | 4.6 | | | 24.4 | |
| | |
| |
|
| |
|
|
| | | 64.7 | | (9.8 | ) | | 3.4 | |
| | |
| |
|
| |
|
|
Reconciliation of earnings used in the calculation of earnings per share
| | | | | | | |
| | | Year to 31 Dec 2003 A$m
| | Year to 31 Dec 2002 A$m
| | | Year to 31 Dec 2001 A$m
|
Net income used for basic and diluted earnings per share | | 245.6 | | 23.0 | | | 126.0 |
| | |
| |
|
| |
|
Net US GAAP income/(loss) before cumulative effect of change in accounting principle (Note 45) | | 751.5 | | (70.0 | ) | | 37.7 |
| | |
| |
|
| |
|
F-84
WMC RESOURCES LTD AND CONTROLLED ENTITIES
NOTES TO THE CONSOLIDATED FINANCIAL STATEMENTS—(Continued)
| 46. | | OTHER US GAAP DISCLOSURES (Continued) |
Information in accordance with US GAAP regarding the investments outlined in Note 15 is set out below:
| | | | | | |
| | | 31 Dec 2003 A$m
| | | 31 Dec 2002 A$m
| |
Securities listed on prescribed stock exchanges: | | | | | | |
Cost | | 13.6 | | | 3.7 | |
Provision for diminution in value of investments | | — | | | — | |
| | |
|
| |
|
|
Total investments in quoted companies | | 13.6 | | | 3.7 | |
| | |
|
| |
|
|
Quoted market value | | 24.7 | | | 3.7 | |
| | |
|
| |
|
|
Unrealized gains on investments in quoted companies | | 11.1 | | | — | |
| | |
|
| |
|
|
Other investments: | | | | | | |
Other investments at cost | | 8.2 | | | 10.8 | |
Provision for diminution in value of investments | | (0.5 | ) | | (2.2 | ) |
| | |
|
| |
|
|
Total investments in unquoted entities | | 7.7 | | | 8.6 | |
| | |
|
| |
|
|
Total investments in other entities | | 21.3 | | | 12.3 | |
| | |
|
| |
|
|
| (e) | | Current Liabilities—Interest Bearing Liabilities |
Information regarding Interest bearing liabilities in accordance with Australian GAAP is set out in Note 28. Additional information in accordance with US GAAP is presented below.
| | | | | | | | | | |
Category of aggregate short-term borrowings
| | Balance
at end of
year A$m
| | Weighted
average
interest rate
on balance
date
borrowings %
| | Maximum
amount
outstanding
during
period (i) A$m
| | Average
amount
outstanding
during
period (ii) A$m
| | Weighted average interest rate
during period (iii) %
|
Year ended 31 December 2003 | | | | | | | | | | |
Bank overdrafts | | — | | — | | — | | — | | — |
Other loans | | 212.0 | | 5.25 | | 1,300.5 | | 521.7 | | 3.46 |
| | | | | |
Year ended 31 December 2002 | | | | | | | | | | |
Bank overdrafts | | — | | — | | — | | — | | — |
Other loans | | 1,287.6 | | 3.36 | | 1,287.6 | | 597.6 | | 3.84 |
There are no significant unused committed lines of credit for short-term financing.
| | (i) | | Based on bank statement balances. |
| | (ii) | | Based on average monthly balance. |
| | (iii) | | Based on weighted average monthly interest rates. |
| (f) | | Restructuring provisions |
Additional information concerning restructuring provisions held at year end in accordance with US GAAP is disclosed below:
As at 31 December 2002, A$2.4 million remained as a provision yet to be paid. These costs were in relation to the restructuring of group services and the exploration functions. The number of employees terminated within the group services and exploration functions were 78 and 45 respectively.
For US GAAP purposes, WMC Resources applies APB Opinion No. 25, “Accounting for Stock Issued to Employees,” and related interpretations in accounting for its stock-based compensation plans. APB 25 utilizes the intrinsic value method to recognize compensation costs related to employee stock grants. Compensation is recognized when the quoted market price is higher than the exercise price on the measurement date which is typically the grant date to the employee. To the extent that a compensation charge is recorded, it would be amortized over the vesting period of the options which is typically one year. WMC Resources grants are fixed as the number of options and the exercise price are fixed on the date of grant. Compensation costs charged against WMC Resources’ results of operations were nil in 2003, 2002, and 2001.
F-85
WMC RESOURCES LTD AND CONTROLLED ENTITIES
NOTES TO THE CONSOLIDATED FINANCIAL STATEMENTS—(Continued)
| 46. | | OTHER US GAAP DISCLOSURES (Continued) |
| (g) | | Stock options (continued) |
Fair value disclosures:
WMC Resources has adopted the disclosure-only provisions of SFAS No. 123, “Accounting for Stock-Based Compensation.” If WMC Resources had elected to recognize compensation costs based on the fair value at the date of grant for WMC Resources common stock and SAP awards granted consistent with the provisions of SFAS No. 123, net (loss)/income available to common shareholders, and the respective per share amounts would have been as follows:
| | | | | | |
| | | Year to 31 Dec 2003
| | | Year to 31 Dec
2002
| |
Net income/(loss) available to common shareholders (A$m) | | | | | | |
- As reported US GAAP | | 732.4 | | | (109.5 | ) |
- Pro forma | | 731.4 | | | (129.9 | ) |
Net income/(loss) available to common shareholders per share (Australian cents): | | | | | | |
- As reported US GAAP—basic | | 64.7 | | | (9.8 | ) |
- Pro forma—basic | | 64.6 | | | (11.6 | ) |
- As reported US GAAP—diluted | | 64.0 | | | (9.8 | ) |
- Pro forma—diluted | | 63.9 | | | (11.6 | ) |
Assumptions: | | | | | | |
- Risk free interest rates | | 5.6 | % | | 4.8 | % |
- Dividend yield | | 0 | % | | 0 | % |
- Volatility | | 34.6 | % | | 29.8 | % |
- Expected life in years | | 3.20 | | | 3.77 | |
The weighted-average fair value for all WMC Resources stock options and SAPs was estimated using the Black-Scholes option-pricing model.
| (h) | | Long lived asset held for sale |
During 2001, WMC Resources reviewed its asset strategy and decided to focus on building a portfolio of long life, low cost assets. As a result, the company proposed divestment of the Kambalda nickel mines as well as the gold and talc businesses. Not all designated assets have been divested and accordingly the following long lived asset is held for sale:
2003 and 2002—Lanfranchi
The Lanfranchi mine formed part of the Kambalda nickel mines. The sub-lease of WMC Resources interest is expected during 2004, subject to regulatory approval. This asset is currently in the “Nickel” business segment. At 31 December 2003, Lanfranchi had a carrying value of nil (2002: nil). The financial result for the year ended 31 December 2003 was A$nil (2002: A$1.0 million profit).
2001—Long/Victor
The Long/Victor mine formed part of the Kambalda nickel mines. This asset was sold during 2002 for A$14 million, recognizing an after tax profit of A$9.4 million. This asset was held in the “Nickel” business segment. At 31 December 2001, Long/Victor had a carrying value of A$1.6 million. The financial result for the year ended 31 December 2001 was immaterial.
Sales contracts and commitments
WMC Resources sells nickel metal, nickel matte, nickel concentrate and various intermediate products. All nickel metal sales for the year ended December 31, 2003 were made under short to medium term contractual arrangements, to a large number of customers in Europe, North America and Asia. These contracts extend through varying periods expiring between 2004 and 2005. Approximately 90% of nickel-in-matte and nickel-in-concentrate sales for the year ended December 31, 2003 were made under long term contracts expiring between 2004 and 2006. Prices in these contracts are generally not fixed, and provide for sales at prevailing market prices at the contractual settlement dates.
Approximately 90% of Olympic Dam’s copper production for the year ended December 31, 2003 was sold to customers in Europe, Australia and Asia under contracts which are negotiated. Prices in these contracts are generally not fixed, and provide for sales at prevailing market prices at the contractual settlement dates.
F-86
WMC RESOURCES LTD AND CONTROLLED ENTITIES
NOTES TO THE CONSOLIDATED FINANCIAL STATEMENTS—(Continued)
| 46. | | OTHER US GAAP DISCLOSURES (Continued) |
| (i) | | Commitments (continued) |
In the next several years more than 90% of Olympic Dam’s uranium production is committed under long-term sales contracts with well established and reputable electricity generating utilities. Sales of uranium oxide in 2003 were made to the United Kingdom, Finland, Sweden, Belgium, France, Japan, Canada and the United States. Contract prices are a combination of variable and fixed arrangements.
In relation to the fertilizer operations, there are sales arrangements in place for the total fertilizer production based on 2003 volumes (& 2004 planned volumes). There are supply contracts with major Australian fertilizer distributors for the delivery of between 440,000 and 590,000 tonnes of DAP per year and for between 120,000 and 200,000 tonnes of MAP per year. These contracts extend through varying periods, expiring between 2005 and 2010. The fertilizer operation has an export marketing agreement in place with Cargill Fertilizers Incorporated for 350,000 to 500,000 tonnes per year of ammonium phosphate fertilizers. This contract expires at the end of 2004. Prices for all contract sales are formula based and reflect published market prices in the three to four week period preceding either bill of lading or confirmation of sale.
All of WMC Resources’ major products are able to be purchased on a spot market in order to fulfill the sales contracts referred to above if required.
Take or pay commitments
WMC Resources is party to a number of gas supply, gas conversion, shiploading, rail transport and sulphuric acid supply agreements. Under these take or pay contracts, WMC Resources is obligated to pay a minimum amount for the above commodities and services even if those commodities or services are not required for operations. Commitments related to these contracts total A$205.6 million in 2004, A$213.1 million in 2005, A$216.2 million in 2006, A$205.0 million in 2007, and A$205.0 million in 2008. Expenditures under these contracts totaled A$214.2 million in 2003, A$203.5 million in 2002 and A$168.3 million in 2001.
F-87
WMC RESOURCES LTD AND CONTROLLED ENTITIES
NOTES TO THE CONSOLIDATED FINANCIAL STATEMENTS—(Continued)
| 46. | | OTHER US GAAP DISCLOSURES (Continued) |
The following disclosures are presented in accordance with US GAAP:
The following table discloses information in accordance with US GAAP and is based on the information from the WMC Superannuation Plan for the defined benefit category of the fund, which had a financial year ended 30 June. The most recent audited information available is at 30 June 2003. Prior years have been restated to reflect the defined benefit category only, whereas previously they showed all three categories of the Plan, including defined contribution assets and liabilities.
PLUM SUPERANNUATION FUND (WMC Resources Ltd’s Superannuation Fund)
| | | | | | | | | |
| | | Year to 31 Dec 2003 A$m
| | | Year to 31 Dec 2002 A$m
| | | Year to 31 Dec 2001 A$m
| |
Change in benefit obligation | | | | | | | | | |
Benefit obligation at end of prior year | | 85.8 | | | 117.8 | | | 98.7 | |
Service cost | | 4.0 | | | 6.3 | | | 5.5 | |
Interest cost | | 4.7 | | | 5.7 | | | 5.3 | |
Actuarial (gains) losses | | (0.8 | ) | | (33.9 | ) | | 12.9 | |
Members transferring from other funds | | — | | | — | | | 1.7 | |
Benefits and expenses paid | | (19.8 | ) | | (11.5 | ) | | (7.6 | ) |
Plan participants contributions | | 1.1 | | | 1.4 | | | 1.3 | |
| | |
|
| |
|
| |
|
|
Benefit obligation at end of period | | 75.0 | | | 85.8 | | | 117.8 | |
| | |
|
| |
|
| |
|
|
Change in plan assets | | | | | | | | | |
Fair value of plan assets at end of prior year | | 60.8 | | | 99.4 | | | 107.1 | |
Actual return on plan assets | | 3.8 | | | (24.4 | ) | | (5.6 | ) |
Transfers in from other funds | | — | | | — | | | 1.7 | |
Employer contributions | | 4.9 | | | 2.4 | | | 2.5 | |
Plan participants’ contributions | | 1.1 | | | 1.4 | | | 1.3 | |
Benefits and expenses paid | | (19.8 | ) | | (11.5 | ) | | (7.6 | ) |
Adjustment | | — | | | (6.5 | ) | | — | |
| | |
|
| |
|
| |
|
|
Fair value of plan assets at end of period | | 50.8 | | | 60.8 | | | 99.4 | |
| | |
|
| |
|
| |
|
|
Reconciliation of funded status | | | | | | | | | |
Funded status | | (24.2 | ) | | (25.1 | ) | | (18.3 | ) |
Unrecognized net gain | | (14.5 | ) | | (18.5 | ) | | (24.3 | ) |
Unamortized prior service cost | | — | | | — | | | 0.1 | |
Unrecognized net transition asset | | — | | | — | | | (1.6 | ) |
| | |
|
| |
|
| |
|
|
Accrued pension cost | | (38.7 | ) | | (43.6 | ) | | (44.1 | ) |
| | |
|
| |
|
| |
|
|
Components of net periodic benefit costs | | | | | | | | | |
Service cost | | 4.0 | | | 6.3 | | | 5.5 | |
Interest cost | | 4.7 | | | 5.7 | | | 5.3 | |
Expected return on plan assets | | (4.2 | ) | | (5.8 | ) | | (10.4 | ) |
Amortization of prior service cost | | — | | | 0.1 | | | 0.1 | |
Amortization of gain | | (0.7 | ) | | (0.1 | ) | | (3.0 | ) |
Amortization of unrecognized net transition asset | | — | | | (1.6 | ) | | (3.3 | ) |
FAS 88 adjustment | | (3.7 | ) | | (2.9 | ) | | — | |
| | |
|
| |
|
| |
|
|
Net periodic benefit costs | | 0.1 | | | 1.7 | | | (5.8 | ) |
| | |
|
| |
|
| |
|
|
Weighted average assumptions | | | | | | | | | |
Discount rate | | 5.5 | | | 6.0 | | | 6.0 | |
Expected long-term return on plan assets | | 7.0 | | | 7.0 | | | 7.5 | |
Rate of compensation increase | | 4.0 | | | 3.5 | | | 3.5 | |
| | | |
WMC Resources is a sponsor of defined contribution pension plans. Expenses relating to those plans were | | 22.6 | | | 20.1 | | | 20.6 | |
At balance date the plan does not hold any ordinary shares directly in WMC Resources Ltd (WMC Limited’s shares held in prior years were Dec 2002: nil, Dec 2001: 81,790).
F-88
WMC RESOURCES LTD AND CONTROLLED ENTITIES
NOTES TO THE CONSOLIDATED FINANCIAL STATEMENTS—(Continued)
| 46. | | OTHER US GAAP DISCLOSURES (Continued) |
| (j) | | Pension Funds (continued) |
Additional pension information:
| (i) | | Reconciliation of the pension benefit obligation at the beginning and end of the period |
| | | |
| | | 31 Dec
2003
A$m
| |
Benefit obligation at end of prior year | | 85.8 | |
Company service cost | | 4.0 | |
Interest cost | | 4.7 | |
Plan participants’ contributions | | 1.1 | |
Benefits, administrative expenses, taxes and premiums paid | | (19.8 | ) |
Actuarial (gain)/loss | | (0.8 | ) |
| | |
|
|
Benefit obligation at end of year | | 75.0 | |
| | |
|
|
| (ii) | | Reconciliation of the fair value of the plan assets over the accounting period |
| | | |
| | | 31 Dec
2003
A$m
| |
Fair value of plan assets at end of prior year | | 60.8 | |
Actual return on plan assets | | 3.8 | |
Employer contributions | | 4.9 | |
Plan participants’ contributions | | 1.1 | |
Benefits, administrative expenses, taxes and premiums paid | | (19.8 | ) |
| | |
|
|
Fair value of plan assets at end of year | | 50.8 | |
| | |
|
|
| (iii) | | Reconciliation of the funded status of the Plan to amounts reported in the statement of financial position. |
| | | |
| | | 31 Dec
2003
A$m
| |
Funded status | | (24.2 | ) |
Unrecognized net (gain)/loss | | (14.5 | ) |
| | |
|
|
Net amount recognized | | (38.7 | ) |
| | |
|
|
Amount recognized in the statement of financial position consist of: | | | |
Accrued benefit liability | | (38.7 | ) |
| | |
|
|
Net amount recognized | | (38.7 | ) |
| | |
|
|
| (iv) | | Additional year-end information for pension plans with accumulated benefit obligations in excess of plan assets: |
| | | |
| | | 31 Dec
2003
A$m
| |
Projected benefit obligation | | 75.0 | |
Accumulated benefit obligation | | 58.7 | |
Fair value of plan assets | | 50.8 | |
| |
Components of net periodic pension cost | | | |
Service cost | | 4.0 | |
Interest cost | | 4.7 | |
Expected return on plan assets | | (4.2 | ) |
| |
Recognized actuarial (gain)/loss | | (0.7 | ) |
| | |
|
|
Net periodic pension cost | | 3.8 | |
| | |
|
|
FAS 88 adjustment | | (3.7 | ) |
| | |
|
|
Net pension expense | | 0.1 | |
| | |
|
|
F-89
WMC RESOURCES LTD AND CONTROLLED ENTITIES
NOTES TO THE CONSOLIDATED FINANCIAL STATEMENTS—(Continued)
| 46. | | OTHER US GAAP DISCLOSURES (Continued) |
| (j) | | Pension Funds (continued) |
| | | | | | |
| | | Benchmark
| | | Actual
| |
Equity | | 60 | % | | 63 | % |
Property | | 4 | % | | 4 | % |
Fixed Interest | | 30 | % | | 30 | % |
Cash | | 0 | % | | 0 | % |
Other | | 6 | % | | 3 | % |
| | |
|
| |
|
|
Total | | 100 | % | | 100 | % |
| (vi) | | Estimated future benefit payments |
| | |
| | | A$m
|
Year to 31 December 2004 | | 4.3 |
Year to 31 December 2005 | | 4.5 |
Year to 31 December 2006 | | 5.3 |
Year to 31 December 2007 | | 6.9 |
Year to 31 December 2008 | | 6.4 |
Years to 31 December 2009 - 2013 | | 31.3 |
| (vii) | | Estimated future contributions |
Employer contributions for defined benefit liabilities during the fiscal year ending 31 December 2004 are expected to total A$5.4m. The employer currently contributes 15.8% of employees’ salaries and makes additional contributions of A$174,000 per month. Members contribute at 3.4% of post-tax salary or 4.0% of pre-tax salary.
| (viii) | | Expected return on assets assumption |
The expected return on assets assumption is determined by weighting the expected long-term return for each asset class by the benchmark allocation of assets to each class. The returns used for each class are net of investment tax and investment fees.
The investment strategy is:
| | • | | to achieve a real return of 3.5%pa or higher over a rolling 5 year periods; and |
| | • | | to have a low probability of a negative real return in any 1 year. |
F-90
WMC RESOURCES LTD AND CONTROLLED ENTITIES
NOTES TO THE CONSOLIDATED FINANCIAL STATEMENTS—(Continued)
47. SUPPLEMENTAL GUARANTOR INFORMATION
Supplemental condensed consolidating financial information (in accordance with Australian GAAP) of the Guarantors is presented on pages F-92 through F-99. This supplemental financial information should be read in conjunction with the Consolidated Financial Statements. A reconciliation of the Group’s results and equity under Australian GAAP to US GAAP is also presented on a condensed consolidating basis below.
In accordance with SEC Rules and Regulations, the “Guarantor Parent” and “Guarantor subsidiaries” columns use the equity method to account for the results of all of the subsidiaries. The “eliminations and reclassifications” column includes the following entries: eliminations of intragroup sales, purchases and other income/expenses and all intragroup balances; elimination of intragroup investments accounted for under the equity method as required for condensed consolidating financial information; and the allocation of fair value adjustments as outlined in Notes 45(o).
In respect to the guarantor entities:
| | • | | each subsidiary issuer or subsidiary guarantor is 100% owned by the parent entity. |
| | • | | all guarantees are full and unconditional |
| | • | | all guarantees are joint and several. |
The ability of the subsidiary guarantors to pay dividends and make other payments to the parent guarantor is restricted by, among other things, applicable corporate and other laws and regulations. This ability may be further restricted in the future by agreements to which the subsidiary guarantors may be parties. Accordingly in certain circumstances, the parent guarantor may be unable to make required payments on its debt obligations as these obligations become due.
F-91
WMC RESOURCES LTD AND CONTROLLED ENTITIES
NOTES TO THE CONSOLIDATED FINANCIAL STATEMENTS—(Continued)
| 47. | | SUPPLEMENTAL GUARANTOR INFORMATION (Continued) |
| | | Supplemental Condensed Consolidating Statement of Financial Performance |
| | | For the year ended 31 December 2003 |
| | | | | | | | | | | | | | | | | | |
| | | Issuer
WMC
Finance
(USA)
Limited
| | | Guarantor
(Parent)
WMC
Resources
Ltd
| | | Guarantor (subsidiaries)
WMC (Olympic Dam
Corporation) Pty Ltd
WMC Fertilizers Pty Ltd
| | | Other
subsidiaries
| | | Eliminations and
reclassifications
| | | WMC
Resources
Group
| |
Continuing operations: | | | | | | | | | | | | | | | | | | |
Net sales revenue | | — | | | 1,682.9 | | | 957.1 | | | 1,736.1 | | | (1,374.8 | ) | | 3,001.3 | |
Cost of goods sold | | — | | | (1,079.1 | ) | | (857.3 | ) | | (1,636.4 | ) | | 1,489.4 | | | (2,083.4 | ) |
Selling and distribution | | — | | | (22.6 | ) | | (33.3 | ) | | (161.7 | ) | | (21.6 | ) | | (239.2 | ) |
General and administrative | | — | | | (150.8 | ) | | (110.9 | ) | | (8.5 | ) | | 49.5 | | | (220.7 | ) |
General and administrative— significant items | | — | | | (8.4 | ) | | — | | | — | | | — | | | (8.4 | ) |
Exploration and evaluation | | — | | | (9.6 | ) | | — | | | (23.2 | ) | | 8.6 | | | (24.2 | ) |
Other expenses | | (23.5 | ) | | (110.8 | ) | | (61.6 | ) | | 445.2 | | | (356.1 | ) | | (106.8 | ) |
Other expenses-significant items | | — | | | — | | | (48.5 | ) | | — | | | — | | | (48.5 | ) |
Net profit / (loss) from subsidiary entities | | — | | | 36.9 | | | 3.1 | | | — | | | (40.0 | ) | | — | |
Other income | | 39.1 | | | 235.1 | | | 8.3 | | | 316.3 | | | (559.2 | ) | | 39.6 | |
Other income-significant items | | — | | | — | | | — | | | — | | | — | | | — | |
| | |
|
| |
|
| |
|
| |
|
| |
|
| |
|
|
Profit / (loss) before interest and income tax | | 15.6 | | | 573.6 | | | (143.1 | ) | | 667.8 | | | (804.2 | ) | | 309.7 | |
Interest expense | | (37.7 | ) | | (228.5 | ) | | (160.6 | ) | | (219.0 | ) | | 577.5 | | | (68.3 | ) |
| | |
|
| |
|
| |
|
| |
|
| |
|
| |
|
|
Profit / (loss) before income taxes | | (22.1 | ) | | 345.1 | | | (303.7 | ) | | 448.8 | | | (226.7 | ) | | 241.4 | |
Income tax credit / (expense) | | (2.3 | ) | | (99.5 | ) | | 95.8 | | | 51.8 | | | (48.1 | ) | | (2.3 | ) |
| | |
|
| |
|
| |
|
| |
|
| |
|
| |
|
|
Net profit / (loss) from continuing operations | | (24.4 | ) | | 245.6 | | | (207.9 | ) | | 500.6 | | | (274.8 | ) | | 239.1 | |
| | |
|
| |
|
| |
|
| |
|
| |
|
| |
|
|
Discontinued operations: | | | | | | | | | | | | | | | | | | |
Net expenses | | — | | | — | | | — | | | (3.8 | ) | | — | | | (3.8 | ) |
Profit on disposal of Meliadine | | — | | | — | | | — | | | 10.3 | | | — | | | 10.3 | |
| | |
|
| |
|
| |
|
| |
|
| |
|
| |
|
|
Net profit / (loss) from discontinued operations | | — | | | — | | | — | | | 6.5 | | | — | | | 6.5 | |
| | |
|
| |
|
| |
|
| |
|
| |
|
| |
|
|
| | | | | | |
Consolidated operations | | | | | | | | | | | | | | | | | | |
Net sales revenue | | — | | | 1,682.9 | | | 957.1 | | | 1,736.1 | | | (1,374.8 | ) | | 3,001.3 | |
Cost of goods sold | | — | | | (1,079.1 | ) | | (857.3 | ) | | (1,636.4 | ) | | 1,489.4 | | | (2,083.4 | ) |
Selling and distribution | | — | | | (22.6 | ) | | (33.3 | ) | | (161.7 | ) | | (21.6 | ) | | (239.2 | ) |
General and administrative | | — | | | (150.8 | ) | | (110.9 | ) | | (8.5 | ) | | 49.5 | | | (220.7 | ) |
General and administrative— significant items | | — | | | (8.4 | ) | | — | | | — | | | — | | | (8.4 | ) |
Exploration and evaluation | | — | | | (9.6 | ) | | — | | | (27.0 | ) | | 8.6 | | | (28.0 | ) |
Other expenses | | (23.5 | ) | | (110.8 | ) | | (61.6 | ) | | 445.2 | | | (356.1 | ) | | (106.8 | ) |
Other expenses-significant items | | — | | | — | | | (48.5 | ) | | (13.5 | ) | | — | | | (62.0 | ) |
Net profit / (loss) from subsidiary entities | | — | | | 36.9 | | | 3.1 | | | — | | | (40.0 | ) | | — | |
Other income | | 39.1 | | | 235.1 | | | 8.3 | | | 316.3 | | | (559.2 | ) | | 39.6 | |
Other income-significant items | | — | | | — | | | — | | | 23.8 | | | — | | | 23.8 | |
| | |
|
| |
|
| |
|
| |
|
| |
|
| |
|
|
Profit / (loss) before interest and income tax | | 15.6 | | | 573.6 | | | (143.1 | ) | | 674.3 | | | (804.2 | ) | | 316.2 | |
Interest expense | | (37.7 | ) | | (228.5 | ) | | (160.6 | ) | | (219.0 | ) | | 577.5 | | | (68.3 | ) |
| | |
|
| |
|
| |
|
| |
|
| |
|
| |
|
|
Profit / (loss) before income taxes | | (22.1 | ) | | 345.1 | | | (303.7 | ) | | 455.3 | | | (226.7 | ) | | 247.9 | |
Income tax credit/(expense) | | (2.3 | ) | | (99.5 | ) | | 95.8 | | | 51.8 | | | (48.1 | ) | | (2.3 | ) |
| | |
|
| |
|
| |
|
| |
|
| |
|
| |
|
|
Net profit / (loss) attributable to WMC Resources shareholders | | (24.4 | ) | | 245.6 | | | (207.9 | ) | | 507.1 | | | (274.8 | ) | | 245.6 | |
| | |
|
| |
|
| |
|
| |
|
| |
|
| |
|
|
US GAAP adjustments to income | | 38.8 | | | 486.8 | | | 210.8 | | | (67.2 | ) | | (182.4 | ) | | 486.8 | |
| | |
|
| |
|
| |
|
| |
|
| |
|
| |
|
|
Net profit / (loss) attributable to WMC Resources shareholders in accordance with US GAAP | | 14.4 | | | 732.4 | | | 2.9 | | | 439.9 | | | (457.2 | ) | | 732.4 | |
| | |
|
| |
|
| |
|
| |
|
| |
|
| |
|
|
F-92
WMC RESOURCES LTD AND CONTROLLED ENTITIES
NOTES TO THE CONSOLIDATED FINANCIAL STATEMENTS—(Continued)
| 47. | | SUPPLEMENTAL GUARANTOR INFORMATION (Continued) |
Supplemental Condensed Consolidating Statement of Financial Position
As at 31 December 2003
| | | | | | | | | | | | | | | | |
| | | Issuer
WMC
Finance
(USA)
Limited
| | Guarantor
(Parent)
WMC
Resources
Ltd
| | | Guarantor
(subsidiaries)
WMC (Olympic
Dam Corporation)
Pty Ltd WMC Fertilizers Pty Ltd
| | | Other
subsidiaries
| | Eliminations and
reclassifications
| | | WMC
Resources
Group
| |
Current Assets | | | | | | | | | | | | | | | | |
Cash assets | | — | | — | | | — | | | 100.3 | | — | | | 100.3 | |
Receivables | | 6.8 | | 443.9 | | | 191.9 | | | 3,003.2 | | (3,195.4 | ) | | 450.4 | |
Other financial assets | | — | | — | | | — | | | 13.1 | | — | | | 13.1 | |
Inventories | | — | | 233.4 | | | 264.6 | | | 0.1 | | 47.7 | | | 545.8 | |
Other | | — | | 9.9 | | | 130.3 | | | 3.8 | | (75.9 | ) | | 68.1 | |
| | |
| |
|
| |
|
| |
| |
|
| |
|
|
Total Current Assets | | 6.8 | | 687.2 | | | 586.8 | | | 3,120.5 | | (3,223.6 | ) | | 1,177.7 | |
| | |
| |
|
| |
|
| |
| |
|
| |
|
|
Non-Current Assets | | | | | | | | | | | | | | | | |
Receivables | | 957.2 | | 371.2 | | | 185.1 | | | 233.1 | | (1,469.3 | ) | | 277.3 | |
Intragroup investments | | — | | 2,376.0 | | | 180.9 | | | 200.0 | | (2,756.9 | ) | | — | |
Other financial assets | | — | | 0.4 | | | — | | | 31.7 | | (10.8 | ) | | 21.3 | |
Inventories | | — | | 53.2 | | | 18.0 | | | — | | — | | | 71.2 | |
Exploration and evaluation | | — | | 0.3 | | | — | | | 68.2 | | — | | | 68.5 | |
Property, plant and equipment | | — | | 1,265.9 | | | 3,526.9 | | | 1.0 | | (273.3 | ) | | 4,520.5 | |
Acquired mineral rights | | — | | — | | | — | | | 110.9 | | 1,243.9 | | | 1,354.8 | |
Deferred tax assets | | — | | 46.4 | | | 45.6 | | | 63.4 | | (109.5 | ) | | 46.0 | |
Other | | 9.4 | | 72.8 | | | 9.8 | | | 61.4 | | (130.5 | ) | | 22.9 | |
| | |
| |
|
| |
|
| |
| |
|
| |
|
|
Total Non-Current Assets | | 966.6 | | 4,186.2 | | | 3,966.3 | | | 769.7 | | (3,506.3 | ) | | 6,382.5 | |
| | |
| |
|
| |
|
| |
| |
|
| |
|
|
Total Assets | | 973.4 | | 4,873.4 | | | 4,553.1 | | | 3,890.2 | | (6,729.9 | ) | | 7,560.2 | |
| | |
| |
|
| |
|
| |
| |
|
| |
|
|
Current Liabilities | | | | | | | | | | | | | | | | |
Payables | | 6.6 | | 201.7 | | | 1,569.5 | | | 324.0 | | (1,669.6 | ) | | 432.2 | |
Interest-bearing liabilities | | — | | — | | | — | | | 194.7 | | 17.3 | | | 212.0 | |
Current tax liabilities | | — | | — | | | — | | | 1.3 | | — | | | 1.3 | |
Provisions | | — | | 44.7 | | | 19.5 | | | 37.1 | | (33.6 | ) | | 67.7 | |
Other | | — | | 86.2 | | | 92.0 | | | 6.5 | | (0.3 | ) | | 184.4 | |
| | |
| |
|
| |
|
| |
| |
|
| |
|
|
Total Current Liabilities | | 6.6 | | 332.6 | | | 1,681.0 | | | 563.6 | | (1,686.2 | ) | | 897.6 | |
| | |
| |
|
| |
|
| |
| |
|
| |
|
|
Non-Current Liabilities | | | | | | | | | | | | | | | | |
Payables | | — | | 251.4 | | | — | | | 2,037.5 | | (1,909.7 | ) | | 379.2 | |
Interest-bearing liabilities | | 940.9 | | — | | | — | | | 203.6 | | (3.3 | ) | | 1,141.2 | |
Deferred tax liabilities | | 2.3 | | — | | | 308.0 | | | — | | 71.7 | | | 382.0 | |
Net accumulated losses of subsidiaries in excess of investments | | — | | — | | | 0.3 | | | — | | (0.3 | ) | | — | |
Provisions | | — | | 89.6 | | | 31.5 | | | 0.3 | | 0.4 | | | 121.8 | |
Other | | — | | 250.1 | | | 268.3 | | | 58.1 | | 112.2 | | | 688.7 | |
| | |
| |
|
| |
|
| |
| |
|
| |
|
|
Total Non-Current Liabilities | | 943.2 | | 591.1 | | | 608.1 | | | 2,299.5 | | (1,729.0 | ) | | 2,712.9 | |
| | |
| |
|
| |
|
| |
| |
|
| |
|
|
Total Liabilities | | 949.8 | | 923.7 | | | 2,289.1 | | | 2,863.1 | | (3,415.2 | ) | | 3,610.5 | |
| | |
| |
|
| |
|
| |
| |
|
| |
|
|
Net Assets | | 23.6 | | 3,949.7 | | | 2,264.0 | | | 1,027.1 | | (3,314.7 | ) | | 3,949.7 | |
| | |
| |
|
| |
|
| |
| |
|
| |
|
|
Total Equity | | 23.6 | | 3,949.7 | | | 2,264.0 | | | 1,027.1 | | (3,314.7 | ) | | 3,949.7 | |
| | |
| |
|
| |
|
| |
| |
|
| |
|
|
US GAAP adjustments to equity | | 38.8 | | (24.0 | ) | | (225.7 | ) | | 702.3 | | (515.4 | ) | | (24.0 | ) |
| | |
| |
|
| |
|
| |
| |
|
| |
|
|
Total equity in accordance with US GAAP | | 62.4 | | 3,925.7 | | | 2,038.3 | | | 1,729.4 | | (3,830.1 | ) | | 3,925.7 | |
| | |
| |
|
| |
|
| |
| |
|
| |
|
|
F-93
WMC RESOURCES LTD AND CONTROLLED ENTITIES
NOTES TO THE CONSOLIDATED FINANCIAL STATEMENTS—(Continued)
| 47. | | SUPPLEMENTAL GUARANTOR INFORMATION (Continued) |
Supplemental Condensed Consolidating Statement of Cash flows
For the year ended 31 December 2003
| | | | | | | | | | | | | | | | | | |
| | | Issuer
WMC
Finance
(USA)
Limited
| | | Guarantor
(Parent)
WMC
Resources
Ltd
| | | Guarantor
(subsidiaries)
WMC (Olympic
Dam Corporation)
Pty Ltd WMC Fertilizers Pty
Ltd
| | | Other
subsidiaries
| | | Eliminations and
reclassifications
| | | WMC
Resources
Group
| |
Net cash (used in) / provided by operating activities | | 1,066.0 | | | 203.6 | | | 427.8 | | | (550.9 | ) | | (504.0 | ) | | 642.5 | |
| | |
|
| |
|
| |
|
| |
|
| |
|
| |
|
|
Cash flows from investing activities: | | | | | | | | | | | | | | | | | | |
Payments for property, plant and equipment | | — | | | (224.0 | ) | | (437.2 | ) | | (0.7 | ) | | — | | | (661.9 | ) |
Proceeds from sale of Non-current assets | | — | | | 10.8 | | | 0.6 | | | 11.2 | | | — | | | 22.6 | |
Proceeds from insurance claims | | — | | | — | | | — | | | 12.0 | | | — | | | 12.0 | |
Payments for Research and development | | — | | | — | | | (0.1 | ) | | — | | | — | | | (0.1 | ) |
Payments for evaluation expenditure | | — | | | — | | | — | | | (7.3 | ) | | — | | | (7.3 | ) |
Net increase / (decrease) in loans from related bodies corporate | | (1,066.0 | ) | | — | | | — | | | 1,671.0 | | | (605.0 | ) | | — | |
Increase in deposits with unrelated bodies corporate | | — | | | — | | | — | | | 0.2 | | | (0.2 | ) | | — | |
Demerger costs paid | | — | | | (45.2 | ) | | — | | | — | | | — | | | (45.2 | ) |
| | |
|
| |
|
| |
|
| |
|
| |
|
| |
|
|
Net cash (used in) / provided by investing activities | | (1,066.0 | ) | | (258.4 | ) | | (436.7 | ) | | 1,686.4 | | | (605.2 | ) | | (679.9 | ) |
| | |
|
| |
|
| |
|
| |
|
| |
|
| |
|
|
Cash flows from financing activities | | | | | | | | | | | | | | | | | | |
Proceeds from borrowings | | — | | | — | | | (9.8 | ) | | — | | | 1,096.3 | | | 1,086.5 | |
Repayments of borrowing | | — | | | — | | | 18.7 | | | (1,112.6 | ) | | 61.3 | | | (1,032.6 | ) |
Proceeds from share issue | | — | | | 54.8 | | | — | | | — | | | — | | | 54.8 | |
Payments on close-out of interest rate hedge | | — | | | — | | | — | | | — | | | (38.5 | ) | | (38.5 | ) |
Global bond issue cost paid | | — | | | — | | | — | | | — | | | (9.9 | ) | | (9.9 | ) |
| | |
|
| |
|
| |
|
| |
|
| |
|
| |
|
|
Net cash (used in) / provided by financing activities | | — | | | 54.8 | | | 8.9 | | | (1,112.6 | ) | | 1,109.2 | | | 60.3 | |
| | |
|
| |
|
| |
|
| |
|
| |
|
| |
|
|
Net (decrease) / increase in cash held | | — | | | — | | | — | | | 22.9 | | | — | | | 22.9 | |
Cash at the beginning of the financial year | | — | | | — | | | — | | | 90.5 | | | — | | | 90.5 | |
Effects of exchange rate changes on foreign currency cash balances | | — | | | — | | | — | | | (13.1 | ) | | — | | | (13.1 | ) |
| | |
|
| |
|
| |
|
| |
|
| |
|
| |
|
|
Cash at end of financial year | | — | | | — | | | — | | | 100.3 | | | — | | | 100.3 | |
| | |
|
| |
|
| |
|
| |
|
| |
|
| |
|
|
US GAAP reconciliation of Cash flows: | | | | | | | | | | | | | | | | | | |
Cash flows from financing activities as reported | | — | | | 54.8 | | | 8.9 | | | (1,112.6 | ) | | 1,109.2 | | | 60.3 | |
| | |
|
| |
|
| |
|
| |
|
| |
|
| |
|
|
Net cash (used in) / provided by financing activities-US GAAP | | — | | | 54.8 | | | 8.9 | | | (1,112.6 | ) | | 1,109.2 | | | 60.3 | |
| | |
|
| |
|
| |
|
| |
|
| |
|
| |
|
|
Cash flows from operating activities as reported | | 1,066.0 | | | 203.6 | | | 427.8 | | | (550.9 | ) | | (504.0 | ) | | 642.5 | |
US GAAP adjustment to cash flows | | — | | | (86.2 | ) | | — | | | (15.0 | ) | | — | | | (101.2 | ) |
| | |
|
| |
|
| |
|
| |
|
| |
|
| |
|
|
Net cash (used in) / provided by operating activities-US GAAP | | 1,066.0 | | | 117.4 | | | 427.8 | | | (565.9 | ) | | (504.0 | ) | | 541.3 | |
| | |
|
| |
|
| |
|
| |
|
| |
|
| |
|
|
Cash flows from investing activities as reported | | (1,066.0 | ) | | (258.4 | ) | | (436.7 | ) | | 1,686.4 | | | (605.2 | ) | | (679.9 | ) |
US GAAP adjustments to cash flows | | — | | | 86.2 | | | — | | | 7.3 | | | — | | | 93.5 | |
| | |
|
| |
|
| |
|
| |
|
| |
|
| |
|
|
Net cash (used in) / provided by investing activities-US GAAP | | (1,066.0 | ) | | (172.2 | ) | | (436.7 | ) | | 1,693.7 | | | (605.2 | ) | | (586.4 | ) |
| | |
|
| |
|
| |
|
| |
|
| |
|
| |
|
|
Net (decrease) / increase in cash and cash equivalents—US GAAP | | — | | | — | | | — | | | 15.2 | | | — | | | 15.2 | |
Cash and cash equivalents at the beginning of the year—US GAAP | | — | | | — | | | — | | | 74.3 | | | — | | | 74.3 | |
Effects of exchange rate changes on foreign currency cash balances—US GAAP | | — | | | — | | | — | | | (13.1 | ) | | — | | | (13.1 | ) |
| | |
|
| |
|
| |
|
| |
|
| |
|
| |
|
|
Cash and cash equivalents at the end of the year—US GAAP | | — | | | — | | | — | | | 76.4 | | | — | | | 76.4 | |
| | |
|
| |
|
| |
|
| |
|
| |
|
| |
|
|
F-94
WMC RESOURCES LTD AND CONTROLLED ENTITIES
NOTES TO THE CONSOLIDATED FINANCIAL STATEMENTS—(Continued)
| 47. | | SUPPLEMENTAL GUARANTOR INFORMATION (Continued) |
Supplemental Condensed Consolidating Statement of Financial Performance
For the year ended 31 December 2002
| | | | | | | | | | | | | | | | | | |
| | | Issuer
WMC
Finance
(USA)
Limited
| | | Guarantor
(Parent)
WMC
Resources
Ltd
| | | Guarantor
(subsidiaries)
WMC
(Olympic
Dam
Corporation)
Pty Ltd
WMC
Fertilizers
Pty Ltd
| | | Other
subsidiaries
| | | Eliminations
and
reclassifications
| | | WMC
Resources
Group
| |
Continuing operations: | | | | | | | | | | | | | | | | | | |
Net sales revenue | | — | | | 1,323.6 | | | 1,041.1 | | | 1,330.6 | | | (1,208.1 | ) | | 2,487.2 | |
Cost of goods sold | | — | | | (900.8 | ) | | (844.0 | ) | | (1,257.8 | ) | | 1,136.3 | | | (1,866.3 | ) |
Selling and distribution | | — | | | (19.4 | ) | | (39.9 | ) | | (77.6 | ) | | (20.4 | ) | | (157.3 | ) |
General and administrative | | — | | | (157.8 | ) | | (90.2 | ) | | (6.5 | ) | | (6.3 | ) | | (260.8 | ) |
General and administrative—significant items | | — | | | (51.2 | ) | | — | | | — | | | — | | | (51.2 | ) |
Exploration and evaluation | | — | | | (12.6 | ) | | — | | | (25.4 | ) | | 1.0 | | | (37.0 | ) |
Other expenses | | (9.7 | ) | | (79.2 | ) | | (51.4 | ) | | (65.2 | ) | | 56.5 | | | (149.0 | ) |
Other expenses-significant items | | — | | | (2.0 | ) | | (97.7 | ) | | — | | | — | | | (99.7 | ) |
Net profit / (loss) from subsidiary entities | | — | | | 151.2 | | | 37.2 | | | — | | | (188.4 | ) | | — | |
Other income | | 198.0 | | | 529.1 | | | 102.5 | | | 843.4 | | | (1,631.2 | ) | | 41.8 | |
Other income-significant items | | — | | | 14.0 | | | 130.4 | | | 65.5 | | | — | | | 209.9 | |
| | |
|
| |
|
| |
|
| |
|
| |
|
| |
|
|
Profit / (loss) before interest and income tax | | 188.3 | | | 794.9 | | | 188.0 | | | 807.0 | | | (1,860.6 | ) | | 117.6 | |
Interest expense | | (295.3 | ) | | (992.3 | ) | | (80.9 | ) | | (218.3 | ) | | 1,434.6 | | | (152.2 | ) |
| | |
|
| |
|
| |
|
| |
|
| |
|
| |
|
|
Profit / (loss) before income taxes | | (107.0 | ) | | (197.4 | ) | | 107.1 | | | 588.7 | | | (426.0 | ) | | (34.6 | ) |
Income tax credit / (expense) | | 2.2 | | | 182.7 | | | (17.0 | ) | | (615.6 | ) | | 467.6 | | | 19.9 | |
| | |
|
| |
|
| |
|
| |
|
| |
|
| |
|
|
Net profit / (loss) from continuing operations | | (104.8 | ) | | (14.7 | ) | | 90.1 | | | (26.9 | ) | | 41.6 | | | (14.7 | ) |
| | |
|
| |
|
| |
|
| |
|
| |
|
| |
|
|
Discontinued operations: | | | | | | | | | | | | | | | | | | |
Net sales revenue | | — | | | — | | | — | | | (1.4 | ) | | — | | | (1.4 | ) |
Net expenses | | — | | | (2.7 | ) | | — | | | (0.7 | ) | | 0.7 | | | (2.7 | ) |
Net profit / (loss) from subsidiary entities | | — | | | (7.8 | ) | | — | | | — | | | 7.8 | | | — | |
Income tax credit / (expense) | | — | | | 0.7 | | | — | | | 0.6 | | | — | | | 1.3 | |
Profit on sale of right to Gold Royalty | | — | | | 15.4 | | | — | | | — | | | — | | | 15.4 | |
Profit of sale of Central Norseman Gold Corporation Limited | | — | | | 32.1 | | | — | | | (7.0 | ) | | — | | | 25.1 | |
| | |
|
| |
|
| |
|
| |
|
| |
|
| |
|
|
Net profit / (loss) from discontinued operations | | — | | | 37.7 | | | — | | | (8.5 | ) | | 8.5 | | | 37.7 | |
| | |
|
| |
|
| |
|
| |
|
| |
|
| |
|
|
Consolidated operations: | | | | | | | | | | | | | | | | | | |
Net sales revenue | | — | | | 1,323.6 | | | 1,041.1 | | | 1,329.2 | | | (1,208.1 | ) | | 2,485.8 | |
Cost of goods sold | | — | | | (900.8 | ) | | (844.0 | ) | | (1,257.8 | ) | | 1,136.3 | | | (1,866.3 | ) |
Selling and distribution | | — | | | (19.4 | ) | | (39.9 | ) | | (77.6 | ) | | (20.4 | ) | | (157.3 | ) |
General and administrative | | — | | | (160.2 | ) | | (90.2 | ) | | (7.2 | ) | | (6.3 | ) | | (263.9 | ) |
General and administrative—significant items | | — | | | (51.2 | ) | | — | | | — | | | — | | | (51.2 | ) |
Exploration and evaluation | | — | | | (12.8 | ) | | — | | | (25.4 | ) | | 1.0 | | | (37.2 | ) |
Other expenses | | (9.7 | ) | | (79.5 | ) | | (51.4 | ) | | (65.2 | ) | | 57.2 | | | (148.6 | ) |
Other expenses-significant items | | — | | | (32.9 | ) | | (97.7 | ) | | (7.0 | ) | | — | | | (137.6 | ) |
Net profit / (loss) from subsidiary entities | | — | | | 143.4 | | | 37.2 | | | — | | | (180.6 | ) | | — | |
Other income | | 198.0 | | | 529.3 | | | 102.5 | | | 843.4 | | | (1,631.2 | ) | | 42.0 | |
Other income-significant items | | — | | | 92.4 | | | 130.4 | | | 65.5 | | | — | | | 288.3 | |
| | |
|
| |
|
| |
|
| |
|
| |
|
| |
|
|
Profit / (loss) before interest and income tax | | 188.3 | | | 831.9 | | | 188.0 | | | 797.9 | | | (1,852.1 | ) | | 154.0 | |
Interest expense | | (295.3 | ) | | (992.3 | ) | | (80.9 | ) | | (218.3 | ) | | 1,434.6 | | | (152.2 | ) |
| | |
|
| |
|
| |
|
| |
|
| |
|
| |
|
|
Profit / (loss) before income taxes | | (107.0 | ) | | (160.4 | ) | | 107.1 | | | 579.6 | | | (417.5 | ) | | 1.8 | |
Income tax credit / (expense) | | 2.2 | | | 183.4 | | | (17.0 | ) | | (615.0 | ) | | 467.6 | | | 21.2 | |
| | |
|
| |
|
| |
|
| |
|
| |
|
| |
|
|
Net profit / (loss) attributable to WMC Resources shareholders | | (104.8 | ) | | 23.0 | | | 90.1 | | | (35.4 | ) | | 50.1 | | | 23.0 | |
| | |
|
| |
|
| |
|
| |
|
| |
|
| |
|
|
US GAAP adjustments to income | | — | | | (132.5 | ) | | 55.3 | | | (179.4 | ) | | 124.1 | | | (132.5 | ) |
| | |
|
| |
|
| |
|
| |
|
| |
|
| |
|
|
Net profit / (loss) attributable to WMC Resources shareholders in accordance with US GAAP | | (104.8 | ) | | (109.5 | ) | | 145.4 | | | (214.8 | ) | | 174.2 | | | (109.5 | ) |
| | |
|
| |
|
| |
|
| |
|
| |
|
| |
|
|
F-95
WMC RESOURCES LTD AND CONTROLLED ENTITIES
NOTES TO THE CONSOLIDATED FINANCIAL STATEMENTS—(Continued)
| 47. | | SUPPLEMENTAL GUARANTOR INFORMATION (Continued) |
Supplemental Condensed Consolidating Statements of Financial Position
As at 31 December 2002
| | | | | | | | | | | | | | | | | |
| | | Issuer
WMC
Finance
(USA)
Limited
| | Guarantor
(Parent)
WMC
Resources
Ltd
| | | Guarantor
(subsidiaries)
WMC (Olympic
Dam Corporation)
Pty Ltd WMC Fertilizers
Pty Ltd
| | | Other
subsidiaries
| | | Eliminations and
reclassifications
| | | WMC
Resources
Group (as restated)1
| |
Current Assets | | | | | | | | | | | | | | | | | |
Cash assets | | — | | — | | | — | | | 90.5 | | | — | | | 90.5 | |
Receivables | | 836.1 | | 262.5 | | | 197.5 | | | 2,454.3 | | | (3,192.7 | ) | | 557.7 | |
Other financial assets | | — | | — | | | — | | | 12.7 | | | — | | | 12.7 | |
Inventories | | — | | 193.2 | | | 210.2 | | | 0.2 | | | 65.2 | | | 468.8 | |
Other | | — | | 9.4 | | | 60.6 | | | 4.8 | | | (5.2 | ) | | 69.6 | |
| | |
| |
|
| |
|
| |
|
| |
|
| |
|
|
Total Current Assets | | 836.1 | | 465.1 | | | 468.3 | | | 2,562.5 | | | (3,132.7 | ) | | 1,199.3 | |
| | |
| |
|
| |
|
| |
|
| |
|
| |
|
|
Non-Current Assets | | | | | | | | | | | | | | | | | |
Receivables | | 773.5 | | 477.6 | | | 306.4 | | | 2,956.6 | | | (4,295.3 | ) | | 218.8 | |
Intragroup investments | | — | | 2,386.8 | | | 177.6 | | | 200.0 | | | (2,764.4 | ) | | — | |
Other financial assets | | — | | 3.6 | | | — | | | 19.3 | | | (10.6 | ) | | 12.3 | |
Inventories | | — | | 52.9 | | | 22.0 | | | — | | | — | | | 74.9 | |
Exploration and evaluation | | — | | 0.3 | | | — | | | 169.9 | | | (17.5 | ) | | 152.7 | |
Property, plant and equipment | | — | | 1,291.8 | | | 3,366.3 | | | 1.4 | | | (323.2 | ) | | 4,336.3 | |
Acquired mineral rights | | — | | — | | | — | | | — | | | 1,269.3 | | | 1,269.3 | |
Deferred tax assets | | — | | 20.6 | | | 63.7 | | | 27.0 | | | (66.7 | ) | | 44.6 | |
Other | | — | | 121.0 | | | 129.8 | | | 96.9 | | | (307.8 | ) | | 39.9 | |
| | |
| |
|
| |
|
| |
|
| |
|
| |
|
|
Total Non-Current Assets | | 773.5 | | 4,354.6 | | | 4,065.8 | | | 3,471.1 | | | (6,516.2 | ) | | 6,148.8 | |
| | |
| |
|
| |
|
| |
|
| |
|
| |
|
|
Total Assets | | 1,609.6 | | 4,819.7 | | | 4,534.1 | | | 6,033.6 | | | (9,648.9 | ) | | 7,348.1 | |
| | |
| |
|
| |
|
| |
|
| |
|
| |
|
|
Current Liabilities | | | | | | | | | | | | | | | | | |
Payables | | 798.0 | | 209.7 | | | 1,986.0 | | | 906.1 | | | (3,241.9 | ) | | 657.9 | |
Interest-bearing liabilities | | 33.9 | | — | | | — | | | 1,344.3 | | | (90.6 | ) | | 1,287.6 | |
Current tax liabilities | | — | | — | | | — | | | 3.8 | | | 0.1 | | | 3.9 | |
Provisions | | — | | 42.3 | | | 18.4 | | | 4.6 | | | 0.7 | | | 66.0 | |
Other | | — | | 10.4 | | | 10.5 | | | 6.0 | | | (9.9 | ) | | 17.0 | |
| | |
| |
|
| |
|
| |
|
| |
|
| |
|
|
Total Current Liabilities | | 831.9 | | 262.4 | | | 2,014.9 | | | 2,264.8 | | | (3,341.6 | ) | | 2,032.4 | |
| | |
| |
|
| |
|
| |
|
| |
|
| |
|
|
Non-Current Liabilities | | | | | | | | | | | | | | | | | |
Payables | | 721.7 | | 745.2 | | | 827.7 | | | 2,967.2 | | | (4,412.1 | ) | | 849.7 | |
Interest-bearing liabilities | | 8.0 | | — | | | — | | | 386.7 | | | (24.8 | ) | | 369.9 | |
Deferred tax liabilities | | — | | — | | | 344.9 | | | — | | | 32.1 | | | 377.0 | |
Provisions | | — | | 82.6 | | | 26.1 | | | 0.3 | | | 0.7 | | | 109.7 | |
Other | | — | | 122.9 | | | 130.1 | | | 72.2 | | | (322.4 | ) | | 2.8 | |
| | |
| |
|
| |
|
| |
|
| |
|
| |
|
|
Total Non-Current Liabilities | | 729.7 | | 950.7 | | | 1,328.8 | | | 3,426.4 | | | (4,726.5 | ) | | 1,709.1 | |
| | |
| |
|
| |
|
| |
|
| |
|
| |
|
|
Total Liabilities | | 1,561.6 | | 1,213.1 | | | 3,343.7 | | | 5,691.2 | | | (8,068.1 | ) | | 3,741.5 | |
| | |
| |
|
| |
|
| |
|
| |
|
| |
|
|
Net Assets | | 48.0 | | 3,606.6 | | | 1,190.4 | | | 342.4 | | | (1,580.8 | ) | | 3,606.6 | |
| | |
| |
|
| |
|
| |
|
| |
|
| |
|
|
Total Equity | | 48.0 | | 3,606.6 | | | 1,190.4 | | | 342.4 | | | (1,580.8 | ) | | 3,606.6 | |
| | |
| |
|
| |
|
| |
|
| |
|
| |
|
|
US GAAP adjustments to equity – as restated1 | | — | | (1,195.9 | ) | | (42.2 | ) | | (201.3 | ) | | 243.5 | | | (1,195.9 | ) |
| | |
| |
|
| |
|
| |
|
| |
|
| |
|
|
Total equity in accordance with US GAAP | | 48.0 | | 2,410.7 | | | 1,148.2 | | | 141.1 | | | (1,337.3 | ) | | 2,410.7 | |
| | |
| |
|
| |
|
| |
|
| |
|
| |
|
|
| 1 | | Refer footnote on page F-70 |
F-96
WMC RESOURCES LTD AND CONTROLLED ENTITIES
NOTES TO THE CONSOLIDATED FINANCIAL STATEMENTS—(Continued)
| 47. | | SUPPLEMENTAL GUARANTOR INFORMATION (Continued) |
Supplemental Condensed Consolidating Statement of Cash flows
For the year ended 31 December 2002
| | | | | | | | | | | | | | | | | | |
| | | Issuer
WMC
Finance
(USA)
Limited
| | | Guarantor
(Parent)
WMC
Resources
Ltd
| | | Guarantor
(subsidiaries)
WMC (Olympic
Dam
Corporation) Pty Ltd WMC Fertilizers
Pty Ltd
| | | Other
subsidiaries
| | | Eliminations and
reclassifications
| | | WMC
Resources
Group
| |
Net cash (used in) / provided by operating activities | | (1,471.2 | ) | | 106.0 | | | 228.4 | | | 209.2 | | | 1,286.0 | | | 358.4 | |
| | |
|
| |
|
| |
|
| |
|
| |
|
| |
|
|
Cash flows from investing activities: | | | | | | | | | | | | | | | | | | |
Payments for property, plant and equipment | | — | | | (196.3 | ) | | (265.8 | ) | | (2.8 | ) | | — | | | (464.9 | ) |
Proceeds from sale of CNGC | | — | | | 33.4 | | | — | | | (7.7 | ) | | — | | | 25.7 | |
Proceeds from sale of Non-current assets | | — | | | 62.7 | | | 1.4 | | | 3.5 | | | — | | | 67.6 | |
Proceeds from insurance claims | | — | | | 4.9 | | | 27.3 | | | (4.9 | ) | | — | | | 27.3 | |
Payments for gold hedge close out | | — | | | — | | | — | | | (34.4 | ) | | — | | | (34.4 | ) |
Proceeds from short term investments | | — | | | — | | | — | | | 2.6 | | | — | | | 2.6 | |
Payments for Research and development | | — | | | (0.3 | ) | | (0.1 | ) | | — | | | — | | | (0.4 | ) |
Payments for evaluation expenditure | | — | | | (1.1 | ) | | — | | | (3.4 | ) | | — | | | (4.5 | ) |
Demerger costs paid | | — | | | (21.7 | ) | | — | | | — | | | — | | | (21.7 | ) |
Net increase / (decrease) in loans from related bodies corporate | | 1,471.2 | | | — | | | — | | | (1,315.5 | ) | | (155.7 | ) | | — | |
Increase in deposits with unrelated bodies corporate | | — | | | — | | | — | | | 49.8 | | | (49.8 | ) | | — | |
| | |
|
| |
|
| |
|
| |
|
| |
|
| |
|
|
Net cash (used in) / provided by investing activities | | 1,471.2 | | | (118.4 | ) | | (237.2 | ) | | (1,312.8 | ) | | (205.5 | ) | | (402.7 | ) |
| | |
|
| |
|
| |
|
| |
|
| |
|
| |
|
|
Cash flows from financing activities | | | | | | | | | | | | | | | | | | |
Deemed equity contribution | | — | | | 12.4 | | | — | | | — | | | — | | | 12.4 | |
Proceeds from borrowings | | — | | | 60.1 | | | 8.4 | | | 2,239.4 | | | — | | | 2,307.9 | |
Repayments of borrowing | | — | | | (60.1 | ) | | — | | | (1,163.9 | ) | | (1,530.3 | ) | | (2,754.3 | ) |
Proceeds from share issue | | — | | | 600.0 | | | — | | | — | | | — | | | 600.0 | |
Amounts advanced to controlled entities | | — | | | (600.0 | ) | | — | | | — | | | 600.0 | | | — | |
Yankee bond redemption fee | | — | | | — | | | — | | | — | | | (150.2 | ) | | (150.2 | ) |
| | |
|
| |
|
| |
|
| |
|
| |
|
| |
|
|
Net cash (used in) / provided by financing activities | | — | | | 12.4 | | | 8.4 | | | 1,075.5 | | | (1,080.5 | ) | | 15.8 | |
| | |
|
| |
|
| |
|
| |
|
| |
|
| |
|
|
Net (decrease) / increase in cash held | | — | | | — | | | (0.4 | ) | | (28.1 | ) | | — | | | (28.5 | ) |
Cash at the beginning of the financial year | | — | | | — | | | 0.4 | | | 123.5 | | | — | | | 123.9 | |
Effects of exchange rate changes on foreign currency cash balances | | — | | | — | | | — | | | (4.9 | ) | | — | | | (4.9 | ) |
| | |
|
| |
|
| |
|
| |
|
| |
|
| |
|
|
Cash at end of financial year | | — | | | — | | | — | | | 90.5 | | | — | | | 90.5 | |
| | |
|
| |
|
| |
|
| |
|
| |
|
| |
|
|
US GAAP reconciliation of Cash flows: | | | | | | | | | | | | | | | | | | |
Cash flows from financing activities as reported | | — | | | 12.4 | | | 8.4 | | | 1,075.5 | | | (1,080.5 | ) | | 15.8 | |
Changes in bank overdrafts (net) | | — | | | — | | | — | | | (0.2 | ) | | — | | | (0.2 | ) |
| | |
|
| |
|
| |
|
| |
|
| |
|
| |
|
|
Net cash (used in)/provided by financing activities—US GAAP | | — | | | 12.4 | | | 8.4 | | | 1,075.3 | | | (1,080.5 | ) | | 15.6 | |
| | |
|
| |
|
| |
|
| |
|
| |
|
| |
|
|
Cash flows from operating activities as reported | | (1,471.2 | ) | | 127.7 | | | 228.4 | | | 209.2 | | | 1,264.3 | | | 358.4 | |
US GAAP adjustment to cash flows | | — | | | (98.7 | ) | | — | | | (11.1 | ) | | — | | | (109.8 | ) |
| | |
|
| |
|
| |
|
| |
|
| |
|
| |
|
|
Net cash (used in)/provided by operating activities—US GAAP | | (1,471.2 | ) | | 29.0 | | | 228.4 | | | 198.1 | | | 1,264.3 | | | 248.6 | |
| | |
|
| |
|
| |
|
| |
|
| |
|
| |
|
|
Cash flows from investing activities as reported | | 1,471.2 | | | (140.1 | ) | | (237.2 | ) | | (1,312.8 | ) | | (183.8 | ) | | (402.7 | ) |
US GAAP adjustments to cash flows | | — | | | 98.7 | | | — | | | — | | | — | | | 98.7 | |
| | |
|
| |
|
| |
|
| |
|
| |
|
| |
|
|
Net cash (used in)/provided by investing activities—US GAAP | | 1,471.2 | | | (41.4 | ) | | (237.2 | ) | | (1,312.8 | ) | | (183.8 | ) | | (304.0 | ) |
| | |
|
| |
|
| |
|
| |
|
| |
|
| |
|
|
Net (decrease) / increase in cash and cash equivalents | | — | | | — | | | (0.4 | ) | | (39.4 | ) | | — | | | (39.8 | ) |
Cash and cash equivalents at the beginning of the year | | — | | | — | | | 0.4 | | | 118.6 | | | — | | | 119.0 | |
Effects of exchange rate changes on foreign currency cash balances | | — | | | — | | | — | | | (4.9 | ) | | — | | | (4.9 | ) |
| | |
|
| |
|
| |
|
| |
|
| |
|
| |
|
|
Cash and cash equivalents at the end of the year—US GAAP | | — | | | — | | | — | | | 74.3 | | | — | | | 74.3 | |
| | |
|
| |
|
| |
|
| |
|
| |
|
| |
|
|
F-97
WMC RESOURCES LTD AND CONTROLLED ENTITIES
NOTES TO THE CONSOLIDATED FINANCIAL STATEMENTS—(Continued)
| 47. | | SUPPLEMENTAL GUARANTOR INFORMATION (Continued) |
Supplemental Condensed Consolidating Statement of Financial Performance
For the year ended 31 December 2001
| | | | | | | | | | | | | | | | | | |
| | | Issuer
WMC
Finance
(USA)
Limited
| | | Guarantor
(Parent)
WMC
Resources Ltd
| | | Guarantor
(subsidiaries)
WMC (Olympic
Dam Corporation)
Pty Ltd WMC Fertilizers
Pty Ltd
| | | Other
subsidiaries
| | | Eliminations and
reclassifications
| | | WMC
Resources
Group
| |
Continuing operations: | | | | | | | | | | | | | | | | | | |
Net sales revenue | | — | | | 1,215.3 | | | 1,119.6 | | | 1,628.7 | | | (1,599.5 | ) | | 2,364.1 | |
Cost of goods sold | | — | | | (823.8 | ) | | (829.4 | ) | | (1,538.1 | ) | | 1,312.6 | | | (1,878.7 | ) |
Selling and distribution | | — | | | (25.5 | ) | | (35.5 | ) | | (87.6 | ) | | (14.8 | ) | | (163.4 | ) |
General and administrative | | — | | | (124.3 | ) | | (55.3 | ) | | (14.6 | ) | | (14.5 | ) | | (208.7 | ) |
General and administrative—significant items | | — | | | (20.7 | ) | | (71.8 | ) | | — | | | — | | | (92.5 | ) |
Exploration and evaluation | | — | | | (19.7 | ) | | — | | | (52.3 | ) | | 0.1 | | | (71.9 | ) |
Other expenses | | (0.7 | ) | | (75.0 | ) | | (44.8 | ) | | (793.3 | ) | | 849.6 | | | (64.2 | ) |
Other expenses-significant items | | — | | | — | | | — | | | — | | | — | | | — | |
Net profit / (loss) from subsidiary entities | | — | | | 28.8 | | | 20.9 | | | — | | | (49.7 | ) | | — | |
Other income | | 156.5 | | | 492.4 | | | 110.3 | | | 500.5 | | | (1,072.5 | ) | | 187.2 | |
Other income-significant items | | — | | | — | | | — | | | — | | | — | | | — | |
| | �� |
|
| |
|
| |
|
| |
|
| |
|
| |
|
|
Profit / (loss) before interest and income tax | | 155.8 | | | 647.5 | | | 214.0 | | | (356.7 | ) | | (588.7 | ) | | 71.9 | |
Interest expense | | (156.8 | ) | | (714.1 | ) | | (85.4 | ) | | (283.3 | ) | | 944.4 | | | (295.2 | ) |
| | |
|
| |
|
| |
|
| |
|
| |
|
| |
|
|
Profit / (loss) before income taxes | | (1.0 | ) | | (66.6 | ) | | 128.6 | | | (640.0 | ) | | 355.7 | | | (223.3 | ) |
Income tax credit / (expense) | | 0.3 | | | (90.9 | ) | | (13.6 | ) | | 223.7 | | | (53.7 | ) | | 65.8 | |
| | |
|
| |
|
| |
|
| |
|
| |
|
| |
|
|
Net profit / (loss) from continuing operations | | (0.7 | ) | | (157.5 | ) | | 115.0 | | | (416.3 | ) | | 302.0 | | | (157.5 | ) |
| | |
|
| |
|
| |
|
| |
|
| |
|
| |
|
|
Discontinued operations: | | | | | | | | | | | | | | | | | | |
Net sales revenue | | — | | | 389.5 | | | — | | | 63.4 | | | — | | | 452.9 | |
Net expenses | | — | | | (333.8 | ) | | — | | | (59.3 | ) | | (2.2 | ) | | (395.3 | ) |
Net profit / (loss) from subsidiary entities | | — | | | (50.9 | ) | | — | | | — | | | 50.9 | | | — | |
Income tax credit / (expense) | | — | | | (14.5 | ) | | — | | | (0.7 | ) | | — | | | (15.2 | ) |
Profit on disposal of gold operations (net of income tax benefit of A$34.4 million) | | — | | | 273.2 | | | — | | | (103.2 | ) | | — | | | 170.0 | |
Profit on disposal of Three Springs Talc operation (net on income tax benefit of A$1.4 million) | | — | | | 20.0 | | | — | | | — | | | — | | | 20.0 | |
Profit on disposal of equity interest in Mondo Minerals (net of income tax expense of A$10.1 million) | | — | | | — | | | — | | | 51.1 | | | — | | | 51.1 | |
| | |
|
| |
|
| |
|
| |
|
| |
|
| |
|
|
Net profit / (loss) from discontinued operations | | — | | | 283.5 | | | — | | | (48.7 | ) | | 48.7 | | | 283.5 | |
| | |
|
| |
|
| |
|
| |
|
| |
|
| |
|
|
Consolidated operations | | | | | | | | | | | | | | | | | | |
Net sales revenue | | — | | | 1,604.8 | | | 1,119.6 | | | 1,692.1 | | | (1,599.5 | ) | | 2,817.0 | |
Cost of goods sold | | — | | | (1,123.3 | ) | | (829.4 | ) | | (1,592.3 | ) | | 1,312.6 | | | (2,232.4 | ) |
Selling and distribution | | — | | | (25.3 | ) | | (35.5 | ) | | (90.2 | ) | | (14.8 | ) | | (165.8 | ) |
General and administrative | | — | | | (150.5 | ) | | (55.3 | ) | | (16.4 | ) | | (14.5 | ) | | (236.7 | ) |
General and administrative—significant items | | — | | | (277.1 | ) | | (71.8 | ) | | (164.2 | ) | | — | | | (513.1 | ) |
Exploration and evaluation | | — | | | (40.7 | ) | | — | | | (54.5 | ) | | 0.1 | | | (95.1 | ) |
Other expenses | | (0.7 | ) | | (61.6 | ) | | (44.8 | ) | | (792.5 | ) | | 847.4 | | | (52.2 | ) |
Other expenses-significant items | | — | | | — | | | — | | | — | | | — | | | — | |
Net profit / (loss) from subsidiary entities | | — | | | (22.1 | ) | | 20.9 | | | — | | | 1.2 | | | — | |
Other income | | 156.5 | | | 492.4 | | | 110.3 | | | 501.3 | | | (1,072.5 | ) | | 188.0 | |
Other income-significant items | | — | | | 513.0 | | | — | | | 122.2 | | | — | | | 635.2 | |
| | |
|
| |
|
| |
|
| |
|
| |
|
| |
|
|
Profit / (loss) before interest and income tax | | 155.8 | | | 909.6 | | | 214.0 | | | (394.5 | ) | | (540.0 | ) | | 344.9 | |
Interest expense | | (156.8 | ) | | (714.1 | ) | | (85.4 | ) | | (283.3 | ) | | 944.4 | | | (295.2 | ) |
| | |
|
| |
|
| |
|
| |
|
| |
|
| |
|
|
Profit / (loss) before income taxes | | (1.0 | ) | | 195.5 | | | 128.6 | | | (677.8 | ) | | 404.4 | | | 49.7 | |
Income tax credit/(expense) | | 0.3 | | | (69.5 | ) | | (13.6 | ) | | 212.8 | | | (53.7 | ) | | 76.3 | |
| | |
|
| |
|
| |
|
| |
|
| |
|
| |
|
|
Net profit / (loss) attributable to WMC Resources shareholders | | (0.7 | ) | | 126.0 | | | 115.0 | | | (465.0 | ) | | 350.7 | | | 126.0 | |
| | |
|
| |
|
| |
|
| |
|
| |
|
| |
|
|
US GAAP adjustments to income | | — | | | (88.3 | ) | | 4.9 | | | 6.2 | | | (11.1 | ) | | (88.3 | ) |
| | |
|
| |
|
| |
|
| |
|
| |
|
| |
|
|
Net profit / (loss) attributable to WMC Resources shareholders in accordance with US GAAP | | (0.7 | ) | | 37.7 | | | 119.9 | | | (458.8 | ) | | 339.6 | | | 37.7 | |
| | |
|
| |
|
| |
|
| |
|
| |
|
| |
|
|
F-98
WMC RESOURCES LTD AND CONTROLLED ENTITIES
NOTES TO THE CONSOLIDATED FINANCIAL STATEMENTS—(Continued)
| 47. | | SUPPLEMENTAL GUARANTOR INFORMATION (Continued) |
Supplemental Condensed Consolidating Statement of Cash flows
For the year ended 31 December 2001
| | | | | | | | | | | | | | | | | | |
| | | Issuer
WMC
Finance
(USA)
Limited
| | | Guarantor
(Parent)
WMC
Resources
Ltd
| | | Guarantor
(subsidiaries)
WMC (Olympic
Dam Corporation)
Pty Ltd WMC Fertilizers
Pty Ltd
| | | Other
subsidiaries
| | | Eliminations and
reclassifications
| | | WMC
Resources
Group
| |
Net cash (used in) / provided by operating activities | | 1.2 | | | (197.1 | ) | | 87.5 | | | (431.4 | ) | | 1,117.5 | | | 577.7 | |
| | |
|
| |
|
| |
|
| |
|
| |
|
| |
|
|
Cash flows from investing activities: | | | | | | | | | | | | | | | | | | |
Payments for property, plant and equipment | | — | | | (306.7 | ) | | (117.6 | ) | | (2.5 | ) | | — | | | (426.8 | ) |
Proceeds from sale of St. Ives and Agnew gold operations | | — | | | 432.0 | | | — | | | — | | | — | | | 432.0 | |
Proceeds from sale of Three Springs Talc operations | | — | | | 56.0 | | | — | | | — | | | — | | | 56.0 | |
Proceeds from sale of equity interest in Mondo Minerals | | — | | | — | | | — | | | 122.2 | | | — | | | 122.2 | |
Proceeds from sale of investments | | — | | | — | | | — | | | 24.9 | | | — | | | 24.9 | |
Proceeds from sale of Non-current assets | | — | | | 56.4 | | | 5.5 | | | 2.3 | | | — | | | 64.2 | |
Proceeds from insurance claims | | — | | | — | | | 23.6 | | | — | | | — | | | 23.6 | |
Proceeds from gold hedge close out | | — | | | — | | | — | | | — | | | 21.7 | | | 21.7 | |
Payments for short term investments | | — | | | — | | | — | | | (8.6 | ) | | — | | | (8.6 | ) |
Payments for evaluation expenditure | | — | | | — | | | — | | | (4.9 | ) | | — | | | (4.9 | ) |
Payments for purchase of Yakabindie Nickel Pty Ltd | | — | | | (25.2 | ) | | — | | | — | | | — | | | (25.2 | ) |
Net increase / (decrease) in loans from related bodies corporate | | (1.2 | ) | | — | | | — | | | 1,140.4 | | | (1,139.2 | ) | | — | |
| | |
|
| |
|
| |
|
| |
|
| |
|
| |
|
|
Net cash (used in) / provided by investing activities | | (1.2 | ) | | 212.5 | | | (88.5 | ) | | 1,273.8 | | | (1,117.5 | ) | | 279.1 | |
| | |
|
| |
|
| |
|
| |
|
| |
|
| |
|
|
Cash flows from financing activities | | | | | | | | | | | | | | | | | | |
Deemed equity distribution | | — | | | (15.4 | ) | | — | | | — | | | — | | | (15.4 | ) |
Proceeds from borrowings | | — | | | — | | | — | | | 277.2 | | | — | | | 277.2 | |
Repayments of borrowing | | — | | | — | | | — | | | (1,055.5 | ) | | — | | | (1,055.5 | ) |
| | |
|
| |
|
| |
|
| |
|
| |
|
| |
|
|
Net cash (used in) / provided by financing activities | | — | | | (15.4 | ) | | — | | | (778.3 | ) | | — | | | (793.7 | ) |
| | |
|
| |
|
| |
|
| |
|
| |
|
| |
|
|
Net (decrease) / increase in cash held | | — | | | — | | | (1.0 | ) | | 64.1 | | | — | | | 63.1 | |
Cash at the beginning of the financial year | | — | | | — | | | 1.4 | | | 57.0 | | | — | | | 58.4 | |
Effects of exchange rate changes on foreign currency cash balances | | — | | | — | | | — | | | 2.4 | | | — | | | 2.4 | |
| | |
|
| |
|
| |
|
| |
|
| |
|
| |
|
|
Cash at end of financial year | | — | | | — | | | 0.4 | | | 123.5 | | | — | | | 123.9 | |
| | |
|
| |
|
| |
|
| |
|
| |
|
| |
|
|
US GAAP reconciliation of Cash flows: | | | | | | | | | | | | | | | | | | |
Cash flows from financing activities as reported | | — | | | (15.4 | ) | | — | | | (778.3 | ) | | — | | | (793.7 | ) |
Changes in bank overdrafts (net) | | — | | | (2.3 | ) | | — | | | (1.4 | ) | | — | | | (3.7 | ) |
| | |
|
| |
|
| |
|
| |
|
| |
|
| |
|
|
Net cash (used in) / provided by financing activities—US GAAP | | — | | | (17.7 | ) | | — | | | (779.7 | ) | | — | | | (797.4 | ) |
| | |
|
| |
|
| |
|
| |
|
| |
|
| |
|
|
Cash flows from operating activities as reported | | 1.2 | | | (197.1 | ) | | 87.5 | | | (431.4 | ) | | 1,117.5 | | | 577.7 | |
US GAAP adjustment to cash flows | | — | | | (104.0 | ) | | — | | | (1.9 | ) | | — | | | (105.9 | ) |
| | |
|
| |
|
| |
|
| |
|
| |
|
| |
|
|
Net cash (used in) / provided by operating activities—US GAAP | | 1.2 | | | (301.1 | ) | | 87.5 | | | (433.3 | ) | | 1,117.5 | | | 471.8 | |
| | |
|
| |
|
| |
|
| |
|
| |
|
| |
|
|
Cash flows from investing activities as reported | | (1.2 | ) | | 212.5 | | | (88.5 | ) | | 1,273.8 | | | (1,117.5 | ) | | 279.1 | |
US GAAP adjustments to cash flows | | — | | | 104.0 | | | — | | | 1.8 | | | — | | | 105.8 | |
| | |
|
| |
|
| |
|
| |
|
| |
|
| |
|
|
Net cash (used in) / provided by investing activities—US GAAP | | (1.2 | ) | | 316.5 | | | (88.5 | ) | | 1,275.6 | | | (1,117.5 | ) | | 384.9 | |
| | |
|
| |
|
| |
|
| |
|
| |
|
| |
|
|
Net (decrease) / increase in cash and cash equivalents | | — | | | (2.3 | ) | | (1.0 | ) | | 62.6 | | | — | | | 59.3 | |
Cash and cash equivalents at the beginning of the year | | — | | | 2.3 | | | 1.4 | | | 53.6 | | | — | | | 57.3 | |
Effects of exchange rate changes on foreign currency cash balances | | — | | | — | | | — | | | 2.4 | | | — | | | 2.4 | |
| | |
|
| |
|
| |
|
| |
|
| |
|
| |
|
|
Cash and cash equivalents at the end of the year | | — | | | — | | | 0.4 | | | 118.6 | | | — | | | 119.0 | |
| | |
|
| |
|
| |
|
| |
|
| |
|
| |
|
|
F-99
WMC RESOURCES LTD AND CONTROLLED ENTITIES
NOTES TO THE CONSOLIDATED FINANCIAL STATEMENTS—(Continued)
48. RECENTLY ISSUED FINANCIAL ACCOUNTING STANDARDS
Australian Accounting Standards Board
The Australian Financial Reporting Council (FRC) has determined that Australian entities must adopt International Financial Reporting Standards (IFRS) from January 1, 2005. The adoption of IFRS will be first reflected in our financial statements for the half year ending June 30, 2005 and the year ending December 31, 2005. The significant areas expected to be affected are as follows:
| | – | | Hedge accounting for financial instruments; |
| | – | | Provision for environmental liabilities; |
| | – | | Tax effect accounting; and |
| | – | | Obligations under the superannuation plan. |
It is expected that there will be continuing developments in IFRS up to their application date of 1 January 2005. Consequently there remains uncertainty about the impact of IFRS. We are currently evaluating the potential impact of applying IFRS on the statements of financial position and performance.
We adopted AASB 1028 “Employee Benefits” on January 1, 2003. There was no material impact on our financial statements as a result of adoption.
Financial Accounting Standards Board
The Financial Accounting Standards Board has issued certain Statements of Financial Accounting Standards which are not effective with respect to the fiscal years we have presented in the consolidated financial statements.
In May 2003, the FASB issued FAS 150, Accounting for Certain Financial Instruments with Characteristics of both Liabilities and Equity, which requires financial instruments within its scope to be classified as liabilities (or assets in some circumstances). The Statement is effective for financial instruments entered into or modified after May 31, 2003, and otherwise effective at the beginning of the first interim period beginning after June 15, 2003, except for certain mandatorily redeemable financial instruments. The effective date of certain provisions of Statement 150 for certain mandatorily redeemable financial instruments has been deferred by FSP FAS 150-3. For the Company, FAS 150 was adopted in the financial year ended December 31, 2003. The adoption of the standard had no impact to the Company, as we have not issued any financial instruments which have characteristics of both liability and equity. It is expected any future adoptions related to this standard will not have any impact to the Company.
EITF 00-21 “Revenue Arrangements with Multiple Deliverables” was issued in December 2003. It addresses certain aspects of the accounting by a vendor for arrangements under which it will perform multiple revenue-generating activities. The EITF requires that separate contracts with the same entity or related parties that are entered into at or near the same time are presumed to have been negotiated as a package and should, therefore, be evaluated as a single arrangement in considering whether there are one or more units of accounting. That presumption may be overcome if there is sufficient evidence to the contrary. This Issue also addresses how arrangement consideration should be measured and allocated to the separate units of accounting in the arrangement. The guidance in this Issue is effective for revenue arrangements entered into in fiscal periods beginning after June 15, 2003. We are currently assessing the impact of adopting this standard.
In December 2003, the FASB issued FIN 46(R), Consolidation of Variable Interest Entities, which replaces FASB Interpretation No. 46, Consolidation of Variable Interest Entities. FIN 46(R) applies at different dates to different types of enterprises and entities, and special provisions apply to enterprises that have fully or partially applied Interpretation 46 prior to issuance of Interpretation 46(R) Application of Interpretation 46 or Interpretation 46(R) is required in financial statements of public entities that have interests in variable interest entities or potential variable interest entities commonly referred to as special-purpose entities for periods ending after December 15, 2003.
Application by public entities for all other types of entities is required in financial statements for periods ending after March 15, 2004. In some instances, enterprises have the option of applying or continuing to apply Interpretation 46 for a short period of time before applying Interpretation 46(R). FIN 46 is effective for all new variable interest entities created or acquired after January 31, 2003. The Company has evaluated all SPE’s and have determined that their will be no impact in the future upon final adoption of FIN 46(R) by March 31, 2004. All other entities have been evaluated and resulted in no impact to the financial statements in the current period.
F-100
WMC RESOURCES LTD AND CONTROLLED ENTITIES
NOTES TO THE CONSOLIDATED FINANCIAL STATEMENTS—(Continued)
SCHEDULE II - VALUATION AND QUALIFYING ACCOUNTS
Rule 5-04 of the SEC Regulation S-X Article 5 requires the filing of certain supplementary schedules.
WMC Resources is required to file Schedule II – Valuation and qualifying accounts which is required to present an analysis of valuation reserves:
| | | | | | | | | | | | | |
Description
| | Balance at beginning of year A$m
| | Additions charged to costs and expenses A$m
| | | Charged to other accounts A$m
| | | Deductions A$m
| | | Balance at end of year A$m
|
| | | Year ended 31 December, 2003 |
Future income tax benefit valuation allowance | | 581.4 | | (10.9 | )(a) | | — | | | — | | | 570.5 |
Provision for doubtful debts | | 6.3 | | 1.7 | | | (0.2 | ) | | (0.5 | ) | | 7.3 |
Provision for inventory obsolescence and loss | | 17.1 | | 4.5 | | | 0.4 | | | — | | | 22.0 |
Provision for diminution in value of investment | | 2.2 | | — | | | — | | | (1.7 | ) | | 0.5 |
| | |
| |
|
| |
|
| |
|
| |
|
| | | 607.0 | | (4.7 | ) | | 0.2 | | | (2.2 | ) | | 600.3 |
| | |
| |
|
| |
|
| |
|
| |
|
| |
| | | Year ended 31 December, 2002 |
Future income tax benefit valuation allowance | | 201.4 | | 380.0 | (a) | | — | | | — | | | 581.4 |
Provision for doubtful debts | | 7.4 | | — | | | — | | | (1.1 | ) | | 6.3 |
Provision for inventory obsolescence and loss | | 13.7 | | 6.1 | | | — | | | (2.7 | ) | | 17.1 |
Provision for diminution in value of investment | | — | | 2.2 | | | — | | | — | | | 2.2 |
| | |
| |
|
| |
|
| |
|
| |
|
| | | 222.5 | | 388.3 | | | — | | | (3.8 | ) | | 607.0 |
| | |
| |
|
| |
|
| |
|
| |
|
| |
| | | Year ended 31 December, 2001 |
Future income tax benefit valuation allowance | | 182.1 | | 19.3 | (a) | | — | | | — | | | 201.4 |
Provision for doubtful debts | | 8.7 | | — | | | — | | | (1.3 | ) | | 7.4 |
Provision for inventory obsolescence and loss | | 12.0 | | 4.0 | | | — | | | (2.3 | ) | | 13.7 |
Provision for diminution in value of investment | | 0.1 | | — | | | — | | | (0.1 | ) | | — |
| | |
| |
|
| |
|
| |
|
| |
|
| | | 202.9 | | 23.3 | | | — | | | (3.7 | ) | | 222.5 |
| | |
| |
|
| |
|
| |
|
| |
|
| (a) | | Charged/(credited) to income tax expense |
F-101