| | OMB APPROVAL |
| | OMB Number: 3235-0570 Expires: July 31, 2022 Estimated average burden hours per response: 20.6 |
UNITED STATES
SECURITIES AND EXCHANGE COMMISSION
Washington, D.C. 20549
FORM N-CSR
CERTIFIED SHAREHOLDER REPORT OF REGISTERED
MANAGEMENT INVESTMENT COMPANIES
| Investment Company Act file number | 811-21260 | |
| CM Advisors Family of Funds |
| (Exact name of registrant as specified in charter) |
| 805 Las Cimas Parkway, Suite 430 Austin, Texas | 78746 |
| (Address of principal executive offices) | (Zip code) |
Linda J. Hoard, Esq.
| Ultimus Fund Solutions, LLC | 225 Pictoria Drive, Suite 450 | Cincinnati, Ohio 45246 |
| | (Name and address of agent for service) | |
| Registrant's telephone number, including area code: | (512) 329-0050 | |
| Date of fiscal year end: | February 28 | |
| | | |
| Date of reporting period: | August 31, 2020 | |
Form N-CSR is to be used by management investment companies to file reports with the Commission not later than 10 days after the transmission to stockholders of any report that is required to be transmitted to stockholders under Rule 30e-1 under the Investment Company Act of 1940 (17 CFR 270.30e-1). The Commission may use the information provided on Form N-CSR in its regulatory, disclosure review, inspection, and policymaking roles.
A registrant is required to disclose the information specified by Form N-CSR, and the Commission will make this information public. A registrant is not required to respond to the collection of information contained in Form N-CSR unless the Form displays a currently valid Office of Management and Budget (“OMB”) control number. Please direct comments concerning the accuracy of the information collection burden estimate and any suggestions for reducing the burden to Secretary, Securities and Exchange Commission, 450 Fifth Street, NW, Washington, DC 20549-0609. The OMB has reviewed this collection of information under the clearance requirements of 44 U.S.C. § 3507.
Item 1. Reports to Stockholders.
CM Advisors Family of Funds
Semi-Annual Report 2020
CM Advisors Fixed Income Fund
August 31, 2020
(Unaudited)
Beginning on January 1, 2021, as permitted by regulations adopted by the U.S. Securities and Exchange Commission, paper copies of the Fund’s shareholder reports like this one will no longer be sent by mail, unless you specifically request paper copies of the reports from the Fund or from your financial intermediary, such as a broker-dealer or bank. Instead, the reports will be made available on a website, and you will be notified by mail each time a report is posted and provided with a website link to access the report.
If you have already elected to receive shareholder reports electronically, you will not be affected by this change and you need not take any action. You may elect to receive shareholder reports and other communications from the Fund electronically by contacting the Fund at 1-888-859-5856 or, if you own these shares through a financial intermediary, by contacting your financial intermediary.
You may elect to receive all future reports in paper free of charge. You can inform the Fund that you wish to continue receiving paper copies of your shareholder reports by contacting the Fund at 1-888-859-5856. If you own shares through a financial intermediary, you may contact your financial intermediary or follow instructions included with this document to elect to continue to receive paper copies of your shareholder reports. Your election to receive reports in paper will apply to all Funds held with the Fund complex or at your financial intermediary.
This report and the financial statements contained herein are submitted for the general information of the shareholders of the CM Advisors Family of Funds (the “Trust”). This report is not authorized for distribution to prospective investors of the Trust unless preceded or accompanied by an effective prospectus. Mutual fund shares are not deposits or obligations of, or guaranteed by, any depository institution. Shares are not insured by the FDIC, Federal Reserve Board or any other agency, and are subject to investment risks, including possible loss of principal amount invested.
CM Advisors Fixed Income Fund
Supplementary Portfolio Information
August 31, 2020 (Unaudited)
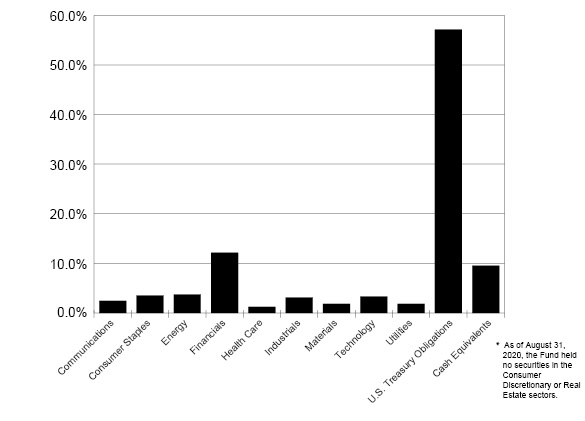
Asset Allocation*
(% of Net Assets)
Top 10 Long-Term Holdings
Security Description | % of Net Assets |
U.S. Treasury Notes, 2.75%, due 11/15/23 | 17.0% |
U.S. Treasury Notes, 2.375%, due 12/31/20 | 15.9% |
U.S. Treasury Notes, 1.375%, due 04/30/21 | 10.2% |
Wells Fargo & Company, 2.55%, due 12/07/20 | 5.1% |
U.S. Treasury Notes, 2.50%, due 12/31/20 | 5.1% |
U.S. Treasury Notes, 2.875%, due 10/31/20 | 5.1% |
PHI Group, Inc. | 3.7% |
General Mills, Inc., 3.15%, due 12/15/21 | 3.5% |
Goldman Sachs Group, Inc., 3.00%, due 04/26/22 | 3.4% |
Eaton Corporation, 8.10%, due 08/15/22 | 2.9% |
1
CM Advisors Fixed Income Fund
Schedule of Investments
August 31, 2020 (Unaudited) |
COMMON STOCKS — 3.7% | | Shares | | | Value | |
Energy — 3.7% | | | | | | | | |
Oil & Gas Services & Equipment — 3.7% | | | | | | | | |
PHI Group, Inc. * (a) (Cost $1,609,094) | | | 149,912 | | | $ | 1,469,137 | |
|
CORPORATE BONDS — 29.1% | | Par Value | | | Value | |
Communications — 2.4% | | | | | | | | |
Cable & Satellite — 0.9% | | | | | | | | |
Tele-Communications, Inc., 10.125%, due 04/15/22 | | $ | 300,000 | | | $ | 343,080 | |
| | | | | | | | | |
Publishing & Broadcasting — 1.5% | | | | | | | | |
Discovery Communications, Inc., 4.375%, due 06/15/21 | | | 600,000 | | | | 614,793 | |
| | | | | | | | | |
Consumer Staples — 3.5% | | | | | | | | |
Food — 3.5% | | | | | | | | |
General Mills, Inc., 3.15%, due 12/15/21 | | | 1,340,000 | | | | 1,377,829 | |
| | | | | | | | | |
Financials — 12.1% | | | | | | | | |
Banking — 6.9% | | | | | | | | |
Wells Fargo & Company, | | | | | | | | |
2.55%, due 12/07/20 | | | 2,007,000 | | | | 2,019,242 | |
4.125%, due 08/15/23 | | | 650,000 | | | | 711,589 | |
| | | | | | | | 2,730,831 | |
Institutional Financial Services — 3.4% | | | | | | | | |
Goldman Sachs Group, Inc., 3.00%, due 04/26/22 | | | 1,350,000 | | | | 1,372,113 | |
| | | | | | | | | |
Insurance — 1.8% | | | | | | | | |
Enstar Group Ltd., 4.50%, due 03/10/22 | | | 675,000 | | | | 705,975 | |
| | | | | | | | | |
Health Care — 1.2% | | | | | | | | |
Medical Equipment & Devices — 1.2% | | | | | | | | |
Becton Dickinson & Company, 3.25%, due 11/12/20 | | | 471,000 | | | | 473,288 | |
| | | | | | | | | |
Industrials — 3.1% | | | | | | | | |
Machinery — 2.9% | | | | | | | | |
Eaton Corporation, 8.10%, due 08/15/22 | | | 1,000,000 | | | | 1,137,010 | |
| | | | | | | | | |
Transportation & Logistics — 0.2% | | | | | | | | |
United Parcel Service, Inc., 2.05%, due 04/01/21 | | | 100,000 | | | | 101,021 | |
2
CM Advisors Fixed Income Fund
Schedule of Investments (Continued) |
CORPORATE BONDS — 29.1% (Continued) | | Par Value | | | Value | |
Materials — 1.8% | | | | | | | | |
Chemicals — 1.8% | | | | | | | | |
Mosaic Company (The), 3.25%, due 11/15/22 | | $ | 685,000 | | | $ | 714,986 | |
| | | | | | | | | |
Technology — 3.2% | | | | | | | | |
Software — 1.6% | | | | | | | | |
Symantec, Corporation, 4.20%, due 09/15/20 | | | 665,000 | | | | 665,200 | |
| | | | | | | | | |
Technology Hardware — 1.6% | | | | | | | | |
Corning, Inc., 7.25%, due 08/15/36 | | �� | 500,000 | | | | 630,155 | |
| | | | | | | | | |
Utilities — 1.8% | | | | | | | | |
Electric Utilities — 1.8% | | | | | | | | |
Southern Company, 2.35%, due 07/01/21 | | | 690,000 | | | | 700,151 | |
| | | | | | | | | |
Total Corporate Bonds (Cost $11,006,079) | | | | | | $ | 11,566,432 | |
|
U.S. TREASURY OBLIGATIONS — 57.1% | | Par Value | | | Value | |
U.S. Treasury Inflation-Protected Notes — 1.4% | | | | | | | | |
2.375%, due 01/15/25 | | $ | 477,250 | | | $ | 560,097 | |
| | | | | | | | | |
U.S. Treasury Notes – 55.7% | | | | | | | | |
1.375%, due 01/31/20 | | | 1,000,000 | | | | 1,004,922 | |
2.375%, due 12/31/20 | | | 6,250,000 | | | | 6,296,387 | |
2.50%, due 12/31/20 | | | 2,000,000 | | | | 2,015,313 | |
1.375%, due 04/30/21 | | | 4,000,000 | | | | 4,031,562 | |
2.875%, due 10/31/21 | | | 2,000,000 | | | | 2,008,978 | |
2.75%, due 11/15/23 | | | 6,250,000 | | | | 6,765,625 | |
| | | | | | | | 22,122,787 | |
| | | | | | | | | |
Total U.S. Treasury Obligations (Cost $21,974,737) | | | | | | $ | 22,682,884 | |
3
CM Advisors Fixed Income Fund
Schedule of Investments (Continued) |
MONEY MARKET FUNDS — 9.6% | | Shares | | | Value | |
Wells Fargo Advantage Treasury Plus Money Market Fund - Institutional Class, 0.01% (b) (Cost $3,786,718) | | | 3,786,718 | | | $ | 3,786,718 | |
| | | | | | | | | |
Total Investments at Value — 99.5% (Cost $38,376,628) | | | | | | $ | 39,505,171 | |
| | | | | | | | | |
Other Assets in Excess of Liabilities — 0.5% | | | | | | | 211,803 | |
| | | | | | | | | |
Net Assets — 100.0% | | | | | | $ | 39,716,974 | |
* | Non-income producing security. |
(a) | Security was received in a private placement. Security value has been determined in good faith pursuant to procedures adopted by the Board of Trustees. The total value of such securities is $1,469,137 as of August 31, 2020, representing 3.7% of net assets. |
(b) | The rate shown is the 7-day effective yield as of August 31, 2020. |
See accompanying notes to financial statements. |
4
CM Advisors Fixed Income Fund
Statement of Assets and Liabilities
August 31, 2020 (Unaudited) |
ASSETS | | | | |
Investments in securities: | | | | |
At cost | | $ | 38,376,628 | |
At value (Note 2) | | $ | 39,505,171 | |
Dividends and interest receivable | | | 226,836 | |
Other assets | | | 16,116 | |
TOTAL ASSETS | | | 39,748,123 | |
| | | | | |
LIABILITIES | | | | |
Payable for capital shares redeemed | | | 2,495 | |
Payable to Advisor (Note 5) | | | 4,454 | |
Payable to administrator (Note 5) | | | 6,620 | |
Other accrued expenses | | | 17,580 | |
TOTAL LIABILITIES | | | 31,149 | |
| | | | | |
NET ASSETS | | $ | 39,716,974 | |
| | | | | |
Net assets consist of: | | | | |
Paid-in capital | | $ | 40,930,346 | |
Accumulated deficit | | | (1,213,372 | ) |
Net Assets | | $ | 39,716,974 | |
| | | | | |
Shares of beneficial interest outstanding (unlimited number of shares authorized, $0.001 par value) | | | 3,661,953 | |
| | | | | |
Net asset value, redemption price and offering price per share | | $ | 10.85 | |
See accompanying notes to financial statements. |
5
CM Advisors Fixed Income Fund
Statement of Operations
Six Months Ended August 31, 2020 (Unaudited) |
INVESTMENT INCOME | | | | |
Dividends | | $ | 3,534 | |
Interest | | | 539,061 | |
TOTAL INVESTMENT INCOME | | | 542,595 | |
| | | | | |
EXPENSES | | | | |
Investment advisory fees (Note 5) | | | 109,021 | |
Legal fees | | | 25,268 | |
Registration and filing fees | | | 20,067 | |
Trustees’ fees and expenses (Note 5) | | | 19,613 | |
Administration fees (Note 5) | | | 17,466 | |
Fund accounting fees (Note 2) | | | 14,187 | |
Audit and tax services fees | | | 9,000 | |
Transfer agent fees (Note 5) | | | 9,000 | |
Custody and bank service fees | | | 3,773 | |
Printing of shareholder reports | | | 3,343 | |
Compliance support services fees | | | 2,440 | |
Postage and supplies | | | 2,422 | |
Pricing fees | | | 1,297 | |
Distributor service fees (Note 5) | | | 1,250 | |
Insurance expense | | | 871 | |
Other expenses | | | 5,759 | |
TOTAL EXPENSES | | | 244,777 | |
Advisory fees waived by Advisor (Note 5) | | | (20,415 | ) |
NET EXPENSES | | | 224,362 | |
| | | | | |
NET INVESTMENT INCOME | | | 318,233 | |
| | | | | |
REALIZED AND UNREALIZED LOSSES ON INVESTMENTS | | | | |
Net realized losses from investment transactions | | | (77,184 | ) |
Net change in unrealized appreciation (depreciation) on investments | | | (149,650 | ) |
NET REALIZED AND UNREALIZED LOSSES ON INVESTMENTS | | | (226,834 | ) |
| | | | | |
NET INCREASE IN NET ASSETS RESULTING FROM OPERATIONS | | $ | 91,399 | |
See accompanying notes to financial statements. |
6
CM Advisors Fixed Income Fund
Statements of Changes in Net Assets |
| | Six Months Ended
August 31, 2020
(Unaudited) | | | Year Ended
February 29,
2020 | |
FROM OPERATIONS | | | | | | | | |
Net investment income | | $ | 318,233 | | | $ | 1,217,756 | |
Net realized losses from investment transactions | | | (77,184 | ) | | | (2,352,962 | ) |
Net change in unrealized appreciation (depreciation) on investments | | | (149,650 | ) | | | 2,375,319 | |
Net increase in net assets resulting from operations | | | 91,399 | | | | 1,240,113 | |
| | | | | | | | | |
DISTRIBUTIONS TO SHAREHOLDERS | | | (364,956 | ) | | | (1,368,783 | ) |
| | | | | | | | | |
FROM CAPITAL SHARE TRANSACTIONS | | | | | | | | |
Proceeds from shares sold | | | 5,020,062 | | | | 1,057,883 | |
Net asset value of shares issued in reinvestment of distributions to shareholders | | | 336,617 | | | | 1,271,809 | |
Payments for shares redeemed | | | (17,994,563 | ) | | | (13,791,845 | ) |
Net decrease in net assets from share transactions | | | (12,637,884 | ) | | | (11,462,153 | ) |
| | | | | | | | | |
TOTAL DECREASE IN NET ASSETS | | | (12,911,441 | ) | | | (11,590,823 | ) |
| | | | | | | | | |
NET ASSETS | | | | | | | | |
Beginning of period | | | 52,628,415 | | | | 64,219,238 | |
End of period | | $ | 39,716,974 | | | $ | 52,628,415 | |
| | | | | | | | | |
CAPITAL SHARE ACTIVITY | | | | | | | | |
Shares sold | | | 463,403 | | | | 97,315 | |
Shares reinvested | | | 31,298 | | | | 117,337 | |
Shares redeemed | | | (1,665,780 | ) | | | (1,272,400 | ) |
Net decrease in shares outstanding | | | (1,171,079 | ) | | | (1,057,748 | ) |
Shares outstanding, beginning of period | | | 4,833,032 | | | | 5,890,780 | |
Shares outstanding, end of period | | | 3,661,953 | | | | 4,833,032 | |
See accompanying notes to financial statements. |
7
CM Advisors Fixed Income Fund
Financial Highlights |
Per share data for a share outstanding throughout each period: |
| | | Six Months
Ended
August 31, | | | Years Ended | |
| | 2020
(Unaudited) | | | February 29,
2020 | | | February 28,
2019 | | | February 28,
2018 | | | February 28,
2017 | | | February 29,
2016 | |
Net asset value at beginning of period | | $ | 10.89 | | | $ | 10.90 | | | $ | 11.20 | | | $ | 11.57 | | | $ | 11.10 | | | $ | 11.49 | |
| | | | | | | | | | | | | | | | | | | | | | | | | |
Income (loss) from investment operations: | | | | | | | | | | | | | | | | | | | | | | | | |
Net investment income | | | 0.08 | | | | 0.22 | | | | 0.31 | | | | 0.28 | | | | 0.37 | | | | 0.23 | |
Net realized and unrealized gains (losses) on investments | | | (0.03 | ) | | | 0.01 | | | | (0.25 | ) | | | (0.23 | ) | | | 0.50 | | | | (0.41 | ) |
Total from investment operations | | | 0.05 | | | | 0.23 | | | | 0.06 | | | | 0.05 | | | | 0.87 | | | | (0.18 | ) |
| | | | | | | | | | | | | | | | | | | | | | | | | |
Less distributions: | | | | | | | | | | | | | | | | | | | | | | | | |
From net investment income | | | (0.09 | ) | | | (0.24 | ) | | | (0.30 | ) | | | (0.29 | ) | | | (0.37 | ) | | | (0.19 | ) |
From net realized gains | | | — | | | | — | | | | (0.06 | ) | | | (0.13 | ) | | | (0.03 | ) | | | (0.02 | ) |
Total distributions | | | (0.09 | ) | | | (0.24 | ) | | | (0.36 | ) | | | (0.42 | ) | | | (0.40 | ) | | | (0.21 | ) |
| | | | | | | | | | | | | | | | | | | | | | | | | |
Net asset value at end of period | | $ | 10.85 | | | $ | 10.89 | | | $ | 10.90 | | | $ | 11.20 | | | $ | 11.57 | | | $ | 11.10 | |
| | | | | | | | | | | | | | | | | | | | | | | | | |
Total return (a) | | | 0.44 | %(b) | | | 2.15 | % | | | 0.55 | % | | | 0.43 | % | | | 7.95 | % | | | (1.62 | %) |
| | | | | | | | | | | | | | | | | | | | | | | | | |
Ratios and supplemental data: | | | | | | | | | | | | | | | | | | | | | | | | |
Net assets at end of period (000’s) | | $ | 39,717 | | | $ | 52,628 | | | $ | 64,219 | | | $ | 66,965 | | | $ | 67,445 | | | $ | 64,201 | |
| | | | | | | | | | | | | | | | | | | | | | | | | |
Ratio of total expenses to average net assets | | | 1.12 | %(c) | | | 0.96 | % | | | 0.90 | % | | | 0.87 | % | | | 0.88 | % | | | 0.79 | % |
| | | | | | | | | | | | | | | | | | | | | | | | | |
Ratio of net expenses to average net assets | | | 1.03 | %(c)(d) | | | 0.96 | % | | | 0.90 | % | | | 0.87 | % | | | 0.88 | % | | | 0.79 | % |
| | | | | | | | | | | | | | | | | | | | | | | | | |
Ratio of net investment income to average net assets | | | 1.46 | %(c)(d) | | | 2.00 | % | | | 2.75 | % | | | 2.43 | % | | | 3.16 | % | | | 1.63 | % |
| | | | | | | | | | | | | | | | | | | | | | | | | |
Portfolio turnover rate | | | 1 | %(b) | | | 20 | % | | | 28 | % | | | 35 | % | | | 10 | % | | | 18 | % |
(a) | Total return is a measure of the change in value of an investment in the Fund over the periods covered, which assumes any dividends or capital gains distributions are reinvested in shares of the Fund. The returns shown do not reflect the deduction of taxes a shareholder would pay on Fund distributions or the redemption of Fund shares. |
(b) | Not annualized. |
(c) | Annualized. |
(d) | Ratio was determined after investment advisory fee waivers (Note 5). |
See accompanying notes to financial statements. |
8
CM Advisors Fixed Income Fund
Notes to Financial Statements
August 31, 2020 (Unaudited)
1. Organization
CM Advisors Fixed Income Fund (the “Fund”) is a diversified no-load series of CM Advisors Family of Funds (the “Trust”), which was organized as a Delaware statutory trust and is registered under the Investment Company Act of 1940, as amended (the “1940 Act”) as an open-end management investment company.
The investment objective of the Fund is to seek to preserve capital and maximize total return. The Fund commenced operations on March 24, 2006.
2. Significant Accounting Policies
The Fund follows accounting and reporting guidance under Financial Accounting Standards Board (“FASB”) Accounting Standards Codification Topic 946, “Financial Services – Investment Companies.” The following is a summary of significant accounting policies followed by the Fund. These policies are in conformity with accounting principles generally accepted in the United States of America (“GAAP”).
Investment Valuation – The Fund’s portfolio securities are generally valued at their market values determined on the basis of available market quotations as of the close of regular trading on the New York Stock Exchange (typically 4:00 p.m. Eastern time). Securities, including common stocks, listed on an exchange or quoted on a national market system are valued at the last sales price. Securities which are quoted by NASDAQ are valued at the NASDAQ Official Closing Price. Securities traded in the over-the-counter market and listed securities for which no sale was reported on that date are valued at the most recent bid price. To the extent that the Fund is invested in other open-end investment companies, that are registered under the 1940 Act and not traded on an exchange, the Fund’s net asset values (“NAVs”) are calculated based upon the NAVs reported by such registered open-end investment companies and the prospectuses for these registered open-end investment companies explain the circumstances under which they will use fair value pricing and the effects of using fair value pricing. Fixed income securities are typically valued based on prices provided by an independent pricing service. Securities and assets for which representative market quotations are not readily available (e.g., if the exchange on which the portfolio security is principally traded closes early or if trading of the particular portfolio security is halted during the day and does not resume prior to the Fund’s NAV calculation) or which cannot be accurately valued using the Fund’s normal pricing procedures are valued at fair value as determined in good faith under policies approved by the Trust’s Board of Trustees (the “Board”) and will be classified as Level 2 or 3 within the fair value hierarchy (see below), depending on the inputs used. A portfolio security’s “fair value” price may differ from the price next available for that portfolio security using the Fund’s normal pricing procedures.
GAAP establishes a single authoritative definition of fair value, sets out a framework for measuring fair value and requires disclosures about fair value measurements.
Various inputs are used in determining the value of the Fund’s investments. These inputs are summarized in the three broad levels listed below:
● | Level 1 – quoted prices in active markets for identical securities |
9
CM Advisors Fixed Income Fund
Notes to Financial Statements (Continued)
● | Level 2 – other significant observable inputs |
● | Level 3 – significant unobservable inputs |
Corporate bonds and U.S. Treasury obligations held by the Fund are classified as Level 2 since values are based on prices provided by an independent pricing service that utilizes various “other significant observable inputs” including bid and ask quotations, prices of similar securities and interest rates, among other factors.
The inputs or methodology used for valuing securities are not necessarily an indication of the risks associated with investing in those securities. The inputs used to measure the fair value of a particular security may fall into different levels of the fair value hierarchy. In such cases, for disclosure purposes, the level in the fair value hierarchy within which the fair value measurement of that security falls in its entirety is determined based on the lowest level input that is significant to the fair value measurement.
The following is a summary of the inputs used to value the Fund’s investments as of August 31, 2020 by security type:
| | Level 1 | | | Level 2 | | | Level 3 | | | Total | |
Common Stocks | | $ | — | | | $ | — | | | $ | 1,469,137 | | | $ | 1,469,137 | |
Corporate Bonds | | | — | | | | 11,566,432 | | | | — | | | | 11,566,432 | |
U.S. Treasury Obligations | | | — | | | | 22,682,884 | | | | — | | | | 22,682,884 | |
Money Market Funds | | | 3,786,718 | | | | — | | | | — | | | | 3,786,718 | |
Total | | $ | 3,786,718 | | | $ | 34,249,316 | | | $ | 1,469,137 | | | $ | 39,505,171 | |
Refer to the Fund’s Schedule of Investments for a listing of the securities by asset type and sector and industry type.
The following is a reconciliation of Level 3 investments held in the Fund for which significant unobservable inputs were used to determine fair value for the six months ended August 31, 2020:
Balance as of February 29, 2020 | | $ | 1,609,095 | |
Net change in unrealized appreciation (depreciation) | | | (139,958 | ) |
Balance as of August 31, 2020 | | $ | 1,469,137 | |
10
CM Advisors Fixed Income Fund
Notes to Financial Statements (Continued)
The following table summarizes the valuation techniques used and unobservable inputs developed by the Trust’s Fair Value Committee in conformity with guidelines adopted by and subject to review by the Board to determine the fair value of the Level 3 instruments:
| Fair Value at
8/31/2020 | Valuation
Technique | Unobservable
Input | Value | Impact
to Valuation
from a
Decrease
in Input |
Common Stocks | $ 1,469,137 | Management’s Estimate of Value at Mandatory Exchange | N/A | N/A | N/A |
Share Valuation – The NAV per share of the Fund is calculated on each business day by dividing the total value of the Fund’s assets, less liabilities, by the number of shares outstanding. The offering price and redemption price per share of the Fund is equal to the NAV per share.
Investment Transactions and Investment Income – Investment transactions are accounted for on trade date. Dividend income is recorded on the ex-dividend date. Non-cash dividends included in dividend income, if any, are recorded at the fair market value of the securities received. Interest income is accrued as earned. Discounts and premiums on fixed income securities purchased are amortized using the effective interest method. Realized gains and losses on investments sold are determined on a specific identification basis, which is the same basis used for federal income tax purposes. Withholding taxes on foreign dividends, if any, have been provided for in accordance with the Fund’s understanding of the applicable country’s tax rules and rates.
Dividends and Distributions – Dividends arising from net investment income, if any, are declared and paid quarterly to shareholders of the Fund. Distributions from net realized capital gains, if any, are generally declared and distributed annually. The amount of distributions from net investment income and net realized capital gains are determined in accordance with federal income tax regulations, which may differ from GAAP. These “book/tax” differences are either temporary or permanent in nature and are primarily due to differing treatments of net short-term capital gains. Dividends and distributions are recorded on the ex-dividend date.
The tax character of distributions paid during the periods ended August 31, 2020 and February 29, 2020 was ordinary income.
On September 30, 2020, the Fund paid an ordinary income dividend of $0.0441 per share to shareholders of record on September 29, 2020.
Estimates – The preparation of financial statements in conformity with GAAP requires management to make estimates and assumptions that affect the reported amounts of assets and liabilities and disclosure of contingent assets and liabilities as of the date of the financial statements and the reported amounts of income and expenses during the reporting period. Actual results could differ from those estimates.
11
CM Advisors Fixed Income Fund
Notes to Financial Statements (Continued)
3. Federal Income Tax
The Fund has qualified and intends to continue to qualify each year as a “regulated investment company” under Subchapter M of the Internal Revenue Code of 1986, as amended (the “Code”). Qualification generally will relieve the Fund of liability for federal income taxes to the extent 100% of its net investment income and net realized capital gains are distributed in accordance with the Code.
In order to avoid imposition of the excise tax applicable to regulated investment companies, it is also the Fund’s intention to declare as dividends in each calendar year at least 98% of its net investment income (earned during the calendar year) and 98.2% of its net realized capital gains (earned during the twelve months ended October 31) plus undistributed amounts from prior years.
The following information is computed on a tax basis for each item as of August 31, 2020:
Tax cost of portfolio investments | | $ | 38,376,661 | |
Gross unrealized appreciation | | $ | 1,269,281 | |
Gross unrealized depreciation | | | (140,771 | ) |
Net unrealized appreciation | | | 1,128,510 | |
Accumulated ordinary income | | | 100,872 | |
Capital loss carryforwards | | | (2,365,570 | ) |
Other losses | | | (77,184 | ) |
Accumulated deficit | | $ | (1,213,372 | ) |
The difference between the federal income tax cost of portfolio investments and the financial statement cost for the Fund is due to certain timing differences in the recognition of capital gains or losses under income tax regulations and GAAP. These “book/tax” differences are temporary in nature and are due to the tax deferral of losses on wash sales.
As of February 29, 2020, the Fund had short-term capital loss carryforwards of $75,971 and long-term capital loss carryforwards of $2,289,599 for federal income tax purposes. These capital loss carryforwards, which do not expire, may be utilized in the current and future years to offset realized capital gains, if any, prior to distributing such gains to shareholders.
The Fund recognizes the benefits or expenses of uncertain tax positions only if the position is “more-likely-than-not” of being sustained assuming examination by tax authorities. Management has reviewed the tax positions taken on federal income tax returns for the current and all open tax years (generally, three years) and has concluded that no provision for unrecognized tax benefits or expenses is required in these financial statements.
12
CM Advisors Fixed Income Fund
Notes to Financial Statements (Continued)
4. Investment Transactions
During the six months ended August 31, 2020, cost of purchases and proceeds from sales and maturities of investment securities, other than short-term investments and U.S. Government obligations, were as follows:
Cost of purchases of investment securities | | $ | 97,796 | |
Proceeds from sales and maturities of investment securities | | $ | 8,099,327 | |
5. Transactions with Related Parties
INVESTMENT ADVISORY AGREEMENT
The Fund pays a monthly advisory fee to Van Den Berg Management I, Inc. (d/b/a CM Fund Advisors) (the “Advisor”) calculated at the annual rate of 0.50% of its average daily net assets. Effective June 29, 2020, the Advisor has entered into an Expense Limitation Agreement (the “ELA”) with the Fund under which it has agreed until July 1, 2021 to waive its fees and to assume other expenses of the Fund, if necessary, in an amount that limits the Fund’s total operating expenses (exclusive of interest, taxes, brokerage commissions, other expenditures which are capitalized in accordance with GAAP, other extraordinary expenses not incurred in the ordinary course of the Fund’s business, dividend expense on securities sold short, Acquired Fund Fees and Expenses, and amounts, if any, under a Rule 12b-1 Plan) to not more than 0.87% of its average daily net assets. The ELA cannot be terminated prior to July 1, 2021 without the approval of the Board. Prior to June 29, 2020, the Advisor had contractually agreed under the ELA to limit Fund expenses to 1.50% until July 1, 2021. Accordingly, during the six months ended August 31, 2020, the Advisor waived $20,415 of its investment advisory fees. These fees are not available for recoupment by the Advisor.
Certain Trustees and officers of the Trust are also officers of the Advisor.
OTHER SERVICE PROVIDERS
Ultimus Fund Solutions, LLC (“Ultimus”) provides administration, accounting, and transfer agency services to the Fund. The Fund pays Ultimus fees in accordance with the agreements for its services. In addition, the Fund pays out-of-pocket expenses including, but not limited to, postage, supplies and certain costs related to the pricing of its portfolio securities. Certain officers of the Trust are also officers of Ultimus, or of Ultimus Fund Distributors, LLC (the “Distributor”).
Pursuant to the terms of a Distribution Agreement with the Trust, the Distributor serves as the Fund’s principal underwriter. The Distributor is a wholly-owned subsidiary of Ultimus. The Distributor receives service fees from the Fund for such services.
13
CM Advisors Fixed Income Fund
Notes to Financial Statements (Continued)
COMPENSATION OF TRUSTEES
Trustees and officers affiliated with the Advisor or Ultimus are not compensated by the Fund for their services. Each Trustee who is not an affiliated person of the Advisor or Ultimus receives an annual retainer of $10,000, paid quarterly; a fee of $2,000 for attendance at each in-person meeting of the Board of Trustees; and a fee of $500 for attendance at each telephonic meeting of the Board of Trustees. The Fund reimburses each Trustee and officer for his or her travel and other expenses relating to attendance at Board or committee meetings.
6. Contingencies and Commitments
The Fund indemnifies the Trust’s officers and Trustees for certain liabilities that might arise from the performance of their duties to the Fund. Additionally, in the normal course of business, the Fund enters into contracts that contain a variety of representations and warranties and which provide general indemnifications. The Fund’s maximum exposure under these arrangements is unknown, as this would involve future claims that may be made against the Fund that have not yet occurred. However, based on experience, the Fund expects the risk of loss to be remote.
7. Subsequent Events
The Fund is required to recognize in the financial statements the effects of all subsequent events that provide additional evidence about conditions that existed as of the date of the Statement of Assets and Liabilities. For non-recognized subsequent events that must be disclosed to keep the financial statements from being misleading, the Fund is required to disclose the nature of the event as well as an estimate of the financial effect, or a statement that such an estimate cannot be made. Management has evaluated subsequent events through the issuance of these financial statements and has noted no such events.
14
CM Advisors Fixed Income Fund
About Your Fund’s Expenses (Unaudited)
We believe it is important for you to understand the impact of costs on your investment. As a shareholder of the Fund, you incur ongoing costs, including management fees and other operating expenses. Ongoing costs, which are deducted from the Fund’s gross income, directly reduce the investment return of the Fund.
A mutual fund’s ongoing costs are expressed as a percentage of its average net assets. This figure is known as the expense ratio. The following examples are intended to help you understand the ongoing costs (in dollars) of investing in the Fund and to compare these costs with the ongoing costs of investing in other mutual funds. The examples below are based on an investment of $1,000 made at the beginning of the most recent semi-annual period (March 1, 2020) and held until the end of the period (August 31, 2020).
The table below illustrates the Fund’s costs in two ways:
Actual fund return – This section helps you to estimate the actual expenses that you paid over the period. The “Ending Account Value” shown is derived from the Fund’s actual return, and the fourth column shows the dollar amount of expenses that would have been paid by an investor who started with $1,000 in the Fund. You may use the information here, together with the amount you invested, to estimate the ongoing costs that you paid over the period.
To do so, simply divide your account value by $1,000 (for example, an $8,600 account value divided by $1,000 = 8.6), then multiply the result by the number given for the Fund under the heading “Expenses Paid During Period.”
Hypothetical 5% return – This section is intended to help you compare the Fund’s ongoing costs with those of other mutual funds. It assumes that the Fund had an annual return of 5% before expenses during the period shown, but that the expense ratio is unchanged. In this case, because the return used is not the Fund’s actual return, the results do not apply to your investment. The example is useful in making comparisons because the U.S. Securities and Exchange Commission (the “SEC”) requires all mutual funds to calculate expenses based on a 5% return. You can assess the Fund’s ongoing costs by comparing this hypothetical example with the hypothetical examples that appear in shareholder reports of other funds.
Note that expenses shown in the table are meant to highlight and help you compare ongoing costs only. The Fund does not charge transaction fees, such as purchase or redemption fees, nor does it impose any sales loads.
The calculations assume no shares were bought or sold during the period. Your actual costs may have been higher or lower, depending on the amount of your investment and the timing of any purchases or redemptions.
15
CM Advisors Fixed Income Fund
About Your Fund’s Expenses (Unaudited) (Continued)
More information about the Fund’s expenses, including annual expense ratios, can be found in this report. For additional information on operating expenses and other shareholder costs, please refer to the Fund’s prospectus.
| Beginning
Account Value
March 1, 2020 | Ending
Account Value
August 31, 2020 | Net
Expense
Ratio(a) | Expenses
Paid During
Period(b) |
Based on Actual Fund Return | $ 1,000.00 | $ 1,004.40 | 1.03% | $ 5.19 |
Based on Hypothetical 5% Return (before expenses) | $ 1,000.00 | $ 1,019.96 | 1.03% | $ 5.23 |
(a) | Annualized, based on the Fund’s most recent one-half year expenses. |
(b) | Expenses are equal to the Fund’s annualized expense ratio multiplied by the average account value over the period, multiplied by 184/366 (to reflect the one-half year period). |
16
CM Advisors Fixed Income Fund
Other Information (Unaudited)
The Trust files a complete listing of portfolio holdings for the Fund with the SEC as of the end of the first and third quarters of each fiscal year as an exhibit to its reports on Form N-PORT. The filings are available upon request, by calling 1-888-859-5856. Furthermore, you may obtain a copy of these filings on the SEC’s website at www.sec.gov.
A description of the policies and procedures that the Fund uses to determine how to vote proxies relating to portfolio securities is available without charge upon request by calling toll-free 1-888-859-5856, or on the SEC’s website at www.sec.gov. Information regarding how the Fund voted proxies relating to portfolio securities during the most recent 12-month period ended June 30 is also available without charge upon request by calling toll-free 1-888-859-5856, or on the SEC’s website at www.sec.gov.
17
CM Advisors Fixed Income Fund
a series of
CM Advisors Family of Funds
For Shareholder Service Inquiries: | For Investment Advisor Inquiries: |
Ultimus Fund Solutions, LLC
P.O. Box 46707
Cincinnati, OH 45246-0707 | Van Den Berg Management I, Inc.
(d/b/a CM Fund Advisors)
805 Las Cimas Parkway, Suite 430
Austin, Texas 78746 |
| | |
Toll-Free Telephone: | Toll-Free Telephone: |
1-888-859-5856 | 1-888-859-5856 |
| | |
| | World Wide Web @: |
| | www.cmadvisorsfunds.com |
Investment in the Fund is subject to investment risks, including the possible loss of some or all of the principal amount invested. No investment strategy works all the time, and past performance is not necessarily indicative of future performance. The performance information quoted in this report represents past performance, which is not a guarantee of future results. Investment return and principal value of an investment will fluctuate so that an investor’s shares, when redeemed, may be worth more or less than their original cost. Current performance may be lower or higher than the performance data quoted. An investor should consider the investment objectives, risks, and charges and expenses of the Fund carefully before investing. The prospectus contains this and other information about the Fund. A copy of the prospectus is available at www.cmadvisorsfunds.com or by calling Shareholder Services at 1-888-859-5856. The prospectus should be read carefully before investing. |
For More Information on your CM Advisors Family of Funds:
See Our Web site @ www.cmadvisorsfunds.com or
Call Our Shareholder Services Group Toll-Free at 1-888-859-5856
Not required
| Item 3. | Audit Committee Financial Expert. |
Not required
| Item 4. | Principal Accountant Fees and Services. |
Not required
| Item 5. | Audit Committee of Listed Registrants. |
Not applicable
| Item 6. | Schedule of Investments. |
| (a) | Not applicable [schedule filed with Item 1] |
| Item 7. | Disclosure of Proxy Voting Policies and Procedures for Closed-End Management Investment Companies. |
Not applicable
| Item 8. | Portfolio Managers of Closed-End Management Investment Companies. |
Not applicable
| Item 9. | Purchases of Equity Securities by Closed-End Management Investment Company and Affiliated Purchasers. |
Not applicable
| Item 10. | Submission of Matters to a Vote of Security Holders. |
The registrant has not adopted procedures by which shareholders may recommend nominees to the registrant’s board of trustees.
| Item 11. | Controls and Procedures. |
(a) Based on their evaluation of the registrant’s disclosure controls and procedures (as defined in Rule 30a-3(c) under the Investment Company Act of 1940) as of a date within 90 days of the filing date of this report, the registrant’s principal executive officer and principal financial officer have concluded that such disclosure controls and procedures are reasonably designed and are operating effectively to ensure that material information relating to the registrant, including its consolidated subsidiaries, is made known to them by others within those entities, particularly during the period in which this report is being prepared, and that the information required in filings on Form N-CSR is recorded, processed, summarized, and reported on a timely basis.
(b) There were no changes in the registrant’s internal control over financial reporting (as defined in Rule 30a-3(d) under the Investment Company Act of 1940) that occurred during the period covered by this report that have materially affected, or are reasonably likely to materially affect, the registrant’s internal control over financial reporting.
| Item 12. | Disclosure of Securities Lending Activities for Closed-End Management Investment Companies. |
Not applicable
File the exhibits listed below as part of this Form. Letter or number the exhibits in the sequence indicated.
(a)(1) Any code of ethics, or amendment thereto, that is the subject of the disclosure required by Item 2, to the extent that the registrant intends to satisfy the Item 2 requirements through filing of an exhibit: Not required
(a)(2) A separate certification for each principal executive officer and principal financial officer of the registrant as required by Rule 30a-2(a) under the Act (17 CFR 270.30a-2(a)): Attached hereto
(a)(3) Any written solicitation to purchase securities under Rule 23c-1 under the Act (17 CFR 270.23c-1) sent or given during the period covered by the report by or on behalf of the registrant to 10 or more persons: Not applicable
(a)(4) Change in the registrant’s independent public accountants: Not applicable
(b) Certifications required by Rule 30a-2(b) under the Act (17 CFR 270.30a-2(b)): Attached hereto
SIGNATURES
Pursuant to the requirements of the Securities Exchange Act of 1934 and the Investment Company Act of 1940, the registrant has duly caused this report to be signed on its behalf by the undersigned, thereunto duly authorized.
| (Registrant) | CM Advisors Family of Funds | | |
| | | | |
| By (Signature and Title)* | /s/ James D. Brilliant | |
| | | | |
| | | James D. Brilliant, Chairman and President | |
| | | | |
| Date | October 30, 2020 | | |
Pursuant to the requirements of the Securities Exchange Act of 1934 and the Investment Company Act of 1940, this report has been signed below by the following persons on behalf of the registrant and in the capacities and on the dates indicated.
| By (Signature and Title)* | /s/ James D. Brilliant | |
| | | | |
| | | James D. Brilliant, Chairman and President | |
| | | | |
| Date | October 30, 2020 | | |
| | | | |
| By (Signature and Title)* | /s/ Scott Van Den Berg | |
| | | | |
| | | Scott Van Den Berg, Treasurer and Principal Accounting Officer | |
| | | | |
| Date | October 30, 2020 | | |
| * | Print the name and title of each signing officer under his or her signature. |