Investor Presentation Second Quarter 2022 Exhibit 99.2
Information Related to Forward-Looking Statements Forward-looking statements are based on our beliefs, assumptions and expectations of our future performance, taking into account information currently in our possession. These beliefs, assumptions and expectations may change as a result of many possible events or factors, not all of which are known to us or are within our control. If a change occurs, the performance of our portfolio and our business, financial condition, liquidity and results of operations may vary materially from those expressed, anticipated or contemplated in our forward-looking statements. You should carefully consider these risks, along with the following factors that could cause actual results to vary from our forward-looking statements, before making an investment in our securities: the overall environment for interest rates, changes in interest rates, interest rate spreads, the yield curve and prepayment rates, including the timing of changes in the Federal Funds rate by the U.S. Federal Reserve; the effect of any changes to the London Interbank Offered Rate (“LIBOR”) and the Secured Overnight Financing Rate (“SOFR”) and establishment of alternative reference rates; current conditions and further adverse developments in the residential mortgage market and the overall economy; potential risk attributable to our mortgage-related portfolios, including changes in fair value; our use of leverage and our dependence on repurchase agreements and other short-term borrowings to finance our mortgage-related holdings; the availability of certain short-term liquidity sources; competition for investment opportunities; U.S. Federal Reserve monetary policy; the federal conservatorship of the Federal National Mortgage Association (“Fannie Mae”) and the Federal Home Loan Mortgage Corporation (“Freddie Mac”) and related efforts, along with any changes in laws and regulations affecting the relationship between Fannie Mae and Freddie Mac and the federal government; mortgage loan prepayment activity, modification programs and future legislative action; changes in, and success of, our acquisition, hedging and leverage strategies, changes in our asset allocation and changes in our operational policies, all of which may be changed by us without shareholder approval; failure of sovereign or municipal entities to meet their debt obligations of such debt obligations; fluctuations of the value of our hedge instruments; fluctuating quarterly operating results; changes in laws and regulations and industry practices that may adversely affect our business; volatility of the securities markets and activity in the secondary securities markets in the United States and elsewhere; our ability to qualify and maintain our qualification as a REIT for federal income tax purposes; our ability to successfully expand our business into areas other than investing in MBS and our expectations of the returns of expanding into any such areas; our ability to close on the sale of single-family residential homes described herein, and to realize the expected benefits from such sale; and the other important factors identified in this Annual Report on Form 10-K under the caption “Item 1A - Risk Factors.” These and other risks, uncertainties and factors, including those described elsewhere in our Annual Report on Form 10-K, could cause our actual results to differ materially from those projected in any forward-looking statements we make. All forward-looking statements speak only as of the date on which they are made. New risks and uncertainties arise over time and it is not possible to predict those events or how they may affect us. Except as required by law, we are not obligated to, and do not intend to, update or revise any forward-looking statements, whether as a result of new information, future events or otherwise.
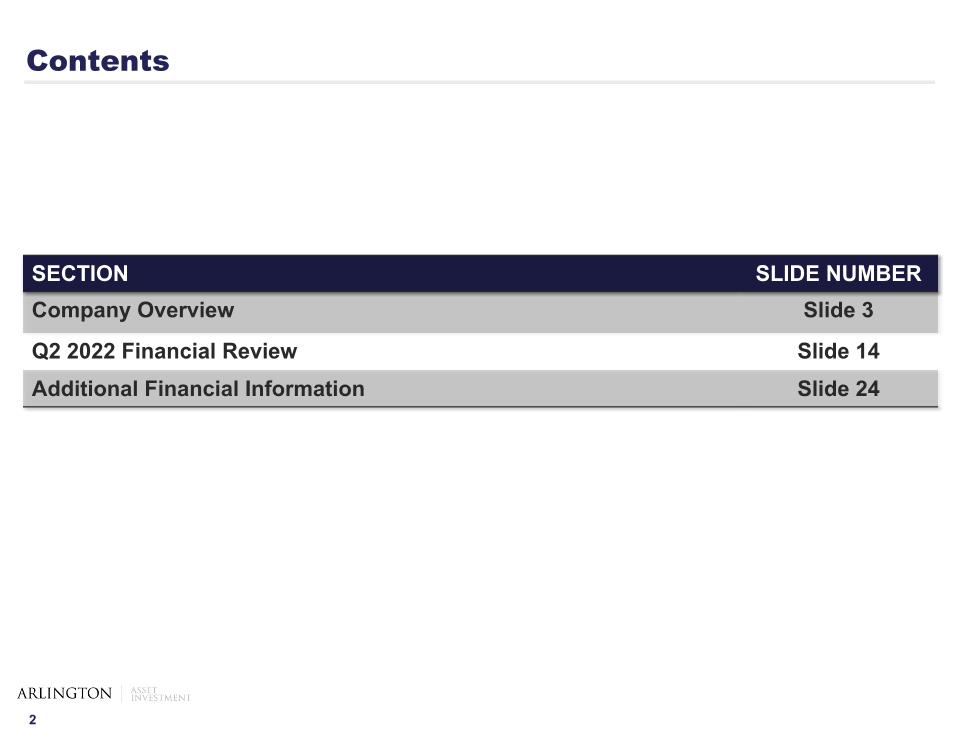
Contents SECTION SLIDE NUMBER Company Overview Slide 3 Q2 2022 Financial Review Slide 14 Additional Financial Information Slide 24
Company Overview
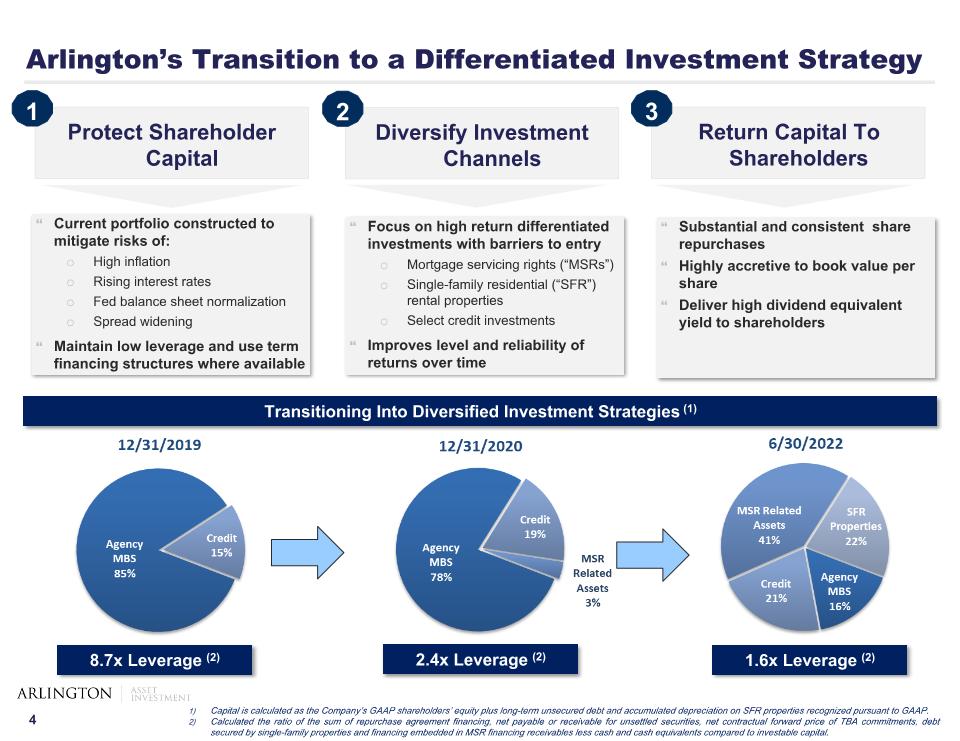
Arlington’s Transition to a Differentiated Investment Strategy Return Capital To Shareholders 3 Focus on high return differentiated investments with barriers to entry Mortgage servicing rights (“MSRs”) Single-family residential (“SFR”) rental properties Select credit investments Improves level and reliability of returns over time Substantial and consistent share repurchases Highly accretive to book value per share Deliver high dividend equivalent yield to shareholders Transitioning Into Diversified Investment Strategies (1) Protect Shareholder Capital Diversify Investment Channels 2 Current portfolio constructed to mitigate risks of: High inflation Rising interest rates Fed balance sheet normalization Spread widening Maintain low leverage and use term financing structures where available 1 8.7x Leverage (2) 2.4x Leverage (2) 1.6x Leverage (2) Capital is calculated as the Company’s GAAP shareholders’ equity plus long-term unsecured debt and accumulated depreciation on SFR properties recognized pursuant to GAAP. Calculated the ratio of the sum of repurchase agreement financing, net payable or receivable for unsettled securities, net contractual forward price of TBA commitments, debt secured by single-family properties and financing embedded in MSR financing receivables less cash and cash equivalents compared to investable capital.
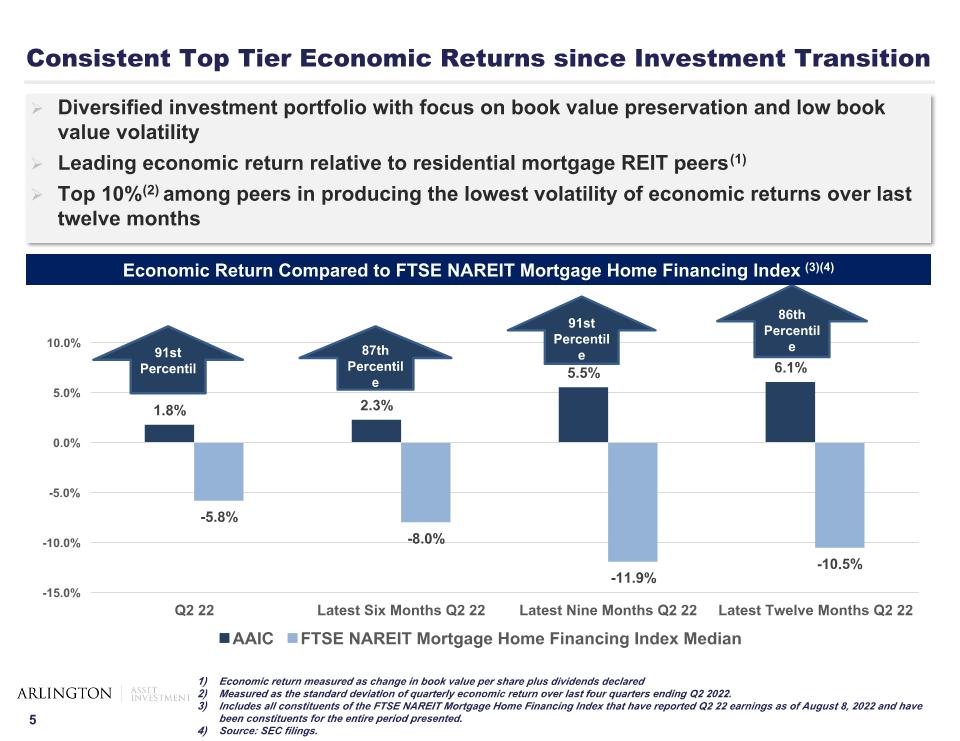
Consistent Top Tier Economic Returns since Investment Transition Economic Return Compared to FTSE NAREIT Mortgage Home Financing Index (3)(4) Diversified investment portfolio with focus on book value preservation and low book value volatility Leading economic return relative to residential mortgage REIT peers(1) Top 10%(2) among peers in producing the lowest volatility of economic returns over last twelve months Economic return measured as change in book value per share plus dividends declared Measured as the standard deviation of quarterly economic return over last four quarters ending Q2 2022. Includes all constituents of the FTSE NAREIT Mortgage Home Financing Index that have reported Q2 22 earnings as of August 8, 2022 and have been constituents for the entire period presented. Source: SEC filings. 91st Percentile 87th Percentile 91st Percentile 86th Percentile
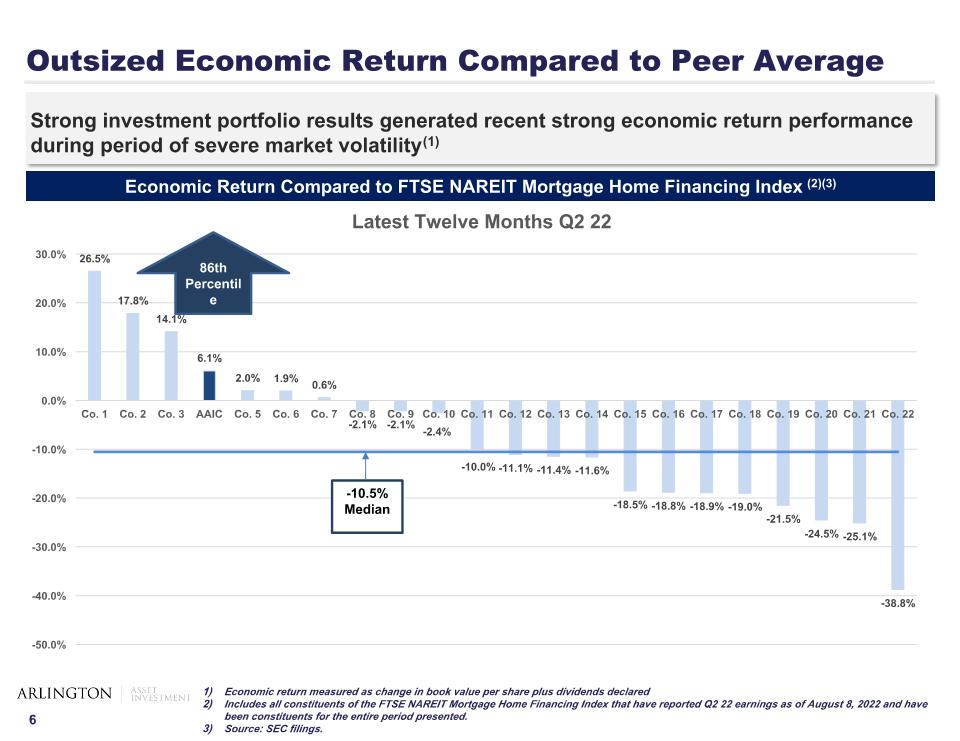
Outsized Economic Return Compared to Peer Average Strong investment portfolio results generated recent strong economic return performance during period of severe market volatility(1) Economic Return Compared to FTSE NAREIT Mortgage Home Financing Index (2)(3) Economic return measured as change in book value per share plus dividends declared Includes all constituents of the FTSE NAREIT Mortgage Home Financing Index that have reported Q2 22 earnings as of August 8, 2022 and have been constituents for the entire period presented. Source: SEC filings. -10.5% Median Economic Return 86th Percentile
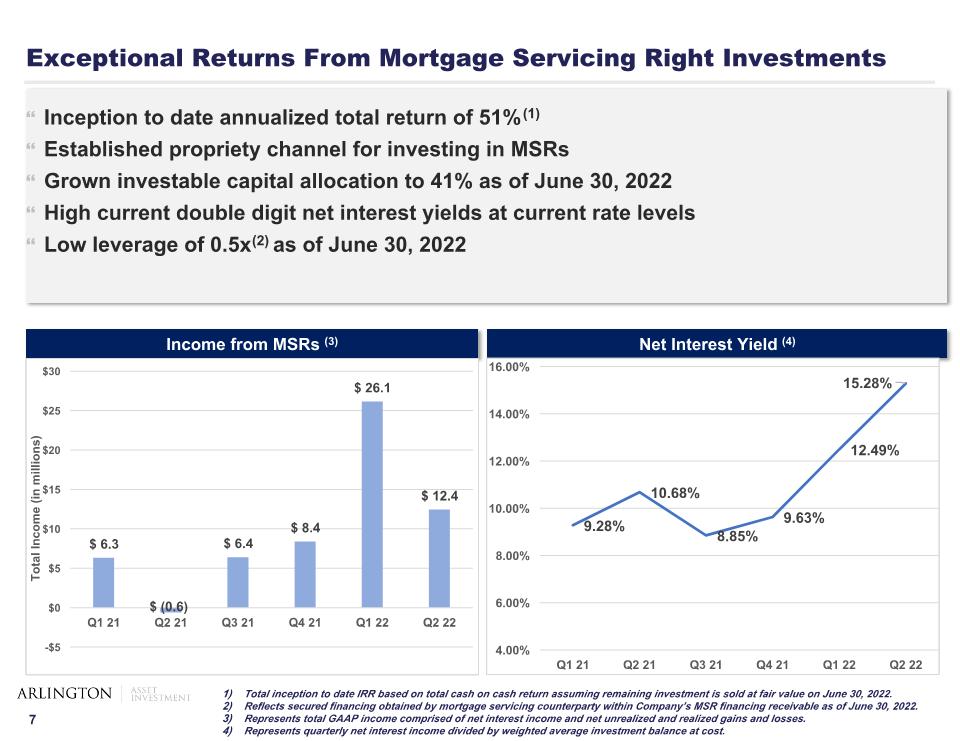
Exceptional Returns From Mortgage Servicing Right Investments Inception to date annualized total return of 51%(1) Established propriety channel for investing in MSRs Grown investable capital allocation to 41% as of June 30, 2022 High current double digit net interest yields at current rate levels Low leverage of 0.5x(2) as of June 30, 2022 Total inception to date IRR based on total cash on cash return assuming remaining investment is sold at fair value on June 30, 2022. Reflects secured financing obtained by mortgage servicing counterparty within Company’s MSR financing receivable as of June 30, 2022. Represents total GAAP income comprised of net interest income and net unrealized and realized gains and losses. Represents quarterly net interest income divided by weighted average investment balance at cost. Income from MSRs (3) Net Interest Yield (4)
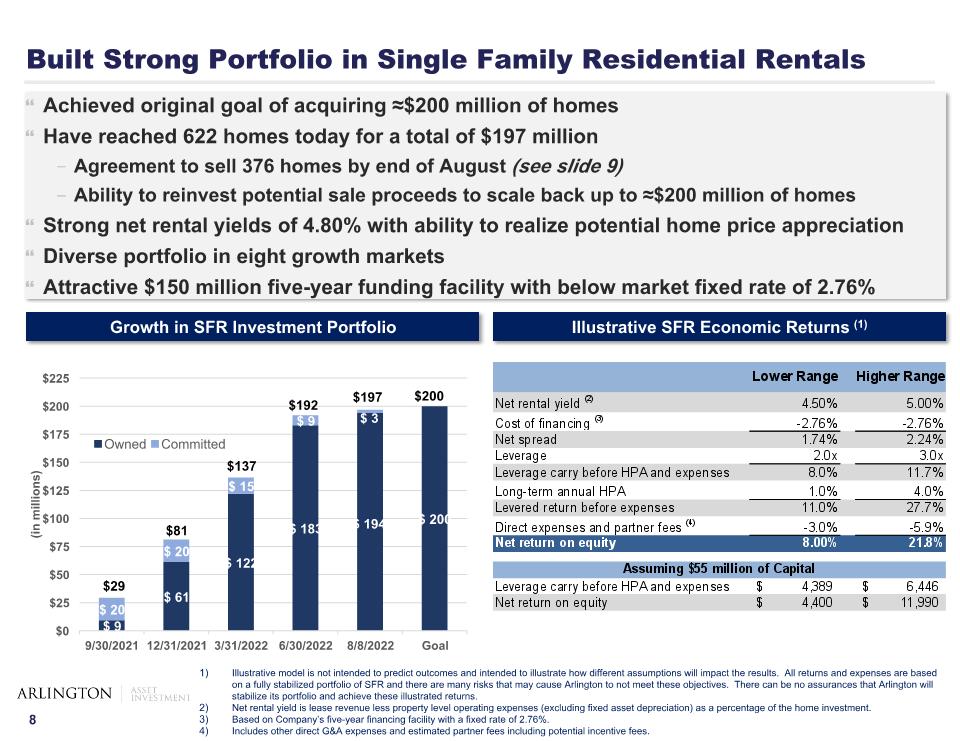
Built Strong Portfolio in Single Family Residential Rentals This illustrative model is not intended to predict outcomes. This model is only intended to illustrate how different assumptions will impact the results. All returns and expenses are based on a fully stabilized portfolio of SFR and there are many risks that may cause Arlington to not meet these objectives. There can be no assurances that Arlington will stabilize its portfolio and achieve these illustrated returns. Illustrative model is not intended to predict outcomes and intended to illustrate how different assumptions will impact the results. All returns and expenses are based on a fully stabilized portfolio of SFR and there are many risks that may cause Arlington to not meet these objectives. There can be no assurances that Arlington will stabilize its portfolio and achieve these illustrated returns. Net rental yield is lease revenue less property level operating expenses (excluding fixed asset depreciation) as a percentage of the home investment. Based on Company’s five-year financing facility with a fixed rate of 2.76%. Includes other direct G&A expenses and estimated partner fees including potential incentive fees. Illustrative SFR Economic Returns (1) Growth in SFR Investment Portfolio Achieved original goal of acquiring ≈$200 million of homes Have reached 622 homes today for a total of $197 million Agreement to sell 376 homes by end of August (see slide 9) Ability to reinvest potential sale proceeds to scale back up to ≈$200 million of homes Strong net rental yields of 4.80% with ability to realize potential home price appreciation Diverse portfolio in eight growth markets Attractive $150 million five-year funding facility with below market fixed rate of 2.76% $29 $81 $137 $192 $200 $197
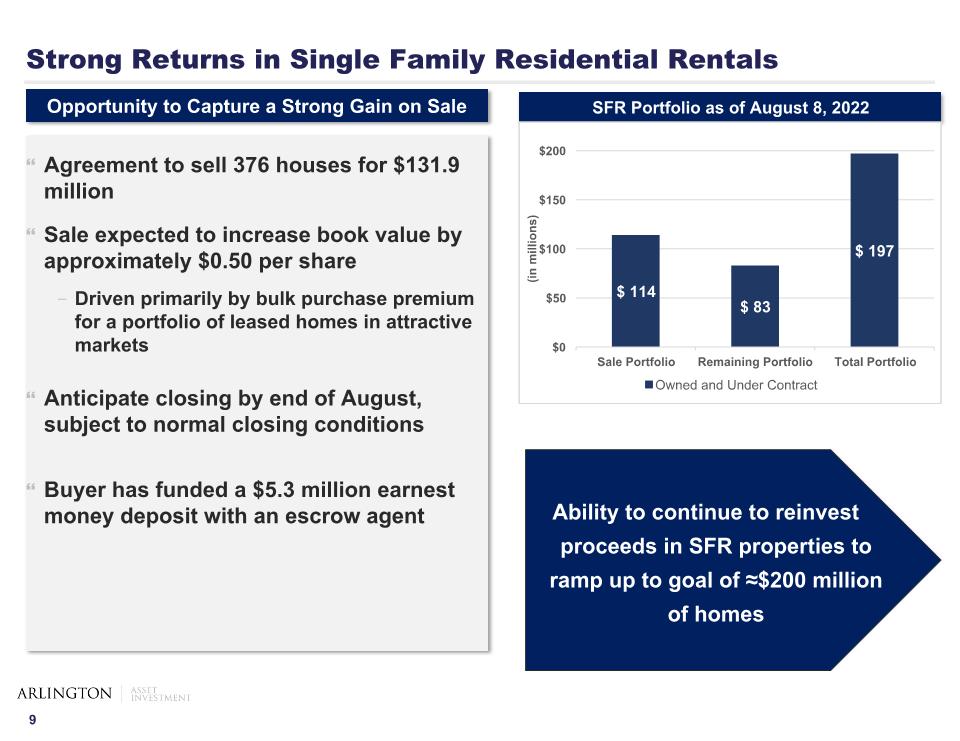
Strong Returns in Single Family Residential Rentals Agreement to sell 376 houses for $131.9 million Sale expected to increase book value by approximately $0.50 per share Driven primarily by bulk purchase premium for a portfolio of leased homes in attractive markets Anticipate closing by end of August, subject to normal closing conditions Buyer has funded a $5.3 million earnest money deposit with an escrow agent Opportunity to Capture a Strong Gain on Sale SFR Portfolio as of August 8, 2022 Ability to continue to reinvest proceeds in SFR properties to ramp up to goal of ≈$200 million of homes
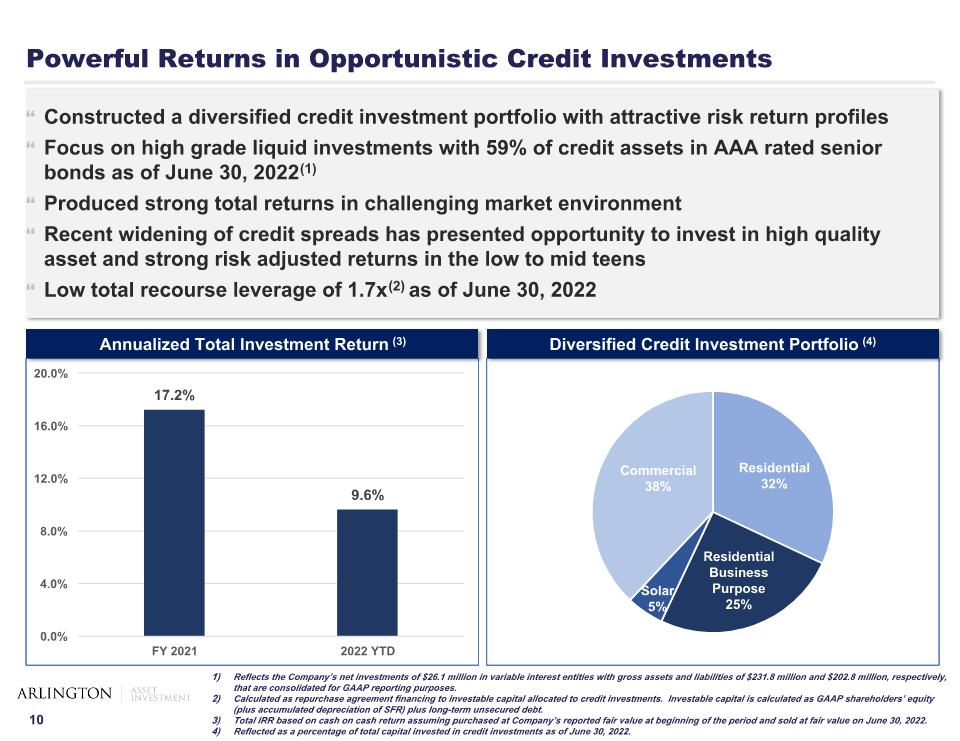
Powerful Returns in Opportunistic Credit Investments Constructed a diversified credit investment portfolio with attractive risk return profiles Focus on high grade liquid investments with 59% of credit assets in AAA rated senior bonds as of June 30, 2022(1) Produced strong total returns in challenging market environment Recent widening of credit spreads has presented opportunity to invest in high quality asset and strong risk adjusted returns in the low to mid teens Low total recourse leverage of 1.7x(2) as of June 30, 2022 Reflects the Company’s net investments of $26.1 million in variable interest entities with gross assets and liabilities of $231.8 million and $202.8 million, respectively, that are consolidated for GAAP reporting purposes. Calculated as repurchase agreement financing to investable capital allocated to credit investments. Investable capital is calculated as GAAP shareholders’ equity (plus accumulated depreciation of SFR) plus long-term unsecured debt. Total IRR based on cash on cash return assuming purchased at Company’s reported fair value at beginning of the period and sold at fair value on June 30, 2022. Reflected as a percentage of total capital invested in credit investments as of June 30, 2022. Annualized Total Investment Return (3) Diversified Credit Investment Portfolio (4)
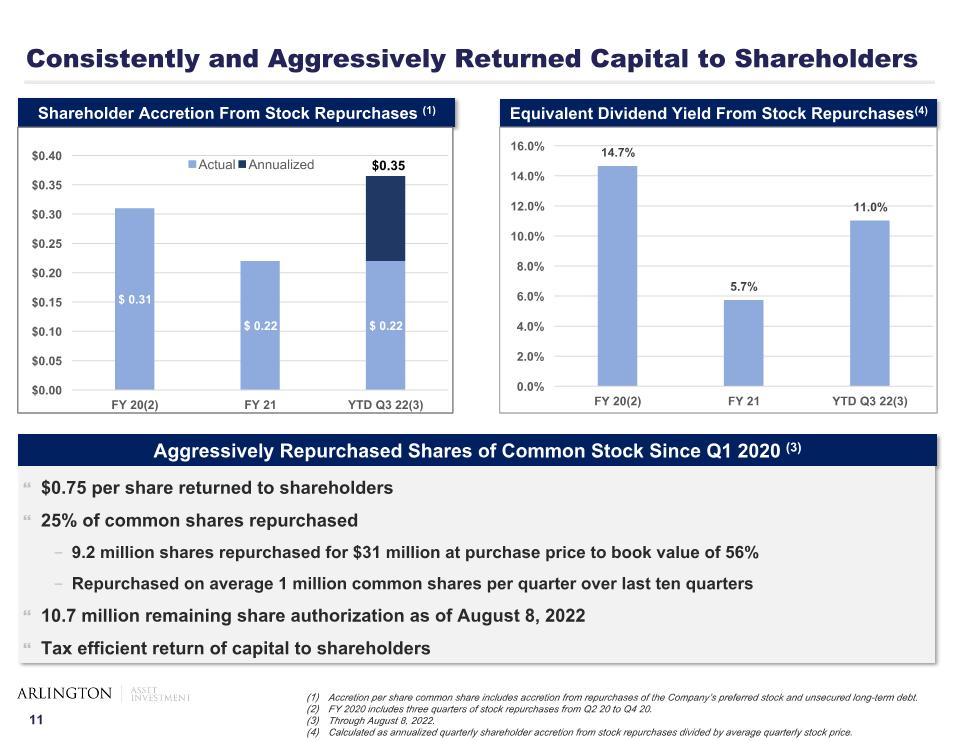
Consistently and Aggressively Returned Capital to Shareholders Accretion per share common share includes accretion from repurchases of the Company’s preferred stock and unsecured long-term debt. FY 2020 includes three quarters of stock repurchases from Q2 20 to Q4 20. Through August 8, 2022. Calculated as annualized quarterly shareholder accretion from stock repurchases divided by average quarterly stock price. Shareholder Accretion From Stock Repurchases (1) Aggressively Repurchased Shares of Common Stock Since Q1 2020 (3) Equivalent Dividend Yield From Stock Repurchases(4) $0.75 per share returned to shareholders 25% of common shares repurchased 9.2 million shares repurchased for $31 million at purchase price to book value of 56% Repurchased on average 1 million common shares per quarter over last ten quarters 10.7 million remaining share authorization as of August 8, 2022 Tax efficient return of capital to shareholders $0.35
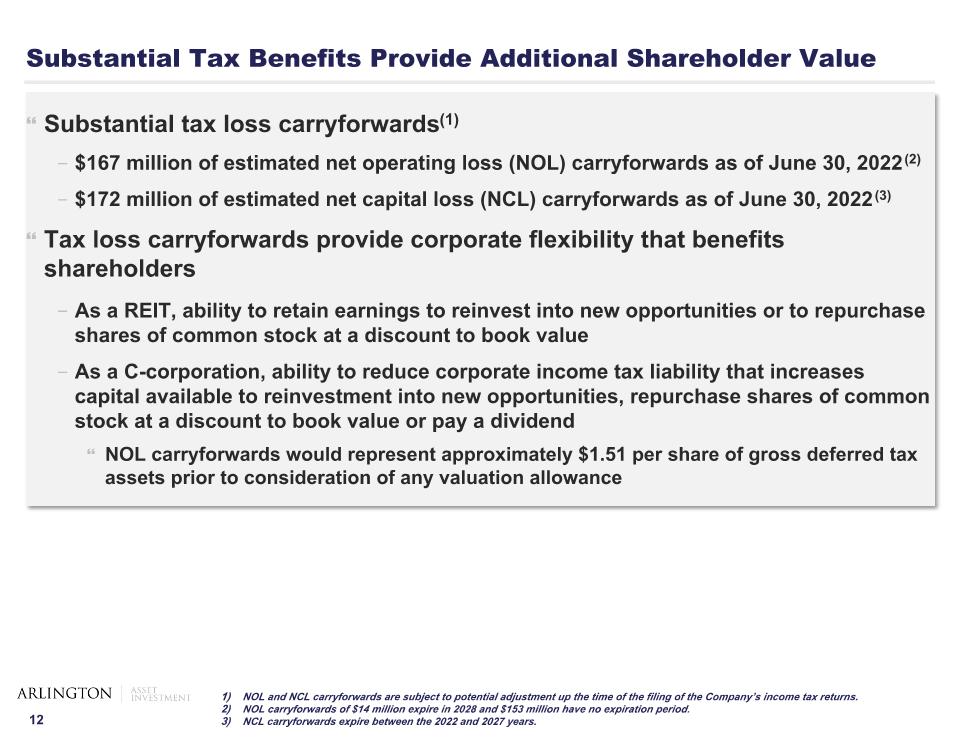
Substantial Tax Benefits Provide Additional Shareholder Value Substantial tax loss carryforwards(1) $167 million of estimated net operating loss (NOL) carryforwards as of June 30, 2022(2) $172 million of estimated net capital loss (NCL) carryforwards as of June 30, 2022(3) Tax loss carryforwards provide corporate flexibility that benefits shareholders As a REIT, ability to retain earnings to reinvest into new opportunities or to repurchase shares of common stock at a discount to book value As a C-corporation, ability to reduce corporate income tax liability that increases capital available to reinvestment into new opportunities, repurchase shares of common stock at a discount to book value or pay a dividend NOL carryforwards would represent approximately $1.51 per share of gross deferred tax assets prior to consideration of any valuation allowance NOL and NCL carryforwards are subject to potential adjustment up the time of the filing of the Company’s income tax returns. NOL carryforwards of $14 million expire in 2028 and $153 million have no expiration period. NCL carryforwards expire between the 2022 and 2027 years.
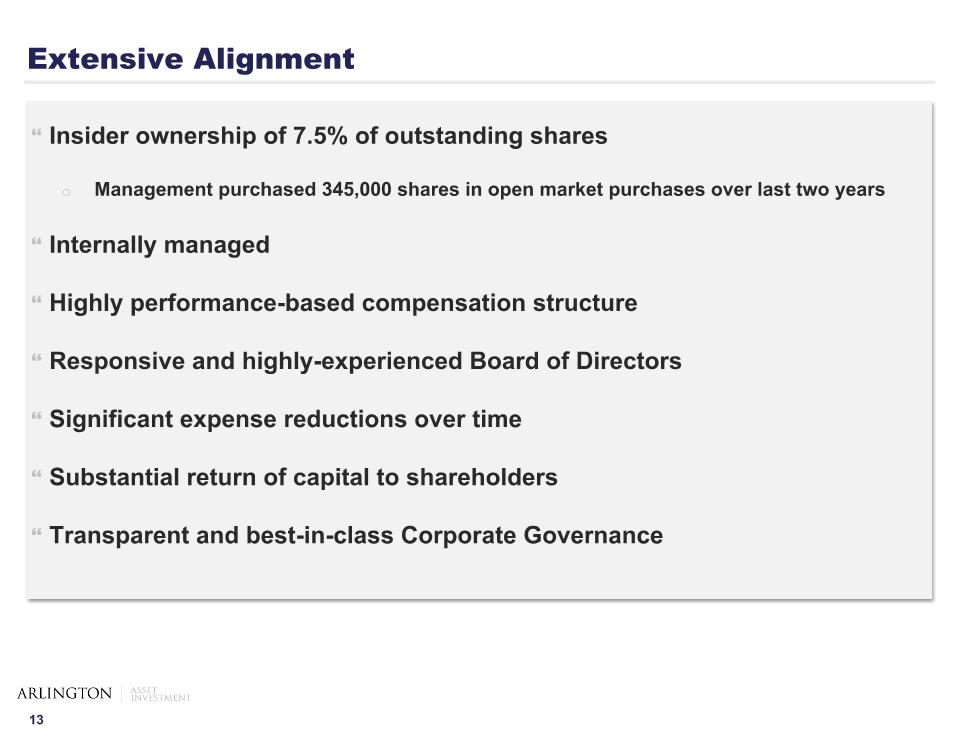
Extensive Alignment Insider ownership of 7.5% of outstanding shares Management purchased 345,000 shares in open market purchases over last two years Internally managed Highly performance-based compensation structure Responsive and highly-experienced Board of Directors Significant expense reductions over time Substantial return of capital to shareholders Transparent and best-in-class Corporate Governance
Q2 2022 Financial Review
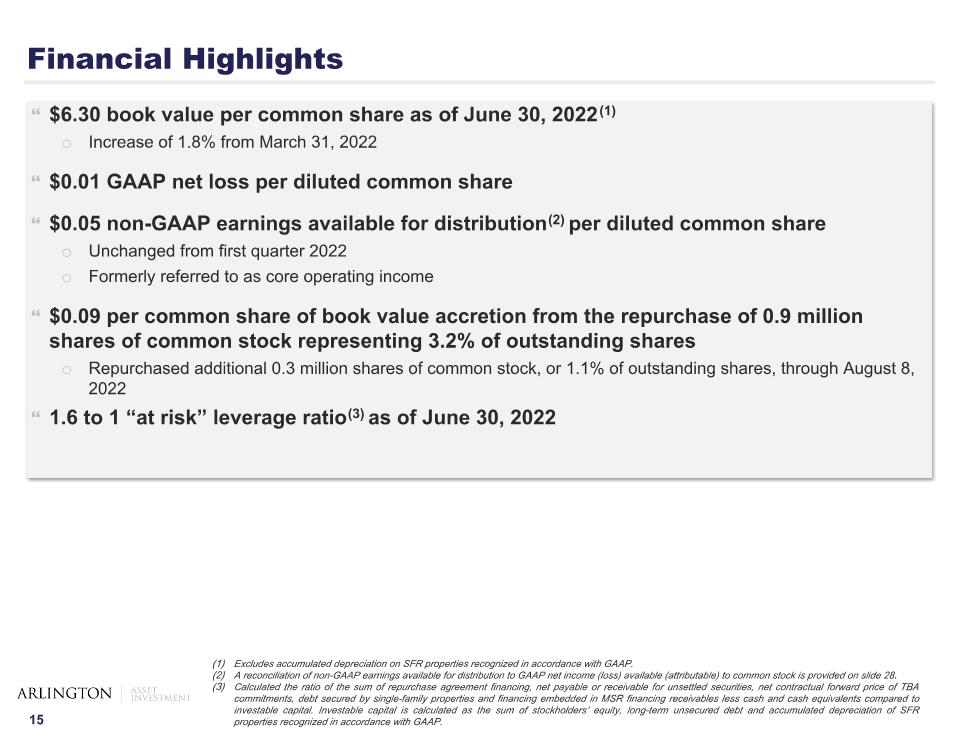
Financial Highlights $6.30 book value per common share as of June 30, 2022(1) Increase of 1.8% from March 31, 2022 $0.01 GAAP net loss per diluted common share $0.05 non-GAAP earnings available for distribution(2) per diluted common share Unchanged from first quarter 2022 Formerly referred to as core operating income $0.09 per common share of book value accretion from the repurchase of 0.9 million shares of common stock representing 3.2% of outstanding shares Repurchased additional 0.3 million shares of common stock, or 1.1% of outstanding shares, through August 8, 2022 1.6 to 1 “at risk” leverage ratio(3) as of June 30, 2022 Excludes accumulated depreciation on SFR properties recognized in accordance with GAAP. A reconciliation of non-GAAP earnings available for distribution to GAAP net income (loss) available (attributable) to common stock is provided on slide 28. Calculated the ratio of the sum of repurchase agreement financing, net payable or receivable for unsettled securities, net contractual forward price of TBA commitments, debt secured by single-family properties and financing embedded in MSR financing receivables less cash and cash equivalents compared to investable capital. Investable capital is calculated as the sum of stockholders’ equity, long-term unsecured debt and accumulated depreciation of SFR properties recognized in accordance with GAAP.
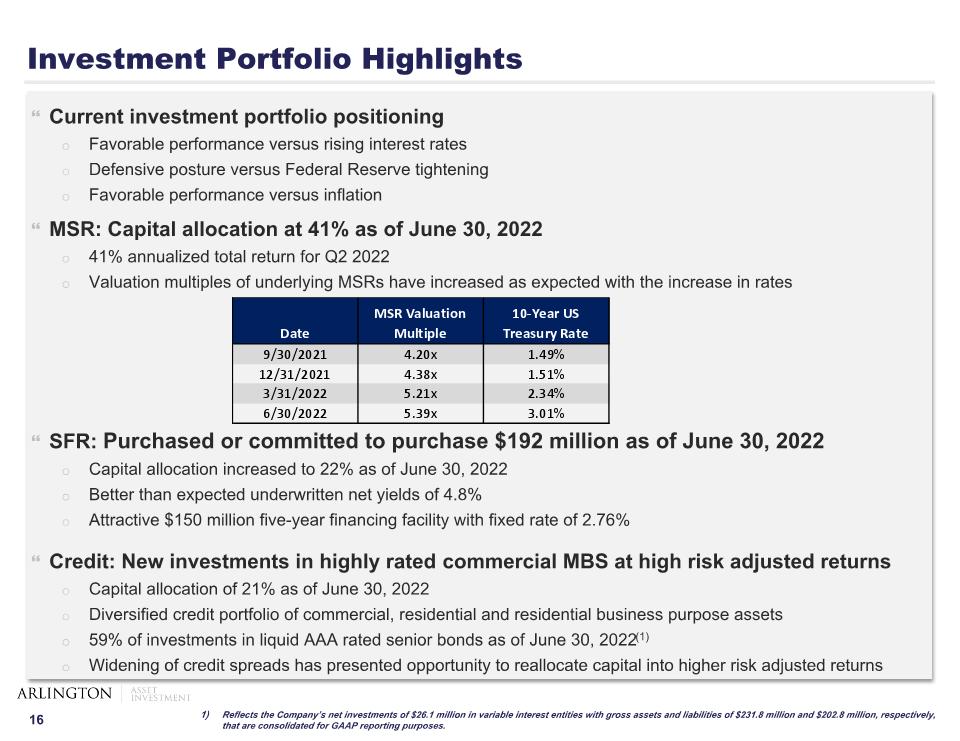
Investment Portfolio Highlights Current investment portfolio positioning Favorable performance versus rising interest rates Defensive posture versus Federal Reserve tightening Favorable performance versus inflation MSR: Capital allocation at 41% as of June 30, 2022 41% annualized total return for Q2 2022 Valuation multiples of underlying MSRs have increased as expected with the increase in rates SFR: Purchased or committed to purchase $192 million as of June 30, 2022 Capital allocation increased to 22% as of June 30, 2022 Better than expected underwritten net yields of 4.8% Attractive $150 million five-year financing facility with fixed rate of 2.76% Credit: New investments in highly rated commercial MBS at high risk adjusted returns Capital allocation of 21% as of June 30, 2022 Diversified credit portfolio of commercial, residential and residential business purpose assets 59% of investments in liquid AAA rated senior bonds as of June 30, 2022(1) Widening of credit spreads has presented opportunity to reallocate capital into higher risk adjusted returns Reflects the Company’s net investments of $26.1 million in variable interest entities with gross assets and liabilities of $231.8 million and $202.8 million, respectively, that are consolidated for GAAP reporting purposes.
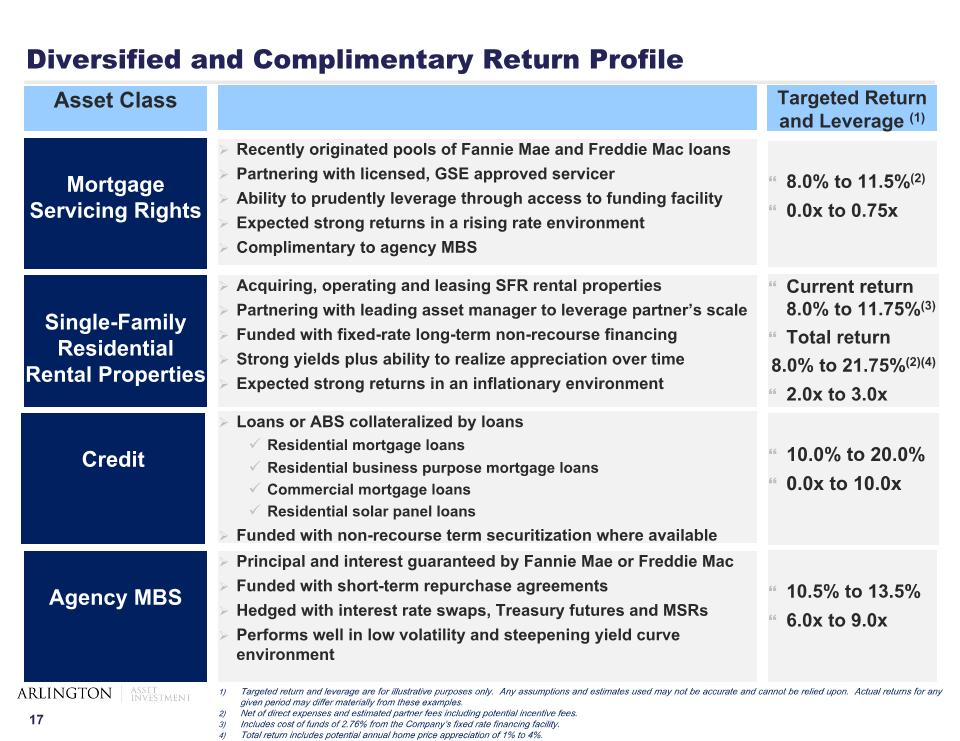
Diversified and Complimentary Return Profile Agency MBS Mortgage Servicing Rights Single-Family Residential Rental Properties Credit Principal and interest guaranteed by Fannie Mae or Freddie Mac Funded with short-term repurchase agreements Hedged with interest rate swaps, Treasury futures and MSRs Performs well in low volatility and steepening yield curve environment 10.5% to 13.5% 6.0x to 9.0x Asset Class Targeted Return and Leverage (1) Recently originated pools of Fannie Mae and Freddie Mac loans Partnering with licensed, GSE approved servicer Ability to prudently leverage through access to funding facility Expected strong returns in a rising rate environment Complimentary to agency MBS 8.0% to 11.5%(2) 0.0x to 0.75x Current return 8.0% to 11.75%(3) Total return 8.0% to 21.75%(2)(4) 2.0x to 3.0x 10.0% to 20.0% 0.0x to 10.0x Acquiring, operating and leasing SFR rental properties Partnering with leading asset manager to leverage partner’s scale Funded with fixed-rate long-term non-recourse financing Strong yields plus ability to realize appreciation over time Expected strong returns in an inflationary environment Loans or ABS collateralized by loans Residential mortgage loans Residential business purpose mortgage loans Commercial mortgage loans Residential solar panel loans Funded with non-recourse term securitization where available Targeted return and leverage are for illustrative purposes only. Any assumptions and estimates used may not be accurate and cannot be relied upon. Actual returns for any given period may differ materially from these examples. Net of direct expenses and estimated partner fees including potential incentive fees. Includes cost of funds of 2.76% from the Company’s fixed rate financing facility. Total return includes potential annual home price appreciation of 1% to 4%.
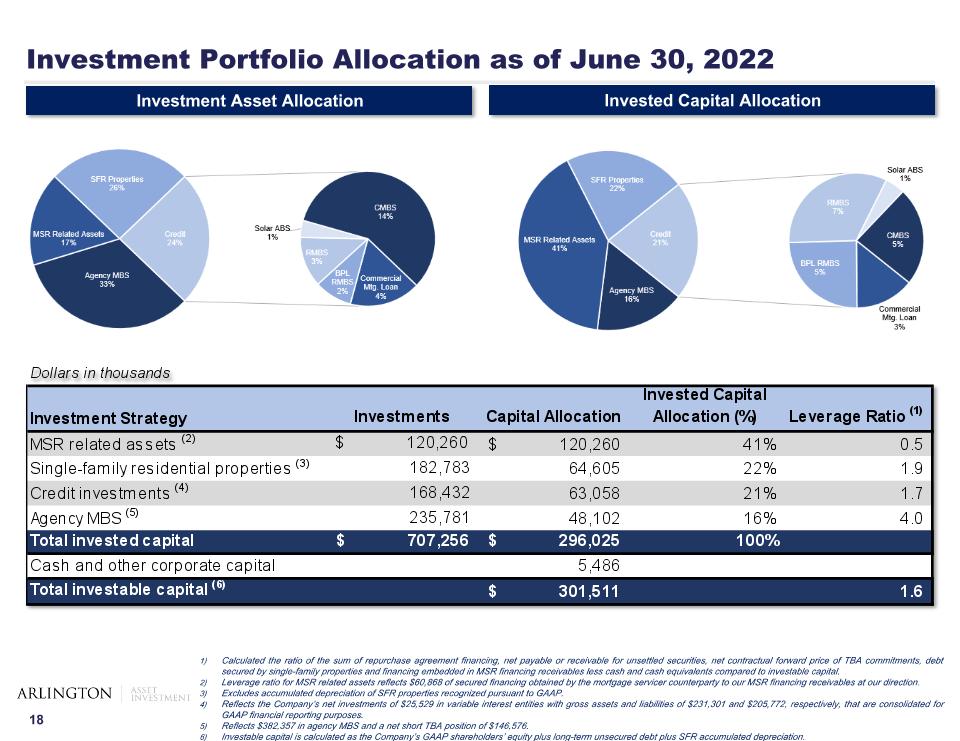
Investment Portfolio Allocation as of June 30, 2022 Investment Asset Allocation Invested Capital Allocation Calculated the ratio of the sum of repurchase agreement financing, net payable or receivable for unsettled securities, net contractual forward price of TBA commitments, debt secured by single-family properties and financing embedded in MSR financing receivables less cash and cash equivalents compared to investable capital. Leverage ratio for MSR related assets reflects $60,868 of secured financing obtained by the mortgage servicer counterparty to our MSR financing receivables at our direction. Excludes accumulated depreciation of SFR properties recognized pursuant to GAAP. Reflects the Company’s net investments of $25,529 in variable interest entities with gross assets and liabilities of $231,301 and $205,772, respectively, that are consolidated for GAAP financial reporting purposes. Reflects $382,357 in agency MBS and a net short TBA position of $146,576. Investable capital is calculated as the Company’s GAAP shareholders’ equity plus long-term unsecured debt plus SFR accumulated depreciation.
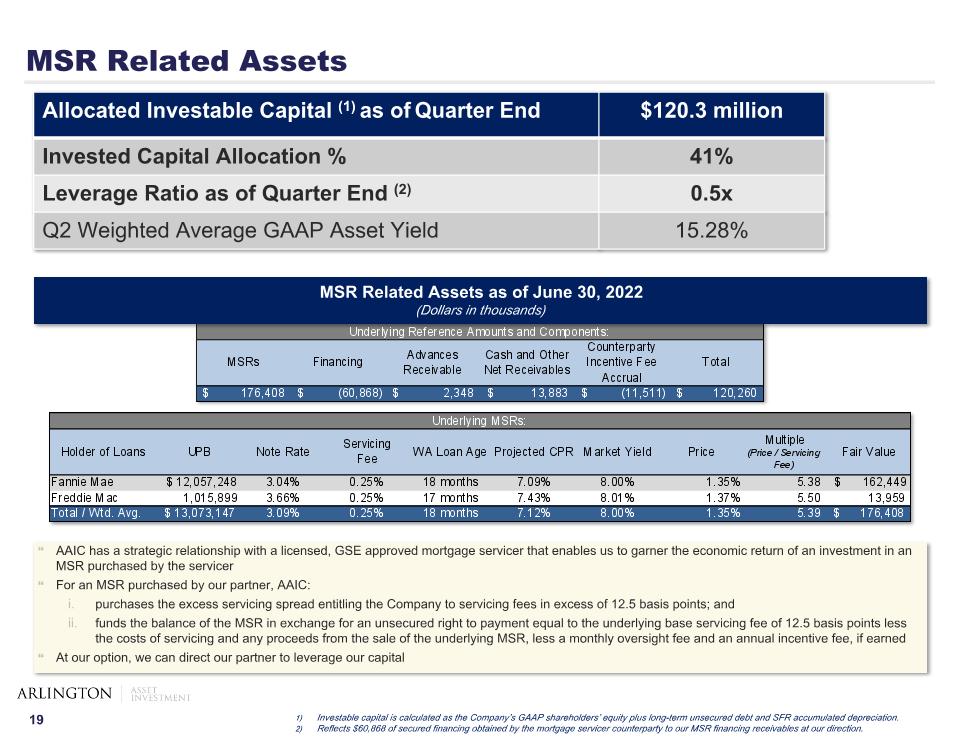
MSR Related Assets Allocated Investable Capital (1) as of Quarter End $120.3 million Invested Capital Allocation % 41% Leverage Ratio as of Quarter End (2) 0.5x Q2 Weighted Average GAAP Asset Yield 15.28% MSR Related Assets as of June 30, 2022 (Dollars in thousands) AAIC has a strategic relationship with a licensed, GSE approved mortgage servicer that enables us to garner the economic return of an investment in an MSR purchased by the servicer For an MSR purchased by our partner, AAIC: purchases the excess servicing spread entitling the Company to servicing fees in excess of 12.5 basis points; and funds the balance of the MSR in exchange for an unsecured right to payment equal to the underlying base servicing fee of 12.5 basis points less the costs of servicing and any proceeds from the sale of the underlying MSR, less a monthly oversight fee and an annual incentive fee, if earned At our option, we can direct our partner to leverage our capital Investable capital is calculated as the Company’s GAAP shareholders’ equity plus long-term unsecured debt and SFR accumulated depreciation. Reflects $60,868 of secured financing obtained by the mortgage servicer counterparty to our MSR financing receivables at our direction.
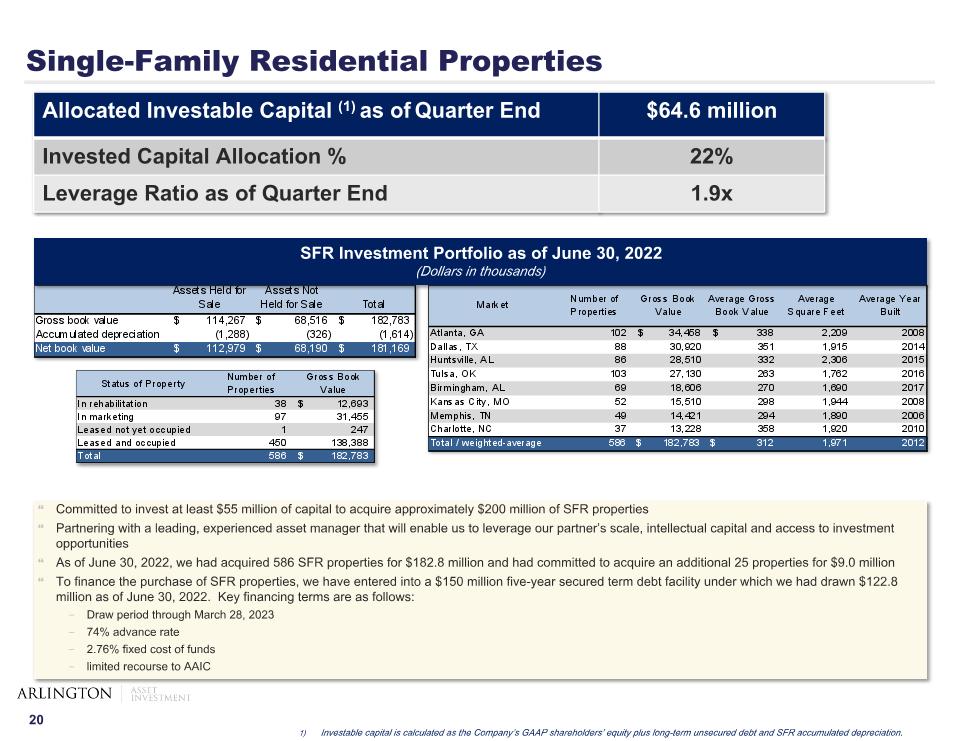
Single-Family Residential Properties Investable capital is calculated as the Company’s GAAP shareholders’ equity plus long-term unsecured debt and SFR accumulated depreciation. Allocated Investable Capital (1) as of Quarter End $64.6 million Invested Capital Allocation % 22% Leverage Ratio as of Quarter End 1.9x SFR Investment Portfolio as of June 30, 2022 (Dollars in thousands) Committed to invest at least $55 million of capital to acquire approximately $200 million of SFR properties Partnering with a leading, experienced asset manager that will enable us to leverage our partner’s scale, intellectual capital and access to investment opportunities As of June 30, 2022, we had acquired 586 SFR properties for $182.8 million and had committed to acquire an additional 25 properties for $9.0 million To finance the purchase of SFR properties, we have entered into a $150 million five-year secured term debt facility under which we had drawn $122.8 million as of June 30, 2022. Key financing terms are as follows: Draw period through March 28, 2023 74% advance rate 2.76% fixed cost of funds limited recourse to AAIC
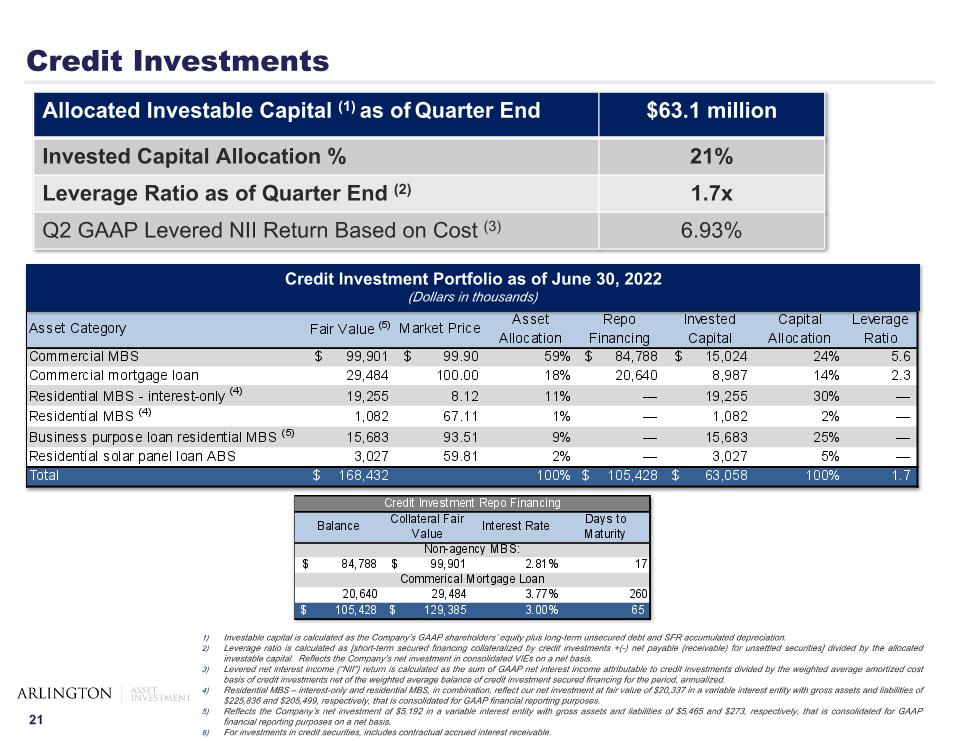
Credit Investments Investable capital is calculated as the Company’s GAAP shareholders’ equity plus long-term unsecured debt and SFR accumulated depreciation. Leverage ratio is calculated as [short-term secured financing collateralized by credit investments +(-) net payable (receivable) for unsettled securities] divided by the allocated investable capital. Reflects the Company’s net investment in consolidated VIEs on a net basis. Levered net interest income (“NII”) return is calculated as the sum of GAAP net interest income attributable to credit investments divided by the weighted average amortized cost basis of credit investments net of the weighted average balance of credit investment secured financing for the period, annualized. Residential MBS – interest-only and residential MBS, in combination, reflect our net investment at fair value of $20,337 in a variable interest entity with gross assets and liabilities of $225,836 and $205,499, respectively, that is consolidated for GAAP financial reporting purposes. Reflects the Company’s net investment of $5,192 in a variable interest entity with gross assets and liabilities of $5,465 and $273, respectively, that is consolidated for GAAP financial reporting purposes on a net basis. For investments in credit securities, includes contractual accrued interest receivable. Allocated Investable Capital (1) as of Quarter End $63.1 million Invested Capital Allocation % 21% Leverage Ratio as of Quarter End (2) 1.7x Q2 GAAP Levered NII Return Based on Cost (3) 6.93% Credit Investment Portfolio as of June 30, 2022 (Dollars in thousands)
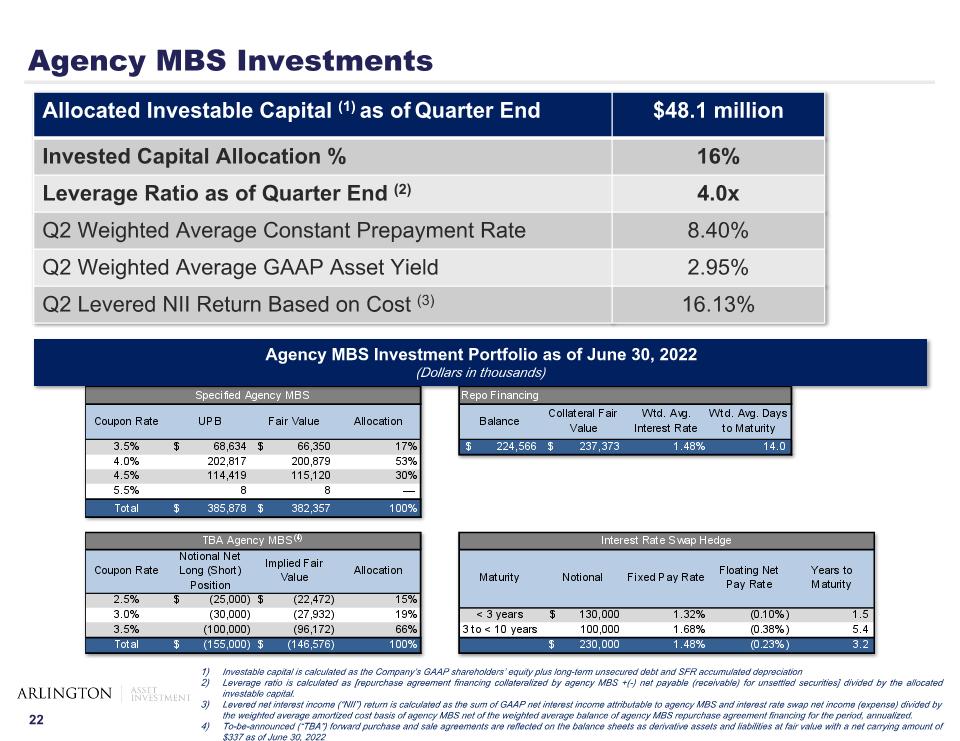
Agency MBS Investments Agency MBS Investment Portfolio as of June 30, 2022 (Dollars in thousands) Investable capital is calculated as the Company’s GAAP shareholders’ equity plus long-term unsecured debt and SFR accumulated depreciation Leverage ratio is calculated as [repurchase agreement financing collateralized by agency MBS +(-) net payable (receivable) for unsettled securities] divided by the allocated investable capital. Levered net interest income (“NII”) return is calculated as the sum of GAAP net interest income attributable to agency MBS and interest rate swap net income (expense) divided by the weighted average amortized cost basis of agency MBS net of the weighted average balance of agency MBS repurchase agreement financing for the period, annualized. To-be-announced (“TBA”) forward purchase and sale agreements are reflected on the balance sheets as derivative assets and liabilities at fair value with a net carrying amount of $337 as of June 30, 2022 Allocated Investable Capital (1) as of Quarter End $48.1 million Invested Capital Allocation % 16% Leverage Ratio as of Quarter End (2) 4.0x Q2 Weighted Average Constant Prepayment Rate 8.40% Q2 Weighted Average GAAP Asset Yield 2.95% Q2 Levered NII Return Based on Cost (3) 16.13%
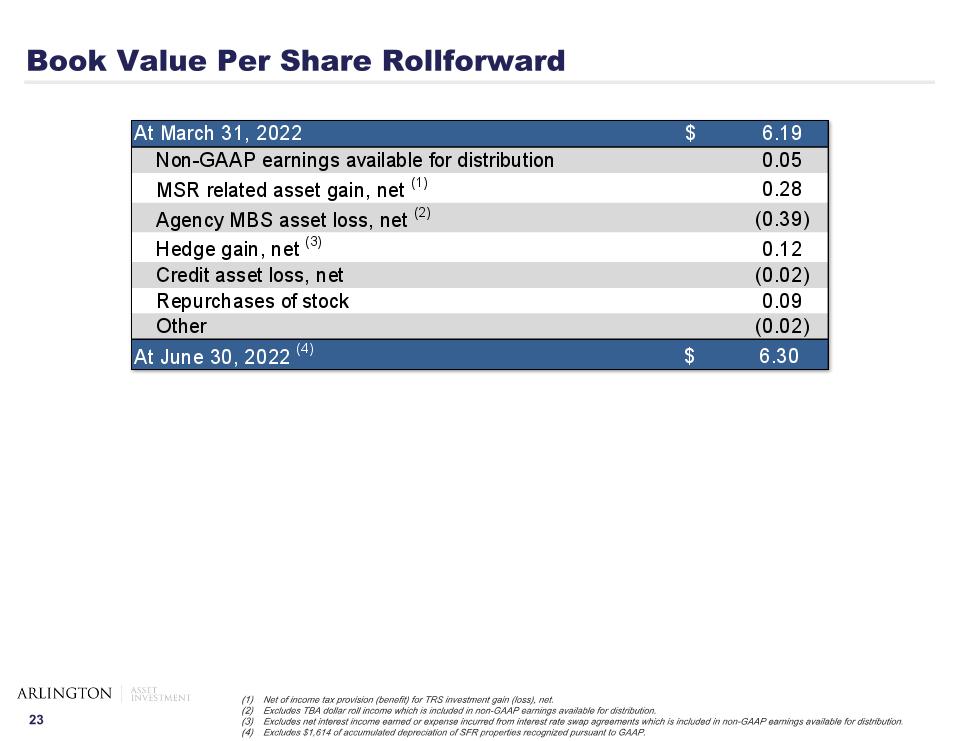
Book Value Per Share Rollforward Net of income tax provision (benefit) for TRS investment gain (loss), net. Excludes TBA dollar roll income which is included in non-GAAP earnings available for distribution. Excludes net interest income earned or expense incurred from interest rate swap agreements which is included in non-GAAP earnings available for distribution. Excludes $1,614 of accumulated depreciation of SFR properties recognized pursuant to GAAP.
Additional Financial Information
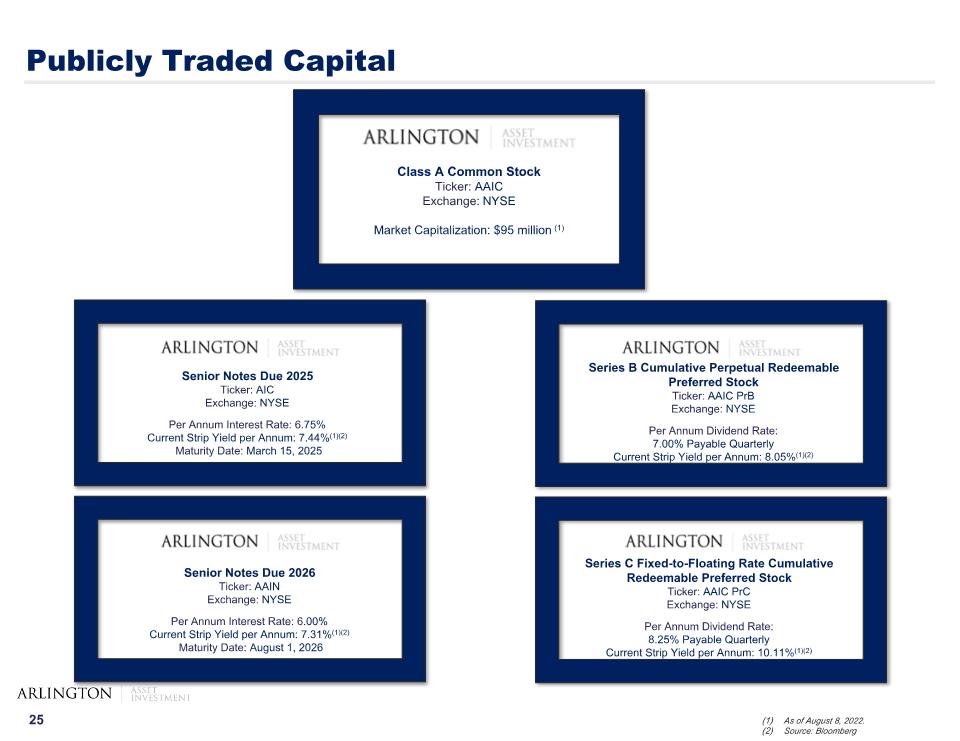
Publicly Traded Capital Class A Common Stock Ticker: AAIC Exchange: NYSE Market Capitalization: $95 million (1) Senior Notes Due 2026 Ticker: AAIN Exchange: NYSE Per Annum Interest Rate: 6.00% Current Strip Yield per Annum: 7.31%(1)(2) Maturity Date: August 1, 2026 Series B Cumulative Perpetual Redeemable Preferred Stock Ticker: AAIC PrB Exchange: NYSE Per Annum Dividend Rate: 7.00% Payable Quarterly Current Strip Yield per Annum: 8.05%(1)(2) As of August 8, 2022. Source: Bloomberg Series C Fixed-to-Floating Rate Cumulative Redeemable Preferred Stock Ticker: AAIC PrC Exchange: NYSE Per Annum Dividend Rate: 8.25% Payable Quarterly Current Strip Yield per Annum: 10.11%(1)(2) Senior Notes Due 2025 Ticker: AIC Exchange: NYSE Per Annum Interest Rate: 6.75% Current Strip Yield per Annum: 7.44%(1)(2) Maturity Date: March 15, 2025
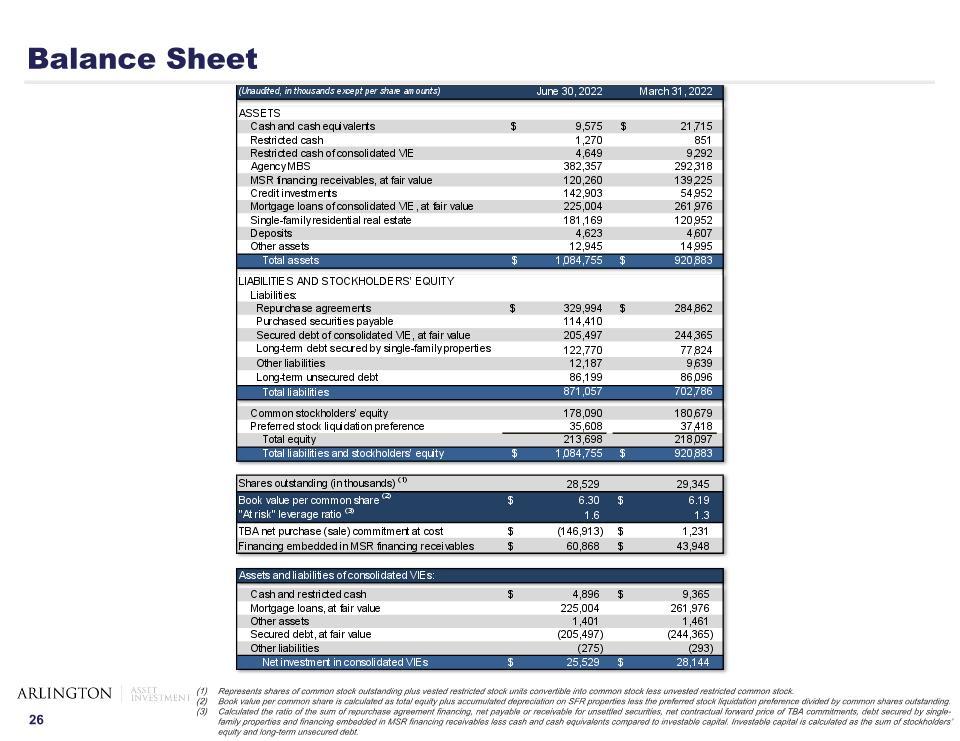
Balance Sheet Represents shares of common stock outstanding plus vested restricted stock units convertible into common stock less unvested restricted common stock. Book value per common share is calculated as total equity plus accumulated depreciation on SFR properties less the preferred stock liquidation preference divided by common shares outstanding. Calculated the ratio of the sum of repurchase agreement financing, net payable or receivable for unsettled securities, net contractual forward price of TBA commitments, debt secured by single-family properties and financing embedded in MSR financing receivables less cash and cash equivalents compared to investable capital. Investable capital is calculated as the sum of stockholders’ equity and long-term unsecured debt.
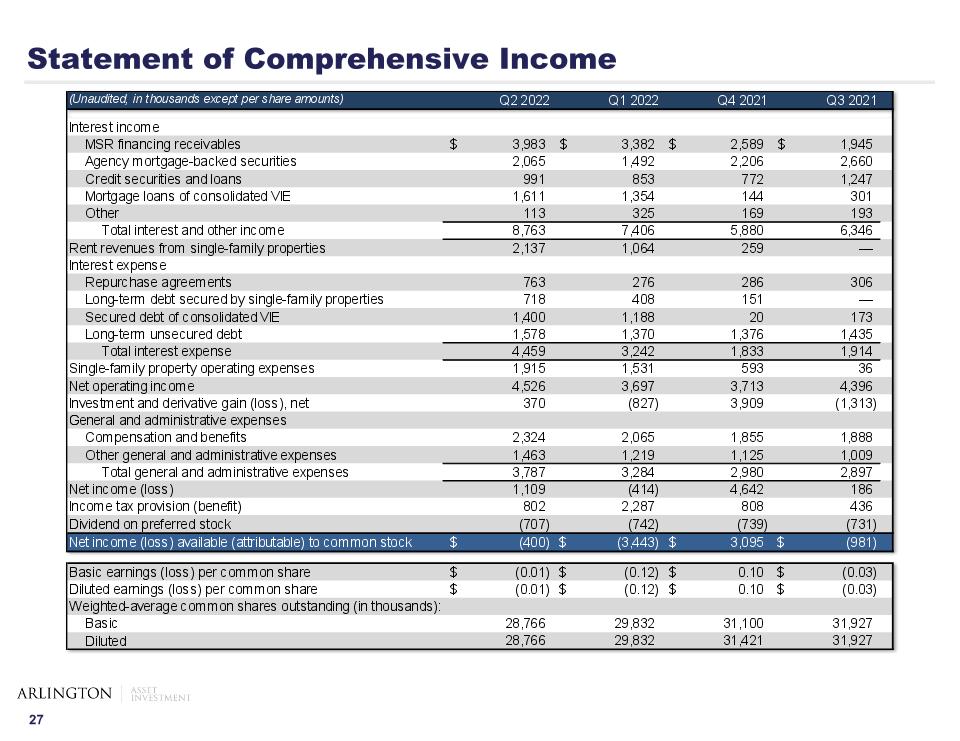
Statement of Comprehensive Income
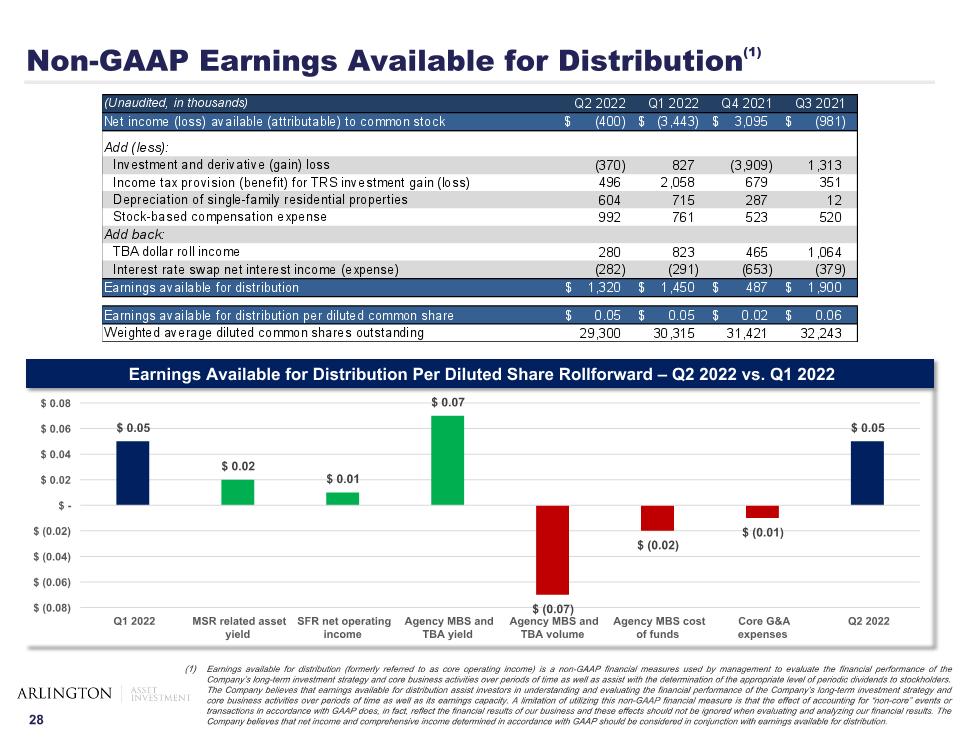
Non-GAAP Earnings Available for Distribution(1) Earnings available for distribution (formerly referred to as core operating income) is a non-GAAP financial measures used by management to evaluate the financial performance of the Company’s long-term investment strategy and core business activities over periods of time as well as assist with the determination of the appropriate level of periodic dividends to stockholders. The Company believes that earnings available for distribution assist investors in understanding and evaluating the financial performance of the Company’s long-term investment strategy and core business activities over periods of time as well as its earnings capacity. A limitation of utilizing this non-GAAP financial measure is that the effect of accounting for “non-core” events or transactions in accordance with GAAP does, in fact, reflect the financial results of our business and these effects should not be ignored when evaluating and analyzing our financial results. The Company believes that net income and comprehensive income determined in accordance with GAAP should be considered in conjunction with earnings available for distribution. Earnings Available for Distribution Per Diluted Share Rollforward – Q2 2022 vs. Q1 2022
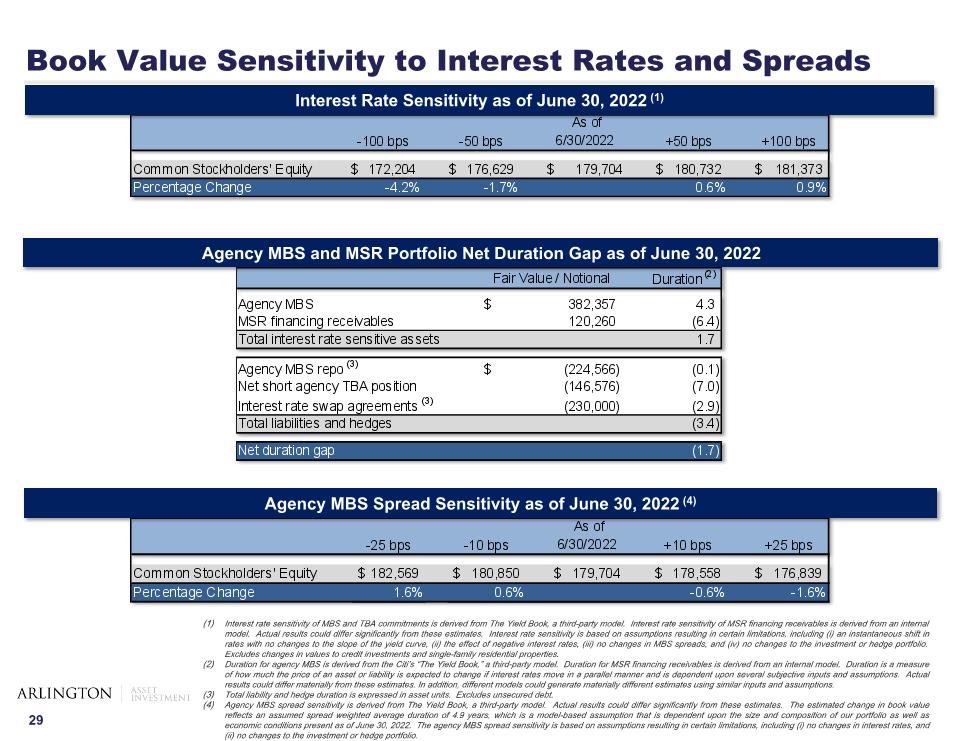
Interest rate sensitivity of MBS and TBA commitments is derived from The Yield Book, a third-party model. Interest rate sensitivity of MSR financing receivables is derived from an internal model. Actual results could differ significantly from these estimates. Interest rate sensitivity is based on assumptions resulting in certain limitations, including (i) an instantaneous shift in rates with no changes to the slope of the yield curve, (ii) the effect of negative interest rates, (iii) no changes in MBS spreads, and (iv) no changes to the investment or hedge portfolio. Excludes changes in values to credit investments and single-family residential properties. Duration for agency MBS is derived from the Citi’s “The Yield Book,” a third-party model. Duration for MSR financing receivables is derived from an internal model. Duration is a measure of how much the price of an asset or liability is expected to change if interest rates move in a parallel manner and is dependent upon several subjective inputs and assumptions. Actual results could differ materially from these estimates. In addition, different models could generate materially different estimates using similar inputs and assumptions. Total liability and hedge duration is expressed in asset units. Excludes unsecured debt. Agency MBS spread sensitivity is derived from The Yield Book, a third-party model. Actual results could differ significantly from these estimates. The estimated change in book value reflects an assumed spread weighted average duration of 4.9 years, which is a model-based assumption that is dependent upon the size and composition of our portfolio as well as economic conditions present as of June 30, 2022. The agency MBS spread sensitivity is based on assumptions resulting in certain limitations, including (i) no changes in interest rates, and (ii) no changes to the investment or hedge portfolio. Interest Rate Sensitivity as of June 30, 2022 (1) Book Value Sensitivity to Interest Rates and Spreads Agency MBS Spread Sensitivity as of June 30, 2022 (4) Agency MBS and MSR Portfolio Net Duration Gap as of June 30, 2022
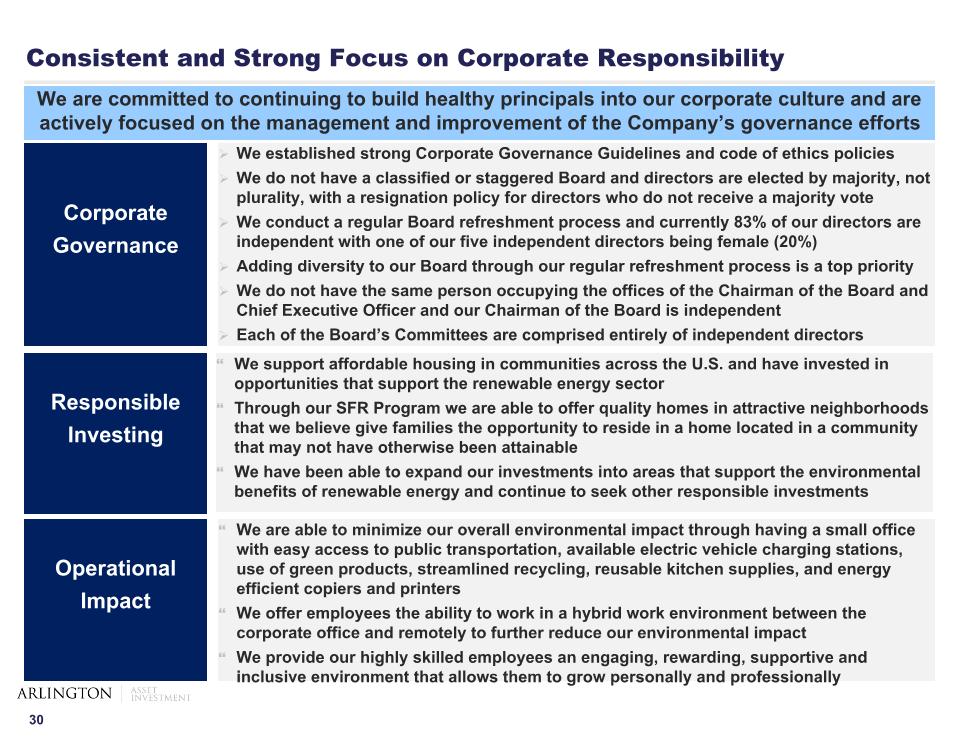
Consistent and Strong Focus on Corporate Responsibility Corporate Governance We are committed to continuing to build healthy principals into our corporate culture and are actively focused on the management and improvement of the Company’s governance efforts We established strong Corporate Governance Guidelines and code of ethics policies We do not have a classified or staggered Board and directors are elected by majority, not plurality, with a resignation policy for directors who do not receive a majority vote We conduct a regular Board refreshment process and currently 83% of our directors are independent with one of our five independent directors being female (20%) Adding diversity to our Board through our regular refreshment process is a top priority We do not have the same person occupying the offices of the Chairman of the Board and Chief Executive Officer and our Chairman of the Board is independent Each of the Board’s Committees are comprised entirely of independent directors Responsible Investing We support affordable housing in communities across the U.S. and have invested in opportunities that support the renewable energy sector Through our SFR Program we are able to offer quality homes in attractive neighborhoods that we believe give families the opportunity to reside in a home located in a community that may not have otherwise been attainable We have been able to expand our investments into areas that support the environmental benefits of renewable energy and continue to seek other responsible investments Operational Impact We are able to minimize our overall environmental impact through having a small office with easy access to public transportation, available electric vehicle charging stations, use of green products, streamlined recycling, reusable kitchen supplies, and energy efficient copiers and printers We offer employees the ability to work in a hybrid work environment between the corporate office and remotely to further reduce our environmental impact We provide our highly skilled employees an engaging, rewarding, supportive and inclusive environment that allows them to grow personally and professionally


