EXHIBIT 99.1
[LOGO]
F R I E D M A N B I L L I N G S R A M S E Y
THE WALL STREET ANALYST FORUM
Presentation
September 17, 2003

This document is intended solely for the use of the party to whom FBR has provided it, and is not to be reprinted or redistributed without the permission of FBR. All references to “FBR” refer to Friedman, Billings, Ramsey Group, Inc., and its predecessors and subsidiaries as appropriate. Investment banking, sales, trading, and research services are provided by Friedman, Billings, Ramsey & Co., Inc. (FBR & Co.), except for those online offering, mutual fund distribution and discount brokerage services provided by FBR Investment Services, Inc. (FBRIS), and those services in the U.K., Europe and elsewhere outside the United States and Canada provided by Friedman, Billings, Ramsey International, Ltd. (FBRIL). FBR & Co. and FBRIS are broker-dealers registered with the SEC and are members of the NASD. FBRIL, based in the U.K, is regulated by the Financial Services Authority. Asset management services, including managed hedge funds, mutual funds, private equity and venture capital funds, are provided by FBR subsidiaries FBR Investment Management, Inc. (FBRIM), FBR Fund Advisers, Inc., and Money Management Advisers, Inc., which are investment advisers registered with the SEC. Banking services, including mutual fund custody and administration, are provided by FBR National Bank & Trust1.
On March 31, 2003, Friedman, Billings, Ramsey Group, Inc. merged with FBR Asset Investment Corporation, a real estate investment trust (“REIT”) managed by FBR prior to the merger. The merged company, Friedman, Billings, Ramsey Group, Inc. is structured as a REIT for U.S. Federal Income Tax purposes and conducts its brokerage, sales and trading, investment banking, asset management and banking business through taxable REIT subsidiaries.
This document is intended for information purposes only, and shall not constitute a solicitation or an offer to buy or sell, any security or services, or an endorsement of any particular investment strategy.
For additional important information, please visit our website, www.fbr.com.
CAUTIONS ABOUT FORWARD-LOOKING INFORMATION
This presentation and the information incorporated by reference in this presentation include forward looking statements within the meaning of Section 27A of the Securities Act of 1933, as amended, and Section 21E of the Securities Exchange Act of 1934, as amended. Some of the forward-looking statements can be identified by the use of forward-looking words such as “believes,” “expects,” “may,” “will,” “should,” “seeks,” “approximately,” “plans,” “estimates” or “anticipates” or the negative of those words or other comparable terminology. Statements concerning projections, future performance developments, events, revenues, expenses, earnings, run rates, and any other guidance on present or future periods constitute forward-looking statements. Such statements include, but are not limited to, those relating to the effects of growth, revenues and earnings, our principal investing activities, levels of assets under management and our current equity capital levels. Forward-looking statements involve risks and uncertainties. You should be aware that a number of important factors could cause our actual results to differ materially from those in the forward-looking statements. These factors include, but are not limited to, the overall environment for interest rates, repayment speeds within the mortgage backed securities market, risk associated with equity investments, the demand for public offerings, activity in the secondary securities markets, competition among financial services firms for business and personnel, the high degree of risk associated with venture capital investments, the effect of demand for public offerings, mutual fund and 401(k) pension plan inflows or outflows in the securities markets, volatility of the securities markets, available technologies, the effect of government regulation and of general economic conditions on our own business and on the business in the industry areas on which we focus, fluctuating quarterly operating results, the availability of capital to us and risks related to online commerce. We will not necessarily update the information presented or incorporated by reference in this presentation if any of these forward looking statements turn out to be inaccurate. Risks affecting our business are described throughout our Form 10-K, especially in the section entitled “Risk Factors” beginning on page 29. The entire Form 10-K, including the Consolidated Financial Statements and the notes and any other documents incorporated by reference into the Form 10-K, as well as, the Forms 10Q and 8-K filed subsequent to the forms 10K, should be read for a complete understanding of our business and the risks associated with that business.
F R I E D M A N B I L L I N G S R A M S E Y
The Wall Street Analyst Forum | 1Member FDIC and an equal housing lender. Products | |
September 17, 2003 Page 2 | offered by other FBR subsidiaries are not FDIC insured, not offered, guaranteed or endorsed by FBR National Bank & Trust, and may lose value. |
| [LOGO] | F R I E D M A N B I L L I N G S R A M S E Y
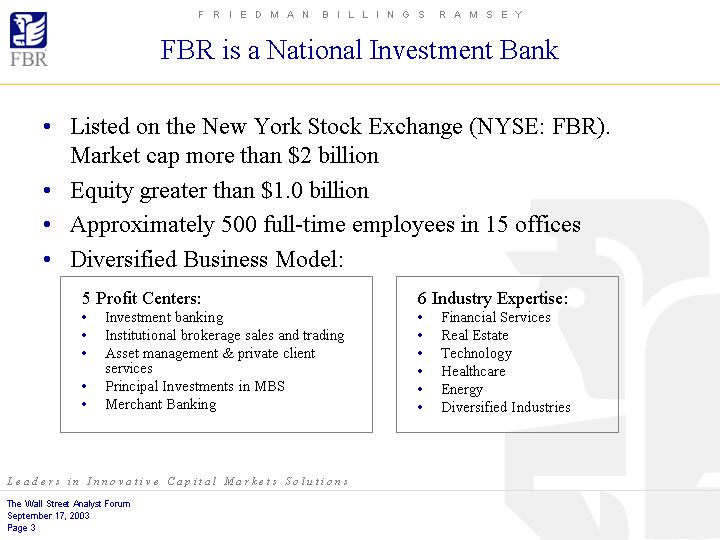
FBR is a National Investment Bank | |
| • | Listed on the New York Stock Exchange (NYSE: FBR). Market cap more than $2 billion |
| • | Equity greater than $1.0 billion |
| • | Approximately 500 full-time employees in 15 offices |
| • | Diversified Business Model: |
| 5 Profit Centers: | 6 Industry Expertise: | |
• Investment banking | • Financial Services | |
• Institutional brokerage sales and trading | • Real Estate | |
• Asset management & private client services | • Technology | |
• Principal Investments in MBS | • Healthcare | |
• Merchant Banking | • Energy | |
• Diversified Industries |
L e a d e r s i n I n n o v a t i v e C a p i t a l M a r k e t s S o l u t i o n s
The Wall Street Analyst Forum
September 17, 2003
Page 3
| [LOGO] | F R I E D M A N B I L L I N G S R A M S E Y
2ndQuarter 2003 Financial Highlights | |
| Q2 Growth | ||
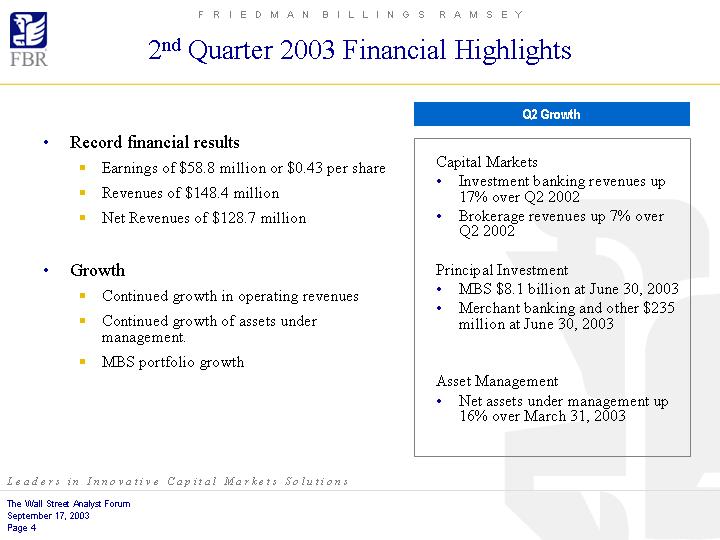
• Record financial results
• Earnings of $58.8 million or $0.43 per share
• Revenues of $148.4 million
• Net Revenues of $128.7 million
• Growth
• Continued growth in operating revenues
• Continued growth of assets under management.
• MBS portfolio growth
| Capital Markets • Investment banking revenues up 17% over Q2 2002
• Brokerage revenues up 7% over Q2 2002
Principal Investment • MBS $8.1 billion at June 30, 2003
• Merchant banking and other $235 million at June 30, 2003
Asset Management • Net assets under management up 16% over March 31, 2003 |
Leaders i n I n n o v a t i v e C a p i t a l M a r k e t s S o l u t i o n s
The Wall Street Analyst Forum
September 17, 2003
Page 4
| [LOGO] | FBR Group Corporate Organizational Chart | |
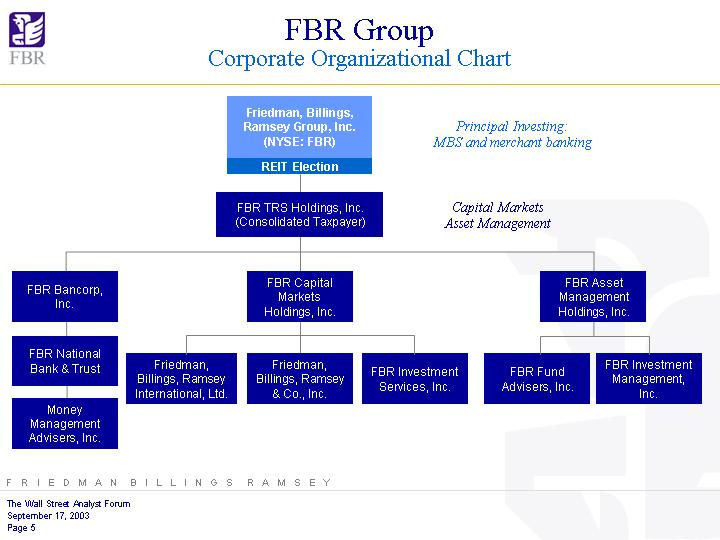
Friedman, Billings, Ramsey Group, Inc. (Nyse: FBR)
REIT Election | Principal Investing: MBS and merchant banking | |||||||||
FBR TRS Holdings, Inc. (Consolidated Taxpayer) | Capital Markets Asset Management | |||||||||
FBR Bancorp, Inc. | FBR Capital Markets Holdings, Inc. | FBR Asset Management Holdings, Inc. | ||||||||
FBR National Bank & Trust | Friedman Bilings, Ramsey International, Ltd. | Friedman, Bilings, Ramsey & Co., Inc. | FBR Investment Services, Inc. | FBR Fund Advisers, Inc. | FBR Investment Management, Inc. | |||||
Money Management Advisers, Inc. | ||||||||||
F R I E D M A N B I L L I N G S R A M S E Y
The Wall Street Analyst Forum
September 17, 2003
Page 5
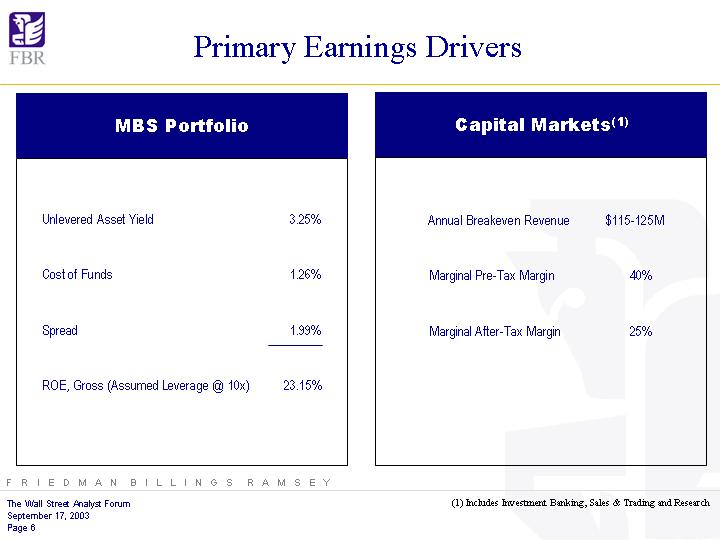
| [LOGO] | Primary Earnings Drivers |
| MBS Portfolio | Capital Markets (1) | |||||
Unlevered Asset Yield | 3.25% | Annual Breakeven Revenue | $115-125M | |||
Cost of Funds | 1.26% | Marginal Pre-Tax Margin | 40% | |||
Spread | 1.99% | Marginal After-Tax Margin | 25% | |||
ROE, Gross (Assumed Leverage @ 10x) | 23.15% | |||||
F R I E D M A N B I L L I N G S R A M S E Y
The Wall Street Analyst Forum September 17, 2003 | (1) Includes Investment Banking, Sales & Trading and Research | |
Page 6 |
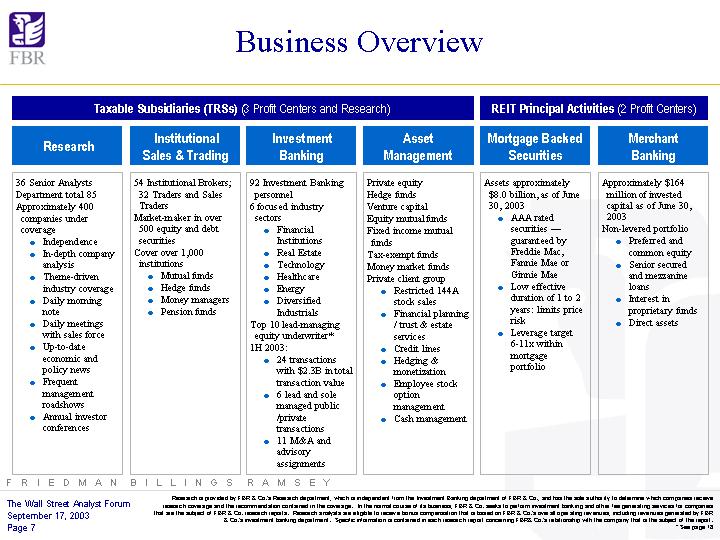
| [LOGO] | Business Overview | |
| ||
| Taxable Subsidiaries (TRSs)(3 Profit Centers and Research) | REIT Principal Activities (2 Profit Centers) | |||||||||
| Research | Institutional Sales & Trading | Investment Banking | Asset Management | Mortgage Backed Securities | Merchant Banking | |||||
36 Senior Analysts Department total 85 Approximately 400 companies under coverage • Independence • In-depth company analysis • Theme-driven industry coverage • Daily morning note • Daily meetings with sales force • Up-to-date economic and policy news • Frequent management roadshows • Annual investor conferences | 54 Institutional Brokers; 32 Traders and Sales Traders Market-maker in over 500 equity and debt securities Cover over 1,000 institutions • Mutual funds • Hedge funds • Money managers • Pension funds | 92 Investment Banking personnel 6 focused industry sectors • Financial Institutions • Real Estate • Technology • Healthcare • Energy • Diversified Industrials Top 10 lead-managing equity underwriter* 1H 2003: • 24 transactions with $2.3B in total transaction value • 6 lead and sole managed public /private transactions • 11 M&A and advisory assignments | Private equity Hedge funds Venture capital Equity mutual funds Fixed income mutual funds Tax-exempt funds Money market funds Private client group • Restricted 144A stock sales • Financial planning / trust & estate services • Credit lines • Hedging & monetization • Employee stock option management | Assets approximately $8.0 billion, as of June 30, 2003 • AAA rated securities — guaranteed by Freddie Mac, Fannie Mae or Ginnie Mae • Low effective duration of 1 to 2 years: limits price risk • Leverage target 6-11x within mortgage portfolio | Approximately $164 million of invested capital as of June 30, 2003 Non-levered portfolio • Preferred and common equity • Senior secured and mezzanine loans • Interest in proprietary funds • Direct assets | |||||
F R I E D M A N B I L L I N G S R A M S E Y
The Wall Street Analyst Forum September 17, 2003 Page 7 | Research is provided by FBR & Co.’s Research department, which is independent from the Investment Banking department of FBR & Co., and has the sole authority to determine which companies receive research coverage and the recommendation contained in the coverage. In the normal course of its business, FBR & Co. seeks to perform investment banking and other fee generating services for companies that are the subject of FBR & Co. research reports. Research analysts are eligible to receive bonus compensation that is based on FBR & Co.’s overall operating revenues, including revenues generated by FBR & Co.’s investment banking department. Specific information is contained in each research report concerning FBR & Co.’s relationship with the company that is the subject of the report. | |
| * See page 18 |
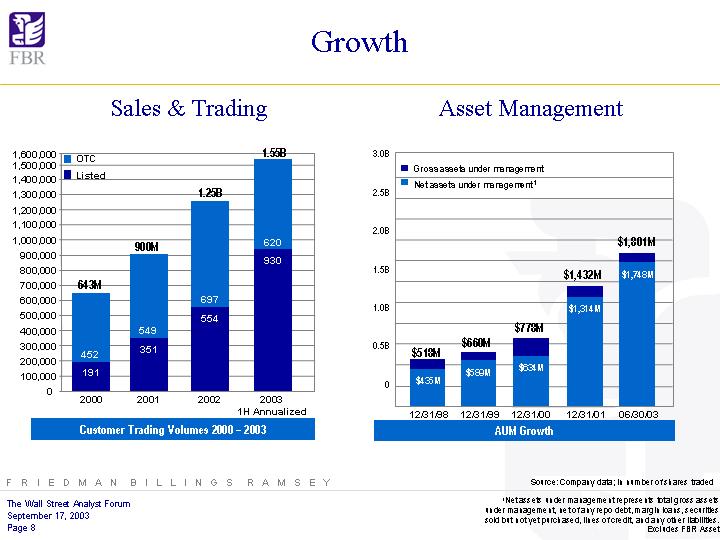
| [LOGO] | Growth |
| Sales & Trading | Asset Management |
[CHARTS]
| F R I E D M A N B I L L I N G S R A M S E Y | Source: Company data; in number of shares traded |
The Wall Street Analyst Forum September 17, 2003 Page 8 | 1Net assets under management represents total gross assets under management, net of any repo debt, margin loans, securities sold but not yet purchased, lines of credit, and any other liabilities. Excludes FBR Asset |
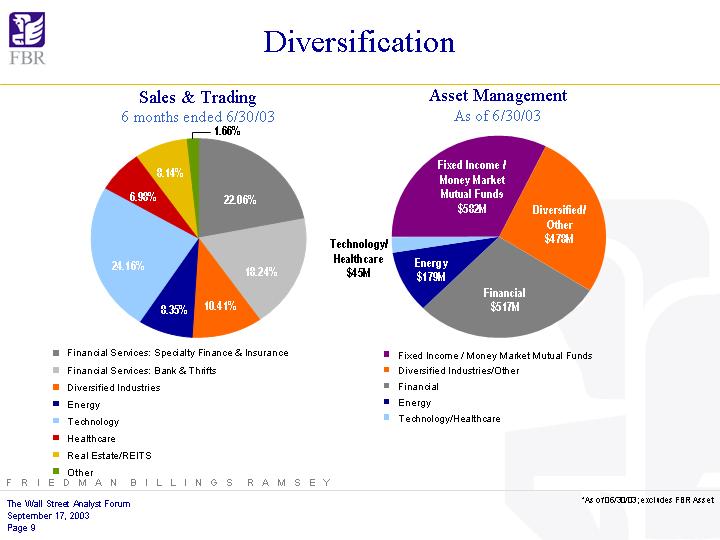
| [LOGO] | Diversification |
Sales & Trading 6 months ended 6/30/03 | Asset Management As of 6/30/03 | |
| [CHARTS] | [CHARTS] |
n Financial Services: Specialty Finance & Insurance | n Fixed Income / Money Market Mutual Funds | |
n Financial Services: Bank & Thrifts | n Diversified Industries/Other | |
n Diversified Industries | n Financial | |
n Energy | n Energy | |
n Technology | n Technology/Healthcare | |
n Healthcare | ||
n Real Estate/REITS | ||
n Other |
F R I E D M A N B I L L I N G S R A M S E Y
The Wall Street Analyst Forum September 17, 2003 Page 9 | *As of 06/30/03; excludes FBR Asset |
| [LOGO] | Rankings |
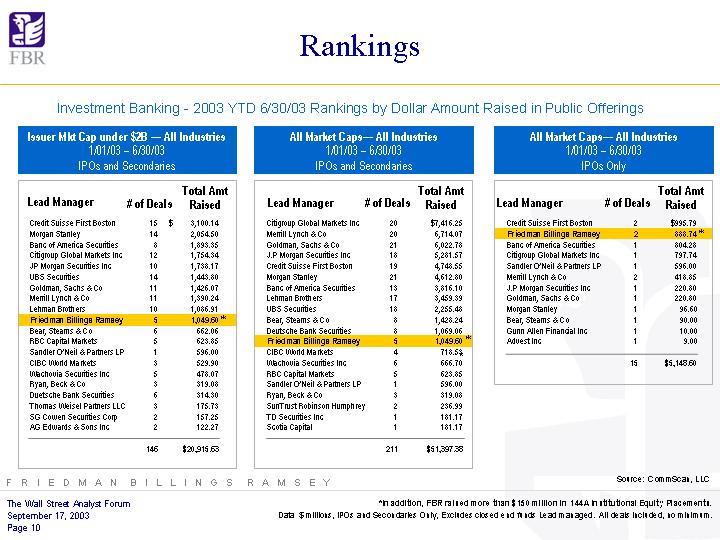
Investment Banking — 2003 YTD 6/30/03 Rankings by Dollar Amount Raised in Public Offerings
Issuer Mkt Cap under $2B — All Industries 1/01/03 – 6/30/03 IPOs and Secondaries | ||||||
| Lead Manager | # of Deals | Total Amt Raised | ||||
Credit Suisse First Boston | 15 | $ | 3,100.14 | |||
Morgan Stanley | 14 | 2,054.50 | ||||
Banc of America Securities | 8 | 1,893.35 | ||||
Citigroup Global Markets Inc | 12 | 1,754.34 | ||||
JP Morgan Securities Inc | 10 | 1,738.17 | ||||
UBS Securities | 14 | 1,443.80 | ||||
Goldman, Sachs & Co | 11 | 1,426.07 | ||||
Merrill Lynch & Co | 11 | 1,390.24 | ||||
Lehman Brothers | 10 | 1,086.91 | ||||
Friedman Billings Ramsey | 5 | 1,049.60 | * | |||
Bear, Stearns & Co | 6 | 662.06 | ||||
RBC Capital Markets | 5 | 623.85 | ||||
Sandler O’Neil & Partners LP | 1 | 596.00 | ||||
CIBC World Markets | 3 | 529.90 | ||||
Wachovia Securities Inc | 5 | 478.07 | ||||
Ryan, Beck & Co | 3 | 319.08 | ||||
Duetsche Bank Securities | 6 | 314.30 | ||||
Thomas Weisel Partners LLC | 3 | 175.73 | ||||
SG Cowen Securities Corp | 2 | 157.25 | ||||
AG Edwards & Sons Inc | 2 | 122.27 | ||||
| 146 | $ | 20,915.63 | ||||
All Market Caps— All Industries 1/01/03 – 6/30/03 IPOs and Secondaries | ||||||
| Lead Manager | # of Deals | Total Amx Raised | ||||
Citigroup Global Markets Inc | 20 | $ | 7,416.25 | |||
Merrill Lynch & Co | 20 | 6,714.07 | ||||
Goldman, Sachs & Co | 21 | 6,022.78 | ||||
J.P Morgan Securities Inc | 18 | 5,281.57 | ||||
Credit Suisse First Boston | 19 | 4,748.55 | ||||
Morgan Stanley | 21 | 4,612.80 | ||||
Banc of America Securities | 13 | 3,816.10 | ||||
Lehman Brothers | 17 | 3,459.39 | ||||
UBS Securities | 18 | 2,255.48 | ||||
Bear, Stearns & Co | 8 | 1,428.24 | ||||
Deutsche Bank Securities | 8 | 1,069.06 | ||||
Friedman Billings Ramsey | 5 | 1,049.60 | * | |||
CIBC World Markets | 4 | 718.53 | * | |||
Wachovia Securities Inc | 6 | 666.70 | ||||
RBC Capital Markets | 5 | 623.85 | ||||
Sandler O’Neil & Partners LP | 1 | 596.00 | ||||
Ryan, Beck & Co | 3 | 319.08 | ||||
SunTrust Robinson Humphrey | 2 | 236.99 | ||||
TD Securities Inc | 1 | 181.17 | ||||
Scotia Capital | 1 | 181.17 | ||||
| 211 | $ | 51,397.38 | ||||
All Market Caps— All Industries 1/01/03 – 6/30/03 IPOs Only | ||||||
| Lead Manager | # of Deals | Total Amt Raised | ||||
Credit Suisse First Boston | 2 | $ | 995.79 | |||
Friedman Billings Ramsey | 2 | 888.74 | * | |||
Banc of America Securities | 1 | 804.28 | ||||
Citigroup Global Markets Inc | 1 | 797.74 | ||||
Sandler O’Neil & Partners LP | 1 | 596.00 | ||||
Merrill Lynch & Co | 2 | 418.85 | ||||
J.P Morgan Securities Inc | 1 | 220.80 | ||||
Goldman, Sachs & Co | 1 | 220.80 | ||||
Morgan Stanley | 1 | 96.60 | ||||
Bear, Stearns & Co | 1 | 90.00 | ||||
Gunn Allen Financial Inc | 1 | 10.00 | ||||
Advest Inc | 1 | 9.00 | ||||
| 15 | $ | 5,148.60 | ||||
F R I E D M A N B I L L I N G S R A M S E Y | Source: CommScan, LLC |
The Wall Street Analyst Forum September 17, 2003 Page 10 | *In addition, FBR raised more than $150 million in 144A Institutional Equity Placements. Data $millions, IPOs and Secondaries Only, Excludes closed end funds Lead managed. All deals included, no minimum |
| [LOGO] | Rankings |
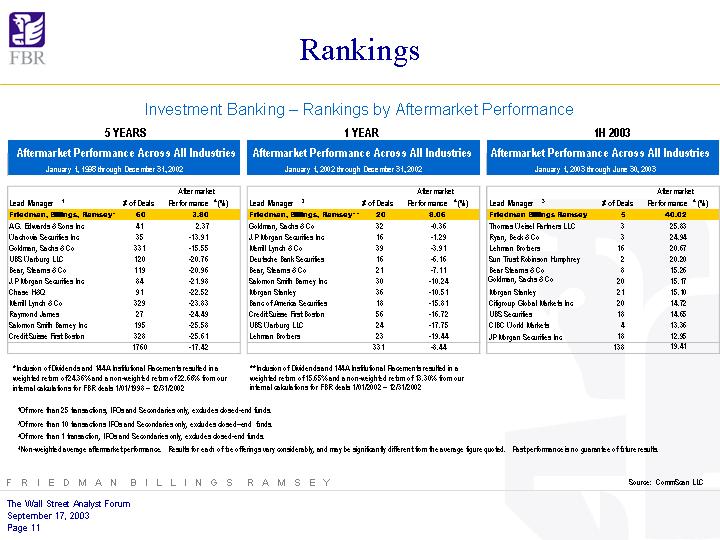
Investment Banking – Rankings by Aftermarket Performance
| 5 YEARS | ||||||
Aftermarket Performance Across All Industries January 1, 1998 through December 31, 2002 | ||||||
| Aftermarket | ||||||
| Lead Manager1 | # of Deals | Performance | 4 (%) | |||
Friedman, Billings, Ramsey* | 60 | 3.80 | ||||
A.G. Edwards & Sons Inc | 41 | 2.37 | ||||
Wachovia Securities Inc | 35 | -13.91 | ||||
Goldman, Sachs & Co | 331 | -15.55 | ||||
UBS Warburg LLC | 120 | -20.76 | ||||
Bear, Stearns & Co | 119 | -20.96 | ||||
J.P Morgan Securities Inc | 84 | -21.98 | ||||
Chase H&Q | 91 | -22.52 | ||||
Merrill Lynch & Co | 329 | -23.83 | ||||
Raymond James | 27 | -24.49 | ||||
Salomon Smith Barney Inc | 195 | -25.58 | ||||
Credit Suisse First Boston | 328 | -25.61 | ||||
| 1760 | -17.42 | |||||
| 1 YEAR | ||||||
Aftermarket Performance Across All Industries January 1, 2002 through December 31, 2002 | ||||||
Aftermarket | ||||||
| Lead Manager2 | # of Deals | Performance | 4 (%) | |||
Friedman, Billings, Ramsey** | 20 | 8.06 | ||||
Goldman, Sachs & Co | 32 | -0.36 | ||||
J.P Morgan Securities Inc | 16 | -1.29 | ||||
Merrill Lynch & Co | 39 | -3.91 | ||||
Deutsche Bank Securities | 16 | -6.16 | ||||
Bear, Stearns & Co | 21 | -7.11 | ||||
Salomon Smith Barney Inc | 30 | -10.24 | ||||
Morgan Stanley | 36 | -10.51 | ||||
Banc of America Securities | 18 | -15.81 | ||||
Credit Suisse First Boston | 56 | -16.72 | ||||
UBS Warburg LLC | 24 | -17.75 | ||||
Lehman Brothers | 23 | -19.44 | ||||
| 331 | -8.44 | |||||
1H 2003 | ||||||
Aftermarket Performance Across All Industries January 1, 2003 through June 30, 2003 | ||||||
| Aftermarket | ||||||
| Lead Manager3 | # of Deals | Performance | 4 (%) | |||
Friedman Billings Ramsey | 5 | 40.02 | ||||
Thomas Weisel Partners LLC | 3 | 25.83 | ||||
Ryan, Beck & Co | 3 | 24.94 | ||||
Lehman Brothers | 16 | 20.67 | ||||
Sun Trust Robinson Humphrey | 2 | 20.20 | ||||
Bear Stearns & Co | 8 | 15.26 | ||||
Goldman, Sachs & Co | 20 | 15.17 | ||||
Morgan Stanley | 21 | 15.10 | ||||
Citigroup Global Markets Inc | 20 | 14.72 | ||||
UBS Securities | 18 | 14.65 | ||||
CIBC World Markets | 4 | 13.36 | ||||
JP Morgan Securities Inc | 18 | 12.95 | ||||
| 138 | 19.41 | |||||
*Inclusion of Dividends and 144A Institutional Placements resulted in a weighted return of 24.36% and a non-weighted return of 22.66% from our internal calculations for FBR deals 1/01/1998 – 12/31/2002
*Inclusion of Dividends and 144A Institutional Placements resulted in a weighted return of 15.65% and a non-weighted return of 13.30% from our internal calculations for FBR deals 1/01/2002 – 12/31/2002
1Of more than 25 transactions, IPOs and Secondaries only, excludes closed–end funds.
2Of more than 10 transactions, IPOs and Secondaries only, excludes closed–end funds.
3Of more than 1 transaction, IPOs and Secondaries only, excludes closed–end funds.
4Non-weighted average aftermarket performance. Results for each of the offerings vary considerably, and may be significantly different from the average figure quoted. Past performance is no guarantee of future results.
F R I E D M A N B I L L I N G S R A M S E Y | Source: CommScan LLC |
The Wall Street Analyst Forum
September 17, 2003
Page 11
| [LOGO] | MBS and Merchant Banking |
The strategy employed by FBR Asset for more than 5 years continues to be used by FBR Group following the merger of the two companies on March 31, 2003
| • | Residential Mortgage-Backed Securities (approximately $8 Billion as of June 30, 2003) |
| n | AAA rated securities – GSE guaranteed by Freddie Mac, Fannie Mae, Ginnie Mae |
| n | Short-duration of 1-2 – limits price risk |
| n | Leverage guideline – 6-11x (debt to equity), |
| n | Allocation of capital: 50%-90% (long-term average target 60%-65%) |
| • | Merchant Banking/Long Term Investment Portfolio (Non-levered portfolio) ($ 236 Million carrying value as of June 30, 2003). |
| n | Senior secured and mezzanine loans |
| n | Preferred and common equity |
| n | Direct assets |
| n | Hedge funds |
| n | Venture funds |
| n | Non-levered portfolio |
| n | Typical hold period 12-18 months |
| n | Allocation of capital: 10%-30% (long-term average target 20%-25%) |
F R I E D M A N B I L L I N G S R A M S E Y
The Wall Street Analyst Forum
September 17, 2003
Page 12
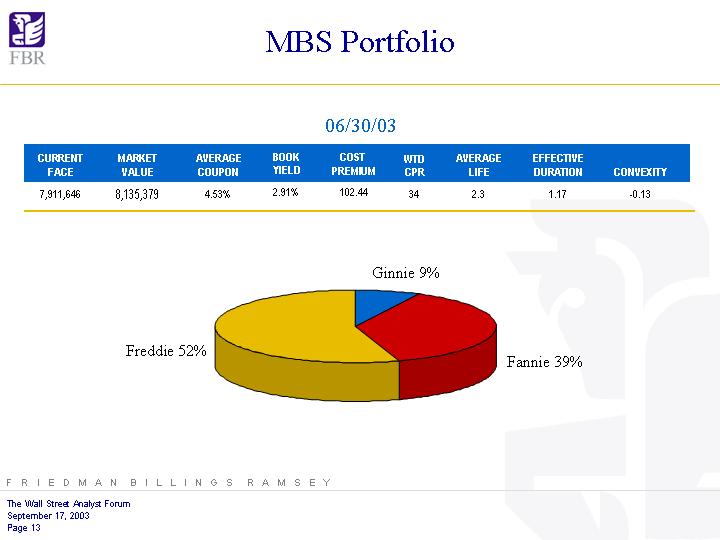
| [LOGO] | MBS Portfolio |
06/30/03
CURRENT FACE | MARKET VALUE | AVERAGE COUPON | BOOK YIELD | COST PREMIUM | WTD CPR | AVERAGE LIFE | EFFECTIVE DURATION | CONVEXITY | ||||||||
7,911,646 | 8,135,379 | 4.53% | 2.91% | 102.44 | 34 | 2.3 | 1.17 | -0.13 |
[CHART]
F R I E D M A N B I L L I N G S R A M S E Y
The Wall Street Analyst Forum
September 17, 2003
Page 13
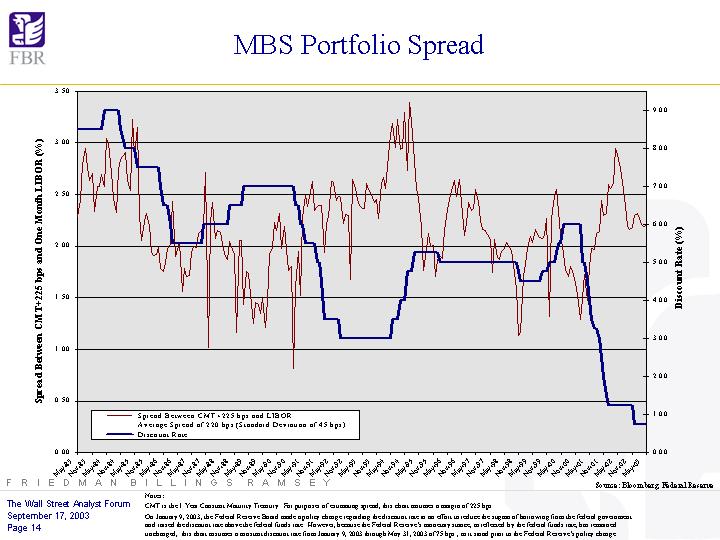
| [LOGO] | MBS Portfolio Spread | |
[CHART]
Notes:
CMT is the 1 Year Constant Maturity Treasury. For purposes of estimating spread, this chart assumes a margin of 225 bps.
On January 9, 2003, the Federal Reserve Board made a policy change regarding the discount rate in an effort to reduce the stigma of borrowing from the federal government and raised the discount rate above the federal funds rate. However, because the Federal Reserve’s monetary stance, as reflected by the federal funds rate, has remained unchanged, this chart assumes a constant discount rate from January 9, 2003 through May 31, 2003 of 75 bps., as it stood prior to the Federal Reserve’s policy change.
F R I E D M A N B I L L I N G S R A M S E Y | Source: Bloomberg, Federal Reserve |
The Wall Street Analyst Forum
September 17, 2003
Page 14
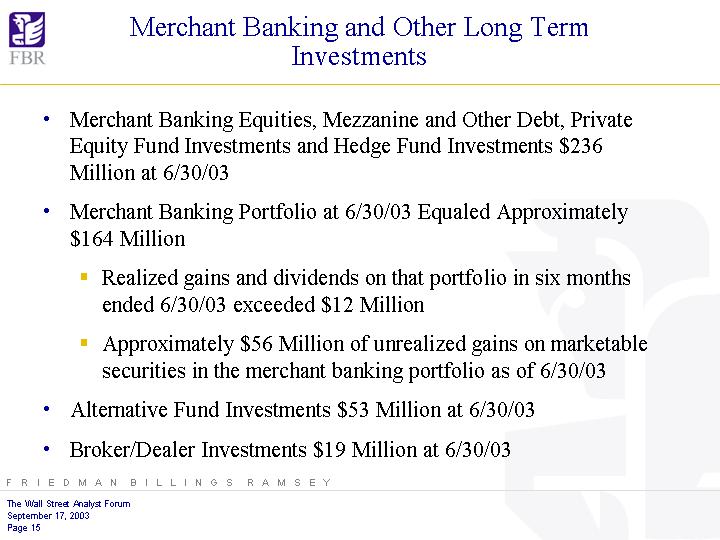
| [LOGO] | Merchant Banking and Other Long Term Investments | |
| • | Merchant Banking Equities, Mezzanine and Other Debt, Private Equity Fund Investments and Hedge Fund Investments $236 Million at 6/30/03 |
| • | Merchant Banking Portfolio at 6/30/03 Equaled Approximately $164 Million |
| n | Realized gains and dividends on that portfolio in six months ended 6/30/03 exceeded $12 Million |
| n | Approximately $56 Million of unrealized gains on marketable securities in the merchant banking portfolio as of 6/30/03 |
| • | Alternative Fund Investments $53 Million at 6/30/03 |
| • | Broker/Dealer Investments $19 Million at 6/30/03 |
F R I E D M A N B I L L I N G S R A M S E Y
The Wall Street Analyst Forum
September 17, 2003
Page 15
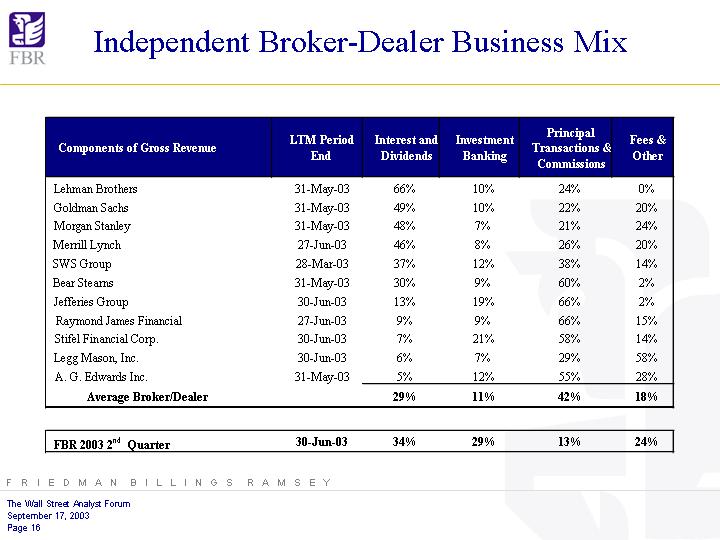
| [LOGO] | Independent Broker-Dealer Business Mix |
Components of Gross Revenue | LTM Period End | Interest and Dividends | Investment Banking | Principal Transactions & Commissions | Fees & Other | |||||
Lehman Brothers | 31-May-03 | 66% | 10% | 24% | 0% | |||||
Goldman Sachs | 31-May-03 | 49% | 10% | 22% | 20% | |||||
Morgan Stanley | 31-May-03 | 48% | 7% | 21% | 24% | |||||
Merrill Lynch | 27-Jun-03 | 46% | 8% | 26% | 20% | |||||
SWS Group | 28-Mar-03 | 37% | 12% | 38% | 14% | |||||
Bear Stearns | 31-May-03 | 30% | 9% | 60% | 2% | |||||
Jefferies Group | 30-Jun-03 | 13% | 19% | 66% | 2% | |||||
Raymond James Financial | 27-Jun-03 | 9% | 9% | 66% | 15% | |||||
Stifel Financial Corp. | 30-Jun-03 | 7% | 21% | 58% | 14% | |||||
Legg Mason, Inc. | 30-Jun-03 | 6% | 7% | 29% | 58% | |||||
A. G. Edwards Inc. | 31-May-03 | 5% | 12% | 55% | 28% | |||||
Average Broker/Dealer | 29% | 11% | 42% | 18% | ||||||
FBR 2003 2nd Quarter | 30-Jun-03 | 34% | 29% | 13% | 24% | |||||
F R I E D M A N B I L L I N G S R A M S E Y
The Wall Street Analyst Forum
September 17, 2003
Page 16
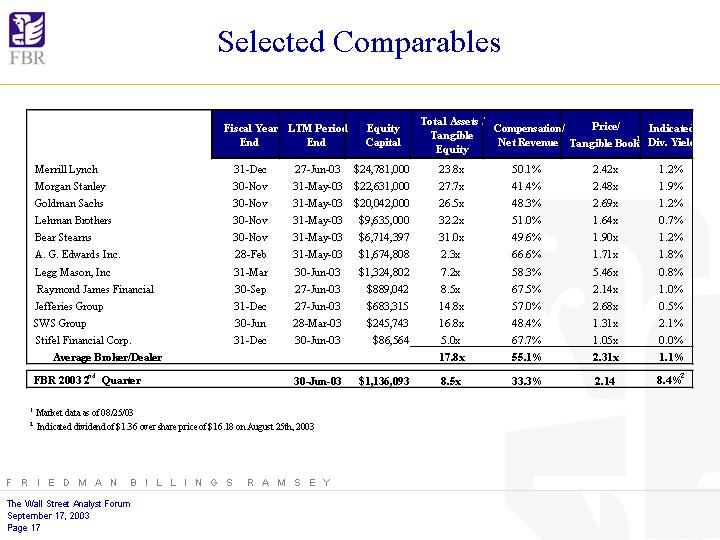
| [LOGO] | Selected Comparables |
Fiscal Year End | LTM Period End | Equity Capital | Total Assets / Tangible | Compensation/ Net Revenue | Price/ Tangible Book 1 | Indicated Div. Yield | |||||||||
Merrill Lynch | 31-Dec | 27-Jun-03 | $ | 24,781,000 | 23.8x | 50.1% | 2.42x | 1.2% | |||||||
Morgan Stanley | 30-Nov | 31-May-03 | $ | 22,631,000 | 27.7x | 41.4% | 2.48x | 1.9% | |||||||
Goldman Sachs | 30-Nov | 31-May-03 | $ | 20,042,000 | 26.5x | 48.3% | 2.69x | 1.2% | |||||||
Lehman Brothers | 30-Nov | 31-May-03 | $ | 9,635,000 | 32.2x | 51.0% | 1.64x | 0.7% | |||||||
Bear Stearns | 30-Nov | 31-May-03 | $ | 6,714,397 | 31.0x | 49.6% | 1.90x | 1.2% | |||||||
A. G. Edwards Inc. | 28-Feb | 31-May-03 | $ | 1,674,808 | 2.3x | 66.6% | 1.71x | 1.8% | |||||||
Legg Mason, Inc | 31-Mar | 30-Jun-03 | $ | 1,324,802 | 7.2x | 58.3% | 5.46x | 0.8% | |||||||
Raymond James Financial | 30-Sep | 27-Jun-03 | $ | 889,042 | 8.5x | 67.5% | 2.14x | 1.0% | |||||||
Jefferies Group | 31-Dec | 27-Jun-03 | $ | 683,315 | 14.8x | 57.0% | 2.68x | 0.5% | |||||||
SWS Group | 30-Jun | 28-Mar-03 | $ | 245,743 | 16.8x | 48.4% | 1.31x | 2.1% | |||||||
Stifel Financial Corp. | 31-Dec | 30-Jun-03 | $ | 86,564 | 5.0x | 67.7% | 1.05x | 0.0% | |||||||
Average Broker/Dealer | 17.8x | 55.1% | 2.31x | 1.1% | |||||||||||
FBR 2003 2nd Quarter | 30-Jun-03 | $ | 1,136,093 | 8.5x | 33.3% | 2.14 | 8.4%2 | ||||||||
| 1 | Market data as of 08/25/03 |
| 2 | Indicated dividend of $1.36 over share price of $16.18 on August 25th, 2003 |
F R I E D M A N B I L L I N G S R A M S E Y
The Wall Street Analyst Forum
September 17, 2003
Page 17
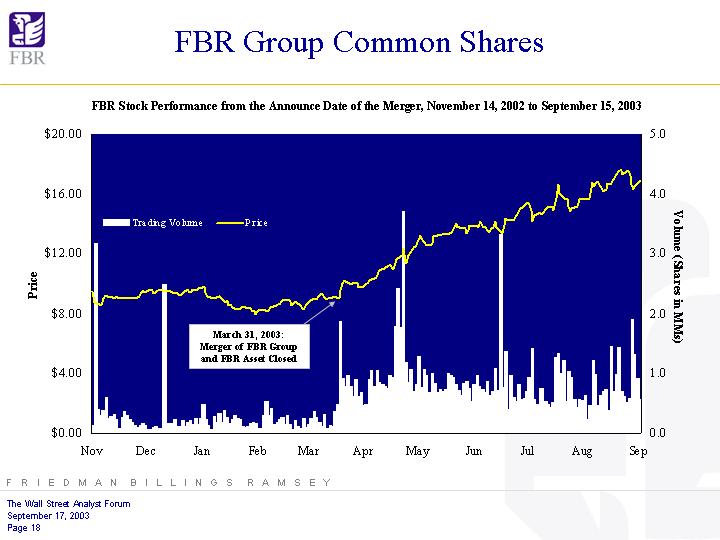
| [LOGO] | FBR Group Common Shares |
FBR Stock Performance from the Announce Date of the Merger, November 14, 2002 to September 15, 2003
[GRAPHIC]
F R I E D M A N B I L L I N G S R A M S E Y
The Wall Street Analyst Forum
September 17, 2003
Page 18
| [LOGO] | Conclusion |
| • | Top 10 National Investment Bank |
| • | Positioned for Continued Growth with Stable Dividend Income |
| • | Number One Aftermarket Underwriting Performance among major underwriters |
| • | Unique Franchise |
| • | Distribution Power |
F R I E D M A N B I L L I N G S R A M S E Y
The Wall Street Analyst Forum
September 17, 2003
Page 19
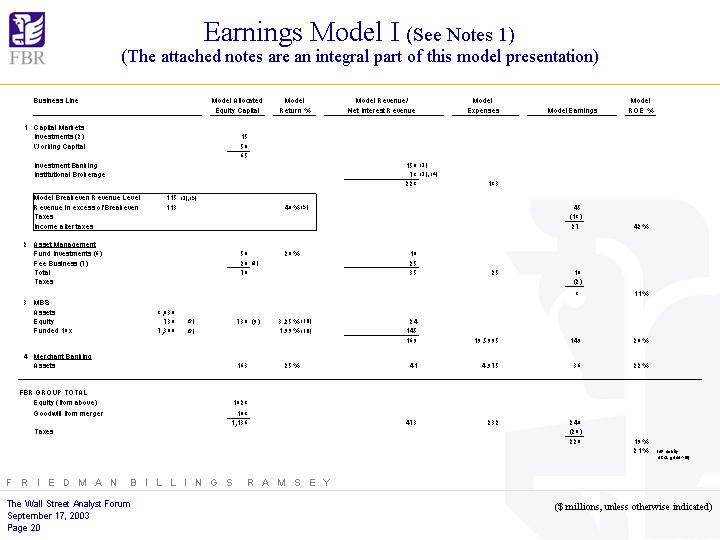
| [LOGO] | Earnings Model I (See Notes 1)
(The attached notes are an integral part of this model presentation) |
Business Line | Model Allocated Equity Capital | Model Return % | Model Revenue/ Net Interest Revenue | Model Expenses | Model Earnings | Model ROE% | ||||||||||||||||||||
1 | Capital Markets | |||||||||||||||||||||||||
| Investments(2) | 15 | |||||||||||||||||||||||||
| Working Capital | 50 | |||||||||||||||||||||||||
| 65 | ||||||||||||||||||||||||||
| Investment Banking | 150 | (3) | ||||||||||||||||||||||||
| Institutional Brokerage | 78 | (3),(4) | ||||||||||||||||||||||||
| 228 | 183 | |||||||||||||||||||||||||
| Model Breakeven Revenue Level | 115 | (2),(5) | ||||||||||||||||||||||||
| Revenue in excess of Breakeven | 113 | 40 | %(5) | 45 | ||||||||||||||||||||||
| Taxes | (18 | ) | ||||||||||||||||||||||||
| Income after taxes | 27 | 42 | % | |||||||||||||||||||||||
2 | Asset Management | |||||||||||||||||||||||||
| Fund Investments(6) | 50 | 20 | % | 10 | ||||||||||||||||||||||
| Fee Business(7) | 20 | (8) | 25 | |||||||||||||||||||||||
| Total | 70 | 35 | 25 | 10 | ||||||||||||||||||||||
| Taxes | (2 | ) | ||||||||||||||||||||||||
| 8 | 11 | % | ||||||||||||||||||||||||
3 | MBS | |||||||||||||||||||||||||
| Assets | 8,030 | |||||||||||||||||||||||||
| Equity | 730 | (9) | 730 | (9) | 3.25 | %(10) | 24 | |||||||||||||||||||
| Funded 10x | 7,300 | (9) | 1.99 | %(10) | 145 | |||||||||||||||||||||
| 169 | 19.5995 | 149 | 20 | % | ||||||||||||||||||||||
4 | Merchant Banking | |||||||||||||||||||||||||
| Assets | 163 | 25 | % | 41 | 4.975 | 36 | 22 | % | ||||||||||||||||||
FBR GROUP TOTAL | ||||||||||||||||||||||||||
| Equity (from above) | 1028 | |||||||||||||||||||||||||
| Goodwill from merger | 108 | |||||||||||||||||||||||||
| 1,136 | 473 | 232 | 240 | |||||||||||||||||||||||
| Taxes | (20 | ) | ||||||||||||||||||||||||
| 220 | 19 | % | ||||||||||||||||||||||||
| 21 | % | (on equity excl. goodwill |
) | |||||||||||||||||||||||
F R I E D M A N B I L L I N G S R A M S E Y
The Wall Street Analyst Forum September 17, 2003 Page 20 | ($ millions, unless otherwise indicated) |
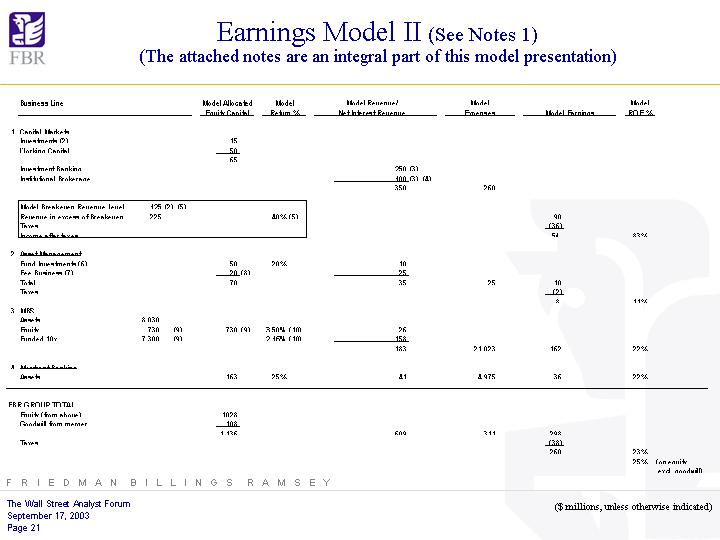
| [LOGO] | Earnings Model II (See Notes 1) (The attached notes are an integral part of this model presentation) |
Business Line | Model Allocated Equity Capital | Model Return | Model Revenue/ Net Interest Revenue | Model Expenses | Model Earnings | Model ROE% | |||||||||||||||||||
1 | Capital Markets | ||||||||||||||||||||||||
Investments (2) | 15 | ||||||||||||||||||||||||
Working Capital | 50 | ||||||||||||||||||||||||
| 65 | |||||||||||||||||||||||||
Investment Banking | 250 | (3) | |||||||||||||||||||||||
Institutional Brokerage | 100 | (3),(4) | |||||||||||||||||||||||
| 350 | 260 | ||||||||||||||||||||||||
Model Breakeven Revenue Level | 125 | (2), (5) | |||||||||||||||||||||||
Revenue in excess of Breakeven | 225 |
| 40 | % (5) | 90 | ||||||||||||||||||||
Taxes | (36 | ) | |||||||||||||||||||||||
Income after taxes | 54 | 83 | % | ||||||||||||||||||||||
2 | Asset Management | ||||||||||||||||||||||||
Fund Investments (6) | 50 | 20 | % | 10 | |||||||||||||||||||||
Fee Business (7) | 20 | (8) | 25 | ||||||||||||||||||||||
Total | 70 | 35 | 25 | 10 | |||||||||||||||||||||
Taxes | (2 | ) | |||||||||||||||||||||||
| 8 | 11 | % | |||||||||||||||||||||||
3 | MBS | ||||||||||||||||||||||||
Assets | 8,030 |
| |||||||||||||||||||||||
Equity | 730 | (9) | 730 | (9) | 3.50 | % (10) | 26 | ||||||||||||||||||
| Funded 10x | 7,300 | (9) | 2.16 | % (10) | 158 | ||||||||||||||||||||
| 183 | 21.023 | 162 | 22 | % | |||||||||||||||||||||
4 | Merchant Banking | ||||||||||||||||||||||||
Assets | 163 | 25 | % | 41 | 4.975 | 36 | 22 | % | |||||||||||||||||
FBR GROUP | |||||||||||||||||||||||||
Equity (from above) | 1028 | ||||||||||||||||||||||||
Goodwill from merger | 108 | ||||||||||||||||||||||||
| 1,136 | 609 | 311 | 298 | ||||||||||||||||||||||
Taxes | (38 | ) | |||||||||||||||||||||||
| 260 | 23 | % | |||||||||||||||||||||||
| 25 | % | (on equity excl. goodwill) | |||||||||||||||||||||||
F R I E D M A N B I L L I N G S R A M S E Y
The Wall Street Analyst Forum September 17, 2003 Page 21 | ($ millions, unless otherwise indicated) |
| [LOGO] | Notes 1 |
| (1) | The foregoing financial models of Friedman, Billings, Ramsey Group, Inc. were prepared by management of the company and will be provided to financial analysts as of September 16, 2003. This model includes a hypothetical allocation of equity. The actual allocation will vary from time to time and the company is not undertaking any obligation to update this model. |
The financial model is not a measure of the company’s historical or future financial performance, financial position or cash flows. The model is not a projection of or a prediction of the company’s future performance. The model contains various assumptions that management has made as of this date with regard to the allocation of capital and the level of returns, revenues, and expenses among the company’s businesses. The assumptions in the model are not necessarily reflective of historical results, or a projection or prediction of the company’s actual performance or decisions with regard to allocation of capital, expenses, returns on equity and revenue levels. Actual performance or decisions by the company may vary from the assumptions contained in the model.
The company’s actual financial performance will be subject to a number of factors, risks and uncertainties that might cause actual results to differ materially from stated expectations or current circumstances. These factors include, but are not limited to, the effect of demand for public offerings, activity in the secondary securities markets, interest rates, costs of borrowing, interest spreads, mortgage pre-payment speeds, risks associated with merchant banking investments, the realization of gains and losses on principal investments, available technology, competition for business and personnel, and general economic, political and market conditions. These and other risks are described in the company’s Annual Report on Form 10-K and quarterly reports on Form 10-Q that are available from the company and from the SEC.
| (2) | Return on investments, interest, dividends and trading gains in the capital markets business line are incorporated in breakeven analysis as an offset to fixed expenses. |
| (3) | Excludes return on investment, interest, dividends and trading gains. See note 2. |
| (4) | Institutional brokerage revenue in the model excludes brokerage revenues attributable to private client, online and asset management business although those revenues are included in the “institutional brokerage” line of the company’s income statement. |
| (5) | Breakeven points and marginal contribution will vary with revenue mix and times of expenses. Model only; actual breakeven point and contribution in any period will vary, and breakeven point will increase with new hiring or other expense increases. |
| (6) | Some fund investments are held in taxable REIT subsidiaries and some in the REIT parent. |
| (7) | Fee businesses are operated in taxable REIT subsidiaries and fees are subject to full taxation. |
| (8) | Equity in the asset management business line includes mutual fund management contracts purchased in the 2001 Rushmore/MMA acquisition and subject to amortization over 15 years. |
| (9) | Indicative equity in MBS portfolio at 10 x leverage. Not intended to reflect actual equity or leverage. Leverage guidelines are generally 6-11, however, levels may vary above or below these targets depending on a variety of factors. |
| (10) | The effective yield and net interest spread will vary from quarter to quarter and may be higher or lower than the spreads indicated in the models. |
F R I E D M A N B I L L I N G S R A M S E Y
The Wall Street Analyst Forum
September 17, 2003
Page 22