FRIEDMAN BILLINGS RAMSEY®
CAPITAL FOR YOUR CONQUEST
FRIEDMAN, BILLINGS, RAMSEY GROUP, INC.
2004 November
FRIEDMAN BILLINGS RAMSEY®
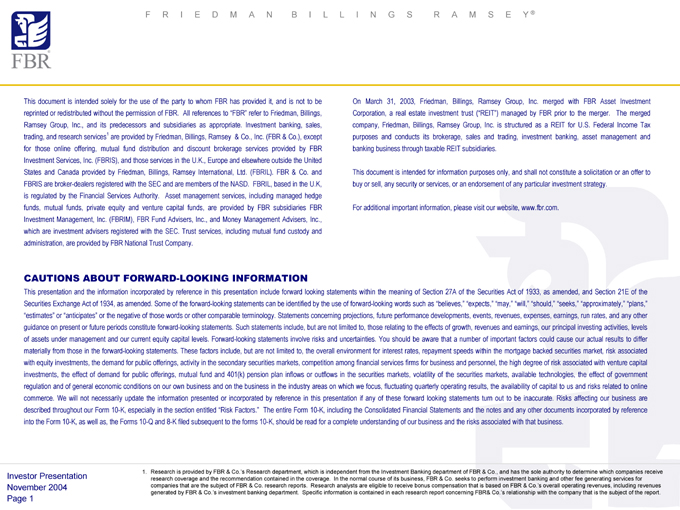
This document is intended solely for the use of the party to whom FBR has provided it, and is not to be reprinted or redistributed without the permission of FBR. All references to “FBR” refer to Friedman, Billings, Ramsey Group, Inc., and its predecessors and subsidiaries as appropriate. Investment banking, sales, trading, and research services1 are provided by Friedman, Billings, Ramsey & Co., Inc. (FBR & Co.), except for those online offering, mutual fund distribution and discount brokerage services provided by FBR Investment Services, Inc. (FBRIS), and those services in the U.K., Europe and elsewhere outside the United States and Canada provided by Friedman, Billings, Ramsey International, Ltd. (FBRIL). FBR & Co. and FBRIS are broker-dealers registered with the SEC and are members of the NASD. FBRIL, based in the U.K, is regulated by the Financial Services Authority. Asset management services, including managed hedge funds, mutual funds, private equity and venture capital funds, are provided by FBR subsidiaries FBR Investment Management, Inc. (FBRIM), FBR Fund Advisers, Inc., and Money Management Advisers, Inc., which are investment advisers registered with the SEC. Trust services, including mutual fund custody and administration, are provided by FBR National Trust Company.
On March 31, 2003, Friedman, Billings, Ramsey Group, Inc. merged with FBR Asset Investment Corporation, a real estate investment trust (“REIT”) managed by FBR prior to the merger.The merged company, Friedman, Billings, Ramsey Group, Inc. is structured as a REIT for U.S. Federal Income Tax purposes and conducts its brokerage, sales and trading, investment banking, asset management and banking business through taxable REIT subsidiaries.
This document is intended for information purposes only, and shall not constitute a solicitation or an offer to buy or sell, any security or services, or an endorsement of any particular investment strategy.
For additional important information, please visit our website, www.fbr.com.
CAUTIONS ABOUT FORWARD-LOOKING INFORMATION
This presentation and the information incorporated by reference in this presentation include forward looking statements within the meaning of Section 27A of the Securities Act of 1933, as amended, and Section 21E of the Securities Exchange Act of 1934, as amended. Some of the forward-looking statements can be identified by the use of forward-looking words such as “believes,” “expects,” “may,” “will,” “should,” “seeks,” “approximately,” “plans,” “estimates” or “anticipates” or the negative of those words or other comparable terminology. Statements concerning projections, future performance developments, events, revenues, expenses, earnings, run rates, and any other guidance on present or future periods constitute forward-looking statements. Such statements include, but are not limited to, those relating to the effects of growth, revenues and earnings, our principal investing activities, levels of assets under management and our current equity capital levels. Forward-looking statements involve risks and uncertainties. You should be aware that a number of important factors could cause our actual results to differ materially from those in the forward-looking statements. These factors include, but are not limited to, the overall environment for interest rates, repayment speeds within the mortgage backed securities market, risk associated with equity investments, the demand for public offerings, activity in the secondary securities markets, competition among financial services firms for business and personnel, the high degree of risk associated with venture capital investments, the effect of demand for public offerings, mutual fund and 401(k) pension plan inflows or outflows in the securities markets, volatility of the securities markets, available technologies, the effect of government regulation and of general economic conditions on our own business and on the business in the industry areas on which we focus, fluctuating quarterly operating results, the availability of capital to us and risks related to online commerce. We will not necessarily update the information presented or incorporated by reference in this presentation if any of these forward looking statements turn out to be inaccurate. Risks affecting our business are described throughout our Form 10-K, especially in the section entitled “Risk Factors.” The entire Form 10-K, including the Consolidated Financial Statements and the notes and any other documents incorporated by reference into the Form 10-K, as well as, the Forms 10-Q and 8-K filed subsequent to the forms 10-K, should be read for a complete understanding of our business and the risks associated with that business.
1. Research is provided by FBR & Co.’s Research department, which is independent from the Investment Banking department of FBR & Co., and has the sole authority to determine which companies receive research coverage and the recommendation contained in the coverage. In the normal course of its business, FBR & Co. seeks to perform investment banking and other fee generating services for companies that are the subject of FBR & Co. research reports. Research analysts are eligible to receive bonus compensation that is based on FBR & Co.’s overall operating revenues, including revenues generated by FBR & Co.’s investment banking department. Specific information is contained in each research report concerning FBR& Co.’s relationship with the company that is the subject of the report.
Investor Presentation
November 2004
Page 1
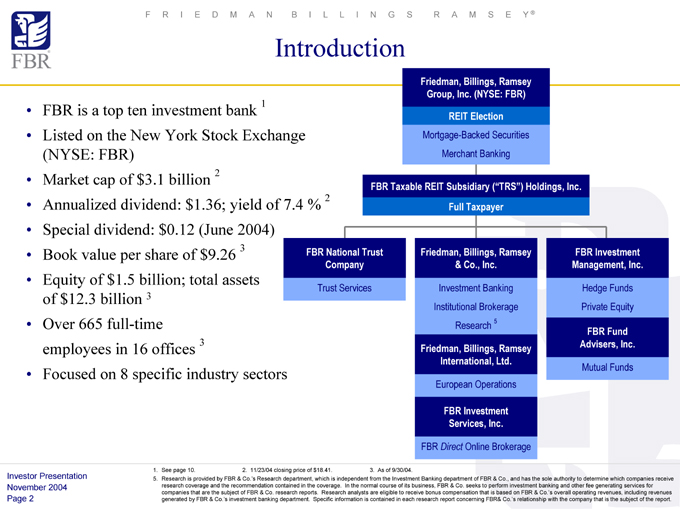
FBR is a top ten investment bank 1 Listed on the New York Stock Exchange (NYSE: FBR) Market cap of $3.1 billion 2 Annualized dividend: $1.36; yield of 7.4 % 2 Special dividend: $0.12 (June 2004)
FRIEDMAN BILLINGS RAMSEY®
Introduction
Book value per share of $9.26 3 Equity of $1.5 billion; total assets of $12.3 billion 3 Over 665 full-time employees in 16 offices 3 Focused on 8 specific industry sectors
Friedman, Billings, Ramsey Group, Inc. (NYSE: FBR)
REIT Election
Mortgage-Backed Securities Merchant Banking
FBR Taxable REIT Subsidiary (“TRS”) Holdings, Inc.
Full Taxpayer
FBR National Trust Company
Trust Services
Friedman, Billings, Ramsey & Co., Inc.
Investment Banking Institutional Brokerage Research 5
Friedman, Billings, Ramsey International, Ltd.
European Operations
FBR Investment Services, Inc.
FBR Direct Online Brokerage
FBR Investment Management, Inc.
Hedge Funds Private Equity
FBR Fund Advisers, Inc.
Mutual Funds
1. See page 10.
2. 11/23/04 closing price of $18.41.
3. As of 9/30/04.
5. Research is provided by FBR & Co.’s Research department, which is independent from the Investment Banking department of FBR & Co., and has the sole authority to determine which companies receive research coverage and the recommendation contained in the coverage. In the normal course of its business, FBR & Co. seeks to perform investment banking and other fee generating services for companies that are the subject of FBR & Co. research reports. Research analysts are eligible to receive bonus compensation that is based on FBR & Co.’s overall operating revenues, including revenues generated by FBR & Co.’s investment banking department. Specific information is contained in each research report concerning FBR& Co.’s relationship with the company that is the subject of the report.
Investor Presentation November 2004 Page 2
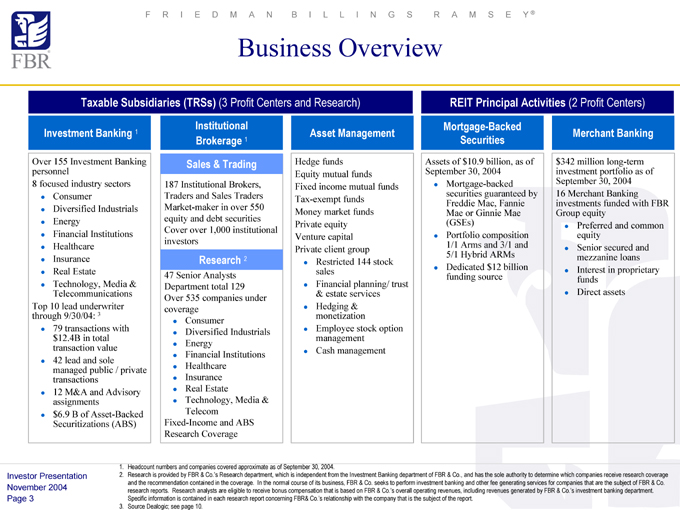
187 Institutional Brokers, Traders and Sales Traders Market-maker in over 550 equity and debt securities Cover over 1,000 institutional investors
Research 2
47 Senior Analysts Department total 129 Over 535 companies under coverage
FRIEDMAN BILLINGS RAMSEY®
Business Overview
Taxable Subsidiaries (TRSs) (3 Profit Centers and Research)
Investment Banking 1
Over 155 Investment Banking personnel 8 focused industry sectors
Consumer
Diversified Industrials Energy Financial Institutions Healthcare Insurance Real Estate Technology, Media & Telecommunications
Top 10 lead underwriter through 9/30/04: 3
79 transactions with $12.4B in total transaction value 42 lead and sole managed public / private transactions 12 M&A and Advisory assignments $6.9 B of Asset-Backed Securitizations (ABS)
Institutional Brokerage 1 Sales & Trading
Consumer
Diversified Industrials Energy Financial Institutions Healthcare Insurance Real Estate Technology, Media & Telecom
Fixed-Income and ABS Research Coverage
Asset Management
Hedge funds Equity mutual funds Fixed income mutual funds Tax-exempt funds Money market funds Private equity Venture capital Private client group
Restricted 144 stock sales Financial planning/ trust & estate services Hedging & monetization Employee stock option management Cash management
REIT Principal Activities (2 Profit Centers)
Mortgage-Backed Securities
Assets of $10.9 billion, as of September 30, 2004
Mortgage-backed securities guaranteed by Freddie Mac, Fannie Mae or Ginnie Mae (GSEs) Portfolio composition 1/1 Arms and 3/1 and 5/1 Hybrid ARMs Dedicated $12 billion funding source
Merchant Banking $342 million long-term investment portfolio as of September 30, 2004 16 Merchant Banking investments funded with FBR Group equity
Preferred and common equity Senior secured and mezzanine loans Interest in proprietary funds Direct assets
1. Headcount numbers and companies covered approximate as of September 30, 2004.
2. Research is provided by FBR & Co.’s Research department, which is independent from the Investment Banking department of FBR & Co., and has the sole authority to determine which companies receive research coverage and the recommendation contained in the coverage. In the normal course of its business, FBR & Co. seeks to perform investment banking and other fee generating services for companies that are the subject of FBR & Co. research reports. Research analysts are eligible to receive bonus compensation that is based on FBR & Co.’s overall operating revenues, including revenues generated by FBR & Co.’s investment banking department. Specific information is contained in each research report concerning FBR& Co.’s relationship with the company that is the subject of the report.
3. Source Dealogic; see page 10.
Investor Presentation November 2004 Page 3
Greater than 35% compound annual revenue growth rate since 1992 Record first nine months of 2004
FRIEDMAN BILLINGS RAMSEY®
Highlights
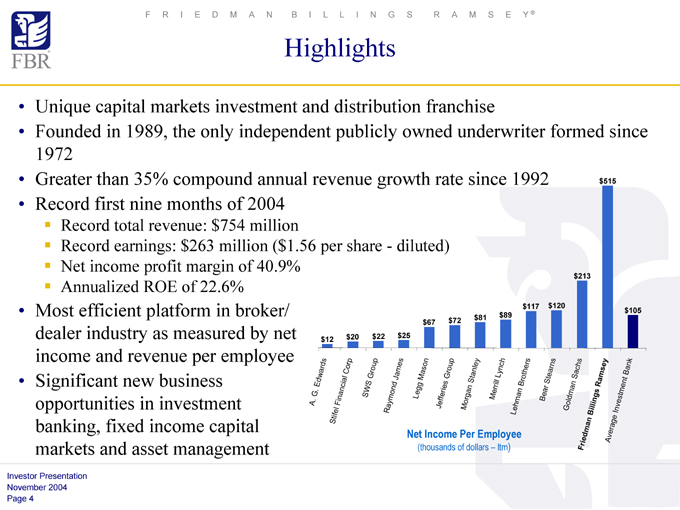
Unique capital markets investment and distribution franchise
Founded in 1989, the only independent publicly owned underwriter formed since 1972
Record total revenue: $754 million
Record earnings: $263 million ($1.56 per share—diluted) Net income profit margin of 40.9% Annualized ROE of 22.6%
Most efficient platform in broker/ dealer industry as measured by net income and revenue per employee Significant new business opportunities in investment banking, fixed income capital markets and asset management
$20 $22 $25 $12
$72 $81 $67 $213
$117 $120 $89 $515
$105
A. G. Edwards
Stifel Financial Corp
SWS Group
Raymond James
Legg Mason
Jefferies Group
Morgan Stanley
(thousands of dollars—Itm)
Merrill Lynch
Lehman Brothers
Net Income Per Employee
Bear Stearns
Goldman Sachs
Frisedman Billings Ramsey
Average Investment Bank
Investor Presentation November 2004 Page 4
#1 lead managing underwriter in aftermarket performance 1
#1 lead managing underwriter of companies valued $1 billion and under 2 #3 lead managing underwriter in 2003 for IPOs across all industries 3 Top ten equity underwriter — $7.2 billion of lead or sole-managed new capital raised this year 2 Market leader in innovative transaction structures (144A, private block secondaries, public corporate formations)
FRIEDMAN BILLINGS RAMSEY®
Investment and Distribution Franchise
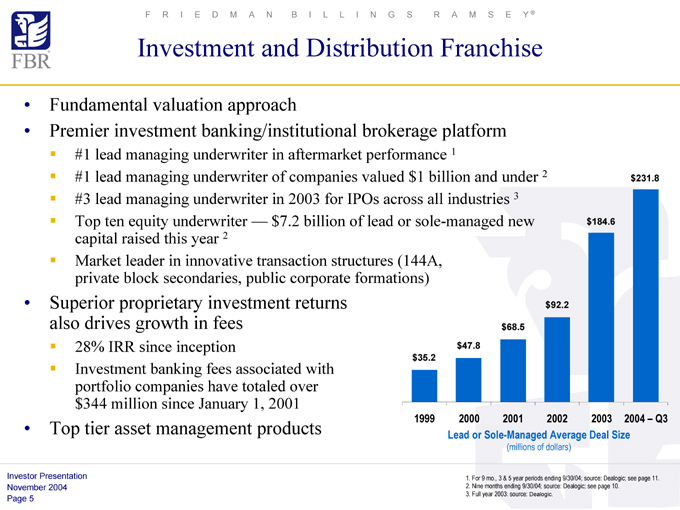
Fundamental valuation approach
Premier investment banking/institutional brokerage platform
Superior proprietary investment returns also drives growth in fees
28% IRR since inception
Investment banking fees associated with portfolio companies have totaled over $344 million since January 1, 2001
Top tier asset management products $92.2
$68.5 $47.8 $35.2 $184.6 $231.8
19992000200120022003 2004 – Q3 Lead or Sole-Managed Average Deal Size
(millions of dollars)
1. For 9 mo., 3 & 5 year periods ending 9/30/04; source: Dealogic; see page 11. 2. Nine months ending 9/30/04; source: Dealogic; see page 10.
3. Full year 2003: source: Dealogic.
Investor Presentation November 2004 Page 5
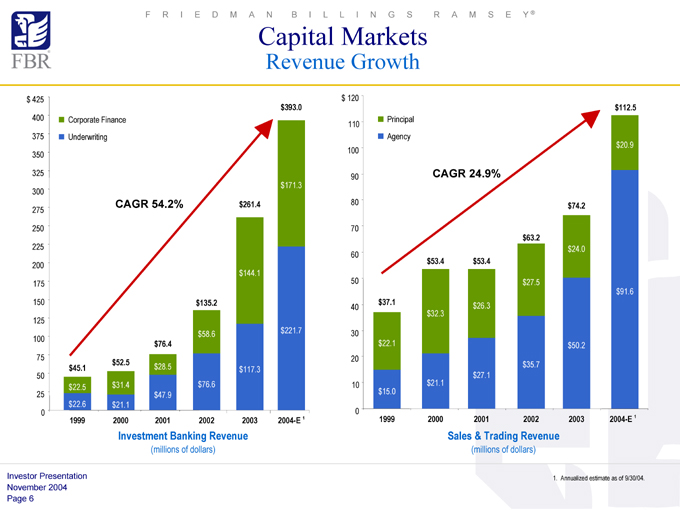
$393.0
Corporate Finance Underwriting
$171.3
CAGR 54.2%$261.4
$144.1
$135.2
$58.6$221.7 $76.4
$52.5 $45.1$28.5$117.3 $22.5$31.4$76.6 $47.9 $22.6$21.1
199920002001200220032004-E 1
FRIEDMAN BILLINGS RAMSEY®
Capital Markets
Revenue Growth $ 425 400 375 350 325 300 275 250 225 200 175 150 125 100 75 50 25 0 $ 120 $112.5
Principal 110 Agency $20.9 100
90CAGR 24.9%
80$74.2
70 $63.2 $24.0 60 $53.4$53.4
50$27.5 $91.6 $37.1$26.3 40 $32.3
30 $22.1$50.2 20 $35.7 $27.1
10$21.1 $15.0
0
199920002001200220032004-E 1
Investment Banking Revenue
(millions of dollars)
Sales & Trading Revenue
(millions of dollars)
Investor Presentation1. Annualized estimate as of 9/30/04.
November 2004 Page 6
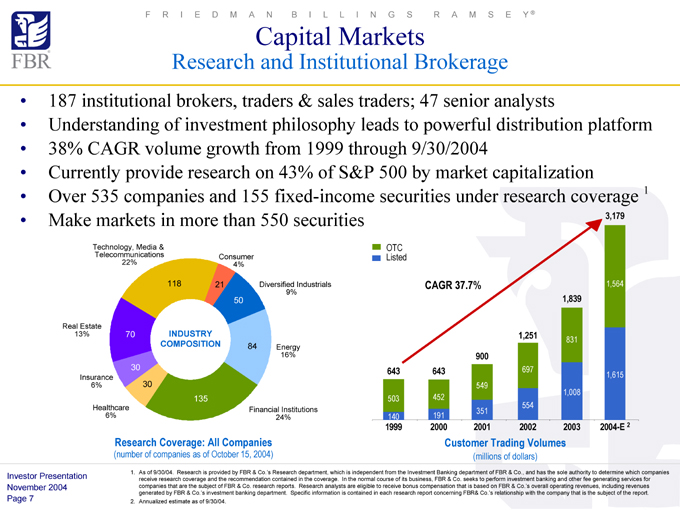
187 institutional brokers, traders & sales traders; 47 senior analysts
Understanding of investment philosophy leads to powerful distribution platform 38% CAGR volume growth from 1999 through 9/30/2004 Currently provide research on 43% of S&P 500 by market capitalization Over 535 companies and 155 fixed-income securities under research coverage 1 Make markets in more than 550 securities3,179
FRIEDMAN BILLINGS RAMSEY®
Capital Markets
Research and Institutional Brokerage
Technology, Media & Telecommunications 22%
Real Estate 13%
Insurance 6%
Healthcare 6%
70
30 30
118
INDUSTRY
COMPOSITION84
135
Diversified Industrials 9%
Energy 16%
Financial Institutions 24%
OTC Listed
CAGR 37.7%
CAGR 37.7%1,564
1,839
1,251831 900 643643697
1,615 549 1,008 503452 554 351 140191
199920002001200220032004-E 2
Customer Trading Volumes
(millions of dollars)
Research Coverage: All Companies
(number of companies as of October 15, 2004)
Investor Presentation1. As of 9/30/04. Research is provided by FBR & Co.’s Research department, which is independent from the Investment Banking department of FBR & Co., and has the sole authority to determine which companies receive research coverage and the recommendation contained in the coverage. In the normal course of its business, FBR & Co. seeks to perform investment banking and other fee generating services for November 2004 companies that are the subject of FBR & Co. research reports. Research analysts are eligible to receive bonus compensation that is based on FBR & Co.’s overall operating revenues, including revenues generated by FBR & Co.’s investment banking department. Specific information is contained in each research report concerning FBR& Co.’s relationship with the company that is the subject of the report.
Page 72. Annualized estimate as of 9/30/04.
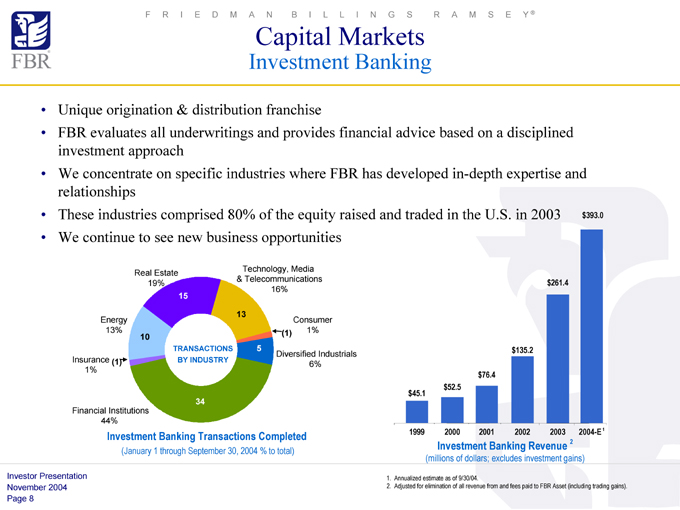
Unique origination & distribution franchise
FBR evaluates all underwritings and provides financial advice based on a disciplined investment approach We concentrate on specific industries where FBR has developed in-depth expertise and relationships These industries comprised 80% of the equity raised and traded in the U.S. in 2003 $393.0 We continue to see new business opportunities
FRIEDMAN BILLINGS RAMSEY®
Capital Markets
Investment Banking
Technology, Media Real Estate
& Telecommunications$261.4 19% 16%
15
13
EnergyConsumer 13%(1) 1%
10
TRANSACTIONS5$135.2
Diversified Industrials Insurance (1)BY INDUSTRY
6% 1% $76.4 $52.5 $45.1
34
Financial Institutions 44%
Investment Banking Transactions Completed1999 2000 2001 2002 2003 2004-E 1
(January 1 through September 30, 2004 % to total)Investment Banking Revenue 2 (millions of dollars; excludes investment gains)
Investor Presentation1. Annualized estimate as of 9/30/04.
November 20042. Adjusted for elimination of all revenue from and fees paid to FBR Asset (including trading gains).
Page 8
Top 10 book running equity underwriter by dollar volume 1 #3 IPO underwriter for 2003 1 #1 in aftermarket performance of IPOs and secondaries 2
#1 lead managing underwriter of issuers valued $1 billion and under 3
FRIEDMAN BILLINGS RAMSEY®
Capital Markets
Investment Banking
We identify and structure innovative opportunities for our issuer and investor clients
144A equity placements Private block trades Public/private recapitalizations M&A
Other more traditional capital events
Premier track record
Investor Presentation1. Full year 2003 and nine months ending 9/30/04; source: Dealogic; see page 10.
2.For 9 mo., 2 & 5 year periods ending 9/30/04; source: Dealogic; see page 11.
November 2004
3.Nine months ending 9/30/04; source: Dealogic; see page 10.
Page 9

Book-Running Total Amt
Manager # of Deals Raised
Morgan Stanley 60 $ 15,449.8
Goldman, Sachs & Co 52 12,832.0
JP Morgan Securities Inc 55 8,888.3
Citigroup Global Markets Inc 43 7,960.3
Credit Suisse First Boston 46 7,329.0
Merrill Lynch & Co 49 6,796.1
Lehman Brothers 44 5,004.5
UBS Securities Inc 46 4,968.3
Friedman Billings Ramsey 26 3,220.9
Banc of America Securities 29 2,636.9
Bear, Stearns & Co 18 2,386.8
Deutsche Bank Securities 26 2,345.8
Wachovia Capital Markets LLC 18 1,635.4
Ryan, Beck & Co 3 732.5
SG Cowen Securities Corp 21 723.1
Raymond James 6 713.2
CIBC World Markets 12 689.8
AG Edwards & Sons Inc 13 565.3
RBC Capital Markets 9 528.1
Piper Jaffray & Co 7 392.2
FRIEDMAN BILLINGS RAMSEY®
Investment Banking Rankings
First Nine Months 2004 Underwriting
Issuer Mkt Cap $1B & under — All Industries All Market Caps — All Industries All Market Caps — All Industries
1/1/2004 – 9/30/2004 All Common Stock1/1/2004 – 9/30/20041/1/2004 – 9/30/2004 (IPO, Secondary, Private)IPOs and SecondariesIPOs Only
Book-Running Total Amt
Manager # of Deals Raised
Friedman Billings Ramsey 29 $ 4,691.2
Goldman, Sachs & Co 25 3,905.4
JP Morgan Securities Inc 35 3,729.9
Morgan Stanley 23 3,395.1
UBS Securities Inc 35 2,570.1
Citigroup Global Markets Inc 15 2,423.5
Lehman Brothers 30 2,298.1
Merrill Lynch & Co 22 2,022.3
Credit Suisse First Boston 24 1,914.3
Deutsche Bank Securities 18 1,173.1
Banc of America Securities 20 980.5
Bear, Stearns & Co 13 957.3
SG Cowen Securities Corp 23 768.3
Ryan, Beck & Co 5 749.6
Wachovia Capital Markets LLC 11 649.7
Raymond James 6 640.3
CIBC World Markets 12 544.4
Piper Jaffray & Co 8 413.8
Needham & Co Inc 9 373.6
Thomas Weisel Partners LLC 8 306.2
Book-Running Total Amt
Manager # of Deals Raised
Morgan Stanley 16 $ 6,223.3
Goldman, Sachs & Co 17 3,968.5
Credit Suisse First Boston 14 2,910.8
JP Morgan Securities Inc 17 2,881.2
Merrill Lynch & Co 17 2,482.8
Friedman Billings Ramsey 12 1,908.7
Citigroup Global Markets Inc 7 1,658.1
UBS Securities Inc 10 1,334.5
Lehman Brothers 12 1,288.1
Ryan, Beck & Co 2 725.3
Raymond James 1 465.8
Banc of America Securities 9 402.8
Deutsche Bank Securities 6 399.9
Bear, Stearns & Co Inc 3 319.1
Wachovia Capital Markets LLC 3 317.7
Piper Jaffray & Co 4 258.6
SG Cowen Securities Corp 6 227.5
Ferris Baker Watts Inc 3 206.3
Thomas Weisel Partners LLC 4 142.1
William Blair & Co 3 130.3
Source: Dealogic
Investor Presentation
Note: Apportioned credit to all book-running managers; U.S. Issuers; excludes closed-end funds.
November 2004 Page 10
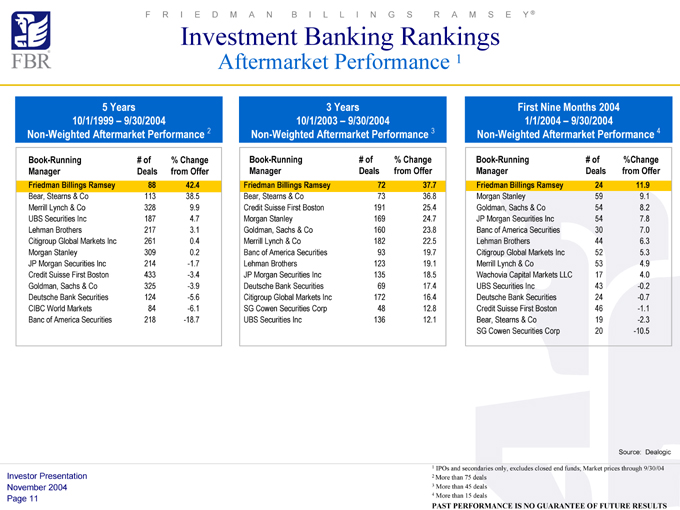
3 Years
10/1/2003 – 9/30/2004
Non-Weighted Aftermarket Performance 3
Book-Running # of % Change
Manager Deals from Offer
Friedman Billings Ramsey 72 37.7
Bear, Stearns & Co 73 36.8
Credit Suisse First Boston 191 25.4
Morgan Stanley 169 24.7
Goldman, Sachs & Co 160 23.8
Merrill Lynch & Co 182 22.5
Banc of America Securities 93 19.7
Lehman Brothers 123 19.1
JP Morgan Securities Inc 135 18.5
Deutsche Bank Securities 69 17.4
Citigroup Global Markets Inc 172 16.4
SG Cowen Securities Corp 48 12.8
UBS Securities Inc 136 12.1
FRIEDMAN BILLINGS RAMSEY®
Investment Banking Rankings
Aftermarket Performance 1
5 Years
10/1/1999 – 9/30/2004
Non-Weighted Aftermarket Performance 2
Book-Running # of % Change
Manager Deals from Offer
Friedman Billings Ramsey 88 42.4
Bear, Stearns & Co 113 38.5
Merrill Lynch & Co 328 9.9
UBS Securities Inc 187 4.7
Lehman Brothers 217 3.1
Citigroup Global Markets Inc 261 0.4
Morgan Stanley 309 0.2
JP Morgan Securities Inc 214 -1.7
Credit Suisse First Boston 433 -3.4
Goldman, Sachs & Co 325 -3.9
Deutsche Bank Securities 124 -5.6
CIBC World Markets 84 -6.1
Banc of America Securities 218 -18.7
First Nine Months 2004
1/1/2004 – 9/30/2004
Non-Weighted Aftermarket Performance 4
Book-Running # of %Change
Manager Deals from Offer
Friedman Billings Ramsey 24 11.9
Morgan Stanley 59 9.1
Goldman, Sachs & Co 54 8.2
JP Morgan Securities Inc 54 7.8
Banc of America Securities 30 7.0
Lehman Brothers 44 6.3
Citigroup Global Markets Inc 52 5.3
Merrill Lynch & Co 53 4.9
Wachovia Capital Markets LLC 17 4.0
UBS Securities Inc 43 -0.2
Deutsche Bank Securities 24 -0.7
Credit Suisse First Boston 46 -1.1
Bear, Stearns & Co 19 -2.3
SG Cowen Securities Corp 20 -10.5
Source: Dealogic
1IPOs and secondaries only, excludes closed end funds; Market prices through 9/30/04
Investor Presentation2 More than 75 deals
November 20043 More than 45 deals Page 114 More than 15 deals
PAST PERFORMANCE IS NO GUARANTEE OF FUTURE RESULTS
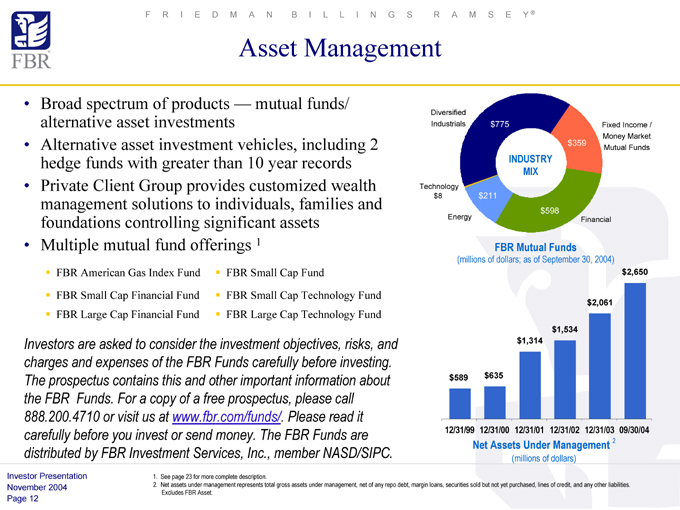
Broad spectrum of products — mutual funds/ alternative asset investments Alternative asset investment vehicles, including 2 hedge funds with greater than 10 year records Private Client Group provides customized wealth management solutions to individuals, families and foundations controlling significant assets Multiple mutual fund offerings 1
FRIEDMAN BILLINGS RAMSEY®
Asset Management
FBR American Gas Index Fund FBR Small Cap Financial Fund FBR Large Cap Financial Fund
FBR Small Cap Fund
FBR Small Cap Technology Fund FBR Large Cap Technology Fund
Investors are asked to consider the investment objectives, risks, and charges and expenses of the FBR Funds carefully before investing. The prospectus contains this and other important information about the FBR Funds. For a copy of a free prospectus, please call 888.200.4710 or visit us at www.fbr.com/funds/. Please read it carefully before you invest or send money. The FBR Funds are distributed by FBR Investment Services, Inc., member NASD/SIPC.
Investor Presentation November 2004 Page 12
1.See page 23 for more complete description.
2.Net assets under management represents total gross assets under management, net of any repo debt, margin loans, securities sold but not yet purchased, lines of credit, and any other liabilities. Excludes FBR Asset.
Diversified
Industrials $775 Fixed Income /
Money Market
$359
Mutual Funds
INDUSTRY
MIX
Technology
$8 $211
$598
Energy Financial
FBR Mutual Funds
(millions of dollars; as of September 30, 2004)
$2,650
$2,061
$1,534
$1,314
$589 $635
12/31/99 12/31/00 12/31/01 12/31/02 12/31/03 09/30/04
Net Assets Under Management 2
(millions of dollars)
$10.9 billion portfolio as of September 30, 2004 Portfolio securities are all adjustable rate, guaranteed by Freddie Mac, Fannie Mae or Ginnie Mae at September 30, 2004 Low duration of 1 to 2 — limits price risk Leverage guideline — 6x to 11x debt to equity, 9.5x long-term target Allocation of FBR equity capital: 50%–90% (long-term average target 60%–65%) Georgetown Funding, FBR’s proprietary $12 billion A1+/P1 commercial paper funding source Consistent high prepayments allow for continuous reinvestment Long-term average target ROE of > 20%
FRIEDMAN BILLINGS RAMSEY®
Principal Investing
Mortgage-Backed Securities
Investor Presentation November 2004 Page 13
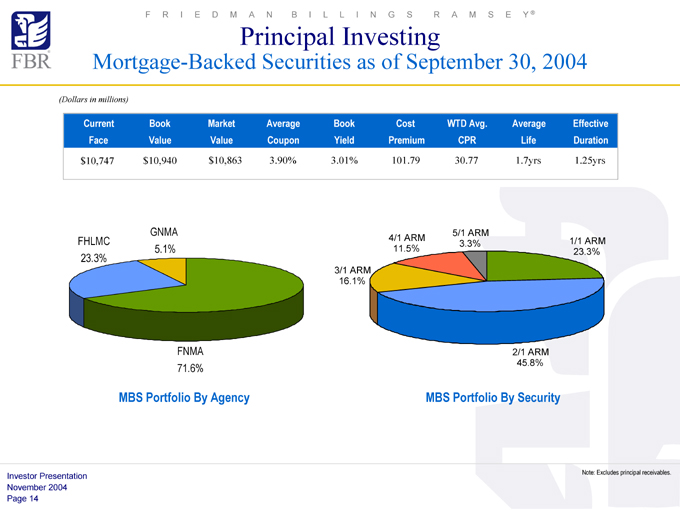
GNMA 5.1%
FRIEDMAN BILLINGS RAMSEY®
Principal Investing
Mortgage-Backed Securities as of September 30, 2004
(Dollars in millions)
Current Book Market Average Book Cost WTD Avg. Average Effective Duration
Face Value Value Coupon Yield Premium CPR Life Duration
$10,747 $10,940 $10,863 3.90% 3.01% 101.79 30.77 1.7yrs 1.25yrs
Investor Presentation Note: Excludes principal receivables.
November 2004 Page 14
FHLMC 23.3%
FNMA 71.6%
MBS Portfolio By Agency
4/1 ARM 11.5%
3/1 ARM 16.1%
5/1 ARM
3.3%
2/1 ARM 45.8%
1/1 ARM 23.3%
MBS Portfolio By Security
All investment decisions driven by fundamental valuation approach Proprietary deal flow through FBR & Co., Inc.
Independent due diligence and investment committee process Deep industry knowledge allows for expedited execution and innovative structures enhance potential for premium returns Investment banking experience improves accuracy of our predicted liquidity outcomes Portfolio of 16 investments funded with FBR Group equity Allocation of 10%–30% of FBR’s equity IRR of 28% from inception to September 30, 2004
FRIEDMAN BILLINGS RAMSEY®
Principal Investing
Merchant Banking
Investor Presentation November 2004 Page 15
Period of Investment Total Banking
Investment Amount Fees Earned
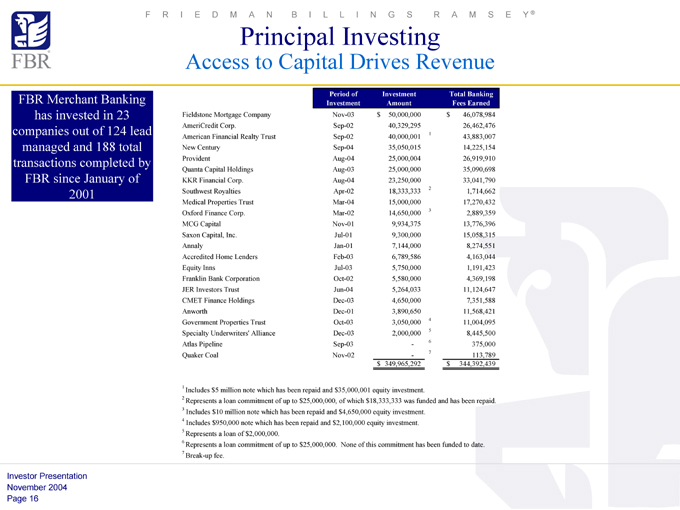
Fieldstone Mortgage Company Nov-03 $ 50,000,000 $46,078,984
AmeriCredit Corp. Sep-02 40,329,295 26,462,476
American Financial Realty Trust Sep-02 40,000,001 1 43,883,007
New Century Sep-04 35,050,015 14,225,154
Provident Aug-04 25,000,004 26,919,910
Quanta Capital Holdings Aug-03 25,000,000 35,090,698
KKR Financial Corp. Aug-04 23,250,000 33,041,790
Southwest Royalties Apr-02 18,333,333 2 1,714,662
Medical Properties Trust Mar-04 15,000,000 17,270,432
Oxford Finance Corp. Mar-02 14,650,000 3 2,889,359
MCG Capital Nov-01 9,934,375 13,776,396
Saxon Capital, Inc. Jul-01 9,300,000 15,058,315
Annaly Jan-01 7,144,000 8,274,551
Accredited Home Lenders Feb-03 6,789,586 4,163,044
Equity Inns Jul-03 5,750,000 1,191,423
Franklin Bank Corporation Oct-02 5,580,000 4,369,198
JER Investors Trust Jun-04 5,264,033 11,124,647
CMET Finance Holdings Dec-03 4,650,000 7,351,588
Anworth Dec-01 3,890,650 11,568,421
Government Properties Trust Oct-03 3,050,000 4 11,004,095
Specialty Underwriters’ Alliance Dec-03 2,000,000 5 8,445,500
Atlas Pipeline Sep-03 - 6 375,000
Quaker Coal Nov-02 - 7 113,789
$ 349,965,292 $ 344,392,439
FRIEDMAN BILLINGS RAMSEY®
Principal Investing
Access to Capital Drives Revenue
FBR Merchant Banking has invested in 23 companies out of 124 lead managed and 188 total transactions completed by FBR since January of 2001
1 Includes $5 million note which has been repaid and $35,000,001 equity investment.
2 Represents a loan commitment of up to $25,000,000, of which $18,333,333 was funded and has been repaid.
3Includes $10 million note which has been repaid and $4,650,000 equity investment.
4Includes $950,000 note which has been repaid and $2,100,000 equity investment.
5 Represents a loan of $2,000,000.
6 Represents a loan commitment of up to $25,000,000. None of this commitment has been funded to date.
7 Break-up fee.
Investor Presentation November 2004
Page 16
Energy Real Estate Healthcare Other finance
FRIEDMAN BILLINGS RAMSEY®
Principal Investing
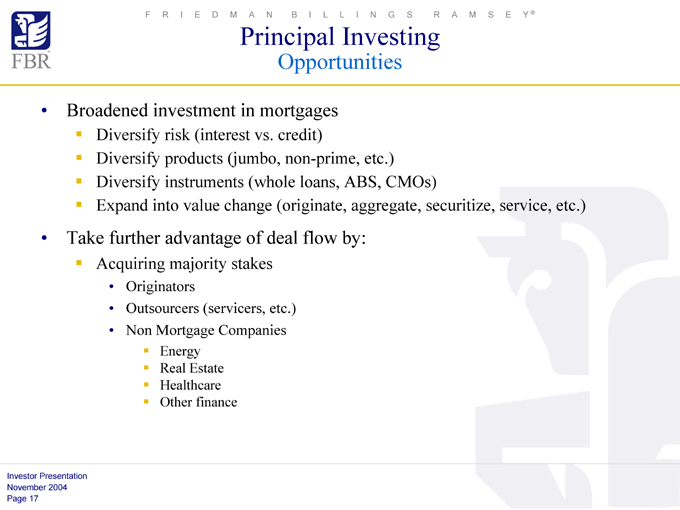
Opportunities
Broadened investment in mortgages
Diversify risk (interest vs. credit)
Diversify products (jumbo, non-prime, etc.)
Diversify instruments (whole loans, ABS, CMOs)
Expand into value change (originate, aggregate, securitize, service, etc.)
Take further advantage of deal flow by:
Acquiring majority stakes
Originators
Outsourcers (servicers, etc.)
Non Mortgage Companies
Investor Presentation November 2004 Page 17
LTM Net LTM Net Price /
LTM Net LTM Net Total Assets / Price /
LTM Period Equity Capital Income per Rev. per Compensation / LTM
Broker / Dealer Fiscal Year End Income Revenue Tangible ROE Tangible
End ($000) Employee Employee Net Revenue Diluted
($000) ($000) Equity Book 1
($000) ($000) EPS 1
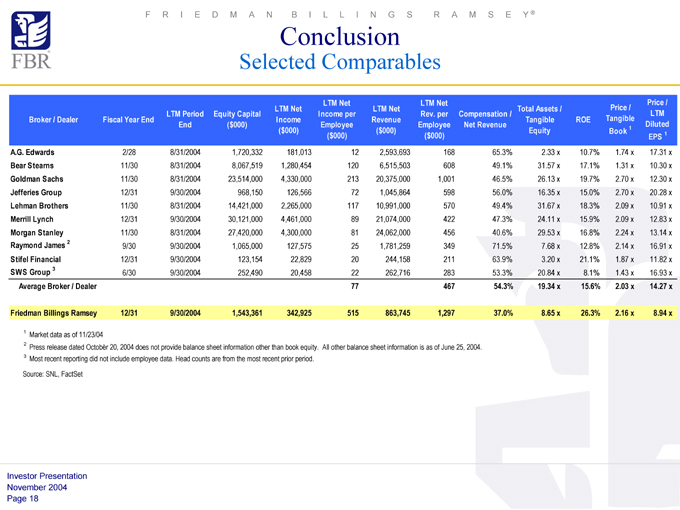
A.G. Edwards 2/28 8/31/2004 1,720,332 181,013 12 2,593,693 168 65.3% 2.33 x 10.7% 1.74 x 17.31 x
Bear Stearns 11/30 8/31/2004 8,067,519 1,280,454 120 6,515,503 608 49.1% 31.57 x 17.1% 1.31 x 10.30 x
Goldman Sachs 11/30 8/31/2004 23,514,000 4,330,000 213 20,375,000 1,001 46.5% 26.13 x 19.7% 2.70 x 12.30 x
Jefferies Group 12/31 9/30/2004 968,150 126,566 72 1,045,864 598 56.0% 16.35 x 15.0% 2.70 x 20.28 x
Lehman Brothers 11/30 8/31/2004 14,421,000 2,265,000 117 10,991,000 570 49.4% 31.67 x 18.3% 2.09 x 10.91 x
Merrill Lynch 12/31 9/30/2004 30,121,000 4,461,000 89 21,074,000 422 47.3% 24.11 x 15.9% 2.09 x 12.83 x
Morgan Stanley 11/30 8/31/2004 27,420,000 4,300,000 81 24,062,000 456 40.6% 29.53 x 16.8% 2.24 x 13.14 x
Raymond James 2 9/30 9/30/2004 1,065,000 127,575 25 1,781,259 349 71.5% 7.68 x 12.8% 2.14 x 16.91 x
Stifel Financial 12/31 9/30/2004 123,154 22,829 20 244,158 211 63.9% 3.20 x 21.1% 1.87 x 11.82 x
SWS Group 3 6/30 9/30/2004 252,490 20,458 22 262,716 283 53.3% 20.84 x 8.1% 1.43 x 16.93 x
Average Broker / Dealer 77 467 54.3% 19.34 x 15.6% 2.03 x 14.27 x
Friedman Billings Ramsey 12/31 9/30/2004 1,543,361 342,925 515 863,745 1,297 37.0% 8.65 x 26.3% 2.16 x 8.94 x
FRIEDMAN BILLINGS RAMSEY®
Conclusion
Selected Comparables
1 Market data as of 11/23/04
2 Press release dated October 20, 2004 does not provide balance sheet information other than book equity. All other balance sheet information is as of June 25, 2004.
3 Most recent reporting did not include employee data. Head counts are from the most recent prior period.
Source: SNL, FactSet
Investor Presentation November 2004 Page 18
#1 lead managing underwriter for after-market performance 1
#1 lead managing underwriter for companies valued $1 billion and under 2 #3 lead managing underwriter for 2003 IPOs 3 Top ten underwriter — $7.2 billion lead/sole managed this year 2
FRIEDMAN BILLINGS RAMSEY®
Conclusion
Summary
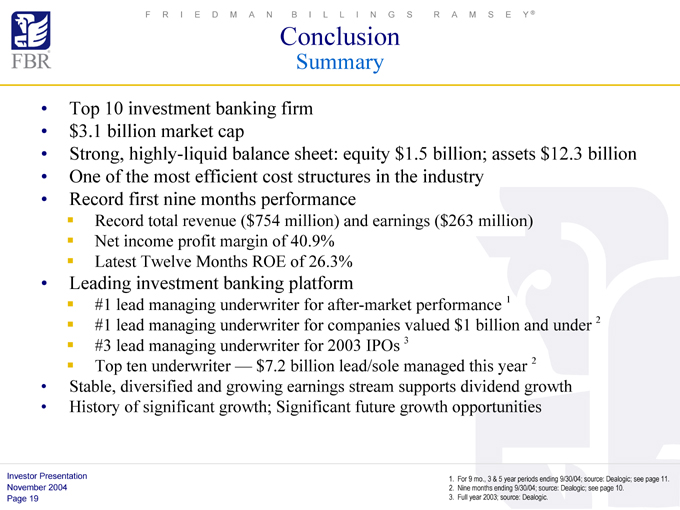
Top 10 investment banking firm $3.1 billion market cap
Strong, highly-liquid balance sheet: equity $1.5 billion; assets $12.3 billion One of the most efficient cost structures in the industry Record first nine months performance
Record total revenue ($754 million) and earnings ($263 million) Net income profit margin of 40.9% Latest Twelve Months ROE of 26.3%
Leading investment banking platform
Stable, diversified and growing earnings stream supports dividend growth History of significant growth; Significant future growth opportunities
1. For 9 mo., 3 & 5 year periods ending 9/30/04; source: Dealogic; see page 11.
2. Nine months ending 9/30/04; source: Dealogic; see page 10.
3. Full year 2003; source: Dealogic.
Investor Presentation November 2004 Page 19
APPENDIX
FRIEDMAN BILLINGS RAMSEY®
CAPITAL FOR YOUR CONQUEST
2004 November
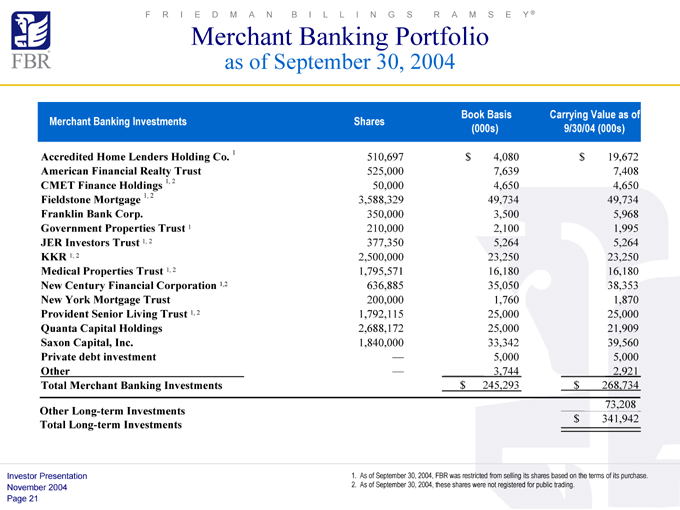
Book Basis Carrying Value as of
Merchant Banking Investments Shares
(000s) 9/30/04 (000s)
Accredited Home Lenders Holding Co. 1 510,697 $4,080 $19,672
American Financial Realty Trust 525,000 7,639 7,408
CMET Finance Holdings 1, 2 50,000 4,650 4,650
Fieldstone Mortgage 1, 2 3,588,329 49,734 49,734
Franklin Bank Corp. 350,000 3,500 5,968
Government Properties Trust 1 210,000 2,100 1,995
JER Investors Trust 1, 2 377,350 5,264 5,264
KKR 1, 2 2,500,000 23,250 23,250
Medical Properties Trust 1, 2 1,795,571 16,180 16,180
New Century Financial Corporation 1,2 636,885 35,050 38,353
New York Mortgage Trust 200,000 1,760 1,870
Provident Senior Living Trust 1, 2 1,792,115 25,000 25,000
Quanta Capital Holdings 2,688,172 25,000 21,909
Saxon Capital, Inc. 1,840,000 33,342 39,560
Private debt investment — 5,000 5,000
Other — 3,744 2,921
Total Merchant Banking Investments $245,293 $ 268,734
73,208
Other Long-term Investments
$341,942
Total Long-term Investments
FRIEDMAN BILLINGS RAMSEY®
Merchant Banking Portfolio
as of September 30, 2004
Investor Presentation November 2004 Page 21
1. As of September 30, 2004, FBR was restricted from selling its shares based on the terms of its purchase.
2. As of September 30, 2004, these shares were not registered for public trading.
FRIEDMAN BILLINGS RAMSEY®
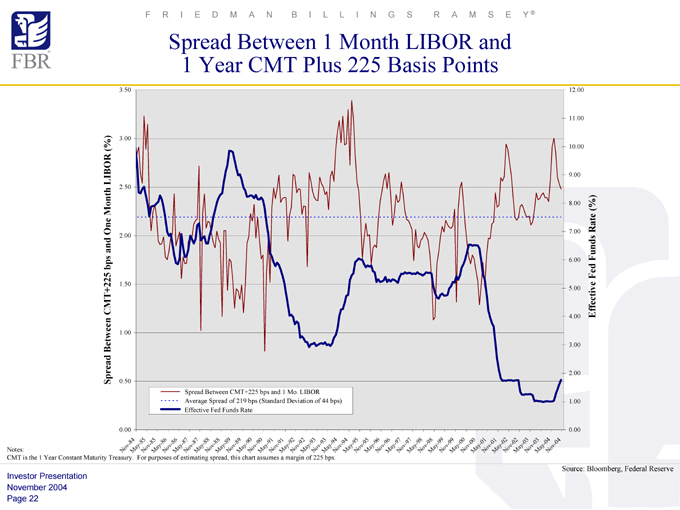
Spread Between 1 Month LIBOR and 1 Year CMT Plus 225 Basis Points
Spread Between CMT+225 bps and One Month LIBOR (%)
3.50 3.00 2.50 2.00 1.50 1.00 0.50 0.00
Nov- 84
May- 85
Nov- 85
May- 86
Nov- 86
May- 87
Nov- 87
May- 88
Nov- 88
May- 89
Nov- 89
May- 90
Nov- 90
May- 91
Nov- 91
May- 92
Nov- 92
May- 93
Nov- 93
May- 94
Nov- 94
May- 95
Nov- 95
May- 96
Nov- 96
May- 97
Nov- 97
May- 98
Nov- 98
May- 99
Nov- 99
May- 00
Nov- 00
May- 01
Nov- 01
May- 02
Nov- 02
May- 03
Nov- 03
May- 04
Nov- 04
12.00 11.00 10.00 9.00 8.00 7.00 6.00 5.00 4.00 3.00 2.00 1.00 0.00
Effective Fed Funds Rate (%)
Spread Between CMT+225 bps and 1 Mo. LIBOR Average Spread of 219 bps (Standard Deviation of 44 bps) Effective Fed Funds Rate
Notes:
CMT is the 1 Year Constant Maturity Treasury. For purposes of estimating spread, this chart assumes a margin of 225 bps
Investor Presentation November 2004 Page 22
Source: Bloomberg, Federal Reserve
Dallas
2100 McKinney Avenue Suite 1940 Dallas, Texas 75201 469.341.1200
Denver
1200 17th Street Suite 550 Denver, Colorado 80202 720.946.6000
Houston
600 Travis Street Suite 6070 Houston, Texas 77002 713.343.1000
Irvine (Los Angeles)
18101 Von Karman Avenue Suite 1000 Irvine, California 92612 949.477.3100
FRIEDMAN BILLINGS RAMSEY
Friedman Billings Ramsey Group, Inc. Metropolitan Washington, D.C. Headquarters
1001 Nineteenth Street North Arlington, Virginia 22209 Tel: 703.312.9500 Fax: 703.312.9501 www.fbr.com
Bethesda
4922 Fairmont Avenue Bethesda, Maryland 20814 301.657.1500
Boston
101 Federal Street Suite 2100
Boston, Massachusetts 02110 617.757.2900
Chicago
200 South Wacker Drive 31st Floor Chicago, Illinois 6060 312.674.4635
Cleveland
3201 Enterprise Parkway Suite 320 Cleveland, Ohio 44122 216.593.7000
New York
299 Park Avenue
New York, New York 10171 212.457.3300
Phoenix
Camelback Esplanade V Suite 180 Phoenix, Arizona 85016 602.794.3700
Portland
208 SW First Avenue Suite 300 Portland, Oregon 97204 503.221.0200
San Francisco
4 Embarcadero Center Suite1950
San Francisco, California 94111 415.248.2900
Seattle
111 Third Avenue Suite 2400
Seattle, Washington 98101 206.382.9191
London, UK
9-11 Grosvenor Gardens London SW1W OBD 011.44.20.7663.9100
Vienna, Austria
Millenium Tower, 23rd floor Handelskai 94-96 A-1201 Vienna 011.43.12.402.7250
NOTE: Not all services are available from all offices.