Exhibit 99.1
FRIEDMAN BILLINGS RAMSEY ®
CAPITAL FOR YOUR CONQUEST
THE WALL STREET ANALYST FORUM Presentation
February 28, 2005
FEBRUARY
All information as of December 31, 2004 unless indicated.
FRIEDMAN BILLINGS BRAMSEY ®
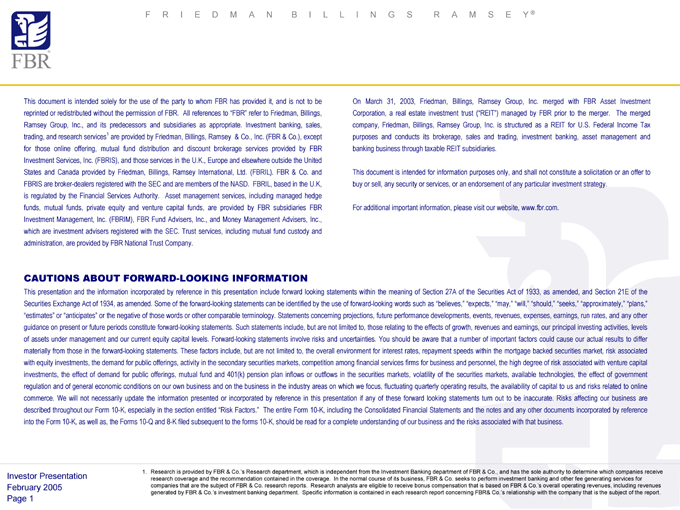
This document is intended solely for the use of the party to whom FBR has provided it, and is not to be reprinted or redistributed without the permission of FBR. All references to “FBR” refer to FRIEDMAN, BILLINGS, RAMSEY Group, Inc., and its predecessors and subsidiaries as appropriate. Investment banking, sales, trading, and research services1 are provided by FRIEDMAN, BILLINGS, RAMSEY & Co., Inc. (FBR & Co.), except for those online offering, mutual fund distribution and discount brokerage services provided by FBR Investment Services, Inc. (FBRIS), and those services in the U.K., Europe and elsewhere outside the United States and Canada provided by FRIEDMAN, BILLINGS, RAMSEY International, Ltd. (FBRIL). FBR & Co. and FBRIS are broker-dealers registered with the SEC and are members of the NASD. FBRIL, based in the U.K, is regulated by the Financial Services Authority. Asset management services, including managed hedge funds, mutual funds, private equity and venture capital funds, are provided by FBR subsidiaries FBR Investment Management, Inc. (FBRIM), FBR Fund Advisers, Inc., and Money Management Advisers, Inc., which are investment advisers registered with the SEC. Trust services, including mutual fund custody and administration, are provided by FBR National Trust Company.
On March 31, 2003, FRIEDMAN, BILLINGS, RAMSEY Group, Inc. merged with FBR Asset Investment Corporation, a real estate investment trust (“REIT”) managed by FBR prior to the merger. The merged company, FRIEDMAN, BILLINGS, RAMSEY Group, Inc. is structured as a REIT for U.S. Federal Income Tax purposes and conducts its brokerage, sales and trading, investment banking, asset management and banking business through taxable REIT subsidiaries.
This document is intended for information purposes only, and shall not constitute a solicitation or an offer to buy or sell, any security or services, or an endorsement of any particular investment strategy.
For additional important information, please visit our website, www.fbr.com.
CAUTIONS ABOUT FORWARD-LOOKING INFORMATION
This presentation and the information incorporated by reference in this presentation include forward looking statements within the meaning of Section 27A of the Securities Act of 1933, as amended, and Section 21E of the Securities Exchange Act of 1934, as amended. Some of the forward-looking statements can be identified by the use of forward-looking words such as “believes,” “expects,” “may,” “will,” “should,” “seeks,” “approximately,” “plans,” “estimates” or “anticipates” or the negative of those words or other comparable terminology. Statements concerning projections, future performance developments, events, revenues, expenses, earnings, run rates, and any other guidance on present or future periods constitute forward-looking statements. Such statements include, but are not limited to, those relating to the effects of growth, revenues and earnings, our principal investing activities, levels of assets under management and our current equity capital levels. Forward-looking statements involve risks and uncertainties. You should be aware that a number of important factors could cause our actual results to differ materially from those in the forward-looking statements. These factors include, but are not limited to, the overall environment for interest rates, repayment speeds within the mortgage backed securities market, risk associated with equity investments, the demand for public offerings, activity in the secondary securities markets, competition among financial services firms for business and personnel, the high degree of risk associated with venture capital investments, the effect of demand for public offerings, mutual fund and 401(k) pension plan inflows or outflows in the securities markets, volatility of the securities markets, available technologies, the effect of government regulation and of general economic conditions on our own business and on the business in the industry areas on which we focus, fluctuating quarterly operating results, the availability of capital to us and risks related to online commerce. We will not necessarily update the information presented or incorporated by reference in this presentation if any of these forward looking statements turn out to be inaccurate. Risks affecting our business are described throughout our Form 10-K, especially in the section entitled “Risk Factors.” The entire Form 10-K, including the Consolidated Financial Statements and the notes and any other documents incorporated by reference into the Form 10-K, as well as, the Forms 10-Q and 8-K filed subsequent to the forms 10-K, should be read for a complete understanding of our business and the risks associated with that business.
1. Research is provided by FBR & Co.’s Research department, which is independent from the Investment Banking department of FBR & Co., and has the sole authority to determine which companies receive research coverage and the recommendation contained in the coverage. In the normal course of its business, FBR & Co. seeks to perform investment banking and other fee generating services for companies that are the subject of FBR & Co. research reports. Research analysts are eligible to receive bonus compensation that is based on FBR & Co.’s overall operating revenues, including revenues generated by FBR & Co.’s investment banking department. Specific information is contained in each research report concerning FBR& Co.’s relationship with the company that is the subject of the report.
Investor Presentation February 2005 Page 1
FRIEDMAN BILLINGS RAMSEY ®
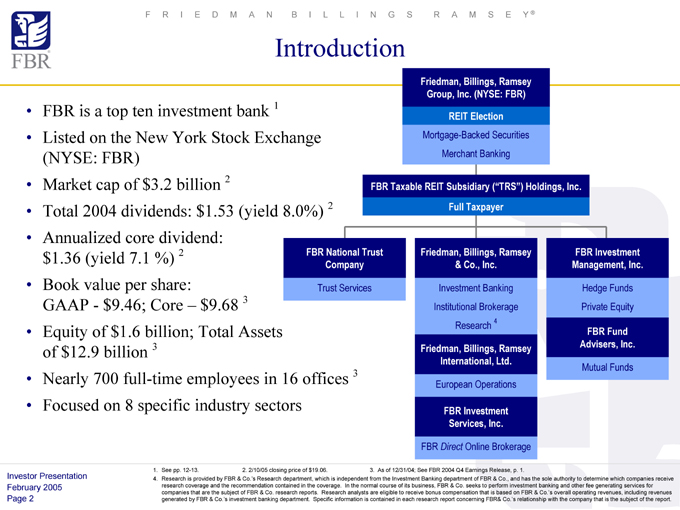
Introduction
FBR is a top ten investment bank 1 Listed on the New York Stock Exchange (NYSE: FBR) Market cap of $3.2 billion 2 Total 2004 dividends: $1.53 (yield 8.0%) 2
Annualized core dividend: $1.36 (yield 7.1 %) 2 Book value per share: GAAP—$9.46; Core – $9.68 3
Equity of $1.6 billion; Total Assets of $12.9 billion 3
Nearly 700 full-time employees in 16 offices 3 Focused on 8 specific industry sectors
FRIEDMAN , BILLINGS , RAMSEY Group, Inc. (NYSE: FBR)
REIT Election
Mortgage-Backed Securities Merchant Banking
FBR Taxable REIT Subsidiary (“TRS”) Holdings, Inc.
Full Taxpayer
FBR National Trust Company
Trust Services
FRIEDMAN , BILLINGS , RAMSEY & Co., Inc.
Investment Banking Institutional Brokerage Research 4
FRIEDMAN , BILLINGS , RAMSEY International, Ltd.
European Operations
FBR Investment Services, Inc.
FBR Direct Online Brokerage
FBR Investment Management, Inc.
Hedge Funds Private Equity
FBR Fund Advisers, Inc.
Mutual Funds
1. See pp. 12-13. 2. 2/10/05 closing price of $19.06. 3. As of 12/31/04; See FBR 2004 Q4 Earnings Release, p. 1.
4. Research is provided by FBR & Co.’s Research department, which is independent from the Investment Banking department of FBR & Co., and has the sole authority to determine which companies receive research coverage and the recommendation contained in the coverage. In the normal course of its business, FBR & Co. seeks to perform investment banking and other fee generating services for companies that are the subject of FBR & Co. research reports. Research analysts are eligible to receive bonus compensation that is based on FBR & Co.’s overall operating revenues, including revenues generated by FBR & Co.’s investment banking department. Specific information is contained in each research report concerning FBR& Co.’s relationship with the company that is the subject of the report.
Investor Presentation February 2005 Page 2
FRIEDMAN BILLINGS RAMSEY ®
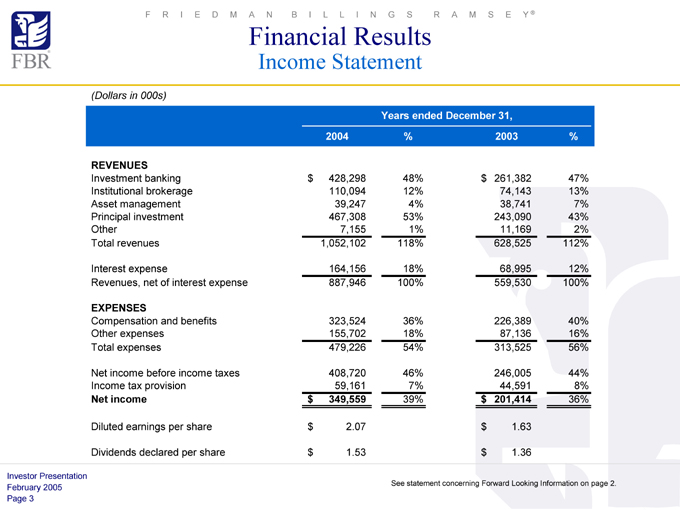
Financial Results
Income Statement
(Dollars in 000s)
Years ended December 31,
2004 % 2003 %
REVENUES
Investment banking $428,298 48% $261,382 47%
Institutional brokerage 110,094 12% 74,143 13%
Asset management 39,247 4% 38,741 7%
Principal investment 467,308 53% 243,090 43%
Other 7,155 1% 11,169 2%
Total revenues 1,052,102 118% 628,525 112%
Interest expense 164,156 18% 68,995 12%
Revenues, net of interest expense 887,946 100% 559,530 100%
EXPENSES
Compensation and benefits 323,524 36% 226,389 40%
Other expenses 155,702 18% 87,136 16%
Total expenses 479,226 54% 313,525 56%
Net income before income taxes 408,720 46% 246,005 44%
Income tax provision 59,161 7% 44,591 8%
Net income $349,559 39% $201,414 36%
Diluted earnings per share $2.07 $1.63
Dividends declared per share $1.53 $1.36
See statement concerning Forward Looking Information on page 2.
Investor Presentation February 2005 Page 3
FRIEDMAN BILLINGS RAMSEY ®
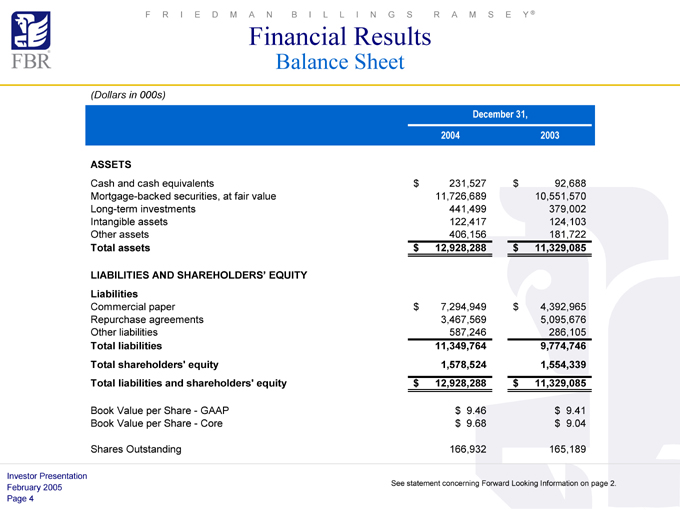
Financial Results
Balance Sheet
(Dollars in 000s)
December 31,
2004 2003
ASSETS
Cash and cash equivalents $231,527 $92,688
Mortgage-backed securities, at fair value 11,726,689 10,551,570
Long-term investments 441,499 379,002
Intangible assets 122,417 124,103
Other assets 406,156 181,722
Total assets $12,928,288 $11,329,085
LIABILITIES AND SHAREHOLDERS’ EQUITY
Liabilities
Commercial paper $7,294,949 $4,392,965
Repurchase agreements 3,467,569 5,095,676
Other liabilities 587,246 286,105
Total liabilities 11,349,764 9,774,746
Total shareholders’ equity 1,578,524 1,554,339
Total liabilities and shareholders’ equity $12,928,288 $11,329,085
Book Value per Share—GAAP $9.46 $9.41
Book Value per Share—Core $9.68 $9.04
Shares Outstanding 166,932 165,189
See statement concerning Forward Looking Information on page 2.
Investor Presentation February 2005 Page 4
FRIEDMAN BILLINGS RAMSEY ®
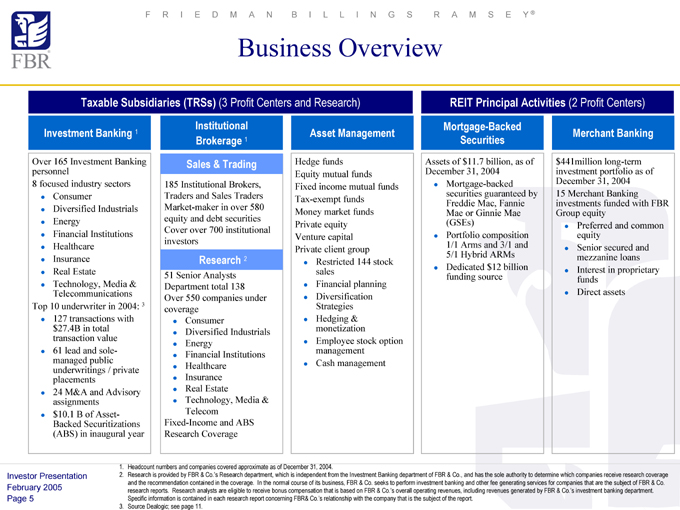
Business Overview
Taxable Subsidiaries (TRSs) (3 Profit Centers and Research)
Investment Banking 1
Over 165 Investment Banking personnel 8 focused industry sectors
Consumer
Diversified Industrials Energy Financial Institutions Healthcare Insurance Real Estate Technology, Media & Telecommunications
Top 10 underwriter in 2004: 3
127 transactions with $27.4B in total transaction value 61 lead and sole-managed public underwritings / private placements 24 M&A and Advisory assignments $10.1 B of Asset-Backed Securitizations (ABS) in inaugural year
Institutional Brokerage 1
Sales & Trading
185 Institutional Brokers, Traders and Sales Traders Market-maker in over 580 equity and debt securities Cover over 700 institutional investors
Research 2
51 Senior Analysts Department total 138 Over 550 companies under coverage
Consumer
Diversified Industrials Energy Financial Institutions Healthcare Insurance Real Estate Technology, Media & Telecom
Fixed-Income and ABS Research Coverage
Asset Management
Hedge funds Equity mutual funds Fixed income mutual funds Tax-exempt funds Money market funds Private equity Venture capital Private client group
Restricted 144 stock sales Financial planning Diversification Strategies Hedging & monetization Employee stock option management Cash management
REIT Principal Activities (2 Profit Centers)
Mortgage-Backed Securities
Assets of $11.7 billion, as of December 31, 2004
Mortgage-backed securities guaranteed by Freddie Mac, Fannie Mae or Ginnie Mae (GSEs) Portfolio composition 1/1 Arms and 3/1 and 5/1 Hybrid ARMs Dedicated $12 billion funding source
Merchant Banking
$441million long-term investment portfolio as of December 31, 2004 15 Merchant Banking investments funded with FBR Group equity
Preferred and common equity Senior secured and mezzanine loans Interest in proprietary funds Direct assets
1. Headcount numbers and companies covered approximate as of December 31, 2004.
2. Research is provided by FBR & Co.’s Research department, which is independent from the Investment Banking department of FBR & Co., and has the sole authority to determine which companies receive research coverage and the recommendation contained in the coverage. In the normal course of its business, FBR & Co. seeks to perform investment banking and other fee generating services for companies that are the subject of FBR & Co. research reports. Research analysts are eligible to receive bonus compensation that is based on FBR & Co.’s overall operating revenues, including revenues generated by FBR & Co.’s investment banking department. Specific information is contained in each research report concerning FBR& Co.’s relationship with the company that is the subject of the report.
3. Source Dealogic; see page 11.
Investor Presentation February 2005 Page 5
FRIEDMAN BILLINGS RAMSEY ®
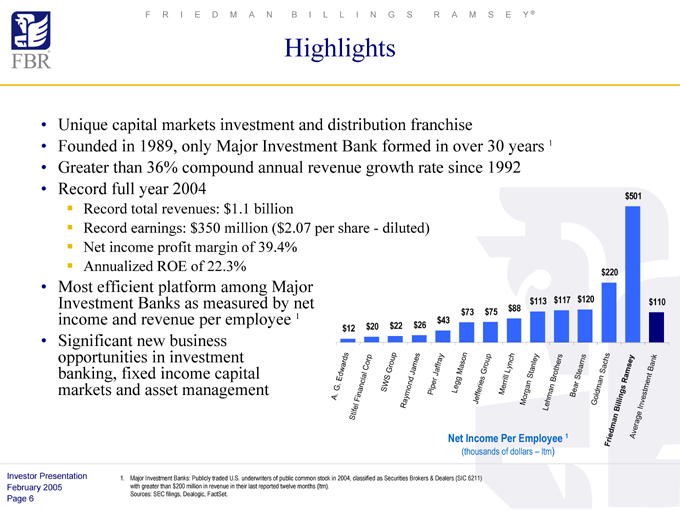
Highlights
Unique capital markets investment and distribution franchise
Founded in 1989, only Major Investment Bank formed in over 30 years 1 Greater than 36% compound annual revenue growth rate since 1992 Record full year 2004
Record total revenues: $1.1 billion
Record earnings: $350 million ($2.07 per share—diluted) Net income profit margin of 39.4% Annualized ROE of 22.3%
Most efficient platform among Major Investment Banks as measured by net income and revenue per employee 1
Significant new business opportunities in investment banking, fixed income capital markets and asset management $113 $117 $120
$73 $75 $88 $43
$12$20 $22 $26 $501
$220
$110
A. G. Edwards
Stifel Financial Corp
SWS Group
Raymond James
Piper Jaffray
Legg Mason
Jefferies Group
Merrill Lynch
Morgan Stanley
Lehman Brothers
Bear Stearns
Goldman Sachs
FRIEDMAN BILLINGS RAMSEY
Average Investment Bank
1. Major Investment Banks: Publicly traded U.S. underwriters of public common stock in 2004, classified as Securities Brokers & Dealers (SIC 6211) with greater than $200 million in revenue in their last reported twelve months (ltm).
Sources: SEC filings, Dealogic, FactSet.
Investor Presentation February 2005 Page 6
FRIEDMAN BILLINGS RAMSEY ®
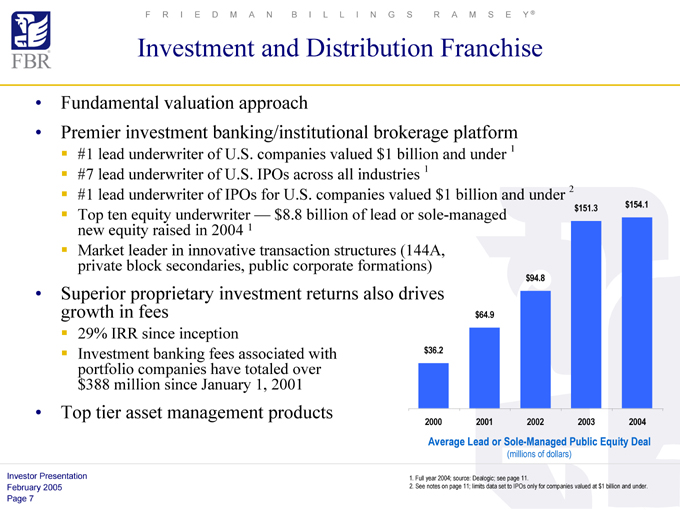
Investment and Distribution Franchise
Fundamental valuation approach
Premier investment banking/institutional brokerage platform
#1 lead underwriter of U.S. companies valued $1 billion and under 1 #7 lead underwriter of U.S. IPOs across all industries 1
#1 lead underwriter of IPOs for U.S. companies valued $1 billion and under 2
Top ten equity underwriter — $8.8 billion of lead or sole-managed new equity raised in 2004 1 Market leader in innovative transaction structures (144A, private block secondaries, public corporate formations)
Superior proprietary investment returns also drives growth in fees
29% IRR since inception
Investment banking fees associated with portfolio companies have totaled over $388 million since January 1, 2001
Top tier asset management products $36.2 $64.9 $94.8 $151.3 $154.1
2000 2001 2002 2003 2004
Average Lead or Sole-Managed Public Equity Deal
(millions of dollars)
1. Full year 2004; source: Dealogic; see page 11.
2. See notes on page 11; limits data set to IPOs only for companies valued at $1 billion and under.
Investor Presentation February 2005 Page 7
FRIEDMAN BILLINGS RAMSEY ®
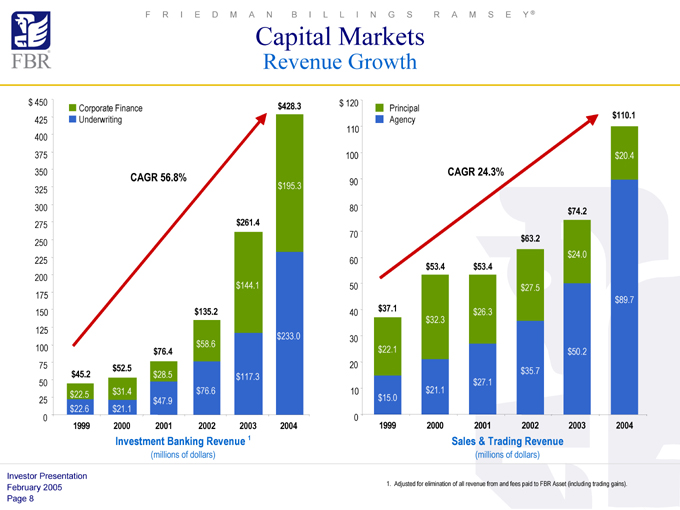
Capital Markets
Revenue Growth $450 425 400 375 350 325 300 275 250 225 200 175 150 125 100 75 50 25 0
Corporate Finance Underwriting
CAGR 56.8%
$76.4
$52.5
$45.2 $28.5
$22.5 $31.4
$47.9
$22.6 $21.1
1999 2000 2001
$428.3
$195.3
$261.4
$144.1
$135.2
$233.0
$58.6
$117.3
$76.6
2002 2003 2004
Investment Banking Revenue 1
(millions of dollars) $120 110 100 90 80 70 60 50 40 30 20 10 0
Principal Agency
CAGR 24.3%
$74.2
$63.2
$24.0
$53.4 $53.4
$27.5
$37.1 $26.3
$32.3
$22.1 $50.2
$35.7
$27.1
$21.1
$15.0
1999 2000 2001 2002 2003
$110.1 $20.4 $89.7
2004
Sales & Trading Revenue
(millions of dollars)
1. Adjusted for elimination of all revenue from and fees paid to FBR Asset (including trading gains).
Investor Presentation February 2005 Page 8
FRIEDMAN BILLINGS RAMSEY ®
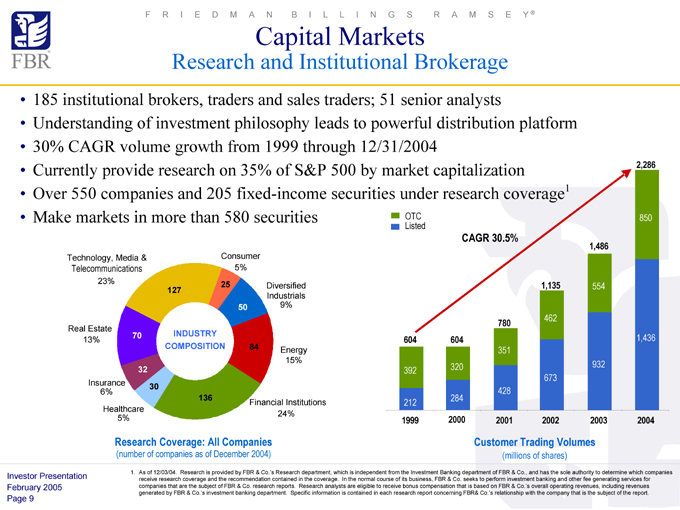
Capital Markets
Research and Institutional Brokerage
Industry Composition
185 institutional brokers, traders and sales traders; 51 senior analysts
Understanding of investment philosophy leads to powerful distribution platform 30% CAGR volume growth from 1999 through 12/31/2004 Currently provide research on 35% of S&P 500 by market capitalization Over 550 companies and 205 fixed-income securities under research coverage1
Make markets in more than 580 securities
Technology, Media &
Telecommunications
23%
Real Estate 13%
Insurance 6%
Healthcare 5%
Financial Institutions 24%
Energy 15%
Diversified Industrials 9%
Consumer 5%
127
70
32
30
136
84
50
25
Research Coverage: All Companies
(number of companies as of December 2004)
OTC Listed
CAGR 30.5%
1,486
1,135 554
462
780
604 604
351
320 932
392
673
428
212 284
1999 2000 2001 2002 2003
2,286
850
1,436
2004
Customer Trading Volumes
(millions of shares)
1. As of 12/03/04. Research is provided by FBR & Co.’s Research department, which is independent from the Investment Banking department of FBR & Co., and has the sole authority to determine which companies receive research coverage and the recommendation contained in the coverage. In the normal course of its business, FBR & Co. seeks to perform investment banking and other fee generating services for companies that are the subject of FBR & Co. research reports. Research analysts are eligible to receive bonus compensation that is based on FBR & Co.’s overall operating revenues, including revenues generated by FBR & Co.’s investment banking department. Specific information is contained in each research report concerning FBR& Co.’s relationship with the company that is the subject of the report.
Investor Presentation February 2005 Page 9
FRIEDMAN BILLINGS RAMSEY ®
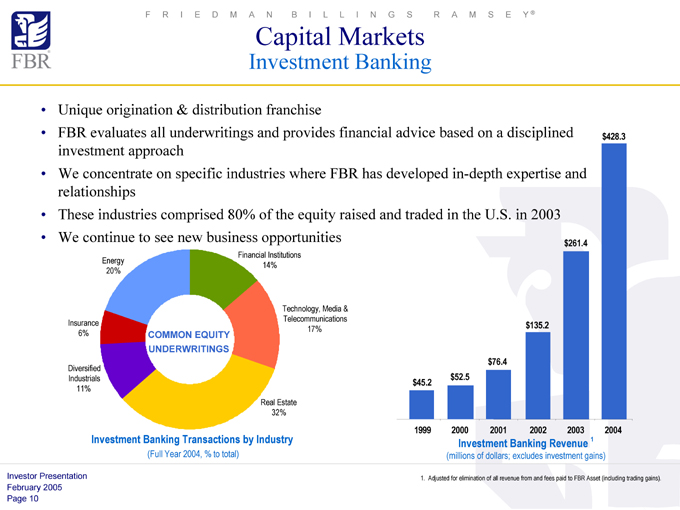
Capital Markets
Investment Banking
Common Equity Underwriting
Unique origination & distribution franchise
Technology,
FBR evaluates all underwritings and provides financial advice based on a disciplined& Telecom investment approach We concentrate on specific industries where FBR has developed in-depth expertise and relationships These industries comprised 80% of the equity raised and traded in the U.S. in 2003
We continue to see new business opportunities
Energy 20%
Insurance 6%
Diversified Industrials 11%
Real Estate 32%
Technology, Media & Telecommunications 17%
Financial Institutions 14%
Investment Banking Transactions by Industry
(Full Year 2004, % to total)
$261.4
$135.2
$76.4
$52.5
$45.2
1999 2000 2001 2002 2003 2004
$428.3
Investment Banking Revenue 1
(millions of dollars; excludes investment gains)
1. Adjusted for elimination of all revenue from and fees paid to FBR Asset (including trading gains).
Investor Presentation February 2005 Page 10
FRIEDMAN BILLINGS RAMSEY ®
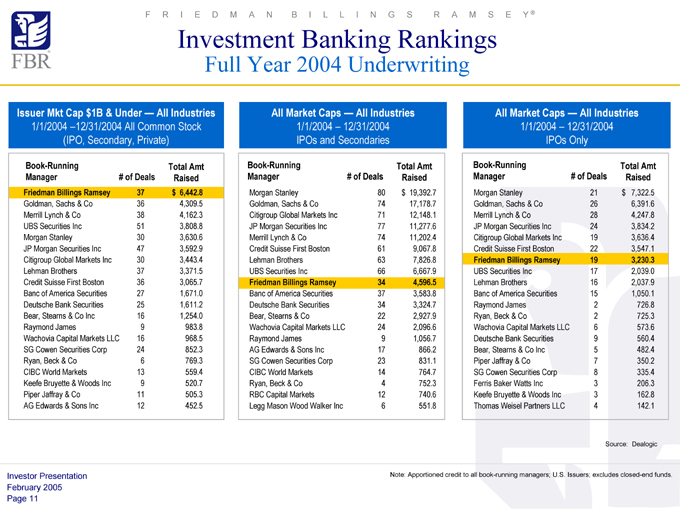
Investment Banking Rankings
Full Year 2004 Underwriting
Issuer Mkt Cap $1B & Under — All Industries
1/1/2004 –12/31/2004 All Common Stock (IPO, Secondary, Private)
Book-Running Total Amt
Manager # of Deals Raised
FRIEDMAN BILLINGS RAMSEY 37 $6,442.8
Goldman, Sachs & Co 36 4,309.5
Merrill Lynch & Co 38 4,162.3
UBS Securities Inc 51 3,808.8
Morgan Stanley 30 3,630.6
JP Morgan Securities Inc 47 3,592.9
Citigroup Global Markets Inc 30 3,443.4
Lehman Brothers 37 3,371.5
Credit Suisse First Boston 36 3,065.7
Banc of America Securities 27 1,671.0
Deutsche Bank Securities 25 1,611.2
Bear, Stearns & Co Inc 16 1,254.0
Raymond James 9 983.8
Wachovia Capital Markets LLC 16 968.5
SG Cowen Securities Corp 24 852.3
Ryan, Beck & Co 6 769.3
CIBC World Markets 13 559.4
Keefe Bruyette & Woods Inc 9 520.7
Piper Jaffray & Co 11 505.3
AG Edwards & Sons Inc 12 452.5
All Market Caps — All Industries
1/1/2004 – 12/31/2004 IPOs and Secondaries
Book-Running Total Amt
Manager # of Deals Raised
Morgan Stanley 80 $19,392.7
Goldman, Sachs & Co 74 17,178.7
Citigroup Global Markets Inc 71 12,148.1
JP Morgan Securities Inc 77 11,277.6
Merrill Lynch & Co 74 11,202.4
Credit Suisse First Boston 61 9,067.8
Lehman Brothers 63 7,826.8
UBS Securities Inc 66 6,667.9
FRIEDMAN BILLINGS RAMSEY 34 4,596.5
Banc of America Securities 37 3,583.8
Deutsche Bank Securities 34 3,324.7
Bear, Stearns & Co 22 2,927.9
Wachovia Capital Markets LLC 24 2,096.6
Raymond James 9 1,056.7
AG Edwards & Sons Inc 17 866.2
SG Cowen Securities Corp 23 831.1
CIBC World Markets 14 764.7
Ryan, Beck & Co 4 752.3
RBC Capital Markets 12 740.6
Legg Mason Wood Walker Inc 6 551.8
All Market Caps — All Industries
1/1/2004 – 12/31/2004 IPOs Only
Book-Running Total Amt
Manager # of Deals Raised
Morgan Stanley 21 $7,322.5
Goldman, Sachs & Co 26 6,391.6
Merrill Lynch & Co 28 4,247.8
JP Morgan Securities Inc 24 3,834.2
Citigroup Global Markets Inc 19 3,636.4
Credit Suisse First Boston 22 3,547.1
FRIEDMAN BILLINGS RAMSEY 19 3,230.3
UBS Securities Inc 17 2,039.0
Lehman Brothers 16 2,037.9
Banc of America Securities 15 1,050.1
Raymond James 2 726.8
Ryan, Beck & Co 2 725.3
Wachovia Capital Markets LLC 6 573.6
Deutsche Bank Securities 9 560.4
Bear, Stearns & Co Inc 5 482.4
Piper Jaffray & Co 7 350.2
SG Cowen Securities Corp 8 335.4
Ferris Baker Watts Inc 3 206.3
Keefe Bruyette & Woods Inc 3 162.8
Thomas Weisel Partners LLC 4 142.1
Source: Dealogic
Note: Apportioned credit to all book-running managers; U.S. Issuers; excludes closed-end funds.
Investor Presentation February 2005 Page 11
FRIEDMAN BILLINGS RAMSEY ®
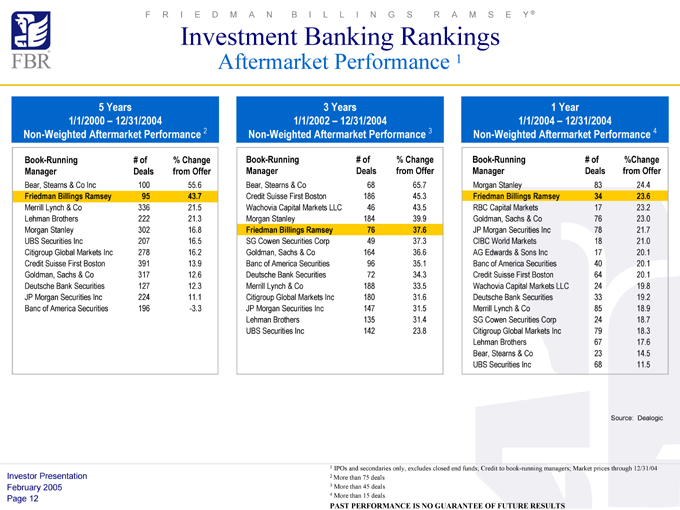
Investment Banking Rankings
Aftermarket Performance 1
5 Years 1/1/2000 – 12/31/2004
Non-Weighted Aftermarket Performance 2
Book-Running # of % Change
Manager Deals from Offer
Bear, Stearns & Co Inc 100 55.6
FRIEDMAN BILLINGS RAMSEY 95 43.7
Merrill Lynch & Co 336 21.5
Lehman Brothers 222 21.3
Morgan Stanley 302 16.8
UBS Securities Inc 207 16.5
Citigroup Global Markets Inc 278 16.2
Credit Suisse First Boston 391 13.9
Goldman, Sachs & Co 317 12.6
Deutsche Bank Securities 127 12.3
JP Morgan Securities Inc 224 11.1
Banc of America Securities 196 -3.3
3 Years 1/1/2002 – 12/31/2004
Non-Weighted Aftermarket Performance 3
Book-Running # of % Change
Manager Deals from Offer
Bear, Stearns & Co 68 65.7
Credit Suisse First Boston 186 45.3
Wachovia Capital Markets LLC 46 43.5
Morgan Stanley 184 39.9
FRIEDMAN BILLINGS RAMSEY 76 37.6
SG Cowen Securities Corp 49 37.3
Goldman, Sachs & Co 164 36.6
Banc of America Securities 96 35.1
Deutsche Bank Securities 72 34.3
Merrill Lynch & Co 188 33.5
Citigroup Global Markets Inc 180 31.6
JP Morgan Securities Inc 147 31.5
Lehman Brothers 135 31.4
UBS Securities Inc 142 23.8
1 Year 1/1/2004 – 12/31/2004
Non-Weighted Aftermarket Performance 4
Book-Running # of %Change
Manager Deals from Offer
Morgan Stanley 83 24.4
FRIEDMAN BILLINGS RAMSEY 34 23.6
RBC Capital Markets 17 23.2
Goldman, Sachs & Co 76 23.0
JP Morgan Securities Inc 78 21.7
CIBC World Markets 18 21.0
AG Edwards & Sons Inc 17 20.1
Banc of America Securities 40 20.1
Credit Suisse First Boston 64 20.1
Wachovia Capital Markets LLC 24 19.8
Deutsche Bank Securities 33 19.2
Merrill Lynch & Co 85 18.9
SG Cowen Securities Corp 24 18.7
Citigroup Global Markets Inc 79 18.3
Lehman Brothers 67 17.6
Bear, Stearns & Co 23 14.5
UBS Securities Inc 68 11.5
Source: Dealogic
1 IPOs and secondaries only, excludes closed end funds; Credit to book-running managers; Market prices through 12/31/04
2 More than 75 deals
3 More than 45 deals
4 More than 15 deals
PAST PERFORMANCE IS NO GUARANTEE OF FUTURE RESULTS
Investor Presentation February 2005 Page 12
FRIEDMAN BILLINGS RAMSEY ®
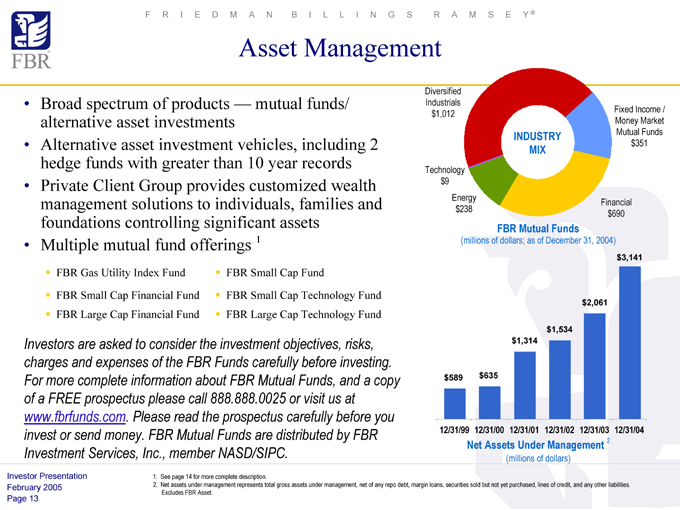
Asset Management
Broad spectrum of products — mutual funds/ alternative asset investments Alternative asset investment vehicles, including 2 hedge funds with greater than 10 year records Private Client Group provides customized wealth management solutions to individuals, families and foundations controlling significant assets Multiple mutual fund offerings 1
FBR Gas Utility Index Fund FBR Small Cap Financial Fund FBR Large Cap Financial Fund
FBR Small Cap Fund
FBR Small Cap Technology Fund FBR Large Cap Technology Fund
Investors are asked to consider the investment objectives, risks, charges and expenses of the FBR Funds carefully before investing. For more complete information about FBR Mutual Funds, and a copy of a FREE prospectus please call 888.888.0025 or visit us at www.fbrfunds.com. Please read the prospectus carefully before you invest or send money. FBR Mutual Funds are distributed by FBR Investment Services, Inc., member NASD/SIPC.
Diversified Industrials $1,012
Technology $9
Energy $238
INDUSTRY
MIX
Financial $690
Fixed Income / Money Market Mutual Funds $351
FBR Mutual Funds
(millions of dollars; as of December 31, 2004)
$3,141
$2,061
$1,534
$1,314
$589 $635
12/31/99 12/31/00 12/31/01 12/31/02 12/31/03 12/31/04
Net Assets Under Management 2
(millions of dollars)
1. See page 14 for more complete description.
2. Net assets under management represents total gross assets under management, net of any repo debt, margin loans, securities sold but not yet purchased, lines of credit, and any other liabilities. Excludes FBR Asset.
Investor Presentation February 2005 Page 13
FRIEDMAN BILLINGS RAMSEY ®
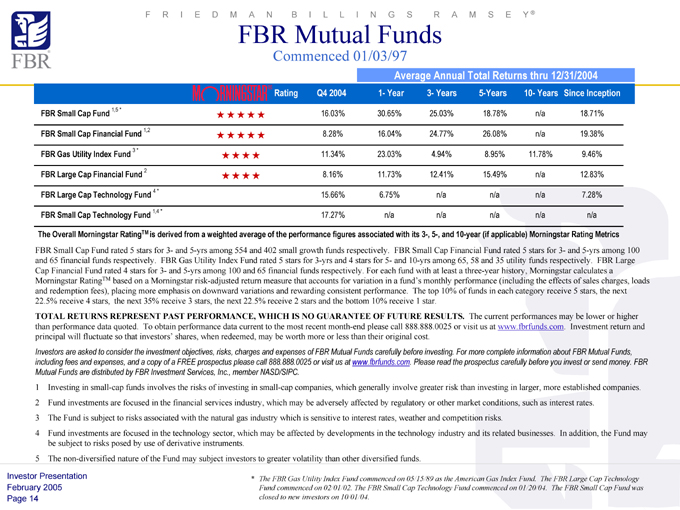
FBR Mutual Funds
Commenced 01/03/97
Average Annual Total Returns thru 12/31/2004
Rating Q4 2004 1- Year 3- Years 5-Years 10- Years Since Inception
FBR Small Cap Fund 1,5 * 16.03% 30.65% 25.03% 18.78% n/a 18.71%
FBR Small Cap Financial Fund 1,2 8.28% 16.04% 24.77% 26.08% n/a 19.38%
FBR Gas Utility Index Fund 3 * 11.34% 23.03% 4.94% 8.95% 11.78% 9.46%
FBR Large Cap Financial Fund 2 8.16% 11.73% 12.41% 15.49% n/a 12.83%
FBR Large Cap Technology Fund 4 * 15.66% 6.75% n/a n/a n/a 7.28%
FBR Small Cap Technology Fund 1,4 * 17.27% n/a n/a n/a n/a n/a
The Overall Morningstar RatingTM is derived from a weighted average of the performance figures associated with its 3-, 5-, and 10-year (if applicable) Morningstar Rating Metrics
FBR Small Cap Fund rated 5 stars for 3- and 5-yrs among 554 and 402 small growth funds respectively. FBR Small Cap Financial Fund rated 5 stars for 3- and 5-yrs among 100 and 65 financial funds respectively. FBR Gas Utility Index Fund rated 5 stars for 3-yrs and 4 stars for 5- and 10-yrs among 65, 58 and 35 utility funds respectively. FBR Large Cap Financial Fund rated 4 stars for 3- and 5-yrs among 100 and 65 financial funds respectively. For each fund with at least a three-year history, Morningstar calculates a Morningstar RatingTM based on a Morningstar risk-adjusted return measure that accounts for variation in a fund’s monthly performance (including the effects of sales charges, loads and redemption fees), placing more emphasis on downward variations and rewarding consistent performance. The top 10% of funds in each category receive 5 stars, the next 22.5% receive 4 stars, the next 35% receive 3 stars, the next 22.5% receive 2 stars and the bottom 10% receive 1 star.
TOTAL RETURNS REPRESENT PAST PERFORMANCE, WHICH IS NO GUARANTEE OF FUTURE RESULTS. The current performances may be lower or higher than performance data quoted. To obtain performance data current to the most recent month-end please call 888.888.0025 or visit us at www.fbrfunds.com. Investment return and principal will fluctuate so that investors’ shares, when redeemed, may be worth more or less than their original cost.
Investors are asked to consider the investment objectives, risks, charges and expenses of FBR Mutual Funds carefully before investing. For more complete information about FBR Mutual Funds, including fees and expenses, and a copy of a FREE prospectus please call 888.888.0025 or visit us at www.fbrfunds.com. Please read the prospectus carefully before you invest or send money. FBR Mutual Funds are distributed by FBR Investment Services, Inc., member NASD/SIPC.
1 Investing in small-cap funds involves the risks of investing in small-cap companies, which generally involve greater risk than investing in larger, more established companies.
2 Fund investments are focused in the financial services industry, which may be adversely affected by regulatory or other market conditions, such as interest rates.
3 The Fund is subject to risks associated with the natural gas industry which is sensitive to interest rates, weather and competition risks.
4 Fund investments are focused in the technology sector, which may be affected by developments in the technology industry and its related businesses. In addition, the Fund may be subject to risks posed by use of derivative instruments.
5 The non-diversified nature of the Fund may subject investors to greater volatility than other diversified funds.
* The FBR Gas Utility Index Fund commenced on 05/15/89 as the American Gas Index Fund. The FBR Large Cap Technology Fund commenced on 02/01/02. The FBR Small Cap Technology Fund commenced on 01/20/04. The FBR Small Cap Fund was closed to new investors on 10/01/04.
Investor Presentation February 2005 Page 14
FRIEDMAN BILLINGS RAMSEY B ®
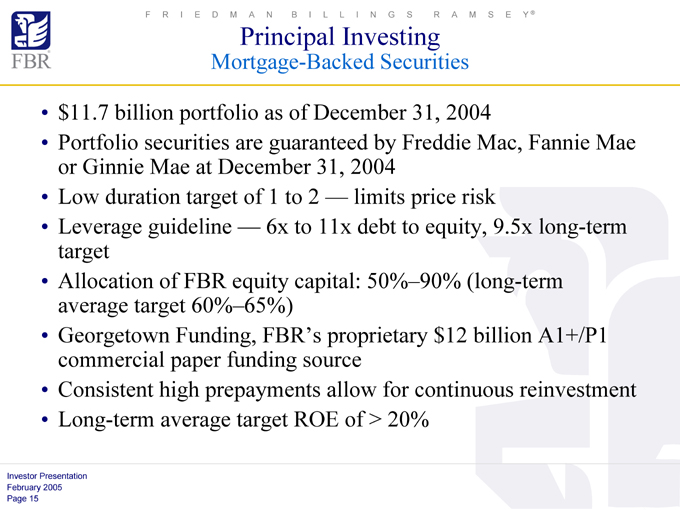
Principal Investing
Mortgage-Backed Securities $11.7 billion portfolio as of December 31, 2004
Portfolio securities are guaranteed by Freddie Mac, Fannie Mae or Ginnie Mae at December 31, 2004 Low duration target of 1 to 2 — limits price risk Leverage guideline — 6x to 11x debt to equity, 9.5x long-term target Allocation of FBR equity capital: 50%–90% (long-term average target 60%–65%) Georgetown Funding, FBR’s proprietary $12 billion A1+/P1 commercial paper funding source Consistent high prepayments allow for continuous reinvestment Long-term average target ROE of > 20%
Investor Presentation February 2005 Page 15
FRIEDMAN BILLINGS RAMSEY ®
Principal Investing
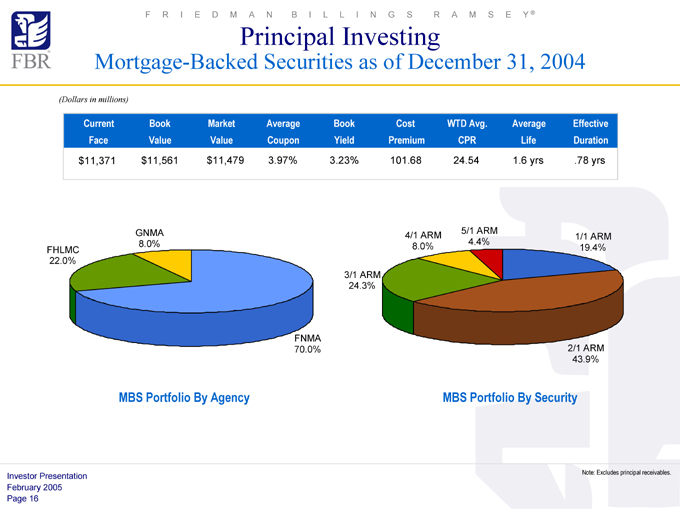
Mortgage-Backed Securities as of December 31, 2004
(Dollars in millions)
Current Book Market Average Book Cost WTD Avg. Average Effective
Face Value Value Coupon Yield Premium CPR Life Duration
$11,371 $11,561 $11,479 3.97% 3.23% 101.68 24.54 1.6 yrs .78 yrs
FHLMC 22.0%
GNMA 8.0%
FNMA 70.0%
MBS Portfolio By Agency
3/1 ARM 24.3%
4/1 ARM
8.0%
5/1 ARM
4.4%
1/1 ARM 19.4%
2/1 ARM 43.9%
MBS Portfolio By Security
Note: Excludes principal receivables.
Investor Presentation February 2005 Page 16
FRIEDMAN BILLINGS RAMSEY ®
Principal Investing
Merchant Banking
All investment decisions driven by fundamental valuation approach Proprietary deal flow through FBR & Co., Inc.
Independent due diligence and investment committee process Deep industry knowledge allows for expedited execution and innovative structures enhance potential for premium returns Investment banking experience improves accuracy of our predicted liquidity outcomes Portfolio of 15 investments funded with FBR Group equity Allocation of 10%–30% of FBR’s equity IRR of 29% from inception to December 31, 2004
Investor Presentation February 2005 Page 17
FRIEDMAN BILLINGS RAMSEY ®
Principal Investing
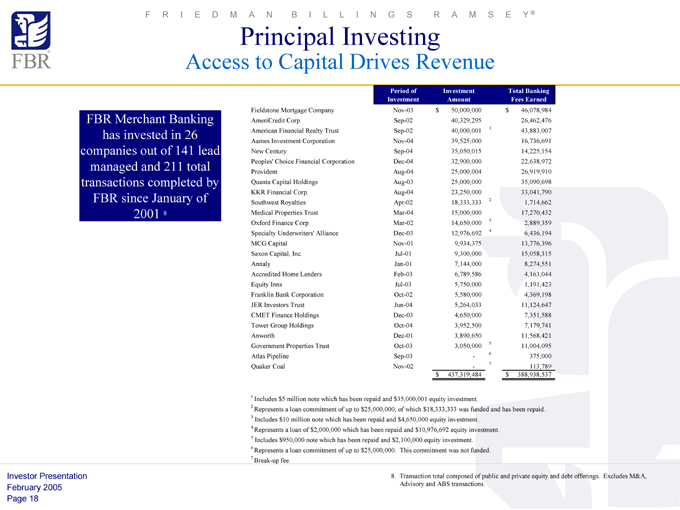
Access to Capital Drives Revenue
FBR Merchant Banking has invested in 26 companies out of 141 lead managed and 211 total transactions completed by FBR since January of 2001 8
Period of Investment Total Banking
Investment Amount Fees Earned
Fieldstone Mortgage Company Nov-03 $50,000,000 $46,078,984
AmeriCredit Corp. Sep-02 40,329,295 26,462,476
American Financial Realty Trust Sep-02 40,000,001 1 43,883,007
Aames Investment Corporation Nov-04 39,525,000 16,736,691
New Century Sep-04 35,050,015 14,225,154
Peoples’ Choice Financial Corporation Dec-04 32,900,000 22,638,972
Provident Aug-04 25,000,004 26,919,910
Quanta Capital Holdings Aug-03 25,000,000 35,090,698
KKR Financial Corp. Aug-04 23,250,000 33,041,790
Southwest Royalties Apr-02 18,333,333 2 1,714,662
Medical Properties Trust Mar-04 15,000,000 17,270,432
Oxford Finance Corp. Mar-02 14,650,000 3 2,889,359
Specialty Underwriters’ Alliance Dec-03 12,976,692 4 6,436,194
MCG Capital Nov-01 9,934,375 13,776,396
Saxon Capital, Inc. Jul-01 9,300,000 15,058,315
Annaly Jan-01 7,144,000 8,274,551
Accredited Home Lenders Feb-03 6,789,586 4,163,044
Equity Inns Jul-03 5,750,000 1,191,423
Franklin Bank Corporation Oct-02 5,580,000 4,369,198
JER Investors Trust Jun-04 5,264,033 11,124,647
CMET Finance Holdings Dec-03 4,650,000 7,351,588
Tower Group Holdings Oct-04 3,952,500 7,179,741
Anworth Dec-01 3,890,650 11,568,421
Government Properties Trust Oct-03 3,050,000 5 11,004,095
Atlas Pipeline Sep-03 - 6 375,000
Quaker Coal Nov-02 - 7 113,789
$437,319,484 $388,938,537
1 Includes $5 million note which has been repaid and $35,000,001 equity investment.
2 Represents a loan commitment of up to $25,000,000, of which $18,333,333 was funded and has been repaid.
3 Includes $10 million note which has been repaid and $4,650,000 equity investment.
4 Represents a loan of $2,000,000 which has been repaid and $10,976,692 equity investment.
5 Includes $950,000 note which has been repaid and $2,100,000 equity investment.
6 Represents a loan commitment of up to $25,000,000. This commitment was not funded. 7 Break-up fee.
8. Transaction total composed of public and private equity and debt offerings. Excludes M&A, Advisory and ABS transactions.
Investor Presentation February 2005 Page 18
FRIEDMAN BILLINGS RAMSEY ®
Principal Investing
Opportunities
Broadened investment in mortgages
Diversify risk (interest vs. credit)
Diversify products (jumbo, non-prime, etc.) Diversify instruments (whole loans, ABS, CMOs)
Expand into value change (originate, aggregate, securitize, service, etc.)
Take further advantage of deal flow by:
Acquiring majority stakes
Originators
Outsourcers (servicers, etc.) Non Mortgage Companies
Energy Real Estate Healthcare Other finance
Investor Presentation February 2005 Page 19
FRIEDMAN BILLINGS RAMSEY ®
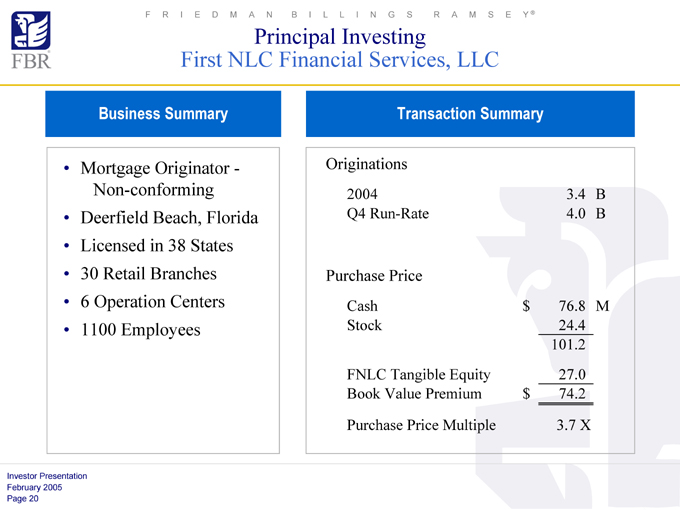
Principal Investing First NLC Financial Services, LLC
Business Summary
Mortgage Originator -Non-conforming Deerfield Beach, Florida Licensed in 38 States 30 Retail Branches 6 Operation Centers 1100 Employees
Transaction Summary
Originations
2004 3.4 B
Q4 Run-Rate 4.0 B
Purchase Price
Cash $76.8 M
Stock 24.4
101.2
FNLC Tangible Equity 27.0
Book Value Premium $74.2
Purchase Price Multiple 3.7 X
Investor Presentation February 2005 Page 20
FRIEDMAN BILLINGS RAMSEY ®
Conclusion
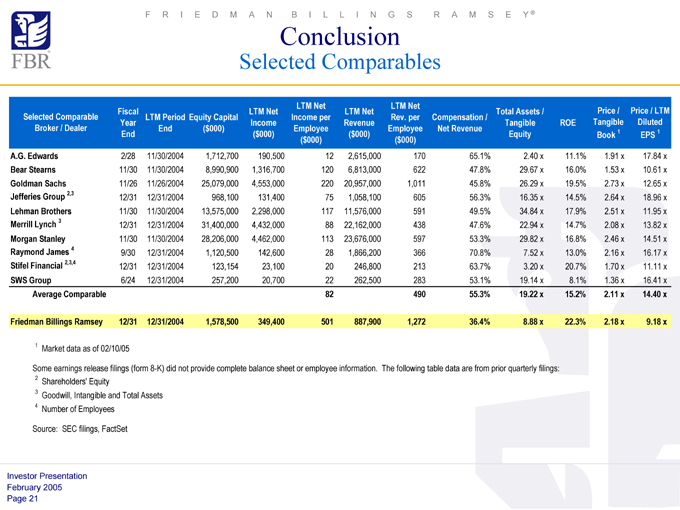
Selected Comparables
LTM Net LTM Net
Fiscal LTM Net LTM Net Total Assets / Price / Price / LTM
Selected Comparable LTM Period Equity Capital Income per Rev. per Compensation /
Year Income Revenue Tangible ROE Tangible Diluted
Broker / Dealer End ($000) Employee Employee Net Revenue
End ($000) ($000) Equity Book 1 EPS 1
($000) ($000)
A.G. Edwards 2/28 11/30/2004 1,712,700 190,500 12 2,615,000 170 65.1% 2.40 x 11.1% 1.91 x 17.84 x
Bear Stearns 11/30 11/30/2004 8,990,900 1,316,700 120 6,813,000 622 47.8% 29.67 x 16.0% 1.53 x 10.61 x
Goldman Sachs 11/26 11/26/2004 25,079,000 4,553,000 220 20,957,000 1,011 45.8% 26.29 x 19.5% 2.73 x 12.65 x
Jefferies Group 2,3 12/31 12/31/2004 968,100 131,400 75 1,058,100 605 56.3% 16.35 x 14.5% 2.64 x 18.96 x
Lehman Brothers 11/30 11/30/2004 13,575,000 2,298,000 117 11,576,000 591 49.5% 34.84 x 17.9% 2.51 x 11.95 x
Merrill Lynch 3 12/31 12/31/2004 31,400,000 4,432,000 88 22,162,000 438 47.6% 22.94 x 14.7% 2.08 x 13.82 x
Morgan Stanley 11/30 11/30/2004 28,206,000 4,462,000 113 23,676,000 597 53.3% 29.82 x 16.8% 2.46 x 14.51 x
Raymond James 4 9/30 12/31/2004 1,120,500 142,600 28 1,866,200 366 70.8% 7.52 x 13.0% 2.16 x 16.17 x
Stifel Financial 2,3,4 12/31 12/31/2004 123,154 23,100 20 246,800 213 63.7% 3.20 x 20.7% 1.70 x 11.11 x
SWS Group 6/24 12/31/2004 257,200 20,700 22 262,500 283 53.1% 19.14 x 8.1% 1.36 x 16.41 x
Average Comparable 82 490 55.3% 19.22 x 15.2% 2.11 x 14.40 x
FRIEDMAN BILLINGS RAMSEY 12/31 12/31/2004 1,578,500 349,400 501 887,900 1,272 36.4% 8.88 x 22.3% 2.18 x 9.18 x
1 Market data as of 02/10/05
Some earnings release filings (form 8-K) did not provide complete balance sheet or employee information. The following table data are from prior quarterly filings:
2 Shareholders’ Equity
3 Goodwill, Intangible and Total Assets
4 Number of Employees Source: SEC filings, FactSet
Investor Presentation February 2005 Page 21
FRIEDMAN BILLINGS RAMSEY ®
Conclusion
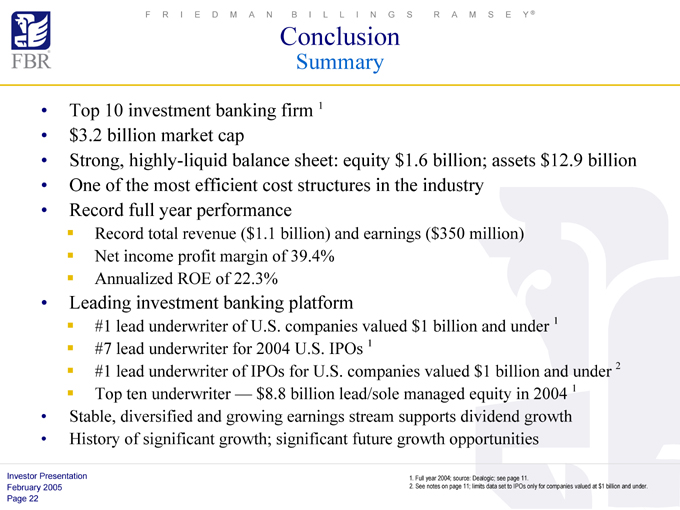
Summary
Top 10 investment banking firm 1 $3.2 billion market cap
Strong, highly-liquid balance sheet: equity $1.6 billion; assets $12.9 billion One of the most efficient cost structures in the industry Record full year performance
Record total revenue ($1.1 billion) and earnings ($350 million) Net income profit margin of 39.4% Annualized ROE of 22.3%
Leading investment banking platform
#1 lead underwriter of U.S. companies valued $1 billion and under 1 #7 lead underwriter for 2004 U.S. IPOs 1
#1 lead underwriter of IPOs for U.S. companies valued $1 billion and under 2 Top ten underwriter — $8.8 billion lead/sole managed equity in 2004 1
Stable, diversified and growing earnings stream supports dividend growth History of significant growth; significant future growth opportunities
1. Full year 2004; source: Dealogic; see page 11.
2. See notes on page 11; limits data set to IPOs only for companies valued at $1 billion and under.
Investor Presentation February 2005 Page 22
FRIEDMAN BILLINGS RAMSEY
FRIEDMAN BILLINGS RAMSEY Group, Inc. Metropolitan Washington, D.C. Headquarters
1001 Nineteenth Street North Arlington, Virginia 22209 Tel: 703.312.9500 Fax: 703.312.9501 www.fbr.com
Bethesda
4922 Fairmont Avenue Bethesda, Maryland 20814 301.657.1500
Boston
100 Federal Street 29th Floor
Boston, Massachusetts 02110 617.757.2900
Chicago
200 South Wacker Drive 31st Floor Chicago, Illinois 60606 312.674.4635
Cleveland
3201 Enterprise Parkway Suite 320 Cleveland, Ohio 44122 216.593.7000
Dallas
2100 McKinney Avenue Suite 1940 Dallas, Texas 75201 469.341.1200
Denver
1200 17th Street Suite 550 Denver, Colorado 80202 720.946.6000
Houston
600 Travis Street Suite 6070 Houston, Texas 77002 713.343.1000
Irvine (Los Angeles)
18101 Von Karman Avenue Suite 1000 Irvine, California 92612 949.477.3100
New York
299 Park Avenue
New York, New York 10171 212.457.3300
Phoenix
Camelback Esplanade V Suite 180 Phoenix, Arizona 85016 602.794.3700
Portland
208 SW First Avenue Suite 300 Portland, Oregon 97204 503.221.0200
San Francisco
4 Embarcadero Center Suite1950
San Francisco, California 94111 415.248.2900
Seattle
111 Third Avenue Suite 2400
Seattle, Washington 98101 206.382.9191
London, UK
9-11 Grosvenor Gardens London SW1W OBD 011.44.20.7663.9100
Vienna, Austria
Millenium Tower, 23rd floor Handelskai 94-96 A-1201 Vienna 011.43.12.402.7250
NOTE: Not all services are available from all offices.