 CAPITAL FOR YOUR CONQUEST 2005 N O V E M B E R CORPORATE PRESENTATION All information as of September 30, 2005 unless indicated. Friedman, Billings, Ramsey Group, Inc. November 1, 2005 Exhibit 99.1 |
 Corporate Presentation November 2005 Page 1 This document is intended solely for the use of the party to whom FBR has provided it, and is not to be reprinted or redistributed without the permission of FBR. All references to “FBR” refer to Friedman, Billings, Ramsey Group, Inc., and its predecessors and subsidiaries as appropriate. Investment banking, sales, trading, and research services¹ are provided by Friedman, Billings, Ramsey & Co., Inc. (FBR & Co.), except for those online offering, mutual fund distribution and discount brokerage services provided by FBR Investment Services, Inc. (FBRIS), and those services in the U.K., Europe and elsewhere outside the United States and Canada provided by Friedman, Billings, Ramsey International, Ltd. (FBRIL). FBR & Co. and FBRIS are broker-dealers registered with the SEC and are members of the NASD. FBRIL, based in the U.K, is regulated by the Financial Services Authority. Asset management services, including managed hedge funds, mutual funds, private equity and venture capital funds, are provided by FBR subsidiaries FBR Investment Management, Inc. (FBRIM), FBR Fund Advisers, Inc., and Money Management Advisers, Inc., which are investment advisers registered with the SEC. Trust services, including mutual fund custody and administration, are provided by FBR National Trust Company. Mortgage lending and origination provided by First NLC Financial Services, LLC (FNLC). On March 31, 2003, Friedman, Billings, Ramsey Group, Inc. merged with FBR Asset Investment Corporation (“FBR Asset”), a real estate investment trust (“REIT”) managed by FBR prior to the merger. The merged company, Friedman, Billings, Ramsey Group, Inc. is structured as a REIT for U.S. Federal Income Tax purposes and conducts its brokerage, sales and trading, investment banking, asset management and banking business through taxable REIT subsidiaries. This document is intended for information purposes only, and shall not constitute a solicitation or an offer to buy or sell, any security or services, or an endorsement of any particular investment strategy. For additional important information, please visit our website, www.fbr.com. CAUTIONS ABOUT FORWARD-LOOKING INFORMATION This presentation and the information incorporated by reference in this presentation include forward looking statements within the meaning of Section 27A of the Securities Act of 1933, as amended, and Section 21E of the Securities Exchange Act of 1934, as amended. Some of the forward-looking statements can be identified by the use of forward-looking words such as “believes,” “expects,” “may,” “will,” “should,” “seeks,” “approximately,” “plans,” “estimates” or “anticipates” or the negative of those words or other comparable terminology. Statements concerning projections, future performance developments, events, revenues, expenses, earnings, run rates, and any other guidance on present or future periods constitute forward-looking statements. Such statements include, but are not limited to, those relating to the effects of growth, revenues and earnings, our principal investing activities, levels of assets under management and our current equity capital levels. Forward-looking statements involve risks and uncertainties. You should be aware that a number of important factors could cause our actual results to differ materially from those in the forward-looking statements. These factors include, but are not limited to, the overall environment for interest rates, repayment speeds within the mortgage backed securities market, risk associated with equity investments, the demand for public offerings, activity in the secondary securities markets, competition among financial services firms for business and personnel, the high degree of risk associated with venture capital investments, the effect of demand for public offerings, mutual fund and 401(k) pension plan inflows or outflows in the securities markets, volatility of the securities markets, available technologies, the effect of government regulation and of general economic conditions on our own business and on the business in the industry areas on which we focus, fluctuating quarterly operating results, the availability of capital to us and risks related to online commerce. We will not necessarily update the information presented or incorporated by reference in this presentation if any of these forward looking statements turn out to be inaccurate. Risks affecting our business are described throughout our Form 10-K, especially in the section entitled “Risk Factors.” The entire Form 10-K, including the Consolidated Financial Statements and the notes and any other documents incorporated by reference into the Form 10-K, as well as, the Forms 10-Q and 8-K filed subsequent to the Form 10-K, should be read for a complete understanding of our business and the risks associated with that business. 1. Research is provided by FBR & Co.’s Research department, which is independent from the Investment Banking department of FBR & Co., and has the sole authority to determine which companies receive research coverage and the recommendation contained in the coverage. In the normal course of its business, FBR & Co. seeks to perform investment banking and other fee generating services for companies that are the subject of FBR & Co. research reports. Research analysts are eligible to receive bonus compensation that is based on FBR & Co.’s overall operating revenues, including revenues generated by FBR & Co.’s investment banking department. Specific information is contained in each research report concerning FBR& Co.’s relationship with the company that is the subject of the report. |
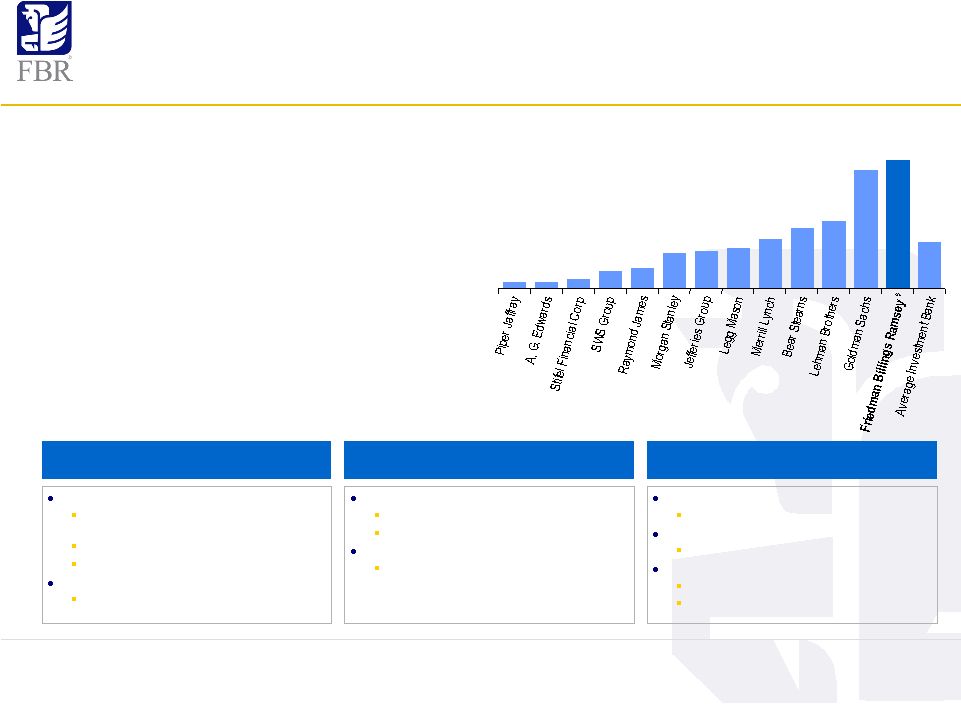 Corporate Presentation November 2005 Page 2 Investment Banking #1 underwriter of common stock for U.S. companies valued $2 billion and under ¹ #1 underwriter of Real Estate IPOs 1 #2 underwriter of Oil & Gas common stock 1 Research and Institutional Brokerage 9 29% compound growth in customer trading volume since 2000 Capital Markets Business Overview • Friedman Billings Ramsey (NYSE: FBR) is a top ten investment banking firm 1 • Most efficient platform among Major Investment Banks as measured by net income per employee 5, 6 • 31% Revenue Compound Annual Growth Rate (CAGR) 1992 through Q3 2005 • Annualized core dividend: $ .80 (yield 8.5%) 2, 3 • Core book value per share: $9.44 2, 4 • Equity: $1.4 billion; Assets: $21.0 billion 2, 4 • Market cap of $1.6 billion 2, 3 • Focused on 8 specific industry sectors 1. Source Dealogic; see page 6. 2. See FBR 2005 Q3 Earnings Release, ex. 99.1. 3. 10/24/05 closing price of $9.36. 4. As of 9/30/05. 5. FBR net income and employees exclude FNLC. 6. Major Investment Banks: Publicly traded U.S. underwriters of public common stock in 2004, classified as Securities Brokers & Dealers (SIC 6211) with greater than $200 million in revenue in their last reported twelve months (ltm). Sources: SEC filings, Capital IQ, Bloomberg, company financials. 7. See pages 12-14. 8. See page 10. 9. Research is provided by FBR & Co.’ s Research department, which is independent from the Investment Banking department of FBR & Co., and has the sole authority to determine which companies receive research coverage and the recommendation contained in the coverage. In the normal course of its business, FBR & Co. seeks to perform investment banking and other fee generating services for companies that are the subject of FBR & Co. research reports. Research analysts are eligible to receive bonus compensation that is based on FBR & Co.’s overall operating revenues, including revenues generated by FBR & Co.’s investment banking department. Specific information is contained in each research report concerning FBR& Co.’s relationship with the company that is the subject of the report. Mortgage Investing Portfolios Mortgage Loans Agency Issued Securities Merchant Banking Investment banking fees associated with portfolio companies have totaled over $450 million since January 1, 2001 8 Principal Investment Mutual Funds Top tier asset management products Private Wealth Management SEC-Registered Investment Adviser Proprietary Managed Funds Hedge Funds Funds of Funds Asset Management 7 Net Income Per Employee 6 (thousands of dollars; ltm as of September 30, 2005) $12 $13 $18 $34 $39 $70 $73 $80 $98 $120 $134 $91 $235 $249 |
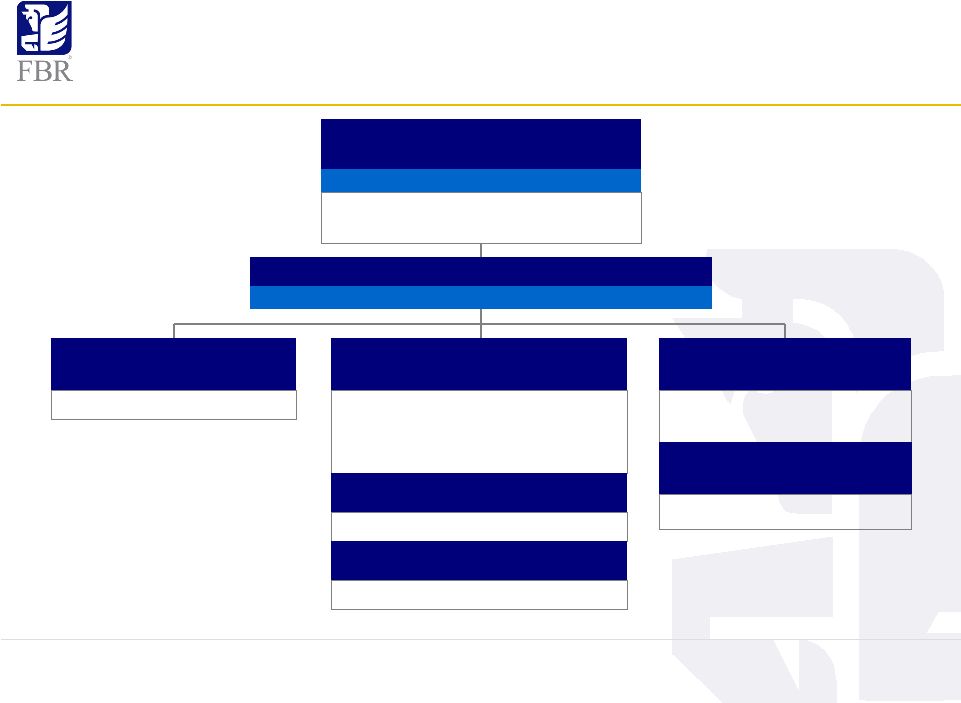 Corporate Presentation November 2005 Page 3 Legal Structure REIT Parent with Full Taxpayer Subsidiaries 1. Research is provided by FBR & Co.’s Research department, which is independent from the Investment Banking department of FBR & Co., and has the sole authority to determine which companies receive research coverage and the recommendation contained in the coverage. In the normal course of its business, FBR & Co. seeks to perform investment banking and other fee generating services for companies that are the subject of FBR & Co. research reports. Research analysts are eligible to receive bonus compensation that is based on FBR & Co.’s overall operating revenues, including revenues generated by FBR & Co.’s investment banking department. Specific information is contained in each research report concerning FBR& Co.’s relationship with the company that is the subject of the report. FBR Taxable REIT Subsidiary (“TRS”) Holdings, Inc. Full Taxpayer Friedman, Billings, Ramsey Group, Inc. (NYSE: FBR) REIT Election Mortgage Portfolios Merchant Banking First NLC Financial Services, LLC Mortgage Origination Friedman, Billings, Ramsey & Co., Inc. Investment Banking Institutional Brokerage Research ¹ Friedman, Billings, Ramsey International, Ltd. European Operations FBR Investment Services, Inc. FBR Direct Online Brokerage FBR Investment Management, Inc. Private Wealth Management Managed Funds FBR Fund Advisers, Inc. Mutual Funds |
 Corporate Presentation November 2005 Page 4 Business Summary 1. See pages 12-14. 2. Headcount numbers approximate as of 9/30/05. 3. See page 9. 4. Source Dealogic; see page 6. 5. Coverage as of 8/5/05. Research is provided by FBR & Co.’s Research department, which is independent from the Investment Banking department of FBR & Co., and has the sole authority to determine which companies receive research coverage and the recommendation contained in the coverage. In the normal course of its business, FBR & Co. seeks to perform investment banking and other fee generating services for companies that are the subject of FBR & Co. research reports. Research analysts are eligible to receive bonus compensation that is based on FBR & Co.’s overall operating revenues, including revenues generated by FBR & Co.’s investment banking department. Specific information is contained in each research report concerning FBR& Co.’s relationship with the company that is the subject of the report. 194 Investment Banking personnel 8 focused industry sectors Consumer Diversified Industrials Energy & Natural Resources Financial Institutions Healthcare Insurance Real Estate Technology, Media & Telecommunications Top 10 lead underwriter through 9/30/05: 4 91 transactions with $32.2B in total transaction value 39 lead and sole- managed public underwritings / private placements 19 M&A and Advisory assignments $15.5B of Asset-Backed Securitizations (ABS) Investment Banking ² 198 Institutional Brokers, Traders and Sales Traders Market-maker in over 585 equity and debt securities Cover over 700 institutional investors 50 Senior Analysts Department total 132 Over 595 companies under coverage Consumer Diversified Industrials Energy & Natural Resources Financial Institutions Healthcare Insurance Real Estate Technology, Media & Telecommunications Fixed-Income and ABS Research Coverage Institutional Brokerage ² Research 5 Sales & Trading Capital Markets Assets of $9.3 billion, as of September 30, 2005 Mortgage-backed securities primarily guaranteed by Freddie Mac, Fannie Mae or Ginnie Mae (GSEs) Portfolio composition 1/1 ARMs through 5/1 Hybrid ARMs 3 Dedicated $12 billion funding source Assets of $7.0 billion held for investment and $1.5 billion held for sale, as of September 30, 2005 Loans acquired through wholly-owned FNLC or from third parties Focus on higher quality non-prime loans Ultimately funded through securitization Mortgage Investing and Origination $361 million long-term investment portfolio as of September 30, 2005 20 Merchant Banking equity investments funded with FBR Group equity as of September 30, 2005 FBR Group potential long- term investments include: Preferred and common equity Senior secured and mezzanine loans Interest in proprietary funds Direct assets Merchant Banking Principal Investing Mortgage Loans Mortgage-Backed Securities Hedge funds Equity mutual funds Fixed income mutual funds Tax-exempt funds Money market funds Private equity funds Venture capital funds Private Wealth Management Open architecture asset allocation and performance reporting Risk-managed portfolio construction Best of breed third party traditional investments Access to FBR proprietary alternative strategies and dealflow Liquidity management 10b5-1 Plans and options / stock sales Restricted stock sales and concentrated strategies Asset Management ¹ |
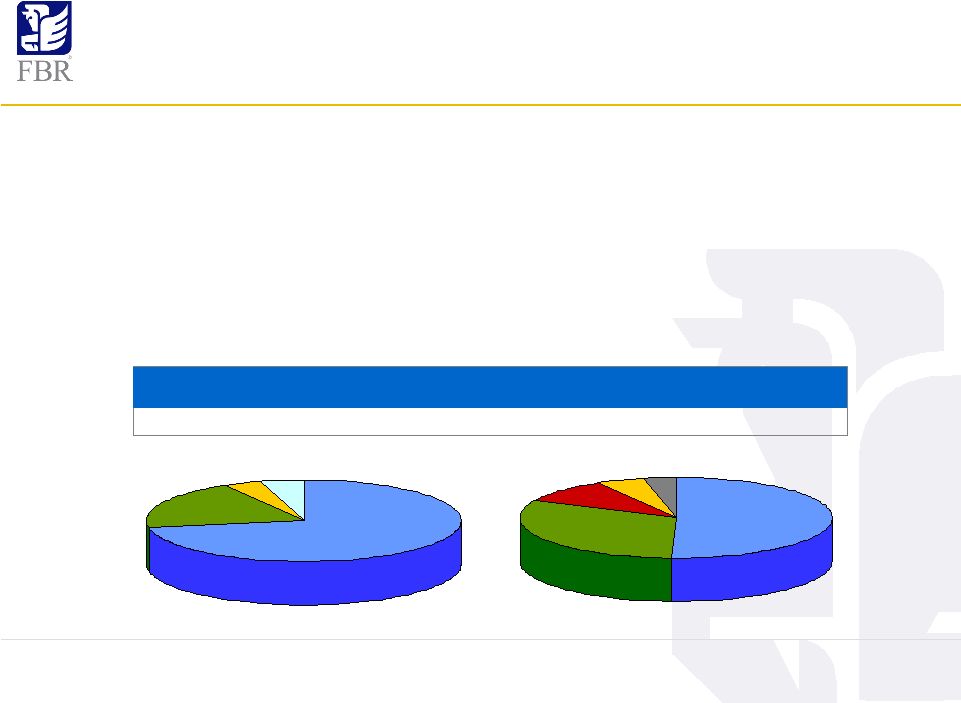
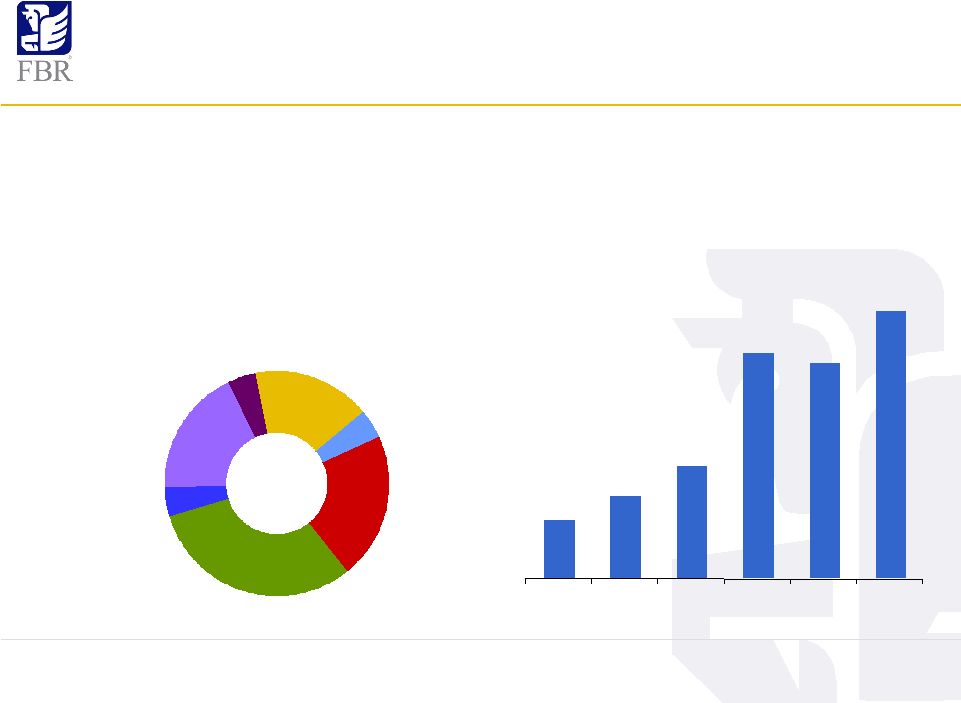 Corporate Presentation November 2005 Page 5 Capital Markets Investment Banking • #1 Book-Running Manager of common stock offerings for U.S. companies valued $2 billion and under ¹ • Concentrated on specific industries where FBR has developed in-depth expertise and relationships • These industries comprised 80% of the equity raised and 87% traded in the U.S. in 2004 • We continue to see new business opportunities 1. Source: Dealogic; see page 6. 2. Excluding asset-backed securities transactions. 3. First three quarters of 2005 Annualized (12-month estimate). Investment Banking Transactions by Industry ² (% to total; through Q3 2005) Lead or Sole-Managed Average Deal Size (millions of dollars) INDUSTRY COMPOSITION Healthcare 4% Financial Institutions 31% Technology, Media & Telecom 17% Real Estate 19% Energy 21% Diversified Industrials 4% Insurance 4% $47.8 $68.5 $92.2 $184.6 $173.2 $219.4 2000 2001 2002 2003 2004 2005-E ³ |
 Corporate Presentation November 2005 Page 6 Investment Banking Rankings First Three Quarters of 2005 Underwriting Note: Apportioned credit to all book-running managers; Issuer nationality as noted; excludes closed-end funds and best efforts. Source: Dealogic. Book-Running Manager # of Deals Amount Raised Friedman Billings Ramsey 21 4,284.1 $ Citigroup 40 4,207.9 Merrill Lynch & Co 40 4,187.1 Morgan Stanley 25 4,052.9 Lehman Brothers 37 3,802.7 JP Morgan 32 3,560.4 Credit Suisse First Boston 30 3,287.3 UBS 33 2,806.0 Goldman Sachs & Co 20 2,472.7 Banc of America Securities 25 1,746.3 Bear Stearns & Co Inc 17 1,576.2 Wachovia Capital Markets LLC 18 1,430.6 US Issuers - All Industries Market Cap $2B & Under 1/1/2005 - 9/30/2005 All Common Stock (IPO, Secondary, Private) Book-Running Manager # of Deals Amount Raised Goldman Sachs & Co 3 1,747.1 $ Friedman Billings Ramsey 4 1,744.3 JP Morgan 7 1,611.6 Citigroup 3 1,414.9 Lehman Brothers 5 480.3 Raymond James 4 404.8 Jefferies & Co Inc 4 377.9 Morgan Stanley 1 326.0 RBC Capital Markets 1 299.8 Bear Stearns & Co Inc 2 269.6 Credit Suisse First Boston 3 216.5 Banc of America Securities 3 138.5 US Issuers - Oil & Gas Industry All Market Caps 1/1/2005 - 9/30/2005 All Common Stock (IPO, Secondary, Private) Book-Running Manager # of Deals Amount Raised Friedman Billings Ramsey 5 962.8 $ JP Morgan 2 324.8 Citigroup 2 306.4 UBS 2 289.8 Credit Suisse First Boston 2 265.0 Wachovia Capital Markets LLC 1 207.0 Lehman Brothers 1 150.0 Bear Stearns & Co Inc 1 150.0 Banc of America Securities 1 124.7 Merrill Lynch & Co 1 115.0 Deutsche Bank 1 115.0 BMO Financial Services 1 43.0 Global Issuers - Real Estate Industry All Market Caps 1/1/2005 - 9/30/2005 IPOs Only |
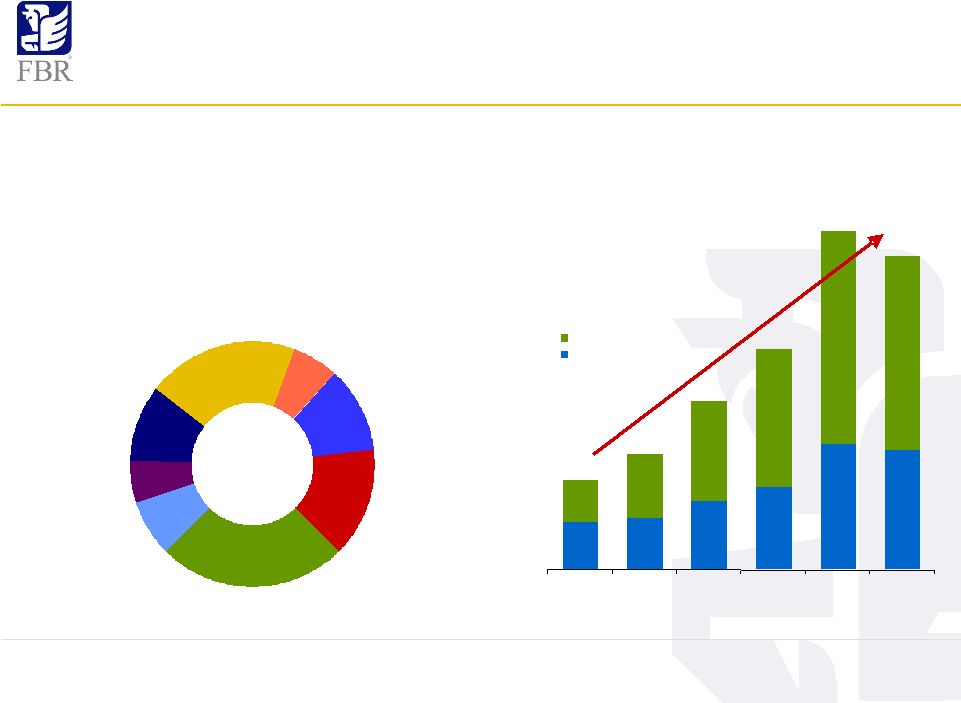 Corporate Presentation November 2005 Page 7 Capital Markets Research and Institutional Brokerage • 198 institutional brokers, traders and sales traders; 50 senior analysts • Understanding of investment philosophy leads to powerful distribution platform • 29% volume growth CAGR from 2000 through Q3 2005 • Currently provide research on 39% of S&P 500 by market capitalization • Over 595 companies and 83 fixed-income securities under research coverage 1 • Make markets in more than 585 securities 1. As of 8/5/05. Research is provided by FBR & Co.’s Research department, which is independent from the Investment Banking department of FBR & Co., and has the sole authority to determine which companies receive research coverage and the recommendation contained in the coverage. In the normal course of its business, FBR & Co. seeks to perform investment banking and other fee generating services for companies that are the subject of FBR & Co. research reports. Research analysts are eligible to receive bonus compensation that is based on FBR & Co.’s overall operating revenues, including revenues generated by FBR & Co.’s investment banking department. Specific information is contained in each research report concerning FBR& Co.’s relationship with the company that is the subject of the report. 2. Q3 2005 Annualized (12-month estimate); Q3 2005 Actuals: Listed – 985, OTC - 602. Research Coverage: All Companies ¹ (number of companies; as of August 2005) Customer Trading Volumes (millions of shares) Diversified Industrials 11% Energy 15% Financial Institutions 23% Consumer 5% Technology, Media & Telecom 22% Real Estate 11% Insurance 6% Healthcare 7% INDUSTRY COVERAGE 320 351 554 850 803 284 428 673 932 1,436 1,313 352 2000 2001 2002 2003 2004 2005-E ² Listed OTC CAGR 28.5% 604 780 1,135 1,486 2,286 2,116 68 87 149 46 33 59 120 36 |
 Corporate Presentation November 2005 Page 8 Principal Investing Non-Conforming Mortgage Loans • Portfolio run in conjunction with mortgage-backed securities portfolio • Loans acquired through owned origination platform (First NLC) or purchased from third parties • Current portfolio focus is on non-prime loans with summary characteristics of: Average Fair Isaac FICO score¹ of approximately 625 Average loan to value of approximately 81.5% Approximately 95% of loans become adjustable rate loans after 2 to 3 years • Loans are funded through in-place warehouse lines or Arlington Funding (a proprietary commercial paper conduit) then securitized with permanent funding • Permanent funding reduces mark to market liquidity risk and allows for 20-22x leverage • Loan portfolio target IRR > 25% 1 FICO® risk scores rank-order consumers according to the likelihood that their credit obligations will be paid as expected. Source: Fair Isaac Corporation (www.fairisaac.com). |
 Corporate Presentation November 2005 Page 9 Principal Investing Mortgage-Backed Securities • $9.3 billion portfolio as of September 30, 2005 • Portfolio securities are primarily agency issues guaranteed by Freddie Mac, Fannie Mae or Ginnie Mae • Low duration target of 1 to 2 — limits price risk • Leverage guideline — 6x to 11x debt to equity, 10x to 11x long-term target • Georgetown Funding, FBR’s proprietary $12 billion A1+/P1 commercial paper funding source • Consistent high prepayments allow for continuous reinvestment • Long-term average target ROE of approximately 20% (Dollars in millions) Book Value $9,411 Market Value $9,242 Average Coupon 4.02% Cost Premium 101.55 WTD Avg. CPR 35.59 Average Life 1.45 yrs Current Face $9,268 Effective Duration 1.01 yrs MBS Portfolio by Agency MBS Portfolio by Security 1/1 ARM 50.6% 2/1 ARM 31.5% 3/1 ARM 9.7% 4/1 ARM 4.8% 5/1 ARM 3.4% FNMA 72.1% FHLMC 19.5% GNMA 3.9% AAA 4.5% |
 Corporate Presentation November 2005 Page 10 Principal Investing Merchant Banking • All investment decisions driven by fundamental valuation approach • Proprietary deal flow through FBR & Co., Inc. • Independent due diligence and investment committee process • Deep industry knowledge allows for expedited execution and innovative structures enhance potential for premium returns • Investment banking experience improves accuracy of our predicted liquidity outcomes • Portfolio of 20 investments funded with FBR Group equity FBR Merchant Banking has invested in 32 companies out of 168 lead-managed and 263 total transactions completed by FBR since January of 2001 8 Period of Investment Investment Amount Total Banking Fees Earned Fieldstone Mortgage Company Nov-03 50,000,000 $ 46,078,984 $ AmeriCredit Corp. Sep-02 40,329,295 26,462,476 American Financial Realty Trust Sep-02 40,000,001 1 43,883,007 Aames Investment Corporation Nov-04 39,525,000 16,736,691 New Century Sep-04 35,050,015 14,225,154 Peoples' Choice Financial Corporation Dec-04 32,900,000 22,638,972 Provident Aug-04 25,000,004 26,919,910 Quanta Capital Holdings Aug-03 25,000,000 35,090,698 ECC Capital Corporation Feb-05 24,999,998 21,639,199 KKR Financial Corp. Aug-04 23,250,000 33,041,790 Southwest Royalties Apr-02 18,333,333 2 1,714,662 Medical Properties Trust Mar-04 15,000,000 17,270,432 Oxford Finance Corp. Mar-02 14,650,000 3 2,889,359 Specialty Underwriters' Alliance Dec-03 12,976,692 4 6,436,194 Taberna Realty Finance Trust Apr-05 10,000,000 17,039,510 Vintage Wine Trust Mar-05 9,999,992 11,014,111 MCG Capital Nov-01 9,934,375 13,776,396 Saxon Capital, Inc. Jul-01 9,300,000 15,058,315 Asset Capital Corporation Jun-05 7,499,995 6,149,699 Annaly Jan-01 7,144,000 8,274,551 Accredited Home Lenders Feb-03 6,789,586 4,163,044 Equity Inns Jul-03 5,750,000 1,191,423 Franklin Bank Corporation Oct-02 5,580,000 4,369,198 JER Investors Trust Jun-04 5,264,033 11,124,647 Whittier Energy Corporation Jun-05 5,000,015 2,805,899 Lexington Strategic Asset Corporation Sep-05 4,999,996 3,181,995 CMET Finance Holdings Dec-03 4,650,000 7,351,588 Tower Group Holdings Oct-04 3,952,500 7,179,741 Anworth Dec-01 3,890,650 11,568,421 Government Properties Trust Oct-03 3,050,000 5 11,004,095 Atlas Pipeline Sep-03 - 6 375,000 Quaker Coal Nov-02 - 7 113,789 499,819,480 $ 450,768,949 $ 1 Includes $5 million note which has been repaid and $35,000,001 equity investment. 2 Represents a loan commitment of up to $25,000,000, of which $18,333,333 was funded and has been repaid. 3 Includes $10 million note which has been repaid and $4,650,000 equity investment. 4 Represents a loan of $2,000,000 which has been repaid and $10,976,692 equity investment. 5 Includes $950,000 note which has been repaid and $2,100,000 equity investment. 6 Represents a loan commitment of up to $25,000,000. This commitment was not funded. 7 Break-up fee. 8 Transaction total composed of public and private equity and debt offerings. Excludes M& A, Advisory and ABS transactions. As of September 30, 2005. |
 Corporate Presentation November 2005 Page 11 • Non-prime residential mortgage lending with nationwide origination • Loan products with flexibility on a broad array of attributes: maturity, documentation, rate type and credit quality Principal Investing First NLC Financial Services, LLC Operational Profile • Headquartered in Deerfield Beach, FL • Licensed in 41 States • 41 Retail Branches • 6 Operation Centers • Approximately 1,700 Employees See statement concerning Forward Looking Information on page 1. Originations ($ in billions): 2004 $ 3.4 Q3 2005 Run-Rate $ 7.0 Corporate Contribution ($ in millions): Revenue $ 28.1 Pre-Tax Income $ 2.1 2005 Q3 Performance ¹ |
 Corporate Presentation November 2005 Page 12 Asset Management Products and Services Managed Funds 5 Hedge Funds • FBR Ashton Income Fund, LLC • FBR Life Sciences Fund, LLC • FBR Life Sciences, Ltd • FBR Weston, LP Funds of Funds • FBR Pegasus Fund of Funds, LLC • FBR Pegasus Fund of Funds, Ltd • FBR Multi-Strategy Fund, LLC Private Wealth Advisory Services • Open architecture asset allocation • Risk-managed portfolio construction • Best of breed third party traditional investments • Access to FBR proprietary alternative strategies • Access to FBR Syndicate dealflow • Open architecture performance reporting • Tax and legal advisory “quarterbacking” • Liquidity management • Concentrated stock strategies • 10b5-1 Plans and options / stock sales • Restricted stock sales Private Wealth Management The FBR Funds ¹ (Mutual Funds) Equity funds (see next page) • FBR Small Cap Financial Fund • FBR Large Cap Financial Fund • FBR Small Cap Fund 2 • FBR Gas Utility Index Fund • FBR Small Cap Technology Fund • FBR Large Cap Technology Fund Fixed income and money market funds • FBR Fund for Government Investors ³ • FBR Maryland Tax-Free Portfolio 4 • FBR Virginia Tax-Free Portfolio 4 5. Managed Funds currently offered through FBR Investment Management, Inc. 1. Investors are asked to consider the investment objectives, risks, charges and expenses of the FBR Funds carefully before investing. For more complete information about FBR Mutual Funds, including fees and expenses, and a copy of a FREE prospectus please call 888.888.0025 or visit us at www.fbrfunds.com . Please read the prospectus carefully before you invest or send money. FBR Mutual Funds are distributed by FBR Investment Services, Inc., member NASD/SIPC. 2. The FBR Small Cap Fund is closed to NEW investors effective October 1, 2004. 3. Investments in money market funds are not guaranteed by the Federal Deposit Insurance Corporation or any other government agency. Although money market funds seek to preserve the NAV (Net Asset Value) at $1.00 per share, it is possible to lose money by investing in the fund. 4. Some income earned in the tax- free Portfolios may be subject to the Federal Alternative Minimum Tax. Income earned by non-Maryland or non-Virginia residents will be subject to applicable state and local taxes. |
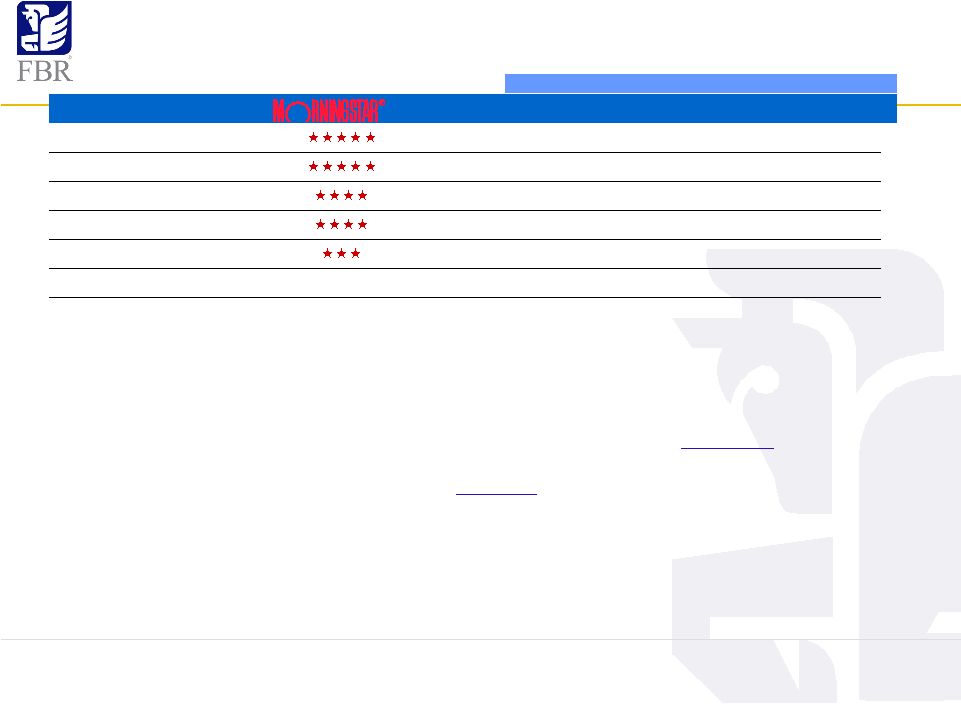 Corporate Presentation November 2005 Page 13 FBR Mutual Funds Commenced 01/03/97 7.57% n/a n/a 29.18% 23.12% 8.01% FBR Large Cap Technology Fund 3, 4 * 1.41% n/a n/a n/a 22.78% 9.40% FBR Small Cap Technology Fund 2, 3, 4 * 11.00% n/a 9.04% 12.69% 2.66% -2.26% FBR Large Cap Financial Fund 1, 3 10.19% 11.66% 4.83% 24.49% 32.77% 6.84% FBR Gas Utility Index Fund 5 * 16.94% n/a 20.35% 18.39% 3.23% -3.31% FBR Small Cap Financial Fund 1, 2, 3 17.03% n/a 18.48% 28.91% 16.50% -2.60% FBR Small Cap Fund 2, 3, 6 Average Annual Total Returns thru 9/30/2005 Since Inception Rating Q3 2005 1- Year 3- Years 5-Years 10- Years The Overall Morningstar Rating™ is based on risk-adjusted returns, derived from a weighted average of the 3-, 5 -, and 10-year (if applicable) Morningstar metrics. * The FBR Gas Utility Index Fund commenced on 05/10/89 as the American Gas Index Fund. The FBR Large Cap Technology Fund commenced on 02/01/02. The FBR Small Cap Technology Fund commenced on 01/20/04. FBR Small Cap Fund rated 5 stars for 3- and 5-yrs among 577 and 421 small growth funds respectively. FBR Small Cap Financial Fund rated 4 stars for 3-yrs and 5 stars for 5-yrs among 103 and 77 financial funds respectively. FBR Large Cap Technology Fund rated 4 stars for 3-yrs among 247 technology funds. FBR Gas Utility Index Fund rated 3 stars for 3- yrs and 4 stars for 5- and 10-yrs among 68, 72 and 38 utility funds respectively. FBR Large Cap Financial Fund rated 2 stars for 3-yrs and 4 stars for 5-yrs among 103 and 77 financial funds respectively. For each fund with at least a three-year history, Morningstar calculates a Morningstar Rating™ based on a Morningstar risk-adjusted return measure that accounts for variation in a fund’s monthly performance (including the effects of sales charges, loads and redemption fees), placing more emphasis on downward variations and rewarding consistent performance. The top 10% of funds in each category receive 5 stars, the next 22.5% receive 4 stars, the next 35% receive 3 stars, the next 22.5% receive 2 stars and the bottom 10% receive 1 star. TOTAL RETURNS REPRESENT PAST PERFORMANCE, WHICH IS NO GUARANTEE OF FUTURE RESULTS. The current performances may be lower or higher than performance data quoted. To obtain performance data current to the most recent month-end please call 888.200.4710 or visit us at www.fbrfunds.com. Investment return and principal will fluctuate so that investors’ shares, when redeemed, may be worth more, or less, than their original value. Investors are asked to consider the investment objectives, risks, charges and expenses of The FBR Funds carefully before investing. For more complete information about The FBR Funds, including fees and expenses, and a copy of a FREE prospectus please call 888.888.0025 or visit us at www.fbrfunds.com. Please read the prospectus carefully before you invest or send money. The FBR Funds are distributed by FBR Investment Services, Inc., member NASD/SIPC. 1 Fund investments are focused in the financial services industry, which may be adversely affected by regulatory or other market conditions, such as rising interest rates. 2 Investing in a small-cap fund involves the risks of investing in small-cap companies, which generally involve greater risk than investing in larger, more established companies. 3 The non-diversified nature of the Fund may subject investors to greater volatility than other diversified funds. 4 Fund investments are focused in the technology sector, which may be affected by developments in the technology industry and its related businesses. In addition, the Fund may be subject to risks posed by use of derivative instruments. 5 The Fund is subject to risks associated with the natural gas industry which is sensitive to interest rates, weather and competition risks. 6 The FBR Small Cap Fund is closed to NEW investors effective October 1, 2004. |
 Corporate Presentation November 2005 Page 14 Asset Management Private Wealth Management • Comprehensive private wealth management services provided to high net worth individuals and families through FBR Investment Management, Inc. (FBRIM), an SEC-registered investment adviser • FBRIM manages approximately $721 million in assets 1 • Private Wealth Management professionals work in defined teams, responding to specific wealth management client needs including: 1. As of 9/30/05. Open architecture performance reporting Tax and legal advisory “quarterbacking” Liquidity management Concentrated stock strategies 10b5-1 Plans and options / stock sales Restricted stock sales Open architecture asset allocation Risk-managed portfolio construction Best of breed third party traditional investments Access to FBR proprietary alternative strategies Access to FBR Syndicate dealflow |
 Corporate Presentation November 2005 Page 15 Five-Year Indexed Total Return 1 FBR vs. Peer Group vs. S&P 500 10/24/2000 - 10/24/2005 0 100 200 300 400 500 10/24/00 10/24/01 10/24/02 10/24/03 10/24/04 10/24/05 Market Return Comparison Notes: 1. Indexed Prices are adjusted for dividends and stock splits (reinvested on ex-date) 2. Peer Group includes Jeffries Group, Bear Stearns, Goldman Sachs, Lehman Brothers and Piper Jaffray Source: FactSet Merger Close Date 3/31/2003 Annualized Total Return Merger 5-Year Close Return Date FBR 11.5% 11.4% Peer Group ² 8.3% 28.1% S&P 500 (1.4%) 16.4% |
 Corporate Presentation November 2005 Page 16 Peer Group Statistical Analysis Highlights • Superior Margins • Lowest Cost Platform • Solid ROAE • Highest Dividend Yield • Compelling Valuation ($ in 000s, Peers ranked by Equity) Broker / Dealer Latest Twelve Months (LTM) Period End Most Recent Quarter (MRQ) Stockholder's Equity LTM Net Income LTM Net Revenue Net Income Growth (YTD04 - YTD05) 1 Net Revenue Growth (YTD04 - YTD05) 1 LTM Profit Margin LTM ROAE Assets / Core Book2 FBR3 30-Sep-05 $1,394,137 $182,581 $731,716 -63.5% -24.3% 25.0% 12.4% 13.1x Goldman Sachs 26-Aug-05 $26,607,000 $5,179,000 $23,077,000 18.6% 15.8% 22.4% 20.7% 25.2x Lehman Brothers 31-Aug-05 16,334,000 2,948,000 13,823,000 37.6% 25.8% 21.3% 19.2% 23.5x Bear Stearns 31-Aug-05 9,881,046 1,382,341 7,352,149 6.8% 10.8% 18.8% 15.4% 28.8x Jefferies Group 30-Sep-05 1,200,000 146,100 1,139,933 15.4% 10.5% 12.8% 13.5% 10.6x Piper Jaffray 30-Sep-05 734,185 35,529 762,664 -38.5% -5.8% 4.7% 4.9% 3.5x Peer Average 8.0% 11.4% 16.0% 14.7% 18.3x Broker / Dealer 10/24/2005 Market Value Price/ Book Price / Core Book2 Price / 2005E EPS Price / 2006E EPS Dividend Yield LTM Net Revenue / Employee LTM Comp & Benefits/ LTM Net Revenue LTM Net Income / Employee FBR $1,590,180 1.1x 1.0x 9.1x 6.7x 8.5% $997 42.0% $249 Goldman Sachs $55,583,552 2.1x 2.1x 11.2x 11.2x 0.8% $1,047 61.1% $235 Lehman Brothers 31,339,988 1.9x 1.9x 10.9x 11.1x 0.7% 628 49.3% 134 Bear Stearns 15,424,236 1.6x 1.6x 10.4x 10.2x 1.0% 639 47.4% 120 Jefferies Group 2,452,264 2.0x 2.0x 18.8x 16.7x 1.2% 570 56.2% 73 Piper Jaffray 680,722 0.9x 0.9x 19.4x 15.7x NA 262 61.1% 12 Peer Average 1.7x 1.7x 14.2x 13.0x 0.9% $629 55.0% $115 Footnotes: 1. YTD = Year To Date 2. Core Book adjusted for accumulated other comprehensive income / loss. 3. FBR income statetement financials exclude FNLC. Sources: Company Reports, Bloomberg (Market Data as of 10/24/2005). |
 Corporate Presentation November 2005 Page 17 FBR at a Glance Performance Summary • Top 10 investment banking firm ¹ • 31% Revenue CAGR 1992 through Q3 2005 • $1.6 billion market cap ² • Strong, highly-liquid balance sheet: Equity $1.4 billion; Assets $21.0 billion • One of the most efficient cost structures in the industry • Leading capital markets platform ¹ #1 lead underwriter of common stock for U.S. companies valued $2 billion and under #9 lead underwriter of common stock for all U.S. companies ³ #1 lead underwriter of IPOs for all Real Estate companies worldwide #2 lead underwriter of common stock for U.S. Oil & Gas companies Top ten underwriter — $5.9 billion lead/sole managed equity through Q3 2005 4 • Diversified mortgage and principal investing activities • Asset management business positioned for growth • Stable and diversified earnings stream supports regular dividends • History of significant growth; significant future growth opportunities 1. Source: Dealogic; see page 6. 2. 10/24/05 closing price of $9.36. 3. Source: Dealogic. Relates to total dollar amount, with over-allotment, of all IPOs, secondary offerings and private placements for all U.S. issuers; priced between 1/1/05 and 9/30/05, with apportioned credit to all book-runners. Excludes closed-end funds and best efforts. 4. Excluding asset-backed securitizations. |
 Metropolitan Washington, D.C. Headquarters 1001 Nineteenth Street North • Arlington, Virginia 22209 Tel: 703.312.9500 • Fax: 703.312.9501 www.fbr.com Phoenix 2555 East Camelback Road Suite 180 Phoenix, Arizona 85016 602.794.3700 San Francisco 4 Embarcadero Center Suite 1950 San Francisco, California 94111 415.248.2900 Seattle Two Union Square 601 Union Street, Suite 4200 Seattle, Washington 98101 206.652.3564 London, UK 8th Floor Berkeley Square House Berkeley Square London WIJ 6DB 011.44.20.7409.5300 Vienna, Austria Millenium Tower, 23rd floor Handelskai 94-96 A-1201 Vienna 011.43.12.402.7250 First NLC Headquarters 700 W. Hillsboro Boulevard Bldg. 1, Suite 204 Deerfield Beach, Florida 33441 954.420.0060 Bethesda 4922 Fairmont Avenue Bethesda, Maryland 20814 301.657.1500 Boston 100 Federal Street, 29th Floor Boston, Massachusetts 02110 617.757.2900 Cleveland 3201 Enterprise Parkway Suite 320 Cleveland, Ohio 44122 216.593.7000 Dallas 2100 McKinney Avenue Suite 1940 Dallas, Texas 75201 469.341.1200 Denver 1200 17th Street, Suite 550 Denver, Colorado 80202 720.946.6010 Houston 600 Travis Street Suite 6070 Houston, Texas 77002 713.343.1000 Irvine (Los Angeles) 18101 Von Karman Avenue Suite 950 Irvine, California 92612 949.477.3100 New York 299 Park Avenue, 7th Floor New York, New York 10171 212.457.3300 Friedman Billings Ramsey Group, Inc. NOTE: Not all services are available from all offices. Does not include FNLC branch offices. |
 2005 N O V E M B E R CAPITAL FOR YOUR CONQUEST ADDENDUM |
 Corporate Presentation November 2005 Page 20 Financial Results Income Statement See statement concerning Forward Looking Information on page 1. (Dollars in 000's) 2005 2004 2005 2004 REVENUES Investment banking 89,061 $ 141,621 $ 278,231 $ 294,722 $ Institutional brokerage 33,696 22,746 84,837 84,388 Asset management 8,746 8,781 25,382 22,921 Principal investment 158,039 112,945 399,350 347,147 Mortgage banking 46,983 - �� 92,633 - Other 3,376 1,827 9,327 4,824 Gross revenues 339,901 287,920 889,760 754,002 Interest expense and loan loss provision 161,263 44,265 340,948 111,188 Revenues, net of interest expense and loan loss provision 178,638 243,655 548,812 642,814 NON-INTEREST EXPENSES Compensation and benefits 88,348 95,824 244,162 228,411 Other expenses 59,155 35,353 177,125 115,307 Total non-interest expenses 147,503 131,177 421,287 343,718 Net income before income taxes 31,135 112,478 127,525 299,096 Income tax provision 8,090 20,329 26,825 36,129 Net income 23,045 92,149 100,700 262,967 Diluted earnings per share 0.14 $ 0.55 $ 0.59 $ 1.56 $ Dividends declared per share 0.34 $ 0.34 $ 1.02 $ 1.14 $ Three Months Ended September 30, Nine Months Ended September 30, |
 Corporate Presentation November 2005 Page 21 Financial Results Balance Sheet See statement concerning Forward Looking Information on page 1. (Dollars in 000s) September 30, June 30, December 31, 2005 2005 2004 ASSETS Cash and cash equivalents 181,534 $ 299,428 $ 224,371 $ Mortgage-backed securities, at fair value 9,268,662 10,622,271 11,726,689 Mortgage loans, net 8,540,692 3,075,753 - Long-term investments 361,131 433,206 441,499 Other investments 1,917,660 732,515 191,119 Intangible assets 188,405 189,551 122,417 Other assets 582,742 304,033 222,193 Total assets 21,040,826 15,656,757 12,928,288 LIABILITIES AND SHAREHOLDERS' EQUITY Liabilities Commercial paper 8,214,835 $ 7,765,230 $ 7,294,949 $ Repurchase agreements 6,853,306 4,923,394 3,467,569 Securitization financing 3,809,901 702,636 - Other liabilities 484,719 523,485 458,876 Long-term debt 283,928 222,991 128,370 Total liabilities 19,646,689 14,137,736 11,349,764 Total shareholders' equity 1,394,137 1,519,021 1,578,524 Total liabilities and shareholders' equity 21,040,826 15,656,757 12,928,288 Book Value Per Share - GAAP 8.21 $ 8.96 $ 9.46 $ Book Value Per Share - Core 9.44 $ 9.62 $ 9.68 $ Shares Outstanding 169,891 169,617 166,932 |
 2005 CAPITAL FOR YOUR CONQUEST N O V E M B E R |