Investor Presentation Second Quarter 2018 Exhibit 99.2
Information Related to Forward-Looking Statements This presentation contains “forward-looking statements” made pursuant to the safe harbor provisions of the Private Securities Litigation Reform Act of 1995, including statements regarding future results or expectations about our investments, interest rates, portfolio allocation, dividends, financing agreements, returns on invested capital, investment strategy, taxes, portfolio, earnings, book value, housing market, compensation, growth in capital, agency MBS spreads, prepayments, hedging instruments, duration, credit performance of private-label MBS, cash flow and benefit of deferred tax asset value. Forward-looking statements can be identified by forward-looking language, including words such as “believes,” “anticipates,” “views,” “expects,” “estimates,” “intends,” “may,” “plans,” “projects,” “potential,” “prospective,” “will” and similar expressions, or the negative of these words. Such forward-looking statements are based on facts and conditions as they exist at the time such statements are made. Forward-looking statements are also based on predictions as to future facts and conditions, the accurate prediction of which may be difficult and involve the assessment of events beyond our control. Forward-looking statements are further based on various operating and return assumptions. Caution must be exercised in relying on forward-looking statements. Due to known and unknown risks, actual results may differ materially from expectations or projections. You should carefully consider these risks when you make a decision concerning an investment in our common stock or senior notes, along with the following factors, among others, that may cause our actual results to differ materially from those described in any forward-looking statements: availability of, and our ability to deploy, capital; growing our business primarily through our current strategy of focusing on acquiring primarily agency mortgage-backed securities (“MBS”); our ability to forecast our tax attributes, which are based upon various facts and assumptions, and our ability to protect and use our net operating losses, and net capital losses to offset future taxable income, including whether our shareholder rights plan will be effective in preventing an ownership change that would significantly limit our ability to utilize such losses; our business, acquisition, leverage, asset allocation, operational, investment, hedging and financing strategies and the success of these strategies; the effect of changes in prepayment rates, interest rates and default rates on our portfolio; the effect of governmental regulation and actions; our ability to roll our repurchase agreements on favorable terms, if at all; our liquidity; our asset valuation policies; our decisions with respect to, and ability to make, future dividends; investing in assets other than MBS or pursuing business activities other than investing in MBS; our ability to maintain our exclusion from the definition of “investment company” under the Investment Company Act of 1940, as amended; our decision to not elect to be taxed as a real estate investment trust under the Internal Revenue Code; competition for investment opportunities, including competition from the U.S. Department of Treasury and the U.S. Federal Reserve, for investments in agency MBS, as well as the timing of the termination by the U.S. Federal Reserve of its purchases of agency MBS; the federal conservatorship of the Federal National Mortgage Association (“Fannie Mae”) and the Federal Home Loan Mortgage Corporation (“Freddie Mac”) and related efforts, along with any changes in laws and regulations affecting the relationship between Fannie Mae and Freddie Mac and the federal government; mortgage loan prepayment activity, modification programs and future legislative action; changes in, and success of, our acquisition, hedging and leverage strategies, changes in our asset allocation and changes in our operational policies, all of which may be changed by us without shareholder approval; failure of sovereign or municipal entities to meet their debt obligations or a downgrade in the credit rating of such debt obligations; fluctuations of the value of our hedge instruments; fluctuating quarterly operating results; changes in laws and regulations and industry practices that may adversely affect our business; volatility of the securities markets and activity in the secondary securities markets in the United States and elsewhere; our ability to successfully expand our business into areas other than investing in MBS; changes in, and our ability to remain in compliance with, law, regulations or governmental policies affecting our business; and the factors described in the sections entitled “Risk Factors” in our most recent Annual Report on Form 10-K, subsequent Quarterly Reports on Form 10-Q and other documents filed by the Company with the SEC from time to time. All forward-looking statements speak only as of the date on which they are made. New risks and uncertainties arise over time, and it is not possible to predict those events or how they may affect us. Except as required by law, the Company is not obligated to, and does not intend to, update or revise any forward-looking statements, whether as a result of new information, future events or otherwise.
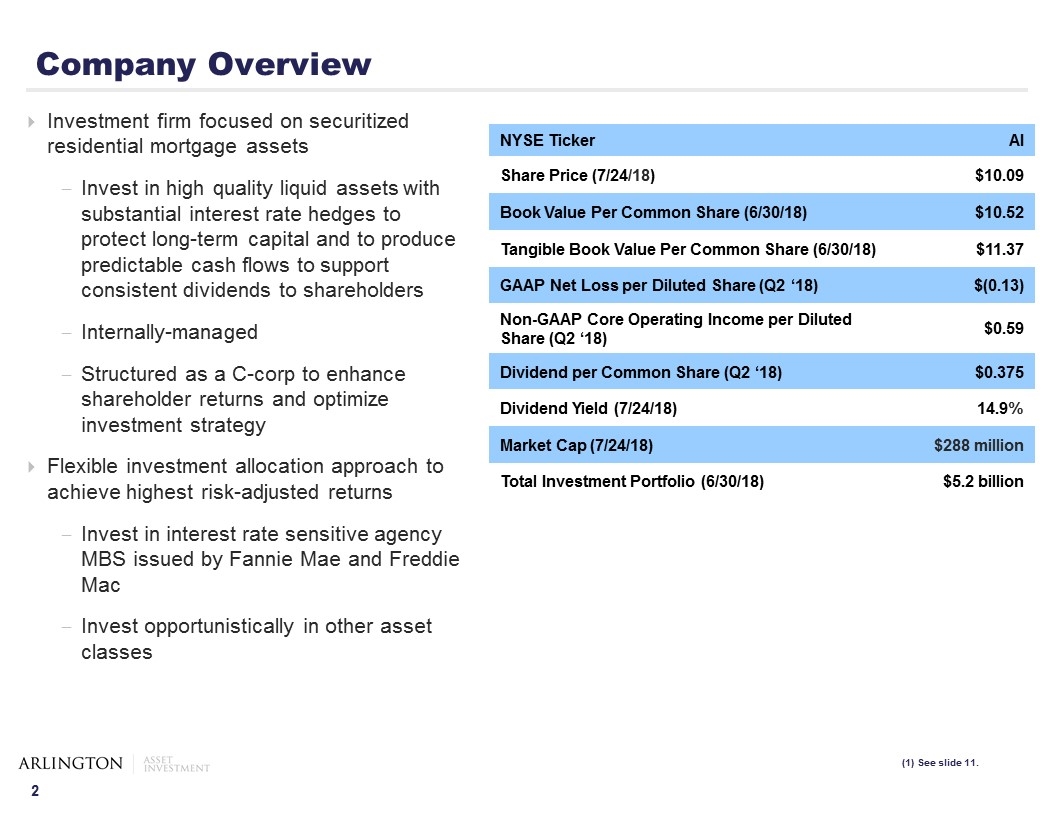
Company Overview Investment firm focused on securitized residential mortgage assets Invest in high quality liquid assets with substantial interest rate hedges to protect long-term capital and to produce predictable cash flows to support consistent dividends to shareholders Internally-managed Structured as a C-corp to enhance shareholder returns and optimize investment strategy Flexible investment allocation approach to achieve highest risk-adjusted returns Invest in interest rate sensitive agency MBS issued by Fannie Mae and Freddie Mac Invest opportunistically in other asset classes NYSE Ticker AI Share Price (7/24/18) $10.09 Book Value Per Common Share (6/30/18) $10.52 Tangible Book Value Per Common Share (6/30/18) $11.37 GAAP Net Loss per Diluted Share (Q2 ‘18) $(0.13) Non-GAAP Core Operating Income per Diluted Share (Q2 ‘18) $0.59 Dividend per Common Share (Q2 ‘18) $0.375 Dividend Yield (7/24/18) 14.9% Market Cap (7/24/18) $288 million Total Investment Portfolio (6/30/18) $5.2 billion (1) See slide 11.
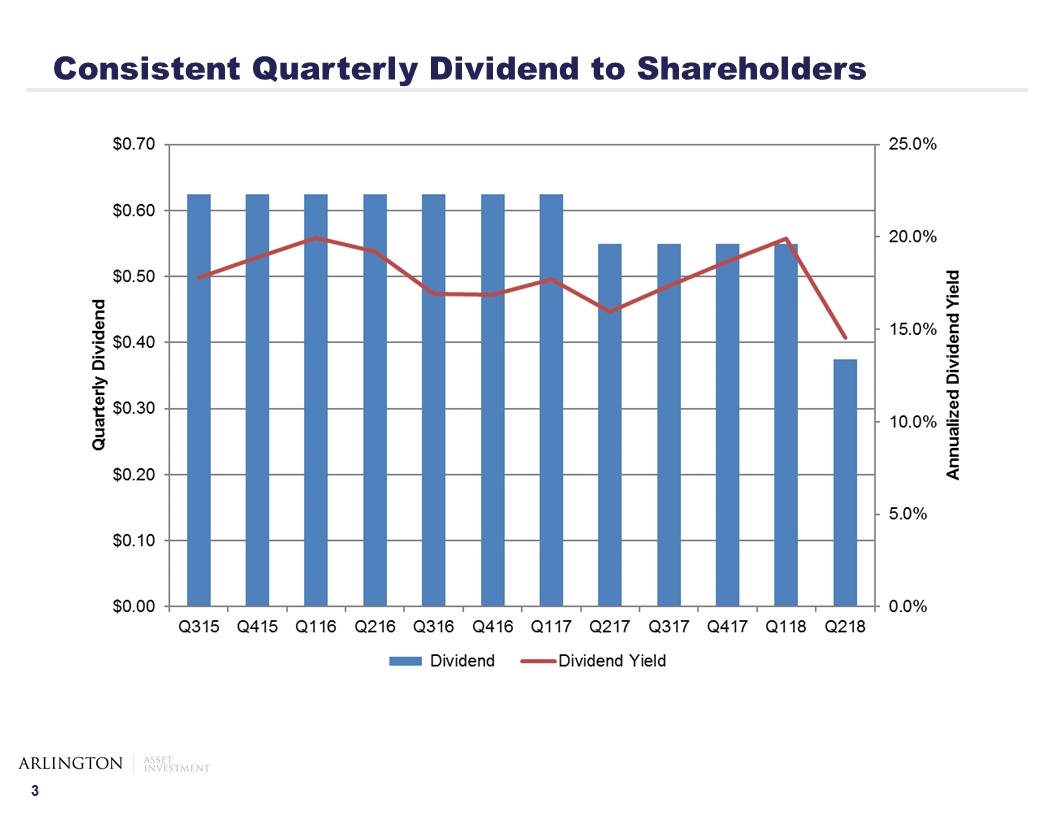
Consistent Quarterly Dividend to Shareholders
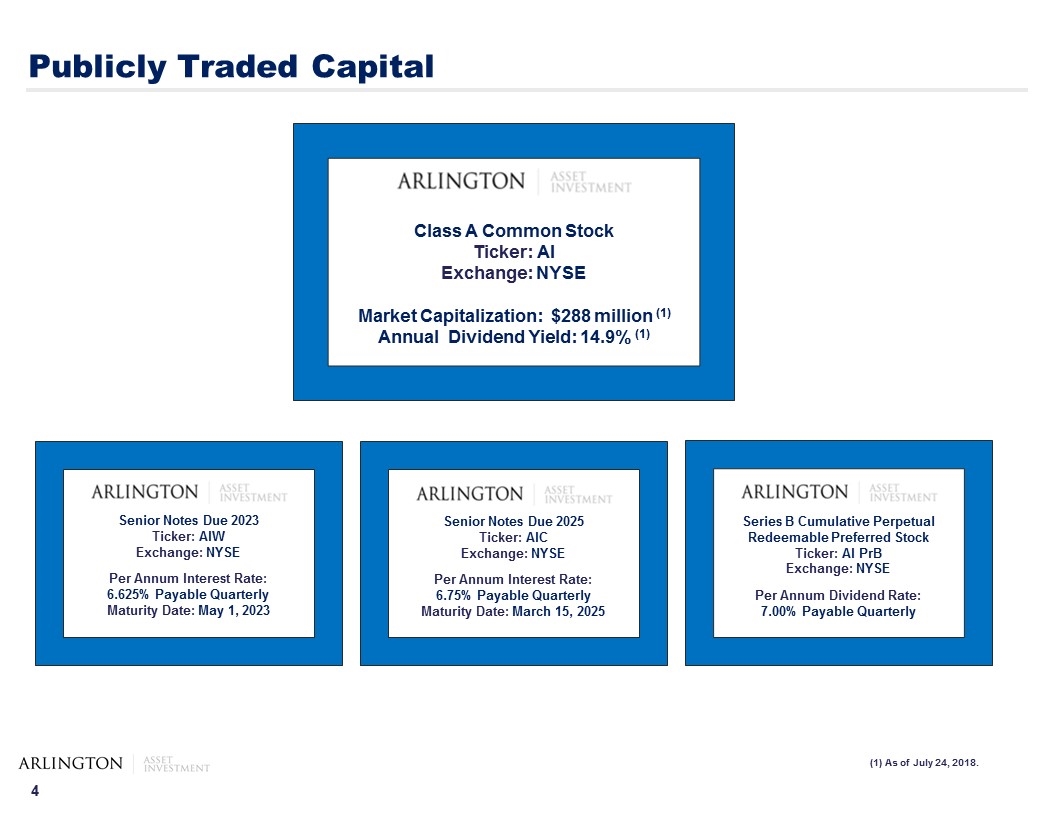
Publicly Traded Capital Class A Common Stock Ticker: AI Exchange: NYSE Market Capitalization: $288 million (1) Annual Dividend Yield: 14.9% (1) Senior Notes Due 2023 Ticker: AIW Exchange: NYSE Per Annum Interest Rate: 6.625% Payable Quarterly Maturity Date: May 1, 2023 Senior Notes Due 2025 Ticker: AIC Exchange: NYSE Per Annum Interest Rate: 6.75% Payable Quarterly Maturity Date: March 15, 2025 Series B Cumulative Perpetual Redeemable Preferred Stock Ticker: AI PrB Exchange: NYSE Per Annum Dividend Rate: 7.00% Payable Quarterly (1) As of July 24, 2018.
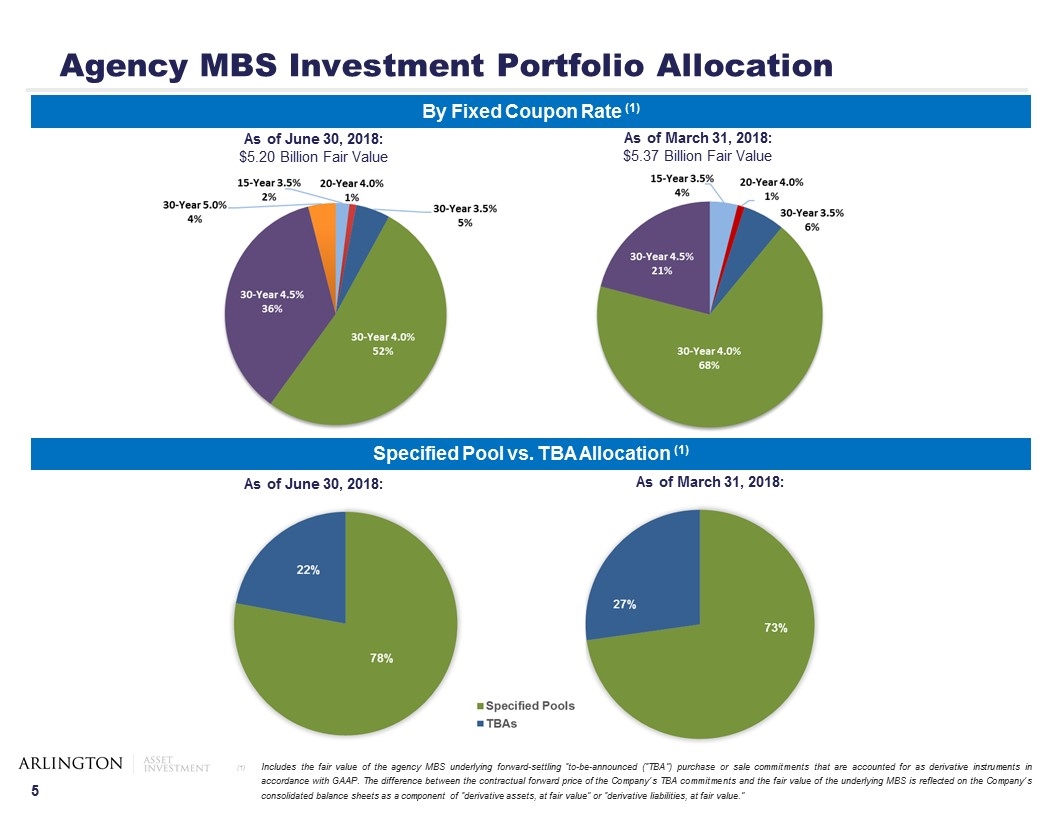
As of June 30, 2018: $5.20 Billion Fair Value As of March 31, 2018: $5.37 Billion Fair Value Agency MBS Investment Portfolio Allocation Specified Pool vs. TBA Allocation (1) Includes the fair value of the agency MBS underlying forward-settling “to-be-announced (“TBA”) purchase or sale commitments that are accounted for as derivative instruments in accordance with GAAP. The difference between the contractual forward price of the Company’s TBA commitments and the fair value of the underlying MBS is reflected on the Company’s consolidated balance sheets as a component of “derivative assets, at fair value” or “derivative liabilities, at fair value.” By Fixed Coupon Rate (1) As of March 31, 2018: As of June 30, 2018:
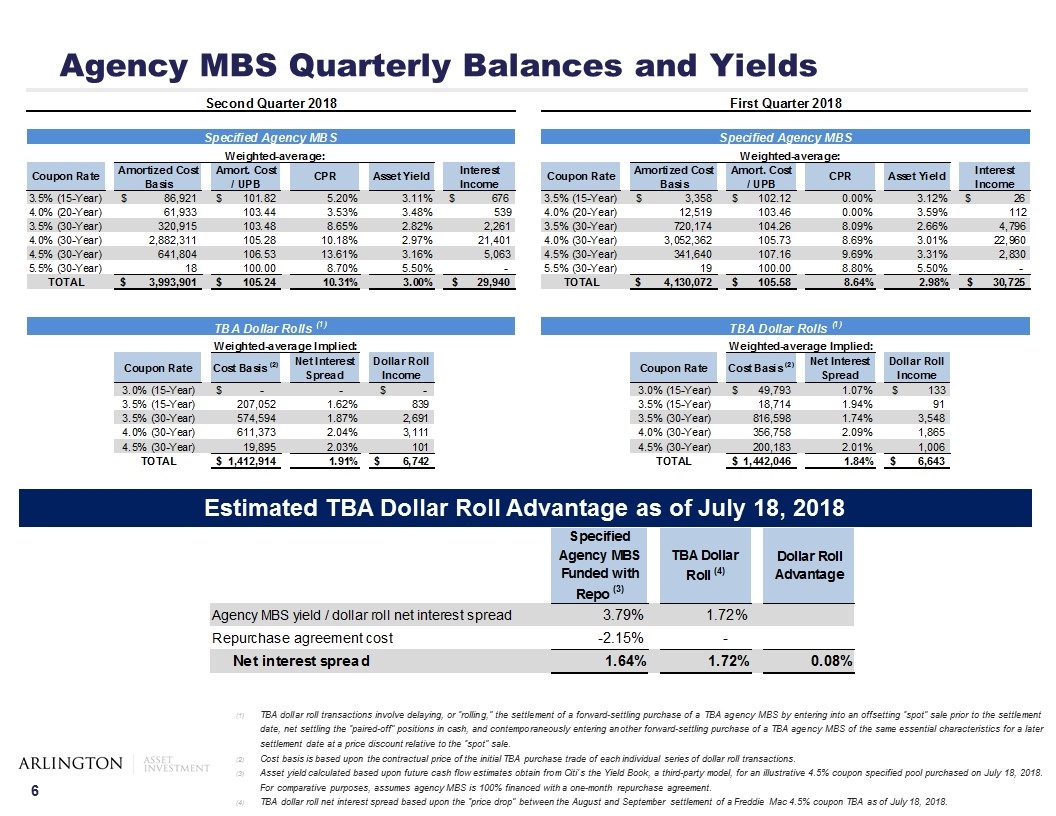
Agency MBS Quarterly Balances and Yields TBA dollar roll transactions involve delaying, or “rolling,” the settlement of a forward-settling purchase of a TBA agency MBS by entering into an offsetting “spot” sale prior to the settlement date, net settling the “paired-off” positions in cash, and contemporaneously entering another forward-settling purchase of a TBA agency MBS of the same essential characteristics for a later settlement date at a price discount relative to the “spot” sale. Cost basis is based upon the contractual price of the initial TBA purchase trade of each individual series of dollar roll transactions. Asset yield calculated based upon future cash flow estimates obtain from Citi’s the Yield Book, a third-party model, for an illustrative 4.5% coupon specified pool purchased on July 18, 2018. For comparative purposes, assumes agency MBS is 100% financed with a one-month repurchase agreement. TBA dollar roll net interest spread based upon the “price drop” between the August and September settlement of a Freddie Mac 4.5% coupon TBA as of July 18, 2018. Estimated TBA Dollar Roll Advantage as of July 18, 2018

Financing Summary 16 counterparties with access to 21 total counterparties Less than 10% of equity at risk with any one counterparty 7.2% of equity at risk with largest counterparty 31.5% of equity at risk with five largest counterparties Favorable repo financing costs Diversified Funding Sources As of June 30, 2018 (dollars in thousands): Spread between average one- and three-month LIBOR increased through the first half of 2018, impacting favorably the Company’s economic financing costs The Company’s repo agreements generally have one-month terms while it receives three-month LIBOR on its interest rate swaps Spread between average one-month LIBOR and the Company’s average repo financing rate remains low relative to recent historical periods
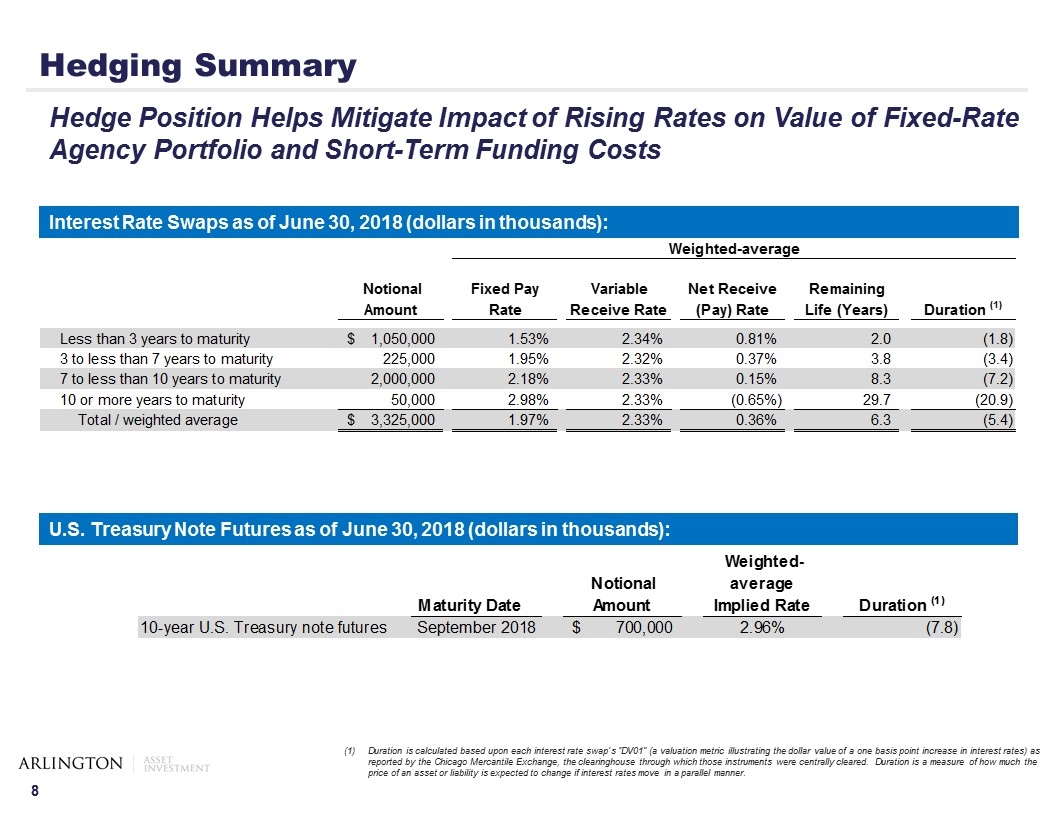
Hedging Summary Hedge Position Helps Mitigate Impact of Rising Rates on Value of Fixed-Rate Agency Portfolio and Short-Term Funding Costs Duration is calculated based upon each interest rate swap’s “DV01” (a valuation metric illustrating the dollar value of a one basis point increase in interest rates) as reported by the Chicago Mercantile Exchange, the clearinghouse through which those instruments were centrally cleared. Duration is a measure of how much the price of an asset or liability is expected to change if interest rates move in a parallel manner. Interest Rate Swaps as of June 30, 2018 (dollars in thousands): U.S. Treasury Note Futures as of June 30, 2018 (dollars in thousands):
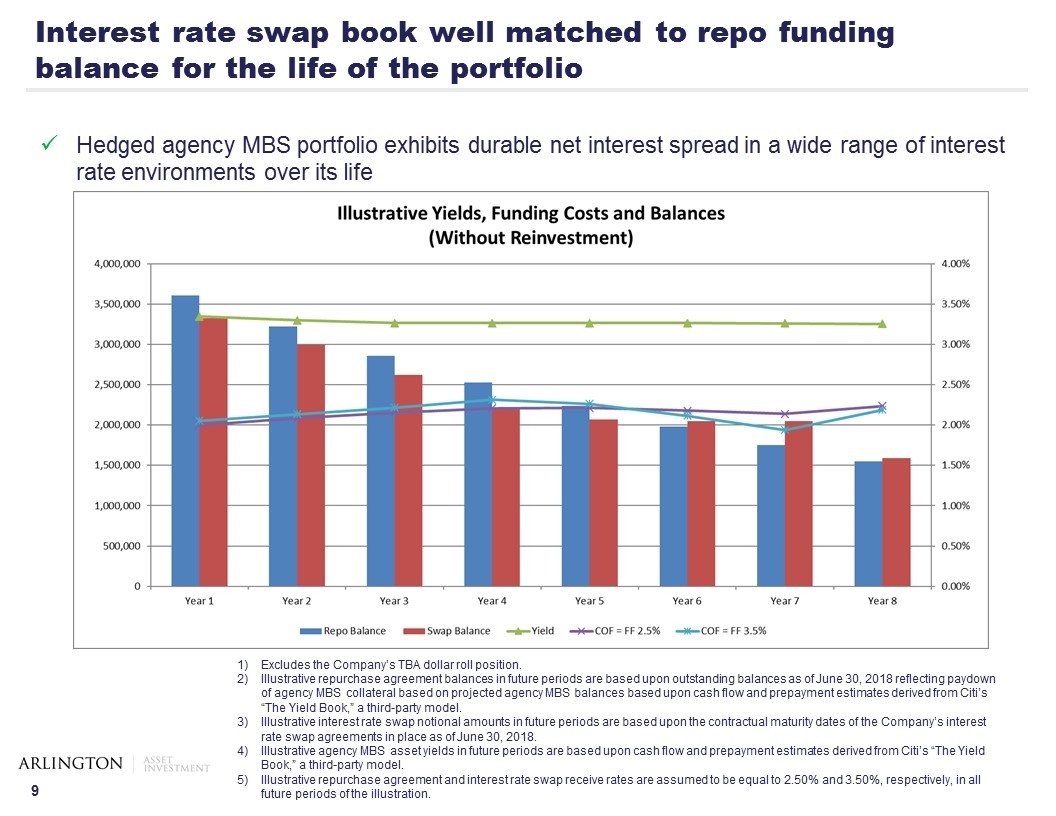
Interest rate swap book well matched to repo funding balance for the life of the portfolio Hedged agency MBS portfolio exhibits durable net interest spread in a wide range of interest rate environments over its life Excludes the Company’s TBA dollar roll position. Illustrative repurchase agreement balances in future periods are based upon outstanding balances as of June 30, 2018 reflecting paydown of agency MBS collateral based on projected agency MBS balances based upon cash flow and prepayment estimates derived from Citi’s “The Yield Book,” a third-party model. Illustrative interest rate swap notional amounts in future periods are based upon the contractual maturity dates of the Company’s interest rate swap agreements in place as of June 30, 2018. Illustrative agency MBS asset yields in future periods are based upon cash flow and prepayment estimates derived from Citi’s “The Yield Book,” a third-party model. Illustrative repurchase agreement and interest rate swap receive rates are assumed to be equal to 2.50% and 3.50%, respectively, in all future periods of the illustration.
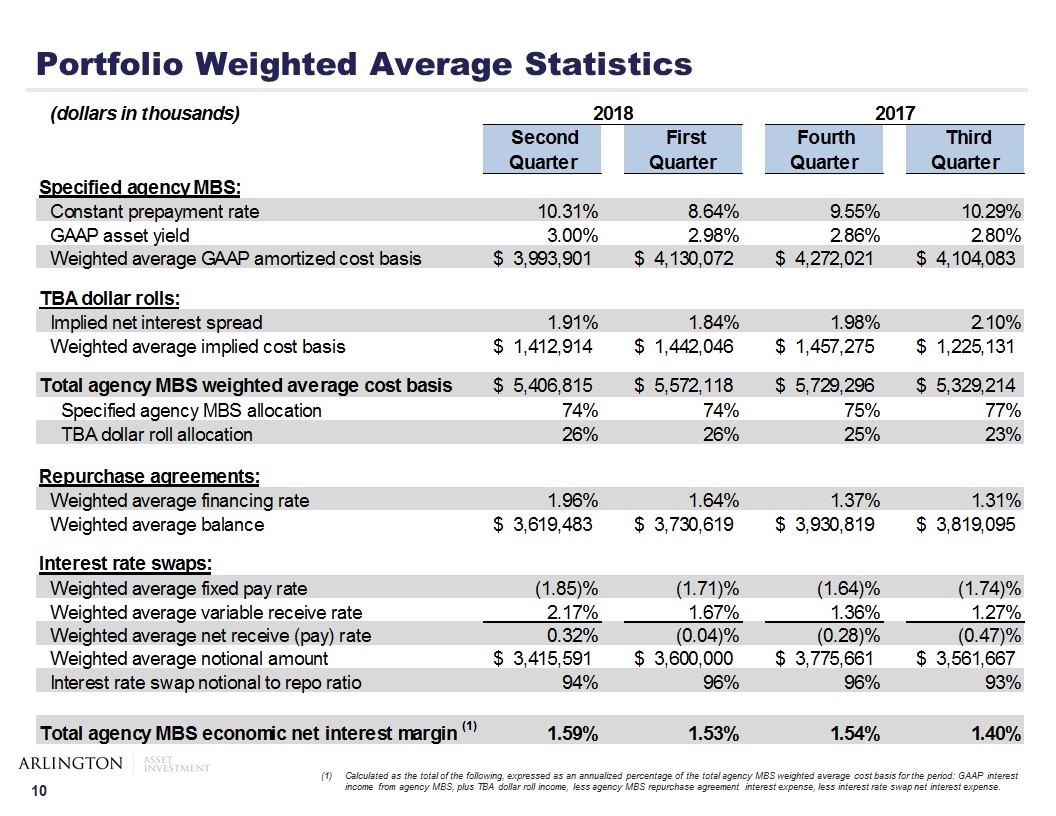
Portfolio Weighted Average Statistics Calculated as the total of the following, expressed as an annualized percentage of the total agency MBS weighted average cost basis for the period: GAAP interest income from agency MBS, plus TBA dollar roll income, less agency MBS repurchase agreement interest expense, less interest rate swap net interest expense.
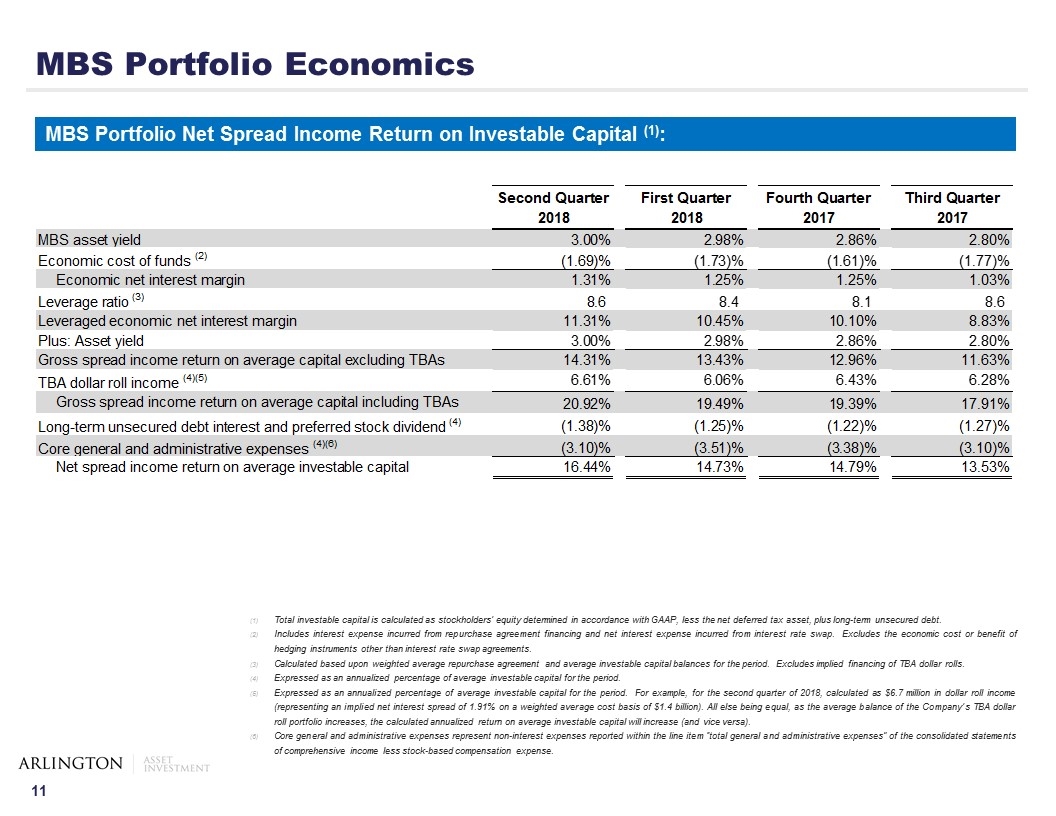
MBS Portfolio Economics MBS Portfolio Net Spread Income Return on Investable Capital (1): Total investable capital is calculated as stockholders’ equity determined in accordance with GAAP, less the net deferred tax asset, plus long-term unsecured debt. Includes interest expense incurred from repurchase agreement financing and net interest expense incurred from interest rate swap. Excludes the economic cost or benefit of hedging instruments other than interest rate swap agreements. Calculated based upon weighted average repurchase agreement and average investable capital balances for the period. Excludes implied financing of TBA dollar rolls. Expressed as an annualized percentage of average investable capital for the period. Expressed as an annualized percentage of average investable capital for the period. For example, for the second quarter of 2018, calculated as $6.7 million in dollar roll income (representing an implied net interest spread of 1.91% on a weighted average cost basis of $1.4 billion). All else being equal, as the average balance of the Company’s TBA dollar roll portfolio increases, the calculated annualized return on average investable capital will increase (and vice versa). Core general and administrative expenses represent non-interest expenses reported within the line item “total general and administrative expenses” of the consolidated statements of comprehensive income less stock-based compensation expense.
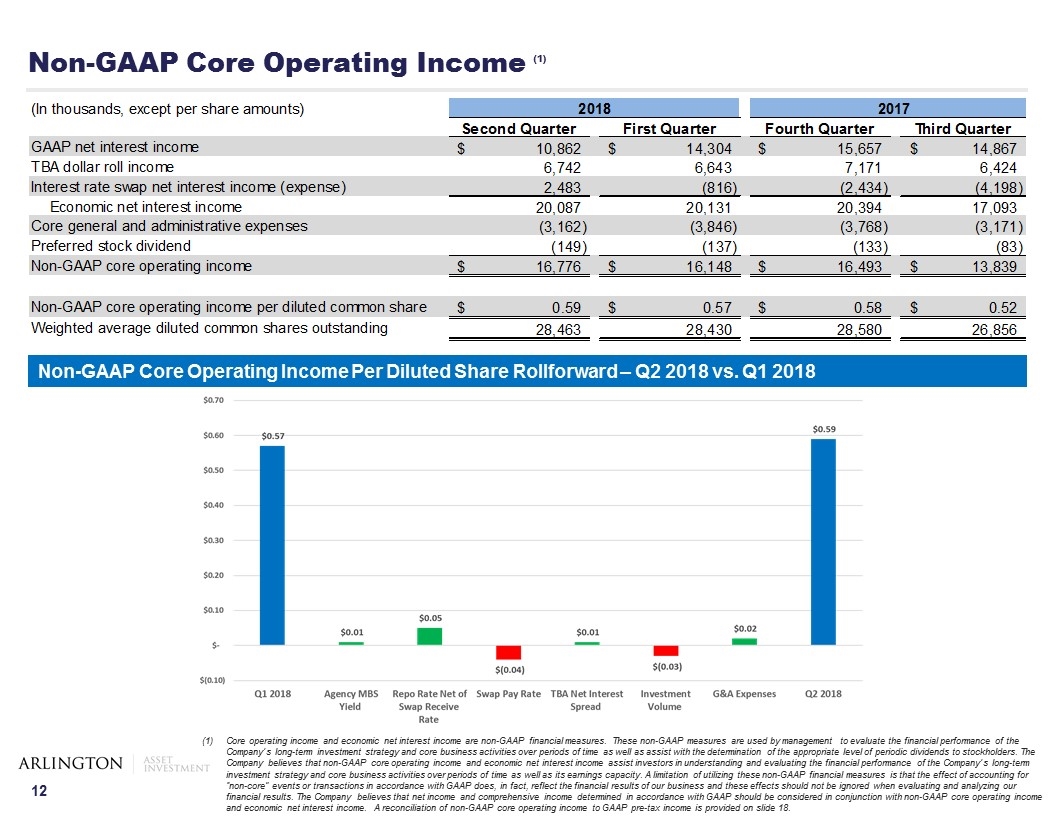
Non-GAAP Core Operating Income (1) Core operating income and economic net interest income are non-GAAP financial measures. These non-GAAP measures are used by management to evaluate the financial performance of the Company’s long-term investment strategy and core business activities over periods of time as well as assist with the determination of the appropriate level of periodic dividends to stockholders. The Company believes that non-GAAP core operating income and economic net interest income assist investors in understanding and evaluating the financial performance of the Company’s long-term investment strategy and core business activities over periods of time as well as its earnings capacity. A limitation of utilizing these non-GAAP financial measures is that the effect of accounting for “non-core” events or transactions in accordance with GAAP does, in fact, reflect the financial results of our business and these effects should not be ignored when evaluating and analyzing our financial results. The Company believes that net income and comprehensive income determined in accordance with GAAP should be considered in conjunction with non-GAAP core operating income and economic net interest income. A reconciliation of non-GAAP core operating income to GAAP pre-tax income is provided on slide 18. Non-GAAP Core Operating Income Per Diluted Share Rollforward – Q2 2018 vs. Q1 2018
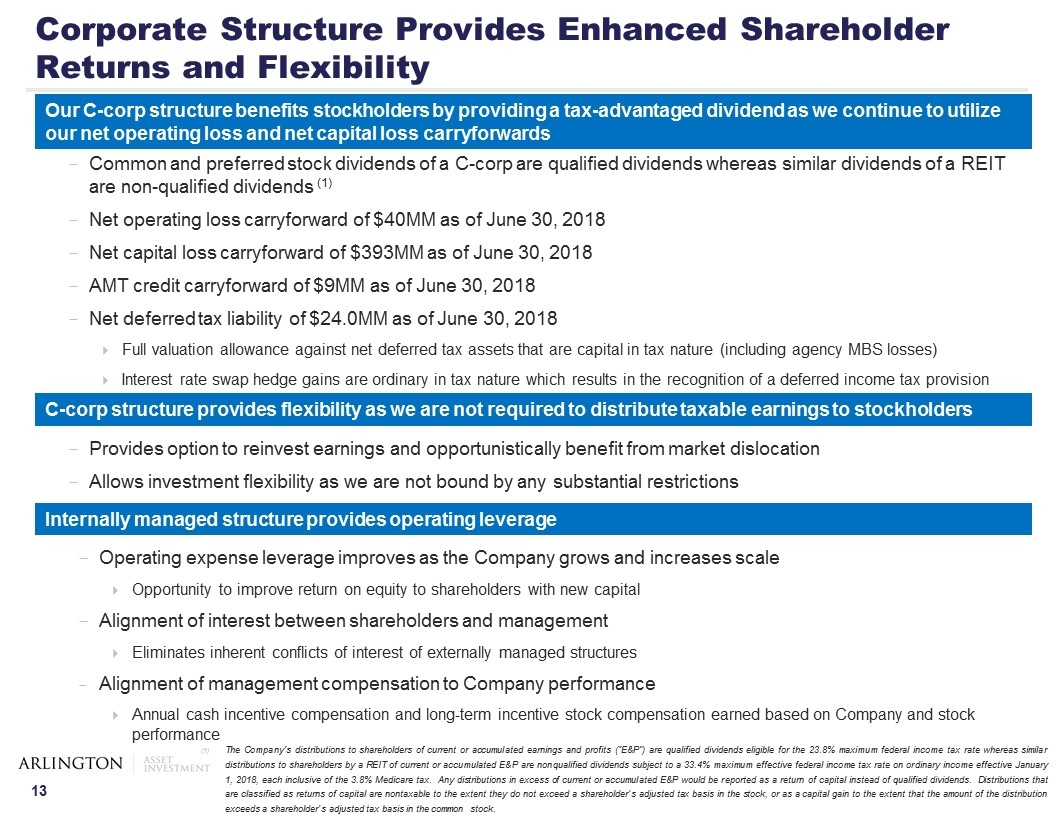
Common and preferred stock dividends of a C-corp are qualified dividends whereas similar dividends of a REIT are non-qualified dividends (1) Net operating loss carryforward of $40MM as of June 30, 2018 Net capital loss carryforward of $393MM as of June 30, 2018 AMT credit carryforward of $9MM as of June 30, 2018 Net deferred tax liability of $24.0MM as of June 30, 2018 Full valuation allowance against net deferred tax assets that are capital in tax nature (including agency MBS losses) Interest rate swap hedge gains are ordinary in tax nature which results in the recognition of a deferred income tax provision The Company's distributions to shareholders of current or accumulated earnings and profits (“E&P”) are qualified dividends eligible for the 23.8% maximum federal income tax rate whereas similar distributions to shareholders by a REIT of current or accumulated E&P are nonqualified dividends subject to a 33.4% maximum effective federal income tax rate on ordinary income effective January 1, 2018, each inclusive of the 3.8% Medicare tax. Any distributions in excess of current or accumulated E&P would be reported as a return of capital instead of qualified dividends. Distributions that are classified as returns of capital are nontaxable to the extent they do not exceed a shareholder’s adjusted tax basis in the stock, or as a capital gain to the extent that the amount of the distribution exceeds a shareholder’s adjusted tax basis in the common stock. Corporate Structure Provides Enhanced Shareholder Returns and Flexibility Our C-corp structure benefits stockholders by providing a tax-advantaged dividend as we continue to utilize our net operating loss and net capital loss carryforwards Provides option to reinvest earnings and opportunistically benefit from market dislocation Allows investment flexibility as we are not bound by any substantial restrictions C-corp structure provides flexibility as we are not required to distribute taxable earnings to stockholders Internally managed structure provides operating leverage Operating expense leverage improves as the Company grows and increases scale Opportunity to improve return on equity to shareholders with new capital Alignment of interest between shareholders and management Eliminates inherent conflicts of interest of externally managed structures Alignment of management compensation to Company performance Annual cash incentive compensation and long-term incentive stock compensation earned based on Company and stock performance

Appendix
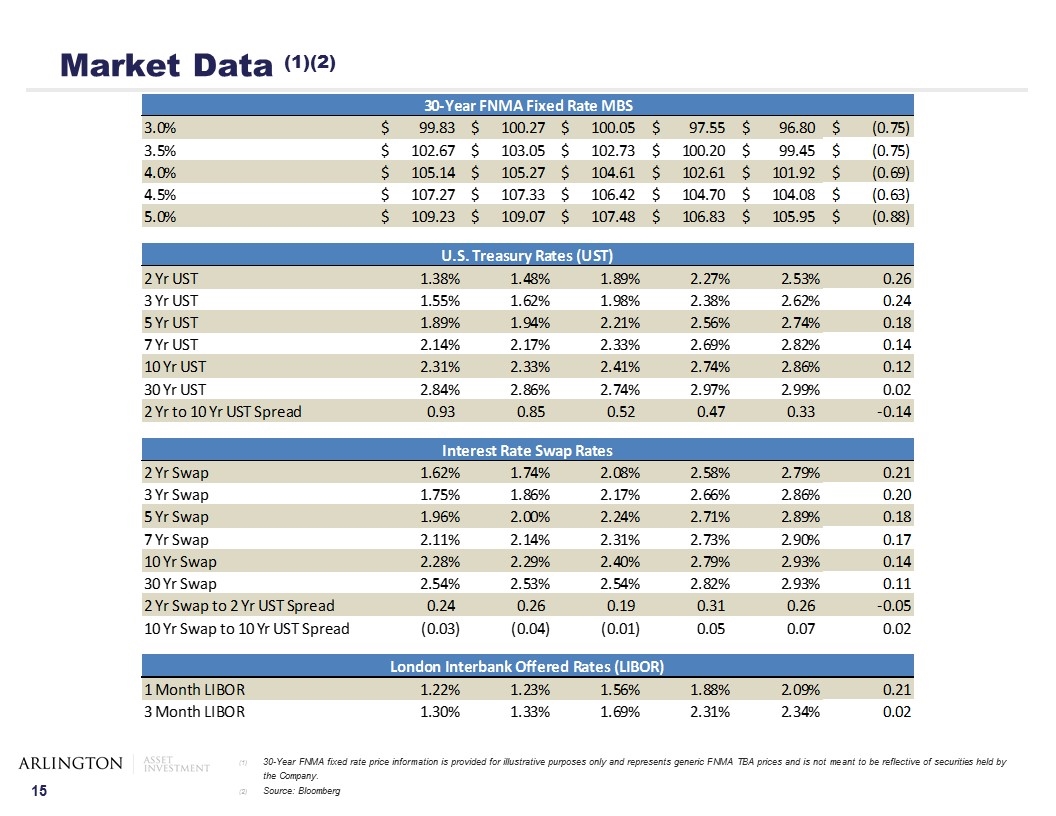
Market Data (1)(2) 30-Year FNMA fixed rate price information is provided for illustrative purposes only and represents generic FNMA TBA prices and is not meant to be reflective of securities held by the Company. Source: Bloomberg
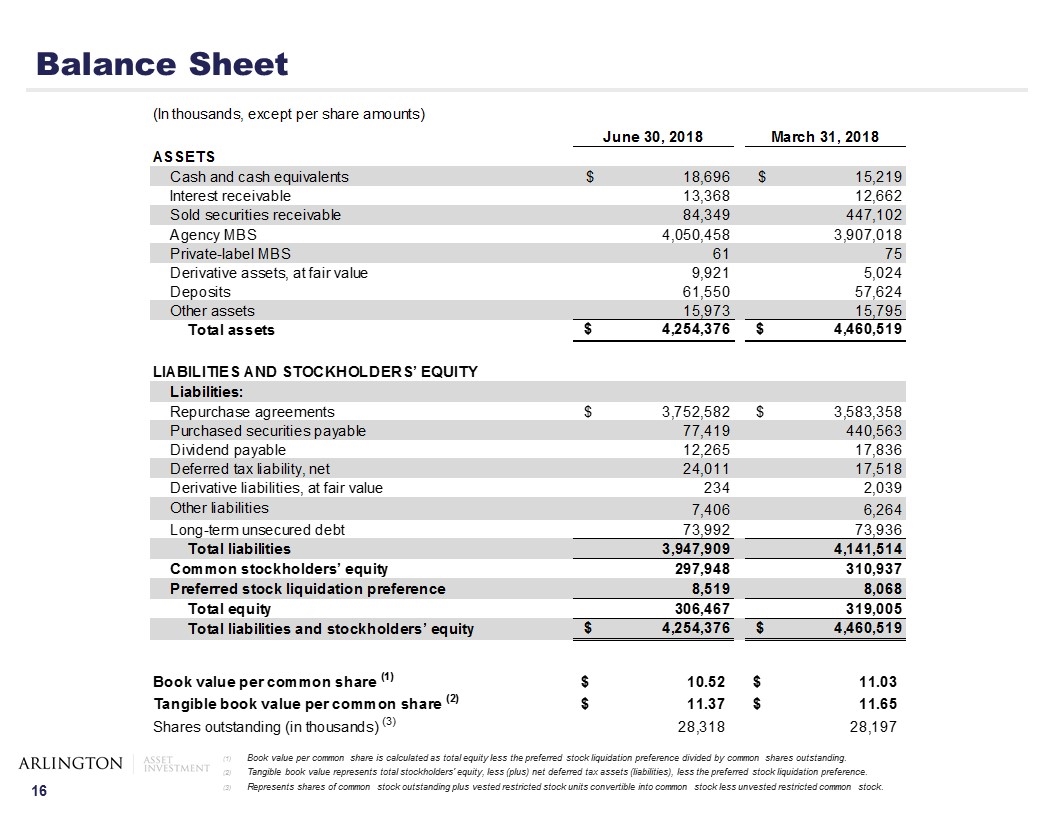
Balance Sheet Book value per common share is calculated as total equity less the preferred stock liquidation preference divided by common shares outstanding. Tangible book value represents total stockholders' equity, less (plus) net deferred tax assets (liabilities), less the preferred stock liquidation preference. Represents shares of common stock outstanding plus vested restricted stock units convertible into common stock less unvested restricted common stock.
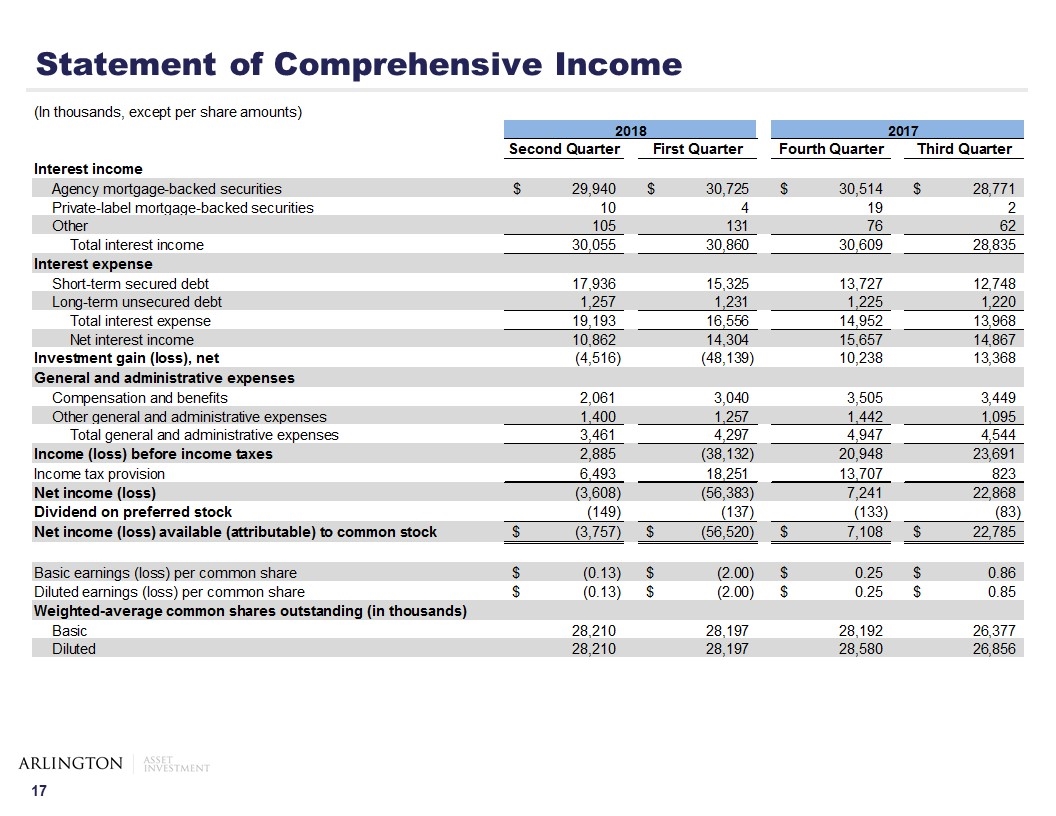
Statement of Comprehensive Income
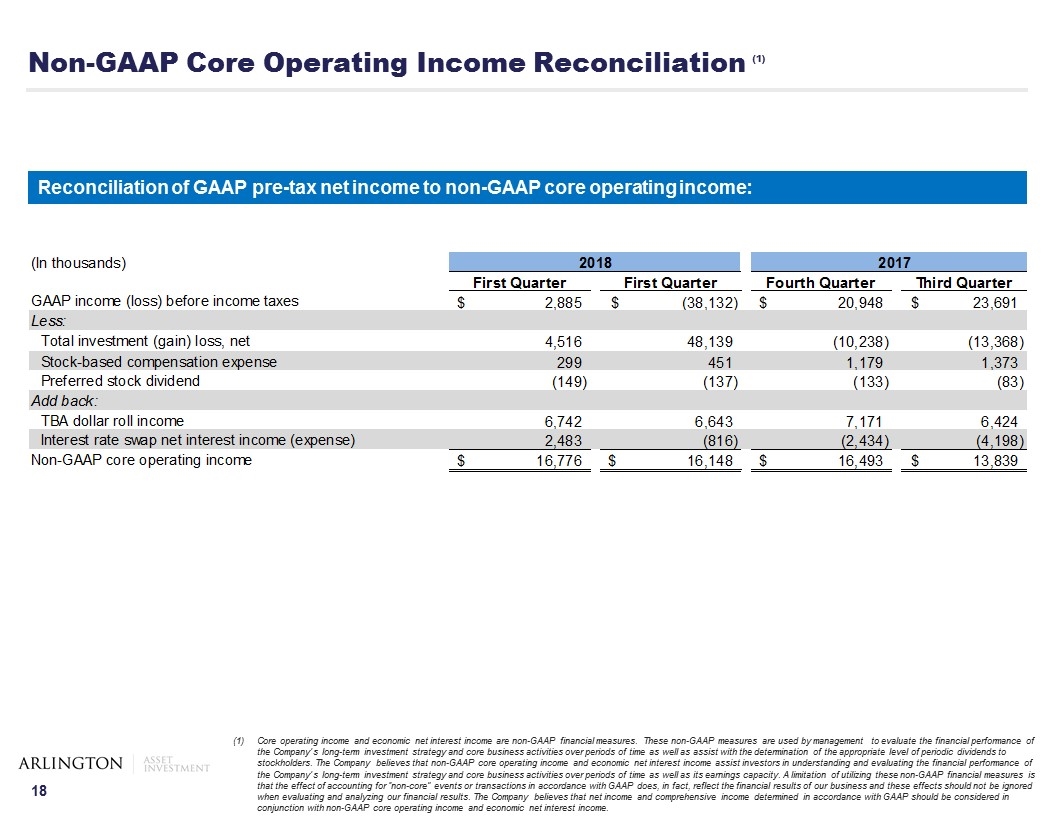
Non-GAAP Core Operating Income Reconciliation (1) Core operating income and economic net interest income are non-GAAP financial measures. These non-GAAP measures are used by management to evaluate the financial performance of the Company’s long-term investment strategy and core business activities over periods of time as well as assist with the determination of the appropriate level of periodic dividends to stockholders. The Company believes that non-GAAP core operating income and economic net interest income assist investors in understanding and evaluating the financial performance of the Company’s long-term investment strategy and core business activities over periods of time as well as its earnings capacity. A limitation of utilizing these non-GAAP financial measures is that the effect of accounting for “non-core” events or transactions in accordance with GAAP does, in fact, reflect the financial results of our business and these effects should not be ignored when evaluating and analyzing our financial results. The Company believes that net income and comprehensive income determined in accordance with GAAP should be considered in conjunction with non-GAAP core operating income and economic net interest income. Reconciliation of GAAP pre-tax net income to non-GAAP core operating income:
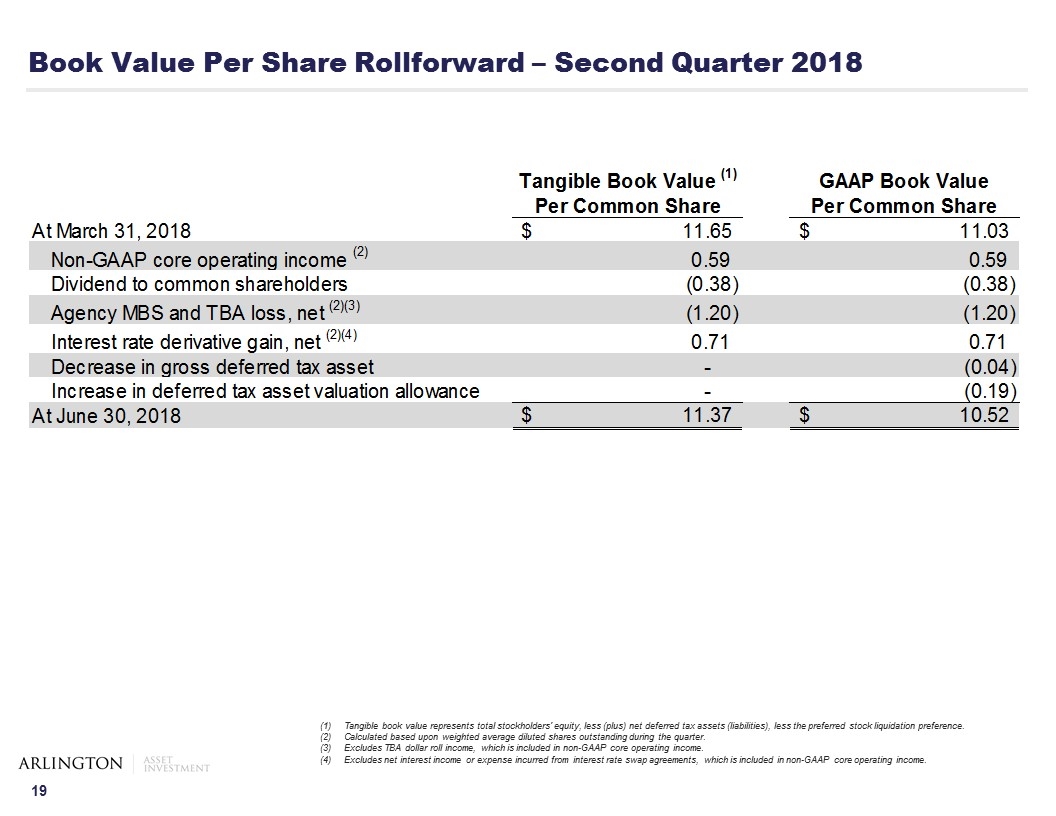
Book Value Per Share Rollforward – Second Quarter 2018 Tangible book value represents total stockholders' equity, less (plus) net deferred tax assets (liabilities), less the preferred stock liquidation preference. Calculated based upon weighted average diluted shares outstanding during the quarter. Excludes TBA dollar roll income, which is included in non-GAAP core operating income. Excludes net interest income or expense incurred from interest rate swap agreements, which is included in non-GAAP core operating income.
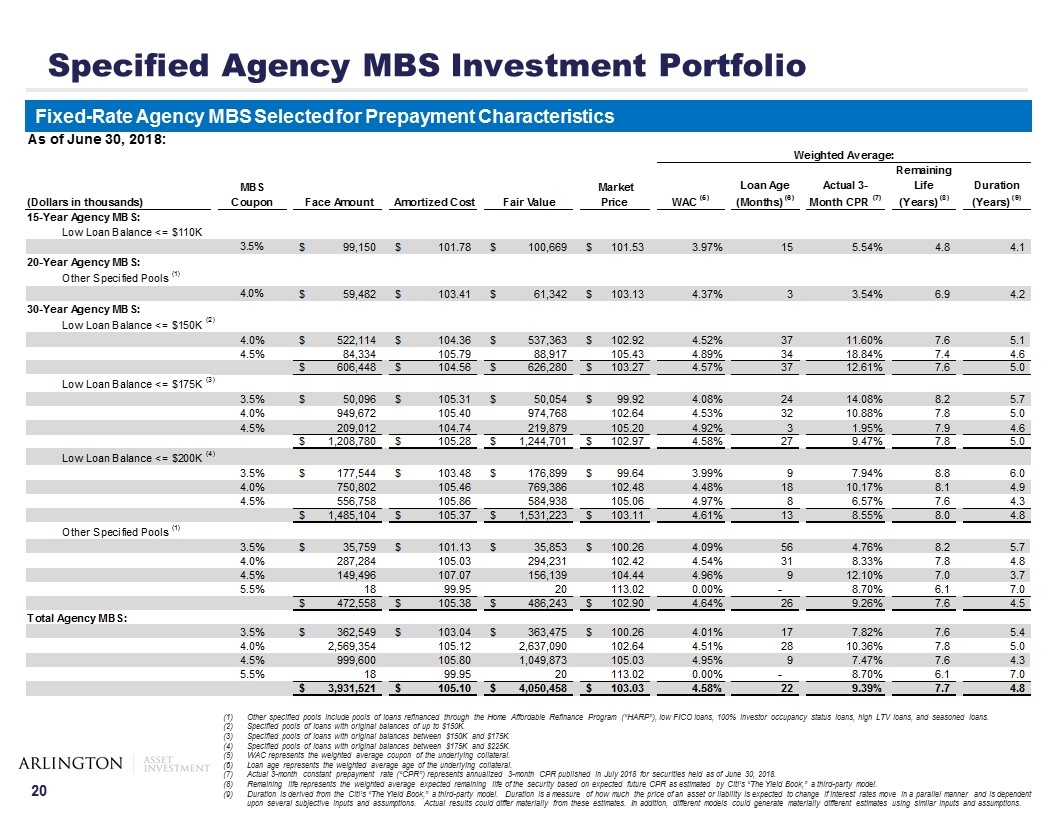
Specified Agency MBS Investment Portfolio Other specified pools include pools of loans refinanced through the Home Affordable Refinance Program (“HARP”), low FICO loans, 100% investor occupancy status loans, high LTV loans, and seasoned loans. Specified pools of loans with original balances of up to $150K. Specified pools of loans with original balances between $150K and $175K. Specified pools of loans with original balances between $175K and $225K. WAC represents the weighted average coupon of the underlying collateral. Loan age represents the weighted average age of the underlying collateral. Actual 3-month constant prepayment rate (“CPR”) represents annualized 3-month CPR published in July 2018 for securities held as of June 30, 2018. Remaining life represents the weighted average expected remaining life of the security based on expected future CPR as estimated by Citi’s “The Yield Book,” a third-party model. Duration is derived from the Citi’s “The Yield Book,” a third-party model. Duration is a measure of how much the price of an asset or liability is expected to change if interest rates move in a parallel manner and is dependent upon several subjective inputs and assumptions. Actual results could differ materially from these estimates. In addition, different models could generate materially different estimates using similar inputs and assumptions. Fixed-Rate Agency MBS Selected for Prepayment Characteristics
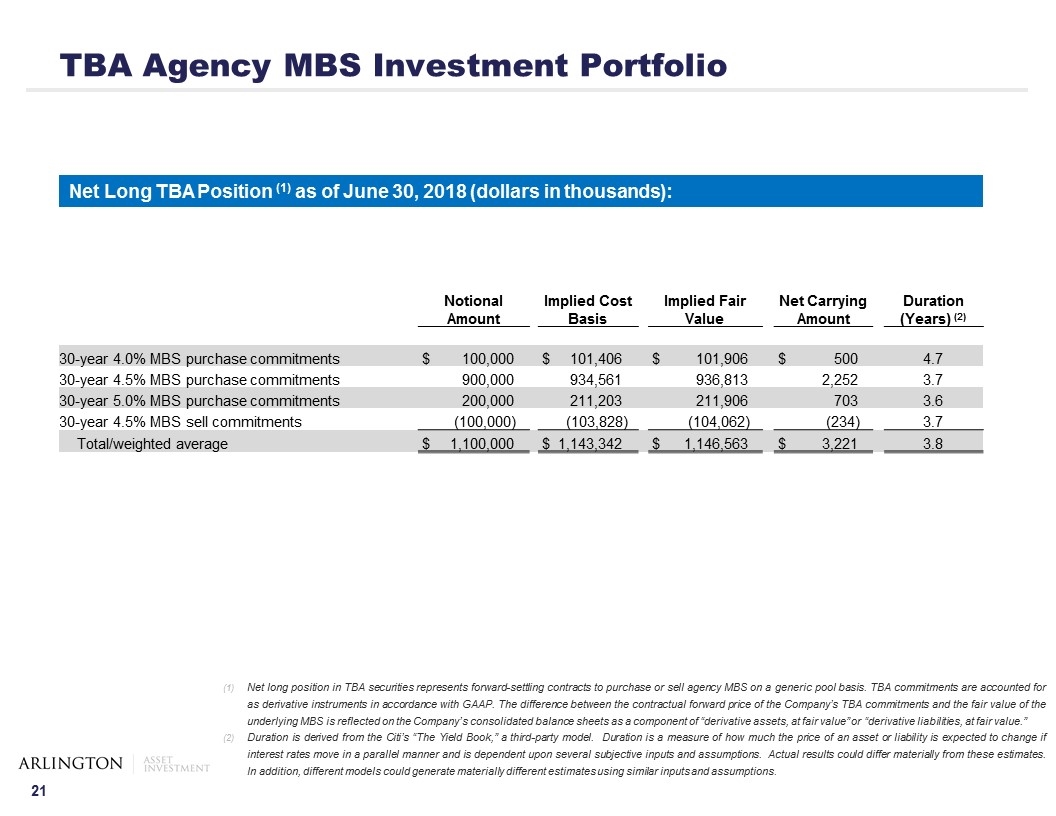
TBA Agency MBS Investment Portfolio Net long position in TBA securities represents forward-settling contracts to purchase or sell agency MBS on a generic pool basis. TBA commitments are accounted for as derivative instruments in accordance with GAAP. The difference between the contractual forward price of the Company’s TBA commitments and the fair value of the underlying MBS is reflected on the Company’s consolidated balance sheets as a component of “derivative assets, at fair value” or “derivative liabilities, at fair value.” Duration is derived from the Citi’s “The Yield Book,” a third-party model. Duration is a measure of how much the price of an asset or liability is expected to change if interest rates move in a parallel manner and is dependent upon several subjective inputs and assumptions. Actual results could differ materially from these estimates. In addition, different models could generate materially different estimates using similar inputs and assumptions. Net Long TBA Position (1) as of June 30, 2018 (dollars in thousands): Notional Amount Implied Cost Basis Implied Fair Value Net Carrying Amount Duration (Years) (2) 30-year 4.0% MBS purchase commitments $ 100,000 $ 101,406 $ 101,906 $ 500 4.7 30-year 4.5% MBS purchase commitments 900,000 934,561 936,813 2,252 3.7 30-year 5.0% MBS purchase commitments 200,000 211,203 211,906 703 3.6 30-year 4.5% MBS sell commitments (100,000) (103,828) (104,062) (234) 3.7 Total/weighted average $ 1,100,000 $ 1,143,342 $ 1,146,563 $ 3,221 3.8
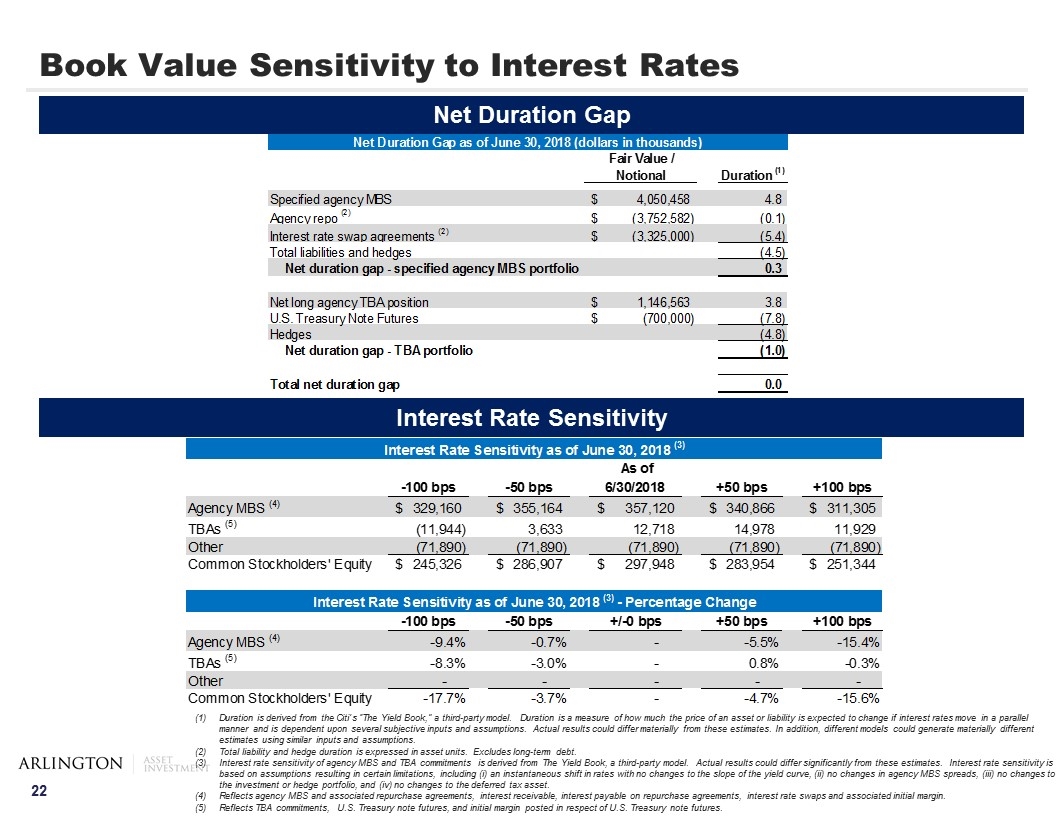
Book Value Sensitivity to Interest Rates Duration is derived from the Citi’s “The Yield Book,” a third-party model. Duration is a measure of how much the price of an asset or liability is expected to change if interest rates move in a parallel manner and is dependent upon several subjective inputs and assumptions. Actual results could differ materially from these estimates. In addition, different models could generate materially different estimates using similar inputs and assumptions. Total liability and hedge duration is expressed in asset units. Excludes long-term debt. Interest rate sensitivity of agency MBS and TBA commitments is derived from The Yield Book, a third-party model. Actual results could differ significantly from these estimates. Interest rate sensitivity is based on assumptions resulting in certain limitations, including (i) an instantaneous shift in rates with no changes to the slope of the yield curve, (ii) no changes in agency MBS spreads, (iii) no changes to the investment or hedge portfolio, and (iv) no changes to the deferred tax asset. Reflects agency MBS and associated repurchase agreements, interest receivable, interest payable on repurchase agreements, interest rate swaps and associated initial margin. Reflects TBA commitments, U.S. Treasury note futures, and initial margin posted in respect of U.S. Treasury note futures. Net Duration Gap Interest Rate Sensitivity
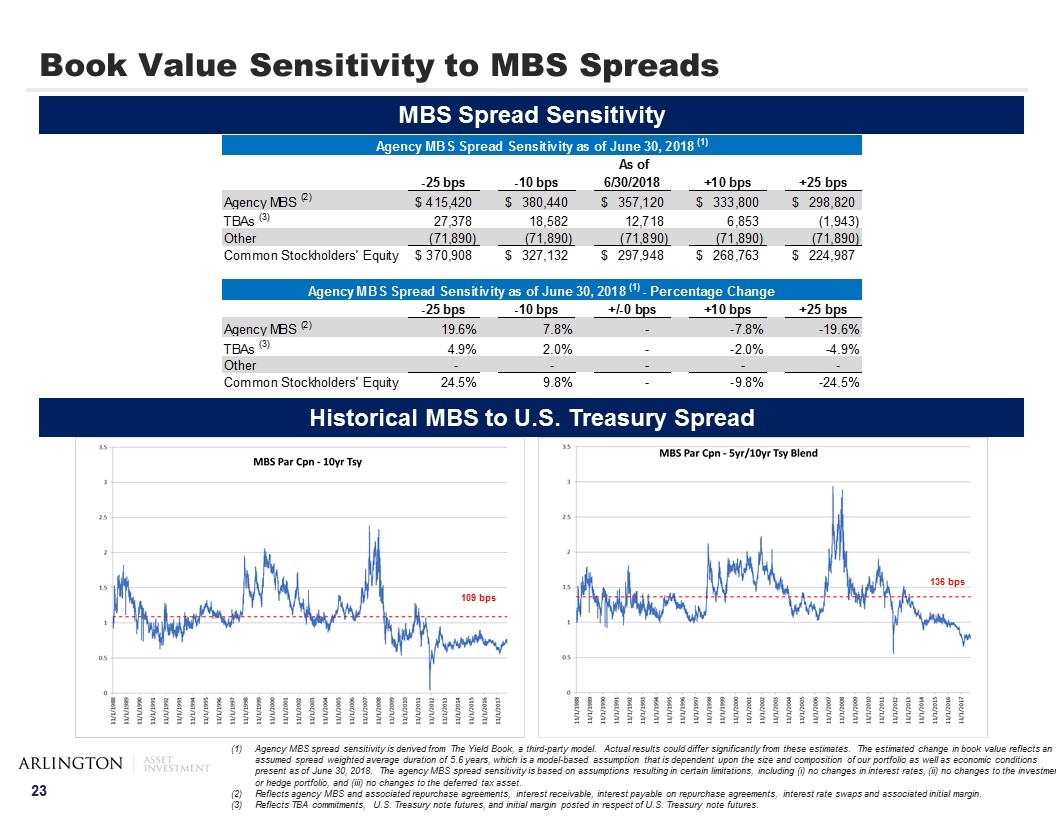
Book Value Sensitivity to MBS Spreads Agency MBS spread sensitivity is derived from The Yield Book, a third-party model. Actual results could differ significantly from these estimates. The estimated change in book value reflects an assumed spread weighted average duration of 5.6 years, which is a model-based assumption that is dependent upon the size and composition of our portfolio as well as economic conditions present as of June 30, 2018. The agency MBS spread sensitivity is based on assumptions resulting in certain limitations, including (i) no changes in interest rates, (ii) no changes to the investment or hedge portfolio, and (iii) no changes to the deferred tax asset. Reflects agency MBS and associated repurchase agreements, interest receivable, interest payable on repurchase agreements, interest rate swaps and associated initial margin. Reflects TBA commitments, U.S. Treasury note futures, and initial margin posted in respect of U.S. Treasury note futures. MBS Spread Sensitivity Historical MBS to U.S. Treasury Spread 109 bps 136 bps
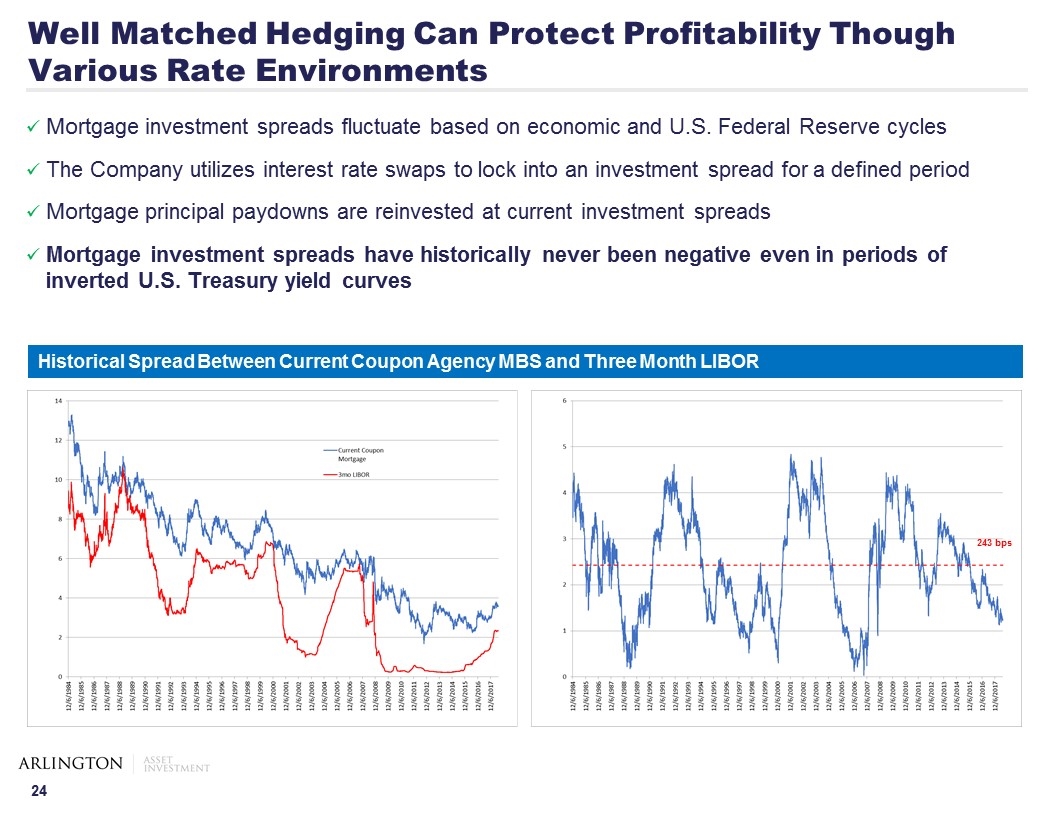
Well Matched Hedging Can Protect Profitability Though Various Rate Environments Mortgage investment spreads fluctuate based on economic and U.S. Federal Reserve cycles The Company utilizes interest rate swaps to lock into an investment spread for a defined period Mortgage principal paydowns are reinvested at current investment spreads Mortgage investment spreads have historically never been negative even in periods of inverted U.S. Treasury yield curves Historical Spread Between Current Coupon Agency MBS and Three Month LIBOR 243 bps
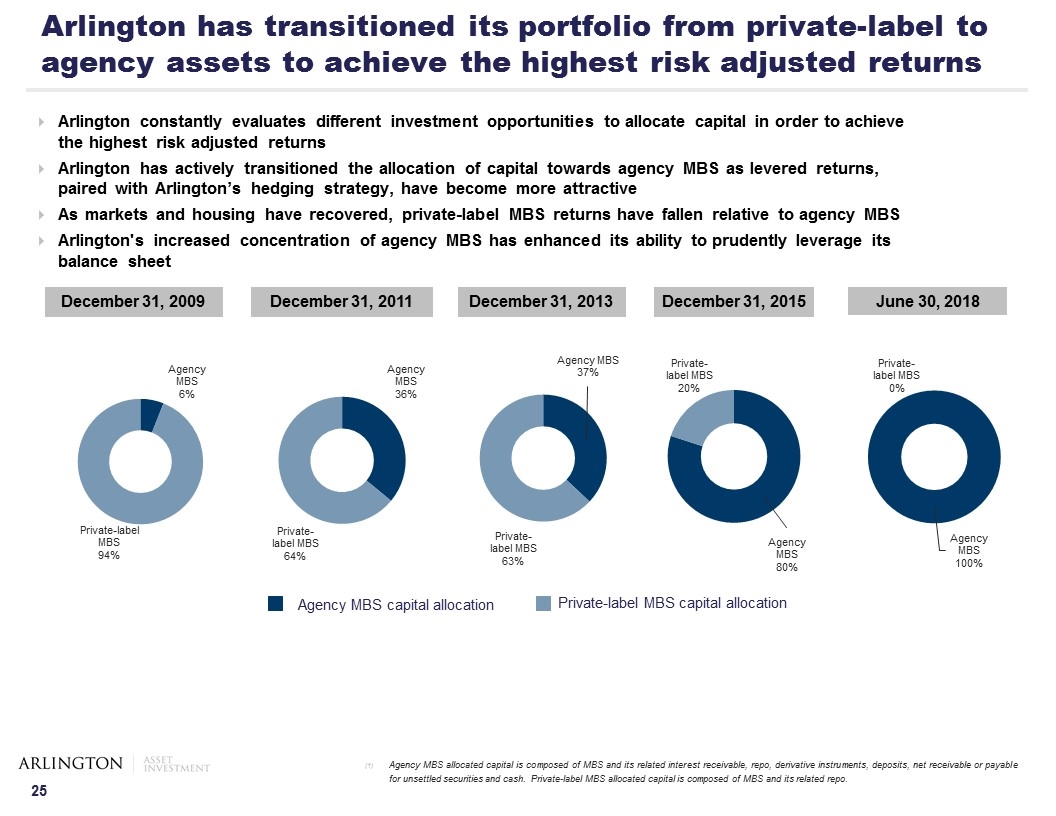
Arlington has transitioned its portfolio from private-label to agency assets to achieve the highest risk adjusted returns December 31, 2009 December 31, 2011 December 31, 2013 Agency MBS capital allocation Private-label MBS capital allocation Arlington constantly evaluates different investment opportunities to allocate capital in order to achieve the highest risk adjusted returns Arlington has actively transitioned the allocation of capital towards agency MBS as levered returns, paired with Arlington’s hedging strategy, have become more attractive As markets and housing have recovered, private-label MBS returns have fallen relative to agency MBS Arlington's increased concentration of agency MBS has enhanced its ability to prudently leverage its balance sheet December 31, 2015 June 30, 2018 Agency MBS allocated capital is composed of MBS and its related interest receivable, repo, derivative instruments, deposits, net receivable or payable for unsettled securities and cash. Private-label MBS allocated capital is composed of MBS and its related repo.