Use these links to rapidly review the document
TABLE OF CONTENTS
INDEX TO FINANCIAL STATEMENTS
Table of Contents
UNITED STATES
SECURITIES AND EXCHANGE COMMISSION
Washington, D.C. 20549
Form 10-K
| | |
ý |
|
ANNUAL REPORT PURSUANT TO SECTION 13 or 15(d) OF THE SECURITIES EXCHANGE ACT OF 1934 |
For the fiscal year ended December 31, 2012 |
OR |
o |
|
TRANSITION REPORT PURSUANT TO SECTION 13 OR 15(d) OF THE SECURITIES EXCHANGE ACT OF 1934 |
For the transition period from to |
Commission file number: 000-50536
CROSSTEX ENERGY, INC.
(Exact name of registrant as specified in its charter)
| | |
Delaware
(State of organization) | | 52-2235832
(I.R.S. Employer Identification No.) |
2501 CEDAR SPRINGS
DALLAS, TEXAS
(Address of principal executive offices) |
|
75201
(Zip Code) |
(214) 953-9500
(Registrant's telephone number, including area code)
SECURITIES REGISTERED PURSUANT TO SECTION 12(b) OF THE ACT:
| | |
| Title of Each Class | | Name of Exchange on which Registered |
|---|
| Common Stock, Par Value $0.01 Per Share | | The NASDAQ Global Select Market |
SECURITIES REGISTERED PURSUANT TO SECTION 12(g) OF THE ACT:None.
Indicate by check mark if registrant is a well-known seasoned issuer, as defined in Rule 405 of the Securities Act. Yes o No ý
Indicate by check mark if registrant is not required to file reports pursuant to Section 13 or Section 15(d) of the Act. Yes o No ý
Indicate by check mark whether registrant (1) has filed all reports required to be filed by Section 13 or 15(d) of the Securities Exchange Act of 1934 during the preceding 12 months (or for such shorter period that the registrant was required to file such reports), and (2) has been subject to such filing requirements for the past 90 days. Yes ý No o
Indicate by check mark whether the registrant has submitted electronically and posted on its corporate Web site, if any, every Interactive Data File required to be submitted and posted pursuant to Rule 405 of Regulation S-T (§ 232.405 of this chapter) during the preceding 12 months (or for such shorter period that the registrant was required to submit and post such files). Yes ý No o
Indicate by check mark if disclosure of delinquent filers pursuant to Item 405 of Regulation S-K (§229.405 of this chapter) is not contained herein, and will not be contained, to the best of registrant's knowledge, in definitive proxy or information statements incorporated by reference in Part III of this Form 10-K or any amendment to this Form 10-K.ý
Indicate by check mark whether the registrant is a large accelerated filer, an accelerated filer, a non-accelerated filer, or a smaller reporting company. See the definitions of "large accelerated filer," "accelerated filer" and "smaller reporting company" in Rule 12b-2 of the Securities Exchange Act. (Check one):
| | | | | | |
| Large accelerated filer o | | Accelerated filer ý | | Non-accelerated filer o
(Do not check if a
smaller reporting company) | | Smaller reporting company o |
Indicate by check mark whether the registrant is a shell company (as defined in Rule 12b-2 of the Act). Yes o No ý
The aggregate market value of the voting and non-voting common equity held by non-affiliates of the registrant was approximately $390,092,570 on June 30, 2012, based on $14.00 per share, the closing price of the Common Stock as reported on The NASDAQ Global Select Market on such date.
At February 15, 2013, there were 47,558,679 common shares outstanding.
DOCUMENTS INCORPORATED BY REFERENCE:
Portions of the Registrant's Proxy Statement relating to its 2013 Annual Stockholders' Meeting to be filed with the Securities and Exchange Commission are incorporated by reference herein into Part III of this Report.
Table of Contents
TABLE OF CONTENTS
| | | | | | |
Item | | DESCRIPTION | | Page | |
|---|
| | PART I | | | | |
1.
|
|
BUSINESS
|
|
|
3 |
|
1A.
|
|
RISK FACTORS
|
|
|
25 |
|
1B.
|
|
UNRESOLVED STAFF COMMENTS
|
|
|
45 |
|
2.
|
|
PROPERTIES
|
|
|
45 |
|
3.
|
|
LEGAL PROCEEDINGS
|
|
|
45 |
|
4.
|
|
MINE SAFETY DISCLOSURES
|
|
|
46 |
|
|
|
PART II
|
|
|
|
|
5.
|
|
MARKET FOR REGISTRANT'S COMMON EQUITY, RELATED STOCKHOLDER MATTERS AND ISSUER PURCHASES OF EQUITY SECURITIES
|
|
|
46 |
|
6.
|
|
SELECTED FINANCIAL DATA
|
|
|
49 |
|
7.
|
|
MANAGEMENT'S DISCUSSION AND ANALYSIS OF FINANCIAL CONDITION AND RESULTS OF OPERATIONS
|
|
|
53 |
|
7A.
|
|
QUANTITATIVE AND QUALITATIVE DISCLOSURES ABOUT MARKET RISK
|
|
|
80 |
|
8.
|
|
FINANCIAL STATEMENTS AND SUPPLEMENTARY DATA
|
|
|
83 |
|
9.
|
|
CHANGES IN AND DISAGREEMENTS WITH ACCOUNTANTS ON ACCOUNTING AND FINANCIAL DISCLOSURE
|
|
|
83 |
|
9A.
|
|
CONTROLS AND PROCEDURES
|
|
|
83 |
|
9B.
|
|
OTHER INFORMATION
|
|
|
84 |
|
|
|
PART III
|
|
|
|
|
10.
|
|
DIRECTORS, EXECUTIVE OFFICERS AND CORPORATE GOVERNANCE
|
|
|
84 |
|
11.
|
|
EXECUTIVE COMPENSATION
|
|
|
86 |
|
12.
|
|
SECURITY OWNERSHIP OF CERTAIN BENEFICIAL OWNERS AND MANAGEMENT AND RELATED STOCKHOLDER MATTERS
|
|
|
86 |
|
13.
|
|
CERTAIN RELATIONSHIPS AND RELATED TRANSACTIONS AND DIRECTOR INDEPENDENCE
|
|
|
86 |
|
14.
|
|
PRINCIPAL ACCOUNTING FEES AND SERVICES
|
|
|
86 |
|
|
|
PART IV
|
|
|
|
|
15.
|
|
EXHIBITS AND FINANCIAL STATEMENT SCHEDULES
|
|
|
87 |
|
2
Table of Contents
CROSSTEX ENERGY, INC.
PART I
Item 1. Business
General
Crosstex Energy, Inc. is a Delaware corporation formed in April 2000. We completed our initial public offering in January 2004. Our shares of common stock are listed and traded on the NASDAQ Global Select Market under the symbol "XTXI". Our executive offices are located at 2501 Cedar Springs, Dallas, Texas 75201, and our telephone number is (214) 953-9500. Our Internet address is www.crosstexenergy.com. In the "Investors" section of our web site, we post the following filings as soon as reasonably practicable after they are electronically filed with or furnished to the Securities and Exchange Commission: our annual reports on Form 10-K; our quarterly reports on Form 10-Q; our current reports on Form 8-K; and any amendments to those reports or statements filed or furnished pursuant to Section 13(a) or 15(d) of the Securities Exchange Act of 1934, as amended. All such filings on our web site are available free of charge. In this report, the term "Crosstex Energy, Inc." as well as the terms "our," "we," and "us," or like terms, are sometimes used as references to Crosstex Energy, Inc. and its consolidated subsidiaries. References in this report to "Crosstex Energy, L.P.," the "Partnership," "CELP" or like terms refer to Crosstex Energy, L.P. itself or Crosstex Energy, L.P. together with its consolidated subsidiaries.
CROSSTEX ENERGY, INC.
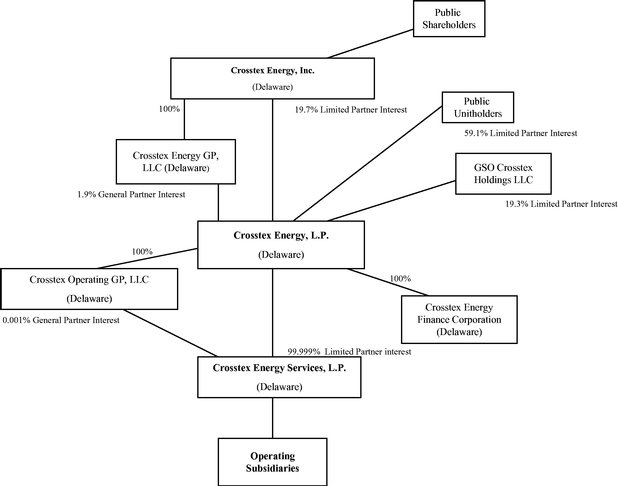
Our assets consist almost exclusively of partnership interests in Crosstex Energy, L.P., a publicly traded limited partnership engaged in the gathering, transmission, processing and marketing of natural gas and natural gas liquids, or NGLs and crude oil. These partnership interests consist of the following:
- •
- 16,414,830 common units representing an aggregate 19.7% limited partner interest in the Partnership as of December 31, 2012 (17.3% following the Partnership's January 2013 offerings); and
- •
- 100.0% ownership interest in Crosstex Energy GP, LLC, the general partner of the Partnership, which owns a 1.9% general partner interest as of December 31, 2012 (1.6% following the Partnership's January 2013 offerings) and all of the incentive distribution rights in the Partnership.
Our cash flows consist almost exclusively of distributions from the Partnership on the partnership interests we own. The Partnership is required by its partnership agreement to distribute all its cash on hand at the end of each quarter, less reserves established by its general partner in its sole discretion to provide for the proper conduct of the Partnership's business or to provide for future distributions.
The incentive distribution rights entitle us to receive an increasing percentage of cash distributed by the Partnership as certain target distribution levels are reached. Specifically, they entitle us to receive 13.0% of all cash distributed in a quarter after each unit has received $0.25 for that quarter, 23.0% of all cash distributed after each unit has received $0.3125 for that quarter and 48.0% of all cash distributed after each unit has received $0.375 for that quarter.
During 2012, the Partnership paid quarterly distributions to its common units holders in May, August and November of $0.33, $0.33, and $0.33 related to the first, second and third quarters, respectively, of 2012. The Partnership paid a quarterly distribution of $0.33 in February 2013 related to the fourth quarter of 2012. Our share of the distributions with respect to our limited and general partner interests in the Partnership totaled $27.4 million for the year ended December 31, 2012, $0.1 million of which was paid-in-kind through the issuance of additional limited partner common units to the general partner in lieu of cash.
3
Table of Contents
During 2012, we paid quarterly dividends of $0.12, $0.12 and $0.12 for the first, second and third quarter of 2012, respectively. We paid a quarterly dividend of $0.12 in February 2013 for the fourth quarter of 2012. We intend to continue to pay dividends to our stockholders on a quarterly basis equal to the cash we receive, if any, from our Partnership distributions, less reserves for expenses, future dividends and other uses of cash, including:
- •
- federal income taxes, which we are required to pay because we are taxed as a corporation;
- •
- the expenses of being a public company;
- •
- other general and administrative expenses;
- •
- capital contributions to the Partnership upon the issuance by it of additional partnership securities in order to maintain the general partner's then-current general partner interest, to the extent the board of directors of the general partner exercises its option to do so; and
- •
- cash reserves our board of directors believes are prudent to maintain.
Our ability to pay dividends is limited by the Delaware General Corporation Law, which provides that a corporation may only pay dividends out of existing "surplus," which is defined as the amount by which a corporation's net assets exceeds its stated capital. While our ownership of the general partner and the common units of the Partnership are included in our calculation of net assets, the value of these assets may decline to a level where we have no "surplus," thus prohibiting us from paying dividends under Delaware law.
Our primary business objective is to increase our cash available for dividends to our stockholders by assisting the Partnership in executing its business strategy. So long as we own the Partnership's general partner, under the terms of an omnibus agreement with the Partnership we are prohibited from engaging in the business of gathering, transmitting, treating, processing, storing and marketing natural gas and transporting, fractionating, storing and marketing NGLs and crude oil, except to the extent that the Partnership, with the concurrence of a majority of its independent directors comprising its conflicts committee, elects not to engage in a particular acquisition or expansion opportunity. The Partnership may elect to forego an opportunity for several reasons, including:
- •
- the nature of some or all of the target's assets or income might affect the Partnership's ability to be taxed as a partnership for federal income tax purposes;
- •
- the board of directors of Crosstex Energy GP, LLC, the general partner of the Partnership, may conclude that some or all of the target assets are not a good strategic opportunity for the Partnership; or
- •
- the seller may desire equity, rather than cash, as consideration or may not want to accept the Partnership's units as consideration.
In the future, we may acquire assets that we are permitted to acquire under the terms of the omnibus agreement, and such assets could be candidates for acquisition by the Partnership, potentially after operational or commercial improvement or further development. In the event that we pursue the types of opportunities that we are permitted to pursue under the omnibus agreement, our board of directors, in its sole discretion, may retain all, or a portion of, the cash distributions we receive on our partnership interests in the Partnership to finance all, or a portion of, such transactions, which may reduce or eliminate dividends paid to our stockholders.
CROSSTEX ENERGY, L.P.
Crosstex Energy, L.P. is a publicly traded Delaware limited partnership formed in 2002. The Partnership's common units are traded on The NASDAQ Global Select Market under the symbol "XTEX". The Partnership's business activities are conducted through its subsidiaries. The Partnership's
4
Table of Contents
executive offices are located at 2501 Cedar Springs, Dallas, Texas 75201, and its telephone number is (214) 953-9500. The Partnership's Internet address is www.crosstexenergy.com. The Partnership posts the following filings in the "Investors" section of its website as soon as reasonably practicable after they are electronically filed with or furnished to the Securities and Exchange Commission: the Partnership's annual report on Form 10-K; the Partnership's quarterly reports on Form 10-Q; the Partnership's current reports on Form 8-K; and any amendments to those reports or statements filed or furnished pursuant to Section 13(a) or 15(d) of the Securities Exchange Act of 1934, as amended. All such filings on the Partnership's web-site are available free of charge.
Crosstex Energy GP, LLC, a Delaware limited liability company, is the Partnership's general partner. Crosstex Energy GP, LLC manages the Partnership's operations and activities. Crosstex Energy GP, LLC is a wholly owned subsidiary of Crosstex Energy, Inc., or CEI.
The following diagram depicts the organization and ownership of the Partnership as of December 31, 2012.
The following terms as defined generally are used in the energy industry and in this document:
/d = per day
Bbls = barrels
Bcf = billion cubic feet
Btu = British thermal units
CO2= Carbon dioxide
Gal = gallon
Mcf = thousand cubic feet
5
Table of Contents
MMBtu = million British thermal units
MMcf = million cubic feet
NGL = natural gas liquid and natural gas liquids
Capacity volumes for the Partnership's facilities are measured based on physical volume and stated in cubic feet (Bcf, Mcf or MMcf). Throughput volumes are measured based on energy content and stated in British thermal units (Btu or MMBtu). A volume capacity of 100 MMcf generally correlates to volume capacity of 100,000 MMBtu. Fractionated volumes are measured based on physical volumes and stated in gallons (Gal). Crude oil, condensate and brine services volumes are measured based on physical volume and stated in barrels (Bbls).
Operations of the Partnership
The Partnership is a Delaware limited partnership formed on July 12, 2002. The Partnership primarily focuses on providing midstream energy services, including gathering, processing, transmission and marketing, to producers of natural gas, NGLs and crude oil. The Partnership also provides crude oil, condensate and brine services to producers. The Partnership's midstream energy asset network includes approximately 3,500 miles of pipelines, ten natural gas processing plants, four fractionators, 3.1 million barrels of NGL cavern storage, rail terminals, barge terminals, truck terminals and a fleet of approximately 100 trucks. The Partnership manages and reports its activities primarily according to geography. The Partnership has five reportable segments: (1) South Louisiana processing, crude and NGL, or PNGL, which includes its processing and NGL assets in south Louisiana; (2) Louisiana, or LIG, which includes its pipelines and processing plants located in Louisiana; (3) North Texas, or NTX, which includes its activities in the Barnett Shale and the Permian Basin; (4) Ohio River Valley, or ORV, which includes its activities in the Utica and Marcellus Shales; and (5) Corporate Segment, or Corporate, which includes its equity investment in Howard Energy Partners, or HEP, in the Eagle Ford Shale and its general partnership property and expenses. See Note 14 to the consolidated financial statements for financial information about these operating segments.
The Partnership connects the wells of natural gas producers in its market areas to its gathering systems, processes natural gas for the removal of NGLs, fractionates NGLs into purity products and markets those products for a fee, transports natural gas and ultimately provides natural gas to a variety of markets. The Partnership purchases natural gas from natural gas producers and other supply sources and sells that natural gas to utilities, industrial consumers, other marketers and pipelines. The Partnership operates processing plants that process gas transported to the plants by major interstate pipelines or from its own gathering systems under a variety of fee arrangements. In addition, the Partnership purchases natural gas from producers not connected to its gathering systems for resale and sells natural gas on behalf of producers for a fee. The Partnership provides a variety of crude services throughout the ORV which include crude oil gathering via pipelines, barges and trucks and oilfield brine disposal. The Partnership also has crude oil terminal facilities in south Louisiana that provide access for crude oil producers to the premium markets in this area. The Partnership's gas gathering systems consist of networks of pipelines that collect natural gas from points near producing wells and transport it to larger pipelines for further transmission. The Partnership's transmission pipelines primarily receive natural gas from its gathering systems and from third party gathering and transmission systems and deliver natural gas to industrial end-users, utilities and other pipelines. The Partnership's oil gathering and transmission systems consist of trucking facilities, pipelines and barges that, in exchange for a fee, transport oil from a producer site to an end user. The Partnership's processing plants remove NGLs and CO2 from a natural gas stream and its fractionators separate the NGLs into separate NGL products, including ethane, propane, iso-butane, normal butanes and natural gasoline.
6
Table of Contents
The Partnership's assets include the following:
- •
- North Texas Assets. The Partnership's North Texas assets consist of gathering systems with total capacity of approximately 1.2 Bcf/d, processing facilities with a total processing capacity of approximately 340 MMcf/d and a transmission pipeline with a capacity of approximately 375 MMcf/d.
- •
- LIG System. The Partnership's LIG system is one of the largest intrastate pipeline systems in Louisiana, consisting of approximately 2,000 miles of mainly transmission pipelines which extend from the Haynesville Shale in north Louisiana to onshore production in south central and southeast Louisiana and processing facilities with a total processing capacity of 335 MMcf/d.
- •
- South Louisiana Processing and NGL Assets. The Partnership's south Louisiana natural gas processing and liquid assets include approximately 1.7 Bcf/d of processing capacity, 54,000 Bbls/d of fractionation capacity, 3.1 million barrels of underground NGL storage, 440 miles of liquids transport lines and a crude oil terminal with a total capacity of 4,500 Bbls/d.
- •
- Ohio River Valley Assets. The Partnership's Ohio River Valley assets include a 4,500-barrel-per-hour crude oil barge loading terminal on the Ohio River, a crude oil rail loading terminal on the Ohio Central Railroad network that is being expanded to a 20-spot operation and approximately 200 miles of crude oil pipelines in Ohio and West Virginia. The assets also include 500,000 barrels of above ground storage and a trucking fleet of approximately 100 vehicles comprised of both semi and straight trucks. The Partnership has seven existing brine disposal wells with an injection capacity of approximately 10,000 Bbls/d. The Partnership currently holds two additional brine well permits in Ohio, one of which is under development. In addition, the Partnership owns more than 2,500 miles of unused rights-of-way.
Business Strategy
The Partnership's business strategy consists of two overarching objectives which are to maximize earnings and growth of its existing businesses and enhance the scale and diversification of its assets. In 2013, the Partnership will continue to focus on the same business strategy that the Partnership believes it successfully executed in 2012.
As part of enhancing its scale and diversification, the Partnership has concentrated on expanding its NGL business, growing a crude oil and condensate business, and developing its gas processing and transportation business in rich gas areas. The Partnership believes increasing its scale and diversification will strengthen the Partnership as a company because the Partnership believes it will lead to less reliance on any single geographic area, provide the Partnership a better balance between business driven by crude oil and natural gas, offer the Partnership greater opportunities from a broader asset base and provide the Partnership with more sustainable fee-based cash flows.
The Partnership's strategies include the following:
- •
- Maximize earnings and growth of its existing businesses. The Partnership intends to leverage its franchise position, infrastructure and customer relationships in the Partnership's existing areas of operation by expanding its existing systems to meet new or increased demand for its gathering, transmission, processing and marketing services. Examples of these activities are discussed more fully under "Recent Growth Developments" below.
- •
- Enhance the scale and diversification of our assets. The Partnership looks to grow and diversify its business through acquiring and/or building assets in new areas that will serve as a platform for future growth with a focus on emerging shale plays and other areas with NGL, crude oil and condensate exposure. For example, the Partnership expanded its scale and diversification in 2012 by acquiring assets in the Ohio River Valley that give it the opportunity to expand its crude and
7
Table of Contents
During 2012, the Partnership participated in several projects and transactions that expanded its size and outreach while increasing the Partnership's fee-based business, including: (1) the construction and operation of a cryogenic plant in the Permian Basin in west Texas as part of a joint venture with Apache Corporation, (2) its equity investment in HEP in the Eagle Ford Shale natural gas play in south Texas and (3) the expansion and operation of crude oil terminals in south Louisiana. In addition, the Partnership began construction of Phase I of the Cajun-Sibon pipeline extension project that will expand its NGL pipeline system and fractionation facilities in south Louisiana. The Partnership expects this phase of the project will be completed and operational by mid-2013. The Partnership also initiated Phase II of the Cajun-Sibon project that the Partnership expects to complete in late 2014. These projects are discussed more fully under "Recent Growth Developments" below.
The Partnership's growth plans for 2013 align with its business strategy. The Partnership believes through the execution of this strategy, the Partnership will continue to drive growth and deliver value to its investors, customers and employees by leveraging its well-positioned asset base. This platform consists of various fee-based projects with geographic and product diversity which will allow the Partnership to:
- •
- Diversify its revenue streams with the continued emphasis on the NGL, crude oil and condensate businesses. The Partnership expects that more than 40 percent of its gross operating margin will be derived from the crude oil, condensate and NGL businesses by the fourth quarter of 2013, an increase from 21 percent, 9 percent and 8 percent in 2012, 2011 and 2010, respectively.
- •
- Evolve into a fee-based provider with projected 2013 gross operating margin from fee-based businesses of over 85 percent, an increase from 83 percent, 70 percent and 77 percent in 2012, 2011 and 2010, respectively. The Partnership's objective has been to focus on long-term contracts that will provide the Partnership with sustainable and more predictable cash flow.
- •
- Expand into new geographic areas beyond its traditional strongholds and enhance its footprint in north Texas, Louisiana and south Louisiana. The Partnership will continue to focus on its activities in the developing Utica Shale play in Ohio, its Cajun-Sibon pipeline extension and its growing business in the Permian Basin in west Texas. By diversifying the Partnership's geographic focus, the Partnership believes it will be less reliant on any individual geographic area or product line.
Recent Growth Developments
Cajun-Sibon Phases I and II. In Louisiana, the Partnership is transforming its business that has been historically focused on processing offshore natural gas to a business that is focused on NGLs with additional opportunities for growth from new onshore supplies of NGLs. The Louisiana petrochemical market has historically relied on liquids from offshore production; however, the decrease in offshore production and increase in onshore rich gas production have changed the market structure. Cajun-Sibon Phases I and II will work to bridge the gap between supply, which aggregates in the Mont Belvieu area, and demand located in the Mississippi River corridor of Louisiana, thereby building a strategic NGL position in this region.
The Partnership began this transformation by restarting its Eunice fractionator during 2011 at a rate of 15,000 Bbls/d of NGLs. This is a pivotal asset for Cajun-Sibon Phase I as the Partnership is expanding this facility to a rate of 55,000 Bbls/d. When Phase I of its pipeline extension project is completed, Mont Belvieu supply lines in east Texas will be connected to Eunice providing a direct link to the Partnership's fractionators in south Louisiana markets. The Eunice fractionator expansion will increase the Partnership's interconnected fractionation capacity in Louisiana to approximately 97,000 Bbls/d of raw-make NGLs.
8
Table of Contents
Construction is underway on Phase I, which includes a 130-mile, 12-inch diameter pipeline extension of the Partnership's existing 440-mile Cajun-Sibon NGL pipeline system, connecting Mont Belvieu to the Partnership's Eunice fractionator. The pipeline will have an initial capacity of 70,000 Bbls/d for raw make NGLs. The Phase I NGL pipeline extension will originate from interconnects with major Mont Belvieu supply pipelines, providing connections for NGLs from the Permian Basin, Mid-Continent, Barnett Shale, Eagle Ford, and Rocky Mountain areas to its NGL fractionation facilities and key NGL markets in south Louisiana. The Partnership expects Phase I facilities, both the NGL pipeline and the expanded Eunice fractionation facilities, will be operating by mid-2013. Phase I is anchored by a five year ethane sales agreement with Williams Olefins, a subsidiary of the Williams Companies.
Cajun-Sibon Phase II will further enhance the Partnership's Louisiana NGL business with significant additions to the Cajun-Sibon Phase I NGL pipeline extension and fractionator expansion. Phase II will include the addition of four pumping stations, totaling 13,400 horsepower, that will facilitate increasing NGL supply capacity from Phase I's 70,000 Bbls/d to 120,000 Bbls/d; the construction of a new 100,000 Bbls/d fractionator at the Plaquemine gas processing plant site; the conversion of the Partnership's Riverside fractionator to a butanes-and-heavier facility; and the construction of 57 miles of NGL pipelines that will originate at the Eunice fractionator and connect to the new Plaquemine fractionator, which will provide optionality to move purity products around the Louisiana-liquids market; and ultimately, the construction of a 32-mile, 16-inch diameter extension of LIG's Bayou Jack lateral, which will provide gas services to customers in the Mississippi River corridor, replacing the conversion of supply lines that the Partnership currently uses for liquid service.
The Partnership has entered into 10-year sales agreements with Dow Hydrocarbons and Resources, or Dow to deliver up to 40,000 Bbls/d of ethane and 25,000 Bbls/d of propane produced at its new Plaquemine fractionator into Dow's Louisiana pipeline system. The Partnership will also deliver 70,000 MMBtu/d of natural gas to Dow's Plaquemine facility.
The Partnership expects Phase II will be in service during the second half of 2014. The Partnership currently estimates the total capital investment for both phases of Cajun-Sibon will be between $680.0 million and $700.0 million.
The Partnership believes the Cajun-Sibon projects not only represent a tremendous growth step by leveraging the Partnership's Louisiana assets, but that they also create a significant platform for continued growth of its NGL business. The Partnership believes these projects, along with its existing assets, will provide a number of additional opportunities to grow this business, including expanding market optionality and connectivity, upgrading products, expanding rail imports, exporting NGLs and expanding fractionation and product storage capacity.
Clearfield Acquisition. On July 2, 2012, the Partnership completed the acquisition of all of the issued and outstanding common stock of Clearfield Energy, Inc. and its wholly-owned subsidiaries (collectively, "Clearfield"). Clearfield was a crude oil, condensate and water services company with operations in Ohio, Kentucky and West Virginia. The Partnership paid approximately $215.0 million in cash for the acquisition, which was funded from the proceeds of its May 2012 offering of 7.125% Senior Notes due 2022. The assets associated with this acquisition are included in a new reporting segment that is referred to as Ohio River Valley.
The Partnership's Ohio River Valley assets include a 4,500-barrel-per-hour crude oil barge loading terminal on the Ohio River, a crude rail loading terminal on the Ohio Central Railroad network that is being expanded to a 20-spot operation and approximately 200 miles of crude oil pipelines in Ohio and West Virginia. The Partnership also has 500,000 barrels of above ground storage, seven existing brine disposal wells with one under development and a truck fleet of approximately 100 trucks. In addition, the Partnership owns more than 2,500 miles of unused rights-of-way.
9
Table of Contents
The Partnership believes its Ohio River Valley assets provide a first-mover advantage in the developing Utica Shale, in addition to providing access to the Marcellus Shale. The Partnership views this position as its next growth platform and it offers the Partnership a great opportunity to continue to diversify into the crude and condensate business. From an operations standpoint, the Partnership is focusing on improving or expanding the existing assets. The Partnership is enhancing its Black Run rail terminal, increasing storage capacity and condensate handling at Bells Run barge terminal on the Ohio River, and expanding the capacity of its brine disposal network and wells. The Partnership achieved record brine disposal rates in the fourth quarter, the result of optimizing its newest disposal well in West Virginia along with the six other disposal wells on the system. The Partnership has also focused on utilization and deployment of its truck fleet, which the Partnership is transitioning to a seven-day, 24-hour operation.
Investment in Limited Liability Company. On June 22, 2011, the Partnership entered into a limited liability agreement with HEP for an initial capital contribution of $35.0 million in exchange for an individual ownership interest in HEP. In 2012, the Partnership made an additional capital contribution of $52.3 million to HEP related to HEP's acquisition of substantially all of Meritage Midstream Services' natural gas gathering assets in south Texas. HEP owns midstream assets and provides midstream and construction services to Eagle Ford Shale producers. As of December 31, 2012, the Partnership owned a 30.6 percent interest in HEP and accounted for this investment under the equity method of accounting. In December 2012, HEP sold its construction services business. In February 2013, HEP announced that it will construct another cryogenic natural gas plant and an import and export logistics railroad hub to service customers in the Eagle Ford Shale play in south Texas. The Partnership expects to make an additional capital contribution of approximately $34.0 million during 2013 to fund its portion of these new construction projects. The Partnership expects to receive distributions of approximately $10.0 million to 15.0 million from HEP during 2013.
Riverside Crude Facility Expansion. In January 2012, the Partnership completed its modifications to the Riverside fractionation facility in south Louisiana to allow 4,500 Bbls/d of crude oil as well as NGLs to be transloaded from rail to barge. In June 2012, the Partnership began construction on Phase II to increase its capacity to transload crude oil from rail cars to both barges and pipeline at its Riverside facility from approximately 4,500 Bbls/d of crude oil to approximately 15,000 Bbls/d of crude oil. The Phase II development at the Riverside facility will include new storage tank facilities, upgraded pipeline connections and improved barge delivery capabilities on the Mississippi River. The expansion project is expected to be operational in the second quarter of 2013 at a cost of approximately $16.4 million. The Partnership has entered into a long-term agreement which supports the expansion.
Permian Basin Apache Joint Investment. The Partnership and Apache Corporation jointly invested $85.0 million in a new-build natural gas processing facility with a capacity of 58 MMcf/d in the Permian Basin in Glasscock County, Texas, which the Partnership refers to as its Deadwood plant. The Partnership and Apache funded the processing project equally and each hold a 50 percent undivided working interest in the assets. The Partnership commenced operation of this facility in February 2012. The project gives the Partnership a footprint for growth in the Permian Basin where it will pursue additional business opportunities.
The Partnership also purchased and upgraded a nearby rail terminal and fractionator (the Partnership refers to this terminal as the Mesquite Terminal) in Midland County at a cost of $23.4 million to serve initially as a rail terminal for the Deadwood plant and third party raw-make NGLs. After the ethane is removed, these NGLs are transported by rail to the Partnership's Eunice fractionation facility in south Louisiana for fractionation and sales. The Partnership owns 100 percent of the terminal and fractionator. The Mesquite Terminal began receiving raw-make NGLs in February 2012 from the Deadwood Plant when the Partnership commenced its operation and from others via existing NGL pipelines or trucks. The Partnership is also transloading crude oil at the facility. This
10
Table of Contents
facility provides NGL takeaway for the constrained Permian infrastructure until a long-term pipeline solution becomes available.
Partnership Assets
North Texas Assets (including Permian Basin Assets). The Partnership's gathering systems in north Texas, or NTG, consist of approximately 690 miles of gathering lines that had an average throughput of approximately 810,000 MMBtu/d for the year ended December 31, 2012. The Partnership's processing facilities in north Texas include three gas processing plants with total processing throughput that averaged 324,000 MMBtu/d for the year ended December 31, 2012. The Partnership's transmission asset, referred to as the North Texas Pipeline, or NTP, is a 140-mile pipeline from an area near Fort Worth, Texas to a point near Paris, Texas and related facilities. The NTP connects production from the Barnett Shale to markets in north Texas accessed by the Natural Gas Pipeline Company of America, LLC, Kinder Morgan, Inc., Houston Pipeline Company, L.P., Atmos Energy Corporation and Gulf Crossing Pipeline Company, LLC. For the year ended December 31, 2012, the average throughput on the NTP was approximately 350,000 MMBtu/d.
During 2011, the Partnership expanded its gas gathering system in north Texas with the construction of a $28.3 million, 15-mile pipeline extension to serve major Barnett Shale producers. The project, which is supported by volumetric commitments, commenced operation in March 2011. The Partnership added more compression to this gathering system in January 2012 to increase capacity. In March 2011, the Partnership also completed construction of a new compressor station at a cost of approximately $15.9 million that increased compression on an existing north Texas gathering line to handle an additional 50 MMcf/d of natural gas. This capacity increase was needed to support a 10-year gathering commitment from a major Barnett Shale producer.
The Partnership's North Texas segment also includes its Deadwood natural gas processing plant, and its Mesquite Terminal and fractionator which comprise the Partnership's Permian Basin assets. The Deadwood processing facility has a total capacity of 58 MMcf/d and total processing throughput that averaged 40,000 MMBtu/d for the year ended December 31, 2012. See "Recent Growth Developments" for a full description of these assets.
LIG Assets. The LIG gathering and transmission pipeline system is comprised of a north and south system and had an average throughput of approximately 783,000 MMBtu/d for the year ended December 31, 2012. The southern part of the Partnership's LIG system has a capacity in excess of 1.5 Bcf/d and approximately 1,125 miles of pipeline. The south system also includes two operating, on-system processing plants, its Plaquemine and Gibson plants, with an average throughput of 248,000 MMBtu/d for the year ended December 31, 2012. The Plaquemine plant also has a fractionation capacity of 10,800 Bbls/d of raw-make NGL products, and total volume for fractionated liquids at Plaquemine averaged 3,800 Bbls/d for the year ended December 31, 2012. The Partnership also connected the Plaquemine plant to its south Louisiana NGL system in 2012. The south system has access to both rich and lean gas supplies from onshore production in south central and southeast Louisiana. LIG has a variety of transportation and industrial sales customers in the south, with the majority of its sales being made into the industrial Mississippi River corridor between Baton Rouge and New Orleans.
The Partnership's LIG system in the north, comprised of approximately 800 miles of pipeline, serves the natural gas fields south of Shreveport, Louisiana and extends into the Haynesville Shale gas play in north Louisiana. The north Louisiana system has a capacity of 465 MMcf/d and interconnects with interstate pipelines of ANR Pipeline, Columbia Gulf Transmission, Texas Gas Transmission, Trunkline Gas and Tennessee Gas Pipeline. The Partnership has firm transportation agreements for 345 MMcf/d on the north system with weighted average lives of approximately four and a half years.
11
Table of Contents
The Partnership's north Louisiana system is connected to its south Louisiana system and has the capacity to move approximately 145 MMcf/d of gas to its markets in the south.
In August 2012, a slurry-filled sinkhole developed in Assumption Parish near Bayou Corne, Louisiana and in the vicinity of certain of the Partnership's pipelines and its underground storage resevoir located in Napoleonville, Louisiana. The cause of the slurry is currently under investigation by Louisiana state and local officials. Consequently, the Partnership took a section of its 36-inch-diameter natural gas pipeline located near the sinkhole out of service. Service to certain markets, primarily in the Mississippi River area, has been curtailed or interrupted, and the Partnership has worked with its customers to secure alternative natural gas supplies so that disruptions are minimized. See "Item 7—Liquidity and Capital Resources" for further information about this matter.
PNGL Assets. The Partnership's south Louisiana natural gas processing and liquids assets include processing and fractionation capabilities, underground storage and approximately 440 miles of liquids transport lines. Total processing throughput averaged 738,000 MMBtu/d for the year ended December 31, 2012.
- •
- NGL Assets. The Partnership's NGL assets include its Eunice fractionation facility, its Riverside fractionation plant, its Cajun-Sibon pipeline system and its Napoleonville storage facility.
- •
- Eunice Fractionation Facility. The Eunice fractionation facility is located in south central Louisiana and was restarted in 2011 to take advantage of the activity around liquids rich shale-plays, including the Eagle Ford, Permian, Granite Wash, Marcellus and Bakken plays. The Eunice fractionation facility has a capacity of 15,000 Bbls/d of liquid products, including ethane, propane, iso-butane, normal butane and natural gasoline, and is directly connected to the southeast propane market and pipelines to the Anse La Butte storage facility. The plant fractionated 7,600 Bbls/d of liquids during 2012. The Partnership connected the Plaquemine facility into its PNGL system during 2012. This connection gives the Partnership operational flexibility, increased fractionation capacity, and the ability to capture new NGL-related business. See "Recent Growth Developments" for a discussion of the Eunice expansion in conjunction with the Cajun-Sibon project.
- •
- Riverside Fractionation Plant. The Riverside fractionator and loading facility is located on the Mississippi River upriver from Geismar, Louisiana. The Riverside plant has a fractionation capacity of approximately 28,000 Bbls/d of liquids delivered by the Cajun-Sibon pipeline system from the Eunice, Pelican and Blue Water processing plants or by truck and rail. The Riverside facility has above-ground storage capacity of approximately 133,000 barrels. The loading facility has the capacity to transload 4,500 Bbls/d of crude oil and NGLs from rail cars to both barges and pipeline. Total volume for fractionated liquids at Riverside averaged 19,200 Bbls/d for the year ended December 31, 2012. See "Recent Growth Developments" for discussion of the expansion at Riverside.
- •
- Cajun-Sibon Pipeline System. Currently, the Cajun-Sibon pipeline system consists of approximately 440 miles of 6" and 8" pipelines with a system capacity of approximately 28,000 Bbls/d. The pipeline transports unfractionated NGLs, referred to as raw make, from the Eunice, Pelican and Blue Water processing plants to either the Riverside or Eunice fractionators or to third party fractionators when necessary. See "Recent Growth Developments" for information regarding the expansion of this pipeline system.
- •
- Napoleonville Storage Facility. The Napoleonville NGL storage facility, located outside of Belle Rose, Louisiana, is connected to the Riverside facility and has a total capacity of 3.1 million barrels of underground storage from two existing caverns. The caverns are currently operated in propane and butane service, and space is leased to customers for a fee.
12
Table of Contents
- •
- Processing Assets. The Partnership's processing assets include its Pelican processing plant, its Eunice processing plant and its Blue Water gas processing plant.
- •
- Pelican Processing Plant. The Pelican processing plant complex is located in Patterson, Louisiana and has a designed capacity of 600 MMcf/d of natural gas. For the year ended December 31, 2012, the plant processed approximately 377,000 MMBtu/d. The Pelican plant is connected with continental shelf and deepwater production and has downstream connections to the ANR Pipeline. This plant has an interconnection with the LIG pipeline so the Partnership can process natural gas from the LIG system at its Pelican plant when markets are favorable.
- •
- Eunice Processing Plant. The Eunice processing plant is located in south central Louisiana, has a capacity of 475 MMcf/d and processed approximately 215,000 MMBtu/d for the year ended December 31, 2012. The plant is connected to onshore gas supply as well as continental shelf and deepwater gas production and has downstream connections to the ANR Pipeline, Florida Gas Transmission and Texas Gas Transmission.
- •
- Blue Water Gas Processing Plant. The Partnership owns a 64.29% interest in the Blue Water gas processing plant and operates the plant. The Blue Water plant is located in Crowley, Louisiana and is connected to the Blue Water pipeline system. The plant has a net capacity to the Partnership's interest of 300 MMcf/d. In January 2009, the flow of the gas on the pipeline was reversed by the Tennessee Gas Pipeline (TGP), the owner of the pipeline, thereby removing access to all the gas processed at the Partnership's Blue Water plant from the Blue Water offshore system. The gas composition of the reversed TGP stream is leaner in NGL content, but is profitable to process during periods of high fractionation spreads. The plant only operated during the first five months of 2012 and processed approximately 78,000 MMBtu/d for the year ended December 31, 2012. The plant is not expected to operate in the future unless fractionation spreads are favorable and volumes are sufficient to run the plant.
Ohio River Valley Assets. The Partnership's Ohio River Valley assets include a 4,500-barrel-per-hour crude oil barge loading terminal on the Ohio River, a crude oil rail loading terminal on the Ohio Central Railroad network that is being expanded to a 20-spot operation and approximately 200 miles of crude oil pipelines in Ohio and West Virginia. The assets also include 500,000 barrels of above ground storage and a trucking fleet of approximately 100 vehicles comprised of both semi and straight trucks with a current capacity of 25,000 Bbls/d. Total crude oil handled averaged approximately 9,800 Bbls/d for the six months operated by the Partnership during 2012. The Partnership has seven existing brine disposal wells with an injection capacity of approximately 10,000 Bbls/d and an average disposal rate of 7,800 Bbls/d for the six months operated by the Partnership during 2012. The Partnership currently holds two additional well permits in Ohio, one of which is under development. In addition, the Partnership owns more than 2,500 miles of unused rights-of-way.
13
Table of Contents
Industry Overview
The following diagram illustrates the gathering, processing, fractionation and transmission process.
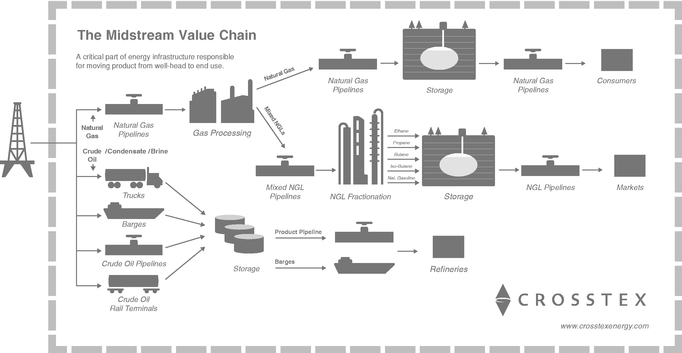
The midstream industry is the link between the exploration and production of natural gas and crude oil and the delivery of its components to end-user markets. The midstream industry is generally characterized by regional competition based on the proximity of gathering systems and processing plants to natural gas and crude oil producing wells.
Natural gas gathering. The natural gas gathering process follows the drilling of wells into gas-bearing rock formations. After a well has been completed, it is connected to a gathering system. Gathering systems typically consist of a network of small diameter pipelines and, if necessary, compression and treating systems that collect natural gas from points near producing wells and transport it to larger pipelines for further transmission.
Compression. Gathering systems are operated at pressures that will maximize the total natural gas throughput from all connected wells. Because wells produce gas at progressively lower field pressures as they age, it becomes increasingly difficult to deliver the remaining production in the ground against the higher pressure that exists in the connected gathering system. Natural gas compression is a mechanical process in which a volume of gas at an existing pressure is compressed to a desired higher pressure, allowing gas that no longer naturally flows into a higher-pressure downstream pipeline to be brought to market. Field compression is typically used to allow a gathering system to operate at a lower pressure or provide sufficient discharge pressure to deliver gas into a higher-pressure downstream pipeline. The remaining natural gas in the ground will not be produced if field compression is not installed because the gas will be unable to overcome the higher gathering system pressure. In contrast, a declining well can continue delivering natural gas if the field compression is installed.
Natural gas processing. The principal components of natural gas are methane and ethane, but most natural gas also contains varying amounts of heavier NGLs and contaminants, such as water and CO2, sulfur compounds, nitrogen or helium. Natural gas produced by a well may not be suitable for long-haul pipeline transportation or commercial use and may need to be processed to remove the heavier hydrocarbon components and contaminants. Natural gas in commercial distribution systems
14
Table of Contents
mostly consists of methane and ethane, and moisture and other contaminants have been removed so there are negligible amounts of them in the gas stream. Natural gas is processed to remove unwanted contaminants that would interfere with pipeline transportation or use of the natural gas and to separate those hydrocarbon liquids from the gas that have higher value as NGLs. The removal and separation of individual hydrocarbons through processing is possible due to differences in weight, boiling point, vapor pressure and other physical characteristics. Natural gas processing involves the separation of natural gas into pipeline-quality natural gas and a mixed NGL stream and the removal of contaminants.
NGL fractionation. NGLs are separated into individual, more valuable components during the fractionation process. NGL fractionation facilities separate mixed NGL streams into discrete NGL products: ethane, propane, isobutane, normal butane, natural gasoline and stabilized condensate. Ethane is primarily used in the petrochemical industry as feedstock for ethylene, one of the basic building blocks for a wide range of plastics and other chemical products. Propane is used as a petrochemical feedstock in the production of ethylene and propylene and as a heating fuel, an engine fuel and industrial fuel. Isobutane is used principally to enhance the octane content of motor gasoline. Normal butane is used as a petrochemical feedstock in the production of ethylene and butylene (a key ingredient in synthetic rubber), as a blend stock for motor gasoline and to derive isobutene through isomerization. Natural gasoline, a mixture of pentanes and heavier hydrocarbons, is used primarily as motor gasoline blend stock or petrochemical feedstock.
Natural gas transmission. Natural gas transmission pipelines receive natural gas from mainline transmission pipelines, processing plants and gathering systems and deliver it to industrial end-users, utilities and to other pipelines.
Crude Oil and Condensate Transmission. Crude oil and condensate are transported by pipelines, barges, rail cars and tank trucks. The method of transportation used depends on, among other things, the resources of the transporter, the locations of the production points and the delivery points, cost-efficiency and the quantity of product being transported.
Brine Gathering and Disposal Services. Typically, shale wells produce significant amounts of water that, in most cases, require disposal. Produced water and frac-flowback is hauled via truck transport or is pumped through pipelines from its origin at the oilfield tank battery or drilling pad to the disposal location. Once the water reaches the delivery disposal location, water is processed and filtered to remove impurities and injection wells place fluids underground for storage and disposal.
Crude oil terminals. Crude oil rail terminals are an integral part of ensuring the movement of new crude oil production from the developing shale plays in the United States and Canada. In general, the crude oil rail loading terminals are used to load rail cars and transport the commodity out of developing basins into market rich areas of the country where crude rail unloading terminals are used to unload rail cars and store crude oil volumes for third parties until the oil is redelivered to premium markets via pipelines, trucks or rail to delivery points.
Balancing Supply and Demand
When the Partnership purchases natural gas and crude oil, it establishes a margin normally by selling it for physical delivery to third-party users. It can also use over-the-counter derivative instruments or enter into future delivery obligations under futures contracts on the New York Mercantile Exchange (the "NYMEX") related to its natural gas purchases. Through these transactions, the Partnership seeks to maintain a position that is balanced between purchases, on the one hand, and sales or future delivery obligations, on the other hand. Its policy is not to acquire and hold natural gas futures contracts or derivative products for the purpose of speculating on price changes. The Partnership currently has not entered into over-the-counter derivative instruments related to its crude oil purchases.
15
Table of Contents
Competition
The business of providing gathering, transmission, processing and marketing services for crude oil, natural gas and NGLs is highly competitive. The Partnership faces strong competition in obtaining natural gas and crude oil supplies and in the marketing and transportation of crude oil, natural gas and NGLs. Its competitors include major integrated and independent E&P oil companies, natural gas producers, interstate and intrastate pipelines, other natural gas and crude oil gatherers and natural gas processors. Competition for natural gas and crude oil supplies is primarily based on geographic location of facilities in relation to production or markets, the reputation, efficiency and reliability of the gatherer and the pricing arrangements offered by the gatherer. Many of the Partnership's competitors offer more services or have greater financial resources and access to larger natural gas and crude oil supplies than it does. The Partnership's competition varies in different geographic areas.
In marketing natural gas and NGLs, the Partnership has numerous competitors, including marketing affiliates of interstate pipelines, major integrated oil and gas companies, and local and national natural gas producers, gatherers, brokers and marketers of widely varying sizes, financial resources and experience. Local utilities and distributors of natural gas are, in some cases, engaged directly and through affiliates in marketing activities that compete with the Partnership's marketing operations.
The Partnership faces strong competition for acquisitions and development of new projects from both established and start-up companies. Competition increases the cost to acquire existing facilities or businesses and results in fewer commitments and lower returns for new pipelines or other development projects. Many of the Partnership's competitors have greater financial resources or lower cost of capital or are willing to accept lower returns or greater risks. The Partnership's competition differs by region and by the nature of the business or the project involved.
Natural Gas Supply
The Partnership's gathering and transmission pipelines have connections with major intrastate and interstate pipelines, which it believes have ample natural gas supplies in excess of the volumes required for the operation of these systems. The Partnership evaluates well and reservoir data that is either publicly available or furnished by producers or other service providers in connection with the construction and acquisition of its gathering systems to determine the availability of natural gas supply for the systems and/or obtain a minimum volume commitment from the producer that results in a rate of return on investment. Based on these facts, the Partnership believes that there should be adequate natural gas supply to recoup its investment with an adequate rate of return. The Partnership does not routinely obtain independent evaluations of reserves dedicated to its systems due to the cost and relatively limited benefit of such evaluations. Accordingly, it does not have estimates of total reserves dedicated to its systems or the anticipated life of such producing reserves.
Credit Risk and Significant Customers
The Partnership is diligent in attempting to ensure that it issues credit to only credit-worthy customers. However, the purchase and resale of oil, gas and other products exposes it to significant credit risk, as the margin on any sale is generally a very small percentage of the total sale price. Therefore, a credit loss can be very large relative to the Partnership's overall profitability.
During the year ended December 31, 2012, the Partnership had only one customer, Dow, which represented greater than 10.0% of its revenue. While this customer represented 10.5% of consolidated revenues, the loss of this customer would not have a material impact on the Partnership's results of operations because the gross operating margins received from transactions with this customer are not material to the Partnership's total gross operating margin, and the Partnership believes the sales to this customer could be replaced with other buyers at comparable sales prices.
16
Table of Contents
Regulation
Regulation by FERC of Interstate Natural Gas Pipelines. The Partnership does not own any interstate natural gas pipelines, so the Federal Energy Regulatory Commission, or FERC, does not directly regulate its operations under the National Gas Act, or NGA. However, FERC's regulation of interstate natural gas pipelines influences certain aspects of the Partnership's business and the market for its products. In general, FERC has authority over natural gas companies that provide natural gas pipeline transportation services in interstate commerce and its authority to regulate those services includes:
- •
- the certification and construction of new facilities;
- •
- the extension or abandonment of services and facilities;
- •
- the maintenance of accounts and records;
- •
- the acquisition and disposition of facilities;
- •
- maximum rates payable for certain services; and
- •
- the initiation and discontinuation of services.
While the Partnership does not own any interstate pipelines, it does transport gas in interstate commerce. The rates, terms and conditions of service under which the Partnership transports natural gas in its pipeline systems in interstate commerce are subject to FERC jurisdiction under Section 311 of the Natural Gas Policy Act, or NGPA. The maximum rates for services provided under Section 311 of the NGPA may not exceed a "fair and equitable rate," as defined in the NGPA. The rates are generally subject to review every three years by FERC or by an appropriate state agency. The inability to obtain approval of rates at acceptable levels could result in refund obligations, the inability to achieve adequate returns on investments in new facilities and the deterrence of future investment or growth of the regulated facilities.
Regulation by FERC of Interstate Liquids Pipelines. As discussed in "Recent Growth Developments," the Partnership acquired liquids transportation, storage and other assets in the Ohio River Valley in 2012, including certain assets providing common carrier interstate service subject to regulation by FERC under the Interstate Commerce Act, or ICA, the Energy Policy Act of 1992 and related rules and orders. Further, the Partnership began construction in 2012 of an expansion of the Cajun-Sibon NGL pipeline that is connected to its fractionation facilities in south Louisiana. This expansion is scheduled to be operational mid-2013. Once operational, the expansion will be subject to regulation by FERC as a common carrier under the ICA, the Energy Policy Act of 1992 and related rules and orders.
FERC regulation requires that interstate liquids pipeline rates and terms and conditions of service, including rates for transportation of crude oil and NGLs, be filed with FERC and that these rates and terms and conditions of service be "just and reasonable" and not unduly discriminatory or unduly preferential.
Rates of interstate liquids pipelines are currently regulated by FERC primarily through an annual indexing methodology, under which pipelines increase or decrease their rates in accordance with an index adjustment specified by FERC. For the five-year period beginning in 2010, FERC established an annual index adjustment equal to the change in the producer price index for finished goods plus 2.65%. This adjustment is subject to review every five years. Under FERC's regulations, liquids pipelines can request a rate increase that exceeds the rate obtained through application of the indexing methodology by using a cost-of-services approach, but only after the pipeline establishes that a substantial divergence exists between the actual costs experienced by the pipeline and the rates resulting from application of the indexing methodology.
17
Table of Contents
The ICA permits interested persons to challenge proposed new or changed rates and authorizes FERC to suspend the effectiveness of such rates for up to seven months and investigate such rates. If, upon completion of an investigation, FERC finds that the new or changed rate is unlawful, it is authorized to require the pipeline to refund revenues collected in excess of the just and reasonable rate during the term of the investigation. FERC may also investigate, upon complaint or on its own motion, rates that are already in effect and may order a carrier to change its rates prospectively. Under certain circumstances, FERC could limit the Partnership's ability to set rates based on its costs or could order the Partnership to reduce its rates and could require the payment of reparations to complaining shippers for up to two years prior to the date of the complaint. FERC also has the authority to change the Partnership's terms and conditions of service if it determines that they are unjust and unreasonable or unduly discriminatory or preferential.
As the Partnership acquires, constructs and operates new liquids assets and expands its liquids transportation business segment, the classification and regulation of its liquids transportation services are subject to ongoing assessment and change based on the services the Partnership provides and determinations by FERC and the courts. Such changes may subject additional services the Partnership provides to regulation by FERC.
Intrastate Pipeline Regulation. The Partnership's intrastate natural gas pipeline operations are subject to regulation by various agencies of the states in which they are located. Most states have agencies that possess the authority to review and authorize natural gas transportation transactions and the construction, acquisition, abandonment and interconnection of physical facilities. Some states also have state agencies that regulate transportation rates, service terms and conditions and contract pricing to ensure their reasonableness and to ensure that the intrastate pipeline companies that they regulate do not discriminate among similarly situated customers.
Gathering Pipeline Regulation. Section 1(b) of the NGA exempts natural gas gathering facilities from the jurisdiction of FERC under the NGA. The Partnership owns a number of natural gas pipelines that it believes meet the traditional tests FERC has used to establish a pipeline's status as a gatherer not subject to FERC jurisdiction. State regulation of gathering facilities generally includes various safety, environmental and, in some circumstances, nondiscriminatory take requirements, and in some instances complaint-based rate regulation.
The Partnership is subject to some state ratable take and common purchaser statutes. The ratable take statutes generally require gatherers to take, without undue discrimination, natural gas production that may be tendered to the gatherer for handling. Similarly, common purchaser statutes generally require gatherers to purchase without undue discrimination as to source of supply or producer. These statutes are designed to prohibit discrimination in favor of one producer over another producer or one source of supply over another source of supply.
Sales of Natural Gas. The price at which the Partnership sells natural gas currently is not subject to federal regulation and, for the most part, is not subject to state regulation. The Partnership's natural gas sales are affected by the availability, terms and cost of pipeline transportation. As noted above, the price and terms of access to pipeline transportation are subject to extensive federal and state regulation. FERC is continually proposing and implementing new rules and regulations affecting those segments of the natural gas industry, most notably interstate natural gas transmission companies that remain subject to FERC's jurisdiction. These initiatives also may affect the intrastate transportation of natural gas under certain circumstances. The Partnership cannot predict the ultimate impact of these regulatory changes on its natural gas marketing operations, but it does not believe that it will be affected by any such FERC action in a manner that is materially different from the natural gas marketers with whom it competes.
18
Table of Contents
Environmental Matters
General. The Partnership's operations involve processing and pipeline services for delivery of hydrocarbons (natural gas, NGLs, petroleum and fractionates) from point-of-origin at oil and gas wellheads operated by its suppliers to its end-use market customers. The Partnership's facilities include natural gas processing and fractionation plants, brine disposal well, pipelines and associated facilities, fractionation and storage units for NGLs, and transportation and delivery of petroleum. As with all companies in the Partnership's industrial sector, its operations are subject to stringent and complex federal, state and local laws and regulations relating to release of hazardous substances or wastes into the environment or otherwise relating to protection of the environment. Compliance with existing and anticipated environmental laws and regulations increases the Partnership's overall costs of doing business, including costs of planning, constructing, and operating plants, pipelines, and other facilities, as well as capital cost items necessary to maintain or upgrade equipment and facilities. Similar costs are likely upon changes in laws or regulations and upon any future acquisition of operating assets.
The Partnership believes its operations are in material compliance with applicable environmental laws and regulations. However, any failure to comply with applicable environmental laws and regulations, including those relating to equipment failures, and obtaining required governmental approvals, may result in the assessment of administrative, civil or criminal penalties, imposition of investigatory or remedial activities and, in less common circumstances, issuance of temporary or permanent injunctions or construction or operation bans or delays.
The Partnership believes that it currently holds all material governmental approvals required to operate its major facilities. As part of the regular evaluation of its operations, the Partnership routinely reviews and updates governmental approvals as necessary. The Partnership believes that its operations and facilities are in substantial compliance with applicable environmental laws and regulations and that the cost of compliance with such laws and regulations currently in effect will not have a material adverse effect on its operating results or financial condition.
The continuing trend in environmental regulation is to place more restrictions and limitations on activities that may affect the environment, and thus there can be no assurance as to the amount or timing of future expenditures for environmental compliance or remediation, and actual future expenditures may be different from the amounts the Partnership currently anticipates. Moreover, risks of process upsets, accidental releases or spills are associated with possible future operations, and the Partnership cannot assure you that the Partnership will not incur significant costs and liabilities, including those relating to claims for damage to property and persons as a result of any such upsets, releases or spills. In the event of future increases in environmental costs, the Partnership may be unable to pass on those cost increases to its customers. A discharge of hazardous substances or wastes into the environment could, to the extent losses related to the event are not insured, subject the Partnership to substantial expense, including both the cost to comply with applicable laws and regulations and to pay fines or penalties that may be assessed and the cost related to claims made by neighboring landowners and other third parties for personal injury or damage to natural resources or property. The Partnership will attempt to anticipate future regulatory requirements that might be imposed and plan accordingly to comply with changing environmental laws and regulations and to minimize costs with respect to more stringent future laws and regulations or more rigorous enforcement of existing laws and regulations.
Hazardous Substances and Waste. Environmental laws and regulations that relate to the release of hazardous substances or solid wastes into soils, groundwater and surface water and/or include measures to prevent and control pollution may pose the highest potential cost to the Partnership's industry sector. These laws and regulations generally regulate the generation, storage, treatment, transportation and disposal of solid and hazardous wastes and may require investigatory and corrective actions at facilities where such waste may have been released or disposed. For instance, the Comprehensive
19
Table of Contents
Environmental Response, Compensation, and Liability Act, or CERCLA, also known as the federal "Superfund" law, and comparable state laws impose liability without regard to fault or the legality of the original conduct on certain classes of persons that contributed to a release of "hazardous substance" into the environment. Potentially liable persons include the owner or operator of the site where a release occurred and companies that disposed or arranged for the disposal of the hazardous substances found at the site. Under CERCLA, these persons may be subject to joint and several liability for the costs of cleaning up the hazardous substances that have been released into the environment, for damages to natural resources, and for the costs of certain health studies. CERCLA also authorizes the Environmental Protection Agency (EPA) and, in some cases, third parties to take actions in response to threats to the public health or the environment and to seek to recover from the potentially responsible classes of persons the costs they incur. It is not uncommon for neighboring landowners and other third parties to file claims for personal injury and property damage allegedly caused by hazardous substances or other wastes released into the environment. Although petroleum, natural gas and NGLs are excluded from CERCLA's definition of a "hazardous substance" in the course of ordinary operations, the Partnership may generate wastes that may fall within the definition of a "hazardous substance." In addition, there are other laws and regulations that can create liability for releases of petroleum, natural gas or NGLs. Moreover, the Partnership may be responsible under CERCLA or other laws for all or part of the costs required to clean up sites at which such wastes have been disposed. The Partnership has not received any notification that the Partnership may be potentially responsible for cleanup costs under CERCLA or any analogous federal or state law.
The Partnership also generates, and may in the future generate, both hazardous and nonhazardous solid wastes that are subject to requirements of the federal Resource Conservation and Recovery Act, or RCRA, and/or comparable state statutes. From time to time, the EPA and state regulatory agencies have considered the adoption of stricter disposal standards for nonhazardous wastes, including crude oil and natural gas wastes. Moreover, it is possible that some wastes generated by the Partnership that are currently considered as nonhazardous may in the future be designated as "hazardous wastes," resulting in the wastes being subject to more rigorous and costly management and disposal requirements. Changes in applicable laws or regulations may result in an increase in the Partnership's capital expenditures or plant operating expenses or otherwise impose limits or restrictions on its production and operations.
The Partnership currently owns or leases, has in the past owned or leased, and in the future the Partnership may own or lease, properties that have been used over the years for brine disposal operations, crude and condensate transportation, natural gas gathering, treating or processing and for NGL fractionation, transportation or storage. Solid waste disposal practices within the NGL industry and other oil and natural gas related industries have improved over the years with the passage and implementation of various environmental laws and regulations. Nevertheless, some hydrocarbons and other solid wastes have been disposed of on or under various properties owned or leased by the Partnership during the operating history of those facilities. In addition, a number of these properties may have been operated by third parties over whose operations and hydrocarbon and waste management practices the Partnership had no control. These properties and wastes disposed thereon may be subject to the Safe Drinking Water Act, CERCLA, RCRA and analogous state laws. Under these laws, the Partnership could be required, alone or in participation with others, to remove or remediate previously disposed wastes or property contamination, if present, including groundwater contamination, or to take action to prevent future contamination.
Air Emissions. The Partnership's current and future operations are subject to the federal Clean Air Act and comparable state laws and regulations. These laws and regulations regulate emissions of air pollutants from various industrial sources, including the Partnership's facilities, and impose various controls together with monitoring and reporting requirements. Pursuant to these laws and regulations, the Partnership may be required to obtain environmental agency pre-approval for the construction or
20
Table of Contents
modification of certain projects or facilities expected to produce air emissions or result in an increase in existing air emissions, obtain and comply with the terms of air permits, which include various emission and operational limitations, or use specific emission control technologies to limit emissions. The Partnership likely will be required to incur certain capital expenditures in the future for air pollution control equipment in connection with maintaining or obtaining governmental approvals addressing air emission-related issues. Failure to comply with applicable air statutes or regulations may lead to the assessment of administrative, civil or criminal penalties and may result in the limitation or cessation of construction or operation of certain air emission sources. Although it can give no assurances, the Partnership believes such requirements will not have a material adverse effect on its financial condition or operating results, and the requirements are not expected to be more burdensome to the Partnership than to any similarly situated company.
On April 17, 2012, the EPA approved final rules under the Clean Air Act that establish new air emission controls for oil and natural gas production, pipelines and processing operations. These rules became effective on October 15, 2012. For new or reworked hydraulically-fractured gas wells, the rules require the control of emissions through flaring or reduced emission (or "green") completions until 2015, when the rules require the use of green completions by all such wells except wildcat (exploratory) and delineation gas wells and low reservoir pressure non-wildcat and non-delineation gas wells. The rules also establish specific new requirements regarding emissions from wet seal and reciprocating compressors at production facilities, gathering systems, boosting facilities and onshore natural gas processing plants, effective October 15, 2012, and from pneumatic controllers and storage vessels at production facilities, gathering systems, boosting facilities and onshore natural gas processing plants, effective October 15, 2013. In addition, the rules revise existing requirements for volatile organic compound emissions from equipment leaks at onshore natural gas processing plants by lowering the leak definition for valves from 10,000 parts per million to 500 parts per million and requiring the monitoring of connectors, pumps, pressure relief devices and open-ended lines, effective October 15, 2012. These rules may therefore require a number of modifications to the Partnership's and its suppliers' and customers' operations, including the installation of new equipment to control emissions.
In October 2012, several challenges to the EPA's April 17, 2012 rules were filed by various parties, including environmental groups and industry associations. In a January 1, 2013 unopposed motion to hold this litigation in abeyance, the EPA indicated that it may reconsider some aspects of the rules. Depending on the outcome of such proceedings, the rules may be modified or rescinded or the EPA may issue new rules. The costs of compliance with any modified or newly issued rules cannot be predicted. Additionally, on December 11, 2012, seven states submitted a notice of intent to sue the EPA to compel the agency to make a determination as to whether standards of performance limiting methane emissions from the oil and gas sector are appropriate, which was not addressed in the EPA rule that became effective on October 15, 2012. The notice of intent also requested that the EPA issue emission guidelines for the control of methane emissions from existing oil and gas sources. Depending on whether such rules are promulgated and the applicability and restrictions in any promulgated rule, compliance with such rules could result in additional costs, including increased capital expenditures and operating costs for the Partnership and for other companies in its industry. While the Partnership is not able at this time to estimate such additional costs, as is the case with similarly situated entities in the industry, they could be significant for the Partnership. Compliance with such rules, as well as any new state rules, may also make it more difficult for the Partnership's suppliers and customers to operate, thereby reducing the volume of natural gas transported through its pipelines, which may adversely affect its business.
Climate Change. In response to concerns suggesting that emissions of certain gases, commonly referred to as "greenhouse gases" (including carbon dioxide and methane), may be contributing to warming of the earth's atmosphere, the EPA is taking steps that would result in the regulation of greenhouse gases as pollutants under the federal Clean Air Act.
21
Table of Contents
In October 2009, the EPA promulgated its Mandatory Reporting Rule for greenhouse gases, which requires the monitoring and reporting of greenhouse gas emissions on an annual basis. All of the Partnership's facilities operating combustion sources, such as engines or natural gas fractionation facilities, are subject to the greenhouse gas reporting requirements included in the October 2009 final rule. The first annual greenhouse gas emissions inventory for the Partnership's affected facilities was filed by the Partnership in September 2011. In November 2010 and further in December 2011, the EPA expanded the scope of the Mandatory Reporting Rule to include petroleum and natural gas pipeline systems, which applies the Mandatory Reporting Rule's requirements to, among other sources, fugitive and vented methane emissions from the oil and gas sector, including natural gas transmission compression. The Partnership's transmission compression facilities as well as gathering compressor stations with large amine treating capacities are also required to report under this expanded rule. The first reports for these facilities were due in 2012. Although the Mandatory Reporting Rule does not control greenhouse gas emission levels from any facilities, it has still caused the Partnership to incur monitoring and reporting costs for emissions that are subject to the rule.
After a series of regulatory actions finalized by the EPA between December 2009 and May 2010, greenhouse gases became pollutants "subject to regulation" under the Clean Air Act's Prevention of Significant Deterioration (PSD) air quality permit program for stationary sources, which in turn triggered permitting requirements under the Clean Air Act's Title V permitting program. In the "Tailoring Rule," the EPA promulgated regulatory thresholds for greenhouse gases that make PSD permitting requirements applicable to only relatively large sources of greenhouse gas emissions. As a result, new and modified stationary sources that emit greenhouse gases over statutory thresholds and the Tailoring Rule's regulatory thresholds must obtain a PSD permit setting forth Best Available Control Technology (BACT) for those emissions. The current Tailoring Rule threshold levels act to limit PSD permitting for greenhouse gases to only relatively large sources of greenhouse gas emissions, but the EPA has indicated that it may tighten the Tailoring Rule thresholds in the future, subjecting additional sources to PSD permitting requirements for greenhouse gases. The EPA has also proposed to regulate greenhouse gas emissions from certain electric generating units through the Clean Air Act's New Source Performance Standards (NSPS) program, and may expand greenhouse gas NSPS requirements to additional source categories in the future. Any new requirements could in the future affect the Partnership's operations and its ability to obtain air permits for new or modified facilities.
The U.S. Congress has considered but has not yet enacted legislation to mandate reductions of greenhouse gas emissions, and almost half of the states, either individually or through multi-state regional initiatives, have already taken legal measures intended to reduce greenhouse gas emissions, primarily through the planned development of greenhouse gas emission inventories and/or greenhouse gas cap and trade programs.
Because regulation of greenhouse gas emissions is relatively new, further regulatory, legislative and judicial developments are likely to occur. Such developments in greenhouse gas initiatives may affect the Partnership and other companies operating in the oil and gas industry. In addition to these developments, recent judicial decisions have allowed certain tort claims alleging property damage to proceed against greenhouse gas emissions sources, which may increase the Partnership's litigation risk for such claims. Due to the uncertainties surrounding the regulation of and other risks associated with greenhouse gas emissions, the Partnership cannot predict the financial impact of related developments on it.
Federal or state legislative or regulatory initiatives that regulate or restrict emissions of greenhouse gases in areas in which the Partnership conducts business could adversely affect the availability of, or demand for, the products the Partnership stores, transports and processes, and, depending on the particular program adopted, could increase the costs of its operations, including costs to operate and maintain its facilities, install new emission controls on its facilities, acquire allowances to authorize its greenhouse gas emissions, pay any taxes related to its greenhouse gas emissions and/or administer and
22
Table of Contents
manage a greenhouse gas emissions program. The Partnership may be unable to recover any such lost revenues or increased costs in the rates it charges its customers, and any such recovery may depend on events beyond its control, including the outcome of future rate proceedings before FERC or state regulatory agencies and the provisions of any final legislation or regulations. Reductions in the Partnership's revenues or increases in its expenses as a result of climate control initiatives could have adverse effects on its business, financial position, results of operations and prospects.
Some scientific studies on climate change suggest that adverse weather events may become stronger or more frequent in the future in certain of the areas in which the Partnership operates, although the scientific studies are not unanimous. Due to their location, the Partnership's operations along the Gulf Coast are vulnerable to operational and structural damages resulting from hurricanes and other severe weather systems, while inland operations include areas subject to tornadoes. The Partnership's insurance may not cover all associated losses. The Partnership is taking steps to mitigate physical risks from storms, but no assurance can be given that future storms will not have a material adverse effect on its business.
Water and Hydraulic Fracturing Regulation. The Federal Water Pollution Control Act, also known as the Clean Water Act, and comparable state laws impose restrictions and strict controls regarding the discharge of pollutants, including NGL related wastes, into state waters or waters of the United States. Regulations promulgated pursuant to these laws require that entities that discharge into federal and state waters obtain National Pollutant Discharge Elimination System, or NPDES, and/or state permits authorizing these discharges. The Clean Water Act and analogous state laws assess administrative, civil and criminal penalties for discharges of unauthorized pollutants into the water and impose substantial liability for the costs of removing spills from such waters. In addition, the Clean Water Act and analogous state laws require that individual permits or coverage under general permits be obtained by covered facilities for discharges of storm water runoff. The Partnership believes that it is in substantial compliance with Clean Water Act permitting requirements as well as the conditions imposed thereunder and that continued compliance with such existing permit conditions will not have a material effect on its results of operations.
The Partnership operates brine disposal wells that are regulated as Class II wells under the federal Safe Drinking Water Act (SDWA). The SDWA imposes requirements on owners and operators of Class II wells through the EPA's Underground Injection Control program, including construction, operating, monitoring and testing, reporting and closure requirements. The Partnership's brine disposal wells are also subject to comparable state laws and regulations, which in some cases are more stringent than requirements under the federal SDWA. Compliance with current and future laws and regulations regarding the Partnership's brine disposal wells may impose substantial costs and restrictions on its brine disposal operations, as well as adversely affect demand for the Partnership's brine disposal services.
It is common for the Partnership's customers or suppliers to recover natural gas from deep shale formations through the use of hydraulic fracturing, combined with sophisticated horizontal drilling. Hydraulic fracturing is an important and commonly used process in the completion of wells by oil and gas producers. Hydraulic fracturing involves the injection of water, sand and chemical additives under pressure into rock formations to stimulate gas production. Due to public concerns raised regarding potential impacts of hydraulic fracturing on groundwater quality, legislative and regulatory efforts at the federal level and in some states and localities have been initiated to require or make more stringent the permitting and other regulatory requirements for hydraulic fracturing operations. There are certain governmental reviews either underway or being proposed that focus on environmental aspects of hydraulic fracturing practices. The White House Council on Environmental Quality is coordinating an administration-wide review of hydraulic fracturing practices, and a committee of the United States House of Representatives has conducted an investigation of hydraulic fracturing practices. In addition, the EPA is conducting a study of the potential environmental effects of hydraulic fracturing on drinking
23
Table of Contents
water and groundwater and has initiated plans to promulgate regulations controlling wastewater disposal associated with hydraulic fracturing and shale gas development. These ongoing or proposed studies, depending on their degree of pursuit and any meaningful results obtained, could spur initiatives to further regulate hydraulic fracturing. Additional regulatory burdens in the future, whether federal, state or local, could increase the cost of or restrict the ability of the Partnership's customers or suppliers to perform hydraulic fracturing. As a result, any increased federal, state or local regulation could reduce the volumes of natural gas that the Partnership's customers move through its gathering systems which would materially adversely affect its revenues and results of operations.
Employee Safety. The Partnership is subject to the requirements of the Occupational Safety and Health Act, referred to as OSHA, and comparable state laws that regulate the protection of the health and safety of workers. In addition, the OSHA hazard communication standard requires that information be maintained about hazardous materials used or produced in operations and that this information be provided to employees, state and local government authorities and citizens. The Partnership believes that its operations are in substantial compliance with the OSHA requirements including general industry standards, record keeping requirements, and monitoring of occupational exposure to regulated substances.
Pipeline Safety Regulations. The Partnership's pipelines are subject to regulation by the U.S. Department of Transportation (DOT). DOT's Pipeline Hazardous Material Safety Administration (PHMSA), acting through the Office of Pipeline Safety (OPS), administers the national regulatory program to assure the safe transportation of natural gas, petroleum and other hazardous materials by pipeline. OPS develops regulations and other approaches to risk management to assure safety in design, construction, testing, operation, maintenance and emergency response of pipeline facilities. The main bodies of safety regulations that cover the Partnership's operations are set forth at 49 CFR, Parts 192 (covering pipelines that transport natural gas) and 195 (pipelines that transport crude oil, carbon dioxide, NGL and petroleum products). In addition to recordkeeping and reporting requirements, amendments to 49 CFR Part 192 and 195 created the Pipeline Integrity Management in High Consequence Areas (PIM) requiring operators of transmission pipelines to ensure the integrity of their pipelines through hydrostatic pressure testing, the use of in-line inspection tools or through risk-based direct assessment techniques. In January 2012, the President signed into law the Pipeline Safety, Regulatory Certainty, and Job Creation Act of 2011 which increases potential penalties for pipeline safety violations, gives new rulemaking authority to DOT with respect to shut-off valves on transmission pipeline facilities constructed or entirely replaced after the rule is promulgated, requires DOT to revise incident notification guidance and imposes new records requirements on pipeline owners and operators. The new legislation also requires DOT to study and report to Congress on other areas of pipeline safety, including expanding the reach of the integrity management regulations beyond high consequences areas, but restricts DOT from promulgating expanded integrity management rules during the review period and for a period following submission of its report to Congress unless the rulemaking is needed to address a present condition that poses a risk to public safety, property or the environment. Additionally, PHMSA issued an Advisory Bulletin in May 2012, which advised pipeline operators of anticipated changes in annual reporting requirements and that if they are relying on design, construction, inspection, testing or other data to determine the pressures at which their pipelines should operate, the records of that data must be traceable, verifiable and complete. Locating such records and, in the absence of any such records, verifying maximum pressures through physical testing or modifying or replacing facilities to meet the demands of such pressures could significantly increase the Partnership's costs. Additionally, failure to locate such records or verify maximum pressures could result in reductions of allowable operating pressures, which would reduce available capacity on the Partnership's pipeline. At the state level, several states have passed legislation or promulgated rulemaking dealing with pipeline safety. The Partnership believes that its pipeline operations are in substantial compliance with applicable PHMSA and state requirements; however, due to the possibility of new or amended laws and regulations or reinterpretation of existing laws and regulations, there can
24
Table of Contents
be no assurance that future compliance with the PHMSA or state requirements will not have a material adverse effect on its results of operations or financial positions.
Bayou Corne Sinkhole Incident. The Partnership owns and operates a high-pressure pipeline and underground natural gas and NGL storage reservoirs and associated facilities near Bayou Corne, Louisiana. In August 2012, a large sinkhole formed in the vicinity of these pipelines and the Partnership's underground storage reservoirs located in Napoleonville, Louisiana. This sinkhole is situated west of the Partnership's underground natural gas and NGL storage facility.
Following the formation of the sinkhole, the Partnership and other pipeline operators in the area promptly undertook steps to depressurize and shutdown its pipelines in the affected area. In particular, the Partnership took a section of its 36-inch diameter natural gas pipeline out of service. The Partnership's pipeline remains out of service, which has partially interrupted service to certain markets including the Mississippi River but the Partnership worked with its customers to secure alternative natural gas supplies to minimize disruptions. In addition, the Partnership has begun work on rerouting this pipeline outside of the affected areas. Bringing this pipeline into operation will be subject to costs, lengthy and detailed planning, right-of-way acquisition and federal and state permitting requirements. The Partnership also implemented additional inspection and operational measures, including use restrictions, at its nearby underground facility. The damage to its business, including costs and loss of business, will be considerable. For more information regarding the costs associated with this sinkhole, please see "Item 7. Management's Discussion and Analysis of Financial condition and Results of Operations—Liquidity and Capital Resources—Changes in Operations During 2012 and 2013."
The cause and full consequences of this sinkhole and natural gas release and the conditions giving rise thereto remain uncertain. In addition, any restrictions imposed by governmental agencies could negatively impact the Partnership's assets. The Partnership is assessing the potential for recovering its losses from responsible parties and the Partnership is seeking recovery from its insurers. The Partnership's insurers, however, have denied the Partnership's insurance claim for coverage and filed a declaratory judgment asking a court to determine that its insurance policy does not cover this damage. The Partnership has sued its insurers for breach of contract due to its insurers' refusal to pay its insurance claim for this damage. The Partnership cannot assure you that the Partnership will be able to fully recover its losses through insurance recovery or claims against responsible parties.
Office Facilities
We occupy approximately 108,500 square feet of space at our executive offices in Dallas, Texas under a lease expiring in August 2019, approximately 25,100 square feet of office space for the Partnership's Louisiana operations in Houston, Texas with lease terms expiring in April 2023 and approximately 9,000 square feet of office space in Lafayette, Louisiana with lease terms expiring in January 2023.
Employees
As of December 31, 2012, the Partnership (through its subsidiaries) employed approximately 736 full-time employees. Approximately 205 of the employees were general and administrative, engineering, accounting and commercial personnel and the remainder were operational employees. The Partnership is not party to any collective bargaining agreements and has not had any significant labor disputes in the past. We believe that the Partnership has good relations with its employees.
Item 1A. Risk Factors
The following risk factors and all other information contained in this report should be considered carefully when evaluating us. These risk factors could affect our actual results. Other risks and uncertainties, in addition to those that are described below, may also impair our business operations. If any of the
25
Table of Contents
following risks occur, our business, financial condition or results of operations could be affected materially and adversely. In that case, we may be unable to pay dividends to our shareholders and the trading price of our common share could decline. These risk factors should be read in conjunction with the other detailed information concerning us set forth in our accompanying financial statements and notes and contained in "Item 7. Management's Discussion and Analysis of Financial Condition and Results of Operations" included herein.
Our cash flow consists almost exclusively of distributions from Crosstex Energy, L.P.
Our only cash-generating assets are our partnership interests in Crosstex Energy, L.P. Our cash flow is therefore completely dependent upon the ability of the Partnership to make distributions to its partners. The amount of cash that the Partnership can distribute to its partners, including us, each quarter principally depends upon the amount of cash it generates from its operations, which will fluctuate from quarter to quarter based on, among other things:
- •
- the amount of natural gas transported in its gathering and transmission pipelines;
- •
- the level of the Partnership's processing operations;
- •
- the fees the Partnership charges and the margins it realizes for its services;
- •
- the prices of, levels of production of and demand for oil and natural gas;
- •
- the volume of natural gas the Partnership gathers, compresses, processes, transports and sells, the volume of NGLs the Partnership processes or fractionates and sells, the volume of crude oil the Partnership handles at its crude terminals, the volume of crude oil the Partnership gathers, transports, purchases and sells and the volumes of brine the Partnership disposes;
- •
- the relationship between natural gas and NGL prices; and
- •
- its level of operating costs.
In addition, the actual amount of cash the Partnership will have available for distribution will depend on other factors, some of which are beyond its control, including:
- •
- the level of capital expenditures the Partnership makes;
- •
- the cost of acquisitions, if any;
- •
- its debt service requirements;
- •
- fluctuations in its working capital needs;
- •
- its ability to make working capital borrowings under its bank credit facility to pay distributions;
- •
- prevailing economic conditions; and
- •
- the amount of cash reserves established by the general partner in its sole discretion for the proper conduct of its business.
Because of these factors, the Partnership may not be able, or may not have sufficient available cash to pay distributions to unitholders each quarter. Furthermore, you should also be aware that the amount of cash the Partnership has available for distribution depends primarily upon its cash flow, including cash flow from financial reserves and working capital borrowings, and is not solely a function of profitability, which will be affected by non-cash items. As a result, the Partnership may make cash distributions during periods when it records losses and may not make cash distributions during periods when it records net income.
26
Table of Contents
We are largely prohibited from engaging in activities that compete with the Partnership.
Our primary business objective is to increase our cash available for dividends to our stockholders by assisting the Partnership in executing its business strategy. So long as we own the general partner of the Partnership, we are prohibited by an omnibus agreement with the Partnership from engaging in the business of gathering, transmitting, treating, processing, storing and marketing natural gas and crude oil and transporting, fractionating, storing and marketing NGLs, except to the extent that the Partnership, with the concurrence of its independent directors comprising its conflicts committee, elects not to engage in a particular acquisition or expansion opportunity. This exception for competitive activities is relatively limited. Although we are permitted to pursue certain opportunities under the omnibus agreement, such as competitive opportunities that the Partnership declines to pursue or permitted activities that are not in competition with the Partnership, the provisions of the omnibus agreement may, in the future, limit activities that we would otherwise pursue.
In our corporate charter, we have renounced business opportunities that may be pursued by the Partnership or by certain stockholders.
In our restated charter and in accordance with Delaware law, we have renounced any interest or expectancy we may have in, or in being offered an opportunity to participate in, any business opportunities, including any opportunities within those classes of opportunity currently pursued by the Partnership, presented to:
- •
- persons who are officers or directors of the company or who, on October 1, 2003, were, and at the time of presentation are, stockholders of the company (or to persons who are affiliates or associates of such officers, directors or stockholders), if the company is prohibited from participating in such opportunities by the omnibus agreement; or
- •
- any investment fund sponsored or managed by Yorktown Partners LLC, including any fund still to be formed, or to any of our directors who is an affiliate or designate of these entities.
As a result of this renunciation, these officers, directors and stockholders should not be deemed to be breaching any fiduciary duty to us if they or their affiliates or associates pursue opportunities presented as described above.
Although we control the Partnership, the general partner owes fiduciary duties to the Partnership and the unitholders.
Conflicts of interest exist and may arise in the future as a result of the relationship between us and our affiliates, including the general partner, on the one hand, and the Partnership and its limited partners, on the other hand. The directors and officers of Crosstex Energy GP, LLC have fiduciary duties to manage the general partner in a manner beneficial to us, its owner. At the same time, the general partner has a fiduciary duty to manage the Partnership in a manner beneficial to the Partnership and its limited partners. The board of directors of Crosstex Energy GP, LLC will resolve any such conflict and has broad latitude to consider the interests of all parties to the conflict. The resolution of these conflicts may not always be in our best interest or that of our stockholders.
For example, conflicts of interest may arise in the following situations:
- •
- the allocation of shared overhead expenses to the Partnership and us;
- •
- the interpretation and enforcement of contractual obligations between us and our affiliates, on the one hand, and the Partnership, on the other hand, including obligations under the omnibus agreement;
- •
- the determination of the amount of cash to be distributed to the Partnership's partners and the amount of cash to be reserved for the future conduct of the Partnership's business;
27
Table of Contents
- •
- the determination whether to make borrowings under the capital facility to pay distributions to partners; and
- •
- any decision we make in the future to engage in activities in competition with the Partnership as permitted under our omnibus agreement with the Partnership.
If the general partner is not fully reimbursed or indemnified for obligations and liabilities it incurs in managing the business and affairs of the Partnership, its value, and therefore the value of our common stock, could decline.
The general partner may make expenditures on behalf of the Partnership for which it will seek reimbursement from the Partnership. In addition, under Delaware partnership law, the general partner, in its capacity as the general partner of the Partnership, has unlimited liability for the obligations of the Partnership, such as its debts and environmental liabilities, except for those contractual obligations of the Partnership that are expressly made without recourse to the general partner. To the extent the general partner incurs obligations on behalf of the Partnership, it is entitled to be reimbursed or indemnified by the Partnership. In the event that the Partnership is unable or unwilling to reimburse or indemnify the general partner, the general partner may be unable to satisfy these liabilities or obligations, which would reduce its value and therefore the value of our common stock.
Risks Inherent in the Partnership's Business
The Partnership's profitability is dependent upon prices and market demand for oil, condensate, natural gas and NGLs, which are beyond its control and have been volatile.
The Partnership is subject to significant risks due to fluctuations in commodity prices. The Partnership is directly exposed to these risks primarily in the gas processing component of its business. For the year ended December 31, 2012 approximately 7.5% of its total gross operating margin was generated under percent of liquids contracts. Under these contracts the Partnership receives a fee in the form of a percentage of the liquids recovered and the producer bears all the cost of the natural gas shrink. Accordingly, the Partnership's revenues under these contracts are directly impacted by the market price of NGLs.
The Partnership also realizes processing gross operating margins under processing margin (margin) contracts. For the year ended December 31, 2012 approximately 9.6% of the Partnership's total gross operating margin was generated under processing margin contracts. The Partnership has a number of processing margin contracts with the Partnership's Plaquemine, Gibson, Eunice, Blue Water and Pelican processing plants. Under this type of contract, the Partnership pays the producer for the full amount of inlet gas to the plant, and it makes a margin based on the difference between the value of liquids recovered from the processed natural gas as compared to the value of the natural gas volumes lost ("shrink") and the cost of fuel used in processing. The shrink and fuel losses are referred to as plant thermal reduction or PTR. The Partnership's margins from these contracts can be greatly reduced or eliminated during periods of high natural gas prices relative to liquids prices.
The Partnership is also indirectly exposed to commodity prices due to the negative impacts on production and the development of production of oil, condensate, natural gas and NGLs connected to or near its assets and on its margins for transportation between certain market centers. Low prices for these products will reduce the demand for the Partnership's services and volumes on its systems.
In the past, the prices of oil, natural gas and NGLs have been extremely volatile, and the Partnership expects this volatility to continue. For example, prices of natural gas and NGLs in 2012 were below the market prices realized throughout most of 2011 while prices for oil were relatively consistent with 2011 market prices. Crude oil prices (based on the NYMEX futures daily close prices for the prompt month) in 2012 ranged from a high of $109.77 per Bbl in February 2012 to a low of
28
Table of Contents
$77.69 per Bbl in June 2012. Weighted average NGL prices in 2012 (based on the Oil Price Information Service (OPIS) Napoleonville daily average spot liquids prices) ranged from a high of $1.36 per gallon in January 2012 to a low of $0.79 per gallon in June 2012. Natural gas prices (based on Gas Daily Henry Hub closing prices) during 2012 ranged from a low of $1.83 per MMBtu in April 2012 to a high of $3.77 per MMBtu in November 2012.
The markets and prices for oil, condensate, natural gas and NGLs depend upon factors beyond the Partnership's control. These factors include the supply and demand for oil, condensate, natural gas and NGLs, which fluctuate with changes in market and economic conditions and other factors, including:
- •
- the impact of weather on the demand for oil and natural gas;
- •
- the level of domestic oil, condensate and natural gas production;
- •
- technology, including improved production techniques (particularly with respect to shale development);
- •
- the level of domestic industrial and manufacturing activity;
- •
- the availability of imported oil, natural gas and NGLs;
- •
- international demand for oil and NGLs;
- •
- actions taken by foreign oil and gas producing nations;
- •
- the availability of local, intrastate and interstate transportation systems;
- •
- the availability of downstream NGL fractionation facilities;
- •
- the availability and marketing of competitive fuels;
- •
- the impact of energy conservation efforts; and
- •
- the extent of governmental regulation and taxation, including the regulation of "greenhouse gases."
Changes in commodity prices may also indirectly impact the Partnership's profitability by influencing drilling activity and well operations, and thus the volume of gas, crude oil and condensate it gathers and processes. The volatility in commodity prices may cause the Partnership's gross operating margin and cash flows to vary widely from period to period. The Partnership's hedging strategies may not be sufficient to offset price volatility risk and, in any event, do not cover all of its throughput volumes. Moreover, hedges are subject to inherent risks, which we describe in "Item 7A. Quantitative and Qualitative Disclosure about Market Risk." The Partnership's use of derivative financial instruments does not eliminate its exposure to fluctuations in commodity prices and interest rates and has in the past and could in the future result in financial losses or reduced income. For a discussion of the Partnership's risk management activities, please read "Item 7A. Quantitative and Qualitative Disclosure about Market Risk."
The Partnership's substantial indebtedness could limit its flexibility and adversely affect its financial health.
The Partnership has a substantial amount of indebtedness. As of December 31, 2012, the Partnership had approximately $1.04 billion of indebtedness outstanding primarily comprised of $725.0 million (including $9.7 million of original issue discount) of senior unsecured notes due in 2018 and $250.0 million of senior unsecured notes due in 2022. As of December 31, 2012, there was $71.0 million of borrowing and $62.2 million in outstanding letters of credit under the bank credit facility leaving approximately $501.8 million available for future borrowings and letters of credit based on a borrowing capacity of $635.0 million. However, the financial covenants in the amended credit facility limit the amount of funds that the Partnership can borrow. As of December 31, 2012, based on
29
Table of Contents
the financial covenants in the amended credit facility, the Partnership could borrow approximately $334.6 million of additional funds.
The Partnership's substantial indebtedness could limit its flexibility and adversely affect its financial health. For example, it could:
- •
- make the Partnership more vulnerable to general adverse economic and industry conditions;
- •
- require the Partnership to dedicate a substantial portion of its cash flow from operations to payments on its indebtedness, thereby reducing the availability of its cash flow for operations and other purposes;
- •
- limit the Partnership's flexibility in planning for, or reacting to, changes in its business and the industry in which it operates; and
- •
- place the Partnership at a competitive disadvantage compared to competitors that may have proportionately less indebtedness.
In addition, the Partnership's ability to make scheduled payments or to refinance its obligations depends on its successful financial and operating performance. The Partnership cannot assure you that its operating performance will generate sufficient cash flow or that its capital resources will be sufficient for payment of its debt obligations in the future. The Partnership's financial and operating performance, cash flow and capital resources depend upon prevailing economic conditions and certain financial, business and other factors, many of which are beyond its control.
If the Partnership's cash flow and capital resources are insufficient to fund its debt service obligations, the Partnership may be forced to sell material assets or operations, obtain additional capital or restructure its debt. In the event that the Partnership is required to dispose of material assets or operations or restructure its debt to meet its debt service and other obligations, there cannot be any assurance as to the terms of any such transaction or how quickly any such transaction could be completed, if at all.
The Partnership may not be able to access new capital to fund its acquisition and growth strategies which could impair its ability to fund future capital needs and to grow.
Any limitations on the Partnership's access to capital will impair its ability to execute its growth strategy, complete future acquisitions or future construction projects or other capital expenditures, take advantage of other business opportunities or respond to competitive pressures, any of which could have a material adverse effect on the Partnership's revenues and results of operations. In addition, if the cost of capital becomes too expensive, its ability to develop or acquire strategic and accretive assets will be limited. Further, the Partnership's customers may increase collateral requirements from it, including letters of credit which reduce available borrowing capacity, or reduce the business they transact with the Partnership to reduce their credit exposure .
Due to the Partnership's lack of asset diversification, adverse developments in its gathering, transmission, processing, crude oil, condensate, and NGL services businesses would materially impact its financial condition.
The Partnership relies exclusively on the revenues generated from its gathering, transmission, processing, crude oil and condensate and NGL services businesses and as a result its financial condition depends upon prices of, and continued demand for, natural gas, NGLs and crude oil. Due to its lack of asset diversification, an adverse development in one of these businesses would have a significantly greater impact on its financial condition and results of operations than if the Partnership maintained more diverse assets.
30
Table of Contents
The Partnership may not be successful in balancing its purchases and sales.
The Partnership is a party to certain long-term gas sales commitments that it satisfies through supplies purchased under long-term gas purchase agreements. When the Partnership enters into those arrangements, its sales obligations generally match its purchase obligations. However, over time the supplies that the Partnership has under contract may decline due to reduced drilling or other causes and it may be required to satisfy the sales obligations by buying additional gas at prices that may exceed the prices received under the sales commitments. In addition, a producer could fail to deliver contracted volumes or deliver in excess of contracted volumes, or a consumer could purchase more or less than contracted volumes. Any of these actions could cause the Partnership's purchases and sales not to be balanced. If the Partnership's purchases and sales are not balanced, it will face increased exposure to commodity price risks and could have increased volatility in its operating income.
The Partnership has made commitments to purchase natural gas in production areas based on production-area indices and to sell the natural gas into market areas based on market-area indices, pay the costs to transport the natural gas between the two points and capture the difference between the indices as margin. Changes in the index prices relative to each other (also referred to as basis spread) can significantly affect the Partnership's margins or even result in losses. For example, the Partnership is a party to one contract with a term to 2019 to supply approximately 150,000 MMBtu/d of gas. The Partnership buys gas for this contract on several different production-area indices on its NTP and sells the gas into a different market area index. For the year ended December 31, 2012, the Partnership has recorded a loss of approximately $17.5 million on this contract, and the Partnership currently expects that it will record a loss of approximately $20.0 million to $24.0 million on this contract in 2013. Reduced supplies and narrower basis spreads in recent periods have increased the losses on this contract, and greater losses on this contract could occur in future periods if these conditions persist or become worse. For additional information on this contract, please see "Item 7. Management's Discussion and Analysis of Financial Condition and Results of Operations—Overview."
The Partnership must continually compete for crude oil, condensate and natural gas supplies, and any decrease in supplies of such commodities could adversely affect its financial condition and results of operations.
The Partnership's gathering systems are connected to wells and its crude oil and condensate assets service wells from which production will naturally decline over time, which means that cash flows associated with these assets will likely also decline over time. In order to maintain or increase throughput levels in the Partnership's natural gas gathering systems and asset utilization rates at its processing plants and to fulfill its current sales commitments, the Partnership must continually contract for new natural gas supplies. The Partnership may not be able to obtain additional contracts for crude oil, condensate and natural gas supplies. The primary factors affecting the Partnership's ability to connect new wells to its gathering facilities include its success in contracting for existing supplies that are not committed to other systems and the level of drilling activity near its gathering systems. If the Partnership is unable to maintain or increase the volumes on its systems by accessing new supplies to offset the natural decline in reserves, its business and financial results could be materially, adversely affected. In addition, the Partnership's future growth will depend in part upon whether it can contract for additional supplies at a greater rate than the rate of natural decline in its current supplies.
Fluctuations in energy prices can greatly affect production rates and investments by third parties in the development of new oil, condensate and natural gas reserves. Natural gas prices were relatively low in 2012 and continue to be depressed. Prolonged periods of low natural gas prices may put downward pressure on future drilling activity which may result in lower volumes. Tax policy changes or additional regulatory restrictions on development could also have a negative impact on drilling activity, reducing supplies of natural gas available to the Partnership's systems. Additional governmental regulation of, or delays in issuance of permits for, the offshore exploration and production industry may negatively
31
Table of Contents
impact current and future volumes from offshore pipelines supplying its processing plants. The Partnership has no control over producers and depends on them to maintain sufficient levels of drilling activity. A material decrease in production or in the level of drilling activity in its principal geographic areas for a prolonged period, as a result of depressed commodity prices or otherwise, likely would have a material adverse effect on the Partnership's results of operations and financial position.
A substantial portion of the Partnership's assets is connected or dependent on hydrocarbon reserves that will decline over time, and the cash flows associated with those assets will decline accordingly.
A substantial portion of the Partnership's assets, including its gathering systems, is dedicated to certain hydrocarbon reserves and wells for which the production will naturally decline over time. Accordingly, the Partnership's cash flows associated with these assets will also decline. If the Partnership is unable to access new supplies of hydrocarbons either by connecting additional reserves to its existing assets or by constructing or acquiring new assets that have access to additional hydrocarbon reserves, the Partnership's cash flows may decline.
Growing the Partnership's business by constructing new pipelines and processing facilities subjects it to construction risks, risks that oil, natural gas or NGL supplies will not be available upon completion of the facilities and risks of construction delay and additional costs due to obtaining rights-of-way permits and complying with federal, state and local laws.
One of the ways the Partnership intends to grow its business is through the construction of additions to its existing gathering systems and construction of new pipelines and gathering and processing facilities. The construction of pipelines and gathering and processing and fractionation facilities requires the expenditure of significant amounts of capital, which may exceed the Partnership's expectations. Generally, the Partnership may have only limited natural gas or NGL supplies committed to these facilities prior to their construction. Moreover, it may construct facilities to capture anticipated future growth in production in a region in which anticipated production growth does not materialize. The Partnership may also rely on estimates of proved reserves in its decision to construct new pipelines and facilities, which may prove to be inaccurate because there are numerous uncertainties inherent in estimating quantities of proved reserves. As a result, new facilities may not be able to attract enough natural gas and NGLs to achieve its expected investment return, which could adversely affect the Partnership's results of operations and financial condition. In addition, the Partnership faces the risks of construction delay and additional costs due to obtaining rights-of-way, federal permits, state permits and local permits and complying with federal or state laws and city ordinances.
The Partnership's failure to effectively execute its major development projects could result in significant delays and/or cost over-runs, limitations on its growth and negative effects on its operating results, liquidity and financial position.
The Partnership is engaged in the planning and construction of several major development projects, some of which will take a number of months before commercial operation, such as Phase I and Phase II of the Partnership's Cajun-Sibon pipeline expansions. These projects are complex and subject to a number of factors beyond the Partnership's control, including delays from third-party landowners, the permitting process, unavailability of materials, labor disruptions, environmental hazards, financing, accidents, weather and other factors. Any delay in the completion of these projects could have a material adverse effect on the Partnership's business, financial condition, results of operations and liquidity. Estimating the timing and expenditures related to these development projects is very complex and subject to variables that can significantly increase expected costs. Should the actual costs of these projects exceed the Partnership's estimates, its liquidity and capital position could be adversely affected. This level of development activity requires significant effort from the Partnership's management and technical personnel and places additional requirements on its financial resources and
32
Table of Contents
internal financial controls. The Partnership may not have the ability to attract and/or retain the necessary number of personnel with the skills required to bring complicated projects to successful conclusions.
The Partnership is vulnerable to operational, regulatory and other risks due to its concentration of assets in south Louisiana and the Gulf of Mexico, including the effects of adverse weather conditions such as hurricanes.
The Partnership's operations and revenues will be significantly impacted by conditions in south Louisiana and the Gulf of Mexico because it has a significant portion of its assets located in these two areas. The Partnership's concentration of activity in Louisiana and the Gulf of Mexico makes it more vulnerable than many of its competitors to the risks associated with these areas, including:
- •
- adverse weather conditions, including hurricanes and tropical storms;
- •
- delays or decreases in production, the availability of equipment, facilities or services; and
- •
- changes in the regulatory environment.
Because a significant portion of the Partnership's operations could experience the same condition at the same time, these conditions could have a relatively greater impact on its results of operations than they might have on other midstream companies that have operations in more diversified geographic areas.
The Partnership's use of derivative financial instruments does not eliminate its exposure to fluctuations in commodity prices and interest rates and has in the past and could in the future result in financial losses or reduce its income.
The Partnership's operations expose it to fluctuations in commodity prices, and its credit facility exposes the Partnership to fluctuations in interest rates. The Partnership uses over-the-counter price and basis swaps with other natural gas merchants and financial institutions. Use of these instruments is intended to reduce the Partnership's exposure to short-term volatility in commodity prices. As of December 31, 2012, the Partnership has hedged only portions of its expected exposures to commodity price risk. In addition, to the extent the Partnership hedges its commodity price risk using swap instruments, the Partnership will forego the benefits of favorable changes in commodity prices. Although the Partnership does not currently have any financial instruments to eliminate its exposure to interest rate fluctuations, the Partnership may use financial instruments in the future to offset its exposure to interest rate fluctuations.
Even though monitored by management, the Partnership's hedging activities may fail to protect it and could reduce its earnings and cash flow. The Partnership's hedging activity may be ineffective or adversely affect cash flow and earnings because, among other factors:
- •
- hedging can be expensive, particularly during periods of volatile prices;
- •
- the Partnership's counterparty in the hedging transaction may default on its obligation to pay or otherwise fail to perform; and
- •
- available hedges may not correspond directly with the risks against which the Partnership seeks protection. For example:
- •
- the duration of a hedge may not match the duration of the risk against which the Partnership seeks protection;
- •
- variations in the index used to price a commodity hedge may not adequately correlate with variations in the index used to sell the physical commodity (known as basis risk); and
33
Table of Contents
- •
- the Partnership may not produce or process sufficient volumes to cover swap arrangements it enters into for a given period. If its actual volumes are lower than the volumes it estimated when entering into a swap for the period, the Partnership might be forced to satisfy all or a portion of its derivative obligation without the benefit of cash flow from its sale or purchase of the underlying physical commodity, which could adversely affect liquidity.
The Partnership's financial statements may reflect gains or losses arising from exposure to commodity prices for which it is unable to enter into fully effective hedges. In addition, the standards for cash flow hedge accounting are rigorous. Even when the Partnership engages in hedging transactions that are effective economically, these transactions may not be considered effective cash flow hedges for accounting purposes. The Partnership's earnings could be subject to increased volatility to the extent its derivatives do not continue to qualify as cash flow hedges and, if the Partnership assumes derivatives as part of an acquisition, to the extent the Partnership cannot obtain or chooses not to seek cash flow hedge accounting for the derivatives it assumes. Please read "Item 7A. Quantitative and Qualitative Disclosures about Market Risk" for a summary of the Partnership's hedging activities.
A reduction in demand for NGL products by the petrochemical, refining or other industries or by the fuel markets could materially adversely affect the Partnership's results of operations and financial condition.
The NGL products the Partnership produces have a variety of applications, including as heating fuels, petrochemical feedstocks and refining blend stocks. A reduction in demand for NGL products, whether because of general or industry specific economic conditions, new government regulations, global competition, reduced demand by consumers for products made with NGL products (for example, reduced petrochemical demand observed due to lower activity in the automobile and construction industries), increased competition from petroleum-based feedstocks due to pricing differences, mild winter weather for some NGL applications or other reasons, could result in a decline in the volume of NGL products the Partnership handles or reduce the fees the Partnership charges for its services. The Partnership's NGL products and the demand for these products are affected as follows:
- •
- Ethane. Ethane is typically supplied as purity ethane or as part of ethane-propane mix. Ethane is primarily used in the petrochemical industry as feedstock for ethylene, one of the basic building blocks for a wide range of plastics and other chemical products. Although ethane is typically extracted as part of the mixed NGL stream at gas processing plants, if natural gas prices increase significantly in relation to NGL product prices or if the demand for ethylene falls, it may be more profitable for natural gas processors to leave the ethane in the natural gas stream thereby reducing the volume of NGLs delivered for fractionation and marketing.
- •
- Propane. Propane is used as a petrochemical feedstock in the production of ethylene and propylene, as a heating, engine and industrial fuel, and in agricultural applications such as crop drying. Changes in demand for ethylene and propylene could adversely affect demand for propane. The demand for propane as a heating fuel is significantly affected by weather conditions. The volume of propane sold is at its highest during the six-month peak heating season of October through March. Demand for the Partnership's propane may be reduced during periods of warmer-than-normal weather.
- •
- Normal Butane. Normal butane is used in the production of isobutane, as a refined product blending component, as a fuel gas, and in the production of ethylene and propylene. Changes in the composition of refined products resulting from governmental regulation, changes in feedstocks, products and economics, demand for heating fuel and for ethylene and propylene could adversely affect demand for normal butane.
34
Table of Contents
- •
- Isobutane. Isobutane is predominantly used in refineries to produce alkylates to enhance octane levels. Accordingly, any action that reduces demand for motor gasoline or demand for isobutane to produce alkylates for octane enhancement might reduce demand for isobutane.
- •
- Natural Gasoline. Natural gasoline is used as a blending component for certain refined products and as a feedstock used in the production of ethylene and propylene. Changes in the mandated composition resulting from governmental regulation of motor gasoline and in demand for ethylene and propylene could adversely affect demand for natural gasoline.
NGLs and products produced from NGLs also compete with global markets. Any reduced demand for ethane, propane, normal butane, isobutane or natural gasoline in the markets the Partnership accesses for any of the reasons stated above could adversely affect demand for the services the Partnership provides as well as NGL prices, which would negatively impact its results of operations and financial condition.
If the Partnership does not make acquisitions on economically acceptable terms or efficiently and effectively integrate the acquired assets with its asset base, its future growth will be limited.
The Partnership's ability to grow depends, in part, on its ability to make acquisitions that result in an increase in cash generated from operations on a per unit basis. If the Partnership is unable to make accretive acquisitions either because it is (1) unable to identify attractive acquisition candidates or negotiate acceptable purchase contracts with them, (2) unable to obtain financing for these acquisitions on economically acceptable terms or (3) outbid by competitors, then its future growth and its ability to increase distributions will be limited.
From time to time, the Partnership may evaluate and seek to acquire assets or businesses that it believes complement its existing business and related assets. The Partnership may acquire assets or businesses that it plans to use in a manner materially different from their prior owner's use. Any acquisition involves potential risks, including:
- •
- the inability to integrate the operations of recently acquired businesses or assets, especially if the assets acquired are in a new business segment or geographic area;
- •
- the diversion of management's attention from other business concerns;
- •
- the failure to realize expected volumes, revenues, profitability or growth;
- •
- the failure to realize any expected synergies and cost savings;
- •
- the coordination of geographically disparate organizations, systems and facilities;
- •
- the assumption of unknown liabilities;
- •
- the loss of customers or key employees from the acquired businesses;
- •
- a significant increase in the Partnership's indebtedness; and
- •
- potential environmental or regulatory liabilities and title problems.
Management's assessment of these risks is inexact and may not reveal or resolve all existing or potential problems associated with an acquisition. Realization of any of these risks could adversely affect the Partnership's operations and cash flows. If the Partnership consummates any future acquisition, its capitalization and results of operations may change significantly, and you will not have the opportunity to evaluate the economic, financial and other relevant information that the Partnership will consider in determining the application of these funds and other resources.
35
Table of Contents
The terms of the Partnership's credit facility and indentures may restrict its current and future operations, particularly its ability to respond to changes in business or to take certain actions.
The Partnership's credit agreement and the indentures governing its senior notes contain, and any future indebtedness the Partnership incurs will likely contain, a number of restrictive covenants that impose significant operating and financial restrictions, including restrictions on its ability to engage in acts that may be in its best long-term interest. These agreements include covenants that, among other things, restrict the Partnership's ability to:
- •
- incur or guarantee additional indebtedness or issue preferred stock;
- •
- pay dividends on its equity securities or redeem, repurchase or retire its equity securities or subordinated indebtedness;
- •
- make investments;
- •
- pay dividends or other distributions by its subsidiaries;
- •
- engage in transactions with its affiliates;
- •
- sell assets, including equity securities of its subsidiaries;
- •
- consolidate or merge;
- •
- incur liens;
- •
- prepay, redeem and repurchase certain debt;
- •
- make certain acquisitions;
- •
- transfer assets;
- •
- enter into sale and lease back transactions;
- •
- amend its partnership agreement;
- •
- make certain capital expenditures; and
- •
- change business activities it conducts.
In addition, the Partnership's credit facility requires it to satisfy and maintain specified financial ratios and other financial condition tests. Its ability to meet those financial ratios and tests can be affected by events beyond its control, and it cannot assure you that it will meet those ratios and tests.
A breach of any of these covenants could result in an event of default under the Partnership's credit facility and indentures. Upon the occurrence of such an event of default, all amounts outstanding under the applicable debt agreements could be declared to be immediately due and payable and all applicable commitments to extend further credit could be terminated. If the Partnership is unable to repay the accelerated debt under its senior secured credit facility, the lenders under its senior secured credit facility could proceed against the collateral granted to them to secure that indebtedness. The Partnership has pledged substantially all of its assets as collateral under its senior secured credit facility. If indebtedness under its senior secured credit facility or indentures is accelerated, there can be no assurance that the Partnership will have sufficient assets to repay the indebtedness. The operating and financial restrictions and covenants in these debt agreements and any future financing agreements may adversely affect the Partnership's ability to finance future operations or capital needs or to engage in other business activities.
36
Table of Contents
The Partnership does not own most of the land on which its pipelines and compression facilities are located, which could disrupt its operations.
The Partnership does not own most of the land on which its pipelines and compression facilities are located, and it is therefore subject to the possibility of more onerous terms and/or increased costs to retain necessary land use if it does not have valid rights-of-way or leases or if such rights-of-way or leases lapse or terminate. The Partnership sometimes obtains the rights to land owned by third parties and governmental agencies for a specific period of time. The Partnership's loss of these rights, through its inability to renew right-of-way contracts, leases or otherwise, could cause it to cease operations on the affected land, increase costs related to continuing operations elsewhere and reduce its revenue.
The Partnership expects to encounter significant competition in any new geographic areas into which the Partnership seeks to expand and its ability to enter such markets may be limited.
If the Partnership expands its operations into new geographic areas, the Partnership expects to encounter significant competition for natural gas and crude oil supplies and markets. Competitors in these new markets will include companies larger than the Partnership, which have both lower cost of capital and greater geographic coverage, as well as smaller companies, which have lower total cost structures. As a result, it may not be able to successfully develop acquired assets and markets located in new geographic areas and the Partnership's results of operations could be adversely affected.
With its acquisition of Clearfield, the Partnership entered geographic regions in which the Partnership did not previously operate, including Kentucky, Ohio and West Virginia. In order to operate effectively in these new regions, the Partnership needs to understand the local market and regulatory environment and identify and retain certain employees from Clearfield who are familiar with these markets. If the Partnership is not successful in retaining these employees or operating in these new geographic areas, the Partnership may not be able to compete effectively in the new markets or fully realize the expected benefits of the Clearfield acquisition.
The Partnership faces new risks as it entered into new lines of business as a result of the Clearfield acquisition.
As a result of the Clearfield acquisition, the Partnership entered new lines of business including the transportation of crude oil and condensate by rail cars, barge facilities and trucks and the disposal and transportation of brine. Prior to the Clearfield acquisition, the Partnership did not have experience in these lines of business and the success of this acquisition will be subject to all of the uncertainties regarding the maintenance and development of these new lines of business. These activities involve a number of uncertainties, risks and expenses, including the investment of significant time and resources, and the Partnership can give no assurance that its efforts will be successful.
The Partnership may not be able to retain existing customers or acquire new customers, which would reduce its revenues and limit its future profitability.
The renewal or replacement of existing contracts with the Partnership's customers at rates sufficient to maintain current revenues and cash flows depends on a number of factors beyond its control, including competition from other midstream service provider, and the price of, and demand for, crude oil, condensate, NGLs and natural gas in the markets the Partnership serves. The inability of the Partnership's management to renew or replace its current contracts as they expire and to respond appropriately to changing market conditions could have a negative effect on its profitability.
37
Table of Contents
In particular, the Partnership's ability to renew or replace its existing contracts with industrial end-users and utilities impacts its profitability. For the year ended December 31, 2012, approximately 56% of its sales of gas that was transported using its physical facilities were to industrial end-users and utilities. As a consequence of the increase in competition in the industry and volatility of natural gas prices, end-users and utilities may be reluctant to enter into long-term purchase contracts. Many end-users purchase natural gas from more than one natural gas company and have the ability to change providers at any time. Some of these end-users also have the ability to switch between gas and alternate fuels in response to relative price fluctuations in the market. Because there are numerous companies of greatly varying size and financial capacity that compete with the Partnership in the marketing of natural gas, the Partnership often competes in the end-user and utilities markets primarily on the basis of price.
The Partnership depends on certain key customers, and the loss of any of its key customers could adversely affect its financial results.
The Partnership derives a significant portion of its revenues from contracts with key customers. To the extent that these and other customers may reduce volumes of natural gas purchased or transported under existing contracts, the Partnership would be adversely affected unless it was able to make comparably profitable arrangements with other customers. Certain agreements with key customers provide for minimum volumes of natural gas or natural gas services that require the customer to transport, process or purchase until the expiration of the term of the applicable agreement, subject to certain force majeure provisions. Customers may default on their obligations to transport, process or purchase the minimum volumes of natural gas or natural gas services required under the applicable agreements.
The Partnership is exposed to the credit risk of its customers and counterparties, and a general increase in the nonpayment and nonperformance by its customers could have an adverse effect on its financial condition and results of operations.
Risks of nonpayment and nonperformance by the Partnership's customers are a major concern in its business. The Partnership is subject to risks of loss resulting from nonpayment or nonperformance by its customers and other counterparties, such as its lenders and hedging counterparties. Any increase in the nonpayment and nonperformance by its customers could adversely affect its results of operations and reduce its ability to make distributions to its unitholders.
Federal, state or local regulatory measures could adversely affect the Partnership's business.
The Partnership's natural gas gathering and processing activities generally are exempt from FERC regulation under the Natural Gas Act. However, the distinction between FERC-regulated transmission services and federally unregulated gathering services is the subject of substantial, on-going litigation, so the classification and regulation of the Partnership's gathering facilities are subject to change based on future determinations by FERC and the courts. Natural gas gathering may receive greater regulatory scrutiny at both the state and federal levels since FERC has less extensively regulated the gathering activities of interstate pipeline transmission companies and a number of such companies have transferred gathering facilities to unregulated affiliates. The Partnership's gathering operations also may be or become subject to safety and operational regulations relating to the design, installation, testing, construction, operation, replacement and management of gathering facilities. Additional rules and legislation pertaining to these matters are considered or adopted from time to time. The Partnership cannot predict what effect, if any, such changes might have on its operations, but the industry could be required to incur additional capital expenditures and increased costs depending on future legislative and regulatory changes.
The rates, terms and conditions of service under which the Partnership transports natural gas in its pipeline systems in interstate commerce are subject to FERC regulation under Section 311 of the
38
Table of Contents
Natural Gas Policy Act. Under these regulations, the Partnership is required to justify its rates for interstate transportation service on a cost-of-service basis every five years. The Partnership's intrastate natural gas pipeline operations are subject to regulation by various agencies of the states in which they are located. Should FERC or any of these state agencies determine that its rates for Section 311 transportation service or intrastate transportation service should be lowered, its business could be adversely affected.
In 2012, the Partnership acquired liquids transportation, storage and other assets in the Ohio River Valley, including certain assets providing common carrier interstate service subject to regulation by FERC under the ICA. Further, the Cajun-Sibon NGL pipeline is scheduled to be operational in mid-2013 and will operate as an interstate, common carrier NGL pipeline subject to FERC's jurisdiction under the ICA.
The ICA permits interested persons to challenge proposed new or changed rates and authorizes FERC to suspend the effectiveness of such rates for up to seven months and investigate such rates. If, upon completion of an investigation, FERC finds that the new or changed rates are unlawful, it is authorized to require the pipeline to refund revenues collected in excess of the just and reasonable rates during the term of the investigation. FERC may also investigate, upon complaint or on its own motion, rates that are already in effect and may order a carrier to change its rates prospectively. Under certain circumstances, FERC could limit the Partnership's ability to set rates based on its costs or could order the Partnership to reduce its rates and could require the payment of reparations to complaining shippers for up to two years prior to the date of the complaint. FERC also has the authority to change the Partnership's terms and conditions of service if it determines that they are unjust and unreasonable or unduly discriminatory or preferential.
As the Partnership acquires, constructs and operates new liquids assets and expands its liquids transportation business segment, the classification and regulation of its liquids transportation services are subject to ongoing assessment and change based on the services the Partnership provides and determinations by FERC and the courts. Such changes may subject additional services the Partnership provides to regulation by FERC.
Other state and local regulations also affect the Partnership's business. The Partnership is subject to some ratable take and common purchaser statutes in the states where it operates. Ratable take statutes generally require gatherers to take, without undue discrimination, natural gas production that may be tendered to the gatherer for handling. Similarly, common purchaser statutes generally require gatherers to purchase without undue discrimination as to source of supply or producer. These statutes have the effect of restricting the Partnership's right as an owner of gathering facilities to decide with whom it contracts to purchase or transport natural gas. Federal law leaves any economic regulation of natural gas gathering to the states, and some of the states in which it operates have adopted complaint-based or other limited economic regulation of natural gas gathering activities. States in which the Partnership operates that have adopted some form of complaint-based regulation, like Texas, generally allow natural gas producers and shippers to file complaints with state regulators in an effort to resolve grievances relating to natural gas gathering access and rate discrimination.
The states in which the Partnership conducts operations administer federal pipeline safety standards under the NGPA. These standards only apply to certain gathering lines based on the gathering line's operating pressure and proximity to people. Because of their pressure and location, substantial portions of the Partnership's gathering facilities are not regulated under that statute. The gathering line exemptions, however, may be restricted in the future, and they do not apply to our natural gas transmission pipelines. In response to recent pipeline accidents in other parts of the country, Congress and the Department of Transportation, or DOT, have passed or are considering heightened pipeline safety requirements, including gathering lines.
39
Table of Contents
Compliance with pipeline integrity and other pipeline safety regulations issued by DOT or those issued by the Texas Railroad Commission, or TRRC, could result in substantial expenditures for testing, repairs and replacement. TRRC regulations require periodic testing of all intrastate pipelines meeting certain size and location requirements. The Partnership's costs relating to compliance with the required testing under the TRRC regulations were approximately at $1.4 million, $1.3 million, and $1.4 million for the years ended December 31, 2012, 2011 and 2010, respectively. The Partnership expects the costs for compliance with TRRC and DOT regulations to be approximately $2.0 million during 2013. If its pipelines fail to meet the safety standards mandated by the TRRC or the DOT regulations, then it may be required to repair or replace sections of such pipelines, the cost of which cannot be estimated at this time.
As the Partnership's operations continue to expand into and around urban or more populated areas, such as the Barnett Shale, it may incur additional expenses to mitigate noise, odor and light that may be emitted in its operations and expenses related to the appearance of its facilities. Municipal and other local or state regulations are imposing various obligations including, among other things, regulating the location of its facilities, imposing limitations on the noise levels of its facilities and requiring certain other improvements that increase the cost of its facilities. The Partnership is also subject to claims by neighboring landowners for nuisance related to the construction and operation of its facilities, which could subject it to damages for declines in neighboring property values due to its construction and operation of facilities.
The Partnership's business involves hazardous substances and may be adversely affected by environmental regulation.
Many of the operations and activities of the Partnership's gathering systems, processing plants, fractionators, brine disposal operations and other facilities are subject to significant federal, state and local environmental laws and regulations. The obligations imposed by these laws and regulations include obligations related to air emissions and discharge of pollutants from its facilities and the cleanup of hazardous substances and other wastes that may have been released at properties currently or previously owned or operated by the Partnership or locations to which the Partnership has sent wastes for treatment or disposal. Various governmental authorities have the power to enforce compliance with these laws and regulations and the permits issued under them, and violators are subject to administrative, civil and criminal penalties, including civil fines, injunctions or both. Strict, joint and several liability may be incurred under these laws and regulations for the remediation of contaminated areas. Private parties, including the owners of properties near the Partnership's facilities or upon or through which its gathering systems traverse, may also have the right to pursue legal actions to enforce compliance as well as to seek damages for non-compliance with environmental laws and regulations for releases of contaminants or for personal injury or property damage.
There is inherent risk of the incurrence of significant environmental costs and liabilities in the Partnership's business due to its handling of natural gas, crude oil and other petroleum substances, its brine disposal operations, air emissions related to its operations, historical industry operations, waste disposal practices and the prior use of natural gas flow meters containing mercury. For example, the Partnership operates brine disposal wells in Ohio and West Virginia and may gather brine from surrounding states. These wells are regulated under the federal Safe Drinking Water Act (SDWA) as Class II wells and under state laws. State laws and regulations that govern these operations can be more stringent than the federal SDWA, such as the Ohio Department of Natural Resources rules which became effective October 1, 2012. These rules imposed new, more stringent environmentally responsible standards for the permitting and operating of brine disposal wells, including extensive review of geologic data and use of state of the art technology. They apply to new disposal wells and, as applicable, to existing wells. The Ohio Department of Natural Resources also imposes requirements on the transportation and disposal of brine. In addition, the possibility exists that stricter laws, regulations
40
Table of Contents
or enforcement policies could significantly increase its compliance costs and the cost of any remediation that may become necessary. The Partnership may incur material environmental costs and liabilities. Furthermore, its insurance may not provide sufficient coverage in the event an environmental claim is made against it.
The Partnership's business may be adversely affected by increased costs due to stricter pollution control requirements or liabilities resulting from non-compliance with required operating or other regulatory permits. New environmental laws or regulations, including, for example, legislation relating to the control of greenhouse gas emissions, or changes in existing environmental laws or regulations might adversely affect its products and activities, including processing, storage and transportation, as well as waste management and air emissions. Federal and state agencies could also impose additional safety requirements, any of which could affect the Partnership's profitability. Changes in laws or regulations could also limit its production or the operation of its assets or adversely affect its ability to comply with applicable legal requirements or the demand for crude oil, brine disposal services or natural gas, which could adversely affect its business and its profitability.
Recently finalized rules under the Clean Air Act imposing more stringent requirements on the oil and gas industry could cause the Partnership's customers and the Partnership to incur increased capital expenditures and operating costs as well as reduce the demand for our services.
On April 17, 2012, the EPA issued final rules under the Clean Air Act that became effective on October 15, 2012. Among other things, these rules require additional emissions controls for natural gas and NGLs production, including New Source Performance Standards to address emissions of sulfur dioxide and volatile organic compounds ("VOCs") and a separate set of emission standards to address hazardous air pollutants frequently associated with such production activities. The final regulations require, among other things, the reduction of VOC emissions from natural gas wells through the use of reduced emission completions or "green completions" on all hydraulically fractured wells constructed or refractured after January 1, 2015. Moreover, these rules establish specific requirements regarding emissions from compressors and controllers at natural gas gathering and boosting stations and processing plants together with dehydrators and storage tanks at natural gas processing plants, compressor stations and gathering and boosting stations. The rules also establish new requirements for leak detection and repair of leaks at natural gas processing plants that exceed 500 parts per million in concentration. These regulations could require a number of modifications to the Partnership's operations and its natural gas exploration and production suppliers' and customers' operations, including the installation of new equipment, which could result in significant costs, including increased capital expenditures and operating costs. The incurrence of such expenditures and costs by the Partnership's suppliers and customers could result in reduced production by those suppliers and customers and thus translate into reduced demand for the Partnership's services. The rules are subject to an ongoing legal challenge brought by various parties, including environmental groups and industry, and the EPA has indicated that it may revise the rules. Any such revisions could affect the Partnership's operations, as well as the operations of its suppliers and customers.
The Partnership's business involves many hazards and operational risks, some of which may not be fully covered by insurance.
The Partnership's operations are subject to the many hazards inherent in the gathering, compressing, processing and storage of natural gas, NGLs and crude oil, including:
- •
- damage to pipelines, related equipment and surrounding properties caused by hurricanes, floods, fires and other natural disasters and acts of terrorism;
- •
- inadvertent damage from construction and farm equipment;
- •
- leaks of natural gas, NGLs, crude oil and other hydrocarbons; and
41
Table of Contents
These risks could result in substantial losses due to personal injury and/or loss of life, severe damage to and destruction of property and equipment and pollution or other environmental damage and may result in curtailment or suspension of the Partnership's related operations. The Partnership is not fully insured against all risks incident to its business. In accordance with typical industry practice, the Partnership does not have business interruption insurance or any property insurance on any of its underground pipeline systems that would cover damage to the pipelines. The Partnership is not insured against all environmental accidents that might occur, other than those considered to be sudden and accidental. If a significant accident or event occurs that is not fully insured, it could adversely affect the Partnership's operations and financial condition.
The Partnership could experience increased severity or frequency of trucking accidents and other claims.
Potential liability associated with accidents in the trucking industry is severe and occurrences are unpredictable. A material increase in the frequency or severity of accidents or workers' compensation claims or the unfavorable development of existing claims could be expected to materially adversely affect the Partnership's results of operations. In the event that accidents occur, the Partnership may be unable to obtain desired contractual indemnities, and its insurance may be inadequate in certain cases. The occurrence of an event not fully insured or indemnified against, or the failure or inability of a customer or insurer to meet its indemnification or insurance obligations, could result in substantial losses.
Changes in trucking regulations may increase the Partnership's costs and negatively impact its results of operations.
The Partnership's trucking services are subject to regulation as a motor carrier by the United States Department of Transportation and by various state agencies, whose regulations include certain permit requirements of state highway and safety authorities. These regulatory authorities exercise broad powers over the Partnership's trucking operations, generally governing such matters as the authorization to engage in motor carrier operations, safety, equipment testing and specifications and insurance requirements. There are additional regulations specifically relating to the trucking industry, including testing and specification of equipment and product handling requirements. The trucking industry is subject to possible regulatory and legislative changes that may impact the Partnership's operations and affect the economics of the industry by requiring changes in operating practices or by changing the demand for or the cost of providing trucking services. Some of these possible changes include increasingly stringent fuel emission limits, changes in the regulations that govern the amount of time a driver may drive or work in any specific period, limits on vehicle weight and size and other matters, including safety requirements.
The adoption of derivatives legislation by the United States Congress and promulgation of related regulations could have an adverse effect on the Partnership's ability to hedge risks associated with its business.
Comprehensive financial reform legislation was signed into law by the President on July 21, 2010. The legislation calls for the Commodity Futures Trading Commission (the "CFTC") to regulate certain markets for over-the-counter ("OTC") derivative products. The CFTC has issued several new relevant regulations and other rulemakings are pending at the CFTC, the product of which would be rules that implement the mandates in the new legislation to cause significant portions of derivatives to be cleared through clearinghouses. The rules could also impose burdens on market participants to such an extent that liquidity in the bilateral OTC derivative market decreases substantially. The legislation and new regulations may also require counterparties to its derivative instruments to spin off some of their derivatives activities to separate entities, which may not be as creditworthy as the current counterparties. The new legislation and any new regulations, including determinations with respect to
42
Table of Contents
the applicability of margin requirements and other trading structures, could significantly increase the cost of derivative contracts, materially alter the terms of derivative contracts, reduce the availability of derivatives to protect against risks the Partnership encounters, reduce its ability to monetize or restructure its existing derivative contracts, and increase its exposure to less creditworthy counterparties. If the Partnership reduces its use of derivatives as a result of the legislation and regulations, its results of operations may become more volatile and its cash flows may be less predictable, which could adversely affect its ability to plan for and fund capital expenditures and to generate sufficient cash flow to pay quarterly distributions at current levels or at all. The Partnership's revenues could be adversely affected if a consequence of the legislation and regulations is to lower commodity prices. Any of these consequences could have a material, adverse effect on the Partnership, the Partnership's financial condition and its results of operations.
Climate change legislation and regulatory initiatives could result in increased operating costs and reduced demand for the natural gas and NGL services the Partnership provides.
On December 15, 2009, the EPA published its findings that emissions of carbon dioxide, methane and other greenhouse gases ("GHGs") present an endangerment to public health and the environment because emissions of such gases are, according to the EPA, contributing to warming of the earth's atmosphere and other climatic changes. These findings allowed the EPA to proceed with the adoption and implementation of regulations restricting emissions of GHGs under existing provisions of the federal Clean Air Act. Since 2011, the EPA has required stationary sources that emit GHGs above regulatory and statutory thresholds to obtain a Prevention of Significant Deterioration permit. Moreover, on October 30, 2009, the EPA published a "Mandatory Reporting of Greenhouse Gases" final rule that established a comprehensive scheme requiring operators of stationary sources emitting more than established annual thresholds of GHGs to inventory and report their GHG emissions annually on a facility-by-facility basis. The Mandatory Reporting Rule was expanded by a rule promulgated on November 30, 2010 to include owners and operators of onshore oil and natural gas production, processing, transmission, storage and distribution facilities. Reporting emissions from such onshore activities is required on an annual basis. The first reports were due in 2012 for emissions occurring in 2011. Additionally, the EPA has proposed to regulate greenhouse gas emissions from certain electric generating units under the Clean Air Act's New Source Performance Standards ("NSPS") program. The EPA may propose to regulate additional source categories under the NSPS program in the future.
In addition, both houses of Congress have actively considered legislation to reduce emissions of GHGs, and almost half of the states have already taken legal measures to reduce emissions of GHGs, primarily through the planned development of GHG emission inventories and/or regional GHG cap and trade programs. Most of these cap and trade programs work by requiring either major sources of emissions, such as electric power plants, or major producers of fuels, such as refineries and NGL fractionation plants, to acquire and surrender emission allowances with the number of allowances available for purchase reduced each year until the overall GHG emission reduction goal is achieved. The adoption of legislation or regulations imposing reporting or permitting obligations on, or limiting emissions of GHGs from, the Partnership's equipment and operations could require the Partnership to incur additional costs to reduce emissions of GHGs associated with its operations, could adversely affect its performance of operations in the absence of any permits that may be required to regulate emission of GHGs or could adversely affect demand for the natural gas the Partnership gathers, processes or otherwise handles in connection with its services.
43
Table of Contents
The Partnership typically does not obtain independent evaluations of hydrocarbon reserves; therefore, volumes it services in the future could be less than it anticipates.
The Partnership typically does not obtain independent evaluations of hydrocarbon reserves connected to its gathering systems or that the Partnership otherwise services due to the unwillingness of producers to provide reserve information as well as the cost of such evaluations. Accordingly, the Partnership does not have independent estimates of total reserves serviced by its assets or the anticipated life of such reserves. If the total reserves or estimated life of the reserves is less than it anticipates and it is unable to secure additional sources then the volumes transported on its gathering systems or that the Partnership otherwise services in the future could be less than anticipated. A decline in the volumes could have a material adverse effect on the Partnership's results of operations and financial condition.
The Partnership's success depends on key members of its management, the loss or replacement of whom could disrupt its business operations.
The Partnership depends on the continued employment and performance of the officers of its general partner and key operational personnel. The general partner has entered into employment agreements with each of its executive officers. If any of these officers or other key personnel resign or become unable to continue in their present roles and are not adequately replaced, the Partnership's business operations could be materially adversely affected. The Partnership does not maintain any "key man" life insurance for any officers.
Increased regulation of hydraulic fracturing could result in reductions or delays in natural gas production by the Partnership's customers, which could adversely impact its revenues.
A portion of the Partnership's suppliers' and customers' natural gas production is developed from unconventional sources, such as deep gas shales, that require hydraulic fracturing as part of the completion process. Hydraulic fracturing involves the injection of water, sand and chemicals under pressure into the formation to stimulate gas production. Hydraulic fracturing activities are generally regulated by state oil and gas commissions; however, the EPA has asserted federal regulatory authority over certain hydraulic fracturing activities involving diesel under the Safe Drinking Water Act and has released draft permitting guidance for hydraulic fracturing activities that use diesel in fracturing fluids in those states where EPA is the permitting authority. In addition, legislation has been proposed, but not passed that would provide for federal regulation of hydraulic fracturing and require disclosure of the chemicals used in the hydraulic-fracturing process. State legislatures and agencies are also enacting legislation and promulgating rules to regulate hydraulic fracturing and require disclosure of hydraulic fracturing chemicals.
There are certain governmental reviews either underway or being proposed that focus on environmental aspects of hydraulic fracturing practices. The White House Council on Environmental Quality is coordinating an administration-wide review of hydraulic fracturing practices, and a committee of the United States House of Representatives has conducted an investigation of hydraulic fracturing practices. In addition, the EPA is conducting a study of the potential environmental effects of hydraulic fracturing on drinking water and groundwater and has initiated plans to promulgate regulations controlling wastewater disposal associated with hydraulic fracturing and shale gas development. In addition to the EPA, other federal agencies are analyzing, or have been requested to review, a variety of environmental issues associated with hydraulic fracturing. These on-going or proposed studies, depending on their degree of pursuit and any meaningful results obtained, could spur initiatives to further regulate hydraulic fracturing under the Safe Drinking Water Act, the Toxic Substances Control Act, or other statutory and/or regulatory mechanisms. President Obama created the Interagency Working Group on Unconventional Natural Gas and Oil by Executive Order on April 13, 2012, which
44
Table of Contents
is charged with coordinating and aligning federal agency research and scientific studies on unconventional natural gas and oil resources.
The Partnership cannot predict whether any additional legislation or regulations will be enacted and, if so, what the provisions would be. If additional levels of regulation and permits were required through the adoption of new laws and regulations at the federal or state level, that could lead to delays, increased operating costs and process prohibitions for the Partnership's suppliers and customers that could reduce the volumes of natural gas that move through its gathering systems which could materially adversely affect its revenue and results of operations.
Item 1B. Unresolved Staff Comments
We do not have any unresolved staff comments.
Item 2. Properties
A description of our properties is contained in "Item 1. Business."
Title to Properties
Substantially all of the Partnership's pipelines are constructed on rights-of-way granted by the apparent record owners of the property. Lands over which pipeline rights-of-way have been obtained may be subject to prior liens that have not been subordinated to the right-of-way grants. The Partnership has obtained, where necessary, easement agreements from public authorities and railroad companies to cross over or under, or to lay facilities in or along, watercourses, county roads, municipal streets, railroad properties and state highways, as applicable. In some cases, property on which the Partnership's pipeline was built was purchased in fee. The Partnership's processing plants are located on land that the Partnership leases or owns in fee.
We believe that the Partnership has satisfactory title to all of its rights-of-way and land assets. Title to these assets may be subject to encumbrances or defects. The Partnership believes that none of such encumbrances or defects should materially detract from the value of its assets or from its interest in these assets or should materially interfere with their use in the operation of the business.
Item 3. Legal Proceedings
Our operations and those of the Partnership are subject to a variety of risks and disputes normally incident to our business. As a result, at any given time we or the Partnership may be a defendant in various legal proceedings and litigation arising in the ordinary course of business, including litigation on disputes related to contracts, property use or damage and personal injury. Additionally, as the Partnership continues to expand operations into more urban, populated areas, such as the Barnett Shale, it may see an increase in claims brought by area landowners, such as nuisance claims and other claims based on property rights. Except as otherwise set forth herein, we do not believe that any pending or threatened claim or dispute is material to our financial results on our operations. We maintain insurance policies with insurers in amounts and with coverage and deductibles as our general partner believes are reasonable and prudent. However, we cannot assure you that this insurance will be adequate to protect us from all material expenses related to potential future claims for personal and property damage or that these levels of insurance will be available in the future at economical prices.
At times, the Partnership's gas-utility and common carrier subsidiaries acquire pipeline easements and other property rights by exercising rights of eminent domain. As a result, the Partnership (or its subsidiaries) is party to a number of lawsuits under which a court will determine the value of pipeline easements or other property interests obtained by the Partnership's gas utility subsidiaries by condemnation. Damage awards in these suits should reflect the value of the property interest acquired
45
Table of Contents
and the diminution in the value of the remaining property owned by the landowner. However, some landowners have alleged unique damage theories to inflate their damage claims or assert valuation methodologies that could result in damage awards in excess of the amounts anticipated. Although it is not possible to predict the ultimate outcomes of these matters, the Partnership does not expect that awards in these matters will have a material adverse impact on its consolidated results of operations or financial condition.
The Partnership (or its subsidiaries) is defending lawsuits filed by owners of property located near processing facilities or compression facilities constructed by the Partnership as part of its systems. The suits generally allege that the facilities create a private nuisance and have damaged the value of surrounding property. Claims of this nature have arisen as a result of the industrial development of natural gas gathering, processing and treating facilities in urban and occupied rural areas. Although it is not possible to predict the ultimate outcomes of these matters, the Partnership does not expect that awards in these matters will have a material adverse impact on its consolidated results of operations or financial condition.
Item 4. Mine Safety Disclosures
Not applicable.
PART II
Item 5. Market for Registrant's Common Equity, Related Stockholder Matters and Issuer Purchases of Equity Securities
Our common stock is listed on The NASDAQ Global Select Market under the symbol "XTXI". Our common stock began trading on January 12, 2004. On February 13, 2013, the closing market price for our common stock was $17.88 per share and there were approximately 10,911 record holders and beneficial owners (held in street name) of the shares of our common stock. For equity compensation plan information, see discussion under "Item 12 Security Ownership of Certain Beneficial Owners and Management and Related Stockholder Matters—Equity Compensation Plan Information."
The following table shows (i) the high and low closing sales prices per share, as reported by The NASDAQ Global Select Market, and (ii) the amount of our quarterly dividends for the periods indicated.
| | | | | | | | | | |
| |
| |
| | Cash
Dividends | |
|---|
| | Common Stock
Price Range | |
|---|
| | Declared
Per Share | |
|---|
| | High | | Low | |
|---|
2012: | | | | | | | | | | |
Quarter Ended December 31 | | $ | 14.47 | | $ | 11.59 | | $ | 0.12 | |
Quarter Ended September 30 | | | 14.66 | | | 11.90 | | | 0.12 | |
Quarter Ended June 30 | | | 15.43 | | | 13.10 | | | 0.12 | |
Quarter Ended March 31 | | | 14.65 | | | 12.56 | | | 0.12 | |
2011: | | | | | | | | | | |
Quarter Ended December 31 | | $ | 14.70 | | $ | 10.92 | | | 0.11 | |
Quarter Ended September 30 | | | 15.14 | | | 8.62 | | | 0.10 | |
Quarter Ended June 30 | | | 11.90 | | | 9.02 | | | 0.10 | |
Quarter Ended March 31 | | | 10.52 | | | 8.41 | | | 0.09 | |
46
Table of Contents
We intend to pay dividends to our stockholders, on a quarterly basis, equal to the cash we receive if any, from distributions from the Partnership, less reserves for expenses, future dividends and other uses of cash, including:
- •
- federal income taxes, which we are required to pay because we are taxed as a corporation;
- •
- the expenses of being a public company;
- •
- other general and administrative expenses; and
- •
- capital contributions to the Partnership upon the issuance by it of additional partnership securities in order to maintain the general partner's then-current general partner interest, to the extent the board of directors of the general partner exercises its option to do so; and
- •
- reserves our board of directors believes prudent to maintain.
The determination of the amount of cash dividends, including the quarterly dividend referred to above, if any, to be declared and paid will depend upon our financial condition, results of operations, cash flow, the level of our capital expenditures, future business prospects and any other matters that our board of directors deems relevant. The Company intends to pay dividends to stockholders and is dependent on receiving a cash distribution from the Partnership. During 2012, the Partnership paid quarterly distributions to its common unitsholders in May, August and November of $0.33, $0.33, and $0.33 related to the first, second and third quarters of 2012, respectively. The Partnership paid a quarterly distribution of $0.33 in February 2013 related to the fourth quarter of 2012. Our share of the distributions with respect to our limited and general partner interests in the Partnership totaled $27.4 million for the year ended December 31, 2012, $0.1 million of which was paid-in-kind through the issuance of additional limited partner common units to the general partner in lieu of cash.
47
Table of Contents
Performance Graph
The following graph sets forth the cumulative total stockholder return for our common stock, the Standard & Poor's 500 Stock Index and a peer group of publicly traded partners of publicly traded limited partnerships in the Midstream natural gas, natural gas liquids, propane, and pipeline industries from January 1, 2008 through December 31, 2012. The chart assumes that $100 was invested on January 1, 2008, with dividends reinvested. The peer group includes Atlas Energy, L.P., Energy Transfer Equity, L.P., Nustar GP Holdings, LLC, Targa Resources, Inc. and Western Gas Equity Partners, L.P. (Targa Resources, Inc.'s and Western Gas Equity Partners, L.P.'s initial public offerings were in January 2010 and December 2012, respectively, and it has been assumed that both performed in accordance with the peer group average prior to such date).
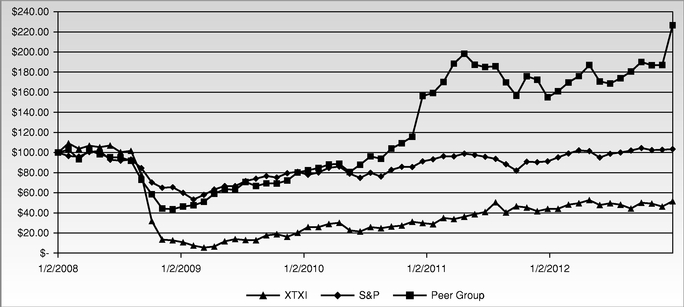
48
Table of Contents
Item 6. Selected Financial Data
The following table sets forth selected historical financial and operating data of Crosstex Energy, Inc as of and for the dates and periods indicated. Financial and operating data related to the acquisition of its ORV assets is included for the year ended December 31, 2012. The selected historical financial data are derived from the audited consolidated financial statements of Crosstex Energy, L.P. and should be read together with "Item 7. Management's Discussion and Analysis of Financial Condition and Results of Operations."
| | | | | | | | | | | | | | | | |
| | Crosstex Energy, Inc. | |
|---|
| | Years Ended December 31, | |
|---|
| | 2012 | | 2011 | | 2010 | | 2009 | | 2008 | |
|---|
| | (In thousands, except per share data)
| |
|---|
Statement of Operations Data: | | | | | | | | | | | | | | | | |
Revenues: | | | | | | | | | | | | | | | | |
Midstream | | $ | 1,655,851 | | $ | 2,013,942 | | $ | 1,792,676 | | $ | 1,583,551 | | $ | 3,558,213 | |
Operating costs and expenses: | | | | | | | | | | | | | | | | |
Purchased gas, NGLs and crude oil | | | 1,262,093 | | | 1,638,777 | | | 1,454,376 | | | 1,272,329 | | | 3,250,427 | |
Operating expenses | | | 130,882 | | | 111,778 | | | 105,060 | | | 110,394 | | | 125,762 | |
General and administrative | | | 65,083 | | | 55,516 | | | 51,172 | | | 62,491 | | | 72,377 | |
(Gain) loss on derivatives | | | 1,006 | | | 7,776 | | | 9,100 | | | (2,994 | ) | | (8,619 | ) |
(Gain) loss on sale of property | | | (342 | ) | | 264 | | | (13,881 | ) | | (666 | ) | | (947 | ) |
Impairments | | | — | | | — | | | 1,311 | | | 2,894 | | | 30,177 | |
Depreciation and amortization | | | 162,300 | | | 125,358 | | | 111,625 | | | 119,162 | | | 107,652 | |
| | | | | | | | | | | | |
Total operating costs and expenses | | | 1,621,022 | | | 1,939,469 | | | 1,718,763 | | | 1,563,610 | | | 3,576,829 | |
| | | | | | | | | | | | |
Operating income (loss) | | | 34,829 | | | 74,473 | | | 73,913 | | | 19,941 | | | (18,616 | ) |
Other income (expense): | | | | | | | | | | | | | | | | |
Interest expense, net | | | (86,515 | ) | | (79,227 | ) | | (87,028 | ) | | (95,078 | ) | | (74,861 | ) |
Loss on extinguishment of debt | | | — | | | — | | | (14,713 | ) | | (4,669 | ) | | — | |
Equity in income of limited liability company | | | 3,250 | | | — | | | — | | | — | | | — | |
Other income | | | 5,054 | | | 707 | | | 294 | | | 1,449 | | | 27,898 | |
| | | | | | | | | | | | |
Total other expense | | | (78,211 | ) | | (78,520 | ) | | (101,447 | ) | | (98,298 | ) | | (46,963 | ) |
| | | | | | | | | | | | |
Loss from continuing operations before income taxes and gain on issuance of Partnership units | | | (43,382 | ) | | (4,047 | ) | | (27,534 | ) | | (78,357 | ) | | (65,579 | ) |
Income tax benefit (provision) | | | 6,642 | | | (2,768 | ) | | 6,021 | | | 6,020 | | | 1,375 | |
Gain on issuance of Partnership units(1) | | | — | | | — | | | — | | | — | | | 14,748 | |
| | | | | | | | | | | | |
Loss from continuing operations, net of tax | | | (36,740 | ) | | (1,279 | ) | | (21,513 | ) | | (72,337 | ) | | (49,456 | ) |
Discontinued Operations: | | | | | | | | | | | | | | | | |
Income (loss) from discontinued operations, net of tax | | | — | | | — | | | — | | | (1,519 | ) | | 21,466 | |
Gain from sale of discontinued operations, net of tax | | | — | | | — | | | — | | | 159,961 | | | 42,753 | |
| | | | | | | | | | | | |
Discontinued operations, net of tax | | | — | | | — | | | — | | | 158,442 | | | 64,219 | |
| | | | | | | | | | | | |
Net income (loss) | | | (36,740 | ) | | (1,279 | ) | | (21,513 | ) | | 86,105 | | | 14,763 | |
Less: Interest of non-controlling partners in the Partnership's net income (loss): | | | | | | | | | | | | | | | | |
Interest of non-controlling partners in the
Partnership's continuing operations | | | (24,259 | ) | | 4,728 | | | (9,862 | ) | | (48,069 | ) | | (55,704 | ) |
Interest of non-controlling partners in the Partnership's discontinued operations | | | — | | | — | | | — | | | (1,137 | ) | | 15,454 | |
Interest of non-controlling partners in the Partnership's gain on sale of discontinued operations | | | — | | | — | | | — | | | 119,669 | | | 30,780 | |
| | | | | | | | | | | | |
Total interest of non-controlling partner in the partnership's net income (loss) | | | (24,259 | ) | $ | 4,728 | | | (9,862 | ) | | 70,463 | | | (9,470 | ) |
| | | | | | | | | | | | |
Net income (loss) attributable to Crosstex Energy, Inc. | | $ | (12,481 | ) | $ | (6,007 | ) | $ | (11,651 | ) | $ | 15,642 | | $ | 24,233 | |
| | | | | | | | | | | | |
49
Table of Contents
| | | | | | | | | | | | | | | | |
| | Crosstex Energy, Inc. | |
|---|
| | Years Ended December 31, | |
|---|
| | 2012 | | 2011 | | 2010 | | 2009 | | 2008 | |
|---|
| | (In thousands, except per share data)
| |
|---|
Net income (loss) from continuing operations per common share: | | | | | | | | | | | | | | | | |
Basic | | $ | (0.26 | ) | $ | (0.12 | ) | $ | (0.24 | ) | $ | (0.52 | ) | $ | 0.13 | |
Diluted | | $ | (0.26 | ) | $ | (0.12 | ) | $ | (0.24 | ) | $ | (0.52 | ) | $ | 0.13 | |
Dividends per share—common(2) | | $ | 0.47 | | $ | 0.37 | | $ | 0.07 | | $ | 0.09 | | $ | 1.32 | |
Balance Sheet Data (end of period): | | | | | | | | | | | | | | | | |
Working capital deficit | | $ | (15,926 | ) | $ | (16,802 | ) | $ | (12,781 | ) | $ | (41,791 | ) | $ | (20,431 | ) |
Property and equipment, net | | | 1,472,161 | | | 1,242,890 | | | 1,216,166 | | | 1,280,233 | | | 1,528,490 | |
Total assets | | | 2,426,475 | | | 1,962,616 | | | 1,991,103 | | | 2,080,233 | | | 2,546,743 | |
Long-term and current maturities of debt | | | 1,036,305 | | | 798,409 | | | 718,570 | | | 873,702 | | | 1,263,706 | |
Capital lease obligations (including current maturities) | | | 25,257 | | | 28,367 | | | 31,327 | | | 23,799 | | | 27,896 | |
Interest of non-controlling partners in the Partnership | | | 792,574 | | | 666,827 | | | 717,063 | | | 587,624 | | | 522,961 | |
Stockholders' equity | | | 950,240 | | | 829,247 | | | 901,478 | | | 815,910 | | | 738,390 | |
Cash Flow Data: | | | | | | | | | | | | | | | | |
Net cash flow provided by (used in)(3): | | | | | | | | | | | | | | | | |
Operating activities | | $ | 100,456 | | $ | 141,293 | | $ | 84,790 | | $ | 78,850 | | $ | 170,154 | |
Investing activities | | | (490,283 | ) | | (132,094 | ) | | 14,638 | | | 379,874 | | | (186,768 | ) |
Financing activities | | | 362,460 | | | (1,636 | ) | | (87,351 | ) | | (461,980 | ) | | 22,720 | |
Non-GAAP Financial Measures: | | | | | | | | | | | | | | | | |
Gross operating margin(4) | | $ | 393,758 | | $ | 375,165 | | $ | 338,300 | | $ | 311,222 | | $ | 307,786 | |
Partnership's adjusted EBITDA(5)(6) | | $ | 214,089 | | $ | 214,028 | | $ | 186,880 | | $ | 158,682 | | $ | 163,394 | |
Operating Data: | | | | | | | | | | | | | | | | |
Pipeline throughput (MMBtu/d) | | | 1,943,000 | | | 2,037,000 | | | 1,971,000 | | | 2,040,000 | | | 2,002,000 | |
Natural gas processed (MMBtu/d) | | | 1,350,000 | | | 1,325,000 | | | 1,366,000 | | | 1,235,000 | | | 1,608,000 | |
NGL Fractionation (Gals/d) | | | 1,359,000 | | | 1,109,000 | | | 922,000 | | | 686,000 | | | 956,000 | |
Crude oil handling (Bbls/d)(7) | | | 11,800 | | | — | | | — | | | — | | | — | |
Brine disposal handling (Bbls/d)(7) | | | 7,800 | | | — | | | — | | | — | | | — | |
- (1)
- We recognized a gain of $14.7 million in 2008 as a result of the Partnership issuing additional units in public offerings at prices per unit greater than our equivalent carrying value.
- (2)
- Dividend Paid.
- (3)
- Cash flow data includes cash flows from discontinued operations.
- (4)
- Gross operating margin is defined as revenue less related cost of purchased gas, NGLs and crude oil.
- (5)
- Partnership's adjusted EBITDA is defined as net income plus interest expense, provision for income taxes and depreciation and amortization expense, impairments, stock-based compensation, loss on extinguishment of debt, (gain) loss on noncash derivatives, transaction cost associated with successful transactions, non-controlling interest; certain severance and exit expenses; and accrued legal judgment under appeal; less (income) loss from discontinued operations, gain on sale of assets related to discontinued operations and equity in earnings of limited liability company.
- (6)
- Partnership's adjusted EBITDA for the years ended December 31, 2009 and 2008 is from continuing operations.
- (7)
- Crude oil handling and brine disposal volumes include a daily average for July 2012 through December 2012, the six-month period these assets were operated by the Partnership.
Non-GAAP Financial Measures
We include the following non-GAAP financial measures in this report: adjusted EBITDA and gross operating margin.
We define adjusted EBITDA as net income plus interest expense, provision for income taxes and depreciation and amortization expense, impairments, stock-based compensation, loss on extinguishment of debt, (gain) loss on noncash derivatives, transaction costs associated with successful transactions, non-controlling interest; certain severance and exit expenses; and accrued legal judgment under appeal;
50
Table of Contents
less (income) loss from discontinued operations, gain on sale of assets related to discontinued operations, gain on sale of property and equity in earnings of limited liability company. The Partnership's adjusted EBITDA is used as a supplemental performance measure by its management and by external users of its financial statements such as investors, commercial banks, research analysts and others to assess:
- •
- financial performance of the Partnership's assets without regard to financing methods, capital structure or historical cost basis;
- •
- the ability of the Partnership's assets to generate cash sufficient to pay interest costs, support its indebtedness and make cash distributions to its unitholders and the general partner;
- •
- the Partnership's operating performance and return on capital as compared to those of other companies in the midstream energy sector, without regard to financing methods or capital structure; and
- •
- the viability of acquisitions and capital expenditure projects and the overall rates of return on alternative investment opportunities.
Adjusted EBITDA is one of the critical inputs into the financial covenants within the Partnership's credit facility. The rates the Partnership pays for borrowings under its credit facility are determined by the ratio of its debt to the Partnership's adjusted EBITDA.
Adjusted EBITDA should not be considered an alternative to, or more meaningful than, net income, operating income, cash flows from operating activities or any other measure of financial performance presented in accordance with GAAP. The Partnership's adjusted EBITDA may not be comparable to similarly titled measures of other companies because other entities may not calculate adjusted EBITDA operations in the same manner.
The Partnership's adjusted EBITDA does not include interest expense, income taxes or depreciation and amortization expense. Because the Partnership has borrowed money to finance its operations, interest expense is a necessary element of its costs and its ability to generate cash available for distribution. Because the Partnership uses capital assets, depreciation and amortization are also necessary elements of its costs. Therefore, any measures that exclude these elements have material limitations. To compensate for these limitations, we believe that it is important to consider both net earnings determined under GAAP, as well as the Partnership's adjusted EBITDA, to evaluate the Partnership's overall performance.
51
Table of Contents
The following table provides a reconciliation of the Company's net income(loss) to the Partnership's adjusted EBITDA:
| | | | | | | | | | | | | | | | |
| | Years Ended December 31, | |
|---|
| | 2012 | | 2011 | | 2010 | | 2009 | | 2008 | |
|---|
| | (In thousands)
| |
|---|
Net income (loss) attributable to Crosstex Energy, Inc. | | $ | (12,481 | ) | $ | (6,007 | ) | $ | (11,651 | ) | $ | 15,642 | | $ | 24,233 | |
Interest expense | | | 86,515 | | | 79,227 | | | 87,028 | | | 95,078 | | | 74,861 | |
Depreciation and amortization | | | 162,300 | | | 125,358 | | | 111,625 | | | 119,162 | | | 107,652 | |
Impairment | | | — | | | — | | | 1,311 | | | 2,894 | | | 30,177 | |
Equity in earnings of limited liability company | | | (3,250 | ) | | — | | | — | | | — | | | — | |
Loss on extinguishment of debt | | | — | | | — | | | 14,713 | | | 4,669 | | | — | |
(Gain) loss on sale of property | | | (342 | ) | | 264 | | | (13,881 | ) | | (666 | ) | | (947 | ) |
Stock-based compensation | | | 9,484 | | | 7,556 | | | 9,569 | | | 8,854 | | | 11,279 | |
(Income) loss from discontinued operations, net of tax | | | — | | | — | | | — | | | 1,519 | | | (21,466 | ) |
Gain on sale of discontinued operations, net of tax | | | — | | | — | | | — | | | (159,961 | ) | | (42,753 | ) |
Gain on issuance of Partnership units | | | — | | | — | | | — | | | — | | | (14,748 | ) |
Non-controlling interest | | | (24,259 | ) | | 4,728 | | | (9,862 | ) | | 70,463 | | | (9,470 | ) |
Taxes | | | (6,642 | ) | | (2,768 | ) | | (6,021 | ) | | (6,020 | ) | | (1,375 | ) |
Other(a) | | | 2,764 | | | 5,670 | | | 4,049 | | | 7,048 | | | 5,951 | |
| | | | | | | | | | | | |
Partnership's adjusted EBITDA(b) | | $ | 214,089 | | $ | 214,028 | | $ | 186,880 | | $ | 158,682 | | $ | 163,394 | |
| | | | | | | | | | | | |
- (a)
- Includes the Partnership's financial derivatives marked-to-market; the Partnership's transaction costs associated with successful transactions; the Partnership's severance and exit expenses and accrued expense of a legal judgment under appeal (as allowed for adjustment under the Partnership's credit facility) and CEI's direct general and adminstrative expenses and other income are not included in the Partnership's adjusted EBITDA.
- (b)
- The Partnership's Adjusted EBITDA for the years ended December 31, 2009 and 2008 is from continuing operations.
We define gross operating margin as revenues minus cost of purchased gas, NGLs and crude oil. We present gross operating margin by segment in "Item 7. Management's Discussion and Analysis of Financial Condition and Results of Operations—Results of Operations." We disclose gross operating margin in addition to total revenue because it is the primary performance measure used by our management. We believe gross operating margin is an important measure because the Partnership's business is generally to purchase and resell natural gas and crude oil for a margin or to gather, process, transport or market natural gas, NGLs and crude oil for a fee. Operating expense is a separate measure used by management to evaluate operating performance of field operations. Direct labor and supervision, property insurance, property taxes, repair and maintenance, utilities and contract services comprise the most significant portion of the Partnership's operating expenses. We do not deduct operating expenses from total revenue in calculating gross operating margin because these expenses are largely independent of the volumes the Partnership transports or processes and fluctuate depending on the activities performed during a specific period. As an indicator of our operating performance, gross operating margin should not be considered an alternative to, or more meaningful than, net income as determined in accordance with GAAP. Our gross operating margin may not be comparable to similarly titled measures of other companies because other entities may not calculate these amounts in the same manner.
52
Table of Contents
The following table provides a reconciliation of gross operating margin to operating income (in thousands):
| | | | | | | | | | | | | | | | |
| | Years Ended December 31, | |
|---|
| | 2012 | | 2011 | | 2010 | | 2009 | | 2008 | |
|---|
Total gross operating margin | | $ | 393,758 | | $ | 375,165 | | $ | 338,300 | | $ | 311,222 | | $ | 307,786 | |
Add (deduct): | | | | | | | | | | | | | | | | |
Operating expenses | | | (130,882 | ) | | (111,778 | ) | | (105,060 | ) | | (110,394 | ) | | (125,762 | ) |
General and administrative expenses | | | (65,083 | ) | | (55,516 | ) | | (51,172 | ) | | (62,491 | ) | | (72,377 | ) |
Gain (loss) on sale of property | | | 342 | | | (264 | ) | | 13,881 | | | 666 | | | 947 | |
Gain (loss) on derivatives | | | (1,006 | ) | | (7,776 | ) | | (9,100 | ) | | 2,994 | | | 8,619 | |
Depreciation, amortization and impairments | | | (162,300 | ) | | (125,358 | ) | | (112,936 | ) | | (122,056 | ) | | (137,829 | ) |
| | | | | | | | | | | | |
Operating income | | $ | 34,829 | | $ | 74,473 | | $ | 73,913 | | $ | 19,941 | | $ | (18,616 | ) |
| | | | | | | | | | | | |
Item 7. Management's Discussion and Analysis of Financial Condition and Results of Operations
You should read the following discussion of our financial condition and results of operations in conjunction with the financial statements and notes thereto included elsewhere in this report. For more detailed information regarding the basis of presentation for the following information, you should read the notes to the financial statements included in this report.
Overview
Crosstex Energy, Inc. is a Delaware corporation formed on April 28, 2000. Our assets consist almost exclusively of partnership interests in Crosstex Energy, L.P., a publicly traded limited partnership engaged in providing midstream energy services, including gathering, processing, transmission and marketing, to producers of natural gas, NGLs and crude oil. The Partnership also provides crude oil, condensate and brine water services to producers. The Partnership's midstream energy asset network includes approximately 3,500 miles of pipelines, ten natural gas processing plants, four fractionators, 3.1 million barrels of NGL cavern storage, rail terminals, barge terminals, truck terminals and a fleet of approximately 100 trucks. The Partnership manages and reports its activities primarily according to geography. The Partnership has five reportable segments: (1) South Louisiana processing and NGL, or PNGL, which includes its processing and NGL assets in South Louisiana; (2) Louisiana, or LIG, which includes its pipelines and processing plants located in Louisiana; (3) North Texas, or NTX, which includes its activities in the Barnett Shale and the Permian Basin; (4) Ohio River Valley, or ORV, which includes its activities in the Utica Shale; and (5) Corporate Segment, or Corporate, which includes its equity investment in Howard Energy Partners, or HEP, in the Eagle Ford Shale and its general partnership property and expenses. These partnership interests consist of (i) 16,414,830 common units, representing approximately 19.7% of the limited partner interests in Crosstex Energy, L.P. as of December 31, 2012 and (ii) 100% ownership interest in Crosstex Energy GP, LLC, the general partner of Crosstex Energy, L.P., which owns a 1.9% general partner interest as of December 31, 2012 and all of the incentive distribution rights in Crosstex Energy, L.P.
Our cash flows consist almost exclusively of distributions from the Partnership on the partnership interests we own. The Partnership is required by its partnership agreement to distribute all of its cash on hand at the end of each quarter, less reserves established by its general partner in its sole discretion to provide for the proper conduct of the Partnership's business or to provide for future distributions.
53
Table of Contents
The incentive distribution rights entitle us to receive an increasing percentage of cash distributed by the Partnership as certain target distribution levels are reached. Specifically, they entitle us to receive 13.0% of all cash distributed in a quarter after each unit has received $0.25 for that quarter, 23.0% of all cash distributed after each unit has received $0.3125 for that quarter, and 48.0% of all cash distributed after each unit has received $0.375 for that quarter.
During 2012, the Partnership paid quarterly distributions to it common unitsholders in May, August and November of $0.33, $0.33 and $0.33 related to the first, second and third quarters of 2012, respectively. The Partnership paid a quarterly distribution of $0.33 in February 2013 related to the fourth quarter of 2012. Our share of the distributions with respect to our limited and general partner interests in the Partnership totaled $27.4 million for the year end December 31, 2012, $0.1 million of which was paid-in-kind through the issuance of additional limited partner common units to the general partner in lieu of cash.
Since we control the general partner interest in the Partnership, we reflect our ownership interest in the Partnership on a consolidated basis, which means that our financial results are combined with the Partnership's financial results and the results of our other subsidiaries. The interest owned by non-controlling partners' share of income is reflected separately in our results of operations. We have no separate operating activities apart from those conducted by the Partnership, and our cash flows consist almost exclusively of distributions from the Partnership on the partnership interests we own. Our consolidated results of operations are derived from the results of operations of the Partnership and also include our gains on the issuance of units in the Partnership, deferred taxes, interest of non-controlling partners in the Partnership's net income, interest income (expense) and general and administrative expenses not reflected in the Partnership's results of operation. Accordingly, the discussion of our financial position and results of operations in this "Management's Discussion and Analysis of Financial Condition and Results of Operations" primarily reflects the operating activities and results of operations of the Partnership.
The Partnership manages its operations by focusing on gross operating margin because its business is generally to purchase and resell natural gas, NGLs and crude oil for a margin or to gather, process, transport or market natural gas, NGLs and crude oil for a fee. In addition, the Partnership earns a volume based fee for brine disposal services. The Partnership defines gross operating margin as operating revenue minus cost of purchased gas, NGLs and crude oil.
The Partnership's gross operating margins are determined primarily by the volumes of natural gas gathered, transported, purchased and sold through its pipeline systems, processed at its processing facilities, the volumes of NGLs handled at its fractionation facilities, the volumes of crude oil handled at its crude terminals, the volumes of crude oil gathered, transported, purchased and sold and the volume of brine disposed. The Partnership generates revenues from seven primary sources:
- •
- purchasing and reselling or transporting natural gas on the pipeline systems it owns;
- •
- processing natural gas at its processing plants;
- •
- fractionating and marketing the recovered NGLs;
- •
- providing compression services;
- •
- purchasing and reselling crude and condensate;
- •
- providing crude oil transportation and terminal services; and
- •
- providing brine disposal services.
The Partnership generally gathers or transports gas owned by others through its facilities for a fee, or it buys natural gas from a producer, plant or shipper at either a fixed discount to a market index or a percentage of the market index, then transports and resells the natural gas at the market index. The
54
Table of Contents
Partnership attempts to execute all purchases and sales substantially concurrently, or it enters into a future delivery obligation, thereby establishing the basis for the margin it will receive for each natural gas transaction. The Partnership's gathering and transportation margins related to a percentage of the index price can be adversely affected by declines in the price of natural gas. The Partnership is also party to certain long-term gas sales commitments that it satisfies through supplies purchased under long-term gas purchase agreements. When the Partnership enters into those arrangements, its sales obligations generally match its purchase obligations. However, over time the supplies that it has under contract may decline due to reduced drilling or other causes and the Partnership may be required to satisfy the sales obligations by buying additional gas at prices that may exceed the prices received under the sales commitments. In the Partnership's purchase/sale transactions, the resale price is generally based on the same index at which the gas was purchased. However, on occasion the Partnership has entered into certain purchase/sale transactions in which the purchase price is based on a production-area index and the sales price is based on a market-area index, and it captures the difference in the indices (also referred to as basis spread), less the transportation expenses from the two areas, as margin. Changes in the basis spread can increase or decrease the Partnership's margins.
One contract (the "Delivery Contract") has a term to 2019 that obligates the Partnership to supply approximately 150,000 MMBtu/d of gas. At the time that the Partnership entered into the Delivery Contract in 2008, it had dedicated supply sources in the Barnett Shale that exceeded the delivery obligations under the Delivery Contract. The Partnership's agreements with these suppliers generally provided that the purchase price for the gas was equal to a portion of its sales price for such gas less certain fees and costs. Accordingly, the Partnership was initially able to generate a positive margin under the Delivery Contract. However, since entering into the Delivery Contract, there has been both (1) a reduction in the gas available under the supply contracts and (2) the discovery of other shale reserves, most notably the Haynesville and the Marcellus Shales, which has increased the supplies available to east coast markets and reduced the basis spread between north Texas-area production and the market indices used in the Delivery Contract. Due to these factors, the Partnership has had to purchase a portion of the gas necessary to fulfill its obligations under the Delivery Contract at market prices, resulting in negative margins under the Delivery Contract.
The Partnership has recorded a loss of approximately $17.5 million during the year ended December 31, 2012 on the Delivery Contract. The Partnership currently expects that it will record a loss of approximately $20.0 million to $24.0 million during the year ending December 31, 2013. This estimate is based on forward prices, basis spreads and other market assumptions as of December 31, 2012. These assumptions are subject to change if market conditions change during 2013 and actual results under the Delivery Contract in 2013 could be substantially different from the Partnership's current estimates, which may result in a greater loss than currently estimated.
The Partnership generally gathers or transports crude oil owned by others by rail, truck, pipeline and barge facilities for a fee, or it buys crude oil from a producer at a fixed discount to a market index, then transports and resells the crude oil at the market index. The Partnership executes all purchases and sales substantially concurrently, thereby establishing the basis for the margin it will receive for each crude oil transaction. Additionally, it provides crude oil, condensate and brine services on a volume basis.
The Partnership also realizes gross operating margins from its processing services primarily through three different contract arrangements: processing margins (margin), percentage of liquids (POL) or fixed-fee based. Under margin contract arrangements the Partnership's gross operating margins are higher during periods of high liquid prices relative to natural gas prices. Gross operating margin results under POL contracts are impacted only by the value of the liquids produced with margins higher during periods of higher liquids prices. Under fixed-fee based contracts the Partnership's gross operating margins are driven by throughput volume. See "Item 7A. Quantitative and Qualitative Disclosures about Market Risk—Commodity Price Risk."
55
Table of Contents
Operating expenses are costs directly associated with the operations of a particular asset. Among the most significant of these costs are those associated with direct labor and supervision, property insurance, property taxes, repair and maintenance expenses, contract services and utilities. These costs are normally fairly stable across broad volume ranges and therefore do not normally decrease or increase significantly in the short term with decreases or increases in the volume of gas, liquids or crude oil moved through or by the asset.
Business Strategy
The Partnership's business strategy consists of two overarching objectives which are to maximize earnings and growth of its existing businesses and enhance the scale and diversification of its assets.
As part of enhancing its scale and diversification, the Partnership has concentrated on expanding its NGL business, growing a crude oil and condensate business, and developing its gas processing and transportation business in rich gas areas. The Partnership believes increasing its scale and diversification will strengthen the Partnership as a company because the Partnership believes it will lead to less reliance on any single geographic area, provide the Partnership a better balance between business driven by crude oil and natural gas, offer the Partnership greater opportunities from a broader asset base and provide the Partnership with more sustainable fee-based cash flows.
The Partnership's strategies include the following:
- •
- Maximize earnings and growth of its existing businesses. The Partnership intends to leverage its franchise position, infrastructure and customer relationships in the Partnership's existing areas of operation by expanding its existing systems to meet new or increased demand for its gathering, transmission, processing and marketing services.
- •
- Enhance scale and diversification of its assets. The Partnership looks to grow and diversify by acquiring and/or building assets in new areas that will serve as a platform for growth with a focus on emerging shale plays and other areas with NGL, crude oil and condensate exposure.
Recent Developments
Cajun-Sibon Phases I and II. In Louisiana, the Partnership is transforming its business that has been historically focused on processing offshore natural gas to a business that is focused on NGLs with additional opportunities for growth from new onshore supplies of NGLs. The Louisiana petrochemical market has historically relied on liquids from offshore production; however, the decrease in offshore production and increase in onshore rich gas production have changed the market structure. Cajun-Sibon Phases I and II will work to bridge the gap between supply, which aggregates in the Mont Belvieu area, and demand located in the Mississippi River corridor of Louisiana, thereby building a strategic NGL position in this region.
The Partnership began this transformation by restarting its Eunice fractionator during 2011 at a rate of 15,000 Bbls/d of NGLs. This is a pivotal asset for Cajun-Sibon Phase I as the Partnership is expanding this facility to a rate of 55,000 Bbls/d. When Phase I of its pipeline extension project is completed, Mont Belvieu supply lines in east Texas will be connected to Eunice providing a direct link to its fractionators in south Louisiana markets. The Eunice fractionator expansion will increase our interconnected fractionation capacity in Louisiana to approximately 97,000 Bbls/d of raw-make NGLs.
Construction is underway on the Phase I pipeline extension. The pipeline extension between Mont Belvieu and Eunice will have an initial capacity of 70,000 Bbls/d for raw-make NGLs. The Partnership expects Phase I facilities, both the pipeline and the expanded fractionation facilities, will be operating by mid-2013.
56
Table of Contents
Cajun-Sibon Phase II will further enhance the Partnership's Louisiana NGL business with significant additions to the Cajun-Sibon Phase I NGL pipeline extension and Eunice expansion. Under Phase II the Partnership will add pumping stations on the Phase I extension to increase its NGL supply capacity from 70,000 Bbls/d to 120,000 Bbls/d, construct a new 100,000 Bbl/d fractionator at the Plaquemine gas processing plant site and extend the Phase I NGL pipeline from Eunice to the new Plaquemine fractionator. The Partnership expects Phase II will be in service during the second half of 2014. The Partnership currently estimates the total capital investment for both Phases of Cajun-Sibon will be between $680.0 million and $700.0 million.
Clearfield Acquisition. On July 2, 2012, the Partnership completed the acquisition of all of the issued and outstanding common stock of Clearfield Energy, Inc. and its wholly-owned subsidiaries (collectively, "Clearfield"). Clearfield was a crude oil, condensate and water services company with operations in Ohio, Kentucky and West Virginia. The Partnership paid approximately $215.0 million in cash for Clearfield, which the Partnership funded from proceeds of its May 2012 offering of 7.125% Senior Notes due 2022. The assets associated with this acquisition are included in a new reporting segment that is referred to as Ohio River Valley. See "Item 1. Business-Recent Growth Developments" for further details.
2022 Notes. On May 24, 2012, the Partnership issued $250.0 million in aggregate principal amount of 7.125% senior unsecured notes (the "2022 Notes") due on June 1, 2022. The interest payments are due semi-annually in arrears in June and December. Net proceeds from the sale of the notes of $245.1 million (net of transaction costs) were used to fund the Clearfield acquisition and for general partnership purposes, including capital expenditures for the Cajun-Sibon NGL pipeline expansion.
Issuance of Common Units. On May 15, 2012, the Partnership issued 10,120,000 common units representing limited partner interests in the Partnership at a public offering price of $16.28 per unit for net proceeds of $158.0 million. In addition, the Partnership's general partner made a capital contribution of $3.4 million in connection with the issuance to maintain its general partner interest. The net proceeds from the common units offering were used for general partnership purposes.
On September 14, 2012, the Partnership issued 5,660,378 common units representing limited partner interests in the Partnership at a price of $13.25 per unit for net proceeds of $74.8 million. The net proceeds from the common units issuance were used primarily to fund the Partnership's currently identified projects, including the Cajun-Sibon NGL pipeline expansion, and for general partnership purposes. The Partnership's general partner did not make a general partner contribution to maintain its general partner interest in accordance with the September 2012 amendment to the partnership agreement causing its general partner's contribution to be permissive rather than mandatory.
On January 14, 2013, the Partnership issued 8,625,000 common units representing limited partner interests in the Partnership at a public offering price of $15.15 per common unit for net proceeds of $125.5 million. Concurrent with the public offering, the Partnership issued 2,700,000 common units representing limited partner interest in the Partnership at a price of $14.55 per unit for net proceeds of $39.3 million. The net proceeds from both common unit offerings will be used for capital expenditures for currently identified projects, including the Cajun-Sibon NGL pipeline extension, and for general partnership purposes. The Partnership's general partner did not make a general partner contribution to maintain its general partner interest in accordance with the September 2012 amendment to the partnership agreement causing its general partner's contribution to be permissive rather than mandatory.
Other Developments. The Partnership jointly invested in two other projects during 2011 and 2012. First, the Partnership and Apache Corporation jointly invested $85.0 million in the Deadwood natural gas processing facility in the Permian Basin which commenced operation in February 2012. The
57
Table of Contents
Partnership owns a 50% undivided working interest in this facility which is reflected on a consolidated basis. The Partnership also invested a total of $85.3 million during 2011 and 2012 for a 30.6% interest in HEP which owns midstream assets and provides midstream services to Eagle Ford Shale producers. The Partnership accounts for this investment under the equity method of accounting. Both of these investments are discussed more fully under "Item 1. Business—Recent Growth Developments."
During 2011, the Partnership expanded its gas gathering system in north Texas with the construction of a $28.3 million, 15-mile pipeline extension to serve major Barnett Shale producers. The project, which is supported by volumetric commitments, commenced operation in March 2011. The Partnership added more compression to this gathering system in January 2012 to increase capacity. In March 2011, the Partnership also completed construction of a new compressor station at a cost of approximately $15.9 million that increased compression on an existing north Texas gathering line to handle an additional 50 MMcf/d of natural gas. This capacity increase was needed to support a 10-year gathering commitment from a major Barnett Shale producer.
Impact of Federal Income Taxes
We are a corporation for federal income tax purposes. As such, we are subject to federal income tax on our taxable income at a maximum rate of 35% under current law and are also subject to state income tax. While we have historically been allocated losses from our investment in the Partnership's units, we expect that in the future we will be allocated taxable income as the level of tax depreciation and amortization deductions allocated to us from the Partnership diminishes relative to the income allocated to us from the Partnership's operations.
As of December 31, 2012 we have a net operating loss carry forward of $135.7 million for federal tax purposes. We believe it is more likely than not that we will generate sufficient taxable income from our future operations to utilize these net operating loss carry forwards before they expire. Once these net operating loss carry forwards are fully utilized, we will be subject to federal income tax on our taxable income at a maximum rate of 35% under current law.
Our use of this net operating loss carry forward will be limited if there is an "ownership change" in our common stock (generally, cumulative stock ownership changes in our common stock exceeding 50% during a three year period, as determined under Section 382 of the Internal Revenue Code).
Commodity Price Risk
The Partnership's business is subject to significant risks due to fluctuations in commodity prices. Its exposure to these risks is primarily in the gas processing component of its business. For the year ended December 31, 2012, approximately 7.5% of the Partnership's processed gas arrangements, based on gross operating margin, was processed under POL contracts. A portion of the volume of inlet gas at the Partnership's south Louisiana and north Texas processing plants is settled under POL agreements. Under these contracts the Partnership receives a fee in the form of a percentage of the liquids recovered and the producer bears all the costs of the natural gas volumes lost ("shrink"). Accordingly, the Partnership's revenues under these contracts are directly impacted by the market price of NGLs.
The Partnership also realizes processing gross margins under margin contracts and spot purchases. For the year ended December 31, 2012, approximately 9.6% of the Partnership's processed gas arrangements, based on gross operating margin, was processed under margin contracts and spot purchases. The Partnership has a number of margin contracts on the Plaquemine, Gibson, Eunice, Blue Water and Pelican processing plants. Under this type of contract, the Partnership pays the producer for the full amount of inlet gas to the plant and makes a margin based on the difference between the value of liquids recovered from the processed natural gas as compared to the value of the natural gas shrink and the cost of fuel used in processing. The shrink and fuel losses are referred to as plant thermal reduction or PTR.
58
Table of Contents
The Partnership is also indirectly exposed to commodity prices due to the negative impacts on production and the development of production of natural gas, NGLs and crude oil connected to or near the assets and on its margins for transportation between certain market centers. Low prices for these products could reduce the demand for the Partnership's services and volumes on its systems.
In the past, the prices of natural gas and NGLs have been extremely volatile and the Partnership expects this volatility to continue. For example, prices of natural gas and NGLs in 2012 were below the market price realized throughout most of 2011 while prices for oil were relatively consistent with 2011 market prices. Crude oil prices (based on the NYMEX futures daily close prices for the prompt month) in 2012 ranged from a high of $109.77 per Bbl in February 2012 to a low of $77.69 per Bbl in June 2012. Weighted average NGL prices in 2012 (based on the OPIS Napoleonville daily average spot liquids prices) ranged from a high of $1.36 per gallon in January 2012 to a low of $0.79 per gallon in June 2012. Natural gas prices (based on Gas Daily Henry Hub closing prices) during 2012 ranged from a low of $1.83 per MMBtu in April 2012 to a high of $3.77 per MMBtu in November 2012.
Changes in commodity prices may also indirectly impact the Partnership's profitability by influencing drilling activity and well operations, and thus the volume of gas the Partnership gathers and processes. The volatility in commodity prices may cause the Partnership's gross operating margin and cash flows to vary widely from period to period. Partnership hedging strategies may not be sufficient to offset price volatility risk and, in any event, do not cover all of the Partnership's throughput volumes. For a discussion of the Partnership's risk management activities, please read "Item 7A. Quantitative and Qualitative Disclosures about Market Risk."
Results of Operations
Set forth in the table below is certain financial and operating data for the periods indicated, which excludes financial and operating data deemed discontinued operations. The Partnership manages its
59
Table of Contents
operations by focusing on gross operating margin which the Partnership defines as operating revenue minus cost of purchased gas, NGLs and crude oil as reflected in the table below.
| | | | | | | | | | |
| | Years Ended December 31, | |
|---|
| | 2012 | | 2011 | | 2010 | |
|---|
| | (Dollars in millions)
| |
|---|
LIG Segment | | | | | | | | | | |
Revenues | | $ | 786.9 | | $ | 939.3 | | $ | 963.0 | |
Purchased gas and NGLs | | | (678.2 | ) | | (809.5 | ) | | (845.6 | ) |
| | | | | | | | |
Total gross operating margin | | $ | 108.7 | | $ | 129.8 | | $ | 117.4 | |
| | | | | | | | |
NTX Segment | | | | | | | | | | |
Revenues | | $ | 365.5 | | $ | 432.6 | | $ | 399.5 | |
Purchased gas and NGLs | | | (180.1 | ) | | (262.7 | ) | | (240.1 | ) |
| | | | | | | | |
Total gross operating margin | | $ | 185.4 | | $ | 169.9 | | $ | 159.4 | |
| | | | | | | | |
PNGL Segment | | | | | | | | | | |
Revenues | | $ | 862.8 | | $ | 910.9 | | $ | 602.6 | |
Purchased gas and NGLs | | | (788.8 | ) | | (835.4 | ) | | (541.1 | ) |
| | | | | | | | |
Total gross operating margin | | $ | 74.0 | | $ | 75.5 | | $ | 61.5 | |
| | | | | | | | |
ORV Segment | | | | | | | | | | |
Revenues | | $ | 108.0 | | $ | — | | $ | — | |
Purchased crude oil | | | (82.3 | ) | | — | | | — | |
| | | | | | | | |
Total gross operating margin | | $ | 25.7 | | $ | — | | $ | — | |
| | | | | | | | |
Corporate | | | | | | | | | | |
Revenues | | $ | (467.3 | ) | $ | (268.9 | ) | $ | (172.4 | ) |
Purchased gas, NGLs and crude oil | | | 467.3 | | | 268.9 | | | 172.4 | |
| | | | | | | | |
Total gross operating margin | | $ | — | | $ | — | | $ | — | |
| | | | | | | | |
Total | | | | | | | | | | |
Revenues | | $ | 1,655.9 | | $ | 2,013.9 | | $ | 1,792.7 | |
Purchased gas, NGLs and crude oil | | | (1,262.1 | ) | | (1,638.7 | ) | | (1,454.4 | ) |
| | | | | | | | |
Total gross operating margin | | $ | 393.8 | | $ | 375.2 | | $ | 338.3 | |
| | | | | | | | |
Midstream Volumes: | | | | | | | | | | |
LIG | | | | | | | | | | |
Gathering and Transportation (MMBtu/d) | | | 783,000 | | | 912,000 | | | 902,000 | |
Processing (MMBtu/d) | | | 248,000 | | | 247,000 | | | 283,000 | |
NTX | | | | | | | | | | |
Gathering and Transportation (MMBtu/d) | | | 1,160,000 | | | 1,125,000 | | | 1,069,000 | |
Processing (MMBtu/d) | | | 364,000 | | | 249,000 | | | 209,000 | |
PNGL | | | | | | | | | | |
Processing (MMBtu/d) | | | 738,000 | | | 829,000 | | | 874,000 | |
NGL Fractionation (Gals/d) | | | 1,359,000 | | | 1,109,000 | | | 922,000 | |
ORV* | | | | | | | | | | |
Crude Oil Handling (Bbls/d)(1) | | | 11,800 | | | — | | | — | |
Brine Disposal (Bbls/d)(1) | | | 7,800 | | | — | | | — | |
- *
- Crude oil handling from PNGL is included in ORV reported volumes
60
Table of Contents
- (1)
- Crude oil handling and brine disposal volume for ORV include a daily average for July 2012 through December 2012, a six-month period these assets were operated by us.
Year ended December 31, 2012 Compared to Year ended December 31, 2011
Gross Operating Margin. Gross operating margin was $393.8 million for the year ended December 31, 2012 compared to $375.2 million for the year ended December 31, 2011, an increase of $18.6 million, or 5%. The overall increase was due to the July 2012 acquisition of the ORV assets, increased throughput on the Partnership's NTX and Permian Basin systems, an increase in NGL fractionation and marketing activity and an increase from the Partnership's south Louisiana crude oil terminal activity. The following provides additional details regarding this change in gross operating margin:
- •
- The ORV segment is comprised of the assets from the Partnership's acquisition of Clearfield Energy, Inc. in July 2012. These assets contributed a total of $25.7 million to the Partnership's gross operating margin growth for the year ended December 31, 2012. Gross operating margins from crude oil and condensate handling and brine disposal and handling were $17.2 million and $8.5 million, respectively. See "Recent Developments" for further detail on the acquisition and assets.
- •
- The LIG segment had a gross operating margin decline of $21.1 million for the year ended December 31, 2012 compared to the year ended December 31, 2011. The weaker processing environment during 2012 as compared to 2011 contributed to a decrease in gross operating margin for the processing activities during the year ended December 31, 2012. Gross operating margin decreased by $7.7 million from the Partnership's Plaquemine and Gibson plants and by $9.0 million from gas processed for the Partnership's account by a third party processor. Gross operating margins decreased by $4.4 million on the gathering and transmission assets due to decreased throughput volumes which includes the impact of Bayou Corne sinkhole discussed more fully under "Changes in Operations During 2012 and 2013."
- •
- The NTX segment had a gross operating margin increase of $15.5 million for the year ended December 31, 2012 compared to the year ended December 31, 2011. An increase in throughput volume on the gathering and transmission assets from two north Texas expansion projects contributed $5.8 million to the gross operating margin improvement. The north Texas processing plants also had a gross operating margin increase of $4.3 million for the comparable periods primarily due to increased supply due to the Partnership's expansion projects. In addition, the gas processing facilities located in the Permian Basin, which commenced operations in 2012, contributed $9.6 million to gross operating margin. These increases were partially offset by an increase in losses of $4.2 million on the Delivery Contract discussed more fully under "Overview."
- •
- The PNGL segment had a gross operating margin decrease of $1.5 million the year ended December 31, 2012 compared to the year ended December 31, 2011. The Partnership's NGL fractionation and marketing activities contributed a gross operating margin improvement of $11.6 million as a result of the growth and expansion of its NGL fractionation and marketing activities. The Partnership increased its NGL fractionation and marketing activities through the restart of the Eunice fractionator in June 2011 and by increasing its truck and rail activity at its Riverside fractionator. These increases were offset by a combined gross operating margin decrease of $18.3 million from the Partnership's south Louisiana processing plants due to a less favorable processing environment during 2012 as compared to 2011. The Partnership's new crude oil terminal activity in south Louisiana also contributed a gross operating margin increase of $5.2 million during the year ended December 31, 2012.
61
Table of Contents
Operating Expenses. Operating expenses were $130.9 million for the year ended December 31, 2012 compared to $111.8 million for the year ended December 31, 2011, an increase of $19.1 million, or 17.1%. This increase in operating expenses includes a total increase of $11.9 million related to the direct operating costs of the ORV assets that the Partnership purchased from Clearfield in July 2012. The primary contributors to the total increase are as follows:
- •
- the Partnership's labor and benefits expense increased by $9.5 million related to the acquisition of its ORV assets and an increase in employee headcount for activity related to the Permian Basin expansions in the North Texas segment and for growth projects in the PNGL segment;
- •
- the Partnership's materials, supplies and contractor service expenses increased by $5.8 million related to the acquisition of the Partnership's ORV assets, project expansions in the North Texas and PNGL segments and compressor overhauls;
- •
- the Partnership's rents, leases, vehicle and utility expenses increased $1.8 million due to increases from the acquisition of the Partnership's ORV assets and project expansions in the North Texas and PNGL segments, which were partially offset by reductions in compressor rental and utilities expenses in the LIG segment;
- •
- the Partnership's training, audit and consulting expenses related to regulatory activity increased by $1.2 million;
- •
- the Partnership's ad valorem tax expense increased by $2.0 million due to project expansions; and
- •
- the Partnership's other expenses decreased by $2.0 million due to the 2011 accrual of a legal judgment under appeal.
General and Administrative Expenses. General and administrative expenses were $65.1 million for the year ended December 31, 2012 compared to $55.5 million for the year ended December 31, 2011, an increase of $9.6 million, or 17.1%. The increase is primarily a result of the following:
- •
- the Partnership's fees and services expense increased by $7.3 million primarily due to $2.8 million of acquisition cost for its ORV assets and $3.2 million for evaluation expenses related to potential acquisitions;
- •
- the Partnership's stock based compensation expense increased by $1.8 million;
- •
- the Partnership's labor and benefits expense decreased by $0.2 million primarily related to a decrease in bonuses substantially offset by an increase in labor and benefit expenses due to an increase in employee headcount; and
- •
- the Partnership's traveling and training expense increased by $0.5 million primarily due to acquisition activities.
62
Table of Contents
Gain/Loss on Derivatives. Loss on derivatives was $1.0 million for the year ended December 31, 2012 compared to a loss of $7.8 million for the year ended December 31, 2011. The derivative transaction types contributing to the net (gain) loss are as follows (in millions):
| | | | | | | | | | | | | |
| | Years Ended December 31, | |
|---|
| | 2012 | | 2011 | |
|---|
(Gain) Loss on Derivatives: | | Total | | Realized | | Total | | Realized | |
|---|
Basis swaps | | $ | 5.2 | | $ | 4.6 | | $ | 1.4 | | $ | 1.3 | |
Processing margin hedges | | | (3.1 | ) | | 0.5 | | | 6.6 | | | 5.7 | |
Liquids Swaps-non designated | | | (1.0 | ) | | — | | | — | | | — | |
Other | | | (0.1 | ) | | (0.6 | ) | | (0.2 | ) | | — | |
| | | | | | | | | | |
Net loss on derivatives | | $ | 1.0 | | $ | 4.5 | | $ | 7.8 | | $ | 7.0 | |
| | | | | | | | | | |
Depreciation and Amortization. Depreciation and amortization expenses were $162.3 million for the year ended December 31, 2012 compared to $125.4 million for the year ended December 31, 2011, an increase of $36.9 million, or 29.5%. The increase includes $24.9 million due to accelerated depreciation related to the Sabine Pass plant, $4.9 million related to depreciation on the ORV assets and $2.8 million related to depreciation on additions in the Permian area. In addition, amortization increased $3.1 million due to intangible amortization related to a downward revision in future estimated throughput volumes attributable to the dedicated acreage purchased with the Partnership's gathering system in north Texas and a $1.2 million impact due to depreciation on other net asset additions.
Interest Expense. Interest expense was $86.5 million for the year ended December 31, 2012 compared to $79.2 million for the year ended December 31, 2011, an increase of $7.3 million, or 9.2%. Net interest expense consists of the following (in millions):
| | | | | | | |
| | Years Ended
December 31, | |
|---|
| | 2012 | | 2011 | |
|---|
Senior notes | | $ | 75.1 | | $ | 64.3 | |
Bank credit facility | | | 6.5 | | | 5.5 | |
Capitalized interest | | | (4.0 | ) | | (0.9 | ) |
Amortization of debt issue costs and notes discount | | | 7.3 | | | 8.3 | |
Other | | | 1.6 | | | 2.0 | |
| | | | | | |
Total | | $ | 86.5 | | $ | 79.2 | |
| | | | | | |
Equity in earnings of limited liability company. Equity in earnings of limited liability company was $3.3 million for the year ended December 31, 2012 compared to no equity in earnings of limited liability company for the year ended December 31, 2011. Equity in earnings of limited liability company relates to the Partnership's investment in HEP.
Other Income. Other income was $5.1 million for the year ended December 31, 2012 compared to $0.7 million for the year ended December 31, 2011. Other income in 2012 includes a $3.0 million net gain related to the assignment to a third party of the Partnership's rights, title and interest in a contract for the construction of a processing plant. In addition, the Partnership settled certain liabilities associated with sold assets for less than the accrued liabilities resulting in a $1.3 million gain during 2012.
Income Taxes. We provide for income taxes using the liability method. Accordingly, deferred taxes are recorded for the differences between the tax and book basis of assets and liabilities that will reverse
63
Table of Contents
in future periods. An income tax benefit of $6.6 million was recorded on the loss from operations (net of non-controlling interest) for the year ended December 31, 2012. A net income tax benefit of $2.8 million was also recorded on loss from operation (net of non-controlling interest) for the year ended December 31, 2011.
Interest of Non-Controlling Partners in the Partnership's Net Income (Loss). The interest of non-controlling partners in the Partnership's net loss was $24.3 million for the year ended December 31, 2012 compared to a net income of $4.7 million for the year ended December 31, 2011 due to the changes shown in the following summary (in millions):
| | | | | | | |
| | Years Ended
December 31, | |
|---|
| | 2012 | | 2011 | |
|---|
Net loss for the Partnership | | $ | (40.3 | ) | $ | (2.4 | ) |
(Income) allocation to CEI for the general partner incentive distribution | | | (4.5 | ) | | (2.4 | ) |
Stock-based compensation costs allocated to CEI for its stock options and restricted stock granted to Partnership officers, employees and directors | | | 4.2 | | | 3.1 | |
Loss allocation to CEI for its general partner share of Partnership loss | | | 0.8 | | | — | |
| | | | | | |
Net loss allocable to limited partners | | | (39.8 | ) | | (1.7 | ) |
Less: CEI's share of net loss allocable to limited partners | | | 15.5 | | | 6.4 | |
| | | | | | |
Non-controlling partners' share of Partnership net income (loss) (including the Partnership's income attributed to preferred unitholders) | | $ | (24.3 | ) | $ | 4.7 | |
| | | | | | |
Year ended December 31, 2011 Compared to Year ended December 31, 2010
Gross Operating Margin. Gross operating margin was $375.2 million for the year ended December 31, 2011 compared to $338.3 million for the year ended December 31, 2010, an increase of $36.9 million, or 10.9%. The increase was due to increased throughput on the Partnership's gathering and transmission systems, as well as favorable NGL markets during 2011. The following provides additional details regarding this change in gross operating margin:
- •
- The LIG segment had a gross operating margin increase of $12.4 million for the year ended December 31, 2011 compared to the year ended December 31, 2010. The strength of the processing environment during 2011 contributed to a gross operating margin increase of $16.6 million. The Gibson and Plaquemine plants were the primary contributors to this gain with a gross operating margin increase of $10.0 million. Other processing activity contributed an additional gross operating margin increase of $6.6 million. The processing gains were partially offset by a decrease in gross operating margin of $4.2 million on the gathering and transportation assets. Gross operating margins on the Partnership's gathering and transportation assets decreased due to lower margins realized under new contracts and due to the expiration of certain contracts in 2011.
- •
- The NTX segment had a gross operating margin increase of $10.5 million for the year ended December 31, 2011 compared to the year ended December 31, 2010. An increase in throughput volume primarily from the two expansion projects which commenced operations in March 2011 was the main contributor to a gross operating margin increase of $11.4 million on the gathering and transmission assets. The processing plants also had a gross operating margin increase of $3.9 million due to increased supply and the favorable processing environment. These increases were partially offset by an increase in losses of $4.9 million on the Delivery Contract discussed more fully under "Overview".
64
Table of Contents
- •
- The PNGL segment had a gross margin increase of $14.0 million for the year ended December 31, 2011 compared to the year ended December 31, 2010. This was primarily related to the favorable processing and NGL marketing environment. The PNGL processing plants contributed a gross operating margin increase of $9.9 million. NGL fractionation and marketing activity generated a gross operating margin increase of $4.9 million due to the improved marketing environment and volume increases. The Sabine Pass plant had a gross operating margin decline of $0.9 million due to a decrease in volumes from the offshore pipelines that supply the plant.
Operating Expenses. Operating expenses were $111.8 million for the year ended December 31, 2011 compared to $105.1 million for the year ended December 31, 2010, an increase of $6.7 million, or 6.4%. The increase is primarily the result of the following:
- •
- the Partnership's labor and benefits expense increased by $4.4 million related to an increase in accrued bonuses and employee headcount for activity related to project expansions in the north Texas segment and technical services;
- •
- the Partnership's bulk chemicals, supplies and service fees expenses increased $0.5 million related to project expansions;
- •
- the Partnership's other expenses increased by $2.0 million for an accrued legal judgment under appeal;
- •
- the Partnership's electric utility expenses increased $1.0 million due to an increase in operations at the Eunice processing plant and other north Texas project expansions; and
- •
- the Partnership's operating expenses decreased by $1.2 million primarily related to periodic testing incurred in 2010.
General and Administrative Expenses. General and administrative expenses were $55.5 million for the year ended December 31, 2011 compared to $51.2 million for the year ended December 31, 2010, an increase of $4.3 million, or 8.5%. The increase is primarily a result of the following:
- •
- the Partnership's labor and benefits expense increased by $3.2 million primarily related to an increase in accrued bonuses and an increase in employee headcount; and
- •
- the Partnership increased the Partnership's bad debt expense by $1.0 million in 2011 due to uncollectible gathering fees related to a particular customer.
Gain/Loss on Sale of Property. Loss on sale of property was $0.3 million for the year ended December 31, 2011 compared to a gain of $13.9 million for the year ended December 31, 2010. The loss on sale of property for the year ended December 31, 2011 was primarily related to the sale of a minor section of pipeline in Louisiana in September 2011. The gain on sale of property for the year ended December 31, 2010 was related to the sale of the Partnership's east Texas assets in January 2010.
65
Table of Contents
Gain/Loss on Derivatives. Loss on derivatives was $7.8 million for the year ended December 31, 2011 compared to a loss of $9.1 million for the year ended December 31, 2010. The derivative transaction types contributing to the net (gain) loss are as follows (in millions):
| | | | | | | | | | | | | |
| | Years Ended December 31, | |
|---|
| | 2011 | | 2010 | |
|---|
(Gain) Loss on Derivatives: | | Total | | Realized | | Total | | Realized | |
|---|
Basis swaps | | $ | 1.4 | | $ | 1.3 | | $ | 5.6 | | $ | 2.3 | |
Processing margin hedges | | | 6.6 | | | 5.7 | | | 3.5 | | | 5.5 | |
Other | | | (0.2 | ) | | — | | | — | | | 0.1 | |
| | | | | | | | | | |
Net loss on derivatives | | $ | 7.8 | | $ | 7.0 | | $ | 9.1 | | $ | 7.9 | |
| | | | | | | | | | |
Impairments. During 2010, impairments totaling $1.3 million were taken on excess pipe that was ultimately sold later during 2010. No impairments were recorded in 2011.
Depreciation and Amortization. Depreciation and amortization expenses were $125.4 million for the year ended December 31, 2011 compared to $111.6 million for the year ended December 31, 2010, an increase of $13.7 million, or 12.3%. The increase of $13.7 million includes $13.4 million due to intangible amortization related to a downward revision in future estimated throughput volumes attributable to the dedicated acreage purchased with the Partnership's gathering system in north Texas. In addition, depreciation increased $0.3 million primarily due to an increase of assets placed in service in our north Texas and LIG regions.
Interest Expense. Interest expense was $79.2 million for the year ended December 31, 2011 compared to $87 million for the year ended December 31, 2010, a decrease of $7.8 million, or 9.0%. Net interest expense consists of the following (in millions):
| | | | | | | |
| | Years Ended
December 31, | |
|---|
| | 2011 | | 2010 | |
|---|
Senior notes (secured and unsecured) | | $ | 64.3 | | $ | 62.5 | |
Paid-in-kind interest on senior secured notes | | | — | | | 1.4 | |
Bank credit facility | | | 5.5 | | | 10.0 | |
Capitalized interest | | | (0.9 | ) | | (0.1 | ) |
Mark to market interest rate swaps | | | — | | | (22.4 | ) |
Realized interest rate swap losses | | | — | | | 26.5 | |
Amortization of debt issue costs an notes discount | | | 8.3 | | | 6.6 | |
Other | | | 2.0 | | | 2.5 | |
| | | | | | |
Total | | $ | 79.2 | | $ | 87.0 | |
| | | | | | |
Income Taxes. Income tax benefits of $2.8 and $6.0 million were recorded on the losses from operations (net of non-controlling interest) for the years ended December 31, 2011 and 2010, respectively.
Interest of Non-Controlling Partners in the Partnership's Net Income (Loss). The interest of non-controlling partners in the Partnership's net income was $4.7 million for the year ended
66
Table of Contents
December 31, 2011 compared to a net loss of $9.9 million for the year ended December 31, 2010 due to the changes shown in the following summary (in millions):
| | | | | | | |
| | Years Ended
December 31, | |
|---|
| | 2011 | | 2010 | |
|---|
Net loss for the Partnership | | $ | (2.4 | ) | $ | (25.8 | ) |
(Income) allocation to CEI for the general partner incentive distribution | | | (2.4 | ) | | (0.1 | ) |
Stock-based compensation costs allocated to CEI for its stock options and restricted stock granted to Partnership officers, employees and directors | | | 3.1 | | | 3.9 | |
Loss allocation to CEI for its general partner share of Partnership loss | | | — | | | 0.6 | |
| | | | | | |
Net loss allocable to limited partners | | | (1.7 | ) | | (21.4 | ) |
Less: CEI's share of net (income) loss allocable to limited partners | | | 6.4 | | | 11.5 | |
| | | | | | |
Non-controlling partners' share of Partnership net income (loss) (including the Partnership's income attributable to preferred unitholders) | | $ | 4.7 | | $ | (9.9 | ) |
| | | | | | |
Loss on Extinguishment of Debt. Loss on extinguishment of debt was $14.7 million for the year ended December 31, 2010. In February 2010, the Partnership repaid its prior credit facility and senior secured notes which resulted in make-whole interest payments on its senior secured notes and the write-off of unamortized debt costs totaling $14.7 million.
Critical Accounting Policies
The selection and application of accounting policies is an important process that has developed as our business activities have evolved and as the accounting rules have developed. Accounting rules generally do not involve a selection among alternatives, but involve an implementation and interpretation of existing rules, and the use of judgment to the specific set of circumstances existing in our business. Compliance with the rules necessarily involves reducing a number of very subjective judgments to a quantifiable accounting entry or valuation. We make every effort to properly comply with all applicable rules on or before their adoption, and we believe the proper implementation and consistent application of the accounting rules is critical. Our critical accounting policies are discussed below. See Note 2 of the Notes to Consolidated Financial Statements for further details on our accounting policies.
Revenue Recognition and Commodity Risk Management. The Partnership recognizes revenue for sales or services at the time the natural gas, NGLs or crude oil is delivered or at the time the service is performed. It generally accrues one month of sales and the related gas, NGL or crude oil purchases and reverses these accruals when the sales and purchases are actually invoiced and recorded in the subsequent months. Actual results could differ from the accrual estimates.
The Partnership utilizes extensive estimation procedures to determine the sales and cost of gas, NGL or crude oil purchase accruals for each accounting cycle. Accruals are based on estimates of volumes flowing each month from a variety of sources. The Partnership uses actual measurement data, if it is available, and will use such data as producer/shipper nominations, prior month average daily flows, estimated flow for new production and estimated end-user requirements (all adjusted for the estimated impact of weather patterns) when actual measurement data is not available. Throughout the month or two following production, actual measured sales and transportation volumes are received and invoiced and used in a process referred to as "actualization." Through the actualization process, any estimation differences recorded through the accrual are reflected in the subsequent month's accounting cycle when the accrual is reversed and actual amounts are recorded. Actual volumes purchased, processed or sold may differ from the estimates due to a variety of factors including, but not limited to: actual wellhead production or customer requirements being higher or lower than the amount
67
Table of Contents
nominated at the beginning of the month; liquids recoveries being higher or lower than estimated because gas processed through the plants was richer or leaner than estimated; the estimated impact of weather patterns being different from the actual impact on sales and purchases; and pipeline maintenance or allocation causing actual deliveries of gas to be different than estimated. The Partnership believes that its accrual process for sales and purchases provides a reasonable estimate of such sales and purchases.
The Partnership engages in price risk management activities in order to minimize the risk from market fluctuations in the price of natural gas and NGLs. It also manages its price risk related to future physical purchase or sale commitments by entering into either corresponding physical delivery contracts or financial instruments with an objective to balance its future commitments and significantly reduce its risk to the movement in natural gas and NGL prices.
The Partnership uses derivatives to hedge against changes in cash flows related to product prices, as opposed to their use for trading purposes. FASB ASC 815 requires that all derivatives and hedging instruments are recognized as assets or liabilities at fair value. If a derivative qualifies for hedge accounting, changes in the fair value can be offset against the change in the fair value of the hedged item through earnings or recognized in other comprehensive income until such time as the hedged item is recognized in earnings.
The Partnership conducts "off-system" gas marketing operations as a service to producers on systems that it does not own. It refers to these activities as part of energy trading activities. In some cases, the Partnership earns an agency fee from the producer for arranging the marketing of the producer's natural gas. In other cases, the Partnership purchases the natural gas from the producer and enters into a sales contract with another party to sell the natural gas. The revenue and cost of sales for these activities are included in revenue on a net basis in the statement of operations.
The Partnership manages its price risk related to future physical purchase or sale commitments for energy trading activities by entering into either corresponding physical delivery contracts or financial instruments with an objective to balance future commitments and significantly reduce risk related to the movement in natural gas prices. However, the Partnership is subject to counter-party risk for both the physical and financial contracts. The Partnership's energy trading contracts qualify as derivatives and it uses mark-to-market accounting for both physical and financial contracts of the energy trading business. Accordingly, any gain or loss associated with changes in the fair value of derivatives and physical delivery contracts relating to energy trading activities are recognized in earnings as gain or loss on derivatives immediately.
Sales of Securities by Subsidiaries. Prior to 2009, we recognized gains and losses in the consolidated statements of operations resulting from subsidiary sales of additional equity interest, including the Partnership's limited partnership units to unrelated parties. Pursuant to new accounting guidance adopted effective January 1, 2009, we reflect changes in our ownership interest in the Partnership as equity transactions. The carrying amount of the non-controlling interest is adjusted to reflect the change in our ownership interest in the Partnership. Any difference between the fair value of the consideration received and the amount by which the non-controlling interest is adjusted is recognized in additional paid-in capital.
Impairment of Long-Lived Assets. In accordance with FASB ASC 360-10-05, the Partnership evaluates the long-lived assets, including related intangibles, of identifiable business activities for impairment when events or changes in circumstances indicate, in management's judgment, that the carrying value of such assets may not be recoverable. The determination of whether impairment has occurred is based on management's estimate of undiscounted future cash flows attributable to the assets as compared to the carrying value of the assets. If impairment has occurred, the amount of the impairment recognized is determined by estimating the fair value for the assets and recording a provision for loss if the carrying value is greater than fair value.
68
Table of Contents
When determining whether impairment of one of the Partnership's long-lived assets has occurred, it must estimate the undiscounted cash flows attributable to the asset. The estimate of cash flows is based on assumptions regarding the purchase and resale margins on natural gas, volume of gas available to the asset, markets available to the asset, operating expenses, and future natural gas prices and NGL product prices. The amount of availability of gas and crude oil to an asset is sometimes based on assumptions regarding future drilling activity, which may be dependent in part on natural gas and crude oil prices. Projections of gas and crude oil volumes and future commodity prices are inherently subjective and contingent upon a number of variable factors, including but not limited to:
- •
- changes in general economic conditions in regions in which the Partnership's markets are located;
- •
- the availability and prices of natural gas and crude oil supply;
- •
- the Partnership's ability to negotiate favorable sales agreements;
- •
- the risks that natural gas and crude oil exploration and production activities will not occur or be successful;
- •
- the Partnership's dependence on certain significant customers, producers and transporters of natural gas and crude oil; and
- •
- competition from other midstream companies, including major energy producers.
Any significant variance in any of the above assumptions or factors could materially affect the Partnership's cash flows, which could require us to record an impairment of an asset.
Goodwill Impairment. In accordance with FASB ASC 350-20-35, the Partnership will test goodwill impairment annually starting July 1, 2013, or between annual tests if an event occurs or circumstances that would more likely than not reduce the fair value of a reporting unit below its carrying amount.
Depreciation Expense and Cost Capitalization. The Partnership's assets consist primarily of natural gas, NGL and crude oil gathering pipelines, processing plants, transmission pipelines and trucks. The Partnership capitalizes all construction-related direct labor and material costs, as well as indirect construction costs. Indirect construction costs include general engineering and the costs of funds used in construction. Capitalized interest represents the cost of funds used to finance the construction of new facilities and is expensed over the life of the constructed assets through the recording of depreciation expense. The Partnership capitalizes the costs of renewals and betterments that extend the useful life, while it expenses the costs of repairs, replacements and maintenance projects as incurred.
The Partnership generally computes depreciation using the straight-line method over the estimated useful life of the assets. Certain assets such as land, NGL line pack, natural gas line pack and crude oil line pack are non-depreciable. The computation of depreciation expense requires judgment regarding the estimated useful lives and salvage value of assets. As circumstances warrant, the Partnership may review depreciation estimates to determine if any changes are needed. Such changes could involve an increase or decrease in estimated useful lives or salvage values, which would impact future depreciation expense.
Liquidity and Capital Resources
Cash Flows from Operating Activities. Net cash provided by operating activities was $100.5 million, $141.3 million and $84.8 million for the years ended December 31, 2012, 2011 and 2010, respectively.
69
Table of Contents
Income before non-cash income and expenses and changes in working capital for 2012, 2011 and 2010 were as follows (in millions):
| | | | | | | | | | |
| | Years Ended December 31, | |
|---|
| | 2012 | | 2011 | | 2010 | |
|---|
Income before non-cash income and expenses | | $ | 123.9 | | $ | 136.5 | | $ | 58.8 | |
Changes in working capital | | | (23.4 | ) | | 4.8 | | | 26.0 | |
| | | | | | | | |
Total | | $ | 100.5 | | $ | 141.3 | | $ | 84.8 | |
| | | | | | | | |
The primary reason for the decrease in cash flow from income before non-cash income and expenses of $12.6 million from 2011 to 2012 relates to an increase in operating and general and administrative expenses partially offset by an increase in gross operating margin. The primary reason for the increased cash flow from income before non-cash income and expenses of $77.7 million from 2011 to 2010 relates to payments made in 2010 for settlement of interest rate swaps, make-whole payments and PIK notes combined with an increase in 2011 gross operating margin and a decrease in interest expense.
The change in working capital for 2012, 2011 and 2010 primarily relates to normal fluctuations in trade receivable and payable balances due to timing of collections and payments.
Cash Flows from Investing Activities. Net cash used in investing activities was $490.3 million and $132.1 million for the years ended December 31, 2012 and 2011, respectively, and net cash provided by investing activities was $14.6 million for the year ended December 31, 2010. Cash flows from investing activities for the years ended December 31, 2012, 2011 and 2010 included proceeds from property sales of $11.8 million, $0.5 million and $60.2 million, respectively. Proceeds from property sales for the year ended December 31, 2012 include $11.1 million received for the assignment to a third party of the rights, title and interest in a contract for the construction of a processing plant. The east Texas assets and a non-operational processing plant held in inventory were the primary assets sold in 2010 for $39.8 million and $19.5 million, respectively. The Partnership's primary use of cash related to investing activities for the years ended December 31, 2012, 2011 and 2010 was acquisition costs and capital expenditures, net of accrued amounts, and an investment in limited liability company as follows (in millions):
| | | | | | | | | | |
| | Years Ended December 31, | |
|---|
| | 2012 | | 2011 | | 2010 | |
|---|
Growth capital expenditures | | $ | 221.2 | | $ | 85.0 | | $ | 37.4 | |
Acquisition and asset purchases | | | 215.0 | | | — | | | — | |
Maintenance capital expenditures | | | 13.6 | | | 12.6 | | | 10.8 | |
Investment in limited liability company | | | 52.3 | | | 35.0 | | | — | |
| | | | | | | | |
Total | | $ | 502.1 | | $ | 132.6 | | $ | 48.2 | |
| | | | | | | | |
See "Overview—Recent Developments" for further discussion related to 2012 acquisition and growth expenditures and the Partnership's investment in HEP.
Cash Flows from Financing Activities. Net cash provided by financing activities was $362.5 million for the year ended December 31, 2012, and net cash used in financing activities was $1.6 million and
70
Table of Contents
$87.4 million for the years ended 2011 and 2010, respectively. Our primary financing activities consist of the following (in millions):
| | | | | | | | | | |
| | Years Ended December 31, | |
|---|
| | 2012 | | 2011 | | 2010 | |
|---|
Net borrowings (repayments) under bank credit facilities | | $ | (14.0 | ) | $ | 85.0 | | $ | (529.6 | ) |
Senior secured note repayments | | | — | | | — | | | (316.5 | ) |
Senior unsecured note borrowings (net of discount on the note) | | | 250.0 | | | — | | | 711.5 | |
Series B secured note repayment | | | — | | | (7.1 | ) | | (11.0 | ) |
Net borrowings (repayments) under capital lease obligations | | | (3.1 | ) | | (3.1 | ) | | (2.4 | ) |
Debt refinancing costs | | | (7.2 | ) | | (4.0 | ) | | (28.6 | ) |
Proceeds from issuance of Partnership units | | | 232.8 | | | — | | | 120.8 | |
Dividends to shareholders and distributions to non-controlling partners in the Partnership represent our primary use of cash in financing activities. Total cash distributions made during the last three years were as follows (in millions):
| | | | | | | | | | |
| | Years Ended
December 31, | |
|---|
| | 2012 | | 2011 | | 2010 | |
|---|
Dividends to shareholders | | $ | 22.9 | | $ | 17.9 | | $ | 3.4 | |
Distributions to non-controlling partners | | | 69.4 | | | 58.2 | | | 19.0 | |
| | | | | | | | |
Total | | $ | 92.3 | | $ | 76.1 | | $ | 22.4 | |
| | | | | | | | |
In order to reduce the Partnership's interest costs, the Partnership does not borrow money to fund outstanding checks until they are presented to the bank. Fluctuations in drafts payable are caused by timing of disbursements, cash receipts and draws on its revolving credit facility. The Partnership borrows money under the Partnership's $635.0 million credit facility to fund checks as they are presented. As of December 31, 2012, it had approximately $501.8 million of available borrowing capacity under this facility, although its actual borrowing capacity is limited by its financial covenants. Changes in drafts payable for 2012, 2011 and 2010 were as follows (in millions):
| | | | | | | | | | |
| | Years Ended
December 31, | |
|---|
| | 2012 | | 2011 | | 2010 | |
|---|
Increase (decrease) in drafts payable | | $ | (1.9 | ) | $ | 5.9 | | $ | (5.1 | ) |
Working Capital Deficit. We had a working capital deficit of $15.9 million as of December 31, 2012. Changes in working capital may fluctuate significantly between periods even though the Partnership's trade receivables and payables are typically collected and paid in 30 to 60 day pay cycles. A large volume of its revenues are collected and a large volume of its gas and crude oil purchases are paid near each month end or the first few days of the following month so receivable and payable balances at any month end may fluctuate significantly depending on the timing of these receipts and payments. In addition, although the Partnership strives to minimize natural gas and NGLs in inventory, these working inventory balances may fluctuate significantly from period to period due to operational reasons and changes in natural gas and NGL prices. The changes in working capital during the years ended December 31, 2012 and 2011 are due to the impact of the fluctuations discussed above.
January 2010 Sale of Preferred Units. On January 19, 2010, the Partnership issued approximately $125.0 million of preferred units to an affiliate of Blackstone/GSO Capital Solutions for net proceeds of $120.8 million. The preferred units are not redeemable, but are entitled to a quarterly distribution
71
Table of Contents
that will be the greater of $0.2125 per unit or the amount of the quarterly distribution per unit paid to common unitholders, subject to certain adjustments.
On September 13, 2012, the board of directors of the Partnership's general partner amended its partnership agreement to amend certain terms and conditions of the preferred units, including, among other corresponding modifications, the following amendments:
- •
- Distributions Paid-In-Kind (PIK): for each quarter through the quarter ending December 31, 2013 (the "PIK Period"), the Partnership will pay distributions in-kind on the preferred units ("PIK Preferred Units") without penalty and without affecting its ability to pay cash distributions on the common units.
- •
- PIK Preferred Unit Price: during the PIK Period, the fixed price used to determine the number of PIK Preferred Units to be paid instead of cash distributions will increase from $8.50 per preferred unit to $13.25 per preferred unit.
- •
- Optional Redemption: the existing right of the holders of preferred units to convert the preferred units into common units at any time into common units on a one-for-one basis, subject to certain adjustments in the event of certain dilutive issuances of common units was modified so that such right may not be exercised until the earlier of (i) the business day following the record date for the distribution for the quarter ending December 31, 2013 and (ii) February 10, 2014.
- •
- Mandatory Redemption: the Partnership's right to convert the preferred units into common units on January 19, 2013 was modified so that such right may not be exercised until the business day following the distribution for the quarter ending December 31, 2013 (subject to the satisfaction of the existing conditions applicable to such right).
Changes in Operations During 2012 and 2013. The Partnership's Sabine Pass plant held a contract with a third-party to fractionate the raw-make NGLs produced by the Sabine Pass plant. The primary term of the contract expired in March 2012 and was renewed on a month-to-month basis. Due to the anticipated termination of this third-party fractionation agreement in early 2013, the Partnership began accelerating depreciation of this facility during the third quarter of 2012. The plant also had some equipment failures during the fourth quarter of 2012. In January 2013, the Partnership ceased plant operations because the cost to repair the equipment could not be supported by the current month-to-month agreement. Depreciation and amortization expense during the fourth quarter of 2012 was changed to accelerate the remaining non-recoverable costs associated with the plant. Total depreciation and amortization of $28.9 million was recognized for the Sabine Pass plant during 2012. The Sabine Pass plant contributed gross operating margin of $2.0 million and $2.7 million for the years ended December 31, 2012 and 2011, respectively. The net book value for the plant is $20.0 million as of December 31, 2012 and represents the plant's fair market value. Although the Partnership does not have specific plans at this time to relocate the Sabine Pass plant, the Partnership may utilize it elsewhere in its operations.
The Partnership has a gas gathering contract with a major producer in its North Texas assets with a primary term that expired August 31, 2012 that was modified to be on a month-to-month basis beginning September 1, 2012. Subsequently, the modified contract was extended for six months at a reduced gathering fee rate which reduced its gross operating margin by approximately $1.2 million per quarter. The Partnership is in the process of negotiating a longer term agreement.
The Partnership owns and operates a high-pressure pipeline and underground natural gas and NGL storage reservoirs and associated facilities near Bayou Corne, Louisiana. In August 2012, a large sinkhole formed in the vicinity of these pipelines and the Partnership's underground storage reservoirs located in Napoleonville, Louisiana. This sinkhole is situated west of the Partnership's underground natural gas and NGL storage facility. The cause of the sinkhole is currently under investigation by Louisiana state and local officials. The Partnership took a section of its 36-inch-diameter natural gas
72
Table of Contents
pipeline located near the sinkhole out of service. Service to certain markets, primarily in the Mississippi River area, has been curtailed or interrupted, and the Partnership has worked with its customers to secure alternative natural gas supplies so that disruptions are minimized. The Partnership expects that the ongoing overall business impact on the services previously provided by the pipeline, which include gathering, processing, transportation and end-user sales, will be approximately $0.25 to $0.3 million per month while the pipeline section is out of service.
The Partnership is working to relocate the portion of the pipeline affected and certain services will not resume until the relocation has been completed. The Partnership has evaluated potential rerouting alternatives, timing and expected costs. Based upon the alternative being considered, the Partnership estimates the cost of the relocation to be $20.0 to $25.0 million and expects to complete the relocation by summer 2013. The Partnership has accelerated the depreciation of this effected portion of the existing pipeline in the amount of $0.4 million and will capitalize the costs of the replacement pipeline.
The Partnership is assessing the potential for recovering its losses from responsible parties, and it is seeking recovery from its insurers. The Partnership's insurers, however, have denied its insurance claim for coverage and filed a declaratory judgment asking a court to determine that the Partnership's insurance policy does not cover this damage. The Partnership has sued its insurers for breach of contract due to its insurers' refusal to pay its insurance claim for this damage. The Partnership cannot give assurance that the Partnership will be able to fully recover its losses through insurance recovery or claims against responsible parties.
Capital Requirements. The Partnership's 2013 capital budget includes approximately $465.0 million of identified growth projects and capital interest. The Partnership's primary capital projects for 2013 include the expansion of the Cajun-Sibon NGL Pipeline Phase I and II. During 2012, the Partnership invested in several capital projects which included the expansion of the Cajun-Sibon NGL Pipeline and construction of processing plants in the Permian Basin. The Cajun-Sibon NGL pipeline expansion projects have an estimated cost of $680.0 million to $700.0 million. See "Item 1. Business—Recent Growth Developments" for further details.
In 2013, it is possible that not all of the planned projects will be commenced or completed. The Partnership expects to fund our maintenance capital expenditures of approximately $13.0 million from operating cash flows. The Partnership expects to fund the growth capital expenditures from the proceeds of borrowings under the Partnership's bank credit facility discussed below, proceeds from the sale of the LDCs discussed below and proceeds from other debt and equity sources including the Partnership's January 2013 offering. Our ability to pay dividends to our shareholders, and the Partnership's ability to fund planned capital expenditures and to make acquisitions will depend upon its future operating performance, which will be affected by prevailing economic conditions in the industry and financial, business and other factors, some of which are beyond the Partnership's control.
Included in the Clearfield acquisition were three local distribution companies, or LDCs, which the Partnership marketed for sale and were classified as held for disposition on the balance sheet as of December 31, 2012. On October 15, 2012, a subsidiary of the Partnership entered into an agreement to sell the LDCs for an amount of $19.5 million, and the sale was completed on January 18, 2013. The proceeds from the sale of the LDCs will be used to fund 2013 growth capital expenditures.
Off-Balance Sheet Arrangements. We had no off-balance sheet arrangements as of December 31, 2012, 2011 and 2010.
73
Table of Contents
Total Contractual Cash Obligations. A summary of the Partnership's total contractual cash obligations as of December 31, 2012 is as follows (in millions):
| | | | | | | | | | | | | | | | | | | | | | |
| | Payments Due by Period | |
|---|
| | Total | | 2013 | | 2014 | | 2015 | | 2016 | | 2017 | | Thereafter | |
|---|
Long-term debt obligations | | $ | 975.0 | | $ | — | | $ | — | | $ | — | | $ | — | | $ | — | | $ | 975.0 | |
Bank credit facility | | | 71.0 | | | — | | | — | | | — | | | 71.0 | | | — | | | — | |
Interest payable on fixed long-term debt obligations | | | 522.2 | | | 82.2 | | | 82.2 | | | 82.2 | | | 82.2 | | | 82.2 | | | 111.2 | |
Capital lease obligations | | | 30.4 | | | 4.6 | | | 4.6 | | | 4.6 | | | 4.6 | | | 6.9 | | | 5.1 | |
Operating lease obligations | | | 45.3 | | | 8.5 | | | 7.6 | | | 7.7 | | | 7.0 | | | 4.3 | | | 10.2 | |
Purchase obligations | | | 7.3 | | | 7.3 | | | — | | | — | | | — | | | — | | | — | |
Additional benefit obligations | | | 4.4 | | | 1.0 | | | 3.4 | | | — | | | — | | | — | | | — | |
Inactive easement commitment* | | | 10.0 | | | — | | | — | | | — | | | — | | | — | | | 10.0 | |
Uncertain tax position obligations | | | 4.1 | | | 4.1 | | | — | | | — | | | — | | | — | | | — | |
| | | | | | | | | | | | | | | | |
Total contractual obligations | | $ | 1,669.7 | | $ | 107.7 | | $ | 97.8 | | $ | 94.5 | | $ | 164.8 | | $ | 93.4 | | $ | 1,111.5 | |
| | | | | | | | | | | | | | | | |
- *
- Amounts related to inactive easements paid as utilized with remaining balance of easements not utilized due at end of 10 years.
The above table does not include any physical or financial contract purchase commitments for natural gas due to the nature of both the price and volume components of such purchases, which vary on a daily or monthly basis. Additionally, we do not have contractual commitments for fixed price and/or fixed quantities of any material amount.
The interest payable under the Partnership's credit facility is not reflected in the above table because such amounts depend on outstanding balances and interest rates, which will vary from time to time. However, given the same borrowing amount and rates in effect at December 31, 2012 the Partnership's cash obligation for interest expense on its credit facility would be approximately $3.1 million per year.
Description of Indebtedness
As of December 31, 2012 and 2011, long-term debt consisted of the following (in millions):
| | | | | | | |
| | 2012 | | 2011 | |
|---|
Bank credit facility (due 2016), interest based on Prime and/or LIBOR plus an applicable margin, interest rate at December 31, 2012 and December 31, 2011 was 4.3% and 2.9%, respectively | | $ | 71.0 | | $ | 85.0 | |
Senior unsecured notes (due 2018), net of discount of $9.7 million and $11.6 million, respectively, which bear interest at the rate of 8.875% | | | 715.3 | | | 713.4 | |
Senior unsecured notes (due 2022), which bear interest at the rate of 7.125% | | | 250.0 | | | — | |
| | | | | | |
Debt classified as long-term | | $ | 1,036.3 | | $ | 798.4 | |
| | | | | | |
Credit Facility. The Partnership amended its bank credit facility in January 2012, May 2012, August 2012 and January 2013. Among other things, the amendments contained the following changes:
- •
- Increased borrowing capacity from $485.0 million to $635.0 million;
- •
- Increased the maximum permitted consolidated leverage ratio to 5.5 to 1.0 for each fiscal quarter ending on or prior to December 31, 2013, with a maximum ratio of 5.25 to 1.0 for each fiscal quarter ending thereafter;
74
Table of Contents
- •
- Decreased the minimum permitted interest coverage ratio to 2.25 to 1.0 for each fiscal quarter ending on or prior to December 31, 2013, with a minimum ratio of 2.50 to 1.0 for each fiscal quarter ending thereafter; and
- •
- Amended the credit facility to include projected EBITDA from material projects in its EBITDA for purposes of calculating compliance with the amended credit agreement's minimum interest coverage ratio, maximum leverage ratio and maximum senior leverage ratio. The aggregate amount of all material project EBITDA adjustments during any period shall be limited to 15% of the total actual consolidated EBITDA for such period.
As of December 31, 2012, there was $71.0 million of outstanding borrowings and $62.2 million in outstanding letters of credit under the amended credit facility leaving approximately $501.8 million available for future borrowings and letters of credit based on a borrowing capacity of $635.0 million. However, the financial covenants in the amended credit facility limit the amount of funds that the Partnership can borrow. As of December 31, 2012, based on the financial covenants in the amended credit facility, the Partnership could borrow approximately $334.6 million of additional funds.
The credit facility is guaranteed by substantially all of the Partnership's subsidiaries and is secured by first priority liens on substantially all of the Partnership's assets and those of the guarantors, including all material pipeline, gas gathering and processing assets, all material working capital assets and a pledge of all of its equity interests in substantially all of the Partnership's subsidiaries.
The Partnership may prepay all loans under the credit facility at any time without premium or penalty (other than customary LIBOR breakage costs), subject to certain notice requirements. The credit facility requires mandatory prepayments of amounts outstanding thereunder with the net proceeds of certain asset sales, extraordinary receipts, equity issuances and debt incurrences, but these mandatory prepayments do not require any reduction of the lenders' commitments under the credit facility.
Under the amended credit facility, borrowings bear interest at the Partnership's option at the Eurodollar Rate (the British Bankers Association LIBOR Rate) plus an applicable margin or the Base Rate (the highest of the Federal Funds Rate plus 0.50%, the 30-day Eurodollar Rate plus 1.0%, or the administrative agent's prime rate) plus an applicable margin. The Partnership pays a per annum fee (as described below) on all letters of credit issued under the amended credit facility and a commitment fee of between 0.375% and 0.50% per annum on the unused availability under the amended credit facility. The commitment fee, letter of credit fee and the applicable margins for the interest rate vary quarterly based on the Partnership's leverage ratio (as defined in the credit facility, being generally computed as the ratio of total funded debt to consolidated earnings before interest, taxes, depreciation, amortization and certain other non-cash charges) and are as follows:
| | | | | | | | | | |
Leverage Ratio | | Base Rate
Loans | | Eurodollar Rate
Loans and
Letter of Credit
Fees | | Letter of
Commitment
Fees | |
|---|
Greater than or equal to 4.50 to 1.00 | | | 2.00 | % | | 3.00 | % | | 0.50 | % |
Greater than or equal to 4.00 to 1.00 and less than 4.50 to 1.00 | | | 1.75 | % | | 2.75 | % | | 0.50 | % |
Greater than or equal to 3.50 to 1.00 and less than 4.00 to 1.00 | | | 1.50 | % | | 2.50 | % | | 0.50 | % |
Greater than or equal to 3.00 to 1.00 and less than 3.50 to 1.00 | | | 1.25 | % | | 2.25 | % | | 0.50 | % |
Less than 3.00 to 1.00 | | | 1.00 | % | | 2.00 | % | | 0.38 | % |
The amended credit facility includes financial covenants that are tested on a quarterly basis, based on the rolling four-quarter period that ends on the last day of each fiscal quarter. The maximum permitted leverage ratio (as defined in the credit facility, but generally computed as the ratio of total funded debt to consolidated earnings before interest, taxes, depreciation, amortization and certain other non-cash charges) is 5.50 to 1.00 for the fiscal quarters ending on or before December 31, 2013 with a
75
Table of Contents
maximum ratio of 5.25 to 1.00 for each fiscal quarter thereafter. The maximum permitted senior leverage ratio (as defined in the credit facility, but generally computed as the ratio of total secured funded debt to consolidated earnings before interest, taxes, depreciation, amortization and certain other non cash charges) is 2.75 to 1.00. The minimum consolidated interest coverage ratio (as defined in the credit facility, but generally computed as the ratio of consolidated earnings before interest, taxes, depreciation, amortization and certain other non-cash charges to consolidated interest charges) is 2.25 to 1.00 for the fiscal quarters ending on or before December 31, 2013, with a minimum ratio of 2.50 to 1.0 for each fiscal quarter ending thereafter.
In addition, the credit facility contains various covenants that, among other restrictions, limit the Partnership's ability to:
- •
- grant or assume liens;
- •
- make investments;
- •
- incur or assume indebtedness;
- •
- engage in mergers or acquisitions;
- •
- sell, transfer, assign or convey assets;
- •
- repurchase its equity, make distributions and certain other restricted payments;
- •
- change the nature of its business;
- •
- engage in transactions with affiliates;
- •
- enter into certain burdensome agreements;
- •
- make certain amendments to the omnibus agreement, the Partnership's or its subsidiaries' organizational documents;
- •
- prepay the senior unsecured notes and certain other indebtedness; and
- •
- enter into certain hedging contracts.
The credit facility permits the Partnership to make quarterly distributions to unitholders so long as no default exists under the credit facility.
Each of the following is an event of default under the credit facility:
- •
- failure to pay any principal, interest, fees, expenses or other amounts when due;
- •
- failure to meet the quarterly financial covenants;
- •
- failure to observe any other agreement, obligation or covenant in the credit facility or any related loan document, subject to cure periods for certain failures;
- •
- the failure of any representation or warranty to be materially true and correct when made;
- •
- the Partnership or any of its subsidiaries' default under other indebtedness that exceeds a threshold amount;
- •
- judgments against the Partnership or any of its material subsidiaries, in excess of a threshold amount;
- •
- certain ERISA events involving the Partnership or any of its material subsidiaries, in excess of a threshold amount;
- •
- bankruptcy or other insolvency events involving the Partnership or any of its material subsidiaries; and
76
Table of Contents
- •
- a change in control (as defined in the credit facility).
If an event of default relating to bankruptcy or other insolvency events occur, all indebtedness under the credit facility will immediately become due and payable. If any other event of default exists under the credit facility, the lenders may accelerate the maturity of the obligations outstanding under the credit facility and exercise other rights and remedies. In addition, if any event of default exists under the credit facility, the lenders may commence foreclosure or other actions against the collateral.
If any default occurs under the credit facility, or if the Partnership is unable to make any of the representations and warranties in the credit facility, the Partnership will be unable to borrow funds or have letters of credit issued under the credit facility.
The Partnership expects to be in compliance with the covenants in the amended credit facility for at least the next twelve months.
Senior Unsecured Notes. On February 10, 2010, the Partnership issued $725.0 million in aggregate principal amount of 8.875% senior unsecured notes (the "2018 Notes") due on February 15, 2018 at an issue price of 97.907% to yield 9.25% to maturity including the original issue discount (OID). Net proceeds from the sale of the 2018 Notes of $689.7 million (net of transaction costs and OID), together with borrowings under the credit facility discussed above, were used to repay in full amounts outstanding under the prior bank credit facility and senior secured notes and to pay related fees, costs and expenses, including the settlement of interest rate swaps associated with the prior credit facility. Interest payments on the 2018 Notes are due semi-annually in arrears in February and August.
On May 24, 2012, the Partnership issued $250.0 million in aggregate principal amount of 7.125% senior unsecured notes (the "2022 Notes" and together with the 2018 Notes, the "Senior Notes") due on June 1, 2022 at an issue price of 100% of the principal amount to yield 7.125% to maturity. The interest payments are due semi-annually in arrears in June and December. Net proceeds from the sale of the 2022 Notes of $245.1 million (net of transaction costs) were used to fund the Clearfield acquisition and for general partnership purposes, including capital expenditures for the Cajun-Sibon NGLs pipeline expansion.
The indentures governing the Senior Notes contain covenants that, among other things, limit the Partnership's ability and the ability of certain of its subsidiaries to:
- •
- sell assets including equity interests in its subsidiaries;
- •
- pay distributions on, redeem or repurchase units or redeem or repurchase its subordinated debt (as discussed in more detail below);
- •
- make investments;
- •
- incur or guarantee additional indebtedness or issue preferred units;
- •
- create or incur certain liens;
- •
- enter into agreements that restrict distributions or other payments from its restricted subsidiaries to the Partnership;
- •
- consolidate, merge or transfer all or substantially all of its assets;
- •
- engage in transactions with affiliates;
- •
- create unrestricted subsidiaries;
- •
- enter into sale and leaseback transactions; or
- •
- engage in certain business activities.
77
Table of Contents
The indentures provide that if the Partnership's fixed charge coverage ratio (the ratio of consolidated cash flow to fixed charges, which generally represents the ratio of adjusted EBITDA to interest charges with further adjustments as defined per the indenture) for the most recently ended four full fiscal quarters is not less than 2.00 to 1.0, the Partnership will be permitted to pay distributions to its unitholders in an amount equal to available cash from operating surplus (each as defined in our partnership agreement) with respect to its preceding fiscal quarter plus a number of items, including the net cash proceeds received by the Partnership as a capital contribution or from the issuance of equity interests since the date of the indenture, to the extent not previously expended. If its fixed charge coverage ratio is less than 2.00 to 1.0, the Partnership will be able to pay distributions to its unitholders in an amount equal to a specified basket (less amounts previously expended pursuant to such basket), plus the same number of items discussed in the preceding sentence to the extent not previously expended. The Partnership expects to be in compliance with this covenant for at least the next twelve months.
If the Senior Notes achieve an investment grade rating from each of Moody's Investors Service, Inc. and Standard & Poor's Ratings Services, many of the covenants discussed above will terminate.
Prior to February 15, 2014, the Partnership may redeem the 2018 Notes, in whole or in part, at a "make-whole" redemption price. On or after February 15, 2014, the Partnership may redeem all or a part of the 2018 Notes at redemption prices (expressed as percentages of principal amount) equal to 104.438% for the twelve-month period beginning on February 15, 2014, 102.219% for the twelve-month period beginning February 15, 2015 and 100.00% for the twelve-month period beginning on February 15, 2016 and at any time thereafter, plus accrued and unpaid interest, if any, to the applicable redemption date on the notes.
The Partnership may redeem up to 35% of the 2022 Notes at any time prior to June 1, 2015 in an amount not greater than the cash proceeds from one or more equity offerings at a redemption price of 107.125% of the principal amount of the 2022 Notes (plus accrued and unpaid interest to the redemption date) provided that
- •
- at least 65% of the aggregate principal amount of the 2022 Notes remains outstanding immediately after the occurrence of such redemption; and
- •
- the redemption occurs within 180 days of the date of the closing of the equity offering.
Prior to June 1, 2017, the Partnership may redeem all or a part of the 2022 Notes at the redemption price equal to the sum of the principal amount thereof, plus a make-whole premium at the redemption date, plus accrued and unpaid interest to the redemption date.
On or after June 1, 2017, the Partnership may redeem all or a part of the 2022 Notes at redemption prices (expressed as percentages of principal amount) equal to 103.563% for the twelve-month period beginning on June 1, 2017, 102.375% for the twelve-month period beginning on June 1, 2018, 101.188% for the twelve-month period beginning on June 1, 2019 and 100.000% for the twelve-month period beginning on June 1, 2020 and at any time thereafter, plus accrued and unpaid interest, if any, to the applicable redemption date on the 2022 Notes.
Each of the following is an event of default under the indentures:
- •
- failure to pay any principal or interest when due;
- •
- failure to observe any other agreement, obligation or other covenant in the indenture, subject to the cure periods for certain failures;
- •
- the Partnership or any of its subsidiaries' default under other indebtedness that exceeds a certain threshold amount;
78
Table of Contents
- •
- failures by the Partnership or any of its subsidiaries to pay final judgments that exceed a certain threshold amount; and
- •
- bankruptcy or other insolvency events involving the Partnership or any of its material subsidiaries.
If an event of default relating to bankruptcy or other insolvency events occurs, the Senior Notes will immediately become due and payable. If any other event of default exists under the indenture, the trustee under the indenture or the holders of the Senior Notes may accelerate the maturity of the Senior Notes and exercise other rights and remedies.
Credit Risk
Risks of nonpayment and nonperformance by the Partnership's customers are a major concern in its business. The Partnership is subject to risks of loss resulting from nonpayment or nonperformance by its customers and other counterparties, such as lenders and hedging counterparties. Any increase in the nonpayment and nonperformance by its customers could adversely affect the results of operations and reduce the Partnership's ability to make distributions to its unitholders.
Inflation
Inflation in the United States has been relatively low in recent years in the economy as a whole. The midstream natural gas industry's labor and material costs remained relatively unchanged in 2010, 2011 and 2012. Although the impact of inflation has been insignificant in recent years, it is still a factor in the United States economy and may increase the cost to acquire or replace property, plant and equipment and may increase the costs of labor and supplies. To the extent permitted by competition, regulation and our existing agreements, we have and will continue to pass along increased costs to our customers in the form of higher fees.
Environmental
The Partnership's operations are subject to environmental laws and regulations adopted by various governmental authorities in the jurisdictions in which these operations are conducted. We believe the Partnership is in material compliance with all applicable laws and regulations. For a more complete discussion of the environmental laws and regulations that impact us, see "Item 1. Business—Environmental Matters."
Contingencies
At times, the Partnership's gas-utility subsidiaries acquire pipeline easements and other property rights by exercising rights of eminent domain and common carrier. As a result, the Partnership (or its subsidiaries) is party to a number of lawsuits under which a court will determine the value of pipeline easements or other property interests obtained by the Partnership's gas utility subsidiaries by condemnation. Damage awards in these suits should reflect the value of the property interest acquired and the diminution in the value of the remaining property owned by the landowner. However, some landowners have alleged unique damage theories to inflate their damage claims or assert valuation methodologies that could result in damage awards in excess of the amounts anticipated. Although it is not possible to predict the ultimate outcomes of these matters, the Partnership does not expect that awards in these matters will have a material adverse impact on its consolidated results of operations or financial condition.
The Partnership (or its subsidiaries) is defending lawsuits filed by owners of property located near processing facilities or compression facilities constructed by the Partnership as part of its systems. The suits generally allege that the facilities create a private nuisance and have damaged the value of
79
Table of Contents
surrounding property. Claims of this nature have arisen as a result of the industrial development of natural gas gathering, processing and treating facilities in urban and occupied rural areas. In January 2012, a plaintiff in one of these lawsuits was awarded a judgment of $2.0 million. The Partnership has appealed the matter and has posted a bond to secure the judgment pending its resolution. The Partnership has accrued $2.0 million related to this matter and reflected the related expense in operating expenses in the fourth quarter of 2011. Although it is not possible to predict the ultimate outcomes of these matters, the Partnership does not expect that awards in these matters will have a material adverse impact on its consolidated results of operations or financial condition.
Disclosure Regarding Forward-Looking Statements
This Annual Report on Form 10-K contains forward-looking statements that are based on information currently available to management as well as management's assumptions and beliefs. All statements, other than statements of historical fact, included in this Form 10-K constitute forward-looking statements, including but not limited to statements identified by the words "forecast," "may," "believe," "will," "should," "plan," "predict," "anticipate," "intend," "estimate" and "expect" and similar expressions. Such statements reflect our current views with respect to future events, based on what we believe are reasonable assumptions; however, such statements are subject to certain risks and uncertainties. In addition to the specific uncertainties discussed elsewhere in this Form 10-K, the risk factors set forth in "Item 1A. Risk Factors" may affect our performance and results of operations. Should one or more of these risks or uncertainties materialize, or should underlying assumptions prove incorrect, actual results may differ materially from those in the forward-looking statements. We disclaim any intention or obligation to update or review any forward-looking statements or information, whether as a result of new information, future events or otherwise.
Item 7A. Quantitative and Qualitative Disclosures about Market Risk
Market risk is the risk of loss arising from adverse changes in market rates and prices. The Partnership's primary market risk is the risk related to changes in the prices of natural gas, NGLs and crude oil. In addition, it is also exposed to the risk of changes in interest rates on floating rate debt.
Comprehensive financial reform legislation was signed into law by the President on July 21, 2010. The legislation calls for the CFTC to regulate certain markets for over-the-counter ("OTC") derivative products. The CFTC has issued several new relevant regulations and other rulemakings are pending at the CFTC, the product of which would be rules that implement the mandates in the new legislation to cause significant portions of derivatives to clear through clearinghouses. The rules could also impose burdens on market participants to such an extent that liquidity in the bilateral OTC derivative market decreases substantially. The legislation and new regulations may also require counterparties to our derivative instruments to spin off some of their derivatives activities to separate entities, which may not be as creditworthy as the current counterparties. The new legislation and any new regulations, including determinations with respect to the applicability of margin requirements and other trading structures, could significantly increase the cost of derivative contracts, materially alter the terms of derivative contracts, reduce the availability of derivatives to protect against risks the Partnership encounters, reduce the Partnership's ability to monetize or restructure its existing derivative contracts, and increase the Partnership's exposure to less creditworthy counterparties. If the Partnership reduces its use of derivatives as a result of the legislation and regulations, the Partnership's results of operations may become more volatile and its cash flows may be less predictable, which could adversely affect the Partnership's ability to plan for and fund capital expenditures and to generate sufficient cash flow to pay quarterly distributions at current levels or at all. The Partnership's revenues could be adversely affected if a consequence of the legislation and regulations is to lower commodity prices. Any of these consequences could have a material, adverse effect on the Partnership, its financial condition and its results of operations.
80
Table of Contents
Commodity Price Risk
The Partnership is subject to significant risks due to fluctuations in commodity prices. Its exposure to these risks is primarily in the gas processing component of its business. The Partnership currently processes gas under three main types of contractual arrangements:
- 1.
- Processing margin contracts: Under this type of contract, the Partnership pays the producer for the full amount of inlet gas to the plant, and makes a margin based on the difference between the value of liquids recovered from the processed natural gas as compared to the value of the natural gas volumes lost ("shrink") and the cost of fuel used in processing. The shrink and fuel losses are referred to as plant thermal reduction or PTR. The Partnership's margins from these contracts are high during periods of high liquids prices relative to natural gas prices, and can be negative during periods of high natural gas prices relative to liquids prices. However, the Partnership mitigates its risk of processing natural gas when margins are negative primarily through its ability to bypass processing when it is not profitable for the Partnership, or by contracts that revert to a minimum fee for processing if the natural gas must be processed to meet pipeline quality specifications.
- 2.
- Percent of liquids contracts: Under these contracts, the Partnership receives a fee in the form of a percentage of the liquids recovered, and the producer bears all the cost of the natural gas shrink. Therefore, its margins from these contracts are greater during periods of high liquids prices. The Partnership's margins from processing cannot become negative under percent of liquids contracts, but do decline during periods of low NGL prices.
- 3.
- Fee based contracts: Under these contracts the Partnership has no commodity price exposure and are paid a fixed fee per unit of volume that is processed.
Gas processing margins by contract types and gathering and transportation margins as a percent of total gross operating margin for the comparative year-to-date periods are as follows:
| | | | | | | | | | |
| | Years Ended December 31, | |
|---|
| | 2012 | | 2011 | | 2010 | |
|---|
Gathering, transportation and crude handling margin | | | 63.8 | % | | 56.6 | % | | 62.2 | % |
Gas processing margins: | | | | | | | | | | |
Processing margin | | | 9.6 | % | | 19.3 | % | | 12.9 | % |
Percent of liquids | | | 7.5 | % | | 10.7 | % | | 10.6 | % |
Fee based | | | 19.1 | % | | 13.4 | % | | 14.3 | % |
| | | | | | | | |
Total gas processing | | | 36.2 | % | | 43.4 | % | | 37.8 | % |
Total | | | 100.0 | % | | 100.0 | % | | 100.0 | % |
| | | | | | | | |
The Partnership has hedges in place at December 31, 2012 covering a portion of the liquids volumes it expects to receive under percent of liquids (POL) contracts. The hedges done via swaps are set forth in the following table. The relevant payment index price is the monthly average of the daily
81
Table of Contents
closing price for deliveries of commodities into Mont Belvieu, Texas as reported by the Oil Price Information Service (OPIS).
| | | | | | | | | | | | |
Period | | Underlying | | Notional
Volume | | We Pay | | We Receive* | | Fair Value
Asset/(Liability) | |
|---|
| |
| |
| |
| |
| | (In thousands)
| |
|---|
January 2013 - December 2013 | | Ethane | | 114 (MBbls) | | Index | | $0.4226/gal | | $ | 773 | |
January 2013 - December 2013 | | Propane | | 64 (MBbls) | | Index | | $1.1713/gal | | | 634 | |
January 2013 - December 2013 | | Normal Butane | | 34 (MBbls) | | Index | | $1.7079/gal | | | 108 | |
January 2013 - December 2013 | | Natural Gasoline | | 23 (MBbls) | | Index | | $2.2347/gal | | | 140 | |
| | | | | | | | | | | | |
*weighted average | | | | | | | | | | $ | 1,655 | |
| | | | | | | | | | | | |
The Partnership has hedged its exposure to declines in prices for NGL volumes produced for its account. The NGL volumes hedged, as set forth above, focus on POL contracts. The Partnership hedges its POL exposure based on volumes it considers hedgeable (volumes committed under contracts that are long term in nature) versus total POL volumes that include volumes that may fluctuate due to contractual terms, such as contracts with month to month processing options. The Partnership has hedged 47.5% of its hedgeable volumes at risk through December 2013 (34.7% of total volumes at risk through December 2013).
The Partnership also has hedges in place at December 31, 2012 covering the fractionation spread risk related to its processing margin contracts as set forth in the following table:
| | | | | | | | | | | | |
Period | | Underlying | | Notional Volume | | We Pay | | We Receive | | Fair Value
Asset/(Liability) | |
|---|
| |
| |
| |
| |
| | (In thousands)
| |
|---|
January 2013 - December 2013 | | Propane | | 59 (MBbls) | | Index | | $1.2621/gal* | | $ | 808 | |
January 2013 - December 2013 | | Normal Butane | | 60 (MBbls) | | Index | | $1.6921/gal* | | | 157 | |
January 2013 - December 2013 | | Natural Gasoline | | 34 (MBbls) | | Index | | $2.2612/gal* | | | 247 | |
January 2013 - December 2013 | | Natural Gas | | 2,055 (MMBtu/d) | | $3.557/MMBtu* | | Index | | | (21 | ) |
| | | | | | | | | | | | |
*weighted average | | | | | | | | | | $ | 1,191 | |
| | | | | | | | | | | | |
In relation to its fractionation spread risk, as set forth above, the Partnership has hedged 28.3% of its hedgeable liquids volumes at risk through December 2013 (6.4% of total liquids volumes at risk) and 35.4% of the related hedgeable PTR volumes through December 2013 (7.0% of total PTR volumes).
The Partnership is also subject to price risk to a lesser extent for fluctuations in natural gas prices with respect to a portion of its gathering and transport services. Approximately 2.7% of the natural gas the Partnership markets is purchased at a percentage of the relevant natural gas index price, as opposed to a fixed discount to that price. As a result of purchasing the natural gas at a percentage of the index price, the Partnership's resale margins are higher during periods of high natural gas prices and lower during periods of lower natural gas prices.
Another price risk the Partnership faces is the risk of mismatching volumes of gas bought or sold on a monthly price versus volumes bought or sold on a daily price. The Partnership enters each month with a balanced book of natural gas bought and sold on the same basis. However, it is normal to experience fluctuations in the volumes of natural gas bought or sold under either basis, which leaves the Partnership with short or long positions that must be covered. The Partnership uses financial swaps to mitigate the exposure at the time it is created to maintain a balanced position.
The Partnership's primary commodity risk management objective is to reduce volatility in its cash flows. The Partnership maintains a risk management committee, including members of senior management, which oversees all hedging activity. The Partnership enters into hedges for natural gas
82
Table of Contents
and NGLs using over-the-counter derivative financial instruments with only certain well-capitalized counterparties which have been approved by its risk management committee.
The use of financial instruments may expose the Partnership to the risk of financial loss in certain circumstances, including instances when (1) sales volumes are less than expected requiring market purchases to meet commitments or (2) counterparties fail to purchase the contracted quantities of natural gas or otherwise fail to perform. To the extent that the Partnership engages in hedging activities it may be prevented from realizing the benefits of favorable price changes in the physical market. However, the Partnership is similarly insulated against unfavorable changes in such prices.
As of December 31, 2012, outstanding natural gas swap agreements, NGL swap agreements, swing swap agreements, storage swap agreements and other derivative instruments were a net fair value asset of $1.9 million. The aggregate effect of a hypothetical 10% increase in gas and NGL prices would result in decrease of approximately $2.0 million in the net fair value asset of these contracts as of December 31, 2012 to a net fair value liability of approximately $0.1 million.
Interest Rate Risk
The Partnership is exposed to interest rate risk on its variable rate bank credit facility. At December 31, 2012, the Partnership had $71.0 million outstanding borrowings under this facility. A 1% increase or decrease in interest rates would change its annual interest expense by approximately $0.7 million for the year.
At December 31, 2012 and 2011, the Partnership had total fixed rate debt obligations of $965.3 million and $713.4 million, respectively. The balance at December 31, 2012 is related to the Partnership's 2018 Notes and the Partnership's 2022 Notes of $715.3 million and $250.0 million with interest rates of 8.875% and 7.125%, respectively. The balance at 2011 is related to the Partnership's 2018 Notes of $713.4 million with an interest rate of 8.875%. The fair value of these fixed rate obligations was approximately $1.0 billion and $797.5 million as of December 31, 2012 and 2011, respectively. We estimate that a 1% increase or decrease in interest rates would decrease or increase the fair value of the fixed rate debt by $14.7 million based on the debt obligations as of December 31, 2012.
Item 8. Financial Statements and Supplementary Data
The Report of Independent Registered Public Accounting Firm, Consolidated Financial Statements and supplementary financial data required by this Item are set forth on pages F-1 through F-37 of this Report and are incorporated herein by reference.
Item 9. Changes in and Disagreements With Accountants on Accounting and Financial Disclosure
None.
Item 9A. Controls and Procedures
We carried out an evaluation, under the supervision and with the participation of our management, including our Chief Executive Officer and Chief Financial Officer, of the effectiveness of our disclosure controls and procedures as of the end of the period covered by this report pursuant to Exchange Act Rules 13a-15 and 15d-15. Based on that evaluation, our Chief Executive Officer and Chief Financial Officer have concluded that, as of the end of the period covered by this report (December 31, 2012), our disclosure controls and procedures were effective to provide reasonable assurance that information required to be disclosed by us in the reports we file or submit under the Securities Exchange Act of 1934 is recorded, processed, summarized and reported, within the time period specified in the
83
Table of Contents
applicable rules and forms, and that such information is accumulated and communicated to management, including our Chief Executive Officer and Chief Financial Officer, to allow timely decisions regarding disclosure.
There has been no change in our internal control over financial reporting that occurred in the three months ended December 31, 2012 that has materially affected, or is reasonably likely to materially affect, our internal control over financial reporting.
Internal Control Over Financial Reporting
See "Management's Report on Internal Control over Financial Reporting" on page F-2.
Item 9B. Other Information
None.
PART III
Item 10. Directors, Executive Officers and Corporate Governance
The following table shows information about the Partnership's executive officers. Executive officers serve until their successors are elected or appointed.
| | | | | |
Name | | Age | | Position with Crosstex Energy GP, LLC |
|---|
Barry E. Davis(1) | | | 51 | | President, Chief Executive Officer and Director |
William W. Davis(1) | | | 59 | | Executive Vice President and Chief Operating Officer |
Joe A. Davis(1) | | | 52 | | Executive Vice President, General Counsel and Secretary |
Michael J. Garberding | | | 44 | | Executive Vice President and Chief Financial Officer |
Stan Golemon | | | 49 | | Senior Vice President-Engineering and Operations |
Barry E. Davis, President, Chief Executive Officer and Director, led the management buyout of the midstream assets of Comstock Natural Gas, Inc. in December 1996, which transaction resulted in the formation of our predecessor. Mr. Davis has served as director since our IPO in December 2002. Mr. Davis was President and Chief Operating Officer of Comstock Natural Gas and founder of Ventana Natural Gas, a gas marketing and pipeline company that was purchased by Comstock Natural Gas. Mr. Davis started Ventana Natural Gas in June 1992. Prior to starting Ventana, he was Vice President of Marketing and Project Development for Endevco, Inc. Before joining Endevco, Mr. Davis was employed by Enserch Exploration in the marketing group. Mr. Davis holds a B.B.A. in Finance from Texas Christian University. Mr. Davis also serves as Chairman of the Board for Crosstex Energy, Inc. Mr. Davis is not related to William W. Davis or Joe A. Davis. Mr. Davis' leadership skills and experience in the midstream natural gas industry, among other factors, led the Board to conclude that he should serve as a director.
William W. Davis, Executive Vice President and Chief Operating Officer, joined our predecessor in September 2001, and has over 30 years of finance and accounting experience. Mr. Davis assumed the role of Chief Operating Officer in August 2011. Mr. Davis previously served as our Chief Financial Officer. Prior to joining our predecessor, Mr. Davis held various positions with Sunshine Mining and Refining Company from 1983 to September 2001, including Executive Vice President and Chief Financial Officer from 1991 to 2001. In addition, Mr. Davis served as Chief Operating Officer in 2000 and 2001. Mr. Davis graduated magna cum laude from Texas A&M University with a B.B.A. in
84
Table of Contents
Accounting and is a Certified Public Accountant. Mr. Davis is not related to Barry E. Davis or Joe A. Davis.
Joe A. Davis, Executive Vice President, General Counsel and Secretary, joined Crosstex in October 2005. He began his legal career in 1985 with the Dallas firm of Worsham Forsythe, which merged with the international law firm of Hunton & Williams in 2002. Most recently, he served as a partner in the firm's Energy Practice Group, and served on the firm's Executive Committee. Mr. Davis specialized in facility development, sales, acquisitions and financing for the energy industry, representing entrepreneurial start up/development companies, growth companies, large public corporations and large electric and gas utilities. He received his J.D. from Baylor Law School in Waco and his B.S. degree from the University of Texas in Dallas. Mr. Davis is not related to Barry E. Davis or William W. Davis.
Michael J. Garberding, Executive Vice President and Chief Financial Officer joined our general partner in February 2008. Mr. Garberding assumed the role of Senior Vice President and Chief Financial Officer in August 2011. Mr. Garberding previously led the finance and business development organization for the Partnership. Mr. Garberding has 20 years experience in finance and accounting. From 2002 to 2008, Mr. Garberding held various finance and business development positions at TXU Corporation, including assistant treasurer. In addition, Mr. Garberding worked at Enron North America as a Finance Manager and Arthur Andersen LLP as an Audit Manager. He received his Masters in Business Administration from the University of Michigan in 1999 and his B.B.A. in Accounting from Texas A&M University in 1991.
Stan Golemon, Senior Vice President—Engineering and Operations, joined our general partner in May of 2008. Mr. Golemon has 25 years of experience in engineering, operations, and commercial development in the midstream and exploration and production industries. From 1997 to 2008, Mr. Golemon held various midstream engineering, commercial, and management positions with Union Pacific Resources and its successor company Anadarko Petroleum Corporation including General Manager of Midstream Engineering and Engineering Supervisor. Mr. Golemon also spent 3 years with The Arrington Corporation consulting on sulfur recovery operations and Process Safety Management. Mr. Golemon began his career with ARCO Oil and Gas Company where he worked in plant engineering, onshore facilities engineering, and offshore facilities engineering. Mr. Golemon graduated summa cum laude from Louisiana Tech University in 1985 with a Bachelor of Science degree in Chemical Engineering.
Code of Ethics
We adopted a Code of Business Conduct and Ethics (the "Code of Ethics") applicable to all of our employees, officers, and directors, with regard to company-related activities. The Code of Ethics incorporates guidelines designed to deter wrongdoing and to promote honest and ethical conduct and compliance with applicable laws and regulations. The Code of Ethics also incorporates our expectations of our employees that enable us to provide accurate and timely disclosure in our filings with the Securities and Exchange Commission and other public communications. A copy of the Code of Ethics is available to any person, free of charge, at our web site: www.crosstexenergy.com. If any substantive amendments are made to the Code of Ethics or if we grant any waiver, including any implicit waiver, from a provision of the Code of Ethics to any of our executive officers and directors, we will disclose the nature of such amendment or waiver on our web site.
Other
The sections entitled "Proposal One: Election of Directors," "Additional Information Regarding the Board of Directors," "Section 16(a) Beneficial Ownership Reporting Compliance," and "Stockholder Proposals and Other Matters" that will appear in our proxy statement for the 2013 annual meeting of stockholders, which we expect to file with the Securities and Exchange Commission within
85
Table of Contents
120 days after December 31, 2012 (the "2013 Proxy Statement"), will set forth certain information with respect to our directors and with respect to reporting under Section 16(a) of the Securities Exchange Act of 1934, and are incorporated herein by reference.
Item 11. Executive Compensation
The section entitled "Executive Compensation" that will appear in the 2013 Proxy Statement will set forth certain information with respect to the compensation of our management, and is incorporated herein by reference
Item 12. Security Ownership of Certain Beneficial Owners and Management and Related Stockholder Matters
The sections entitled "Equity Compensation Plans" and "Security Ownership of Certain Beneficial Owners and Management" that appears in the 2013 Proxy Statement will set forth certain information with respect to securities authorized for issuance under equity compensation plans and the ownership of our voting securities and equity securities and are incorporated herein by reference.
Item 13. Certain Relationships and Related Transactions and Director Independence
The sections entitled "Certain Relationships and Related Party Transactions" and "Additional Information Regarding the Board of Directors" that will appear in the 2013 Proxy Statement will set forth certain information with respect to certain relationships and related party transactions, and are incorporated herein by reference.
Item 14. Principal Accounting Fees and Services
The section entitled "Fees Paid to Independent Public Accounting Firm" that will appear in the 2013 Proxy Statement will set forth certain information with respect to accounting fees and services, and is incorporated herein by reference.
86
Table of Contents
PART IV
Item 15. Exhibits and Financial Statement Schedules
- (a)
- Financial Statements and Schedules
- (1)
- See the Index to Financial Statements on page F-1.
- (2)
- Schedule I—Parent Company Statements on page F-47.
- (3)
- Exhibits
The exhibits filed as part of this report are as follows (exhibits incorporated by reference are set forth with the name of the registrant, the type of report and registration number or last date of the period for which it was filed, and the exhibit number in such filing):
| | | | | |
| Number | |
| | Description |
|---|
| | 2.1 | *** | — | | Stock Purchase and Sale Agreement, dated as of May 7, 2012, by and among Energy Equity Partners, L.P., the Individual Owners (as defined therein), Clearfield Energy, Inc., Clearfield Holdings, Inc., West Virginia Oil Gathering Corporation, Appalachian Oil Purchasers, Inc., Kentucky Oil Gathering Corporation, Ohio Oil Gathering Corporation II, Ohio Oil Gathering Corporation III, OOGC Disposal Company I, M&B Gas Services, Inc., Clearfield Ohio Holdings, Inc., Pike Natural Gas Company, Eastern Natural Gas Company, Southeastern Natural Gas Company and Crosstex Energy Services, L.P. (incorporated by reference to Exhibit 2.1 to Crosstex Energy, L.P.'s Current Report on Form 8-K dated May 7, 2012, filed with the Commission on May 8, 2012, file No. 000-50067). |
| | | | | | |
| | 3.1 | | — | | Amended and Restated Certificate of Incorporation of Crosstex Energy, Inc. (incorporated by reference to Exhibit 3.1 to our Current Report on Form 8-K dated October 26, 2006, filed with the Commission on October 31, 2006, file No. 000-50536). |
| | | | | | |
| | 3.2 | | — | | Third Amended and Restated Bylaws of Crosstex Energy, Inc. (incorporated by reference to Exhibit 3.1 to our Current Report on Form 8-K dated March 22, 2006, filed with the Commission on March 28, 2006, file No. 000-50536). |
| | | | | | |
| | 3.3 | | — | | Certificate of Limited Partnership of Crosstex Energy, L.P. (incorporated by reference to Exhibit 3.1 to Crosstex Energy, L.P.'s Registration Statement on Form S-1, file No. 333-97779). |
| | | | | | |
| | 3.4 | | — | | Certificate of Amendment to the Certificate of Limited Partnership of Crosstex Energy, L.P. (incorporated by reference to Exhibit 3.2 to Crosstex Energy, L.P.'s Quarterly Report on Form 10-Q for the quarterly period ended June 30, 2012, filed with the Commission on August 7, 2012, file No. 000-50067). |
| | | | | | |
| | 3.5 | | — | | Sixth Amended and Restated Agreement of Limited Partnership of Crosstex Energy, L.P., dated as of March 23, 2007 (incorporated by reference to Exhibit 3.1 to Crosstex Energy, L.P.'s Current Report on Form 8-K dated March 23, 2007, filed with the Commission on March 27, 2007, file No. 000-50067). |
| | | | | | |
| | 3.6 | | — | | Amendment No. 1 to Sixth Amended and Restated Agreement of Limited Partnership of Crosstex Energy, L.P., dated December 20, 2007 (incorporated by reference to Exhibit 3.1 to Crosstex Energy, L.P.'s Current Report on Form 8-K dated December 20, 2007, filed with the Commission on December 21, 2007, file No. 000-50067). |
| |
| | | | |
87
Table of Contents
| | | | | |
| Number | |
| | Description |
|---|
| | 3.7 | | — | | Amendment No. 2 to Sixth Amended and Restated Agreement of Limited Partnership of Crosstex Energy, L.P. (incorporated by reference to Exhibit 3.1 to Crosstex Energy, L.P.'s Current Report on Form 8-K dated March 27, 2008, filed with the Commission on March 28, 2008, file No. 000-50067). |
| | | | | | |
| | 3.8 | | — | | Amendment No. 3 to Sixth Amended and Restated Agreement of Limited Partnership of Crosstex Energy, L.P., dated as of January 19, 2010 (incorporated by reference to Exhibit 3.1 to Crosstex Energy, L.P.'s Current Report on Form 8-K dated January 19, 2010, filed with the Commission on January 22, 2010, file No. 000-50067). |
| | | | | | |
| | 3.9 | | — | | Amendment No. 4 to Sixth Amended and Restated Agreement of Limited Partnership of Crosstex Energy, L.P., dated as of September 13, 2012 (incorporated by reference to Exhibit 3.1 to Crosstex Energy, L.P.'s Current Report on Form 8-K dated September 13, 2012, filed with the Commission on September 14, 2012, file No. 000-50067). |
| | | | | | |
| | 3.10 | | — | | Certificate of Formation of Crosstex Energy GP, LLC (incorporated by reference to Exhibit 3.7 to Crosstex Energy, L.P.'s Registration Statement on Form S-1, file No. 333-97779). |
| | | | | | |
| | 3.11 | | — | | Amended and Restated Limited Liability Company Agreement of Crosstex Energy GP, LLC, dated as of December 17, 2002 (incorporated by reference to Exhibit 3.8 to Crosstex Energy, L.P.'s Registration Statement on Form S-1, file No. 333-97779). |
| | | | | | |
| | 3.12 | | — | | Amendment No. 1 to Amended and Restated Limited Liability Company Agreement of Crosstex Energy GP, LLC, dated as of January 19, 2010 (incorporated by reference to Exhibit 3.2 to Crosstex Energy, L.P.'s Current Report on Form 8-K dated January 19, 2010, filed with the Commission on January 22, 2010, file No. 000-50067). |
| | | | | | |
| | 4.1 | | — | | Specimen Certificate representing shares of common stock (incorporated by reference to Exhibit 4.1 to our Registration Statement on Form S-1, file No. 333-110095). |
| | | | | | |
| | 4.2 | | — | | Indenture, dated as of February 10, 2010, by and among Crosstex Energy, L.P., Crosstex Energy Finance Corporation, the Guarantors named therein and Wells Fargo Bank, National Association, as trustee (incorporated by reference to Exhibit 4.1 to Crosstex Energy, L.P.'s Current Report on Form 8-K dated February 10, 2010, filed with the Commission on February 16, 2010, file No. 000-50067). |
| | | | | | |
| | 4.3 | | — | | Supplemental Indenture, dated as of July 11, 2011, to the Indenture governing the Issuers' 8.875% senior unsecured notes due 2018, dated as of February 10, 2010, by and among Crosstex Energy, L.P., Crosstex Energy Finance Corporation, the Guarantors names therein and Wells Fargo Bank, National Association, as trustee (incorporated by reference to Exhibit 4.1 to Crosstex Energy, L.P.'s Current Report on Form 8-K dated July 11, 2011, filed with the Commission on July 12, 2011, file No. 000-50067). |
| | | | | | |
| | 4.4 | | — | | Supplemental Indenture, dated as of January 24, 2012, to the Indenture governing the Issuers' 8.875% senior unsecured notes due 2018, dated as of February 10, 2010, by and among Crosstex Energy, L.P., Crosstex Energy Finance Corporation, the Guarantors named therein and Well Fargo Bank, National Association, as trustee (incorporated by reference to Exhibit 4.1 to Crosstex Energy, L.P.'s Current Report on Form 8-K dated January 24, 2012, filed with the Commission on January 25, 2012, file No. 000-50067). |
| |
| | | | |
88
Table of Contents
| | | | | |
| Number | |
| | Description |
|---|
| | 4.5 | | — | | Registration Rights Agreement, dated as of January 19, 2010, by and among Crosstex Energy, L.P. and GSO Crosstex Holdings LLC (incorporated by reference to Exhibit 4.1 to Crosstex Energy, L.P.'s Current Report on Form 8-K dated January 19, 2010, filed with the Commission on January 22, 2010, file No. 000-50067). |
| | | | | | |
| | 4.6 | | — | | Indenture governing the Issuers' 71/8% senior unsecured notes due 2022, dated as of May 24, 2012, by and among Crosstex Energy, L.P., Crosstex Energy Finance Corporation, the Guarantors named therein and Wells Fargo Bank, National Association, as trustee (incorporated by reference to Exhibit 4.1 to Crosstex Energy, L.P.'s Current Report on Form 8-K dated May 23, 2012, filed with the Commission on May 24, 2012, file No. 000-50067). |
| | | | | | |
| | 4.7 | | — | | Registration Rights Agreement, dated as of May 24, 2012, by and among Crosstex Energy, L.P., Crosstex Energy Finance Corporation, the Guarantors named therein and Merrill Lynch, Pierce, Fenner & Smith Incorporated, as representative of the several Initial Purchasers named therein (incorporated by reference to Exhibit 4.2 to Crosstex Energy, L.P.'s Current Report on Form 8-K dated May 23, 2012, filed with the Commission on May 24, 2012, file No. 000-50067). |
| | | | | | |
| | 4.8 | | — | | Supplemental Indenture, dated as of August 6, 2012, to the indenture governing the Issuers' 87/8% senior unsecured notes due 2018, dated as of February 10, 2010, by and among Crosstex Energy, L.P., Crosstex Energy Finance Corporation, the Guarantors named therein and Wells Fargo Bank, National Association, as trustee (incorporated by reference to Exhibit 4.3 to Crosstex Energy, L.P.'s Quarterly Report on Form 10-Q for the quarterly period ended June 30, 2012, filed with the Commission on August 7, 2012, file No. 000-50067). |
| | | | | | |
| | 4.9 | | — | | Supplemental Indenture, dated as of August 6, 2012, to the indenture governing the Issuers' 71/8% senior unsecured notes due 2022, dated as of May 24, 2012, by and among Crosstex Energy, L.P., Crosstex Energy Finance Corporation, the Guarantors named therein and Wells Fargo Bank, National Association, as trustee (incorporated by reference to Exhibit 4.4 to Crosstex Energy, L.P.'s Quarterly Report on Form 10-Q for the quarterly period ended June 30, 2012, filed with the Commission on August 7, 2012, file No. 000-50067). |
| | | | | | |
| | 4.10 | | — | | Supplemental Indenture, dated as of October 5, 2012, to the indenture governing the Issuers' 87/8% senior unsecured notes due 2018, dated as of February 10, 2010, by and among Crosstex Energy, L.P., Crosstex Energy Finance Corporation, the Guarantors named therein and Wells Fargo Bank, National Association, as trustee (incorporated by reference to Exhibit 4.1 to Crosstex Energy, L.P.'s Current Report on Form 8-K dated October 2, 2012, filed with the Commission on October 5, 2012, file No. 000-50067). |
| | | | | | |
| | 4.11 | | — | | Supplemental Indenture, dated as of October 5, 2012, to the indenture governing the Issuers' 71/8% senior unsecured notes due 2022, dated as of May 24, 2012, by and among Crosstex Energy, L.P., Crosstex Energy Finance Corporation, the Guarantors named therein and Wells Fargo Bank, National Association, as trustee (incorporated by reference to Exhibit 4.2 to Crosstex Energy, L.P.'s Current Report on Form 8-K dated October 2, 2012, filed with the Commission on October 5, 2012, file No. 000-50067). |
| | | | | | |
| | 10.1 | † | — | | Crosstex Energy, Inc. Amended and Restated Long-Term Incentive Plan effective as of September 6, 2006 (incorporated by reference to Exhibit 10.1 to our Current Report on Form 8-K dated October 26, 2006, filed with the Commission on October 31, 2006, file No. 000-50536). |
| |
| | | | |
89
Table of Contents
| | | | | |
| Number | |
| | Description |
|---|
| | 10.2 | † | — | | Crosstex Energy GP, LLC Amended and Restated Long-Term Incentive Plan, dated March 17, 2009 (incorporated by reference to Exhibit 10.3 to Crosstex Energy, L.P.'s Quarterly Report on Form 10-Q for the quarter ended March 31, 2009, file No. 000-50067). |
| | | | | | |
| | 10.3 | † | — | | Crosstex Energy, Inc. 2009 Long-Term Incentive Plan, effective March 17, 2009 (incorporated by reference to Exhibit 10.3 to our Quarterly Report on Form 10-Q for the quarter ended March 31, 2009, file No. 000-50536). |
| | | | | | |
| | 10.4 | | — | | Omnibus Agreement, dated December 17, 2002, among Crosstex Energy, L.P. and certain other parties (incorporated by reference to Exhibit 10.5 to Crosstex Energy, L.P.'s Annual Report on Form 10-K for the year ended December 31, 2002, file No. 000-50067). |
| | | | | | |
| | 10.5 | † | — | | Form of Performance Unit Agreement (incorporated by reference to Exhibit 10.1 to Crosstex Energy, L.P.'s Current Report on Form 8-K dated June 27, 2007, filed with the Commission on July 3, 2007, file No. 000-50067). |
| | | | | | |
| | 10.6 | † | — | | Form of Restricted Unit Agreement (incorporated by reference to Exhibit 10.9 to Crosstex Energy, L.P.'s Annual Report on Form 10-K for the year ended December 31, 2009, file No. 000-50067). |
| | | | | | |
| | 10.7 | † | — | | Form of Restricted Stock Agreement (incorporated by reference to Exhibit 10.9 to our Annual Report on Form 10-K for the year ended December 31, 2009, file No. 000-50536). |
| | | | | | |
| | 10.8 | † | — | | Form of Performance Share Agreement (incorporated by reference to Exhibit 10.1 to our Current Report on Form 8-K dated June 27, 2007, filed with the Commission on July 3, 2007, file No. 000-50536). |
| | | | | | |
| | 10.9 | † | — | | Form of Indemnity Agreement (incorporated by reference to Exhibit 10.2 to our Annual Report on Form 10-K for the year ended December 31, 2003, file No. 000-50536). |
| | | | | | |
| | 10.10 | | — | | Board Representation Agreement, dated as of January 19, 2010, by and among Crosstex Energy GP, LLC, Crosstex Energy GP, L.P., Crosstex Energy, L.P., Crosstex Energy, Inc. and GSO Crosstex Holdings LLC (incorporated by reference to Exhibit 10.1 to Crosstex Energy, L.P.'s Current Report on Form 8-K dated January 19, 2010, filed with the Commission on January 22, 2010, file No. 000-50067). |
| | | | | | |
| | 10.11 | | — | | Amended and Restated Credit Agreement, dated as of February 10, 2010, by and among Crosstex Energy, L.P., Bank of America, N.A., as Administrative Agent and L/C Issuer thereunder, and the other lenders party thereto (incorporated by reference to Exhibit 10.1 to Crosstex Energy, L.P.'s Current Report on Form 8-K dated February 10, 2010, filed with the Commission on February 16, 2010, file No. 000-50067). |
| | | | | | |
| | 10.12 | | — | | First Amendment to Amended and Restated Credit Agreement dated as of May 2, 2011, by and among Crosstex Energy, L.P., Bank of America, N.A., as Administrative Agent and L/C Issuer, and the other lenders party thereto (incorporated by reference to Exhibit 10.1 to Crosstex Energy, L.P.'s Current Report on Form 8-K dated May 2, 2011, filed with the Commission on May 3, 2011, file No. 000-50067). |
| |
| | | | |
90
Table of Contents
| | | | | |
| Number | |
| | Description |
|---|
| | 10.13 | | — | | Second Amendment to Amended and Restated Credit Agreement dated as of July 11, 2011, by and among Crosstex Energy, L.P., Bank of America, N.A., as Administrative Agent and L/C Issuer, and the other lenders party thereto (incorporated by reference to Exhibit 10.1 to Crosstex Energy, L.P.'s Current Report on Form 8-K dated July 11, 2011, filed with the Commission on July 12, 2011, file No. 000-50067). |
| | | | | | |
| | 10.14 | | — | | Third Amendment to Amended and Restated Credit Agreement dated as of January 24, 2012, by and among Crosstex Energy, L.P., Bank of America, N.A., as Administrative Agent and L/C Issuer, and the other lenders party thereto (incorporated by reference to Exhibit 10.1 to Crosstex Energy, L.P.'s Current Report on Form 8-K dated January 24, 2012, filed with the Commission on January 25, 2012, file No. 000-50067). |
| | | | | | |
| | 10.15 | | — | | Fourth Amendment to Amended and Restated Credit Agreement, dated as of May 23, 2012, by and among Crosstex Energy, L.P., Bank of America, N.A., as Administrative Agent and L/C Issuer, and the other lenders party thereto (incorporated by reference to Exhibit 10.1 to Crosstex Energy, L.P.'s Current Report on Form 8-K dated May 23, 2012, filed with the Commission on May 24, 2012, file No. 000-50067). |
| | | | | | |
| | 10.16 | | — | | Fifth Amendment to Amended and Restated Credit Agreement, dated as of August 3, 2012, by and among Crosstex Energy, L.P., Bank of America, N.A., as Administrative Agent and L/C Issuer, and the other lenders party thereto (incorporated by reference to Exhibit 10.3 to Crosstex Energy, L.P.'s Quarterly Report on Form 10-Q for the quarterly period ended June 30, 2012, filed with the Commission on August 7, 2012, file No. 000-50067). |
| | | | | | |
| | 10.17 | | — | | Sixth Amendment to Amended and Restated Credit Agreement, dated as of August 30, 2012, by and among Crosstex Energy, L.P., Bank of America, N.A., as Administrative Agent and L/C Issuer, and the other lenders party thereto (incorporated by reference to Exhibit 10.1 to Crosstex Energy, L.P.'s Current Report on Form 8-K dated August 30, 2012, filed with the Commission on August 31, 2012, file No. 000-50067). |
| | | | | | |
| | 10.18 | | — | | Seventh Amendment to Amended and Restated Credit Agreement, dated as of January 28, 2013, by and among Crosstex Energy, L.P., Bank of America, N.A., as Administrative Agent and L/C Issuer, and the other lenders party thereto (incorporated by reference to Exhibit 10.1 to Crosstex Energy, L.P.'s Current Report on Form 8-K dated January 28, 2013, filed with the Commission on January 29, 2013, file No. 000-50067). |
| | | | | | |
| | 10.19 | † | — | | Crosstex Energy Services, L.P. Severance Pay Plan (incorporated by reference to Exhibit 10.1 to Crosstex Energy, L.P.'s Current Report on Form 8-K July 1, 2011, filed with the Commission on July 1, 2011, file No. 000-50067). |
| | | | | | |
| | 10.20 | † | — | | Form of Employment Agreement (incorporated by reference to Exhibit 10.20 to Crosstex Energy, L.P.'s Annual Report on Form 10-K for the year ended December 31, 2011, file No. 000-50536). |
| | | | | | |
| | 10.21 | | — | | Purchase Agreement, dated as of May 10, 2012, by and among Crosstex Energy, L.P., Crosstex Energy Finance Corporation, the Guarantors named therein and the Initial Purchasers named therein (incorporated by reference to Exhibit 10.1 to Crosstex Energy, L.P.'s Current Report on Form 8-K dated May 9, 2012, filed with the Commission on May 11, 2012, file No. 000-50067). |
| |
| | | | |
91
Table of Contents
| | | | | |
| Number | |
| | Description |
|---|
| | 10.22 | | — | | Common Unit Purchase Agreement, dated as of September 14, 2012, by and among Crosstex Energy, L.P., and each of the Purchasers set forth on Schedule A thereto (incorporated by reference to Exhibit 10.1 to Crosstex Energy, L.P.'s Current Report on Form 8-K dated September 14, 2012, filed with the Commission on September 14, 2012, file No. 000-50067). |
| | | | | | |
| | 10.23 | | — | | Common Unit Purchase Agreement, dated as of January 9, 2013, by and among Crosstex Energy, L.P., and each of the Purchasers set forth on Schedule A thereto (incorporated by reference to Exhibit 10.1 to Crosstex Energy, L.P.'s Current Report on Form 8-K dated January 8, 2013, filed with the Commission on January 10, 2013, file No. 000-50067). |
| | | | | | |
| | 21.1 | * | — | | List of Subsidiaries. |
| | | | | | |
| | 23.1 | * | — | | Consent of KPMG LLP. |
| | | | | | |
| | 31.1 | * | — | | Certification of the Principal Executive Officer. |
| | | | | | |
| | 31.2 | * | — | | Certification of the Principal Financial Officer. |
| | | | | | |
| | 32.1 | * | — | | Certification of the Principal Executive Officer and the Principal Financial Officer of the Company pursuant to 18 U.S.C. Section 1350. |
| | | | | | |
| | 101 | ** | — | | The following financial information from Crosstex Energy, Inc.'s Annual Report on Form 10-K for the year ended December 31, 2012, formatted in XBRL (eXtensible Business Reporting Language): (i) Consolidated Statements of Operations for the years ended December 31, 2012, 2011, and 2010, (ii) Consolidated Balance Sheets as of December 31, 2012, and 2011 , (iii) Consolidated Statements of Cash Flows for the years ended December 31, 2012, 2011, and 2010, (iv) Consolidated Statements of Comprehensive Income for the years ended December 31, 2012, 2011, and 2010, (v) Consolidated Statements of Changes in Stockholders' Equity for the years ended December 31, 2012, 2011, and 2010 and (vi) the Notes to Consolidated Financial Statements. |
- *
- Filed herewith.
- **
- Furnished herewith.
- ***
- In accordance with the instruction on item 601(b)(2) of Regulation S-K, the exhibits and schedules to Exhibit 2.1 are not filed herewith. The agreements identify such exhibits and schedules, including the general nature of their content. We undertake to provide such exhibits and schedules to the Commission upon request.
- †
- As required by Item 15(a)(3), this Exhibit is identified as a compensatory benefit plan or arrangement.
92
Table of Contents
SIGNATURES
Pursuant to the requirements of Section 13 or 15(d) of the Securities Exchange Act of 1934, the Registrant has duly caused this report to be signed on its behalf by the undersigned, thereunto duly authorized, on the 1st day of March 2013.
| | | | |
| | CROSSTEX ENERGY, INC. |
| | By: | | /s/ BARRY E. DAVIS
Barry E. Davis,
President and Chief Executive Officer |
Pursuant to the requirements of the Securities Exchange Act of 1934, this report has been signed by the following persons on behalf of the Registrant and in the capacities and on the dates indicated.
| | | | |
Signature | | Title | | Date |
|---|
|
|
|
|
|
/s/ BARRY E. DAVIS
Barry E. Davis | | President, Chief Executive Officer and Chairman of the Board (Principal Executive Officer) | | March 1, 2013 |
/s/ LELDON E. ECHOLS
Leldon E. Echols |
|
Director |
|
March 1, 2013 |
/s/ JAMES C. CRAIN
James C. Crain |
|
Director |
|
March 1, 2013 |
/s/ BRYAN H. LAWRENCE
Bryan H. Lawrence |
|
Director |
|
March 1, 2013 |
/s/ CECIL E. MARTIN
Cecil E. Martin |
|
Director |
|
March 1, 2013 |
/s/ ROBERT F. MURCHISON
Robert F. Murchison |
|
Director |
|
March 1, 2013 |
/s/ MICHAEL J. GARBERDING
Michael J. Garberding |
|
Executive Vice President and Chief Financial Officer (Principal Financial and Accounting Officer) |
|
March 1, 2013 |
93
Table of Contents
INDEX TO FINANCIAL STATEMENTS
| | |
Crosstex Energy, Inc. Consolidated Financial Statements: | | |
Management's Report on Internal Control Over Financial Reporting | |
F-2 |
Reports of Independent Registered Public Accounting Firm | |
F-3 |
Consolidated Balance Sheets as of December 31, 2012 and 2011 | |
F-5 |
Statements of Operations for the years ended December 31, 2012, 2011 and 2010 | |
F-6 |
Consolidated Statements of Comprehensive Income (Loss) for the years ended December 31, 2012, 2011 and 2010 | |
F-7 |
Statements of Changes in Stockholders' Equity for the years ended December 31, 2012, 2011 and 2010 | |
F-8 |
Consolidated Statements of Cash Flows for the years ended December 31, 2012, 2011 and 2010 | |
F-9 |
Notes to Consolidated Financial Statements | |
F-10 |
Crosstex Energy, Inc. Financial Statement Schedules: | | |
Schedule I—Parent Company Statements: | | |
Condensed Balance Sheets as of December 31, 2012 and 2011 | |
F-47 |
Condensed Statements of Operations for the years ended December 31, 2012, 2011 and 2010 | |
F-48 |
Condensed Statements of Cash Flows for the years ended December 31, 2012, 2011 and 2010 | |
F-49 |
F-1
Table of Contents
MANAGEMENT'S REPORT ON
INTERNAL CONTROL OVER FINANCIAL REPORTING
Management of Crosstex Energy Inc. is responsible for establishing and maintaining adequate internal control over financial reporting and for the assessment of the effectiveness of internal control over financial reporting for Crosstex Energy, Inc (the "Company"). As defined by the Securities and Exchange Commission (Rule 13a-15(f) under the Securities Exchange Act of 1934, as amended), internal control over financial reporting is a process designed by, or under the supervision of Crosstex Energy Inc.'s principal executive and principal financial officers and effected by its Board of Directors, management and other personnel, to provide reasonable assurance regarding the reliability of financial reporting and the preparation of the consolidated financial statements in accordance with U.S. generally accepted accounting principles.
The Company's internal control over financial reporting is supported by written policies and procedures that (1) pertain to the maintenance of records that, in reasonable detail, accurately and fairly reflect the Company's transactions and dispositions of the Company's assets; (2) provide reasonable assurance that transactions are recorded as necessary to permit preparation of the consolidated financial statements in accordance with U.S. generally accepted accounting principles, and that receipts and expenditures of the Partnership are being made only in accordance with authorization of the Company's management and directors; and (3) provide reasonable assurance regarding prevention or timely detection of unauthorized acquisition, use or disposition of the Company's assets that could have a material effect on the consolidated financial statements.
Because of its inherent limitations, internal control over financial reporting may not prevent or detect misstatements. Also, projections of any evaluation of effectiveness to future periods are subject to the risk that controls may become inadequate because of changes in conditions, or that the degree of compliance with the policies or procedures may deteriorate.
In connection with the preparation of the Company's annual consolidated financial statements, management has undertaken an assessment of the effectiveness of the Company's internal control over financial reporting as of December 31, 2012, based on criteria established inInternal Control—Integrated Framework issued by the Committee of Sponsoring Organizations of the Treadway Commission (the COSO Framework). Management's assessment included an evaluation of the design of the Company's internal control over financial reporting and testing of the operational effectiveness of those controls.
Based on this assessment, management has concluded that as of December 31, 2012, the Company's internal control over financial reporting was effective to provide reasonable assurance regarding the reliability of financial reporting and the preparation of financial statements for external purposes in accordance with U.S. generally accepted accounting principles.
KPMG LLP, the independent registered public accounting firm that audited the Company's consolidated financial statements included in this report, has issued an attestation report on the Company's internal control over financial reporting, a copy of which appears on page F-4 of this Annual Report on Form 10-K.
F-2
Table of Contents
Report of Independent Registered Public Accounting Firm
To the Board of Directors and the Stockholders of
Crosstex Energy, Inc:
We have audited the accompanying consolidated balance sheets of Crosstex Energy, Inc (a Delaware corporation) and subsidiaries as of December 31, 2012 and 2011 and the related consolidated statements of operations, comprehensive income (loss), changes in stockholders' equity, and cash flows for each of the years in the three-year period ended December 31, 2012. In connection with our audits of the consolidated financial statements, we also have audited the accompanying financial statement schedule. These consolidated financial statements and financial statement schedule are the responsibility of the Company's management. Our responsibility is to express an opinion on these consolidated financial statements and financial statement schedule based on our audits.
We conducted our audits in accordance with the standards of the Public Company Accounting Oversight Board (United States). Those standards require that we plan and perform the audit to obtain reasonable assurance about whether the financial statements are free of material misstatement. An audit includes examining, on a test basis, evidence supporting the amounts and disclosures in the financial statements. An audit also includes assessing the accounting principles used and significant estimates made by management, as well as evaluating the overall financial statement presentation. We believe that our audits provide a reasonable basis for our opinion.
In our opinion, the consolidated financial statements referred to above present fairly, in all material respects, the financial position of Crosstex Energy, Inc and subsidiaries as of December 31, 2012 and 2011 and the results of their operations and their cash flows for each of the years in the three-year period ended December 31, 2012, in conformity with U.S. generally accepted accounting principles. Also in our opinion, the related financial statement schedule, when considered in relation to the basic consolidated financial statements taken as a whole, presents fairly, in all material respects, the information set forth therein.
We have also audited, in accordance with the standards of the Public Company Accounting Oversight Board (United States), the Company's internal control over financial reporting as of December 31, 2012, based on criteria established inInternal Control—Integrated Framework issued by the Committee of Sponsoring Organizations of the Treadway Commission (COSO), and our report dated March 1, 2013, expressed an unqualified opinion on the effectiveness of the Company's internal control over financial reporting.
Dallas, Texas
March 1, 2013
F-3
Table of Contents
Report of Independent Registered Public Accounting Firm
To the Board of Directors and the Stockholders of
Crosstex Energy, Inc:
We have audited Crosstex Energy, Inc and subsidiaries' internal control over financial reporting as of December 31, 2012, based on criteria established inInternal Control—Integrated Framework issued by the Committee of Sponsoring Organizations of the Treadway Commission (COSO). The Company's management is responsible for maintaining effective internal control over financial reporting and for its assessment of the effectiveness of internal control over financial reporting, included in the accompanying Management's Report on Internal Control over Financial Reporting. Our responsibility is to express an opinion on the Company's internal control over financial reporting based on our audit.
We conducted our audit in accordance with the standards of the Public Company Accounting Oversight Board (United States). Those standards require that we plan and perform the audit to obtain reasonable assurance about whether effective internal control over financial reporting was maintained in all material respects. Our audit included obtaining an understanding of internal control over financial reporting, assessing the risk that a material weakness exists, and testing and evaluating the design and operating effectiveness of internal control based on the assessed risk. Our audit also included performing such other procedures as we considered necessary in the circumstances. We believe that our audit provides a reasonable basis for our opinion.
A company's internal control over financial reporting is a process designed to provide reasonable assurance regarding the reliability of financial reporting and the preparation of financial statements for external purposes in accordance with generally accepted accounting principles. A company's internal control over financial reporting includes those policies and procedures that (1) pertain to the maintenance of records that, in reasonable detail, accurately and fairly reflect the transactions and dispositions of the assets of the company; (2) provide reasonable assurance that transactions are recorded as necessary to permit preparation of financial statements in accordance with generally accepted accounting principles, and that receipts and expenditures of the company are being made only in accordance with authorizations of management and directors of the company; and (3) provide reasonable assurance regarding prevention or timely detection of unauthorized acquisition, use, or disposition of the company's assets that could have a material effect on the financial statements.
Because of its inherent limitations, internal control over financial reporting may not prevent or detect misstatements. Also, projections of any evaluation of effectiveness to future periods are subject to the risk that controls may become inadequate because of changes in conditions, or that the degree of compliance with the policies or procedures may deteriorate.
In our opinion, the Company maintained, in all material respects, effective internal control over financial reporting as of December 31, 2012, based on criteria established inInternal Control—Integrated Framework issued by the Committee of Sponsoring Organizations of the Treadway Commission.
We also have audited, in accordance with the standards of the Public Company Accounting Oversight Board (United States), the consolidated balance sheets of the Company as of December 31, 2012 and 2011, and the related consolidated statements of operations, comprehensive income (loss), stockholders' equity and cash flows for each of the years in the three-year period ended December 31, 2012, and our report dated March 1, 2013 expressed an unqualified opinion on those consolidated financial statements.
Dallas, Texas
March 1, 2013
F-4
Table of Contents
CROSSTEX ENERGY, INC.
Consolidated Balance Sheets
| | | | | | | |
| | December 31, | |
|---|
| | 2012 | | 2011 | |
|---|
| | (In thousands, except
share data)
| |
|---|
ASSETS | | | | | | | |
Current assets: | | | | | | | |
Cash and cash equivalents | | $ | 2,976 | | $ | 30,343 | |
Accounts receivable: | | | | | | | |
Trade, net of allowance for bad debts of $535 and $405, respectively | | | 63,690 | | | 22,680 | |
Accrued revenues | | | 150,734 | | | 140,023 | |
Imbalances | | | 1,533 | | | 1,658 | |
Other | | | 3,561 | | | 1,516 | |
Fair value of derivative assets | | | 3,234 | | | 2,867 | |
Natural gas and natural gas liquids inventory, prepaid expenses and other | | | 11,866 | | | 9,965 | |
Assets held for disposition | | | 22,599 | | | — | |
| | | | | | |
Total current assets | | | 260,193 | | | 209,052 | |
| | | | | | |
Property and equipment: | | | | | | | |
Transmission assets | | | 397,381 | | | 384,959 | |
Gathering systems | | | 723,626 | | | 656,407 | |
Gas plants | | | 586,294 | | | 494,365 | |
Other property and equipment | | | 88,326 | | | 58,465 | |
Construction in process | | | 180,976 | | | 55,467 | |
| | | | | | |
Total property and equipment | | | 1,976,603 | | | 1,649,663 | |
Accumulated depreciation | | | (504,442 | ) | | (406,773 | ) |
| | | | | | |
Total property and equipment, net | | | 1,472,161 | | | 1,242,890 | |
| | | | | | |
Intangible assets, net of accumulated amortization of $263,305 and $199,248, respectively | | | 425,005 | | | 451,462 | |
Goodwill | | | 152,627 | | | — | |
Investment in limited liability company | | | 90,500 | | | 35,000 | |
Other assets, net | | | 25,989 | | | 24,212 | |
| | | | | | |
Total assets | | $ | 2,426,475 | | $ | 1,962,616 | |
| | | | | | |
LIABILITIES AND STOCKHOLDERS' EQUITY | | | | | | | |
Current liabilities: | | | | | | | |
Drafts payable | | $ | 4,093 | | $ | 6,005 | |
Accounts payable | | | 25,839 | | | 14,196 | |
Accrued gas and crude oil purchases | | | 140,344 | | | 106,233 | |
Accrued imbalances payable | | | 2,333 | | | 2,348 | |
Fair value of derivative liabilities | | | 1,310 | | | 5,587 | |
Accrued interest | | | 26,712 | | | 24,918 | |
Liabilities held for disposition | | | 3,572 | | | — | |
Other current liabilities | | | 71,916 | | | 66,567 | |
| | | | | | |
Total current liabilities | | | 276,119 | | | 225,854 | |
| | | | | | |
Long-term debt | | | 1,036,305 | | | 798,409 | |
Other long-term liabilities | | | 30,256 | | | 23,919 | |
Deferred tax liability | | | 133,555 | | | 85,187 | |
Commitments and contingencies | | | — | | | — | |
Stockholders' equity: | | | | | | | |
Common stock (150,000,000 shares authorized, $.01 par value, 47,413,789 and 47,194,023 issued and outstanding in 2012 and 2011, respectively) | | | 473 | | | 471 | |
Additional paid-in capital | | | 274,635 | | | 244,211 | |
Accumulated deficit | | | (117,583 | ) | | (82,177 | ) |
Accumulated other comprehensive income (loss) | | | 141 | | | (85 | ) |
| | | | | | |
Total Crosstex Energy, Inc. stockholders' equity | | | 157,666 | | | 162,420 | |
Interest of non-controlling partners in the Partnership | | | 792,574 | | | 666,827 | |
| | | | | | |
Total stockholders' equity | | | 950,240 | | | 829,247 | |
| | | | | | |
Total liabilities and stockholders' equity | | $ | 2,426,475 | | $ | 1,962,616 | |
| | | | | | |
See accompanying notes to consolidated financial statements.
F-5
Table of Contents
CROSSTEX ENERGY, INC.
Consolidated Statements of Operations
| | | | | | | | | | |
| | Years ended December 31, | |
|---|
| | 2012 | | 2011 | | 2010 | |
|---|
| | (In thousands, except per unit data)
| |
|---|
Revenues: | | | | | | | | | | |
Midstream | | $ | 1,655,851 | | $ | 2,013,942 | | $ | 1,792,676 | |
| | | | | | | | |
Total revenues | | | 1,655,851 | | | 2,013,942 | | | 1,792,676 | |
| | | | | | | | |
Operating costs and expenses: | | | | | | | | | | |
Purchased gas, NGLs and crude oil | | | 1,262,093 | | | 1,638,777 | | | 1,454,376 | |
Operating expenses | | | 130,882 | | | 111,778 | | | 105,060 | |
General and administrative | | | 65,083 | | | 55,516 | | | 51,172 | |
(Gain) loss on sale of property | | | (342 | ) | | 264 | | | (13,881 | ) |
Loss on derivatives | | | 1,006 | | | 7,776 | | | 9,100 | |
Impairments | | | — | | | — | | | 1,311 | |
Depreciation and amortization | | | 162,300 | | | 125,358 | | | 111,625 | |
| | | | | | | | |
Total operating costs and expenses | | | 1,621,022 | | | 1,939,469 | | | 1,718,763 | |
| | | | | | | | |
Operating income | | | 34,829 | | | 74,473 | | | 73,913 | |
Other income (expense): | | | | | | | | | | |
Interest expense, net of interest income | | | (86,515 | ) | | (79,227 | ) | | (87,028 | ) |
Loss on extinguishment of debt | | | — | | | — | | | (14,713 | ) |
Equity in earnings of limited liability company | | | 3,250 | | | — | | | — | |
Other income | | | 5,054 | | | 707 | | | 294 | |
| | | | | | | | |
Total other expense | | | (78,211 | ) | | (78,520 | ) | | (101,447 | ) |
| | | | | | | | |
Loss before non-controlling interest and income taxes | | | (43,382 | ) | | (4,047 | ) | | (27,534 | ) |
Income tax benefit | | | 6,642 | | | 2,768 | | | 6,021 | |
| | | | | | | | |
Net loss | | | (36,740 | ) | | (1,279 | ) | | (21,513 | ) |
| | | | | | | | |
Less: Net income (loss) attributable to non-controlling interest | | | (24,259 | ) | | 4,728 | | | (9,862 | ) |
| | | | | | | | |
Net loss attributable to Crosstex Energy, Inc. | | $ | (12,481 | ) | $ | (6,007 | ) | $ | (11,651 | ) |
| | | | | | | | |
Net loss per common share: | | | | | | | | | | |
Basic | | $ | (0.26 | ) | $ | (0.12 | ) | $ | (0.24 | ) |
| | | | | | | | |
Diluted | | $ | (0.26 | ) | $ | (0.12 | ) | $ | (0.24 | ) |
| | | | | | | | |
Weighted-average shares outstanding: | | | | | | | | | | |
Basic | | | 47,384 | | | 47,150 | | | 46,732 | |
Diluted | | | 47,384 | | | 47,150 | | | 46,732 | |
Dividend paid per share: | | | | | | | | | | |
Common | | $ | 0.47 | | $ | 0.37 | | $ | 0.07 | |
See accompanying notes to consolidated financial statements.
F-6
Table of Contents
CROSSTEX ENERGY, INC.
Consolidated Statements of Comprehensive Income (Loss)
| | | | | | | | | | |
| | Years Ended December 31, | |
|---|
| | 2012 | | 2011 | | 2010 | |
|---|
| | (In thousands)
| |
|---|
Net loss | | $ | (36,740 | ) | $ | (1,279 | ) | $ | (21,513 | ) |
Change in non-controlling interest's portion of accumulated other comprehensive income due to issuance of units by the Partnership, net of taxes of $0, $0 and $68, respectively | | | — | | | — | | | 115 | |
Hedging gains or losses reclassified to earnings, net of taxes of $(48), $195 and $208, respectively | | | (641 | ) | | 1,769 | | | 1,877 | |
Adjustment in fair value of derivatives, net of taxes of $181, $(159) and $(26), respectively | | | 1,642 | | | (1,446 | ) | | (249 | ) |
| | | | | | | | |
Comprehensive loss | | | (35,739 | ) | | (956 | ) | | (19,770 | ) |
Comprehensive income (loss) attributable to non-controlling interest | | | (23,484 | ) | | 4,991 | | | (8,542 | ) |
| | | | | | | | |
Comprehensive loss attributable to Crosstex Energy, Inc. | | $ | (12,255 | ) | $ | (5,947 | ) | $ | (11,228 | ) |
| | | | | | | | |
See accompanying notes to consolidated financial statements.
F-7
Table of Contents
CROSSTEX ENERGY, INC.
Consolidated Statements of Changes in Stockholders' Equity
Years ended December 31, 2012, 2011 and 2010
| | | | | | | | | | | | | | | | | | | | | | |
| | Common Stock | |
| |
| | Accumulated
Other
Comprehensive
Income (loss) | |
| |
| |
|---|
| | Additional
Paid-In
Capital | | Retained
Earnings
(Deficit) | | Non-
Controlling
Interest | | Total
Stockholders'
Equity | |
|---|
| | Shares | | Amount | |
|---|
| | (In thousands)
| |
|---|
Balance, December 31, 2009 | | | 46,524 | | $ | 464 | | $ | 271,669 | | $ | (43,279 | ) | $ | (568 | ) | $ | 587,624 | | $ | 815,910 | |
Issuance of units by the Partnership to non-controlling interest | | | — | | | — | | | — | | | — | | | — | | | 120,786 | | | 120,786 | |
Conversion of restricted stock for common, net of shares withheld for taxes | | | 370 | | | 4 | | | (709 | ) | | — | | | — | | | — | | | (705 | ) |
Change in equity due to issuance of units by the Partnership | | | — | | | — | | | (32,769 | ) | | — | | | 115 | | | 32,586 | | | (68 | ) |
Stock-based compensation | | | — | | | — | | | 4,199 | | | — | | | — | | | 5,370 | | | 9,569 | |
Common dividends | | | — | | | — | | | — | | | (3,368 | ) | | — | | | — | | | (3,368 | ) |
Net loss | | | — | | | — | | | — | | | (11,651 | ) | | — | | | (9,862 | ) | | (21,513 | ) |
Hedging gains or losses reclassified to earnings | | | — | | | — | | | — | | | — | | | 353 | | | 1,524 | | | 1,877 | |
Adjustment in fair value of derivatives | | | — | | | — | | | — | | | — | | | (45 | ) | | (204 | ) | | (249 | ) |
Non-controlling partner's impact of conversion of restricted units and option exercises | | | — | | | — | | | — | | | — | | | — | | | (1,768 | ) | | (1,768 | ) |
Distribution to non-controlling interest | | | — | | | — | | | — | | | — | | | — | | | (18,993 | ) | | (18,993 | ) |
| | | | | | | | | | | | | | | | |
Balance, December 31, 2010 | | | 46,894 | | | 468 | | | 242,390 | | | (58,298 | ) | | (145 | ) | | 717,063 | | | 901,478 | |
Conversion of restricted stock for common, net of shares withheld for taxes | | | 300 | | | 3 | | | (1,071 | ) | | — | | | — | | | — | | | (1,068 | ) |
Change in equity due to issuance of units by the Partnership | | | — | | | — | | | (476 | ) | | — | | | — | | | — | | | (476 | ) |
Stock-based compensation | | | — | | | — | | | 3,368 | | | — | | | — | | | 4,188 | | | 7,556 | |
Common dividends | | | — | | | — | | | — | | | (17,872 | ) | | — | | | — | | | (17,872 | ) |
Net (loss) income | | | — | | | — | | | — | | | (6,007 | ) | | — | | | 4,728 | | | (1,279 | ) |
Hedging gains or losses reclassified to earnings | | | — | | | — | | | — | | | — | | | 330 | | | 1,439 | | | 1,769 | |
Adjustment in fair value of derivatives | | | — | | | — | | | — | | | — | | | (270 | ) | | (1,176 | ) | | (1,446 | ) |
Non-controlling partner's impact of conversion of restricted units and option exercises | | | — | | | — | | | — | | | — | | | — | | | (1,206 | ) | | (1,206 | ) |
Distribution to non-controlling interest | | | — | | | — | | | — | | | — | | | — | | | (58,209 | ) | | (58,209 | ) |
| | | | | | | | | | | | | | | | |
Balance, December 31, 2011 | | | 47,194 | | | 471 | | | 244,211 | | | (82,177 | ) | | (85 | ) | | 666,827 | | | 829,247 | |
Issuance of units by the Partnership to non-controlling interest | | | — | | | — | | | — | | | — | | | — | | | 232,791 | | | 232,791 | |
Conversion of restricted stock for common, net of shares withheld for taxes | | | 220 | | | 2 | | | (796 | ) | | — | | | — | | | — | | | (794 | ) |
Change in equity due to issuance of units by the Partnership | | | — | | | — | | | 24,500 | | | — | | | — | | | (15,890 | ) | | 8,610 | |
Stock-based compensation | | | — | | | — | | | 4,481 | | | — | | | — | | | 5,002 | | | 9,483 | |
Common dividends | | | — | | | — | | | — | | | (22,925 | ) | | — | | | — | | | (22,925 | ) |
Net loss | | | — | | | — | | | — | | | (12,481 | ) | | — | | | (24,259 | ) | | (36,740 | ) |
Hedging gains or losses reclassified to earnings | | | — | | | — | | | — | | | — | | | (81 | ) | | (560 | ) | | (641 | ) |
Adjustment in fair value of derivatives | | | — | | | — | | | — | | | — | | | 307 | | | 1,335 | | | 1,642 | |
Non-controlling partner's impact of conversion of restricted units and option exercises | | | — | | | — | | | — | | | — | | | — | | | (594 | ) | | (594 | ) |
Distribution to non-controlling interest | | | — | | | — | | | — | | | — | | | — | | | (69,839 | ) | | (69,839 | ) |
Purchase of non-controlling interest | | | — | | | — | | | 2,239 | | | — | | | — | | | (2,239 | ) | | — | |
| | | | | | | | | | | | | | | | |
Balance, December 31, 2012 | | | 47,414 | | $ | 473 | | $ | 274,635 | | $ | (117,583 | ) | $ | 141 | | $ | 792,574 | | $ | 950,240 | |
| | | | | | | | | | | | | | | | |
See accompanying notes to consolidated financial statements.
F-8
Table of Contents
CROSSTEX ENERGY, INC.
Consolidated Statements of Cash Flows
| | | | | | | | | | |
| | Years Ended December 31, | |
|---|
| | 2012 | | 2011 | | 2010 | |
|---|
| | (In thousands)
| |
|---|
Cash flows from operating activities: | | | | | | | | | | |
Net loss | | $ | (36,740 | ) | $ | (1,279 | ) | $ | (21,513 | ) |
Adjustments to reconcile net loss to net cash provided by operating activities: | | | | | | | | | | |
Depreciation and amortization | | | 162,300 | | | 125,358 | | | 111,625 | |
Non-cash stock-based compensation | | | 9,483 | | | 7,556 | | | 9,569 | |
(Gain) loss on sale of property | | | (3,328 | ) | | 264 | | | (13,881 | ) |
Impairments | | | — | | | — | | | 1,311 | |
Deferred tax (benefit) expense | | | (8,384 | ) | | (4,540 | ) | | (7,538 | ) |
Derivatives mark to market interest rate settlement | | | — | | | — | | | (24,160 | ) |
Non-cash portion of derivatives loss | | | (3,508 | ) | | 761 | | | 1,136 | |
Non-cash portion of loss on debt extinguishment | | | — | | | — | | | 5,396 | |
Interest paid-in-kind | | | — | | | — | | | (11,558 | ) |
Amortization of debt issue costs | | | 5,377 | | | 6,462 | | | 6,680 | |
Amortization of discount on notes | | | 1,897 | | | 1,897 | | | 1,686 | |
Equity in income of limited liability company | | | (3,250 | ) | | | | | | |
Changes in assets and liabilities: | | | | | | | | | | |
Accounts receivable, accrued revenue and other | | | (39,120 | ) | | 44,121 | | | 4,665 | |
Natural gas and natural gas liquids, prepaid expenses and other | | | (4,015 | ) | | (1,507 | ) | | 2,376 | |
Accounts payable, accrued gas purchases and other accrued liabilities | | | 19,744 | | | (37,800 | ) | | 18,996 | |
| | | | | | | | |
Net cash provided by operating activities | | | 100,456 | | | 141,293 | | | 84,790 | |
| | | | | | | | |
Cash flows from investing activities: | | | | | | | | | | |
Additions to property and equipment | | | (234,849 | ) | | (97,572 | ) | | (48,191 | ) |
Insurance recoveries on property and equipment | | | — | | | — | | | 2,599 | |
Acquisitions and asset purchases | | | (214,957 | ) | | — | | | — | |
Proceeds from sale of property | | | 11,773 | | | 478 | | | 60,230 | |
Investment in limited liability company | | | (52,250 | ) | | (35,000 | ) | | — | |
| | | | | | | | |
Net cash provided by (used in) investing activities | | | (490,283 | ) | | (132,094 | ) | | 14,638 | |
| | | | | | | | |
Cash flows from financing activities: | | | | | | | | | | |
Proceeds from borrowings | | | 806,500 | | | 471,250 | | | 997,412 | |
Payments on borrowings | | | (570,500 | ) | | (393,308 | ) | | (1,144,705 | ) |
Payments on capital lease obligations | | | (3,112 | ) | | (3,122 | ) | | (2,385 | ) |
Increase (decrease) in drafts payable | | | (1,912 | ) | | 5,854 | | | (5,063 | ) |
Debt refinancing costs | | | (7,155 | ) | | (3,954 | ) | | (28,561 | ) |
Distributions to non-controlling partners in the Partnership | | | (69,839 | ) | | (58,209 | ) | | (18,993 | ) |
Common dividends paid | | | (22,925 | ) | | (17,872 | ) | | (3,368 | ) |
Conversion of restricted units, net of units withheld for taxes | | | (1,030 | ) | | (1,798 | ) | | (2,659 | ) |
Conversion of restricted stock, net of shares withheld for taxes | | | (794 | ) | | (1,068 | ) | | (705 | ) |
Proceeds from issuance of Partnership units | | | 232,791 | | | — | | | 120,786 | |
Proceeds from exercise of Partnership unit options | | | 436 | | | 591 | | | 890 | |
| | | | | | | | |
Net cash provided by (used in) financing activities | | | 362,460 | | | (1,636 | ) | | (87,351 | ) |
| | | | | | | | |
Net increase (decrease) in cash and cash equivalents | | | (27,367 | ) | | 7,563 | | | 12,077 | |
Cash and cash equivalents, beginning of period | | | 30,343 | | | 22,780 | | | 10,703 | |
| | | | | | | | |
Cash and cash equivalents, end of period | | $ | 2,976 | | $ | 30,343 | | $ | 22,780 | |
| | | | | | | | |
Cash paid for interest | | $ | 81,237 | | $ | 71,950 | | $ | 66,081 | |
Cash paid (refunded) for income taxes | | $ | 1,706 | | $ | 1,104 | | $ | (33 | ) |
See accompanying notes to consolidated financial statements.
F-9
Table of Contents
CROSSTEX ENERGY, INC.
Notes to Consolidated Financial Statements
December 31, 2012 and 2011
(1) Organization and Summary of Significant Agreements
(a) Description of Business
Crosstex Energy, Inc., a Delaware corporation formed on April 28, 2000, is engaged, through its subsidiaries, in providing midstream energy services, including gathering, processing, transmission and marketing, to producers of natural gas, NGLs and crude oil. The Company also provides crude oil, condensate and brine water services to producers. The Company connects the wells of natural gas producers in its market areas to its gathering systems, processes natural gas for the removal of NGLs, fractionates NGLs into purity products and markets those products for a fee, transports natural gas and ultimately provides natural gas to a variety of markets. The Company purchases natural gas from natural gas producers and other supply sources and sells that natural gas to utilities, industrial consumers, other marketers and pipelines. The Company operates processing plants that process gas transported to the plants by major interstate pipelines or from its own gathering systems under a variety of fee arrangements. In addition, the Company purchases natural gas from producers not connected to its gathering systems for resale and sells natural gas on behalf of producers for a fee. The Company provides a variety of crude services throughout the Ohio River Valley (ORV) which include crude oil gathering via pipelines and trucks and oilfield brine disposal. The Company also has crude oil terminal facilities in south Louisiana that provide access for crude oil producers to the premium markets in this area. The Company's gas gathering systems consist of networks of pipelines that collect natural gas from points near producing wells and transport it to larger pipelines for further transmission. The Company's transmission pipelines primarily receive natural gas from its gathering systems and from third party gathering and transmission systems and deliver natural gas to industrial end-users, utilities and other pipelines. The Company's oil gathering and transmission systems consist of trucking facilities, pipelines and barges that, in exchange for a fee, transport oil from a producer site to an end user. The Company's processing plants remove NGLs and CO2 from a natural gas stream and its fractionators separate the NGLs into separate NGL products, including ethane, propane, iso-butane, normal butanes and natural gasoline.
(b) Organization
On July 12, 2002, the Company formed Crosstex Energy, L.P. (herein referred to as the Partnership or CELP), a Delaware limited partnership. Crosstex Energy GP, LLC, a wholly owned subsidiary of the Company, is the general partner of the Partnership. As of December 31, 2012, the Company owned 16,414,830 common units in the Partnership through its wholly owned subsidiary, which represented 19.7% (17.3% effective following the Partnership's January 2013 equity offerings) of the limited partner interests in the Partnership and a 1.9% (1.6% effective following the Partnership's January 2013 offerings) general partner interest. On September 13, 2012, the board of directors of the general partner amended the partnership agreement to convert the general partner's obligation to make capital contributions to the Partnership to maintain its 2% interest in connection with the issuance of additional limited interests by the Partnership to an option of the general partner to make future capital contributions to maintain its then current general partner percentage interest.
(c) Basis of Presentation
The accompanying consolidated financial statements include the assets, liabilities and results of operations of the Company and its wholly-owned subsidiaries, including the Partnership. The
F-10
Table of Contents
CROSSTEX ENERGY, INC.
Notes to Consolidated Financial Statements (Continued)
December 31, 2012 and 2011
(1) Organization and Summary of Significant Agreements (Continued)
Partnership proportionately consolidates its undivided 50.0% interest in a gas processing plant located in the Permian Basin and its undivided 64.29% interest in a gas plant located in south Louisiana. The Company also consolidates its majority interest in Crosstex DC Gathering, J.V. (CDC), until October 2012 when it acquired the remaining interest for $0.4 million. The consolidated operations are hereafter referred to collectively as the "Company." All material intercompany balances and transactions have been eliminated.
(2) Significant Accounting Policies
(a) Management's Use of Estimates
The preparation of financial statements in accordance with accounting principles generally accepted in the United States of America requires management of the Company to make estimates and assumptions that affect the reported amounts of assets and liabilities and disclosure of contingent assets and liabilities at the date of the financial statements and the reported amounts of revenues and expenses during the period. Actual results could differ from these estimates.
(b) Cash and Cash Equivalents
The Company considers all highly liquid investments with an original maturity of three months or less to be cash equivalents.
(c) Natural Gas and Natural Gas Liquids Inventory
Inventories of products consist of natural gas and NGLs. The Company reports these assets at the lower of cost or market.
(d) Property, Plant, and Equipment
Property, plant and equipment consist of intrastate gas transmission systems, gas gathering systems, NGL and crude oil pipelines, natural gas processing plants, NGL fractionation plants and brine disposal wells. Gas required to maintain pipeline minimum pressures is capitalized and classified as property, plant and equipment. Other property and equipment is primarily comprised of computer software and equipment, furniture, fixtures, leasehold improvements and office equipment. Property, plant and equipment are recorded at cost. Repairs and maintenance are charged against income when incurred. Renewals and betterments, which extend the useful life of the properties, are capitalized. Interest costs are capitalized to property, plant and equipment during the period the assets are undergoing preparation for intended use. Interest costs totaling $ 4.0 million, $0.9 million and $0.1 million were capitalized for the years ended December 31, 2012, 2011 and 2010, respectively.
F-11
Table of Contents
CROSSTEX ENERGY, INC.
Notes to Consolidated Financial Statements (Continued)
December 31, 2012 and 2011
(2) Significant Accounting Policies (Continued)
Depreciation is provided using the straight-line method based on the estimated useful life of each asset, as follows:
| | |
| | Useful Lives |
|---|
Transmission assets | | 20 - 30 years |
Gathering systems | | 15 - 20 years |
Gas processing plants | | 20 years |
Other property and equipment | | 3 - 15 years |
Depreciation expense of $98.2 million, $77.8 million and $75.7 million was recorded for the years ended December 31, 2012, 2011 and 2010, respectively. Depreciation expense also includes the amortization of assets classified as capital lease assets.
FASB ASC 360-10-05-4 requires long-lived assets to be reviewed whenever events or changes in circumstances indicate that the carrying value of such assets may not be recoverable. In order to determine whether an impairment has occurred, the Company compares the net book value of the asset to the undiscounted expected future net cash flows. If an impairment has occurred, the amount of such impairment is determined based on the expected future net cash flows discounted using a rate commensurate with the risk associated with the asset.
When determining whether impairment of one of our long-lived assets has occurred, we must estimate the undiscounted cash flows attributable to the asset. The Company's estimate of cash flows is based on assumptions regarding the purchase and resale margins on natural gas, volume of gas available to the asset, markets available to the asset, operating expenses, and future natural gas prices and NGL product prices. The amount of availability of gas to an asset is sometimes based on assumptions regarding future drilling activity, which may be dependent in part on natural gas prices. Projections of gas volumes and future commodity prices are inherently subjective and contingent upon a number of variable factors. Any significant variance in any of the above assumptions or factors could materially affect our cash flows, which could require us to record an impairment of an asset.
(e) Goodwill and Intangible Assets
The Partnership has approximately $152.6 million of goodwill at December 31, 2012 related to the acquisition of Clearfield Energy, Inc. and its wholly-owned subsidiaries (collectively, "Clearfield") in July 2012. The goodwill recognized from the Clearfield acquisition results primarily from the value of opportunity created from the strategic asset positioning in the Utica and Marcellus shale plays which provides the Partnership with a substantial growth platform in a new geographic area. The goodwill is allocated to the ORV segment. Goodwill will be assessed at least annually for impairment beginning on July1, 2013.
Intangible assets consist of customer relationships and the value of the dedicated and non-dedicated acreage attributable to pipeline, gathering and processing systems. Intangible assets associated with customer relationships are amortized on a straight-line basis over the expected period of benefits of the customer relationships, which range from three to twenty years. The intangible assets associated with dedicated and non-dedicated acreage attributable to pipeline, gathering and processing systems are being amortized using the units of throughput method of amortization.
F-12
Table of Contents
CROSSTEX ENERGY, INC.
Notes to Consolidated Financial Statements (Continued)
December 31, 2012 and 2011
(2) Significant Accounting Policies (Continued)
The following table represents the Partnership's total purchased intangible assets at years ended December 31, 2012 and 2011 (in thousands):
| | | | | | | | | | |
| | Gross
Carrying
Amount | | Accumulated
Amortization | | Net
Carrying
Amount | |
|---|
2012 | | | | | | | | | | |
Customer relationships | | $ | 292,658 | | $ | (130,458 | ) | $ | 162,200 | |
Dedicated and non-dedicated acreage | | | 395,652 | | | (132,847 | ) | | 262,805 | |
| | | | | | | | |
Total | | $ | 688,310 | | $ | (263,305 | ) | $ | 425,005 | |
| | | | | | | | |
2011 | | | | | | | | | | |
Customer relationships | | $ | 255,058 | | $ | (101,762 | ) | $ | 153,296 | |
Dedicated and non-dedicated acreage | | | 395,652 | | | (97,486 | ) | | 298,166 | |
| | | | | | | | |
Total | | $ | 650,710 | | $ | (199,248 | ) | $ | 451,462 | |
| | | | | | | | |
The weighted average amortization period for intangible assets is 18.0 years. Amortization expense for intangibles was approximately $64.1 million, $47.5 million and $35.9 million for the years ended December 31, 2012, 2011 and 2010, respectively.
The following table summarizes the Company's estimated aggregate amortization expense for the next five years (in thousands):
| | | | |
2013 | | $ | 48,156 | |
2014 | | | 45,129 | |
2015 | | | 43,319 | |
2016 | | | 43,429 | |
2017 | | | 42,375 | |
Thereafter | | | 202,597 | |
| | | | |
Total | | $ | 425,005 | |
| | | | |
(f) Investment in Limited Liability Company
On June 22, 2011, the Partnership entered into a limited liability agreement with Howard Energy Partners ("HEP") for an initial capital contribution of $35.0 million in exchange for an individual ownership interest in HEP. In 2012, the Partnership made an additional capital contribution of $52.3 million to HEP related to HEP's acquisition of substantially all of Meritage Midstream Services' natural gas gathering assets in south Texas. HEP owns midstream assets and provides midstream services to Eagle Ford Shale producers. The Partnership owns 30.6 percent of HEP and accounts for this investment under the equity method of accounting. This investment is reflected on the balance sheet as "Investment in limited liability company." The Partnership's proportional share of earnings is recorded as an increase to this investment account and recorded as equity in earnings of limited liability company.
F-13
Table of Contents
CROSSTEX ENERGY, INC.
Notes to Consolidated Financial Statements (Continued)
December 31, 2012 and 2011
(2) Significant Accounting Policies (Continued)
(g) Other Assets
Unamortized debt issuance costs totaling $26.0 million and $24.2 million as of December 31, 2012 and 2011, respectively, are included in other assets, net. Debt issuance costs are amortized into interest expense using the straight-line method over the terms of the debt.
(h) Gas Imbalance Accounting
Quantities of natural gas and NGLs over-delivered or under-delivered related to imbalance agreements are recorded monthly as receivables or payables using weighted average prices at the time of the imbalance. These imbalances are typically settled with deliveries of natural gas or NGLs. The Company had imbalance payables of $2.3 million and $2.3 million at December 31, 2012 and 2011, respectively, which approximate the fair value of these imbalances. The Company had imbalance receivables of $1.5 million and $1.7 million at December 31, 2012 and 2011, respectively, which are carried at the lower of cost or market value.
(i) Asset Retirement Obligations
FASB ASC 410-20-25-16 was issued in March 2005, which became effective at December 31, 2005. FASB ASC 410-20-25-16 clarifies that the term "conditional asset retirement obligation" as used in FASB ASC 410-20, refers to a legal obligation to perform an asset retirement activity in which the timing and/or method of settlement are conditional on a future event that may or may not be within the control of the entity. Since the obligation to perform the asset retirement activity is unconditional, FASB ASC 410-20-25-16 provides that a liability for the fair value of a conditional asset retirement activity should be recognized if that fair value can be reasonably estimated, even though uncertainty exists about the timing and/or method of settlement. FASB ASC 410-20-25-16 also clarifies when an entity would have sufficient information to reasonably estimate the fair value of an asset retirement obligation under FASB ASC 410-20. The Company provided an asset retirement obligation of $0.5 million as of December 31, 2012 related to the discontinued use of the Sabine Pass plant. The Company did not provide any asset retirement obligations as of 2011 because it did not have sufficient information as set forth in FASB ASC 410-20-25-16 to reasonably estimate such obligations, and the Company had no intention of discontinuing use of any significant assets. See Note 2 "Acquisition, Disposition, and Impairments" for further discussion of the Sabine Pass plant.
(j) Revenue Recognition
The Company recognizes revenue for sales or services at the time the natural gas, NGLs or crude oil are delivered or at the time the service is performed. The Company generally accrues one month of sales and the related gas purchases and reverses these accruals when the sales and purchases are actually invoiced and recorded in the subsequent months. Actual results could differ from the accrual estimates. Purchase and sale arrangements are generally reported in revenues and costs on a gross basis in the consolidated statement of operations in accordance with FASB ASC 605-45-45-1. Except for fee based arrangements, the Partnership acts as the principal in these purchase and sale transactions, has the risk and reward of ownership as evidenced by title transfer, schedules the transportation and assumes credit risk. The Partnership conducts "off-system" gas marketing operations as a service to producers on systems that it does not own. It refers to these activities as part of energy trading
F-14
Table of Contents
CROSSTEX ENERGY, INC.
Notes to Consolidated Financial Statements (Continued)
December 31, 2012 and 2011
(2) Significant Accounting Policies (Continued)
activities. In some cases, the Partnership earns an agency fee from the producer for arranging the marketing of the producer's natural gas. In other cases, the Partnership purchases the natural gas from the producer and enters into a sales contract with another party to sell the natural gas. The revenue and cost of sales for these activities are included in revenue on a net basis in the consolidated statement of operations.
The Company accounts for taxes collected from customers attributable to revenue transactions and remitted to government authorities on a net basis (excluded from revenues).
(k) Derivatives
The Partnership uses derivatives to hedge against changes in cash flows related to product price, as opposed to their use for trading purposes. FASB ASC 815 requires that all derivatives be recorded on the balance sheet at fair value. It generally determines the fair value of futures contracts and swap contracts based on the difference between the derivative's fixed contract price and the underlying market price at the determination date. The asset or liability related to the derivative instruments is recorded on the balance sheet in fair value of derivative assets or liabilities.
Realized and unrealized gains and losses on commodity related derivatives that are not designated as hedges, as well as the ineffective portion of hedge derivatives, are recorded as gain or loss on derivatives in the consolidated statement of operations. Realized and unrealized gains and losses on interest rate derivatives that are not designated as hedges are included in interest expense in the consolidated statement of operations. Unrealized gains and losses on effective cash flow hedge derivatives are recorded as a component of accumulated other comprehensive income. When the hedged transaction occurs, the realized gain or loss on the hedge derivative is transferred from accumulated other comprehensive income to earnings. Realized gains and losses on commodity hedge derivatives are recognized in revenues, and realized gains and losses on interest hedge derivatives are recorded as adjustments to interest expense. Settlements of derivatives are included in cash flows from operating activities.
(l) Comprehensive Income (Loss)
Comprehensive income includes net income (loss) and other comprehensive income, which includes unrealized gains and losses on derivative financial instruments. Pursuant to FASB ASC 815, the Company records deferred hedge gains and losses on its derivative financial instruments that qualify as cash flow hedges as other comprehensive income.
(m) Legal Costs Expected to be Incurred in Connection with a Loss Contingency
Legal costs incurred in connection with a loss contingency are expensed as incurred.
(n) Concentrations of Credit Risk
Financial instruments, which potentially subject the Partnership to concentrations of credit risk, consist primarily of trade accounts receivable and derivative financial instruments. Management believes the risk is limited since the Partnership's customers represent a broad and diverse group of energy marketers and end users. In addition, the Partnership continually monitors and reviews credit exposure
F-15
Table of Contents
CROSSTEX ENERGY, INC.
Notes to Consolidated Financial Statements (Continued)
December 31, 2012 and 2011
(2) Significant Accounting Policies (Continued)
to its marketing counter-parties and letters of credit or other appropriate security are obtained as considered necessary to limit the risk of loss. The Partnership's records reserves for uncollectible accounts on a specific identification basis since there is not a large volume of late paying customers. The Partnership had a reserve for uncollectible receivables as of December 31, 2012, 2011 and 2010 of $0.5 million, $0.4 million and $0.2 million, respectively.
During the years ended December 31, 2012 and 2011, the Partnership had only one customer that represented greater than 10.0% individually of its revenue. The customer is located in the LIG segment and represented 10.5% and 12.3% of the consolidated revenue for each of the years ended December 31, 2012 and 2011, respectively. During the year ended December 31, 2010, three customers accounted for 14.5%, 10.6%, and 10.2% of consolidated revenue. As the Partnership continues to grow and expand, the relationship between individual customer sales and consolidated total sales is expected to continue to change. While these customers represent a significant percentage of revenues, the loss of these customers would not have a material adverse impact on the Partnership's results of operations because the gross operating margin received from transactions with these customers are not material to the Partnership's gross operating margin.
(o) Environmental Costs
Environmental expenditures are expensed or capitalized as appropriate, depending on the nature of the expenditures and their future economic benefit. Expenditures that related to an existing condition caused by past operations that do not contribute to current or future revenue generation are expensed. Liabilities for these expenditures are recorded on an undiscounted basis (or a discounted basis when the obligation can be settled at fixed and determinable amounts) when environmental assessments or clean-ups are probable and the costs can be reasonably estimated. For the years ended December 31, 2012, 2011 and 2010, such expenditures were not significant.
(p) Share-Based Awards
The Company recognizes compensation cost related to all stock-based awards, including stock options, in its consolidated financial statements in accordance with FASB ASC 718. The Partnership and CEI each have similar unit or share-based payment plans for employees, which are described below. Share-based compensation associated with CEI's share-based compensation plans awarded to officers and employees of the general partner of the Partnership are recorded by the Partnership since
F-16
Table of Contents
CROSSTEX ENERGY, INC.
Notes to Consolidated Financial Statements (Continued)
December 31, 2012 and 2011
(2) Significant Accounting Policies (Continued)
CEI has no operating activities other than its interest in the Partnership. Amounts recognized in the consolidated financial statements with respect to these plans are as follows (in thousands):
| | | | | | | | | | |
| | Years Ended December 31, | |
|---|
| | 2012 | | 2011 | | 2010 | |
|---|
Cost of share-based compensation charged to general and administrative expense | | $ | 8,240 | | $ | 6,405 | | $ | 8,246 | |
Cost of share-based compensation charged to operating expense | | | 1,243 | | | 1,151 | | | 1,323 | |
| | | | | | | | |
Total amount charged to income | | $ | 9,483 | | $ | 7,556 | | $ | 9,569 | |
| | | | | | | | |
Interest of non-controlling partners in share-based compensation | | $ | 3,813 | | $ | 3,052 | | $ | 3,900 | |
| | | | | | | | |
Amount of related income tax benefit recognized in income | | $ | 2,102 | | $ | 1,670 | | $ | 2,038 | |
| | | | | | | | |
The fair value of each option is estimated on the date of grant using the Black Scholes option-pricing model as disclosed in Note 9—Employee Incentive Plans.
(q) Recent Accounting Pronouncements
We have reviewed recently issued accounting pronouncements that became effective during the year ended December 31, 2012, and have determined that none would have a material impact on our Consolidated Financial Statements.
(3) Public Offering of Units by CELP and Certain Provisions of the Partnership Agreement
(a) Issuance of Preferred Units
On January 19, 2010, the Partnership issued approximately $125.0 million of Series A Convertible Preferred Units (the "preferred units") to an affiliate of Blackstone/GSO Capital Solutions for net proceeds of $120.8 million. The general partner of the Partnership made a contribution of $2.6 million in connection with the issuance to maintain its 2% general partner interest. The 14,705,882 preferred units are convertible by the holders thereof at any time into common units on a one-for-one basis, subject to certain adjustments in the event of certain dilutive issuances of common units. The Partnership has the right to force conversion of the preferred units beginning on the business day following the distribution for the quarter ending December 31, 2013 if (i) the daily volume-weighted average trading price of the common units is greater than $12.75 per unit for 20 out of the trailing 30 trading days ending on two trading days before the date on which the Partnership delivers notice of such conversion, and (ii) the average daily trading volume of common units must have exceeded 250,000 common units for 20 out of the trailing 30 trading days ending on two trading days before the date on which the Partnership delivers notice of such conversion. The preferred units are not redeemable, but are entitled to a quarterly distribution that will be the greater of $0.2125 per unit or the amount of the quarterly distribution per unit paid to common unitholders, subject to certain adjustments. During 2012 and 2011, the Partnership paid distributions on its preferred units of
F-17
Table of Contents
CROSSTEX ENERGY, INC.
Notes to Consolidated Financial Statements (Continued)
December 31, 2012 and 2011
(3) Public Offering of Units by CELP and Certain Provisions of the Partnership Agreement (Continued)
$14.4 million and $17.2 million, respectively. The distribution for the three months ended September 30, 2012 was paid-in-kind through the issuance of 366,000 preferred units. A distribution on the preferred units of $0.33 per unit was declared for the three months ended December 31, 2012 and was paid-in-kind.
On September 13, 2012, the board of directors of Crosstex Energy GP, LLC amended the Partnership's partnership agreement to amend certain terms and conditions of the preferred units, including, among other corresponding modifications, the following amendments:
- •
- Distributions Paid-In-Kind (PIK): for each quarter through the quarter ending December 31, 2013 (the "PIK Period"), the Partnership will pay distributions in-kind on the Preferred Units ("PIK Preferred Units") without penalty and without affecting the Partnership's ability to pay cash distributions on the common units.
- •
- PIK Preferred Unit Price: during the PIK Period, the fixed price used to determine the number of PIK Preferred Units to be paid instead of cash distributions will increase from $8.50 per Preferred Unit to $13.25 per Preferred Unit.
- •
- Optional Redemption: the existing right of the holders of Preferred Units to convert the Preferred Units into common units was modified so that such right may not be exercised until the earlier of (i) the business day following the record date for the distribution for the quarter ending December 31, 2013 and (ii) February 10, 2014.
- •
- Mandatory Redemption: the right of the Partnership to convert the Preferred Units into common units on January 19, 2013 was modified so that such right may not be exercised until the business day following the distribution for the quarter ending December 31, 2013 (subject to the satisfaction of the existing conditions applicable to such right).
(b) Issuance of Partnership Equity
On May 15, 2012, the Partnership issued 10,120,000 common units representing limited partner interests in the Partnership at a public offering price of $16.28 per unit for net proceeds of $158.0 million. In addition, Crosstex Energy GP, LLC made a general partner contribution of $3.4 million in connection with the issuance to maintain its 2% general partner interest. The net proceeds from the common units offering were used for general partnership purposes.
On September 14, 2012, the Partnership issued 5,660,378 common units representing limited partner interests in the Partnership at an offering price of $13.25 per unit for net proceeds of $74.8 million. The net proceeds from the common units issuance were used primarily to fund the Partnership's currently identified projects, including the Cajun-Sibon NGL pipeline expansion, and for general partnership purposes. Crosstex Energy GP, LLC did not exercise its option to make a general partner contribution to maintain its then current general partner percentage interest in connection with this offering.
F-18
Table of Contents
CROSSTEX ENERGY, INC.
Notes to Consolidated Financial Statements (Continued)
December 31, 2012 and 2011
(3) Public Offering of Units by CELP and Certain Provisions of the Partnership Agreement (Continued)
On January 14, 2013, the Partnership issued 8,625,000 common units representing limited partner interests in the Partnership at a public offering price of $15.15 per common unit for net proceeds of $125.5 million. Concurrent with the public offering, the Partnership issued 2,700,000 common units representing limited partner interest in the Partnership at an offering price of $14.55 per unit for net proceeds of $39.3 million. The net proceeds from both common unit offerings will be used for capital expenditures for currently identified projects, including the Cajun-Sibon natural gas liquids pipeline extension, and for general partnership purposes. Crosstex Energy GP, LLC did not exercise its option to make a general partner contribution to maintain its then current general partner percentage interest in connection with this offering.
The Company reflects changes in its ownership interest in the Partnership as equity transactions. The carrying amount of the non-controlling interest is adjusted to reflect the change in the Company's ownership interest in the Partnership. Any difference between the fair value of the consideration received and the amount by which the non-controlling interest is adjusted is recognized in additional paid-in-capital. The Company's book carrying amount per Partnership unit was below the price per unit received by the Partnership for its May 2012 and September 2012 sales of common units resulting in changes in equity of $12.3 million and $3.6 million, respectively. The changes were recorded as an increase in additional paid-in-capital and a reduction in non-controlling interest during the period ended December 31, 2012. The Company also reduced its deferred tax liability in the amount of $5.1 million and $6.0 million, respectively, relating to the difference between its book and tax investment in the Partnership with the offset to additional paid-in-capital.
(c) Cash Distributions
Unless restricted by the terms of the Partnership's credit facility and/or senior unsecured note indentures, the Partnership must make distributions of 100% of available cash, as defined in the partnership agreement, within 45 days following the end of each quarter. As described under(a) Issuance of Preferred Units above, the preferred units are entitled to a quarterly distribution equal to the greater of $0.2125 per unit or the amount of the quarterly distribution per unit paid to common unitholders, subject to certain adjustments. The general partner is not entitled to a distribution in relation to its percentage interest with respect to the quarterly preferred distribution of $0.2125 per unit that is made solely to the preferred unitholders. The general partner is entitled to a distribution in relation to its percentage interest with respect to all distributions made to common unitholders. If the distributions are in excess of $0.2125 per unit, distributions are made 100% to the common and preferred unitholders minus the general partner's percentage interest, subject to the payment of incentive distributions as described below to the extent that certain target levels of cash distributions are achieved.
Under the quarterly incentive distribution provisions, generally the Partnership's general partner is entitled to 13% of amounts the Partnership distributes in excess of $0.25 per unit, 23% of the amounts the Partnership distributes in excess of $0.3125 per unit and 48% of amounts the Partnership distributes distribute in excess of $0.375 per unit. Incentive distributions totaling $4.5 million, $2.4 million and $0.1 million were earned by our general partner for the years ended 2012, 2011 and 2010, respectively.
F-19
Table of Contents
CROSSTEX ENERGY, INC.
Notes to Consolidated Financial Statements (Continued)
December 31, 2012 and 2011
(3) Public Offering of Units by CELP and Certain Provisions of the Partnership Agreement (Continued)
The Partnership paid annual distributions per common unit of $1.31, $1.17 and $0.25 in the years ended December 31, 2012, 2011 and 2010, respectively.
The Partnership's fourth quarter distribution on its common units is $0.33 per unit which was paid February 14, 2013.
(d) Allocation of Partnership Income
Net income is allocated to Crosstex Energy GP, LLC, a wholly-owned subsidiary of the Company, as the Partnership's general partner in an amount equal to its incentive distributions as described in Note 3(c) above. The general partner's share of the Partnership's net income is reduced by stock-based compensation expense attributed to the Company's stock options and restricted stock awarded to officers and employees of the Partnership. The remaining net income after incentive distributions and Company-related stock-based compensation is allocated pro rata between a relational interest percentage of the general partner interest, the subordinated units (excluding senior subordinated units), and the common units. The following table reflects the Company's general partner share of the Partnership's net income (in thousands):
| | | | | | | | | | |
| | Years Ended December 31, | |
|---|
| | 2012 | | 2011 | | 2010 | |
|---|
Income allocation for incentive distributions | | $ | 4,489 | | $ | 2,372 | | $ | 99 | |
Stock-based compensation attributable to CEI's stock options and restricted shares | | | (4,205 | ) | | (3,119 | ) | | (3,906 | ) |
General partner interest in net loss | | | (818 | ) | | 15 | | | (564 | ) |
| | | | | | | | |
General partner share of net loss | | $ | (534 | ) | $ | (732 | ) | $ | (4,371 | ) |
| | | | | | | | |
The Company also owns limited partner common units. The Company's share of the Partnership's net income attributable to its limited partner common units was net loss of $15.5 million, $6.4 million and $11.6 million for the years ended December 31, 2012, 2011 and 2010, respectively.
(4) Acquisition, Disposition and Impairments
(a) Acquisition
On July 2, 2012, the Partnership, through a wholly-owned subsidiary, acquired all of the issued and outstanding common stock of Clearfield Energy, Inc. and Clearfield Energy's wholly owned subsidiaries (collectively, "Clearfield"). Clearfield is a well-established crude oil, condensate and water services company with operations in Ohio, Kentucky and West Virginia. Clearfield's business includes crude oil pipelines, a barge loading terminal on the Ohio River, a rail loading terminal on the Ohio Central Railroad network, a trucking fleet and brine disposal wells. All of these assets are now included in the Partnership's ORV segment.
The Partnership paid approximately $215.0 million in cash (before working capital and certain purchase price adjustments) for the acquisition and the purchase was funded with proceeds from the senior notes offering in May 2012.
F-20
Table of Contents
CROSSTEX ENERGY, INC.
Notes to Consolidated Financial Statements (Continued)
December 31, 2012 and 2011
(4) Acquisition, Disposition and Impairments (Continued)
Included in the Clearfield acquisition were three local distribution companies, or LDCs, which the Partnership marketed for sale and were classified as held for disposition on the balance sheet as of December 31, 2012. The Partnership chose not to apply discontinued operations presentation on the income statement as the related amounts are immaterial during the period of the Partnership's ownership. On October 15, 2012, the Partnership entered into an agreement to sell the LDCs for an amount of $19.5 million, and the sale was completed on January 18, 2013. The assets held for disposition net of liabilities assumed are recorded at the sales price of $19.5 million.
The goodwill recognized from the Clearfield acquisition results primarily from the value of opportunity created from the strategic asset positioning in the Utica and Marcellus shale plays which provides the Partnership with a substantial growth platform in a new geographic area.
The Partnership recognized intangible assets related to customer relationships. The acquired intangible assets will be amortized on a straight-line basis over the estimated customer contract life of approximately 20 years.
The Partnership assumed a long-term liability related to additional benefit obligations. Also, the Partnership assumed a long-term liability related to inactive easement commitments for a period of 10 years.
Purchase Price Allocation in Clearfield Acquisition
Based on currently available information, the following table is a summary of the consideration paid for the Clearfield acquisition and the preliminary purchase price allocation for the fair value of the assets acquired and liabilities assumed at the acquisition date, subject to revision pending finalization of closing adjustments and the sale of the LDC assets:
| | | | |
Purchase Price Allocation (in thousands): | |
| |
|---|
Purchase Price to Clearfield Energy, Inc. | | $ | 214,957 | |
| | | | |
Total purchase price | | $ | 214,957 | |
| | | | |
Assets acquired: | | | | |
Current assets | | $ | 17,622 | |
Assets held for disposition | | | 19,500 | |
Property, plant, and equipment | | | 89,752 | |
Goodwill | | | 152,627 | |
Intangibles | | | 37,600 | |
Liabilities assumed: | | | | |
Current liabilities | | | (24,784 | ) |
Liabilities held for disposition | | | (2,627 | ) |
Deferred taxes | | | (65,228 | ) |
Long term liabilities | | | (9,505 | ) |
| | | | |
Total purchase price | | $ | 214,957 | |
| | | | |
For the period from July 2, 2012 to December 31, 2012, the Partnership recognized $108.0 million of midstream revenue related to properties acquired in the Clearfield acquisition. For the period from
F-21
Table of Contents
CROSSTEX ENERGY, INC.
Notes to Consolidated Financial Statements (Continued)
December 31, 2012 and 2011
(4) Acquisition, Disposition and Impairments (Continued)
July 2, 2012 to December 31, 2012, the Partnership recognized $94.2 million of operating costs and expenses related to properties acquired in the Clearfield acquisition.
Pro Forma Information
The following unaudited pro forma condensed financial data for the year ended December 31, 2012 and 2011 gives effect to the Clearfield acquisition as if it had occurred on January 1, 2011. The unaudited pro forma condensed financial information has been included for comparative purposes only and is not necessarily indicative of the results that might have occurred had the transactions taken place on the dates indicated and is not intended to be a projection of future results.
| | | | | | | |
| | Year Ended | |
|---|
| | December 31,
2012 | | December 31,
2011 | |
|---|
| | (in thousands except
for per unit data)
| |
|---|
Pro forma total revenues | | $ | 1,761,762 | | $ | 2,266,868 | |
Pro forma net loss | | $ | (39,021 | ) | $ | (15,476 | ) |
Pro forma net loss attributable to Crosstex Energy, Inc. | | $ | (14,762 | ) | $ | (8,460 | ) |
Pro forma net loss per common unit: | | | | | | | |
Basic and Diluted | | $ | (0.30 | ) | $ | (0.18 | ) |
(b) Other Disposition
The Partnership disposed of assets that were not considered discontinued operations in the year ended December 31, 2010. The 2010 disposition was related to assets in east Texas for a gain of $14.0 million.
(c) Long-Lived Assets Impairments
Impairments of $1.3 million were recorded in the year ended December 31, 2010 related to long-lived assets. The impairment in 2010 primarily relates to the write down of certain excess pipe inventory prior to its sale.
The Partnership's Sabine Pass plant held a contract with a third-party to fractionate the raw-make NGLs produced by the Sabine Pass plant. The primary term of the contract expired in March 2012 and was renewed on a month-to-month basis. Due to the anticipated termination of this third-party fractionation agreement in early 2013, the Partnership began accelerating depreciation of this facility during the third quarter of 2012. The plant also had some equipment failures during the fourth quarter of 2012. In January 2013, the Partnership ceased plant operations because the cost to repair the equipment could not be supported by an existing month-to-month fractionation agreement. Depreciation and amortization expense during the fourth quarter 2012 was changed to accelerate the remaining non-recoverable costs associated with the plant. Total depreciation and amortization of $28.9 million was recognized for the Sabine Pass plant during 2012. The Sabine Pass plant contributed gross operating margin of $2.0 million and $2.7 million for the years ended December 31, 2012 and
F-22
Table of Contents
CROSSTEX ENERGY, INC.
Notes to Consolidated Financial Statements (Continued)
December 31, 2012 and 2011
(4) Acquisition, Disposition and Impairments (Continued)
2011, respectively. The net book value for the plant is $20.0 million as of December 31, 2012 and represents the plant's fair market value. Although the Partnership does not have specific plans at this time to relocate the Sabine Pass plant, the Partnership may utilize it elsewhere in its operations.
(5) Long-Term Debt
As of December 31, 2012 and 2011, long-term debt consisted of the following (in thousands):
| | | | | | | |
| | 2012 | | 2011 | |
|---|
Bank credit facility (due 2016), interest based on Prime and/or LIBOR plus an applicable margin, interest rate at December 31, 2012 and December 31, 2011 was 4.3% and 2.9%, respectively | | $ | 71,000 | | $ | 85,000 | |
Senior unsecured notes (due 2018), net of discount of $9.7 million and $11.6 million, respectively, which bear interest at the rate of 8.875% | | | 715,305 | | | 713,409 | |
Senior unsecured notes (due 2022), which bear interest at the rate of 7.125% | | | 250,000 | | | — | |
| | | | | | |
Debt classified as long-term | | $ | 1,036,305 | | $ | 798,409 | |
| | | | | | |
Maturities. Maturities for the long-term debt as of December 31, 2012 are as follows (in thousands):
| | | | |
2013 | | | — | |
2014 | | | — | |
2015 | | | — | |
2016 | | $ | 71,000 | |
2017 | | | — | |
Thereafter | | | 975,000 | |
| | | | |
Subtotal | | | 1,046,000 | |
Less discount | | | (9,695 | ) |
| | | | |
Total outstanding debt | | $ | 1,036,305 | |
| | | | |
Credit Facility. In January 2012, the Partnership amended its credit facility to increase the Partnership's borrowing capacity from $485.0 million to $635.0 million and amend certain terms under the facility to provide additional financial flexibility during the remaining four-year term of the facility.
The Partnership amended the credit facility again in May 2012. This amendment, among other things, increased the maximum permitted consolidated leverage ratio (as defined in the amended credit facility, being generally computed as the ratio of total funded debt to consolidated earnings before interest, taxes, depreciation, amortization and certain other non-cash charges) during the Clearfield acquisition period (as defined in the amended credit facility, being generally the four quarterly measurement periods after closing the Clearfield acquisition) from 5.0 to 1.0 to 5.5 to 1.0.
In August 2012, the Partnership amended the credit facility to include projected EBITDA from material projects (as defined in the amendment, but generally being the construction or expansion of any capital project by the Partnership or any of its subsidiaries that is expected to cost more than
F-23
Table of Contents
CROSSTEX ENERGY, INC.
Notes to Consolidated Financial Statements (Continued)
December 31, 2012 and 2011
(5) Long-Term Debt (Continued)
$20.0 million and the Partnership's "Riverside Phase II" project) in its EBITDA for purposes of calculating compliance with the amended credit agreement's minimum interest coverage ratio, maximum leverage ratio and maximum senior leverage ratio. The amount of projected EBITDA from material projects that is included in such financial covenant calculations is subject to the approval of Bank of America, N.A. (the "Administrative Agent"), and it will be based on contracts related to the material project, expected expenses, the completion percentage of the material project, the expected commercial operation date of the material project, and other factors deemed appropriate by the Administrative Agent. The aggregate amount of all material project EBITDA adjustments during any period shall be limited to 15% of the total actual consolidated EBITDA for such period (which total actual consolidated EBITDA shall be determined without including any material project EBITDA adjustments).
In January 2013, the Partnership amended the credit facility to, among other things, (i) decrease the minimum consolidated interest coverage ratio (as defined in the amended credit agreement, being generally computed as the ratio of consolidated earnings before interest, taxes, depreciation, amortization and certain other non-cash charges to consolidated interest charges) to 2.25 to 1.0 for the fiscal quarters ending September 30, 2013 and December 31, 2013, with a minimum ratio of 2.50 to 1.0 for each fiscal quarter ending thereafter, (ii) increase the maximum permitted consolidated leverage ratio (as defined in the amended credit agreement, being generally computed as the ratio of total funded debt to consolidated earnings before interest, taxes, depreciation, amortization and certain other non-cash charges) to 5.50 to 1.0 for each fiscal quarter ending on or prior to December 31, 2013, with a maximum ratio of 5.25 to 1.0 for each fiscal quarter ending thereafter, and (iii) eliminate the existing and any future step-up in the maximum permitted consolidated leverage ratio for acquisitions.
As of December 31, 2012, there was $71.0 million of borrowing and $62.2 million in outstanding letters of credit, under the bank credit facility leaving approximately $501.8 million available for future borrowing based on a borrowing capacity of $635.0 million. However, the financial covenants in the amended credit facility limit the amount of funds that we can borrow. As of December 31, 2012, based on the financial covenants in the amended credit facility, we could borrow approximately $334.6 million of additional funds.
The credit facility is guaranteed by substantially all of our subsidiaries and is secured by first priority liens on substantially all of our assets and those of the guarantors, including all material pipeline, gas gathering and processing assets, all material working capital assets and a pledge of all of our equity interests in substantially all of our subsidiaries.
We may prepay all loans under the credit facility at any time without premium or penalty (other than customary LIBOR breakage costs), subject to certain notice requirements. The credit facility requires mandatory prepayments of amounts outstanding thereunder with the net proceeds of certain asset sales, extraordinary receipts, equity issuances and debt incurrences, but these mandatory prepayments do not require any reduction of the lenders' commitments under the credit facility.
Under the amended credit facility, borrowings bear interest at our option at the Eurodollar Rate (the British Bankers Association LIBOR Rate) plus an applicable margin or the Base Rate (the highest of the Federal Funds Rate plus 0.50%, the 30-day Eurodollar Rate plus 1.0%, or the administrative agent's prime rate) plus an applicable margin. We pay a per annum fee (as described below) on all
F-24
Table of Contents
CROSSTEX ENERGY, INC.
Notes to Consolidated Financial Statements (Continued)
December 31, 2012 and 2011
(5) Long-Term Debt (Continued)
letters of credit issued under the amended credit facility and a commitment fee of between 0.375% and 0.50% per annum on the unused availability under the amended credit facility. The commitment fee, letter of credit fee and the applicable margins for the interest rate vary quarterly based on our leverage ratio (as defined in the credit facility, being generally computed as the ratio of total funded debt to consolidated earnings before interest, taxes, depreciation, amortization and certain other non-cash charges) and are as follows:
| | | | | | | | | | |
Leverage Ratio | | Base
Rate
Loans | | Eurodollar Rate
Loans and
Letter of
Credit Fees | | Letter of
Commitment
Fees | |
|---|
Greater than or equal to 4.50 to 1.00 | | | 2.00 | % | | 3.00 | % | | 0.50 | % |
Greater than or equal to 4.00 to 1.00 and less than 4.50 to 1.00 | | | 1.75 | % | | 2.75 | % | | 0.50 | % |
Greater than or equal to 3.50 to 1.00 and less than 4.00 to 1.00 | | | 1.50 | % | | 2.50 | % | | 0.50 | % |
Greater than or equal to 3.00 to 1.00 and less than 3.50 to 1.00 | | | 1.25 | % | | 2.25 | % | | 0.50 | % |
Less than 3.00 to 1.00 | | | 1.00 | % | | 2.00 | % | | 0.38 | % |
The amended credit facility includes financial covenants that are tested on a quarterly basis, based on the rolling four-quarter period that ends on the last day of each fiscal quarter. The maximum permitted leverage ratio (as defined in the credit facility, but generally computed as the ratio of total funded debt to consolidated earnings before interest, taxes, depreciation, amortization and certain other non-cash charges) is 5.50 to 1.00 for the fiscal quarters ending on or before December 31, 2013 with a maximum ratio of 5.25 to 1.00 for each fiscal quarter thereafter. The maximum permitted senior leverage ratio (as defined in the credit facility, but generally computed as the ratio of total secured funded debt to consolidated earnings before interest, taxes, depreciation, amortization and certain other non cash charges) is 2.75 to 1.00. The minimum consolidated interest coverage ratio (as defined in the credit facility, but generally computed as the ratio of consolidated earnings before interest, taxes, depreciation, amortization and certain other non-cash charges to consolidated interest charges) is 2.25 to 1.00 for the fiscal quarters ending on or before December 31, 2013, with a minimum ratio of 2.50 to 1.0 for each fiscal quarter ending thereafter.
In addition, the credit facility contains various covenants that, among other restrictions, limit the Partnerhship's ability to:
- •
- grant or assume liens;
- •
- make investments;
- •
- incur or assume indebtedness;
- •
- engage in mergers or acquisitions;
- •
- sell, transfer, assign or convey assets;
- •
- repurchase the Partnership's equity, make distributions and certain other restricted payments;
- •
- change the nature of the Partnership's business;
- •
- engage in transactions with affiliates;
F-25
Table of Contents
CROSSTEX ENERGY, INC.
Notes to Consolidated Financial Statements (Continued)
December 31, 2012 and 2011
(5) Long-Term Debt (Continued)
- •
- enter into certain burdensome agreements;
- •
- make certain amendments to the omnibus agreement or the Partnership's subsidiaries' organizational documents;
- •
- prepay the senior unsecured notes and certain other indebtedness; and
- •
- enter into certain hedging contracts.
The credit facility permits the Partnership to make quarterly distributions to unitholders so long as no default exists under the credit facility.
Each of the following is an event of default under the credit facility:
- •
- failure to pay any principal, interest, fees, expenses or other amounts when due;
- •
- failure to meet the quarterly financial covenants;
- •
- failure to observe any other agreement, obligation, or covenant in the credit facility or any related loan document, subject to cure periods for certain failures;
- •
- the failure of any representation or warranty to be materially true and correct when made;
- •
- The Partnership's or any of its subsidiaries default under other indebtedness that exceeds a threshold amount;
- •
- judgments against the Partnership or any of its material subsidiaries, in excess of a threshold amount;
- •
- certain ERISA events involving the Partnership or any of its material subsidiaries, in excess of a threshold amount;
- •
- bankruptcy or other insolvency events involving the Partnership or any of its material subsidiaries; and
- •
- a change in control (as defined in the credit facility).
If an event of default relating to bankruptcy or other insolvency events occurs, all indebtedness under the credit facility will immediately become due and payable. If any other event of default exists under the credit facility, the lenders may accelerate the maturity of the obligations outstanding under the credit facility and exercise other rights and remedies. In addition, if any event of default exists under the credit facility, the lenders may commence foreclosure or other actions against the collateral.
If any default occurs under the credit facility, or if the Partnership is unable to make any of the representations and warranties in the credit facility, the Partnership will be unable to borrow funds or have letters of credit issued under the credit facility.
The Partnership expects to be in compliance with the covenants in the credit facility for at least the next twelve months.
Senior Unsecured Notes. On February 10, 2010, the Partnership and Crosstex Energy Finance Corporation issued $725.0 million in aggregate principal amount of 8.875% senior unsecured notes (the "2018 Notes") due on February 15, 2018 at an issue price of 97.907% to yield 9.25% to maturity
F-26
Table of Contents
CROSSTEX ENERGY, INC.
Notes to Consolidated Financial Statements (Continued)
December 31, 2012 and 2011
(5) Long-Term Debt (Continued)
including the original issue discount (OID). Net proceeds from the sale of the notes of $689.7 million (net of transaction costs and OID), together with borrowings under the credit facility discussed above, were used to repay in full amounts outstanding under the prior bank credit facility and senior secured notes and to pay related fees, costs and expenses, including the settlement of interest rate swaps associated with the prior credit facility. Interest payments on the notes are due semi-annually in arrears in February and August.
On May 24, 2012, the Partnership and Crosstex Energy Finance Corporation issued $250.0 million in aggregate principal amount of 7.125% senior unsecured notes (the "2022 Notes" and together with the 2018 Notes, the "Senior Notes") due on June 1, 2022 at an issue price of 100% of the principal amount to yield 7.125% to maturity. The interest payments are due semi-annually in arrears in June and December. Net proceeds from the sale of the notes of $245.1 million (net of transaction costs) were used to fund the Clearfield acquisition and for general partnership purposes, including capital expenditures for the Cajun-Sibon NGLs pipeline expansion.
The indentures governing the Senior Notes contain covenants that, among other things, limit the Partnership's ability and the ability of certain of its subsidiaries to:
- •
- sell assets including equity interests in its subsidiaries;
- •
- pay distributions on, redeem or repurchase units or redeem or repurchase its subordinated debt (as discussed in more detail below);
- •
- make investments;
- •
- incur or guarantee additional indebtedness or issue preferred units;
- •
- create or incur certain liens;
- •
- enter into agreements that restrict distributions or other payments from its restricted subsidiaries to the Partnership;
- •
- consolidate, merge or transfer all or substantially all of its assets;
- •
- engage in transactions with affiliates;
- •
- create unrestricted subsidiaries;
- •
- enter into sale and leaseback transactions; or
- •
- engage in certain business activities.
The indentures provide that if the Partnership's fixed charge coverage ratio (the ratio of consolidated cash flow to fixed charges, which generally represents the ratio of adjusted EBITDA to interest charges with further adjustments as defined per the indenture) for the most recently ended four full fiscal quarters is not less than 2.00 to 1.0, the Partnership will be permitted to pay distributions to its unitholders in an amount equal to available cash from operating surplus (each as defined in our partnership agreement) with respect to its preceding fiscal quarter plus a number of items, including the net cash proceeds received by the Partnership as a capital contribution or from the issuance of equity interests since the date of the indenture, to the extent not previously expended. If the Partnership's fixed charge coverage ratio is less than 2.00 to 1.0, the Partnership will be able to pay
F-27
Table of Contents
CROSSTEX ENERGY, INC.
Notes to Consolidated Financial Statements (Continued)
December 31, 2012 and 2011
(5) Long-Term Debt (Continued)
distributions to its unitholders in an amount equal to a specified basket (less amounts previously expended pursuant to such basket), plus the same number of items discussed in the preceding sentence to the extent not previously expended. The Partnership was in compliance with this covenant as of December 31, 2012.
If the Senior Notes achieve an investment grade rating from each of Moody's Investors Service, Inc. and Standard & Poor's Ratings Services, many of the covenants discussed above will terminate. Our current ratings on our bonds from Moody's Investors Service, Inc. and Standard & Poor's Rating Services are B2 and B+, respectively.
Prior to February 15, 2014, the Partnership may redeem the 2018 Notes, in whole or in part, at a "make-whole" redemption price. On or after February 15, 2014, the Partnership may redeem all or a part of the notes at redemption prices (expressed as percentages of principal amount) equal to 104.438% for the twelve-month period beginning on February 15, 2014, 102.219% for the twelve-month period beginning February 15, 2015 and 100.00% for the twelve-month period beginning on February 15, 2016 and at any time thereafter, plus accrued and unpaid interest, if any, to the applicable redemption date on the notes.
The Partnership may redeem up to 35% of the 2022 Notes at any time prior to June 1, 2015 in an amount not greater than the cash proceeds from equity offerings at a redemption price of 107.125% of the principal amount of the 2022 Notes (plus accrued and unpaid interest to the redemption date) provided that:
- •
- at least 65% of the aggregate principal amount of the 2022 Notes remains outstanding immediately after the occurrence of such redemption; and
- •
- the redemption occurs within 180 days of the date of the closing of the equity offering.
Prior to June 1, 2017, the Partnership may redeem all or a part of the 2022 Notes at the redemption price equal to the sum of the principal amount thereof, plus a make-whole premium at the redemption date, plus accrued and unpaid interest to the redemption date.
On or after June 1, 2017, the Partnership may redeem all or a part of the 2022 Notes at redemption prices (expressed as percentages of principal amount) equal to 103.563% for the twelve-month period beginning on June 1, 2017, 102.375% for the twelve-month period beginning on June 1, 2018, 101.188% for the twelve-month period beginning on June 1, 2019 and 100.000% for the twelve-month period beginning on June 1, 2020 and at any time thereafter, plus accrued and unpaid interest, if any, to the applicable redemption date on the 2022 Notes.
Each of the following is an event of default under the indenture:
- •
- failure to pay any principal or interest when due;
- •
- failure to observe any other agreement, obligation, or other covenant in the indenture, subject to the cure periods for certain failures;
- •
- the Partnership's or any of its subsidiaries' default under other indebtedness that exceeds a certain threshold amount;
F-28
Table of Contents
CROSSTEX ENERGY, INC.
Notes to Consolidated Financial Statements (Continued)
December 31, 2012 and 2011
(5) Long-Term Debt (Continued)
- •
- failures by the Partnership or any of its subsidiaries to pay final judgments that exceed a certain threshold amount; and
- •
- bankruptcy or other insolvency events involving the Partnership or any of its material subsidiaries.
If an event of default relating to bankruptcy or other insolvency events occurs, the Senior Notes will immediately become due and payable. If any other event of default exists under the indenture, the trustee under the indenture or the holders of the Senior Notes may accelerate the maturity of the Senior Notes and exercise other rights and remedies.
(6) Other Long-Term Liabilities
The Partnership entered into 9 and 10-year capital leases for certain compressor equipment. Assets under capital leases are summarized as follows (in thousands):
| | | | | | | |
| | December 31, | |
|---|
| | 2012 | | 2011 | |
|---|
Compression equipment | | $ | 37,199 | | $ | 37,199 | |
Less: Accumulated amortization | | | (13,813 | ) | | (10,361 | ) |
| | | | | | |
Net assets under capital lease | | $ | 23,386 | | $ | 26,838 | |
| | | | | | |
The following are the minimum lease payments to be made in each of the following years indicated for the capital lease in effect as of December 31, 2012 (in thousands):
| | | | |
Fiscal Year | |
| |
|---|
2013 | | $ | 4,583 | |
2014 | | | 4,582 | |
2015 | | | 4,582 | |
2016 | | | 4,582 | |
2017 | | | 6,910 | |
Thereafter | | | 5,189 | |
Less: Interest | | | (5,171 | ) |
| | | | |
Net minimum lease payments under capital lease | | | 25,257 | |
Less: Current portion of net minimum lease payments | | | (4,448 | ) |
| | | | |
Long-term portion of net minimum lease payments | | $ | 20,809 | |
| | | | |
Other long-term liabilities also include an inactive easement commitment of $6.4 million (net of discount of $3.6 million) assumed with the Clearfield acquisition which is due over the next 10 years as such easements are utilized and a long-term liability of $3.0 million assumed with the Clearfield acquisition for additional benefit obligations from the affiliate of the seller which is payable in monthly installments of $0.08 million over the next 5 years with a contract cancellation option by the affiliate of the seller in July 2014 that would cause the remaining liability to be payable at such time.
F-29
Table of Contents
CROSSTEX ENERGY, INC.
Notes to Consolidated Financial Statements (Continued)
December 31, 2012 and 2011
(7) Income Taxes
The Company provides for income taxes using the liability method. Accordingly, deferred taxes are recorded for the differences between the tax and book basis that will reverse in future periods (in thousands).
| | | | | | | | | | |
| | 2012 | | 2011 | | 2010 | |
|---|
Current tax provision | | $ | 1,742 | | $ | 1,772 | | $ | 1,516 | |
Deferred tax provision (benefit) | | | (8,384 | ) | | (4,540 | ) | | (7,537 | ) |
| | | | | | | | |
| | $ | (6,642 | ) | $ | (2,768 | ) | $ | (6,021 | ) |
| | | | | | | | |
A reconciliation of the provision (benefit) for income taxes is as follows (in thousands):
| | | | | | | | | | |
| | 2012 | | 2011 | | 2010 | |
|---|
Federal income tax at statutory rate (35%) | | $ | (6,692 | ) | $ | (3,071 | ) | $ | (6,185 | ) |
State income taxes, net | | | (396 | ) | | (182 | ) | | (366 | ) |
Non-deductible expenses | | | 258 | | | 153 | | | 156 | |
Other | | | 188 | | | 332 | | | 374 | |
| | | | | | | | |
Tax provision (benefit) | | $ | (6,642 | ) | $ | (2,768 | ) | $ | (6,021 | ) |
| | | | | | | | |
The principal component of the Company's net deferred tax liability are as follows (in thousands):
| | | | | | | |
| | Years Ended December 31, | |
|---|
| | 2012 | | 2011 | |
|---|
Deferred income tax assets: | | | | | | | |
Accrued expenses | | $ | 1,455 | | $ | — | |
Deferred transaction costs | | | 863 | | | — | |
Net operating loss carryforward—non-current | | | 51,488 | | | 45,569 | |
Investment in the Partnership | | | 5,981 | | | 20,483 | |
Other comprehensive income | | | — | | | 77 | |
Alternative minimum tax carry forward (AMT) | | | 8 | | | 8 | |
| | | | | | |
| | | 59,795 | | | 66,137 | |
Less: valuation allowance | | | (5,981 | ) | | (20,483 | ) |
| | | | | | |
| | | 53,814 | | | 45,654 | |
Deferred income tax liabilities: | | | | | | | |
Property, plant, equipment, and intangible assets—current | | | (7,075 | ) | | (501 | ) |
Property, plant, equipment, and intangible assets—non-current | | | (184,889 | ) | | (129,207 | ) |
Other comprehensive income | | | (56 | ) | | — | |
Other | | | (2,424 | ) | | (1,634 | ) |
| | | | | | |
| | | (194,444 | ) | | (131,342 | ) |
| | | | | | |
Net deferred tax liability | | $ | (140,630 | ) | $ | (85,688 | ) |
| | | | | | |
F-30
Table of Contents
CROSSTEX ENERGY, INC.
Notes to Consolidated Financial Statements (Continued)
December 31, 2012 and 2011
(7) Income Taxes (Continued)
At December 31, 2012, the Company had a net operating loss carryforward of approximately $135.7 million that expires from 2027 through 2032. The Company also has various state net operating loss carryforwards of approximately $79.1 million which will begin expiring in 2027. Management believes that it is more likely than not that the future results of operations will generate sufficient taxable income to utilize these net operating loss carryforwards before they expire. Although the Company has generated net operating losses in the past, the Company expects to have future taxable income from its investment in the Partnership, generated by the remedial allocations of income among the unitholders and the income generated by operations including effect of reversals of accelerated depreciation.
Deferred tax liabilities relating to property, plant, equipment and intangible assets represent, primarily, the Company's share of the book basis in excess of tax basis for assets inside of the Partnership. The Company has also recorded a deferred tax asset in the amount of $6.0 million relating to the difference between its book and tax basis of its investment in the Partnership. Because the Company can only realize this deferred tax asset upon the liquidation of the Partnership and to the extent of capital gains, the Company has provided a full valuation allowance against this deferred tax asset.
The Company adopted the provisions of FASB ASC 740-10-25-16 on January 1, 2007. A reconciliation of the beginning and ending amount of the unrecognized tax benefits is as follows (In thousands):
| | | | |
Balance as of December 31, 2010 | | $ | 2,331 | |
Decreases related to prior year tax positions | | | (6 | ) |
Increases related to current year tax positions | | | 325 | |
| | | | |
Balance as of December 31, 2011 | | $ | 2,650 | |
Decreases related to prior year tax positions | | | (383 | ) |
Increases related to current year tax positions | | | 320 | |
| | | | |
Balance as of December 31, 2012 | | $ | 2,587 | |
| | | | |
Unrecognized tax benefits of $2.6 million, if recognized, would affect the effective tax rate. It is unknown when this uncertain tax position will be resolved. In the event additional interest and penalties are incurred prior to resolution, per company policy, such penalties and interest will be recorded to income tax expense.
At December 31, 2012, tax years 2009 through 2012 remain subject to examination by the Internal Revenue Services and tax years 2008 through 2012 remain subject to examination by various state taxing authorities.
(8) Retirement Plans
The Company sponsors a single employer 401(k) plan for employees who become eligible upon the date of hire. The plan allows for contributions to be made at each compensation calculation period based on the annual discretionary contribution rate. Contributions of $3.3 million, $2.5 million and
F-31
Table of Contents
CROSSTEX ENERGY, INC.
Notes to Consolidated Financial Statements (Continued)
December 31, 2012 and 2011
(8) Retirement Plans (Continued)
$2.3 million were made to the plan for the years ended December 31, 2012, 2011 and 2010, respectively.
(9) Employee Incentive Plans
(a) Long-Term Incentive Plans
The Partnership has a long-term incentive plan for its employees, directors and affiliates who perform services for the Partnership. The plan currently permits the grant of awards covering an aggregate of 5,600,000 common unit options and restricted units. The plan is administered by the compensation committee of the Partnership's board of directors. The units issued upon exercise or vesting are newly issued units.
(b) Partnership Restricted Units
A restricted unit is a "phantom" unit that entitles the grantee to receive a common unit upon the vesting of the phantom unit, or in the discretion of the compensation committee, cash equivalent to the value of a common unit. In addition, the restricted units will become exercisable upon a change of control of the Partnership or its general partner.
The restricted units are intended to serve as a means of incentive compensation for performance and not primarily as an opportunity to participate in the equity appreciation of the common units. Therefore, plan participants will not pay any consideration for the common units they receive and the Partnership will receive no remuneration for the units. The restricted units include a tandem award that entitles the participant to receive cash payments equal to the cash distributions made by the Partnership with respect to its outstanding common units until the restriction period is terminated or the restricted units are forfeited. The restricted units granted in 2012, 2011 and 2010 generally cliff vest after three years of service.
The restricted units are valued at their fair value at the date of grant which is equal to the market value of common units on such date. A summary of the restricted unit activity for the year ended December 31, 2012 is provided below:
| | | | | | | |
Crosstex Energy, L.P. Restricted Units: | | Number of
Units | | Weighted
Average
Grant-Date
Fair Value | |
|---|
Non-vested, beginning of period | | | 949,844 | | $ | 10.45 | |
Granted | | | 417,677 | | | 16.58 | |
Vested* | | | (264,632 | ) | | 7.93 | |
Forfeited | | | (99,730 | ) | | 14.01 | |
| | | | | | |
Non-vested, end of period | | | 1,003,159 | | $ | 13.31 | |
| | | | | | |
Aggregate intrinsic value, end of period (in thousands) | | $ | 14,596 | | | | |
| | | | | | | |
- *
- Vested units include 66,180 units withheld for payroll taxes paid on behalf of employees.
F-32
Table of Contents
CROSSTEX ENERGY, INC.
Notes to Consolidated Financial Statements (Continued)
December 31, 2012 and 2011
(9) Employee Incentive Plans (Continued)
A summary of the restricted units' aggregate intrinsic value (market value at vesting date) and fair value of units vested (market value at date of grant) during the years ended December 31, 2012, 2011 and 2010 are provided below (in thousands):
| | | | | | | | | | |
| | Years Ended December 31, | |
|---|
Crosstex Energy, L.P. Restricted Units: | | 2012 | | 2011 | | 2010 | |
|---|
Aggregate intrinsic value of units vested | | $ | 3,850 | | $ | 6,438 | | $ | 11,076 | |
Fair value of units vested | | $ | 2,097 | | $ | 5,945 | | $ | 5,785 | |
As of December 31, 2012, there was $5.4 million of unrecognized compensation cost related to non-vested restricted units. That cost is expected to be recognized over a weighted-average period of 1.2 years.
(c) Partnership Unit Options
Unit options will have an exercise price that is not less than the fair market value of the units on the date of grant. In general, unit options granted will become exercisable over a period determined by the compensation committee. In addition, unit options will become exercisable upon a change in control of the Partnership or its general partner.
The fair value of each unit option award is estimated at the date of grant using the Black-Scholes-Merton model. This model is based on the assumptions summarized below. Expected volatilities are based on historical volatilities of the Partnership's traded common units. The Partnership has used historical data to estimate share option exercise and employee departure behavior to estimate expected forfeiture rates. The expected life of unit options represents the period of time that unit options granted are expected to be outstanding. The risk-free interest rate for periods within the expected term of the unit option is based on the U.S. Treasury yield curve in effect at the time of the grant. The Partnership used the simplified method to calculate the expected term.
Unit options are generally awarded with an exercise price equal to the market price of the Partnership's common units at the date of grant. The unit options granted generally vest based on 3 years of service (one-third after each year of service). There have been no options granted since 2009.
F-33
Table of Contents
CROSSTEX ENERGY, INC.
Notes to Consolidated Financial Statements (Continued)
December 31, 2012 and 2011
(9) Employee Incentive Plans (Continued)
A summary of the unit option activity for the years ended December 31, 2012, 2011, and 2010 is provided below:
| | | | | | | | | | | | | | | | | | | |
| | Years Ended December 31, | |
|---|
| | 2012 | | 2011 | | 2010 | |
|---|
| | Number of
Units | | Weighted
Average
Exercise
Price | | Number of
Units | | Weighted
Average
Exercise
Price | | Number of
Units | | Weighted
Average
Exercise
Price | |
|---|
Outstanding, beginning of period | | | 451,574 | | $ | 6.99 | | | 611,311 | | $ | 6.77 | | | 882,836 | | $ | 6.43 | |
Exercised | | | (87,857 | ) | | 4.96 | | | (128,477 | ) | | 4.61 | | | (198,725 | ) | | 4.48 | |
Forfeited | | | (14,699 | ) | | 13.39 | | | (31,260 | ) | | 12.83 | | | (67,183 | ) | | 9.27 | |
Expired | | | — | | | — | | | — | | | — | | | (5,617 | ) | | 5.37 | |
| | | | | | | | | | | | | | |
Outstanding, end of period | | | 349,018 | | $ | 7.25 | | | 451,574 | | $ | 6.99 | | | 611,311 | | $ | 6.77 | |
| | | | | | | | | | | | | | |
Options exercisable at end of period | | | 286,715 | | $ | 7.52 | | | 315,742 | | $ | 7.42 | | | 278,214 | | $ | 7.78 | |
Weighted average contractual term (years) end of period: | | | | | | | | | | | | | | | | | | | |
Options outstanding | | | 6.1 | | | — | | | 7.2 | | | — | | | 8.2 | | | — | |
Options exercisable | | | 6.0 | | | — | | | 6.9 | | | — | | | 7.6 | | | — | |
Aggregate intrinsic value end of period (in thousands): | | | | | | | | | | | | | | | | | | | |
Options outstanding | | $ | 3,016 | | | — | | $ | 4,648 | | | — | | $ | 5,350 | | | — | |
Options exercisable | | $ | 2,483 | | | — | | $ | 3,260 | | | — | | $ | 2,463 | | | — | |
A summary of the unit options intrinsic value exercised (market value in excess of exercise price at date of exercise) and fair value of units vested (value per Black-Scholes-Merton option pricing model at date of grant) during the years ended December 31, 2012, 2011 and 2010 is provided below (in thousands):
| | | | | | | | | | |
| | Years Ended December 31, | |
|---|
Crosstex Energy, L.P. Unit Options: | | 2012 | | 2011 | | 2010 | |
|---|
Intrinsic value of units options exercised | | $ | 988 | | $ | 1,527 | | $ | 1,470 | |
Fair value of unit options vested | | $ | 277 | | $ | 563 | | $ | 764 | |
As of December 31, 2012, there was less than $0.1 million of unrecognized compensation cost related to non-vested unit options. That cost is expected to be recognized during the first quarter of 2013.
(d) Crosstex Energy, Inc.'s Restricted Stock
The Crosstex Energy, Inc. long-term incentive plan provides for the award of restricted stock (collectively, "Awards") for up to 7,190,000 shares of Crosstex Energy, Inc.'s common stock. As of January 1, 2013, approximately 1,248,713 shares remained available under the long-term incentive plans for future issuance to participants. The maximum number of shares set forth above are subject to appropriate adjustment in the event of a recapitalization of the capital structure of Crosstex
F-34
Table of Contents
CROSSTEX ENERGY, INC.
Notes to Consolidated Financial Statements (Continued)
December 31, 2012 and 2011
(9) Employee Incentive Plans (Continued)
Energy, Inc. or reorganization of Crosstex Energy, Inc. Awards that are forfeited, terminated or expire unexercised become immediately available for additional awards under the long-term incentive plan.
CEI's restricted shares are included at their fair value at the date of grant which is equal to the market value of the common stock on such date. CEI's restricted stock granted in 2012, 2011 and 2010 generally cliff vest after three years of service. A summary of the restricted stock activity which includes officers and employees of the Partnership and directors of the general partner of the Partnership for the year ended December 31, 2012, is provided below:
| | | | | | | |
Crosstex Energy, Inc. Restricted Shares: | | Number of
Shares | | Weighted
Average
Grant-Date
Fair Value | |
|---|
Non-vested, beginning of period | | | 1,221,351 | | $ | 7.40 | |
Granted | | | 528,946 | | | 13.34 | |
Vested* | | | (285,872 | ) | | 6.13 | |
Forfeited | | | (135,263 | ) | | 10.27 | |
| | | | | | |
Non-vested, end of period | | | 1,329,162 | | $ | 9.75 | |
| | | | | | |
Aggregate intrinsic value, end of period (in thousands) | | $ | 19,060 | | | | |
| | | | | | | |
- *
- Vested units include 66,106 units withheld for payroll taxes paid on behalf of employees.
A summary of the restricted shares' aggregate intrinsic value (market value at vesting date) and fair value of shares vested (market value at date of grant) during the years ended December 31, 2012, 2011 and 2010 is provided below (in thousands):
| | | | | | | | | | |
| | Years Ended December 31, | |
|---|
Crosstex Energy, Inc. Restricted Shares: | | 2012 | | 2011 | | 2010 | |
|---|
Aggregate intrinsic value of shares vested | | $ | 4,099 | | $ | 3,915 | | $ | 3,163 | |
Fair value of shares vested | | $ | 1,754 | | $ | 5,623 | | $ | 4,388 | |
As of December 31, 2012 there was $5.5 million of unrecognized compensation costs related to CEI restricted shares for directors, officers and employees. The cost is expected to be recognized over a weighted average period of 1.2 years.
F-35
Table of Contents
CROSSTEX ENERGY, INC.
Notes to Consolidated Financial Statements (Continued)
December 31, 2012 and 2011
(9) Employee Incentive Plans (Continued)
(e) Crosstex Energy, Inc.'s Stock Options
CEI stock options have not been granted since 2005. A summary of the stock option activity includes officers and employees of the Partnership and directors of CEI for the years ended December 31, 2012, 2011 and 2010 is provided below:
| | | | | | | | | | | | | | | | | | | |
| | Years Ended December 31, | |
|---|
| | 2012 | | 2011 | | 2010 | |
|---|
| | Number of
Units | | Weighted
Average
Exercise
Price | | Number of
Units | | Weighted
Average
Exercise
Price | | Number of
Units | | Weighted
Average
Exercise
Price | |
|---|
Outstanding, beginning of period | | | 37,500 | | $ | 6.50 | | | 37,500 | | $ | 6.50 | | | 67,500 | | $ | 9.54 | |
Forfeited | | | — | | | — | | | — | | | — | | | (30,000 | ) | | 13.33 | |
| | | | | | | | | | | | | | |
Outstanding, end of period | | | 37,500 | | $ | 6.50 | | | 37,500 | | $ | 6.50 | | | 37,500 | | $ | 6.50 | |
| | | | | | | | | | | | | | |
Options exercisable at end of period | | | 37,500 | | $ | 6.50 | | | 37,500 | | $ | 6.50 | | | 37,500 | | $ | 6.50 | |
No stock options were exercised or vested during the years ended December 31, 2012, 2011 and 2010.
(10) Derivatives
Interest Rate Swaps
The Partnership did not have any interest rate swaps during the years ended December 31, 2012 and December 31, 2011.
The impact of the interest rate swaps on net income during the year ended December 31, 2010 is included in other income (expense) in the consolidated statements of operations as part of interest expense, net, as follows (in thousands):
| | | | |
| | Year Ended
December 31,
2010 | |
|---|
Change in fair value of derivatives that do not qualify for hedge accounting | | $ | 22,405 | |
Realized losses on derivatives | | | (26,542 | ) |
| | | | |
Loss on interest rate swaps | | $ | (4,137 | ) |
| | | | |
Commodity Swaps
The Partnership manages its exposure to fluctuations in commodity prices by hedging the impact of market fluctuations. Swaps are used to manage and hedge prices and location risk related to these market exposures. Swaps are also used to manage margins on offsetting fixed-price purchase or sale commitments for physical quantities of natural gas and NGLs.
F-36
Table of Contents
CROSSTEX ENERGY, INC.
Notes to Consolidated Financial Statements (Continued)
December 31, 2012 and 2011
(10) Derivatives (Continued)
The Partnership commonly enters into various derivative financial transactions which it does not designate as hedges. These transactions include "swing swaps," "third party on-system financial swaps," "storage swaps," "basis swaps," "processing margin swaps," "liquids swaps" and "put options." Swing swaps are generally short-term in nature (one month), and are usually entered into to protect against changes in the volume of daily versus first-of-month index priced gas supplies or markets. Third party on-system financial swaps are hedges that the Partnership enters into on behalf of its customers who are connected to its systems, wherein the Partnership fixes a supply or market price for a period of time for its customers and simultaneously enters into the derivative transaction. Storage swap transactions protect against changes in the value of gas that the Partnership has stored to serve various operational requirements. Basis swaps are used to hedge basis location price risk due to buying gas into one of our systems on one index and selling gas off that same system on a different index. Processing margin financial swaps are used to hedge fractionation spread risk at our processing plants relating to the option to process versus bypassing our equity gas. Liquids financial swaps are used to hedge price risk on percent of liquids (POL) contracts. Put options are purchased to hedge against declines in pricing and as such represent options, not obligations, to sell the related underlying volumes at a fixed price.
The components of loss on derivatives in the consolidated statements of operations relating to commodity swaps are (in thousands):
| | | | | | | | | | |
| | Years Ended December 31, | |
|---|
| | 2012 | | 2011 | | 2010 | |
|---|
Change in fair value of derivatives that do not qualify for hedge accounting | | $ | (3,473 | ) | $ | 726 | | $ | 1,003 | |
Realized losses on derivatives | | | 4,514 | | | 7,015 | | | 7,955 | |
Ineffective portion of derivatives qualifying for hedge accounting | | | (35 | ) | | (158 | ) | | 142 | |
| | | | | | | | |
Net losses related to commodity swaps | | $ | 1,006 | | $ | 7,583 | | $ | 9,100 | |
Put option premium mark to market | | | — | | | 193 | | | — | |
| | | | | | | | |
Losses on derivatives | | $ | 1,006 | | $ | 7,776 | | $ | 9,100 | |
| | | | | | | | |
The fair value of derivative assets and liabilities relating to commodity swaps are as follows (in thousands):
| | | | | | | |
| | December 31, | |
|---|
| | 2012 | | 2011 | |
|---|
Fair value of derivative assets—current, designated | | $ | 724 | | $ | 151 | |
Fair value of derivative assets—current, non-designated | | | 2,510 | | | 2,716 | |
Fair value of derivative liabilities—current, designated | | | (105 | ) | | (702 | ) |
Fair value of derivative liabilities—current, non-designated | | | (1,205 | ) | | (4,885 | ) |
| | | | | | |
Net fair value of derivatives | | $ | 1,924 | | $ | (2,720 | ) |
| | | | | | |
F-37
Table of Contents
CROSSTEX ENERGY, INC.
Notes to Consolidated Financial Statements (Continued)
December 31, 2012 and 2011
(10) Derivatives (Continued)
Set forth below is the summarized notional volumes and fair value of all instruments held for price risk management purposes and related physical offsets at December 31, 2012 (all gas volumes are expressed in MMBtus and liquids volumes are expressed in gallons). The remaining term of the contracts extend no later than December 2013. Changes in the fair value of the Partnership's mark to market derivatives are recorded in earnings in the period the transaction is entered into. The effective portion of changes in the fair value of cash flow hedges is recorded in accumulated other comprehensive income until the related anticipated future cash flow is recognized in earnings. The ineffective portion is recorded in earnings immediately.
| | | | | | | |
| | December 31, 2012 | |
|---|
Transaction Type | | Volume | | Fair Value | |
|---|
| | (In thousands)
| |
|---|
Cash Flow Hedges:* | | | | | | | |
Liquids swaps (short contracts) | | | (5,496 | ) | $ | 619 | |
| | | | | | | |
Total swaps designated as cash flow hedges | | | | | $ | 619 | |
| | | | | | | |
Mark to Market Derivatives:* | | | | | | | |
Swing swaps (long contracts) | | | 890 | | $ | (2 | ) |
Physical offsets to swing swap transactions (short contracts) | | | (890 | ) | | — | |
Basis swaps (long contracts) | | |
2,450 | | |
13 | |
Physical offsets to basis swap transactions (short contracts) | | | (2,450 | ) | | 7,179 | |
Basis swaps (short contracts) | | | (2,450 | ) | | 5 | |
Physical offsets to basis swap transactions (long contracts) | | | 2,450 | | | (8,029 | ) |
Third-party on-system swaps (long contracts) | | |
465 | | |
(19 |
) |
Physical offsets to third-party on-system swap transactions (short contracts) | | | (465 | ) | | 33 | |
Processing margin hedges—liquids (short contracts) | | |
(6,423 |
) | |
1,212 | |
Processing margin hedges—gas (long contracts) | | | 750 | | | (21 | ) |
Liquids swaps—non-designated (short contracts) | | |
(4,393 |
) | |
1,035 | |
Storage swap transactions (short contracts) | | | (2,400 | ) | | (101 | ) |
| | | | | | | |
Total mark to market derivatives | | | | | $ | 1,305 | |
| | | | | | | |
- *
- All are gas contracts, volume in MMBtus, except for liquids swaps (designated or non-designated) and processing margin hedges—liquids (volume in gallons).
F-38
Table of Contents
CROSSTEX ENERGY, INC.
Notes to Consolidated Financial Statements (Continued)
December 31, 2012 and 2011
(10) Derivatives (Continued)
On all transactions where the Partnership is exposed to counterparty risk, the Partnership analyzes the counterparty's financial condition prior to entering into an agreement, establishes limits and monitors the appropriateness of these limits on an ongoing basis. The Partnership primarily deals with two types of counterparties, financial institutions and other energy companies, when entering into financial derivatives on commodities. The Partnership has entered into Master International Swaps and Derivatives Association Agreements that allow for netting of swap contract receivables and payables in the event of default by either party. If the Partnership's counterparties failed to perform under existing swap contracts, the Partnership's maximum loss as of December 31, 2012 of $3.2 million would be reduced to $2.8 million due to the offsetting of gross fair value payables against gross fair value receivables as allowed by the ISDAs.
Impact of Cash Flow Hedges
The impact of realized gains or losses from derivatives designated as cash flow hedge contracts in the consolidated statements of operations is summarized below (in thousands):
| | | | | | | | | | |
| | Years Ended December 31, | |
|---|
Increase (decrease) in Midstream revenue | | 2012 | | 2011 | | 2010 | |
|---|
Liquids | | $ | 1,381 | | $ | (2,772 | ) | $ | (1,733 | ) |
As of December 31, 2012, the Partnership has no balances in accumulated other comprehensive income (loss) related to natural gas.
As of December 31, 2012, an unrealized derivative fair value net gain of $0.6 million related to cash flow hedges of liquids price risk was recorded in accumulated other comprehensive income (loss). Of this net amount, a $0.6 million gain is expected to be reclassified into earnings through December 2013. The actual reclassification to earnings will be based on mark to market prices at the contract settlement date, along with the realization of the gain or loss on the related physical volume, which amount is not reflected above.
Derivatives Other Than Cash Flow Hedges
Assets and liabilities related to third party derivative contracts, swing swaps, basis swaps, storage swaps, processing margin swaps and liquids swaps are included in the fair value of derivative assets and liabilities and the profit and loss on the mark to market value of these contracts are recorded net as (gain) loss on derivatives in the consolidated statement of operations. The Partnership estimates the
F-39
Table of Contents
CROSSTEX ENERGY, INC.
Notes to Consolidated Financial Statements (Continued)
December 31, 2012 and 2011
(10) Derivatives (Continued)
fair value of all of its energy trading contracts using actively quoted prices. The estimated fair value of energy trading contracts by maturity date was as follows (in thousands):
| | | | | | | | | | | | | |
| | Maturity Periods | |
|---|
| | Less than one
year | | One to two
years | | More than two
years | | Total fair
value | |
|---|
December 31, 2012. | | $ | 1,305 | | $ | — | | $ | — | | $ | 1,305 | |
(11) Fair Value Measurements
FASB ASC 820 sets forth a framework for measuring fair value and required disclosures about fair value measurements of assets and liabilities. Fair value under FASB ASC 820 is defined as the price at which an asset could be exchanged in a current transaction between knowledgeable, willing parties. A liability's fair value is defined as the amount that would be paid to transfer the liability to a new obligor, not the amount that would be paid to settle the liability with the creditor. Where available, fair value is based on observable market prices or parameters or derived from such prices or parameters. Where observable prices or inputs are not available, use of unobservable prices or inputs are used to estimate the current fair value, often using an internal valuation model. These valuation techniques involve some level of management estimation and judgment, the degree of which is dependent on the item being valued.
FASB ASC 820 established a three-tier fair value hierarchy, which prioritizes the inputs used in measuring fair value. These tiers include: Level 1, defined as observable inputs such as quoted prices in active markets; Level 2, defined as inputs other than quoted prices in active markets that are either directly or indirectly observable; and Level 3, defined as unobservable inputs in which little or no market data exists, therefore requiring an entity to develop its own assumptions.
The Partnership's derivative contracts primarily consist of commodity swap contracts which are not traded on a public exchange. The fair values of commodity swap contracts are determined using discounted cash flow techniques. The techniques incorporate Level 1 and Level 2 inputs for future commodity prices that are readily available in public markets or can be derived from information available in publicly quoted markets. These market inputs are utilized in the discounted cash flow calculation considering the instrument's term, notional amount, discount rate and credit risk and are classified as Level 2 in hierarchy.
F-40
Table of Contents
CROSSTEX ENERGY, INC.
Notes to Consolidated Financial Statements (Continued)
December 31, 2012 and 2011
(11) Fair Value Measurements (Continued)
Net assets (liabilities) measured at fair value on a recurring basis are summarized below (in thousands):
| | | | | | | |
| | December 31, | |
|---|
| | 2012 | | 2011 | |
|---|
| | Level 2 | | Level 2 | |
|---|
Commodity Swaps* | | $ | 1,924 | | $ | (2,720 | ) |
| | | | | | |
Total | | $ | 1,924 | | $ | (2,720 | ) |
| | | | | | |
- *
- Unrealized gains or losses on commodity derivatives qualifying for hedge accounting are recorded in accumulated other comprehensive income at each measurement date. The fair value of derivative contracts included in assets or liabilities for risk management activities represents the amount at which the instruments could be exchanged in a current arms-length transaction adjusted for credit risk of the Partnership and/or the counterparty as required under FASB ASC 820.
Fair Value of Financial Instruments
The estimated fair value of the Company's financial instruments has been determined by the Company using available market information and valuation methodologies. Considerable judgment is required to develop the estimates of fair value, thus, the estimates provided below are not necessarily indicative of the amount the Company could realize upon the sale or refinancing of such financial instruments (in thousands).
| | | | | | | | | | | | | |
| | December 31, 2012 | | December 31, 2011 | |
|---|
| | Carrying
Value | | Fair
Value | | Carrying
Value | | Fair
Value | |
|---|
Long-term debt | | $ | 1,036,305 | | $ | 1,118,875 | | $ | 798,409 | | $ | 882,500 | |
Obligations under capital lease | | | 25,257 | | | 27,667 | | | 28,367 | | | 27,637 | |
The carrying amounts of the Company's cash and cash equivalents, accounts receivable, and accounts payable approximate fair value due to the short-term maturities of these assets and liabilities.
The Partnership had $71.0 million in borrowings under its revolving credit facility included in long-term debt as of December 31, 2012 and $85.0 million in borrowings under this credit facility as of December 31, 2011. Borrowings under the credit facility accrue interest under a floating interest rate structure so the carrying value of such indebtedness approximates fair value for the amounts outstanding under the credit facility. As of December 31, 2012 and December 31, 2011, the Partnership also had borrowings totaling $715.3 million and $713.4 million, net of discount, respectively, under the 2018 Notes with a fixed rate of 8.875% and borrowings of $250.0 million as of December 31, 2012 under the 2022 Notes with a fixed rate of 7.125%. The fair value of all senior unsecured notes as of December 31, 2012 and December 31, 2011 was based on Level 1 inputs from third-party market quotations. The fair value of obligations under capital leases was calculated using Level 2 inputs from third-party banks.
F-41
Table of Contents
CROSSTEX ENERGY, INC.
Notes to Consolidated Financial Statements (Continued)
December 31, 2012 and 2011
(12) Commitments and Contingencies
The Partnership has operating leases for office space, office and field equipment.
The following table summarizes the Partnership remaining non-cancelable future payments under operating leases with initial or remaining non-cancelable lease terms in excess of one year (in thousands):
| | | | |
2013 | | $ | 8,512 | |
2014 | | | 7,604 | |
2015 | | | 7,678 | |
2016 | | | 7,068 | |
2017 | | | 4,310 | |
Thereafter | | | 10,170 | |
| | | | |
| | $ | 45,342 | |
| | | | |
Operating lease rental expense in the years ended December 31, 2012, 2011 and 2010 was approximately $23.2 million, $21.9 million and $21.9 million, respectively.
Certain members of management of the Company are parties to employment and/or severance agreements with the general partner of the Partnership. The employment and severance agreements provide those managers with severance payments in certain circumstances and, in the case of employment agreements, prohibit each such person from competing with the general partner or its affiliates for a certain period of time following the termination of such person's employment.
The Partnership acquired LIG Pipeline Company and its subsidiaries on April 1, 2004. Contamination from historical operations was identified during due diligence at a number of sites owned by the acquired companies. The seller, AEP, has indemnified the Partnership for these identified sites. Moreover, AEP has entered into an agreement with a third party company pursuant to which the remediation costs associated with these sites have been assumed by this third party company that specializes in remediation work. To date, 23 of the 25 sites requiring remediation have been completed and have received a "No Further Action" status from the Louisiana Department of Environmental Quality. The remaining two sites continuing with remediation efforts are expected to reach closure in 2013. The Partnership does not expect to incur any material liability with these sites; however, there can be no assurance that the third parties who have assumed responsibility for remediation of site conditions will fulfill their obligations.
The Company is involved in various litigation and administrative proceedings arising in the normal course of business. In the opinion of management, any liabilities that may result from these claims
F-42
Table of Contents
CROSSTEX ENERGY, INC.
Notes to Consolidated Financial Statements (Continued)
December 31, 2012 and 2011
(12) Commitments and Contingencies (Continued)
would not individually or in the aggregate have a material adverse effect on its financial position or results of operations.
At times, the Partnership's gas-utility and common carrier subsidiaries acquire pipeline easements and other property rights by exercising rights of eminent domain provided under state law. As a result, the Partnership (or its subsidiaries) is party to a number of lawsuits under which a court will determine the value of pipeline easements or other property interests obtained by the Partnership's gas utility subsidiaries by condemnation. Damage awards in these suits should reflect the value of the property interest acquired and the diminution in the value of the remaining property owned by the landowner. However, some landowners have alleged unique damage theories to inflate their damage claims or assert valuation methodologies that could result in damage awards in excess of the amounts anticipated. Although it is not possible to predict the ultimate outcomes of these matters, the Partnership does not expect that awards in these matters will have a material adverse impact on its consolidated results of operations or financial condition.
The Partnership (or its subsidiaries) is defending a number of lawsuits filed by owners of property located near processing facilities or compression facilities constructed by the Partnership as part of its systems. The suits generally allege that the facilities create a private nuisance and have damaged the value of surrounding property. Claims of this nature have arisen as a result of the industrial development of natural gas gathering, processing and treating facilities in urban and occupied rural areas. In January 2012, a plaintiff in one of these lawsuits was awarded a judgment of $2.0 million. The Partnership has appealed the matter and has posted a bond to secure the judgment pending its resolution. The Partnership has accrued $2.0 million related to this matter as of December 31, 2011 and reflected the related expense in operating expenses in the fourth quarter of 2011. Although it is not possible to predict the ultimate outcomes of these matters, the Partnership does not expect that awards in these matters will have a material adverse impact on its consolidated results of operations or financial condition.
(13) Capital Stock
In October 2006, the Company's stockholders approved an increase in the number of authorized shares of capital stock from 20 million shares, consisting of 19 million shares of common stock and 1 million shares of preferred stock, to 150 million shares, consisting of 140 million shares of common stock and 10 million shares of preferred stock.
Basic earnings per common share was computed by dividing net income by the weighted-average number of common shares outstanding for the periods presented. The computation of diluted earnings per common share further assumes the dilutive effect of common share options and restricted shares. All common share equivalents were antidilutive for the years ended December 31, 2012, 2011 and 2010 because the Company had net losses in these periods.
The Company has issued restricted shares that entitle employees to receive non-forfeitable dividends during their vesting period and are therefore considered participating securities for earnings
F-43
Table of Contents
CROSSTEX ENERGY, INC.
Notes to Consolidated Financial Statements (Continued)
December 31, 2012 and 2011
(13) Capital Stock (Continued)
per share calculations. The restricted shares, which participate in earnings and dividends in the same manner as other common shares, were allocated total net loss of $307,000, $125,000 and $287,000 for the years ended December 31, 2012, 2011 and 2010, respectively
(14) Segment Information
Identification of operating segments is based principally upon regions served. The Partnership's reportable segments consist of the natural gas gathering, processing and transmission operations located in north Texas and in the Permian Basin in west Texas (NTX), the pipelines and processing plants located in Louisiana (LIG), the south Louisiana processing and NGL assets (PNGL) and rail, truck, pipeline, and barge facilities in the Ohio River Valley (ORV). The Partnership's sales are derived from external domestic customers.
The Partnership evaluates the performance of its operating segments based on operating revenues and segment profits. Corporate expenses include general partnership expenses associated with managing all reportable operating segments. Corporate assets consist principally of property and equipment, including software, for general corporate support, working capital, debt financing costs and its investment in HEP. Profit in the corporate segment for the years ended 2011 and 2010 includes the operating activity for intersegment eliminations.
F-44
Table of Contents
CROSSTEX ENERGY, INC.
Notes to Consolidated Financial Statements (Continued)
December 31, 2012 and 2011
(14) Segment Information (Continued)
Summarized financial information concerning the Partnership's reportable segments as consolidated into the Company's financial statements is shown in the following table.
| | | | | | | | | | | | | | | | | | | |
| | LIG | | NTX | | PNGL | | ORV | | Corporate | | Totals | |
|---|
| | (In thousands)
| |
|---|
Year Ended December 31, 2012: | | | | | | | | | | | | | | | | | | | |
Sales to external customers | | $ | 561,389 | | $ | 269,302 | | $ | 717,123 | | $ | 108,037 | | $ | — | | $ | 1,655,851 | |
Sales to affiliates | | | 225,542 | | | 96,177 | | | 145,569 | | | — | | | (467,288 | ) | | — | |
Purchased gas, NGLs and crude oil | | | (678,188 | ) | | (180,116 | ) | | (788,803 | ) | | (82,274 | ) | | 467,288 | | | (1,262,093 | ) |
Operating expenses | | | (33,817 | ) | | (55,582 | ) | | (29,601 | ) | | (11,882 | ) | | — | | | (130,882 | ) |
| | | | | | | | | | | | | | |
Segment profit | | $ | 74,926 | | $ | 129,781 | | $ | 44,288 | | $ | 13,881 | | $ | — | | $ | 262,876 | |
| | | | | | | | | | | | | | |
Gain (loss) on derivatives | | $ | 3,440 | | $ | (4,405 | ) | $ | (41 | ) | $ | — | | $ | — | | $ | (1,006 | ) |
Depreciation, amortization and impairments | | $ | (13,936 | ) | $ | (83,492 | ) | $ | (57,652 | ) | $ | (4,861 | ) | $ | (2,359 | ) | $ | (162,300 | ) |
Capital expenditures | | $ | 4,059 | | $ | 45,235 | | $ | 182,782 | | $ | 3,893 | | $ | 8,944 | | $ | 244,913 | |
Identifiable assets | | $ | 279,755 | | $ | 1,057,504 | | $ | 632,962 | | $ | 316,927 | | $ | 139,327 | | $ | 2,426,475 | |
Year Ended December 31, 2011: | | | | | | | | | | | | | | | | | | | |
Sales to external customers | | $ | 811,216 | | $ | 332,026 | | $ | 870,700 | | $ | — | | $ | — | | $ | 2,013,942 | |
Sales to affiliates | | | 128,130 | | | 100,527 | | | 40,185 | | | — | | | (268,842 | ) | | — | |
Purchased gas, NGLs and crude oil | | | (809,471 | ) | | (262,708 | ) | | (835,440 | ) | | — | | | 268,842 | | | (1,638,777 | ) |
Operating expenses | | | (35,434 | ) | | (48,807 | ) | | (27,537 | ) | | — | | | — | | | (111,778 | ) |
| | | | | | | | | | | | | | |
Segment profit | | $ | 94,441 | | $ | 121,038 | | $ | 47,908 | | $ | — | | $ | — | | $ | 263,387 | |
| | | | | | | | | | | | | | |
Gain (loss) on derivatives | | $ | (6,145 | ) | $ | (1,896 | ) | $ | 265 | | $ | | | $ | — | | $ | (7,776 | ) |
Depreciation, amortization and impairments | | $ | (13,676 | ) | $ | (76,535 | ) | $ | (31,271 | ) | $ | — | | $ | (3,876 | ) | $ | (125,358 | ) |
Capital expenditures | | $ | 2,820 | | $ | 73,069 | | $ | 25,618 | | $ | — | | $ | 2,629 | | $ | 104,136 | |
Identifiable assets | | $ | 305,359 | | $ | 1,113,431 | | $ | 460,865 | | $ | — | | $ | 82,961 | | $ | 1,962,616 | |
Year Ended December 31, 2010 | | | | | | | | | | | | | | | | | | | |
Sales to external customers | | $ | 880,336 | | $ | 309,771 | | $ | 602,569 | | $ | — | | $ | — | | $ | 1,792,676 | |
Sales to affiliates | | | 82,688 | | | 89,752 | | | — | | | — | | | (172,440 | ) | | — | |
Purchased gas, NGLs and crude oil | | | (845,627 | ) | | (240,085 | ) | | (541,104 | ) | | — | | | 172,440 | | | (1,454,376 | ) |
Operating expenses | | | (33,188 | ) | | (46,384 | ) | | (25,488 | ) | | — | | | — | | | (105,060 | ) |
| | | | | | | | | | | | | | |
Segment profit | | $ | 84,209 | | $ | 113,054 | | $ | 35,977 | | $ | — | | $ | — | | $ | 233,240 | |
| | | | | | | | | | | | | | |
Loss on derivatives | | $ | (3,664 | ) | $ | (5,352 | ) | $ | (84 | ) | $ | | | $ | — | | $ | (9,100 | ) |
Depreciation, amortization and impairments | | $ | (12,382 | ) | $ | (64,458 | ) | $ | (31,661 | ) | $ | — | | $ | (4,435 | ) | $ | (112,936 | ) |
Capital expenditures | | $ | 9,930 | | $ | 31,678 | | $ | 5,871 | | $ | — | | $ | 1,907 | | $ | 49,386 | |
Identifiable assets | | $ | 331,261 | | $ | 1,107,279 | | $ | 493,143 | | $ | — | | $ | 59,420 | | $ | 1,991,103 | |
F-45
Table of Contents
CROSSTEX ENERGY, INC.
Notes to Consolidated Financial Statements (Continued)
December 31, 2012 and 2011
(14) Segment Information (Continued)
The following table reconciles the segment profits reported above to the operating income as reported in the consolidated statements of operations (in thousands):
| | | | | | | | | | |
| | Years ended December 31, | |
|---|
| | 2012 | | 2011 | | 2010 | |
|---|
Segment profits | | $ | 262,876 | | $ | 263,387 | | $ | 233,240 | |
General and administrative expenses | | | (65,083 | ) | | (55,516 | ) | | (51,172 | ) |
Loss on derivatives | | | (1,006 | ) | | (7,776 | ) | | (9,100 | ) |
Gain (loss) on sale of property | | | 342 | | | (264 | ) | | 13,881 | |
Depreciation, amortization and impairments | | | (162,300 | ) | | (125,358 | ) | | (112,936 | ) |
| | | | | | | | |
Operating income | | $ | 34,829 | | $ | 74,473 | | $ | 73,913 | |
| | | | | | | | |
(15) Quarterly Financial Data (Unaudited)
Summarized unaudited quarterly financial data is presented below.
| | | | | | | | | | | | | | | | |
| | First | | Second | | Third | | Fourth | | Total | |
|---|
| | (In thousands, except per unit data)
| |
|---|
2012: | | | | | | | | | | | | | | | | |
Revenues | | $ | 371,709 | | $ | 351,194 | | $ | 406,968 | | $ | 525,980 | | $ | 1,655,851 | |
Operating income | | $ | 22,074 | | $ | 18,381 | | $ | 899 | | $ | (6,525 | ) | $ | 34,829 | |
Net income (loss) attributable to the non-controlling partners | | $ | 3,594 | | $ | (530 | ) | $ | (10,240 | ) | $ | (17,083 | ) | $ | (24,259 | ) |
Net loss attributable to the Crosstex Energy, Inc | | $ | (825 | ) | $ | (1,672 | ) | $ | (4,314 | ) | $ | (5,670 | ) | $ | (12,481 | ) |
Basic earnings per common share | | $ | (0.02 | ) | $ | (0.03 | ) | $ | (0.09 | ) | $ | (0.12 | ) | $ | (0.26 | ) |
Diluted earnings per common share | | $ | (0.02 | ) | $ | (0.03 | ) | $ | (0.09 | ) | $ | (0.12 | ) | $ | (0.26 | ) |
2011: | | | | | | | | | | | | | | | | |
Revenues | | $ | 489,770 | | $ | 525,735 | | $ | 517,498 | | $ | 480,939 | | $ | 2,013,942 | |
Operating income | | $ | 19,238 | | $ | 22,243 | | $ | 15,612 | | $ | 17,380 | | $ | 74,473 | |
Net income (loss) attributable to the non-controlling partners | | $ | 1,770 | | $ | 2,648 | | $ | (364 | ) | $ | 674 | | $ | 4,728 | |
Net income (loss) attributable to the Crosstex Energy, Inc | | $ | (1,536 | ) | $ | (1,073 | ) | $ | (1,588 | ) | $ | (1,810 | ) | $ | (6,007 | ) |
Basic earnings per common share | | $ | (0.03 | ) | $ | (0.02 | ) | $ | (0.04 | ) | $ | (0.03 | ) | $ | (0.12 | ) |
Diluted earnings per common share | | $ | (0.03 | ) | $ | (0.02 | ) | $ | (0.04 | ) | $ | (0.03 | ) | $ | (0.12 | ) |
F-46
Table of Contents
Schedule I
CROSSTEX ENERGY, INC. (PARENT COMPANY)
CONDENSED BALANCE SHEETS
| | | | | | | |
| | December 31, | |
|---|
| | 2012 | | 2011 | |
|---|
| | (In thousands)
| |
|---|
ASSETS | | | | | | | |
Current assets: | | | | | | | |
Cash and cash equivalents | | $ | 2,852 | | $ | 6,200 | |
Prepaid expenses and other | | | 120 | | | 14 | |
| | | | | | |
Total current assets | | | 2,972 | | | 6,214 | |
| | | | | | |
Investment in the Partnership | | | 217,425 | | | 234,702 | |
| | | | | | |
Total assets | | $ | 220,397 | | $ | 240,916 | |
| | | | | | |
LIABILITIES AND STOCKHOLDERS' EQUITY | | | | | | | |
Current liabilities: | | | | | | | |
Other current liabilities | | $ | 580 | | $ | 501 | |
| | | | | | |
Total current liabilities | | | 580 | | | 501 | |
| | | | | | |
Deferred tax liability | | | 62,151 | | | 77,995 | |
Stockholders' equity: | | | | | | | |
Common stock | | | 473 | | | 471 | |
Additional paid-in capital | | | 274,635 | | | 244,211 | |
Accumulated deficit | | | (117,583 | ) | | (82,177 | ) |
Accumulated other comprehensive loss | | | 141 | | | (85 | ) |
| | | | | | |
Total stockholders' equity | | | 157,666 | | | 162,420 | |
| | | | | | |
Total liabilities and stockholders' equity | | $ | 220,397 | | $ | 240,916 | |
| | | | | | |
See "Notes to Consolidated Financial Statements" of Crosstex Energy, Inc. included in this report.
F-47
Table of Contents
CROSSTEX ENERGY, INC. (PARENT COMPANY)
CONDENSED STATEMENTS OF OPERATIONS
| | | | | | | | | | |
| | Years ended December 31, | |
|---|
| | 2012 | | 2011 | | 2010 | |
|---|
| | (In thousands, except per unit data)
| |
|---|
Operating income and expenses: | | | | | | | | | | |
Income (loss) from investment in the Partnership | | $ | (16,080 | ) | $ | (7,192 | ) | $ | (16,042 | ) |
General and administrative expenses | | | (3,775 | ) | | (2,715 | ) | | (2,758 | ) |
| | | | | | | | |
Operating income (loss) | | | (19,855 | ) | | (9,907 | ) | | (18,800 | ) |
| | | | | | | | |
Other income (expense): | | | | | | | | | | |
Interest and other income | | | 7 | | | 6 | | | 7 | |
| | | | | | | | |
Income (loss) before income taxes | | | (19,848 | ) | | (9,901 | ) | | (18,793 | ) |
Income tax benefit (provision) | | | 7,367 | | | 3,894 | | | 7,142 | |
| | | | | | | | |
Net income (loss) | | $ | (12,481 | ) | $ | (6,007 | ) | $ | (11,651 | ) |
| | | | | | | | |
Net income (loss) per common share: | | | | | | | | | | |
Basic | | $ | (0.26 | ) | $ | (0.12 | ) | $ | (0.24 | ) |
| | | | | | | | |
Diluted | | $ | (0.26 | ) | $ | (0.12 | ) | $ | (0.24 | ) |
| | | | | | | | |
Weighted average common shares outstanding | | | | | | | | | | |
Basic | | $ | 47,384 | | $ | 47,150 | | $ | 46,732 | |
| | | | | | | | |
Diluted | | $ | 47,384 | | $ | 47,150 | | $ | 46,732 | |
| | | | | | | | |
See "Notes to Consolidated Financial Statements" of Crosstex Energy, Inc. included in this report.
F-48
Table of Contents
CROSSTEX ENERGY, INC. (PARENT COMPANY)
CONDENSED STATEMENTS OF CASH FLOWS
| | | | | | | | | | |
| | Years Ended December 31, | |
|---|
| | 2012 | | 2011 | | 2010 | |
|---|
| | (In thousands)
| |
|---|
Cash flows from operating activities: | | | | | | | | | | |
Net income (loss) | | $ | (12,481 | ) | $ | (6,007 | ) | $ | (11,651 | ) |
Adjustments to reconcile net income (loss) to net cash provided by (used in) operating activities: | | | | | | | | | | |
Loss (income) from investment in the Partnership | | | 16,080 | | | 7,196 | | | 16,041 | |
Deferred tax provision (benefit) | | | (7,367 | ) | | (3,896 | ) | | (7,142 | ) |
Stock-based compensation | | | 277 | | | 249 | | | 292 | |
Changes in assets and liabilities, net of acquisition effects: | | | | | | | | | | |
Accounts receivable, prepaid expenses and other | | | (27 | ) | | (57 | ) | | (6 | ) |
Accounts payable, and other accrued liabilities | | | 79 | | | 238 | | | 71 | |
| | | | | | | | |
Net cash used in operating activities | | | (3,439 | ) | | (2,277 | ) | | (2,395 | ) |
| | | | | | | | |
Cash flows from investing activities: | | | | | | | | | | |
Investment in the Partnership | | | (3,460 | ) | | (163 | ) | | (2,807 | ) |
Distributions from the Partnership | | | 27,270 | | | 22,497 | | | 4,435 | |
| | | | | | | | |
Net cash provided by investing activities | | | 23,810 | | | 22,334 | | | 1,628 | |
| | | | | | | | |
Cash flows from financing activities: | | | | | | | | | | |
Conversion of restricted units, net of units withheld for taxes | | | (794 | ) | | (1,068 | ) | | (705 | ) |
Common dividends paid | | | (22,925 | ) | | (17,872 | ) | | (3,368 | ) |
| | | | | | | | |
Net cash provided by (used in) financing activities | | | (23,719 | ) | | (18,940 | ) | | (4,073 | ) |
| | | | | | | | |
Net increase (decrease) in cash and cash equivalents | | | (3,348 | ) | | 1,117 | | | (4,840 | ) |
Cash, beginning of period | | | 6,200 | | | 5,083 | | | 9,923 | |
| | | | | | | | |
Cash, end of period | | $ | 2,852 | | $ | 6,200 | | $ | 5,083 | |
| | | | | | | | |
See "Notes to Consolidated Financial Statements" of Crosstex Energy, Inc. included in this report.
F-49