
UNITED STATES
SECURITIES AND EXCHANGE COMMISSION
Washington, D.C. 20549
FORM N-CSRS
CERTIFIED SHAREHOLDER REPORT OF REGISTERED
MANAGEMENT INVESTMENT COMPANIES
Investment Company Act file number: 811-21269
Wells Fargo Advantage Income Opportunities Fund
(Exact name of registrant as specified in charter)
525 Market St., San Francisco, CA 94105
(Address of principal executive offices) (Zip code)
C. David Messman
Wells Fargo Funds Management, LLC
525 Market St., San Francisco, CA 94105
(Name and address of agent for service)
Registrant’s telephone number, including area code: 800-222-8222
Date of fiscal year end: April 30
Date of reporting period: October 31, 2013
ITEM 1. REPORT TO STOCKHOLDERS

Wells Fargo Advantage
Income Opportunities Fund

Semi-Annual Report
October 31, 2013

This closed-end fund is no longer offered as an initial public offering and is only offered through broker/ dealers on the secondary market. A closed-end fund is not required to buy its shares back from investors upon request.
Reduce clutter. Save trees.
Sign up for electronic delivery of prospectuses and shareholder reports at wellsfargo.com/advantagedelivery
Contents
The views expressed and any forward-looking statements are as of October 31, 2013, unless otherwise noted, and are those of the Fund managers and/or Wells Fargo Funds Management, LLC. Discussions of individual securities, or the markets generally, or any Wells Fargo Advantage Fund are not intended as individual recommendations. Future events or results may vary significantly from those expressed in any forward-looking statements; the views expressed are subject to change at any time in response to changing circumstances in the market. Wells Fargo Funds Management, LLC and the Fund disclaim any obligation to publicly update or revise any views expressed or forward-looking statements.
NOT FDIC INSURED ¡ NO BANK GUARANTEE ¡ MAY LOSE VALUE
| | | | |
| 2 | | Wells Fargo Advantage Income Opportunities Fund | | Letter to shareholders (unaudited) |

Karla M. Rabusch
President
Wells Fargo Advantage Funds
Fixed-income markets shifted significantly during the period as economic optimism surged in the opening months of 2013, spurring a rally in equities; a rise in U.S. Treasury yields; and, ultimately, significant outperformance from high-yield bonds.
Dear Valued Shareholder:
We are pleased to offer you this semi-annual report for the Wells Fargo Advantage Income Opportunities Fund for the six-month period that ended October 31, 2013. Fixed-income markets shifted significantly during the period as economic optimism surged in the opening months of 2013, spurring a rally in equities; a rise in U.S. Treasury yields; and, ultimately, significant outperformance from high-yield bonds. Most investment-grade bond sectors experienced price declines along with rising Treasury yields during much of 2013. However, below-investment-grade securities tended to perform better as their higher-yield spreads cushioned some of the yield increases from the Treasury markets before rallying later in the period. On the whole, U.S. high-yield corporate securities generated strong positive returns during the period, overcoming significant price corrections in June 2013.
The return of economic optimism in 2013 led to declines in bond prices as yields rose higher.
Before the period began, U.S. Treasury yields began to rise higher on optimistic expectations for a strengthening U.S. economy during the opening months of 2013. Consequently, fixed-income security yields shifted higher and prices declined across much of the U.S. investment-grade bond sectors, most notably in the longer-maturity ranges, as investors began to reprice bond yields for potential interest-rate increases in upcoming years. Nonetheless, high-yield securities generally withstood the rate shocks and continued to provide positive returns.
These trends continued into May 2013 which was rattled by geopolitical events, domestic terrorism in Boston, and uncertain global economic conditions. U.S. Treasury prices increased sharply, temporarily erasing all of the price losses endured in January 2013 and, in fact, crossing over into positive gains. Meanwhile, U.S. high-yield bonds continued to generate positive returns for the month.
Unfortunately, this streak for high yield would end in May 2013 as a massive rally in the U.S. equity markets erupted, driving U.S. Treasury prices down and this time dragging with them the high-yield bond market. These market moves resulted in the largest monthly losses across the investment-grade bond markets in nearly five years, while high yield saw its first monthly decline in just over a year.
The depreciating trends for bonds deepened in mid-June 2013 on comments from Federal Reserve (Fed) Chairman Bernanke that tapering of the Fed’s bond-buying programs could begin later in the year and that the programs may end completely around mid-2014. For the last two weeks of June 2013, that debate appeared to play out daily, as volatility buffeted both the equity and bond markets, finally capitulating to yet another sustained rally in equities and a modest retreat in bond prices. Both investment-grade bonds and high-yield bonds posted their worst monthly returns of the year in June 2013—investment-grade securities had their largest quarterly decline in nine years during the second quarter and high yield had its worst quarter since 2011.
In July and August 2013, equity exuberance quieted a bit, and fixed-income markets stabilized. Returns were more mixed, with slightly negative returns in the highest-quality securities to modestly positive in the lower credit tiers. In September and October 2013, investment-grade and high-yield bond markets began generating positive returns yet again, as the Fed backtracked on its intentions to taper quantitative easing, postponing it until 2014 at the
| | | | | | |
| Letter to shareholders (unaudited) | | Wells Fargo Advantage Income Opportunities Fund | | | 3 | |
earliest. Bond markets rallied on the news through the end of the period, and the high-yield bond markets significantly outperformed the investment-grade markets.
On the whole, strong returns in high yield during the final months of the period overcame the sharp price declines during May, June, and August 2013, culminating in positive returns across the high-yield market during the full period. Thus, the theme for the period was a persistent increase in U.S. Treasury yields that pressured fixed-income security prices before relaxing in September and October 2013. High-yield securities benefited from yield cushioning during the yield rises before rallying on strong investor appetite for equity-correlated returns.
Don’t let short-term uncertainty derail long-term investment goals.
Periods of uncertainty can present challenges, but experience has taught us that maintaining long-term investment goals can be an effective way to plan for the future. Although diversification cannot guarantee an investment profit or prevent losses, we believe it can be an effective way to manage investment risk and potentially smooth out overall portfolio performance. We encourage investors to know their investments and to understand that appropriate levels of risk-taking may unlock opportunities.
Thank you for choosing to invest with Wells Fargo Advantage Funds. We appreciate your confidence in us and remain committed to helping you meet your financial needs. For current information about your fund investments, contact your investment professional, visit our website at wellsfargoadvantagefunds.com, or call us directly at 1-800-222-8222. We are available 24 hours a day, 7 days a week.
Sincerely,

Karla M. Rabusch
President
Wells Fargo Advantage Funds
The theme for the period was a persistent increase in U.S. Treasury yields that pressured fixed-income security prices before relaxing in September and October 2013. High-yield securities benefited from yield cushioning during the yield rises before rallying on strong investor appetite for equity-correlated returns.
| | | | |
| 4 | | Wells Fargo Advantage Income Opportunities Fund | | Performance highlights (unaudited) |
Investment objective
The Fund seeks a high level of current income. Capital appreciation is a secondary objective.
Adviser
Wells Fargo Funds Management, LLC
Subadviser
Wells Capital Management Incorporated
Portfolio managers
Niklas Nordenfelt, CFA
Phillip Susser
Average annual total returns1 (%) as of October 31, 2013
| | | | | | | | | | | | |
| | | 1 year | | | 5 year | | | 10 year | |
Based on market value | | | (4.29 | ) | | | 21.10 | | | | 6.85 | |
Based on net asset value (NAV) per share | | | 7.90 | | | | 18.99 | | | | 7.32 | |
Figures quoted represent past performance, which is no guarantee of future results, and do not reflect taxes that a shareholder may pay on fund distributions or the sales of fund shares. Investment return and principal value of an investment will fluctuate so that an investor’s shares, when sold, may be worth more or less than their original cost. Current performance may be lower or higher than the performance data quoted, which assumes the reinvestment of dividends and capital gains. Performance figures of the Fund do not reflect brokerage commissions that a shareholder would pay on the purchase and sale of shares. If taxes and such brokerage commissions had been reflected, performance would have been lower. To obtain performance information current to the most recent month-end, please call 1-800-222-8222.
The Adviser has committed through February 25, 2014, to waive fees and/or reimburse expenses to the extent necessary to limit the Fund’s borrowing expenses to an amount that is 0.05% lower than what the borrowing expenses would have been if the Fund had not redeemed its Auction Market Preferred Shares. The Fund’s gross and net expense ratios for the six months ended October 31, 2013, were 1.27% and 1.02%, respectively, which includes 0.07% of interest expense. Without this waiver and/or reimbursement, the Fund’s returns would have been lower.
| | |
| Comparison of NAV vs. market value2 | | |
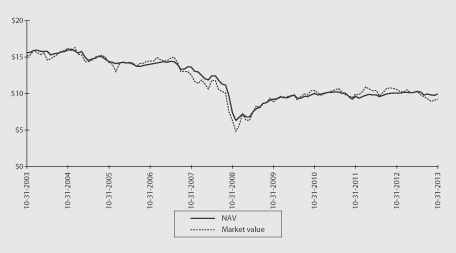
The Fund is leveraged through a secured debt borrowing facility and also may incur leverage by issuing preferred shares in the future. The use of leverage results in certain risks including, among others, the likelihood of greater volatility of net asset value and the market price of common shares. Derivatives involve additional risks including interest rate risk, credit risk, the risk of improper valuation, and the risk of non-correlation to the relevant instruments that they are designed to hedge or to closely track. Bond values fluctuate in response to the financial condition of individual issuers, general market and economic conditions, and changes in interest rates. In general, when interest rates rise, bond values fall and investors may lose principal value. High-yield securities have a greater risk of default and tend to be more volatile than higher-rated debt securities.
| 1. | Total returns based on market value are calculated assuming a purchase of common stock on the first day and a sale on the last day of the period reported. Total returns based on NAV are calculated based on the NAV at the beginning of the period and end of the period. Dividends and distributions, if any, are assumed for the purposes of these calculations to be reinvested at prices obtained under the Fund’s Automatic Dividend Reinvestment Plan. |
| 2. | This chart does not reflect any brokerage commissions on the purchase and sale of the Fund’s common stock. Dividends and distributions have the effect of reducing the Fund’s NAV. |
| | | | | | |
| Performance highlights (unaudited) | | Wells Fargo Advantage Income Opportunities Fund | | | 5 | |
MANAGER’S DISCUSSION
The Fund’s return based on market value was -4.29% during the 6 months ended October 31, 2013. During the same period, the Fund’s returns based on NAV was 7.90%.
Overview
Fixed-income markets generally struggled as Treasury yields rose in anticipation of a reduction in the extraordinarily loose Federal Reserve (Fed) policies. Expectations that tapering in the Fed’s monthly $85 billion asset purchase program would cause rates to rise led to investors selling rate-sensitive bonds. The high-yield market was initially weak yet managed to generate positive returns in spite of the rate volatility with credit spreads declining during the period. Ultimately, the Fed surprised the markets by postponing the tapering, resulting in a strong rally across all asset classes, including high-yield bonds in the last few months of the period. Although the Fed’s decision was based on weaker-than-hoped-for economic data, the continuation of a low-interest-rate environment spurred investor confidence and provided support to the market.
| | | | |
| Ten largest holdings3 (%) as of October 31, 2013 | |
Texas Competitive Electric Holdings LLC, 3.71%, 10-10-2014 | | | 3.31 | |
Dell Incorporated, 0.00% 4-30-2020 | | | 2.66 | |
Sprint Capital Corporation, 6.88%, 11-15-2028 | | | 2.59 | |
Jabil Circuit Incorporated, 8.25%, 3-15-2018 | | | 2.29 | |
Greektown Superholdings Incorporated Series A,
13.00%, 7-1-2015 | | | 1.93 | |
Nielsen Finance LLC, 7.75%, 10-15-2018 | | | 1.83 | |
CCM Merger Incorporated, 9.13%, 5-1-2019 | | | 1.65 | |
Sabine Pass LNG LP, 7.50%, 11-30-2016 | | | 1.55 | |
Local TV Finance LLC, 9.25%, 6-15-2015 | | | 1.44 | |
Sabine Pass LNG LP, 6.50%, 11-1-2020 | | | 1.39 | |
|
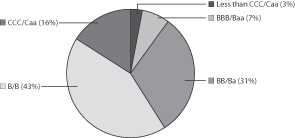
| Credit quality4 as of October 31, 2013 |
|
|
Contributors to performance
The Fund benefited from the continuation of accommodative monetary policy. The interest earned on higher yields combined with a decline in spreads helped offset market shifts to higher interest rates. Compared with the broad high-yield market, the Fund’s lower exposure to interest-rate sensitivity was a positive contributor to performance. A number of well-performing securities and a significant allocation to the information technology sector also aided performance.
Detractors to performance
The Fund continued to be positioned conservatively with less higher-yielding and more higher-quality issues than the broad high-yield market. Although the market was volatile during the period, the volatility was almost entirely due to rising interest rates. Credit continued to outperform with lower-quality securities outperforming amid a market
that continues to benefit from the Fed-induced low interest rates. In addition, Fund holdings within the pipelines and electric utilities sectors detracted from performance due to the impact from low natural gas prices.
| 3. | The ten largest holdings are calculated based on the value of the securities divided by total net assets of the Fund. Holdings are subject to change and may have changed since the date specified. |
| 4. | Credit quality is subject to change and is calculated based on the total market value of bonds held by the Fund. The ratings indicated are from Standard & Poor’s, Moody’s Investors Service, and/or Fitch Ratings Ltd. Credit Quality Ratings. Credit quality ratings apply to the underlying holdings of the Fund and not the Fund itself. Standard & Poor’s rates the creditworthiness of bonds on a scale of AAA (highest) to D (lowest). Ratings from A to CCC may be modified by the addition of a plus (+) or minus (–) sign to show relative standing within the rating categories. Standard & Poor’s rates the creditworthiness of short-term notes from SP-1 (highest) to SP-3 (lowest). Moody’s rates the creditworthiness of bonds on a scale of Aaa (highest) to C (lowest). Ratings Aa to B may be modified by the addition of a number 1 (highest) to 3 (lowest) to show relative standing within the ratings categories. Moody’s rates the creditworthiness of short-term U.S. tax-exempt municipal securities from MIG 1/VMIG 1 (highest) to SG (lowest). Fitch rates the creditworthiness of bonds on a scale of AAA (highest) to D (lowest). If a security was rated by all three rating agencies, the middle rating was utilized. If rated by two of three rating agencies, the lower rating was utilized and if rated by one of the agencies that rating was utilized. We generally define higher quality bonds as bonds that have a rating of BBB/Baa and above and lower quality bonds as bonds with a rating below BBB/Baa. |
| | | | |
| 6 | | Wells Fargo Advantage Income Opportunities Fund | | Performance highlights (unaudited) |
|
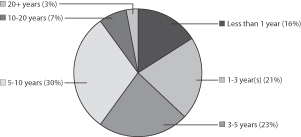
| Effective maturity distribution5 as of October 31, 2013 |
|
|
Management outlook
The Fund’s focus is on bottom-up security selection of bonds issued by companies with high intrinsic value, which, in our view, limits downside risk. Much of the high-yield market performance has been driven by the extraordinarily low interest rates, which allow highly indebted and highly leveraged companies to meet interest expense and term out maturities. The Fund continues to avoid companies that rely on such conditions to persist. As a result of the strategy of avoiding uncompensated risk, the Fund maintains its
lower-volatility profile. We do not feel it is prudent to stretch for yield in the current environment because of the relatively low compensation for taking incremental risk. That said, conditions are quite benign for the high-yield market, with the bulk of issuers enjoying high interest coverage ratios (ability to generate sufficient cash to meet interest expense) and low near-term maturities. We believe default rates may remain well below historical averages and high yield may continue to outperform rate-sensitive fixed-income markets.
| 5. | Effective maturity distribution is subject to change and are calculated based on the total long-term investments of the Fund. |
| | | | | | |
| Portfolio of investments—October 31, 2013 (unaudited) | | Wells Fargo Advantage Income Opportunities Fund | | | 7 | |
| | | | | | | | | | | | | | | | |
| Security name | | | | | | | | Shares | | | Value | |
| | | | | | | | | | | | | | | | |
| | | | |
Common Stocks: 0.18% | | | | | | | | | | | | | | | | |
| | | | |
Consumer Discretionary: 0.00% | | | | | | | | | | | | | | | | |
| | | | |
| Hotels, Restaurants & Leisure: 0.00% | | | | | | | | | | | | | | | | |
Trump Entertainment Resorts Incorporated †(a)(i) | | | | | | | | | | | 2,149 | | | $ | 0 | |
| | | | | | | | | | | | | | | | |
| | | | |
Telecommunication Services: 0.18% | | | | | | | | | | | | | | | | |
| | | | |
| Diversified Telecommunication Services: 0.18% | | | | | | | | | | | | | | | | |
Fairpoint Communications Incorporated † | | | | | | | | | | | 134,376 | | | | 1,255,072 | |
| | | | | | | | | | | | | | | | |
| | | | |
Total Common Stocks (Cost $3,109,765) | | | | | | | | | | | | | | | 1,255,072 | |
| | | | | | | | | | | | | | | | |
| | | | |
| | | Interest rate | | | Maturity date | | | Principal | | | | |
| Corporate Bonds and Notes: 108.62% | | | | | | | | | | | | | | | | |
| | | | |
Consumer Discretionary: 25.36% | | | | | | | | | | | | | | | | |
| | | | |
| Auto Components: 2.37% | | | | | | | | | | | | | | | | |
Allison Transmission Incorporated 144A | | | 7.13 | % | | | 5-15-2019 | | | $ | 8,015,000 | | | | 8,636,162 | |
Cooper Tire & Rubber Company | | | 7.63 | | | | 3-15-2027 | | | | 4,305,000 | | | | 4,132,800 | |
Cooper Tire & Rubber Company | | | 8.00 | | | | 12-15-2019 | | | | 150,000 | | | | 154,125 | |
Goodyear Tire & Rubber Company | | | 7.00 | | | | 5-15-2022 | | | | 700,000 | | | | 752,500 | |
United Rentals North America Incorporated | | | 5.75 | | | | 7-15-2018 | | | | 2,675,000 | | | | 2,868,938 | |
| | | | |
| | | | | | | | | | | | | | | 16,544,525 | |
| | | | | | | | | | | | | | | | |
| | | | |
| Diversified Consumer Services: 2.30% | | | | | | | | | | | | | | | | |
Ceridian HCM Holding Incorporated 144A | | | 11.00 | | | | 3-15-2021 | | | | 75,000 | | | | 87,750 | |
Service Corporation International | | | 6.75 | | | | 4-1-2016 | | | | 1,250,000 | | | | 1,365,625 | |
Service Corporation International | | | 7.00 | | | | 6-15-2017 | | | | 1,250,000 | | | | 1,401,563 | |
Service Corporation International | | | 7.00 | | | | 5-15-2019 | | | | 1,125,000 | | | | 1,209,375 | |
Service Corporation International | | | 7.50 | | | | 4-1-2027 | | | | 7,078,000 | | | | 7,573,460 | |
Service Corporation International | | | 7.63 | | | | 10-1-2018 | | | | 1,100,000 | | | | 1,259,500 | |
Service Corporation International | | | 8.00 | | | | 11-15-2021 | | | | 885,000 | | | | 1,014,431 | |
Sotheby’s 144A | | | 5.25 | | | | 10-1-2022 | | | | 2,265,000 | | | | 2,163,075 | |
| | | | |
| | | | | | | | | | | | | | | 16,074,779 | |
| | | | | | | | | | | | | | | | |
| | | | |
| Hotels, Restaurants & Leisure: 8.26% | | | | | | | | | | | | | | | | |
Burger King Corporation | | | 9.88 | | | | 10-15-2018 | | | | 1,600,000 | | | | 1,794,000 | |
CCM Merger Incorporated 144A | | | 9.13 | | | | 5-1-2019 | | | | 10,830,000 | | | | 11,479,800 | |
CityCenter Holdings LLC | | | 7.63 | | | | 1-15-2016 | | | | 2,050,000 | | | | 2,155,575 | |
CityCenter Holdings LLC (PIK at 11.50%) ¥ | | | 10.75 | | | | 1-15-2017 | | | | 4,816,305 | | | | 5,163,079 | |
DineEquity Incorporated | | | 9.50 | | | | 10-30-2018 | | | | 8,475,000 | | | | 9,428,437 | |
Greektown Superholdings Incorporated Series A | | | 13.00 | | | | 7-1-2015 | | | | 12,887,000 | | | | 13,450,806 | |
Greektown Superholdings Incorporated Series B | | | 13.00 | | | | 7-1-2015 | | | | 1,475,000 | | | | 1,539,531 | |
Hilton Worldwide Finance LLC 144A | | | 5.63 | | | | 10-15-2021 | | | | 320,000 | | | | 328,800 | |
Pinnacle Entertainment Incorporated | | | 7.50 | | | | 4-15-2021 | | | | 6,187,000 | | | | 6,790,232 | |
Ruby Tuesday Incorporated | | | 7.63 | | | | 5-15-2020 | | | | 3,405,000 | | | | 3,268,800 | |
Scientific Games Corporation | | | 9.25 | | | | 6-15-2019 | | | | 1,130,000 | | | | 1,218,988 | |
Speedway Motorsports Incorporated | | | 6.75 | | | | 2-1-2019 | | | | 980,000 | | | | 1,040,025 | |
| | | | |
| | | | | | | | | | | | | | | 57,658,073 | |
| | | | | | | | | | | | | | | | |
The accompanying notes are an integral part of these financial statements.
| | | | |
| 8 | | Wells Fargo Advantage Income Opportunities Fund | | Portfolio of investments—October 31, 2013 (unaudited) |
| | | | | | | | | | | | | | | | |
| Security name | | Interest rate | | | Maturity date | | | Principal | | | Value | |
| | | | | | | | | | | | | | | | |
| | | | |
| Household Durables: 0.19% | | | | | | | | | | | | | | | | |
American Greetings Corporation | | | 7.38 | % | | | 12-1-2021 | | | $ | 950,000 | | | $ | 947,625 | |
Tempur Sealy International Incorporated | | | 6.88 | | | | 12-15-2020 | | | | 325,000 | | | | 346,938 | |
| | | | |
| | | | | | | | | | | | | | | 1,294,563 | |
| | | | | | | | | | | | | | | | |
| | | | |
| Media: 9.99% | | | | | | | | | | | | | | | | |
Allbritton Communications Company | | | 8.00 | | | | 5-15-2018 | | | | 3,274,000 | | | | 3,503,180 | |
Cablevision Systems Corporation | | | 8.63 | | | | 9-15-2017 | | | | 2,975,000 | | | | 3,465,876 | |
CCO Holdings LLC | | | 8.13 | | | | 4-30-2020 | | | | 746,000 | | | | 816,870 | |
Cinemark USA Incorporated | | | 7.38 | | | | 6-15-2021 | | | | 1,525,000 | | | | 1,669,875 | |
CSC Holdings LLC | | | 7.63 | | | | 7-15-2018 | | | | 1,145,000 | | | | 1,319,611 | |
CSC Holdings LLC | | | 7.88 | | | | 2-15-2018 | | | | 1,650,000 | | | | 1,909,875 | |
CSC Holdings LLC | | | 8.63 | | | | 2-15-2019 | | | | 635,000 | | | | 750,887 | |
DISH DBS Corporation | | | 5.13 | | | | 5-1-2020 | | | | 575,000 | | | | 582,187 | |
DISH DBS Corporation | | | 7.88 | | | | 9-1-2019 | | | | 2,260,000 | | | | 2,627,250 | |
DreamWorks Animation SKG Incorporated 144A | | | 6.88 | | | | 8-15-2020 | | | | 2,690,000 | | | | 2,861,487 | |
EchoStar DBS Corporation | | | 7.13 | | | | 2-1-2016 | | | | 1,160,000 | | | | 1,281,800 | |
EchoStar DBS Corporation | | | 7.75 | | | | 5-31-2015 | | | | 650,000 | | | | 710,937 | |
Gray Television Incorporated 144A | | | 7.50 | | | | 10-1-2020 | | | | 1,615,000 | | | | 1,691,713 | |
Gray Television Incorporated | | | 7.50 | | | | 10-1-2020 | | | | 6,920,000 | | | | 7,248,700 | |
Lamar Media Corporation | | | 5.88 | | | | 2-1-2022 | | | | 1,785,000 | | | | 1,843,013 | |
Lamar Media Corporation | | | 7.88 | | | | 4-15-2018 | | | | 4,090,000 | | | | 4,355,850 | |
Lamar Media Corporation Series C | | | 9.75 | | | | 4-1-2014 | | | | 620,000 | | | | 641,700 | |
LIN Television Corporation | | | 6.38 | | | | 1-15-2021 | | | | 500,000 | | | | 510,000 | |
LIN Television Corporation | | | 8.38 | | | | 4-15-2018 | | | | 3,475,000 | | | | 3,705,219 | |
Live Nation Entertainment Incorporated 144A | | | 7.00 | | | | 9-1-2020 | | | | 330,000 | | | | 350,625 | |
Local TV Finance LLC 144A | | | 9.25 | | | | 6-15-2015 | | | | 9,943,218 | | | | 10,042,650 | |
Lynx I Corporation 144A | | | 5.38 | | | | 4-15-2021 | | | | 605,000 | | | | 608,025 | |
Lynx II Corporation 144A | | | 6.38 | | | | 4-15-2023 | | | | 605,000 | | | | 620,125 | |
National CineMedia LLC | | | 6.00 | | | | 4-15-2022 | | | | 3,635,000 | | | | 3,780,400 | |
National CineMedia LLC | | | 7.88 | | | | 7-15-2021 | | | | 1,150,000 | | | | 1,270,750 | |
Nexstar Broadcasting Group Incorporated 144A | | | 6.88 | | | | 11-15-2020 | | | | 3,510,000 | | | | 3,667,950 | |
Regal Cinemas Corporation | | | 8.63 | | | | 7-15-2019 | | | | 6,665,000 | | | | 7,198,200 | |
Regal Entertainment Group | | | 5.75 | | | | 6-15-2023 | | | | 665,000 | | | | 656,688 | |
| | | | |
| | | | | | | | | | | | | | | 69,691,443 | |
| | | | | | | | | | | | | | | | |
| | | | |
| Specialty Retail: 2.25% | | | | | | | | | | | | | | | | |
ABC Supply Company Incorporated 144A | | | 5.63 | | | | 4-15-2021 | | | | 730,000 | | | | 739,125 | |
Ahern Rentals Incorporated 144A | | | 9.50 | | | | 6-15-2018 | | | | 1,985,000 | | | | 2,128,912 | |
L Brands Incorporated | | | 6.63 | | | | 4-1-2021 | | | | 925,000 | | | | 1,017,500 | |
Neiman Marcus Group Limited 144A | | | 8.00 | | | | 10-15-2021 | | | | 340,000 | | | | 348,075 | |
Penske Auto Group Incorporated | | | 5.75 | | | | 10-1-2022 | | | | 1,965,000 | | | | 1,960,088 | |
RadioShack Corporation | | | 6.75 | | | | 5-15-2019 | | | | 3,698,000 | | | | 2,449,925 | |
Rent-A-Center Incorporated | | | 6.63 | | | | 11-15-2020 | | | | 2,765,000 | | | | 2,920,531 | |
Toys “R” Us Property Company II LLC | | | 8.50 | | | | 12-1-2017 | | | | 4,025,000 | | | | 4,155,813 | |
| | | | |
| | | | | | | | | | | | | | | 15,719,969 | |
| | | | | | | | | | | | | | | | |
The accompanying notes are an integral part of these financial statements.
| | | | | | |
| Portfolio of investments—October 31, 2013 (unaudited) | | Wells Fargo Advantage Income Opportunities Fund | | | 9 | |
| | | | | | | | | | | | | | | | |
| Security name | | Interest rate | | | Maturity date | | | Principal | | | Value | |
| | | | | | | | | | | | | | | | |
| | | | |
Energy: 20.68% | | | | | | | | | | | | | | | | |
| | | | |
| Energy Equipment & Services: 5.44% | | | | | | | | | | | | | | | | |
Cleaver Brooks Incorporated 144A | | | 8.75 | % | | | 12-15-2019 | | | $ | 475,000 | | | $ | 516,562 | |
Dresser-Rand Group Incorporated | | | 6.50 | | | | 5-1-2021 | | | | 1,825,000 | | | | 1,939,063 | |
Era Group Incorporated | | | 7.75 | | | | 12-15-2022 | | | | 4,285,000 | | | | 4,359,987 | |
Forum Energy Technologies Incorporated 144A | | | 6.25 | | | | 10-1-2021 | | | | 315,000 | | | | 328,387 | |
Gulfmark Offshore Incorporated | | | 6.38 | | | | 3-15-2022 | | | | 7,433,000 | | | | 7,488,748 | |
Hornbeck Offshore Services Incorporated | | | 5.00 | | | | 3-1-2021 | | | | 4,395,000 | | | | 4,318,088 | |
Hornbeck Offshore Services Incorporated | | | 5.88 | | | | 4-1-2020 | | | | 840,000 | | | | 863,100 | |
NGPL PipeCo LLC 144A | | | 7.77 | | | | 12-15-2037 | | | | 8,690,000 | | | | 7,538,575 | |
Oil States International Incorporated | | | 6.50 | | | | 6-1-2019 | | | | 3,759,000 | | | | 4,003,335 | |
PHI Incorporated | | | 8.63 | | | | 10-15-2018 | | | | 5,955,000 | | | | 6,356,963 | |
Pride International Incorporated | | | 8.50 | | | | 6-15-2019 | | | | 210,000 | | | | 268,012 | |
| | | | |
| | | | | | | | | | | | | | | 37,980,820 | |
| | | | | | | | | | | | | | | | |
| | | | |
| Oil, Gas & Consumable Fuels: 15.24% | | | | | | | | | | | | | | | | |
Crestwood Midstream Partners LP 144A%% | | | 6.13 | | | | 3-1-2022 | | | | 475,000 | | | | 485,687 | |
CVR Refining LLC/Coffeyville Finance Incorporated | | | 6.50 | | | | 11-1-2022 | | | | 2,850,000 | | | | 2,857,125 | |
Denbury Resources Incorporated | | | 4.63 | | | | 7-15-2023 | | | | 675,000 | | | | 622,687 | |
Denbury Resources Incorporated | | | 6.38 | | | | 8-15-2021 | | | | 700,000 | | | | 747,250 | |
Denbury Resources Incorporated | | | 8.25 | | | | 2-15-2020 | | | | 5,965,000 | | | | 6,561,500 | |
El Paso Corporation | | | 6.50 | | | | 9-15-2020 | | | | 1,155,000 | | | | 1,233,847 | |
El Paso Corporation | | | 7.00 | | | | 6-15-2017 | | | | 3,183,000 | | | | 3,592,538 | |
El Paso Corporation | | | 7.25 | | | | 6-1-2018 | | | | 3,149,000 | | | | 3,565,969 | |
El Paso Corporation | | | 7.42 | | | | 2-15-2037 | | | | 1,820,000 | | | | 1,723,600 | |
El Paso Corporation | | | 7.80 | | | | 8-1-2031 | | | | 3,050,000 | | | | 3,147,478 | |
Energy Transfer Equity LP | | | 7.50 | | | | 10-15-2020 | | | | 5,950,000 | | | | 6,872,249 | |
Exterran Partners LP 144A | | | 6.00 | | | | 4-1-2021 | | | | 3,100,000 | | | | 3,084,500 | |
Ferrellgas LP | | | 9.13 | | | | 10-1-2017 | | | | 2,300,000 | | | | 2,417,300 | |
Inergy Midstream LP 144A | | | 6.00 | | | | 12-15-2020 | | | | 1,230,000 | | | | 1,257,675 | |
Kinder Morgan Energy 144A | | | 6.00 | | | | 1-15-2018 | | | | 125,000 | | | | 136,080 | |
Murphy Oil USA Incorporated 144A | | | 6.00 | | | | 8-15-2023 | | | | 635,000 | | | | 644,525 | |
Northern Tier Energy LLC | | | 7.13 | | | | 11-15-2020 | | | | 2,390,000 | | | | 2,437,800 | |
Petrohawk Energy Corporation | | | 7.88 | | | | 6-1-2015 | | | | 2,045,000 | | | | 2,093,569 | |
Petrohawk Energy Corporation | | | 10.50 | | | | 8-1-2014 | | | | 1,065,000 | | | | 1,091,625 | |
Pioneer Natural Resources Company | | | 7.50 | | | | 1-15-2020 | | | | 3,170,000 | | | | 3,930,486 | |
Plains Exploration & Production Company | | | 8.63 | | | | 10-15-2019 | | | | 6,380,000 | | | | 7,059,802 | |
Rockies Express Pipeline LLC 144A | | | 5.63 | | | | 4-15-2020 | | | | 6,255,000 | | | | 5,269,838 | |
Rockies Express Pipeline LLC 144A | | | 6.00 | | | | 1-15-2019 | | | | 630,000 | | | | 559,125 | |
Rockies Express Pipeline LLC 144A | | | 6.88 | | | | 4-15-2040 | | | | 10,760,000 | | | | 8,123,800 | |
Rockies Express Pipeline LLC 144A | | | 7.50 | | | | 7-15-2038 | | | | 4,425,000 | | | | 3,628,500 | |
Sabine Pass LNG LP 144A | | | 5.63 | | | | 2-1-2021 | | | | 1,425,000 | | | | 1,439,250 | |
Sabine Pass LNG LP 144A | | | 5.63 | | | | 4-15-2023 | | | | 1,425,000 | | | | 1,396,500 | |
Sabine Pass LNG LP | | | 6.50 | | | | 11-1-2020 | | | | 9,260,000 | | | | 9,676,700 | |
Sabine Pass LNG LP | | | 7.50 | | | | 11-30-2016 | | | | 9,675,000 | | | | 10,799,719 | |
Semgroup LP 144A | | | 7.50 | | | | 6-15-2021 | | | | 4,200,000 | | | | 4,399,500 | |
Suburban Propane Partners LP | | | 7.38 | | | | 3-15-2020 | | | | 1,475,000 | | | | 1,581,938 | |
Suburban Propane Partners LP | | | 7.38 | | | | 8-1-2021 | | | | 592,000 | | | | 637,880 | |
Suburban Propane Partners LP | | | 7.50 | | | | 10-1-2018 | | | | 802,000 | | | | 861,148 | |
Tesoro Corporation | | | 9.75 | | | | 6-1-2019 | | | | 2,185,000 | | | | 2,387,113 | |
| | | | |
| | | | | | | | | | | | | | | 106,324,303 | |
| | | | | | | | | | | | | | | | |
The accompanying notes are an integral part of these financial statements.
| | | | |
| 10 | | Wells Fargo Advantage Income Opportunities Fund | | Portfolio of investments—October 31, 2013 (unaudited) |
| | | | | | | | | | | | | | | | |
| Security name | | Interest rate | | | Maturity date | | | Principal | | | Value | |
| | | | | | | | | | | | | | | | |
| | | | |
Financials: 21.74% | | | | | | | | | | | | | | | | |
| | | | |
| Commercial Banks: 1.66% | | | | | | | | | | | | | | | | |
CIT Group Incorporated 144A | | | 5.25 | % | | | 4-1-2014 | | | $ | 1,205,000 | | | $ | 1,224,581 | |
CIT Group Incorporated | | | 5.25 | | | | 3-15-2018 | | | | 875,000 | | | | 946,094 | |
CIT Group Incorporated 144A | | | 5.50 | | | | 2-15-2019 | | | | 2,225,000 | | | | 2,408,561 | |
Emigrant Bancorp Incorporated 144A | | | 6.25 | | | | 6-15-2014 | | | | 6,950,000 | | | | 7,019,500 | |
| | | | |
| | | | | | | | | | | | | | | 11,598,736 | |
| | | | | | | | | | | | | | | | |
| | | | |
| Consumer Finance: 12.96% | | | | | | | | | | | | | | | | |
Ally Financial Incorporated | | | 5.50 | | | | 2-15-2017 | | | | 1,325,000 | | | | 1,431,000 | |
Ally Financial Incorporated | | | 6.75 | | | | 12-1-2014 | | | | 1,869,000 | | | | 1,967,122 | |
Ally Financial Incorporated | | | 7.50 | | | | 12-31-2013 | | | | 6,855,000 | | | | 6,911,896 | |
Ally Financial Incorporated | | | 7.50 | | | | 9-15-2020 | | | | 1,930,000 | | | | 2,258,100 | |
Ally Financial Incorporated | | | 8.00 | | | | 3-15-2020 | | | | 1,545,000 | | | | 1,834,687 | |
Ally Financial Incorporated | | | 8.30 | | | | 2-12-2015 | | | | 8,820,000 | | | | 9,558,675 | |
American General Finance Corporation | | | 5.40 | | | | 12-1-2015 | | | | 2,650,000 | | | | 2,775,875 | |
American General Finance Corporation | | | 5.75 | | | | 9-15-2016 | | | | 2,325,000 | | | | 2,458,687 | |
American General Finance Corporation | | | 6.50 | | | | 9-15-2017 | | | | 550,000 | | | | 583,000 | |
BMC Software Finance Incorporated 144A | | | 8.13 | | | | 7-15-2021 | | | | 1,025,000 | | | | 1,083,937 | |
Clearwire Communications Finance Corporation 144A | | | 12.00 | | | | 12-1-2015 | | | | 5,420,000 | | | | 5,620,540 | |
Ford Motor Credit Company LLC | | | 8.00 | | | | 12-15-2016 | | | | 200,000 | | | | 237,556 | |
General Motors Financial Company Incorporated | | | 6.75 | | | | 6-1-2018 | | | | 2,770,000 | | | | 3,137,025 | |
Homer City Funding LLC (PIK at 9.23%) ¥ | | | 8.73 | | | | 10-1-2026 | | | | 3,084,040 | | | | 3,184,271 | |
International Lease Finance Corporation 144A | | | 6.75 | | | | 9-1-2016 | | | | 2,200,000 | | | | 2,444,750 | |
International Lease Finance Corporation 144A | | | 7.13 | | | | 9-1-2018 | | | | 1,015,000 | | | | 1,168,519 | |
International Lease Finance Corporation | | | 8.63 | | | | 9-15-2015 | | | | 1,700,000 | | | | 1,891,250 | |
Level 3 Financing Incorporated | | | 10.00 | | | | 2-1-2018 | | | | 4,555,000 | | | | 4,868,156 | |
Nielsen Finance LLC | | | 4.50 | | | | 10-1-2020 | | | | 200,000 | | | | 196,000 | |
Nielsen Finance LLC | | | 7.75 | | | | 10-15-2018 | | | | 11,690,000 | | | | 12,742,100 | |
SLM Corporation | | | 7.25 | | | | 1-25-2022 | | | | 1,600,000 | | | | 1,712,000 | |
SLM Corporation | | | 8.00 | | | | 3-25-2020 | | | | 6,460,000 | | | | 7,380,550 | |
SLM Corporation | | | 8.45 | | | | 6-15-2018 | | | | 3,110,000 | | | | 3,630,925 | |
Springleaf Finance Corporation 144A | | | 6.00 | | | | 6-1-2020 | | | | 3,800,000 | | | | 3,743,000 | |
Springleaf Finance Corporation | | | 6.90 | | | | 12-15-2017 | | | | 6,950,000 | | | | 7,523,375 | |
Springleaf Finance Corporation 144A | | | 7.75 | | | | 10-1-2021 | | | | 100,000 | | | | 107,500 | |
| | | | |
| | | | | | | | | | | | | | | 90,450,496 | |
| | | | | | | | | | | | | | | | |
| | | | |
| Diversified Financial Services: 2.52% | | | | | | | | | | | | | | | | |
Denali Borrower/Finance Corporation 144A | | | 5.63 | | | | 10-15-2020 | | | | 7,150,000 | | | | 7,078,500 | |
MPH Intermediate Holding Company (PIK at 9.13%) 144A¥ | | | 8.38 | | | | 8-1-2018 | | | | 575,000 | | | | 597,281 | |
Neuberger Berman Group LLC 144A | | | 5.63 | | | | 3-15-2020 | | | | 900,000 | | | | 933,750 | |
Neuberger Berman Group LLC 144A | | | 5.88 | | | | 3-15-2022 | | | | 1,125,000 | | | | 1,150,313 | |
Nuveen Investments Incorporated | | | 5.50 | | | | 9-15-2015 | | | | 6,830,000 | | | | 6,625,100 | |
Nuveen Investments Incorporated 144A | | | 9.13 | | | | 10-15-2017 | | | | 1,220,000 | | | | 1,183,400 | |
| | | | |
| | | | | | | | | | | | | | | 17,568,344 | |
| | | | | | | | | | | | | | | | |
| | | | |
| Insurance: 0.15% | | | | | | | | | | | | | | | | |
Fidelity & Guaranty Life Holdings Incorporated 144A | | | 6.38 | | | | 4-1-2021 | | | | 995,000 | | | | 1,037,287 | |
| | | | | | | | | | | | | | | | |
The accompanying notes are an integral part of these financial statements.
| | | | | | |
| Portfolio of investments—October 31, 2013 (unaudited) | | Wells Fargo Advantage Income Opportunities Fund | | | 11 | |
| | | | | | | | | | | | | | | | |
| Security name | | Interest rate | | | Maturity date | | | Principal | | | Value | |
| | | | | | | | | | | | | | | | |
| | | | |
| Real Estate Management & Development: 1.18% | | | | | | | | | | | | | | | | |
Hockey Incorporated 144A | | | 7.88 | % | | | 10-1-2021 | | | $ | 4,560,000 | | | $ | 4,708,200 | |
Onex Corporation 144A | | | 7.75 | | | | 1-15-2021 | | | | 3,480,000 | | | | 3,549,600 | |
| | | | |
| | | | | | | | | | | | | | | 8,257,800 | |
| | | | | | | | | | | | | | | | |
| | | | |
| REITs: 3.27% | | | | | | | | | | | | | | | | |
DuPont Fabros Technology Incorporated 144A | | | 5.88 | | | | 9-15-2021 | | | | 7,670,000 | | | | 7,861,750 | |
Omega Healthcare Investors Incorporated | | | 6.75 | | | | 10-15-2022 | | | | 3,375,000 | | | | 3,695,625 | |
Sabra Health Care Incorporated | | | 5.38 | | | | 6-1-2023 | | | | 1,425,000 | | | | 1,392,938 | |
Sabra Health Care Incorporated | | | 8.13 | | | | 11-1-2018 | | | | 1,853,000 | | | | 2,010,505 | |
The Geo Group Incorporated | | | 5.13 | | | | 4-1-2023 | | | | 3,000,000 | | | | 2,812,500 | |
The Geo Group Incorporated 144A | | | 5.88 | | | | 1-15-2022 | | | | 4,350,000 | | | | 4,382,625 | |
The Geo Group Incorporated | | | 6.63 | | | | 2-15-2021 | | | | 605,000 | | | | 640,544 | |
| | | | |
| | | | | | | | | | | | | | | 22,796,487 | |
| | | | | | | | | | | | | | | | |
| | | | |
Health Care: 5.24% | | | | | | | | | | | | | | | | |
| | | | |
| Health Care Equipment & Supplies: 0.39% | | | | | | | | | | | | | | | | |
Hologic Incorporated | | | 6.25 | | | | 8-1-2020 | | | | 2,590,000 | | | | 2,751,875 | |
| | | | | | | | | | | | | | | | |
| | | | |
| Health Care Providers & Services: 4.60% | | | | | | | | | | | | | | | | |
Aviv Healthcare Properties LP 144A | | | 6.00 | | | | 10-15-2021 | | | | 850,000 | | | | 871,250 | |
Aviv Healthcare Properties LP | | | 7.75 | | | | 2-15-2019 | | | | 3,725,000 | | | | 4,018,344 | |
Capella Healthcare Incorporated | | | 9.25 | | | | 7-1-2017 | | | | 1,455,000 | | | | 1,562,306 | |
Centene Corporation | | | 5.75 | | | | 6-1-2017 | | | | 1,925,000 | | | | 2,054,937 | |
DaVita HealthCare Partners Incorporated | | | 5.75 | | | | 8-15-2022 | | | | 1,360,000 | | | | 1,395,700 | |
DaVita HealthCare Partners Incorporated | | | 6.38 | | | | 11-1-2018 | | | | 140,000 | | | | 146,825 | |
Fresenius Medical Care Holdings Incorporated 144A | | | 5.63 | | | | 7-31-2019 | | | | 1,800,000 | | | | 1,926,000 | |
Fresenius Medical Care Holdings Incorporated | | | 6.88 | | | | 7-15-2017 | | | | 700,000 | | | | 791,000 | |
HCA Incorporated | | | 5.88 | | | | 3-15-2022 | | | | 750,000 | | | | 789,375 | |
HCA Incorporated | | | 6.50 | | | | 2-15-2020 | | | | 5,675,000 | | | | 6,313,438 | |
HCA Incorporated | | | 7.50 | | | | 11-15-2095 | | | | 1,350,000 | | | | 1,215,000 | |
HCA Incorporated | | | 8.50 | | | | 4-15-2019 | | | | 975,000 | | | | 1,046,906 | |
Health Management Associates Incorporated | | | 6.13 | | | | 4-15-2016 | | | | 475,000 | | | | 522,500 | |
HealthSouth Corporation | | | 5.75 | | | | 11-1-2024 | | | | 100,000 | | | | 99,250 | |
HealthSouth Corporation | | | 7.25 | | | | 10-1-2018 | | | | 675,000 | | | | 725,625 | |
HealthSouth Corporation | | | 8.13 | | | | 2-15-2020 | | | | 820,000 | | | | 903,025 | |
MPT Operating Partnership LP | | | 6.38 | | | | 2-15-2022 | | | | 1,325,000 | | | | 1,368,063 | |
MPT Operating Partnership LP | | | 6.88 | | | | 5-1-2021 | | | | 3,175,000 | | | | 3,413,125 | |
Multiplan Incorporated 144A | | | 9.88 | | | | 9-1-2018 | | | | 565,000 | | | | 624,325 | |
Select Medical Corporation | | | 6.38 | | | | 6-1-2021 | | | | 1,560,000 | | | | 1,505,400 | |
Tenet Healthcare Corporation 144A | | | 6.00 | | | | 10-1-2020 | | | | 355,000 | | | | 375,413 | |
Tenet Healthcare Corporation 144A | | | 8.13 | | | | 4-1-2022 | | | | 400,000 | | | | 438,000 | |
| | | | |
| | | | | | | | | | | | | | | 32,105,807 | |
| | | | | | | | | | | | | | | | |
| | | | |
| Health Care Technology: 0.12% | | | | | | | | | | | | | | | | |
Healthcare Technology Intermediate Incorporated (PIK at 8.13%) 144A¥ | | | 7.38 | | | | 9-1-2018 | | | | 790,000 | | | | 816,663 | |
| | | | | | | | | | | | | | | | |
| | | | |
| Pharmaceuticals: 0.13% | | | | | | | | | | | | | | | | |
Pinnacle Incorporated 144A | | | 9.50 | | | | 10-1-2023 | | | | 835,000 | | | | 880,925 | |
| | | | | | | | | | | | | | | | |
The accompanying notes are an integral part of these financial statements.
| | | | |
| 12 | | Wells Fargo Advantage Income Opportunities Fund | | Portfolio of investments—October 31, 2013 (unaudited) |
| | | | | | | | | | | | | | | | |
| Security name | | Interest rate | | | Maturity date | | | Principal | | | Value | |
| | | | | | | | | | | | | | | | |
| | | | |
Industrials: 5.52% | | | | | | | | | | | | | | | | |
| | | | |
| Aerospace & Defense: 0.30% | | | | | | | | | | | | | | | | |
TransDigm Group Incorporated | | | 7.75 | % | | | 12-15-2018 | | | $ | 1,939,000 | | | $ | 2,084,425 | |
| | | | | | | | | | | | | | | | |
| | | | |
| Air Freight & Logistics: 0.69% | | | | | | | | | | | | | | | | |
Bristow Group Incorporated | | | 6.25 | | | | 10-15-2022 | | | | 4,555,000 | | | | 4,782,750 | |
| | | | | | | | | | | | | | | | |
| | | | |
| Airlines: 0.53% | | | | | | | | | | | | | | | | |
Aviation Capital Group Corporation 144A | | | 6.75 | | | | 4-6-2021 | | | | 2,190,000 | | | | 2,357,465 | |
Aviation Capital Group Corporation 144A | | | 7.13 | | | | 10-15-2020 | | | | 1,210,000 | | | | 1,342,127 | |
| | | | |
| | | | | | | | | | | | | | | 3,699,592 | |
| | | | | | | | | | | | | | | | |
| | | | |
| Commercial Services & Supplies: 1.26% | | | | | | | | | | | | | | | | |
ADT Corporation 144A | | | 6.25 | | | | 10-15-2021 | | | | 990,000 | | | | 1,050,637 | |
Covanta Holding Corporation | | | 6.38 | | | | 10-1-2022 | | | | 900,000 | | | | 929,786 | |
Interface Incorporated | | | 7.63 | | | | 12-1-2018 | | | | 270,000 | | | | 293,625 | |
Iron Mountain Incorporated | | | 5.75 | | | | 8-15-2024 | | | | 475,000 | | | | 453,625 | |
Iron Mountain Incorporated | | | 6.00 | | | | 8-15-2023 | | | | 3,560,000 | | | | 3,622,300 | |
Iron Mountain Incorporated | | | 8.38 | | | | 8-15-2021 | | | | 2,244,000 | | | | 2,423,520 | |
| | | | |
| | | | | | | | | | | | | | | 8,773,493 | |
| | | | | | | | | | | | | | | | |
| | | | |
| Machinery: 0.97% | | | | | | | | | | | | | | | | |
Columbus McKinnon Corporation | | | 7.88 | | | | 2-1-2019 | | | | 1,575,000 | | | | 1,691,156 | |
H&E Equipment Services Incorporated | | | 7.00 | | | | 9-1-2022 | | | | 4,680,000 | | | | 5,101,200 | |
| | | | |
| | | | | | | | | | | | | | | 6,792,356 | |
| | | | | | | | | | | | | | | | |
| | | | |
| Professional Services: 0.63% | | | | | | | | | | | | | | | | |
Interactive Data Corporation | | | 10.25 | | | | 8-1-2018 | | | | 4,005,000 | | | | 4,425,525 | |
| | | | | | | | | | | | | | | | |
| | | | |
| Trading Companies & Distributors: 0.84% | | | | | | | | | | | | | | | | |
Ashtead Capital Incorporated 144A | | | 6.50 | | | | 7-15-2022 | | | | 5,435,000 | | | | 5,829,037 | |
| | | | | | | | | | | | | | | | |
| | | | |
| Transportation Infrastructure: 0.30% | | | | | | | | | | | | | | | | |
Florida East Coast Railway Corporation | | | 8.13 | | | | 2-1-2017 | | | | 1,465,000 | | | | 1,541,912 | |
Watco Companies LLC 144A | | | 6.38 | | | | 4-1-2023 | | | | 570,000 | | | | 564,300 | |
| | | | |
| | | | | | | | | | | | | | | 2,106,212 | |
| | | | | | | | | | | | | | | | |
| | | | |
Information Technology: 7.86% | | | | | | | | | | | | | | | | |
| | | | |
| Communications Equipment: 0.63% | | | | | | | | | | | | | | | | |
Avaya Incorporated | | | 9.75 | | | | 11-1-2015 | | | | 1,150,000 | | | | 1,138,500 | |
CyrusOne LP | | | 6.38 | | | | 11-15-2022 | | | | 500,000 | | | | 503,750 | |
Lucent Technologies Incorporated | | | 6.45 | | | | 3-15-2029 | | | | 3,100,000 | | | | 2,728,000 | |
| | | | |
| | | | | | | | | | | | | | | 4,370,250 | |
| | | | | | | | | | | | | | | | |
| | | | |
| Electronic Equipment, Instruments & Components: 2.35% | | | | | | | | | | | | | | | | |
CDW Financial Corporation | | | 12.54 | | | | 10-12-2017 | | | | 372,000 | | | | 386,880 | |
Jabil Circuit Incorporated | | | 8.25 | | | | 3-15-2018 | | | | 13,532,000 | | | | 16,001,590 | |
| | | | |
| | | | | | | | | | | | | | | 16,388,470 | |
| | | | | | | | | | | | | | | | |
The accompanying notes are an integral part of these financial statements.
| | | | | | |
| Portfolio of investments—October 31, 2013 (unaudited) | | Wells Fargo Advantage Income Opportunities Fund | | | 13 | |
| | | | | | | | | | | | | | | | |
| Security name | | Interest rate | | | Maturity date | | | Principal | | | Value | |
| | | | | | | | | | | | | | | | |
| | | | |
| Internet Software & Services: 0.06% | | | | | | | | | | | | | | | | |
Equinix Incorporated | | | 7.00 | % | | | 7-15-2021 | | | $ | 125,000 | | | $ | 136,562 | |
Verisign Incorporated | | | 4.63 | | | | 5-1-2023 | | | | 290,000 | | | | 282,388 | |
| | | | |
| | | | | | | | | | | | | | | 418,950 | |
| | | | | | | | | | | | | | | | |
| | | | |
| IT Services: 4.45% | | | | | | | | | | | | | | | | |
Audatex North America Incorporated 144A | | | 6.00 | | | | 6-15-2021 | | | | 2,300,000 | | | | 2,374,750 | |
Audatex North America Incorporated 144A%% | | | 6.13 | | | | 11-1-2023 | | | | 695,000 | | | | 705,425 | |
Audatex North America Incorporated | | | 6.75 | | | | 6-15-2018 | | | | 1,375,000 | | | | 1,470,287 | |
Fidelity National Information Services Incorporated | | | 7.88 | | | | 7-15-2020 | | | | 3,200,000 | | | | 3,524,726 | |
First Data Corporation 144A | | | 11.75 | | | | 8-15-2021 | | | | 3,505,000 | | | | 3,566,337 | |
First Data Corporation 144A | | | 7.38 | | | | 6-15-2019 | | | | 1,325,000 | | | | 1,426,031 | |
First Data Corporation | | | 11.25 | | | | 3-31-2016 | | | | 9,555,000 | | | | 9,602,775 | |
SunGard Data Systems Incorporated | | | 7.38 | | | | 11-15-2018 | | | | 7,230,000 | | | | 7,663,800 | |
SunGard Data Systems Incorporated | | | 7.63 | | | | 11-15-2020 | | | | 650,000 | | | | 707,688 | |
| | | | |
| | | | | | | | | | | | | | | 31,041,819 | |
| | | | | | | | | | | | | | | | |
| | | | |
| Software: 0.37% | | | | | | | | | | | | | | | | |
Activision Blizzard Incorporated 144A | | | 5.63 | | | | 9-15-2021 | | | | 1,155,000 | | | | 1,195,425 | |
Activision Blizzard Incorporated 144A | | | 6.13 | | | | 9-15-2023 | | | | 285,000 | | | | 297,825 | |
Nuance Communications Incorporated 144A | | | 5.38 | | | | 8-15-2020 | | | | 1,130,000 | | | | 1,121,525 | |
| | | | |
| | | | | | | | | | | | | | | 2,614,775 | |
| | | | | | | | | | | | | | | | |
| | | | |
Materials: 1.79% | | | | | | | | | | | | | | | | |
| | | | |
| Chemicals: 0.20% | | | | | | | | | | | | | | | | |
Celanese US Holdings LLC | | | 5.88 | | | | 6-15-2021 | | | | 440,000 | | | | 470,800 | |
Chemtura Corporation | | | 5.75 | | | | 7-15-2021 | | | | 950,000 | | | | 961,875 | |
| | | | |
| | | | | | | | | | | | | | | 1,432,675 | |
| | | | | | | | | | | | | | | | |
| | | | |
| Containers & Packaging: 1.10% | | | | | | | | | | | | | | | | |
Ball Corporation | | | 5.75 | | | | 5-15-2021 | | | | 400,000 | | | | 422,500 | |
Ball Corporation | | | 6.75 | | | | 9-15-2020 | | | | 375,000 | | | | 407,812 | |
Crown Americas LLC | | | 6.25 | | | | 2-1-2021 | | | | 515,000 | | | | 545,900 | |
Crown Cork & Seal Company Incorporated | | | 7.38 | | | | 12-15-2026 | | | | 300,000 | | | | 332,250 | |
Crown Cork & Seal Company Incorporated (i) | | | 7.50 | | | | 12-15-2096 | | | | 1,225,000 | | | | 1,145,375 | |
Owens-Illinois Incorporated | | | 7.80 | | | | 5-15-2018 | | | | 837,000 | | | | 965,689 | |
Sealed Air Corporation 144A | | | 6.88 | | | | 7-15-2033 | | | | 1,715,000 | | | | 1,612,100 | |
Silgan Holdings Incorporated | | | 5.00 | | | | 4-1-2020 | | | | 2,250,000 | | | | 2,238,750 | |
| | | | |
| | | | | | | | | | | | | | | 7,670,376 | |
| | | | | | | | | | | | | | | | |
| | | | |
| Metals & Mining: 0.00% | | | | | | | | | | | | | | | | |
Indalex Holdings Corporation (s)(a)(i) | | | 11.50 | | | | 2-1-2014 | | | | 5,985,000 | | | | 0 | |
| | | | | | | | | | | | | | | | |
| | | | |
| Paper & Forest Products: 0.49% | | | | | | | | | | | | | | | | |
Georgia-Pacific LLC | | | 8.88 | | | | 5-15-2031 | | | | 2,430,000 | | | | 3,424,227 | |
| | | | | | | | | | | | | | | | |
The accompanying notes are an integral part of these financial statements.
| | | | |
| 14 | | Wells Fargo Advantage Income Opportunities Fund | | Portfolio of investments—October 31, 2013 (unaudited) |
| | | | | | | | | | | | | | | | |
| Security name | | Interest rate | | | Maturity date | | | Principal | | | Value | |
| | | | | | | | | | | | | | | | |
| | | | |
Telecommunication Services: 15.37% | | | | | | | | | | | | | | | | |
| | | | |
| Diversified Telecommunication Services: 7.41% | | | | | | | | | | | | | | | | |
Citizens Communications Company | | | 7.88 | % | | | 1-15-2027 | | | $ | 4,205,000 | | | $ | 4,162,950 | |
Frontier Communications Corporation | | | 8.13 | | | | 10-1-2018 | | | | 1,980,000 | | | | 2,281,950 | |
Frontier Communications Corporation | | | 8.25 | | | | 4-15-2017 | | | | 2,380,000 | | | | 2,751,875 | |
Frontier Communications Corporation | | | 8.50 | | | | 4-15-2020 | | | | 1,000,000 | | | | 1,142,500 | |
GCI Incorporated | | | 6.75 | | | | 6-1-2021 | | | | 4,145,000 | | | | 4,010,287 | |
GCI Incorporated | | | 8.63 | | | | 11-15-2019 | | | | 8,750,000 | | | | 9,296,875 | |
Qwest Corporation | | | 7.13 | | | | 11-15-2043 | | | | 1,810,000 | | | | 1,756,596 | |
Qwest Corporation | | | 7.25 | | | | 9-15-2025 | | | | 2,755,000 | | | | 2,935,750 | |
Qwest Corporation | | | 7.63 | | | | 8-3-2021 | | | | 440,000 | | | | 465,300 | |
Syniverse Holdings Incorporated | | | 9.13 | | | | 1-15-2019 | | | | 8,545,000 | | | | 9,249,963 | |
TW Telecommunications Holdings Incorporated 144A | | | 5.38 | | | | 10-1-2022 | | | | 990,000 | | | | 987,525 | |
TW Telecommunications Holdings Incorporated | | | 5.38 | | | | 10-1-2022 | | | | 6,525,000 | | | | 6,508,688 | |
Windstream Corporation | | | 7.88 | | | | 11-1-2017 | | | | 5,380,000 | | | | 6,153,375 | |
| | | | |
| | | | | | | | | | | | | | | 51,703,634 | |
| | | | | | | | | | | | | | | | |
| | | | |
| Wireless Telecommunication Services: 7.96% | | | | | | | | | | | | | | | | |
Cricket Communications Incorporated | | | 7.75 | | | | 10-15-2020 | | | | 3,835,000 | | | | 4,381,487 | |
Crown Castle International Corporation | | | 5.25 | | | | 1-15-2023 | | | | 4,385,000 | | | | 4,341,150 | |
Crown Castle International Corporation | | | 7.13 | | | | 11-1-2019 | | | | 220,000 | | | | 237,600 | |
MetroPCS Wireless Incorporated 144A | | | 6.25 | | | | 4-1-2021 | | | | 290,000 | | | | 303,413 | |
MetroPCS Wireless Incorporated | | | 6.63 | | | | 11-15-2020 | | | | 5,910,000 | | | | 6,249,825 | |
MetroPCS Wireless Incorporated 144A | | | 6.63 | | | | 4-1-2023 | | | | 825,000 | | | | 863,156 | |
MetroPCS Wireless Incorporated | | | 7.88 | | | | 9-1-2018 | | | | 3,015,000 | | | | 3,256,200 | |
SBA Telecommunications Corporation | | | 5.63 | | | | 10-1-2019 | | | | 270,000 | | | | 277,425 | |
SBA Telecommunications Corporation | | | 5.75 | | | | 7-15-2020 | | | | 2,795,000 | | | | 2,906,800 | |
SBA Telecommunications Corporation | | | 8.25 | | | | 8-15-2019 | | | | 93,000 | | | | 100,789 | |
Sprint Capital Corporation | | | 6.88 | | | | 11-15-2028 | | | | 19,000,000 | | | | 18,050,000 | |
Sprint Capital Corporation | | | 8.75 | | | | 3-15-2032 | | | | 6,270,000 | | | | 6,787,275 | |
Sprint Corporation 144A | | | 7.25 | | | | 9-15-2021 | | | | 330,000 | | | | 355,575 | |
Sprint Corporation 144A | | | 7.88 | | | | 9-15-2023 | | | | 330,000 | | | | 358,050 | |
Sprint Nextel Corporation 144A | | | 9.00 | | | | 11-15-2018 | | | | 750,000 | | | | 909,375 | |
Sprint Nextel Corporation | | | 11.50 | | | | 11-15-2021 | | | | 1,200,000 | | | | 1,563,000 | |
T-Mobile USA Incorporated | | | 6.46 | | | | 4-28-2019 | | | | 265,000 | | | | 280,900 | |
T-Mobile USA Incorporated | | | 6.54 | | | | 4-28-2020 | | | | 275,000 | | | | 291,500 | |
T-Mobile USA Incorporated | | | 6.63 | | | | 4-28-2021 | | | | 1,510,000 | | | | 1,596,825 | |
T-Mobile USA Incorporated | | | 6.73 | | | | 4-28-2022 | | | | 1,445,000 | | | | 1,526,281 | |
T-Mobile USA Incorporated | | | 6.84 | | | | 4-28-2023 | | | | 850,000 | | | | 898,875 | |
| | | | |
| | | | | | | | | | | | | | | 55,535,501 | |
| | | | | | | | | | | | | | | | |
| | | | |
Utilities: 5.06% | | | | | | | | | | | | | | | | |
| | | | |
| Electric Utilities: 2.92% | | | | | | | | | | | | | | | | |
Energy Future Holdings Corporation | | | 10.00 | | | | 12-1-2020 | | | | 150,000 | | | | 157,500 | |
Energy Future Intermediate Holding Company LLC 144A | | | 6.88 | | | | 8-15-2017 | | | | 875,000 | | | | 894,688 | |
IPALCO Enterprises Incorporated | | | 5.00 | | | | 5-1-2018 | | | | 2,050,000 | | | | 2,142,250 | |
IPALCO Enterprises Incorporated 144A | | | 7.25 | | | | 4-1-2016 | | | | 3,783,000 | | | | 4,161,300 | |
Mirant Mid-Atlantic LLC Series C | | | 10.06 | | | | 12-30-2028 | | | | 7,560,525 | | | | 8,411,084 | |
Otter Tail Corporation | | | 9.00 | | | | 12-15-2016 | | | | 3,985,000 | | | | 4,635,882 | |
| | | | |
| | | | | | | | | | | | | | | 20,402,704 | |
| | | | | | | | | | | | | | | | |
The accompanying notes are an integral part of these financial statements.
| | | | | | |
| Portfolio of investments—October 31, 2013 (unaudited) | | Wells Fargo Advantage Income Opportunities Fund | | | 15 | |
| | | | | | | | | | | | | | | | |
| Security name | | Interest rate | | | Maturity date | | | Principal | | | Value | |
| | | | | | | | | | | | | | | | |
| | | | |
| Gas Utilities: 0.56% | | | | | | | | | | | | | | | | |
AmeriGas Finance LLC | | | 6.50 | % | | | 5-20-2021 | | | $ | 75,000 | | | $ | 80,250 | |
AmeriGas Finance LLC | | | 6.75 | | | | 5-20-2020 | | | | 1,675,000 | | | | 1,825,750 | |
AmeriGas Finance LLC | | | 7.00 | | | | 5-20-2022 | | | | 1,840,000 | | | | 1,987,200 | |
| | | | |
| | | | | | | | | | | | | | | 3,893,200 | |
| | | | | | | | | | | | | | | | |
| | | | |
| Independent Power Producers & Energy Traders: 1.58% | | | | | | | | | | | | | | | | |
Calpine Corporation 144A | | | 6.00 | | | | 1-15-2022 | | | | 715,000 | | | | 741,812 | |
NRG Energy Incorporated | | | 8.50 | | | | 6-15-2019 | | | | 3,675,000 | | | | 3,959,813 | |
NSG Holdings LLC 144A | | | 7.75 | | | | 12-15-2025 | | | | 3,640,000 | | | | 3,867,500 | |
Reliant Energy Incorporated | | | 9.24 | | | | 7-2-2017 | | | | 1,621,527 | | | | 1,670,173 | |
Reliant Energy Incorporated | | | 9.68 | | | | 7-2-2026 | | | | 780,000 | | | | 811,200 | |
| | | | |
| | | | | | | | | | | | | | | 11,050,498 | |
| | | | | | | | | | | | | | | | |
| | | | |
Total Corporate Bonds and Notes (Cost $725,283,714) | | | | | | | | | | | | | | | 757,993,364 | |
| | | | | | | | | | | | | | | | |
| | | | |
| | | Dividend yield | | | | | | Shares | | | | |
| Preferred Stocks: 0.31% | | | | | | | | | | | | | | | | |
| | | | |
Financials: 0.31% | | | | | | | | | | | | | | | | |
| | | | |
| Diversified Financial Services: 0.31% | | | | | | | | | | | | | | | | |
GMAC Capital Trust I ± | | | 8.13 | | | | | | | | 81,784 | | | | 2,196,718 | |
| | | | | | | | | | | | | | | | |
| | | | |
Total Preferred Stocks (Cost $2,078,248) | | | | | | | | | | | | | | | 2,196,718 | |
| | | | | | | | | | | | | | | | |
| | | | |
| | | Interest rate | | | | | | Principal | | | | |
| | | | |
Term Loans: 14.14% | | | | | | | | | | | | | | | | |
Advantage Sales & Marketing LLC | | | 8.25 | | | | 6-17-2018 | | | $ | 846,429 | | | | 853,835 | |
Alliance Laundry Systems LLC | | | 9.50 | | | | 12-10-2019 | | | | 3,407,755 | | | | 3,439,720 | |
Applied Systems Incorporated | | | 8.25 | | | | 6-8-2017 | | | | 680,000 | | | | 682,836 | |
Capital Automotive LP | | | 4.00 | | | | 4-5-2019 | | | | 5,105,779 | | | | 5,132,891 | |
Capital Automotive LP | | | 6.00 | | | | 4-30-2020 | | | | 2,450,000 | | | | 2,520,437 | |
CBAC Borrower LLC | | | 8.25 | | | | 7-2-2020 | | | | 1,965,000 | | | | 2,023,950 | |
CCM Merger Incorporated | | | 5.00 | | | | 3-1-2017 | | | | 4,604,130 | | | | 4,627,150 | |
Centaur LLC | | | 8.75 | | | | 2-20-2020 | | | | 3,135,000 | | | | 3,168,952 | |
Dell Incorporated < | | | 0.00 | | | | 4-30-2020 | | | | 18,645,000 | | | | 18,530,333 | |
Federal-Mogul Corporation | | | 2.12 | | | | 12-27-2014 | | | | 2,000,071 | | | | 1,979,710 | |
Federal-Mogul Corporation | | | 2.12 | | | | 12-27-2015 | | | | 1,534,579 | | | | 1,518,957 | |
Focus Brands Incorporated | | | 10.25 | | | | 8-21-2018 | | | | 4,124,203 | | | | 4,175,755 | |
Four Seasons Holdings Incorporated | | | 6.25 | | | | 12-24-2020 | | | | 550,000 | | | | 563,750 | |
HHI Holdings LLC | | | 5.00 | | | | 10-5-2018 | | | | 3,348,865 | | | | 3,368,388 | |
Learfield Communications Incorporated | | | 8.75 | | | | 10-9-2021 | | | | 165,000 | | | | 168,300 | |
Level 3 Financing Incorporated | | | 4.00 | | | | 1-15-2020 | | | | 5,750,000 | | | | 5,773,978 | |
LTS Buyer LLC | | | 8.00 | | | | 4-12-2021 | | | | 85,000 | | | | 86,063 | |
nTelos Incorporated | | | 5.75 | | | | 11-9-2019 | | | | 1,120,715 | | | | 1,124,918 | |
Philadelphia Energy Solutions LLC | | | 6.25 | | | | 4-4-2018 | | | | 4,736,200 | | | | 4,238,899 | |
Sedgwick CMS Holdings Incorporated | | | 8.00 | | | | 12-12-2018 | | | | 850,000 | | | | 863,813 | |
Spin Holdco Incorporated | | | 4.25 | | | | 11-14-2019 | | | | 1,850,000 | | | | 1,845,375 | |
Springleaf Finance Corporation | | | 4.75 | | | | 9-30-2019 | | | | 775,000 | | | | 782,425 | |
Tallgrass Energy Partners LP | | | 5.25 | | | | 11-13-2018 | | | | 2,358,360 | | | | 2,373,099 | |
The accompanying notes are an integral part of these financial statements.
| | | | |
| 16 | | Wells Fargo Advantage Income Opportunities Fund | | Portfolio of investments—October 31, 2013 (unaudited) |
| | | | | | | | | | | | | | | | |
| Security name | | Interest rate | | | Maturity date | | | Principal | | | Value | |
| | | | | | | | | | | | | | | | |
| | | | |
Term Loans (continued) | | | | | | | | | | | | | | | | |
Texas Competitive Electric Holdings LLC | | | 3.71 | % | | | 10-10-2014 | | | $ | 34,355,889 | | | $ | 23,111,550 | |
TWCC Holdings Corporation | | | 7.00 | | | | 6-26-2020 | | | | 330,000 | | | | 338,045 | |
United Surgical Partners International Incorporated | | | 4.75 | | | | 4-3-2019 | | | | 2,216,418 | | | | 2,223,068 | |
W3 Company | | | 9.25 | | | | 9-13-2020 | | | | 488,775 | | | | 497,329 | |
WASH Multifamily Laundry Systems LLC | | | 5.25 | | | | 2-21-2019 | | | | 2,641,725 | | | | 2,648,329 | |
| | | | |
Total Term Loans (Cost $107,570,400) | | | | | | | | | | | | | | | 98,661,855 | |
| | | | | | | | | | | | | | | | |
| | | | |
Yankee Corporate Bonds and Notes: 6.38% | | | | | | | | | | | | | | | | |
| | | | |
Consumer Discretionary: 0.23% | | | | | | | | | | | | | | | | |
| | | | |
| Media: 0.23% | | | | | | | | | | | | | | | | |
Videotron Limited | | | 5.00 | | | | 7-15-2022 | | | | 745,000 | | | | 731,963 | |
Videotron Limited | | | 6.38 | | | | 12-15-2015 | | | | 100,000 | | | | 100,500 | |
Videotron Limited | | | 9.13 | | | | 4-15-2018 | | | | 714,000 | | | | 750,593 | |
| | | | |
| | | | | | | | | | | | | | | 1,583,056 | |
| | | | | | | | | | | | | | | | |
| | | | |
Energy: 0.29% | | | | | | | | | | | | | | | | |
| | | | |
| Oil, Gas & Consumable Fuels: 0.29% | | | | | | | | | | | | | | | | |
Griffin Coal Mining Company Limited 144A(s) | | | 9.50 | | | | 12-1-2016 | | | | 2,119,383 | | | | 1,759,087 | |
Griffin Coal Mining Company Limited (s) | | | 9.50 | | | | 12-1-2016 | | | | 290,088 | | | | 240,773 | |
| | | | |
| | | | | | | | | | | | | | | 1,999,860 | |
| | | | | | | | | | | | | | | | |
| | | | |
Financials: 0.44% | | | | | | | | | | | | | | | | |
| | | | |
| Consumer Finance: 0.34% | | | | | | | | | | | | | | | | |
Wind Acquisition Finance SpA 144A | | | 11.75 | | | | 7-15-2017 | | | | 2,205,000 | | | | 2,342,813 | |
| | | | | | | | | | | | | | | | |
| | | | |
| Diversified Financial Services: 0.10% | | | | | | | | | | | | | | | | |
Nielsen Holding and Finance BV 144A | | | 5.50 | | | | 10-1-2021 | | | | 700,000 | | | | 719,250 | |
Preferred Term Securities XII Limited (s)(i) | | | 0.00 | | | | 12-24-2033 | | | | 1,540,000 | | | | 15 | |
| | | | |
| | | | | | | | | | | | | | | 719,265 | |
| | | | | | | | | | | | | | | | |
| | | | |
Health Care: 0.49% | | | | | | | | | | | | | | | | |
| | | | |
| Pharmaceuticals: 0.49% | | | | | | | | | | | | | | | | |
VPII Escrow Corporation 144A | | | 6.75 | | | | 8-15-2018 | | | | 1,120,000 | | | | 1,226,400 | |
VPII Escrow Corporation 144A | | | 7.50 | | | | 7-15-2021 | | | | 1,995,000 | | | | 2,214,450 | |
| | | | |
| | | | | | | | | | | | | | | 3,440,850 | |
| | | | | | | | | | | | | | | | |
| | | | |
Information Technology: 0.79% | | | | | | | | | | | | | | | | |
| | | | |
| Computers & Peripherals: 0.79% | | | | | | | | | | | | | | | | |
Seagate Technology HDD Holdings | | | 6.80 | | | | 10-1-2016 | | | | 1,275,000 | | | | 1,443,938 | |
Seagate Technology HDD Holdings | | | 6.88 | | | | 5-1-2020 | | | | 1,860,000 | | | | 2,041,350 | |
Seagate Technology HDD Holdings | | | 7.00 | | | | 11-1-2021 | | | | 1,805,000 | | | | 1,994,525 | |
| | | | |
| | | | | | | | | | | | | | | 5,479,813 | |
| | | | | | | | | | | | | | | | |
The accompanying notes are an integral part of these financial statements.
| | | | | | |
| Portfolio of investments—October 31, 2013 (unaudited) | | Wells Fargo Advantage Income Opportunities Fund | | | 17 | |
| | | | | | | | | | | | | | | | |
| Security name | | Interest rate | | | Maturity date | | | Principal | | | Value | |
| | | | | | | | | | | | | | | | |
| | | | |
Materials: 0.83% | | | | | | | | | | | | | | | | |
| | | | |
| Metals & Mining: 0.59% | | | | | | | | | | | | | | | | |
Novelis Incorporated | | | 8.38 | % | | | 12-15-2017 | | | $ | 1,100,000 | | | $ | 1,177,000 | |
Novelis Incorporated | | | 8.75 | | | | 12-15-2020 | | | | 2,675,000 | | | | 2,975,938 | |
| | | | |
| | | | | | | | | | | | | | | 4,152,938 | |
| | | | | | | | | | | | | | | | |
| | | | |
| Paper & Forest Products: 0.24% | | | | | | | | | | | | | | | | |
Sappi Limited 144A | | | 7.50 | | | | 6-15-2032 | | | | 2,155,000 | | | | 1,675,513 | |
| | | | | | | | | | | | | | | | |
| | | | |
Telecommunication Services: 3.31% | | | | | | | | | | | | | | | | |
| | | | |
| Diversified Telecommunication Services: 3.09% | | | | | | | | | | | | | | | | |
Intelsat Bermuda Limited 144A | | | 7.75 | | | | 6-1-2021 | | | | 1,985,000 | | | | 2,094,175 | |
Intelsat Bermuda Limited 144A | | | 8.13 | | | | 6-1-2023 | | | | 890,000 | | | | 941,175 | |
Intelsat Jackson Holdings Limited 144A | | | 5.50 | | | | 8-1-2023 | | | | 4,775,000 | | | | 4,607,875 | |
Intelsat Jackson Holdings Limited | | | 7.25 | | | | 4-1-2019 | | | | 6,515,000 | | | | 7,019,913 | |
Intelsat Jackson Holdings Limited | | | 7.50 | | | | 4-1-2021 | | | | 2,214,000 | | | | 2,413,260 | |
Intelsat Jackson Holdings Limited | | | 8.50 | | | | 11-1-2019 | | | | 905,000 | | | | 993,238 | |
Intelsat Jackson Holdings SA | | | 7.25 | | | | 10-15-2020 | | | | 3,225,000 | | | | 3,499,125 | |
| | | | |
| | | | | | | | | | | | | | | 21,568,761 | |
| | | | | | | | | | | | | | | | |
| | | | |
| Wireless Telecommunication Services: 0.22% | | | | | | | | | | | | | | | | |
Telesat Canada Incorporated 144A | | | 6.00 | | | | 5-15-2017 | | | | 1,475,000 | | | | 1,541,375 | |
| | | | | | | | | | | | | | | | |
| | | | |
Total Yankee Corporate Bonds and Notes (Cost $42,818,482) | | | | | | | | | | | | | | | 44,504,244 | |
| | | | | | | | | | | | | | | | |
| | | | |
| | | Yield | | | | | | Shares | | | | |
| | | | |
Short-Term Investments: 4.32% | | | | | | | | | | | | | | | | |
| | | | |
| Investment Companies: 4.32% | | | | | | | | | | | | | | | | |
Wells Fargo Advantage Cash Investment Money Market Fund, Select Class (l)(u)## | | | 0.08 | | | | | | | | 30,116,566 | | | | 30,116,566 | |
| | | | | | | | | | | | | | | | |
| | | | |
Total Short-Term Investments (Cost $30,116,566) | | | | | | | | | | | | | | | 30,116,566 | |
| | | | | | | | | | | | | | | | |
| | | | | | | | |
| Total investments in securities | | | | | | | | |
| (Cost $910,977,175) * | | | 133.95 | % | | | 934,727,819 | |
Other assets and liabilities, net | | | (33.95 | ) | | | (236,887,088 | ) |
| | | | | | | | |
| Total net assets | | | 100.00 | % | | $ | 697,840,731 | |
| | | | | | | | |
The accompanying notes are an integral part of these financial statements.
| | | | |
| 18 | | Wells Fargo Advantage Income Opportunities Fund | | Portfolio of investments—October 31, 2013 (unaudited) |
| † | Non-income-earning security |
| (a) | Security is fair valued by the Management Valuation Team, and in certain instances by the Board of Trustees, in accordance with procedures approved by the Board of Trustees. |
| 144A | Security that may be resold to “qualified institutional buyers” under Rule 144A or security offered pursuant to Section 4(2) of the Securities Act of 1933, as amended. |
| ¥ | A payment-in-kind (PIK) security is a security in which the issuer may make interest or dividend payments in cash or additional securities. These additional securities generally have the same terms as the original holdings. |
| %% | Security issued on a when-issued basis. |
| (s) | Security is currently in default with regards to scheduled interest and/or principal payments. The Fund has stopped accruing interest on this security. |
| ± | Variable rate investment. The rate shown is the rate in effect at period end. |
| < | All or a portion of the position represents an unfunded term loan commitment. |
| (l) | Investment in an affiliate |
| (u) | Rate shown is the 7-day annualized yield at period end. |
| ## | All or a portion of this security has been segregated for when-issued securities or unfunded term loans. |
| * | Cost for federal income tax purposes is $918,958,153 and unrealized appreciation (depreciation) consists of: |
| | | | |
Gross unrealized appreciation | | $ | 49,099,058 | |
Gross unrealized depreciation | | | (33,329,392 | ) |
| | | | |
Net unrealized appreciation | | $ | 15,769,666 | |
The accompanying notes are an integral part of these financial statements.
| | | | | | |
| Statement of assets and liabilities —October 31, 2013 (unaudited) | | Wells Fargo Advantage Income Opportunities Fund | | | 19 | |
| | | | |
| | | | |
| |
Assets | | | | |
Investments | | | | |
In unaffiliated securities, at value (see cost below) | | $ | 904,611,253 | |
In affiliated securities, at value (see cost below) | | | 30,116,566 | |
| | | | |
Total investments, at value (see cost below) | | | 934,727,819 | |
Cash | | | 5,221,111 | |
Receivable for investments sold | | | 1,713,331 | |
Receivable for interest and dividends | | | 15,393,685 | |
Prepaid expenses and other assets | | | 17,001 | |
| | | | |
Total assets | | | 957,072,947 | |
| | | | |
| |
Liabilities | | | | |
Dividends payable | | | 4,826,367 | |
Payable for investments purchased | | | 23,677,776 | |
Secured borrowing payable | | | 230,211,266 | |
Advisory fee payable | | | 315,744 | |
Due to other related parties | | | 39,053 | |
Accrued expenses and other liabilities | | | 162,010 | |
| | | | |
Total liabilities | | | 259,232,216 | |
| | | | |
Total net assets | | $ | 697,840,731 | |
| | | | |
| |
NET ASSETS CONSIST OF | | | | |
Paid-in capital | | $ | 983,331,382 | |
Overdistributed net investment income | | | (7,830,738 | ) |
Accumulated net realized losses on investments | | | (301,410,557 | ) |
Net unrealized gains on investments | | | 23,750,644 | |
| | | | |
Total net assets | | $ | 697,840,731 | |
| | | | |
| |
NET ASSET VALUE PER SHARE | | | | |
Based on $697,840,731 divided by 70,983,001 shares issued and outstanding (100,000,000 shares authorized) | | | $9.83 | |
| | | | |
| |
Investments in unaffiliated securities, at cost | | $ | 880,860,609 | |
| | | | |
Investments in affiliated securities, at cost | | $ | 30,116,566 | |
| | | | |
Total investments, at cost | | $ | 910,977,175 | |
| | | | |
The accompanying notes are an integral part of these financial statements.
| | | | |
| 20 | | Wells Fargo Advantage Income Opportunities Fund | | Statement of operations—six months ended October 31, 2013 (unaudited) |
| | | | |
| | | | |
| |
Investment income | | | | |
Interest | | $ | 33,471,378 | |
Dividends | | | 68,445 | |
Income from affiliated securities | | | 6,226 | |
| | | | |
Total investment income | | | 33,546,049 | |
| | | | |
| |
Expenses | | | | |
Advisory fee | | | 2,805,107 | |
Administration fee | | | 233,759 | |
Custody and accounting fees | | | 28,173 | |
Professional fees | | | 35,840 | |
Shareholder report expenses | | | 50,886 | |
Trustees’ fees and expenses | | | 5,897 | |
Transfer agent fees | | | 13,055 | |
Interest expense | | | 243,915 | |
Secured borrowing fees | | | 1,017,509 | |
Other fees and expenses | | | 27,357 | |
| | | | |
Total expenses | | | 4,461,498 | |
Less: Fee waivers and/or expense reimbursements | | | (881,937 | ) |
| | | | |
Net expenses | | | 3,579,561 | |
| | | | |
Net investment income | | | 29,966,488 | |
| | | | |
| |
REALIZED AND UNREALIZED GAINS (LOSSES) ON INVESTMENTS | | | | |
| |
Net realized gains on investments | | | 3,320,733 | |
Net change in unrealized gains (losses) on investments | | | (29,203,671 | ) |
| | | | |
Net realized and unrealized gains (losses) on investments | | | (25,882,938 | ) |
| | | | |
Net increase in net assets resulting from operations | | $ | 4,083,550 | |
| | | | |
The accompanying notes are an integral part of these financial statements.
| | | | | | |
| Statement of changes in net assets | | Wells Fargo Advantage Income Opportunities Fund | | | 21 | |
| | | | | | | | |
| | | Six months ended
October 31, 2013
(unaudited) | | | Year ended April 30, 2013 | |
| | |
Operations | | | | | | | | |
Net investment income | | $ | 29,966,488 | | | $ | 62,380,589 | |
Net realized gains on investments | | | 3,320,733 | | | | 11,572,543 | |
Net change in unrealized gains (losses) on investments | | | (29,203,671 | ) | | | 27,158,011 | |
| | | | | | | | |
Net increase in net assets resulting from operations | | | 4,083,550 | | | | 101,111,143 | |
| | | | | | | | |
| | |
Distributions to shareholders from | | | | | | | | |
Net investment income | | | (28,961,064 | ) | | | (64,767,000 | ) |
| | | | | | | | |
| | |
Capital share transactions | | | | | | | | |
Net asset value of common shares issued under the Automatic Dividend Reinvestment Plan | | | 162,908 | | | | 2,403,707 | |
| | | | | | | | |
Total increase (decrease) in net assets | | | (24,714,606 | ) | | | 38,747,850 | |
| | | | | | | | |
| | |
Net assets | | | | | | | | |
Beginning of period | | | 722,555,337 | | | | 683,807,487 | |
| | | | | | | | |
End of period | | $ | 697,840,731 | | | $ | 722,555,337 | |
| | | | | | | | |
| | |
Overdistributed net investment income | | $ | (7,830,738 | ) | | $ | (4,920,932 | ) |
| | | | | | | | |
The accompanying notes are an integral part of these financial statements.
| | | | |
| 22 | | Wells Fargo Advantage Income Opportunities Fund | | Statement of cash flows—six months ended October 31, 2013 (unaudited) |
| | | | |
| | | | |
| |
Cash flows from operating activities: | | | | |
Net increase in net assets resulting from operations | | $ | 4,083,550 | |
| |
Adjustments to reconcile net increase in net assets resulting from operations to net cash provided by operating activities: | | | | |
Purchase of investment securities | | | (254,208,973 | ) |
Proceeds from disposition of investment securities | | | 255,640,903 | |
Amortization | | | (1,263,335 | ) |
Purchase of short-term investment securities, net | | | (12,918,997 | ) |
Decrease in dividends and interest receivable | | | 813,438 | |
Decrease in receivable for investments sold | | | 7,370,107 | |
Decrease in prepaid expenses and other assets | | | 82,880 | |
Increase in payable for investments purchased | | | 8,392,169 | |
Increase in advisory fee payable | | | 12,092 | |
Increase in due to other related parties | | | 151 | |
Decrease in accrued expenses and other liabilities | | | (72,949 | ) |
Unrealized losses on investments | | | 29,203,671 | |
Litigation payments received | | | 202,244 | |
Net realized gains on investments | | | (3,320,733 | ) |
| | | | |
Net cash provided by operating activities | | | 34,016,218 | |
| | | | |
| |
Cash flows from financing activities: | | | | |
Cash distributions paid | | | (28,797,275 | ) |
Increase in secured borrowing payable | | | 2,168 | |
| | | | |
Net cash used in financing activities | | | (28,795,107 | ) |
| | | | |
Net increase in cash | | | 5,221,111 | |
| | | | |
| |
Cash: | | | | |
Beginning of period | | $ | 0 | |
| | | | |
End of period | | $ | 5,221,111 | |
| | | | |
| |
Supplemental cash disclosure: | | | | |
Cash paid for interest | | $ | 246,989 | |
| | | | |
| |
Supplemental non-cash financing disclosure: | | | | |
Reinvestment of dividends | | $ | 162,908 | |
| | | | |
The accompanying notes are an integral part of these financial statements.
| | | | | | |
| Financial highlights | | Wells Fargo Advantage Income Opportunities Fund | | | 23 | |
(For a share outstanding throughout each period)
| | | | | | | | | | | | | | | | | | | | | | | | |
| | | Six months ended
October 31, 2013 (unaudited) | | | Year ended April 30 | |
| | | | 2013 | | | 2012 | | | 2011 | | | 2010 | | | 2009 | |
Net asset value, beginning of period | | $ | 10.18 | | | $ | 9.67 | | | $ | 10.11 | | | $ | 9.69 | | | $ | 7.37 | | | $ | 12.32 | |
Net investment income | | | 0.42 | 1 | | | 0.88 | 1 | | | 0.95 | 1 | | | 1.02 | 1 | | | 1.06 | 1 | | | 1.35 | 1 |
Net realized and unrealized gains (losses) on investments | | | (0.36 | ) | | | 0.54 | | | | (0.37 | ) | | | 0.42 | | | | 2.41 | | | | (4.91 | ) |
Distributions to preferred shareholders from | | | | | | | | | | | | | | | | | | | | | | | | |
Net investment income | | | 0.00 | | | | 0.00 | | | | 0.00 | | | | (0.00 | )1,2 | | | (0.01 | )1 | | | (0.08 | )1 |
| | | | | | | | | | | | | | | | | | | | | | | | |
Total from investment operations | | | 0.06 | | | | 1.42 | | | | 0.58 | | | | 1.44 | | | | 3.46 | | | | (3.64 | ) |
Distributions to common shareholders from | | | | | | | | | | | | | | | | | | | | | | | | |
Net investment income | | | (0.41 | ) | | | (0.91 | ) | | | (1.02 | ) | | | (1.02 | ) | | | (1.08 | ) | | | (1.31 | ) |
Tax basis return of capital | | | 0.00 | | | | 0.00 | | | | 0.00 | | | | 0.00 | | | | (0.06 | )1 | | | 0.00 | |
| | | | | | | | | | | | | | | | | | | | | | | | |
Total distributions to common shareholders | | | (0.41 | ) | | | (0.91 | ) | | | (1.02 | ) | | | (1.02 | ) | | | (1.14 | ) | | | (1.31 | ) |
Net asset value, end of period | | $ | 9.83 | | | $ | 10.18 | | | $ | 9.67 | | | $ | 10.11 | | | $ | 9.69 | | | $ | 7.37 | |
Market value, end of period | | $ | 9.14 | | | $ | 10.23 | | | $ | 10.29 | | | $ | 10.38 | | | $ | 9.63 | | | $ | 7.30 | |
Total return based on market value3 | | | (6.62 | )% | | | 8.90 | % | | | 10.03 | % | | | 19.68 | % | | | 49.84 | % | | | (25.48 | )% |
Ratios to average net assets (annualized) | | | | | | | | | | | | | | | | | | | | | | | | |
Gross expenses4 | | | 1.27 | % | | | 1.29 | % | | | 1.35 | % | | | 1.44 | % | | | 1.79 | % | | | 3.09 | % |
Net expenses4 | | | 1.02 | % | | | 1.05 | % | | | 1.03 | % | | | 1.09 | % | | | 1.13 | % | | | 2.30 | % |
Net investment income | | | 8.52 | % | | | 8.89 | % | | | 9.89 | % | | | 10.55 | %5 | | | 11.81 | %5 | | | 14.35 | %5 |
Supplemental data | | | | | | | | | | | | | | | | | | | | | | | | |
Portfolio turnover rate | | | 16 | % | | | 27 | % | | | 25 | % | | | 42 | % | | | 108 | % | | | 88 | % |
Net assets of common shareholders, end of period (000s omitted) | | | $697,841 | | | | $722,555 | | | | $683,807 | | | | $709,850 | | | | $676,144 | | | | $508,602 | |
| | | | | | |
Borrowings outstanding, end of period (000s omitted) | | | $230,000 | | | | $230,000 | | | | $230,000 | | | | $230,000 | | | | N/A | | | | N/A | |
Asset coverage per $1,000 of borrowing, end of period | | | $4,034 | | | | $4,142 | | | | $3,973 | | | | $4,088 | | | | N/A | | | | N/A | |
| | | | | | |
Liquidation value of Preferred Shares, end of period (000s omitted) | | | N/A | | | | N/A | | | | N/A | | | | N/A | | | | $196,000 | | | | $196,000 | |
Asset coverage ratio for Preferred Shares, end of period | | | N/A | | | | N/A | | | | N/A | | | | N/A | | | | 394 | % | | | 315 | % |
| 1. | Calculated based upon average common shares outstanding |
| 2. | Amount is less than $0.005. |
| 3. | Total return is calculated assuming a purchase of common stock on the first day and a sale on the last day of the period reported. Dividends and distributions, if any, are assumed for purposes of these calculations to be reinvested at prices obtained under the Fund’s Automatic Dividend Reinvestment Plan. Total return does not reflect brokerage commissions that a shareholder would pay on the purchase and sale of shares. Returns for periods of less than one year are not annualized |
| 4. | Ratios include interest expense relating to interest associated with borrowings and/or leverage transactions as follows: |
| | | | |
Six months ended October 31, 2013 | | | 0.07 | % |
Year ended April 30, 2013 | | | 0.08 | % |
Year ended April 30, 2012 | | | 0.08 | % |
Year ended April 30, 2011 | | | 0.11 | % |
Year ended April 30, 2010 | | | 0.02 | % |
Year ended April 30, 2009 | | | 0.79 | % |
| 5. | The net investment income ratio reflects distributions paid to preferred shareholders. |
The accompanying notes are an integral part of these financial statements.
| | | | |
| 24 | | Wells Fargo Advantage Income Opportunities Fund | | Notes to financial statements (unaudited) |
1. ORGANIZATION
Wells Fargo Advantage Income Opportunities Fund (the “Fund”) was organized as a statutory trust under the laws of the state of Delaware on December 3, 2002 and is registered as a diversified closed-end management investment company under the Investment Company Act of 1940, as amended.
2. SIGNIFICANT ACCOUNTING POLICIES
The following significant accounting policies, which are consistently followed in the preparation of the financial statements of the Fund, are in conformity with U.S. generally accepted accounting principles which require management to make estimates and assumptions that affect the reported amounts of assets and liabilities, disclosure of contingent assets and liabilities at the date of the financial statements, and the reported amounts of revenues and expenses during the reporting period. Actual results could differ from those estimates.
Securities valuation
All investments are valued each business day as of the close of regular trading on the New York Stock Exchange (generally 4 p.m. Eastern Time).
Fixed income securities acquired with maturities exceeding 60 days are valued based on evaluated bid prices provided by an independent pricing service which may utilize both transaction data and market information such as yield, quality, coupon rate, maturity, type of issue, trading characteristics and other market data. If prices are not available from the independent pricing service or prices received are deemed not representative of market value, values will be obtained from an independent broker-dealer or otherwise determined based on the Fund’s Valuation Procedures.
Short-term securities, with maturities of 60 days or less at time of purchase, generally are valued at amortized cost which approximates fair value. The amortized cost method involves valuing a security at its cost, plus accretion of discount or minus amortization of premium over the period until maturity.
Equity securities that are listed on a foreign or domestic exchange or market are valued at the official closing price or, if none, the last sales price. If no sale occurs on the primary exchange or market for the security that day, the prior day’s price will be deemed “stale” and fair values will be determined in accordance with the Fund’s Valuation Procedures.
Investments in registered open-end investment companies are valued at net asset value.
Investments which are not valued using any of the methods discussed above are valued at their fair value, as determined in good faith by the Board of Trustees of the Fund. The Board of Trustees has established a Valuation Committee comprised of the Trustees and has delegated to it the authority to take any actions regarding the valuation of portfolio securities that the Valuation Committee deems necessary or appropriate, including determining the fair value of portfolio securities, unless the determination has been delegated to the Management Valuation Team of Wells Fargo Funds Management, LLC (“Funds Management”). The Board of Trustees retains the authority to make or ratify any valuation decisions or approve any changes to the Valuation Procedures as it deems appropriate. On a quarterly basis, the Board of Trustees receives reports on any valuation actions taken by the Valuation Committee or the Management Valuation Team which may include items for ratification.
Valuations of fair valued securities are compared to the next actual sales price when available, or other appropriate market values, to assess the continued appropriateness of the fair valuation methodologies used. These securities are fair valued on a day-to-day basis, taking into consideration changes to appropriate market information and any significant changes to the inputs considered in the valuation process until there is a readily available price provided on an exchange or by an independent pricing service. Valuations received from an independent pricing service or independent broker-dealer quotes are periodically validated by comparisons to most recent trades and valuations provided by other independent pricing services in addition to the review of prices by the adviser and/or subadviser. Unobservable inputs used in determining fair valuations are identified based on the type of security, taking into consideration factors utilized by market participants in valuing the investment, knowledge about the issuer and the current market environment.
When-issued transactions
The Fund may purchase securities on a forward commitment or when-issued basis. The Fund records a when-issued transaction on the trade date and will segregate assets in an amount at least equal in value to the Fund’s commitment to purchase when-issued securities. Securities purchased on a when-issued basis are marked-to-market daily and the Fund begins earning interest on the settlement date. Losses may arise due to changes in the market value of the underlying securities or if the counterparty does not perform under the contract.
| | | | | | |
| Notes to financial statements (unaudited) | | Wells Fargo Advantage Income Opportunities Fund | | | 25 | |
Term loans
The Fund may invest in term loans. The Fund begins earning interest when the loans are funded. The loans pay interest at rates which are periodically reset by reference to a base lending rate plus a spread. The Fund assumes the credit risk of the borrower and there could be potential loss to the Fund in the event of default by the borrower.
Security transactions and income recognition
Securities transactions are recorded on a trade date basis. Realized gains or losses are recorded on the basis of identified cost.
Interest income is accrued daily and bond discounts are accreted and premiums are amortized daily based on the effective interest method. To the extent debt obligations are placed on non-accrual status, any related interest income may be reduced by writing off interest receivables when the collection of all or a portion of interest has become doubtful based on consistently applied procedures. If the issuer subsequently resumes interest payments or when the collectability of interest is reasonably assured, the debt obligation is removed from non-accrual status.
Dividend income is recognized on the ex-dividend date.
Distributions to shareholders
Distributions to shareholders from net investment income and net realized gains, if any, are recorded on the ex-dividend date. Such distributions are determined in conformity with federal income tax regulations, which may differ in amount or character from net investment income and realized gains recognized for purposes of U.S. generally accepted accounting principles.
Federal and other taxes
The Fund intends to continue to qualify as a regulated investment company by distributing substantially all of its investment company taxable income and any net realized capital gains (after reduction for capital loss carryforwards) sufficient to relieve it from all, or substantially all, federal income taxes. Accordingly, no provision for federal income taxes was required.
The Fund’s income and federal excise tax returns and all financial records supporting those returns for the prior three fiscal years are subject to examination by the federal and Delaware revenue authorities. Management has analyzed the Fund’s tax positions taken on federal, state, and foreign tax returns for all open tax years and does not believe that there are any uncertain tax positions that require recognition of a tax liability.
As of April 30, 2013, capital loss carryforwards available to offset future net realized capital gains were as follows through the indicated expiration dates:
| | | | | | | | | | | | |
| 2015 | | 2016 | | | 2017 | | | 2018 | |
$1,830,407 | | $ | 15,525,027 | | | $ | 130,598,584 | | | $ | 155,329,141 | |
3. FAIR VALUATION MEASUREMENTS
Fair value measurements of investments are determined within a framework that has established a fair value hierarchy based upon the various data inputs utilized in determining the value of the Fund’s investments. The three-level hierarchy gives the highest priority to unadjusted quoted prices in active markets for identical assets or liabilities (Level 1) and the lowest priority to significant unobservable inputs (Level 3). The Fund’s investments are classified within the fair value hierarchy based on the lowest level of input that is significant to the fair value measurement. The inputs are summarized into three broad levels as follow
| n | | Level 1 – quoted prices in active markets for identical securities |
| n | | Level 2 – other significant observable inputs (including quoted prices for similar securities, interest rates, prepayment speeds, credit risk, use of amortized cost, etc.) |
| n | | Level 3 – significant unobservable inputs (including the Fund’s own assumptions in determining the fair value of investments) |
The inputs or methodologies used for valuing investments in securities are not necessarily an indication of the risk associated with investing in those securities.
| | | | |
| 26 | | Wells Fargo Advantage Income Opportunities Fund | | Notes to financial statements (unaudited) |
As of October 31, 2013, the inputs used in valuing investments in securities were as follows:
| | | | | | | | | | | | | | | | |
| Investments in securities | | Quoted prices (Level 1) | | | Other significant
observable inputs (Level 2) | | | Significant unobservable inputs (Level 3) | | | Total | |
Equity securities | | | | | | | | | | | | | | | | |
Common stocks | | $ | 1,255,072 | | | $ | 0 | | | $ | 0 | | | $ | 1,255,072 | |
Preferred stocks | | | 2,196,718 | | | | 0 | | | | 0 | | | | 2,196,718 | |
Corporate bonds and notes | | | 0 | | | | 757,993,364 | | | | 0 | | | | 757,993,364 | |
Term loans | | | 0 | | | | 80,623,248 | | | | 18,038,607 | | | | 98,661,855 | |
Yankee corporate bonds and notes | | | 0 | | | | 44,504,244 | | | | 0 | | | | 44,504,244 | |
Short-term investments | | | | | | | | | | | | | | | | |
Investment companies | | | 30,116,566 | | | | 0 | | | | 0 | | | | 30,116,566 | |
| | | $ | 33,568,356 | | | $ | 883,120,856 | | | $ | 18,038,607 | | | $ | 934,727,819 | |
Transfers in and transfers out are recognized at the end of the reporting period. For the six months ended October 31, 2013, the Fund did not have any transfers into/out of Level 1 or Level 2.
The following is a reconciliation of assets in which significant unobservable inputs (Level 3) were used in determining fair value:
| | | | | | | | | | | | |
| | | Common
stocks | | | Term loans | | | Total | |
Balance as of April 30, 2013 | | $ | 2,149 | | | $ | 20,331,214 | | | $ | 20,333,363 | |
Accrued discounts (premiums) | | | 0 | | | | 8,053 | | | | 8,053 | |
Realized gains (losses) | | | 0 | | | | (2,524 | ) | | | (2,524 | ) |
Change in unrealized gains (losses) | | | (2,149 | ) | | | (689,881 | ) | | | (692,030 | ) |
Purchases | | | 0 | | | | 5,419,262 | | | | 5,419,262 | |
Sales | | | 0 | | | | (219,409 | ) | | | (219,409 | ) |
Transfers into Level 3 | | | 0 | | | | 0 | | | | 0 | |
Transfers out of Level 3 | | | 0 | | | | (6,808,108 | ) | | | (6,808,108 | ) |
Balance as of October 31, 2013 | | $ | 0 | | | $ | 18,038,607 | | | $ | 18,038,607 | |
Change in unrealized gains (losses) relating to securities still held at October 31, 2013 | | $ | (2,149 | ) | | $ | (604,345 | ) | | $ | (606,494 | ) |
The investment types categorized above were valued using indicative broker quotes and are therefore considered Level 3 inputs.
Quantitative unobservable inputs used by the brokers are often proprietary and not provided to the Fund and therefore the disclosure that would address these inputs is not included above.
4. TRANSACTIONS WITH AFFILIATES AND OTHER EXPENSES
Advisory fee
Funds Management, an indirect wholly owned subsidiary of Wells Fargo & Company (“Wells Fargo”), is the adviser to the Fund and is entitled to receive a fee at an annual rate of 0.60% of the Fund’s average daily total assets. Total assets consist of the net assets of the Fund plus borrowings or other leverage for investment purposes to the extent excluded in calculating net assets. Funds Management has committed through February 25, 2014, to waive fees and/or reimburse expenses to the extent necessary to limit the Fund’s borrowing expenses to an amount that is 0.05% lower than what the borrowing expenses would have been if the Fund had not redeemed its Auction Market Preferred Shares (“Preferred Shares”). Funds Management contractually waived its advisory fee in the amount of $881,937 for the six months ended October 31, 2013.
Funds Management has retained the services of a subadviser to provide daily portfolio management to the Fund. The fee for subadvisory services is borne by Funds Management. Wells Capital Management Incorporated, an affiliate of Funds Management and an indirect, wholly owned subsidiary of Wells Fargo, is the subadviser to the Fund and is entitled to receive a fee from Funds Management at an annual rate of 0.40% of the Fund’s average daily total assets.
| | | | | | |
| Notes to financial statements (unaudited) | | Wells Fargo Advantage Income Opportunities Fund | | | 27 | |
Administration fee
Funds Management also serves as the administrator to the Fund providing the Fund with a wide range of administrative services necessary to the operation of the Fund. Funds Management is entitled to receive an annual administration fee from the Fund equal to 0.05% of the Fund’s average daily total assets.
5. CAPITAL SHARE TRANSACTIONS
The Fund has authorized capital of 100,000,000 shares with no par value. For the six months ended October 31, 2013, and year ended April 30, 2013, the Fund issued 15,971 and 241,079 shares, respectively.
The Fund no longer has any Preferred Shares outstanding.
6. BORROWINGS
The Fund has borrowed approximately $230 million through a secured debt financing agreement administered by a major financial institution (the “Facility”). The Facility has a commitment amount of $230 million which expires on February 24, 2014, at which point it may be renegotiated and potentially renewed for another one-year term. At October 31, 2013, the Fund had secured borrowings outstanding in the amount of $230,211,266 (including accrued interest and usage and commitment fees payable).
The Fund’s borrowings under the Facility are generally charged interest at a rate based on the rates of the commercial paper notes issued to fund the Fund’s borrowings or at the London Interbank Offered Rate (LIBOR) plus 1.0%. During the six months ended October 31, 2013, an effective interest rate of 0.21% was incurred on the borrowings. Interest expense of $243,915, representing 0.07% of the Fund’s average daily net assets, was incurred during the six months ended October 31, 2013.
The Fund has pledged all of its assets to secure the borrowings and currently pays, on a monthly basis, a usage fee at an annual rate of 0.40% of the daily average outstanding principal amount of borrowings and commitment fee at an annual rate of 0.40% of the product of (i) the daily average outstanding principal amount of borrowings and (ii) 1.02. The secured borrowing fees on the Statement of Operations of $1,017,509 represents the usage fee, commitment fee and structuring fees. For the six months ended October 31, 2013, the Fund paid structuring fees in the amount of $67,660.
7. INVESTMENT PORTFOLIO TRANSACTIONS
Purchases and sales of investments, excluding U.S. government obligations (if any) and short-term securities, for the six months ended October 31, 2013 were $190,729,310 and $149,548,464, respectively.
As of October 31, 2013, the Fund had unfunded term loan commitments of $19,730,700.
8. INDEMNIFICATION
Under the Fund’s organizational documents, the officers and directors are indemnified against certain liabilities that may arise out of performance of their duties to the Fund. Additionally, in the normal course of business, the Fund may enter into contracts with service providers that contain a variety of indemnification clauses. The Fund’s maximum exposure under these arrangements is dependent on future claims that may be made against the Fund and, therefore, cannot be estimated.
9. SUBSEQUENT DISTRIBUTIONS
The Fund declared the following distributions to common shareholders:
| | | | | | |
| Declaration date | | Record date | | Payable date | | Per share amount |
| October 25, 2013 | | November 14, 2013 | | December 2, 2013 | | $0.068 |
| November 15, 2013 | | December 16, 2013 | | January 2, 2014 | | 0.068 |
These distributions are not reflected in the accompanying financial statements. The final determination of the source of all distributions is subject to change and made after the Fund’s tax year-end.
| | | | |
| 28 | | Wells Fargo Advantage Income Opportunities Fund | | Other information (unaudited) |
PROXY VOTING INFORMATION
A description of the policies and procedures that the Fund uses to determine how to vote proxies relating to portfolio securities is available without charge, upon request, by calling 1-800-222-8222, visiting our website at wellsfargoadvantagefunds.com, or visiting the SEC website at sec.gov. Information regarding how the Fund voted proxies relating to portfolio securities during the most recent 12-month period ended June 30 is available without charge on the Fund’s website at wellsfargoadvantagefunds.com or by visiting the SEC website at sec.gov.
ANNUAL MEETING OF SHAREHOLDERS
On August 5, 2013, an Annual Meeting of Shareholders for the Fund was held to consider the following proposal. The results of the proposal are indicated below.
Proposal 1 – Election of trustees:
| | | | | | |
| Net assets voted “For” | | Peter G. Gordon | | $ | 614,443,892 | |
| Net assets voted “Withhold” | | | | $ | 28,132,659 | |
| Net assets voted “For” | | Timothy J. Penny | | $ | 613,052,485 | |
| Net assets voted “Withhold” | | | | $ | 29,524,066 | |
| Net assets voted “For” | | Michael S. Scofield | | $ | 613,588,348 | |
| Net assets voted “Withhold” | | | | $ | 28,988,203 | |
PORTFOLIO HOLDINGS INFORMATION
The complete portfolio holdings for the Fund are publicly available on the Fund’s website (wellsfargoadvantagefunds.com) on a monthly, 30-day or more delayed basis. The Fund files its complete schedule of portfolio holdings with the SEC for the first and third quarters of each fiscal year on Form N-Q, which is available without charge by visiting the SEC website at sec.gov. In addition, the Fund’s Form N-Q may be reviewed and copied at the SEC’s Public Reference Room in Washington, DC, and at regional offices in New York City, at 233 Broadway, and in Chicago, at 175 West Jackson Boulevard, Suite 900. Information about the Public Reference Room may be obtained by calling 1-800-SEC-0330.
| | | | | | |
| Other information (unaudited) | | Wells Fargo Advantage Income Opportunities Fund | | | 29 | |
BOARD OF TRUSTEES AND OFFICERS
The following table provides basic information about the Board of Trustees (the “Trustees”) and Officers of the Fund. Each of the Trustees and Officers listed below acts in identical capacities for each fund in the Wells Fargo Advantage family of funds, which consists of 131 mutual funds1 comprising the Wells Fargo Funds Trust, Wells Fargo Variable Trust, Wells Fargo Master Trust, and four closed-end funds, including the Fund (collectively the “Fund Complex”). All of the Trustees are also Members of the Audit and Governance Committees of each Trust in the Fund Complex. The mailing address of each Trustee and Officer is 525 Market Street, 12th Floor, San Francisco, CA 94105. The Board of Trustees is classified into three classes of which one is elected annually. Each Trustee serves a three-year term concurrent with the class from which the Trustee is elected. Each Officer serves an indefinite term.
Independent Trustees
| | | | | | |
Name and year of birth | | Position held and length of service | | Principal occupations during past five years | | Other directorships during
past five years |
| Peter G. Gordon (Born 1942) | | Trustee, since 2010; Chairman, since 2010 | | Co-Founder, Retired Chairman, President and CEO of Crystal Geyser Water Company. Trustee Emeritus, Colby College. | | Asset Allocation Trust |
| Isaiah Harris, Jr. (Born 1952) | | Trustee, since 2010 | | Retired. Prior thereto, President and CEO of BellSouth Advertising and Publishing Corp. from 2005 to 2007, President and CEO of BellSouth Enterprises from 2004 to 2005 and President of BellSouth Consumer Services from 2000 to 2003. Emeritus member of the Iowa State University Foundation Board of Governors. Emeritus Member of the Advisory Board of Iowa State University School of Business. Advisory Board Member, Palm Harbor Academy (charter school). Mr. Harris is a certified public accountant. | | CIGNA Corporation; Deluxe Corporation; Asset Allocation Trust |
| Judith M. Johnson (Born 1949) | | Trustee, since 2010; Audit Committee Chairman, since 2010 | | Retired. Prior thereto, Chief Executive Officer and Chief Investment Officer of Minneapolis Employees Retirement Fund from 1996 to 2008. Ms. Johnson is an attorney, certified public accountant and a certified managerial accountant. | | Asset Allocation Trust |
| Leroy Keith, Jr. (Born 1939) | | Trustee, since 2003 | | Chairman, Bloc Global Services (development and construction). Trustee of the Evergreen Funds from 1983 to 2010. Former Managing Director, Almanac Capital Management (commodities firm), former Partner, Stonington Partners, Inc. (private equity fund), former Director, Obagi Medical Products Co. and former Director, Lincoln Educational Services. | | Trustee, Virtus Fund Complex (consisting of 48 portfolios as of 1/31/2013); Asset Allocation Trust |
| David F. Larcker (Born 1950) | | Trustee, since 2010 | | James Irvin Miller Professor of Accounting at the Graduate School of Business, Stanford University, Morgan Stanley Director of the Center for Leadership Development and Research and Senior Faculty of The Rock Center for Corporate Governance since 2006. From 2005 to 2008, Professor of Accounting at the Graduate School of Business, Stanford University. Prior thereto, Ernst & Young Professor of Accounting at The Wharton School, University of Pennsylvania from 1985 to 2005. | | Asset Allocation Trust |
| Olivia S. Mitchell (Born 1953) | | Trustee, since 2010 | | International Foundation of Employee Benefit Plans Professor, Wharton School of the University of Pennsylvania since 1993. Director of Wharton’s Pension Research Council and Boettner Center on Pensions & Retirement Research, and Research Associate at the National Bureau of Economic Research. Previously, Cornell University Professor from 1978 to 1993. | | Asset Allocation Trust |
| Timothy J. Penny (Born 1951) | | Trustee, since 2010 | | President and CEO of Southern Minnesota Initiative Foundation, a non-profit organization, since 2007 and Senior Fellow at the Humphrey Institute Policy Forum at the University of Minnesota since 1995. Member of the Board of Trustees of NorthStar Education Finance, Inc., a non-profit organization, since 2007. | | Asset Allocation Trust |
| | | | |
| 30 | | Wells Fargo Advantage Income Opportunities Fund | | Other information (unaudited) |
| | | | | | |
Name and year of birth | | Position held and length of service | | Principal occupations during past five years | | Other directorships during
past five years |
| Michael S. Scofield (Born 1943) | | Trustee, since 2003 | | Served on the Investment Company Institute’s Board of Governors and Executive Committee from 2008-2011 as well the Governing Council of the Independent Directors Council from 2006-2011 and the Independent Directors Council Executive Committee from 2008-2011. Chairman of the IDC from 2008-2010. Institutional Investor (Fund Directions) Trustee of Year in 2007. Trustee of the Evergreen Funds (and its predecessors) from 1984 to 2010. Chairman of the Evergreen Funds from 2000-2010. Former Trustee of the Mentor Funds. Retired Attorney, Law Offices of Michael S. Scofield. | | Asset Allocation Trust |
| Donald C. Willeke (Born 1940) | | Trustee, since 2010 | | Principal of the law firm of Willeke & Daniels. General Counsel of the Minneapolis Employees Retirement Fund from 1984 until its consolidation into the Minnesota Public Employees Retirement Association on June 30, 2010. Director and Vice Chair of The Tree Trust (non-profit corporation). Director of the American Chestnut Foundation (non-profit corporation). | | Asset Allocation Trust |
Officers
| | | | | | |
Name and year of birth | | Position held and
length of service | | Principal occupations during past five years | | |
| Karla M. Rabusch (Born 1959) | | President, since 2010 | | Executive Vice President of Wells Fargo Bank, N.A. and President of Wells Fargo Funds Management, LLC since 2003. | | |
| Jeremy DePalma1 (Born 1974) | | Treasurer, since 2012 | | Senior Vice President of Wells Fargo Funds Management, LLC since 2009. Senior Vice President of Evergreen Investment Management Company, LLC from 2008 to 2010. Vice President, Evergreen Investment Services, Inc. from 2004 to 2007. Head of the Fund Reporting and Control Team within Fund Administration from 2005 to 2010. | | |
| C. David Messman (Born 1960) | | Secretary, since 2010; Chief Legal Officer, since 2010 | | Senior Vice President and Secretary of Wells Fargo Funds Management, LLC since 2001. Vice President and Managing Counsel of Wells Fargo Bank, N.A. from 1996 to 2013. Vice President and Assistant General Counsel of Wells Fargo Bank, N.A. since 2013. | | |
Debra Ann Early (Born 1964) | | Chief Compliance Officer, since 2010 | | Chief Compliance Officer of Wells Fargo Funds Management, LLC since 2007. Chief Compliance Officer of Parnassus Investments from 2005 to 2007. Chief Financial Officer of Parnassus Investments from 2004 to 2007. | | |
David Berardi (Born 1975) | | Assistant Treasurer, since 2009 | | Vice President of Wells Fargo Funds Management, LLC since 2009. Vice President of Evergreen Investment Management Company, LLC from 2008 to 2010. Assistant Vice President of Evergreen Investment Services, Inc. from 2004 to 2008. Manager of Fund Reporting and Control for Evergreen Investment Management Company, LLC from 2004 to 2010. | | |
| 1. | Jeremy DePalma acts as Treasurer of 58 funds and Assistant Treasurer of 73 funds in the Fund Complex. |
| | | | | | |
| Automatic dividend reinvestment plan | | Wells Fargo Advantage Income Opportunities Fund | | | 31 | |
AUTOMATIC DIVIDEND REINVESTMENT PLAN
All common shareholders are eligible to participate in the Automatic Dividend Reinvestment Plan (“the Plan”). Pursuant to the Plan, unless a common shareholder is ineligible or elects otherwise, all cash dividends and capital gains distributions are automatically reinvested by Computershare Trust Company, N.A., as agent for shareholders in administering the Plan (“Plan Agent”), in additional common shares of the Fund. Whenever the Fund declares an ordinary income dividend or a capital gain dividend (collectively referred to as “dividends”) payable either in shares or in cash, nonparticipants in the Plan will receive cash, and participants in the Plan will receive the equivalent in common shares. The shares are acquired by the Plan Agent for the participant’s account, depending upon the circumstances described below, either (i) through receipt of additional unissued but authorized common shares from the Fund (“newly issued common shares”) or (ii) by purchase of outstanding common shares on the open-market (open-market purchases) on the NYSE Amex or elsewhere. If, on the payment date for any dividend or distribution, the net asset value per share of the common shares is equal to or less than the market price per common share plus estimated brokerage commissions (“market premium”), the Plan Agent will invest the amount of such dividend or distribution in newly issued shares on behalf of the participant. The number of newly issued common shares to be credited to the participant’s account will be determined by dividing the dollar amount of the dividend by the net asset value per share on the date the shares are issued, provided that the maximum discount from the then current market price per share on the date of issuance may not exceed 5%. If on the dividend payment date the net asset value per share is greater than the market value or market premium (“market discount”), the Plan Agent will invest the dividend amount in shares acquired on behalf of the participant in open-market purchases. There will be no brokerage charges with respect to shares issued directly by the Fund as a result of dividends or capital gains distributions payable either in shares or in cash. However, each participant will pay a pro rata share of brokerage commissions incurred with respect to the Plan Agent’s open-market purchases in connection with the reinvestment of dividends. The automatic reinvestment of dividends and distributions will not relieve participants of any federal, state or local income tax that may be payable (or required to be withheld) on such dividends. All correspondence concerning the Plan should be directed to the Plan Agent at P.O. Box 43010, Providence, Rhode Island 02940-3010 or by calling 1-800-730-6001.
| | | | |
| 32 | | Wells Fargo Advantage Income Opportunities Fund | | List of abbreviations |
The following is a list of common abbreviations for terms and entities that may have appeared in this report.
| ACA | — ACA Financial Guaranty Corporation |
| ADR | — American depositary receipt |
| ADS | — American depositary shares |
| AGC | — Assured Guaranty Corporation |
| AGM | — Assured Guaranty Municipal |
| Ambac | — Ambac Financial Group Incorporated |
| AMT | — Alternative minimum tax |
| BAN | — Bond anticipation notes |
| BHAC | — Berkshire Hathaway Assurance Corporation |
| CAB | — Capital appreciation bond |
| CCAB | — Convertible capital appreciation bond |
| CDA | — Community Development Authority |
| CDO | — Collateralized debt obligation |
| COP | — Certificate of participation |
| DRIVER | — Derivative inverse tax-exempt receipts |
| DW&P | — Department of Water & Power |
| DWR | — Department of Water Resources |
| ECFA | — Educational & Cultural Facilities Authority |
| EDA | — Economic Development Authority |
| EDFA | — Economic Development Finance Authority |
| ETF | — Exchange-traded fund |
| FDIC | — Federal Deposit Insurance Corporation |
| FFCB | — Federal Farm Credit Banks |
| FGIC | — Financial Guaranty Insurance Corporation |
| FHA | — Federal Housing Administration |
| FHLB | — Federal Home Loan Bank |
| FHLMC | — Federal Home Loan Mortgage Corporation |
| FICO | — The Financing Corporation |
| FNMA | — Federal National Mortgage Association |
| GDR | — Global depositary receipt |
| GNMA | — Government National Mortgage Association |
| HCFR | — Healthcare facilities revenue |
| HEFA | — Health & Educational Facilities Authority |
| HEFAR | — Higher education facilities authority revenue |
| HFA | — Housing Finance Authority |
| HFFA | — Health Facilities Financing Authority |
| HUD | — Department of Housing and Urban Development |
| IDA | — Industrial Development Authority |
| IDAG | — Industrial Development Agency |
| IDR | — Industrial development revenue |
| KRW | — Republic of Korea won |
| LIBOR | — London Interbank Offered Rate |
| LLC | — Limited liability company |
| LLP | — Limited liability partnership |
| MBIA | — Municipal Bond Insurance Association |
| MFHR | — Multifamily housing revenue |
| MSTR | — Municipal securities trust receipts |
| MUD | — Municipal Utility District |
| National | — National Public Finance Guarantee Corporation |
| PCFA | — Pollution Control Financing Authority |
| PCL | — Public Company Limited |
| PCR | — Pollution control revenue |
| PFA | — Public Finance Authority |
| PFFA | — Public Facilities Financing Authority |
| PFOTER | — Puttable floating option tax-exempt receipts |
| plc | — Public limited company |
| PUTTER | — Puttable tax-exempt receipts |
| R&D | — Research & development |
| Radian | — Radian Asset Assurance |
| RAN | — Revenue anticipation notes |
| RDA | — Redevelopment Authority |
| RDFA | — Redevelopment Finance Authority |
| REIT | — Real estate investment trust |
| ROC | — Reset option certificates |
| SAVRS | — Select auction variable rate securities |
| SBA | — Small Business Authority |
| SFHR | — Single-family housing revenue |
| SFMR | — Single-family mortgage revenue |
| SPA | — Standby purchase agreement |
| SPDR | — Standard & Poor’s Depositary Receipts |
| STRIPS | — Separate trading of registered interest and principal securities |
| TAN | — Tax anticipation notes |
| TIPS | — Treasury inflation-protected securities |
| TRAN | — Tax revenue anticipation notes |
| TTFA | — Transportation Trust Fund Authority |
| TVA | — Tennessee Valley Authority |


Transfer Agent, Registrar, Shareholder Servicing
Agent & Dividend Disbursing Agent
Computershare Trust Company, N.A.
P.O. Box 43010
Providence, RI 02940-3010
1-800-730-6001
Website: wellsfargoadvantagefunds.com
Wells Fargo Funds Management, LLC, is a subsidiary of Wells Fargo & Company and is an affiliate of Wells Fargo & Company’s broker/dealer subsidiaries. This material is being prepared by Wells Fargo Funds Distributor, LLC. Member FINRA/SIPC, an affiliate of Wells Fargo & Company.
NOT FDIC INSURED ¡ NO BANK GUARANTEE ¡ MAY LOSE VALUE
© 2013 Wells Fargo Funds Management, LLC. All rights reserved.
| | |
 | | 220815 12-13 SIO/SAR148 10-13 |
ITEM 2. CODE OF ETHICS
Not applicable.
ITEM 3. AUDIT COMMITTEE FINANCIAL EXPERT
Not applicable.
ITEM 4. PRINCIPAL ACCOUNTANT FEES AND SERVICES
Not applicable.
ITEM 5. AUDIT COMMITTEE OF LISTED REGISTRANTS
Not applicable.
ITEM 6. INVESTMENTS
The Portfolio of investments is included as part of the report to shareholders filed under Item 1 of this Form.
| ITEM 7. | DISCLOSURE OF PROXY VOTING POLICIES AND PROCEDURES FOR CLOSED-END MANAGEMENT INVESTMENT COMPANIES |
Not applicable.
ITEM 8. PORTFOLIO MANAGERS OF CLOSED-END MANAGEMENT INVESTMENT COMPANIES
Not applicable.
| ITEM 9. | PURCHASES OF EQUITY SECURITIES BY CLOSED-END MANAGEMENT INVESTMENT COMPANY AND AFFILIATED PURCHASERS |
Not applicable.
ITEM 10. SUBMISSION OF MATTERS TO A VOTE OF SECURITY HOLDERS
There have been no material changes to the procedures by which shareholders may recommend nominees to the Registrant’s board of trustees that have been implemented since the Registrant’s last provided disclosure in response to the requirements of this Item.
ITEM 11. CONTROLS AND PROCEDURES
(a) The President and Treasurer have concluded that the Wells Fargo Advantage Income Opportunities Fund (the “Trust”) disclosure controls and procedures (as defined in Rule 30a-3(c) under the Investment Company Act of 1940) provide reasonable assurances that material information relating to the Trust is made known to them by the appropriate persons, based on their evaluation of these controls and procedures as of a date within 90 days of the filing of this report.
(b) There were no significant changes in the Trust’s internal controls over financial reporting (as defined in Rule 30a-3(d) under the Investment Company Act of 1940) that occurred during the second fiscal quarter of the period covered by this report that materially affected, or is reasonably likely to materially affect, the registrant’s internal control over financial reporting.
ITEM 12. EXHIBITS
(a)(1) Not applicable
(a)(2) Certification pursuant to Rule 30a-2(a) under the Investment Company Act of 1940 (17 CFR 270.30a-2(a)) is filed and attached hereto as Exhibit 99.CERT.
(a)(3) Not applicable.
(b) Certification pursuant to Rule 30a-2(b) under the Investment Company Act of 1940 (17 CFR 270.30a-2(b)) is filed and attached hereto as Exhibit 99.906CERT.
SIGNATURES
Pursuant to the requirements of the Securities Exchange Act of 1934 and the Investment Company Act of 1940, the registrant has duly caused this report to be signed on its behalf by the undersigned, thereunto duly authorized.
| | |
| Wells Fargo Advantage Income Opportunities Fund |
| |
| By: | | /s/ Karla M. Rabusch |
| |
| | Karla M. Rabusch |
| | President |
| |
| Date: | | December 23, 2013 |
Pursuant to the requirements of the Securities Exchange Act of 1934 and the Investment Company Act of 1940, this report has been signed below by the following persons on behalf of the registrant and in the capacities and on the date indicated.
| | |
| Wells Fargo Advantage Income Opportunities Fund |
| |
| By: | | /s/ Karla M. Rabusch |
| |
| | Karla M. Rabusch |
| | President |
| |
| Date: | | December 23, 2013 |
| |
| By: | | /s/ Jeremy DePalma |
| |
| | Jeremy DePalma |
| | Treasurer |
| |
| Date: | | December 23, 2013 |