Exhibit 99.1

BNC BANCORP
ANNUAL MEETING
JUNE 15, 2006
BNC BANCORP
Forward-Looking Statements
This presentation contains forward-looking statements as defined by federal securities laws. The written or oral statements may address issues that involve significant risks, uncertainties, estimates and assumptions made by management. Actual results could differ materially from current projections.
Please refer to BNC Bancorp’s filings with the Securities and Exchange Commission for a summary of important factors that could affect BNC Bancorp’s forward-looking statements. BNC Bancorp undertakes no obligation to revise these statements following the release of this presentation.
BNC BANCORP
2005 RESULTS
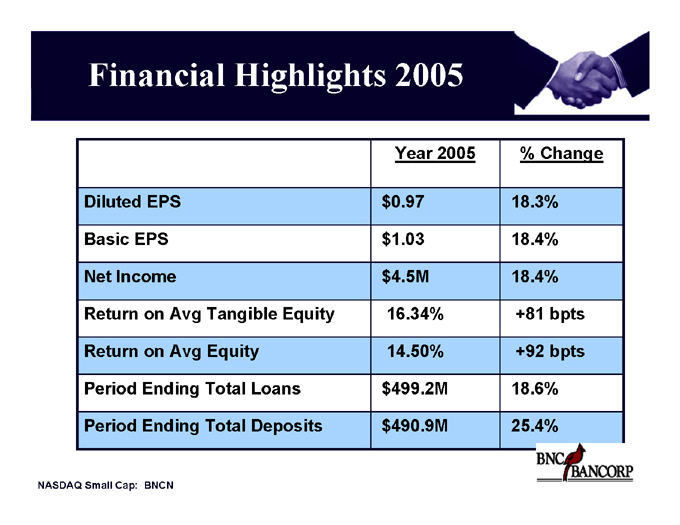
Financial Highlights 2005
Year 2005 % Change
Diluted EPS $0.97 18.3%
Basic EPS $1.03 18.4%
Net Income $4.5M 18.4%
Return on Avg Tangible Equity 16.34% +81 bpts
Return on Avg Equity 14.50% +92 bpts
Period Ending Total Loans $499.2M 18.6%
Period Ending Total Deposits $490.9M 25.4%
NASDAQ Small Cap: BNCN
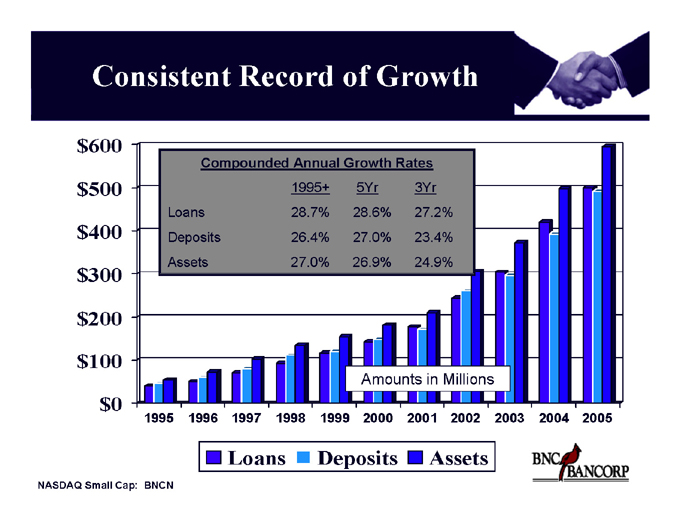
Consistent Record of Growth $600 $500 $400 $300 $200 $100 $0
1995 1996 1997 1998 1999 2000 2001 2002 2003 2004 2005
Compounded Annual Growth Rates
1995+ 5Yr 3Yr
Loans 28.7% 28.6% 27.2%
Deposits 26.4% 27.0% 23.4%
Assets 27.0% 26.9% 24.9%
Amounts in Millions
Loans Deposits Assets
NASDAQ Small Cap: BNCN
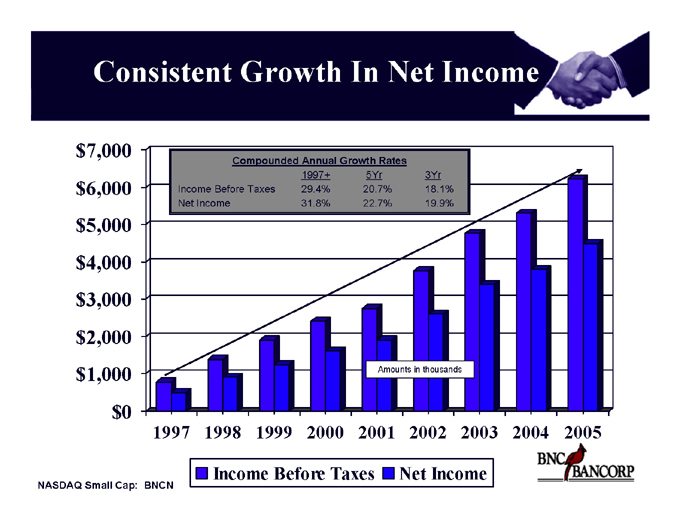
Consistent Growth In Net Income $7,000 $6,000 $5,000 $4,000 $3,000 $2,000 $1,000 $0
1997 1998 1999 2000 2001 2002 2003 2004 2005
Compounded Annual Growth Rates
1997+ 5Yr 3Yr
Income Before Taxes 29.4% 20.7% 18.1%
Net Income 31.8% 22.7% 19.9%
Amounts in thousands
Income Before Taxes Net Income
NASDAQ Small Cap: BNCN
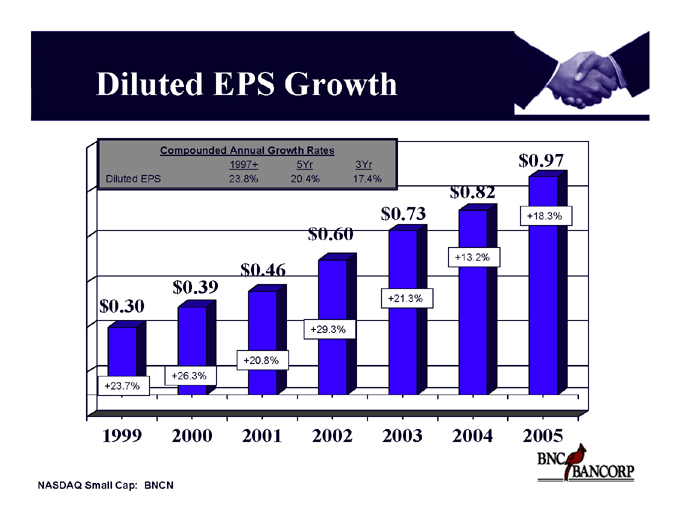
Diluted EPS Growth
Compounded Annual Growth Rates
1997+ 5Yr 3Yr
Diluted EPS 23.8% 20.4% 17.4%
$0.30 $0.39 $0.46 $0.60 $0.73 $0.82 $0.97
+23.7%
+26.3%
+20.8%
+29.3%
+21.3%
+13.2%
+18.3%
1999 2000 2001 2002 2003 2004 2005
NASDAQ Small Cap: BNCN
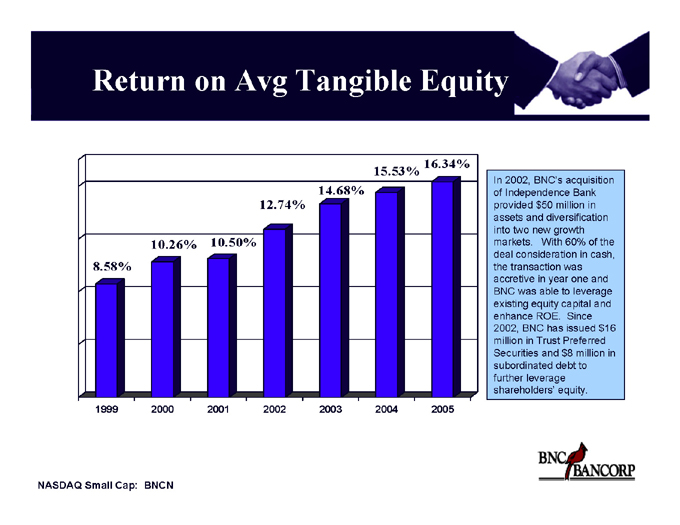
Return on Avg Tangible Equity
15.53% 16.34% 14.68% 12.74%
10.26% 10.50% 8.58%
1999 2000 2001 2002 2003 2004 2005
In 2002, BNC’s acquisition of Independence Bank provided $50 million in assets and diversification into two new growth markets. With 60% of the deal consideration in cash, the transaction was accretive in year one and BNC was able to leverage existing equity capital and enhance ROE. Since 2002, BNC has issued $16 million in Trust Preferred Securities and $8 million in subordinated debt to further leverage shareholders’ equity.
NASDAQ Small Cap: BNCN
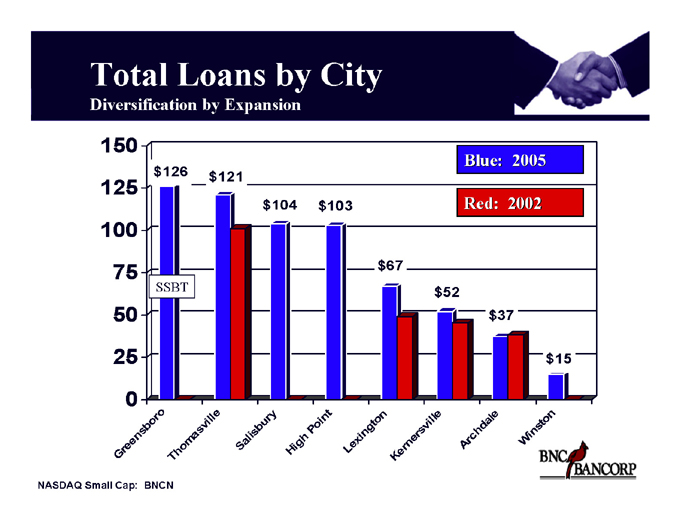
Total Loans by City
Diversification by Expansion
150 125 100 75 50 25 0 $126 $121 $104 $103 $67 $52 $37
$15
SSBT
Blue: 2005
Red: 2002
NASDAQ Small Cap: BNCN
Greensboro Thomasville Salisbury High Point Lexington Kernersville Archdale Winston

BNC BANCORP
BNC Bancorp Acquires SterlingSouth
Overview of SterlingSouth
Operations began in October 2000 in Greensboro, North Carolina (Guilford County)
Loan and deposit growth over 30% for last three years
Dynamic banking market located within the Greensboro-High Point MSA
#8 community banking market share
Three full service branches in Guilford County
Insiders collectively own 35% of the Company
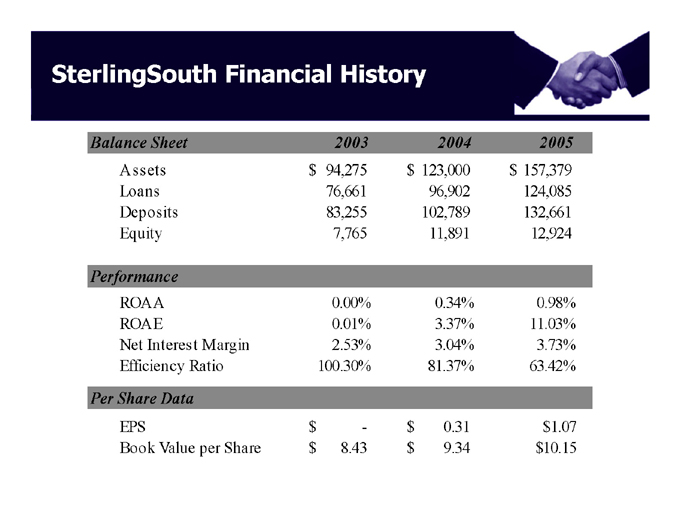
SterlingSouth Financial History
Balance Sheet 2003 2004 2005
Assets $94,275 $123,000 $157,379
Loans 76,661 96,902 124,085
Deposits 83,255 102,789 132,661
Equity 7,765 11,891 12,924
Performance
ROAA 0.00% 0.34% 0.98%
ROAE 0.01% 3.37% 11.03%
Net Interest Margin 2.53% 3.04% 3.73%
Efficiency Ratio 100.30% 81.37% 63.42%
Per Share Data
EPS $— $0.31 $1.07
Book Value per Share $8.43 $9.34 $10.15
Benefits from SterlingSouth
Benefits of merger with SterlingSouth:
People:
Experienced Management Board with Greensboro roots Strong Lending Group
Earnings:
Revenue enhancements – significant potential
Higher lending limits $10 million+ in participations sold
Additional business with current customers
Noninterest Income:
Mortgage Leasing
Wealth Management
Benefits from SterlingSouth
Growth:
Total assets of over $800 million Pro forma growth rate over 20%
Franchise / Market:
Acquire Greensboro, Guilford County footprint
Third largest county in North Carolina
Provides important element to Triad strategy $9.5 billion deposit market
BNC had plans to enter market on a de novo basis
Shareholder Liquidity:
Increase shares outstanding to 6 million shares Pro forma market cap of approximately $112.1 million Pro forma float to approximate 4.6 million shares (1)
(1) Float calculated by subtracting insider ownership from shares outstanding and adding shares issued in the transaction

BNC BANCORP
New Offices New People Building Infrastructure
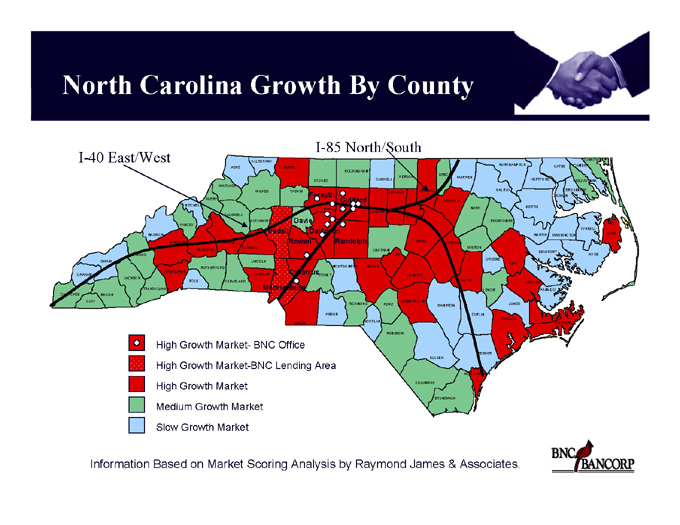
North Carolina Growth By County
ALLEGHANY ASHE
WATAUGA
WILKES
AVERY MITCHELL
CALDWELL
ALEXANDER YANCEY
MADISON
BUNCOMBE
HAYWOOD SWAIN
HENDERSON GRAHAM
JACKSON
TRANSYLVANIA CHEROKEE MACON
CLAY
BURKE
CATAWBA MCDOWELL
RUTHERFORD
POLK
CLEVELAND
LINCOLN
GASTON
SURRY
ROCKINGHAM
VANCE
PERSON WARREN STOKES CASWELL
YADKIN GRANVILLE
Forsyth ORANGE
Guilford FRANKLIN
NASH ALAMANCE
DURHAM
Davie
Iredell Davidson Rowan Randolph
CHATHAM
WAKE
JOHNSTON
WILSON
MONTGOMERY MOORE
Cabarrus STANLY
LEE
Mecklenburg
RICHMOND
ANSON
UNION
HARNETT
WAYNE
CUMBERLAND HOKE
SAMPSON
SCOTLAND
ROBESON
BLADEN
COLUMBUS
BRUNSWICK
CURRITUCK NORTHAMPTON CAMDEN
GATES
HERTFORD PASQUOTANK
HALIFAX PERQUIMANS
CHOWAN
BERTIE
EDGECOMBE
TYRRELL
MARTIN DARE
WASHINGTON
BEAUFORT
HYDE GREENE
PITT
CRAVEN
LENOIR PAMLICO
JONES
DUPLIN
ONSLOW
CARTERET
PENDER
NEW HANOVER
High Growth Market- BNC Office High Growth Market-BNC Lending Area High Growth Market Medium Growth Market Slow Growth Market
Information Based on Market Scoring Analysis by Raymond James & Associates.
I-40 East/West
I-85 North/South

BNC BANCORP
SHAREHOLDER RETURNS
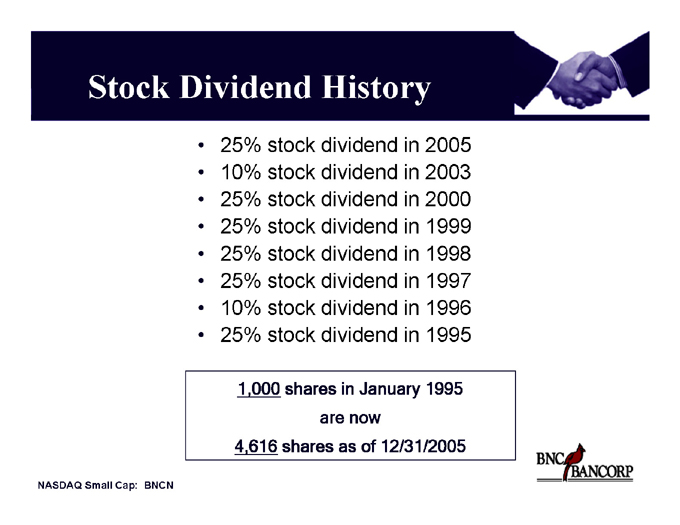
Stock Dividend History
25% stock dividend in 2005 10% stock dividend in 2003 25% stock dividend in 2000 25% stock dividend in 1999 25% stock dividend in 1998 25% stock dividend in 1997 10% stock dividend in 1996 25% stock dividend in 1995
1,000 shares in January 1995 are now 4,616 shares as of 12/31/2005
NASDAQ Small Cap: BNCN
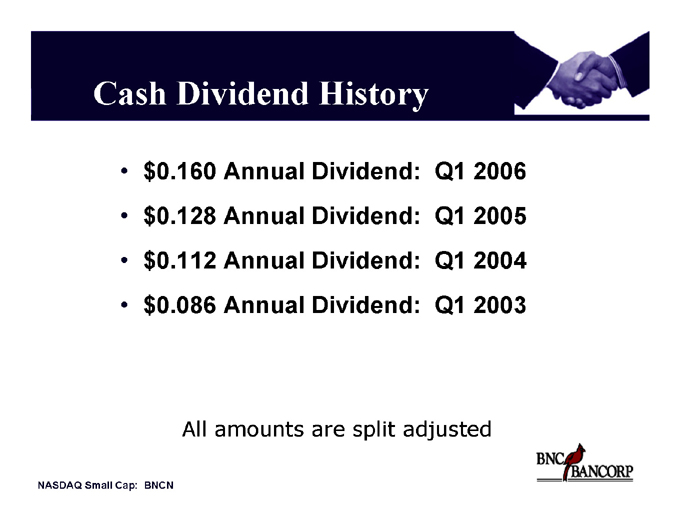
Cash Dividend History $0.160 Annual Dividend: Q1 2006 $0.128 Annual Dividend: Q1 2005 $0.112 Annual Dividend: Q1 2004 $0.086 Annual Dividend: Q1 2003
All amounts are split adjusted
NASDAQ Small Cap: BNCN

Growth of Investment in BNCN
$90,000 $80,000 $70,000 $60,000 $50,000 $40,000 $30,000 $20,000 $10,000
1998 1999 2000 2001 2002 2003 2004 2005
23.5% Compound Annual Return since 1998
NASDAQ Small Cap: BNCN

BNC BANCORP
Historical Performance Future Projections
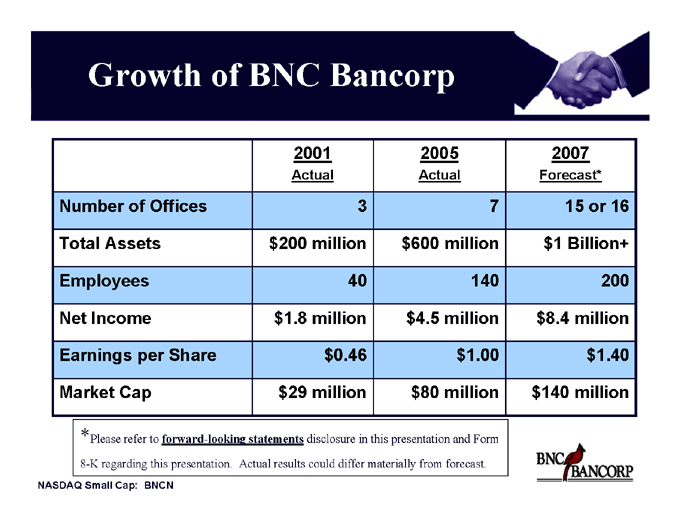
Growth of BNC Bancorp
2001 2005 2007
Actual Actual Forecast*
Number of Offices 3 7 15 or 16
Total Assets $200 million $600 million $1 Billion+
Employees 40 140 200
Net Income $1.8 million $4.5 million $8.4 million
Earnings per Share $0.46 $1.00 $1.40
Market Cap $29 million $80 million $140 million
* Please refer to forward-looking statements disclosure in this presentation and Form 8-K regarding this presentation. Actual results could differ materially from forecast.
NASDAQ Small Cap: BNCN