UNITED STATES
SECURITIES AND EXCHANGE COMMISSION
Washington, D.C. 20549
FORM 10-K
ANNUAL REPORT PURSUANT TO SECTION 13 OR 15(d)
OF THE SECURITIES EXCHANGE ACT OF 1934
For the fiscal year ended December 31, 2006
Commission File Number: 000-50128
BNC BANCORP
(Exact name of registrant as specified in its charter)
| | |
| North Carolina | | 47-0898685 |
| (State or Other Jurisdiction of | | (I.R.S. Employer |
| Incorporation or Organization) | | Identification No.) |
| | |
| 831 Julian Avenue | | |
| Thomasville, North Carolina | | 27360 |
| (Address of Principal Executive Offices) | | (Zip Code) |
(336) 476-9200
(Registrant’s telephone number, including area code)
Securities Registered Pursuant to Section 12(b) of the Act: None
| | | | |
| | Securities Registered Pursuant to Section 12(g) of the Act: | | Common stock, no par value |
| | | | (Title of Class) |
Indicate by check mark if the registrant is a well-known seasoned issuer, as defined in Rule 405 of the Securities Act. Yes ¨ No x
Indicate by check mark if the registrant is not required to file reports pursuant to Section 13 or Section 15(d) of the Act. Yes ¨ No x
Indicate by check mark whether the registrant (1) has filed all reports required to be filed by Section 13 or 15(d) of the Securities Exchange Act of 1934 during the preceding 12 months (or for such shorter period that the registrant was required to file such reports), and (2) has been subject to such filing requirements for the past 90 days. Yes x No ¨
Indicate by check mark if disclosure of delinquent filers pursuant to Item 405 of Regulation S-K is not contained herein, and will not be contained, to the best of registrant’s knowledge, in definitive proxy or information statements incorporated by reference in Part III of this Form 10-K or any amendment to this Form 10-K. ¨
Indicate by check mark whether the registrant is a large accelerated filer, an accelerated filer, or a non-accelerated file (as defined in Rule 12b-2 of the Exchange Act).
Large Accelerated filer ¨ Accelerated filer ¨ Non-Accelerated filer x
Indicate by check mark whether the Registrant is a shell company (as defined in Rule 12b-2 of the Exchange Act). Yes ¨ No x
$104,299,869
(Aggregate value of voting and non-voting common equity held by non-affiliates of the registrant based
on the price at which the registrant’s common stock, no par value per share was sold on March 27, 2007)
State the number of shares outstanding of each of the issuer’s classes of common equity, as of the latest practicable date. 5,294,410 shares of common stock, no par value, as of March 27, 2007.
DOCUMENTS INCORPORATED BY REFERENCE
Portions of the Annual Report to stockholders of BNC Bancorp for the year ended December 31, 2006 (“2006 Annual Report”), are incorporated by reference into Part II.
Portions of the Proxy Statement for the 2007 Annual Meeting of Stockholders of BNC Bancorp to be held on June 19, 2007, are incorporated by reference into Part III.
PART I
General
BNC Bancorp (the “Company”) was formed in 2002 to serve as a one-bank holding company for Bank of North Carolina (the “Bank”). The Company is registered with the Board of Governors of the Federal Reserve System (the “Federal Reserve”) under the Bank Holding Company Act of 1956, as amended (the “BHCA”) and the bank holding company laws of North Carolina. The Company’s and the Bank’s main office is located at 831 Julian Avenue, Thomasville, North Carolina 27360. The Company’s only business at this time is owning the Bank and its primary source of income is any dividends that are declared and paid by the Bank on its capital stock.
The Bank is a full service commercial bank that was incorporated under the laws of the State of North Carolina on November 15, 1991, and opened for business on December 3, 1991. The Bank concentrates its marketing and banking efforts to serve the citizens and business interests of the cities and communities located in Davidson, Randolph, Rowan, Forsyth, Guilford and Cabarrus Counties. The Bank conducts its business in Davidson County from its corporate headquarters located in Thomasville, North Carolina, an additional branch in Thomasville, a branch in Lexington and in Northern Davidson County. In Randolph County, the Bank has one location in the Archdale-Trinity community; in Forsyth County, the Bank has one location in Kernersville and a commercial loan office in Winston Salem; in Guilford County, the Bank has three locations in Greensboro, one location in Oak Ridge and one location in High Point; in Cabarrus County, the Bank one office in Harrisburg; and in Rowan County, the Bank has one office in Salisbury.
The three branches located in Greensboro, North Carolina are the result of the Company’s acquisition of SterlingSouth Bank & Trust Company (“SterlingSouth”) and the merger of SterlingSouth into the Bank effective July 20, 2006. These offices increase the Bank’s presence in Guilford County, North Carolina.
The Bank operates under the rules and regulations of and is subject to examination by the Federal Deposit Insurance Corporation (“FDIC”) and the North Carolina Commissioner of Banks, North Carolina Department of Commerce (the “Commissioner”). The Bank is also subject to certain regulations of the Federal Reserve governing the reserves to be maintained against deposits and other matters.
The Bank provides a wide range of banking services tailored to the particular banking needs of the communities it serves. It is principally engaged in the business of attracting deposits from the general public and using such deposits, together with other funding from the Bank’s lines of credit, to make primarily consumer and commercial loans. The Bank has pursued a strategy that emphasizes its local affiliations. This business strategy stresses the provision of high quality banking services to individuals and small to medium-sized local businesses. Specifically, the Bank makes business loans secured by real estate, personal property and accounts receivable; unsecured business loans; consumer loans, which are secured by consumer products, such as automobiles and boats; unsecured consumer loans; commercial real estate loans; and other loans. The Bank also offers a wide range of banking services, including checking and savings accounts, commercial, installment and personal loans, safe deposit boxes, and other associated services.
Deposits are the primary source of the Bank’s funds for lending and other investment purposes. The Bank attracts both short-term and long-term deposits from the general public locally and out-of-state by offering a variety of accounts and rates. The Bank offers statement savings accounts, negotiable order of withdrawal accounts, money market demand accounts, noninterest-bearing accounts, and fixed interest rate certificates with varying maturities.
Deposit flows are greatly influenced by economic conditions, the general level of interest rates, competition, and other factors. The Bank’s deposits are obtained both from its primary market area and through wholesale sources throughout the United States. The Bank uses traditional marketing methods to attract new customers and savings deposits, including print media advertising and direct mailings.
The Bank’s primary sources of revenue are interest and fee income from its lending activities, primarily consisting of making
2
business loans for small to medium-sized businesses, and, to a lesser extent, from its investment portfolio. During the period 2002 to 2006, with interest rates being at historic lows on investment securities and other short-term liquid investments, the Bank chose to limit the investment in these short-term investments and focus the majority of its new investment dollars into higher yielding loans and longer term municipal securities. The interest on US Agency securities declined in each of the years 2004 through 2006, while the interest on municipal securities increased significantly throughout this three-year period. The major expenses of the Bank are interest paid on deposits and general administrative expenses such as salaries, employee benefits, advertising and office occupancy.
The Bank has experienced steady growth over its fifteen-year history. The Bank’s assets totaled $952 million and $595 million as of December 31, 2006 and 2005, respectively. Net income for the fiscal year ended December 31, 2006 was $6.2 million, or $1.04 per diluted share, compared with $4.5 million, or $0.88 per diluted share, for the fiscal year ended December 31, 2005. All per share amounts have been adjusted for the 10% stock dividend distributed on January 22, 2007.
Because the Bank is the sole banking subsidiary of the Company, the Company’s operations are located at the Bank level. Throughout this Annual Report, results of operations will relate to the Bank’s operations, unless a specific reference is made to the Company and its operating results other than through the Bank’s business and activities.
Competition and Market Area
Commercial banks generally compete with other financial institutions through the banking products and services offered, the pricing of services, the level of service provided, the convenience and availability of services, and the degree of expertise and the personal manner in which services are offered. The Bank is locally owned and managed and its personnel have strong community ties. Management believes this strong community identity and involvement plus the Bank’s commitment to offer personalized services and attention to its customers help the Bank compete with the other financial institutions in its market area.
As of December 31, 2006, there were thirty-one branch offices of eleven commercial banks located in Thomasville and Lexington (Davidson County); and eight offices of seven commercial banks located in the town of Archdale (Randolph County); Thirteen offices of thirteen commercial banks located in the town of Kernersville (Forsyth County); two offices of two commercial banks in the town of Oak Ridge (Guilford County); thirty-one offices of twelve commercial banks in the town of High Point (Guilford County); ninety-four offices of twenty commercial banks located in the city of Greensboro (Guilford County); and twenty-three offices of ten commercial banks located in the town of Salisbury (Rowan County). The Bank faces additional competition for investors’ funds from short-term money market securities and other corporate and governmental securities.
Davidson, Randolph, Guilford, Rowan, Cabarrus and Forsyth Counties are located in the diverse, growing region of the Piedmont Triad. Lexington, High Point, Archdale and Thomasville’s traditional economic base includes furniture and textile manufacturing, while Greensboro’s base is much more service oriented. Large area employers in the counties of Davidson and Guilford include Dell Corporation, High Point Regional Medical Center, Moses Cone Health System, American Express, RF Micro Devices, Thomas Built Buses, and Dar/Ran Furniture. Oak Ridge is primarily rural with the economic base consisting of farming and small business. Kernersville’s economic base consists primarily of small businesses. Large employers in Kernersville include Roadway Express, Barco Pruden, Sara Lee Sock Co., Deere Hitachi and Hooker Furniture.
Rowan and Cabarrus Counties are located in the growing Piedmont region of North Carolina between the Charlotte metro market and the High Point and Thomasville markets. Rowan and Cabarrus Counties offers a premier location for warehouses, manufacturing and distribution facilities because the largest consolidated rail system in the country is centered in the region. Rowan County is home to over 45 freight companies. Cabarrus County is the home to Lowes Motor Speedway, and numerous NASCAR related suppliers and team headquarters.
3
Employees
At December 31, 2006, the Bank had 181 full-time and 12 part-time employees.
Subsidiaries
The Company is a one-bank holding company for Bank of North Carolina. In addition, the Company has wholly owned subsidiaries to issue trust preferred securities: BNC Bancorp Capital Trust I, BNC Capital Trust II, BNC Bancorp Capital Trust III and BNC Bancorp Capital Trust IV. These long term obligations, which qualify as Tier I capital for the Company, constitute a full and unconditional guarantee by the Company of the trusts’ obligations under the preferred securities.
Supervision and Regulation
Bank holding companies and state commercial banks are extensively regulated under both federal and state law. The following is a brief summary of certain statutes and rules and regulations that affect or will affect the Company and the Bank. This summary is qualified in its entirety by reference to the particular statute and regulatory provisions referred to below and is not intended to be an exhaustive description of the statutes or regulations applicable to the business of the Company and the Bank. Supervision, regulation and examination of the Company and the Bank by the regulatory agencies are intended primarily for the protection of depositors rather than shareholders of the Company. The Company cannot predict whether or in what form any proposed statute or regulation will be adopted or the extent to which the business of the Company and the Bank may be affected by a statute or regulation.
General. There are a number of obligations and restrictions imposed on bank holding companies and their depository institution subsidiaries by law and regulatory policy that are designed to minimize potential loss to the depositors of such depository institutions and the FDIC insurance funds in the event the depository institution becomes in danger of default or in default. For example, to avoid receivership of an insured depository institution subsidiary, a bank holding company is required to guarantee the compliance of any insured depository institution subsidiary that may become “undercapitalized” with the terms of any capital restoration plan filed by such subsidiary with its appropriate federal banking agency up to the lesser of (i) an amount equal to 5% of the bank’s total assets at the time the bank became undercapitalized or (ii) the amount which is necessary (or would have been necessary) to bring the bank into compliance with all acceptable capital standards as of the time the bank fails to comply with such capital restoration plan. The Company, as a registered bank holding company, is subject to the regulation of the Federal Reserve. Under a policy of the Federal Reserve with respect to bank holding company operations, a bank holding company is required to serve as a source of financial strength to its subsidiary depository institutions and to commit resources to support such institutions in circumstances where it might not do so absent such policy. The Federal Reserve under the BHCA also has the authority to require a bank holding company to terminate any activity or to relinquish control of a nonbank subsidiary (other than a nonbank subsidiary of a bank) upon the Federal Reserve’s determination that such activity or control constitutes a serious risk to the financial soundness and stability of any bank subsidiary of the bank holding company.
In addition, insured depository institutions under common control are required to reimburse the FDIC for any loss suffered by its deposit insurance funds as a result of the default of a commonly controlled insured depository institution or for any assistance provided by the FDIC to a commonly controlled insured depository institution in danger of default. The FDIC may decline to enforce the cross-guarantee provisions if it determines that a waiver is in the best interest of the deposit insurance funds. The FDIC’s claim for damages is superior to claims of stockholders of the insured depository institution or its holding company but is subordinate to claims of depositors, secured creditors and holders of subordinated debt (other than affiliates) of the commonly controlled insured depository institutions.
As a result of the Company’s ownership of the Bank, the Company is also registered under the bank holding company laws of North Carolina. Accordingly, the Company is also subject to regulation and supervision by the Commissioner.
4
Capital Adequacy Guidelines for Holding Companies. The Federal Reserve has adopted capital adequacy guidelines for bank holding companies and banks that are members of the Federal Reserve System and have consolidated assets of $150 million or more. Bank holding companies subject to the Federal Reserve’s capital adequacy guidelines are required to comply with the Federal Reserve’s risk-based capital guidelines. Under these regulations, the minimum ratio of total capital to risk-weighted assets is 8%. At least half of the total capital is required to be “Tier I capital,” principally consisting of common stockholders’ equity, noncumulative perpetual preferred stock, and a limited amount of cumulative perpetual preferred stock, less certain intangible items. The remainder (“Tier II capital”) may consist of a limited amount of subordinated debt, certain hybrid capital instruments and other debt securities, perpetual preferred stock, and the allowance for loan losses, subject to certain restrictions. In addition to the risk-based capital guidelines, the Federal Reserve has adopted a minimum Tier I capital (leverage) ratio, under which a bank holding company must maintain a minimum level of Tier I capital to average total consolidated assets of at least 3% in the case of a bank holding company which has the highest regulatory examination rating and is not contemplating significant growth or expansion. All other bank holding companies are expected to maintain a Tier I capital (leverage) ratio of at least 1% to 2% above the stated minimum.
Capital Requirements for the Bank. The Bank, as a North Carolina commercial bank, is required to maintain a surplus account equal to 50% or more of its paid-in capital stock. As a North Carolina chartered, FDIC-insured commercial bank which is not a member of the Federal Reserve System, the Bank is also subject to capital requirements imposed by the FDIC. Under the FDIC’s regulations, state nonmember banks that (a) receive the highest rating during the examination process and (b) are not anticipating or experiencing any significant growth, are required to maintain a minimum leverage ratio of 3% of total consolidated assets; all other banks are required to maintain a minimum ratio of 1% or 2% above the stated minimum, with a minimum leverage ratio of not less than 4%. The Bank exceeded all applicable capital requirements as of December 31, 2006.
Dividend and Repurchase Limitations. The Company must obtain Federal Reserve approval prior to repurchasing common stock in excess of 10% of its net worth during any twelve-month period unless the Company (i) both before and after the redemption satisfies capital requirements for “well capitalized” state member banks; (ii) received a one or two rating in its last examination; and (iii) is not the subject of any unresolved supervisory issues.
Although the payment of dividends and repurchase of stock by the Company are subject to certain requirements and limitations of North Carolina corporate law, except as set forth in this paragraph, neither the Commissioner nor the FDIC have promulgated any regulations specifically limiting the right of the Company to pay dividends and repurchase shares. However, the ability of the Company to pay dividends or repurchase shares may be dependent upon the Company’s receipt of dividends from the Bank.
North Carolina commercial banks, such as the Bank, are subject to legal limitations on the amounts of dividends they are permitted to pay. Dividends may be paid by the Bank from undivided profits, which are determined by deducting and charging certain items against actual profits, including any contributions to surplus required by North Carolina law. Also, an insured depository institution, such as the Bank, is prohibited from making capital distributions, including the payment of dividends, if, after making such distribution, the institution would become “undercapitalized” (as such term is defined in the applicable law and regulations).
Deposit Insurance. The deposits of the Bank are currently insured to a maximum of $100,000 per depositor, subject to aggregation rules. The FDIC establishes rates for the payment of premiums by federally insured banks and thrifts for deposit insurance. Since 1993, insured depository institutions like the Bank have paid for deposit insurance under a risk-based premium system. Insurance of deposits may be terminated by the FDIC upon a finding that the institution has engaged in unsafe and unsound practices, is in an unsafe or unsound condition to continue operations, or has violated any applicable law, regulation, rule, order, or condition imposed by the FDIC. Due to its severe consequences, the FDIC historically uses insurance termination as an enforcement action of last resort and the termination process itself involves substantial notice, a formal adjudicative hearing and federal appellate review. In instances where insurance deposit is terminated, the financial institution is required to notify its depositors and insured funds on the date of termination that they will continue to be insured for at least six months and up to two years, at the discretion of the FDIC. After the date of termination, no new deposits accepted by the financial institution will be federally insured.
5
Federal Deposit Insurance Reform. On February 8, 2006, President Bush signed the Federal Deposit Insurance Reform Act of 2005 (FDIRA). The FDIC was required to adopt rules implementing the various provisions of FDIRA by November 5, 2006. Among other things, FDIRA changes the Federal deposit insurance system by:
| | • | | raising the coverage level for retirement accounts to $250,000; |
| | • | | indexing deposit insurance coverage levels for inflation beginning in 2012; |
| | • | | prohibiting undercapitalized financial institutions from accepting employee benefit plan deposits; |
| | • | | merging the Bank Insurance Fund and Savings Association Insurance Fund into a new Deposit Insurance Fund (the “DIF”); and |
| | • | | providing credits to financial institutions that capitalized the FDIC prior to 1996 to offset future assessment premiums. |
FDIRA also authorizes the FDIC to revise the current risk-based assessment system, subject to notice and comment and caps the amount of the DIF at 1.50% of domestic deposits. The FDIC must issue cash dividends, awarded on a historical basis, for the amount of the DIF over the 1.50% ratio. Additionally, if the DIF exceeds 1.35% of domestic deposits at year-end, the FDIC must issue cash dividends, awarded on a historical basis, for half of the amount of the excess.
Federal Home Loan Bank System. The FHLB system provides a central credit facility for member institutions. In December 2004, the FHLB of Atlanta implemented a new capital plan. As a member of the FHLB of Atlanta and under the new capital plan, the Bank is required to own capital stock in the FHLB of Atlanta in an amount at least equal to 0.20% (or 20 basis points) of the Bank’s total assets at the end of each calendar year, plus 4.5% of its outstanding advances (borrowings) from the FHLB of Atlanta under the new activity-based stock ownership requirement. On December 31, 2006, the Bank was in compliance with this requirement.
Community Reinvestment. Under the Community Reinvestment Act (“CRA”), as implemented by regulations of the FDIC, an insured institution has a continuing and affirmative obligation consistent with its safe and sound operation to help meet the credit needs of its entire community, including low and moderate income neighborhoods. The CRA does not establish specific lending requirements or programs for financial institutions, nor does it limit an institution’s discretion to develop, consistent with the CRA, the types of products and services that it believes are best suited to its particular community. The CRA requires the federal banking regulators, in connection with their examinations of insured institutions, to assess the institutions’ records of meeting the credit needs of their communities, using the ratings of “outstanding,” “satisfactory,” “needs to improve,” or “substantial noncompliance,” and to take that record into account in its evaluation of certain applications by those institutions. All institutions are required to make public disclosure of their CRA performance ratings. The Bank received a “satisfactory” rating in its last CRA examination which was conducted during December 2004.
Prompt Corrective Action.The FDIC has broad powers to take corrective action to resolve the problems of insured depository institutions. The extent of these powers will depend upon whether the institution in question is “well capitalized,” “adequately capitalized,” “undercapitalized,” “significantly undercapitalized,” or “critically undercapitalized.” Under the regulations, an institution is considered “well capitalized” if it has (i) a total risk-based capital ratio of 10% or greater, (ii) a Tier I risk-based capital ratio of 6% or greater, (iii) a leverage ratio of 5% or greater and (iv) is not subject to any order or written directive to meet and maintain a specific capital level for any capital measure. An “adequately capitalized” institution is defined as one that has (i) a total risk-based capital ratio of 8% or greater, (ii) a Tier I risk-based capital ratio of 4% or greater and (iii) a leverage ratio of 4% or greater (or 3% or greater in the case of an institution with the highest examination rating). An institution is considered (A) “undercapitalized” if it has (i) a total risk-based capital ratio of less than 8%, (ii) a Tier I risk-based capital ratio of less than 4% or (iii) a leverage ratio of less than 4% (or 3% in the case of an institution with the highest examination rating); (B) “significantly undercapitalized” if the institution has (i) a total risk-based capital ratio of less than 6%, or (ii) a Tier I risk-based capital ratio of less than 3% or (iii) a leverage ratio of less than 3% and (C) “critically undercapitalized” if the institution has a ratio of tangible equity to total assets equal to or less than 2%.
6
Changes in Control. The BHCA prohibits the Company from acquiring direct or indirect control of more than 5% of the outstanding voting stock or substantially all of the assets of any bank or savings bank or merging or consolidating with another bank holding company or savings bank holding company without prior approval of the Federal Reserve. Similarly, Federal Reserve approval (or, in certain cases, non-disapproval) must be obtained prior to any person acquiring control of the Company. Control is conclusively presumed to exist if, among other things, a person acquires more than 25% of any class of voting stock of the Company or controls in any manner the election of a majority of the directors of the Company. Control is presumed to exist if a person acquires more than 10% of any class of voting stock and the stock is registered under Section 12 of the Securities Exchange Act of 1934 as amended (the “Exchange Act”) or the acquiror will be the largest shareholder after the acquisition.
Federal Securities Law. The Company has registered its common stock with the Securities and Exchange Commission (the “SEC”) pursuant to Section 12(g) of the Exchange Act. As a result of such registration, the proxy and tender offer rules, insider trading reporting requirements, annual and periodic reporting and other requirements of the Exchange Act are applicable to the Company.
Transactions with Affiliates.Under current federal law, depository institutions are subject to the restrictions contained in Section 22(h) of the Federal Reserve Act with respect to loans to directors, executive officers and principal shareholders. Under Section 22(h), loans to directors, executive officers and shareholders who own more than 10% of a depository institution (18% in the case of institutions located in an area with less than 30,000 in population), and certain affiliated entities of any of the foregoing, may not exceed, together with all other outstanding loans to such person and affiliated entities, the institution’s loans-to-one-borrower limit (as discussed below). Section 22(h) also prohibits loans above amounts prescribed by the appropriate federal banking agency to directors, executive officers and shareholders who own more than 10% of an institution, and their respective affiliates, unless such loans are approved in advance by a majority of the board of directors of the institution. Any “interested” director may not participate in the voting. The FDIC has prescribed the loan amount (which includes all other outstanding loans to such person), as to which such prior board of director approval is required, as being the greater of $25,000 or 5% of capital and surplus (up to $500,000). Further, pursuant to Section 22(h), the Federal Reserve requires that loans to directors, executive officers, and principal shareholders be made on terms substantially the same as offered in comparable transactions with non-executive employees of the Bank. The FDIC has imposed additional limits on the amount a bank can loan to an executive officer.
Loans to One Borrower.The Bank is subject to the Commissioner’s loans to one borrower limits which are substantially the same as those applicable to national banks. Under these limits, no loans and extensions of credit to any borrower outstanding at one time and not fully secured by readily marketable collateral shall exceed 15% of the unimpaired capital and unimpaired surplus of the bank. Loans and extensions of credit fully secured by readily marketable collateral may comprise an additional 10% of unimpaired capital and unimpaired surplus.
Gramm-Leach-Bliley Act. The federal Gramm-Leach-Bliley Act enacted in 1999 (the “GLB Act”) dramatically changed various federal laws governing the banking, securities and insurance industries. The GLB Act has expanded opportunities for banks and bank holding companies to provide services and engage in other revenue-generating activities that previously were prohibited to them. However, this expanded authority also may present us with new challenges as our larger competitors are able to expand their services and products into areas that are not feasible for smaller, community oriented financial institutions. The GLB Act likely will have a significant economic impact on the banking industry and on competitive conditions in the financial services industry generally.
USA Patriot Act of 2001.The USA Patriot Act of 2001 was enacted in response to the terrorist attacks that occurred in New York, Pennsylvania and Washington, D.C. on September 11, 2001. The Act is intended to strengthen the ability of U.S. law enforcement and the intelligence community to work cohesively to combat terrorism on a variety of fronts. The potential impact of the Act on financial institutions of all kinds is significant and wide ranging. The Act contains sweeping anti-money laundering and financial transparency laws and requires various regulations, including standards for verifying customer identification at account opening, and rules to promote cooperation among financial institutions, regulators, and law enforcement entities in identifying parties that may be involved in terrorism or money laundering.
Sarbanes-Oxley Act of 2002.On July 30, 2002, the Sarbanes-Oxley Act of 2002 was signed into law and became some of the most sweeping federal legislation addressing accounting, corporate governance and disclosure issues. The impact of the Sarbanes-Oxley Act is wide-ranging as it applies to all public companies and imposes significant new requirements for public company governance and disclosure requirements.
7
In general, the Sarbanes-Oxley Act mandates important new corporate governance and financial reporting requirements intended to enhance the accuracy and transparency of public companies’ reported financial results. It establishes new responsibilities for corporate chief executive officers, chief financial officers and audit committees in the financial reporting process and creates a new regulatory body to oversee auditors of public companies. It backs these requirements with new SEC enforcement tools, increases criminal penalties for federal mail, wire and securities fraud, and creates new criminal penalties for document and record destruction in connection with federal investigations. It also increases the opportunity for more private litigation by lengthening the statute of limitations for securities fraud claims and providing new federal corporate whistleblower protection.
The economic and operational effects of this new legislation on public companies, including us, will be significant in terms of the time, resources and costs associated with complying with the new law. Because the Sarbanes-Oxley Act, for the most part, applies equally to larger and smaller public companies, we will be presented with additional challenges as a smaller, community-oriented financial institution seeking to compete with larger financial institutions in our market.
Other.The federal banking agencies, including the FDIC, have developed joint regulations requiring annual examinations of all insured depository institutions by the appropriate federal banking agency, with some exceptions for small, well-capitalized institutions and state chartered institutions examined by state regulators, and establish operational and managerial, asset quality, earnings and stock valuation standards for insured depository institutions, as well as compensation standards when such compensation would endanger the insured depository institution or would constitute an unsafe practice.
In addition, the Bank is subject to various other state and federal laws and regulations, including state usury laws, laws relating to fiduciaries, consumer credit and equal credit, fair credit reporting laws and laws relating to branch banking. The Bank, as an insured North Carolina commercial bank, is prohibited from engaging as a principal in activities that are not permitted for national banks, unless (i) the FDIC determines that the activity would pose no significant risk to the appropriate deposit insurance fund and (ii) the Bank is, and continues to be, in compliance with all applicable capital standards.
Under Chapter 53 of the North Carolina General Statutes, if the capital stock of a North Carolina commercial bank is impaired by losses or otherwise, the Commissioner is authorized to require payment of the deficiency by assessment upon the bank’s shareholders, pro rata, and to the extent necessary, if any such assessment is not paid by any shareholder, upon 30 days notice, to sell as much as is necessary of the stock of such shareholder to make good the deficiency.
The Bank’s operations are concentrated in the Piedmont region of North Carolina along the I-85/I-40 corridor. The Bank’s operations are concentrated in the Piedmont region of North Carolina. As a result of this geographic concentration, our results may correlate to the economic conditions in these areas. Deterioration in economic conditions in any of these market areas, particularly in the industries on which these geographic areas depend, may adversely affect the quality of the Bank’s loan portfolio and the demand for its products and services, and accordingly, the Bank’s results of operations.
8
The Bank is exposed to risks in connection with the loans it makes. A significant source of risk for the Company and the Bank arises from the possibility that losses will be sustained by the Bank because borrowers, guarantors and related parties may fail to perform in accordance with the terms of their loans. The Bank has underwriting and credit monitoring procedures and credit policies, including the establishment and review of the allowance for loan losses, that it believes are appropriate to minimize this risk by assessing the likelihood of nonperformance, tracking loan performance and diversifying its loan portfolio. Such policies and procedures, however, may not prevent unexpected losses that could adversely affect the Bank’s results of operations.
The Company and the Bank compete with much larger companies for some of the same business. The banking and financial services business in the Bank’s market areas continues to be a competitive field and is becoming more competitive as a result of:
| | • | | Changes in regulations; |
| | • | | Changes in technology and product delivery systems; and |
| | • | | The accelerating pace of consolidation among financial services providers. |
The Company and the Bank may not be able to compete effectively in its markets, and its results of operations could be adversely affected by the nature or pace of change in competition. The Bank competes for loans, deposits and customers with various bank and nonbank financial services providers, many of which are much larger in total assets and capitalization, have greater access to capital markets and offer a broader array of financial services.
The Company’s trading volume has been low compared with larger national and regional banks. The Company common stock is traded on the NASDAQ Global Market. However, the trading volume of the Company’s common stock is relatively low when compared with more seasoned companies listed on NASDAQ Global Market, NASDAQ Global Select System, or other consolidated reporting systems or stock exchanges. Thus, the market in the Company’s common stock may be limited in scope relative to other larger companies. In addition, the Company cannot say with any certainty that a more active and liquid trading market for its common stock will develop.
Technological advances impact the Company’s business. The banking industry is undergoing technological changes with frequent introductions of new technology-driven products and services. In addition to improving customer services, the effective use of technology increases efficiency and enables financial institutions to reduce costs. The Company’s future success will depend, in part, on our ability to address the needs of the Bank’s customers by using technology to provide products and services that will satisfy customer demands for convenience as well as to create additional efficiencies in operations. Many competitors have substantially greater resources to invest in technological improvements. The Bank may not be able to effectively implement new technology-driven products and services or successfully market such products and services to its customers.
Government regulations may prevent or impair the Company’s ability to pay dividends, engage in mergers or operate in other ways. Current and future legislation and the policies established by federal and state regulatory authorities will affect our operations. The Bank is subject to supervision and periodic examination by the FDIC and the North Carolina State Commissioner of Banks (the “Commissioner”). The Company is subject to regulation by the Federal Reserve and the Commissioner. Banking regulations, designed primarily for the protection of depositors, may limit the growth and the return to the Company’s shareholders by restricting certain activities, such as:
| | • | | The payment of dividends to our shareholders; |
| | • | | Possible mergers with or acquisitions of or by other institutions; |
| | • | | Our desired investments; |
| | • | | Loans and interest rates on loans; |
| | • | | Interest rates paid on our deposits; |
| | • | | The possible expansion of our branch offices; and/or |
| | • | | Our ability to provide securities or trust services. |
The Bank also is subject to capitalization guidelines set forth in federal legislation, and could be subject to enforcement actions to the extent that it is found by regulatory examiners to be undercapitalized. The Company cannot predict what changes, if any, will be made to existing federal and state legislation and regulations or the effect that such changes may have on the Company’s future business and earnings prospects. The cost of compliance with regulatory requirements may adversely affect our ability to operate profitably.
9
The cost of compliance with Section 404 of the Sarbanes-Oxley Act of 2002 may negatively impact the Company’s income. The Company is subject to the rules and regulations of the SEC, including those rules and regulations mandated by the Sarbanes-Oxley Act of 2002. Section 404 of the Sarbanes-Oxley Act of requires all reporting companies to include in their annual report a statement of management’s responsibilities for establishing and maintaining adequate internal control over financial reporting, together with an assessment of the effectiveness of those internal controls. Section 404 further requires that the reporting company’s independent auditors attest to, and report on, this management assessment. The Company is not yet subject to the auditor attestation requirement of Section 404; however, the Company expects its expenses related to its internal and external auditors to increase significantly.
The cost efficiencies of the merger between the Bank and SterlingSouth may not be realized or as great as expected. The Company is continuing the process of merging the operations of SterlingSouth with the Bank’s. As the Company continues to integrate the two companies’ operations, it is possible that there will be disruptions in the operations. For example, as the Bank continues working out differences in the two companies’ business procedures, controls, product descriptions, account terms, personnel policies and data processing systems, there could be problems that affect the Bank’s ongoing relationships with its and SterlingSouth’s customers or that affect the Bank’s ability to realize all anticipated benefits of the merger. Some of these difficulties include, without limitation, the loss of key employees and customers, the disruption of ongoing business relationships, and possible inconsistencies in standards, controls, procedures and policies.
| ITEM 1B. | UNRESOLVED STAFF COMMENTS |
None.
|
Owned properties: |
Main Office: 831 Julian Avenue, Thomasville, NC 27360. |
Archdale Office: 113 Trindale Road, Archdale, NC 27263. |
Lexington Office: 115 East Center Street, Lexington, NC 27292. |
North Thomasville Office: 1317 National Highway, Thomasville, NC 27360. |
Kernersville Office: 211 Broad Street, Kernersville, NC 27284. |
Oak Ridge Office: 8000 Linville Road, Oak Ridge, NC 27310 |
High Point Office: 801 North Elm Street, High Point, NC 27262. |
Salisbury Office: 415 Jake Alexander Boulevard West, Salisbury, NC 28147. |
Harrisburg Office: 3890 Main Street, Harrisburg, NC 28075 |
N. Davidson Office: 5744 Old US Hwy 52, Lexington, NC 27374 |
|
Leased properties: |
Friendly Center Office: 3202 Northline Avenue, Greensboro, NC 27408 |
Dover Road Office: 1110 Dover Road, Greensboro, NC 27408 |
Elm Street Office: 112 N. Elm Street, Greensboro, NC 27404 |
Winston Salem Office: 1551 Westbrook Plaza Drive, Suite 90, Greentree II Building, |
Winston Salem, NC 27103 |
The total net book value of the Bank’s premises and equipment on December 31, 2006 was $19.6 million. All properties are considered by the Bank’s management to be in good condition and adequately covered by insurance.
Any property acquired as a result of foreclosure or by deed in lieu of foreclosure is classified as “real estate owned” until it is sold or otherwise disposed of by the Bank to recover its investment. As of December 31, 2006, the Bank had $1.1 million of assets classified as real estate owned.
10
None.
| ITEM 4. | SUBMISSION OF MATTERS TO A VOTE OF SECURITY HOLDERS |
No matter was submitted to a vote of the stockholders of the Company during the fourth quarter of the fiscal year ended December 31, 2006.
PART II
| ITEM 5. | MARKET FOR REGISTRANT’S COMMON EQUITY, RELATED STOCK HOLDER MATTERS AND ISSUER PURCHASES OF EQUITY SECURITIES |
The Company’s common stock is listed in the NASDAQ Global Market under the symbol “BNCN”. Scott & Stringfellow, Inc., Morgan Keegan, Ryan Beck & Co., Sandler O’Neill & Partners, L.P., Raymond James & Associates, Howe Barnes, McKinnon and Company, and Monroe Securities are the market makers in the Company’s stock. Wachovia Securities is not a market maker; however, they do attempt to match-up buyers and sellers through their local offices.
Table 19 following this discussion presents the over-the-counter market quotations for the Company’s common stock for the years ended December 31, 2006 and 2005. The quotations reflect inter-dealer prices, without retail mark-up, mark-down or commission, and may not represent actual transactions.
As of December 31, 2006, the Company had approximately 1,421 shareholders of record not including persons or entities whose stock is held in nominee or “street” name and by various banks and brokerage firms.
See “ITEM 1. DESCRIPTION OF BUSINESS — Supervision and Regulation” above for regulatory restrictions which limit the ability of the Bank to pay dividends. The Company has paid five annual cash dividends, with the most recent two being cash dividends of $0.18 and $0.15 per share of common stock on a split adjusted basis on February 23, 2007 and March 10, 2006, respectively. The Company paid a 10% stock dividend on January 22, 2007 to all holders of common stock on January 5, 2007.
There were no purchases made by or on behalf of the Company or any “affiliated purchases” (as defined in Rule 10b-18(a)(3) under the Securities Exchange Act of 1934), of the Company’s common stock during the three months ended December 31, 2006.The maximum amount of shares that may be purchased in the stock repurchase program will be limited to 10% of the outstanding common stock. As of December 31, 2006, the maximum of stock able to be purchased by the Company amounted to 609,909 shares, with 199,864 shares repurchased.
The information required to be disclosed under Item 201(d) of Regulation S-K “Securities Authorized for Issuance Under Equity Compensation Plans” is presented in Item 12 of this Form 10-K.
11
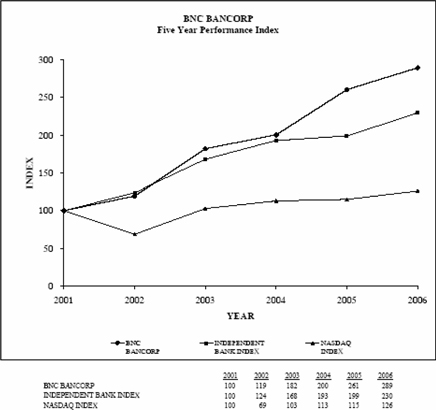
Performance Graph
The following graph compares the Company’s cumulative stockholder return on its Common Stock with a NASDAQ index and with a southeastern bank index. The graph was prepared by The Carson Medlin Company using data as of December 31, 2006.
12
| ITEM 6. | SELECTED FINANCIAL DATA |
SELECTED CONSOLIDATED FINANCIAL INFORMATION AND OTHER DATA
The following table sets forth our historical consolidated financial data and operating information for the periods indicated. The selected historical annual consolidated statement of operations and balance sheet data as of and for each of the five fiscal years presented are derived from, and are qualified in their entirety by, our consolidated financial statements. Historical results are not necessarily indicative of the results to be expected in the future. You should read the following data together with “Item 1. Business,” “Item 7. Management’s Discussion and Analysis of Financial Condition and Results of Operations,” and our consolidated financial statements and the related notes appearing in “Item 8. Consolidated Financial Statements and Supplemental Data.” (Dollars in thousands, except share and per share data).
BNC Bancorp
Table 1
Selected Consolidated Financial Information and Other Data
($ in thousands, except per share and nonfinancial data)
| | | | | | | | | | | | | | | |
| | | At or for the Year Ended December 31, |
| | | 2006 | | 2005 | | 2004 | | 2003 | | 2002 |
Operating Data: | | | | | | | | | | | | | | | |
Total interest income | | $ | 53,211 | | $ | 33,373 | | $ | 23,171 | | $ | 18,024 | | $ | 15,929 |
Total interest expense | | | 26,481 | | | 14,593 | | | 8,029 | | | 6,074 | | | 5,918 |
| | | | | | | | | | | | | | | |
Net interest income | | | 26,730 | | | 18,780 | | | 15,142 | | | 11,950 | | | 10,011 |
Provision for loan losses | | | 2,655 | | | 2,515 | | | 1,190 | | | 520 | | | 820 |
| | | | | | | | | | | | | | | |
Net interest income after provision | | | 24,075 | | | 16,265 | | | 13,952 | | | 11,430 | | | 9,191 |
Non-interest income | | | 3,821 | | | 2,982 | | | 3,190 | | | 3,379 | | | 2,348 |
Non-interest expense | | | 19,110 | | | 13,023 | | | 11,863 | | | 10,034 | | | 7,772 |
| | | | | | | | | | | | | | | |
Income before income taxes | | | 8,786 | | | 6,224 | | | 5,279 | | | 4,775 | | | 3,767 |
Provision for income taxes | | | 2,616 | | | 1,719 | | | 1,474 | | | 1,368 | | | 1,157 |
| | | | | | | | | | | | | | | |
Net income (loss) | | $ | 6,170 | | $ | 4,505 | | $ | 3,805 | | $ | 3,407 | | $ | 2,610 |
| | | | | | | | | | | | | | | |
Per Share Data: (6) | | | | | | | | | | | | | | | |
Earnings per share - basic | | $ | 1.09 | | $ | 0.94 | | $ | 0.79 | | $ | 0.70 | | $ | 0.57 |
Earnings per share - diluted | | | 1.04 | | | 0.88 | | | 0.75 | | | 0.66 | | | 0.55 |
Cash dividends paid | | | 0.15 | | | 0.12 | | | 0.10 | | | 0.08 | | | — |
Market price | | | | | | | | | | | | | | | |
High | | | 18.58 | | | 17.65 | | | 13.43 | | | 12.90 | | | 8.10 |
Low | | | 15.43 | | | 12.42 | | | 11.31 | | | 7.01 | | | 5.62 |
Close | | | 18.58 | | | 16.86 | | | 13.09 | | | 12.00 | | | 7.93 |
Tangible book value | | | 6.92 | | | 6.18 | | | 5.35 | | | 4.80 | | | 4.45 |
| | | | | |
Weighted average shares outstanding: | | | | | | | | | | | | | | | |
Basic | | | 5,658,196 | | | 4,798,869 | | | 4,788,713 | | | 4,854,205 | | | 4,617,986 |
Diluted | | | 5,957,478 | | | 5,093,327 | | | 5,099,679 | | | 5,133,131 | | | 4,812,740 |
Year-end shares outstanding | | | 6,709,007 | | | 4,804,748 | | | 4,785,754 | | | 4,801,548 | | | 4,884,505 |
| | | | | |
Selected Year-End Balance Sheet Data: | | | | | | | | | | | | | | | |
Total assets | | $ | 951,731 | | $ | 594,550 | | $ | 497,549 | | $ | 372,281 | | $ | 306,636 |
Loans | | | 774,664 | | | 499,247 | | | 420,838 | | | 303,732 | | | 233,180 |
Allowance for loan losses | | | 10,400 | | | 6,140 | | | 5,361 | | | 4,598 | | | 4,306 |
Goodwill | | | 26,129 | | | 3,423 | | | 3,423 | | | 3,423 | | | 3,423 |
Deposits | | | 786,777 | | | 490,892 | | | 391,480 | | | 296,742 | | | 259,546 |
Short-term borrowings | | | 4,673 | | | 7,061 | | | 28,275 | | | 12,535 | | | 3,783 |
Long-term debt | | | 81,713 | | | 59,496 | | | 45,496 | | | 34,000 | | | 16,000 |
Shareholders’ equity | | | 72,523 | | | 33,114 | | | 29,037 | | | 26,493 | | | 25,169 |
| | | | | |
Selected Average Balances: | | | | | | | | | | | | | | | |
Total assets | | $ | 747,997 | | $ | 549,654 | | $ | 442,087 | | $ | 331,907 | | $ | 255,988 |
Loans, including loans held for sale | | | 615,689 | | | 454,395 | | | 365,377 | | | 257,402 | | | 203,333 |
Total interest-earning assets | | | 685,981 | | | 503,013 | | | 408,385 | | | 299,033 | | | 232,263 |
Deposits, interest-bearing | | | 564,084 | | | 404,384 | | | 321,590 | | | 240,325 | | | 184,662 |
Total interest-bearing liabilities | | | 643,325 | | | 475,254 | | | 378,563 | | | 274,007 | | | 206,172 |
Shareholders’ Equity | | | 48,949 | | | 31,061 | | | 28,011 | | | 26,734 | | | 22,386 |
13
BNC Bancorp
Table 1
Selected Consolidated Financial Information and Other Data
($ in thousands, except per share and nonfinancial data)
| | | | | | | | | | | | | | | |
| | | At or for the Year Ended December 31, | |
| | | 2006 | | | 2005 | | | 2004 | | | 2003 | | | 2002 | |
Selected Performance Ratios: | | | | | | | | | | | | | | | |
Return on average assets | | 0.82 | % | | 0.82 | % | | 0.86 | % | | 1.03 | % | | 1.02 | % |
Return on average equity | | 12.60 | % | | 14.50 | % | | 13.58 | % | | 12.74 | % | | 11.66 | % |
Net interest spread (1) | | 3.82 | % | | 3.75 | % | | 3.72 | % | | 3.95 | % | | 4.10 | % |
Net interest margin (2) | | 4.08 | % | | 3.92 | % | | 3.87 | % | | 4.14 | % | | 4.42 | % |
Non-interest income to total revenue (5) | | 12.51 | % | | 13.70 | % | | 17.40 | % | | 22.04 | % | | 19.00 | % |
Non-interest income to average assets | | 0.51 | % | | 0.54 | % | | 0.72 | % | | 1.02 | % | | 0.92 | % |
Non-interest expense to average assets | | 2.55 | % | | 2.37 | % | | 2.68 | % | | 3.02 | % | | 3.04 | % |
Efficiency ratio(7) | | 62.55 | % | | 59.84 | % | | 64.71 | % | | 65.46 | % | | 62.89 | % |
Dividend payout ratio | | 13.34 | % | | 12.43 | % | | 12.84 | % | | 11.40 | % | | 0.00 | % |
| | | | | |
Asset Quality Ratios: | | | | | | | | | | | | | | | |
Nonperforming loans to period-end loans | | 0.16 | % | | 0.37 | % | | 0.08 | % | | 0.27 | % | | 0.73 | % |
Allowance for loan losses to period-end loans | | 1.34 | % | | 1.23 | % | | 1.27 | % | | 1.51 | % | | 1.85 | % |
Allowance for loan losses to nonperforming loans | | 839.39 | % | | 335.70 | % | | 1614.76 | % | | 550.66 | % | | 253.29 | % |
Nonperforming assets to total assets (3) | | 0.24 | % | | 0.45 | % | | 0.18 | % | | 0.27 | % | | 0.55 | % |
Net loan charge-offs to average loans | | 0.20 | % | | 0.38 | % | | 0.12 | % | | 0.09 | % | | 0.49 | % |
| | | | | |
Capital Ratios: (4) | | | | | | | | | | | | | | | |
Total risk-based capital | | 10.23 | % | | 11.27 | % | | 10.79 | % | | 10.16 | % | | 9.85 | % |
Tier 1 risk-based capital | | 8.00 | % | | 8.61 | % | | 9.55 | % | | 8.91 | % | | 8.60 | % |
Leverage ratio | | 7.40 | % | | 7.92 | % | | 8.66 | % | | 7.94 | % | | 7.33 | % |
Equity to assets ratio | | 7.62 | % | | 5.57 | % | | 5.84 | % | | 7.12 | % | | 8.21 | % |
Tangible equity to assets ratio | | 4.77 | % | | 5.01 | % | | 5.16 | % | | 6.22 | % | | 7.13 | % |
| | | | | |
Other Data: | | | | | | | | | | | | | | | |
Number of full service banking offices | | 13 | | | 8 | | | 7 | | | 6 | | | 6 | |
Number of limited service lending offices | | 1 | | | 2 | | | 3 | | | 3 | | | — | |
Number of full time equivalent employees | | 187 | | | 140 | | | 122 | | | 106 | | | 94 | |
| (1) | Net interest spread is the difference between the average yield on interest-earning assets and the average cost of interest-bearing liabilities. |
| (2) | Net interest margin is net interest income divided by average interest-earning assets. |
| (3) | Nonperforming assets consist of non-accrual loans, restructured loans, and real estate owned, where applicable. |
| (4) | Capital ratios are for the bank. |
| (5) | Total revenue consists of net interest income and non-interest income. |
| (6) | All per share data has been restated to reflect the dilutive effect of a 10% stock dividend distributed on January 22, 2007, a stock split effected in the form of a 25% stock dividend in 2005 and a stock split effected in the form of a 10% stock dividend in 2003. |
| (7) | Efficiency ratio is non-interest expense divided by the sum of net interest income and non-interest income. |
14
| ITEM 7. | MANAGEMENT’S DISCUSSION AND ANALYSIS OF FINANCIAL CONDITION AND RESULTS OF OPERATIONS |
Management’s discussion and analysis is intended to assist readers in understanding and evaluating of the consolidated financial condition and results of operations of the Company. It should be read in conjunction with the audited consolidated financial statements and accompanying notes included in this annual report. Additional discussion and analysis related to fiscal 2006 is contained in our Quarterly Reports on Form 10-Q for the fiscal quarters ended March 31, 2006, June 30, 2006 and September 30, 2006, respectively.
FORWARD LOOKING STATEMENTS
This report contains certain forward-looking statements with respect to the financial condition, results of operations and business of the Company and the Bank. These forward-looking statements involve risks and uncertainties and are based on the beliefs and assumptions of management of the Company and on the information available to management at the time that these disclosures were prepared. These statements can be identified by the use of words like “expect,” “anticipate,” “estimate” and “believe,” variations of these words and other similar expressions. Readers should not place undue reliance on forward-looking statements as a number of important factors could cause actual results to differ materially from those in the forward-looking statements. Factors that could cause actual results to differ materially include, but are not limited to, (1) competition in the Bank’s markets, (2) changes in the interest rate environment, (3) general national, regional or local economic conditions may be less favorable than expected, resulting in, among other things, a deterioration in credit quality and the possible impairment of collectibility of loans, (4) legislative or regulatory changes, including changes in accounting standards, (5) significant changes in the federal and state legal and regulatory environment and tax laws, (6) the impact of changes in monetary and fiscal policies, laws, rules and regulations and (7)other risks and factors identified in the Company’s other filings with the SEC. The Company undertakes no obligation to update any forward-looking statements.
The Company is a one-bank holding company incorporated under the laws of North Carolina to serve as the holding company for the Bank. The Company acquired all of the outstanding capital stock of the Bank on December 16, 2002. The Bank is a full service commercial bank that was incorporated under the laws of the State of North Carolina on November 15, 1991, and opened for business on December 3, 1991. The Bank concentrates its marketing and banking efforts to serve the citizens and business interests of the cities and communities located in Davidson, Randolph, Guilford, Rowan, Cabarrus and Forsyth Counties. See “PART I, ITEM 1 — BUSINESS” for an overview of the business operations of the Company and the Bank.
EXECUTIVE SUMMARY
Growth, Expansion, and Funding Trends. The common theme with all of our expansion efforts is finding great bankers of high character and technical skills in high growth markets. We have looked at acquisition opportunities over the past three years, but until our transaction with SterlingSouth, none had the ingredients that we require: solid management, common philosophy on service, and a strong market presence. During 2006, the Company acquired SterlingSouth Bank in Greensboro, North Carolina. SterlingSouth had approximately $175 million in assets at the time of the acquisition, and conducted its business from three offices in the dynamic Greensboro metro-market. Combining the highly attractive Greensboro market and a management and lending team comprised of seasoned veterans, all having over 17 years of banking experience, made this acquisition a great fit strategically. See Note B – “Business Combinations” in the accompanying audited financial statements.
Quality people, high growth markets, and a strong dedication to asset quality are the underlying principles of our expansion efforts. In 2006 we opened a full-service office in the northern tip of Davidson County, just south of the Winston-Salem metro market. This office was staffed with two of the most prominent and long-standing bankers in this market. With this group’s leadership, the Bank was able to assemble a team for this office that brings a long track record of success, both as bankers and civic leaders in this community. Also in 2006, we received full service banking powers for our Harrisburg limited service facility.
In February of 2006, the Board of Directors announced a definitive agreement to acquire SterlingSouth Bank located in
15
Greensboro, North Carolina. This transaction was closed in July, and provided approximately $175 million in asset growth and three full-service offices in the Greensboro market. This acquisition provided seasoned bankers in the Greensboro market, experienced loan and deposit support professionals, and three outside directors with long standing ties to the Greensboro market. Strategically, this acquisition met all of our objectives: quality bankers, a high growth market, and seasoned, local leadership.
Trends. Beginning in 2003, the Company began expanding our footprint into new markets using loan production offices as an entry vehicle. Loan production offices were opened in High Point in the second quarter of 2003, and in Salisbury in the fourth quarter of 2003. Each of these offices was successful in growing their respective loan portfolios to over $100 million in loans outstanding by the end of 2005, and both have been converted into full-service offices. With the success of the loan production office model, the Company opened loan production offices in the cities of Winston-Salem and Harrisburg, North Carolina in 2004 and 2005. With deposit rates on the rise, and the value of core deposits increasing, our strategy shifted more towards and expansion strategy that was much more balanced from a deposit and loan growth perspective. We will continue to evaluate opportunities that arise, and utilize either the full-service office or the loan production vehicle as entries into attractive markets as deemed appropriate.
The Company’s loan portfolio has more than tripled from the $233.2 million reported on December 31, 2002, to December 31, 2006, when total loans were $774.7 million. In this four-year period, rates have been at historically low levels. Management has made a conscious effort to pursue variable rate pricing on a predominance of this new growth in the loan portfolio, thereby experiencing a shift in our portfolio mix from 50% fixed at the end of 2002, to 61% variable at the end of 2006. As rates have increased over the past 27 months, the rates on these variable-rate loans have increased concurrently, and have contributed to a strong rise in the Bank’s yield on earning assets.
Over the same time period, management has utilized the wholesale CD markets to attract and lock in longer-term funding. This longer term funding, terms of 18 months to five years, carried a higher cost in the short-term, but as rates have risen substantially over the past 15 months, this strategy has helped to hold down the cost of our interest bearing liabilities.
With rates at a level that is approaching “neutral” as defined by the Federal Reserve Open Market Committee, management and the Board of Directors have worked to formulate and execute a strategy to reduce our Company’s asset sensitive position. During 2005 and 2006, the Company executed a $55 million notional of swap transactions whereby we are paying prime rate variable and received a fixed rate of 7.85% for a weighted average period of less than five years. This effectively turned the interest stream on $55 million of our prime based loan portfolio into a fixed interest stream at 7.85%. This was a series of planned moves to reduce the rate sensitivity in our balance sheet.
The primary driver of our gains in net income have come from a 55.0%, 18.5% and 38.6% growth in the loan portfolio, net of allowance for loan losses, in 2006, 2005 and 2004, respectively. In addition to driving a 42.3% and 24.0% increase in net interest income in 2006 and 2005, respectively, the expansion over the past three years also served to provide greater diversification of our loan portfolio into markets less dependent on manufacturing. In 2002, the Thomasville and Lexington offices accounted for 64.4% of the Company’s total loan portfolio, compared to 25.6% at the end of 2006. These markets continue to be very sound banking markets, however, with the current employment volatility in the manufacturing sectors, management is continuing to look at rapidly growing markets outside Davidson County that provide diverse industries and economic drivers.
In 2003 and early 2004, as we originated variable-rate loans funded with longer-term deposits, the Company’s net interest margin declined from 4.14% in 2003 to 3.87% in 2004. However, the Bank’s net interest income increased 26.7%, or $3.2 million in 2004 compared to 2003. By accepting a slightly smaller net interest margin, the Bank was able to accelerate the growth of our loan portfolio, price our loans and deposits to take advantage of future rate increases, and still report record increases in our net interest income. Each of these results was expected as part of the strategic plan implemented during 2003. In 2005 and 2006, as rates rose steadily, the investment we made in longer-term funding, with the sacrifice in short-term yield we experienced by stressing variable-rate credits began to pay significant dividends. In 2006, the Company’s net interest margin increased to 4.08% and net interest income increased by $7.9 million, or 42.3%.
With assets growing at an accelerated rate over the past four years, it was imperative that part of our on-going strategic plan be
16
devoted to capital planning. As noted in prior reports, the Company has utilized alternative forms of regulatory capital to supplement our shareholders’ equity in order to remain well capitalized for regulatory purposes. The Company has issued four blocks of 30 year variable rate junior subordinated debentures to its wholly owned capital trusts: $5.2 million in April of 2003 priced at 3 month LIBOR + 3.25%; $6.2 million in March of 2004 priced at 3 month LIBOR + 2.80%; $5.2 million in September of 2004 priced at 3 month LIBOR + 2.40%; and $7.2 million in September of 2006 priced at 3 month LIBOR + 1.70%. These debentures fully and unconditionally guarantee the preferred securities issued by the trusts. These debentures are classified as long-term debt on our Company’s financial statements. In addition, during the second quarter of 2005, the Bank issued $8.0 million of subordinated debentures priced at 3 month LIBOR + 1.80%, which is classified as Tier II capital for regulatory purposes.
During 2006, in addition to increases in long-term debt, total shareholders’ equity increased by $39.4 million, or 119.0%. The largest component of this increase was the issuance of 1,686,370 shares of stock amounting to $33.5 million associated with the acquisition of SterlingSouth. The Company reported net income of $6.2 million, and repurchased 11,790 shares of stock amounting to $225,000 as part of the stock repurchase plan approved by the Board of Directors. The stock was repurchased on the open market, at prices and block sizes in accordance with the provisions of the stock repurchase plan and relevant securities laws. In addition, the Company paid cash dividends amounting to $730,000 during 2006. All capital ratios continue to place the Bank in excess of the minimum required to be deemed a “well-capitalized” bank by regulatory measures.
The Bank has maintained liquidity at what it believes to be an appropriate level. Liquid assets, consisting of cash and demand balances due from banks, interest-earning deposits in other banks, investment securities available for sale and FHLB stock, ended the year in the aggregate at $105.2 million, or 11.1% of total assets. The Bank, as a member of the FHLB, has an investment of $3.8 million in FHLB stock. The Bank’s investment in premises and equipment increased by $4.9 million, primarily from adding $2.5 million from the acquisition of SterlingSouth and continued expansion into our markets. Goodwill increased $22.7 million as a result of the acquisition. At December 31, 2006, the Company recorded goodwill of $26.1 million that is not amortizable. At December 31, 2006, the core deposit intangibles associated with acquisitions amounted to $2.3 million.
Net Interest Margin Trends. With rates at historically low levels, the Bank made a conscious decision to limit the growth of our fixed-rate loan portfolio over the past three years. While these fixed-rate credits provide short-term spread, they would have provided a less favorable impact on the Company’s earnings stream as the Federal Reserve increased short-term rates over the past 15 months. In 2006, the Bank reported total loan growth of over $275.4 million, consisting of $142.4 million of net loans from the acquisition of SterlingSouth. During the year, variable-rate loans increased by $118.9 million, while fixed-rate loans increased by $156.5 million. As would be expected, in a rising interest rate environment, the market rate for variable-rate loans adjusted each time the Federal Reserve increased its benchmark rates, and resulted in the Bank’s yield on earning assets increasing throughout 2006.
The funding for the loan growth in 2005 and 2006, unlike in 2004 when funding came primarily from wholesale funding sources, was comprised of both local and wholesale funds. In 2004, we were actively seeking longer-term funding, which was not readily available in our local markets. For efficiency and availability of these longer-term funds, we were forced to utilize the wholesale markets almost exclusively. In 2005, when our targeted terms for new funding changed to 15 months or less, we were able to tap our local markets and generate local deposit growth, primarily with terms of eight months to 13 months. This local deposit growth was led by the opening of our full-service office in High Point in the first quarter, and the expanded awareness of our Salisbury office during the second half of 2005. When local deposit growth was not sufficient to meet short-term funding requirements, we continued to use the wholesale markets to acquire (or to obtain) funding with terms of six months to 24 months. In 2006, with core deposit rates being at a steep discount to wholesale funding, we made an even greater effort to grow our core deposit base through aggressive calling efforts, acquisition, and expansion of our deposit gathering locations. In 2006, core deposits (excludes time deposits) grew approximately $88 million, of which $59 million was from the Sterling acquisition and $29 million was from organic growth.
As management and the Board looks ahead to 2007, it is uncertain how long and at what pace the Federal Reserve will continue to raise, or possibly lower, short-term interest rates. We are positioning our balance sheet and interest income stream to partially participate in future rate moves, while reducing our exposure to a sharp drop in rates. These strategic initiatives now in place management believes are a prudent way to protect the long-term income stream of our Company.
17
FINANCIAL CONDITION
DECEMBER 31, 2006 AND 2005
The most significant factor affecting the Bank’s growth in 2006 was the acquisition of SterlingSouth Bank & Trust Company (SterlingSouth) on July 20, 2006. The largest component of growth was the $275.4 million increase in gross loans. This total increase was composed principally of an increase of $128.3 million in loans secured by real estate other than construction, an increase of $95.5 million in loans secured by construction purpose real estate and an increase of $33.6 million in commercial and industrial loans. The acquisition of SterlingSouth added $142.4 million of net loans, which are included above. The Bank has maintained liquidity at what it believes to be an appropriate level. Liquid assets, consisting of cash and demand balances due from banks, interest-earning deposits in other banks, investment securities available for sale and FHLB stock, ended the year in the aggregate at $105.2 million, or 11.1% of total assets. The Bank, as a member of the FHLB, has an investment of $3.8 million in FHLB stock. The Bank’s investment in premises and equipment increased by $4.9 million, primarily from adding $2.5 million from the acquisition of SterlingSouth and continued expansion into our markets. Goodwill increased $22.7 million as a result of the acquisition. At December 31, 2006, the Company recorded goodwill of $26.1 million that is not amortizable. At December 31, 2006, the core deposit intangibles associated with acquisitions amounted to $2.3 million.
Funding to support higher total assets held at year-end was provided by an increase of $295.9 million in deposit accounts, a decrease of $2.4 million in short-term borrowings, and an increase of $22.2 million in long-term debt. The increase in deposit accounts was due to an increase of $208.2 million in certificates of deposit. Large denomination certificates of deposit increased by $150.0 million in 2006, with $86 million coming from additional wholesale sources and $64 million coming from acquisition and organic growth. At year-end 2006, the Bank had $276.2 million in large denomination certificates of deposit obtained through the wholesale markets. These certificates had maturities ranging from six months to five years at rates at or below those being quoted in the local markets at the time of closing. The smaller denomination time deposits, which come primarily from within our local markets, increased by $58.3 million. The acquisition of SterlingSouth added $141.4 million of deposits, which are included above. Included in long-term borrowings was the issuance of $7.0 million of trust preferred securities that were placed through BNC Capital Trust IV during 2006. The trust preferred securities qualify as Tier 1 capital for regulatory capital purposes subject to certain limitations.
During 2006, total shareholders’ equity increased by $39.4 million, or 119.0%. The largest component of this increase was the issuance of 1,686,370 shares of stock amounting to $33.5 million associated with the acquisition of SterlingSouth. The Company reported net income of $6.2 million, and repurchased 11,790 shares of stock amounting to $225,000 as part of the stock repurchase plan approved by the Board of Directors. The stock was repurchased on the open market, at prices and block sizes in accordance with the provisions of the stock repurchase plan and relevant securities laws. In addition, the Company paid cash dividends amounting to $730,000 during 2006. All capital ratios continue to place the Bank in excess of the minimum required to be deemed an adequately capitalized bank by regulatory measures.
The Company utilizes alternative forms of regulatory capital to supplement our shareholders’ equity in order to remain “well capitalized” for regulatory purposes. The Company has issued four blocks of 30 year variable rate junior subordinated debentures to its wholly owned capital trusts: $5.2 million in April of 2003 priced at 3 month LIBOR + 3.25%; $6.2 million in March of 2004 priced at 3 month LIBOR + 2.80%; $5.2 million in September of 2004 priced at 3 month LIBOR + 2.40%; and $7.2 million in September of 2006 priced at 3 month LIBOR + 1.70%. In addition, during 2005 the Bank issued $8.0 million of subordinated debentures at 3 month LIBOR + 1.80%, which counts as Tier II capital for regulatory purposes. These instruments are classified as long-term debt on our Company’s financial statements.
RESULTS OF OPERATIONS
YEARS ENDED DECEMBER 31, 2006 AND 2005
Overview. The Company reported net income of $6.2 million or $1.04 per diluted share for the year ended December 31, 2006, as compared with net income of $4.5 million or $0.88 per diluted share for 2005, an improvement of $1.7 million or $0.16 per diluted share. Net interest income increased by $8.0 million, or 42.3%, in 2006, while non- interest income increased by $839,000, or 28.1%.
18
The increases in income exceeded the $6.1 million increase in non-interest expenses, which totaled $19.1 million in 2006 as compared with $13.0 million in 2005. The most significant factor affecting the Bank’s operations in 2006 was the acquisition of SterlingSouth Bank & Trust Company (SterlingSouth) on July 20, 2006.
Net Interest Income. Like most financial institutions, the primary component of earnings for the Bank is net interest income. Net interest income is the difference between interest income, principally from loan and investment securities portfolios, and interest expense, principally on customer deposits and borrowings. Changes in net interest income result from changes in volume, spread and margin. For this purpose, “volume” refers to the average dollar level of interest-earning assets and interest-bearing liabilities, “spread” refers to the difference between the average yield on interest-earning assets and the average cost of interest-bearing liabilities, and “margin” refers to net interest income divided by average interest-earning assets and is influenced by the level and relative mix of interest-earning assets and interest-bearing liabilities, as well as levels of non-interest-bearing liabilities. During the years ended December 31, 2006 and 2005, average interest-earning assets were $686.0 million, and $503.0 million, respectively. During these same years, the Bank’s tax effected net yields on average interest-earning assets were 4.08% and 3.92%, respectively. The increase in the net interest margin from 2005 to 2006 was due primarily to two factors:
1. With the Federal Reserve continuing to raise short-term interest rates throughout much of 2006, the Company benefited from having approximately 60% of its loan portfolio with variable-rate pricing. The constant repricing of over 60% of our loan portfolio helped to increase our yield on earning assets and ultimately increase net interest margin.
2. As short-term rates increased, the increases did not have the immediate impact on the rates paid on premium money market accounts and longer term wholesale funding sources. The Company had over $100 million in premium money market balances, whose rates adjusted upwards approximately 65% of the move in the prime rate. In addition, the Bank had over $200 million in longer term funding; either time deposits or FHLB advances, that remained at pre-2005 rates throughout 2006. This helped to control the rise in the interest expense on the Company’s interest-bearing deposits during 2006.
Table 2 and Table 3 following this discussion, “Average Balances and Net Interest Income” and “Volume and Rate Analysis,” respectively, presents an analysis of the Bank’s net interest income and rate/volume activity for 2006 and 2005.
As described above, the primary component of earnings for the Bank is net interest income. Net interest income increased to $26.7 million for the year ended December 31, 2006, an $8.0 million or 42.3% increase from the $18.8 million earned in 2005. Total interest income benefited from strong growth in the level of average earning assets and higher asset yields cause by the repricing of our variable rate loan portfolio as short-term rates rose throughout the year. Average total interest-earning assets increased $183.0 million, or 36.4%, during 2006 as compared to 2005, while the average yield increased by 112 basis points from 6.82% to 7.94%. Average total interest-bearing liabilities increased by $168.1 million, or 35.4%, consistent with the increase in interest-earning assets. The average cost of interest-bearing liabilities increased by 105 basis points from 3.07% to 4.12%. With both yield on earning assets and cost of interest-bearing liabilities increasing, the Bank’s net interest margin increased by 16 basis points. For the year ended December 31, 2006 the net interest margin was 4.08%, while for the year ended December 31, 2005, the net interest margin was a slightly lower 3.92%.
Provision for Loan Losses. The Bank recorded a $2.7 million provision for loan losses in 2006, representing an increase of $140,000 from the $2.5 million provision made in 2005. Provisions for loan losses are charged to income to bring the allowance for loan losses to a level deemed appropriate by management. In evaluating the allowance for loan losses, management considers factors that include growth, composition and industry diversification of the portfolio, historical loan loss experience, current delinquency levels, adverse situations that may affect a borrower’s ability to repay, estimated value of any underlying collateral, prevailing economic conditions and other relevant factors. In both 2006 and 2005 the provision for loan losses was made principally in response to growth in loans and to cover charge-offs. Net loan growth totaled $128.8 million in 2006 (excluding $142.4 million of net loans from the acquisition of SterlingSouth) and $77.6 million in 2005. The allowance for loan losses, as a percentage of loans outstanding,
19
increased from 1.23% at the beginning of 2006 to 1.34% at the end of the year. At December 31, 2006, the allowance for loan losses was $10.4 million, an increase of $4.3 million, or 69.4% from the $6.1 million at the end of 2005. The primary factor contributing to this increase was from the $2.8 million of allowance for loan losses from the acquisition of SterlingSouth. At December 31, 2006 and 2005, the Bank had $1.1 million and $324,000 in nonaccrual loans, respectively. The nonaccrual balance at December 31, 2006 has been written down to a balance that management believes is collectible under normal market conditions. Net loan charge-offs for 2006 were $1.2 million or 0.20% of average loans outstanding during the year.
Non-Interest Income. Non-interest income increased to $3.8 million for the year ended December 31, 2006 as compared with $3.0 million for the year ended December 31, 2005, an increase of $839,000 or 28.1%. Since inception, the Bank has actively pursued additional non-interest income sources outside of traditional banking operations, including income from our investment service operations and our mortgage origination department. The fee income from the Company’s mortgage origination unit increased in 2006 to $605,000 from $512,000 in 2005. Service charges on deposits and other services in 2006 were $2.4 million, an increase of $650,000, or 36.2%, when compared to the $1.8 million in 2005. This increase was essentially growth related. Table 4 following this discussion presents a comparative analysis of the components of non-interest income.
Non-Interest Expenses. Non-interest expenses totaled $19.1 million for the year ended December 31, 2006, an increase of $6.1 million over the $13.0 million reported for 2005. Substantially all of this increase resulted from the Bank’s growth and development during 2006 and 2005, including the opening and expanded staffing of several offices. Personnel costs increased by $3.9 million, or 50.2%, with the majority of this increase attributable to the acquisition of SterlingSouth and to a lesser extent paying the salaries of the lenders and support staff at the new full-service and loan production offices. Included in this increase in personnel costs were the effects of the adoption of accounting standard SFAS 123(R), which added $222,000 to compensation expense during 2006. In addition, with the Bank experiencing asset growth of 60.1% for the year, the necessary support staff also increased. Table 5 following this discussion presents a comparative analysis of the components of non-interest expenses.
Income Taxes. The provision for income taxes of $2.6 million in 2006 and $1.7 million in 2005 represents 29.8% and 27.6%, respectively, of income before income taxes. These effective rates are lower than the blended federal/North Carolina statutory rate of 38.55% principally due to tax-exempt income from municipal bonds and bank-owned life insurance.
RESULTS OF OPERATIONS
YEARS ENDED DECEMBER 31, 2005 AND 2004
Overview. The Company reported net income of $4.5 million or $0.88 per diluted share for the year ended December 31, 2005, as compared with net income of $3.8 million or $0.75 per diluted share for 2004, an improvement of $700,000 or $0.13 per diluted share. Net interest income increased by $3.6 million, or 24.0%, in 2005, while non-interest income decreased by $208,000, or 6.5%. The net increases in income exceeded the $1.2 million increase in non-interest expenses, which totaled $13.0 million in 2005 as compared with $11.9 million in 2004.
Net Interest Income. Like most financial institutions, the primary component of earnings for the Bank is net interest income. Net interest income is the difference between interest income, principally from loan and investment securities portfolios, and interest expense, principally on customer deposits and borrowings. Changes in net interest income result from changes in volume, spread and margin. For this purpose, “volume” refers to the average dollar level of interest-earning assets and interest-bearing liabilities, “spread” refers to the difference between the average yield on interest-earning assets and the average cost of interest-bearing liabilities, and “margin” refers to net interest income divided by average interest-earning assets and is influenced by the level and relative mix of interest-earning assets and interest-bearing liabilities, as well as levels of non-interest-bearing liabilities. During the years ended December 31, 2005 and 2004, average interest-earning assets were $503.0 million, and $408.4 million, respectively. During these same years, the Bank’s tax effected net yields on average interest-earning assets were 3.92% and 3.87%, respectively. The increase in the net interest margin from 2004 to 2005 was due primarily to two factors:
1. With the Federal Reserve raising short-term interest rates steadily throughout 2005, the Company benefited from having 70.8% of its loan portfolio with variable-rate pricing. The constant repricing of over 70% of our loan portfolio helped to increase our yield on earning assets and ultimately increase net interest margin.
20
2. As short-term rates increased, the increases were not as pronounced on rates paid on premium money market accounts. The Company had over $100 million in premium money market balances, whose rates adjusted upwards approximately 65% of the move in the prime rate. This helped to control the rise in the interest expense on the Company’s interest-bearing deposits during 2005.
Table 2 and Table 3 following this discussion, “Average Balances and Net Interest Income” and “Volume and Rate Analysis,” respectively, presents an analysis of the Bank’s net interest income and rate/volume activity for 2005 and 2004.
As described above, the primary component of earnings for the Bank is net interest income. Net interest income increased to $18.8 million for the year ended December 31, 2005, a $3.6 million or 24.0% increase from the $15.1 million earned in 2004. Total interest income benefited from strong growth in the level of average earning assets and higher asset yields cause by the repricing of our variable rate loan portfolio as short-term rates rose throughout the year. Average total interest-earning assets increased $94.6 million, or 23.2%, during 2005 as compared to 2004, while the average yield increased by 98 basis points from 5.84% to 6.82%. Average total interest-bearing liabilities increased by $96.7 million, or 25.5%, consistent with the increase in interest-earning assets. The average cost of interest-bearing liabilities increased by 95 basis points from 2.12% to 3.07%. With both yield on earning assets and cost of interest-bearing liabilities increasing, the Bank’s net interest margin increased by five basis points. For the year ended December 31, 2005 the net interest margin was 3.92%, while for the year ended December 31, 2004, the net interest margin was a slightly lower 3.87%.
Provision for Loan Losses. The Bank recorded a $2.5 million provision for loan losses in 2005, representing an increase of $1.3 million from the $1.2 million provision made in 2004. Provisions for loan losses are charged to income to bring the allowance for loan losses to a level deemed appropriate by management. In evaluating the allowance for loan losses, management considers factors that include growth, composition and industry diversification of the portfolio, historical loan loss experience, current delinquency levels, adverse situations that may affect a borrower’s ability to repay, estimated value of any underlying collateral, prevailing economic conditions and other relevant factors. In both 2005 and 2004 the provision for loan losses was made principally in response to growth in loans and to cover charge-offs. Net loan growth totaled $77.6 million in 2005 and $116.3 million in 2004. The allowance for loan losses, as a percentage of loans outstanding, declined from 1.27% at the beginning of 2005 to 1.23% at the end of the year. At December 31, 2005, the allowance for loan losses was $6.1 million, an increase of $779,000, or 14.5% from the $5.4 million at the end of 2004. At December 31, 2005 and 2004, the Bank had $324,000 and $332,000 in nonaccrual loans, respectively. The nonaccrual balance at December 31, 2005 has been written down to a balance that management believes is collectible under normal market conditions. Net loan charge-offs for 2005 were $1.7 million or 0.38% of average loans outstanding during the year.
Non-Interest Income. Non-interest income decreased to $3.0 million for the year ended December 31, 2005 as compared with $3.2 million for the year ended December 31, 2004, a decrease of $208,000 or 6.5%. Since inception, the Bank has actively pursued additional non-interest income sources outside of traditional banking operations, including income from our investment service operations and our mortgage origination department. The fee income from the Company’s mortgage origination unit decreased in 2005 to $512,000 from $526,000 in 2004. Service charges on deposits and other services in 2005 were $1.8 million, an increase of $114,000, or 6.8%, when compared to the $1.7 million in 2004. This increase was essentially growth related. Table 4 following this discussion presents a comparative analysis of the components of non-interest income.
Non-Interest Expenses. Non-interest expenses totaled $13.0 million for the year ended December 31, 2005, an increase of $1.2 million over the $11.9 million reported for 2004. Substantially all of this increase resulted from the Bank’s growth and development during 2005 and 2004, including the opening and staffing of the full-service office in High Point, expanded staffing in the loan production offices in both Salisbury and Winston-Salem, and staffing of the Harrisburg loan office. Personnel costs increased by $859,000 or 12.5%, with the majority of this increase attributable to paying the salaries of the lenders and support staff at the new full-service and loan production offices. In addition, with the Bank experiencing asset growth of 19.5% for the year, the necessary support staff also increased. Table 5 following this discussion presents a comparative analysis of the components of non-interest expenses.
21
Income Taxes. The provision for income taxes of $1.7 million in 2005 and $1.5 million in 2004 represents 27.6% and 27.9%, respectively, of income before income taxes. These effective rates are lower than the blended federal/North Carolina statutory rate of 38.55% principally due to tax-exempt income from municipal bonds and bank-owned life insurance.
LIQUIDITY
The Bank’s sources of funds are deposits, cash and demand balances due from other banks, interest-earning deposits in other banks and investment securities available for sale. These funds, together with loan repayments, are used to make loans and to fund continuing operations. In addition, at December 31, 2006, the Bank had credit availability with the FHLB of approximately $142.3 million, with $50.0 million outstanding at December 31, 2006.
Total deposits were $786.8 million, and $490.9 million at December 31, 2006 and 2005, respectively. As a result of the Company’s loan growth exceeding local deposit growth, the Bank utilized its wholesale funding sources, such as borrowings from the FHLB and the wholesale CD market. Due to the availability of funds and a wide range of terms available in the wholesale CD market, the Bank grew out-of-market time deposits by $86.0 million in 2006. At December 31, 2006 and 2005, time deposits represented 67.5% and 65.8%, respectively, of the Company’s total deposits. Certificates of deposit of $100,000 or more represented 47.0% and 44.7%, respectively, of the Bank’s total deposits at December 31, 2006 and 2005. At December 31, 2006, the Company had no funds from public municipalities and $276.2 million in wholesale time deposits. Management believes that most other time deposits are relationship-oriented. While the Bank will need to pay competitive rates to retain these deposits at their maturities, there are other subjective factors that will determine their continued retention. Based upon prior experience, the Bank anticipates that a substantial portion of outstanding certificates of deposit will renew upon maturity.
Management anticipates that the Bank will rely primarily upon customer deposits, loan repayments and current earnings to provide liquidity, and will use funds thus generated to make loans and to purchase securities, primarily securities issued by the federal government and its agencies, municipal securities and mortgage-backed securities. In the normal course of business there are various outstanding contractual obligations of the Bank that will require future cash outflows.
In addition there are commitments and contingent liabilities, such as commitments to extend credit that may or may not require future cash outflows. Table 6 following this discussion, “Contractual Obligations and Commitments”, summarizes the Bank’s contractual obligations and commitments as of December 31, 2006.
CAPITAL RESOURCES
At December 31, 2006 and 2005, the Company’s tangible shareholders’ equity totaled $44.1 million and $29.6 million, respectively. The Company’s tangible equity to asset ratio on those dates was 4.63% and 5.01%, respectively. These ratios are above regulatory minimums necessary to be classified as well-capitalized, and show continued effort in our plan to leverage tangible equity capital to better enhance our return on average tangible equity. The Company and the Bank are subject to minimum capital requirements. See “PART 1, ITEM 1—DESCRIPTION OF BUSINESS” — Supervision and Regulation.”
All capital ratios place the Bank in excess of the minimum required to be deemed adequately capitalized by regulatory measures. During 2002, the Bank’s Total Capital to Risk Weighted Assets ratio fell below the 10% threshold to be considered a well-capitalized institution as a result of the high concentration of cash paid in the Bank’s acquisition of a smaller community bank located in Kernersville, North Carolina. The Company’s wholly owned capital trust issued $5.0 million in trust preferred securities during the first half of 2003 to re-establish the Bank’s capital levels to well-capitalized. The Company’s capital trusts issued $7.0 million and $11.0 million of 30 year trust preferred securities during 2006 and 2004, respectively, and while the Bank issued $8.0 million of subordinated debentures in 2005 to augment regulatory Tier I and Tier II capital. The Bank’s Tier I Leverage ratio as of December 31, 2006 and 2005 was 7.70% and 7.89%, respectively.
22
Note O to the accompanying consolidated financial statements presents an analysis of the Company’s and Bank’s regulatory capital position as of December 31, 2006. With the anticipated issuance of subordinated debentures in 2007, to be treated as Tier II capital, after December 31, 2006, management expects that the Bank will remain “well-capitalized” for regulatory purposes throughout 2007, although there can be no assurance that the Bank will not fall into the “adequately-capitalized” classification.
ASSET/LIABILITY MANAGEMENT
The Bank’s results of operations depend substantially on its net interest income. Like most financial institutions, the Bank’s interest income and cost of funds are affected by general economic conditions and by competition in the market place. The purpose of asset/liability management is to provide stable net interest income growth by protecting the Bank’s earnings from undue interest rate risk, which arises from volatile interest rates and changes in the balance sheet mix, and by managing the risk/return relationships between liquidity, interest rate risk, market risk, and capital adequacy. The Bank maintains, and has complied with, an asset/liability management policy approved by the Board of Directors of the Bank and the Company that provides guidelines for controlling exposure to interest rate risk by utilizing the following ratios and trend analysis: liquidity, equity, volatile liability dependence, portfolio maturities, maturing assets and maturing liabilities. This policy is to control the exposure of its earnings to changing interest rates by generally endeavoring to maintain a position within a narrow range around an “earnings neutral position,” which is defined as the mix of assets and liabilities that generate a net interest margin that is least affected by interest rate changes.
When suitable lending opportunities are not sufficient to utilize available funds, the Bank has generally invested such funds in securities, primarily U.S. Treasury securities, securities issued by governmental agencies, mortgage-backed securities and securities issued by local governmental municipalities. The securities portfolio contributes to the Bank’s, and thus the Company’s profits, and plays an important part in the overall interest rate management. However, management of the securities portfolio alone cannot balance overall interest rate risk. The securities portfolio must be used in combination with other asset/liability techniques to actively manage the balance sheet. The primary objectives in the overall management of the securities portfolio are safety, yield, liquidity, asset/liability management (interest rate risk), and investing in securities that can be pledged for public deposits or as collateral for FHLB advances.
In reviewing the needs of the Bank with regard to proper management of its asset/liability program, the Bank’s management estimates its future needs, taking into consideration historical periods of high loan demand and low deposit balances, estimated loan and deposit increases (due to increased demand through marketing), and forecasted interest rate changes. A number of measures are used to monitor and manage interest rate risk, including income simulations and interest sensitivity (gap) analyses. An income simulation model is the primary tool used to assess the direction and magnitude of changes in net interest income resulting from changes in interest rates. Key assumptions in the model include prepayments on loan and loan-backed assets, cash flows and maturities of other investment securities, loan and deposit volumes and pricing. These assumptions are inherently uncertain and, as a result, the model cannot precisely estimate net interest income or precisely predict the impact of higher or lower interest rates on net interest income. Actual results will differ from simulated results due to timing, magnitude and frequency of interest rate changes and changes in market conditions and management strategies, among other factors.
Based on the results of the income simulation model as of December 31, 2006, looking forward for 12 months, the Bank would expect an increase in net interest income of $2.2 million if interest rates increase from current rates by 300 basis points and a decrease in net interest income of $2.0 million if interest rates decrease from current rates by 300 basis points.
The analysis of an institution’s interest rate gap (the difference between the repricing of interest-earning assets and interest-bearing liabilities during a given period of time) is another standard tool for the measurement of the exposure to interest rate risk. The management believes that because interest rate gap analysis does not address all factors that can affect earnings performance, it should be used in conjunction with other methods of evaluating interest rate risk.
23
Table 7 following this discussion, “Interest Rate Sensitivity Analysis” sets forth the amounts of interest-earning assets and interest-bearing liabilities outstanding at December 31, 2006, which are projected to reprice or mature in each of the future time periods shown. Except as stated below, the amounts of assets and liabilities shown which reprice or mature within a particular period were determined in accordance with the contractual terms of the assets or liabilities. Loans with adjustable rates are shown as being due at the end of the next upcoming adjustment period. Money market deposit accounts are considered rate sensitive and are placed in the shortest period, while negotiable order of withdrawal or other transaction accounts are assumed to be more stable sources that are less price elastic and have been placed in the longest period. In making the gap computations, none of the assumptions sometimes made regarding prepayment rates and deposit decay rates have been used for any interest-earning assets or interest-bearing liabilities. In addition, the table does not reflect scheduled principal payments, which will be received throughout the lives of the loans. The interest rate sensitivity of the Bank’s assets and liabilities illustrated in the following table would vary substantially if different assumptions were used or if actual experience differs from that indicated by such assumptions.
Table 7 illustrates that if assets and liabilities reprice in the time intervals indicated in the table, the Bank is asset sensitive within three months, liability sensitive within twelve months, and asset sensitive thereafter. As stated above, certain shortcomings are inherent in the method of analysis presented in the foregoing table. For example, although certain assets and liabilities may have similar maturities or periods to repricing, they may react in different degrees to changes in market interest rates. Also, the interest rates on certain types of assets and liabilities may fluctuate in advance of changes in market interest rates, while interest rates on other types may lag behind changes in market interest rates. For instance, while the table is based on the assumption that money market accounts are immediately sensitive to movements in rates, the Bank expects that in a changing rate environment the amount of the adjustment in interest rates for such accounts would be less than the adjustment in categories of assets that are considered to be immediately sensitive. The same is true for all other interest bearing transaction accounts. Additionally, certain assets have features that restrict changes in the interest rates of such assets both on a short-term basis and over the lives of such assets. Further, in the event of a change in market interest rates, prepayment and early withdrawal levels could deviate significantly from those assumed in calculating the tables. Finally, the ability of many borrowers to service their adjustable-rate debt may decrease in the event of an increase in market interest rates. Due to these shortcomings, the Bank places primary emphasis on its income simulation model when managing its exposure to changes in interest rates.
LENDING ACTIVITIES
General. The Bank provides to its customers a full range of short- to medium-term commercial, mortgage, construction and personal loans, both secured and unsecured. The Bank also makes real estate mortgage and construction loans.
The Bank’s loan policies and procedures establish the basic guidelines governing its lending operations. Generally, the guidelines address the types of loans that the Bank seeks, target markets, underwriting and collateral requirements, terms, interest rate and yield considerations and compliance with laws and regulations. All loans or credit lines are subject to approval procedures and amount limitations. These limitations apply to the borrower’s total outstanding indebtedness to the Bank, including the indebtedness of any guarantor. The policies are reviewed and approved at least annually by the Boards of Directors of the Bank and the Company. The Bank supplements its own supervision of the loan underwriting and approval process with periodic loan audits by internal loan examiners and outside professionals experienced in loan review work. The Bank has focused its portfolio lending activities on higher yielding commercial loans.
Table 8 following this discussion provides an analysis of the Bank’s loan portfolio composition by type of loan as of the end of each of the last five years.
Table 9 following this discussion presents, at December 31, 2006, (i) the aggregate maturities or repricings of loans in the named categories of the Company’s loan portfolio and (ii) the aggregate amounts of variable and fixed rate loans that mature or reprice after one year.
24
Commercial Loans. Commercial business lending is a major focus of the Bank’s lending activities. At December 31, 2006, the Bank’s commercial and industrial loan portfolio equaled $97.1 million or 12.5% of total loans, as compared with $63.4 million or 12.7% of total loans at December 31, 2005. Commercial and industrial loans include both secured and unsecured loans for working capital, expansion, and other business purposes. Short-term working capital loans generally are secured by accounts receivable, inventory and/or equipment. The Bank also makes term commercial loans secured by real estate, which are categorized as real estate loans. Lending decisions are based on an evaluation of the financial strength, management and credit history of the borrower, and the quality of the collateral securing the loan. With few exceptions, the Bank requires personal guarantees and secondary sources of repayment.
Commercial loans generally provide greater yields and reprice more frequently than other types of loans, such as real estate loans. More frequent repricing means that yields on our commercial loans adjust with changes in interest rates.
Real Estate Loans. Real estate loans are made for purchasing, constructing and refinancing one to four family, five or more family and commercial properties. Real estate loans also include home equity credit lines. The Bank offers fixed and adjustable rate options and provides customers access to long-term conventional real estate loans through its mortgage loan department which makes secondary market conforming loans that are originated with a commitment from a correspondent to purchase the loan within 30 days of closing.
Residential real estate loans amounted to $266.1 million and $187.1 million at December 31, 2006 and 2005, respectively. The Bank’s residential mortgage loans are generally secured by properties located within the Bank’s market area. Many of the residential mortgage loans that the Bank makes are originated for the account of third parties. Such loans are classified as loans held for sale in the financial statements. The Bank receives fees for each such loan originated, with such fees aggregating $605,000 for the year ended December 31, 2006 and $512,000 for the year ended December 31, 2005. The Bank anticipates that it will continue to be an active originator of residential loans for the account of third parties.
Commercial real estate loans totaled $382.3 million and $237.5 million at December 31, 2006 and 2005, respectively. This lending has involved loans secured principally by commercial buildings for office, storage and warehouse space, and by agricultural properties. Generally in underwriting commercial real estate loans, the Bank requires the personal guaranty of borrowers and a demonstrated cash flow capability sufficient to service the debt. Loans secured by commercial real estate may be in greater amount and involve a greater degree of risk than one to four family residential mortgage loans. Payments on such loans are often dependent on successful operation or management of the properties.
The Bank originates one to four family residential construction loans for the construction of custom homes (where the home buyer is the borrower) and provides financing to builders and consumers for the construction of pre-sold homes. The Company generally receives a pre-arranged permanent financing commitment from an outside entity prior to financing the construction of pre-sold homes. The Company lends to builders who have demonstrated a favorable record of performance and profitable operations and who are building in markets that management believes it understands and in which it is comfortable with the economic conditions. The Company also makes commercial real estate construction loans, generally for owner-occupied properties. The Company further endeavors to limit its construction lending risk through adherence to established underwriting procedures. Also, the Company generally requires documentation of all draw requests and utilizes loan officers to inspect the project prior to paying any draw requests from the builder. With few exceptions, the Bank requires personal guarantees and secondary sources of repayment on construction loans.
Loans to Individuals. Loans to individuals include automobile loans; boat and recreational vehicle financing and miscellaneous secured and unsecured personal loans. Consumer loans generally can carry significantly greater risks than other loans, even if secured, because the collateral often consists of rapidly depreciating assets such as automobiles and equipment. Repossessed collateral securing a defaulted consumer loan may not provide an adequate source of repayment of the loan. Consumer loan collections are sensitive to job loss, illness and other personal factors. The Bank attempts to manage the risks inherent in consumer lending by following established credit guidelines and underwriting practices designed to minimize risk of loss.
25
COMMITMENTS TO EXTEND CREDIT
In the ordinary course of business, the Bank enters into various types of transactions that include commitments to extend credit that are not included in loans receivable, net, presented on the Company’s consolidated balance sheets. The Bank applies the same credit standards to these commitments as it uses in all its lending activities and has included these commitments in its lending risk evaluations. The Bank’s exposure to credit loss under commitments to extend credit is represented by the amount of these commitments. See Table 6 and Note Q to the accompanying consolidated financial statements.
ASSET QUALITY
The Bank considers asset quality to be of primary importance, and employs a formal internal loan review process to ensure adherence to its lending policy as approved by the Bank’s and the Company’s Boards of Directors. It is the responsibility of each lending officer to assign an appropriate risk grade to every loan originated. Credit Administration, through the loan review process, validates the accuracy of the initial risk grade assessment. In addition, as a given loan’s credit quality improves or deteriorates, it is Credit Administration’s responsibility to change the borrower’s risk grade accordingly. The function of determining the allowance for loan losses is fundamentally driven by the risk grade system. In determining the allowance for loan losses and any resulting provision to be charged against earnings, particular emphasis is placed on the results of the loan review process. Consideration is also given to historical loan loss experience, the value and adequacy of collateral, economic conditions in the Bank’s market area and other factors. For loans determined to be impaired, the allowance is based on discounted cash flows using the loan’s initial effective interest rate or the fair value of the collateral for certain collateral dependent loans. This evaluation is inherently subjective, as it requires material estimates, including the amounts and timing of future cash flows expected to be received on impaired loans that may be susceptible to significant change. The allowance for loan losses represents management’s estimate of the appropriate level of reserve to provide for probable losses inherent in the loan portfolio.
The Bank’s policy regarding past due loans normally requires a prompt charge-off to the allowance for loan losses following timely collection efforts and a thorough review. Further efforts are then pursued through various means available. Loans carried in a non-accrual status are generally collateralized and probable losses are considered in the determination of the allowance for loan losses.
NONPERFORMING ASSETS
Table 10 following this discussion sets forth, for the periods indicated, information with respect to the Bank’s nonaccrual loans, restructured loans, total nonperforming loans (nonaccrual loans plus restructured loans plus loans ninety days past due and still accruing), and total nonperforming assets.
The Company’s consolidated financial statements are prepared on the accrual basis of accounting, including the recognition of interest income on loans, unless we place a loan on nonaccrual basis. The Bank accounts for loans on a nonaccrual basis when it has serious doubts about the ability to collect principal or interest in full. Generally, the Bank’s policy is to place a loan on nonaccrual status when the loan becomes past due 90 days. Loans are also placed on nonaccrual status in cases where management is uncertain whether the borrower can satisfy the contractual terms of the loan agreement. Amounts received on nonaccrual loans generally are applied first to principal and then to interest only after all principal has been collected. Restructured loans are those for which concessions, including the reduction of interest rates below a rate otherwise available to that borrower or the deferral of interest or principal, have been granted due to the borrower’s weakened financial condition. The Bank accrues interest on restructured loans at the restructured rates when management anticipates that no loss of original principal will occur. Potential problem loans are loans which are currently performing and are not included in nonaccrual or restructured loans above, but about which management has serious doubts as to the borrower’s ability to comply with present repayment terms. These loans are likely to be included later in nonaccrual, past due or restructured loans, so they are considered by management in assessing the adequacy of the Bank’s allowance for loan losses. At December 31, 2006, the Bank had identified $1.1 million in nonaccrual loans, increasing from $324,000 at the end of 2005. Loans past due and still accruing totaled $165,000 compared to $1.2 million at the end of 2005.
26
Real estate owned consists of foreclosed, repossessed and idled properties. At December 31, 2006 and 2005, there were $1.1 million and $855,000, respectively, in assets classified as real estate owned.
ANALYSIS OF ALLOWANCE FOR LOAN LOSSES
The allowance for loan losses is established through charges to earnings in the form of a provision for loan losses. Management increases allowance for loan losses by provisions charged to operations and by recoveries of amounts previously charged off. The allowance is reduced by loans charged off. Management evaluates the adequacy of the allowance at least quarterly. In addition, on a quarterly basis our Board of Directors reviews the loan portfolio, conducts an evaluation of credit quality and reviews the computation of the loan loss allowance. In evaluating the adequacy of the allowance, management considers the growth, composition and industry diversification of the portfolio, historical loan loss experience, current delinquency levels, adverse situations that may affect a borrower’s ability to repay, estimated value of any underlying collateral, prevailing economic conditions and other relevant factors deriving from the Bank’s history of operations. In addition to the Bank’s history, management also considers the loss experience and allowance levels of other similar banks and the historical experience encountered by our management and senior lending officers prior to joining us. In addition, regulatory agencies, as an integral part of their examination process, periodically review allowance for loan losses and may require us to make additions for estimated losses based upon judgments different from those of management. No regulatory agency asked for a change in our allowance for loan losses during 2006 or 2005.
Management uses the risk-grading program, as described under “Asset Quality,” to facilitate evaluation of probable inherent loan losses and the adequacy of the allowance for loan losses. In this program, risk grades are initially assigned by loan officers and reviewed by Credit Administration, and tested by the Bank’s internal auditor. The testing program includes an evaluation of a sample of new loans, large loans, loans that are identified as having potential credit weaknesses, loans past due 90 days or more and still accruing, and nonaccrual loans. The Bank strives to maintain the loan portfolio in accordance with conservative loan underwriting policies that result in loans specifically tailored to the needs of the Bank’s market area. Every effort is made to identify and minimize the credit risks associated with such lending strategies. The Bank has no foreign loans and does not engage in significant lease financing or highly leveraged transactions.
Management follows a loan review program designed to evaluate the credit risk in our loan portfolio. Through this loan review process, we maintain an internally classified watch list that helps management assess the overall quality of the loan portfolio and the adequacy of the allowance for loan losses. In establishing the appropriate classification for specific assets, management considers, among other factors, the estimated value of the underlying collateral, the borrower’s ability to repay, the borrower’s payment history and the current delinquent status. As a result of this process, certain loans are categorized as substandard, doubtful or loss and reserves are allocated based on management’s judgment and historical experience.
Loans classified as “substandard” are those loans with clear and defined weaknesses such as unfavorable financial ratios, uncertain repayment sources or poor financial condition that may jeopardize the liquidation of the debt. They are characterized by the distinct possibility that the Bank will sustain some losses if the deficiencies are not corrected. A reserve range of 10%—45% is generally allocated to these loans, depending on credit quality. Loans classified as “doubtful” are those loans that have characteristics similar to substandard loans but with an increased risk that collection or liquidation in full is highly questionable and improbable. A reserve of 50% is generally allocated to loans classified as doubtful. Loans classified as “loss” are considered uncollectible and of such little value that their continuance as bankable assets is not warranted. This classification does not mean that the loan has absolutely no recovery or salvage value but rather it is not practical or desirable to defer writing off this asset even though partial recovery may be achieved in the future. As a practical matter, when loans are identified as loss they are charged off against the allowance for loan losses. In addition to the above classification categories, the Bank also categorizes loans based upon risk grade and loan type, assigning an allowance allocation based upon each category.
Growth in loans outstanding has, throughout the Bank’s history, been the primary reason for increases in the Bank’s allowance for loan losses and the resultant provisions for loan losses necessary to provide for those increases. This growth has been spread
27
among the Bank’s major loan categories, with the concentrations of major loan categories being relatively consistent from 2000 through 2003. Over the three-year period from 2004 through 2006, there has been an increase in the concentration of real estate construction loans and real estate loans while there has been a decline in the percentage of the portfolio made up of commercial and industrial loans. This reflects the real estate lending background and experience of our lenders and the growth opportunities in the Salisbury, Greensboro and High Point markets.
For the four fiscal years 2002 through 2005, the Bank’s loan loss experience has seen net loan charge-offs in each year of range from 0.09% to 0.49% of average loans outstanding. For 2006, net charge-offs were 0.20% of average loans outstanding as compared to 0.38% in the prior year. This decrease in charge-offs in 2006 were due to several 2005 factors that increased the percentage of charge-offs in 2005 which were: A change in the bankruptcy laws in the third quarter of 2005 resulted in numerous borrowers filing prior to the more restrictive laws became effective, and continued softening in the Archdale and Thomasville economies. This resulted in charge-offs for 2005 being 0.38% for the year, slightly above our five-year averages and the 0.20% reported for 2006.
The Bank’s allowance for loan losses at December 31, 2006 of $10.4 million represents 1.34% of total loans outstanding, excluding loans held for sale. The Bank’s allowance for loan losses at December 31, 2005 of $6.1 million represents 1.23% of total loans outstanding, excluding loans held for sale. This increase in the allowance relative to our gross loans has been significantly impacted by the general allowance for loan losses assigned to the SterlingSouth portfolio as part of the merger. Due to the majority of the SterlingSouth portfolio being less than two years old and originated and underwritten in a historically low interest rate environment, the perceived risk associated with this portfolio was much greater than the historical charge-off history would indicate. The lack of seasoning, rising interest rates, internal and third-party due diligence assessments, plus other factors led to a general allowance addition of $2.8 million related to the SterlingSouth loan portfolio. The remainder of the growth in the allowance for loan losses related directly to the organic growth in the loan portfolio, plus management’s internal assessment of risk factors impacting credit quality. Management believes that the allowance for loan losses at December 31, 2006 is adequate to absorb probable losses inherent in the loan portfolio.
The allowance for loan losses represents management’s estimate of an amount adequate to provide for known and inherent losses in the loan portfolio in the normal course of business. The Bank makes specific allowances that are allocated to certain individual loans and pools of loans based on risk characteristics, as discussed below. While management believes that it uses the best information available to establish the allowance for loan losses, future adjustments to the allowance may be necessary and results of operations could be adversely affected if circumstances differ substantially from the assumptions used in making the determinations.
Furthermore, while management believes it has established the allowance for loan losses in conformity with generally accepted accounting principles, there can be no assurance that regulators, in reviewing our portfolio, will not require an adjustment to the allowance for loan losses. No regulatory agency asked for a change in our allowance for loan losses during 2006 or 2005. In addition, because future events affecting borrowers and collateral cannot be predicted with certainty, there can be no assurance that the existing allowance for loan losses is adequate or that increases will not be necessary should the quality of any loans deteriorate as a result of the factors discussed herein. Any material increase in the allowance for loan losses may adversely affect the Bank’s and the Company’s financial condition and results of operations.
The Bank’s primary markets, including the counties of Davidson, Guilford, Randolph, Forsyth, Rowan and Cabarrus have historically been very heavily concentrated in textile, furniture, and heavy manufacturing. With the competition from overseas, these industries have experienced significant plant closings and layoffs in our markets. To this point, the retraction in the manufacturing base has had a minimal impact on our loan quality, except as noted in the Thomasville and Archdale markets. However, if this trend continues, it could negatively impact the Bank’s asset quality.
Table 11 following this discussion shows the allocation of the allowance for loan losses at the dates indicated. The allocation is based on an evaluation of defined loan problems, historical ratios of loan losses and other factors that may affect future loan losses in the categories of loans shown.
28
Table 12 following this discussion sets forth for the periods indicated information regarding changes in the Bank’s allowance for loan losses.
INVESTMENT ACTIVITIES
The Bank’s portfolio of investment securities, all of which are available for sale, consists primarily of securities issued by local governmental municipalities. Securities to be held for indefinite periods of time and not intended to be held to maturity are classified as available for sale and carried at fair value with any unrealized gains or losses, net of related taxes, reflected as an adjustment to stockholders’ equity. Securities held for indefinite periods of time include securities that management intends to use as part of its asset/liability management strategy and that may be sold in response to changes in interest rates and/or significant prepayment risks. It is the Bank’s policy to classify all investment securities as available for sale. Table 13 following this discussion summarizes securities available for sale.
Table 13 following this discussion summarizes the amortized costs, gross unrealized gains and losses and estimated fair values of securities available for sale at December 31, 2006, 2005 and 2004.
Table 14 following this discussion summarizes the amortized costs, fair values and weighted average yields of securities available for sale at December 31, 2006, by contractual maturity groups.
The Bank does not engage in, nor does it presently intend to engage in, securities trading activities and therefore does not maintain a trading account. At December 31, 2006, there were no securities of any issuer (other than governmental agencies) that exceeded 10% of the Company’s shareholders’ equity.
SOURCES OF FUNDS
Deposit Activities. The Bank provides a range of deposit services, including non-interest-bearing checking accounts, interest-bearing checking and savings accounts, money market accounts and certificates of deposit. These accounts generally earn interest at rates established by management based on competitive market factors and management’s desire to increase or decrease certain types or maturities of deposits. During 2006, the Bank’s deposit mix reshifted due to customer preferences and asset-liability pricing decisions by management. Interest bearing demand accounts increased by $60.7 million, or 51.3%, due to $41.9 million being acquired in the SterlingSouth merger and internal growth efforts resulting in $18.9 million in core deposit growth from our branch network. This growth in interest bearing deposits reversed a trend from 2005 where customers began shifting their investment funds from short-term liquidity instruments into CD’s and other short-to-intermediate-term investments as rates continued to climb. The Bank had net growth of approximately $86.0 million in wholesale time deposits and $122.2 million in local time deposits, of which, $82.8 million was acquired with SterlingSouth. This compares to $87.5 million and $69.7 million of net growth in wholesale time deposits in 2005 and 2004, respectively. With rates at historically low levels in 2003 through the first half of 2005, the Bank chose to extend the average term of our time deposit portfolio. In general, investors in the local markets are not interested in time deposits with terms of two years and longer. The wholesale markets provide a very efficient source of long term funding at rates equal to or below those quoted at the local level. In 2005 and 2006, while wholesale sources provided a source of short-term funding which was consistent with the Bank’s asset-liability objectives, our emphasis on growing deposits through our local branch network was much more successful than in 2004 and 2003.
Borrowings. Borrowings provide an additional source of funding for the Bank. The Bank may purchase federal funds through unsecured federal funds guidance lines of credit totaling $40.0 million at December 31, 2006. These lines are intended for short-term borrowings and are subject to restrictions limiting the frequency and terms of advances. These lines of credit are payable on demand and bear interest based upon the daily federal funds rate. The Bank had no outstanding balances on the lines of credit as of December 31, 2006 and 2005.
As an additional source of borrowings the Bank utilizes securities sold under agreements to repurchase, with balances outstanding of $4.7 million and $7.1 million at December 31, 2006 and 2005, respectively. Securities sold under agreements to repurchase generally mature within one day from the transaction date and are collateralized by securities issued by local governmental municipalities.
29
The Bank also uses advances from the FHLB of Atlanta under a line of credit equal to 15% of the Bank’s total assets ($142.8 million at December 31, 2006). Outstanding advances totaled $50.0 million and $35.0 million at December 31, 2006 and 2005, respectively. These advances are secured by a blanket-floating lien on qualifying first mortgage loans and equity lines of credit. A more detailed analysis of the Bank’s FHLB advances is presented in Note H and Note I to the consolidated financial statements.
Table 15 following this discussion sets forth for the periods indicated the average balances outstanding and average interest rates for each major category of deposits.
Table 16 following this discussion sets forth at the dates indicated the amounts and maturities of certificates of deposit with balances of $100,000 or more at December 31, 2006.
Table 17 following this discussion sets forth for the periods indicated information regarding the Company’s borrowed funds.
MARKET RISK
Market risk reflects the risk of economic loss resulting from adverse changes in market price and interest rates. This risk of loss can be reflected in diminished current market values and/or reduced potential net interest income in future periods. Our market risk arises primarily from interest rate risk inherent in our lending and deposit-taking activities. The structure of our loan and deposit portfolios is such that a significant decline in interest rates may adversely impact net market values and net interest income. We do not maintain a trading account nor are we subject to currency exchange risk or commodity price risk. Interest rate risk is monitored as part of the bank’s asset/liability management function. See “ASSET/LIABILITY MANAGEMENT” on page 24 of this Report.
Table 7 following this discussion sets forth the amounts of interest-earning assets and interest-bearing liabilities outstanding at December 31, 2006, which are projected to reprice or mature in each of the future time periods shown.
Table 18 following this discussion presents information about the contractual maturities, average interest rates and estimated fair values of our financial instruments that are considered market risk sensitive at December 31, 2006.
QUARTERLY FINANCIAL INFORMATION
Table 19 following this discussion sets forth, for the periods indicated, certain of our consolidated quarterly financial information. This information is derived from our unaudited financial statements, which include, in the opinion of management, all normal recurring adjustments which management considers necessary for a fair presentation of the results for such periods. This information should be read in conjunction with our consolidated financial statements included elsewhere in this report. The results for any quarter are not necessarily indicative of results for any future period.
RECENT ACCOUNTING PRONOUNCEMENTS
See Note A to the Consolidated Financial Statements for a full description of recent accounting pronouncements including the respective expected dates of adoption and effects on results of operations and financial condition.
SFAS No. 155,“Accounting for Certain Hybrid Financial Instruments — an amendment of SFAS No. 133 and 140” provides entities relief from the requirement to separately determine the fair value of an embedded derivative that would otherwise be bifurcated from the host contract under SFAS 133. This statement allows an irrevocable election on an instrument-by-instrument basis to measure such a hybrid financial instrument at fair value. This statement is effective for all financial instruments acquired or issued after the beginning of the fiscal years beginning after September 15, 2006. The Company has evaluated this statement and does not believe it will have a material effect on the Company’s financial position, results of operations and cash flows.
30
SFAS No. 156,“Accounting for Servicing of Financial Assets — an amendment of SFAS No. 140” requires that all separately recognized servicing assets and liabilities be initially measured at fair value and permits (but does not require) subsequent measurement of servicing assets and liabilities at fair value. This statement is effective for fiscal years beginning after September 15, 2006. The Company has evaluated this statement and does not believe it will have a material effect on the Company’s financial position, results of operations and cash flows.
SFAS No. 158,Employers’ Accounting for Defined Benefit Pension and Other Postretirement Plans. This statement requires recognition on the balance sheet of a plan’s overfunded or underfunded status with an offset to comprehensive income. This statement also requires, with limited exceptions, that the funded status of the plan be determined as of the employer’s fiscal year end. The balance sheet recognition provisions of SFAS 158 are effective for entities with publicly traded equity securities for years ending after December 15, 2006 and for all other entities for years ending after June 15, 2007. The Company does not anticipate that this statement will have an impact on the Company’s financial position, results of operations and cash flows.
FIN 48 – In July 2006, the FASB issued FIN No. 48,Accounting for Uncertainty in Income Taxes-an interpretation of FASB Statement No. 109, which is a change in accounting for income taxes. FIN 48 specifies how tax benefits for uncertain tax positions are to be recognized, measured, and derecognized in financial statements; requires certain disclosures of uncertain tax matters; specifies how reserves for uncertain tax positions should be classified on the balance sheet; and provides transition and interim period guidance, among other provisions. FIN 48 is effective for fiscal years beginning after December 15, 2006 and as a result, is effective for the Company in the first quarter of fiscal 2008. The Company is currently evaluating the impact of FIN 48 on its consolidated financial statements.
SAB 108 – In September 2006, the SEC staff issued Staff Accounting Bulletin (“SAB”) No. 108,Considering the Effects of Prior Year Misstatements when Quantifying Misstatements in Current Year Financial Statements. SAB 108 was issued in order to eliminate the diversity of practice surrounding how public companies quantify financial statements misstatements.
Traditionally, there have been two widely-recognized methods for quantifying the effects of financial statement misstatements the “roll-over” method and the “iron curtain” method. The roll-over method focuses primarily on the impact of a misstatement on the income statement – including the reversing effect of prior year misstatements – but its use can lead to the accumulation of misstatements in the balance sheet. The iron-curtain method, on the other hand, focuses primarily on the effect of correcting the period-end balance sheet with less emphasis on the reversing effects of prior year errors on the income statement. We currently use the roll-over method for quantifying identified financial statement misstatements.
In SAB 108, the SEC staff established an approach that requires quantification of financial statement misstatements based on the effects of the misstatements on each of the Company’s financial statements and the related financial statement disclosures. This model is commonly referred to as a “dual approach” because it requires quantification of errors under both the iron curtain and the roll-over-methods.
SAB 108 permits existing public companies to initially apply its provisions either by (i) restating prior financial statements as if the “dual approach” had always been used or (ii) recording the cumulative effect of initially applying the “dual approach” as adjustments to the carrying values of assets and liabilities as of October 1, 2006 with an offsetting adjustment recorded to the opening balance of retained earnings. Use the “cumulative effect” transition method requires detailed disclosure of the nature and amount of each individual error being corrected through the cumulative adjustment and how and when it arose. The adoption of SAB 108 will not have a material financial impact on the Company’s consolidated financial statements.
The Emerging Issues Task Force (“EITF”) reached a consensus at its September 2006 meeting regarding EITF 06-4,Accounting for Deferred Compensation and Postretirement Benefit Aspects of Endorsement Split-Dollar Life Insurance Arrangements. The scope of EITF 06-4 is limited to the recognition of a liability and related compensation costs for endorsement split-dollar life insurance policies that provide a benefit to an employee that extends to postretirement periods. Therefore, this EITF would not apply to a split-dollar life insurance arrangement that provides a specified benefit to an employee that is limited to the employee’s active service period with an employer. This EITF 06-4 is effective for fiscal years beginning after December 15, 2007, with earlier application permitted. The effects of this EITF have not yet been evaluated.
31
The EITF reached a consensus at its September 2006 meeting regarding EITF 06-5,Accounting for Purchases of Life Insurance Determining the Amount That Could be Realized in Accordance with FASB Technical Bulletin No. 85-5. The scope of EITF 06-5 is limited to the determination of net cash surrender value of a life insurance contract in accordance with Technical Bulletin 85-4. This EITF outlines when contractual limitations of the policy should be considered when determining the net realizable value of the contract. EITF 06-5 is effective for fiscal years beginning after December 15, 2006, with earlier application permitted. The Company has not yet evaluated the effects of this EITF.
From time to time the FASB issues exposure drafts for proposed statements of financial accounting standards. Such exposure drafts are subject to comment from the public, to revisions by the FASB and to final issuance by the FASB as statements of financial accounting standards. Management considers the effect of the proposed statements on the consolidated financial statements of the Company and monitors the status of changes to and proposed effective dates of exposure drafts.
CRITICAL ACCOUNTING POLICY
Allowance for Loan losses. The Company’s most significant critical accounting policy is the determination of our allowance for loan losses. A critical accounting policy is one that is both very important to the portrayal of our financial condition and results, and requires our most difficult, subjective or complex judgments. What makes these judgments difficult, subjective and/or complex is the need to make estimates about the effects of matters that are inherently uncertain. If the mix and amount of future write-offs differ significantly from those assumptions we use in making our determination, the allowance for loan losses and provision for loan losses on our income statement could be materially affected. For further discussion of the allowance for loan losses and a detailed description of the methodology used in determining the adequacy of the allowance, see the sections of this discussion titled “Asset Quality” and “Analysis of Allowance for Loan Losses” and Note D to the consolidated financial statements contained in this Annual Report.
OFF-BALANCE SHEET ARRANGEMENTS
Information about our off-balance sheet risk exposure is presented in Note Q to the accompanying consolidated financial statements. As part of our ongoing business, we do not participate in transactions that generate relationships with unconsolidated entities or financial partnerships, such as entities often referred to as special purpose entities (SPEs), which generally are established for the purpose of facilitating off-balance sheet arrangements or other contractually narrow or limited purposes. As of December 31, 2006, our SPE activity is limited to our capital trust subsidiaries: BNC Bancorp Capital Trust I, BNC Bancorp Capital Trust II , BNC Bancorp Capital Trust III and BNC Capital Trust IV, which in aggregate issued 23,000,000 Trust Preferred Securities.
| ITEM 7A. | QUANTITATIVE AND QUALITATIVE DISCLOSURES ABOUT MARKET RISK |
See “Market Risk” under item 7.
32
BNC Bancorp
Table 2
Average Balances and Net Interest Income
($ in thousands)
| | | | | | | | | | | | | | | | | | | | | | | | | | | | | | |
| | | Year Ended December 31, 2006 | | | Year Ended December 31, 2005 | | | Year Ended December 31, 2004 | |
| | | Average Balance | | | Interest | | Average Rate | | | Average Balance | | | Interest | | Average Rate | | | Average Balance | | | Interest | | Average Rate | |
| | | | | | | | | |
Interest-earning assets: | | | | | | | | | | | | | | | | | | | | | | | | | | | | | | |
Loans, net (1) | | $ | 615,689 | | | $ | 50,002 | | 8.12 | % | | $ | 454,395 | | | $ | 31,338 | | 6.90 | % | | $ | 365,377 | | | $ | 21,531 | | 5.89 | % |
Investment securities, tax effected (2) | | | 58,519 | | | | 3,883 | | 6.64 | % | | | 40,251 | | | | 2,674 | | 6.64 | % | | | 32,896 | | | | 2,129 | | 6.47 | % |
Interest-earning balances | | | 8,348 | | | | 353 | | 4.23 | % | | | 5,497 | | | | 183 | | 3.33 | % | | | 8,090 | | | | 102 | | 1.26 | % |
Other | | | 3,425 | | | | 235 | | 6.86 | % | | | 2,870 | | | | 131 | | 4.56 | % | | | 2,022 | | | | 92 | | 4.55 | % |
| | | | | | | | | | | | | | | | | | | | | | | | | | | | | | |
Total interest-earning assets | | | 685,981 | | | | 54,473 | | 7.94 | % | | | 503,013 | | | | 34,326 | | 6.82 | % | | | 408,385 | | | | 23,854 | | 5.84 | % |
| | | | | | | | | | | | | | | | | | | | | | | | | | | | | | |
Other assets | | | 62,016 | | | | | | | | | | 46,641 | | | | | | | | | | 33,702 | | | | | | | |
| | | | | | | | | | | | | | | | | | | | | | | | | | | | | | |
Total assets | | $ | 747,997 | | | | | | | | | $ | 549,654 | | | | | | | | | $ | 442,087 | | | | | | | |
| | | | | | | | | | | | | | | | | | | | | | | | | | | | | | |
Interest-bearing liabilities: | | | | | | | | | | | | | | | | | | | | | | | | | | | | | | |
Deposits: | | | | | | | | | | | | | | | | | | | | | | | | | | | | | | |
Demand deposits | | | 141,467 | | | | 3,947 | | 2.79 | % | | | 122,317 | | | | 2,346 | | 1.92 | % | | | 145,606 | | | | 2,186 | | 1.50 | % |
Savings deposits | | | 10,739 | | | | 65 | | 0.61 | % | | | 10,949 | | | | 53 | | 0.48 | % | | | 10,619 | | | | 21 | | 0.20 | % |
Time deposits | | | 411,878 | | | | 18,306 | | 4.44 | % | | | 271,118 | | | | 9,085 | | 3.35 | % | | | 165,365 | | | | 3,829 | | 2.32 | % |
Borrowings | | | 79,241 | | | | 4,163 | | 5.25 | % | | | 70,870 | | | | 3,109 | | 4.39 | % | | | 56,973 | | | | 1,993 | | 3.50 | % |
| | | | | | | | | | | | | | | | | | | | | | | | | | | | | | |
Total interest-bearing liabilities | | | 643,325 | | | | 26,481 | | 4.12 | % | | | 475,254 | | | | 14,593 | | 3.07 | % | | | 378,563 | | | | 8,029 | | 2.12 | % |
| | | | | | | | | | | | | | | | | | | | | | | | | | | | | | |
Non-interest-bearing deposits | | | 51,822 | | | | | | | | | | 39,856 | | | | | | | | | | 32,881 | | | | | | | |
Other liabilities | | | 3,900 | | | | | | | | | | 3,483 | | | | | | | | | | 2,632 | | | | | | | |
Shareholders’ equity | | | 48,949 | | | | | | | | | | 31,061 | | | | | | | | | | 28,011 | | | | | | | |
| | | | | | | | | | | | | | | | | | | | | | | | | | | | | | |
Total liabilities and stockholders’ equity | | $ | 747,997 | | | | | | | | | $ | 549,654 | | | | | | | | | $ | 442,087 | | | | | | | |
| | | | | | | | | | | | | | | | | | | | | | | | | | | | | | |
Net interest income and interest rate spread (3) | | | | | | $ | 27,992 | | 3.82 | % | | | | | | $ | 19,733 | | 3.75 | % | | | | | | $ | 15,825 | | 3.72 | % |
| | | | | | | | | | | | | | | | | | | | | | | | | | | | | | |
Net interest margin (4) | | | | | | | | | 4.08 | % | | | | | | | | | 3.92 | % | | | | | | | | | 3.87 | % |
| | | | | | | | | | | | | | | | | | | | | | | | | | | | | | |
Ratio of average interest-earning assets to average interest-bearing liabilities | | | 106.63 | % | | | | | | | | | 105.84 | % | | | | | | | | | 107.88 | % | | | | | | |
| | | | | | | | | | | | | | | | | | | | | | | | | | | | | | |
| (1) | Average loans include non-accruing loans and loans held for sale. |
| (2) | Yields on tax-exempt investments have been adjusted to a fully taxable-equivalent basis (FTE) using the federal income tax rate of 34%. The taxable equivalent adjustment was $1.3 million, $953,000 and $683,000 for the years 2006, 2005, and 2004, respectively. |
| (3) | Interest rate spread equals the earning asset yield minus the interest-bearing liability rate. |
| (4) | Net interest margin is computed by dividing net interest income by total earning assets. |
33
BNC Bancorp
Table 3
Volume and Rate Variance Analysis
(In Thousands)
| | | | | | | | | | | | | | | | | | | | | |
| | | Year Ended December 31, 2006 vs. 2005 | | Year Ended December 31, 2005 vs. 2004 |
| | | Increase (Decrease) Due to | | Increase (Decrease) Due to |
| | | Volume | | | Rate | | | Total | | Volume | | | Rate | | Total |
Interest income: | | | | | | | | | | | | | | | | | | | | | |
Loans, net | | $ | 12,112 | | | $ | 6,552 | | | $ | 18,664 | | $ | 5,692 | | | $ | 4,115 | | $ | 9,807 |
Investment securities, tax effected | | | 1,213 | | | | (4 | ) | | | 1,209 | | | 482 | | | | 63 | | | 545 |
Interest-earning balances | | | 108 | | | | 62 | | | | 170 | | | (60 | ) | | | 141 | | | 81 |
Other | | | 32 | | | | 72 | | | | 104 | | | 39 | | | | — | | | 39 |
| | | | | | | | | | | | | | | | | | | | | |
Total interest income | | | 13,465 | | | | 6,682 | | | | 20,147 | | | 6,153 | | | | 4,319 | | | 10,472 |
| | | | | | | | | | | | | | | | | | | | | |
Interest expense: | | | | | | | | | | | | | | | | | | | | | |
Deposits | | | | | | | | | | | | | | | | | | | | | |
Demand deposits | | | 451 | | | | 1,150 | | | | 1,601 | | | (398 | ) | | | 558 | | | 160 |
Savings deposits | | | (1 | ) | | | 13 | | | | 12 | | | 1 | | | | 31 | | | 32 |
Time deposits | | | 5,486 | | | | 3,735 | | | | 9,221 | | | 2,996 | | | | 2,260 | | | 5,256 |
Borrowings | | | 404 | | | | 650 | | | | 1,054 | | | 548 | | | | 568 | | | 1,116 |
| | | | | | | | | | | | | | | | | | | | | |
Total interest expense | | | 6,340 | | | | 5,548 | | | | 11,888 | | | 3,147 | | | | 3,417 | | | 6,564 |
| | | | | | | | | | | | | | | | | | | | | |
Net interest income increase (decrease) | | $ | 7,125 | | | $ | 1,134 | | | $ | 8,259 | | $ | 3,006 | | | $ | 902 | | $ | 3,908 |
| | | | | | | | | | | | | | | | | | | | | |
34
BNC Bancorp
Table 4
Non-Interest Income
(In thousands)
| | | | | | | | | |
| | | Year Ended December 31, |
| | | 2006 | | 2005 | | 2004 |
Mortgage fees | | $ | 605 | | $ | 512 | | $ | 526 |
Service charges | | | 2,446 | | | 1,796 | | | 1,682 |
Investment brokerage fees | | | 118 | | | 123 | | | 286 |
Increase in cash surrender value of life insurance | | | 562 | | | 477 | | | 422 |
| | | | | | | | | |
Core non-interest income | | | 3,731 | | | 2,908 | | | 2,916 |
Gain on sales of investment securities available for sale, net | | | — | | | 1 | | | 149 |
Other non-interest income | | | 90 | | | 73 | | | 125 |
| | | | | | | | | |
Total non-interest income | | $ | 3,821 | | $ | 2,982 | | $ | 3,190 |
| | | | | | | | | |
35
BNC Bancorp
Table 5
Non-Interest Expense
(In thousands)
| | | | | | | | | |
| | | Year Ended December 31, |
| | | 2006 | | 2005 | | 2004 |
Salaries and employee benefits | | $ | 11,584 | | $ | 7,716 | | $ | 6,857 |
Occupancy expense | | | 1,270 | | | 808 | | | 656 |
Furniture and equipment expense | | | 804 | | | 729 | | | 696 |
Data processing and supply expense | | | 1,073 | | | 671 | | | 687 |
Advertising | | | 668 | | | 443 | | | 358 |
Insurance, professional and other services | | | 1,586 | | | 1,167 | | | 988 |
Telephone and network expense | | | 359 | | | 309 | | | 312 |
Other | | | 1,766 | | | 1,180 | | | 1,309 |
| | | | | | | | | |
Total non-interest expense | | $ | 19,110 | | $ | 13,023 | | $ | 11,863 |
| | | | | | | | | |
36
BNC Bancorp
Table 6
Contractual Obligations and Commitments
(In thousands)
| | | | | | | | | | | | | | | |
| | | Payments Due by Period |
Contractual Obligations | | Total | | On Demand or Within 1 Year | | 2 - 3 Years | | 4 -5 Years | | After 5 Years |
| | | | | |
| | | | | |
Short-term borrowings | | $ | 4,673 | | | 4,673 | | $ | — | | $ | — | | $ | — |
Long-term debt | | | 81,713 | | | 19,673 | | | 6,000 | | | 14,000 | | | 42,040 |
Deposits | | | 720,845 | | | 595,708 | | | 113,039 | | | 6,147 | | | 5,951 |
| | | | | | | | | | | | | | | |
Total contractual cash obligations | | $ | 807,231 | | $ | 620,054 | | $ | 119,039 | | $ | 20,147 | | $ | 47,991 |
| | | | | | | | | | | | | | | |
|
| The following table reflects other commitments of the Company outstanding as of December 31, 2006. |
| |
| | | Amount of Commitment Expiration Per Period |
Commitments | | Total Amounts Committed | | Within 1 Year | | 2 - 3 Years | | 4 -5 Years | | After 5 Years |
| | | | | |
| | | | | |
Lines of credit and loan commitments | | $ | 177,890 | | $ | 32,020 | | $ | 36,574 | | $ | 41,157 | | $ | 68,139 |
Standby letters of credit | | | 6,605 | | | 6,605 | | | — | | | — | | | — |
Sell loans held for sale | | | 2,168 | | | 2,168 | | | — | | | — | | | — |
| | | | | | | | | | | | | | | |
Total commitments | | $ | 186,663 | | $ | 40,793 | | $ | 36,574 | | $ | 41,157 | | $ | 68,139 |
| | | | | | | | | | | | | | | |
37
BNC Bancorp
Table 7
Interest Rate Sensitivity Analysis
($ in thousands)
| | | | | | | | | | | | | | | | | | | | |
| | | At December 31, 2006 | |
| | | 3 Months or Less | | | Over 3 Months to 12 Months | | | Total Within 12 Months | | | Over 12 Months | | | Total | |
| | | | | |
Interest-earning assets: | | | | | | | | | | | | | | | | | | | | |
Loans | �� | $ | 486,676 | | | $ | 46,538 | | | $ | 533,214 | | | $ | 241,450 | | | $ | 774,664 | |
Interest Rate Swap | | | (55,000 | ) | | | — | | | | (55,000 | ) | | | 55,000 | | | | — | |
Loans held for sale | | | 2,168 | | | | — | | | | 2,168 | | | | — | | | | 2,168 | |
Securities available for sale | | | 498 | | | | 1,854 | | | | 2,352 | | | | 72,795 | | | | 75,147 | |
Other earning assets | | | 8,863 | | | | — | | | | 8,863 | | | | — | | | | 15,835 | |
| | | | | | | | | | | | | | | | | | | | |
Total interest-earning assets | | $ | 443,205 | | | $ | 48,392 | | | $ | 491,597 | | | $ | 369,245 | | | $ | 867,814 | |
| | | | | | | | | | | | | | | | | | | | |
Interest-bearing liabilities | | | | | | | | | | | | | | | | | | | | |
Interest-bearing demand deposits | | $ | 145,074 | | | $ | — | | | $ | 145,074 | | | $ | 33,740 | | | $ | 178,814 | |
Time deposits and savings | | | 263,810 | | | | 153,084 | | | | 416,894 | | | | 125,137 | | | | 542,031 | |
Borrowings | | | 4,673 | | | | 15,000 | | | | 19,673 | | | | 66,713 | | | | 86,386 | |
| | | | | | | | | | | | | | | | | | | | |
| | $ | 413,557 | | | $ | 168,084 | | | $ | 581,641 | | | $ | 225,590 | | | $ | 807,231 | |
| | | | | | | | | | | | | | | | | | | | |
Interest sensitivity gap | | $ | 29,648 | | | $ | (119,692 | ) | | $ | (90,044 | ) | | $ | 143,655 | | | $ | 60,583 | |
Cumulative interest sensitivity gap | | | 29,648 | | | | (90,044 | ) | | | (90,044 | ) | | | 53,611 | | | | 53,611 | |
Cumulative interest sensitivity gap as a percent of total interest-earning assets | | | 3.42 | % | | | -10.38 | % | | | -10.38 | % | | | 6.18 | % | | | 6.18 | % |
Cumulative ratio of interest-sensitive assets to interest-sensitive liabilities | | | 107.17 | % | | | 84.52 | % | | | 84.52 | % | | | 107.51 | % | | | 107.51 | % |
38
BNC Bancorp
Table 8
Loan Portfolio Composition
($ in thousands)
| | | | | | | | | | | | | | | | | | | | | | | | | | | | | | |
| | | At December 31, | |
| | | 2006 | | | 2005 | | | 2004 | | | 2003 | | | 2002 | |
| | | Amount | | % of Total Loans | | | Amount | | % of Total Loans | | | Amount | | % of Total Loans | | | Amount | | % of Total Loans | | | Amount | | % of Total Loans | |
| | | | | | | | | | |
| | | | | | | | | | |
Real estate loans | | | 444,724 | | 57.4 | % | | | 316,390 | | 63.4 | % | | | 273,638 | | 65.1 | % | | | 164,927 | | 54.3 | % | | | 141,170 | | 60.5 | % |
Real estate construction loans | | | 203,695 | | 26.3 | % | | | 108,172 | | 21.7 | % | | | 70,346 | | 16.7 | % | | | 34,154 | | 11.2 | % | | | 19,973 | | 8.6 | % |
Commercial and industrial loans | | | 97,071 | | 12.5 | % | | | 63,423 | | 12.7 | % | | | 58,110 | | 13.8 | % | | | 85,759 | | 28.2 | % | | | 50,360 | | 21.6 | % |
Loans to individuals | | | 18,140 | | 2.3 | % | | | 11,262 | | 2.3 | % | | | 18,744 | | 4.5 | % | | | 18,892 | | 6.2 | % | | | 21,677 | | 9.3 | % |
Leases | | | 11,034 | | 1.4 | % | | | — | | 0.0 | % | | | — | | 0.0 | % | | | — | | 0.0 | % | | | — | | 0.0 | % |
| | | | | | | | | | | | | | | | | | | | | | | | | | | | | | |
Total loans | | $ | 774,664 | | 100.0 | % | | $ | 499,247 | | 100.0 | % | | $ | 420,838 | | 100.0 | % | | $ | 303,732 | | 100.0 | % | | $ | 233,180 | | 100.0 | % |
| | | | | | | | | | | | | | | | | | | | | | | | | | | | | | |
These classifications are based upon Call Report Classification codes.
39
BNC Bancorp
Table 9
Loan Maturities
(In thousands)
| | | | | | | | | | | | |
| | | At December 31, 2006 |
| | | Due
within one year | | Due after one year
but within five | | Due after five
years | | Total |
| | | | |
| | | | |
By loan type: | | | | | | | | | | | | |
Real estate loans | | $ | 77,858 | | $ | 298,514 | | $ | 68,352 | | $ | 444,724 |
Real estate construction loans | | | 151,417 | | | 52,278 | | | — | | | 203,695 |
Commercial and industrial loans and leases | | | 41,821 | | | 58,473 | | | 7,811 | | | 108,105 |
Loans to individuals | | | 5,617 | | | 12,162 | | | 361 | | | 18,140 |
| | | | | | | | | | | | |
Total | | $ | 276,713 | | $ | 421,427 | | $ | 76,524 | | $ | 774,664 |
| | | | | | | | | | | | |
By interest rate type: | | | | | | | | | | | | |
Fixed rate loans | | $ | 60,880 | | $ | 201,083 | | $ | 40,367 | | $ | 302,330 |
Variable rate loans | | | 215,833 | | | 220,344 | | | 36,157 | | | 472,334 |
| | | | | | | | | | | | |
| | $ | 276,713 | | $ | 421,427 | | $ | 76,524 | | $ | 774,664 |
| | | | | | | | | | | | |
40
BNC Bancorp
Table 10
Nonperforming Assets
($ in thousands)
| | | | | | | | | | | | | | | | | | | | |
| | | At December 31, | |
| | | 2006 | | | 2005 | | | 2004 | | | 2003 | | | 2002 | |
Nonaccrual loans | | $ | 1,074 | | | $ | 324 | | | $ | 332 | | | $ | 835 | | | $ | 1,700 | |
Accruing loans past due 90 days or more | | | 165 | | | | 1,193 | | | | 795 | | | | 360 | | | | — | |
Restructured loans | | | — | | | | 312 | | | | — | | | | — | | | | — | |
| | | | | | | | | | | | | | | | | | | | |
Total nonperforming loans | | | 1,239 | | | | 1,829 | | | | 1,127 | | | | 1,195 | | | | 1,700 | |
Other real estate owned | | | 1,078 | | | | 855 | | | | 540 | | | | 177 | | | | — | |
| | | | | | | | | | | | | | | | | | | | |
Total nonperforming assets | | $ | 2,317 | | | $ | 2,684 | | | $ | 1,667 | | | $ | 1,372 | | | $ | 1,700 | |
| | | | | | | | | | | | | | | | | | | | |
Allowance for loan losses | | $ | 10,400 | | | $ | 6,140 | | | $ | 5,361 | | | $ | 4,598 | | | $ | 4,306 | |
Nonperforming loans to year end loans | | | 0.16 | % | | | 0.37 | % | | | 0.27 | % | | | 0.39 | % | | | 0.73 | % |
Allowance for loan losses to year end loans | | | 1.34 | % | | | 1.23 | % | | | 1.27 | % | | | 1.51 | % | | | 1.85 | % |
Nonperforming assets to loans and other real estate | | | 0.30 | % | | | 0.54 | % | | | 0.40 | % | | | 0.45 | % | | | 0.73 | % |
Nonperforming assets to total assets | | | 0.24 | % | | | 0.45 | % | | | 0.34 | % | | | 0.37 | % | | | 0.55 | % |
Allowance for loan losses to nonperforming loans | | | 839.39 | % | | | 335.70 | % | | | 475.69 | % | | | 384.77 | % | | | 253.29 | % |
41
BNC Bancorp
Table 11
Allocation of the Allowance for Loan Losses
(In thousands)
| | | | | | | | | | | | | | | | | | | | | | | | | | | | | | |
| | | 2006 | | | 2005 | | | 2004 | | | 2003 | | | 2002 | |
| | | Amount | | % of
Total Loans
(1) | | | Amount | | % of
Total Loans
(1) | | | Amount | | % of
Total Loans
(1) | | | Amount | | % of
Total Loans
(1) | | | Amount | | % of
Total Loans
(1) | |
| | | | | | | | | | |
Real estate loans | | $ | 5,970 | | 57.4 | % | | $ | 3,891 | | 63.4 | % | | $ | 3,486 | | 65.1 | % | | $ | 2,499 | | 54.4 | % | | $ | 2,607 | | 60.5 | % |
Real estate construction loans | | | 2,735 | | 26.3 | % | | | 1,330 | | 21.7 | % | | | 896 | | 16.7 | % | | | 517 | | 11.2 | % | | | 369 | | 8.6 | % |
Commercial and industrial loans | | | 1,300 | | 12.5 | % | | | 780 | | 12.7 | % | | | 740 | | 13.8 | % | | | 1,297 | | 28.2 | % | | | 930 | | 21.6 | % |
Loans to individuals | | | 249 | | 2.4 | % | | | — | | 2.2 | % | | | 239 | | 4.5 | % | | | 285 | | 6.2 | % | | | 400 | | 9.3 | % |
Leases | | | 146 | | 1.4 | % | | | — | | 0.0 | % | | | — | | 0.0 | % | | | — | | 0.0 | % | | | — | | 0.0 | % |
| | | | | | | | | | | | | | | | | | | | | | | | | | | | | | |
| | $ | 10,400 | | 100.0 | % | | $ | 6,140 | | 100.0 | % | | $ | 5,361 | | 100.0 | % | | $ | 4,598 | | 100.0 | % | | $ | 4,306 | | 100.0 | % |
| | | | | | | | | | | | | | | | | | | | | | | | | | | | | | |
| (1) | Represents total of all outstanding loans in each category as a percent of total loans outstanding |
42
BNC Bancorp
Table 12
Loan Loss and Recovery Experience
($ in thousands)
| | | | | | | | | | | | | | | | | | | | |
| | | At or for the Year Ended December 31, | |
| | | 2006 | | | 2005 | | | 2004 | | | 2003 | | | 2002 | |
Loans outstanding at the end of the year | | $ | 774,664 | | | $ | 499,247 | | | $ | 420,838 | | | $ | 303,732 | | | $ | 233,180 | |
| | | | | | | | | | | | | | | | | | | | |
Average loans outstanding during the year | | $ | 615,689 | | | $ | 454,395 | | | $ | 365,377 | | | $ | 257,402 | | | $ | 203,333 | |
| | | | | | | | | | | | | | | | | | | | |
Allowance for loan losses at beginning of year | | $ | 6,140 | | | $ | 5,361 | | | $ | 4,598 | | | $ | 4,306 | | | $ | 2,292 | |
Provision for loan losses | | | 2,655 | | | | 2,515 | | | | 1,190 | | | | 520 | | | | 820 | |
Allowance acquired in merger of SterlingSouth Bank | | | 2,816 | | | | — | | | | — | | | | — | | | | 2,200 | |
| | | | | | | | | | | | | | | | | | | | |
| | | 11,611 | | | | 7,876 | | | | 5,788 | | | | 4,826 | | | | 5,312 | |
| | | | | | | | | | | | | | | | | | | | |
Loans charged off: | | | | | | | | | | | | | | | | | | | | |
Real estate loans | | | (738 | ) | | | (645 | ) | | | (150 | ) | | | (150 | ) | | | (109 | ) |
Real estate construction loans | | | — | | | | (235 | ) | | | (31 | ) | | | (105 | ) | | | (43 | ) |
Commercial and industrial loans | | | (352 | ) | | | (290 | ) | | | (56 | ) | | | (8 | ) | | | (875 | ) |
Loans to individuals | | | (199 | ) | | | (618 | ) | | | (311 | ) | | | (182 | ) | | | (74 | ) |
| | | | | | | | | | | | | | | | | | | | |
Total charge-offs | | | (1,289 | ) | | | (1,788 | ) | | | (548 | ) | | | (445 | ) | | | (1,101 | ) |
| | | | | | | | | | | | | | | | | | | | |
Recoveries of loans previously charged off: | | | | | | | | | | | | | | | | | | | | |
Real estate loans | | | 64 | | | | 3 | | | | 10 | | | | 31 | | | | 29 | |
Real estate construction loans | | | — | | | | — | | | | — | | | | — | | | | — | |
Commercial and industrial loans | | | 8 | | | | 4 | | | | 90 | | | | 177 | | | | 66 | |
Loans to individuals | | | 6 | | | | 45 | | | | 21 | | | | 9 | | | | — | |
| | | | | | | | | | | | | | | | | | | | |
Total recoveries | | | 78 | | | | 52 | | | | 121 | | | | 217 | | | | 95 | |
| | | | | | | | | | | | | | | | | | | | |
Net charge-offs | | | (1,211 | ) | | | (1,736 | ) | | | (427 | ) | | | (228 | ) | | | (1,006 | ) |
| | | | | | | | | | | | | | | | | | | | |
Allowance for loan losses at end of year | | $ | 10,400 | | | $ | 6,140 | | | $ | 5,361 | | | $ | 4,598 | | | $ | 4,306 | |
| | | | | | | | | | | | | | | | | | | | |
Ratios: | | | | | | | | | | | | | | | | | | | | |
Net charge-offs as a percent of average loans | | | 0.20 | % | | | 0.38 | % | | | 0.12 | % | | | 0.09 | % | | | 0.49 | % |
Allowance for loan losses as a percent of loans at end of year | | | 1.34 | % | | | 1.23 | % | | | 1.27 | % | | | 1.51 | % | | | 1.85 | % |
43
BNC Bancorp
Table 13
Securities Portfolio Composition
(In thousands)
| | | | | | | | | | | | |
| | | Amortized cost | | Gross unrealized gains | | Gross unrealized losses | | Estimated fair value |
| | | | |
| | | | |
December 31, 2006 | | | | | | | | | | | | |
Available for sale: | | | | | | | | | | | | |
U. S. Government agency obligations | | $ | 4,407 | | $ | 29 | | $ | — | | $ | 4,436 |
State and municipals | | | 60,989 | | | 1,358 | | | 8 | | | 62,339 |
Mortgage-backed securities | | | 9,585 | | | 174 | | | — | | | 9,759 |
Other | | | 166 | | | — | | | — | | | 166 |
| | | | | | | | | | | | |
| | $ | 75,147 | | $ | 1,561 | | $ | 8 | | $ | 76,700 |
| | | | | | | | | | | | |
December 31, 2005 | | | | | | | | | | | | |
Available for sale: | | | | | | | | | | | | |
U. S. Government agency obligations | | $ | — | | $ | — | | $ | — | | $ | — |
State and municipals | | | 41,373 | | | 941 | | | 122 | | | 42,192 |
Mortgage-backed securities | | | — | | | — | | | — | | | — |
Other | | | 297 | | | — | | | — | | | 297 |
| | | | | | | | | | | | |
| | $ | 41,670 | | $ | 941 | | $ | 122 | | $ | 42,489 |
| | | | | | | | | | | | |
December 31, 2004 | | | | | | | | | | | | |
Available for sale: | | | | | | | | | | | | |
U. S. Government agency obligations | | $ | 2,000 | | $ | 8 | | $ | — | | $ | 2,008 |
State and municipals | | | 32,465 | | | 657 | | | 164 | | | 32,958 |
Mortgage-backed securities | | | 201 | | | 11 | | | — | | | 212 |
Other | | | 250 | | | — | | | — | | | 250 |
| | | | | | | | | | | | |
| | $ | 34,916 | | $ | 676 | | $ | 164 | | $ | 35,428 |
| | | | | | | | | | | | |
44
BNC Bancorp
Table 14
Securities Portfolio Composition
($ in thousands)
| | | | | | | | | |
| | | Amortized Cost | | Fair Value | | Book Yield (1) | |
| | | |
Securities available for sale: | | | | | | | | | |
| | | |
U. S. Government agency obligations | | | | | | | | | |
Due within one year | | $ | 499 | | $ | 499 | | 5.53 | % |
Due after one but within five years | | | 3,908 | | | 3,937 | | 5.49 | % |
Due after five but within ten years | | | — | | | — | | 0.00 | % |
Due after ten years | | | — | | | — | | 0.00 | % |
| | | | | | | | | |
| | | 4,407 | | | 4,436 | | 5.49 | % |
| | | | | | | | | |
Mortgage-backed securities | | | | | | | | | |
Due within one year | | | 1,674 | | | 1,702 | | 5.77 | % |
Due after one but within five years | | | 4,885 | | | 4,967 | | 5.76 | % |
Due after five but within ten years | | | 2,573 | | | 2,620 | | 5.77 | % |
Due after ten years | | | 453 | | | 462 | | 5.79 | % |
| | | | | | | | | |
| | | 9,585 | | | 9,751 | | 5.77 | % |
| | | | | | | | | |
State and municipals | | | | | | | | | |
Due within one year | | | 179 | | | 180 | | 4.00 | % |
Due after one but within five years | | | 11,202 | | | 11,342 | | 4.29 | % |
Due after five but within ten years | | | 28,055 | | | 28,647 | | 4.36 | % |
Due after ten years | | | 21,553 | | | 22,178 | | 4.57 | % |
| | | | | | | | | |
| | | 60,989 | | | 62,347 | | 4.42 | % |
| | | | | | | | | |
Other | | | | | | | | | |
Due within one year | | | — | | | — | | 0.00 | % |
Due after one but within five years | | | — | | | — | | 0.00 | % |
Due after five but within ten years | | | — | | | — | | 0.00 | % |
Due after ten years | | | 166 | | | 166 | | 2.40 | % |
| | | | | | | | | |
| | | 166 | | | 166 | | 2.40 | % |
| | | | | | | | | |
Total securities available for sale | | | | | | | | | |
Due within one year | | | 2,352 | | | 2,381 | | 5.59 | % |
Due after one but within five years | | | 19,995 | | | 20,246 | | 4.88 | % |
Due after five but within ten years | | | 30,628 | | | 31,267 | | 4.48 | % |
Due after ten years | | | 22,172 | | | 22,806 | | 4.58 | % |
| | | | | | | | | |
| | $ | 75,147 | | $ | 76,700 | | 4.65 | % |
| | | | | | | | | |
45
BNC Bancorp
Table 15
Average Deposits
($ in thousands)
| | | | | | | | | | | | | | | | | | |
| | | For the Year Ended December 31, | |
| | | 2006 | | | 2005 | | | 2004 | |
| | | Average
Amount | | Average
Rate | | | Average
Amount | | Average
Rate | | | Average
Amount | | Average
Rate | |
Demand deposits | | $ | 141,467 | | 2.79 | % | | $ | 122,317 | | 1.92 | % | | $ | 145,606 | | 1.50 | % |
Savings deposits | | | 10,739 | | 0.61 | % | | | 10,949 | | 0.48 | % | | | 10,619 | | 0.20 | % |
Time deposits | | | 411,878 | | 4.44 | % | | | 271,118 | | 3.35 | % | | | 165,365 | | 2.32 | % |
| | | | | | | | | | | | | | | | | | |
Total interest-bearing deposits | | | 564,084 | | 3.96 | % | | | 404,384 | | 2.84 | % | | | 321,590 | | 1.88 | % |
| | | | | | |
Non-interest-bearing deposits | | | 51,822 | | — | | | | 39,856 | | — | | | | 32,881 | | — | |
| | | | | | | | | | | | | | | | | | |
Total deposits | | $ | 615,906 | | 3.62 | % | | $ | 444,240 | | 2.59 | % | | $ | 354,471 | | 1.70 | % |
| | | | | | | | | | | | | | | | | | |
46
BNC Bancorp
Table 16
Maturities of Time Deposits of $100,000 or More
(In thousands)
| | | | | | | | | | | | | | | |
| | | At December 31, 2006 |
| | | 3 Months
or Less | | Over 3 Months
to 6 Months | | Over 6 Months
to 12 Months | | Over 12
Months | | Total |
Time Deposits of $100,000 or more | | $ | 166,058 | | $ | 56,867 | | $ | 53,893 | | $ | 92,672 | | $ | 369,490 |
| | | | | | | | | | | | | | | |
47
BNC Bancorp
Table 17
Borrowings
($ in thousands)
The following table sets forth certain information regarding the Company’s borrowed funds for the dates indicated.
| | | | | | | | | | | | |
| | | For the Year Ended December 31, | |
| | | 2006 | | | 2005 | | | 2004 | |
Short-term borrowings: | | | | | | | | | | | | |
Repurchase agreements and FHLB lines of credit | | | | | | | | | | | | |
Balance outstanding at end of period | | $ | 4,673 | | | $ | 7,061 | | | $ | 28,275 | |
Maximum amount outstanding at any month end during the period | | | 36,115 | | | | 28,275 | | | | 28,275 | |
Average balance outstanding | | | 7,130 | | | | 11,374 | | | | 16,258 | |
Weighted-average interest rate during the period | | | 4.61 | % | | | 2.41 | % | | | 1.11 | % |
Weighted-average interest rate at end of period | | | 3.41 | % | | | 2.50 | % | | | 2.32 | % |
Long-term debt: | | | | | | | | | | | | |
Federal Home Loan Bank advances and subordinated debentures | | | | | | | | | | | | |
Balance outstanding at end of period | | $ | 81,713 | | | $ | 59,496 | | | $ | 45,496 | |
Maximum amount outstanding at any month end during the period | | | 81,713 | | | | 59,496 | | | | 45,496 | |
Average balance outstanding | | | 72,111 | | | | 59,496 | | | | 40,715 | |
Weighted-average interest rate during the period | | | 5.32 | % | | | 4.76 | % | | | 4.44 | % |
Weighted-average interest rate at end of period | | | 5.65 | % | | | 5.02 | % | | | 4.55 | % |
Total borrowings: | | | | | | | | | | | | |
Balance outstanding at end of period | | $ | 86,386 | | | $ | 66,557 | | | $ | 73,771 | |
Maximum amount outstanding at any month end during the period | | | 117,828 | | | | 87,771 | | | | 73,771 | |
Average balance outstanding | | | 79,241 | | | | 70,870 | | | | 56,973 | |
Weighted-average interest rate during the period | | | 5.25 | % | | | 4.39 | % | | | 3.50 | % |
Weighted-average interest rate at end of period | | | 5.53 | % | | | 4.75 | % | | | 3.70 | % |
48
BNC Bancorp
Table 18
Market Risk Sensitive Investments
($ in thousands)
| | | | | | | | | | | | | | | | | | | | | | | | | | | |
| | | Expected Maturities of Market Sensitive Instruments Held at December 31, 2006 Occuring in the Indicated Year |
| | | 2007 | | 2008 | | 2009 | | 2010 | | 2011 | | Beyond | | Total | | Average
Interest Rate | | | Fair Value |
Interest-earning assets: | | | | | | | | | | | | | | | | | | | | | | | | | | | |
Due from banks | | $ | 12,009 | | $ | — | | $ | — | | $ | — | | $ | — | | $ | — | | $ | 12,009 | | 5.25 | % | | $ | 12,009 |
Other earning assets | | | 2,168 | | | — | | | — | | | — | | | — | | | 3,626 | | | 5,794 | | 5.25 | % | | | 5,794 |
Debt securities (1) (2) | | | 2,352 | | | 2,363 | | | 3,113 | | | 2,973 | | | 11,546 | | | 52,800 | | | 75,147 | | 6.49 | % | | | 76,700 |
Loans—fixed rate (3) | | | 60,880 | | | 74,710 | | | 51,247 | | | 43,517 | | | 31,609 | | | 40,367 | | | 302,330 | | 7.27 | % | | | 300,911 |
Loans—variable rate (3) | | | 215,833 | | | 74,063 | | | 61,547 | | | 71,547 | | | 13,187 | | | 36,157 | | | 472,334 | | 8.33 | % | | | 472,032 |
| | | | | | | | | | | | | | | | | | | | | | | | | | | |
| | $ | 293,242 | | $ | 151,136 | | $ | 115,907 | | $ | 118,037 | | $ | 56,342 | | $ | 132,950 | | $ | 867,614 | | 7.74 | % | | $ | 867,446 |
| | | | | | | | | | | | | | | | | | | | | | | | | | | |
Interest-bearing liabilities: | | | | | | | | | | | | | | | | | | | | | | | | | | | |
NOW and money market deposits | | $ | — | | $ | — | | $ | — | | $ | — | | $ | — | | $ | 178,814 | | $ | 178,814 | | 2.79 | % | | $ | 178,814 |
Time deposits and savings | | | 416,894 | | | 71,774 | | | 41,265 | | | 6,147 | | | — | | | 5,951 | | | 542,031 | | 4.75 | % | | | 543,087 |
Subordinated debentures | | | — | | | — | | | — | | | — | | | — | | | 31,713 | | | 31,713 | | 7.67 | % | | | 31,189 |
Borrowings | | | 19,673 | | | 6,000 | | | — | | | 9,000 | | | 5,000 | | | 15,000 | | | 54,673 | | 4.16 | % | | | 55,351 |
| | | | | | | | | | | | | | | | | | | | | | | | | | | |
| | $ | 436,567 | | $ | 77,774 | | $ | 41,265 | | $ | 15,147 | | $ | 5,000 | | $ | 231,478 | | $ | 807,231 | | 4.39 | % | | $ | 808,441 |
| | | | | | | | | | | | | | | | | | | | | | | | | | | |
49
BNC Bancorp
Table 19
Quarterly Financial Data
($ in thousands, except per share data)
| | | | | | | | | | | | | | | | | | | | | | | | |
| | | Year Ended December 31, 2006 | | Year Ended December 31, 2005 |
| | | Fourth
Quarter | | Third
Quarter | | Second
Quarter | | First
Quarter | | Fourth
Quarter | | Third
Quarter | | Second
Quarter | | First
Quarter |
Operating Data: | | | | | | | | | | | | | | | | | | | | | | | | |
Total interest income | | $ | 16,616 | | $ | 15,026 | | $ | 11,301 | | $ | 10,268 | | $ | 9,651 | | $ | 8,867 | | $ | 7,854 | | $ | 7,001 |
Total interest expense | | | 8,509 | | | 7,548 | | | 5,549 | | | 4,875 | | | 4,343 | | | 4,033 | | | 3,452 | | | 2,765 |
| | | | | | | | | | | | | | | | | | | | | | | | |
Net interest income | | | 8,107 | | | 7,478 | | | 5,752 | | | 5,393 | | | 5,308 | | | 4,834 | | | 4,402 | | | 4,236 |
Provision for loan losses | | | 780 | | | 645 | | | 710 | | | 520 | | | 900 | | | 610 | | | 525 | | | 480 |
| | | | | | | | | | | | | | | | | | | | | | | | |
Net interest income after provision | | | 7,327 | | | 6,833 | | | 5,042 | | | 4,873 | | | 4,408 | | | 4,224 | | | 3,877 | | | 3,756 |
Noninterest income | | | 1,152 | | | 1,051 | | | 822 | | | 796 | | | 904 | | | 759 | | | 702 | | | 617 |
Noninterest expense | | | 5,540 | | | 5,522 | | | 3,977 | | | 4,071 | | | 3,622 | | | 3,300 | | | 3,061 | | | 3,040 |
| | | | | | | | | | | | | | | | | | | | | | | | |
Income before income taxes | | | 2,939 | | | 2,362 | | | 1,887 | | | 1,598 | | | 1,690 | | | 1,683 | | | 1,518 | | | 1,333 |
Provision for income taxes | | | 898 | | | 710 | | | 540 | | | 468 | | | 470 | | | 463 | | | 411 | | | 375 |
| | | | | | | | | | | | | | | | | | | | | | | | |
Net income (loss) | | $ | 2,041 | | $ | 1,652 | | $ | 1,347 | | $ | 1,130 | | $ | 1,220 | | $ | 1,220 | | $ | 1,107 | | $ | 958 |
| | | | | | | | | | | | | | | | | | | | | | | | |
Per Share Data: (1) | | | | | | | | | | | | | | | | | | | | | | | | |
Earnings per share—basic | | $ | 0.30 | | $ | 0.26 | | $ | 0.28 | | $ | 0.24 | | $ | 0.25 | | $ | 0.25 | | $ | 0.23 | | $ | 0.20 |
Earnings per share—diluted | | | 0.29 | | | 0.25 | | | 0.26 | | | 0.22 | | | 0.24 | | | 0.24 | | | 0.22 | | | 0.19 |
| | | | | | | | |
Cash dividends paid | | | — | | | — | | | — | | | 0.15 | | | — | | | — | | | — | | | 0.12 |
| | | | | | | | |
Common stock price: | | | | | | | | | | | | | | | | | | | | | | | | |
High | | | 18.58 | | | 17.96 | | | 18.00 | | | 17.83 | | | 17.65 | | | 14.75 | | | 14.73 | | | 14.69 |
Low | | | 15.43 | | | 16.36 | | | 16.32 | | | 15.69 | | | 14.15 | | | 13.09 | | | 12.42 | | | 13.38 |
| (1) | All per share data has been restated to reflect the dilutive effect of a 10% stock dividend distributed on January 22, 2007. |
50
| ITEM 8. | FINANCIAL STATEMENTS |
BNC Bancorp
CONSOLIDATED FINANCIAL STATEMENTS
Years Ended December 31, 2006, 2005 and 2004
51
BNC BANCORP AND SUBSIDIARY
INDEX TO THE CONSOLIDATED FINANCIAL STATEMENTS
F-1

REPORT OF INDEPENDENT REGISTERED PUBLIC ACCOUNTING FIRM
The Board of Directors and Shareholders
BNC Bancorp
Thomasville, North Carolina
We have audited the accompanying consolidated balance sheets of BNC Bancorp and subsidiary as of December 31, 2006 and 2005, and the related consolidated statements of income, comprehensive income, shareholders’ equity and cash flows for each of the years then ended. These consolidated financial statements are the responsibility of the BNC Bancorp’s management. Our responsibility is to express an opinion on these consolidated financial statements based on our audits.
We conducted our audits in accordance with the standards of the Public Company Accounting Oversight Board (United States). Those standards require that we plan and perform the audit to obtain reasonable assurance about whether the financial statements are free of material misstatement. An audit includes examining, on a test basis, evidence supporting the amounts and disclosures in the financial statements. An audit also includes assessing the accounting principles used and significant estimates made by management, as well as evaluating the overall financial statement presentation. We believe that our audits provide a reasonable basis for our opinion.
In our opinion, the consolidated financial statements referred to above present fairly, in all material respects, the financial position of BNC Bancorp and subsidiary as of December 31, 2006 and 2005, and the results of their operations and their cash flows for each of the years then ended in conformity with accounting principles generally accepted in the United States of America.
/s/ Cherry, Bekaert & Holland, L.L.P.
Raleigh, North Carolina
March 30, 2007
F-2

REPORT OF INDEPENDENT REGISTERED PUBLIC ACCOUNTING FIRM
To the Board of Directors and Shareholders
BNC Bancorp
Thomasville, North Carolina
We have audited the accompanying consolidated statements of income, comprehensive income, shareholders’ equity and cash flows of BNC Bancorp and Subsidiary for the year ended December 31, 2004. These consolidated financial statements are the responsibility of the Company’s management. Our responsibility is to express an opinion on these consolidated financial statements based on our audit.
We conducted our audit in accordance with the standards of the Public Company Accounting Oversight Board (United States). Those standards require that we plan and perform the audit to obtain reasonable assurance about whether the financial statements are free of material misstatement. An audit includes examining, on a test basis, evidence supporting the amounts and disclosures in the financial statements. An audit also includes assessing the accounting principles used and significant estimates made by management, as well as evaluating the overall financial statement presentation. We believe that our audits provide a reasonable basis for our opinion.
In our opinion, the consolidated financial statements referred to above present fairly, in all material respects, the results of operations and the cash flows of BNC Bancorp and Subsidiary for the year ended December 31, 2004 in conformity with accounting principles generally accepted in the United States of America.

Sanford, North Carolina
February 23, 2005
F-3
CONSOLIDATED BALANCE SHEETS
December 31, 2006 and 2005
| | | | | | | | |
| | | 2006 | | | 2005 | |
| | (Amounts in thousands,
except share data) | |
Assets | | | | | | | | |
Cash and due from banks | | $ | 12,688 | | | $ | 8,961 | |
Interest-earning deposits in other banks | | | 12,009 | | | | 6,294 | |
Securities available for sale | | | 76,700 | | | | 42,489 | |
Federal Home Loan Bank stock, at cost | | | 3,826 | | | | 2,569 | |
Loans held for sale | | | 2,168 | | | | 1,701 | |
Loans | | | 774,664 | | | | 499,247 | |
Less allowance for loan losses | | | (10,400 | ) | | | (6,140 | ) |
| | | | | | | | |
Net loans | | | 764,264 | | | | 493,107 | |
Accrued interest receivable | | | 4,813 | | | | 2,784 | |
Premises and equipment, net | | | 19,622 | | | | 14,720 | |
Investment in life insurance | | | 19,084 | | | | 12,319 | |
Goodwill | | | 26,129 | | | | 3,423 | |
Other assets | | | 10,428 | | | | 6,183 | |
| | | | | | | | |
Total assets | | $ | 951,731 | | | $ | 594,550 | |
| | | | | | | | |
Liabilities and Shareholders’ Equity | | | | | | | | |
Deposits: | | | | | | | | |
Non-interest bearing demand | | $ | 65,932 | | | $ | 39,573 | |
Interest-bearing demand | | | 178,814 | | | | 118,118 | |
Savings | | | 10,810 | | | | 10,185 | |
Time deposits of $100,000 and greater | | | 369,490 | | | | 219,581 | |
Other time | | | 161,731 | | | | 103,435 | |
| | | | | | | | |
Total deposits | | | 786,777 | | | | 490,892 | |
| | |
Short-term borrowings | | | 4,673 | | | | 7,061 | |
Long-term debt | | | 81,713 | | | | 59,496 | |
Accrued expenses and other liabilities | | | 6,045 | | | | 3,987 | |
| | | | | | | | |
Total liabilities | | | 879,208 | | | | 561,436 | |
| | | | | | | | |
Shareholders’ Equity: | | | | | | | | |
Common stock, no par value; authorized 80,000,000 shares; 6,099,097 and 4,367,953 issued and outstanding at December 31, 2006 and 2005, respectively | | | 53,086 | | | | 19,448 | |
Retained earnings | | | 18,595 | | | | 13,155 | |
Stock in directors rabbi trust | | | (711 | ) | | | (503 | ) |
Directors deferred fees obligation | | | 711 | | | | 503 | |
Accumulated other comprehensive income | | | 842 | | | | 511 | |
| | | | | | | | |
Total shareholders’ equity | | | 72,523 | | | | 33,114 | |
| | | | | | | | |
Total liabilities and shareholders’ equity | | $ | 951,731 | | | $ | 594,550 | |
| | | | | | | | |
F-4
CONSOLIDATED STATEMENTS OF INCOME
Years Ended December 31, 2006, 2005 and 2004
| | | | | | | | | |
| | | 2006 | | 2005 | | 2004 |
| | (Amounts in thousands, except per share data) |
Interest Income | | | | | | | | | |
Interest and fees on loans | | $ | 50,002 | | $ | 31,338 | | $ | 21,531 |
Debt securities: | | | | | | | | | |
Taxable | | | 378 | | | 27 | | | 117 |
Tax-exempt | | | 2,243 | | | 1,694 | | | 1,329 |
Interest on interest-earning balances | | | 353 | | | 183 | | | 102 |
Other | | | 235 | | | 131 | | | 92 |
| | | | | | | | | |
Total interest income | | | 53,211 | | | 33,373 | | | 23,171 |
| | | | | | | | | |
Interest Expense | | | | | | | | | |
Interest on demand deposits | | | 3,947 | | | 2,346 | | | 2,186 |
Interest on savings deposits | | | 65 | | | 53 | | | 21 |
Interest on time deposits of $100,000 and greater | | | 12,192 | | | 6,481 | | | 2,510 |
Interest on other time deposits | | | 6,114 | | | 2,604 | | | 1,319 |
Interest on short-term borrowings | | | 150 | | | 432 | | | 248 |
Interest on long-term debt | | | 4,013 | | | 2,677 | | | 1,745 |
| | | | | | | | | |
Total interest expense | | | 26,481 | | | 14,593 | | | 8,029 |
| | | | | | | | | |
Net Interest Income | | | 26,730 | | | 18,780 | | | 15,142 |
Provision for loan losses | | | 2,655 | | | 2,515 | | | 1,190 |
| | | | | | | | | |
Net interest income after provision for loan losses | | | 24,075 | | | 16,265 | | | 13,952 |
| | | | | | | | | |
Non-Interest Income | | | | | | | | | |
Mortgage fees | | | 605 | | | 512 | | | 526 |
Service charges | | | 2,446 | | | 1,796 | | | 1,682 |
Investment brokerage fees | | | 118 | | | 123 | | | 286 |
Increase in cash surrender value of life insurance | | | 562 | | | 477 | | | 422 |
Gain on sale of investment securities available for sale | | | — | | | 1 | | | 149 |
Other | | | 90 | | | 73 | | | 125 |
| | | | | | | | | |
Total non-interest income | | | 3,821 | | | 2,982 | | | 3,190 |
| | | | | | | | | |
Non-Interest Expense | | | | | | | | | |
Salaries and employee benefits | | | 11,584 | | | 7,716 | | | 6,857 |
Occupancy | | | 1,270 | | | 808 | | | 656 |
Furniture and equipment | | | 804 | | | 729 | | | 696 |
Data processing and supply | | | 1,073 | | | 671 | | | 687 |
Advertising | | | 668 | | | 443 | | | 358 |
Insurance, professional and other services | | | 1,586 | | | 1,167 | | | 988 |
Telephone and network | | | 359 | | | 309 | | | 312 |
Other | | | 1,766 | | | 1,180 | | | 1,309 |
| | | | | | | | | |
Total non-interest expense | | | 19,110 | | | 13,023 | | | 11,863 |
| | | | | | | | | |
Income before income tax expense | | | 8,786 | | | 6,224 | | | 5,279 |
| | | |
Income tax expense | | | 2,616 | | | 1,719 | | | 1,474 |
| | | | | | | | | |
Net income | | $ | 6,170 | | $ | 4,505 | | $ | 3,805 |
| | | | | | | | | |
Basic net income per share | | $ | 1.09 | | $ | .94 | | $ | .79 |
| | | | | | | | | |
Diluted net income per share | | $ | 1.04 | | $ | .88 | | $ | .75 |
| | | | | | | | | |
| | | | |
| See accompanying notes. | | F-5 | | |
CONSOLIDATED STATEMENTSOF COMPREHENSIVE INCOME
Years Ended December 31, 2006, 2005 and 2004
| | | | | | | | | | | | |
| | | 2006 | | | 2005 | | | 2004 | |
| | (Amounts in thousands) | |
Net income | | $ | 6,170 | | | $ | 4,505 | | | $ | 3,805 | |
| | | | | | | | | | | | |
Other comprehensive income: | | | | | | | | | | | | |
Securities available for sale: | | | | | | | | | | | | |
Unrealized holding gains on available for sale securities | | | 734 | | | | 308 | | | | 148 | |
Tax effect | | | (268 | ) | | | (112 | ) | | | (57 | ) |
Reclassification of gains recognized in net income | | | — | | | | (1 | ) | | | (149 | ) |
Tax effect | | | — | | | | — | | | | 57 | |
| | | | | | | | | | | | |
Net of tax amount | | | 466 | | | | 195 | | | | (1 | ) |
| | | | | | | | | | | | |
Cash flow hedging activities: | | | | | | | | | | | | |
Unrealized holding losses on cash flow hedging activities | | | (220 | ) | | | (15 | ) | | | — | |
Tax effect | | | 85 | | | | 6 | | | | — | |
| | | | | | | | | | | | |
Net of tax amount | | | (135 | ) | | | (9 | ) | | | — | |
| | | | | | | | | | | | |
Total other comprehensive income (loss) | | | 331 | | | | 186 | | | | (1 | ) |
| | | | | | | | | | | | |
Comprehensive income | | $ | 6,501 | | | $ | 4,691 | | | $ | 3,804 | |
| | | | | | | | | | | | |
| | | | |
| See accompanying notes. | | F-6 | | |
CONSOLIDATED STATEMENTS OF SHAREHOLDERS’ EQUITY
Years Ended December 31, 2006, 2005 and 2004
| | | | | | | | | | | | | | | | | | | | | | | | | | |
| | | Common stock | | | Retained | | | Stock in
directors | | | Directors
deferred
fees | | Accumulated
other com-
prehensive | | | Total | |
| | Shares | | | Amount | | | earnings | | | rabbi trust | | | obligation | | income | | |
| | (Amounts in thousands, except share and per share data) | |
Balance, December 31, 2003 | | 3,492,035 | | | $ | 20,725 | | | $ | 5,442 | | | $ | (303 | ) | | $ | 303 | | $ | 326 | | | $ | 26,493 | |
Net income | | — | | | | — | | | | 3,805 | | | | — | | | | — | | | — | | | | 3,805 | |
Other comprehensive income, net of tax | | — | | | | — | | | | — | | | | — | | | | — | | | (1 | ) | | | (1 | ) |
Directors deferred fees | | — | | | | — | | | | — | | | | (124 | ) | | | 124 | | | — | | | | — | |
Common stock issued pursuant to: | | | | | | | | | | | | | | | | | | | | | | | | | | |
Stock options exercised | | 40,710 | | | | 189 | | | | — | | | | — | | | | — | | | — | | | | 189 | |
Current income tax benefit. | | — | | | | 22 | | | | — | | | | — | | | | — | | | — | | | | 22 | |
Shares traded to exercise options | | (8,840 | ) | | | (151 | ) | | | — | | | | — | | | | — | | | — | | | | (151 | ) |
Purchases and retirement of common stock | | (43,357 | ) | | | (752 | ) | | | — | | | | — | | | | — | | | — | | | | (752 | ) |
Cash dividends $.12 per share | | — | | | | — | | | | (568 | ) | | | — | | | | — | | | — | | | | (568 | ) |
| | | | | | | | | | | | | | | | | | | | | | | | | | |
Balance, December 31, 2004 | | 3,480,548 | | | | 20,033 | | | | 8,679 | | | | (427 | ) | | | 427 | | | 325 | | | | 29,037 | |
Net income | | — | | | | — | | | | 4,505 | | | | — | | | | — | | | — | | | | 4,505 | |
Other comprehensive income, net of tax | | — | | | | — | | | | — | | | | — | | | | — | | | 186 | | | | 186 | |
Directors deferred fees | | — | | | | — | | | | — | | | | (76 | ) | | | 76 | | | — | | | | — | |
Common stock issued pursuant to: | | | | | | | | | | | | | | | | | | | | | | | | | | |
Five-for-four stock split effected as a 25% stock dividend | | 873,497 | | | | — | | | | (29 | ) | | | — | | | | — | | | — | | | | (29 | ) |
Stock options exercised | | 58,919 | | | | 283 | | | | — | | | | — | | | | — | | | — | | | | 283 | |
Current income tax benefit. | | — | | | | 54 | | | | — | | | | — | | | | — | | | — | | | | 54 | |
Shares traded to exercise options | | (11,417 | ) | | | (225 | ) | | | — | | | | — | | | | — | | | — | | | | (225 | ) |
Purchases and retirement of common stock | | (33,594 | ) | | | (697 | ) | | | — | | | | — | | | | — | | | — | | | | (697 | ) |
| | | | | | | | | | | | | | | | | | | | | | | | | | |
Balance, December 31, 2005 | | 4,367,953 | | | | 19,448 | | | | 13,155 | | | | (503 | ) | | | 503 | | | 511 | | | | 33,114 | |
Net income | | — | | | | — | | | | 6,170 | | | | — | | | | — | | | — | | | | 6,170 | |
Other comprehensive income, net of tax | | — | | | | — | | | | — | | | | — | | | | — | | | 331 | | | | 331 | |
Directors deferred fees | | — | | | | — | | | | — | | | | (208 | ) | | | 208 | | | — | | | | — | |
Common stock issued pursuant to: | | | | | | | | | | | | | | | | | | | | | | | | | | |
Business combination | | 1,686,370 | | | | 33,453 | | | | — | | | | — | | | | — | | | — | | | | 33,453 | |
Stock options exercised | | 51,551 | | | | 222 | | | | — | | | | — | | | | — | | | — | | | | 222 | |
Current income tax benefit. | | — | | | | 83 | | | | — | | | | — | | | | — | | | — | | | | 83 | |
Shares traded to exercise options | | (5,987 | ) | | | (117 | ) | | | — | | | | — | | | | — | | | — | | | | (117 | ) |
Stock-based compensation | | 11,000 | | | | 222 | | | | — | | | | — | | | | — | | | — | | | | 222 | |
Purchases and retirement of common stock | | (11,790 | ) | | | (225 | ) | | | — | | | | — | | | | — | | | — | | | | (225 | ) |
Cash dividends of $ .16 per share | | — | | | | — | | | | (730 | ) | | | — | | | | — | | | — | | | | (730 | ) |
| | | | | | | | | | | | | | | | | | | | | | | | | | |
Balance, December 31, 2006 | | 6,099,097 | | | $ | 53,086 | | | $ | 18,595 | | | $ | (711 | ) | | $ | 711 | | $ | 842 | | | $ | 72,523 | |
| | | | | | | | | | | | | | | | | | | | | | | | | | |
| | | | |
| See accompanying notes. | | F-7 | | |
CONSOLIDATED STATEMENTS OF CASH FLOWS
Years Ended December 31, 2006, 2005 and 2004
| | | | | | | | | | | | |
| | | 2006 | | | 2005 | | | 2004 | |
| | (Amounts in thousands) | |
Operating Activities | | | | | | | | | | | | |
Net income | | $ | 6,170 | | | $ | 4,505 | | | $ | 3,805 | |
Adjustments to reconcile net income to net cash provided by operating activities: | | | | | | | | | | | | |
Depreciation and amortization | | | 1,097 | | | | 843 | | | | 653 | |
Amortization (accretion) of premiums and discounts, net | | | (3 | ) | | | (323 | ) | | | 206 | |
Amortization of core deposit intangible | | | 115 | | | | 20 | | | | 25 | |
Stock-based compensation | | | 222 | | | | — | | | | — | |
Provision for loan losses | | | 2,655 | | | | 2,515 | | | | 1,190 | |
Provision for deferred income taxes (benefit) | | | (1,767 | ) | | | (376 | ) | | | (228 | ) |
Increase in cash surrender value life insurance | | | (562 | ) | | | (477 | ) | | | (422 | ) |
Gain on sale of securities | | | — | | | | (1 | ) | | | (149 | ) |
Gain (loss) on disposal of premises and equipment | | | — | | | | 21 | | | | (1 | ) |
Gain (loss) on sales of foreclosed assets | | | (46 | ) | | | (12 | ) | | | 67 | |
Gain on sale of loans | | | (605 | ) | | | (512 | ) | | | (526 | ) |
Origination of loans held for sale | | | (30,250 | ) | | | (30,026 | ) | | | (28,412 | ) |
Proceeds from sales of loans held for sale | | | 30,388 | | | | 30,731 | | | | 28,036 | |
Changes in assets and liabilities: | | | | | | | | | | | | |
Increase in accrued interest receivable | | | (1,572 | ) | | | (916 | ) | | | (364 | ) |
Increase in other assets | | | 4,221 | | | | (273 | ) | | | (1,031 | ) |
Increase (decrease) in accrued expenses and other liabilities | | | 510 | | | | 1,322 | | | | 705 | |
| | | | | | | | | | | | |
Net cash provided by operating activities | | | 10,573 | | | | 7,041 | | | | 3,554 | |
| | | | | | | | | | | | |
Investing Activities | | | | | | | | | | | | |
Purchases of securities available for sale | | | (18,684 | ) | | | (12,075 | ) | | | (11,645 | ) |
Proceeds from sales of securities available for sale | | | — | | | | 3,013 | | | | 4,689 | |
Proceeds from calls and maturities of securities available for sale | | | 3,958 | | | | 2,631 | | | | 3,141 | |
Purchases (sales) of Federal Home Loan Bank stock | | | (267 | ) | | | 468 | | | | (1,192 | ) |
Investment in life insurance | | | (3,014 | ) | | | (129 | ) | | | (2,282 | ) |
Net increase in loans | | | (133,809 | ) | | | (82,657 | ) | | | (118,622 | ) |
Purchases of premises and equipment | | | (3,484 | ) | | | (3,746 | ) | | | (2,751 | ) |
Proceeds from disposal of premises and equipment | | | — | | | | — | | | | 31 | |
Proceeds from sales of foreclosed assets | | | 2,308 | | | | 2,209 | | | | 636 | |
Net cash used in business combination | | | (1,226 | ) | | | — | | | | — | |
| | | | | | | | | | | | |
Net cash used by investing activities | | | (154,218 | ) | | | (90,286 | ) | | | (127,995 | ) |
| | | | | | | | | | | | |
Financing Activities | | | | | | | | | | | | |
Net increase in deposits | | | 154,435 | | | | 99,412 | | | | 94,738 | |
Net increase (decrease) in short-term borrowings | | | (7,798 | ) | | | (13,214 | ) | | | 15,740 | |
Net increase in long-term debt | | | 7,217 | | | | 6,000 | | | | 11,341 | |
Proceeds from exercise of stock options | | | 105 | | | | 58 | | | | 38 | |
Tax benefit from exercise of stock options | | | 83 | | | | — | | | | — | |
Purchase and retirement common stock | | | (225 | ) | | | (697 | ) | | | (752 | ) |
Cash dividends paid | | | (730 | ) | | | (578 | ) | | | (501 | ) |
Cash in lieu of fractional shares | | | — | | | | (8 | ) | | | — | |
| | | | | | | | | | | | |
Net cash provided by financing activities | | | 153,087 | | | | 90,973 | | | | 120,604 | |
| | | | | | | | | | | | |
Net increase (decrease) in cash and cash equivalents | | | 9,442 | | | | 7,728 | | | | (3,837 | ) |
Cash and cash equivalents, beginning of year | | | 15,255 | | | | 7,527 | | | | 11,364 | |
| | | | | | | | | | | | |
Cash and cash equivalents, end of year | | $ | 24,697 | | | $ | 15,255 | | | $ | 7,527 | |
| | | | | | | | | | | | |
Supplemental Statement of Cash Flows Disclosure | | | | | | | | | | | | |
Interest paid | | $ | 25,146 | | | $ | 14,076 | | | $ | 7,689 | |
Income taxes paid | | | 2,787 | | | | 2,049 | | | | 1,421 | |
| | | |
Summary of Noncash Investing and Financing Activities | | | | | | | | | | | | |
Increase (decrease) in fair value of securities available for sale, net of tax | | $ | 466 | | | $ | 195 | | | $ | (1 | ) |
Decrease in fair value of cash flow hedge, net of tax | | | (135 | ) | | | (9 | ) | | | — | |
Transfer of loans to foreclosed assets | | | 2,485 | | | | 2,512 | | | | 1,089 | |
Dividends declared | | | — | | | | — | | | | 556 | |
| | | | |
| See accompanying notes. | | F-8 | | |
NOTES TO CONSOLIDATED FINANCIAL STATEMENTS
December 31, 2006, 2005 and 2004
NOTE A - ORGANIZATION AND SUMMARY OF SIGNIFICANT ACCOUNTING POLICIES
Organization
On December 16, 2002, BNC Bancorp (“BNC”) was formed as a holding company for Bank of North Carolina (the “Bank”). Upon formation, one share of the BNC’s no par value common stock was exchanged for each outstanding share of the Bank’s $2.50 par value common stock. BNC is subject to the rules and regulations of the Federal Reserve Bank.
Bank of North Carolina was incorporated and began banking operations in 1991. The Bank is engaged in commercial banking predominantly in Davidson, Forsyth, Guilford and Randolph Counties, North Carolina, operating under the Banking Laws of North Carolina and the Rules and Regulations of the Federal Deposit Insurance Corporation and the North Carolina Commissioner of Banks. The Bank’s primary source of revenue is derived from loans to customers, who are predominantly individuals and small to medium size businesses in Davidson and Randolph Counties.
Basis of Presentation
The accompanying consolidated financial statements include the accounts and transactions of BNC Bancorp and its wholly owned subsidiary Bank of North Carolina, collectively referred to herein as the “Company”. All significant intercompany transactions and balances are eliminated in consolidation.
Use of Estimates
The preparation of consolidated financial statements in conformity with accounting principles generally accepted in the United States of America requires management to make estimates and assumptions that affect the reported amounts of assets and liabilities and disclosure of contingent assets and liabilities at the date of the financial statements and the reported amounts of revenues and expenses during the reporting period. Actual results could differ from those estimates. Material estimates that are particularly susceptible to significant change in the near term relate to the determination of the allowance for loan losses.
Cash and Cash Equivalents
For the purpose of presentation in the statements of cash flows, cash and cash equivalents include cash and due from banks and interest-earning deposits in other banks with maturities of three months or less. From time to time, the Bank may have deposits in excess of federally insured limits.
Federal regulations require financial institutions to set aside a specified amount as a reserve against transaction accounts and time deposits. At December 31, 2006, there was no reserve required.
Securities
Securities are classified into one of three categories on the date of purchase and accounted for as follows: (1) debt securities that the Company has the positive intent and the ability to hold to maturity are classified as held to maturity and reported at amortized cost; (2) debt and equity securities that are bought and held principally for the purpose of selling them in the near term are classified as trading securities and reported at fair value, with unrealized gains and losses included in earnings; (3) debt and equity securities not classified as either held to maturity securities or trading securities are classified as available for sale securities and reported at fair value, with unrealized gains and losses, net of taxes, reported as other comprehensive income.
F-9
NOTES TO CONSOLIDATED FINANCIAL STATEMENTS
December 31, 2006, 2005 and 2004
Premiums are amortized and discounts accreted using the interest method over the remaining terms of the related securities. Gains and losses on the sale of securities are determined using the specific identification method and are included in non-interest income on a trade date basis.
Federal Home Loan Bank Stock
As a member of the Federal Home Loan Bank of Atlanta (the “FHLB”), the Company is required to maintain an investment in the stock of the FHLB. This stock is carried at cost. Due to the redemption provisions of the FHLB, the Company estimated that fair value equals cost and that this investment was not impaired at December 31, 2006 and 2005.
Loans Held for Sale
The Company originates certain single family, residential first mortgage loans for sale and on a presold basis. Loans held for sale are carried at the lower of cost or estimated fair value in the aggregate as determined by outstanding commitments from investors. Upon closing, these loans, together with their servicing rights, are sold to other financial institutions under prearranged terms. The Company recognizes certain origination and service fees upon the sale which are classified as mortgage fee income on the statement of operations.
Loans and Allowance for Loan Losses
Loans that management has the intent and ability to hold for the foreseeable future or until maturity are reported at their outstanding principal adjusted for any charge-offs, the allowance for loan losses, and any deferred fees or costs on originated loans and unamortized premiums or discounts on purchased loans. Loan origination fees and certain direct origination costs are capitalized and recognized as an adjustment of the yield of the related loan. Interest on loans is recorded based on the principal amount outstanding.
The allowance for loan losses is established through a provision for loan losses charged to expense. Loans are charged-off against the allowance when management believes that the collectibility of principal is unlikely. Recoveries of amounts previously charged-off are credited to the allowance. The allowance is an amount that management believes will be adequate to absorb probable losses on existing loans, based on evaluations of the collectibility of loans. The evaluations take into consideration such factors as changes in the nature and volume of the loan portfolio, overall portfolio quality, historical loan losses, review of specific loans for impairment, and current economic conditions and trends that may affect the borrowers’ ability to pay. Accrual of interest is discontinued on loans when management believes, after considering economic and business conditions and collection efforts, that the borrowers’ financial condition is such that collection is doubtful.
The Company considers a loan impaired, based on current information and events, if it is probable that the Company will be unable to collect the scheduled payments of principal or interest when due according to the contractual terms of the loan agreement. All impaired loans are measured based on the present value of the expected future cash flows discounted at the loan’s effective interest rate, the loan’s observable market price, or at the fair value of the collateral if the loan is collateral dependent.
F-10
NOTES TO CONSOLIDATED FINANCIAL STATEMENTS
December 31, 2006, 2005 and 2004
The Company uses several factors in determining if a loan is impaired. Internal asset classification procedures include a thorough review of significant loans and lending relationships and include the accumulation of related data. This data includes loan payment status and the borrowers’ financial data, cash flows, operating income or loss, and other factors. While management uses the best information available to make evaluations, this evaluation is inherently subjective as it requires material estimates including the amounts and timing of future cash flows expected to be received on impaired loans that may be susceptible to significant change.
In addition, various regulatory agencies, as an integral part of their examination process, periodically review the Bank’s allowance for loan losses. Such agencies may require the Bank to recognize adjustments to the allowance based on their judgments of information available to them at the time of their examination.
Income Recognition of Impaired and Nonaccrual Loans
Loans, including impaired loans, are generally classified as nonaccrual if they are past due as to maturity or payment of principal or interest for a period of more than ninety (90) days, unless such loans are well-secured and in the process of collection. If a loan or a portion of a loan is classified as doubtful or is partially charged off, the loan is generally classified as nonaccrual. Loans that are on a current payment status or past due less than ninety (90) days may also be classified as nonaccrual if repayment in full of principal and/or interest is in doubt.
Loans may be returned to accrual status when all principal and interest amounts contractually due (including arrearages) are reasonably assured of repayment within an acceptable period of time and there is a sustained period of repayment performance (generally, a minimum of six months) by the borrower in accordance with the contractual terms of interest and principal.
While a loan is classified as nonaccrual and the future collectibility of the recorded loan balance is doubtful, collections of interest and principal are generally applied as a reduction to principal outstanding, except loans with scheduled amortizations where the payment is generally applied to the oldest payment due. When future collection of the recorded loan balance is expected, interest income may be recognized on a cash basis. In the case where a nonaccrual loan had been partially charged off, recognition of interest on a cash basis is limited to that which would have been recognized on the recorded loan balance at the contractual interest rate. Receipts in excess of that amount are recorded as recoveries to the allowance for loan losses until prior charge-offs have been fully recovered.
F-11
NOTES TO CONSOLIDATED FINANCIAL STATEMENTS
December 31, 2006, 2005 and 2004
Comprehensive Income
Comprehensive income is defined as the change in equity during a period for non-owner transactions and is divided into net income and other comprehensive income. Other comprehensive income includes revenues, expenses, gains, and losses that are excluded from earnings under current accounting standards. Components of other comprehensive income for the Company consist of the unrealized gains and losses, net of taxes, in the Company’s available for sale securities portfolio and unrealized gains and losses, net of taxes, in the Company’s cash flow hedge instruments.
Accumulated other comprehensive income at December 31, 2006, 2005 and 2004 consists of the following:
| | | | | | | | | | | | |
| | | 2006 | | | 2005 | | | 2004 | |
| | (Amounts in thousands) | |
Unrealized holding gains - investment securities available for sale | | $ | 1,553 | | | $ | 819 | | | $ | 512 | |
Deferred income taxes | | | (567 | ) | | | (299 | ) | | | (187 | ) |
| | | | | | | | | | | | |
Net unrealized holding gains - investment securities available for sale | | | 986 | | | | 520 | | | | 325 | |
| | | | | | | | | | | | |
Unrealized holding losses - cash flow hedge instruments | | | (235 | ) | | | (15 | ) | | | — | |
Deferred income taxes | | | 91 | | | | 6 | | | | — | |
| | | | | | | | | | | | |
Net unrealized holding losses - cash flow hedge instruments | | | (144 | ) | | | (9 | ) | | | — | |
| | | | �� | | | | | | | | |
Total accumulated other comprehensive income | | $ | 842 | | | $ | 511 | | | $ | 325 | |
| | | | | | | | | | | | |
Premises and Equipment
Premises and equipment are stated at cost less accumulated depreciation and amortization. Land is carried at cost. Depreciation and amortization are computed using the straight-line method over the estimated useful lives of the respective assets which are 40 years for buildings and 3 to 10 years for furniture and equipment. Leasehold improvements are amortized over the terms of the respective leases or the estimated useful lives of the improvements, whichever is shorter. Repairs and maintenance costs are charged to operations as incurred.
Foreclosed Assets
Assets acquired through, or in lieu of, loan foreclosure are held for sale and are initially recorded at fair value at the date of foreclosure, establishing a new cost basis. Subsequent to foreclosure, valuations are periodically performed by management and the assets are carried at the lower of carrying amount or fair value less cost to sell. Revenue and expenses from operations and changes in the valuation allowance are included in other non-interest expense.
F-12
NOTES TO CONSOLIDATED FINANCIAL STATEMENTS
December 31, 2006, 2005 and 2004
Income Taxes
Deferred income taxes are recognized for the tax consequences of temporary differences between financial statement carrying amounts and the tax bases of existing assets and liabilities that will result in taxable or deductible amounts in future years. These temporary differences are multiplied by the enacted income tax rate expected to be in effect when the taxes become payable or receivable. The effect on deferred taxes of a change in tax rates is recognized in income in the period that includes the enactment date. Deferred tax assets are reduced, if necessary, by the amount of such benefits that are not expected to be realized based on available evidence.
Goodwill and Other Intangibles
In July 2001, the Financial Accounting Standards Board issued Statement of Financial Accounting Standards (“SFAS”) No. 142,Goodwill and Other Intangible Assets. SFAS No. 142 required companies to cease amortizing goodwill and established a new method for testing goodwill for impairment on an annual basis. In accordance with provisions of SFAS No. 142, all goodwill resulting from the acquisition during the year ended December 31, 2006 will not be amortized. However, the other intangible assets, which consisted of premiums on purchased core deposits which will be amortized over ten years using the straight-line method. The carrying amount of goodwill and other intangible assets at December 31, 2006 amounted to $26.1 million and $2.3 million, respectively.
Reclassifications
Certain amounts in the 2005 and 2004 consolidated financial statements have been reclassified to conform to the 2006 presentation. The reclassifications had no effect on net income or shareholders’ equity as previously reported.
Derivatives
For asset/liability management purposes, the Company utilizes interest rate swap agreements to hedge various exposures of various balance sheet accounts. Such derivatives are used as part of the asset/liability management process and are linked to specific assets or liabilities, and have high correlation between the contract and the underlying item being hedged, both at inception and throughout the hedge period.
The Company utilizes interest rate swap agreements to convert a portion of its variable-rate loans to a fixed rate (cash flow hedge). Interest rate swaps are contracts in which a series of interest rate flows, primarily from interest rate receipts, are exchanged over a prescribed period. The notional amount on which the interest payments are based is not exchanged. Interest payments or receipts are recorded as an adjustment to yield on the hedged assets.
The effective portion of the gain or loss on a derivative designated and qualifying as a cash flow hedging instrument is initially reported as a component of other comprehensive income and subsequently reclassified into earnings in the same period or periods during which the hedged transaction affects earnings. The ineffective portion of the gain or loss on the derivative instrument, if any, is recognized currently in earnings.
F-13
NOTES TO CONSOLIDATED FINANCIAL STATEMENTS
December 31, 2006, 2005 and 2004
Interest rate derivative financial instruments receive hedge accounting treatment only if they are designated as a hedge and are expected to be, and are, effective in substantially reducing interest rate risk arising from the assets and liabilities identified as exposing the Company to risk. Derivative hedge contracts must meet specific effectiveness tests (i.e., over time the change in their fair values due to the designated hedge risk must be within 80 to 125 percent of the opposite change in the fair values of the hedged assets or liabilities). Cash flows of the derivative financial instruments must be effective at offsetting cash flows of the hedged asset during the term of the hedge. Further, if the underlying financial instrument differs from the hedged asset or liability, there must be a clear economic relationship between the prices of the two financial instruments. If periodic assessment indicates derivatives no longer provide an effective hedge, the derivatives contracts would be closed out and settled or classified as a trading activity.
Hedges of variable-rate loans are accounted for as cash flow hedges, with changes in fair value recorded in derivative assets or liabilities and other comprehensive income. The net settlement (upon close out or termination) that offsets changes in the value of the hedged debt is deferred and amortized into net interest income over the life of the hedged debt.
Cash flows resulting from the derivative financial instruments that are accounted for as hedges of assets and liabilities are classified in the cash flow statement in the same category as the cash flows of the items being hedged.
Net Income Per Share
Basic and diluted net income per share are computed based on the weighted average number of shares outstanding during each period after retroactively adjusting for a 10% stock dividend distributed on January 22, 2007. Diluted net income per share reflects the potential dilution that could occur if stock options were exercised, resulting in the issuance of common stock that then shared in the net income of the Company.
Basic and diluted net income per share have been computed based upon net income as presented in the accompanying consolidated statements of operations divided by the weighted average number of common shares outstanding or assumed to be outstanding as summarized below:
| | | | | | |
| | | 2006 | | 2005 | | 2004 |
Weighted average number of common shares used in computing basic net income per share | | 5,658,196 | | 4,798,869 | | 4,788,713 |
| | | |
Effect of dilutive stock options | | 296,267 | | 294,458 | | 310,966 |
| | | |
Effects of restricted stock | | 3,015 | | — | | — |
| | | | | | |
Weighted average number of common shares and dilutive potential common shares used in computing diluted net income per share | | 5,957,478 | | 5,093,327 | | 5,099,679 |
| | | | | | |
F-14
NOTES TO CONSOLIDATED FINANCIAL STATEMENTS
December 31, 2006, 2005 and 2004
For the years ended December 31, 2006, 2005 and 2004 there were no antidilutive options.
Stock Compensation Plans
Effective January 1, 2006, the Company adopted SFAS No. 123 (revised 2004),Share-Based Payment (“SFAS No. 123R”) which was issued by the FASB in December 2004. SFAS No. 123R revises SFAS No. 123Accounting for Stock Based Compensation, and supersedes Accounting Principals Board Opinion (“APB”) No. 25,Accounting for Stock Issued to Employees, and its related interpretations. SFAS No. 123R requires recognition of the cost of employee services received in exchange for an award of equity instruments in the financial statements over the period the employee is required to perform the services in exchange for the award (usually the vesting period). SFAS No. 123R also requires measurement of the cost of employee services received in exchange for an award based on the grant-date fair value of the award. SFAS No. 123R also amends SFAS No. 95Statement of Cash Flows, to require that excess tax benefits be reported as financing cash inflows, rather than as a reduction of taxes paid, which is included within operating cash flows.
The Company adopted SFAS No. 123R using the modified prospective application as permitted under SFAS No. 123R. Accordingly, prior period amounts have not been restated. Under this application, the Company is required to record compensation expense for all awards granted after the date of adoption and for the unvested portion of previously granted awards that remain outstanding at the date of adoption. Prior to the adoption of SFAS No. 123R, the Company used the intrinsic value method as prescribed by APB No. 25 and thus recognized no compensation expense for options granted with exercise prices equal to the fair market value of the Company’s common stock on the date of grant.
The impact of the adoption of SFAS 123(R) is as follows:
| | | | |
| | | For the year ended
December 31, 2006 | |
Income before income tax expense | | $ | (222,000 | ) |
Net income | | $ | (222,000 | ) |
| |
Cash flow from operating activities | | $ | (83,000 | ) |
Cash flow provided by financing activities | | $ | 83,000 | |
| |
Basic earnings per share | | $ | (0.04 | ) |
Diluted earnings per share | | $ | (0.04 | ) |
The following table illustrates the effect on net income and earnings per share if the Company had applied the fair value recognition provisions of SFAS 123R to options granted under the Company’s stock option plans for the years ended December 31, 2005 and 2004. For purposes of this pro forma disclosure, the value of the options is estimated using the Black-Scholes option-pricing model and amortized to expense over the options’ vesting periods.
F-15
NOTES TO CONSOLIDATED FINANCIAL STATEMENTS
December 31, 2006, 2005 and 2004
| | | | | | | | |
| | | 2005 | | | 2004 | |
| | (In thousands, except
per share amounts) | |
Net income, as reported | | $ | 4,505 | | | $ | 3,805 | |
Deduct: Total stock-based employee compensation expense, net of tax | | | (126 | ) | | | (193 | ) |
| | | | | | | | |
Pro forma net income | | $ | 4,379 | | | $ | 3,612 | |
| | | | | | | | |
Net income per share: | | | | | | | | |
As reported: | | | | | | | | |
Basic | | $ | .94 | | | $ | .79 | |
Diluted | | $ | .88 | | | $ | .75 | |
Pro forma: | | | | | | | | |
Basic | | $ | .91 | | | $ | .74 | |
Diluted | | $ | .85 | | | $ | .70 | |
Segment Reporting
SFAS No. 131,Disclosures about Segments of an Enterprise and Related Information requires management to report selected financial and descriptive information about reportable operating segments. It also establishes standards for related disclosures about products and services, geographic areas, and major customers. Generally, disclosures are required for segments internally identified to evaluate performance and resource allocation. In all material respects, the Company’s operations are entirely within the commercial banking segment, and the financial statements presented herein reflect the results of that segment. Also, the Bank has no foreign operations or customers.
Recent Accounting Pronouncements
SFAS No. 155,Accounting for Certain Hybrid Financial Instruments — an amendment of SFAS No. 133 and 140 provides entities relief from the requirement to separately determine the fair value of an embedded derivative that would otherwise be bifurcated from the host contract under SFAS 133. This statement allows an irrevocable election on an instrument-by-instrument basis to measure such a hybrid financial instrument at fair value. This statement is effective for all financial instruments acquired or issued after the beginning of the fiscal years beginning after September 15, 2006. The Company has evaluated this statement and does not believe it will have a material effect on the Company’s financial position, results of operations and cash flows.
SFAS No. 156,Accounting for Servicing of Financial Assets — an amendment of SFAS No. 140 requires that all separately recognized servicing assets and liabilities be initially measured at fair value and permits (but does not require) subsequent measurement of servicing assets and liabilities at fair value. This statement is effective for fiscal years beginning after September 15, 2006. The Company has evaluated this statement and does not believe it will have a material effect on the Company’s financial position, results of operations and cash flows.
F-16
NOTES TO CONSOLIDATED FINANCIAL STATEMENTS
December 31, 2006, 2005 and 2004
SFAS No. 158,Employers’ Accounting for Defined Benefit Pension and Other Postretirement Plans. This statement requires recognition on the balance sheet of a plan’s overfunded or underfunded status with an offset to comprehensive income. This statement also requires, with limited exceptions, that the funded status of the plan be determined as of the employer’s fiscal year end. The balance sheet recognition provisions of SFAS 158 are effective for entities with publicly traded equity securities for years ending after December 15, 2006 and for all other entities for years ending after June 15, 2007. The Company does not anticipate that this statement will have an impact on the Company’s financial position, results of operations and cash flows.
FIN 48 – In July 2006, the FASB issued Financial Interpretation (“FIN”) No. 48,Accounting for Uncertainty in Income Taxes-an interpretation of FASB Statement No. 109, which is a change in accounting for income taxes. FIN 48 specifies how tax benefits for uncertain tax positions are to be recognized, measured, and derecognized in financial statements; requires certain disclosures of uncertain tax matters; specifies how reserves for uncertain tax positions should be classified on the balance sheet; and provides transition and interim period guidance, among other provisions. FIN 48 is effective for fiscal years beginning after December 15, 2006 and as a result, is effective for the Company in the first quarter of fiscal 2008. The Company is currently evaluating the impact of FIN 48 on its consolidated financial statements.
SAB 108 – In September 2006, the SEC staff issued Staff Accounting Bulletin No. 108,Considering the Effects of Prior Year Misstatements when Quantifying Misstatements in Current Year Financial Statements. SAB 108 was issued in order to eliminate the diversity of practice surrounding how public companies quantify financial statements misstatements.
Traditionally, there have been two widely-recognized methods for quantifying the effects of financial statement misstatements the “roll-over” method and the “iron curtain” method. The roll-over method focuses primarily on the impact of a misstatement on the income statement – including the reversing effect of prior year misstatements – but its use can lead to the accumulation of misstatements in the balance sheet. The iron-curtain method, on the other hand, focuses primarily on the effect of correcting the period-end balance sheet with less emphasis on the reversing effects of prior year errors on the income statement. We currently use the roll-over method for quantifying identified financial statement misstatements.
In SAB 108, the SEC staff established an approach that requires quantification of financial statement misstatements based on the effects of the misstatements on each of the Company’s financial statements and the related financial statement disclosures. This model is commonly referred to as a “dual approach” because it requires quantification of errors under both the iron curtain and the roll-over-methods.
SAB 108 permits existing public companies to initially apply its provisions either by (i) restating prior financial statements as if the “dual approach” had always been used or (ii) recording the cumulative effect of initially applying the “dual approach” as adjustments to the carrying values of assets and liabilities as of October 1, 2006 with an offsetting adjustment recorded to the opening balance of retained earnings. Use the “cumulative effect” transition method requires detailed disclosure of the nature and amount of each individual error being corrected through the cumulative adjustment and how and when it arose. The adoption of SAB 108 will not have a material financial impact on the Company’s consolidated financial statements.
F-17
NOTES TO CONSOLIDATED FINANCIAL STATEMENTS
December 31, 2006, 2005 and 2004
EITF 06-4 – The Emerging Issues Task Force (“EITF”) reached a consensus at its September 2006 meeting regarding EITF 06-4,Accounting for Deferred Compensation and Postretirement Benefit Aspects of Endorsement Split-Dollar Life Insurance Arrangements. The scope of EITF 06-4 is limited to the recognition of a liability and related compensation costs for endorsement split-dollar life insurance policies that provide a benefit to an employee that extends to postretirement periods. Therefore, this EITF would not apply to a split-dollar life insurance arrangement that provides a specified benefit to an employee that is limited to the employee’s active service period with an employer. This EITF 06-4 is effective for fiscal years beginning after December 15, 2007, with earlier application permitted. The effects of this EITF have not yet been evaluated.
EITF 06-5 – The EITF reached a consensus at its September 2006 meeting regarding EITF 06-5,Accounting for Purchases of Life Insurance Determining the Amount That Could be Realized in Accordance with FASB Technical Bulletin No. 85-5. The scope of EITF 06-5 is limited to the determination of net cash surrender value of a life insurance contract in accordance with Technical Bulletin 85-4. This EITF outlines when contractual limitations of the policy should be considered when determining the net realizable value of the contract. EITF 06-5 is effective for fiscal years beginning after December 15, 2006, with earlier application permitted. The Company has not yet evaluated the effects of this EITF.
From time to time the FASB issues exposure drafts for proposed statements of financial accounting standards. Such exposure drafts are subject to comment from the public, to revisions by the FASB and to final issuance by the FASB as statements of financial accounting standards. Management considers the effect of the proposed statements on the consolidated financial statements of the Company and monitors the status of changes to and proposed effective dates of exposure drafts.
NOTE B - BUSINESS COMBINATION
On February 6, 2006, the Company and SterlingSouth Bank & Trust Company (SterlingSouth) jointly announced the execution of a definitive agreement in which BNC Bancorp would acquire SterlingSouth of Greensboro, North Carolina. The acquisition was approved at the annual shareholders’ meeting on June 15, 2006 and the transaction took place effective with the close of business on July 20, 2006. SterlingSouth shareholders exchanged each share of SterlingSouth stock for 1.21056 shares of BNC Bancorp common stock. As a result of the acquisition, the Company paid $3.2 million in cash for the outstanding options and warrants to purchase SterlingSouth common stock and has issued 1,686,370 additional shares of stock. The acquisition was accounted for using the purchase method of accounting, with the operating results of SterlingSouth subsequent to July 20, 2006 included in the Company’s consolidated financial statements.
The following table reflects the unaudited pro forma combined results of operations for the twelve months ended December 31, 2006 and 2005, assuming the acquisition had occurred at the beginning of fiscal year 2005.
F-18
NOTES TO CONSOLIDATED FINANCIAL STATEMENTS
December 31, 2006, 2005 and 2004
| | | | | | |
| | | (Unaudited) |
| | 2006 | | 2005 |
| | (Amounts in thousands) |
Net interest income | | $ | 30,039 | | $ | 23,753 |
Net income | | | 6,950 | | | 5,495 |
| | |
Net income per share: | | | | | | |
Basic | | $ | 1.04 | | $ | .83 |
Diluted | | | 1.00 | | | .79 |
The pro forma net income for the twelve months ended December 31, 2006 does not reflect approximately $2.1 million and $219,000 in after tax merger related costs incurred by SterlingSouth and the Company, respectively. In management’s opinion, these unaudited results are not necessarily indicative of what actual combined results of operations might have been if the acquisition had been effective at the beginning of fiscal year 2005.
A summary of the total purchase price of the transaction is as follows:
| | | |
| | | (In thousands) |
Fair value of common stock issued | | $ | 32,051 |
Fair value of common stock options issued | | | 1,402 |
Cash paid for shares and warrants | | | 3,172 |
Transaction costs paid in cash | | | 638 |
| | | |
Total purchase price | | $ | 37,263 |
| | | |
A summary of the fair value of the assets acquired and liabilities assumed is as follows:
| | | | |
| | | (In thousands) | |
Cash and cash equivalents | | $ | 2,584 | |
Investment securities available for sale | | | 18,799 | |
Loans receivable, net | | | 142,357 | |
Bank premises and equipment | | | 2,503 | |
Deferred tax asset | | | 1,363 | |
Goodwill | | | 22,706 | |
Core deposit intangible | | | 2,370 | |
Other assets | | | 7,506 | |
Deposits | | | (141,370 | ) |
Borrowings | | | (20,410 | ) |
Other liabilities | | | (1,145 | ) |
| | | | |
Net assets acquired | | | 37,263 | |
Less: Equity adjustment | | | (33,453 | ) |
| | | | |
Cash consideration paid | | $ | 3,810 | |
| | | | |
Net cash paid in acquisition | | $ | 1,226 | |
| | | | |
F-19
NOTES TO CONSOLIDATED FINANCIAL STATEMENTS
December 31, 2006, 2005 and 2004
NOTE C - SECURITIES
The amortized cost and estimated fair values of securities as of December 31 are as follows:
| | | | | | | | | | | | |
| 2006 | | Amortized
cost | | Gross
unrealized
gains | | Gross
unrealized
losses | | Estimated
fair
value |
| Available for sale: | | (Amounts in thousands) |
U.S. Government agency obligations | | $ | 4,407 | | $ | 29 | | $ | — | | $ | 4,436 |
State and municipals | | | 60,989 | | | 1,358 | | | 8 | | | 62,339 |
Mortgage-backed | | | 9,585 | | | 174 | | | — | | | 9,759 |
Other | | | 166 | | | — | | | — | | | 166 |
| | | | | | | | | | | | |
| | $ | 75,147 | | $ | 1,561 | | $ | 8 | | $ | 76,700 |
| | | | | | | | | | | | |
| 2005 | | Amortized
cost | | Gross
unrealized
gains | | Gross
unrealized
losses | | Estimated
fair
value |
| Available for sale: | | (Amounts in thousands) |
U.S. Government agency obligations | | $ | — | | $ | — | | $ | — | | $ | — |
State and municipals | | | 41,373 | | | 941 | | | 122 | | | 42,192 |
Mortgage-backed | | | — | | | — | | | — | | | — |
Other | | | 297 | | | — | | | — | | | 297 |
| | | | | | | | | | | | |
| | $ | 41,670 | | $ | 941 | | $ | 122 | | $ | 42,489 |
| | | | | | | | | | | | |
The following tables show gross unrealized losses and fair values of investment securities, aggregated by investment category and length of time that the individual securities have been in a continuous unrealized loss position, at December 31, 2006 and 2005. At December 31, 2006, the unrealized losses relate to three State and municipal securities which had continuous unrealized losses for more than twelve months. The unrealized losses relate to debt securities that have incurred fair value reductions due to higher market interest rates since the securities were purchased. The unrealized losses are not likely to reverse unless and until market interest rates decline to the levels that existed when the securities were purchased. Since none of the unrealized losses relate to the marketability of the securities or the issuer’s ability to honor redemption obligations and it is management’s intent and ability to hold these securities until maturity, none of the securities are deemed to be other than temporarily impaired. The temporarily impaired securities as of December 31, 2006 and 2005 are as follows:
| | | | | | | | | | | | | | | | | | |
| | | 2006 |
| | Less Than 12
Months | | 12 Months or More | | Total |
| | Fair
value | | Unrealized
losses | | Fair
value | | Unrealized
losses | | Fair
value | | Unrealized
losses |
| | | (Amounts in thousands) |
Securities available for sale: | | | | | | | | | | | | | | | | | | |
State and municipals | | $ | - | | $ | - | | $ | 1,361 | | $ | 8 | �� | $ | 1,361 | | $ | 8 |
| | | | | | | | | | | | | | | | | | |
F-20
NOTES TO CONSOLIDATED FINANCIAL STATEMENTS
December 31, 2006, 2005 and 2004
| | | | | | | | | | | | | | | | | | |
| | | 2005 |
| | Less Than 12 Months | | 12 Months or More | | Total |
| | Fair
value | | Unrealized
losses | | Fair
value | | Unrealized
losses | | Fair
value | | Unrealized
losses |
| | | (Amounts in thousands) |
Securities available for sale: | | | | | | | | | | | | | | | | | | |
State and municipals | | $ | 9,038 | | $ | 86 | | $ | 3,810 | | $ | 36 | | $ | 12,848 | | $ | 122 |
| | | | | | | | | | | | | | | | | | |
The amortized cost and estimated fair value of debt securities at December 31, 2006, by contractual maturity and projected cash flows, are shown below. Actual maturities may differ from contractual maturities because borrowers may have the right to call or prepay obligations with or without penalties.
| | | | | | |
| | | Available for Sale |
| | Amortized
Cost | | Fair
Value |
| | (Amounts in thousands) |
Due within one year | | $ | 2,352 | | $ | 2,381 |
After one year through five years | | | 19,995 | | | 20,246 |
After five years through ten years | | | 30,628 | | | 31,267 |
Over ten years | | | 22,172 | | | 22,806 |
| | | | | | |
| | $ | 75,147 | | $ | 76,700 |
| | | | | | |
Proceeds from sales of securities available for sale during 2005 and 2004 amounted to $3.0 million and $4.7 million, respectively, resulting in gross gains of $1,000 and $149,000, respectively, and no gross losses. There were no sales of securities available for sale during 2006.
At December 31, 2006 and 2005, securities with an estimated fair value of approximately $20.0 million and $16.5 million, respectively, were pledged to secure public deposits and for other purposes required or permitted by law.
NOTE D - LOANS AND ALLOWANCE FOR LOAN LOSSES
Major classifications of loans at December 31 are summarized below:
| | | | | | |
| | | 2006 | | 2005 |
| | (Amounts in thousands) |
Real estate mortgage loans | | $ | 444,724 | | $ | 316,390 |
Real estate construction loans | | | 203,695 | | | 108,172 |
Commercial and industrial loans | | | 97,071 | | | 63,423 |
Loans to individuals | | | 18,140 | | | 11,262 |
Leases | | | 11,034 | | | — |
| | | | | | |
| | | 774,664 | | | 499,247 |
Less allowance for loan losses | | | 10,400 | | | 6,140 |
| | | | | | |
| | $ | 764,264 | | $ | 493,107 |
| | | | | | |
F-21
NOTES TO CONSOLIDATED FINANCIAL STATEMENTS
December 31, 2006, 2005 and 2004
The Company’s lending is concentrated primarily in Davidson, Randolph, Forsyth and Guilford Counties and the surrounding communities in which it operates. The Company has loan and deposit relationships with its directors and executive officers and with companies with which certain directors and executive officers are associated. The following is a summary of loans to executive officers, directors, and their affiliates for the year ended December 31, 2006 in thousands:
| | | | |
Balance at beginning of year | | $ | 6,594 | |
Loans acquired from SterlingSouth | | | 7,964 | |
Additional borrowings during the year | | | 4,025 | |
Loan repayments during the year | | | (271 | ) |
| | | | |
Balance at end of year | | $ | _18,312 | |
| | | | |
As a matter of policy, these loans and credit lines are approved by the Board of Directors and are made with interest rates, terms, and collateral requirements comparable to those required of other borrowers. In the opinion of management, these loans do not involve more than the normal risk of collectibility.
At December 31, 2006, the Company had pre-approved but unused lines of credit totaling $5.0 million to executive officers, directors and their affiliates.
A summary of activity in the allowance for loan losses for the years ended December 31 is as follows:
| | | | | | | | | | | | |
| | | 2006 | | | 2005 | | | 2004 | |
| | | (Amounts in thousands) | |
Balance at beginning of year | | $ | 6,140 | | | $ | 5,361 | | | $ | 4,598 | |
Provision charged to operations | | | 2,655 | | | | 2,515 | | | | 1,190 | |
Loans charged off | | | (1,289 | ) | | | (1,788 | ) | | | (548 | ) |
Recoveries | | | 78 | | | | 52 | | | | 121 | |
Allowance recorded in merger of SterlingSouth | | | 2,816 | | | | — | | | | — | |
| | | | | | | | | | | | |
Balance at end of year | | $ | 10,400 | | | $ | 6,140 | | | $ | 5,361 | |
| | | | | | | | | | | | |
At December 31, 2006 and 2005, the recorded investment in loans considered impaired totaled $1.1 million and $324,000, respectively, with corresponding valuation allowances of $171,000 and $81,000, respectively. For the years ended December 31, 2006 and 2005, the average recorded investment in impaired loans was approximately $1.4 million and $907,000, respectively. Restructured loans amounted to $312,000 at December 31, 2005. There were no restructured loans at December 31, 2006. The amount of interest recognized on impaired and restructured loans during the portion of the year that they were impaired was not material.
F-22
NOTES TO CONSOLIDATED FINANCIAL STATEMENTS
December 31, 2006, 2005 and 2004
NOTE E - PREMISES AND EQUIPMENT
Premises and equipment at December 31 are summarized as follows:
| | | | | | |
| | | 2006 | | 2005 |
| | (Amounts in thousands) |
Land | | $ | 5,176 | | $ | 3,867 |
Buildings and improvements | | | 13,195 | | | 10,093 |
Furniture and equipment | | | 7,875 | | | 5,715 |
| | | | | | |
| | | 26,246 | | | 19,675 |
Less accumulated depreciation and amortization | | | 6,624 | | | 4,955 |
| | | | | | |
| | $ | 19,622 | | $ | 14,720 |
| | | | | | |
Depreciation and amortization expense for the years ended December 31, 2006, 2005 and 2004 amounted to $1.1 million, $832,000 and $649,000, respectively.
NOTE F - GOODWILL AND OTHER INTANGIBLES
The following is a summary of goodwill and other intangible assets at December 31, 2006 and 2005:
| | | | | | |
| | | 2006 | | 2005 |
| | | (Amounts in thousands) |
Goodwill, beginning of year | | $ | 3,423 | | $ | 3,423 |
Goodwill acquired during the year | | | 22,706 | | | — |
| | | | | | |
Goodwill, end of year | | $ | 26,129 | | $ | 3,423 |
| | | | | | |
Other intangibles – gross | | $ | 2,524 | | $ | 154 |
Less accumulated amortization | | | 209 | | | 94 |
| | | | | | |
Other intangibles – net | | $ | 2,315 | | $ | 60 |
| | | | | | |
Other intangibles amortization expense for the years ended December 31, 2006, 2005 and 2004 amounted to $115,000, $20,000 and $25,000, respectively. The following table presents estimated amortization expense for other intangibles.
| | | |
| | | Estimated Amortization Expense |
| | | (Amounts in thousands) |
| For the Year Ended December 31: | | |
2007 | | $ | 251 |
2008 | | | 248 |
2009 | | | 246 |
2010 | | | 247 |
2011 | | | 218 |
Thereafter | | | 1,105 |
| | | |
| | $ | 2,315 |
| | | |
F-23
NOTES TO CONSOLIDATED FINANCIAL STATEMENTS
December 31, 2006, 2005 and 2004
NOTE G - DEPOSITS
At December 31, 2006, the scheduled maturities of time deposits are as follows (amounts in thousands):
| | | |
2007 | | $ | 440,991 |
2008 - 2009 | | | 75,741 |
2010 - 2011 | | | 14,489 |
| | | |
Total | | $ | 531,221 |
| | | |
NOTE H - SHORT-TERM BORROWINGS
The Company may purchase federal funds through an unsecured federal funds guidance line of credit totaling $40.0 million, with no outstanding borrowings as of December 31, 2006 and 2005. This line is intended for short-term borrowings and is subject to restrictions limiting the frequency and terms of advances. This line of credit is payable on demand and bears interest based upon the daily federal funds rate.
Included in short-term borrowings are repurchase agreements with outstanding balances of $4.7 million and $7.1 million at December 31, 2006 and 2005, respectively. Securities sold under agreements to repurchase generally mature within one day from the transaction date and are collateralized by U.S. Government Agency obligations.
In addition, the Company utilizes short-term borrowings from FHLB and bears interest based upon the daily federal funds rate. There were no outstanding balances as of December 31, 2006 and 2005. The line of credit is secured as discussed below for other FHLB advances.
NOTE I - LONG-TERM DEBT
Long-term debt at December 31, 2006 and 2005 consisted of the following fixed rate advances from FHLB:
| | | | | | | | | |
Maturity | | Interest
rate | | | 2006 | | 2005 |
| | | | | | (Amounts in thousands) |
December 2007 | | 4.21 | % | | $ | 15,000 | | $ | — |
April 2008 | | 4.36 | % | | | 6,000 | | | 6,000 |
March 2010 | | 5.71 | % | | | 5,000 | | | 5,000 |
March 2010 | | 5.92 | % | | | 4,000 | | | 4,000 |
February 2011 | | 4.36 | % | | | 3,000 | | | 3,000 |
February 2011 | | 4.84 | % | | | 2,000 | | | 2,000 |
March 2013 | | 2.85 | % | | | 5,000 | | | 5,000 |
May 2013 | | 2.74 | % | | | 5,000 | | | 5,000 |
October 2013 | | 3.18 | % | | | 5,000 | | | 5,000 |
| | | | | | | | | |
| | | | �� | $ | 50,000 | | $ | 35,000 |
| | | | | | | | | |
F-24
NOTES TO CONSOLIDATED FINANCIAL STATEMENTS
December 31, 2006, 2005 and 2004
The above advances have been made against a $142.8 million line of credit secured by a blanket floating lien on qualifying first mortgage loans in the amount of $87.8 million. Advances must be adequately collateralized. The weighted average rate for advances outstanding at December 31, 2006 and 2005 was 4.16% and 4.15%, respectively.
In September 2006, $7.0 million of trust preferred securities were placed through BNC Capital Trust IV. The Trust issuer has invested the total proceeds from the sale of the Trust Preferred in Junior Subordinated Debentures issued by the Company. The trust preferred securities pay cumulative cash distributions quarterly at an annual rate, reset quarterly, equal to 3 month LIBOR plus 1.70%. The dividends paid to holders of the trust preferred securities, which will be recorded as interest expense, are deductible for income tax purposes. The trust preferred securities are redeemable on December 15, 2011 or afterwards in whole or in part, on any December 30, March 30, June 30 or September 30. Redemption is mandatory at December 30, 2036. The Company has fully and unconditionally guaranteed the trust preferred securities through the combined operation of the debentures and other related documents. The Company’s obligation under the guarantee is unsecured and subordinate to senior and subordinated indebtedness of the Company. The trust preferred securities quality as Tier I capital for regulatory capital purposes subject to certain limitations.
A description of the junior subordinated debentures outstanding at December 31, 2006 and 2005 is as follows:
| | | | | | | | | | | | | | |
Issuing Entity | | Date of
Issuance | | Shares
Issued | | Interest
Rate | | Maturity
Date | | Principal Amount |
| | | | | | 2006 | | 2005 |
| | | | | | | | | | | (In thousands) |
Bank of NC | | 6/07/2005 | | 8,000 | | Libor plus | | 7/07/2015 | | $ | 8,000 | | $ | 8,000 |
| | | | | | 1.80% | | | | | | | | |
| | | | | | |
BNC Bancorp | | 4/03/2003 | | 5,000 | | Libor plus | | 4/15/2033 | | | 5,155 | | | 5,155 |
Capital Trust I | | | | | | 3.25% | | | | | | | | |
| | | | | | |
BNC Bancorp | | 3/11/2004 | | 6,000 | | Libor plus | | 4/07/2034 | | | 6,186 | | | 6,186 |
Capital Trust II | | | | | | 2.80% | | | | | | | | |
| | | | | | |
BNC Bancorp | | 9/23/2004 | | 5,000 | | Libor plus | | 9/23/2034 | | | 5,155 | | | 5,155 |
Capital Trust III | | | | | | 2.40% | | | | | | | | |
| | | | | | |
BNC Bancorp | | 9/27/2006 | | 7,000 | | Libor plus | | 12/31/2036 | | | 7,217 | | | — |
| | | | | | | | | | | | | | |
Capital Trust IV | | | | | | 1.70% | | | | | | | | |
| | | | | | | | | | $ | 31,713 | | $ | 24,496 |
| | | | | | | | | | | | | | |
F-25
NOTES TO CONSOLIDATED FINANCIAL STATEMENTS
December 31, 2006, 2005 and 2004
The junior subordinated debentures issued by the Bank of North Carolina are classified as Tier II capital for regulatory purposes. The junior subordinated debentures issued by the trusts currently qualify as Tier I capital for the Company, and constitute a full and unconditional guarantee by the Company of the trust’s obligations under the preferred securities.
NOTE J - INCOME TAXES
Income tax expense is summarized as follows for the years ended December 31:
| | | | | | | | | | | | |
| | | 2006 | | | 2005 | | | 2004 | |
| | | (In thousands) | |
Current: | | | | | | | | | | | | |
Federal | | $ | 2,203 | | | $ | 1,622 | | | $ | 1,355 | |
State | | | 625 | | | | 473 | | | | 347 | |
| | | | | | | | | | | | |
Total current | | | 2,828 | | | | 2,095 | | | | 1,702 | |
| | | | | | | | | | | | |
Deferred: | | | | | | | | | | | | |
Federal | | | (236 | ) | | | (392 | ) | | | (246 | ) |
State | | | 24 | | | | 16 | | | | 18 | |
| | | | | | | | | | | | |
Total current | | | (212 | ) | | | (376 | ) | | | (228 | ) |
| | | | | | | | | | | | |
Total income tax expense | | $ | 2,616 | | | $ | 1,719 | | | $ | 1,474 | |
| | | | | | | | | | | | |
The difference between income tax expense and the amount computed by applying the statutory federal income tax rate of 34% was as follows for the years ended December 31:
| | | | | | | | | | | | |
| | | 2006 | | | 2005 | | | 2004 | |
| | | (In thousands) | |
Pre-tax income | | $ | 8,786 | | | $ | 6,224 | | | $ | 5,279 | |
| | | | | | | | | | | | |
Tax at statutory federal rate | | $ | 2,987 | | | $ | 2,116 | | | $ | 1,795 | |
| | | |
State income tax, net of federal benefit | | | 428 | | | | 322 | | | | 265 | |
Tax exempt interest income | | | (648 | ) | | | (512 | ) | | | (440 | ) |
| Income from life insurance | | | (186 | ) | | | (162 | ) | | | (163 | ) |
Other | | | 36 | | | | (45 | ) | | | 17 | |
| | | | | | | | | | | | |
| | $ | 2,616 | | | $ | 1,719 | | | $ | 1,474 | |
| | | | | | | | | | | | |
F-26
NOTES TO CONSOLIDATED FINANCIAL STATEMENTS
December 31, 2006, 2005 and 2004
Significant components of deferred tax assets and liabilities at December 31 were as follows:
| | | | | | |
| | | 2006 | | 2005 |
| | | (In thousands) |
Deferred tax assets: | | | | | | |
Allowance for loan losses | | $ | 3,739 | | $ | 2,067 |
Net operating losses carryforwards | | | 1,094 | | | 688 |
Deferred compensation | | | 1,125 | | | 821 |
Interest rate swap | | | 63 | | | 6 |
Loans | | | 393 | | | — |
Investments | | | 277 | | | — |
Other | | | 67 | | | 46 |
| | | | | | |
Total deferred tax assets | | | 6,758 | | | 3,628 |
| | | | | | |
Deferred tax liabilities: | | | | | | |
Premises and equipment | | | 246 | | | 146 |
Leasing activities | | | 720 | | | — |
Unrealized gain on securities | | | 567 | | | 305 |
Core deposit intangibles | | | 892 | | | — |
Deposits | | | 61 | | | — |
Other | | | 53 | | | 126 |
| | | | | | |
Total deferred tax liabilities | | | 2,539 | | | 577 |
| | | | | | |
Net deferred tax asset | | $ | 4,219 | | $ | 3,051 |
| | | | | | |
It is management’s opinion that realization of the net deferred tax asset is more likely than not based on the Company’s history of taxable income and estimates of future taxable income.
The Company has net operating loss carryforwards of approximately $3.2 million, which were acquired in the mergers of Independence Bank and SterlingSouth Bank & Trust. These loss carryforwards expire at various dates through 2026.
NOTE K - EMPLOYEE BENEFIT PLANS
The Company maintains a qualified profit sharing 401(k) plan for employees 20.5 years of age or over which covers substantially all employees. Under the plan, employees may contribute up to an annual maximum as determined by the Internal Revenue Code. The Company matches 100% of such contributions up to 6% of the participant’s compensation. The plan provides that employees’ contributions are 100% vested at all times, and the Company’s contributions vest at 20% each year after the second year of service. The expense related to the plan for the years ended December 31, 2006, 2005 and 2004 was $436,000, $284,000 and $247,000, respectively.
NOTE L - SHARE-BASED COMPENSATION
The Company maintains a nonqualified stock option plan for directors and a qualified incentive stock option plan for key employees. Options granted under the nonqualified plan vest immediately and expire ten years after the grant date. Options granted under the qualified plan vest ratably over a five year period and expire ten years after the grant date. At December 31, 2006, the number of shares available for grant under the nonqualified and qualified plans were -0- and 5,302, respectively.
F-27
NOTES TO CONSOLIDATED FINANCIAL STATEMENTS
December 31, 2006, 2005 and 2004
During 2004 the Company adopted, with shareholder approval in 2004, the BNC Bancorp Omnibus Stock Ownership and Long Term Incentive Plan. The Compensation Committee may grant or award eligible participants options, rights to receive restricted shares of common stock, and or stock appreciation rights (collectively referred to herein as “Rights”). This plan makes available 206,250 grants of Rights, subject to appropriate adjustment for stock splits, stock combinations, reclassifications and similar changes. The exercise price of all options granted to date is the fair value of the Company’s common shares on the date of grant. During 2005, the Company awarded 89,375 options that had a vesting schedule until February 2008 tied to the Company stock attaining certain prices prior to that date. The schedule is as follows: 25% vesting once the Company stock price is at $21.81, 40% at $23.27, 60% at $24.72, 80% at $26.18, and 100% at $29.09. As of December 31, 2006, there were no options vested and the aggregate number of rights available for issuance under this plan amounted to 71,500.
The share-based awards granted under the aforementioned plans have similar characteristics, except that some awards have been granted in options and certain awards have been granted in restricted stock. Therefore, the following disclosures have been disaggregated for the stock option and restricted stock awards of the plans due to their dissimilar characteristics. The Company funds the option shares and restricted stock from unauthorized but un-issued shares.
Stock Option Plans
The fair value of each option award is estimated on the date of grant using the Black-Scholes option pricing model. The risk-free interest rate is based on the U.S. Treasury rate for the expected life at the time of grant. Volatility is based on the average volatility of the Company based upon previous trading history. The expected life and forfeiture assumptions are based on historical data. Dividend yield is based on the yield at the time of the option grant.
The following table illustrates the assumptions for the Black-Scholes model used in determining the fair value of options granted to employees for the year ended December 31, 2006 and 2005.
| | | | | | |
| | | 2006 | | | 2005 | |
Assumptions in estimating option values: | | | | | | |
Risk-free interest rate | | 4.99 | % | | 4.21 | % |
Dividend yield | | 0.97 | % | | 0.93 | % |
Volatility | | 42.39 | % | | 39.97 | % |
Expected life | | 5 years | | | 10 years | |
A summary of option activity under the stock option plans as of December 31, 2006 and changes during the year ended December 31, 2006 is presented below, giving the effects to the 10% stock dividend distributed on January 22, 2007.
F-28
NOTES TO CONSOLIDATED FINANCIAL STATEMENTS
December 31, 2006, 2005 and 2004
| | | | | | | | | | | |
| | | Shares | | | Weighted
Average
Exercise
Price | | Weighted
Average
Remaining
Contractual
Term | | Aggregate
Intrinsic
Value |
| | | | | | | | | | (In thousands) |
Outstanding December 31, 2005 | | 571,142 | | | $ | 6.41 | | | | | |
Granted | | — | | | | — | | | | | |
Issued in acquisition of SterlingSouth | | 140,195 | | | | 8.46 | | | | | |
Exercised | | (56,708 | ) | | | 3.92 | | | | | |
Forfeited | | (151 | ) | | | 5.95 | | | | | |
| | | | | | | | | | | |
Outstanding December 31, 2006 | | 660,478 | | | | 7.06 | | 4.55 years | | $ | 7,612 |
| | | | | | | | | | | |
Exercisable December 31, 2006 | | 571,103 | | | | 6.03 | | 4.55 years | | $ | 7,170 |
| | | | | | | | | | | |
For the year ended December 31, 2006, the intrinsic value of options exercised and fair value of options vested amounted to $675,000 and $108,000, respectively.
Cash received from option exercises under all share-based payment arrangements for the year ended December 31, 2006 was $105,000. The actual tax benefit realized for tax deductions from option exercise of the share-based payment arrangements totaled $83,000 for the year ended December 31, 2006.
Stock Awards
A summary of the status of the Company’s non-vested stock awards as of December 31, 2006, and changes during the year then ended is presented below:
| | | | | |
| | | Shares | | Weighted
average
grant date
fair value |
Non-vested – December 31, 2005 | | — | | $ | — |
Granted | | 12,100 | | | 16.52 |
Vested | | 6,874 | | | 16.52 |
Forfeited | | — | | | — |
| | | | | |
Non-vested – December 31, 2006 | | 5,226 | | $ | 16.52 |
| | | | | |
The total fair value of restricted stock grants issued during the year ended December 31, 2006 was $200,000. The fair value of restricted stock grants vested during the period was $114,000.
As of December 31, 2006, there was $86,000 of unrecognized compensation cost related to nonvested share-based compensation arrangements granted under the plans. That cost is expected to be recognized over a weighted average period of 1.50 years.
F-29
NOTES TO CONSOLIDATED FINANCIAL STATEMENTS
December 31, 2006, 2005 and 2004
NOTE M - EMPLOYMENT AGREEMENTS
The Company has entered into employment agreements with its chief executive officer and two other executive officers to ensure a stable and competent management base. The agreements provide for a three-year term, with an automatic one-year renewal on each anniversary date. The agreements provide for benefits as set forth in the contracts and cannot be terminated by the Board of Directors, except for cause, without prejudicing the officers’ rights to receive certain vested benefits, including compensation. In the event of a change in control of the Company, as outlined in the agreements, the acquirer will be bound to the terms of the contracts.
NOTE N - DIRECTOR AND EXECUTIVE OFFICER BENEFIT PLANS
The Company during 2004 entered into Salary Continuation Agreements with its chief executive officer and two other executive officers. These agreements replace the existing Supplemental Executive Retirement Plans for these executives. All of the Salary Continuation Agreements provide for lifetime benefits to be paid to each executive with the payment amounts varying upon different retirement scenarios, such as normal retirement, early termination, disability, or change in control. The Company has purchased life insurance policies on the participating officers in order to provide future funding of benefit payments. Provisions of $572,000 in 2006, $441,000 in 2005 and $307,000 in 2004 were expensed for future benefits to be provided under these plans. The corresponding liability related to this plan was $2.0 million and $1.4 million as of December 31, 2006 and 2005, respectively.
The Company also has a deferred compensation plan for its directors. Expense provided under the plan totaled $202,000, $102,000 and $102,000 for the years ended December 31, 2006, 2005 and 2004, respectively. Since 2003, directors have had the option to invest amounts deferred in Company common stock that is held in a rabbi trust established for that purpose. At December 31, 2006 and 2005, the trust held 61,055 and 49,179 shares of Company common stock, respectively.
NOTE O - REGULATORY RESTRICTIONS
The Bank, as a North Carolina banking corporation, may pay cash dividends to BNC only out of undivided profits as determined pursuant to North Carolina General Statutes Section 53-87. However, regulatory authorities may limit payment of dividends by any bank when it is determined that such a limitation is in the public interest and is necessary to ensure financial soundness of the bank.
The Company (on a consolidated basis) and the Bank are subject to various regulatory capital requirements administered by the federal banking agencies. Failure to meet minimum capital requirements can initiate certain mandatory - and possibly additional discretionary - actions by regulators that, if undertaken, could have a material effect on the Company’s consolidated financial statements. Capital adequacy guidelines and the regulatory framework for prompt corrective action prescribe specific capital guidelines that involve quantitative measures of the Bank’s assets, liabilities, and certain off-balance sheet items as calculated under regulatory accounting practices. The Bank’s capital amounts and classification are also subject to qualitative judgments by the regulators about components, risk weightings, and other factors. Prompt corrective action provisions are not applicable to bank holding companies.
F-30
NOTES TO CONSOLIDATED FINANCIAL STATEMENTS
December 31, 2006, 2005 and 2004
Quantitative measures established by regulation to ensure capital adequacy require the Company and the Bank to maintain minimum amounts and ratios, as prescribed by regulations, of total and Tier I capital to risk-weighted assets and of Tier I capital to average assets. As of December 31, 2006 and 2005, the Bank met its capital adequacy requirements as set forth below:
| | | | | | | | | | | | | | | | | | |
| | | Actual | | | Minimum for capital
adequacy purposes | | | Minimum to be well
capitalized under prompt
corrective action provisions | |
| | Amount | | Ratio | | | Amount | | Ratio | | | Amount | | Ratio | |
| As of December 31, 2006: | | (Amounts in thousands) | |
Total Capital (to Risk- Weighted Assets) | | $ | 84,030 | | 10.23 | % | | $ | 65,731 | | 8.00 | % | | $ | 82,163 | | 10.00 | % |
Tier I Capital (to Risk- Weighted Assets) | | | 65,750 | | 8.00 | % | | | 32,865 | | 4.00 | % | | | 49,298 | | 6.00 | % |
Tier I Capital (to Average Assets) | | | 65,750 | | 7.40 | % | | | 35,525 | | 4.00 | % | | | 44,407 | | 5.00 | % |
| | | | | | |
As of December 31, 2005: | | | | | | | | | | | | | | | | | | |
| | | | | | |
Total Capital (to Risk- Weighted Assets) | | $ | 59,862 | | 11.27 | % | | $ | 42,477 | | 8.00 | % | | $ | 53,097 | | 10.00 | % |
Tier I Capital (to Risk- Weighted Assets) | | | 45,722 | | 8.61 | % | | | 21,239 | | 4.00 | % | | | 31,858 | | 6.00 | % |
Tier I Capital (to Average Assets) | | | 45,722 | | 7.92 | % | | | 23,085 | | 4.00 | % | | | 28,857 | | 5.00 | % |
The Company is also subject to these capital requirements. At December 31, 2006 and 2005, the Company’s capital amounts are as follows:
| | | | | | |
| | | 2006 | | | 2005 | |
Total capital to risk-weighted assets | | 10.57 | % | | 11.31 | % |
Tier I capital to risk-weighted assets | | 8.35 | % | | 8.63 | % |
Tier I capital to average assets | | 7.70 | % | | 7.89 | % |
NOTE P - DERIVATIVES
Derivative Financial Instruments
The Company utilizes stand-alone derivative financial instruments in the form of interest rate swap agreements, which derive their value from underlying interest rates. These transactions involve both credit and market risk. The notional amounts are amounts on which calculations, payments, and the value of the derivative are based. Notional amounts do not represent direct credit exposures. Direct credit exposure is limited to the net difference between the calculated amounts to be received and paid, if any. Such difference, which represents the fair value of the derivative instruments, is reflected on the Company’s consolidated balance sheets as derivative assets and derivative liabilities.
F-31
NOTES TO CONSOLIDATED FINANCIAL STATEMENTS
December 31, 2006, 2005 and 2004
The Company is exposed to credit-related losses in the event of nonperformance by the counterparties to these agreements. The Company controls the credit risk of its financial contracts through credit approvals, limits and monitoring procedures, and does not expect any counterparties to fail their obligations. The Company deals only with primary dealers.
Derivative instruments are generally either negotiated over-the-counter (“OTC”) contracts or standardized contracts executed on a recognized exchange. Negotiated OTC derivative contracts are generally entered into between two counterparties that negotiate specific agreements terms, including the underlying instruments, amount, exercise prices and maturity.
Risk Management Policies - Hedging Instruments
The primary focus of the Company’s asset/liability management program is to monitor the sensitivity of the Company’s net portfolio value and net income under varying interest rate scenarios to take steps to control its risks. On a quarterly basis, the Company simulates the net portfolio value and net income expected to be earned over a twelve-month period following the date of simulation. The simulation is based on a projection of market interest rates at varying levels and estimates the impact of such market rates on the levels of interest-earning assets and interest-bearing liabilities during the measurement period. Based upon the outcome of the simulation analysis, the Company considers the use of derivatives as a means of reducing the volatility of net portfolio value and projected net income within certain ranges of projected changes in interest rates. The Company evaluates the effectiveness of entering into any derivative instrument agreement by measuring the cost of such an agreement in relation to the reduction in net portfolio value and net income volatility within an assumed range of interest rates.
Interest Rate Risk Management - Cash Flow Hedging Instruments
The Company originates variable rate loans for its loan portfolio. These loans expose the Company to variability in cash flows, primarily from interest receipts due to changes to interest rates. If interest rates increase, interest income increases. Conversely, if interest rates decrease, interest income decreases. Management believes it is prudent to limit the variability of a portion of its cash flows on variable rate loans therefore, generally hedges a portion of its variable-rate receipts. To meet this objective, management enters into interest rate swap agreements whereby the Company receives fixed rate payments and makes variable rate payments during the contract period.
At December 31, 2006 and 2005, the information pertaining to the outstanding interest rate swap agreements used to hedge variable rate loans is as follows (dollar amounts in thousands):
| | | | | | | | |
| | | 2006 | | | 2005 | |
Notional amount | | $ | 55,000 | | | $ | 25,000 | |
Weighted average pay rate | | | 8.25 | % | | | 7.00 | % |
Weighted average receive rate | | | 7.85 | % | | | 7.77 | % |
Weighted average maturity in years | | | 4.2 | | | | 5.0 | |
Unrealized loss relating to interest rate swaps | | $ | (235 | ) | | $ | (15 | ) |
F-32
NOTES TO CONSOLIDATED FINANCIAL STATEMENTS
December 31, 2006, 2005 and 2004
This agreement requires the Company to make payments at a variable rate determined by a specified index (prime) in exchange for receiving payments at a fixed rate. The unrealized losses are included in other liabilities and other comprehensive income, net of tax, in the accompanying consolidated balance sheet.
Risk management results for the year ended December 31, 2006 and 2005 related to the balance sheet hedging of variable rate loans indicate that the hedges were considered 100% effective and that there was no component of the derivative instruments’ gain or loss which was excluded from the assessment of hedge effectiveness.
NOTE Q - OFF-BALANCE SHEET RISK
The Company is a party to financial instruments with off-balance sheet risk in the normal course of business to meet the financing needs of its customers. These financial instruments include commitments to extend credit, unfunded lines of credit, and standby letters of credit. These instruments involve elements of credit risk in excess of amounts recognized in the accompanying consolidated financial statements.
The Company’s risk of loss in the event of nonperformance by the other party to the commitment to extend credit, line of credit and standby letter of credit is represented by the contractual amount of these instruments. The Company uses the same credit policies in making commitments under such instruments as it does for on-balance sheet instruments. The amount of collateral obtained, if any, is based on management’s evaluation of the borrower. Collateral held varies, but may include accounts receivable, inventory, real estate and time deposits with financial institutions. Since many of the commitments are expected to expire without being drawn upon, the total commitment amounts do not necessarily represent cash requirements.
At December 31, 2006 and 2005, outstanding off-balance sheet financial instruments whose contract amounts represent potential credit risk were as follows:
| | | | | | |
| | | 2006 | | 2005 |
| | | (In thousands) |
Commitments under unfunded loans and lines of credit | | $ | 177,890 | | $ | 98,570 |
Standby letters of credit | | | 6,605 | | | 2,114 |
Commitments to sell loans held for sale | | | 2,168 | | | 1,701 |
NOTE R - FAIR VALUE OF FINANCIAL INSTRUMENTS
SFAS No. 107,Disclosures About Fair Value of Financial Instruments, requires disclosure of fair value information about financial instruments, whether or not recognized in the balance sheet, for which it is practicable to estimate that value. In cases where quoted market prices are not available, fair values are based on estimates using present value or other valuation techniques.
Those techniques are significantly affected by the assumptions used, including the discount rate and estimates of future cash flows. In that regard, the derived fair value estimates cannot be substantiated by comparison to independent markets and, in many cases, could not be realized in immediate settlement of the instruments. SFAS 107 excludes certain financial instruments and all nonfinancial
F-33
NOTES TO CONSOLIDATED FINANCIAL STATEMENTS
December 31, 2006, 2005 and 2004
instruments from its disclosure requirements. Accordingly, the aggregate fair value amounts presented do not represent the underlying value of the Company. The following methods and assumptions were used by the Company in estimating its fair value disclosures for financial instruments:
Cash and Cash Equivalents
The carrying amounts reported in the balance sheets for cash and cash equivalents approximate the fair value of those assets.
Securities
Fair values for securities are based on quoted market prices, where available. If quoted market prices are not available, fair values are based on quoted market prices of comparable instruments.
Federal Home Loan Bank Stock
The fair value for FHLB stock is its carrying value, since this is the amount for which it could be redeemed. There is no active market for this stock and the Company, in order to be a member of the FHLB, is required to maintain a minimum balance.
Loans Held for Sale
Fair values of mortgage loans held for sale are based on commitments on hand from investors or prevailing market prices.
Loans Receivable
The fair values for fixed rate loans are estimated using discounted cash flow analyses using interest rates currently being offered for loans with similar terms.
Investment in Life Insurance
The carrying value of life insurance approximates fair value because this investment is carried at cash surrender value, as determined by the insurer.
Accrued Interest Receivable and Accrued Interest Payable
The carrying amount of accrued interest are assumed to approximate fair values.
Deposits
The fair values disclosed for deposits with no stated maturity (e.g., interest and non-interest checking, passbook savings, and certain types of money market accounts) are, by definition, equal to the amount payable on demand at the reporting
F-34
NOTES TO CONSOLIDATED FINANCIAL STATEMENTS
December 31, 2006, 2005 and 2004
date (i.e., their carrying amounts). Fair values for deposits with a stated maturity date (time deposits) are estimated using a discounted cash flow calculation that applies interest rates currently being offered on these accounts to a schedule of aggregated expected monthly maturities on time deposits.
Short-term Borrowings and Long-Term Debt
Rates currently available to the Company for borrowings and debt with similar terms and remaining maturities are used to estimate fair value of the existing debt.
Derivative financial instruments
Fair values for interest rate swap agreements are based upon the amounts required to settle the contracts.
Financial Instruments with Off-Balance Sheet Risk
The fair value of financial instruments with off-balance sheet risk discussed in Note O is not material.
The following table reflects the estimated fair values and carrying values at December 31:
| | | | | | | | | | | | |
| | | 2006 | | 2005 |
| | | Carrying
value | | Estimated
fair value | | Carrying
value | | Estimated
fair value |
| | | (Amounts in thousands) |
Financial assets: | | | | | | | | | | | | |
Cash and cash equivalents | | $ | 24,697 | | $ | 24,697 | | $ | 15,255 | | $ | 15,255 |
Securities available for sale | | | 76,700 | | | 76,700 | | | 42,489 | | | 42,489 |
Federal Home Loan Bank stock | | | 3,826 | | | 3,826 | | | 2,569 | | | 2,569 |
Loans held for sale | | | 2,168 | | | 2,168 | | | 1,701 | | | 1,701 |
Loans receivable, net | | | 764,264 | | | 762,543 | | | 493,107 | | | 492,400 |
Accrued interest receivable | | | 4,813 | | | 4,813 | | | 2,784 | | | 2,784 |
Investment in life insurance | | | 19,084 | | | 19,084 | | | 12,319 | | | 12,319 |
| | | | |
Financial liabilities: | | | | | | | | | | | | |
Demand deposits and savings | | $ | 255,556 | | $ | 255,556 | | $ | 167,876 | | $ | 167,876 |
Time deposits | | | 531,221 | | | 532,277 | | | 323,016 | | | 321,315 |
Short-term borrowings | | | 4,673 | | | 4,673 | | | 7,061 | | | 7,061 |
Long-term debt | | | 81,713 | | | 81,867 | | | 59,496 | | | 60,029 |
Accrued interest payable | | | 2,502 | | | 2,502 | | | 1,156 | | | 1,156 |
| | | | |
On-balance sheet derivative financial instruments: | | | | | | | | | | | | |
Interest rate swap agreement: | | | | | | | | | | | | |
Liabilities | | $ | 235 | | $ | 235 | | $ | 15 | | $ | 15 |
F-35
NOTES TO CONSOLIDATED FINANCIAL STATEMENTS
December 31, 2006, 2005 and 2004
NOTE Q - PARENT COMPANY FINANCIAL DATA
Following are condensed financial statements of BNC Bancorp as of and for the years ended December 31, 2006 and 2005 (In thousands):
Condensed Statements of Financial Condition
December 31, 2006 and 2005
| | | | | | |
| | | 2006 | | 2005 |
Assets | | | | | | |
Cash | | $ | 128 | | $ | 22 |
Investment in subsidiaries | | | 95,983 | | | 50,212 |
Other assets | | | 294 | | | 304 |
| | | | | | |
Total assets | | $ | 96,405 | | $ | 50,538 |
| | | | | | |
| | |
Liabilities and Shareholders’ Equity | | | | | | |
Liabilities: | | | | | | |
Other liabilities | | $ | 169 | | $ | 928 |
Subordinated debentures | | | 23,713 | | | 16,496 |
| | | | | | |
Total liabilities | | | 23,882 | | | 17,424 |
| | | | | | |
| | |
Shareholders’ equity: | | | | | | |
Common stock | | | 53,086 | | | 19,448 |
Retained earnings | | | 18,595 | | | 13,155 |
Accumulated other comprehensive income | | | 842 | | | 511 |
| | | | | | |
| | | 72,523 | | | 33,114 |
| | | | | | |
Total liabilities and shareholders’ equity | | $ | 96,405 | | $ | 50,538 |
| | | | | | |
Condensed Statements of Operations
Years ended December 31, 2006, 2005 and 2004
| | | | | | | | | | | | |
| | | 2006 | | | 2005 | | | 2004 | |
Dividends from bank subsidiary | | $ | 6,780 | | | $ | 1,568 | | | $ | 3,549 | |
Equity in undistributed earnings of bank subsidiary | | | 896 | | | | 3,987 | | | | 809 | |
Interest expense | | | (1,463 | ) | | | (1,050 | ) | | | (531 | ) |
Non-interest expense | | | (43 | ) | | | — | | | | (22 | ) |
Income tax benefit | | | — | | | | — | | | | — | |
| | | | | | | | | | | | |
Net income | | $ | 6,170 | | | $ | 4,505 | | | $ | 3,805 | |
| | | | | | | | | | | | |
F-36
NOTES TO CONSOLIDATED FINANCIAL STATEMENTS
December 31, 2006, 2005 and 2004
Condensed Statements of Cash Flows
Years ended December 31, 2006, 2005 and 2004
| | | | | | | | | | | | |
| | | 2006 | | | 2005 | | | 2004 | |
Operating activities: | | | | | | | | | | | | |
Net income | | $ | 6,170 | | | $ | 4,505 | | | $ | 3,805 | |
Adjustments to reconcile net income to net cash provided by operating activities: | | | | | | | | | | | | |
Equity in undistributed earnings of bank subsidiary | | | (896 | ) | | | (3,987 | ) | | | (809 | ) |
Amortization | | | 12 | | | | 11 | | | | (4 | ) |
Stock-based compensation | | | 114 | | | | — | | | | — | |
Increase in other assets | | | (2 | ) | | | (8 | ) | | | — | |
Increase in other liabilities | | | 87 | | | | 47 | | | | 168 | |
| | | | | | | | | | | | |
Net cash provided by operating activities | | | 5,485 | | | | 568 | | | | 3,160 | |
| | | | | | | | | | | | |
Investing activities: | | | | | | | | | | | | |
Investment in subsidiaries | | | (7,173 | ) | | | (36 | ) | | | (11,341 | ) |
Consideration used in business combination | | | (3,810 | ) | | | — | | | | — | |
| | | | | | | | | | | | |
Net cash used by investing activities | | | (10,983 | ) | | | (36 | ) | | | (11,341 | ) |
| | | | | | | | | | | | |
Financing activities: | | | | | | | | | | | | |
Due (from) to subsidiaries | | | (846 | ) | | | 715 | | | | (1,800 | ) |
Debt issuance costs | | | — | | | | — | | | | (145 | ) |
Proceeds from subordinated debentures | | | 7,217 | | | | — | | | | 11,341 | |
Proceeds from exercise of stock options | | | 105 | | | | 58 | | | | 38 | |
Tax benefit from exercise of stock options | | | 83 | | | | — | | | | — | |
Purchase and retirement of common stock | | | (225 | ) | | | (697 | ) | | | (752 | ) |
Cash dividends paid | | | (730 | ) | | | (578 | ) | | | (501 | ) |
Cash paid in lieu of fractional shares | | | — | | | | (8 | ) | | | — | |
| | | | | | | | | | | | |
Net cash provided (used) by financing activities | | | 5,604 | | | | (510 | ) | | | 8,181 | |
| | | | | | | | | | | | |
Net increase in cash and cash equivalents | | | 106 | | | | 22 | | | | — | |
| | | |
Cash and cash equivalents, beginning | | | 22 | | | | — | | | | — | |
| | | | | | | | | | | | |
Cash and cash equivalents, ending | | $ | 128 | | | $ | 22 | | | $ | — | |
| | | | | | | | | | | | |
F-37
| ITEM 9. | CHANGES IN AND DISAGREEMENTS WITH ACCOUNTANTS ON ACCOUNTING AND FINANCIAL DISCLOSURE. |
None.
| ITEM 9A. | CONTROLS AND PROCEDURES. |
The Company’s management, under the supervision and with the participation of the Chief Executive Officer and the Chief Financial Officer of the Company (its principal executive officer and principal financial officer, respectively) have concluded based on their evaluation as of the end of the period covered by this Report, that the Company’s disclosure controls and procedures are effective to ensure that information required to be disclosed by the Company in the reports filed or submitted by it under the Securities Exchange Act of 1934, as amended, is recorded, processed, summarized and reported within the time periods specified in the applicable rules and forms, and include controls and procedures designed to ensure that information required to be disclosed by the Company in such reports is accumulated and communicated to the Company’s management, including the Chief Executive Officer and the Chief Financial Officer of the Company, as appropriate to allow timely decisions regarding required disclosure.
There have been no significant changes in internal control over financial reporting during the fourth quarter that have materially affected, or are reasonably likely to materially affect, the Company’s internal control over financial reporting.
| ITEM 9B. | OTHER INFORMATION |
None.
PART III
| Item 10. | Directors and Executive Officers of the Registrant. |
Directors and Executive Officers.The information concerning the Company’s directors and executive officers required by this Item 10 is incorporated herein by reference from the Company’s definitive proxy statement for the 2007 Annual Meeting of Shareholders, a copy of which will be filed with the SEC not later than 120 days after the end of the Company’s fiscal year.
Section 16(a) Beneficial Ownership Reporting Compliance.The information concerning compliance with the reporting requirements of Section 16(a) of the Exchange Act by our directors, officers, and ten percent shareholders required by this Item 10 is incorporated by reference from the Company’s definitive proxy statement, a copy of which will be filed with the SEC not later than 120 days after the end of the Company’s fiscal year.
Code of Ethics. The Company has adopted a Code of Business Conduct and Ethics that is applicable to all of its directors, officers and employees, including its principal executive and senior financial officers, as required by Section 406 of the Sarbanes-Oxley Act of 2002 and applicable SEC rules. A copy of the Company’s Code of Business conduct and Ethics adopted by the Company’s Board of Directors is attached as Exhibit 14.
In the event that the Company makes any amendment to, or grants any waivers of, a provision of its Code of Business Conduct and Ethics that applies to the principal executive officer or senior financial officer that requires disclosure under applicable SEC rules, the Company intends to disclose such amendment or waiver by filing a Form 8-K with the SEC.
| ITEM 11. | EXECUTIVE COMPENSATION. |
The information concerning compensation and other matters required by this Item 11 is incorporated herein by reference from the Company’s definitive proxy statement for the 2007 Annual Meeting of Shareholders, a copy of which will be filed with the SEC not later than 120 days after the end of the Company’s fiscal year.
52
| ITEM 12. | SECURITY OWNERSHIP OF CERTAIN BENEFICIAL OWNERS AND MANAGEMENT AND RELATED STOCKHOLDER MATTERS. |
The information concerning security ownership of certain beneficial owners and management required by the Item 12 is incorporated herein by reference from the Company’s definitive proxy statement for the 2007 Annual Meeting of Shareholders, a copy of which will be filed with the SEC not later than 120 days after the end of the Company’s fiscal year.
Securities Authorized for Issuance Under Equity Compensation Plans
The following table presents as of December 31, 2005, the number of securities so be issued upon the exercise of outstanding options, the weighted average price of the outstanding options and the number of securities remaining for further issuance under the plans. The Bank of North Carolina Stock Option Plans for Non-Employees/Directors and Key Employees and the Omnibus Stock Ownership and Long Term Incentive Plan have been approved by the shareholders.
| | | | | | | |
Plan category | | (a) Number of shares to be issued upon
exercise of outstanding options | | (b) Weighted-average exercise price of outstanding options | | (c) Number of shares remaining available for future issuance under
equity compensation plans (excluding shares reflected in column (a)) |
Equity compensation plans Approved by our stockholders | | 524,980 | | $ | 7.05 | | 69,820 |
| | | |
Equity compensation plans not Approved by our stockholders | | 0 | | | 0 | | 0 |
| | | |
Total | | 524,980 | | $ | 7.05 | | 69,820 |
| 1 | Of the 524,980 stock options issued under the Plans, a total of 433,885 of those stock options have vested or are exercisable within 60 days. |
| ITEM 13. | CERTAIN RELATIONSHIPS AND RELATED TRANSACTIONS WITH MANAGEMENT |
The information concerning certain relationships and related transactions and director independence required by this Item 13 is incorporated herein by reference from the Company’s definitive proxy statement for the 2007 Annual Meeting of Shareholders, a copy of which will be filed with the SEC not later than 120 days after the end of the Company’s fiscal year.
| ITEM 14. | PRINCIPAL ACCOUNTANT FEES AND SERVICES |
The information concerning principal accounting fees and services required by this Item 14 is incorporated herein by reference from the Company’s definitive proxy statement for the 2007 Annual Meeting of Shareholders, a copy of which will be filed with the SEC not later than 120 days after the end of the Company’s fiscal year.
| ITEM 15. | EXHIBITS, FINANCIAL STATEMENT SCHEDULES. |
(a)(1) Financial Statements. The following financial statements and supplementary data are included in Item 8 of this
Form 10-K.
(a)(2) NA
(a)(3) See Exhibits 10(i)(a) through 10(vii)(d) below.
15(b) Exhibits
Exhibit (3)(i) Articles of Incorporation, incorporated herein by reference to Exhibit (3)(i) to the Form 8-K—Rule 12g-3,
filed with the SEC on December 17, 2002.
53
Exhibit (3)(ii) Bylaws, incorporated herein by reference to Exhibit (3)(ii) to the Form 8-K - Rule 12g-3, filed with the SEC on December 17, 2002.
Exhibit (4) Form of Stock Certificate, incorporated herein by reference to the Form 8-K - Rule 12g-3, filed with the SEC on December 17, 2002.
Exhibit (10)(i)(a) Employment Agreement dated as of December 31, 2005 among the Company, the Bank and W. Swope Montgomery, Jr., incorporated herein by reference to Exhibit 10(i)(a) to the Form 8-K filed with the SEC on January 4, 2005.
Exhibit (10)(i)(b) Employment Agreement dated as of December 31, 2005 among the Company, the Bank and Richard D. Callicutt, II, incorporated herein by reference to Exhibit 10(i)(b) to the Form 8-K filed with the SEC on January 4, 2005.
Exhibit (10)(i)(c) Employment Agreement dated as of December 31, 2005 among the Company, the Bank and David B. Spencer, incorporated herein by reference to Exhibit 10(i)(c) to the Form 8-K filed with the SEC on January 4, 2005.
Exhibit (10)(i)(d) Employment Agreement dated as of July 21, 2006 among BNC Bancorp, Bank of North Carolina and Ralph N. Strayhorn III, incorporated herein by reference to Exhibit (10)(i)(d) to the Form 8-K filed with the SEC on July 21, 2006.
Exhibit (10)(ii)(a) Salary Continuation Agreement dated as of December 31, 2005 between the Bank and W. Swope Montgomery, Jr., incorporated herein by reference to Exhibit 10(ii)(a) to the Form 8-K filed with the SEC on January 4, 2005.
Exhibit (10)(ii)(b) Salary Continuation Agreement dated as of December 31, 2005 between the Bank and Richard D. Callicutt, II, incorporated herein by reference to Exhibit 10(ii)(b) to the Form 8-K filed with the SEC on January 4, 2005.
Exhibit (10)(ii)(c) Salary Continuation Agreement dated as of December 31, 2005 between the Bank and David B. Spencer, incorporated herein by reference to Exhibit 10(ii)(c) to the Form 8-K filed with the SEC on January 4, 2005.
Exhibit(10)(ii)(d) Salary Continuation Agreement dated as of July 21, 2006 between Bank of North Carolina and Ralph N. Strayhorn III(10)(ii)(d), incorporated herein by reference to Exhibit (10)(i)(d) to the Form 8-K filed with the SEC on July 21, 2006.
Exhibit (10)(iii) Bank of North Carolina Stock Option Plan for Directors, incorporated by reference to Exhibit 10(iii) to the Form F-1, filed with the FDIC on June 1, 1992.
Exhibit (10)(iv) Bank of North Carolina Stock Option Plan for Key Employees, incorporated by reference to Exhibit 10(iv) of the Form F-1, filed with the FDIC on June 1, 1992.
Exhibit (10)(v) Directors Deferred Compensation Plan, incorporated by reference to Exhibit 10(v) of the Form F-2 filed with the FDIC.
Exhibit (10)(vi)(a) Endorsement Split Dollar Agreement dated December 31, 2005 between the Bank and W. Swope Montgomery, Jr., incorporated herein by reference to Exhibit (10)(vi)(a) to the Form 8-K filed with the SEC on January 4, 2005.
Exhibit (10)(vi)(b) Endorsement Split Dollar Agreement dated December 31, 2005 between the Bank and Richard D. Callicutt II, incorporated herein by reference to Exhibit (10)(vi)(b) to the Form 8-K filed with the SEC on January 4, 2005.
Exhibit (10)(vi)(c) Endorsement Split Dollar Agreement dated December 31, 2005 between the Bank and David B. Spencer, incorporated herein by reference to Exhibit (10)(vi)(c) to the Form 8-K filed with the SEC on January 4, 2005.
54
Exhibit (10)(vi)(d) Endorsement Split Dollar Agreement dated as of July 21, 2006 between Bank of North Carolina and Ralph N. Strayhorn III, incorporated herein by reference to Exhibit (10)(vi)(d) to the Form 8-K filed with the SEC on July 21, 2006.
Exhibit (10)(vii) BNC Bancorp Omnibus Stock Ownership and Long Term Incentive Plan incorporated herein by reference to Exhibit (10)(vii) of Form 10-K filed with the SEC on March 31, 2005.
Exhibit (10)(vii)(d) Restricted Stock Grant Agreement dated July 21, 2006 among BNC Bancorp, Bank of North Carolina and Ralph N. Strayhorn III, incorporated herein by reference to Exhibit (10)(vii)(d) to the Form 8-K filed with the SEC on July 21, 2006.
Exhibit (11) Statement Re: Computation of Per Share Earnings (included herein on Page F-10)
Exhibit (14) Code of Ethics
Exhibit (23i) Consent of Cherry Bekaert & Holland LLP
Exhibit (23ii) Consent of Dixon Hughes PLLC
Exhibit (31)(i) Rule 13a-14(a)\15d-14(a) Certifications.
Exhibit 31(ii) Rule 13a-14(a)\15d-14(a) Certifications.
Exhibit (32) Section 1350 Certification.
55
SIGNATURES
Pursuant to the requirements of Section 13 of the Securities Exchange Act of 1934, the registrant has duly caused this report to be signed on its behalf by the undersigned, thereunto duly authorized.
| | | | | | |
| | | | | BNC BANCORP |
| | | |
| | | | By: | | /s/ W. Swope Montgomery, Jr. |
| | | | | | W. Swope Montgomery, Jr. |
Date: March 30, 2007 | | | | President and Chief Executive Officer |
Pursuant to the requirements of the Securities Exchange Act of 1934, this report has been signed below by the following persons on behalf of the Bank and in the capacities and on the dates indicated:
| | | | | | | | |
Signature | | | | Title | | | | Date |
/s/ W. Swope Montgomery, Jr. W. Swope Montgomery, Jr. | | | | President, Chief Executive Officer and Director | | | | March 30, 2007 |
| | | | |
/s/ David B. Spencer David B. Spencer | | | | Executive Vice President, and Chief Financial Officer | | | | March 30, 2007 |
| | | | |
/s/ Richard D. Callicutt, II Richard D. Callicutt, II | | | | Executive Vice President, Chief Operating Officer, and Director | | | | March 30, 2007 |
| | | | |
/s/ Ralph N. Strayhorn, III Ralph N. Strayhorn, III | | | | Executive Vice President, Chief Administrative Officer, and Director | | | | March 30, 2007 |
| | | | |
/s/ Lenin J. Peters, M.D. | | | | Director | | | | March 30, 2007 |
| Lenin J. Peters, M.D. | | | | | | | | |
| | | | |
/s/ Thomas R. Smith, CPA | | | | Director | | | | March 30, 2007 |
| Thomas R. Smith, CPA | | | | | | | | |
| | | | |
/s/ Colon E. Starrett | | | | Director | | | | March 30, 2007 |
| Colon E. Starrett | | | | | | | | |
| | | | |
/s/ W. Groome Fulton, Jr. | | | | Director | | | | March 30, 2007 |
| W. Groome Fulton, Jr. | | | | | | | | |
| | | | |
/s/ Larry L. Callahan | | | | Director | | | | March 30, 2007 |
| Larry L. Callahan | | | | | | | | |
| | | | |
/s/ Joseph M. Coltrane, Jr. | | | | Director | | | | March 30, 2007 |
| Joseph M. Coltrane, Jr. | | | | | | | | |
| | | | |
/s/ Charles T. Hagan, III | | | | Director | | | | March 30, 2007 |
| Charles T. Hagan, III | | | | | | | | |
| | | | |
/s/ Randall R. Kaplan | | | | Director | | | | March 30, 2007 |
| Randall R. Kaplan | | | | | | | | |
| | | | |
/s/ Thomas R. Sloan | | | | Director | | | | March 30, 2007 |
| Thomas R. Sloan | | | | | | | | |
| | | | |
/s/ Robert A. Team | | | | Director | | | | March 30, 2007 |
| Robert A. Team | | | | | | | | |
56
| | | | | | | | | | | | |
| | | | | | |
/s/ D. Vann Williford | | | | | | Director | | | | | | March 30, 2007 |
D. Vann Williford | | | | | | | | | | | | |
| | | | | | |
/s/ Richard F. Wood | | | | | | Director | | | | | | March 30, 2007 |
Richard F. Wood | | | | | | | | | | | | |
57