UNITED STATES
SECURITIES AND EXCHANGE COMMISSION
Washington, D.C. 20549
FORM 10-K
ANNUAL REPORT PURSUANT TO SECTION 13 OR 15(d)
OF THE SECURITIES EXCHANGE ACT OF 1934
For the fiscal year endedDecember 31, 2008
Commission File Number: 000-50128
BNC BANCORP
(Exact name of registrant as specified in its charter)
| | |
| North Carolina | | 47-0898685 |
(State or Other Jurisdiction of Incorporation or Organization) | | (I.R.S. Employer Identification No.) |
| |
831 Julian Avenue Thomasville, North Carolina | | 27360 |
| (Address of Principal Executive Offices) | | (Zip Code) |
(336) 476-9200
(Registrant’s telephone number, including area code)
Securities Registered Pursuant to Section 12(b) of the Act: None
| | | | |
| | Securities Registered Pursuant to Section 12(g) of the Act: | | Common stock, no par value |
| | | | (Title of Class) |
Indicate by check mark if the registrant is a well-known seasoned issuer, as defined in Rule 405 of the Securities Act. Yes ¨ No x
Indicate by check mark if the registrant is not required to file reports pursuant to Section 13 or Section 15(d) of the Act. Yes ¨ No x
Indicate by check mark whether the registrant (1) has filed all reports required to be filed by Section 13 or 15(d) of the Securities Exchange Act of 1934 during the preceding 12 months (or for such shorter period that the registrant was required to file such reports), and (2) has been subject to such filing requirements for the past 90 days. Yes x No ¨
Indicate by check mark if disclosure of delinquent filers pursuant to Item 405 of Regulation S-K is not contained herein, and will not be contained, to the best of registrant’s knowledge, in definitive proxy or information statements incorporated by reference in Part III of this Form 10-K or any amendment to this Form 10-K. x
Indicate by check mark whether the registrant is a large accelerated filer, an accelerated filer, a non-accelerated file, or a smaller reporting company (as defined in Rule 12b-2 of the Exchange Act).
| | | | | | |
| Large Accelerated filer | | ¨ | | Accelerated filer | | x |
| | | |
| Non-Accelerated filer | | ¨ | | Smaller Reporting Company | | ¨ |
Indicate by check mark whether the Registrant is a shell company (as defined in Rule 12b-2 of the Exchange Act). Yes ¨ No x
$84,480,444
(Aggregate value of voting and non-voting common equity held by non-affiliates of the registrant based
on the price at which the registrant’s common stock, no par value per share was sold on June 30, 2008)
State the number of shares outstanding of each of the issuer’s classes of common equity, as of the latest practicable date. 7,354,567 shares of common stock, no par value, as of March 6, 2009.
DOCUMENTS INCORPORATED BY REFERENCE
Portions of the Annual Report to stockholders of BNC Bancorp for the year ended December 31, 2008 (“2008 Annual Report”), are incorporated by reference into Part II.
Portions of the Proxy Statement for the 2009 Annual Meeting of Stockholders of BNC Bancorp to be held on May 19, 2009, are incorporated by reference into Part III.
2
PART I
General
BNC Bancorp (the “Company” or “we” or “our”) was formed in 2002 to serve as a one-bank holding company for Bank of North Carolina (the “Bank” or “we” or “our”). The Company is registered with the Board of Governors of the Federal Reserve System (the “Federal Reserve”) under the Bank Holding Company Act of 1956, as amended (the “BHCA”) and the bank holding company laws of North Carolina. The Company’s administrative office is located at 1226 Eastchester Drive, High Point, North Carolina 27265 and the Bank’s main office is located at 831 Julian Avenue, Thomasville, North Carolina 27360. The Company’s only business at this time is owning the Bank and its primary source of income is any dividends that are declared and paid by the Bank on its capital stock.
The Bank is a full service commercial bank that was incorporated under the laws of the State of North Carolina on November 15, 1991, and opened for business on December 3, 1991. The Bank concentrates its marketing and banking efforts to serve the citizens and business interests of the cities and communities located in Davidson, Randolph, Rowan, Forsyth, Guilford, Iredell and Cabarrus Counties. The Bank conducts its business in Davidson County from its banking headquarters located in Thomasville, North Carolina, an additional branch in Thomasville, a branch in Lexington and another in Northern Davidson County. In Randolph County, the Bank has one location in the Archdale-Trinity community; in Forsyth County, the Bank has one location in Kernersville and one location in Winston Salem; in Guilford County, the Bank has three locations in Greensboro, one location in Oak Ridge and two locations in High Point; in Cabarrus County, the Bank has one office in Harrisburg; in Rowan County, the Bank has one office in Salisbury; and in Iredell County, the Bank has a limited service office in Mooresville.
The Bank operates under the rules and regulations of and is subject to examination by the Federal Deposit Insurance Corporation (“FDIC”) and the North Carolina Commissioner of Banks, North Carolina Department of Commerce (the “Commissioner”). The Bank is also subject to certain regulations of the Federal Reserve governing the reserves to be maintained against deposits and other matters.
The Bank provides a wide range of banking services tailored to the particular banking needs of the communities it serves. It is principally engaged in the business of attracting deposits from the general public and using such deposits, together with other funding from the Bank’s lines of credit, to make primarily consumer and commercial loans. The Bank has pursued a strategy that emphasizes its local affiliations. This business strategy stresses the provision of high quality banking services to individuals and small to medium-sized local businesses. Specifically, the Bank makes business loans secured by real estate, personal property and accounts receivable; unsecured business loans; consumer loans, which are secured by consumer products, such as automobiles and boats; unsecured consumer loans; commercial real estate loans; and other loans. The Bank also offers a wide range of banking services, including checking and savings accounts, commercial, installment and personal loans, safe deposit boxes, and other associated services.
Lending involves credit risk. Credit risk is controlled and monitored through active asset quality management including the use of lending standards, thorough review of potential borrowers, and active asset quality administration. Credit risk management is discussed under See Item 7. Management’s Discussion and Analysis of Financial Condition and Results of Operations, Sections “Credit Quality”, “Trends”, “Asset Liability Management”, “Lending Activities”, “Asset Quality”, “Nonperforming Assets” and “Analysis of Allowance for Loan Losses”. Also see Item 1A, “Risk Factors.”
Deposits are the primary source of the Bank’s funds for lending and other investment purposes. The Bank attracts both short-term and long-term deposits from the general public locally and out-of-state by offering a variety of accounts and rates. The Bank offers statement savings accounts, negotiable order of withdrawal accounts, money market demand accounts, noninterest-bearing accounts, and fixed interest rate certificates with varying maturities.
Deposit flows are greatly influenced by economic conditions, the general level of interest rates, competition, and other factors. The Bank’s deposits are obtained both from its primary market area and through wholesale sources throughout the United States. The Bank uses traditional marketing methods to attract new customers and savings deposits, including print media advertising and direct mailings.
3
The Company’s primary sources of revenue are interest and fee income from its lending activities, primarily consisting of making business loans for small to medium-sized businesses, and, to a lesser extent, from its investment portfolio. In prior years investments have not been a primary source of income for the Company. However, as discussed in Management’s Discussion and Analysis, in November and December of 2008 the company purchased $265 million in mortgage backed securities and $50 million of Company qualified municipal government securities. Since these transactions occurred in late 2008 they did not greatly impact 2008 revenues. We do, however, anticipate that these investments will provide a much greater percentage of total revenues going forward. The major expenses of the Company are interest paid on deposits and borrowings and general administrative expenses such as salaries, employee benefits, advertising and office occupancy.
The Bank has experienced steady growth over its seventeen-year history. The Company’s assets totaled $1.57 billion and $1.13 billion as of December 31, 2008 and 2007, respectively. Net income for the fiscal year ended December 31, 2008 was $3.99 million, or $0.52 per diluted share, compared with $7.44 million, or $1.05 per diluted share, for the fiscal year ended December 31, 2007.
Because the Bank is the sole banking subsidiary of the Company, the Company’s operations are located at the Bank level. Throughout this Annual Report, results of operations will relate to the Bank’s operations, unless a specific reference is made to the Company and its operating results other than through the Bank’s business and activities.
Competition and Market Area
We face substantial competition in all areas of our operations from a variety of different competitors, many of which are larger and may have more financial resources. Such competitors primarily include national, regional, and internet banks within the various markets in which we operate. We also face competition from many other types of financial institutions, including, without limitation, savings and loans, credit unions, finance companies, brokerage firms, insurance companies, and other financial intermediaries. The financial services industry could become even more competitive as a result of legislative, regulatory, and technological changes and continued consolidation. Banks, securities firms, and insurance companies can merge under the umbrella of a financial holding company, which can offer virtually any type of financial service, including banking, securities underwriting, insurance (both agency and underwriting), and merchant banking. Also, technology has lowered barriers to entry and made it possible for nonbanks to offer products and services traditionally provided by banks, such as automatic transfer and automatic payment systems. Many of our competitors have fewer regulatory constraints and may have lower cost structures. Additionally, due to their size, many competitors may be able to achieve economies of scale and, as a result, may offer a broader range of products and services as well as better pricing for those products and services than we can.
Davidson, Randolph, Guilford, Rowan, Cabarrus, Iredell and Forsyth Counties are located along the I-85/I-40 corridor in the region known as the Piedmont Triad. Lexington, High Point, Archdale and Thomasville’s traditional economic base includes furniture and textile manufacturing, which have been particularly economically depressed; Greensboro’s base is much more service oriented. Large area employers in the counties of Forsyth, Davidson and Guilford include Dell Corporation, High Point Regional Medical Center, Moses Cone Health System, Forsyth Medical Center (Novant Health), Wake Forest University Medical System, American Express, RF Micro Devices, and Thomas Built Buses. Oak Ridge is primarily rural with the economic base consisting of farming and small business. Kernersville’s economic base consists primarily of small businesses. Large employers in Kernersville include Sara Lee Sock Co., and Deere Hitachi.
Rowan and Cabarrus Counties are located in the growing Piedmont region of North Carolina between the Charlotte metro market and the High Point and Thomasville markets. Rowan and Cabarrus Counties offers a premier location for warehouses, manufacturing and distribution facilities because the largest consolidated rail system in the country is centered in the region. Rowan County is home to over 45 freight companies. Cabarrus County is the home to Lowes Motor Speedway, and numerous NASCAR related suppliers and team headquarters.
Employees
At December 31, 2008, the Bank had 211 full-time and 11 part-time employees.
4
Subsidiaries
The Company is a one-bank holding company for Bank of North Carolina. In addition, the Company has wholly owned subsidiaries to issue trust preferred securities: BNC Bancorp Capital Trust I, BNC Bancorp Capital Trust II, BNC Bancorp Capital Trust III and BNC Bancorp Capital Trust IV. The Bank has three subsidiaries that operate in the mortgage and real estate areas. These long term obligations, which qualify as Tier I capital for the Company, constitute a full and unconditional guarantee by the Company of the trusts’ obligations under the preferred securities.
The Bank has three subsidiaries: BNC Credit Corp. serves as the Bank’s trustee on deeds of trust and Sterling Real Estate Holdings, LLC and Sterling Real Estate Development of North Carolina, LLC hold and dispose of the Bank’s real estate owned.
Supervision and Regulation
Bank holding companies and state commercial banks are extensively regulated under both federal and state law. The following is a brief summary of certain statutes and rules and regulations that affect or will affect the Company and the Bank. This summary is qualified in its entirety by reference to the particular statute and regulatory provisions referred to below and is not intended to be an exhaustive description of the statutes or regulations applicable to the business of the Company and the Bank. Supervision, regulation and examination of the Company and the Bank by the regulatory agencies are intended primarily for the protection of depositors rather than shareholders of the Company. The Company cannot predict whether or in what form any proposed statute or regulation will be adopted or the extent to which the business of the Company and the Bank may be affected by a statute or regulation.
General. There are a number of obligations and restrictions imposed on bank holding companies and their depository institution subsidiaries by law and regulatory policy that are designed to minimize potential loss to the depositors of such depository institutions and the FDIC insurance funds in the event the depository institution becomes in danger of default or in default. For example, to avoid receivership of an insured depository institution subsidiary, a bank holding company is required to guarantee the compliance of any insured depository institution subsidiary that may become “undercapitalized” with the terms of any capital restoration plan filed by such subsidiary with its appropriate federal banking agency up to the lesser of (i) an amount equal to 5% of the bank’s total assets at the time the bank became undercapitalized or (ii) the amount which is necessary (or would have been necessary) to bring the bank into compliance with all acceptable capital standards as of the time the bank fails to comply with such capital restoration plan. The Company, as a registered bank holding company, is subject to the regulation of the Federal Reserve. Under a policy of the Federal Reserve with respect to bank holding company operations, a bank holding company is required to serve as a source of financial strength to its subsidiary depository institutions and to commit resources to support such institutions in circumstances where it might not do so absent such policy. The Federal Reserve under the BHCA also has the authority to require a bank holding company to terminate any activity or to relinquish control of a nonbank subsidiary (other than a nonbank subsidiary of a bank) upon the Federal Reserve’s determination that such activity or control constitutes a serious risk to the financial soundness and stability of any bank subsidiary of the bank holding company.
In addition, insured depository institutions under common control are required to reimburse the FDIC for any loss suffered by its deposit insurance funds as a result of the default of a commonly controlled insured depository institution or for any assistance provided by the FDIC to a commonly controlled insured depository institution in danger of default. The FDIC may decline to enforce the cross-guarantee provisions if it determines that a waiver is in the best interest of the deposit insurance funds. The FDIC’s claim for damages is superior to claims of stockholders of the insured depository institution or its holding company but is subordinate to claims of depositors, secured creditors and holders of subordinated debt (other than affiliates) of the commonly controlled insured depository institutions.
As a result of the Company’s ownership of the Bank, the Company is also registered under the bank holding company laws of North Carolina. Accordingly, the Company is also subject to regulation and supervision by the Commissioner.
Emergency Economic Stabilization Act of 2008. On October 3, 2008, President Bush signed into law the Emergency Economic Stabilization Act of 2008 (“EESA”), giving the United States Department of the Treasury (“UST”) authority to take certain actions to restore liquidity and stability to the U.S. banking markets. Based upon its authority in the EESA, a number of programs to implement EESA have been announced. The first program implemented by the UST is the Capital Purchase Program (“CPP”).
5
Pursuant to this program, the UST, on behalf of the US government, will purchase preferred stock, along with warrants to purchase common stock, from certain financial institutions, including bank holding companies, savings and loan holding companies and banks or savings associations not controlled by a holding company. The investment will have a dividend rate of 5% per year, until the fifth anniversary of the UST’s investment and a dividend of 9% thereafter. During the time the UST holds securities issued pursuant to this program, participating financial institutions will be required to comply with certain provisions regarding executive compensation and corporate governance. Participation in this program also imposes certain restrictions upon an institution’s dividends to common shareholders and stock repurchase activities. As described further herein, we elected to participate in the CPP and received $31.3 million pursuant to the program.
Capital Adequacy Guidelines for Holding Companies. The Federal Reserve has adopted capital adequacy guidelines for bank holding companies and banks that are members of the Federal Reserve System and have consolidated assets of $150 million or more. Bank holding companies subject to the Federal Reserve’s capital adequacy guidelines are required to comply with the Federal Reserve’s risk-based capital guidelines. Under these regulations, the minimum ratio of total capital to risk-weighted assets is 8%. At least half of the total capital is required to be “Tier I capital,” principally consisting of common stockholders’ equity, noncumulative perpetual preferred stock, and a limited amount of cumulative perpetual preferred stock, less certain intangible items. The remainder (“Tier II capital”) may consist of a limited amount of subordinated debt, certain hybrid capital instruments and other debt securities, perpetual preferred stock, and the allowance for loan losses, subject to certain restrictions. In addition to the risk-based capital guidelines, the Federal Reserve has adopted a minimum Tier I capital (leverage) ratio, under which a bank holding company must maintain a minimum level of Tier I capital to average total consolidated assets of at least 3% in the case of a bank holding company which has the highest regulatory examination rating and is not contemplating significant growth or expansion. All other bank holding companies are expected to maintain a Tier I capital (leverage) ratio of at least 1% to 2% above the stated minimum. At December 31, 2008, the Company’s Tier I risk-based capital and total risk-based capital were 9.99% and 11.83%, respectively.
Capital Requirements for the Bank. The Bank, as a North Carolina commercial bank, is required to maintain a surplus account equal to 50% or more of its paid-in capital stock. As a North Carolina chartered, FDIC-insured commercial bank which is not a member of the Federal Reserve System, the Bank is also subject to capital requirements imposed by the FDIC. Under the FDIC’s regulations, state nonmember banks that (a) receive the highest rating during the examination process and (b) are not anticipating or experiencing any significant growth, are required to maintain a minimum leverage ratio of 3% of total consolidated assets; all other banks are required to maintain a minimum ratio of 1% or 2% above the stated minimum, with a minimum leverage ratio of not less than 4%. At December 31, 2008, the Bank’s leverage ratio was 8.44%.
Dividend and Repurchase Limitations. The Company must obtain Federal Reserve approval prior to repurchasing common stock in excess of 10% of its net worth during any twelve-month period unless the Company (i) both before and after the redemption satisfies capital requirements for “well capitalized” state member banks; (ii) received a one or two rating in its last examination; and (iii) is not the subject of any unresolved supervisory issues. As long as the UST holds equity in the Company pursuant to the CPP, UST approval is required for the Company to repurchase shares of outstanding common stock.
Although the payment of dividends and repurchase of stock by the Company are subject to certain requirements and limitations of North Carolina corporate law, except as set forth in this paragraph, neither the Commissioner nor the FDIC have promulgated any regulations specifically limiting the right of the Company to pay dividends and repurchase shares. However, the ability of the Company to pay dividends or repurchase shares may be dependent upon the Company’s receipt of dividends from the Bank.
North Carolina commercial banks, such as the Bank, are subject to legal limitations on the amounts of dividends they are permitted to pay. Dividends may be paid by the Bank from undivided profits, which are determined by deducting and charging certain items against actual profits, including any contributions to surplus required by North Carolina law. Also, an insured depository institution, such as the Bank, is prohibited from making capital distributions, including the payment of dividends, if, after making such distribution, the institution would become “undercapitalized” (as such term is defined in the applicable law and regulations).
Under the terms of the CPP, the UST has a preferential right to the payment of cumulative dividends on the CPP Series A preferred stock. No dividends are permitted to be paid to common shareholders unless all accrued and unpaid dividends for all past dividend periods on the CPP preferred stock were fully paid. In the case of the Company, any increase in dividends to common shareholders above $0.05 per share quarterly is subject to the consent of the UST for the first three years of the CPP preferred stock investment.
6
Deposit Insurance. The FDIC maintains the Deposit Insurance Fund (“DIF”) by assessing depository institutions an insurance premium on a quarterly basis. The amount of the assessment is a function of the institution’s risk category and assessment base. An institution’s risk category is determined according to its supervisory ratings and capital levels, and is used to determine the institution’s assessment rate. The assessment rate for the lowest risk category (Risk Category I) is calculated according to a formula, which relies on supervisory ratings and either certain financial ratios or long-term debt ratings. An insured bank’s assessment base is determined by the balance of its insured deposits. This system is risk-based and allows banks to pay lower assessments to the FDIC as their capital level and supervisory ratings improve. By the same token, if these indicators deteriorate, the institution will have to pay higher assessments to the FDIC. At December 31, 2008, the Bank’s risk category assignment required payment of approximately 7.33 basis points per $100 of assessable deposits.
Under the Federal Deposit Insurance Act (“FDIA”), the FDIC Board has the authority to set the annual assessment rate range for the various risk categories within certain regulatory limits. Pursuant to this authority, risk-based assessment rates were uniformly increased 7 cents per $100 of assessable deposits by the FDIC Board in December 2008 for the first quarter of 2009. Under this rule, risk-based rates for the first quarter will range between 12 and 50 basis points (“bp”). This action is part of the Restoration Plan adopted by the FDIC in October 2008 as required by law and is intended to increase the reserve ratio to 1.15% within five years.
DIF-insured institutions pay a Financing Corporation (“FICO”) assessment in order to fund the interest on bonds issued in the 1980s in connection with the failures in the thrift industry. For the fourth quarter of 2008, the FICO assessment is equal to 1.14 basis points for each $100 in domestic deposits. These assessments will continue until the bonds mature in 2019.
The FDIC is authorized to terminate a depository bank’s deposit insurance upon a finding by the FDIC that the bank’s financial condition is unsafe or unsound or that the institution has engaged in unsafe or unsound practices or has violated any applicable rule, regulation, order or condition enacted or imposed by the bank’s regulatory agency. The termination of deposit insurance for our national bank subsidiary would have a material adverse effect on our earnings, operations and financial condition.
FDIC Temporary Liquidity Guarantee Program.On October 14, 2008, the FDIC announced its Temporary Liquidity Guarantee Program (“TLGP”), which is comprised of the Debt Guarantee Program (“DGP”) and the Transaction Account Guarantee Program (“TAGP”).
The TAGP provides unlimited deposit insurance coverage through December 31, 2009, for non-interest bearing transaction accounts and certain interest-bearing accounts (negotiable order of withdrawal (NOW) accounts with interest rates of 0.50% or less and lawyers trust accounts) at FDIC-insured depository institutions. Depository institutions participating in the TAGP will be assessed, on a quarterly basis, an annualized 10 basis points fee on the balance of each covered account in excess of the existing FDIC deposit insurance limit of $250,000 that was established on a temporary basis, through December 31, 2009, by the Emergency Economic Stabilization Act of 2008.
The DGP provides an FDIC guarantee of certain senior unsecured debt of FDIC-insured institutions and their holding companies. The unsecured debt must be issued on or after October 14, 2008 and not later than October 31, 2009, and the guarantee is effective through the earlier of the maturity date or June 30, 2012. The DGP coverage limit is generally 125% of the eligible entity’s eligible debt outstanding on September 30, 2008 and scheduled to mature on or before June 30, 2009 or, for certain insured institutions, 2% of their liabilities as of September 30, 2008. The proceeds of debt guaranteed under the DGP may not be used to prepay debt that is not guaranteed by the FDIC. Depending on the term of the debt maturity, the nonrefundable DGP fee ranges from 50 to 100 basis points (annualized) for covered debt outstanding until the earlier of maturity or June 30, 2012.
The TAGP and DGP are in effect for all eligible entities, unless the entity opted out on or before December 5, 2008. The Company is participating in the TAGP and is eligible to participate in the DGP although the Company has not chosen to issue any debt under the program at this time.
Federal Home Loan Bank System. The FHLB system provides a central credit facility for member institutions. As a member of the FHLB of Atlanta and under the its capital plan, the Bank is required to own capital stock in the FHLB of Atlanta in an amount
7
at least equal to 0.20% (or 20 basis points) of the Bank’s total assets at the end of each calendar year, plus 4.5% of its outstanding advances (borrowings) from the FHLB of Atlanta under the new activity-based stock ownership requirement. On December 31, 2008, the Bank was in compliance with this requirement.
Community Reinvestment.Under the Community Reinvestment Act (“CRA”), as implemented by regulations of the FDIC, an insured institution has a continuing and affirmative obligation consistent with its safe and sound operation to help meet the credit needs of its entire community, including low and moderate income neighborhoods. The CRA does not establish specific lending requirements or programs for financial institutions, nor does it limit an institution’s discretion to develop, consistent with the CRA, the types of products and services that it believes are best suited to its particular community. The CRA requires the federal banking regulators, in connection with their examinations of insured institutions, to assess the institutions’ records of meeting the credit needs of their communities, using the ratings of “outstanding,” “satisfactory,” “needs to improve,” or “substantial noncompliance,” and to take that record into account in its evaluation of certain applications by those institutions. All institutions are required to make public disclosure of their CRA performance ratings. The Bank received a “satisfactory” rating in its last CRA examination which was conducted during February 2008.
Prompt Corrective Action.The FDIC has broad powers to take corrective action to resolve the problems of insured depository institutions. The extent of these powers will depend upon whether the institution in question is “well capitalized,” “adequately capitalized,” “undercapitalized,” “significantly undercapitalized,” or “critically undercapitalized.” Under the regulations, an institution is considered “well capitalized” if it has (i) a total risk-based capital ratio of 10% or greater, (ii) a Tier I risk-based capital ratio of 6% or greater, (iii) a leverage ratio of 5% or greater and (iv) is not subject to any order or written directive to meet and maintain a specific capital level for any capital measure. An “adequately capitalized” institution is defined as one that has (i) a total risk-based capital ratio of 8% or greater, (ii) a Tier I risk-based capital ratio of 4% or greater and (iii) a leverage ratio of 4% or greater (or 3% or greater in the case of an institution with the highest examination rating). An institution is considered (A) “undercapitalized” if it has (i) a total risk-based capital ratio of less than 8%, (ii) a Tier I risk-based capital ratio of less than 4% or (iii) a leverage ratio of less than 4% (or 3% in the case of an institution with the highest examination rating); (B) “significantly undercapitalized” if the institution has (i) a total risk-based capital ratio of less than 6%, or (ii) a Tier I risk-based capital ratio of less than 3% or (iii) a leverage ratio of less than 3% and (C) “critically undercapitalized” if the institution has a ratio of tangible equity to total assets equal to or less than 2%.
Changes in Control. The BHCA prohibits the Company from acquiring direct or indirect control of more than 5% of the outstanding voting stock or substantially all of the assets of any bank or savings bank or merging or consolidating with another bank holding company or savings bank holding company without prior approval of the Federal Reserve. Similarly, Federal Reserve approval (or, in certain cases, non-disapproval) must be obtained prior to any person acquiring control of the Company. Control is conclusively presumed to exist if, among other things, a person acquires more than 25% of any class of voting stock of the Company or controls in any manner the election of a majority of the directors of the Company. Control is presumed to exist if a person acquires more than 10% of any class of voting stock and the stock is registered under Section 12 of the Securities Exchange Act of 1934 as amended (the “Exchange Act”) or the acquiror will be the largest shareholder after the acquisition.
Federal Securities Law. The Company has registered its common stock with the Securities and Exchange Commission (the “SEC”) pursuant to Section 12(g) of the Exchange Act. As a result of such registration, the proxy and tender offer rules, insider trading reporting requirements, annual and periodic reporting and other requirements of the Exchange Act are applicable to the Company.
Transactions with Affiliates.Under current federal law, depository institutions are subject to the restrictions contained in Section 22(h) of the Federal Reserve Act with respect to loans to directors, executive officers and principal shareholders. Under Section 22(h), loans to directors, executive officers and shareholders who own more than 10% of a depository institution (18% in the case of institutions located in an area with less than 30,000 in population), and certain affiliated entities of any of the foregoing, may not exceed, together with all other outstanding loans to such person and affiliated entities, the institution’s loans-to-one-borrower limit (as discussed below). Section 22(h) also prohibits loans above amounts prescribed by the appropriate federal banking agency to directors, executive officers and shareholders who own more than 10% of an institution, and their respective affiliates, unless such loans are approved in advance by a majority of the board of directors of the institution. Any “interested” director may not participate in the voting. The FDIC has prescribed the loan amount (which includes all other outstanding loans to such person), as to which such prior board of director approval is required, as being the greater of $25,000 or 5% of capital and surplus (up to $500,000). Further, pursuant to Section 22(h), the Federal Reserve requires that loans to directors, executive officers, and principal shareholders be made on terms substantially the same as offered in comparable transactions with non-executive employees of the Bank. The FDIC has imposed additional limits on the amount a bank can loan to an executive officer.
8
Loans to One Borrower.The Bank is subject to the Commissioner’s loans to one borrower limits which are substantially the same as those applicable to national banks. Under these limits, no loans and extensions of credit to any borrower outstanding at one time and not fully secured by readily marketable collateral shall exceed 15% of the unimpaired capital and unimpaired surplus of the bank. Loans and extensions of credit fully secured by readily marketable collateral may comprise an additional 10% of unimpaired capital and unimpaired surplus.
Gramm-Leach-Bliley Act.The federal Gramm-Leach-Bliley Act enacted in 1999 (the “GLB Act”) dramatically changed various federal laws governing the banking, securities and insurance industries. The GLB Act has expanded opportunities for banks and bank holding companies to provide services and engage in other revenue-generating activities that previously were prohibited to them. However, this expanded authority also may present us with new challenges as our larger competitors are able to expand their services and products into areas that are not feasible for smaller, community oriented financial institutions. The GLB Act likely will have a significant economic impact on the banking industry and on competitive conditions in the financial services industry generally.
USA Patriot Act of 2001.In 2001, Congress enacted the Uniting and Strengthening America by Providing Appropriate Tools Required to Intercept and Obstruct Terrorism Act (the “Patriot Act”). The Patriot Act is intended to strengthen the ability of U.S. law enforcement and the intelligence community to work cohesively to combat terrorism on a variety of fronts. The potential impact of the Act on financial institutions of all kinds is significant and wide ranging. The Act contains sweeping anti-money laundering and financial transparency laws and requires various regulations, including standards for verifying customer identification at account opening, and rules to promote cooperation among financial institutions, regulators, and law enforcement entities in identifying parties that may be involved in terrorism or money laundering.
Sarbanes-Oxley Act of 2002.The Sarbanes-Oxley Act of 2002 is sweeping federal legislation addressing accounting, corporate governance and disclosure issues. The impact of the Sarbanes-Oxley Act is wide-ranging as it applies to all public companies and imposes significant new requirements for public company governance and disclosure requirements.
In general, the Sarbanes-Oxley Act mandates important new corporate governance and financial reporting requirements intended to enhance the accuracy and transparency of public companies’ reported financial results. It establishes new responsibilities for corporate chief executive officers, chief financial officers and audit committees in the financial reporting process and creates a new regulatory body to oversee auditors of public companies. It backs these requirements with new SEC enforcement tools, increases criminal penalties for federal mail, wire and securities fraud, and creates new criminal penalties for document and record destruction in connection with federal investigations. It also increases the opportunity for more private litigation by lengthening the statute of limitations for securities fraud claims and providing new federal corporate whistleblower protection.
The economic and operational effects of this new legislation on public companies, including us, will be significant in terms of the time, resources and costs associated with complying with the new law. Because the Sarbanes-Oxley Act, for the most part, applies equally to larger and smaller public companies, we will be presented with additional challenges as a smaller, community-oriented financial institution seeking to compete with larger financial institutions in our market.
The Company qualified as an accelerated filer in accordance with Rule 12b-2 of the Securities Exchange Act of 1934, effective December 31, 2007. Therefore, the Company is now subject to the requirements of Section 404 of the Sarbanes-Oxley Act of 2002 (“SOX 404”). The Company incurred additional consulting and audit expenses in becoming compliant with SOX 404, and will continue to incur additional audit expenses to comply with SOX 404 going forward. Management does not expect expenses related to SOX 404 to have a material impact on the Company’s financial statements.
Government Monetary Policies and Economic Controls. Our earnings and growth, as well as the earnings and growth of the banking industry, are affected by the credit policies of monetary authorities, including the Federal Reserve. An important function of the Federal Reserve is to regulate the national supply of bank credit in order to combat recession and curb inflationary pressures. Among the instruments of monetary policy used by the Federal Reserve to implement these objectives are open market operations in U.S. government securities, changes in reserve requirements against member bank deposits, and changes in the Federal Reserve
9
discount rate. These means are used in varying combinations to influence overall growth of bank loans, investments, and deposits, and may also affect interest rates charged on loans or paid for deposits. The monetary policies of the Federal Reserve authorities have had a significant effect on the operating results of commercial banks in the past and are expected to continue to have such an effect in the future.
In view of changing conditions in the national economy and in money markets, as well as the effect of credit policies by monetary and fiscal authorities, including the Federal Reserve, no prediction can be made as to possible future changes in interest rates, deposit levels, and loan demand, or their effect on our business and earnings or on the financial condition of our various customers.
Other.The federal banking agencies, including the FDIC, have developed joint regulations requiring annual examinations of all insured depository institutions by the appropriate federal banking agency, with some exceptions for small, well-capitalized institutions and state chartered institutions examined by state regulators, and establish operational and managerial, asset quality, earnings and stock valuation standards for insured depository institutions, as well as compensation standards when such compensation would endanger the insured depository institution or would constitute an unsafe practice.
In addition, the Bank is subject to various other state and federal laws and regulations, including state usury laws, laws relating to fiduciaries, consumer credit and equal credit, fair credit reporting laws and laws relating to branch banking. The Bank, as an insured North Carolina commercial bank, is prohibited from engaging as a principal in activities that are not permitted for national banks, unless (i) the FDIC determines that the activity would pose no significant risk to the appropriate deposit insurance fund and (ii) the Bank is, and continues to be, in compliance with all applicable capital standards.
Under Chapter 53 of the North Carolina General Statutes, if the capital stock of a North Carolina commercial bank is impaired by losses or otherwise, the Commissioner is authorized to require payment of the deficiency by assessment upon the bank’s shareholders, pro rata, and to the extent necessary, if any such assessment is not paid by any shareholder, upon 30 days notice, to sell as much as is necessary of the stock of such shareholder to make good the deficiency.
The Bank’s operations are concentrated in the Piedmont region of North Carolina along the I-85/I-40 corridor. The Bank’s operations are concentrated in the Piedmont region of North Carolina. As a result of this geographic concentration, our results may correlate to the economic conditions in these areas. Deterioration in economic conditions in any of these market areas, particularly in the industries on which these geographic areas depend, may adversely affect the quality of the Bank’s loan portfolio and the demand for its products and services, and accordingly, the Bank’s results of operations.
The Bank is exposed to risks in connection with the loans it makes. A significant source of risk for the Company and the Bank arises from the possibility that losses will be sustained by the Bank because borrowers, guarantors and related parties may fail to perform in accordance with the terms of their loans. The Bank has underwriting and credit monitoring procedures and credit policies, including the establishment and review of the allowance for loan losses, that it believes are appropriate to minimize this risk by assessing the likelihood of nonperformance, tracking loan performance and diversifying its loan portfolio. Such policies and procedures, however, may not prevent unexpected losses that could adversely affect the Bank’s results of operations.
Changes in economic and political conditions could adversely affect our earnings, as our borrowers’ ability to repay loans and the value of the collateral securing our loans decline. Our success depends, to a certain extent, upon economic and political conditions, local and national, as well as governmental monetary policies. Conditions such as inflation, recession, unemployment, changes in interest rates, money supply and other factors beyond our control may adversely affect our asset quality, deposit levels and loan demand and, therefore, our earnings. Because we have a significant amount of real estate loans, decreases in real estate values could adversely affect the value of property used as collateral. Adverse changes in the economy may also have a negative effect on the ability of our borrowers to make timely repayments of their loans, which could have an adverse impact on our earnings. Consequently, any decline in the economy in our market area could have a material adverse effect on our financial condition and results of operations.
10
Our allowance for loan losses may be insufficient. All borrowers carry the potential to default and our remedies to recover (seizure and/or sale of collateral, legal actions, guarantees, etc.) may not fully satisfy money previously lent. We maintain an allowance for loan losses, which is a reserve established through a provision for loan losses charged to expense, which represents management’s best estimate of probable credit losses that have been incurred within the existing portfolio of loans. The allowance, in the judgment of management, is necessary to reserve for estimated loan losses and risks inherent in the loan portfolio. The level of the allowance for loan losses reflects management’s continuing evaluation of industry concentrations; specific credit risks; loan loss experience; current loan portfolio quality; present economic, political, and regulatory conditions; and unidentified losses inherent in the current loan portfolio. The determination of the appropriate level of the allowance for loan losses inherently involves a high degree of subjectivity and requires us to make significant estimates of current credit risks using existing qualitative and quantitative information, all of which may undergo material changes. Changes in economic conditions affecting borrowers, new information regarding existing loans, identification of additional problem loans, and other factors, both within and outside of our control, may require an increase in the allowance for loan losses. In addition, bank regulatory agencies periodically review our allowance for loan losses and may require an increase in the provision for loan losses or the recognition of additional loan charge offs, based on judgments different than those of management. An increase in the allowance for loan losses results in a decrease in net income, and possibly risk-based capital, and may have a material adverse effect on our financial condition and results of operations.
Loss of key personnel could adversely impact results. The success of the Bank has been and will continue to be greatly influenced by the ability to retain the services of existing senior management. The Bank has benefited from consistency within its senior management team, with its top five executives averaging over 14 years of service with the Bank. The Company has entered into employment contracts with each of these top management officials. Nevertheless, the unexpected loss of the services of any of the key management personnel, or the inability to recruit and retain qualified personnel in the future, could have an adverse impact on the business and financial results of the Bank.
The Company and the Bank compete with much larger companies for some of the same business. The banking and financial services business in the Bank’s market areas continues to be a competitive field and is becoming more competitive as a result of:
| | • | | Changes in regulations; |
| | • | | Changes in technology and product delivery systems; and |
| | • | | The accelerating pace of consolidation among financial services providers. |
The Company and the Bank may not be able to compete effectively in its markets, and its results of operations could be adversely affected by the nature or pace of change in competition. The Bank competes for loans, deposits and customers with various bank and nonbank financial services providers, many of which are much larger in total assets and capitalization, have greater access to capital markets and offer a broader array of financial services.
The Company’s trading volume has been low compared with larger national and regional banks. The Company common stock is traded on the NASDAQ Global Market. However, the trading volume of the Company’s common stock is relatively low when compared with more seasoned companies listed on NASDAQ Global Market, NASDAQ Global Select System, or other consolidated reporting systems or stock exchanges. Thus, the market in the Company’s common stock may be limited in scope relative to other larger companies. In addition, the Company cannot say with any certainty that a more active and liquid trading market for its common stock will develop.
Changes in interest rates affect profitability and assets. Changes in prevailing interest rates may hurt the Bank’s business. The Bank derives its income primarily from the difference or “spread” between the interest earned on loans, securities and other interest-earning assets, and interest paid on deposits, borrowings and other interest-bearing liabilities. In general, the larger the spread, the more the Bank earns. When market rates of interest change, the interest the Bank receives on its assets and the interest the Bank pays on its liabilities will fluctuate. This can cause decreases in the “spread” and can adversely affect the Bank’s income. Changes in market interest rates could reduce the value of the Bank’s financial assets. Fixed-rate investments, mortgage-backed and related securities and mortgage loans generally decrease in value as interest rates rise. In addition, interest rates affect how much money the Bank lends. For example, when interest rates rise, the cost of borrowing increases and the loan originations tend to decrease. If the Bank is unsuccessful in managing the effects of changes in interest rates, the financial condition and results of operations could suffer.
11
Technological advances impact the Company’s business. The banking industry is undergoing technological changes with frequent introductions of new technology-driven products and services. In addition to improving customer services, the effective use of technology increases efficiency and enables financial institutions to reduce costs. The Company’s future success will depend, in part, on our ability to address the needs of the Bank’s customers by using technology to provide products and services that will satisfy customer demands for convenience as well as to create additional efficiencies in operations. Many competitors have substantially greater resources to invest in technological improvements. The Bank may not be able to effectively implement new technology-driven products and services or successfully market such products and services to its customers.
Our stock price can be volatile. Stock price volatility may make it more difficult for you to resell your common stock when you want and at prices you find attractive. Our stock price can fluctuate significantly in response to a variety of factors including, among other things:
| | • | | Actual or anticipated variations in quarterly results of operations. |
| | • | | Recommendations by securities analysts. |
| | • | | Operating results and stock price performance of other companies that investors deem comparable to us. |
| | • | | News reports relating to trends, concerns, and other issues in the financial services industry. |
| | • | | Perceptions in the marketplace regarding us and/or our competitors. |
| | • | | New technology used or services offered by competitors. |
| | • | | Significant acquisitions or business combinations, strategic partnerships, joint ventures, or capital commitments by or involving us or our competitors. |
| | • | | Changes in government regulations. |
General market fluctuations, industry factors, and general economic and political conditions and events, such as economic slowdowns or recessions, interest rate changes, or credit loss trends, could also cause our stock price to decrease regardless of operating results.
Government regulations may prevent or impair the Company’s ability to pay dividends, engage in mergers or operate in other ways. Current and future legislation and the policies established by federal and state regulatory authorities will affect our operations. The Bank is subject to supervision and periodic examination by the FDIC and the North Carolina State Commissioner of Banks (the “Commissioner”). The Company is subject to regulation by the Federal Reserve and the Commissioner. Banking regulations, designed primarily for the protection of depositors, may limit the growth and the return to the Company’s shareholders by restricting certain activities, such as:
| | • | | The payment of dividends to our shareholders; |
| | • | | Possible mergers with or acquisitions of or by other institutions; |
| | • | | Our desired investments; |
| | • | | Loans and interest rates on loans; |
| | • | | Interest rates paid on our deposits; |
| | • | | The possible expansion of our branch offices; and/or |
| | • | | Our ability to provide securities or trust services. |
The Bank also is subject to capitalization guidelines set forth in federal legislation, and could be subject to enforcement actions to the extent that it is found by regulatory examiners to be undercapitalized. The Company cannot predict what changes, if any, will be made to existing federal and state legislation and regulations or the effect that such changes may have on the Company’s future business and earnings prospects. The cost of compliance with regulatory requirements may adversely affect our ability to operate profitably.
Our agreements with the UST under the CPP impose restrictions and obligations on us that limit our ability to increase dividends, repurchase our common stock or preferred stock and access the equity capital market.In December 2008, we issued preferred stock and a warrant to purchase our common stock to the UST as part of the CPP under the Troubled Asset Relief Program (“TARP”). Prior to December 5, 2011, unless we have redeemed all of the preferred stock or the UST has transferred all of the preferred stock to a third party, the consent of the UST will be required for us to, among other things, increase our common stock dividend or repurchase our common stock or other preferred stock (with certain exceptions, including the repurchase of our common stock to offset share dilution from equity-based employee compensation awards).
12
The cost of compliance with Section 404 of the Sarbanes-Oxley Act of 2002 may negatively impact the Company’s income. The Company is subject to the rules and regulations of the SEC, including those rules and regulations mandated by the Sarbanes-Oxley Act of 2002. Section 404 of the Sarbanes-Oxley Act of requires all reporting companies to include in their annual report a statement of management’s responsibilities for establishing and maintaining adequate internal control over financial reporting, together with an assessment of the effectiveness of those internal controls. Section 404 further requires that the reporting company’s independent auditors attest to, and report on, this management assessment. The Company is now subject to the auditor attestation requirement of Section 404 which increased expenses related to its internal and external auditors.
Negative publicity could damage our reputation.Reputation risk, or the risk to our earnings and capital from negative public opinion, is inherent in our business. Negative public opinion could adversely affect our ability to keep and attract customers and expose us to adverse legal and regulatory consequences. Negative public opinion could result from our actual or alleged conduct in any number of activities, including lending practices, corporate governance, regulatory compliance, mergers and acquisitions, and disclosure, sharing or inadequate protection of customer information, and from actions taken by government regulators and community organizations in response to that conduct.
Financial services companies depend on the accuracy and completeness of information about customers and counterparties. In deciding whether to extend credit or enter into other transactions, we may rely on information furnished by or on behalf of customers and counterparties, including financial statements, credit reports, and other financial information. We may also rely on representations of those customers, counterparties, or other third parties, such as independent auditors, as to the accuracy and completeness of that information. Reliance on inaccurate or misleading financial statements, credit reports, or other financial information could cause us to enter into unfavorable transactions, which could have a material adverse effect on our financial condition and results of operations.
Liquidity is essential to our businesses. Our liquidity could be impaired by an inability to access the capital markets or unforeseen outflows of cash. This situation may arise due to circumstances that we may be unable to control, such as a general market disruption or an operational problem that affects third parties or us. Our credit ratings are important to our liquidity. A reduction in our credit ratings could adversely affect our liquidity and competitive position, increase our borrowing costs, limit our access to the capital markets or trigger unfavorable contractual obligations.
Changes in our accounting policies or in accounting standards could materially affect how we report our financial results and condition. Our accounting policies are fundamental to understanding our financial results and condition. Some of these policies require use of estimates and assumptions that may affect the value of our assets or liabilities and financial results. Some of our accounting policies are critical because they require management to make difficult, subjective and complex judgments about matters that are inherently uncertain and because it is likely that materially different amounts would be reported under different conditions or using different assumptions.
From time to time the Financial Accounting Standards Board (FASB) and the SEC change the financial accounting and reporting standards or the interpretation of those standards that govern the preparation of our external financial statements. These changes are beyond our control, can be hard to predict and could materially impact how we report our results of operations and financial condition. We could be required to apply a new or revised standard retroactively, resulting in our restating prior period financial statements in material amounts.
Our internal controls may be ineffective. Management regularly reviews and updates our internal controls, disclosure controls and procedures, and corporate governance policies and procedures. Any system of controls, however well designed and operated, is based in part on certain assumptions and can provide only reasonable, not absolute, assurances that the objectives of the system are met. Any failure or circumvention of our controls and procedures or failure to comply with regulations related to controls and procedures could have a material adverse effect on our business, results of operations, and financial condition.
Impairment of investment securities, goodwill, other intangible assets, or deferred tax assets could require charges to earnings, which could result in a negative impact on our results of operations. In assessing the impairment of investment securities, management considers the length of time and extent to which the fair value has been less than cost, the financial condition and near-term prospects of the issues, and the intent and ability of the Corporation to retain its investment in the issuer for a period of time
13
sufficient to allow for any anticipated recovery in fair value in the near term. Under current accounting standards, goodwill and certain other intangible assets with indeterminate lives are no longer amortized but, instead, are assessed for impairment periodically or when impairment indicators are present. Assessment of goodwill and such other intangible assets could result in circumstances where the applicable intangible asset is deemed to be impaired for accounting purposes. Under such circumstances, the intangible asset’s impairment would be reflected as a charge to earnings in the period during which such impairment is identified. In assessing the realizability of deferred tax assets, management considers whether it is more likely than not that some portion or all of the deferred tax assets will not be realized. The ultimate realization of deferred tax assets is dependent upon the generation of future taxable income during the periods in which those temporary differences become deductible. The impact of each of these impairment matters could have a material adverse effect on our business, results of operations, and financial condition.
We rely on other companies to provide key components of our business infrastructure. Third party vendors provide key components of our business infrastructure such as internet connections, network access and core application processing. While we have selected these third party vendors carefully, we do not control their actions. Any problems caused by these third parties, including as a result of their not providing us their services for any reason or their performing their services poorly, could adversely affect our ability to deliver products and services to our customers and otherwise to conduct our business. Replacing these third party vendors could also entail significant delay and expense.
Our information systems may experience an interruption or breach in security. We rely heavily on communications and information systems to conduct our business. Any failure, interruption, or breach in security or operational integrity of these systems could result in failures or disruptions in our customer relationship management, general ledger, deposit, loan, and other systems. While we have policies and procedures designed to prevent or limit the effect of the failure, interruption, or security breach of our information systems, we cannot assure you that any such failures, interruptions, or security breaches will not occur or, if they do occur, that they will be adequately addressed. The occurrence of any failures, interruptions, or security breaches of our information systems could damage our reputation, result in a loss of customer business, subject us to additional regulatory scrutiny, or expose us to civil litigation and possible financial liability, any of which could have a material adverse effect on our financial condition and results of operations.
New requirements under EESA and changes in the TARP CPP regulations may adversely affect our operations and financial condition.Given the current international, national and regional economic climate, it is unclear what effect the provisions of the EESA will have with respect to our profitability and operations. In addition, the US government, either through the UST or some other federal agency, may also advance additional programs that could materially impact our profitability and operations.
| ITEM 1B. | UNRESOLVED STAFF COMMENTS |
None.
At December 31, 2008, the Company conducted its business from its headquarters located in High Point, North Carolina, the Banks main office in Thomasville and 15 other branch offices and one limited services office. The following list sets forth certain information regarding the Company’s and Bank’s properties.
Owned properties:
| | |
| Main Office: | | 831 Julian Avenue, Thomasville, NC 27360. |
| |
| Archdale Office: | | 113 Trindale Road, Archdale, NC 27263. |
| |
| Lexington Office: | | 115 East Center Street, Lexington, NC 27292. |
| |
| North Thomasville Office: | | 1317 National Highway, Thomasville, NC 27360. |
| |
| Kernersville Office: | | 211 Broad Street, Kernersville, NC 27284. |
| |
| Oak Ridge Office: | | 8000 Linville Road, Oak Ridge, NC 27310. |
| |
| Elm Street Branch: | | 801 North Elm Street, High Point, NC 27262. |
| |
| Eastchester Branch: | | 2630 Eastchester Dr., High Point, NC 27265. |
| |
| Salisbury Office: | | 415 Jake Alexander Boulevard West, Salisbury, NC 28147. |
| |
| Harrisburg Office: | | 3890 Main Street, Harrisburg, NC 28075. |
| |
| N. Davidson Office: | | 5744 Old US Hwy 52, Lexington, NC 27295. |
14
Leased properties:
| | |
| High Point Administrative Office: | | 1226 Eastchester Drive, High Point, NC 27265. |
| |
| Friendly Center Office: | | 3202 Northline Avenue, Greensboro, NC 27408. |
| |
| Dover Road Office: | | 1110 Dover Road, Greensboro, NC 27408. |
| |
| Elm Street Office: | | 112 N. Elm Street, Greensboro, NC 27404. |
| |
| Winston Salem Office: | | 1551 Westbrook Plaza Drive, Suite 90, Greentree II Building, Winston Salem, NC 27103. |
| |
| Mooresville Limited Service Office: | | 125 Commerce Park Road, Mooresville, NC 28117. |
The total net book value of the Bank’s premises and equipment on December 31, 2008 was $26 million. All properties are considered by the Bank’s management to be in good condition and adequately covered by insurance.
Any property acquired as a result of foreclosure or by deed in lieu of foreclosure is classified as “real estate owned” until it is sold or otherwise disposed of by the Bank to recover its investment. As of December 31, 2008, the Bank had $5.0 million of assets classified as real estate owned.
In the opinion of management, the Company is not involved in any material pending legal proceeding.
| ITEM 4. | SUBMISSION OF MATTERS TO A VOTE OF SECURITY HOLDERS |
No matter was submitted to a vote of the stockholders of the Company during the fourth quarter of the fiscal year ended December 31, 2008.
PART II
| ITEM 5. | MARKET FOR REGISTRANT’S COMMON EQUITY, RELATED STOCK HOLDER MATTERS AND ISSUER PURCHASES OF EQUITY SECURITIES |
The Company’s common stock is listed in the NASDAQ Global Market under the symbol “BNCN”. Scott & Stringfellow, Inc., Morgan Keegan, Sandler O’Neill & Partners, L.P., Raymond James & Associates, Howe Barnes, McKinnon and Company, and Monroe Securities are the market makers in the Company’s stock. Wachovia Securities is not a market maker; however, they do attempt to match-up buyers and sellers through their local offices.
See table 19 for certain market and market and dividend information for the last two fiscal years.
As of December 31, 2008, the Company had approximately 1383 shareholders of record not including persons or entities whose stock is held in nominee or “street” name and by various banks and brokerage firms.
See “ITEM 1. DESCRIPTION OF BUSINESS — Supervision and Regulation” above for regulatory restrictions which limit the ability of the Bank to pay dividends. The Company has paid seven annual cash dividends, with the most recent being a cash dividends of $0.20 per share of common stock on March 10, 2007. In 2008, the Company began paying quarterly dividends, with the last being a cash dividend of $0.05 paid on February 20, 2009.
There were no purchases made by or on behalf of the Company or any “affiliated purchases” (as defined in Rule 10b-18(a)(3) under the Securities Exchange Act of 1934), of the Company’s common stock during the three months ended December 31, 2008.The maximum amount of shares that may be purchased in the stock repurchase program will be limited to 10% of the outstanding common stock. As of December 31, 2008, the maximum of stock able to be purchased by the Company amounted to 735,003 shares, with 232,838 shares repurchased.
The information required to be disclosed under Item 201(d) of Regulation S-K “Securities Authorized for Issuance Under Equity Compensation Plans” is presented in Item 12 of this Form 10-K.
15
On December 5, 2008, we sold 31,260 shares of our Senior Preferred Stock to the UST pursuant to the CPP. While any Senior Preferred Stock is outstanding, we may pay dividends on our common stock, provided that all accrued and unpaid dividends for all past dividend periods on the Senior Preferred Stock are fully paid. Prior to the third anniversary of the UST’s purchase of the Senior Preferred Stock, unless the Senior Preferred Stock has been redeemed or the UST has transferred all of the Senior Preferred Stock to third parties, the consent of the UST will be required for us to increase our common stock dividend from its current quarterly amount of $0.05 per share.
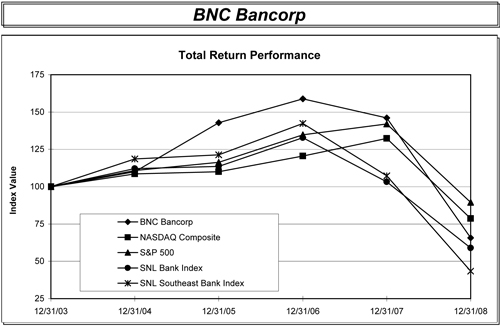
Performance Graph
The following graph compares the Company’s cumulative stockholder return on its Common Stock with a NASDAQ index and with a southeastern bank index. The graph was prepared by SNL Financial, LC using data as of December 31, 2008.
| | | | | | | | | | | | |
| | | Period Ending |
Index | | 12/31/03 | | 12/31/04 | | 12/31/05 | | 12/31/06 | | 12/31/07 | | 12/31/08 |
BNC Bancorp | | 100.00 | | 109.99 | | 142.87 | | 158.88 | | 146.00 | | 65.70 |
NASDAQ Composite | | 100.00 | | 108.59 | | 110.08 | | 120.56 | | 132.39 | | 78.72 |
S&P 500 | | 100.00 | | 110.88 | | 116.33 | | 134.70 | | 142.10 | | 89.53 |
SNL Bank Index | | 100.00 | | 112.06 | | 113.59 | | 132.87 | | 103.25 | | 58.91 |
SNL Southeast Bank Index | | 100.00 | | 118.59 | | 121.39 | | 142.34 | | 107.23 | | 43.41 |
On December 5, 2008, the Company issued 31,260 shares of Series A preferred stock and a warrant to purchase 543,337 shares of the Company’s common stock to the United States Department of the Treasury through a private placement. This issuance of shares was not registered under the Securities Act of 1933 in reliance on the exemption set for in Section 4(2) thereof.
16
| ITEM 6. | SELECTED FINANCIAL DATA |
SELECTED CONSOLIDATED FINANCIAL INFORMATION AND OTHER DATA
The following table sets forth our historical consolidated financial data and operating information for the periods indicated. The selected historical annual consolidated statement of operations and balance sheet data as of and for each of the five fiscal years presented are derived from our consolidated financial statements. Historical results are not necessarily indicative of the results to be expected in the future. You should read the following data together with “Item 1. Business,” “Item 7. Management’s Discussion and Analysis of Financial Condition and Results of Operations,” and our consolidated financial statements and the related notes appearing in “Item 8. Consolidated Financial Statements and Supplemental Data.” (Dollars in thousands, except share and per share data).
BNC Bancorp
Table 1
Selected Consolidated Financial Information and Other Data
($ in thousands, except per share and nonfinancial data)
| | | | | | | | | | | | | | | | |
| | | At or for the Year Ended December 31, |
| | | 2008 | | | 2007 | | 2006 | | 2005 | | 2004 |
Operating Data: | | | | | | | | | | | | | | | | |
Total interest income | | $ | 71,034 | | | $ | 73,670 | | $ | 53,211 | | $ | 33,373 | | $ | 23,171 |
Total interest expense | | | 37,426 | | | | 41,265 | | | 26,481 | | | 14,593 | | | 8,029 |
| | | | | | | | | | | | | | | | |
Net interest income | | | 33,608 | | | | 32,405 | | | 26,730 | | | 18,780 | | | 15,142 |
Provision for loan losses | | | 7,075 | | | | 3,090 | | | 2,655 | | | 2,515 | | | 1,190 |
| | | | | | | | | | | | | | | | |
Net interest income after provision | | | 26,533 | | | | 29,315 | | | 24,075 | | | 16,265 | | | 13,952 |
Non-interest income | | | 5,651 | | | | 5,249 | | | 3,821 | | | 2,982 | | | 3,190 |
Non-interest expense | | | 27,783 | | | | 24,068 | | | 19,110 | | | 13,023 | | | 11,863 |
| | | | | | | | | | | | | | | | |
Income before income taxes | | | 4,401 | | | | 10,496 | | | 8,786 | | | 6,224 | | | 5,279 |
Provision for income taxes | | | 414 | | | | 3,058 | | | 2,616 | | | 1,719 | | | 1,474 |
| | | | | | | | | | | | | | | | |
Net income (loss) | | | 3,987 | | | | 7,438 | | | 6,170 | | | 4,505 | | | 3,805 |
Less preferred stock dividends | | | (142 | ) | | | — | | | — | | | — | | | — |
| | | | | | | | | | | | | | | | |
Net income available to common shareholders | | $ | 3,845 | | | $ | 7,438 | | $ | 6,170 | | $ | 4,505 | | $ | 3,805 |
| | | | | | | | | | | | | | | | |
| | | | | |
Per Share Data: (6) | | | | | | | | | | | | | | | | |
Earnings per share - basic | | $ | 0.53 | | | $ | 1.08 | | $ | 1.09 | | $ | 0.94 | | $ | 0.79 |
Earnings per share - diluted | | | 0.52 | | | | 1.05 | | | 1.04 | | | 0.88 | | | 0.75 |
Cash dividends paid per common share | | | 0.20 | | | | 0.18 | | | 0.15 | | | 0.12 | | | 0.10 |
Market price | | | | | | | | | | | | | | | | |
High | | | 16.92 | | | | 21.00 | | | 18.58 | | | 17.65 | | | 13.43 |
Low | | | 7.01 | | | | 15.60 | | | 15.43 | | | 12.42 | | | 11.31 |
Close | | | 7.46 | | | | 16.91 | | | 18.58 | | | 16.86 | | | 13.09 |
Tangible book value per common share | | $ | 12.62 | | | | 8.30 | | | 6.92 | | | 6.18 | | | 5.35 |
| | | | | |
Weighted average shares outstanding: | | | | | | | | | | | | | | | | |
Basic | | | 7,322,723 | | | | 6,865,204 | | | 5,658,196 | | | 4,798,869 | | | 4,788,713 |
Diluted | | | 7,396,170 | | | | 7,088,218 | | | 5,957,478 | | | 5,093,327 | | | 5,099,679 |
Year-end shares outstanding | | | 7,350,029 | | | | 7,257,532 | | | 6,709,007 | | | 4,804,748 | | | 4,785,754 |
| | | | | |
Selected Year-End Balance Sheet Data: | | | | | | | | | | | | | | | | |
Total assets | | $ | 1,572,876 | | | $ | 1,130,112 | | $ | 951,731 | | $ | 594,550 | | $ | 497,549 |
Loans | | | 1,007,788 | | | | 932,562 | | | 774,664 | | | 499,247 | | | 420,838 |
Allowance for loan losses | | | 13,210 | | | | 11,784 | | | 10,400 | | | 6,140 | | | 5,361 |
Goodwill | | | 26,129 | | | | 26,129 | | | 26,129 | | | 3,423 | | | 3,423 |
Deposits | | | 1,146,013 | | | | 855,130 | | | 786,777 | | | 490,892 | | | 391,480 |
Short-term borrowings | | | 194,143 | | | | 80,928 | | | 4,673 | | | 7,061 | | | 28,275 |
Long-term debt | | | 105,713 | | | | 101,713 | | | 81,713 | | | 59,496 | | | 45,496 |
Shareholders’ equity | | | 120,680 | | | | 86,392 | | | 72,523 | | | 33,114 | | | 29,037 |
17
BNC Bancorp
Table 1
Selected Consolidated Financial Information and Other Data
($ in thousands, except per share and nonfinancial data)
| | | | | | | | | | | | | | | | | | | | |
| | | At or for the Year Ended December 31, | |
| | | 2008 | | | 2007 | | | 2006 | | | 2005 | | | 2004 | |
Selected Average Balances: | | | | | | | | | | | | | | | | | | | | |
Total assets | | $ | 1,227,246 | | | $ | 1,041,018 | | | $ | 747,997 | | | $ | 549,654 | | | $ | 442,087 | |
Loans, including loans held for sale | | | 981,069 | | | | 849,271 | | | | 615,689 | | | | 454,395 | | | | 365,377 | |
Total interest-earning assets | | | 1,116,766 | | | | 943,756 | | | | 685,981 | | | | 503,013 | | | | 408,385 | |
Deposits, interest-bearing | | | 890,058 | | | | 782,755 | | | | 564,084 | | | | 404,384 | | | | 321,590 | |
Total interest-bearing liabilities | | | 1,063,171 | | | | 891,695 | | | | 643,325 | | | | 475,254 | | | | 378,563 | |
Shareholders’ Equity | | | 86,858 | | | | 76,065 | | | | 48,949 | | | | 31,061 | | | | 28,011 | |
| | | | | |
Selected Performance Ratios: | | | | | | | | | | | | | | | | | | | | |
Return on average assets | | | 0.32 | % | | | 0.71 | % | | | 0.82 | % | | | 0.82 | % | | | 0.86 | % |
Return on average equity | | | 4.59 | % | | | 9.78 | % | | | 12.60 | % | | | 14.50 | % | | | 13.58 | % |
Net interest spread (1) | | | 3.00 | % | | | 3.34 | % | | | 3.82 | % | | | 3.75 | % | | | 3.72 | % |
Net interest margin (2) | | | 3.17 | % | | | 3.60 | % | | | 4.08 | % | | | 3.92 | % | | | 3.87 | % |
Non-interest income to total revenue (5) | | | 14.39 | % | | | 13.94 | % | | | 12.51 | % | | | 13.70 | % | | | 17.40 | % |
Non-interest income to average assets | | | 0.46 | % | | | 0.50 | % | | | 0.51 | % | | | 0.54 | % | | | 0.72 | % |
Non-interest expense to average assets | | | 2.26 | % | | | 2.31 | % | | | 2.55 | % | | | 2.37 | % | | | 2.68 | % |
Efficiency ratio (7) | | | 70.77 | % | | | 63.92 | % | | | 62.55 | % | | | 59.84 | % | | | 64.71 | % |
Dividend payout ratio | | | 38.09 | % | | | 16.61 | % | | | 13.34 | % | | | 12.43 | % | | | 12.84 | % |
| | | | | |
Asset Quality Ratios: | | | | | | | | | | | | | | | | | | | | |
Nonperforming loans to period-end loans | | | 1.32 | % | | | 0.39 | % | | | 0.16 | % | | | 0.37 | % | | | 0.08 | % |
Allowance for loan losses to period-end loans | | | 1.31 | % | | | 1.26 | % | | | 1.34 | % | | | 1.23 | % | | | 1.27 | % |
Allowance for loan losses to nonperforming loans | | | 99.18 | % | | | 327.42 | % | | | 839.39 | % | | | 335.70 | % | | | 1614.76 | % |
Nonperforming assets to total assets (3) | | | 1.17 | % | | | 0.54 | % | | | 0.24 | % | | | 0.45 | % | | | 0.18 | % |
Net loan charge-offs to average loans | | | 0.58 | % | | | 0.20 | % | | | 0.20 | % | | | 0.38 | % | | | 0.12 | % |
| | | | | |
Capital Ratios: (4) | | | | | | | | | | | | | | | | | | | | |
Total risk-based capital | | | 11.46 | % | | | 10.31 | % | | | 10.23 | % | | | 11.27 | % | | | 10.79 | % |
Tier 1 risk-based capital | | | 9.60 | % | | | 8.26 | % | | | 8.00 | % | | | 8.61 | % | | | 9.55 | % |
Leverage ratio | | | 8.44 | % | | | 7.40 | % | | | 7.40 | % | | | 7.92 | % | | | 8.66 | % |
Equity to assets ratio | | | 7.67 | % | | | 7.64 | % | | | 7.62 | % | | | 5.57 | % | | | 5.84 | % |
Tangible equity to assets ratio | | | 6.01 | % | | | 5.28 | % | | | 4.77 | % | | | 5.01 | % | | | 5.16 | % |
| | | | | |
Other Data: | | | | | | | | | | | | | | | | | | | | |
Number of full service banking offices | | | 15 | | | | 14 | | | | 13 | | | | 8 | | | | 7 | |
Number of limited service offices | | | 1 | | | | 1 | | | | 1 | | | | 2 | | | | 3 | |
Number of full time equivalent employees | | | 221 | | | | 218 | | | | 196 | | | | 140 | | | | 122 | |
| (1) | Net interest spread is the difference between the average yield on interest-earning assets and the average cost of interest-bearing liabilities. |
| (2) | Net interest margin is net interest income divided by average interest-earning assets. |
| (3) | Nonperforming assets consist of non-accrual loans, restructured loans, and real estate owned, where applicable. |
| (4) | Capital ratios are for the bank. |
| (5) | Total revenue consists of net interest income and non-interest income. |
| (6) | All per share data has been restated to reflect the dilutive effect of a 25% stock dividend distributed in 2007 and a 25% stock dividend paid in 2005. |
| (7) | Efficiency ratio is non-interest expense divided by the sum of net interest income and non-interest income. |
18
| ITEM 7. | MANAGEMENT’S DISCUSSION AND ANALYSIS OF FINANCIAL CONDITION AND RESULTS OF OPERATIONS |
Management’s discussion and analysis is intended to assist readers in understanding and evaluating of the consolidated financial condition and results of operations of the Company. It should be read in conjunction with the audited consolidated financial statements and accompanying notes included in this annual report. Additional discussion and analysis related to fiscal 2008 is contained in our Quarterly Reports on Form 10-Q for the fiscal quarters ended March 31, 2008, June 30, 2008 and September 30, 2008, respectively.
FORWARD LOOKING STATEMENTS
This report contains certain forward-looking statements with respect to the financial condition, results of operations and business of the Company and the Bank. These forward-looking statements involve risks and uncertainties and are based on the beliefs and assumptions of management of the Company and on the information available to management at the time that these disclosures were prepared. These statements can be identified by the use of words like “expect,” “anticipate,” “estimate” and “believe,” variations of these words and other similar expressions. Readers should not place undue reliance on forward-looking statements as a number of important factors could cause actual results to differ materially from those in the forward-looking statements. Factors that could cause actual results to differ materially include, but are not limited to, (1) competition in the Bank’s markets, (2) changes in the interest rate environment, (3) general national, regional or local economic conditions may be less favorable than expected, resulting in, among other things, a deterioration in credit quality and the possible impairment of collectibility of loans, (4) legislative or regulatory changes, including changes in accounting standards, (5) significant changes in the federal and state legal and regulatory environment and tax laws, (6) the impact of changes in monetary and fiscal policies, laws, rules and regulations and (7) other risks and factors identified in the Company’s other filings with the SEC. The Company undertakes no obligation to update any forward-looking statements.
The Company is a one-bank holding company incorporated under the laws of North Carolina to serve as the holding company for the Bank. The Company acquired all of the outstanding capital stock of the Bank on December 16, 2002. The Bank is a full service commercial bank that was incorporated under the laws of the State of North Carolina on November 15, 1991, and opened for business on December 3, 1991. The Bank concentrates its marketing and banking efforts to serve the citizens and business interests of the cities and communities located in Davidson, Randolph, Guilford, Rowan, Iredell, Cabarrus and Forsyth Counties. See “PART I, ITEM 1 — BUSINESS” for an overview of the business operations of the Company and the Bank.
EXECUTIVE SUMMARY
Your Company faced a number of significant challenges in 2008 and 2007 that exceeded those typical in our industry, some attributable to macro-economic and industry conditions, while others related to management initiatives to build infrastructure to support and fuel our growing company.
Capital and the Capital Purchase Program: Since April 3, 2003, either the Bank or the Company has accessed the capital markets on five different occasions, raising a total of $31 million in regulatory capital. In the second quarter of 2008, the capital markets that had historically been very receptive to affordably priced issuances from healthy financial institutions were no longer functioning. The Company was forced to support all additional growth opportunities from internally generated capital through the retention of earnings, or raise capital at highly dilutive levels. The cost of growth had increased significantly at a time when the economy needed all banks to be providing credit to their local communities.
Once the TARP Capital Purchase Program was announced, we were among the first to apply, concluding that the Capital Purchase Program gave us the opportunity to raise capital quickly, at low cost, with little shareholder dilution, and continue to support the credit needs of our communities. And as we stated in our December 8, 2008 press release announcing our receipt of $31.26 million of Capital Purchase Program funds, we considered it our responsibility to participate, rewarding the taxpayers of our communities with an even healthier, more highly capitalized company, better enabling us to serve our customers and communities with access to affordable and reasonably underwritten consumer and commercial credit, supporting economic growth in our communities with loans to creditworthy businesses, and supplying affordable financing to individuals at a time when secondary markets remain in turmoil.
19
Of the total $31.26 million Capital Purchase Program funds, $7 million was applied immediately to repayment of borrowings outstanding under a $20 million line of credit with a Georgia-based financial institution, a line of credit we had drawn upon earlier in the year as a source of bank capital contributions at a time when capital markets were closed and not functioning. Outstanding borrowings under the line of credit were paid down from $7.5 million to $500,000 on December 5, 2008. Another $22 million of the Capital Purchase Program funds were contributed to the Bank as additional equity capital. The remaining funds, approximately $2 million, were retained by the Company for general corporate purposes.
The additional capital provided by the Capital Purchase Program has enhanced the Company’s ability to fund responsible lending and has enabled the Company to better satisfy the credit needs of households and businesses in our markets. The first program we initiated after receiving Capital Purchase Program funds is our Builder Participation Program. This Program makes available up to $100 million of in-house credit to qualified buyers who purchase residential housing inventory currently being financed as part of our residential construction loan portfolio. With the secondary mortgage market functioning inefficiently, we have increased our in-house commitment to fill the credit vacuum, providing builders in our market with a source of qualified buyers and making affordable and rational credit more readily accessible. The Builder Participation Program is a major commitment on our part to help stabilize the housing market in our communities and provide credit locally. To date, $5.9 million of affordable mortgage loans have been provided under the Builders Participation Program.
In early November of 2008, after filing our application to receive CPP Funds, management began implementing a strategy to deploy the capital funds from the Capital Purchase Program into government agency mortgage-backed securities, well before rates in this sector began to decline due to aggressive purchases by the Federal Reserve, by the Treasury Department, and by other community banks seeking to leverage their new Capital Purchase Program funds. That strategy resulted in the Company purchasing $265 million of FNMA and FHLMC sponsored mortgage-backed securities in November and December of 2008, and an additional $50 million of bank-qualified municipal government securities. The weighted average tax equivalent yield on these investments was 5.70%.
In conjunction with the Board, management chose to fund these investment purchases primarily through overnight advances from the FHLB Atlanta. This funding strategy accomplished two objectives. It provided a natural hedge to the Bank’s prime-based loan portfolio. When the Federal Reserve cut benchmark rates by 75 basis points in December, the spread on the leverage transaction widened by 75 basis points at the same time the yield on our prime based loan portfolio declined by 75 basis points. In addition, it provided more time for the longer term funding levels to decline before matching the terms of the expected cash flows from the investment assets and funding liabilities.
At year end, the Company had $180 million borrowed overnight at the FHLB Atlanta. In the first quarter of 2009, these borrowings were repaid from the proceeds of an alternative funding vehicle with a five year fixed effective cost of 2.95%.
Interest Rate Impact: Due to a protracted period of Federal Reserve cuts to short-term benchmarks, our Company has been challenged with shrinking net interest margins over the past 24 months. The Company’s net interest margin has declined gradually over this two year period from 4.09% during the fourth quarter of 2007, to 3.02% during the fourth quarter of 2008. We believe, with the Federal Funds target at 0.25%, and the prime rate at 3.25%, the chances for further cuts to these benchmarks are minimal. Therefore, with most of the repricing pressure on the asset side of the balance sheet occurring over the past two years, we enter 2009 with $720 million of time deposits with an average cost of 3.26% that will be maturing over the coming twelve months. If rates stay at current levels, these time deposits could reprice downward in excess of 1.00% on average, and provide a reversal of the recent trend on net interest margin.
Credit Quality: Even though we operate in one of the most historically stable real estate markets in the southeast, we are prudently and continuously evaluating our policies, procedures, and portfolio mix, especially in this very challenging economy, both overall and in the real estate sector. We fully understand we are in the business of managing risk, and while current conditions have heightened risk greatly within our industry, we are bracing and fortifying the resources within our Company to better manage this risk.
Despite our heightened internal focus on credit quality, net charge-offs for 2008 were 0.58%, significantly above the 0.20% reported in both 2007 and 2006. In addition to higher charge-offs, the Company also experienced a significant increase in the level
20
of non-performing assets, increasing to 1.17% as a percentage of total assets at year end versus 0.54% a year earlier. The majority of the Company’s non-performing assets are real estate related. Net charge-offs for the year were as follows: Real estate term loans, $1.3 million, Real estate construction and development, $1.7 million, and commercial and industrial, $2.5 million. With further economic slowdowns in our markets, we anticipate continued pressure on each of these sectors in 2009.
Growth, Expansion, and Funding Trends. For the first time in this decade, 2008 marked the first year that we had not entered into a new banking market. As opposed to expanding our footprint, we chose to expand within our current footprint by opening a second full-service office in High Point, and beginning the construction of a permanent banking office for our North Davidson operation. The new High Point office is centrally located between our three Greensboro offices, our existing High Point office, and our offices in Oak Ridge and Kernersville.
The North Davidson office has been the model office for future expansion efforts. This office has a very strong team of bankers, and has a very balanced blend of commercial and consumer customers. This office has also been the most balanced in terms of deposit and loan growth of any of our recent branch openings.
Trends. Beginning in 2003, the Company began expanding our footprint into new markets using loan production offices as an entry vehicle. Loan production offices were opened in High Point in the second quarter of 2003, and in Salisbury in the fourth quarter of 2003. Each of these offices was successful in growing their respective loan portfolios to over $100 million in loans outstanding, and both have since been converted into full-service offices. With the success of the loan production office model, the Company opened loan production offices in the cities of Winston-Salem and Harrisburg, North Carolina in 2004 and 2005. With deposit rates on the rise, and the value of core deposits increasing, our strategy shifted more towards an expansion strategy that targeted a greater balance from a deposit and loan growth perspective. This prompted the entry into the Greensboro market with the acquisition of SterlingSouth Bank in July of 2006, and the opening of the North Davidson office. SterlingSouth had relied primarily on local deposits to fund its growth, thus providing our Company with an equal balance of both deposits and loans in the Greensboro market.
In early 2007, it became evident that the flat yield curve and growing credit concerns in our industry would make 2007 and 2008 two of the most difficult years our industry has faced in well over a decade. We chose to retract our expansion efforts in favor of focusing internally on our credit quality, as well as controls and procedures surrounding the credit approval and review functions. In late 2007, with the residential real estate market no longer a sector deemed to be favorable for growth, we turned to an opportunity in the Lake Norman/Mooresville market to hire a team of seasoned bankers whose expertise was in the commercial real estate area. In 2008, we expanded within our current footprint by opening a second full-service office in High Point, and began the construction of a permanent banking office for our North Davidson operation. In addition, with the increasing importance of core deposits to our franchise, in 2008 we greatly increased our investment in the retail and commercial branch support and sales staffs, and the treasury services support and sales platforms. We will continue to evaluate opportunities that arise, and utilize either the full-service office or the loan production vehicle as entries into attractive markets as deemed appropriate.
The Company’s loan portfolio has more than tripled from the $303.7 million reported on December 31, 2003, to December 31, 2008, when total loans were $1.0 billion. In this five-year period, short-term rates have been quite volatile. Management has made a conscious effort to pursue variable rate lending when short-term rates are at historically low levels, then as rates rise we have transitioned the mix of variable to fixed back towards a more balanced portfolio. To accomplish this objective during the most recent Federal Reserve tightening, we utilized $55.0 million of interest rate swaps. The use of swaps was deemed to be a much more efficient vehicle for balancing the Company’s variable to fixed loan rate ratio, and ultimately provided a higher blended fixed rate than was available in our markets at the time on larger loan relationships.
Over the same time period, management has utilized the wholesale CD markets to attract and lock in funding at terms that meet our current asset-liability management objectives. When rates were at historically low levels in 2003 and 2004, we extended our offerings and were able to raise funding in the 18 month to 60 month maturity time periods. During the recent peak and subsequent decline, management has utilized shorter terms through the wholesale network to reduce the average maturity of our time deposit portfolio, thus providing a faster reset on the overall portfolio. As illustrated in the table below, management has begun extending the average term of the time deposit portfolio in this low rate environment, choosing to select terms of less than twelve months, and terms of three years or longer.
21
BNC Bancorp
Time Deposits: Weighted Average Remaining Term of Portfolio (in months)
| | | | | | | | | | | | | | | | | | | | |
| | | At the Year Ended December 31, | |
| | | 2008 | | | 2007 | | | 2006 | | | 2005 | | | 2004 | |
Total CD’s | | $ | 900,776 | | | $ | 570,682 | | | $ | 531,221 | | | $ | 319,116 | | | $ | 205,676 | |
Weighted Average Coupon | | | 3.26 | % | | | 4.84 | % | | | 4.75 | % | | | 3.72 | % | | | 2.46 | % |
Weighted Average Remaining Term | | | 8.89 | | | | 7.58 | | | | 9.66 | | | | 14.55 | | | | 12.00 | |
During 2005 and 2006, the Company executed $55.0 million (notional) of swap transactions whereby we pay prime rate variable and received a blended fixed rate of 7.85% for a weighted average period of slightly less than five years. This strategy helped to bring our portfolio into a better balance between fixed and variable, and helped provide protection to declining rates. Currently, these swaps have an average remaining life of around 2.1 years. This effectively turned the interest stream on $55.0 million of our prime-based loan portfolio into a fixed interest stream at 7.85%. With the prime rate having declined by 500 basis points over the past two years, these swap transactions are performing as intended.
In 2003 and early 2004, as we originated variable-rate loans funded with longer-term deposits, the Company’s net interest margin declined from 4.14% in 2003 to 3.87% in 2004. However, the Bank’s net interest income increased 26.7%, or $3.2 million in 2004 compared to 2003. By accepting a slightly smaller net interest margin, the Bank was able to accelerate the growth of our loan portfolio, price our loans and deposits to take advantage of future rate increases, and still report record increases in our net interest income. Each of these results was expected as part of the strategic plan implemented during 2003. In 2005 and 2006, as rates rose steadily, the investment we made in longer-term funding, with the sacrifice in short-term yield we experienced by stressing variable-rate credits began to pay significant dividends. In 2006, the Company’s net interest margin increased to 4.08% and net interest income increased by $7.9 million, or 42.3%. In 2007, with interest rates being relatively flat for terms of six months out to 10 years, the Company, and our entire industry experienced a significant decline in net interest margin.
When the credit and liquidity markets encountered troubles mid-year of 2007, the Federal Reserve started what has become an aggressive and protracted 500 basis point easing of short-term rates. The impact of this easing, along with a shift in focus of the larger money center banks away from the debt markets and into the CD markets has created additional downward pressure on our Company’s and the industry’s net interest margin. Due to this protracted period of Federal Reserve cuts to short-term benchmarks, our Company has been challenged with shrinking net interest margins over the past 24 months. The Company’s net interest margin has declined gradually over this two year period from 4.09% during the fourth quarter of 2007, to 3.02% during the fourth quarter of 2008. We believe, with the Federal Funds target at 0.25%, and the prime rate at 3.25%, the chances for further cuts to these benchmarks are minimal. Therefore, with most of the repricing pressure on the asset side of the balance sheet occurring over the past two years, we enter 2009 with $720 million of time deposits with an average cost of 3.26% that will be maturing over the coming twelve months. If rates stay at current levels, these time deposits could reprice downward in excess of 1.00% on average, and provide a reversal of the recent trend on net interest margin.
With assets growing at an accelerated rate over the past five years, it was imperative that part of our ongoing strategic plan be devoted to capital planning. As noted in prior reports, the Company has utilized alternative forms of regulatory capital to supplement our shareholders’ equity in order to remain well capitalized for regulatory purposes. The Company has issued four blocks of 30 year variable rate junior subordinated debentures to its wholly owned capital trusts: $5.2 million in April of 2003 priced at 3 month LIBOR + 3.25%; $6.2 million in March of 2004 priced at 3 month LIBOR + 2.80%; $5.2 million in September of 2004 priced at 3 month LIBOR + 2.40%; and $7.2 million in September of 2006 priced at 3 month LIBOR + 1.70%. These debentures fully and unconditionally guarantee the preferred securities issued by the trusts. These debentures are classified as long-term debt on our Company’s financial statements. In addition, during the second quarter of 2005, the Bank issued $8.0 million of subordinated debentures priced at 3 month LIBOR + 1.80%, which is classified as Tier II capital for regulatory purposes.
22
In the second quarter of 2008, the capital markets that had historically been very receptive to affordably priced issuances of regulatory capital outline above from healthy financial institutions were no longer functioning. The Company was forced to support all additional growth opportunities from internally generated capital through the retention of earnings, or raise capital at highly dilutive levels. The cost of growth had increased significantly at a time when the economy needed all banks to be providing credit to their local communities.
Once the TARP Capital Purchase Program was announced, we were among the first to apply, concluding that the Capital Purchase Program gave us the opportunity to raise capital quickly, at low cost, with little shareholder dilution, and continue to support the credit needs of our communities. And as we stated in our December 8, 2008 press release announcing our receipt of $31.26 million of Capital Purchase Program funds, we considered it our responsibility to participate, rewarding the taxpayers of our communities with an even healthier, more highly capitalized company, better enabling us to serve our customers and communities with access to affordable and reasonably underwritten consumer and commercial credit, supporting economic growth in our communities with loans to creditworthy businesses, and supplying affordable financing to individuals at a time when secondary markets remain in turmoil.
Of the total $31.26 million Capital Purchase Program funds, $7 million was applied immediately to repayment of borrowings outstanding under a $20 million line of credit with a Georgia-based financial institution, a line of credit we had drawn upon earlier in the year as a source of bank capital contributions at a time when capital markets were seized up and not functioning. On December 5, 2008 when the Company received the CPP Funds, the outstanding borrowings under the line of credit were paid down from $7.5 million to $500,000. Another $22 million of the Capital Purchase Program funds were contributed to the Bank as additional equity capital. The remaining funds, approximately $2 million, were retained by the Company for general corporate purposes.
During 2008 total shareholders’ equity increased by $34.3 million, or 39.7%. The largest component of the increase was the $31.26 million in capital funds obtained through the Capital Purchase Program. The Company reported net income of $3.99 million, accrued dividends on the CPP capital of $112,000, and declared cash dividends of $1.8 million during 2008. The Company and the Bank are subject to minimum capital requirements. The Company repurchased 39,598 shares in 2008 as part of the stock repurchase plan approved by the Board of Directors. All capital ratios continue to place the Bank in excess of the minimum required to be deemed a “well-capitalized” bank by regulatory measures.
The Bank continually monitors liquidity levels in relation to the market conditions, and adjusts levels to what we deem to be an appropriate level for the current operating environment. Historically, liquid assets, consisting of cash and demand balances due from banks, interest-earning deposits in other banks, investment securities available for sale and FHLB stock, have been managed towards a target of 10% of total assets. At the end of 2007, liquid assets totaled $115.0 million, or 10.2% of total assets. With debt markets becoming less liquid, unsecured credit availability through correspondents less reliable, and customers shifting funds to maximize their FDIC insurance protection, management began building the levels of liquid assets throughout the second half of 2008.
During the fourth quarter, in anticipation of receiving the CPP capital funds, management began implementing a strategy to deploy these capital funds into government agency mortgage-backed securities, well before rates in this sector began to decline due to aggressive purchases by the Federal Reserve, by the Treasury Department, and by other community banks seeking to leverage their new Capital Purchase Program funds. That strategy resulted in the Company purchasing $265 million of FNMA and FHLMC sponsored mortgage-backed securities in November and December of 2008, and an additional $50 million of bank-qualified municipal government securities. The tax equivalent yield on these investments were 5.70%. With $179.6 million being funded by advances at the FHLB, which requires collateral, and the remainder funded by wholesale CD’s, which do not require collateral, we were able to increase unencumbered liquid assets by over $130 million through this process. At year end 2008, the Company had liquid assets of $472.8 million, with $275 million unpledged and available to meet short-term liquidity needs.
Net Interest Margin Trends. Bank earnings are principally driven on the spread between the yield on earning assets and the costs associated with funding these assets. While most funding is generally short-term in nature, approximately half of our earning assets have terms that stretch from 12 months to 60 months. The additional risk premium associated with extending asset maturities above those on the funding side has historically served to enhance the bank’s net interest margin. When the credit and liquidity markets encountered troubles mid-year of 2007, the Federal Reserve started what has become an aggressive and protracted 500 basis
23
point easing of short-term rates. The impact of this easing, along with a shift in focus of the larger money center banks away from the debt markets and into the CD markets has created additional downward pressure on our Company’s and the industry’s net interest margin. Due to this protracted period of Federal Reserve cuts to short-term benchmarks, our Company has been challenged with shrinking net interest margins over the past 24 months. The Company’s net interest margin has declined gradually over this two year period from 4.09% during the fourth quarter of 2007, to 3.02% during the fourth quarter of 2008. We believe, with the Federal Funds target at 0.25%, and the prime rate at 3.25%, the chances for further cuts to these benchmarks are minimal. Therefore, with most of the repricing pressure on the asset side of the balance sheet occurring over the past two years, we enter 2009 with $720 million of time deposits with an average cost of 3.26% that will be maturing over the coming twelve months. If rates stay at current levels, these time deposits could reprice downward in excess of 1.00% on average, and provide a reversal of the recent trend on net interest margin.
In 2008, the Company reported total loan growth of over $75.2 million. During the year, variable-rate loans increased by $34.7 million, while fixed-rate loans increased by $40.5 million. After accounting for the $55.0 million in fixed for prime swaps outstanding, the ratio of fixed to variable rate loans ended the year at 52.0% fixed and 48.0% variable, compared to one year ago when the ratios were virtually identical at 51.9% and 48.1%, respectively.
The funding for the loan growth in 2007 and 2008 was heavily dependent on wholesale funds; unlike in 2006 and 2005 when funding came primarily from the local and wholesale CD markets. With CD rates above the 5% threshold for much of 2006 and 2007, the competition for core deposits were magnified. In 2005, when our targeted terms for new funding changed to 15 months or less, we were able to tap our local markets and generate local deposit growth, primarily with terms of eight months to 13 months. This local deposit growth was led by the opening of our full-service office in High Point in the first quarter, and the expanded awareness of our Salisbury office during the second half of 2005. When local deposit growth was not sufficient to meet short-term funding requirements, we continued to use the wholesale markets to acquire (or to obtain) funding with terms of six months to 24 months. In 2006, with core deposit rates being at a steep discount to wholesale funding, we made an even greater effort to grow our core deposit base through aggressive calling efforts, acquisition, and expansion of our deposit gathering locations. In 2006, core deposits (excludes time deposits) grew approximately $88 million, of which $59 million was from the SterlingSouth acquisition and $29 million was from organic growth. In 2007 and 2008, with competition for core deposits intensifying, much of the funding during this period was derived from the wholesale CD market. Due to the availability of funds and a wide range of terms available in the wholesale CD market, the Bank grew out-of-market time deposits by $328.5 million in 2008, compared to a growth in that sector of $25.1 million in 2007. Approximately $85 million of this growth in out of market time deposits funded the highly liquid securities purchases in the fourth quarter of 2008. Certificates of deposit of $100,000 or more represented 59.1% and 48.9%, respectively, of the Bank’s total deposits at December 31, 2008 and 2007. At December 31, 2008 and 2007, the Company had $629.8 million and $301.3 million in wholesale time deposits, respectively. With many of the national and regional banks having liquidity challenges during the second half of 2008, deposit rates in our local markets were at times up to 100 basis points higher than comparable terms in the wholesale markets, making the efficient pricing, and a broad selection of terms an effective management and funding tool.
As management and the Board looks ahead to 2009, it is uncertain how long and at what pace the economic slowdown will persist, and what the impact future movements in interest rates or fiscal policies will have on the slope of the yield curve. We are positioning our balance sheet and interest income stream to partially participate in future rate moves, while reducing our exposure to pronounced movements in rates in either direction. Management believes these strategic initiatives now in place are a prudent way to protect the long-term income stream of our Company.
FINANCIAL CONDITION
DECEMBER 31, 2008 AND 2007
The most significant factor affecting the Company’s financial condition in 2008 was the broad economic slowdown in both the real estate sector and the general economy in our state and local communities. The challenges posed by a soft real estate sector, coupled with a broad based economic slowdown, have put pressure on the credit quality of both our Company and our entire industry. With non-performing assets and net charge-offs increasing, and the availability of new affordable capital through outside sources at a minimum, the Company began slowing growth late in the second quarter of 2008.
24
In the fourth quarter, the Treasury announced the Capital Purchase Program that was to provide an affordable capital option to healthy banks to insure that banks continued to remain sound, and had the necessary capital to continue to provide affordable credit to their markets. On December 5, 2008, the Company received $31.26 million of Capital Purchase Program funds, $7 million was applied immediately to repayment of borrowings outstanding under a $20 million line of credit with a Georgia-based financial institution, a line of credit we had drawn upon earlier in the year as a source of bank capital contributions at a time when capital markets were seized up and not functioning. Outstanding borrowings under the line of credit were paid down from $7.5 million to $500,000 on December 5, 2008. Another $22 million of the Capital Purchase Program funds were contributed to the Bank as additional equity capital. The remaining funds, approximately $2 million, were retained by the Company for general corporate purposes.
During the fourth quarter, in anticipation of receiving the CPP capital funds, management began implementing a strategy to deploy these capital funds into government agency mortgage-backed securities, well before rates in this sector began to decline due to aggressive purchases by the Federal Reserve, by the Treasury Department, and by other community banks seeking to leverage their new Capital Purchase Program funds. That strategy resulted in the Company purchasing $265 million of FNMA and FHLMC sponsored mortgage-backed securities in November and December of 2008, and an additional $50 million of bank-qualified municipal government securities. The tax equivalent yield on these investments were 5.70%. With $179.6 million being funded by advances at the FHLB, which requires collateral, and the remainder funded by wholesale CD’s, which do not require collateral, we were able to increase unencumbered liquid assets by over $130 million through this process. At year end 2008, the Company had liquid assets of $472.8 million, or 30.1% of total assets, with $275 million unpledged and available to meet short-term liquidity needs.
Total loans increased by $75.2 million in 2008, with this increase composed principally of an increase of $69.5 million in loans secured by real estate other than construction, an increase of $21.3 million in loans secured by construction purpose real estate and a decrease of $5.1 million in commercial and industrial loans. During 2008, while the outstanding balance on loans secured by construction purpose real estate increased, the total amount of committed exposure (outstanding plus undrawn commitments) on projects underwritten and closed prior to December 31, 2007, declined by $93.6 million. The Company has actively and aggressively reduced the overall exposure to the acquisition, development and construction sector during 2008. New originations in this area during 2008 carried much higher credit standards for liquidity, contingencies, net worth, loan-to-value and management expertise.
The Bank continually monitors liquidity levels in relation to the market conditions, and adjusts levels to what we deem to be an appropriate level for the current operating environment. Historically, liquid assets, consisting of cash and demand balances due from banks, interest-earning deposits in other banks, investment securities available for sale and FHLB stock, have been managed towards a target of 10% of total assets. At the end of 2007, liquid assets totaled $115.0 million, or 10.2% of total assets. With debt markets becoming less liquid, unsecured credit availability through correspondents less reliable, and customers shifting funds to maximize their FDIC insurance protection, management began building the levels of liquid assets throughout the second half of 2008.
The Bank, as a member of the FHLB, had an investment of $13.4 million in FHLB stock at December 31, 2008. During the first quarter of 2009, the Bank has repaid overnight advances with the FHLB, and reduced the stock investment to $5.3 million. This action was taken in advance of a growing concern that this investment may ultimately be considered impaired or be a non-performing asset for an undeterminable period. The Bank’s investment in premises and equipment increased by $2.7 million; primarily as a result of the addition of our second full-service office in High Point and the construction costs associated with the North Davidson facility scheduled for completion in the second quarter of 2009. At December 31, 2008, the Company has goodwill of $26.1 million that is not amortizable. At December 31, 2008, the core deposit intangibles associated with acquisitions amounted to $1.8 million.
Funding to support higher total assets held at year-end was provided by an increase of $290.9 million in deposit accounts, an increase of $113.2 million in short-term borrowings, and an increase of $4.0 million in long-term debt. The increase in deposit accounts was due to an increase of $330.1 million in certificates of deposit. Large denomination certificates of deposit increased by $259.3 million in 2008, with virtually all of the growth coming from additional wholesale sources. At year-end 2008, the Bank had $677.8 million in large denomination certificates of deposit obtained through the wholesale markets, compared to $301.3 million at the end of 2007. These certificates had maturities ranging from six months to five years at rates at or below those being quoted in the local markets at the time of closing. Smaller denomination time deposits, which come primarily from within our local markets,
25
increased by $70.8 million. Included in short-term borrowings was $500,000 outstanding on a $20 million line of credit to the Company, which has been drawn up to $7.5 million to increase the Company’s equity investment in and augment capital levels of the Bank.
During 2008 total shareholders’ equity increased by $34.3 million, or 39.7%. The largest component of the increase was the $31.26 million in capital funds obtained through the Capital Purchase Program. The Company reported net income of $3.99 million, accrued dividends on the CPP capital of $112,000, and declared cash dividends of $1.8 million during 2008. The Company and the Bank are subject to minimum capital requirements. The Company repurchased 12,000 shares in 2008 as part of the stock repurchase plan approved by the Board of Directors. All capital ratios continue to place the Bank in excess of the minimum required to be deemed a “well-capitalized” bank by regulatory measures.
The Company utilizes alternative forms of regulatory capital to supplement our shareholders’ equity in order to remain “well capitalized” for regulatory purposes. The Company has issued four blocks of 30 year variable rate junior subordinated debentures to its wholly owned capital trusts: $5.2 million in April of 2003 priced at 3 month LIBOR + 3.25%; $6.2 million in March of 2004 priced at 3 month LIBOR + 2.80%; $5.2 million in September of 2004 priced at 3 month LIBOR + 2.40%; and $7.2 million in September of 2006 priced at 3 month LIBOR + 1.70%. In addition, during 2005 the Bank issued $8.0 million of subordinated debentures at 3 month LIBOR + 1.80%, which counts as Tier II capital for regulatory purposes. These instruments are classified as long-term debt on our Company’s financial statements.
RESULTS OF OPERATIONS
YEARS ENDED DECEMBER 31, 2008 AND 2007
Overview. The Company reported net income of $3.99 million and net income available to common shareholders of $3.85 million, or $0.52 per diluted share for the year ended December 31, 2008, as compared with net income of $7.44 million, or $1.05 per diluted share for 2007. Net interest income increased by $1.2 million, or 3.7%, in 2008, while non-interest income increased by $402,000, or 7.7%. The increases in income are less than the $3.7 million increase in non-interest expenses, which totaled $27.8 million in 2008 as compared with $24.1 million in 2007.
The most significant factors affecting the Bank’s performance in 2008 was a further decline in the Company’s net interest margin from 3.60% to 3.17%, an increase in credit losses which resulted in the provision for loan losses increasing from $3.1 million in 2007 to $7.1 million in 2008. Operating expenses were higher in 2008 compared to 2007, primarily due to a $625,000 one-time separation from employment settlement with one of our former executive officers, the opening of our second High Point office, operating the Harrisburg full service office for a full year, a $395,000 increase in FDIC insurance premiums, and the additional cost associated with a 34% increase in deposits and an 8% increase in loans.
Net Interest Income. Like most financial institutions, the primary component of earnings for the Bank is net interest income. Net interest income is the difference between interest income, principally from loan and investment securities portfolios, and interest expense, principally on customer deposits and borrowings. Changes in net interest income result from changes in volume, spread and margin. For this purpose, “volume” refers to the average dollar level of interest-earning assets and interest-bearing liabilities, “spread” refers to the difference between the average yield on interest-earning assets and the average cost of interest-bearing liabilities, and “margin” refers to net interest income divided by average interest-earning assets and is influenced by the level and relative mix of interest-earning assets and interest-bearing liabilities, as well as levels of non-interest-bearing liabilities. During the years ended December 31, 2008 and 2007, average interest-earning assets were $1.12 billion, and $943.8 million, respectively. During these same years, the Bank’s tax effected net yields on average interest-earning assets were 3.17% and 3.60%, respectively. The decrease in the net interest margin from 2007 to 2008 was due primarily when the Federal Reserve began aggressively reducing short-term rates in the second half of 2007. Over an 18 month period, the Federal Reserve dropped the short-term benchmark rates by 500 basis points, while much of the deposit funding cost declined by considerably less, resulting in an 18 month downward trend in net interest margin.
Table 2 and Table 3 following this discussion, “Average Balances and Net Interest Income” and “Volume and Rate Analysis,” respectively, presents an analysis of the Bank’s net interest income and rate/volume activity for 2008 and 2007.
As described above, the primary component of earnings for the Bank is net interest income. Net interest income increased to $33.6 million for the year ended December 31, 2008, a $1.2 million or 3.7% increase from the $32.4 million earned in 2007. Total
26
interest income benefited from strong growth in the level of average earning assets which offset the marked decline in the Company’s net interest margin. Average total interest-earning assets increased $173.0 million, or 18.3%, during 2008 as compared to 2007, while the average yield decreased by 145 basis points from 7.97% to 6.52%. Average total interest-bearing liabilities increased by $171.5 million, or 19.2%, consistent with the increase in interest-earning assets. The average cost of interest-bearing liabilities decreased by 111 basis points from 4.63% to 3.52%. With the yield on earning assets declining by 34 basis points more than the cost on funding, the Bank’s net interest margin decreased by 43 basis points. For the year ended December 31, 2008 the net interest margin was 3.17%, while for the year ended December 31, 2007, the net interest margin was 3.60%.
Provision for Loan Losses. The Bank recorded a $7.1 million provision for loan losses in 2008, representing an increase of $4.0 million from the $3.1 million provision made in 2007. Provisions for loan losses are charged to income to bring the allowance for loan losses to a level deemed appropriate by management. In evaluating the allowance for loan losses, management considers factors that include growth, composition and industry diversification of the portfolio, historical loan loss experience, current delinquency levels, adverse situations that may affect a borrower’s ability to repay, estimated value of any underlying collateral, prevailing economic conditions and other relevant factors. In both 2008 and 2007 the provision for loan losses was made principally in response to growth in loans and to cover net charge-offs. Net loan growth totaled $73.8 million in 2008 and $156.5 million in 2007. The allowance for loan losses, as a percentage of loans outstanding, increased from 1.26% at the beginning of 2008 to 1.31% at the end of the year. At December 31, 2008, the allowance for loan losses was $13.2 million, an increase of $1.4 million, or 12.1% from the $11.8 million at the end of 2007. At December 31, 2008, the Bank had $13.3 million in nonaccrual and restructured loans compared to $3.6 million at the end of 2007. The nonaccrual balance at December 31, 2008 has been written down to a balance that management believes is collectible under current market conditions. Net loan charge-offs for 2008 were $5.7 million or 0.58% of average loans outstanding during the year. Net charge-offs for 2007 were $1.7 million, resulting in a 0.20% ratio of average loans outstanding for the year.
Non-Interest Income. Non-interest income increased to $5.6 million for the year ended December 31, 2008 as compared with $5.2 million for the year ended December 31, 2007, an increase of $402,000 or 7.7%. The increase resulted from securities gains of $223,000 in 2008, and a $210,000 increase in cash surrender value of life insurance. The fee income from the Company’s mortgage origination unit decreased in 2008 by $56,000, while service charges on deposits and other services increased by $111,000, or 3.8%. Table 4 following this discussion presents a comparative analysis of the components of non-interest income.
Non-Interest Expenses. Non-interest expenses totaled $27.8 million for the year ended December 31, 2008, an increase of $3.7 million over the $24.1 million reported for 2007. Substantially all of this increase resulted from the Bank’s growth and development during 2008 and 2007, including the expanded staffing of several offices, a $625,000 one-time separation from employment settlement with one of our former executive officers, the opening of our second High Point office, operating the Harrisburg full service office for a full year, a $395,000 increase in FDIC insurance premiums, and the additional cost associated with a 34% increase in deposits and an 8% increase in loans. Personnel costs increased by $1.6 million, or 10.6%, with the $625,000 one time employment separation charge accounting for 39% of the increase. Included in this increase in personnel costs were the effects of the adoption of accounting for post retirement split dollar expense, which added $142,000 in 2008, whereas there was no such expense in 2007. Table 5 following this discussion presents a comparative analysis of the components of non-interest expenses.
Income Taxes. The provision for income taxes of $414,000 in 2008 and $3.1 million in 2007 represents 9.4% and 29.1%, respectively, of income before income taxes. These effective rates are lower than the blended federal/North Carolina statutory rate of 38.55% principally due to tax-exempt income from municipal bonds and bank-owned life insurance.
RESULTS OF OPERATIONS
YEARS ENDED DECEMBER 31, 2007 AND 2006
Overview. The Company reported net income of $7.4 million or $1.05 per diluted share for the year ended December 31, 2007, as compared with net income of $6.2 million or $1.04 per diluted share for 2006, an improvement of $1.2 million or $0.01 per diluted share. Net interest income increased by $5.7 million, or 21.2%, in 2007, while non-interest income increased by $1.4 million, or 37.4%. The increases in income exceeded the $5.0 million increase in non-interest expenses, which totaled $24.1 million in 2007 as compared with $19.1 million in 2006. The most significant factor affecting the Bank’s operations in 2007 was the 20.4% increase in the loan portfolio, a decline in our net interest margin of 48 basis points, and a full year of operations in our Greensboro offices obtained through the acquisition of SterlingSouth Bank & Trust Company in July of 2006.
27
Net Interest Income. Like most financial institutions, the primary component of earnings for the Bank is net interest income. Net interest income is the difference between interest income, principally from loan and investment securities portfolios, and interest expense, principally on customer deposits and borrowings. Changes in net interest income result from changes in volume, spread and margin. For this purpose, “volume” refers to the average dollar level of interest-earning assets and interest-bearing liabilities, “spread” refers to the difference between the average yield on interest-earning assets and the average cost of interest-bearing liabilities, and “margin” refers to net interest income divided by average interest-earning assets and is influenced by the level and relative mix of interest-earning assets and interest-bearing liabilities, as well as levels of non-interest-bearing liabilities. During the years ended December 31, 2007 and 2006, average interest-earning assets were $943.8 million, and $686.0 million, respectively. During these same years, the Bank’s tax effected net yields on average interest-earning assets were 3.60% and 4.08%, respectively. The decrease in the net interest margin from 2006 to 2007 was due primarily to two factors:
1. Bank earnings are principally driven on the spread between the yield on earning assets and the costs associated with funding these assets. While most funding is generally short-term in nature, approximately half of our earning assets have terms that stretch from 12 months to 60 months. The additional risk premium associated with extending asset maturities above those on the funding side has historically served to enhance the bank’s net interest margin. In 2007, this historical premium disappeared, and in a flat interest rate environment, new and renewed asset originations carried much smaller spreads than historically received. This produced declining margins for growth companies, brought about by incremental asset generations providing small spreads, and reducing the company’s overall net interest margin.
2. In the second half of 2007, the Federal Reserve began reducing short-term rates, which provided relief from the flat rate environment, but the negative implications on net interest margin of declining short-term rates was nearly as punitive. As is typical with most commercial banks with a large variable rate loan portfolio, the Company had a higher volume of assets relative to liabilities that repriced within thirty days of each rate cut. With further cuts anticipated by the Federal Reserve, we anticipate continued margin pressure throughout the first half of 2008.
Table 2 and Table 3 following this discussion, “Average Balances and Net Interest Income” and “Volume and Rate Analysis,” respectively, presents an analysis of the Bank’s net interest income and rate/volume activity for 2007 and 2006.
As described above, the primary component of earnings for the Bank is net interest income. Net interest income increased to $32.4 million for the year ended December 31, 2007, a $5.7 million or 21.2% increase from the $26.7 million earned in 2006. Total interest income benefited from strong growth in the level of average earning assets which more than offset the marked decline in the Company’s net interest margin. Average total interest-earning assets increased $257.8 million, or 37.6%, during 2007 as compared to 2006, while the average yield increased by 3 basis points from 7.94% to 7.97%. Average total interest-bearing liabilities increased by $248.4 million, or 38.6%, consistent with the increase in interest-earning assets. The average cost of interest-bearing liabilities increased by 51 basis points from 4.12% to 4.63%. With the yield on earning assets staying stable and cost of interest-bearing liabilities increasing by 51 basis points, the Bank’s net interest margin decreased by 48 basis points. For the year ended December 31, 2007 the net interest margin was 3.60%, while for the year ended December 31, 2006, the net interest margin was 4.08%.
Provision for Loan Losses. The Bank recorded a $3.1 million provision for loan losses in 2007, representing an increase of $435,000 from the $2.7 million provision made in 2006. Provisions for loan losses are charged to income to bring the allowance for loan losses to a level deemed appropriate by management. In evaluating the allowance for loan losses, management considers factors that include growth, composition and industry diversification of the portfolio, historical loan loss experience, current delinquency levels, adverse situations that may affect a borrower’s ability to repay, estimated value of any underlying collateral, prevailing economic conditions and other relevant factors. In both 2007 and 2006 the provision for loan losses was made principally in response to growth in loans and to cover charge-offs. Net loan growth totaled $156.5 million in 2007 and $128.8 million in 2006 (excluding $142.4 million of net loans from the acquisition of SterlingSouth). The allowance for loan losses, as a percentage of loans outstanding, decreased from 1.34% at the beginning of 2007 to 1.26% at the end of the year. At December 31, 2007, the allowance for
28
loan losses was $11.8 million, an increase of $1.4 million, or 13.3% from the $10.4 million at the end of 2006. At December 31, 2007, the Bank had $3.6 million in nonaccrual and restructured loans compared to $1.1 million at the end of 2006. The nonaccrual balance at December 31, 2007 has been written down to a balance that management believes is collectible under normal market conditions. Net loan charge-offs for 2007 were $1.7 million or 0.20% of average loans outstanding during the year. Net charge-offs for 2006 were $1.2 million, resulting in a similar 0.20% ratio of average loans outstanding for the year.
Non-Interest Income. Non-interest income increased to $5.2 million for the year ended December 31, 2007 as compared with $3.8 million for the year ended December 31, 2006, an increase of $1.4 million or 37.4%. The fee income from the Company’s mortgage origination unit increased in 2007 to $839,000 from $605,000 in 2006. Service charges on deposits and other services in 2007 were $2.9 million, an increase of $464,000, or 19.0%, when compared to the $2.4 million in 2006. This increase was essentially growth related. Table 4 following this discussion presents a comparative analysis of the components of non-interest income.
Non-Interest Expenses. Non-interest expenses totaled $24.1 million for the year ended December 31, 2007, an increase of $5.0 million over the $19.1 million reported for 2006. Substantially all of this increase resulted from the Bank’s growth and development during 2007 and 2006, including the opening and expanded staffing of several offices, and the full year of our Greensboro operations acquired in mid-2006. Personnel costs increased by $3.2 million, or 27.2%, with the majority of this increase attributable to the acquisition of SterlingSouth and to a lesser extent paying the salaries of the lenders and support staff at the new full-service and loan production offices. Included in this increase in personnel costs were the effects of the adoption of accounting standard SFAS 123(R), which added $97,000 and $222,000 to compensation expense during 2007 and 2006, respectively. In addition, with the Bank experiencing asset growth of 18.7% for the year, the necessary support staff also increased. Table 5 following this discussion presents a comparative analysis of the components of non-interest expenses.
Income Taxes. The provision for income taxes of $3.1 million in 2007 and $2.6 million in 2006 represents 29.1% and 29.8%, respectively, of income before income taxes. These effective rates are lower than the blended federal/North Carolina statutory rate of 38.55% principally due to tax-exempt income from municipal bonds and bank-owned life insurance.
LIQUIDITY
The Bank’s sources of funds are deposits, cash and demand balances due from other banks, interest-earning deposits in other banks and investment securities available for sale. These funds, together with loan repayments, are used to make loans and to fund continuing operations. In addition, at December 31, 2008, the Bank had credit availability with the FHLB of approximately $393.9 million, with $253.6 million outstanding.
Total deposits were $1.15 billion and $855.1 million at December 31, 2008 and 2007, respectively. As a result of the Company’s loan growth exceeding local deposit growth, the Bank utilized its wholesale funding sources, such as borrowings from the FHLB and correspondent banks and the wholesale CD market. Due to the availability of funds and a wide range of terms available in the wholesale CD market, the Bank grew out-of-market time deposits by $328.5 million in 2008, compared to a growth in that sector of $25.1 million in 2007. At December 31, 2008 and 2007, time deposits represented 78.6% and 66.7%, respectively, of the Company’s total deposits. Certificates of deposit of $100,000 or more represented 59.1% and 48.9%, respectively, of the Bank’s total deposits at December 31, 2008 and 2007. At December 31, 2008 and 2007, the Company had $629.8 million and $301.3 million in wholesale time deposits, respectively. With many of the national and regional banks having liquidity challenges during the second half of 2008, deposit rates in our local markets were at times up to 100 basis points higher than comparable terms in the wholesale markets. While our first choice is always to raise funds in our local markets, with this substantial pricing disparity, management chose to utilize the wholesale CD markets much more in 2008. Management believes that most other time deposits are relationship-oriented. While the Bank will need to pay competitive rates to retain these deposits at their maturities, there are other subjective factors that will determine their continued retention. Based upon prior experience, the Bank anticipates that a substantial portion of outstanding certificates of deposit will renew upon maturity. While the Company has utilized wholesale CD’s and overnight advances from the FHLB as its primary funding source during 2008, these sources are not unlimited, and therefore may not be available to fund future growth in 2009 and beyond.
29
Management anticipates that the Bank will rely primarily upon wholesale funding sources, customer deposits, loan repayments and current earnings to provide liquidity, fund loans and to purchase securities. Securities will be primarily issued by the federal government and its agencies, municipal securities and agency sponsored mortgage-backed securities.
In the normal course of business there are various outstanding contractual obligations of the Bank that will require future cash outflows. In addition there are commitments and contingent liabilities, such as commitments to extend credit that may or may not require future cash outflows. Table 6 following this discussion, “Contractual Obligations and Commitments”, summarizes the Bank’s contractual obligations and commitments as of December 31, 2008.
CAPITAL RESOURCES
At December 31, 2008 and 2007, the Company’s tangible shareholders’ equity totaled $92.7 million and $58.2 million, respectively. The Company’s tangible equity to asset ratio on those dates was 5.90% and 5.28%, respectively. These ratios are above regulatory minimums necessary to be classified as well-capitalized.
During 2008 total shareholders’ equity increased by $34.3 million, or 39.7%. The largest component of the increase was the $31.26 million in capital funds obtained through the Capital Purchase Program. The Company reported net income of $3.99 million, accrued dividends on the CPP capital of $112,000, and declared cash dividends of $1.8 million during 2008. The Company and the Bank are subject to minimum capital requirements. See “PART 1, ITEM 1—DESCRIPTION OF BUSINESS” — Supervision and Regulation.”
All capital ratios place the Bank and Company in excess of the minimum required to be deemed adequately capitalized by regulatory measures. During 2002, the Bank’s Total Capital to Risk Weighted Assets ratio fell below the 10% threshold to be considered a well-capitalized institution as a result of the high concentration of cash paid in the Bank’s acquisition of a smaller community bank located in Kernersville, North Carolina. The Company’s wholly owned capital trust issued $5.0 million in trust preferred securities during the first half of 2003 to re-establish the Bank’s capital levels to well-capitalized. The Company’s capital trusts issued $7.0 million and $11.0 million of 30 year trust preferred securities during 2006 and 2004, respectively, while the Bank issued $8.0 million of subordinated debentures in 2005 to augment regulatory Tier I and Tier II capital. The Company’s Tier I Leverage ratio as of December 31, 2008 and 2007 was 8.77% and 7.25%, respectively.
Note O to the accompanying consolidated financial statements presents an analysis of the Company’s and Bank’s regulatory capital position as of December 31, 2008. Management expects that the Bank will remain “well-capitalized” for regulatory purposes throughout 2009, although there can be no assurance that the Bank or Company will not fall into the “adequately-capitalized” classification.
ASSET/LIABILITY MANAGEMENT
The Bank’s results of operations depend substantially on its net interest income. Like most financial institutions, the Bank’s interest income and cost of funds are affected by general economic conditions and by competition in the market place. The purpose of asset/liability management is to provide stable net interest income growth by protecting the Bank’s earnings from undue interest rate risk, which arises from volatile interest rates and changes in the balance sheet mix, and by managing the risk/return relationships between liquidity, interest rate risk, market risk, and capital adequacy. The Bank maintains, and has complied with, an asset/liability management policy approved by the Board of Directors of the Bank and the Company that provides guidelines for controlling exposure to interest rate risk by utilizing the following ratios and trend analysis: liquidity, equity, volatile liability dependence, portfolio maturities, maturing assets and maturing liabilities, earnings at risk, and economic value at risk. This policy is to control the exposure of its earnings to changing interest rates by generally endeavoring to maintain a position within a narrow range around an “earnings neutral position,” which is defined as the mix of assets and liabilities that generate a net interest margin that is least affected by interest rate changes.
When suitable lending opportunities are not sufficient to utilize available funds, the Bank has generally invested such funds in securities, primarily U.S. Treasury securities, securities issued by governmental agencies, government agency sponsored mortgage-backed securities and securities issued by local governmental municipalities. The securities portfolio contributes to the Bank’s, and thus the Company’s profits, and plays an important part in the overall interest rate management. However, management of the securities portfolio alone cannot balance overall interest rate risk. The securities portfolio must be used in combination with other asset/liability techniques to actively manage the balance sheet. The primary objectives in the overall management of the securities portfolio are safety, yield, liquidity, asset/liability management (interest rate risk), and investing in securities that can be pledged for public deposits or as collateral for FHLB advances or borrowings through the Federal Reserve’s Discount Window.
30
In reviewing the needs of the Bank with regard to proper management of its asset/liability program, the Bank’s management estimates its future needs, taking into consideration historical periods of high loan demand and low deposit balances, estimated loan and deposit increases (due to increased demand through marketing), and forecasted interest rate changes. A number of measures are used to monitor and manage interest rate risk, including income simulations and interest sensitivity analyses. An income simulation model is the primary tool used to assess the direction and magnitude of changes in net interest income resulting from changes in interest rates. Key assumptions in the model include prepayments on loan and loan-backed assets, cash flows and maturities of other investment securities, loan and deposit volumes and pricing. These assumptions are inherently uncertain and, as a result, the model cannot precisely estimate net interest income or precisely predict the impact of higher or lower interest rates on net interest income. Actual results will differ from simulated results due to timing, magnitude and frequency of interest rate changes and changes in market conditions and management strategies, among other factors.
Based on the results of the income simulation model as of December 31, 2008, looking forward for 12 months, the Bank would expect an increase in net interest income of $3.0 million if interest rates increase from current rates by 300 basis points and a decrease in net interest income of $4.2 million if applicable interest rates decrease from current rates by 300 basis points. However, in today’s economic environment, simulation models may not be as reliable as in the past.
The analysis of an institution’s interest rate gap (the difference between the repricing of interest-earning assets and interest-bearing liabilities during a given period of time) is another standard tool for the measurement of the exposure to interest rate risk. The management believes that because interest rate gap analysis does not address all factors that can affect earnings performance, it should be used in conjunction with other methods of evaluating interest rate risk.
Table 7 following this discussion, “Interest Rate Sensitivity Analysis” sets forth the amounts of interest-earning assets and interest-bearing liabilities outstanding at December 31, 2008, which are projected to reprice or mature in each of the future time periods shown. Except as stated below, the amounts of assets and liabilities shown which reprice or mature within a particular period were determined in accordance with the contractual terms of the assets or liabilities. Loans with adjustable rates are shown as being due at the end of the next upcoming adjustment period. Money market deposit accounts are considered rate sensitive and are placed in the shortest period, while negotiable order of withdrawal or other transaction accounts are assumed to be more stable sources that are less price elastic and have been placed in the longest period. In making the gap computations, none of the assumptions sometimes made regarding prepayment rates and deposit decay rates have been used for any interest-earning assets or interest-bearing liabilities. In addition, the table does not reflect scheduled principal payments, which will be received throughout the lives of the loans. The interest rate sensitivity of the Bank’s assets and liabilities illustrated in the following table would vary substantially if different assumptions were used or if actual experience differs from that indicated by such assumptions.
Table 7 illustrates that if assets and liabilities reprice in the time intervals indicated in the table, the Bank is liability sensitive within twelve months, and asset sensitive thereafter. As stated above, certain shortcomings are inherent in the method of analysis presented in the foregoing table. For example, although certain assets and liabilities may have similar maturities or periods to repricing, they may react in different degrees to changes in market interest rates. Also, the interest rates on certain types of assets and liabilities may fluctuate in advance of changes in market interest rates, while interest rates on other types may lag behind changes in market interest rates. For instance, while the table is based on the assumption that money market accounts are immediately sensitive to movements in rates, the Bank expects that in a changing rate environment the amount of the adjustment in interest rates for such accounts would be less than the adjustment in categories of assets that are considered to be immediately sensitive. The same is true for all other interest bearing transaction accounts. Additionally, certain assets have features that restrict changes in the interest rates of such assets both on a short-term basis and over the lives of such assets. Further, in the event of a change in market interest rates, prepayment and early withdrawal levels could deviate significantly from those assumed in calculating the tables. Finally, the ability of many borrowers to service their adjustable-rate debt may decrease in the event of an increase in market interest rates. Due to these shortcomings, the Bank places primary emphasis on its income simulation model when managing its exposure to changes in interest rates.
31
LENDING ACTIVITIES
General. The Bank provides to its customers a full range of short- to medium-term commercial, mortgage, construction and personal loans, both secured and unsecured. The Bank also makes real estate mortgage and construction loans.
The Bank’s loan policies and procedures establish the basic guidelines governing its lending operations. Generally, the guidelines address the types of loans that the Bank seeks, target markets, underwriting and collateral requirements, terms, interest rate and yield considerations and compliance with laws and regulations. All loans or credit lines are subject to approval procedures and amount limitations. These limitations apply to the borrower’s total outstanding indebtedness to the Bank, including the indebtedness of any guarantor. The policies are reviewed and approved at least annually by the Boards of Directors of the Bank and the Company. The Bank supplements its own supervision of the loan underwriting and approval process with periodic loan audits by internal loan examiners and outside professionals experienced in loan review work. The Bank has focused its portfolio lending activities on higher yielding commercial loans.
Table 8 following this discussion provides an analysis of the Bank’s loan portfolio composition by type of loan as of the end of each of the last five years.
Table 9 following this discussion presents, at December 31, 2008, (i) the aggregate maturities or repricing of loans in the named categories of the Company’s loan portfolio and (ii) the aggregate amounts of variable and fixed rate loans that mature or reprice after one year.
Commercial Loans. Commercial business lending is a major focus of the Bank’s lending activities. At December 31, 2008, the Bank’s commercial and industrial loan portfolio equaled $113.8 million or 11.3% of total loans, as compared with $124.2 million or 13.3% of total loans at December 31, 2007. Commercial and industrial loans include both secured and unsecured loans for working capital, expansion, and other business purposes. Short-term working capital loans generally are secured by accounts receivable, inventory and/or equipment. The Bank also makes term commercial loans secured by real estate, which are categorized as real estate loans. Lending decisions are based on an evaluation of the financial strength, management and credit history of the borrower, and the quality of the collateral securing the loan. With few exceptions, the Bank requires personal guarantees and secondary sources of repayment. Commercial loans generally provide greater yields and reprice more frequently than other types of loans, such as real estate loans. More frequent repricing means that yields on our commercial loans adjust with changes in interest rates.
Real Estate Loans. Real estate loans are made for purchasing and refinancing one to four family, five or more family and commercial properties. Real estate loans also include home equity credit lines. The Bank offers fixed and adjustable rate options and provides customers access to long-term conventional real estate loans through its mortgage loan department which makes secondary market conforming loans that are originated with a commitment from a correspondent to purchase the loan within 30 days of closing.
Residential real estate loans amounted to $234.9 million and $211.6 million at December 31, 2008 and 2007, respectively. The Bank’s residential mortgage loans are generally secured by properties located within the Bank’s market area. The financing of residential properties, both 1-4 and multi-family, for rental purposes has historically been the predominant portion of the residential real estate portfolio, as Thomasville and Lexington have a high ratio of renters per capita.
Many of the residential mortgage loans that the Bank makes are originated for the account of third parties. Such loans are classified as loans held for sale in the financial statements. The Bank receives fees for each such loan originated, with such fees aggregating $783,000 for the year ended December 31, 2008 and $839,000 for the year ended December 31, 2007. The Bank anticipates that it will continue to be an active originator of residential loans for the account of third parties. The Bank does not originate sub-prime mortgages, unless through a correspondent who has full underwriting authority. In these cases, since the Bank is not involved in the credit decision, there is limited exposure to defaults and buy back provisions.
Commercial real estate loans totaled $340.1 million and $293.7 million at December 31, 2008 and 2007, respectively. This lending has involved loans secured principally by commercial buildings for office, storage and warehouse space, and by agricultural properties. Generally in underwriting commercial real estate loans, the Bank requires the personal guaranty of borrowers and a
32
demonstrated cash flow capability sufficient to service the debt. Loans secured by commercial real estate may be in greater amount and involve a greater degree of risk than one to four family residential mortgage loans. Payments on such loans are often dependent on successful operation or management of the properties.
Real Estate Construction Loans. Real estate loans are made for constructing one to four family and multi- family residential properties, the acquisition and development of land for the purpose of providing residential and commercial lots for sale, and the construction of commercial properties. The Bank primarily offers a variable rate options and provides customers access to short-term conventional real estate financing through a reasonable construction and development process. At December 31, 2008, the real estate construction loan portfolio was $307.2 million, which consisted of the following categories:
| | | |
• Acquisition and development | | $ | 73.9 million |
| |
• Residential construction | | $ | 86.8 million |
| |
• Commercial construction | | $ | 60.7 million |
| |
• 1-4 buildable lots | | $ | 25.9 million |
| |
• Commercial buildable lots | | $ | 16.1 million |
| |
• Land held for development | | $ | 29.3 million |
| |
• Raw/Agricultural land | | $ | 14.5 million |
Management closely monitors residential real estate, specifically its Acquisition, Development and Construction loans, since these loans are generally considered most vulnerable to economic downturns. We attempt to mitigate this risk by employing experienced real estate lenders, providing real estate underwriting standards within the Credit Policy Manual, engaging an outside firm to conduct ongoing credit reviews and most recently, contracting with a firm to provide quarterly real estate updates and trends for communities we have credit exposure. Most residential construction loans require full personal guarantees from the principals of the borrowing entity and maturities are typically limited to 12 months. Trends within the bank’s real estate portfolio have followed the general trends within our markets including increases in average time houses are on the market for sale and housing inventory available for sale with a slight decrease in average home prices. Increases in 2007 and 2008 non-performing assets were primarily due to specific adjustments within the real estate portfolio.
The first program we initiated after receiving Capital Purchase Program funds is our Builder Participation Program. This Program makes available up to $100 million of in-house credit to qualified buyers who purchase residential housing inventory currently being financed as part of our $86.8 million residential construction loan portfolio. With the secondary mortgage market functioning inefficiently, we have increased our in-house commitment to fill the credit vacuum, providing builders in our market with a source of qualified buyers and making affordable and rational credit more readily accessible. The Builder Participation Program is a major commitment on our part to help stabilize the housing market in our communities and provide credit locally to those buyers wishing to purchase a house in our construction portfolio. To date, $5.9 million of mortgage loans have been provided under the Builder Participation Program, reducing the residential construction portfolio by $5.0 million.
Loans to Individuals. Loans to individuals include automobile loans; boat and recreational vehicle financing and miscellaneous secured and unsecured personal loans. Consumer loans generally can carry significantly greater risks than other loans, even if secured, because the collateral often consists of rapidly depreciating assets such as automobiles and equipment. Repossessed collateral securing a defaulted consumer loan may not provide an adequate source of repayment of the loan. Consumer loan collections are sensitive to job loss, illness and other personal factors. The Bank attempts to manage the risks inherent in consumer lending by following established credit guidelines and underwriting practices designed to minimize risk of loss.
COMMITMENTS TO EXTEND CREDIT
In the ordinary course of business, the Bank enters into various types of transactions that include commitments to extend credit that are not included in loans receivable, net, presented on the Company’s consolidated balance sheets. The Bank applies the same credit standards to these commitments as it uses in all its lending activities and has included these commitments in its lending risk evaluations. The Bank’s exposure to credit loss under commitments to extend credit is represented by the amount of these commitments. See Table 6 and Note Q to the accompanying consolidated financial statements.
33
ASSET QUALITY
The Bank considers asset quality to be of primary importance, and employs a formal internal loan review process to ensure adherence to its lending policy as approved by the Bank’s and the Company’s Boards of Directors. It is the responsibility of each lending officer to assign an appropriate risk grade to every loan originated. Credit Administration, through the loan review process, validates the accuracy of the initial risk grade assessment. In addition, as a given loan’s credit quality improves or deteriorates, it is Credit Administration’s responsibility to change the borrower’s risk grade accordingly. The function of determining the allowance for loan losses is fundamentally driven by the risk grade system. In determining the allowance for loan losses and any resulting provision to be charged against earnings, particular emphasis is placed on the results of the loan review process. Consideration is also given to historical loan loss experience, the value and adequacy of collateral, economic conditions in the Bank’s market area and other factors. For loans determined to be impaired, the allowance is based on discounted cash flows using the loan’s initial effective interest rate or the fair value of the collateral for certain collateral dependent loans. This evaluation is inherently subjective, as it requires material estimates, including the amounts and timing of future cash flows expected to be received on impaired loans that may be susceptible to significant change. The allowance for loan losses represents management’s estimate of the appropriate level of reserve to provide for probable losses inherent in the loan portfolio.
The Bank’s policy regarding past due loans normally requires a prompt charge-off to the allowance for loan losses following timely collection efforts and a thorough review. Further efforts are then pursued through various means available. Loans carried in a non-accrual status are generally collateralized and probable losses are considered in the determination of the allowance for loan losses.
NONPERFORMING ASSETS
Our non-performing assets, which consist of loans past due 90 days or more, real estate acquired in the settlement of loans, restructured loans and loans in nonaccrual status, increased to $18.0 million, or 1.17% of total assets, at December 31, 2008 from $6.1 million, or 0.54% of total assets at December 31, 2007. This increase was primarily due to a continued softening in the real estate market, particularly in four large acquisition and development loans that were in various stages of the workout process. Our allowance for loan losses, expressed as a percentage of gross loans, was 1.31% and 1.26% at December 31, 2008 and 2007, respectively.
Table 10 following this discussion sets forth, for the periods indicated, information with respect to the Bank’s nonaccrual loans, restructured loans, total nonperforming loans (nonaccrual loans plus restructured loans plus loans ninety days past due and still accruing), and total nonperforming assets.
The Company’s consolidated financial statements are prepared on the accrual basis of accounting, including the recognition of interest income on loans, unless we place a loan on nonaccrual basis. The Bank accounts for loans on a nonaccrual basis when it has serious doubts about the ability to collect principal or interest in full. Generally, the Bank’s policy is to place a loan on nonaccrual status when the loan becomes past due 90 days. Loans are also placed on nonaccrual status in cases where management is uncertain whether the borrower can satisfy the contractual terms of the loan agreement. Amounts received on nonaccrual loans generally are applied first to principal and then to interest only after all principal has been collected. Restructured loans are those for which concessions, including the reduction of interest rates below a rate otherwise available to that borrower or the deferral of interest or principal, have been granted due to the borrower’s weakened financial condition. The Bank accrues interest on restructured loans at the restructured rates when management anticipates that no loss of original principal will occur. Potential problem loans are loans which are currently performing and are not included in nonaccrual or restructured loans above, but about which management has serious doubts as to the borrower’s ability to comply with present repayment terms. These loans are likely to be included later in nonaccrual, past due or restructured loans, so they are considered by management in assessing the adequacy of the Bank’s allowance for loan losses. At December 31, 2008, the Bank had $13.3 million in nonaccrual and renegotiated loans, an increase from the $3.6 million at the end of 2007. There were no loans ninety-days past due and still accruing interest at the end of either 2007 or 2008. Real estate owned consists of foreclosed, repossessed and idled properties. At December 31, 2008 and 2007, there were $5.0 million and $2.5 million, respectively, in assets classified as real estate owned.
34
ANALYSIS OF ALLOWANCE FOR LOAN LOSSES
The allowance for loan losses is established through charges to earnings in the form of a provision for loan losses. Management increases allowance for loan losses by provisions charged to operations and by recoveries of amounts previously charged off. The allowance is reduced by loans charged off. Management evaluates the adequacy of the allowance at least quarterly. In addition, on a quarterly basis our Board of Directors reviews the loan portfolio, conducts an evaluation of credit quality and reviews the computation of the loan loss allowance. In evaluating the adequacy of the allowance, management considers the growth, composition and industry diversification of the portfolio, historical loan loss experience, current delinquency levels, adverse situations that may affect a borrower’s ability to repay, estimated value of any underlying collateral, prevailing economic conditions and other relevant factors deriving from the Bank’s history of operations. In addition to the Bank’s history, management also considers the loss experience and allowance levels of other similar banks and the historical experience encountered by our management and senior lending officers prior to joining us. In addition, regulatory agencies, as an integral part of their examination process, periodically review allowance for loan losses and may require us to make additions for estimated losses based upon judgments different from those of management. No regulatory agency asked for a change in our allowance for loan losses during 2008 or 2007.
Management uses the risk-grading program, as described under “Asset Quality,” to facilitate evaluation of probable inherent loan losses and the adequacy of the allowance for loan losses. In this program, risk grades are initially assigned by loan officers and reviewed by Credit Administration, and tested by the Bank’s internal auditor. The testing program includes an evaluation of a sample of new loans, large loans, loans that are identified as having potential credit weaknesses, loans past due 90 days or more and still accruing, and nonaccrual loans. The Bank strives to maintain the loan portfolio in accordance with conservative loan underwriting policies that result in loans specifically tailored to the needs of the Bank’s market area. Every effort is made to identify and minimize the credit risks associated with such lending strategies. The Bank has no foreign loans and does not engage in significant lease financing or highly leveraged transactions.
Management follows a loan review program designed to evaluate the credit risk in our loan portfolio. Through this loan review process, we maintain an internally classified watch list that helps management assess the overall quality of the loan portfolio and the adequacy of the allowance for loan losses. In establishing the appropriate classification for specific assets, management considers, among other factors, the estimated value of the underlying collateral, the borrower’s ability to repay, the borrower’s payment history and the current delinquent status. As a result of this process, certain loans are categorized as substandard, doubtful or loss and reserves are allocated based on management’s judgment and historical experience.
Loans classified as “substandard” are those loans with clear and defined weaknesses such as unfavorable financial ratios, uncertain repayment sources or poor financial condition that may jeopardize the liquidation of the debt. They are characterized by the distinct possibility that the Bank will sustain some losses if the deficiencies are not corrected. A reserve range of 5%—45% is generally allocated to these loans, depending on credit quality. Loans classified as “doubtful” are those loans that have characteristics similar to substandard loans but with an increased risk that collection or liquidation in full is highly questionable and improbable. A reserve of 50% or greater is generally allocated to loans classified as doubtful. Loans classified as “loss” are considered uncollectible and of such little value that their continuance as bankable assets is not warranted. This classification does not mean that the loan has absolutely no recovery or salvage value but rather it is not practical or desirable to defer writing off this asset even though partial recovery may be achieved in the future. As a practical matter, when loans are identified as loss they are charged off against the allowance for loan losses. In addition to the above classification categories, the Bank also categorizes loans based upon risk grade and loan type, assigning an allowance allocation based upon each category.
Growth in loans outstanding has, throughout the Bank’s history, been the primary reason for increases in the Bank’s allowance for loan losses and the resultant provisions for loan losses necessary to provide for those increases. This growth has been spread among the Bank’s major loan categories, with the concentrations of major loan categories being relatively consistent from 2000 through 2003. Over the five-year period from 2004 through 2008, there has been an increase in the concentration of real estate construction loans and real estate loans while there has been a decline in the percentage of the portfolio made up of commercial and industrial loans. This reflects the real estate lending background and experience of our lenders and the growth opportunities in the Salisbury, Harrisburg, Greensboro and High Point markets.
For the five fiscal years 2003 through 2007, the Bank’s loan loss experience has seen net loan charge-offs in each year of range from 0.09% to 0.38% of average loans outstanding. For 2008, net charge-offs were 0.58% of average loans outstanding as compared to 0.20% in the prior year. This increase in the amount of net charge-offs in 2008, compared to 2007 and historical ranges, was due primarily to a significant softening of both the local housing market and local economy, and one commercial relationship that was settled in the fourth quarter.
35
The Bank’s allowance for loan losses at December 31, 2008 of $13.2 million represents 1.31% of total loans outstanding, excluding loans held for sale. The Bank’s allowance for loan losses at December 31, 2007 of $11.8 million represented 1.26% of total loans outstanding, excluding loans held for sale. This increase in the allowance relative to our gross loans was primarily due to a higher level of perceived risk in this environment, and a greater amount of specific credits where impairment assessments have been assigned.
The allowance for loan losses represents management’s estimate of an amount adequate to provide for known and inherent losses in the loan portfolio in the normal course of business. The Bank makes specific allowances that are allocated to certain individual loans and pools of loans based on risk characteristics, as discussed below. While management believes that it uses the best information available to establish the allowance for loan losses, future adjustments to the allowance may be necessary and results of operations could be adversely affected if circumstances differ substantially from the assumptions used in making the determinations.
Furthermore, while management believes it has established the allowance for loan losses in conformity with U.S. generally accepted accounting principles, there can be no assurance that regulators, in reviewing our portfolio, will not require an adjustment to the allowance for loan losses. No regulatory agency asked for a change in our allowance for loan losses during 2008 or 2007. In addition, because future events affecting borrowers and collateral cannot be predicted with certainty, there can be no assurance that the existing allowance for loan losses is adequate or that increases will not be necessary should the quality of any loans deteriorate as a result of the factors discussed herein. Any material increase in the allowance for loan losses may adversely affect the Bank’s and the Company’s financial condition and results of operations.
The Bank’s primary markets, including the counties of Davidson, Guilford, Randolph, Forsyth, Iredell, Rowan and Cabarrus have historically been very heavily concentrated in textile, furniture, and heavy manufacturing. With the competition from overseas, these industries have experienced significant plant closings and layoffs in our markets. To this point, the retraction in the manufacturing base has had a minimal impact on our loan quality, except as noted in the Thomasville and Archdale markets. However, if this trend continues, it could negatively impact the Bank’s asset quality.
Table 11 following this discussion shows the allocation of the allowance for loan losses at the dates indicated. The allocation is based on an evaluation of defined loan problems, historical ratios of loan losses and other factors that may affect future loan losses in the categories of loans shown.
Table 12 following this discussion sets forth for the periods indicated information regarding changes in the Bank’s allowance for loan losses.
INVESTMENT ACTIVITIES
The Bank’s portfolio of investment securities, all of which are available for sale, consists primarily of securities issued by government sponsored agencies, and local governmental municipalities. Securities to be held for indefinite periods of time and not intended to be held to maturity are classified as available for sale and carried at fair value with any unrealized gains or losses, net of related taxes, reflected as an adjustment to stockholders’ equity. Securities held for indefinite periods of time include securities that management intends to use as part of its asset/liability management strategy and that may be sold in response to changes in interest rates and/or significant prepayment risks. It is the Bank’s policy to classify all investment securities as available for sale, except in the case with certain corporate bond investments in other local community banks. Table 13 following this discussion summarizes securities available for sale and held to maturity.
Table 13 following this discussion summarizes the amortized costs, gross unrealized gains and losses and estimated fair values of securities available for sale at December 31, 2008, 2007 and 2006.
Table 14 following this discussion summarizes the amortized costs, fair values and weighted average yields of securities available for sale at December 31, 2008, by contractual maturity groups.
The Bank does not engage in, nor does it presently intend to engage in, securities trading activities and therefore does not maintain a trading account. At December 31, 2008, there were no securities of any issuer (other than governmental agencies) that exceeded 10% of the Company’s shareholders’ equity.
36
SOURCES OF FUNDS
Deposit Activities. The Bank provides a range of deposit services, including non-interest-bearing checking accounts, interest-bearing checking and savings accounts, money market accounts and certificates of deposit. These accounts generally earn interest at rates established by management based on competitive market factors and management’s desire to increase or decrease certain types or maturities of deposits. During 2008, the Bank’s deposit mix shifted more towards large denomination time deposits, primarily provided through wholesale sources. Interest bearing demand accounts decreased by $34.4 million, or 16.6%, primarily due to a shifting of large balance money market accounts to the CDARS time deposit product which provides up to $50 million in FDIC protection, or to other competitors which were offering rates significantly above the market.
Total deposits were $1.15 billion and $855.1 million at December 31, 2008 and 2007, respectively. As a result of the Company’s loan growth exceeding local deposit growth, the Bank utilized its wholesale funding sources, such as borrowings from the FHLB and correspondent banks and the wholesale CD market. Due to the availability of funds and a wide range of terms available in the wholesale CD market, the Bank grew out-of-market time deposits by $328.5 million in 2008, compared to a growth in that sector of $25.1 million in 2007. At December 31, 2008 and 2007, time deposits represented 78.6% and 66.7%, respectively, of the Company’s total deposits. Certificates of deposit of $100,000 or more represented 59.1% and 48.9%, respectively, of the Bank’s total deposits at December 31, 2008 and 2007. At December 31, 2008 and 2007, the Company had $629.8 million and $301.3 million in wholesale time deposits, respectively. With many of the national and regional banks having liquidity challenges during the second half of 2008, deposit rates in our local markets were at times up to 100 basis points higher than comparable terms in the wholesale markets. While our first choice is always to raise funds in our local markets, with this substantial pricing disparity, management chose to utilize the wholesale CD markets much more in 2008. Management believes that most other time deposits are relationship-oriented. While the Bank will need to pay competitive rates to retain these deposits at their maturities, there are other subjective factors that will determine their continued retention. Based upon prior experience, the Bank anticipates that a substantial portion of outstanding certificates of deposit will renew upon maturity. While the Company has utilized wholesale CD’s and overnight advances from the FHLB as its primary funding source during 2008, these sources are not unlimited, and therefore may not be available to fund future growth in 2009 and beyond.
Borrowings. Borrowings provide an additional source of funding for the Bank. The Bank may purchase federal funds through unsecured federal funds guidance lines of credit totaling $40.0 million at December 31, 2008. In addition, the Company has an unsecured line of $20 million that is available to utilize at management’s discretion. These lines are intended for short-term borrowings and are subject to restrictions limiting the frequency and terms of advances. These lines of credit are payable on demand and bear interest based upon the daily federal funds rate plus a small spread. The Bank and Company had $0 million and $500,000, respectively, outstanding on the lines of credit as of December 31, 2007. The Bank and Company had $10.8 million and $7.5 million, respectively, outstanding on the lines of credit as of December 31, 2007.
As an additional source of borrowings the Bank utilizes securities sold under agreements to repurchase, with balances outstanding of $14.0 million and $9.9 million at December 31, 2008 and 2007, respectively. Securities sold under agreements to repurchase generally mature within one day from the transaction date and are collateralized by securities issued by local governmental municipalities.
The Bank also uses advances from the FHLB of Atlanta under a line of credit equal to 30% of the Bank’s total assets, subject to qualifying collateral being pledged. Outstanding advances totaled $253.6 million and $122.7 million at December 31, 2008 and 2007, respectively. These advances are secured by a blanket-floating lien on qualifying first mortgage loans, equity lines of credit, certain commercial real estate loans, and certain agency sponsored mortgage-backed securities pledged to the FHLB. A more detailed analysis of the Bank’s FHLB advances is presented in Note H and Note I to the consolidated financial statements.
Table 15 following this discussion sets forth for the periods indicated the average balances outstanding and average interest rates for each major category of deposits.
Table 16 following this discussion sets forth at the dates indicated the amounts and maturities of certificates of deposit with balances of $100,000 or more at December 31, 2008.
37
Table 17 following this discussion sets forth for the periods indicated information regarding the Company’s borrowed funds.
MARKET RISK
Market risk reflects the risk of economic loss resulting from adverse changes in market price and interest rates. This risk of loss can be reflected in diminished current market values and/or reduced potential net interest income in future periods. Our market risk arises primarily from interest rate risk inherent in our lending and deposit-taking activities. The structure of our loan and deposit portfolios is such that a significant decline in interest rates may adversely impact net market values and net interest income. We do not maintain a trading account nor are we subject to currency exchange risk or commodity price risk. Interest rate risk is monitored as part of the bank’s asset/liability management function. See “ASSET/LIABILITY MANAGEMENT” on page 30 of this Report.
Table 7 following this discussion sets forth the amounts of interest-earning assets and interest-bearing liabilities outstanding at December 31, 2008, which are projected to reprice or mature in each of the future time periods shown.
Table 18 following this discussion presents information about the contractual maturities, average interest rates and estimated fair values of our financial instruments that are considered market risk sensitive at December 31, 2008.
DERIVATIVE FINANCIAL INSTRUMENTS
A derivative is a financial instrument that derives its cash flows, and therefore its value, by reference to an underlying instrument, index or reference rate. These instruments primarily consist of interest rate swaps, caps, floors, financial forward and futures contracts and options written or purchased. Derivative contracts are written in amounts referred to as notional amounts. Notional amounts only provide the basis for calculating payments between counterparties and do not represent amounts to be exchanged between parties and are not a measure of financial risk. Credit risk arises when amounts receivable from a counterparty exceed amounts payable. We control our risk of loss on derivative contracts by subjecting counterparties to credit reviews and approvals similar to those used in making loans and other extensions of credit.
We have used interest rate swaps in the management of interest rate risk. Interest rate swaps are contractual agreements between two parties to exchange a series of cash flows representing interest payments. A swap allows both parties to alter the repricing characteristics of assets or liabilities without affecting the underlying principal positions. Through the use of a swap, assets and liabilities may be transformed from fixed to floating rates, from floating rates to fixed rates, or from one type of floating rate to another. At December 31, 2008, swap derivatives with a total notional value of $55.0 million, with remaining terms ranging up to four years, were outstanding. Although off-balance sheet derivative financial instruments do not expose us to credit risk equal to the notional amount, such agreements generate credit risk to the extent of the fair value gain in an off-balance sheet derivative financial instrument if the counterparty fails to perform. We minimize such risk by evaluating the creditworthiness of the counterparties and consistently monitoring these agreements. The counterparties to these arrangements are primarily large commercial banks and investment banks. Where appropriate, master netting agreements are arranged or collateral is obtained in the form of rights to securities. At December 31, 2008, our interest rate swaps reflected a net unrealized gain of $4.5 million.
Other risks associated with interest-sensitive derivatives include the effect on fixed rate positions during periods of changing interest rates. Indexed amortizing swaps’ notional amounts and maturities change based on certain interest rate indices. Generally, as rates fall the notional amounts decline more rapidly, and as rates increase notional amounts decline more slowly. As of December 31, 2008, we had no indexed amortizing swaps outstanding. Under unusual circumstances, financial derivatives also increase liquidity risk, which could result from an environment of rising interest rates in which derivatives produce negative cash flows while being offset by increased cash flows from variable rate loans. We consider such risk to be insignificant due to the relatively small derivative positions we hold. A discussion of derivatives is presented in Note P to our consolidated financial statements, which are presented under Item 8 of Part II in this Form 10-K.
38
QUARTERLY FINANCIAL INFORMATION
Table 19 following this discussion sets forth, for the periods indicated, certain of our consolidated quarterly financial information. This information is derived from our unaudited financial statements, which include, in the opinion of management, all normal recurring adjustments which management considers necessary for a fair presentation of the results for such periods. This information should be read in conjunction with our consolidated financial statements included elsewhere in this report. The results for any quarter are not necessarily indicative of results for any future period.
RECENT ACCOUNTING PRONOUNCEMENTS
See Note A to the Consolidated Financial Statements for a full description of recent accounting pronouncements including the respective expected dates of adoption and effects on results of operations and financial condition.
CRITICAL ACCOUNTING ESTIMATES AND POLICIES
The Company prepares its consolidated financial statements in conformity with accounting principles generally accepted in the United States of America. The preparation of these financial statements requires management to make estimates and assumptions that affect the reported amounts of assets and liabilities and disclosure of contingent assets and liabilities at the date of the financial statements, and the reported amount of revenues and expenses during the reporting period. Actual results could differ from those estimates.
Critical accounting estimates and policies are those management believes are both most important to the portrayal of the Company’s financial condition and results, and require management’s most difficult, subjective or complex judgments, often as a result of the need to make estimates about the effect of matters that are inherently uncertain. Judgments and uncertainties affecting the application of those policies may result in materially different amounts being reported under different conditions or using different assumptions. The allowance for loan losses represents a particularly sensitive accounting estimate. The amount of the allowance is based on management’s evaluation of the collectibility of the loan portfolio, including the maturity of the loan portfolio, credit concentration, trends in historical loss experience, specific impaired loans and general economic conditions. For further discussion of the allowance for loan losses and a detailed description of the methodology used in determining the adequacy of the allowance, see the sections of this discussion titled “Asset Quality” and “Analysis of Allowance for Loan Losses” and Note D to the consolidated financial statements contained in this Annual Report.
Additionally, intangible assets are subject to sensitive accounting estimate. Intangible assets include goodwill and other identifiable assets, such as core deposit premiums, resulting from acquisitions. Core deposit premiums are amortized primarily on a straight-line basis over a ten-year life based upon historical studies of core deposits. Goodwill is not amortized but is tested annually for impairment or at any time an event occurs or circumstances change that may trigger a decline in the value of the reporting unit. Examples of such events or circumstances include a decline in the value of the Company’s common stock below book value, adverse changes in legal factors, business climate, unanticipated competition, change in regulatory environment, or loss of key personnel.
The Company tests for impairment in accordance with SFAS No. 142. Potential impairment of goodwill exists when the carrying amount of a reporting unit exceeds its fair value. Management first estimates the fair value of the Company in a business combination using one of two approaches. The Comparable Transaction Approach utilizes a regional transaction group and a national transaction group. For each group, average and median pricing ratios were applied to provide a range of values along with several qualitative factors being considered. The Discounted Cash Flow Approach is derived from the present value of future dividends over a five year time horizon and the projected terminal value at the end of the fifth year. The goodwill that would arise from this estimate is compared to the carrying value of the goodwill currently on the books to determine impairment.
To the extent a reporting unit’s carrying amount exceeds its fair value, an indication exists that the reporting unit’s goodwill may be impaired, and a second step of impairment test will be performed. In the second step, the implied fair value of the reporting unit’s goodwill, determined by allocating the reporting unit’s fair value to all of its assets (recognized and unrecognized) and liabilities as if the reporting unit had been acquired in a business combination at the date of the impairment test. If the implied fair value of reporting unit goodwill is lower than its carrying amount, goodwill is impaired and is written down to its implied fair value. The loss recognized is limited to the carrying amount of goodwill. Once an impairment loss is recognized, future increases in fair value will not result in the reversal of previously recognized losses.
39
OFF-BALANCE SHEET ARRANGEMENTS
Information about our off-balance sheet risk exposure is presented in Note Q to the accompanying consolidated financial statements. As part of our ongoing business, we do not participate in transactions that generate relationships with unconsolidated entities or financial partnerships, such as entities often referred to as special purpose entities (SPEs), which generally are established for the purpose of facilitating off-balance sheet arrangements or other contractually narrow or limited purposes. As of December 31, 2008, our SPE activity is limited to our capital trust subsidiaries: BNC Bancorp Capital Trust I, BNC Bancorp Capital Trust II, BNC Bancorp Capital Trust III and BNC Bancorp Capital Trust IV, which in aggregate issued 23,000,000 Trust Preferred Securities.
| ITEM 7A. | QUANTITATIVE AND QUALITATIVE DISCLOSURES ABOUT MARKET RISK |
See “Market Risk” under item 7.
40
BNC Bancorp
Table 2
Average Balances and Net Interest Income
($ in thousands)
| | | | | | | | | | | | | | | | | | | | | | | | | | | | | | |
| | | Year Ended December 31, 2008 | | | Year Ended December 31, 2007 | | | Year Ended December 31, 2006 | |
| | | Average
Balance | | | Interest | | Average
Rate | | | Average
Balance | | | Interest | | Average
Rate | | | Average
Balance | | | Interest | | Average
Rate | |
Interest-earning assets: | | | | | | | | | | | | | | | | | | | | | | | | | | | | | | |
Loans, net (1) | | $ | 981,069 | | | $ | 64,855 | | 6.61 | % | | $ | 849,271 | | | $ | 69,280 | | 8.16 | % | | $ | 615,689 | | | $ | 50,002 | | 8.12 | % |
Investment securities, tax effected (2) | | | 119,531 | | | | 7,471 | | 6.25 | % | | | 79,727 | | | | 5,291 | | 6.64 | % | | | 58,519 | | | | 3,883 | | 6.64 | % |
Interest-earning balances | | | 2,243 | | | | 92 | | 4.10 | % | | | 8,353 | | | | 393 | | 4.70 | % | | | 8,348 | | | | 353 | | 4.23 | % |
Other | | | 13,923 | | | | 421 | | 3.02 | % | | | 6,405 | | | | 275 | | 4.29 | % | | | 3,425 | | | | 235 | | 6.86 | % |
| | | | | | | | | | | | | | | | | | | | | | | | | | | | | | |
| | | | | | | | | |
Total interest-earning assets | | | 1,116,766 | | | | 72,839 | | 6.52 | % | | | 943,756 | | | | 75,239 | | 7.97 | % | | | 685,981 | | | | 54,473 | | 7.94 | % |
| | | | | | | | | | | | | | | | | | | | | | | | | | | | | | |
| | | | | | | | | |
Other assets | | | 110,480 | | | | | | | | | | 97,262 | | | | | | | | | | 62,016 | | | | | | | |
| | | | | | | | | | | | | | | | | | | | | | | | | | | | | | |
| | | | | | | | | |
Total assets | | $ | 1,227,246 | | | | | | | | | $ | 1,041,018 | | | | | | | | | $ | 747,997 | | | | | | | |
| | | | | | | | | | | | | | | | | | | | | | | | | | | | | | |
| | | | | | | | | |
Interest-bearing liabilities: | | | | | | | | | | | | | | | | | | | | | | | | | | | | | | |
Deposits: | | | | | | | | | | | | | | | | | | | | | | | | | | | | | | |
Demand deposits | | | 180,353 | | | | 2,725 | | 1.51 | % | | | 195,542 | | | | 6,175 | | 3.16 | % | | | 141,467 | | | | 3,947 | | 2.79 | % |
Savings deposits | | | 11,058 | | | | 13 | | 0.12 | % | | | 10,725 | | | | 48 | | 0.45 | % | | | 10,739 | | | | 65 | | 0.61 | % |
Time deposits | | | 698,647 | | | | 27,978 | | 4.00 | % | | | 576,488 | | | | 29,280 | | 5.08 | % | | | 411,878 | | | | 18,306 | | 4.44 | % |
Borrowings | | | 173,113 | | | | 6,710 | | 3.88 | % | | | 108,940 | | | | 5,762 | | 5.29 | % | | | 79,241 | | | | 4,163 | | 5.25 | % |
| | | | | | | | | | | | | | | | | | | | | | | | | | | | | | |
| | | | | | | | | |
Total interest-bearing liabilities | | | 1,063,171 | | | | 37,426 | | 3.52 | % | | | 891,695 | | | | 41,265 | | 4.63 | % | | | 643,325 | | | | 26,481 | | 4.12 | % |
| | | | | | | | | | | | | | | | | | | | | | | | | | | | | | |
| | | | | | | | | |
Non-interest-bearing deposits | | | 72,008 | | | | | | | | | | 67,774 | | | | | | | | | | 51,822 | | | | | | | |
Other liabilities | | | 5,209 | | | | | | | | | | 5,484 | | | | | | | | | | 3,900 | | | | | | | |
Shareholders’ equity | | | 86,858 | | | | | | | | | | 76,065 | | | | | | | | | | 48,949 | | | | | | | |
| | | | | | | | | | | | | | | | | | | | | | | | | | | | | | |
| | | | | | | | | |
Total liabilities and stockholders’ equity | | $ | 1,227,246 | | | | | | | | | $ | 1,041,018 | | | | | | | | | $ | 747,997 | | | | | | | |
| | | | | | | | | | | | | | | | | | | | | | | | | | | | | | |
| | | | | | | | | |
Net interest income and interest rate spread (3) | | | | | | $ | 35,413 | | 3.00 | % | | | | | | $ | 33,974 | | 3.34 | % | | | | | | $ | 27,992 | | 3.82 | % |
| | | | | | | | | | | | | | | | | | | | | | | | | | | | | | |
| | | | | | | | | |
Net interest margin (4) | | | | | | | | | 3.17 | % | | | | | | | | | 3.60 | % | | | | | | | | | 4.08 | % |
| | | | | | | | | | | | | | | | | | | | | | | | | | | | | | |
| | | | | | | | | |
Ratio of average interest-earning assets to average interest-bearing liabilities | | | 105.04 | % | | | | | | | | | 105.84 | % | | | | | | | | | 106.63 | % | | | | | | |
| | | | | | | | | | | | | | | | | | | | | | | | | | | | | | |
| (1) | Average loans include non-accruing loans and loans held for sale. |
| (2) | Yields on tax-exempt investments have been adjusted to a fully taxable-equivalent basis (FTE) using the federal income tax rate of 34%. |
The taxable equivalent adjustment was $1.8 million, $1.3 million, and $953,000 for the years 2008, 2007, and 2006, respectively.
| (3) | Interest rate spread equals the earning asset yield minus the interest-bearing liability rate. |
| (4) | Net interest margin is computed by dividing net interest income by total earning assets. |
41
BNC Bancorp
Table 3
Volume and Rate Variance Analysis
(In Thousands)
| | | | | | | | | | | | | | | | | | | | | | | | |
| | | Year Ended December 31, 2008 vs. 2007 | | | Year Ended December 31, 2007 vs. 2006 | |
| | | Increase (Decrease) Due to | | | Increase (Decrease) Due to | |
| | | Volume | | | Rate | | | Total | | | Volume | | | Rate | | | Total | |
Interest income: | | | | | | | | | | | | | | | | | | | | | | | | |
Loans, net | | $ | 9,732 | | | $ | (14,157 | ) | | $ | (4,425 | ) | | $ | 19,012 | | | $ | 266 | | | $ | 19,278 | |
Investment securities, tax effected | | | 2,565 | | | | (385 | ) | | | 2,180 | | | | 1,407 | | | | 1 | | | | 1,408 | |
Interest-earning balances | | | (269 | ) | | | (32 | ) | | | (301 | ) | | | 0 | | | | 40 | | | | 40 | |
Other | | | 275 | | | | (129 | ) | | | 146 | | | | 166 | | | | (126 | ) | | | 40 | |
| | | | | | | | | | | | | | | | | | | | | | | | |
| | | | | | |
Total interest income | | | 12,303 | | | | (14,703 | ) | | | (2,400 | ) | | | 20,585 | | | | 181 | | | | 20,766 | |
| | | | | | | | | | | | | | | | | | | | | | | | |
| | | | | | |
Interest expense: | | | | | | | | | | | | | | | | | | | | | | | | |
Deposits | | | | | | | | | | | | | | | | | | | | | | | | |
Demand deposits | | | (355 | ) | | | (3,095 | ) | | | (3,450 | ) | | | 1,608 | | | | 620 | | | | 2,228 | |
Savings deposits | | | 1 | | | | (36 | ) | | | (35 | ) | | | (0 | ) | | | (17 | ) | | | (17 | ) |
Time deposits | | | 5,548 | | | | (6,850 | ) | | | (1,302 | ) | | | 7,838 | | | | 3,136 | | | | 10,974 | |
Borrowings | | | 2,941 | | | | (1,993 | ) | | | 948 | | | | 1,566 | | | | 33 | | | | 1,599 | |
| | | | | | | | | | | | | | | | | | | | | | | | |
| | | | | | |
Total interest expense | | | 8,135 | | | | (11,974 | ) | | | (3,839 | ) | | | 11,012 | | | | 3,772 | | | | 14,784 | |
| | | | | | | | | | | | | | | | | | | | | | | | |
| | | | | | |
Net interest income increase (decrease) | | $ | 4,168 | | | $ | (2,729 | ) | | $ | 1,439 | | | $ | 9,573 | | | $ | (3,591 | ) | | $ | 5,982 | |
| | | | | | | | | | | | | | | | | | | | | | | | |
42
BNC Bancorp
Table 4
Non-Interest Income
(In thousands)
| | | | | | | | | |
| | | Year Ended December 31, |
| | | 2008 | | 2007 | | 2006 |
Mortgage fees | | $ | 783 | | $ | 839 | | $ | 605 |
Service charges | | | 3,021 | | | 2,910 | | | 2,446 |
Investment brokerage fees | | | 434 | | | 490 | | | 118 |
Increase in cash surrender value of life insurance | | | 1,101 | | | 891 | | | 562 |
| | | | | | | | | |
| | | |
Core non-interest income | | | 5,339 | | | 5,130 | | | 3,731 |
| | | |
Gain on sales of investment securities available for sale, net | | | 223 | | | — | | | — |
Other non-interest income | | | 89 | | | 119 | | | 90 |
| | | | | | | | | |
| | | |
Total non-interest income | | $ | 5,651 | | $ | 5,249 | | $ | 3,821 |
| | | | | | | | | |
43
BNC Bancorp
Table 5
Non-Interest Expense
(In thousands)
| | | | | | | | | |
| | | Year Ended December 31, |
| | | 2008 | | 2007 | | 2006 |
Salaries and employee benefits | | $ | 15,668 | | $ | 14,738 | | $ | 11,584 |
Employment settlement with prior EVP | | | 625 | | | — | | | — |
Occupancy expense | | | 2,155 | | | 1,848 | | | 1,270 |
Furniture and equipment expense | | | 1,084 | | | 1,018 | | | 804 |
Data processing and supply expense | | | 1,113 | | | 1,063 | | | 1,073 |
Advertising | | | 455 | | | 522 | | | 668 |
Insurance, professional and other services | | | 3,207 | | | 2,237 | | | 1,586 |
Other | | | 3,476 | | | 2,642 | | | 2,125 |
| | | | | | | | | |
| | | |
Total non-interest expense | | $ | 27,783 | | $ | 24,068 | | $ | 19,110 |
| | | | | | | | | |
44
BNC Bancorp
Table 6
Contractual Obligations and Commitments
(In thousands)
| | | | | | | | | | | | | | | |
| | | Payments Due by Period |
Contractual Obligations | | Total | | On Demand
or Within
1 Year | | 2 - 3 Years | | 4 - 5 Years | | After
5 Years |
Short-term borrowings | | $ | 194,143 | | $ | 194,143 | | $ | — | | $ | — | | $ | — |
Long-term debt | | | 105,713 | | | — | | | 14,000 | | | — | | | 91,713 |
Deposits | | | 1,146,013 | | | 916,165 | | | 187,182 | | | 21,726 | | | 20,940 |
| | | | | | | | | | | | | | | |
| | | | | |
Total contractual cash obligations | | $ | 1,445,869 | | $ | 1,110,308 | | $ | 201,182 | | $ | 21,726 | | $ | 112,653 |
| | | | | | | | | | | | | | | |
|
| The following table reflects other commitments of the Company outstanding as of December 31, 2008. |
| |
| | | Amount of Commitment Expiration Per Period |
Commitments | | Total
Amounts
Committed | | Within
1 Year | | 2 - 3 Years | | 4 - 5 Years | | After
5 Years |
Lines of credit and loan commitments | | $ | 169,014 | | $ | 114,753 | | $ | 54,261 | | $ | — | | $ | — |
Standby letters of credit | | | 11,786 | | | 9,603 | | | 2,183 | | | — | | | — |
Commitments to sell loans held for sale | | | 560 | | | 560 | | | — | | | — | | | — |
| | | | | | | | | | | | | | | |
| | | | | |
Total commitments | | $ | 181,360 | | $ | 124,916 | | $ | 56,444 | | $ | — | | $ | — |
| | | | | | | | | | | | | | | |
45
BNC Bancorp
Table 7
Interest Rate Sensitivity Analysis
($ in thousands)
| | | | | | | | | | | | | | | | | | | | |
| | | At December 31, 2008 | |
| | | 3 Months
or Less | | | Over 3 Months
to 12 Months | | | Total Within
12 Months | | | Over 12
Months | | | Total | |
Interest-earning assets: | | | | | | | | | | | | | | | | | | | | |
Loans | | $ | 554,205 | | | $ | 19,057 | | | $ | 573,262 | | | $ | 434,526 | | | $ | 1,007,788 | |
Interest rate swap | | | (55,000 | ) | | | | | | | (55,000 | ) | | | 55,000 | | | | — | |
Loans held for sale | | | 560 | | | | — | | | | 560 | | | | — | | | | 560 | |
Securities available for sale, at cost | | | 4,144 | | | | 19,244 | | | | 23,388 | | | | 392,173 | | | | 415,561 | |
Other earning assets | | | 37,186 | | | | — | | | | 37,186 | | | | — | | | | 37,186 | |
| | | | | | | | | | | | | | | | | | | | |
Total interest-earning assets | | $ | 541,095 | | | $ | 38,301 | | | $ | 579,396 | | | $ | 881,699 | | | $ | 1,461,095 | |
| | | | | | | | | | | | | | | | | | | | |
| | | | | |
Interest-bearing liabilities | | | | | | | | | | | | | | | | | | | | |
Interest-bearing demand deposits | | $ | 132,873 | | | $ | — | | | $ | 132,873 | | | $ | 39,628 | | | $ | 172,501 | |
Time deposits and savings | | | 317,276 | | | | 402,822 | | | | 720,098 | | | | 191,487 | | | | 911,585 | |
Borrowings | | | 194,143 | | | | — | | | | 194,143 | | | | 105,713 | | | | 299,856 | |
| | | | | | | | | | | | | | | | | | | | |
| | $ | 644,292 | | | $ | 402,822 | | | $ | 1,047,114 | | | $ | 336,828 | | | $ | 1,383,942 | |
| | | | | | | | | | | | | | | | | | | | |
| | | | | |
Interest sensitivity gap | | $ | (103,197 | ) | | $ | (364,521 | ) | | $ | (467,718 | ) | | $ | 544,871 | | | $ | 77,153 | |
Cumulative interest sensitivity gap | | | (103,197 | ) | | | (467,718 | ) | | | (467,718 | ) | | | 77,153 | | | | 77,153 | |
Cumulative interest sensitivity gap as a percent of total interest-earning assets | | | -7.06 | % | | | -32.01 | % | | | -32.01 | % | | | 5.28 | % | | | 5.28 | % |
Cumulative ratio of interest-sensitive assets to interest-sensitive liabilities | | | 83.98 | % | | | 55.33 | % | | | 55.33 | % | | | 105.57 | % | | | 105.57 | % |
46
BNC Bancorp
Table 8
Loan Portfolio Composition
($ in thousands)
| | | | | | | | | | | | | | | | | | | | | | | | | | | | | | |
| | | At December 31, | |
| | | 2008 | | | 2007 | | | 2006 | | | 2005 | | | 2004 | |
| | | Amount | | % of Total
Loans | | | Amount | | % of Total
Loans | | | Amount | | % of Total
Loans | | | Amount | | % of Total
Loans | | | Amount | | % of Total
Loans | |
Real estate loans | | $ | 573,902 | | 56.9 | % | | $ | 504,354 | | 54.1 | % | | $ | 444,724 | | 57.4 | % | | $ | 316,390 | | 63.4 | % | | $ | 273,638 | | 65.1 | % |
Real estate construction loans | | | 307,272 | | 30.5 | % | | | 286,002 | | 30.7 | % | | | 203,695 | | 26.3 | % | | | 108,172 | | 21.7 | % | | | 70,346 | | 16.7 | % |
Commercial and industrial loans | | | 98,595 | | 9.8 | % | | | 109,869 | | 11.8 | % | | | 97,071 | | 12.5 | % | | | 63,423 | | 12.7 | % | | | 58,110 | | 13.8 | % |
Loans to individuals | | | 12,829 | | 1.3 | % | | | 17,967 | | 1.9 | % | | | 18,140 | | 2.3 | % | | | 11,262 | | 2.3 | % | | | 18,744 | | 4.5 | % |
Leases | | | 15,190 | | 1.5 | % | | | 14,370 | | 1.5 | % | | | 11,034 | | 1.4 | % | | | — | | 0.0 | % | | | — | | 0.0 | % |
| | | | | | | | | | | | | | | | | | | | | | | | | | | | | | |
| | | | | | | | | | |
Total loans | | $ | 1,007,788 | | 100.0 | % | | $ | 932,562 | | 100.0 | % | | $ | 774,664 | | 100.0 | % | | $ | 499,247 | | 100.0 | % | | $ | 420,838 | | 100.0 | % |
| | | | | | | | | | | | | | | | | | | | | | | | | | | | | | |
These classifications are based upon Call Report Classification codes.
47
BNC Bancorp
Table 9
Loan Maturities
(In thousands)
| | | | | | | | | | | | |
| | | At December 31, 2008 |
| | | Due within
one year | | Due after
one year but
within five | | Due after
five years | | Total |
By loan type: | | | | | | | | | | | | |
Real estate loans | | $ | 106,143 | | $ | 307,717 | | $ | 160,042 | | $ | 573,902 |
Real estate construction loans | | | 182,431 | | | 124,841 | | | — | | | 307,272 |
Commercial and industrial loans and leases | | | 64,689 | | | 41,089 | | | 8,007 | | | 113,785 |
Loans to individuals | | | 6,421 | | | 6,217 | | | 191 | | | 12,829 |
| | | | | | | | | | | | |
Total | | | 359,684 | | | 479,864 | | | 168,240 | | $ | 1,007,788 |
| | | | | | | | | | | | |
| | | | |
By interest rate type: | | | | | | | | | | | | |
Fixed rate loans | | $ | 68,110 | | $ | 268,172 | | $ | 133,123 | | $ | 469,405 |
Variable rate loans | | | 291,574 | | | 211,692 | | | 35,117 | | | 538,383 |
| | | | | | | | | | | | |
| | $ | 359,684 | | $ | 479,864 | | $ | 168,240 | | $ | 1,007,788 |
| | | | | | | | | | | | |
The above table is based on contractual scheduled maturities. Early repayment of loans or renewals at maturity are not considered in this table.
48
BNC Bancorp
Table 10
Nonperforming Assets
($ in thousands)
| | | | | | | | | | | | | | | | | | | | |
| | | At December 31, | |
| | | 2008 | | | 2007 | | | 2006 | | | 2005 | | | 2004 | |
Nonaccrual loans | | $ | 12,654 | | | $ | 957 | | | $ | 1,074 | | | $ | 324 | | | $ | 332 | |
Accruing loans past due 90 days or more | | | — | | | | — | | | | 165 | | | | 1,193 | | | | 795 | |
Restructured loans | | | 665 | | | | 2,642 | | | | — | | | | 312 | | | | — | |
| | | | | | | | | | | | | | | | | | | | |
| | | | | |
Total nonperforming loans | | | 13,319 | | | | 3,599 | | | | 1,239 | | | | 1,829 | | | | 1,127 | |
| | | | | |
Other real estate owned | | | 5,022 | | | | 2,509 | | | | 1,078 | | | | 855 | | | | 540 | |
| | | | | | | | | | | | | | | | | | | | |
| | | | | |
Total nonperforming assets | | $ | 18,341 | | | $ | 6,108 | | | $ | 2,317 | | | $ | 2,684 | | | $ | 1,667 | |
| | | | | | | | | | | | | | | | | | | | |
| | | | | |
Allowance for loan losses | | $ | 13,210 | | | $ | 11,784 | | | $ | 10,400 | | | $ | 6,140 | | | $ | 5,361 | |
Nonperforming loans to year end loans | | | 1.32 | % | | | 0.39 | % | | | 0.16 | % | | | 0.37 | % | | | 0.08 | % |
Allowance for loan losses to year end loans | | | 1.31 | % | | | 1.26 | % | | | 1.34 | % | | | 1.23 | % | | | 1.27 | % |
Nonperforming assets to loans and other real estate | | | 1.81 | % | | | 0.60 | % | | | 0.30 | % | | | 0.35 | % | | | 0.33 | % |
Nonperforming assets to total assets | | | 1.17 | % | | | 0.54 | % | | | 0.24 | % | | | 0.45 | % | | | 0.18 | % |
Allowance for loan losses to nonperforming loans | | | 99.18 | % | | | 327.42 | % | | | 839.39 | % | | | 335.70 | % | | | 475.69 | % |
49
BNC Bancorp
Table 11
Allocation of the Allowance for Loan Losses
(In thousands)
| | | | | | | | | | | | | | | | | | | | | | | | | | | | | | |
| | | 2008 | | | 2007 | | | 2006 | | | 2005 | | | 2004 | |
| | | Amount | | % of Total
Loans (1) | | | Amount | | % of Total
Loans (1) | | | Amount | | % of Total
Loans (1) | | | Amount | | % of Total
Loans (1) | | | Amount | | % of Total
Loans (1) | |
Real estate loans | | $ | 7,516 | | 56.9 | % | | $ | 6,375 | | 54.1 | % | | $ | 5,970 | | 57.4 | % | | $ | 3,891 | | 63.4 | % | | $ | 3,486 | | 65.1 | % |
Real estate construction loans | | | 4,029 | | 30.5 | % | | | 3,618 | | 30.7 | % | | | 2,735 | | 26.3 | % | | | 1,330 | | 21.7 | % | | | 896 | | 16.7 | % |
Commercial and industrial loans | | | 1,295 | | 9.8 | % | | | 1,391 | | 11.8 | % | | | 1,303 | | 12.5 | % | | | 780 | | 12.7 | % | | | 740 | | 13.8 | % |
Loans to individuals | | | 172 | | 1.3 | % | | | 177 | | 1.9 | % | | | 249 | | 2.3 | % | | | 139 | | 2.2 | % | | | 239 | | 4.5 | % |
Leases | | | 198 | | 1.5 | % | | | 223 | | 1.5 | % | | | 143 | | 1.4 | % | | | — | | 0.0 | % | | | — | | 0.0 | % |
| | | | | | | | | | | | | | | | | | | | | | | | | | | | | | |
| | | | | | | | | | |
| | $ | 13,210 | | 100.0 | % | | $ | 11,784 | | 100.0 | % | | $ | 10,400 | | 100.0 | % | | $ | 6,140 | | 100.0 | % | | $ | 5,361 | | 100.0 | % |
| | | | | | | | | | | | | | | | | | | | | | | | | | | | | | |
| (1) | Represents total of all outstanding loans in each category as a percent of total loans outstanding |
50
BNC Bancorp
Table 12
Loan Loss and Recovery Experience
($ in thousands)
| | | | | | | | | | | | | | | | | | | | |
| | | At or for the Year Ended December 31, | |
| | | 2008 | | | 2007 | | | 2006 | | | 2005 | | | 2004 | |
Loans outstanding at the end of the year | | $ | 1,007,788 | | | $ | 932,562 | | | $ | 774,664 | | | $ | 499,247 | | | $ | 420,838 | |
| | | | | | | | | | | | | | | | | | | | |
| | | | | |
Average loans outstanding during the year | | $ | 981,069 | | | $ | 849,271 | | | $ | 615,689 | | | $ | 454,395 | | | $ | 365,377 | |
| | | | | | | | | | | | | | | | | | | | |
| | | | | |
Allowance for loan losses at beginning of year | | $ | 11,784 | | | $ | 10,400 | | | $ | 6,140 | | | $ | 5,361 | | | $ | 4,598 | |
Provision for loan losses | | | 7,075 | | | | 3,090 | | | | 2,655 | | | | 2,515 | | | | 1,190 | |
Allowance acquired in merger of Independence Bank | | | — | | | | — | | | | — | | | | — | | | | — | |
Allowance acquired in merger of SterlingSouth Bank | | | — | | | | — | | | | 2,816 | | | | — | | | | — | |
| | | | | | | | | | | | | | | | | | | | |
| | | 18,859 | | | | 13,490 | | | | 11,611 | | | | 7,876 | | | | 5,788 | |
| | | | | | | | | | | | | | | | | | | | |
Loans charged off: | | | | | | | | | | | | | | | | | | | | |
Real estate loans | | | (1,332 | ) | | | (331 | ) | | | (738 | ) | | | (645 | ) | | | (150 | ) |
Real estate construction loans | | | (1,665 | ) | | | (1,122 | ) | | | — | | | | (235 | ) | | | (31 | ) |
Commercial and industrial loans | | | (2,529 | ) | | | (228 | ) | | | (352 | ) | | | (290 | ) | | | (56 | ) |
Loans to individuals | | | (257 | ) | | | (74 | ) | | | (199 | ) | | | (618 | ) | | | (311 | ) |
| | | | | | | | | | | | | | | | | | | | |
Total charge-offs | | | (5,783 | ) | | | (1,755 | ) | | | (1,289 | ) | | | (1,788 | ) | | | (548 | ) |
| | | | | | | | | | | | | | | | | | | | |
| | | | | |
Recoveries of loans previously charged off: | | | | | | | | | | | | | | | | | | | | |
Real estate loans | | | 56 | | | | 32 | | | | 64 | | | | 3 | | | | 10 | |
Real estate construction loans | | | — | | | | — | | | | — | | | | — | | | | — | |
Commercial and industrial loans | | | 54 | | | | 6 | | | | 8 | | | | 4 | | | | 90 | |
Loans to individuals | | | 24 | | | | 11 | | | | 6 | | | | 45 | | | | 21 | |
| | | | | | | | | | | | | | | | | | | | |
Total recoveries | | | 134 | | | | 49 | | | | 78 | | | | 52 | | | | 121 | |
| | | | | | | | | | | | | | | | | | | | |
Net charge-offs | | | (5,649 | ) | | | (1,706 | ) | | | (1,211 | ) | | | (1,736 | ) | | | (427 | ) |
| | | | | | | | | | | | | | | | | | | | |
| | | | | |
Allowance for loan losses at end of year | | $ | 13,210 | | | $ | 11,784 | | | $ | 10,400 | | | $ | 6,140 | | | $ | 5,361 | |
| | | | | | | | | | | | | | | | | | | | |
| | | | | |
Ratios: | | | | | | | | | | | | | | | | | | | | |
Net charge-offs as a percent of average loans | | | 0.58 | % | | | 0.20 | % | | | 0.20 | % | | | 0.38 | % | | | 0.12 | % |
Allowance for loan losses as a percent of loans at end of year | | | 1.31 | % | | | 1.26 | % | | | 1.34 | % | | | 1.23 | % | | | 1.27 | % |
51
BNC Bancorp
Table 13
Securities Portfolio Composition
(In thousands)
| | | | | | | | | | | | |
| | | Amortized
cost | | Gross
unrealized
gains | | Gross
unrealized
losses | | Estimated
fair value |
December 31, 2008 | | | | | | | | | | | | |
Available for sale: | | | | | | | | | | | | |
U.S. Government agency obligations | | $ | 4,980 | | $ | 24 | | $ | — | | $ | 5,004 |
State and municipals | | | 123,623 | | | 1,612 | | | 4,802 | | | 120,433 |
Mortgage-backed securities | | | 286,792 | | | 4,297 | | | 128 | | | 290,961 |
Other | | | 166 | | | — | | | — | | | 166 |
| | | | | | | | | | | | |
| | $ | 415,561 | | $ | 5,933 | | $ | 4,930 | | $ | 416,564 |
| | | | | | | | | | | | |
Held to maturity: | | | | | | | | | | | | |
Corporate bonds | | $ | 6,000 | | $ | — | | $ | 600 | | $ | 5,400 |
| | | | | | | | | | | | |
| | | | |
December 31, 2007 | | | | | | | | | | | | |
Available for sale: | | | | | | | | | | | | |
U.S. Government agency obligations | | $ | 2,949 | | $ | 39 | | $ | — | | $ | 2,988 |
State and municipals | | | 66,359 | | | 993 | | | 398 | | | 66,954 |
Mortgage-backed securities | | | 16,157 | | | 418 | | | — | | | 16,575 |
Other | | | 166 | | | — | | | — | | | 166 |
| | | | | | | | | | | | |
| | $ | 85,631 | | $ | 1,450 | | $ | 398 | | $ | 86,683 |
| | | | | | | | | | | | |
| | | | |
December 31, 2006 | | | | | | | | | | | | |
Available for sale: | | | | | | | | | | | | |
U.S. Government agency obligations | | $ | 4,407 | | $ | 29 | | $ | — | | $ | 4,436 |
State and municipals | | | 60,989 | | | 1,358 | | | 8 | | | 62,339 |
Mortgage-backed securities | | | 9,585 | | | 174 | | | — | | | 9,759 |
Other | | | 166 | | | — | | | — | | | 166 |
| | | | | | | | | | | | |
| | $ | 75,147 | | $ | 1,561 | | $ | 8 | | $ | 76,700 |
| | | | | | | | | | | | |
52
BNC Bancorp
Table 14
Securities Portfolio Composition
($ in thousands)
| | | | | | | | | |
| | | Amortized
Cost | | Fair
Value | | Book
Yield | |
Securities available for sale: | | | | | | | | | |
| | | |
U.S. Government agency obligations | | | | | | | | | |
Due after one but within five years | | $ | 4,980 | | $ | 5,004 | | 6.24 | % |
| | | | | | | | | |
| | | 4,980 | | | 5,004 | | 6.24 | % |
| | | | | | | | | |
| | | |
Mortgage-backed securities | | | | | | | | | |
Due within one year | | | 23,127 | | | 23,388 | | 6.01 | % |
Due after one but within five years | | | 87,326 | | | 88,024 | | 5.29 | % |
Due after five but within ten years | | | 94,278 | | | 93,817 | | 5.15 | % |
Due after ten years | | | 82,061 | | | 85,732 | | 5.61 | % |
| | | | | | | | | |
| | | 286,792 | | | 290,961 | | 5.39 | % |
| | | | | | | | | |
| | | |
State and municipals | | | | | | | | | |
Due after one but within five years | | | 2,685 | | | 2,594 | | 4.49 | % |
Due after five but within ten years | | | 8,720 | | | 8,911 | | 6.42 | % |
Due after ten years | | | 112,218 | | | 108,928 | | 4.63 | % |
| | | | | | | | | |
| | | 123,623 | | | 120,433 | | 4.75 | % |
| | | | | | | | | |
| | | |
Other | | | | | | | | | |
Due after ten years | | | 166 | | | 166 | | 2.40 | % |
| | | | | | | | | |
| | | 166 | | | 166 | | 2.40 | % |
| | | | | | | | | |
| | | |
Total securities available for sale | | | | | | | | | |
Due within one year | | | 23,127 | | | 23,388 | | 6.01 | % |
Due after one but within five years | | | 94,991 | | | 95,622 | | 5.32 | % |
Due after five but within ten years | | | 102,998 | | | 102,728 | | 5.26 | % |
Due after ten years | | | 194,445 | | | 194,826 | | 5.06 | % |
| | | | | | | | | |
| | $ | 415,561 | | $ | 416,564 | | 5.22 | % |
| | | | | | | | | |
| | | |
Securities held to maturity: | | | | | | | | | |
Corporate bonds: | | | | | | | | | |
Due after five but within ten years | | | 6,000 | | | 5,400 | | 6.82 | % |
| | | | | | | | | |
| | $ | 6,000 | | $ | 5,400 | | 6.82 | % |
| | | | | | | | | |
53
BNC Bancorp
Table 15
Average Deposits
($ in thousands)
| | | | | | | | | | | | | | | | | | |
| | | For the Year Ended December 31, | |
| | | 2008 | | | 2007 | | | 2006 | |
| | | Average
Amount | | Average
Rate | | | Average
Amount | | Average
Rate | | | Average
Amount | | Average
Rate | |
Demand deposits | | $ | 180,353 | | 1.51 | % | | $ | 195,542 | | 3.16 | % | | $ | 141,467 | | 2.79 | % |
Savings deposits | | | 11,058 | | 0.12 | % | | | 10,725 | | 0.45 | % | | | 10,739 | | 0.61 | % |
Time deposits | | | 698,647 | | 4.00 | % | | | 576,488 | | 5.08 | % | | | 411,878 | | 4.44 | % |
| | | | | | | | | | | | | | | | | | |
| | | | | | |
Total interest-bearing deposits | | | 890,058 | | 3.45 | % | | | 782,755 | | 4.54 | % | | | 564,084 | | 3.96 | % |
| | | | | | |
Non-interest-bearing deposits | | | 72,008 | | — | | | | 67,774 | | — | | | | 51,822 | | — | |
| | | | | | | | | | | | | | | | | | |
| | | | | | |
Total deposits | | $ | 962,066 | | 3.19 | % | | $ | 850,529 | | 4.17 | % | | $ | 615,906 | | 3.62 | % |
| | | | | | | | | | | | | | | | | | |
54
BNC Bancorp
Table 16
Maturities of Time Deposits of $100,000 or More
(In thousands)
| | | | | | | | | | | | | | | |
| | | At December 31, 2008 |
| | | 3 Months
or Less | | Over 3 Months
to 6 Months | | Over 6 Months
to 12 Months | | Over 12
Months | | Total |
Time Deposits of $100,000 or more | | $ | 224,083 | | $ | 174,022 | | $ | 130,629 | | $ | 149,087 | | $ | 677,821 |
| | | | | | | | | | | | | | | |
55
BNC Bancorp
Table 17
Borrowings
($ in thousands)
The following table sets forth certain information regarding the Company’s borrowed funds for the dates indicated.
| | | | | | | | | | | | |
| | | For the Year Ended December 31, | |
| | | 2008 | | | 2007 | | | 2006 | |
Short-term borrowings: | | | | | | | | | | | | |
Repurchase agreements and FHLB lines of credit | | | | | | | | | | | | |
Balance outstanding at end of period | | $ | 194,143 | | | $ | 80,928 | | | $ | 4,673 | |
Maximum amount outstanding at any month end during the period | | | 194,143 | | | | 80,928 | | | | 36,115 | |
Average balance outstanding | | | 56,935 | | | | 14,823 | | | | 7,130 | |
Weighted-average interest rate during the period | | | 2.56 | % | | | 5.40 | % | | | 4.61 | % |
Weighted-average interest rate at end of period | | | 0.68 | % | | | 4.69 | % | | | 3.41 | % |
Long-term debt: | | | | | | | | | | | | |
Federal Home Loan Bank advances and subordinated debentures | | | | | | | | | | | | |
Balance outstanding at end of period | | $ | 105,713 | | | $ | 101,713 | | | $ | 81,713 | |
Maximum amount outstanding at any month end during the period | | | 119,713 | | | | 106,713 | | | | 81,713 | |
Average balance outstanding | | | 116,184 | | | | 94,117 | | | | 72,111 | |
Weighted-average interest rate during the period | | | 4.52 | % | | | 5.27 | % | | | 5.32 | % |
Weighted-average interest rate at end of period | | | 4.24 | % | | | 5.07 | % | | | 5.65 | % |
Total borrowings: | | | | | | | | | | | | |
Balance outstanding at end of period | | $ | 299,856 | | | $ | 182,641 | | | $ | 86,386 | |
Maximum amount outstanding at any month end during the period | | | 313,856 | | | | 187,641 | | | | 117,828 | |
Average balance outstanding | | | 173,113 | | | | 108,940 | | | | 79,241 | |
Weighted-average interest rate during the period | | | 3.88 | % | | | 5.29 | % | | | 5.25 | % |
Weighted-average interest rate at end of period | | | 2.04 | % | | | 4.95 | % | | | 5.53 | % |
56
BNC Bancorp
Table 18
Market Risk Sensitive Investments
($ in thousands)
| | | | | | | | | | | | | | | | | | | | | | | | | | | |
| | | Expected Maturities of Market Sensitive Instruments Held
at December 31, 2008 Occurring in the Indicated Year |
| | | 2009 | | 2010 | | 2011 | | 2012 | | 2013 | | Beyond | | Total | | Average
Interest
Rate | | | Fair Value |
Interest-earning assets: | | | | | | | | | | | | | | | | | | | | | | | | | | | |
Due from banks | | $ | 23,742 | | $ | — | | $ | — | | $ | — | | $ | — | | $ | — | | $ | 23,742 | | 0.18 | % | | $ | 23,742 |
Other earning assets | | | 560 | | | — | | | — | | | — | | | — | | | 13,444 | | | 14,004 | | 1.00 | % | | | 14,004 |
Debt securities (1) (2) | | | 23,127 | | | 24,625 | | | 21,644 | | | 25,283 | | | 23,439 | | | 303,443 | | | 421,561 | | 5.95 | % | | | 421,964 |
Loans - fixed rate (3) | | | 68,110 | | | 91,557 | | | 63,094 | | | 49,330 | | | 64,191 | | | 133,123 | | | 469,405 | | 6.99 | % | | | 465,996 |
Loans - variable rate (3) | | | 291,574 | | | 63,415 | | | 66,105 | | | 60,073 | | | 22,099 | | | 35,117 | | | 538,383 | | 4.51 | % | | | 538,081 |
| | | | | | | | | | | | | | | | | | | | | | | | | | | |
| | $ | 407,113 | | $ | 179,597 | | $ | 150,843 | | $ | 134,686 | | $ | 109,729 | | $ | 485,127 | | $ | 1,467,095 | | 5.61 | % | | $ | 1,463,787 |
| | | | | | | | | | | | | | | | | | | | | | | | | | | |
| | | | | | | | | |
Interest-bearing liabilities: | | | | | | | | | | | | | | | | | | | | | | | | | | | |
NOW and money market deposits | | $ | — | | $ | — | | $ | — | | $ | — | | $ | — | | $ | 172,501 | | $ | 172,501 | | 1.41 | % | | $ | 172,501 |
Time deposits and savings | | | 720,098 | | | 97,260 | | | 47,561 | | | 15,214 | | | 14,669 | | | 16,783 | | | 911,585 | | 3.49 | % | | | 900,776 |
Subordinated debentures | | | — | | | — | | | — | | | — | | | — | | | 31,713 | | | 31,713 | | 6.66 | % | | | 32,157 |
Borrowings | | | 194,143 | | | 9,000 | | | 5,000 | | | — | | | — | | | 60,000 | | | 268,143 | | 1.43 | % | | | 268,194 |
| | | | | | | | | | | | | | | | | | | | | | | | | | | |
| | $ | 914,241 | | $ | 106,260 | | $ | 52,561 | | $ | 15,214 | | $ | 14,669 | | $ | 280,997 | | $ | 1,383,942 | | 2.90 | % | | $ | 1,373,628 |
| | | | | | | | | | | | | | | | | | | | | | | | | | | |
| (1) | Tax-exempt securities are reflected at a tax-equivalent basis using a 34% tax rate. |
| (2) | Callable securities and borrowings with favorable market rates at December 31, 2008 are assumed to mature at their call dates for purposes of this table. |
| (3) | Includes nonaccrual loans but not the allowance for loan losses |
57
BNC Bancorp
Table 19
Quarterly Financial Data
($ in thousands, except per share data)
| | | | | | | | | | | | | | | | | | | | | | | | | | |
| | | Year Ended December 31, 2008 | | Year Ended December 31, 2007 |
| | | Fourth
Quarter | | | Third
Quarter | | | Second
Quarter | | First
Quarter | | Fourth
Quarter | | Third
Quarter | | Second
Quarter | | First
Quarter |
Operating Data: | | | | | | | | | | | | | | | | | | | | | | | | | | |
Total interest income | | $ | 18,041 | | | $ | 17,409 | | | $ | 17,182 | | $ | 18,402 | | $ | 19,262 | | $ | 19,420 | | $ | 18,146 | | $ | 16,842 |
Total interest expense | | | 9,340 | | | | 8,893 | | | | 8,983 | | | 10,210 | | | 11,003 | | | 10,990 | | | 10,090 | | | 9,182 |
| | | | | | | | | | | | | | | | | | | | | | | | | | |
Net interest income | | | 8,701 | | | | 8,516 | | | | 8,199 | | | 8,192 | | | 8,259 | | | 8,430 | | | 8,056 | | | 7,660 |
Provision for loan losses | | | 2,700 | | | | 2,500 | | | | 1,150 | | | 725 | | | 750 | | | 1,140 | | | 650 | | | 550 |
| | | | | | | | | | | | | | | | | | | | | | | | | | |
Net interest income after provision | | | 6,001 | | | | 6,016 | | | | 7,049 | | | 7,467 | | | 7,509 | | | 7,290 | | | 7,406 | | | 7,110 |
Noninterest income | | | 1,323 | | | | 1,328 | | | | 1,625 | | | 1,375 | | | 1,483 | | | 1,255 | | | 1,307 | | | 1,204 |
Noninterest expense | | | 6,946 | | | | 6,716 | | | | 7,675 | | | 6,446 | | | 6,839 | | | 5,941 | | | 5,700 | | | 5,588 |
| | | | | | | | | | | | | | | | | | | | | | | | | | |
Income before income taxes | | | 378 | | | | 628 | | | | 999 | | | 2,396 | | | 2,153 | | | 2,604 | | | 3,013 | | | 2,726 |
Provision for income taxes | | | (247 | ) | | | (119 | ) | | | 84 | | | 696 | | | 600 | | | 754 | | | 895 | | | 809 |
| | | | | | | | | | | | | | | | | | | | | | | | | | |
Net income | | | 625 | | | | 747 | | | | 915 | | | 1,700 | | | 1,553 | | | 1,850 | | | 2,118 | | | 1,917 |
Less preferred stock dividends | | | (142 | ) | | | — | | | | — | | | — | | | — | | | — | | | — | | | — |
| | | | | | | | | | | | | | | | | | | | | | | | | | |
Net income available to common | | $ | 483 | | | $ | 747 | | | $ | 915 | | $ | 1,700 | | $ | 1,553 | | $ | 1,850 | | $ | 2,118 | | $ | 1,917 |
| | | | | | | | | | | | | | | | | | | | | | | | | | |
| | | | | | | | |
Per Share Data: (1) | | | | | | | | | | | | | | | | | | | | | | | | | | |
Earnings per share - basic | | $ | 0.07 | | | $ | 0.10 | | | $ | 0.13 | | $ | 0.23 | | $ | 0.22 | | $ | 0.27 | | $ | 0.31 | | $ | 0.28 |
Earnings per share - diluted | | | 0.07 | | | | 0.10 | | | | 0.12 | | | 0.23 | | | 0.22 | | | 0.26 | | | 0.30 | | | 0.27 |
| | | | | | | | |
Cash dividends paid | | | — | | | | — | | | | — | | | 0.20 | | | — | | | — | | | — | | | 0.18 |
| | | | | | | | |
Common stock price: | | | | | | | | | | | | | | | | | | | | | | | | | | |
High | | | 12.00 | | | | 12.42 | | | | 15.33 | | | 16.92 | | | 17.25 | | | 18.25 | | | 19.61 | | | 21.00 |
Low | | | 7.01 | | | | 7.28 | | | | 11.75 | | | 13.09 | | | 15.60 | | | 16.30 | | | 17.45 | | | 18.00 |
| (1) | All per share data has been restated to reflect the dilutive effect of a 10% stock dividend distributed on January 22, 2007. |
58
| ITEM 8. | FINANCIAL STATEMENTS |
BNC Bancorp
CONSOLIDATED FINANCIAL STATEMENTS
Years Ended December 31, 2008, 2007 and 2006
59
BNC BANCORP AND SUBSIDIARY
INDEX TO THE CONSOLIDATED FINANCIAL STATEMENTS
F-1

REPORT OF INDEPENDENT REGISTERED PUBLIC ACCOUNTING FIRM
To the Board of Directors and
Shareholders of BNC Bancorp
We have audited the accompanying consolidated balance sheets of BNC Bancorp and subsidiary (the “Company”) as of December 31, 2008 and 2007, and the related consolidated statements of income, comprehensive income, shareholders’ equity, and cash flows for each of the years in the three-year period ended December 31, 2008. We also have audited the Company’s internal control over financial reporting as of December 31, 2008 based on criteria established inInternal Control – Integrated Framework issued by the Committee of Sponsoring Organizations of the Treadway Commission (COSO). The Company’s management is responsible for these consolidated financial statements, for maintaining effective internal control over financial reporting, and for its assessment of the effectiveness of internal control over financial reporting, included in the accompanyingManagement’s Report on Internal Control over Financial Reporting. Our responsibility is to express an opinion on these consolidated financial statements and an opinion on the Company’s internal control over financial reporting based on our audits.
We conducted our audits in accordance with the standards of the Public Company Accounting Oversight Board (United States). Those standards require that we plan and perform the audits to obtain reasonable assurance about whether the financial statements are free of material misstatement and whether effective internal control over financial reporting was maintained in all material respects. Our audits of the financial statements included examining, on a test basis, evidence supporting the amounts and disclosures in the financial statements, assessing the accounting principles used and significant estimates made by management, and evaluating the overall financial statement presentation. Our audit of internal control over financial reporting included obtaining an understanding of internal control over financial reporting, assessing the risk that a material weakness exists, and testing and evaluating the design and operating effectiveness of internal control based on the assessed risk. Our audits also included performing such other procedures as we considered necessary in the circumstances. We believe that our audits provide a reasonable basis for our opinions.
A company’s internal control over financial reporting is a process designed to provide reasonable assurance regarding the reliability of financial reporting and the preparation of financial statements for external purposes in accordance with generally accepted accounting principles. A company’s internal control over financial reporting includes those policies and procedures that (1) pertain to the maintenance of records that, in reasonable detail, accurately and fairly reflect the transactions and dispositions of the assets of the company; (2) provide reasonable assurance that transactions are recorded as necessary to permit preparation of financial statements in accordance with generally accepted accounting principles, and that receipts and expenditures of the company are being made only in accordance with authorizations of management and directors of the company; and (3) provide reasonable assurance regarding prevention or timely detection of unauthorized acquisition, use, or disposition of the company’s assets that could have a material effect on the financial statements.
Because of its inherent limitations, internal control over financial reporting may not prevent or detect misstatements. Also, projections of any evaluation of effectiveness to future periods are subject to the risk that controls may become inadequate because of changes in conditions, or that the degree of compliance with the policies or procedures may deteriorate.
F-2
In our opinion, the consolidated financial statements referred to above present fairly, in all material respects, the financial position of BNC Bancorp and subsidiary as of December 31, 2008 and 2007, and the results of their operations and their cash flows for each of the years in the three-year period ended December 31, 2008 in conformity with accounting principles generally accepted in the United States of America. Also in our opinion, BNC Bancorp and subsidiary maintained, in all material respects, effective internal control over financial reporting as of December 31, 2008, based on criteria established inInternal Control – Integrated Framework issued by the Committee of Sponsoring Organizations of the Treadway Commission (COSO).
|
| /s/ Cherry, Bekaert & Holland, L.L.P. |
|
| Raleigh, North Carolina |
| March 16, 2009 |
F-3
CONSOLIDATED BALANCE SHEETS
December 31, 2008 and 2007
| | | | | | | | |
| | | 2008 | | | 2007 | |
| | | (Amounts in thousands,
except share data) | |
Assets | | | | | | | | |
Cash and due from banks | | $ | 13,028 | | | $ | 16,387 | |
Interest-earning deposits in other banks | | | 23,742 | | | | 4,667 | |
Securities available for sale, at fair value | | | 416,564 | | | | 86,683 | |
Securities held to maturity, at amortized cost | | | 6,000 | | | | — | |
Federal Home Loan Bank stock, at cost | | | 13,444 | | | | 7,233 | |
Loans held for sale | | | 560 | | | | 2,315 | |
Loans | | | 1,007,788 | | | | 932,562 | |
Less allowance for loan losses | | | (13,210 | ) | | | (11,784 | ) |
| | | | | | | | |
Net loans | | | 994,578 | | | | 920,778 | |
Accrued interest receivable | | | 7,392 | | | | 5,074 | |
Premises and equipment, net | | | 25,770 | | | | 23,120 | |
Investment in life insurance | | | 26,629 | | | | 24,001 | |
Goodwill | | | 26,129 | | | | 26,129 | |
Other assets | | | 19,040 | | | | 13,725 | |
| | | | | | | | |
Total assets | | $ | 1,572,876 | | | $ | 1,130,112 | |
| | | | | | | | |
| | |
Liabilities and Shareholders’ Equity | | | | | | | | |
Deposits: | | | | | | | | |
Non-interest bearing demand | | $ | 61,927 | | | $ | 67,552 | |
Interest-bearing demand | | | 172,501 | | | | 206,923 | |
Savings | | | 10,809 | | | | 9,973 | |
Time deposits of $100,000 and greater | | | 677,821 | | | | 418,493 | |
Other time | | | 222,955 | | | | 152,189 | |
| | | | | | | | |
Total deposits | | | 1,146,013 | | | | 855,130 | |
Short-term borrowings | | | 194,143 | | | | 80,928 | |
Long-term debt | | | 105,713 | | | | 101,713 | |
Accrued expenses and other liabilities | | | 6,327 | | | | 5,949 | |
| | | | | | | | |
Total liabilities | | | 1,452,196 | | | | 1,043,720 | |
| | | | | | | | |
| | |
Shareholders’ Equity: | | | | | | | | |
Preferred stock, no par value, authorized 20,000,000 shares; 31,260 issued and outstanding at December 31, 2008 | | | 31,260 | | | | — | |
Discount on preferred stock | | | (2,382 | ) | | | — | |
Common stock, no par value; authorized 80,000,000 shares; 7,350,029 and 7,257,532 issued and outstanding at December 31, 2008 and 2007, respectively | | | 70,433 | | | | 70,042 | |
Common stock warrants | | | 2,412 | | | | — | |
Retained earnings | | | 15,557 | | | | 14,496 | |
Stock in directors rabbi trust | | | (1,233 | ) | | | (1,001 | ) |
Directors deferred fees obligation | | | 1,233 | | | | 1,001 | |
Accumulated other comprehensive income | | | 3,400 | | | | 1,854 | |
| | | | | | | | |
Total shareholders’ equity | | | 120,680 | | | | 86,392 | |
| | | | | | | | |
Total liabilities and shareholders’ equity | | $ | 1,572,876 | | | $ | 1,130,112 | |
| | | | | | | | |
See accompanying notes.
F-4
CONSOLIDATED STATEMENTS OF INCOME
Years Ended December 31, 2008, 2007 and 2006
| | | | | | | | | | |
| | | 2008 | | | 2007 | | 2006 |
| | | (Amounts in thousands, except
per share data) |
Interest Income | | | | | | | | | | |
Interest and fees on loans | | $ | 64,855 | | | $ | 69,280 | | $ | 50,002 |
Debt securities: | | | | | | | | | | |
Taxable | | | 2,162 | | | | 932 | | | 378 |
Tax-exempt | | | 3,504 | | | | 2,790 | | | 2,243 |
Interest on interest-earning balances | | | 92 | | | | 393 | | | 353 |
Other | | | 421 | | | | 275 | | | 235 |
| | | | | | | | | | |
Total interest income | | | 71,034 | | | | 73,670 | | | 53,211 |
| | | | | | | | | | |
| | | |
Interest Expense | | | | | | | | | | |
Interest on demand deposits | | | 2,725 | | | | 6,175 | | | 3,947 |
Interest on savings deposits | | | 13 | | | | 48 | | | 65 |
Interest on time deposits of $100,000 and greater | | | 21,842 | | | | 14,466 | | | 12,192 |
Interest on other time deposits | | | 6,136 | | | | 14,814 | | | 6,114 |
Interest on short-term borrowings | | | 1,458 | | | | 1,044 | | | 150 |
Interest on long-term debt | | | 5,252 | | | | 4,718 | | | 4,013 |
| | | | | | | | | | |
Total interest expense | | | 37,426 | | | | 41,265 | | | 26,481 |
| | | | | | | | | | |
| | | |
Net Interest Income | | | 33,608 | | | | 32,405 | | | 26,730 |
Provision for loan losses | | | 7,075 | | | | 3,090 | | | 2,655 |
| | | | | | | | | | |
Net interest income after provision for loan losses | | | 26,533 | | | | 29,315 | | | 24,075 |
| | | | | | | | | | |
| | | |
Non-Interest Income | | | | | | | | | | |
Mortgage fees | | | 783 | | | | 839 | | | 605 |
Service charges | | | 3,021 | | | | 2,910 | | | 2,446 |
Investment brokerage fees | | | 434 | | | | 490 | | | 118 |
Earnings on bank-owned life insurance | | | 1,101 | | | | 891 | | | 562 |
Gain on sale of investment securities available for sale | | | 223 | | | | — | | | — |
Other | | | 89 | | | | 119 | | | 90 |
| | | | | | | | | | |
Total non-interest income | | | 5,651 | | | | 5,249 | | | 3,821 |
| | | | | | | | | | |
| | | |
Non-Interest Expense | | | | | | | | | | |
Salaries and employee benefits | | | 16,293 | | | | 14,738 | | | 11,584 |
Occupancy | | | 2,155 | | | | 1,848 | | | 1,270 |
Furniture and equipment | | | 1,084 | | | | 1,018 | | | 804 |
Data processing and supply | | | 1,113 | | | | 1,063 | | | 1,073 |
Advertising | | | 455 | | | | 522 | | | 668 |
Insurance, professional and other services | | | 3,207 | | | | 2,237 | | | 1,586 |
Other | | | 3,476 | | | | 2,642 | | | 2,125 |
| | | | | | | | | | |
Total non-interest expense | | | 27,783 | | | | 24,068 | | | 19,110 |
| | | | | | | | | | |
Income before income tax expense | | | 4,401 | | | | 10,496 | | | 8,786 |
| | | |
Income tax expense | | | 414 | | | | 3,058 | | | 2,616 |
| | | | | | | | | | |
Net income | | | 3,987 | | | | 7,438 | | | 6,170 |
Less preferred stock dividends | | | (142 | ) | | | — | | | — |
| | | | | | | | | | |
| | | |
Net income available to common shareholders | | $ | 3,845 | | | $ | 7,438 | | $ | 6,170 |
| | | | | | | | | | |
| | | |
Basic net income per share | | $ | 0.53 | | | $ | 1.08 | | $ | 1.09 |
| | | | | | | | | | |
Diluted net income per share | | $ | 0.52 | | | $ | 1.05 | | $ | 1.04 |
| | | | | | | | | | |
See accompanying notes.
F-5
CONSOLIDATED STATEMENTSOF COMPREHENSIVE INCOME
Years Ended December 31, 2008, 2007 and 2006
| | | | | | | | | | | | |
| | | 2008 | | | 2007 | | | 2006 | |
| | | (Amounts in thousands) | |
Net income | | $ | 3,987 | | | $ | 7,438 | | | $ | 6,170 | |
| | | | | | | | | | | | |
| | | |
Other comprehensive income: | | | | | | | | | | | | |
Securities available for sale: | | | | | | | | | | | | |
Unrealized holding gains (losses) | | | 174 | | | | (501 | ) | | | 734 | |
Tax effect | | | (89 | ) | | | 183 | | | | (268 | ) |
Reclassification of gains (losses) recognized in net income | | | (223 | ) | | | — | | | | — | |
Tax effect | | | 86 | | | | — | | | | — | |
| | | | | | | | | | | | |
Net of tax amount | | | (52 | ) | | | (318 | ) | | | 466 | |
| | | | | | | | | | | | |
| | | |
Cash flow hedging activities: | | | | | | | | | | | | |
Unrealized holding gains (losses) | | | 2,600 | | | | 2,166 | | | | (220 | ) |
Tax effect | | | (1,002 | ) | | | (836 | ) | | | 85 | |
| | | | | | | | | | | | |
Net of tax amount | | | 1,598 | | | | 1,330 | | | | (135 | ) |
| | | | | | | | | | | | |
Total other comprehensive income | | | 1,546 | | | | 1,012 | | | | 331 | |
| | | | | | | | | | | | |
| | | |
Comprehensive income | | $ | 5,533 | | | $ | 8,450 | | | $ | 6,501 | |
| | | | | | | | | | | | |
See accompanying notes.
F-6
CONSOLIDATED STATEMENTS OF SHAREHOLDERS’ EQUITY
Years Ended December 31, 2008, 2007 and 2006
| | | | | | | | | | | | | | | | | | | | | | | | | | | | | | | | | | |
| | | Common stock | | | Common
stock | | Preferred | | Discount on
preferred | | Retained | | | Stock in
directors | | | Directors
deferred
fees | | Accumulated
other
comprehensive | | Total | |
| | | Shares | | | Amount | | | warrants | | stock | | stock | | earnings | | | rabbi trust | | | obligation | | income | |
| | | (Amounts in thousands, except share and per share data) | |
Balance, December 31, 2005 | | 4,367,953 | | | $ | 19,448 | | | $ | — | | $ | — | | $ | — | | $ | 13,155 | | | $ | (503 | ) | | $ | 503 | | $ | 511 | | $ | 33,114 | |
Net income | | — | | | | — | | | | — | | | — | | | — | | | 6,170 | | | | — | | | | — | | | — | | | 6,170 | |
Other comprehensive income, net of tax | | — | | | | — | | | | — | | | — | | | — | | | — | | | | — | | | | — | | | 331 | | | 331 | |
Directors deferred fees | | — | | | | — | | | | — | | | — | | | — | | | — | | | | (208 | ) | | | 208 | | | — | | | — | |
Common stock issued pursuant to: | | | | | | | | | | | | | | | | | | | | | | | | | | | | | | | | | | |
Business combination | | 1,686,370 | | | | 33,453 | | | | — | | | — | | | — | | | — | | | | — | | | | — | | | — | | | 33,453 | |
Stock options exercised | | 51,551 | | | | 222 | | | | — | | | — | | | — | | | — | | | | — | | | | — | | | — | | | 222 | |
Current income tax benefit | | — | | | | 83 | | | | — | | | — | | | — | | | — | | | | — | | | | — | | | — | | | 83 | |
Shares traded to exercise options | | (5,987 | ) | | | (117 | ) | | | — | | | — | | | — | | | — | | | | — | | | | — | | | — | | | (117 | ) |
Stock-based compensation | | 11,000 | | | | 222 | | | | — | | | — | | | — | | | — | | | | — | | | | — | | | — | | | 222 | |
Purchases and retirement of common stock | | (11,790 | ) | | | (225 | ) | | | — | | | — | | | — | | | — | | | | — | | | | — | | | — | | | (225 | ) |
Cash dividends of $.16 per share | | — | | | | — | | | | — | | | — | | | — | | | (730 | ) | | | — | | | | — | | | — | | | (730 | ) |
| | | | | | | | | | | | | | | | | | | | | | | | | | | | | | | | | | |
Balance, December 31, 2006 | | 6,099,097 | | | | 53,086 | | | | — | | | — | | | — | | | 18,595 | | | | (711 | ) | | | 711 | | | 842 | | | 72,523 | |
Net income | | — | | | | — | | | | — | | | — | | | — | | | 7,438 | | | | — | | | | — | | | — | | | 7,438 | |
Directors deferred fees | | — | | | | — | | | | — | | | — | | | — | | | — | | | | (290 | ) | | | 290 | | | — | | | — | |
Other comprehensive income, net of tax | | — | | | | — | | | | — | | | — | | | — | | | — | | | | — | | | | — | | | 1,012 | | | 1,012 | |
Common stock issued pursuant to: | | | | | | | | | | | | | | | | | | | | | | | | | | | | | | | | | | |
10% stock dividend | | 606,311 | | | | 10,275 | | | | — | | | — | | | — | | | (10,275 | ) | | | — | | | | — | | | — | | | — | |
Issuance of common shares | | 355,544 | | | | 5,446 | | | | — | | | — | | | — | | | — | | | | — | | | | — | | | — | | | 5,446 | |
Stock options exercised | | 232,786 | | | | 1,206 | | | | — | | | — | | | — | | | — | | | | — | | | | — | | | — | | | 1,206 | |
Current income tax benefit | | — | | | | 588 | | | | — | | | — | | | — | | | — | | | | — | | | | — | | | — | | | 588 | |
Shares traded to exercise options | | (36,206 | ) | | | (711 | ) | | | — | | | — | | | — | | | — | | | | — | | | | — | | | — | | | (711 | ) |
Stock-based compensation: | | | | | | | | | | | | | | | | | | | | | | | | | | | | | | | | | | |
Option expense | | — | | | | 97 | | | | — | | | — | | | — | | | — | | | | —�� | | | | — | | | — | | | 97 | |
Restricted stock awards | | — | | | | 55 | | | | — | | | — | | | — | | | — | | | | — | | | | — | | | — | | | 55 | |
Cash dividends of $.18 per share | | — | | | | — | | | | — | | | — | | | — | | | (1,262 | ) | | | — | | | | — | | | — | | | (1,262 | ) |
| | | | | | | | | | | | | | | | | | | | | | | | | | | | | | | | | | |
Balance, December 31, 2007 | | 7,257,532 | | | | 70,042 | | | | — | | | — | | | — | | | 14,496 | | | | (1,001 | ) | | | 1,001 | | | 1,854 | | | 86,392 | |
See accompanying notes.
F-7
CONSOLIDATED STATEMENTS OF SHAREHOLDERS’ EQUITY
Years Ended December 31, 2008, 2007 and 2006 (Continued)
| | | | | | | | | | | | | | | | | | | | | | | | | | | | | | | | | | | |
| | | Common stock | | | Common
stock | | Preferred | | Discount on
preferred | | | Retained | | | Stock in
directors | | | Directors
deferred
fees | | Accumulated
other
comprehensive | | Total | |
| | | Shares | | | Amount | | | warrants | | stock | | stock | | | earnings | | | rabbi trust | | | obligation | | income | |
| | | (Amounts in thousands, except share and per share data) | |
Adoption of new accounting standard | | — | | | $ | — | | | $ | — | | $ | — | | $ | — | | | $ | (959 | ) | | $ | — | | | $ | — | | $ | — | | $ | (959 | ) |
Net income | | — | | | | — | | | | — | | | — | | | — | | | | 3,987 | | | | — | | | | — | | | — | | | 3,987 | |
Directors deferred fees | | — | | | | — | | | | — | | | — | | | — | | | | — | | | | (232 | ) | | | 232 | | | — | | | — | |
Other comprehensive income, net of tax | | — | | | | — | | | | — | | | — | | | — | | | | — | | | | — | | | | — | | | 1,546 | | | 1,546 | |
Issuance of preferred stock and related common stock warrants | | — | | | | — | | | | 2,412 | | | 31,260 | | | (2,412 | ) | | | — | | | | — | | | | — | | | — | | | 31,260 | |
Common stock issued pursuant to: | | | | | | | | | | | | | | | | | | | | | | | | | | | | | | | | | | | |
Exercise of stock options | | 146,177 | | | | 671 | | | | — | | | — | | | — | | | | — | | | | — | | | | — | | | — | | | 671 | |
Current income tax benefit | | — | | | | 286 | | | | | | | — | | | — | | | | — | | | | — | | | | — | | | — | | | 286 | |
Shares traded to exercise options | | (16,282 | ) | | | (236 | ) | | | — | | | — | | | — | | | | — | | | | — | | | | — | | | — | | | (236 | ) |
Stock-based compensation: | | | | | | | | | | | | | | | | | | | | | | | | | | | | | | | | | | | |
Restricted stock awards | | 2,200 | | | | 55 | | | | — | | | — | | | — | | | | — | | | | — | | | | — | | | — | | | 55 | |
Repurchase of common shares | | (39,598 | ) | | | (385 | ) | | | — | | | — | | | — | | | | — | | | | — | | | | — | | | — | | | (385 | ) |
Preferred stock dividends | | — | | | | — | | | | — | | | — | | | 30 | | | | (142 | ) | | | — | | | | — | | | — | | | (112 | ) |
Cash dividends of $.25 per share | | — | | | | — | | | | — | | | — | | | — | | | | (1,825 | ) | | | — | | | | — | | | — | | | (1,825 | ) |
| | | | | | | | | | | | | | | | | | | | | | | | | | | | | | | | | | | |
Balance, December 31, 2008 | | 7,350,029 | | | $ | 70,433 | | | $ | 2,412 | | $ | 31,260 | | $ | (2,382 | ) | | $ | 15,557 | | | $ | (1,233 | ) | | $ | 1,233 | | $ | 3,400 | | $ | 120,680 | |
| | | | | | | | | | | | | | | | | | | | | | | | | | | | | | | | | | | |
See accompanying notes.
F-8
CONSOLIDATED STATEMENTS OF CASH FLOWS
Years Ended December 31, 2008, 2007 and 2006
| | | | | | | | | | | | |
| | | 2008 | | | 2007 | | | 2006 | |
| | | (Amounts in thousands) | |
Operating Activities | | | | |
Net income | | $ | 3,987 | | | $ | 7,438 | | | $ | 6,170 | |
Adjustments to reconcile net income to net cash provided by operating activities: | | | | | | | | | | | | |
Depreciation and amortization | | | 1,497 | | | | 1,372 | | | | 1,097 | |
Amortization (accretion) of premiums and discounts, net | | | (259 | ) | | | 19 | | | | (3 | ) |
Amortization of core deposit intangible | | | 248 | | | | 251 | | | | 115 | |
Stock-based compensation | | | 55 | | | | 151 | | | | 222 | |
Deferred compensation | | | 791 | | | | 606 | | | | 721 | |
Provision for loan losses | | | 7,075 | | | | 3,090 | | | | 2,655 | |
Provision for deferred income taxes (benefit) | | | 758 | | | | 193 | | | | (1,767 | ) |
Increase in cash surrender value life insurance | | | (1,101 | ) | | | (891 | ) | | | (562 | ) |
Gain on sale of securities | | | (223 | ) | | | — | | | | — | |
(Gain) loss on disposal of premises and equipment | | | (1 | ) | | | — | | | | — | |
(Gain) loss on sales of foreclosed assets | | | 317 | | | | 7 | | | | (46 | ) |
Gain on sale of loans | | | (783 | ) | | | (839 | ) | | | (605 | ) |
Origination of loans held for sale | | | (47,320 | ) | | | (43,583 | ) | | | (30,250 | ) |
Proceeds from sales of loans held for sale | | | 49,858 | | | | 44,275 | | | | 30,388 | |
Changes in assets and liabilities: | | | | | | | | | | | | |
Increase in accrued interest receivable | | | (2,318 | ) | | | (261 | ) | | | (1,572 | ) |
Increase in other assets | | | (2,223 | ) | | | (1,042 | ) | | | 4,221 | |
Increase (decrease) in accrued expenses and other liabilities | | | (1,852 | ) | | | (467 | ) | | | (211 | ) |
| | | | | | | | | | | | |
Net cash provided by operating activities | | | 8,506 | | | | 10,319 | | | | 10,573 | |
| | | | | | | | | | | | |
| | | |
Investing Activities | | | | | | | | | | | | |
Purchases of securities available for sale | | | (347,063 | ) | | | (14,412 | ) | | | (18,684 | ) |
Purchases of securities held to maturity | | | (6,000 | ) | | | — | | | | — | |
Proceeds from sales of securities available for sale | | | 7,823 | | | | — | | | | — | |
Proceeds from calls and maturities of securities available for sale | | | 9,495 | | | | 3,735 | | | | 3,958 | |
Purchases of Federal Home Loan Bank stock | | | (6,211 | ) | | | (3,407 | ) | | | (267 | ) |
Investment in life insurance | | | (1,527 | ) | | | (4,026 | ) | | | (3,014 | ) |
Net increase in loans | | | (85,240 | ) | | | (161,492 | ) | | | (133,809 | ) |
Purchases of premises and equipment | | | (4,147 | ) | | | (4,859 | ) | | | (3,484 | ) |
Proceeds from disposal of premises and equipment | | | 12 | | | | — | | | | — | |
Investment in foreclosed assets | | | — | | | | (69 | ) | | | — | |
Proceeds from sales of foreclosed assets | | | 1,850 | | | | 833 | | | | 2,308 | |
Net cash used in business combination | | | — | | | | — | | | | (1,226 | ) |
| | | | | | | | | | | | |
Net cash used by investing activities | | | (431,008 | ) | | | (183,697 | ) | | | (154,218 | ) |
| | | | | | | | | | | | |
| | | |
Financing Activities | | | | | | | | | | | | |
Net increase in deposits | | | 290,864 | | | | 68,213 | | | | 154,435 | |
Net increase (decrease) in short-term borrowings | | | 113,215 | | | | 76,255 | | | | (7,798 | ) |
Net increase in long-term debt | | | 4,000 | | | | 20,000 | | | | 7,217 | |
Proceeds from issuance of preferred stock | | | 31,260 | | | | — | | | | — | |
Proceeds from issuance of common stock | | | — | | | | 5,446 | | | | — | |
Proceeds from exercise of stock options | | | 435 | | | | 495 | | | | 105 | |
Tax benefit from exercise of stock options | | | 286 | | | | 588 | | | | 83 | |
Purchase and retirement common stock | | | (385 | ) | | | — | | | | (225 | ) |
Cash dividends paid | | | (1,457 | ) | | | (1,262 | ) | | | (730 | ) |
| | | | | | | | | | | | |
Net cash provided by financing activities | | | 438,218 | | | | 169,735 | | | | 153,087 | |
| | | | | | | | | | | | |
Net increase (decrease) in cash and cash equivalents | | | 15,716 | | | | (3,643 | ) | | | 9,442 | |
Cash and cash equivalents, beginning of year | | | 21,054 | | | | 24,697 | | | | 15,255 | |
| | | | | | | | | | | | |
Cash and cash equivalents, end of year | | $ | 36,770 | | | $ | 21,054 | | | $ | 24,697 | |
| | | | | | | | | | | | |
Supplemental Statement of Cash Flows Disclosure | | | | | | | | | | | | |
Interest paid | | $ | 37,458 | | | $ | 41,564 | | | $ | 25,146 | |
Income taxes paid | | | 1,170 | | | | 2,801 | | | | 2,787 | |
Summary of Noncash Investing and Financing Activities | | | | | | | | | | | | |
Increase (decrease) in fair value of securities available for sale, net of tax | | $ | (52 | ) | | $ | (318 | ) | | $ | 466 | |
Increase (decrease) in fair value of cash flow hedge, net of tax | | | 1,598 | | | | 1,330 | | | | (135 | ) |
Transfer of loans to foreclosed assets | | | 4,679 | | | | 2,202 | | | | 2,485 | |
Accrual of dividends payable | | | 480 | | | | — | | | | — | |
Liability accrued under adoption of new accounting standard | | | 959 | | | | — | | | | — | |
See accompanying notes.
F-9
NOTES TO CONSOLIDATED FINANCIAL STATEMENTS
December 31, 2008, 2007 and 2006
NOTE A - ORGANIZATION AND SUMMARY OF SIGNIFICANT ACCOUNTING POLICIES
Organization
On December 16, 2002, BNC Bancorp (“BNC”) was formed as a holding company for Bank of North Carolina (the “Bank”). Upon formation, one share of the BNC’s no par value common stock was exchanged for each outstanding share of the Bank’s $2.50 par value common stock. BNC is subject to the rules and regulations of the Federal Reserve Bank.
Bank of North Carolina was incorporated and began banking operations in 1991. The Bank, which is wholly owned by BNC, is engaged in commercial banking predominantly in Davidson, Forsyth, Guilford and Randolph Counties, North Carolina, operating under the Banking Laws of North Carolina and the Rules and Regulations of the Federal Deposit Insurance Corporation and the North Carolina Commissioner of Banks. The Bank’s primary source of revenue is derived from loans to customers, who are predominantly individuals and small to medium size businesses in Cabarrus, Davidson, Forsyth, Guilford, Iredell, Randolph and Rowan Counties.
Basis of Presentation
The accompanying consolidated financial statements include the accounts and transactions of BNC and the Bank, collectively referred to herein as the “Company”. All significant intercompany transactions and balances are eliminated in consolidation.
Use of Estimates
The preparation of consolidated financial statements in conformity with accounting principles generally accepted in the United States of America (“GAAP”) requires management to make estimates and assumptions that affect the reported amounts of assets and liabilities and disclosure of contingent assets and liabilities at the date of the financial statements and the reported amounts of revenues and expenses during the reporting period. Actual results could differ from those estimates. Material estimates that are particularly susceptible to significant change in the near term relate to the determination of the allowance for loan losses.
Cash and Cash Equivalents
For the purpose of presentation in the statements of cash flows, cash and cash equivalents include cash and due from banks and interest-earning deposits in other banks with maturities of three months or less. From time to time, the Bank may have deposits in excess of federally insured limits.
Federal regulations require financial institutions to set aside a specified amount as a reserve against transaction accounts and time deposits. At December 31, 2008, the Company’s reserve requirement was $6.7 million.
Securities
Securities are classified into one of three categories on the date of purchase and accounted for as follows: (1) debt securities that the Company has the positive intent and the ability to hold to maturity are classified as held to maturity and reported at amortized cost; (2) debt and equity securities that are bought and held principally for the purpose of selling them in the near term are classified as trading securities and reported at fair value, with unrealized gains and losses included in earnings; (3) debt and equity securities not classified as either held to maturity securities or trading securities are classified as available for sale securities and reported at fair value, with unrealized gains and losses, net of taxes, reported as other comprehensive income.
F-10
NOTES TO CONSOLIDATED FINANCIAL STATEMENTS
December 31, 2008, 2007 and 2006
Premiums are amortized and discounts accreted using the interest method over the remaining terms of the related securities. Gains and losses on the sale of securities are determined using the specific identification method and are included in non-interest income on a trade date basis.
Federal Home Loan Bank Stock
As a member of the Federal Home Loan Bank of Atlanta (the “FHLB”), the Company is required to maintain an investment in the stock of the FHLB. This stock is carried at cost. Due to the redemption provisions of the FHLB, the Company estimated that fair value equals cost and that this investment was not impaired at December 31, 2008 and 2007.
Loans Held for Sale
The Company originates certain single family, residential first mortgage loans for sale on a presold basis. Loans held for sale are carried at the lower of cost or estimated fair value in the aggregate as determined by outstanding commitments from investors. Upon closing, these loans, together with their servicing rights, are sold to other financial institutions under prearranged terms. The Company recognizes certain origination and service fees upon the sale which are classified as mortgage fee income on the statement of income.
Loans and Allowance for Loan Losses
Loans that management has the intent and ability to hold for the foreseeable future or until maturity are reported at their outstanding principal adjusted for any charge-offs, the allowance for loan losses, and any deferred fees or costs on originated loans and unamortized premiums or discounts on purchased loans. Loan origination fees and certain direct origination costs are capitalized and recognized as an adjustment of the yield of the related loan. Interest on loans is recorded based on the principal amount outstanding.
The allowance for loan losses is established through a provision for loan losses charged to expense. Loans are charged-off against the allowance when management believes that the collectibility of principal is unlikely. Recoveries of amounts previously charged-off are credited to the allowance. The allowance is an amount that management believes will be adequate to absorb probable losses on existing loans based on evaluations of the collectibility of loans. The evaluations take into consideration such factors as changes in the nature and volume of the loan portfolio, overall portfolio quality, historical loan losses, review of specific loans for impairment, and current economic conditions and trends that may affect the borrowers’ ability to pay. Accrual of interest is discontinued on loans when management believes, after considering economic and business conditions and collection efforts, that the borrowers’ financial condition is such that collection is doubtful.
The Company considers a loan impaired, based on current information and events, if it is probable that the Company will be unable to collect the scheduled payments of principal or interest when due according to the contractual terms of the loan agreement. All impaired loans are measured based on the present value of the expected future cash flows discounted at the loan’s effective interest rate, the loan’s observable market price, or at the fair value of the collateral if the loan is collateral dependent.
F-11
NOTES TO CONSOLIDATED FINANCIAL STATEMENTS
December 31, 2008, 2007 and 2006
The Company uses several factors in determining if a loan is impaired. Internal asset classification procedures include a thorough review of significant loans and lending relationships and include the accumulation of related data. This data includes loan payment status and the borrowers’ financial data, cash flows, operating income or loss, and other factors. While management uses the best information available to make evaluations, this evaluation is inherently subjective as it requires material estimates including the amounts and timing of future cash flows expected to be received on impaired loans that may be susceptible to significant change.
In addition, various regulatory agencies, as an integral part of their examination process, periodically review the Bank’s allowance for loan losses. Such agencies may require the Bank to recognize adjustments to the allowance based on their judgments of information available to them at the time of their examination.
Income Recognition of Impaired and Nonaccrual Loans
Loans, including impaired loans, are generally classified as nonaccrual if they are past due as to maturity or payment of principal or interest for a period of more than ninety (90) days, unless such loans are well-secured and in the process of collection. If a loan or a portion of a loan is classified as doubtful or is partially charged off, the loan is generally classified as nonaccrual. Loans that are on a current payment status or past due less than ninety (90) days may also be classified as nonaccrual if repayment in full of principal and/or interest is in doubt.
Loans may be returned to accrual status when all principal and interest amounts contractually due (including arrearages) are reasonably assured of repayment within an acceptable period of time and there is a sustained period of repayment performance (generally, a minimum of six months) by the borrower in accordance with the contractual terms of interest and principal.
While a loan is classified as nonaccrual and the future collectibility of the recorded loan balance is doubtful, collections of interest and principal are generally applied as a reduction to principal outstanding, except loans with scheduled amortizations where the payment is generally applied to the oldest payment due. When future collection of the recorded loan balance is expected, interest income may be recognized on a cash basis. In the case where a nonaccrual loan had been partially charged off, recognition of interest on a cash basis is limited to that which would have been recognized on the recorded loan balance at the contractual interest rate. Receipts in excess of that amount are recorded as recoveries to the allowance for loan losses until prior charge-offs have been fully recovered.
Comprehensive Income
Comprehensive income is defined as the change in equity during a period for non-owner transactions and is divided into net income and other comprehensive income. Other comprehensive income includes revenues, expenses, gains, and losses that are excluded from earnings under current accounting standards. Components of other comprehensive income for the Company consist of the unrealized gains and losses, net of taxes, in the Company’s available for sale securities portfolio and unrealized gains and losses, net of taxes, in the Company’s cash flow hedge instruments.
F-12
NOTES TO CONSOLIDATED FINANCIAL STATEMENTS
December 31, 2008, 2007 and 2006
Accumulated other comprehensive income at December 31, 2008, 2007 and 2006 consists of the following:
| | | | | | | | | | | | |
| | | 2008 | | | 2007 | | | 2006 | |
| | | (Amounts in thousands) | |
Unrealized holding gains - securities available for sale | | $ | 1,003 | | | $ | 1,052 | | | $ | 1,553 | |
Deferred income taxes | | | (387 | ) | | | (384 | ) | | | (567 | ) |
| | | | | | | | | | | | |
Net unrealized holding gains - securities available for sale | | | 616 | | | | 668 | | | | 986 | |
| | | | | | | | | | | | |
| | | |
Unrealized holding gains (losses) - cash flow hedge instruments | | | 4,531 | | | | 1,931 | | | | (235 | ) |
Deferred income taxes | | | (1,747 | ) | | | (745 | ) | | | 91 | |
| | | | | | | | | | | | |
Net unrealized holding losses - cash flow hedge instruments | | | 2,784 | | | | 1,186 | | | | (144 | ) |
| | | | | | | | | | | | |
| | | |
Total accumulated other comprehensive income | | $ | 3,400 | | | $ | 1,854 | | | $ | 842 | |
| | | | | | | | | | | | |
Premises and Equipment
Premises and equipment are stated at cost less accumulated depreciation and amortization. Land is carried at cost. Depreciation and amortization are computed using the straight-line method over the estimated useful lives of the respective assets which are 40 years for buildings and 3 to 10 years for furniture and equipment. Leasehold improvements are amortized over the terms of the respective leases or the estimated useful lives of the improvements, whichever is shorter. Repairs and maintenance costs are charged to operations as incurred.
Foreclosed Assets
Assets acquired through, or in lieu of, loan foreclosure are held for sale and are initially recorded at fair value at the date of foreclosure, establishing a new cost basis. Subsequent to foreclosure, valuations are periodically performed by management and the assets are carried at the lower of carrying amount or fair value less cost to sell. Revenue and expenses from operations and changes in the valuation allowance are included in other non-interest expense.
Income Taxes
Deferred income taxes are recognized for the tax consequences of temporary differences between financial statement carrying amounts and the tax bases of existing assets and liabilities that will result in taxable or deductible amounts in future years. These temporary differences are multiplied by the enacted income tax rate expected to be in effect when the taxes become payable or receivable. The effect on deferred taxes of a change in tax rates is recognized in income in the period that includes the enactment date. Deferred tax assets are reduced, if necessary, by the amount of such benefits that are not expected to be realized based on available evidence.
The Company adopted the provisions of FIN 48,Accounting for Uncertainty in Income Taxes, on January 1, 2007 with no impact on the consolidated financial statements. The Company did not recognize any interest or penalties related to income tax during the years ended December 31, 2007 and 2008, and did no accrue any interest or penalties as of December 31, 2008 or 2007. The Company did not have an accrual for uncertain tax positions as deductions taken and benefits accrued are based on widely understood administrative practices and procedures, and are based on clear and unambiguous tax law. Tax returns for all years 2005 and thereafter are subject to possible future examinations by tax authorities.
F-13
NOTES TO CONSOLIDATED FINANCIAL STATEMENTS
December 31, 2008, 2007 and 2006
Goodwill and Other Intangibles
In July 2001, the Financial Accounting Standards Board (“FASB”) issued Statement of Financial Accounting Standards (“SFAS”) No. 142,Goodwill and Other Intangible Assets. SFAS No. 142 required companies to cease amortizing goodwill and established a new method for testing goodwill for impairment on an annual basis. In accordance with provisions of SFAS No. 142, all goodwill resulting from business combinations is not being amortized. Other intangible assets, consisting of premiums on purchased core deposits, are being amortized over ten years principally using the straight-line method. The carrying amount of goodwill and other intangible assets at December 31, 2008 amounted to $26.1 million and $1.8 million, respectively.
Impairment or Disposal of Long-Lived Assets
The Company’s long-lived assets are reviewed for impairment whenever events or changes in circumstances indicate that the carrying amount of an asset may not be recoverable. Recoverability of assets to be held and used, such as bank premises and equipment, is measured by a comparison of the carrying amount of an asset to future net cash flows expected to be generated by the asset. If the carrying amount of an asset exceeds its estimated future cash flows, an impairment charge is recognized in the amount by which the carrying amount of the asset exceeds the fair value of the asset. Assets to be disposed of, such as foreclosed properties, are reported at the lower of the carrying amount or fair value less costs to sell.
Reclassifications
Certain amounts in the 2007 and 2006 consolidated financial statements have been reclassified to conform to the 2008 presentation. The reclassifications had no effect on net income or shareholders’ equity as previously reported.
Derivatives
For asset/liability management purposes, the Company utilizes interest rate swap agreements to hedge various exposures of various balance sheet accounts. Such derivatives are used as part of the asset/liability management process and are linked to specific assets or liabilities, and have a high correlation between the contract and the underlying item being hedged, both at inception and throughout the hedge period.
The Company utilizes interest rate swap agreements to convert a portion of its variable-rate loans to a fixed rate (cash flow hedge). Interest rate swaps are contracts in which a series of interest rate flows, primarily from interest rate receipts, are exchanged over a prescribed period. The notional amount on which the interest payments are based is not exchanged. Interest payments or receipts are recorded as an adjustment to yield on the hedged assets.
The effective portion of the gain or loss on a derivative designated and qualifying as a cash flow hedging instrument is initially reported as a component of other comprehensive income and subsequently reclassified into earnings in the same period or periods during which the hedged transaction affects earnings. The ineffective portion of the gain or loss on the derivative instrument, if any, is recognized currently in earnings.
F-14
NOTES TO CONSOLIDATED FINANCIAL STATEMENTS
December 31, 2008, 2007 and 2006
Interest rate derivative financial instruments receive hedge accounting treatment only if they are designated as a hedge and are expected to be, and are, effective in substantially reducing interest rate risk arising from the assets and liabilities identified as exposing the Company to risk. Derivative hedge contracts must meet specific effectiveness tests (i.e., over time the change in their fair values due to the designated hedge risk must be within 80 to 125 percent of the opposite change in the fair values of the hedged assets or liabilities). Cash flows of the derivative financial instruments must be effective at offsetting cash flows of the hedged asset during the term of the hedge. Further, if the underlying financial instrument differs from the hedged asset or liability, there must be a clear economic relationship between the prices of the two financial instruments. If periodic assessment indicates derivatives no longer provide an effective hedge, the derivatives contracts would be closed out and settled or classified as a trading activity.
Hedges of variable-rate loans are accounted for as cash flow hedges, with changes in fair value recorded in derivative assets or liabilities and other comprehensive income. The net settlement (upon close out or termination) that offsets changes in the value of the hedged loans is deferred and amortized into net interest income over the life of the hedged loans.
Cash flows resulting from the derivative financial instruments that are accounted for as hedges of assets and liabilities are classified in the cash flow statement in the same category as the cash flows of the items being hedged.
Net Income Per Share
Basic and diluted net income per share are computed by dividing net income available to common shareholders by the weighted average number of common shares outstanding during each period after retroactively adjusting for a 10% stock dividend distributed on January 22, 2007. Diluted net income per share reflects the potential dilution that could occur if common stock options and warrants were exercised, resulting in the issuance of common stock that then shared in the net income of the Company.
Basic and diluted net income per share have been computed based upon net income available to common shareholders as presented in the accompanying consolidated statements of operations divided by the weighted average number of common shares outstanding or assumed to be outstanding as summarized below:
| | | | | | |
| | | 2008 | | 2007 | | 2006 |
Weighted average number of common shares used in computing basic net income per share | | 7,322,723 | | 6,865,204 | | 5,658,196 |
| | | |
Effect of dilutive stock options | | 71,739 | | 217,925 | | 296,267 |
| | | |
Effects of restricted stock | | 1,708 | | 5,089 | | 3,015 |
| | | | | | |
| | | |
Weighted average number of common shares and dilutive potential common shares used in computing diluted net income per share | | 7,396,170 | | 7,088,218 | | 5,957,478 |
| | | | | | |
F-15
NOTES TO CONSOLIDATED FINANCIAL STATEMENTS
December 31, 2008, 2007 and 2006
At December 31, 2008 the outstanding common stock warrants associated with the Capital Purchase Plan and 131,053 common stock options were excluded in computing diluted shares outstanding because the exercise price exceeded the market price of the common shares outstanding. For the 2007 and 2006 there were no antidilutive options.
Stock Compensation Plans
Effective January 1, 2006 the Company adopted the provisions of SFAS No. 123 (revised 2004),Share-Based Payment (“SFAS No. 123(R)”), and the Securities and Exchange Commission’s (“SEC”) Staff Accounting Bulletin (“SAB”) No. 107,Share-Based Payment, for share-based payment awards. Accordingly, stock-based compensation expense for all share-based payment awards is based on the grant date fair value. The grant date fair value for stock option awards is estimated using the Black-Scholes option pricing model in accordance with the provisions of SFAS No. 123(R) and the grant date fair value for restricted stock awards is based upon the closing price of the Company’s common stock on the date of grant. The Company recognizes these compensation costs on a straight-line basis over the requisite service period of the award, typically the vesting period.
Segment Reporting
SFAS No. 131,Disclosures about Segments of an Enterprise and Related Information requires management to report selected financial and descriptive information about reportable operating segments. It also establishes standards for related disclosures about products and services, geographic areas, and major customers. Generally, disclosures are required for segments internally identified to evaluate performance and resource allocation. In all material respects, the Company’s operations are entirely within the commercial banking segment, and the financial statements presented herein reflect the results of that segment. Also, the Bank has no foreign operations or customers.
Recently Adopted and Issued Accounting Standards
In September 2006, the FASB ratified the consensuses reached by the FASB’s Emerging Issues Task Force (“EITF”) relating to EITF 06-4,Accounting for the Deferred Compensation and Postretirement Benefit Aspects of Endorsement Split-Dollar Life Insurance Arrangements. EITF 06-4 states that an employer accounting for endorsement split-dollar life insurance arrangements that provide a benefit to an employee that extends to postretirement periods should recognize a liability for future benefits in accordance with SFAS No. 106,Employers’ Accounting for Postretirement Benefits Other Than Pensions, or Accounting Principles Board (“APB”) Opinion No. 12,Omnibus Opinion—1967. The Company adopted EITF 06-4 on January 1, 2008, and in connection therewith recorded a liability of $959,000 as a reduction of retained earnings. Subsequent increases in this liability will be reflected as an expense in determining operating results.
SFAS No. 157, Fair Value Measurements, was issued in September 2006. In defining fair value, SFAS No. 157 retains the exchange price notion in earlier definitions of fair value. However, the definition of fair value under SFAS No. 157 focuses on the price that would be received to sell an asset or paid to transfer a liability (an exit price), not the price that would be paid to acquire the asset or received to assume the liability (an entry price). SFAS No. 157 applies whenever other accounting pronouncements require or permit assets or liabilities to be measured at fair value. Accordingly, SFAS No. 157 does not expand the use of fair value in any new circumstances. SFAS No. 157 also establishes a fair value hierarchy that prioritizes the information used to develop assumptions used to determine the exit price. Under this standard, fair value measurements would be disclosed separately by level within the fair value hierarchy. The Company adopted SFAS No. 157 effective January 1, 2008. The adoption of SFAS No. 157 had no effect on the Company’s financial condition or results of operations. For additional information on the fair value of certain financial assets and liabilities, see Note B to the consolidated financial statements.
F-16
NOTES TO CONSOLIDATED FINANCIAL STATEMENTS
December 31, 2008, 2007 and 2006
In February 2007, the FASB issued SFAS No. 159, The Fair Value Option for Financial Assets and Financial Liabilities. SFAS No. 159 creates a fair value option allowing an entity irrevocably to elect fair value as the initial and subsequent measurement attribute for certain financial assets and financial liabilities, with changes in fair value recognized in earnings as they occur. SFAS No. 159 requires an entity to report those financial assets and financial liabilities measured at fair value in a manner that separates those reported fair values from the carrying amounts of assets and liabilities measured using another measurement attribute on the face of the statement of financial position. SFAS No. 159 also requires an entity to provide information that would allow users to understand the effect on earnings of changes in the fair value on those instruments selected for the fair value election. The Company adopted SFAS No. 159 effective January 1, 2008. There was no initial effect of adoption since the Company did not elect the fair value option for any existing asset or liability. In addition, the Company did not elect the fair value option for any financial assets originated or purchased, or for liabilities issued, through December 31, 2008.
In December 2007, the FASB issued SFAS No. 141(revised 2007),Business Combinations, (“SFAS No. 141(R)”), which replaces SFAS No. 141. SFAS No. 141(R) establishes principles and requirements for recognition and measurement of assets, liabilities and any noncontrolling interest acquired due to a business combination. SFAS No. 141(R) expands the definitions of a business and a business combination, resulting in an increased number of transactions or other events that will qualify as business combinations. Under SFAS No. 141(R) the entity that acquires the business (the “acquirer”) will record 100 percent of all assets and liabilities of the acquired business, including goodwill, generally at their fair values. As such, an acquirer will not be permitted to recognize the allowance for loan losses of the acquiree. SFAS No. 141(R) requires the acquirer to recognize goodwill as of the acquisition date, measured as a residual. In most business combinations, goodwill will be recognized to the extent that the consideration transferred plus the fair value of any noncontrolling interests in the acquiree at the acquisition date exceeds the fair values of the identifiable net assets acquired. Under SFAS No. 141(R), acquisition-related transaction and restructuring costs will be expensed as incurred rather than treated as part of the cost of the acquisition and included in the amount recorded for assets acquired. SFAS No. 141(R) is effective for fiscal years beginning after December 15, 2008. Accordingly, for acquisitions completed after December 31, 2008, the Company will apply the provisions of SFAS No. 141(R).
In December 2007, the FASB issued SFAS No. 160,Noncontrolling Interests in Consolidated Financial Statements, an amendment of ARB 51, which defines noncontrolling interest as the portion of equity in a subsidiary not attributable, directly or indirectly, to the parent. SFAS No. 160 requires the ownership interests in subsidiaries held by parties other than the parent (previously referred to as minority interest) to be clearly presented in the consolidated statement of financial position within equity, but separate from the parent’s equity. The amount of consolidated net income attributable to the parent and to any noncontrolling interest must be clearly presented on the face of the consolidated statement of income. Changes in the parent’s ownership interest while the parent retains its controlling financial interest (greater than 50 percent ownership) are to be accounted for as equity transactions. Upon a loss of control, any gain or loss on the interest sold will be recognized in earnings. Additionally, any ownership interest retained will be remeasured
F-17
NOTES TO CONSOLIDATED FINANCIAL STATEMENTS
December 31, 2008, 2007 and 2006
at fair value on the date control is lost, with any gain or loss recognized in earnings. SFAS No. 160 is effective for fiscal years beginning after December 15, 2008. Accordingly, the Company will adopt the provisions of SFAS No. 160 in the first quarter 2009. The Company does not expect the adoption of the provisions of SFAS No. 160 to have a material effect on its financial condition and results of operations.
SFAS No. 161, Disclosures about Derivative Instruments and Hedging Activities, an amendment of FASB Statement No. 133, issued in March 2008, requires enhanced disclosures about an entity’s derivative and hedging activities. These enhanced disclosures will discuss (a) how and why an entity uses derivative instruments; (b) how derivative instruments and related hedged items are accounted for under SFAS No. 133, and its related interpretations; and (c) how derivative instruments and related hedged items affect an entity’s financial position, financial performance, and cash flows. SFAS No. 161 is effective for financial statements issued for fiscal years beginning after November 15, 2008 with earlier adoption allowed. The Company does not believe that the adoption of SFAS No. 161 will have a material effect on its financial condition or results of operations.
FSP No. FAS 157-3,Determining the Fair Value of a Financial Asset When the Market for That Asset Is Not Active(“FSP FAS 157-3”), issued in October 2008, clarifies the application of SFAS No. 157 in a market that is not active and provides an example to illustrate key considerations in determining the fair value of a financial asset when the market for that financial asset is not active. FSP FAS 157-3 was effective upon issuance, including prior periods for which financial statements have not been issued. Revisions resulting from a change in the valuation technique or its application should be accounted for as a change in accounting estimate following the guidance in SFAS No. 154,Accounting Changes and Error Corrections. However, the disclosure provisions in SFAS No. 154 for a change in accounting estimate are not required for revisions resulting from a change in valuation technique or its application. As FSP FAS 157-3 clarified but did not change the application of SFAS No. 157, the adoption of FSP FAS 157-3 had no effect on the Company’s financial condition or results of operations.
Other accounting standards that have been issued or proposed by the FASB or other standards-setting bodies are not expected to have a material impact on the Company’s financial position, results of operations and cash flows.
From time to time the FASB issues exposure drafts for proposed statements of financial accounting standards. Such exposure drafts are subject to comment from the public, to revisions by the FASB and to final issuance by the FASB as statements of financial accounting standards. Management considers the effect of the proposed statements on the consolidated financial statements of the Company and monitors the status of changes to and proposed effective dates of exposure drafts.
NOTE B - ESTIMATED FAIR VALUES
As discussed in Note A to the consolidated financial statements, the Company adopted SFAS No. 157 and SFAS No. 159 on January 1, 2008. SFAS No. 157 defines fair value, establishes a framework for measuring fair value under GAAP and expands disclosures about fair value measurements. SFAS 157 applies whenever other accounting pronouncements require or permit assets or liabilities to be measured at fair value. Accordingly, SFAS No. 157 does not expand the use of fair value in any new circumstances. SFAS No. 159 provides companies with an option to report selected financial assets and liabilities at fair value. As of December 31, 2008, the Company had not elected to measure any financial assets or liabilities using the fair value option under SFAS No. 159; therefore the adoption of SFAS No. 159 had no effect on the Company’s financial condition or results of operations.
F-18
NOTES TO CONSOLIDATED FINANCIAL STATEMENTS
December 31, 2008, 2007 and 2006
The Company records securities available for sale and derivative assets at fair value on a recurring basis. Fair value is a market-based measurement and is defined as the price that would be received to sell an asset, or paid to transfer a liability, in an orderly transaction between market participants at the measurement date. The transaction to sell the asset or transfer the liability is a hypothetical transaction at the measurement date, considered from the perspective of a market participant that holds the assets or owes the liability. In general, the transaction price will equal the exit price and, therefore, represent the fair value of the asset or liability at initial recognition. In determining whether a transaction price represents the fair value of the asset or liability at initial recognition, each reporting entity is required to consider factors specific to the transaction and the asset or liability, the principal or most advantageous market for the asset or liability, and market participants with whom the entity would transact in the market.
SFAS No. 157 establishes a fair value hierarchy to prioritize the inputs of valuation techniques used to measure fair value. The inputs are evaluated and an overall level for the fair value measurement is determined. This overall level is an indication of how market-observable the fair value measurement is and defines the level of disclosure. SFAS No. 157 clarifies fair value in terms of the price in an orderly transaction between market participants to sell an asset or transfer a liability in the principal (or most advantageous) market for the asset or liability at the measurement date (an exit price). In order to determine the fair value or the exit price, entities must determine the unit of account, highest and best use, principal market, and market participants. These determinations allow the reporting entity to define the inputs for fair value and level of hierarchy.
Outlined below is the application of the fair value hierarchy established by SFAS No. 157 to the Company’s financial assets that are carried at fair value.
Level 1 – inputs to the valuation methodology are quoted prices (unadjusted) for identical assets or liabilities in active markets. An active market for the asset or liability is a market in which the transactions for the asset or liability occur with sufficient frequency and volume to provide pricing information on an ongoing basis. As of December 31, 2008, the Company did not carry any financial assets and liabilities at fair value hierarchy Level 1.
Level 2 – inputs to the valuation methodology include quoted prices for similar assets and liabilities in active markets, and inputs that are observable for the asset or liability, either directly or indirectly, for substantially the full term of the financial instrument. As of December 31, 2008, the types of financial assets and liabilities the Company carried at fair value hierarchy Level 2 included securities available for sale and derivatives.
Level 3 – inputs to the valuation methodology are unobservable and significant to the fair value measurement. Unobservable inputs are supported by little or no market activity or by the entity’s own assumptions. As of December 31, 2008, while the Company did not carry any financial assets or liabilities, measured on a recurring basis, at fair value hierarchy Level 3, the Company did value certain financial assets, measured on a non-recurring basis, at fair value hierarchy Level 3.
F-19
NOTES TO CONSOLIDATED FINANCIAL STATEMENTS
December 31, 2008, 2007 and 2006
Fair Value on a Recurring Basis.The Company measures certain assets at fair value on a recurring basis, as described below.
Investment Securities Available-for-Sale
Investment securities available-for-sale are recorded at fair value on a recurring basis. Fair value measurement is based upon quoted prices, if available. If quoted prices are not available, fair values are measured using independent pricing models or other model-based valuation techniques such as the present value of future cash flows, adjusted for the security’s credit rating, prepayment assumptions and other factors such as credit loss assumptions. Level 1 securities include those traded on an active exchange, such as the New York Stock Exchange, U.S. Treasury securities that are traded by dealers or brokers in active over-the-counter markets and money market funds. Level 2 securities include mortgage-backed securities issued by government sponsored entities, municipal bonds and corporate debt securities. Securities classified as Level 3 include asset-backed securities in less liquid markets.
Derivative Assets and Liabilities
Derivative instruments held or issued by the Company for risk management purposes are traded in over-the-counter markets where quoted market prices are not readily available. For those derivatives, the Company measures fair value using models that use primarily market observable inputs, such as yield curves and option volatilities, and include the value associated with counterparty credit risk. The Company classifies derivatives instruments held or issued for risk management purposes as Level 2. As of December 31, 2008 the Company’s derivative instruments consist solely of interest rate swaps.
The Company utilizes valuation techniques that maximize the use of observable inputs and minimize the use of unobservable inputs.
Fair Value on a Recurring Basis.Below is a table that presents information about assets measured at fair value on a recurring basis at December 31, 2008:
| | | | | | | | | | | | | | | |
| | | | | | | Fair Value Measurements at
December 31, 2008, Using |
Description | | Total Carrying
Amount in The
Consolidated
Balance Sheet
12/31/2008 | | Assets/Liabilities
Measured at
Fair Value
12/31/2008 | | Quoted Prices
in Active
Markets for
Identical Assets
(Level 1) | | Significant
Other
Observable
Inputs
(Level 2) | | Significant
Unobservable
Inputs
(Level 3) |
Securities available for sale | | $ | 416,564 | | $ | 416,564 | | $ | — | | $ | 416,564 | | $ | — |
Interest rate swaps | | | 4,531 | | | 4,531 | | | — | | | 4,531 | | | — |
Fair Value on a Nonrecurring Basis.The Company measures certain assets at fair value on a nonrecurring basis, as described below.
Investment Securities Held-to-Maturity
Investment securities held to maturity are recorded at fair value on a nonrecurring basis when an impairment in value that is deemed to be other than temporary occurs. Fair value measurement is based upon quoted prices, if available. If quoted prices are not available, fair values are measured using independent pricing models or other model-based valuation techniques such as the present value of future cash flows, adjusted for the security’s credit rating, prepayment assumptions and other factors such as credit loss assumptions.
F-20
NOTES TO CONSOLIDATED FINANCIAL STATEMENTS
December 31, 2008, 2007 and 2006
Loans Held for Sale
Loans held for sale are carried at the lower of cost or market value. The fair value of loans held for sale is based on what secondary markets are currently offering for portfolios with similar characteristics. As such, the Company classifies loans subjected to nonrecurring fair value adjustments as Level 2. There were no fair value adjustments related to loans held for sale as of or for the year ended December 31, 2008.
Loans
The Company does not record loans at fair value on a recurring basis. However, from time to time, a loan is considered impaired and an allowance for loan losses is established. Loans for which it is probable that payment of interest and principal will not be made in accordance with the contractual terms of the loan agreement are considered impaired. Once a loan is identified as individually impaired, management measures impairment in accordance with SFAS No. 114, “Accounting by Creditors for Impairment of a Loan.” The fair value of impaired loans is estimated using one of several methods, including collateral value, market value of similar debt, enterprise value, liquidation value and discounted cash flows. Those impaired loans not requiring an allowance represent loans for which the fair value of the expected repayments or collateral exceed the recorded investments in such loans. At December 31, 2008, substantially all of the total impaired loans were evaluated based on the fair value of the collateral. In accordance with SFAS No. 157, impaired loans where an allowance is established based on the fair value of collateral require classification in the fair value hierarchy. When the fair value of the collateral is based on an observable market price or a current appraised value, the Company records the impaired loan as nonrecurring Level 2. When current appraised value is not available or management determines the fair value of the collateral is further impaired below the appraised value and there is no observable market price, the Company records the impaired loan as nonrecurring Level 3. Impaired loans totaled $18.0 million at December 31, 2008. Of such loans, $14.8 million had specific loss allowances aggregating $1.8 million at that date. Substantially all of those specific allowances were determined using Level 3 inputs.
Foreclosed Assets
Foreclosed assets are adjusted to fair value upon transfer of the loans to foreclosed assets. Subsequently, foreclosed assets are carried at the lower of carrying value or fair value. Fair value is based upon independent market prices, appraised values of the collateral or management’s estimation of the value of the collateral. When the fair value of the collateral is based on an observable market price or a current appraised value, the Company records the foreclosed asset as nonrecurring Level 2. When an appraised value is not available or management determines the fair value of the collateral is further impaired below the appraised value and there is no observable market price, the Company records the foreclosed asset as nonrecurring Level 3. At December 31, 2008 there were no fair value adjustments related to foreclosed real estate of $5.0 million.
Goodwill and Other Intangible Assets
Goodwill and identified intangible assets are subject to impairment testing. When appropriate, a projected cash flow valuation method is used in the completion of impairment testing. This valuation method requires a significant degree of management judgment. In the event the projected undiscounted net operating cash flows are less than the carrying value, the asset is recorded at fair value as
F-21
NOTES TO CONSOLIDATED FINANCIAL STATEMENTS
December 31, 2008, 2007 and 2006
determined by the valuation model. As such, the Company classifies goodwill and other intangible assets subjected to nonrecurring fair value adjustments as Level 3. At December 31, 2008 there were no fair value adjustments related to goodwill of $26.1 million and other intangible assets of $1.8 million.
SFAS No. 107,Disclosures About Fair Value of Financial Instruments, requires disclosure of fair value information about financial instruments, whether or not recognized in the balance sheet, for which it is practicable to estimate that value. In cases where quoted market prices are not available, fair values are based on estimates using present value or other valuation techniques.
Those techniques are significantly affected by the assumptions used, including the discount rate and estimates of future cash flows. In that regard, the derived fair value estimates cannot be substantiated by comparison to independent markets and, in many cases, could not be realized in immediate settlement of the instruments. SFAS 107 excludes certain financial instruments and all nonfinancial instruments from its disclosure requirements. Accordingly, the aggregate fair value amounts presented do not represent the underlying value of the Company. In addition to the valuation methods previously described for investments available for sale and derivative assets and liabilities, the following methods and assumptions were used by the Company in estimating its fair value disclosures for financial instruments:
Cash and Cash Equivalents
The carrying amounts reported in the balance sheets for cash and cash equivalents approximate the fair value of those assets.
Securities Available for Sale and Securities Held to Maturity
Fair values for securities are based on quoted market prices, where available. If quoted market prices are not available, fair values are based on quoted market prices of comparable instruments.
Federal Home Loan Bank Stock
The fair value for FHLB stock is its carrying value, since this is the amount for which it could be redeemed. There is no active market for this stock and the Company, in order to be a member of the FHLB, is required to maintain a minimum balance.
Loans Held for Sale
Fair values of mortgage loans held for sale are based on commitments on hand from investors or prevailing market prices.
Loans Receivable
The fair values for fixed rate loans are estimated using discounted cash flow analyses using interest rates currently being offered for loans with similar terms.
F-22
NOTES TO CONSOLIDATED FINANCIAL STATEMENTS
December 31, 2008, 2007 and 2006
Investment in Life Insurance
The carrying value of life insurance approximates fair value because this investment is carried at cash surrender value, as determined by the insurer.
Accrued Interest Receivable and Accrued Interest Payable
The carrying amount of accrued interest is assumed to approximate fair value.
Deposits
The fair values disclosed for deposits with no stated maturity (e.g., interest and non-interest checking, passbook savings, and certain types of money market accounts) are, by definition, equal to the amount payable on demand at the reporting date (i.e., their carrying amounts). Fair values for deposits with a stated maturity date (time deposits) are estimated using a discounted cash flow calculation that applies interest rates currently being offered on these accounts to a schedule of aggregated expected monthly maturities on time deposits.
Short-term Borrowings and Long-Term Debt
Rates currently available to the Company for borrowings and debt with similar terms and remaining maturities are used to estimate fair value of the existing debt.
Derivative financial instruments
Fair values for interest rate swap agreements are based values from third parties typically determined using widely accepted discounted cash flow models or Level 2 measurements.
Financial Instruments with Off-Balance Sheet Risk
The fair value of financial instruments with off-balance sheet risk discussed in Note O is not material.
F-23
NOTES TO CONSOLIDATED FINANCIAL STATEMENTS
December 31, 2008, 2007 and 2006
The following table reflects the estimated fair values and carrying values at December 31:
| | | | | | | | | | | | |
| | | 2008 | | 2007 |
| | | Carrying
value | | Estimated
fair value | | Carrying
value | | Estimated
fair value |
| | | (Amounts in thousands) |
Financial assets: | | | | | | | | | | | | |
Cash and cash equivalents | | $ | 36,770 | | $ | 36,770 | | $ | 21,054 | | $ | 21,054 |
Securities available for sale | | | 416,564 | | | 416,564 | | | 86,683 | | | 86,683 |
Securities held to maturity | | | 6,000 | | | 5,400 | | | — | | | — |
Federal Home Loan Bank stock | | | 13,444 | | | 13,444 | | | 7,233 | | | 7,233 |
Loans held for sale | | | 560 | | | 560 | | | 2,315 | | | 2,315 |
Loans receivable, net | | | 994,578 | | | 990,867 | | | 920,778 | | | 932,019 |
Accrued interest receivable | | | 7,392 | | | 7,392 | | | 5,074 | | | 5,074 |
Investment in life insurance | | | 26,629 | | | 26,629 | | | 24,001 | | | 24,001 |
| | | | |
Financial liabilities: | | | | | | | | | | | | |
Demand deposits and savings | | $ | 245,237 | | $ | 245,237 | | $ | 284,448 | | $ | 284,448 |
Time deposits | | | 900,776 | | | 913,234 | | | 570,682 | | | 571,960 |
Short-term borrowings | | | 194,143 | | | 194,143 | | | 80,928 | | | 80,928 |
Long-term debt | | | 105,713 | | | 106,208 | | | 101,713 | | | 101,010 |
Accrued interest payable | | | 1,767 | | | 1,767 | | | 2,203 | | | 2,203 |
| | | | |
On-balance sheet derivative financial instruments: | | | | | | | | | | | | |
Interest rate swap agreements: | | | | | | | | | | | | |
Asset (liability) | | $ | 4,531 | | $ | 4,531 | | $ | 1,931 | | $ | 1,931 |
NOTE C - SECURITIES
The amortized cost and estimated fair values of securities as of December 31 are as follows:
| | | | | | | | | | | | |
| 2008 | | Amortized
cost | | Gross
unrealized
gains | | Gross
unrealized
losses | | Estimated
fair value |
| | | (Amounts in thousands) |
Available for sale: | | | | | | | | | | | | |
U.S. Government agency obligations | | $ | 4,980 | | $ | 24 | | $ | — | | $ | 5,004 |
State and municipals | | | 123,623 | | | 1,612 | | | 4,802 | | | 120,433 |
Mortgage-backed | | | 286,792 | | | 4,297 | | | 128 | | | 290,961 |
Other | | | 166 | | | — | | | — | | | 166 |
| | | | | | | | | | | | |
| | $ | 415,561 | | $ | 5,933 | | $ | 4,930 | | $ | 416,564 |
| | | | | | | | | | | | |
| | | | |
Held to maturity: | | | | | | | | | | | | |
Corporate bonds | | $ | 6,000 | | $ | — | | $ | 600 | | $ | 5,400 |
| | | | | | | | | | | | |
F-24
NOTES TO CONSOLIDATED FINANCIAL STATEMENTS
December 31, 2008, 2007 and 2006
| | | | | | | | | | | | |
| 2007 | | Amortized
cost | | Gross
unrealized
gains | | Gross
unrealized
losses | | Estimated
fair value |
| | | (Amounts in thousands) |
Available for sale: | | | | | | | | | | | | |
U.S. Government agency obligations | | $ | 2,949 | | $ | 39 | | $ | — | | $ | 2,988 |
State and municipals | | | 66,359 | | | 993 | | | 398 | | | 66,954 |
Mortgage-backed | | | 16,157 | | | 418 | | | — | | | 16,575 |
Other | | | 166 | | | — | | | — | | | 166 |
| | | | | | | | | | | | |
| | $ | 85,631 | | $ | 1,450 | | $ | 398 | | $ | 86,683 |
| | | | | | | | | | | | |
The following tables show gross unrealized losses and fair values of investment securities, aggregated by investment category and length of time that the individual securities have been in a continuous unrealized loss position, at December 31, 2008 and 2007. At December 31, 2008, the unrealized losses relate to 97 state and municipal securities, 5 mortgage backed securities and 1 corporate bond. Of those, 3 of the mortgage backed securities had continuous unrealized losses for more than twelve months. At December 31, 2007, the unrealized losses relate to 34 state and municipal securities, none of which had continuous unrealized losses for more than twelve months. The unrealized losses relate to debt securities that have incurred fair value reductions due to higher market interest rates since the securities were purchased. The unrealized losses are not likely to reverse unless and until market interest rates decline to the levels that existed when the securities were purchased. Since none of the unrealized losses relate to the marketability of the securities or the issuer’s ability to honor redemption obligations and it is management’s intent and ability to hold these securities until maturity, none of the securities are deemed to be other than temporarily impaired. The temporarily impaired securities as of December 31, 2008 and 2007 are as follows:
| | | | | | | | | | | | | | | | | | |
| | | 2008 |
| | | Less Than 12 Months | | 12 Months or More | | Total |
| | | Fair
value | | Unrealized
losses | | Fair
value | | Unrealized
losses | | Fair
value | | Unrealized
losses |
| | | (Amounts in thousands) |
Securities available for sale: | | | | | | | | | | | | | | | | | | |
State and municipals | | $ | 72,205 | | $ | 4,279 | | $ | 1,503 | | $ | 523 | | $ | 73,708 | | $ | 4,802 |
Mortgage-backed | | | 22,100 | | | 128 | | | — | | | — | | | 22,100 | | | 128 |
| | | | | | | | | | | | | | | | | | |
| | $ | 94,305 | | $ | 4,407 | | $ | 1,503 | | $ | 523 | | $ | 95,808 | | $ | 4,930 |
| | | | | | | | | | | | | | | | | | |
| | | | | | |
Held to maturity: | | | | | | | | | | | | | | | | | | |
Corporate bonds | | $ | 5,400 | | $ | 600 | | $ | — | | $ | — | | $ | 5,400 | | $ | 600 |
| | | | | | | | | | | | | | | | | | |
| | | | | | | | | | | | | | | | | | |
| | | 2007 |
| | | Less Than 12 Months | | 12 Months or More | | Total |
| | | Fair
value | | Unrealized
losses | | Fair
value | | Unrealized
losses | | Fair
value | | Unrealized
losses |
| | | (Amounts in thousands) |
Securities available for sale: | | | | | | | | | | | | | | | | | | |
State and municipals | | $ | 29,172 | | $ | 398 | | $ | — | | $ | — | | $ | 29,172 | | $ | 398 |
| | | | | | | | | | | | | | | | | | |
F-25
NOTES TO CONSOLIDATED FINANCIAL STATEMENTS
December 31, 2008, 2007 and 2006
The amortized cost and estimated fair value of debt securities at December 31, 2008, by contractual maturity and projected cash flows, are shown below. Actual maturities may differ from contractual maturities because borrowers may have the right to call or prepay obligations with or without penalties.
| | | | | | |
| | | Available for Sale |
| | | Amortized
Cost | | Fair
Value |
| | | (Amounts in thousands) |
Available for sale: | | | | | | |
Due within one year | | $ | 23,127 | | $ | 23,388 |
After one year through five years | | | 94,991 | | | 95,622 |
After five years through ten years | | | 102,998 | | | 102,728 |
Over ten years | | | 194,445 | | | 194,826 |
| | | | | | |
| | $ | 415,561 | | $ | 416,564 |
| | | | | | |
Held to maturity: | | | | | | |
After five through ten years | | $ | 6,000 | | $ | 5,400 |
| | | | | | |
Proceeds from sales of securities available for sale totaled $7.8 million. Gross gains of $248,000 and gross losses of $25,000 were realized on those sales. There were no sales of securities available for sale during 2007 and 2006.
At December 31, 2008 and 2007, securities with an estimated fair value of approximately $269.7 million and $18.8 million, respectively, were pledged to secure public deposits and for other purposes required or permitted by law.
NOTE D - LOANS AND ALLOWANCE FOR LOAN LOSSES
Major classifications of loans at December 31 are summarized below:
| | | | | | |
| | | 2008 | | 2007 |
| | | (Amounts in thousands) |
Real estate mortgage loans | | $ | 573,902 | | $ | 504,354 |
Real estate construction loans | | | 307,272 | | | 286,002 |
Commercial and industrial loans | | | 98,595 | | | 109,869 |
Loans to individuals | | | 12,829 | | | 17,967 |
Leases | | | 15,190 | | | 14,370 |
| | | | | | |
| | | 1,007,788 | | | 932,562 |
Less allowance for loan losses | | | 13,210 | | | 11,784 |
| | | | | | |
| | $ | 994,578 | | $ | 920,778 |
| | | | | | |
The Company’s lending is concentrated primarily in Davidson, Randolph, Forsyth and Guilford Counties and the surrounding communities in which it operates. The Company has loan and deposit relationships with its directors and executive officers and with companies with which certain directors and executive officers are associated. The following is a summary of loans to executive officers, directors, and their affiliates for the year ended December 31, 2008 in thousands:
| | | | |
Balance at beginning of year | | $ | 22,414 | |
Additional borrowings during the year | | | 1,393 | |
Loan repayments during the year | | | (756 | ) |
| | | | |
Balance at end of year | | $ | 23,051 | |
| | | | |
F-26
NOTES TO CONSOLIDATED FINANCIAL STATEMENTS
December 31, 2008, 2007 and 2006
As a matter of policy, these loans and credit lines are approved by the Board of Directors and are made with interest rates, terms, and collateral requirements comparable to those required of other borrowers. In the opinion of management, these loans do not involve more than the normal risk of collectability.
At December 31, 2008, the Company had pre-approved but unused lines of credit totaling $6.8 million to executive officers, directors and their affiliates.
A summary of activity in the allowance for loan losses for the years ended December 31 is as follows:
| | | | | | | | | | | | |
| | | 2008 | | | 2007 | | | 2006 | |
| | | (Amounts in thousands) | |
Balance at beginning of year | | $ | 11,784 | | | $ | 10,400 | | | $ | 6,140 | |
Provision charged to operations | | | 7,075 | | | | 3,090 | | | | 2,655 | |
Loans charged off | | | (5,783 | ) | | | (1,755 | ) | | | (1,289 | ) |
Recoveries | | | 134 | | | | 49 | | | | 78 | |
Allowance recorded in merger of SterlingSouth | | | — | | | | — | | | | 2,816 | |
| | | | | | | | | | | | |
Balance at end of year | | $ | 13,210 | | | $ | 11,784 | | | $ | 10,400 | |
| | | | | | | | | | | | |
At December 31, 2008 and 2007, the recorded investment in loans considered impaired totaled $18.0 million. Of such loans, $14.8 million had valuation allowances aggregating $1.8 million. At December 31, 2007 the recorded investment in loans considered impaired totaled $3.6 million, with corresponding valuation allowances of $863,000. For the years ended December 31, 2008 and 2007, the average recorded investment in impaired loans was approximately $8.9 million and $2.1 million, respectively. There were $2.7 million of restructured loans at December 31, 2008 and no restructured loans at December 31, 2007. The amount of interest recognized on impaired and restructured loans during the portion of the year that they were impaired was not material.
NOTE E - PREMISES AND EQUIPMENT
Premises and equipment at December 31 are summarized as follows:
| | | | | | |
| | | 2008 | | 2007 |
| | | (Amounts in thousands) |
Land | | $ | 6,377 | | $ | 6,377 |
Buildings and improvements | | | 18,133 | | | 15,224 |
Furniture and equipment | | | 9,981 | | | 8,677 |
| | | | | | |
| | | 34,491 | | | 30,278 |
Less accumulated depreciation and amortization | | | 8,721 | | | 7,158 |
| | | | | | |
| | $ | 25,770 | | $ | 23,120 |
| | | | | | |
F-27
NOTES TO CONSOLIDATED FINANCIAL STATEMENTS
December 31, 2008, 2007 and 2006
Depreciation and amortization expense for the years ended December 31, 2008, 2007 and 2006 amounted to $1.5 million, $1.4 million and $1.1 million, respectively.
The Company has entered into various noncancellable operating leases for land and buildings used in its operations. The leases expire over the next 5 years, and most contain renewal options. Certain leases provide for periodic rate negotiation or escalation. The leases generally provide for payment of property taxes, insurance and maintenance costs by the Company. Rental expense, including month-to-month leases, reported in noninterest expense was $417,000, $408,000 and $165,000 for the years ended December 31, 2008, 2007 and 2006, respectively.
At December 31, 2008, future minimum rental commitments under noncancellable operating leases that have a remaining life in excess of one year are as follows (In thousands):
| | | |
2009 | | $ | 368 |
2010 | | | 230 |
2011 | | | 129 |
2012 | | | 86 |
2013 | | | 22 |
| | | |
Total | | $ | 835 |
| | | |
NOTE F - GOODWILL AND OTHER INTANGIBLES
The following is a summary of goodwill and other intangible assets at December 31, 2008 and 2007:
| | | | | | |
| | | 2008 | | 2007 |
| | | (Amounts in thousands) |
Goodwill, beginning of year | | $ | 26,129 | | $ | 26,129 |
Goodwill acquired during the year | | | — | | | — |
| | | | | | |
Goodwill, end of year | | $ | 26,129 | | $ | 26,129 |
| | | | | | |
Other intangibles – gross | | $ | 2,524 | | $ | 2,524 |
Less accumulated amortization | | | 708 | | | 460 |
| | | | | | |
Other intangibles – net | | $ | 1,816 | | $ | 2,064 |
| | | | | | |
Other intangibles amortization expense for the years ended December 31, 2008, 2007 and 2006 amounted to $248,000, $251,000 and $115,000, respectively. The following table presents estimated amortization expense for other intangibles.
| | | |
| | | Estimated
Amortization
Expense |
| | | (Amounts in
thousands) |
For the Year Ending December 31: | | | |
2009 | | $ | 246 |
2010 | | | 247 |
2011 | | | 237 |
2012 | | | 237 |
2013 | | | 237 |
Thereafter | | | 612 |
| | | |
| | $ | 1,816 |
| | | |
F-28
NOTES TO CONSOLIDATED FINANCIAL STATEMENTS
December 31, 2008, 2007 and 2006
NOTE G - DEPOSITS
At December 31, 2008, the scheduled maturities of time deposits are as follows (amounts in thousands):
| | | |
2009 | | $ | 720,098 |
2010 | | | 97,260 |
2011 | | | 47,561 |
2012 | | | 15,214 |
2013 | | | 14,669 |
Thereafter | | | 5,974 |
| | | |
Total | | $ | 900,776 |
| | | |
NOTE H - SHORT-TERM BORROWINGS
Short-term borrowings at December 31, 2008 and 2007 consisted of the following:
| | | | | | |
| | | 2008 | | 2007 |
| | | (In thousands) |
Repurchase agreements | | $ | 14,043 | | $ | 9,949 |
Advances from the FHLB | | | 179,600 | | | 52,700 |
Federal funds purchased | | | — | | | 10,779 |
Revolving line of credit | | | 500 | | | 7,500 |
| | | | | | |
| | $ | 194,143 | | $ | 80,928 |
| | | | | | |
The Company may purchase federal funds through secured and unsecured federal funds guidance lines of credit totaling $20 million and $30 million, respectively, as of December 31, 2008. These lines are intended for short-term borrowings and are subject to restrictions limiting the frequency and terms of advances. These lines of credit are payable on demand and bear interest based upon the daily federal funds rate.
Securities sold under agreements to repurchase generally mature within one day from the transaction date and are collateralized by U.S. Government Agency obligations.
In addition, the Company utilizes short-term borrowings from FHLB and bears interest based upon the daily federal funds rate. Such advances of $179.6 million at December 31, 2008 had a maturity of January 1, 2009 and bore interest at an annual rate of 0.46%. These borrowings are secured as discussed below for other FHLB advances.
The Company also has an unsecured revolving line of credit of up to $20.0 million with a bank, bearing interest at the prime rate (3.25% at December 31, 2009) and maturing on October 1, 2009.
F-29
NOTES TO CONSOLIDATED FINANCIAL STATEMENTS
December 31, 2008, 2007 and 2006
NOTE I - LONG-TERM DEBT
Long-term debt at December 31, 2008 and 2007 consisted of the following fixed rate advances from FHLB:
| | | | | | | | | |
Maturity | | Interest
rate | | | 2008 | | 2007 |
| | | | | | (Amounts in thousands) |
March 2010 | | 5.71 | % | | $ | 5,000 | | $ | 5,000 |
March 2010 | | 5.92 | % | | | 4,000 | | | 4,000 |
February 2011 | | 4.84 | % | | | 2,000 | | | 2,000 |
February 2011 | | 2.15 | % | | | 3,000 | | | 3,000 |
December 2011 | | 4.21 | % | | | 15,000 | | | 15,000 |
September 2017 | | 3.73 | % | | | 10,000 | | | 10,000 |
September 2017 | | 3.66 | % | | | 10,000 | | | 10,000 |
January 2018 | | 2.15 | % | | | 15,000 | | | — |
January 2018 | | 2.27 | % | | | 10,000 | | | — |
Advances repaid in 2008 | | | | | | — | | | 21,000 |
| | | | | | | | | |
| | | | | $ | 74,000 | | $ | 70,000 |
| | | | | | | | | |
The above advances have been made against a $393.9 million line of credit secured by real estate loans in the amount of $139.3 million and investment securities with a fair value of $254.8 million. Advances must be adequately collateralized. The weighted average rate for advances outstanding at December 31, 2008 and 2007 was 3.52% and 4.05%, respectively.
A description of the junior subordinated debentures outstanding at December 31, 2008 and 2007 is as follows:
| | | | | | | | | | | | | | | |
Issuing Entity | | Date of
Issuance | | Shares
Issued | | Interest Rate | | | Maturity
Date | | Principal Amount |
| | | | | | 2008 | | 2007 |
| | | | | | | | | | | | (In thousands) |
Bank of NC | | 6/07/2005 | | 8,000 | | Libor plus 1.80 | % | | 7/07/2015 | | $ | 8,000 | | $ | 8,000 |
BNC Bancorp Capital Trust I | | 4/03/2003 | | 5,000 | | Libor plus 3.25 | % | | 4/15/2033 | | | 5,155 | | | 5,155 |
BNC Bancorp Capital Trust II | | 3/11/2004 | | 6,000 | | Libor plus 2.80 | % | | 4/07/2034 | | | 6,186 | | | 6,186 |
BNC Bancorp Capital Trust III | | 9/23/2004 | | 5,000 | | Libor plus 2.40 | % | | 9/23/2034 | | | 5,155 | | | 5,155 |
BNC Bancorp Capital Trust IV | | 9/27/2006 | | 7,000 | | Libor plus 1.70 | % | | 12/31/2036 | | | 7,217 | | | 7,217 |
| | | | | | | | | | | | | | | |
| | | | | | | | | | | $ | 31,713 | | $ | 31,713 |
| | | | | | | | | | | | | | | |
F-30
NOTES TO CONSOLIDATED FINANCIAL STATEMENTS
December 31, 2008, 2007 and 2006
The junior subordinated debentures issued by the Bank of North Carolina are classified as Tier II capital for regulatory purposes. The junior subordinated debentures issued by the trusts currently qualify as Tier I capital for the Company, subject to certain limitations, and constitute a full and unconditional guarantee by the Company of the trust’s obligations under the preferred securities.
NOTE J - INCOME TAXES
Income tax expense is summarized as follows for the years ended December 31:
| | | | | | | | | | | |
| | | 2008 | | | 2007 | | 2006 | |
| | | (In thousands) | |
Current: | | | | | | | | | | | |
Federal | | $ | 680 | | | $ | 2,016 | | $ | 2,203 | |
State | | | 492 | | | | 849 | | | 625 | |
| | | | | | | | | | | |
Total current | | | 1,172 | | | | 2,865 | | | 2,828 | |
| | | | | | | | | | | |
| | | |
Deferred: | | | | | | | | | | | |
Federal | | | (630 | ) | | | 169 | | | (236 | ) |
State | | | (128 | ) | | | 24 | | | 24 | |
| | | | | | | | | | | |
Total current | | | (758 | ) | | | 193 | | | (212 | ) |
| | | | | | | | | | | |
| | | |
Total income tax expense | | $ | 414 | | | $ | 3,058 | | $ | 2,616 | |
| | | | | | | | | | | |
The difference between income tax expense and the amount computed by applying the statutory federal income tax rate of 34% was as follows for the years ended December 31:
| | | | | | | | | | | | |
| | | 2008 | | | 2007 | | | 2006 | |
| | | (In thousands) | |
Pre-tax income | | $ | 4,401 | | | $ | 10,496 | | | $ | 8,786 | |
| | | | | | | | | | | | |
| | | |
Tax at statutory federal rate | | $ | 1,496 | | | $ | 3,569 | | | $ | 2,987 | |
| | | |
State income tax, net of federal benefit | | | 240 | | | | 576 | | | | 427 | |
Tax exempt interest income | | | (1,024 | ) | | | (783 | ) | | | (648 | ) |
Income from life insurance | | | (374 | ) | | | (303 | ) | | | (186 | ) |
Nondeductible deferred compensation | | | 49 | | | | — | | | | — | |
Other | | | 25 | | | | (1 | ) | | | 36 | |
| | | | | | | | | | | | |
| | $ | 414 | | | $ | 3,058 | | | $ | 2,616 | |
| | | | | | | | | | | | |
F-31
NOTES TO CONSOLIDATED FINANCIAL STATEMENTS
December 31, 2008, 2007 and 2006
Significant components of deferred tax assets and liabilities at December 31 were as follows:
| | | | | | |
| | | 2008 | | 2007 |
| | | (In thousands) |
Deferred tax assets: | | | | | | |
Allowance for loan losses | | $ | 5,076 | | $ | 4,381 |
Net operating losses carryforwards | | | 337 | | | 454 |
Deferred compensation | | | 1,566 | | | 1,337 |
Loans | | | 151 | | | 272 |
Investments | | | 155 | | | 216 |
Other | | | 407 | | | 129 |
| | | | | | |
Total deferred tax assets | | | 7,692 | | | 6,789 |
| | | | | | |
| | |
Deferred tax liabilities: | | | | | | |
Premises and equipment | | | 482 | | | 274 |
Leasing activities | | | 1,148 | | | 1,129 |
Unrealized gains on securities available for sale | | | 387 | | | 384 |
Unrealized gains on interest rate swaps | | | 1,746 | | | 745 |
Core deposit intangibles | | | 700 | | | 796 |
Deposits | | | — | | | 7 |
Other | | | 74 | | | 52 |
| | | | | | |
Total deferred tax liabilities | | | 4,537 | | | 3,387 |
| | | | | | |
Net deferred tax asset included in other assets | | $ | 3,155 | | $ | 3,402 |
| | | | | | |
It is management’s opinion that realization of the net deferred tax asset is more likely than not based on the Company’s history of taxable income and estimates of future taxable income.
The Company has net operating loss carryforwards of approximately $1.3 million, which were acquired in the merger of Independence Bank. These loss carryforwards expire at various dates through 2022.
When tax returns are filed, it is highly certain that some positions taken would be sustained upon examination by the taxing authorities, while others are subject to uncertainty about the merits of the position taken or the amount of the position that would be ultimately sustained. The benefit of a tax position is recognized in the financial statements in the period during which, based on all available evidence, management believes it is more likely than not that the position will be sustained upon examination, including the resolution of appeals or litigation processes, if any. Tax positions taken are not offset or aggregated with other positions. Tax positions that meet the more-likely-than-not recognition threshold are measured as the largest amount of tax benefit that is more than 50 percent likely of being realized upon settlement with the applicable taxing authority. The portion of the benefits associated with tax positions taken that exceeds the amount measured as described above is reflected as a liability for unrecognized tax benefits in the accompanying consolidated balance sheet along with any associated interest and penalties that would be payable to the taxing authorities upon examination. The Company did not have an accrual for uncertain tax positions at December 31, 2008 or 2007.
F-32
NOTES TO CONSOLIDATED FINANCIAL STATEMENTS
December 31, 2008, 2007 and 2006
NOTE K - EMPLOYEE BENEFIT PLANS
The Company maintains a qualified profit sharing 401(k) plan for employees 20.5 years of age or over which covers substantially all employees. Under the plan, employees may contribute up to an annual maximum as determined by the Internal Revenue Code. The Company matches 100% of such contributions up to 6% of the participant’s compensation. The plan provides that employees’ contributions are 100% vested at all times, and the Company’s contributions vest at 20% each year after the second year of service. The expense related to the plan for the years ended December 31, 2008, 2007 and 2006 was $598,000, $590,000 and $436,000, respectively.
NOTE L - SHARE-BASED COMPENSATION
The Company maintains a nonqualified stock option plan for directors and a qualified incentive stock option plan for key employees. Options granted under the nonqualified plan vest immediately and expire ten years after the grant date. Options granted under the qualified plan vest ratably over a five year period and expire ten years after the grant date. At December 31, 2008, the number of shares available for grant under the nonqualified and qualified plans were -0- and 2,785, respectively.
During 2004 the Company adopted, with shareholder approval in 2004, the BNC Bancorp Omnibus Stock Ownership and Long Term Incentive Plan. The Compensation Committee may grant or award eligible participants options, rights to receive restricted shares of common stock, and or stock appreciation rights (collectively referred to herein as “Rights”). This plan makes available 206,250 grants of Rights, subject to appropriate adjustment for stock splits, stock combinations, reclassifications and similar changes. With the exception of shares issued in connection with business combinations, the exercise price of all options granted to date is the fair value of the Company’s common shares on the date of grant. During 2005, the Company awarded 89,375 options that had a vesting schedule until February 2009 tied to the Company stock attaining certain prices prior to that date. As of December 31, 2008, there were 71,500 options vested and the aggregate number of rights available for issuance under this plan amounted to 116,875.
The share-based awards granted under the aforementioned plans have similar characteristics, except that some awards have been granted in options and certain awards have been granted in restricted stock. Therefore, the following disclosures have been disaggregated for the stock option and restricted stock awards of the plans due to their dissimilar characteristics. The Company funds the option shares and restricted stock from unauthorized but un-issued shares.
Stock Option Plans
The fair value of each option award is estimated on the date of grant using the Black-Scholes option pricing model. The risk-free interest rate is based on the U.S. Treasury rate for the expected life at the time of grant. Volatility is based on the average volatility of the Company based upon previous trading history. The expected life and forfeiture assumptions are based on historical data. Dividend yield is based on the yield at the time of the option grant.
The Company has made no grants of options to employees during the years ended December 31, 2008, 2007 and 2006. During 2006 the Company issued 140,195 options with a weighted average exercise price of $8.46 in connection with its acquisition of SterlingSouth Bank & Trust Company. The fair value of the Company’s common stock on the date of issuance of those options was $16.52. The following table presents the assumptions for the Black-Scholes model used in determining the $10.00 fair value for each of the options issued in connection with that business combination:
Assumptions in estimating option values:
| | | |
Risk-free interest rate | | 4.99 | % |
Dividend yield | | 0.97 | % |
Volatility | | 42.39 | % |
Expected life | | 5 years | |
F-33
NOTES TO CONSOLIDATED FINANCIAL STATEMENTS
December 31, 2008, 2007 and 2006
A summary of option activity under the stock option plans as of December 31, 2008 and changes during the year ended December 31, 2008 is presented below.
| | | | | | | | | | |
| | | Shares | | Weighted
Average
Exercise
Price | | Weighted
Average
Remaining
Contractual
Term | | Aggregate
Intrinsic
Value |
| | | | | | | | | (In thousands) |
Outstanding December 31, 2007 | | 427,508 | | $ | 8.08 | | | | | |
Granted | | — | | | — | | | | | |
Vested | | — | | | — | | | | | |
Exercised | | 146,177 | | | 4.59 | | | | | |
Forfeited | | 3,579 | | | 4.52 | | | | | |
| | | | | | | | | | |
Outstanding December 31, 2008 | | 277,752 | | | 9.96 | | 5.8 years | | $ | 102 |
| | | | | | | | | | |
Exercisable December 31, 2008 | | 259,877 | | | 9.71 | | 5.8 years | | $ | 102 |
| | | | | | | | | | |
For the years ended December 31, 2008, 2007 and 2006 the intrinsic value of options exercised amounted to $1.2 million, $3.2 million and $675,000, respectively, and the fair value of options vested amounted to $0, $495,000 and $108,000, respectively.
Cash received from option exercises under all share-based payment arrangements for the years ended December 31, 2008, 2007 and 2006 was $435,000, $495,000 and $105,000, respectively. The actual tax benefit realized for tax deductions from option exercise of the share-based payment arrangements totaled $286,000, $588,000 and $83,000, respectively, for the years ended December 31, 2008, 2007 and 2006.
Stock Awards
A summary of the status of the Company’s non-vested stock awards for the years ended December 31, 2008 and 2007 is presented below:
| | | | | | | |
| | | 2008 | | 2007 | | Weighted
average
grant date
fair value |
Non-vested – beginning of year | | 3,300 | | 6,600 | | $ | 16.52 |
Granted | | — | | — | | | 16.52 |
Vested | | 2,200 | | 3,300 | | | 16.52 |
Forfeited | | — | | — | | | — |
| | | | | | | |
Non-vested – end of year | | 1,100 | | 3,300 | | $ | 16.52 |
| | | | | | | |
F-34
NOTES TO CONSOLIDATED FINANCIAL STATEMENTS
December 31, 2008, 2007 and 2006
The fair value of restricted stock grants vested during 2008 and 2007 was $21,000 and $55,000, respectively.
As of December 31, 2008, there was no unrecognized compensation cost related to nonvested share-based compensation arrangements granted under the plans.
NOTE M - EMPLOYMENT AGREEMENTS
The Company has entered into employment agreements with its chief executive officer and two other executive officers to ensure a stable and competent management base. The agreements provide for a three-year term, with an automatic one-year renewal on each anniversary date. The agreements provide for benefits as set forth in the contracts and cannot be terminated by the Board of Directors, except for cause, without prejudicing the officers’ rights to receive certain vested benefits, including compensation. In the event of a change in control of the Company, as outlined in the agreements, the acquirer will be bound to the terms of the contracts.
NOTE N - DIRECTOR AND EXECUTIVE OFFICER BENEFIT PLANS
The Company during 2004 entered into Salary Continuation Agreements with its chief executive officer and two other executive officers. These agreements replace the existing Supplemental Executive Retirement Plans for these executives. All of the Salary Continuation Agreements provide for lifetime benefits to be paid to each executive with the payment amounts varying upon different retirement scenarios, such as normal retirement, early termination, disability, or change in control. The Company has purchased life insurance policies on the participating officers in order to provide future funding of benefit payments. Provisions of $440,000 in 2008, $465,000 in 2007 and $535,000 in 2006 were expensed for future benefits to be provided under these plans. The corresponding liability related to this plan was $2.8 million and $2.4 million as of December 31, 2008 and 2007, respectively.
The Company also has a deferred compensation plan for its directors. Expense provided under the plan totaled $208,000, $141,000 and $186,000 for the years ended December 31, 2008, 2007 and 2006, respectively. Since 2003, directors have had the option to invest amounts deferred in Company common stock that is held in a rabbi trust established for that purpose. At December 31, 2008 and 2007, the trust held 98,265 and 77,848 shares of Company common stock, respectively.
NOTE O - REGULATORY RESTRICTIONS
The Bank, as a North Carolina banking corporation, may pay cash dividends to BNC only out of undivided profits as determined pursuant to North Carolina General Statutes Section 53-87. However, regulatory authorities may limit payment of dividends by any bank when it is determined that such a limitation is in the public interest and is necessary to ensure financial soundness of the bank.
The Company (on a consolidated basis) and the Bank are subject to various regulatory capital requirements administered by the federal banking agencies. Failure to meet minimum capital requirements can initiate certain mandatory - and possibly additional discretionary—actions by regulators that, if undertaken, could have a material effect on the Company’s consolidated financial statements. Capital adequacy guidelines and the regulatory framework for prompt corrective action prescribe specific capital guidelines that involve quantitative measures of the Bank’s assets, liabilities, and certain off-balance sheet items as calculated under regulatory accounting practices. The Bank’s capital amounts and classification are also subject to qualitative judgments by the regulators about components, risk weightings, and other factors. As of December 31, 2008, the most recent notification from the
F-35
NOTES TO CONSOLIDATED FINANCIAL STATEMENTS
December 31, 2008, 2007 and 2006
FDIC categorized the Bank as well capitalized under the regulatory framework for prompt corrective action. To be categorized as well capitalized the Bank must maintain minimum amounts and ratios, as set forth in the table below. There are no conditions or events since that notification that management believes have changed the Bank’s category. Prompt corrective action provisions are not applicable to bank holding companies.
Quantitative measures established by regulation to ensure capital adequacy require the Company and the Bank to maintain minimum amounts and ratios, as prescribed by regulations, of total and Tier I capital to risk-weighted assets and of Tier I capital to average assets. As of December 31, 2008 and 2007, the Bank met its capital adequacy requirements as set forth below:
| | | | | | | | | | | | | | | | | | |
| | | Actual | | | Minimum for capital
adequacy purposes | | | Minimum to be well
capitalized under prompt
corrective action provisions | |
| | | Amount | | Ratio | | | Amount | | Ratio | | | Amount | | Ratio | |
| | | | | | | | (Amounts in thousands) | | | | | | |
As of December 31, 2008: | | | | | | | | | | | | | | | | |
Total Capital (to Risk-Weighted Assets) | | $ | 130,814 | | 11.46 | % | | $ | 91,311 | | 8.00 | % | | $ | 114,139 | | 10.00 | % |
Tier I Capital (to Risk-Weighted Assets) | | | 109,604 | | 9.60 | % | | | 45,656 | | 4.00 | % | | | 68,483 | | 6.00 | % |
Tier I Capital (to Average Assets) | | | 109,604 | | 8.44 | % | | | 51,968 | | 4.00 | % | | | 64,960 | | 5.00 | % |
| | | | | | |
As of December 31, 2007: | | | | | | | | | | | | | | | | | | |
Total Capital (to Risk-Weighted Assets) | | $ | 99,722 | | 10.31 | % | | $ | 77,379 | | 8.00 | % | | $ | 96,724 | | 10.00 | % |
Tier I Capital (to Risk-Weighted Assets) | | | 79,938 | | 8.26 | % | | | 38,711 | | 4.00 | % | | | 58,066 | | 6.00 | % |
Tier I Capital (to Average Assets) | | | 79,938 | | 7.40 | % | | | 43,210 | | 4.00 | % | | | 54,012 | | 5.00 | % |
The Company is also subject to these capital requirements. At December 31, 2008 and 2007, the Company’s capital amounts are as follows:
| | | | | | |
| | | 2008 | | | 2007 | |
Total capital to risk-weighted assets | | 11.83 | % | | 10.44 | % |
Tier I capital to risk-weighted assets | | 9.99 | % | | 8.12 | % |
Tier I capital to average assets | | 8.77 | % | | 7.25 | % |
On February 27, 2009, the Board of Directors of the FDIC voted to amend the restoration plan for the Deposit Insurance Fund. The Board took action by imposing a special assessment on insured institutions of 20 basis points, implementing changes to the risk-based assessment system, and increased regular premium rates for 2009, which banks must pay on top of the special assessment. The 20 basis point special assessment on the industry will be as of June 30, 2009 and payable on September 30, 2009.
F-36
NOTES TO CONSOLIDATED FINANCIAL STATEMENTS
December 31, 2008, 2007 and 2006
On March 5, 2009, the FDIC Chairman announced that the FDIC intends to lower the special assessment from 20 basis points to 10 basis points. The approval of the cutback is contingent on whether Congress clears legislation that would expand the FDIC’s line of credit with the Treasury to $100 billion. Legislation to increase the FDIC’s borrowing authority on a permanent basis is also expected to advance to Congress, which should aid in reducing the burden on the industry.
As a result of the special assessment and increased regular assessments, the Company projects it will experience an increase in FDIC assessment expense by approximately $2.6 million from 2008 to 2009. The 10 basis point special assessment represents $1.3 million of this increase. The assessment rates, including the special assessment, are subject to change at the discretion of the Board of Directors of the FDIC.
NOTE P - DERIVATIVES
Derivative Financial Instruments
The Company utilizes stand-alone derivative financial instruments in the form of interest rate swap agreements, which derive their value from underlying interest rates. These transactions involve both credit and market risk. The notional amounts are amounts on which calculations, payments, and the value of the derivative are based. Notional amounts do not represent direct credit exposures. Direct credit exposure is limited to the net difference between the calculated amounts to be received and paid, if any. Such difference, which represents the fair value of the derivative instruments, is reflected on the Company’s consolidated balance sheets as derivative assets and derivative liabilities.
The Company is exposed to credit-related losses in the event of nonperformance by the counterparties to these agreements. The Company controls the credit risk of its financial contracts through credit approvals, limits and monitoring procedures, and does not expect any counterparties to fail their obligations. The Company deals only with primary dealers.
Derivative instruments are generally either negotiated over-the-counter (“OTC”) contracts or standardized contracts executed on a recognized exchange. Negotiated OTC derivative contracts are generally entered into between two counterparties that negotiate specific agreements terms, including the underlying instruments, amount, exercise prices and maturity.
Risk Management Policies - Hedging Instruments
The primary focus of the Company’s asset/liability management program is to monitor the sensitivity of the Company’s net portfolio value and net income under varying interest rate scenarios to take steps to control its risks. On a quarterly basis, the Company simulates the net portfolio value and net income expected to be earned over a twelve-month period following the date of simulation. The simulation is based on a projection of market interest rates at varying levels and estimates the impact of such market rates on the levels of interest-earning assets and interest-bearing liabilities during the measurement period. Based upon the outcome of the simulation analysis, the Company considers the use of derivatives as a means of reducing the volatility of net portfolio value and projected net income within certain ranges of projected changes in interest rates. The Company evaluates the effectiveness of entering into any derivative instrument agreement by measuring the cost of such an agreement in relation to the reduction in net portfolio value and net income volatility within an assumed range of interest rates.
Interest Rate Risk Management - Cash Flow Hedging Instruments
The Company originates variable rate loans for its loan portfolio. These loans expose the Company to variability in cash flows, primarily from interest receipts due to changes to interest rates. If interest rates increase, interest income increases. Conversely, if
F-37
NOTES TO CONSOLIDATED FINANCIAL STATEMENTS
December 31, 2008, 2007 and 2006
interest rates decrease, interest income decreases. Management believes it is prudent to limit the variability of a portion of its cash flows on variable rate loans therefore, generally hedges a portion of its variable-rate receipts. To meet this objective, management enters into interest rate swap agreements whereby the Company receives fixed rate payments and makes variable rate payments during the contract period.
At December 31, 2008 and 2007, the information pertaining to the outstanding interest rate swap agreements used to hedge variable rate loans is as follows (dollar amounts in thousands):
| | | | | | | | |
| | | 2008 | | | 2007 | |
Notional amount | | $ | 55,000 | | | $ | 55,000 | |
Weighted average pay rate | | | 3.61 | % | | | 7.25 | % |
Weighted average receive rate | | | 7.85 | % | | | 7.85 | % |
Weighted average maturity in years | | | 2.1 | | | | 3.2 | |
Unrealized gain (loss) relating to interest rate swaps | | $ | 4,531 | | | $ | 1,931 | |
This agreement requires the Company to make payments at a variable rate determined by a specified index (prime) in exchange for receiving payments at a fixed rate. The unrealized gains and losses are included in other assets or other liabilities, as appropriate, and in other comprehensive income, net of tax, in the accompanying consolidated balance sheet.
Risk management results for the year ended December 31, 2008 and 2007 related to the balance sheet hedging of variable rate loans indicate that the hedges were considered 100% effective and that there was no component of the derivative instruments’ gain or loss which was excluded from the assessment of hedge effectiveness.
NOTE Q - OFF-BALANCE SHEET RISK
The Company is a party to financial instruments with off-balance sheet risk in the normal course of business to meet the financing needs of its customers. These financial instruments include commitments to extend credit, unfunded lines of credit, and standby letters of credit. These instruments involve elements of credit risk in excess of amounts recognized in the accompanying consolidated financial statements.
The Company’s risk of loss in the event of nonperformance by the other party to the commitment to extend credit, line of credit and standby letter of credit is represented by the contractual amount of these instruments. The Company uses the same credit policies in making commitments under such instruments as it does for on-balance sheet instruments. The amount of collateral obtained, if any, is based on management’s evaluation of the borrower. Collateral held varies, but may include accounts receivable, inventory, real estate and time deposits with financial institutions. Since many of the commitments are expected to expire without being drawn upon, the total commitment amounts do not necessarily represent cash requirements.
F-38
NOTES TO CONSOLIDATED FINANCIAL STATEMENTS
December 31, 2008, 2007 and 2006
At December 31, 2008 and 2007, outstanding off-balance sheet financial instruments whose contract amounts represent potential credit risk were as follows:
| | | | | | |
| | | 2008 | | 2007 |
| | | (In thousands) |
Commitments under unfunded loans and lines of credit | | $ | 169,014 | | $ | 203,945 |
Standby letters of credit | | | 11,786 | | | 12,551 |
Commitments to sell loans held for sale | | | 560 | | | 2,315 |
NOTE R - PARTICIPATION IN U.S. TREASURY CAPITAL PURCHASE PROGRAM
On December 5, 2008, the Company issued 31,260 shares of preferred stock to the U.S. Treasury for $31.3 million pursuant to the U.S. Treasury’s Capital Purchase Program (“CPP”). Additionally, the Company issued 543,337 common stock warrants to the U.S. Treasury as a condition to its participation in the CPP. The warrants have an exercise price of $8.63 each, are immediately exercisable and expire 10 years from the date of issuance. Proceeds from this sale of the preferred stock are expected to be used for general corporate purposes, including supporting the continued, anticipated growth. The CPP preferred stock is non-voting, other than having class voting rights on certain matters, and pays cumulative dividends quarterly at a rate of 5% per annum for the first five years and 9% thereafter. The preferred shares are redeemable at the option of the Company under certain circumstances during the first three years and only thereafter without restriction. The preferred stock and common stock warrants qualify as Tier 1 capital.
Based on a Black Scholes option pricing model, the common stock warrants have been assigned a fair value of $3.41 per warrant, as of December 12, 2008 using the following assumptions; a risk free interest rate of 2.73% an expected life of 10 years, an expected dividend yield of 2.50% and expected volatility of 49.1%. The Company also estimated a fair value for the preferred stock by discounting future cash flows at 13% under the assumption that the shares will redeemed at the end of five years. The total proceeds of $31.3 million were allocated to the preferred stock and the warrants based upon those relative fair values, resulting in a value assigned to the warrants of $2.4 million and discount on the preferred stock of the same amount. The discount on the preferred stock obtained above and will be accreted as a reduction in net income available for common shareholders over the next five years at approximately $420,000 to $551,000 per year.
F-39
NOTES TO CONSOLIDATED FINANCIAL STATEMENTS
December 31, 2008, 2007 and 2006
NOTE S - PARENT COMPANY FINANCIAL DATA
Following are condensed financial statements of BNC Bancorp as of and for the years ended December 31, 2008 and 2007 (In thousands):
Condensed Statements of Financial Condition
December 31, 2008 and 2007
| | | | | | | |
| | | 2008 | | | 2007 |
Assets | | | | | | | |
Cash and due from banks | | $ | 4,089 | | | $ | 6,849 |
Due from bank subsidiary | | | — | | | | 131 |
Investment in bank subsidiary | | | 140,949 | | | | 109,985 |
Other assets | | | 986 | | | | 996 |
| | | | | | | |
Total assets | | $ | 146,024 | | | $ | 117,961 |
| | | | | | | |
| | |
Liabilities and Shareholders’ Equity | | | | | | | |
Liabilities: | | | | | | | |
Other liabilities | | $ | 886 | | | $ | 356 |
Due to bank subsidiary | | | 245 | | | | — |
Short-term borrowings | | | 500 | | | | 7,500 |
Subordinated debentures | | | 23,713 | | | | 23,713 |
| | | | | | | |
Total liabilities | | | 25,344 | | | | 31,569 |
| | | | | | | |
| | |
Shareholders’ equity: | | | | | | | |
Preferred stock | | | 31,260 | | | | — |
Discount on preferred stock | | | (2,382 | ) | | | — |
Common stock, no par value | | | 70,432 | | | | 70,042 |
Common stock warrants | | | 2,412 | | | | — |
Retained earnings | | | 15,558 | | | | 14,496 |
Accumulated other comprehensive income | | | 3,400 | | | | 1,854 |
| | | | | | | |
| | | 120,680 | | | | 86,392 |
| | | | | | | |
Total liabilities and shareholders’ equity | | $ | 146,024 | | | $ | 117,961 |
| | | | | | | |
Condensed Statements of Operations
Years ended December 31, 2008, 2007 and 2006
| | | | | | | | | | | | |
| | | 2008 | | | 2007 | | | 2006 | |
Dividends from bank subsidiary | | $ | 720 | | | $ | 3,087 | | | $ | 6,780 | |
Equity in undistributed earnings of bank subsidiary | | | 5,290 | | | | 6,517 | | | | 852 | |
Other income | | | 35 | | | | 56 | | | | 44 | |
Interest expense | | | (1,967 | ) | | | (2,168 | ) | | | (1,463 | ) |
Non-interest expense | | | (91 | ) | | | (54 | ) | | | (43 | ) |
| | | | | | | | | | | | |
Net income | | $ | 3,987 | | | $ | 7,438 | | | $ | 6,170 | |
| | | | | | | | | | | | |
F-40
NOTES TO CONSOLIDATED FINANCIAL STATEMENTS
December 31, 2008, 2007 and 2006
Condensed Statements of Cash Flows
Years ended December 31, 2008, 2007 and 2006
| | | | | | | | | | | | |
| | | 2008 | | | 2007 | | | 2006 | |
Operating activities: | | | | | | | | | | | | |
Net income | | $ | 3,987 | | | $ | 7,438 | | | $ | 6,170 | |
Adjustments to reconcile net income to net cash provided by operating activities: | | | | | | | | | | | | |
Equity in undistributed earnings of bank subsidiary | | | (5,290 | ) | | | (6,517 | ) | | | (852 | ) |
Amortization | | | 11 | | | | 12 | | | | 12 | |
Stock-based compensation | | | 55 | | | | 55 | | | | 114 | |
Increase in other assets | | | (1 | ) | | | — | | | | (2 | ) |
Increase in other liabilities | | | 50 | | | | 55 | | | | 43 | |
| | | | | | | | | | | | |
| | | |
Net cash (used) provided by operating activities | | | (1,188 | ) | | | 1,043 | | | | 5,485 | |
| | | | | | | | | | | | |
| | | |
Investing activities: | | | | | | | | | | | | |
Investment in bank subsidiary | | | (25,086 | ) | | | (7,089 | ) | | | (7,173 | ) |
Consideration used in business combination | | | — | | | | — | | | | (3,810 | ) |
| | | | | | | | | | | | |
| | | |
Net cash used by investing activities | | | (25,086 | ) | | | (7,089 | ) | | | (10,983 | ) |
| | | | | | | | | | | | |
| | | |
Financing activities: | | | | | | | | | | | | |
Due (from) to subsidiaries | | | 376 | | | | — | | | | (846 | ) |
Proceeds (repayments) on short-term borrowings | | | (7,000 | ) | | | 7,500 | | | | — | |
Proceeds from subordinated debentures | | | — | | | | — | | | | 7,217 | |
Proceeds from issuance of preferred stock | | | 31,260 | | | | — | | | | — | |
Proceeds from issuance of common stock | | | — | | | | 5,446 | | | | — | |
Proceeds from exercise of stock options | | | 435 | | | | 495 | | | | 105 | |
Tax benefit from exercise of stock options | | | 286 | | | | 588 | | | | 83 | |
Purchase and retirement of common stock | | | (386 | ) | | | — | | | | (225 | ) |
Cash dividends paid | | | (1,457 | ) | | | (1,262 | ) | | | (730 | ) |
| | | | | | | | | | | | |
| | | |
Net cash provided by financing activities | | | 23,514 | | | | 12,767 | | | | 5,604 | |
| | | | | | | | | | | | |
| | | |
Net (decrease) increase in cash and cash equivalents | | | (2,760 | ) | | | 6,721 | | | | 106 | |
| | | |
Cash and cash equivalents, beginning | | | 6,849 | | | | 128 | | | | 22 | |
| | | | | | | | | | | | |
| | | |
Cash and cash equivalents, ending | | $ | 4,089 | | | $ | 6,849 | | | $ | 128 | |
| | | | | | | | | | | | |
NOTE T - BUSINESS COMBINATION
On February 6, 2006, the Company and SterlingSouth Bank & Trust Company (SterlingSouth) jointly announced the execution of a definitive agreement in which BNC Bancorp would acquire SterlingSouth of Greensboro, North Carolina. The acquisition was approved at the annual shareholders’ meeting on June 15, 2006 and the transaction took place effective with the close of business on July 20, 2006. SterlingSouth shareholders exchanged each share of SterlingSouth stock for 1.21056 shares of BNC Bancorp common stock. As a result of the acquisition, the Company paid $3.2 million in cash for the outstanding options and warrants to purchase SterlingSouth common stock and has issued 1,686,370 additional shares of stock. The acquisition was accounted for using the purchase method of accounting, with the operating results of SterlingSouth subsequent to July 20, 2006 included in the Company’s consolidated financial statements. The following table reflects the unaudited pro forma combined results of operations for the year ended December 31, 2006, assuming the acquisition had occurred at the beginning of that year (in thousands).
| | | |
Net interest income | | $ | 30,039 |
Net income | | | 6,950 |
Net income per share: | | | |
Basic | | $ | 1.04 |
Diluted | | | 1.00 |
F-41
NOTES TO CONSOLIDATED FINANCIAL STATEMENTS
December 31, 2008, 2007 and 2006
The pro forma net income for the year ended December 31, 2006 does not reflect approximately $2.1 million and $219,000 in after tax merger related costs incurred by SterlingSouth and the Company, respectively. In management’s opinion, these unaudited results are not necessarily indicative of what actual combined results of operations might have been if the acquisition had been effective at the beginning of 2006.
A summary of the total purchase price of the transaction is as follows:
| | | |
| | | (In thousands) |
Fair value of common stock issued | | $ | 32,051 |
Fair value of common stock options issued | | | 1,402 |
Cash paid for shares and warrants | | | 3,172 |
Transaction costs paid in cash | | | 638 |
| | | |
Total purchase price | | $ | 37,263 |
| | | |
A summary of the fair value of the assets acquired and liabilities assumed is as follows:
| | | | |
| | | (In thousands) | |
Cash and cash equivalents | | $ | 2,584 | |
Investment securities available for sale | | | 18,799 | |
Loans receivable, net | | | 142,357 | |
Bank premises and equipment | | | 2,503 | |
Deferred tax asset | | | 1,363 | |
Goodwill | | | 22,706 | |
Core deposit intangible | | | 2,370 | |
Other assets | | | 7,506 | |
Deposits | | | (141,370 | ) |
Borrowings | | | (20,410 | ) |
Other liabilities | | | (1,145 | ) |
| | | | |
| |
Net assets acquired | | | 37,263 | |
Less: Equity adjustment | �� | | (33,453 | ) |
| | | | |
| |
Cash consideration paid | | $ | 3,810 | |
| | | | |
| |
Net cash paid in acquisition | | $ | 1,226 | |
| | | | |
NOTE U - SUBSEQUENT EVENT
In February 2009, the Company entered into an unsecured $250 million funding arrangement with a third party and hedged its interest rate risk with $250 million of derivative instruments. The effect of this transaction is to fix the Company’s cost of funds for this amount for up to five years.
F-42
| ITEM 9. | CHANGES IN AND DISAGREEMENTS WITH ACCOUNTANTS ON ACCOUNTING AND FINANCIAL DISCLOSURE |
None.
| ITEM 9A. | CONTROLS AND PROCEDURES |
The Company’s management, under the supervision and with the participation of the Chief Executive Officer and the Chief Financial Officer of the Company (its principal executive officer and principal financial officer, respectively) have concluded based on their evaluation as of the end of the period covered by this Report, that the Company’s disclosure controls and procedures are effective to ensure that information required to be disclosed by the Company in the reports filed or submitted by it under the Securities Exchange Act of 1934, as amended, is recorded, processed, summarized and reported within the time periods specified in the applicable rules and forms, and include controls and procedures designed to ensure that information required to be disclosed by the Company in such reports is accumulated and communicated to the Company’s management, including the Chief Executive Officer and the Chief Financial Officer of the Company, as appropriate to allow timely decisions regarding required disclosure.
Our management, including the Chief Executive Officer and the Chief Financial Officer, does not expect that our disclosure controls will prevent all errors and all fraud. A control system, no matter how well conceived and operated, can provide only reasonable, not absolute, assurance that the objectives of the control system are met. Moreover, the design of a control system must reflect the fact that there are resource constraints, and the benefits of controls must be considered relative to their costs. Because of the inherent limitations in all control systems, no evaluation of controls can provide absolute assurance that all control issues and instances of fraud, if any, within the Company have been detected. These inherent limitations include the realities that the judgments in decision making can be faulty, and that breakdowns can occur because of simple error or mistake. The design of any system of controls also is based in part upon certain assumptions about the likelihood of future events, and there can be no assurance that any design will succeed in achieving its stated goals under all potential future conditions.
Management’s Report on Internal Control Over Financial Reporting
The management of the Company is responsible for establishing and maintaining adequate internal control over financial reporting. The Company’s internal control system is designed to provide reasonable assurance to its management and board of directors regarding the preparation and fair presentation of published financial statements.
All internal control systems, no matter how well designed, have inherent limitations. Therefore, even those systems determined to be effective can provide only reasonable assurance with respect to financial statement preparation and presentation.
The Company’s management assessed the effectiveness of the Company’s internal control over financial reporting as of December 31, 2008. In making this assessment, management used the criteria set forth by the Committee of Sponsoring Organizations of the Treadway Commission (“COSO”) inInternal Control – Integrated Framework. Based on that assessment, we believe that, as of December 31, 2008, the Company maintained effective internal control over financial reporting based on those criteria.
| | |
| W. Swope Montgomery, Jr. | | David B. Spencer |
| President and Chief Executive Officer | | Chief Financial Officer |
| | |
The effectiveness of the Company’s internal controls over financial reporting as of December 31, 2008 has been audited by Cherry, Bekaert & Holland, L.L.P., an independent registered public accounting firm, as stated in their report on page F-2.
There have been no significant changes in internal control over financial reporting during the fourth quarter that have materially affected, or are reasonably likely to materially affect, the Company’s internal control over financial reporting.
| ITEM 9B. | OTHER INFORMATION |
None.
PART III
| ITEM 10. | DIRECTORS AND EXECUTIVE OFFICERS OF THE REGISTRANT |
Directors and Executive Officers.The information concerning the Company’s directors and executive officers required by this Item 10 is incorporated herein by reference from the Company’s definitive proxy statement for the 2009 Annual Meeting of Shareholders, a copy of which will be filed with the SEC not later than 120 days after the end of the Company’s fiscal year.
60
Section 16(a) Beneficial Ownership Reporting Compliance.The information concerning compliance with the reporting requirements of Section 16(a) of the Exchange Act by our directors, officers, and ten percent shareholders required by this Item 10 is incorporated by reference from the Company’s definitive proxy statement, a copy of which will be filed with the SEC not later than 120 days after the end of the Company’s fiscal year.
Code of Ethics. The Company has adopted a Code of Business Conduct and Ethics that is applicable to all of its directors, officers and employees, including its principal executive and senior financial officers, as required by Section 406 of the Sarbanes-Oxley Act of 2002 and applicable SEC rules. A copy of the Company’s Code of Business conduct and Ethics adopted by the Company’s Board of Directors may be found on the Bank’s website: www.bankofnc.com.
In the event that the Company makes any amendment to, or grants any waivers of, a provision of its Code of Business Conduct and Ethics that applies to the principal executive officer or senior financial officer that requires disclosure under applicable SEC rules, the Company intends to disclose such amendment or waiver by filing a Form 8-K with the SEC.
| ITEM 11. | EXECUTIVE COMPENSATION |
The information concerning compensation and other matters required by this Item 11 is incorporated herein by reference from the Company’s definitive proxy statement for the 2009 Annual Meeting of Shareholders, a copy of which will be filed with the SEC not later than 120 days after the end of the Company’s fiscal year.
| ITEM 12. | SECURITY OWNERSHIP OF CERTAIN BENEFICIAL OWNERS AND MANAGEMENT AND RELATED STOCKHOLDER MATTERS |
The information concerning security ownership of certain beneficial owners and management required by the Item 12 is incorporated herein by reference from the Company’s definitive proxy statement for the 2009 Annual Meeting of Shareholders, a copy of which will be filed with the SEC not later than 120 days after the end of the Company’s fiscal year.
Securities Authorized for Issuance Under Equity Compensation Plans
The following table presents as of December 31, 2008, the number of securities so be issued upon the exercise of outstanding options, the weighted average price of the outstanding options and the number of securities remaining for further issuance under the plans. The Bank of North Carolina Stock Option Plans for Non-Employees/Directors and Key Employees and the Omnibus Stock Ownership and Long Term Incentive Plan have been approved by the shareholders.
| | | | | | | |
| | | (a) | | (b) | | (c) |
Plan category | | Number of shares
to be issued upon
exercise of
outstanding options | | Weighted-average
exercise price of
outstanding options | | Number of shares remaining
available for future issuance under
equity compensation plans (excluding
shares reflected in column (a) |
Equity compensation plans
Approved by our stockholders | | 259,877 | | $ | 9.71 | | 119,660 |
| | | |
Equity compensation plans not
Approved by our stockholders | | — | | | — | | — |
| | | |
Total | | 259,877 | | $ | 9.71 | | 119,660 |
| (a) | Of the 277,752 stock options issued under the Plans, a total of 259,877 of those stock options have vested or are exercisable within 60 days. |
| ITEM 13. | CERTAIN RELATIONSHIPS AND RELATED TRANSACTIONS WITH MANAGEMENT |
The information concerning certain relationships and related transactions and director independence required by this Item 13 is incorporated herein by reference from the Company’s definitive proxy statement for the 2009 Annual Meeting of Shareholders, a copy of which will be filed with the SEC not later than 120 days after the end of the Company’s fiscal year.
61
| ITEM 14. | PRINCIPAL ACCOUNTANT FEES AND SERVICES |
The information concerning principal accounting fees and services required by this Item 14 is incorporated herein by reference from the Company’s definitive proxy statement for the 2009 Annual Meeting of Shareholders, a copy of which will be filed with the SEC not later than 120 days after the end of the Company’s fiscal year.
| ITEM 15. | EXHIBITS, FINANCIAL STATEMENT SCHEDULES |
(a)(1) Financial Statements. The following financial statements and supplementary data are included in Item 8 of this Form 10-K.
(a)(2) NA
(a)(3) See Exhibits 10(i)(a) through 10(vii)(d) below.
15(b) Exhibits
| | |
| Exhibit (3)(i) | | Articles of Incorporation, incorporated herein by reference to Exhibit (3)(i) to the Form 8-K—Rule 12g-3, filed with the SEC on December 17, 2002. |
| |
| Exhibit (3)(i)(a) | | Articles of Amendment dated December 2, 2008, regarding the Series A Preferred Stock incorporated herein by reference to Exhibit 3.1 to the Form 8-K filed with the SEC on December 5, 2008. |
| |
| Exhibit (3)(ii) | | Bylaws, incorporated herein by reference to Exhibit (3)(ii) to the Form 8-K—Rule 12g-3, filed with the SEC on December 17, 2002. |
| |
| Exhibit (4) | | Form of Stock Certificate, incorporated herein by reference to the Form 8-K—Rule 12g-3, filed with the SEC on December 17, 2002. |
| |
| Exhibit (4)(i) | | Form of Stock Certificate, regarding the Series A Preferred Stock incorporated herein by reference to Exhibit 4.1 to the Form 8-K filed with the SEC on December 5, 2008. |
| |
| Exhibit (4)(ii) | | Warrant dated December 5, 2008, for the purchase of shares of Common Stock incorporated herein by reference to Exhibit 4.2 to the Form 8-K filed with the SEC on December 5, 2008. |
| |
| Exhibit 10.1 | | Letter Agreement dated December 23, 2008 between the Registrant and the United States Treasury, incorporated herein by reference to Exhibit 10.1 to the Form 8-K filed with the SEC on December 5, 2008. |
| |
| Exhibit (10)(i)(a) | | Employment Agreement dated as of December 31, 2005 among the Company, the Bank and W. Swope Montgomery, Jr., incorporated herein by reference to Exhibit 10(i)(a) to the Form 8-K filed with the SEC on January 4, 2005. |
| |
| Exhibit (10)(i)(a)(1) | | Employment Letter Agreement dated December 5, 2008 by and among BNC Bancorp, Bank of North Carolina and W. Swope Montgomery, Jr. incorporated herein by reference to Exhibit 10.2 to the form 8-K filed with the SEC on December 5, 2008. |
| |
| Exhibit (10)(i)(b) | | Employment Agreement dated as of December 31, 2005 among the Company, the Bank and Richard D. Callicutt, II, incorporated herein by reference to Exhibit 10(i)(b) to the Form 8-K filed with the SEC on January 4, 2005. |
| |
| Exhibit (10)(i)(b)(2) | | Employment Letter Agreement dated December 5, 2008 by and among BNC Bancorp, Bank of North Carolina and Richard D. Callicutt, II incorporated herein by reference to Exhibit 10.5 to the form 8-K filed with the SEC on December 5, 2008. |
62
| | |
| Exhibit (10)(i)(c) | | Employment Agreement dated as of December 31, 2005 among the Company, the Bank and David B. Spencer, incorporated herein by reference to Exhibit 10(i)(c) to the Form 8-K filed with the SEC on January 4, 2005. |
| |
| Exhibit 10(i)(c)(3) | | Employment Letter Agreement dated December 5, 2008 by and among BNC Bancorp, Bank of North Carolina and David B. Spencer incorporated herein by reference to Exhibit 10.3 to the form 8-K filed with the SEC on December 5, 2008. |
| |
| Exhibit (10)(ii)(a) | | Salary Continuation Agreement dated as of December 31, 2005 between the Bank and W. Swope Montgomery, Jr., incorporated herein by reference to Exhibit 10(ii)(a) to the Form 8-K filed with the SEC on January 4, 2005. |
| |
| Exhibit (10)(ii)(b) | | Salary Continuation Agreement dated as of December 31, 2005 between the Bank and Richard D. Callicutt, II, incorporated herein by reference to Exhibit 10(ii)(b) to the Form 8-K filed with the SEC on January 4, 2005. |
| |
| Exhibit (10)(ii)(c) | | Salary Continuation Agreement dated as of December 31, 2005 between the Bank and David B. Spencer, incorporated herein by reference to Exhibit 10(ii)(c) to the Form 8-K filed with the SEC on January 4, 2005. |
| |
| Exhibit (10)(iii) | | Bank of North Carolina Stock Option Plan for Directors, incorporated by reference to Exhibit 10(iii) to the Form F-1, filed with the FDIC on June 1, 1992. |
| |
| Exhibit (10)(iv) | | Bank of North Carolina Stock Option Plan for Key Employees, incorporated by reference to Exhibit 10(iv) of the Form F-1, filed with the FDIC on June 1, 1992. |
| |
| Exhibit (10)(v) | | Directors Deferred Compensation Plan, incorporated by reference to Exhibit 10(v) of the Form F-2 filed with the FDIC. |
| |
| Exhibit (10)(vi)(a) | | Endorsement Split Dollar Agreement dated December 31, 2005 between the Bank and W. Swope Montgomery, Jr., incorporated herein by reference to Exhibit (10)(vi)(a) to the Form 8-K filed with the SEC on January 4, 2005. |
| |
| Exhibit (10)(vi)(b) | | Endorsement Split Dollar Agreement dated December 31, 2005 between the Bank and Richard D. Callicutt II, incorporated herein by reference to Exhibit (10)(vi)(b) to the Form 8-K filed with the SEC on January 4, 2005. |
| |
| Exhibit (10)(vi)(c) | | Endorsement Split Dollar Agreement dated December 31, 2005 between the Bank and David B. Spencer, incorporated herein by reference to Exhibit (10)(vi)(c) to the Form 8-K filed with the SEC on January 4, 2005. |
| |
| Exhibit (10)(vii) | | BNC Bancorp Omnibus Stock Ownership and Long Term Incentive Plan incorporated herein by reference to Exhibit (10)(vii) of Form 10-K filed with the SEC on March 31, 2005. |
| |
| Exhibit (10)(viii) | | Employment Letter Agreement dated December 5, 2008 by and among BNC Bancorp, Bank of North Carolina and Thomas N. Nelson, incorporated herein by reference to Exhibit 10.6 to the form 8-K filed with the SEC on December 5, 2008. |
| |
| Exhibit 10(ix) | | Employment Letter Agreement dated December 5, 2008 by and among BNC Bancorp, Bank of North Carolina and William Harvey McMurray III, incorporated herein by reference to Exhibit 10.7 to the form 8-K filed with the SEC on December 5, 2008. |
| |
| Exhibit 10(x) | | Separation and Non-Competition Agreement dated June 16, 2008 by and among BNC Bancorp, Bank of North Carolina and Ralph N. Strayhorn III. |
63
| | |
| Exhibit (11) | | Statement regarding computation of per share earnings (included herein on Page F-15) |
| |
| Exhibit (12) | | Statement regarding computation of ratios |
| |
| Exhibit (21) | | Subsidiaries of the Registrant: incorporated by reference to ITEM 1. Business “Subsidiaries” |
| |
| Exhibit (23i) | | Consent of Cherry Bekaert & Holland LLP |
| |
| Exhibit (31)(i) | | Rule 13a-14(a)\15d-14(a) Certifications |
| |
| Exhibit 31(ii) | | Rule 13a-14(a)\15d-14(a) Certifications |
| |
| Exhibit (32) | | Section 1350 Certification |
64
SIGNATURES
Pursuant to the requirements of Section 13 of the Securities Exchange Act of 1934, the registrant has duly caused this report to be signed on its behalf by the undersigned, thereunto duly authorized.
| | | | | | |
| | | | | BNC BANCORP |
| | | |
| | | | By: | | /s/ W. Swope Montgomery, Jr. |
| | | | | | W. Swope Montgomery, Jr. |
| Date: March 16, 2009 | | | | | | President and Chief Executive Officer |
Pursuant to the requirements of the Securities Exchange Act of 1934, this report has been signed below by the following persons on behalf of the Bank and in the capacities and on the dates indicated:
| | | | | | | | |
Signature | | | | Title | | | | Date |
| | | | |
/s/ W. Swope Montgomery, Jr. | | | | President, Chief Executive Officer | | | | March 16, 2009 |
| W. Swope Montgomery, Jr. | | | | and Director | | | | |
| | | | |
/s/ David B. Spencer | | | | Executive Vice President, and | | | | March 16, 2009 |
| David B. Spencer | | | | Chief Financial Officer | | | | |
| | | | |
/s/ Richard D. Callicutt, II | | | | Executive Vice President, | | | | March 16, 2009 |
| Richard D. Callicutt, II | | | | Chief Operating Officer, and Director | | | | |
| | | | |
/s/ Lenin J. Peters, M.D. | | | | Director | | | | March 16, 2009 |
| Lenin J. Peters, M.D. | | | | | | | | |
| | | | |
/s/ Thomas R. Smith, CPA | | | | Director | | | | March 16, 2009 |
| Thomas R. Smith, CPA | | | | | | | | |
| | | | |
/s/ Colon E. Starrett | | | | Director | | | | March 16, 2009 |
| Colon E. Starrett | | | | | | | | |
| | | | |
/s/ W. Groome Fulton, Jr. | | | | Director | | | | March 16, 2009 |
| W. Groome Fulton, Jr. | | | | | | | | |
| | | | |
/s/ Larry L. Callahan | | | | Director | | | | March 16, 2009 |
| Larry L. Callahan | | | | | | | | |
| | | | |
/s/ Joseph M. Coltrane, Jr. | | | | Director | | | | March 16, 2009 |
| Joseph M. Coltrane, Jr. | | | | | | | | |
| | | | |
/s/ Charles T. Hagan, III | | | | Director | | | | March 16, 2009 |
| Charles T. Hagan, III | | | | | | | | |
| | | | |
/s/ Randall R. Kaplan | | | | Director | | | | March 16, 2009 |
| Randall R. Kaplan | | | | | | | | |
| | | | |
/s/ Thomas R. Sloan | | | | Director | | | | March 16, 2009 |
| Thomas R. Sloan | | | | | | | | |
| | | | |
/s/ Robert A. Team | | | | Director | | | | March 16, 2009 |
| Robert A. Team | | | | | | | | |
| | | | |
/s/ D. Vann Williford | | | | Director | | | | March 16, 2009 |
| D. Vann Williford | | | | | | | | |
| | | | |
/s/ Richard F. Wood | | | | Director | | | | March 16, 2009 |
| Richard F. Wood | | | | | | | | |
65