ACQUISITION OF

Transaction Overview
• Ten branches and $360mm+ deposits in the dynamic Charleston/Mt. Pleasant market • Pro forma BNCN local franchise will be #2 community bank in the MSA • Consistent earnings with opportunity for market share expansion due to dislocation caused by recent market consolidation • Talented lending team has increased loans by more than 10% in 2015 • Significant cost saving opportunities – leverages previous Harbor transaction • Immediately accretive to tangible book value • Immediately accretive to 2016 EPS 3 Transaction Benefits
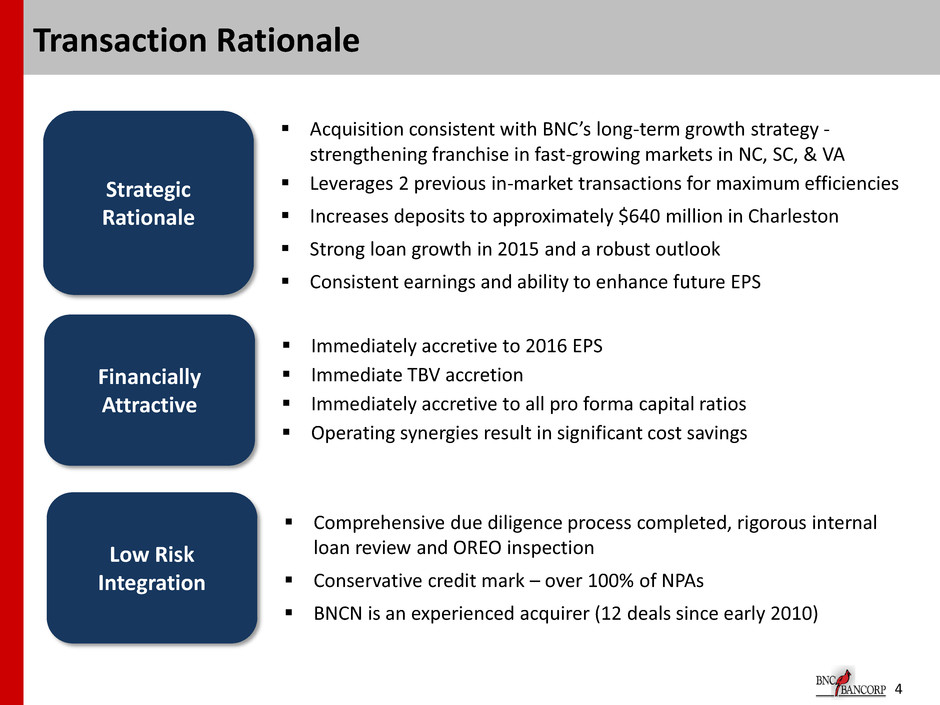
4 Transaction Rationale Acquisition consistent with BNC’s long-term growth strategy - strengthening franchise in fast-growing markets in NC, SC, & VA Leverages 2 previous in-market transactions for maximum efficiencies Increases deposits to approximately $640 million in Charleston Strong loan growth in 2015 and a robust outlook Consistent earnings and ability to enhance future EPS Strategic Rationale Financially Attractive Comprehensive due diligence process completed, rigorous internal loan review and OREO inspection Conservative credit mark – over 100% of NPAs BNCN is an experienced acquirer (12 deals since early 2010) Low Risk Integration Immediately accretive to 2016 EPS Immediate TBV accretion Immediately accretive to all pro forma capital ratios Operating synergies result in significant cost savings
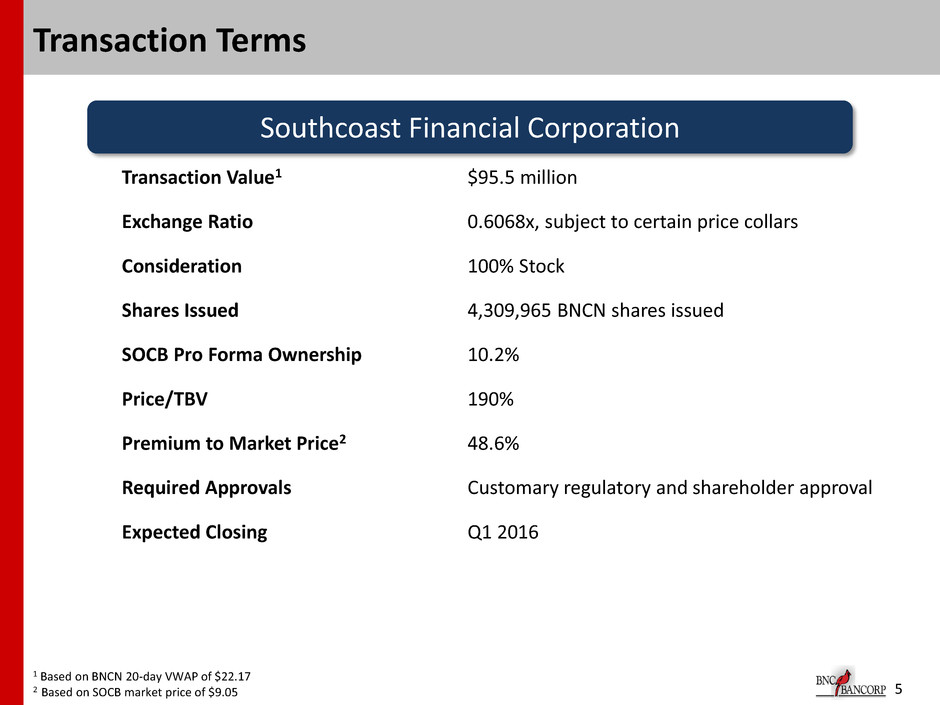
5 Transaction Terms 1 Based on BNCN 20-day VWAP of $22.17 2 Based on SOCB market price of $9.05 Southcoast Financial Corporation Transaction Value1 $95.5 million Exchange Ratio 0.6068x, subject to certain price collars Consideration 100% Stock Shares Issued 4,309,965 BNCN shares issued SOCB Pro Forma Ownership 10.2% Price/TBV 190% Premium to Market Price2 48.6% Required Approvals Customary regulatory and shareholder approval Expected Closing Q1 2016
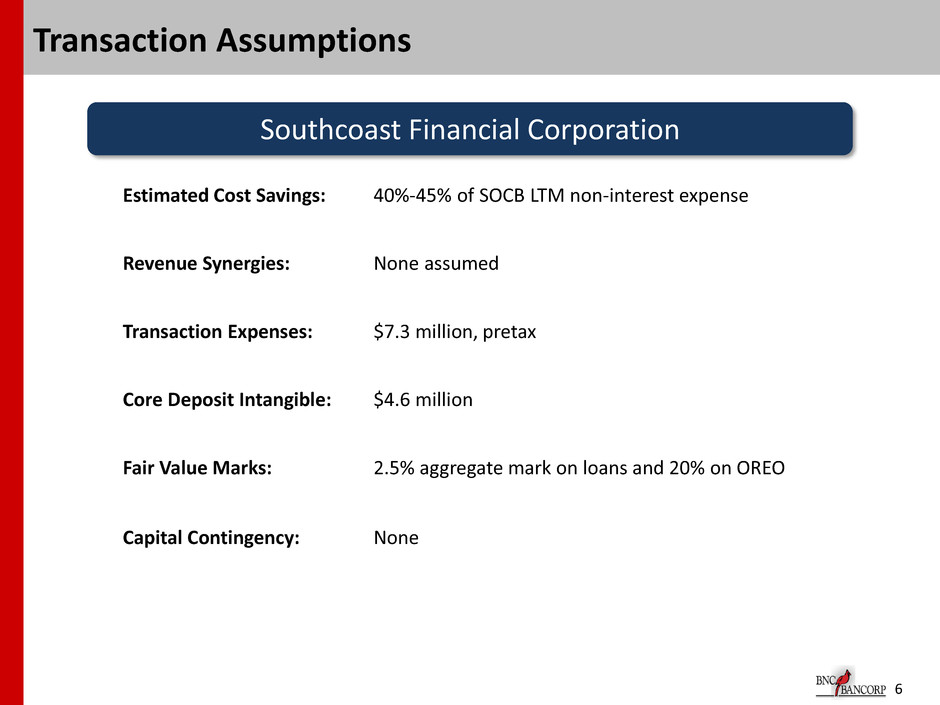
6 Transaction Assumptions Southcoast Financial Corporation Estimated Cost Savings: 40%-45% of SOCB LTM non-interest expense Revenue Synergies: None assumed Transaction Expenses: $7.3 million, pretax Core Deposit Intangible: $4.6 million Fair Value Marks: 2.5% aggregate mark on loans and 20% on OREO Capital Contingency: None
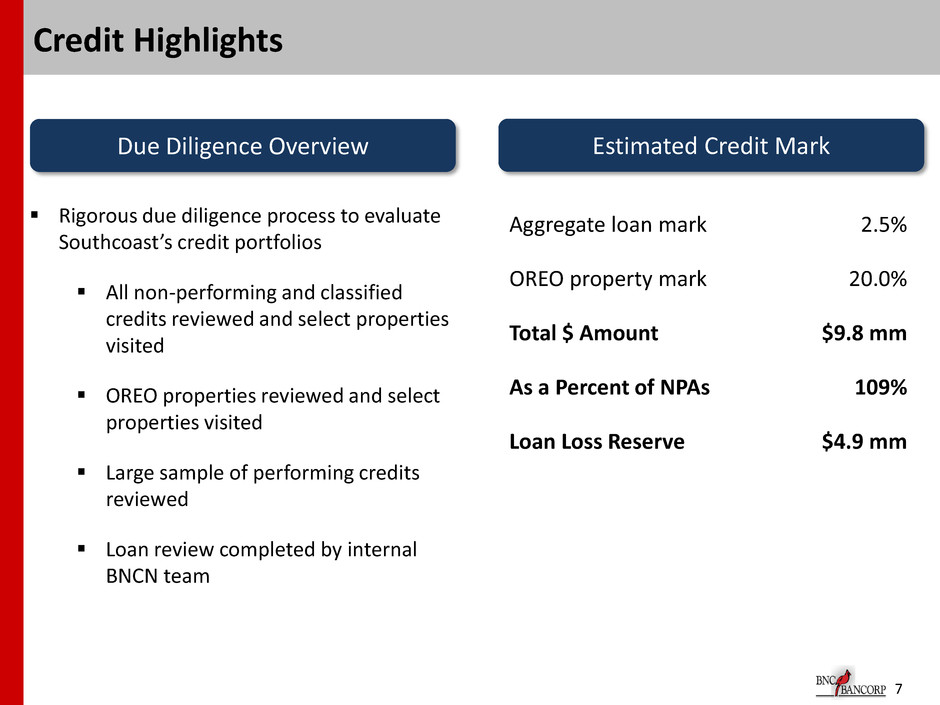
7 Credit Highlights Due Diligence Overview Estimated Credit Mark Rigorous due diligence process to evaluate Southcoast’s credit portfolios All non-performing and classified credits reviewed and select properties visited OREO properties reviewed and select properties visited Large sample of performing credits reviewed Loan review completed by internal BNCN team Aggregate loan mark 2.5% OREO property mark 20.0% Total $ Amount $9.8 mm As a Percent of NPAs 109% Loan Loss Reserve $4.9 mm
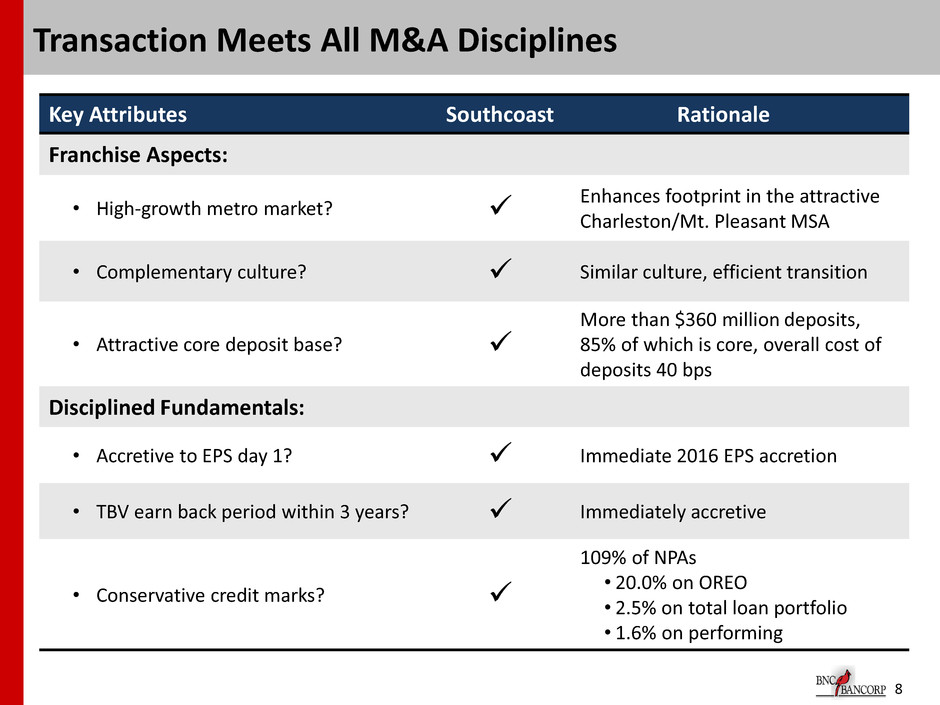
8 Transaction Meets All M&A Disciplines Key Attributes Southcoast Rationale Franchise Aspects: • High-growth metro market? Enhances footprint in the attractive Charleston/Mt. Pleasant MSA • Complementary culture? Similar culture, efficient transition • Attractive core deposit base? More than $360 million deposits, 85% of which is core, overall cost of deposits 40 bps Disciplined Fundamentals: • Accretive to EPS day 1? Immediate 2016 EPS accretion • TBV earn back period within 3 years? Immediately accretive • Conservative credit marks? 109% of NPAs • 20.0% on OREO • 2.5% on total loan portfolio • 1.6% on performing

Adding Value Through Acquisitions
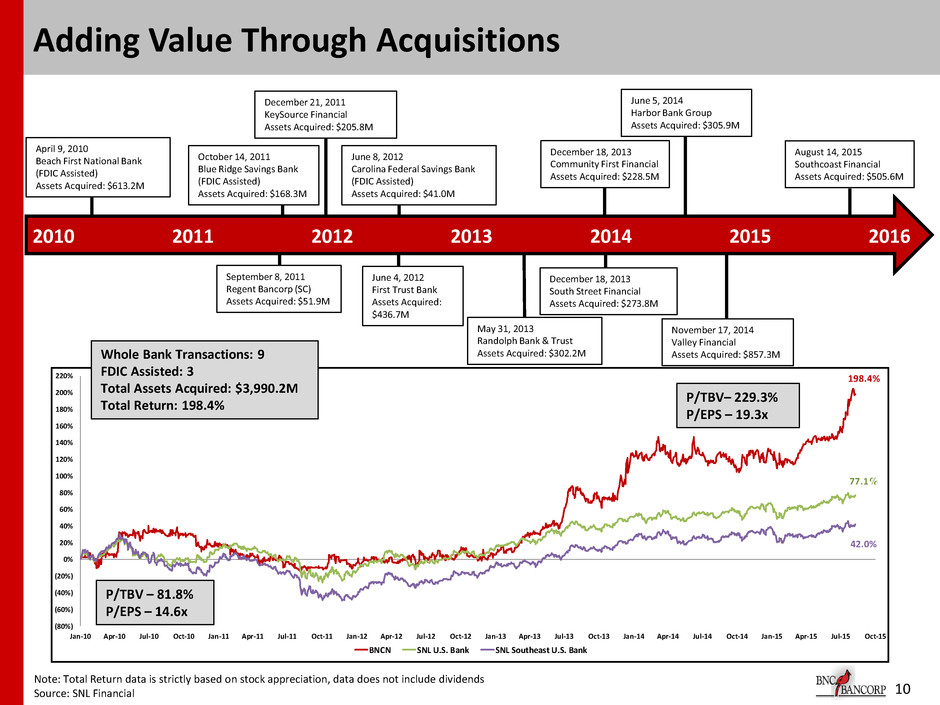
(80%) (60%) (40%) (20%) 0% 20% 40% 60% 80% 100% 120% 140% 160% 180% 200% 220% Jan-10 Apr-10 Jul-10 Oct-10 Jan-11 Apr-11 Jul-11 Oct-11 Jan-12 Apr-12 Jul-12 Oct-12 Jan-13 Apr-13 Jul-13 Oct-13 Jan-14 Apr-14 Jul-14 Oct-14 Jan-15 Apr-15 Jul-15 Oct-15 BNCN SNL U.S. Bank SNL Southeast U.S. Bank 198.4% 77.1% 42.0% 10 Adding Value Through Acquisitions Whole Bank Transactions: 9 FDIC Assisted: 3 Total Assets Acquired: $3,990.2M Total Return: 198.4% 2010 April 9, 2010 Beach First National Bank (FDIC Assisted) Assets Acquired: $613.2M September 8, 2011 Regent Bancorp (SC) Assets Acquired: $51.9M 2011 2012 2014 2015 2013 October 14, 2011 Blue Ridge Savings Bank (FDIC Assisted) Assets Acquired: $168.3M December 21, 2011 KeySource Financial Assets Acquired: $205.8M June 4, 2012 First Trust Bank Assets Acquired: $436.7M June 8, 2012 Carolina Federal Savings Bank (FDIC Assisted) Assets Acquired: $41.0M December 18, 2013 Community First Financial Assets Acquired: $228.5M May 31, 2013 Randolph Bank & Trust Assets Acquired: $302.2M December 18, 2013 South Street Financial Assets Acquired: $273.8M June 5, 2014 Harbor Bank Group Assets Acquired: $305.9M November 17, 2014 Valley Financial Assets Acquired: $857.3M P/TBV– 229.3% P/EPS – 19.3x 2016 August 14, 2015 Southcoast Financial Assets Acquired: $505.6M P/TBV – 81.8% P/EPS – 14.6x Note: Total Return data is strictly based on stock appreciation, data does not include dividends Source: SNL Financial

11 Acquisition Experience 14 Acquisitions Since 2010 8 Whole Bank completed; 3 FDIC-assisted; 1 Branch Transaction; 2 Pending Acquisition Target Announce Date Rationale SouthCoast Community Bank 8/14/2015 Strong Core Deposits, Further expansion in Charleston MSA CertusBank 6/1/2015 Improved market share in Upstate SC Valley Bank 11/17/2014 Strong Core Deposit Base, Virginia Expansion Harbor National Bank 6/5/2014 100% Core Deposits – Charleston, SC Expansion Harrington Bank 12/18/2013 100% Core Deposits - 33% Non Interest DDA - Raleigh CSA Home Savings Bank of Albemarle 12/18/2013 100% Core Deposits – Charlotte CSA Expansion Randolph Bank & Trust 5/31/2013 100% Core Deposits - Loans Primarily Retail Carolina Federal Savings Bank (FDIC) 6/8/2012 100% Core Deposits – Charleston, SC Market Entry First Trust Bank 6/4/2012 Strong Core Deposit Base – Charlotte Metro Expansion Bank of Hampton Roads (2 branches) 4/30/2012 100% Core Deposits – Raleigh CSA Expansion KeySource Commercial Bank 12/21/2011 Diversify Lending – Raleigh CSA Entry Blue Ridge Savings Bank (FDIC) 10/14/2011 100% Core Deposits - Loans Primarily Retail Regent Bank 9/8/2011 100% Core Deposits – Greenville, SC Market Entry Beach First National Bank (FDIC) 4/9/2010 Strong Core Deposits - Reduce Wholesale Reliance BNC has become the “Acquiror of Choice” in the Carolinas

Overview of Southcoast Financial
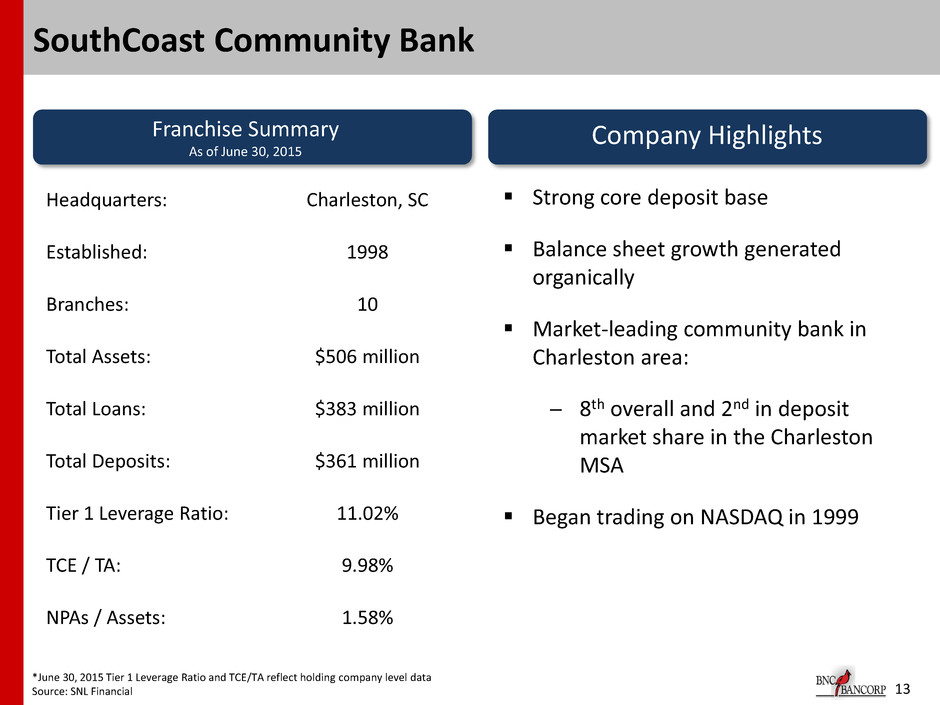
13 SouthCoast Community Bank *June 30, 2015 Tier 1 Leverage Ratio and TCE/TA reflect holding company level data Source: SNL Financial Franchise Summary As of June 30, 2015 Headquarters: Charleston, SC Established: 1998 Branches: 10 Total Assets: $506 million Total Loans: $383 million Total Deposits: $361 million Tier 1 Leverage Ratio: 11.02% TCE / TA: 9.98% NPAs / Assets: 1.58% Company Highlights Strong core deposit base Balance sheet growth generated organically Market-leading community bank in Charleston area: ─ 8th overall and 2nd in deposit market share in the Charleston MSA Began trading on NASDAQ in 1999
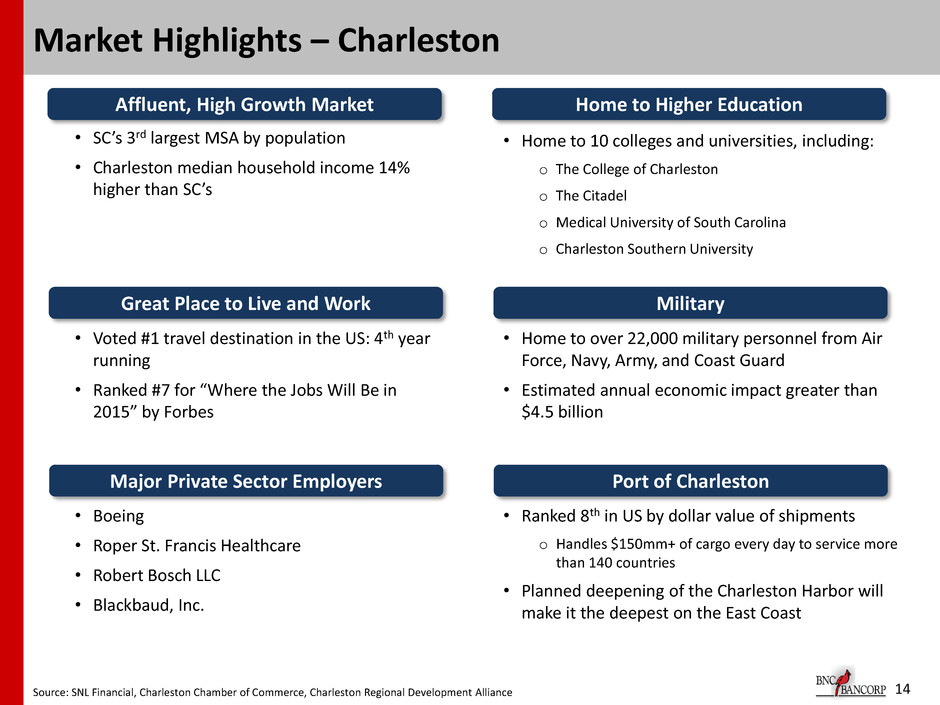
• SC’s 3rd largest MSA by population • Charleston median household income 14% higher than SC’s Home to higher education • Home to 10 colleges and universities, including: o The College of Charleston o The Citadel o Medical University of South Carolina o Charleston Southern University • Voted #1 travel destination in the US: 4th year running • Ranked #7 for “Where the Jobs Will Be in 2015” by Forbes • Home to over 22,000 military personnel from Air Force, Navy, Army, and Coast Guard • Estimated annual economic impact greater than $4.5 billion • Boeing • Roper St. Francis Healthcare • Robert Bosch LLC • Blackbaud, Inc. • Ranked 8th in US by dollar value of shipments o Handles $150mm+ of cargo every day to service more than 140 countries • Planned deepening of the Charleston Harbor will make it the deepest on the East Coast Great Place to Live and Work Military Major Private Sector Employers Port of Charleston 14 Market Highlights – Charleston Source: SNL Financial, Charleston Chamber of Commerce, Charleston Regional Development Alliance Affluent, High Growth Market Home to Higher Education
Pro Forma Balance Sheet
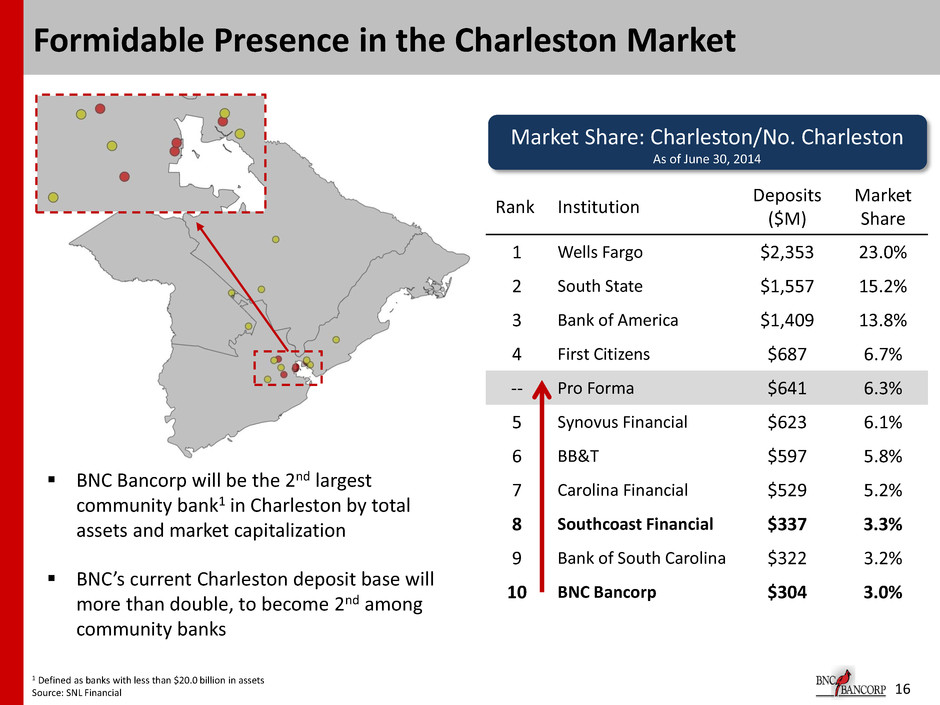
BNC Bancorp will be the 2nd largest community bank1 in Charleston by total assets and market capitalization BNC’s current Charleston deposit base will more than double, to become 2nd among community banks 16 Formidable Presence in the Charleston Market 1 Defined as banks with less than $20.0 billion in assets Source: SNL Financial Rank Institution Deposits ($M) Market Share 1 Wells Fargo $2,353 23.0% 2 South State $1,557 15.2% 3 Bank of America $1,409 13.8% 4 First Citizens $687 6.7% -- Pro Forma $641 6.3% 5 Synovus Financial $623 6.1% 6 BB&T $597 5.8% 7 Carolina Financial $529 5.2% 8 Southcoast Financial $337 3.3% 9 Bank of South Carolina $322 3.2% 10 BNC Bancorp $304 3.0% Market Share: Charleston/No. Charleston As of June 30, 2014

Pro Forma Franchise 17 Branches Loans ($000) Deposits ($000) Western Carolinas - Upstate 11 391,000 414,000 Charlotte 10 1,080,000 831,000 Coastal South Carolina 21 883,000 891,000 Raleigh – Durham – Chapel Hill 8 577,000 435,000 Piedmont Triad – Greensboro 16 913,000 1,573,000 Virginia – Roanoke 9 600,000 680,000

18 Pro Forma Balance Sheet SOCB BNC1 Pro Forma Combined2 Loans $4,127 Cash & Securities $894 Total Assets $5,466 Deposits $4,470 Total Equity $507 $84 $383 $506 $361 Cash & Securities $971 Loans $4,510 Total Assets $6,014 Deposits $4,831 Total Equity $597 $50 Increases balance sheet to $6.0 billion assets Cash & Securities will make up approximately 16% of total assets, giving BNC the opportunity to reallocate these assets into higher yielding loans for greater earnings Deposits increase to $4.8 million, with established deposit bases in North Carolina, South Carolina, and Virginia SOCB shareholders will own approximately 10% of the pro forma institution $ in millions $ in millions 1 BNC data includes acquisitions of Valley Bank and Certus Bank branches, but does not include purchase accounting marks Source: SNL Financial
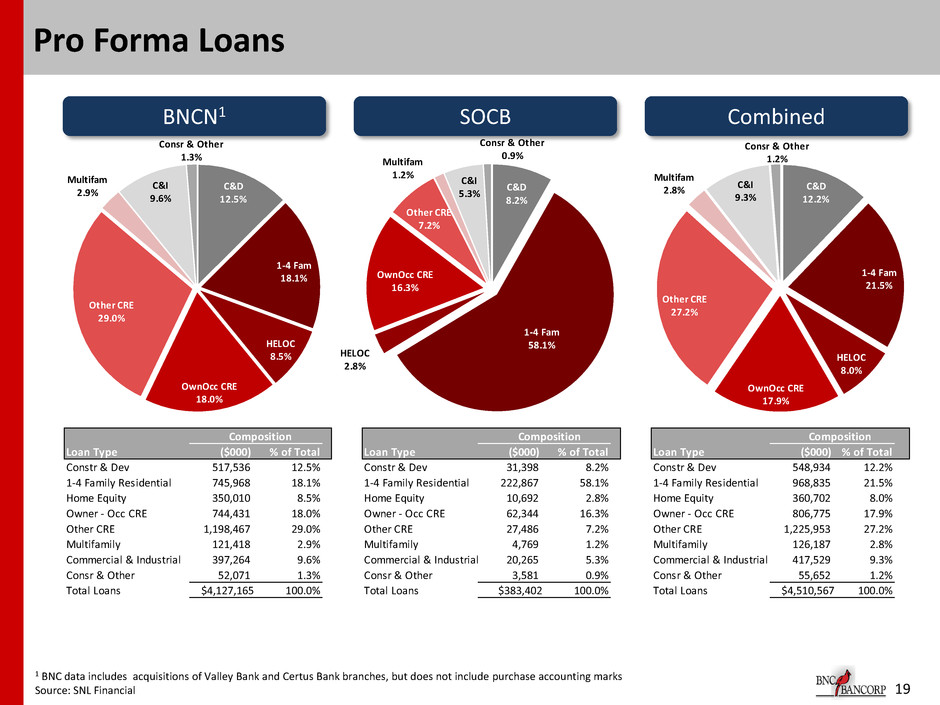
19 Pro Forma Loans BNCN1 SOCB Combined C&D 12.5% 1-4 Fam 18.1% HELOC 8.5% OwnOcc CRE 18.0% Other CRE 29.0% Multifam 2.9% C&I 9.6% Consr & Other 1.3% C&D 8.2% 1-4 Fam 58.1% HELOC 2.8% OwnOcc CRE 16.3% Other CRE 7.2% Multifam 1.2% C&I 5.3% Consr & Other 0.9% C&D 12.2% 1-4 Fam 21.5% HELOC 8.0% OwnOcc CRE 17.9% Other CRE 27.2% Multifam 2.8% C&I 9.3% Consr & Other 1.2% Composition Composition Composition Loan Type ($000) % of Total Loan Type ($000) % of Total Loan Type ($000) % of Total Constr & Dev 517,536 12.5% Constr & Dev 31,398 8.2% Constr & Dev 548,934 12.2% 1-4 Family Residential 745,968 18.1% 1-4 Family Residential 222,867 58.1% 1-4 Family Residential 968,835 21.5% Home Equity 350,010 8.5% Home Equity 10,692 2.8% Home Equity 360,702 8.0% Owner - Occ CRE 744,431 18.0% Owner - Occ CRE 62,344 16.3% Owner - Occ CRE 806,775 17.9% Other CRE 1,198,467 29.0% Other CRE 27,486 7.2% Other CRE 1,225,953 27.2% Multifamily 121,418 2.9% Multifamily 4,769 1.2% Multifamily 126,187 2.8% Commercial & Industrial 397,264 9.6% Commercial & Industrial 20,265 5.3% Commercial & Industrial 417,529 9.3% Consr & Other 52,071 1.3% Consr & Other 3,581 0.9% Consr & Other 55,652 1.2% Total Loans $4,127,165 100.0% Total Loans $383,402 100.0% Total Loans $4,510,567 100.0% 1 BNC data includes acquisitions of Valley Bank and Certus Bank branches, but does not include purchase accounting marks Source: SNL Financial
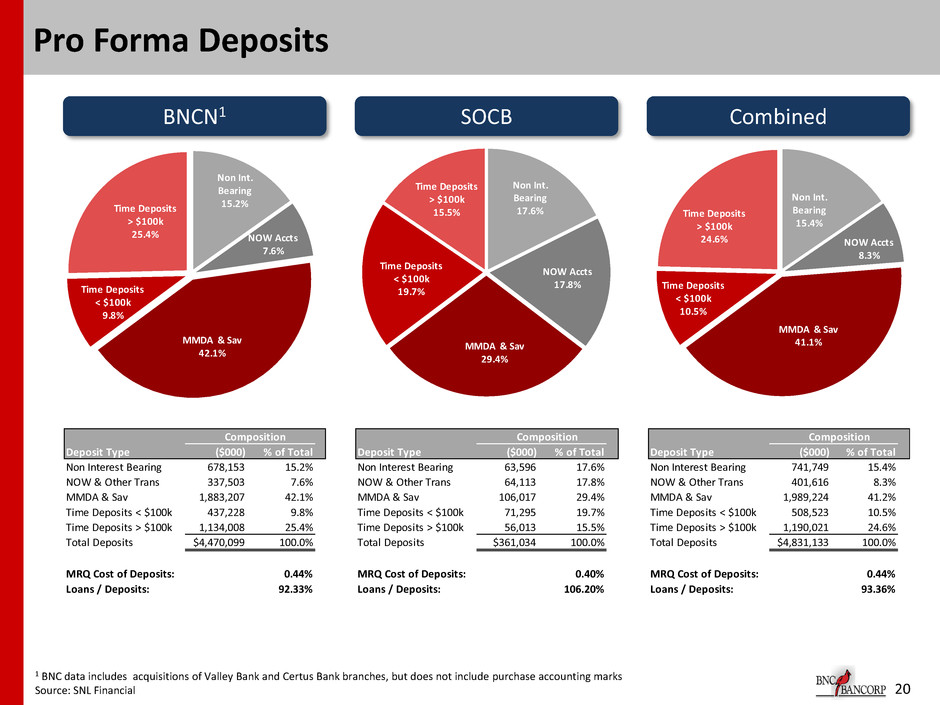
20 Pro Forma Deposits BNCN1 SOCB Combined 1 BNC data includes acquisitions of Valley Bank and Certus Bank branches, but does not include purchase accounting marks Source: SNL Financial Composition Composition Composition Deposit Type ($000) % of Total Deposit Type ($000) % of Total Deposit Type ($000) % of Total Non Interest Bearing 678,153 15.2% Non Interest Bearing 63,596 17.6% Non Interest Bearing 741,749 15.4% NOW & Other Trans 337,503 7.6% NOW & Other Trans 64,113 17.8% NOW & Other Trans 401,616 8.3% MMDA & Sav 1,883,207 42.1% MMDA & Sav 106,017 29.4% MMDA & Sav 1,989,224 41.2% Time Deposits < $100k 437,228 9.8% Time Deposits < $100k 71,295 19.7% Time Deposits < $100k 508,523 10.5% Ti e Deposits > $100k 1,134,008 25.4% Ti e Deposits > $100k 56,013 15.5% Ti e Deposits > $100k 1,190,021 24.6% Total Deposits $4,470,099 100.0% Total Deposits $361,034 100.0% Total Deposits $4,831,133 100.0% MRQ Cost of Deposits: 0.44% MRQ Cost of Deposits: 0.40% MRQ Cost of Deposits: 0.44% Loans / Deposits: 92.33% Loans / Deposits: 106.20% Loans / Deposits: 93.36% Non Int. Bearing 15.2% NOW Accts 7.6% MMDA & Sav 42.1% Time Deposits < $100k 9.8% Time Deposits > $100k 25.4% Non Int. Bearing 17.6% NOW Accts 17.8% MMDA & Sav 29.4% Time Deposits < $100k 19.7% Time Deposits > $100k 15.5% Non Int. Bearing 15.4% NOW Accts 8.3% MMDA & Sav 41.1% Time Deposits < $100k 10.5% Time Deposits > $100k 24.6%
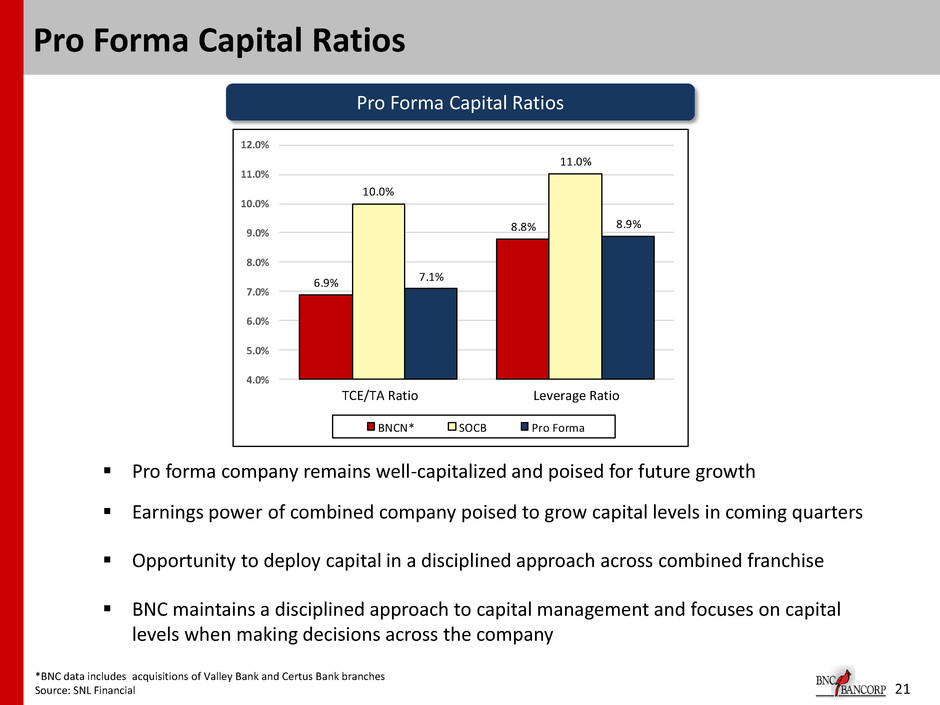
21 Pro Forma Capital Ratios Pro Forma Capital Ratios Pro forma company remains well-capitalized and poised for future growth Earnings power of combined company poised to grow capital levels in coming quarters Opportunity to deploy capital in a disciplined approach across combined franchise BNC maintains a disciplined approach to capital management and focuses on capital levels when making decisions across the company 6.9% 8.8% 10.0% 11.0% 7.1% 8.9% 4.0% 5.0% 6.0% 7.0% 8.0% 9.0% 10.0% 11.0% 12.0% BNCN* SOCB Pro Forma TCE/TA Ratio Leverage Ratio *BNC data includes acquisitions of Valley Bank and Certus Bank branches Source: SNL Financial
22 Transaction Summary Transaction drives earnings growth and overall shareholder value for both BNC and Southcoast shareholders Significantly increases presence in Charleston / Mt. Pleasant with the ability to leverage existing local infrastructure and personnel Pro forma institution is stronger, well-capitalized and remains the acquirer of choice in the Carolinas and Virginia Increases liquidity in BNCN shares Convenience of expanded branch network in Charleston / Mt. Pleasant Increases SOCB’s ability to serve larger, more prominent customers
23 Investor Contacts Richard D. Callicutt II President & Chief Executive Officer David B. Spencer Senior Executive Vice President & Chief Financial Officer BNC Bancorp 3980 Premier Drive, Suite 210 High Point, NC 27265 (366) 869-9200 www.bankofnc.com
24 Forward Looking Statements This presentation contains certain forward-looking information about BNC Bancorp and subsidiaries (collectively, “BNCN”) that is intended to be covered by the safe harbor for “forward-looking statements” provided by the Private Securities Litigation Reform Act of 1995. All statements other than statements of historical fact, are forward-looking statements. In some cases, you can identify forward-looking statements by words such as “may,” “hope,” “will,” “should,” “expect,” “plan,” “anticipate,” “intend,” “believe,” “estimate,” “predict,” “potential,” “continue,” “could,” “future” or the negative of those terms or other words of similar meaning. You should carefully read forward-looking statements, including statements that contain these words, because they discuss the future expectations or state other “forward-looking” information about BNCN. Such statements involve inherent risks and uncertainties, many of which are difficult to predict and are generally beyond the control of BNCN. Forward-looking statements speak only as of the date they are made and BNCN assumes no duty to update such statements. In addition to factors previously disclosed in reports filed by BNCN with the Securities and Exchange Commission (“SEC”), additional risks and uncertainties may include, but are not limited to: the possibility that any of the anticipated benefits of the proposed mergers will not be realized or will not be realized within the expected time period; the risk that integration of operations with those of BNCN will be materially delayed or will be more costly or difficult than expected; the inability to complete the mergers due to the failure of shareholder approval to adopt the respective merger agreements; the failure to satisfy other conditions to completion of the mergers, including receipt of required regulatory and other approvals; the failure of the proposed mergers to close for any other reason; the effect of the announcement of the mergers on customer relationships and operating results; the possibility that the mergers may be more expensive to complete than anticipated, including as a result of unexpected factors or events; and general competitive, economic, political and market conditions and fluctuations. As stated previously, additional factors affecting BNCN are discussed in BNCN’s Annual Report on Form 10-K, its Quarterly Reports on Form 10-Q and its Current Reports on Form 8-K, filed with the SEC. Please refer to the SEC’s website at www.sec.gov where you can review those documents.


