
Stephens Inc. Carolinas Roadshow - Charlotte November 2016

Third Quarter Results 2016
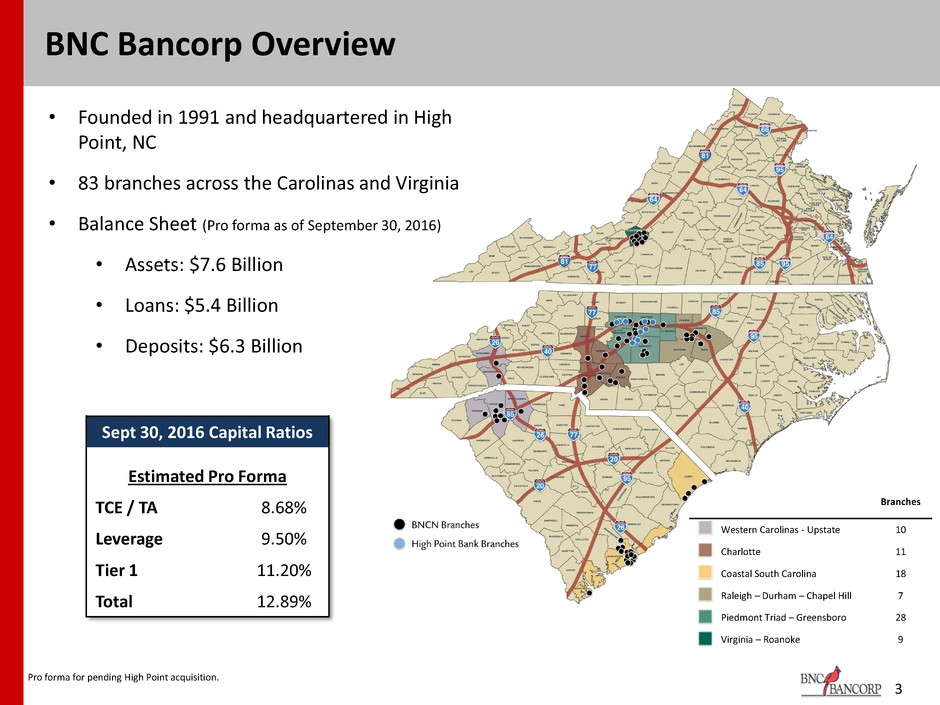
3 BNC Bancorp Overview • Founded in 1991 and headquartered in High Point, NC • 83 branches across the Carolinas and Virginia • Balance Sheet (Pro forma as of September 30, 2016) • Assets: $7.6 Billion • Loans: $5.4 Billion • Deposits: $6.3 Billion Sept 30, 2016 Capital Ratios Estimated Pro Forma TCE / TA 8.68% Leverage 9.50% Tier 1 11.20% Total 12.89% Pro forma for pending High Point acquisition. Branches Western Carolinas - Upstate 10 Charlotte 11 Coastal South Carolina 18 Raleigh – Durham – Chapel Hill 7 Piedmont Triad – Greensboro 28 Virginia – Roanoke 9

Building Premier Franchise in the Carolinas & Virginia 4 • Headquarters: • Branches: • Total Assets: • Total Loans: • Total Deposits: • Tangible Book Value High Point, NC 83 $7.6B $5.4B $6.3B $12.15 per share • Exchange: • Recent Stock Price: • Price to TBV: • Market Cap: • Annual Dividend: • Dividend Yield: NASDAQ: BNCN $24.45 200% $1.27 Billion $0.20 0.82% Primary Objective: Maximize Long-term Shareholder Value All numbers are pro forma and include High Point Bank Corp., with fair value marks and balance sheet deleveraging. Total shares outstanding of 52.145 million. Market data as of November 1, 2016 BNC BANCORP PRO FORMA

5 Third Quarter Operating Results Third Quarter 2016 Results • Originated loans increased $292.3 million, or 9.2%, compared to Q2. • Operating EPS of $0.42, exceeded consensus of $0.38. Increase from $0.41 reported in Q2. • 11.0% Increase in net interest income before accretion results from successful organic growth • Non-interest income increased in Q3 on a linked Q comparison with strong growth in SBA and BOLI. Mortgage revenue was flat due to enhanced efforts to build community outreach mortgage platform. • Non-interest expense remained stable at the $32.0-$32.5 million run rate. Source: Company internal reporting as of September 30, 2016 3Q 2016 Highlights Net Income, Operating 3Q 16 2Q 16 3Q 15 Linked Q 3Q 15 Net Interest Income, before Accretion 49,572$ 44,654$ 41,424$ 11.0% 19.7% Accretion Income 5,845 5,276 4,835 10.8% 20.9% Net Interest Income 55,417 49,930 46,259 11.0% 19.8% Provision for loan losses 1,865 698 198 167.2% 841.9% Non-interest Income 9,777 9,011 8,375 8.5% 16.7% Non-interest Expense, operating less CDI 34,105 31,845 31,434 7.1% 8.5% CDI- Core Deposit Intangible Expense 1,162 1,187 1,102 -2.1% 5.4% Pretax Income 28,062 25,211 21,900 11.3% 28.1% Taxes 8,326 8,169 6,902 1.9% 20.6% Net Income, Operating 19,736$ 17,042$ 14,998$ 15.8% 31.6% EPS 0.42$ 0.41$ 0.39$ ROA 1.20% 1.16% 1.15% ROTCE 14.50% 15.36% 16.79% Net Interest Margin 3.91% 3.91% 4.10% Net Interest Margin, ex accretion 3.51% 3.51% 3.69% Net Overhead Ratio, Operating 1.55% 1.71% 1.88% Efficiency Ratio, Operating 52.31% 54.26% 57.54% Effective Tax Rate 29.7% 32.4% 31.5% Average Diluted Shares 47,360 41,500 38,165 End of Period Shares 48,110 45,201 38,138 Non-Operating Amounts 3Q 16 2Q 16 3Q 15 Merger/Conversion Related Charges 2,568$ 3,808$ 4,886$ Loss on Extinguishment of Debt - - 763 Gains/Losses 34 4 794 Tax Effect (938) (1,407) (1,796) Total Non-Operating Impact on Earnings 1,596 2,397 3,059 Net Income, Reported 18,140 14,645 11,939 EPS, Reported 0.38$ 0.35$ 0.31$ Change versus: (All amounts and ratios below are shown on an operating basis and exclude Non-Operating Amounts Below)
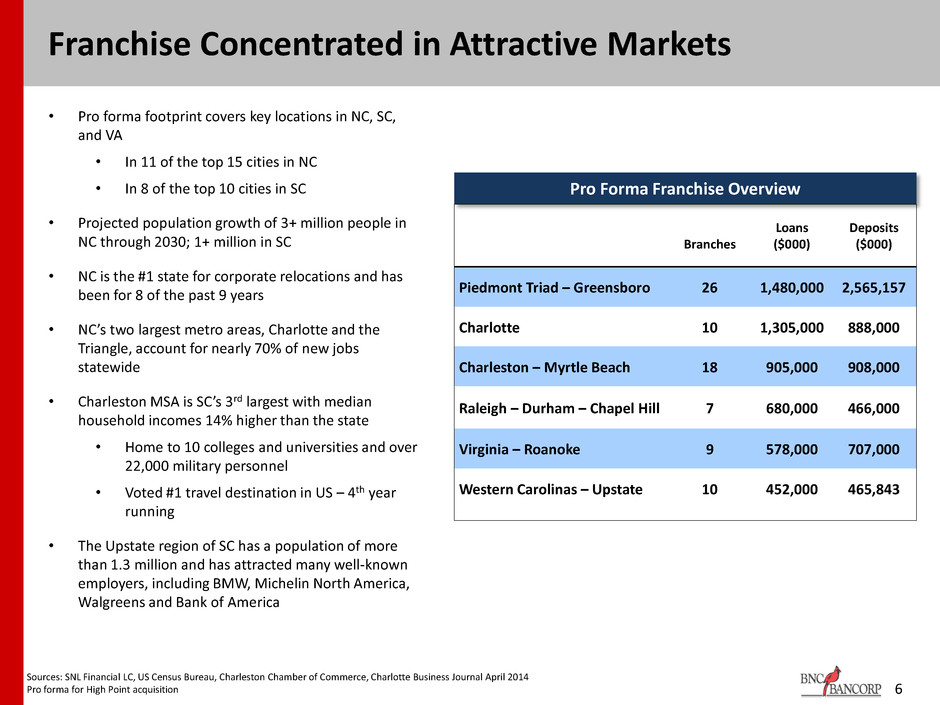
6 Franchise Concentrated in Attractive Markets • Pro forma footprint covers key locations in NC, SC, and VA • In 11 of the top 15 cities in NC • In 8 of the top 10 cities in SC • Projected population growth of 3+ million people in NC through 2030; 1+ million in SC • NC is the #1 state for corporate relocations and has been for 8 of the past 9 years • NC’s two largest metro areas, Charlotte and the Triangle, account for nearly 70% of new jobs statewide • Charleston MSA is SC’s 3rd largest with median household incomes 14% higher than the state • Home to 10 colleges and universities and over 22,000 military personnel • Voted #1 travel destination in US – 4th year running • The Upstate region of SC has a population of more than 1.3 million and has attracted many well-known employers, including BMW, Michelin North America, Walgreens and Bank of America Sources: SNL Financial LC, US Census Bureau, Charleston Chamber of Commerce, Charlotte Business Journal April 2014 Pro forma for High Point acquisition Pro Forma Franchise Overview Branches Loans ($000) Deposits ($000) Piedmont Triad – Greensboro 26 1,480,000 2,565,157 Charlotte 10 1,305,000 888,000 Charleston – Myrtle Beach 18 905,000 908,000 Raleigh – Durham – Chapel Hill 7 680,000 466,000 Virginia – Roanoke 9 578,000 707,000 Western Carolinas – Upstate 10 452,000 465,843

FINANCIAL PERFORMANCE TRENDS 7
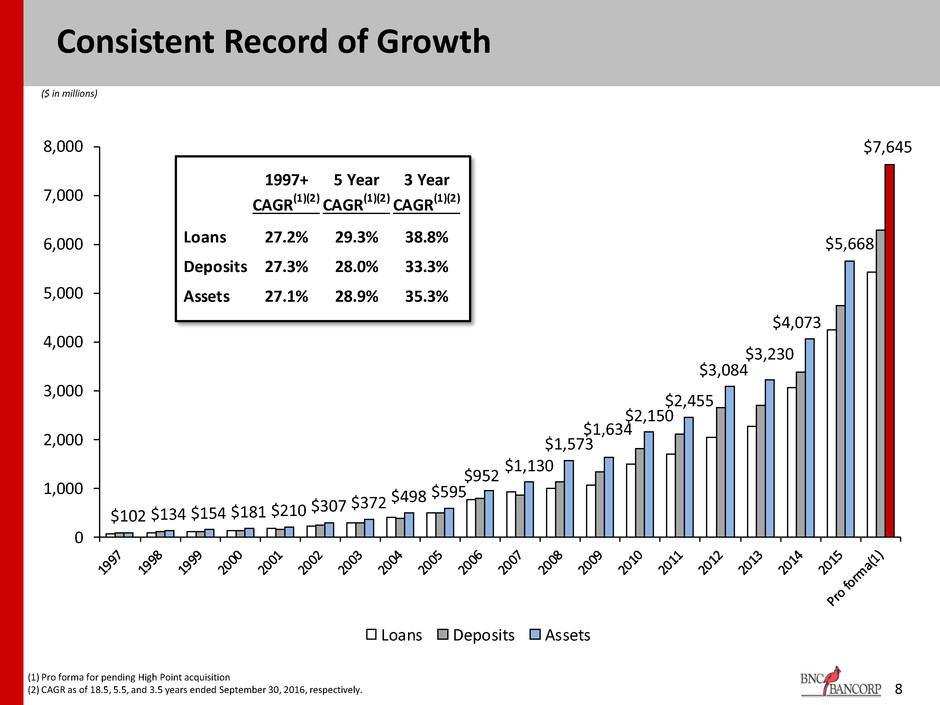
$102 $134 $154 $181 $210 $307 $372 $498 $595 $952 $1,130 $1,573 $1,634 $2,150 $2,455 $3,084 $3,230 $4,073 $5,668 $7,645 0 1,000 2,000 3,000 4,000 5,000 6,000 7,000 8,000 Loans Deposits Assets 8 ($ in millions) (1) Pro forma for pending High Point acquisition (2) CAGR as of 18.5, 5.5, and 3.5 years ended September 30, 2016, respectively. Consistent Record of Growth 1997+ 5 Year 3 Year CAGR(1)(2) CAGR(1)(2) CAGR(1)(2) Loans 27.2% 29.3% 38.8% Deposits 27.3% 28.0% 33.3% Assets 27.1% 28.9% 35.3%
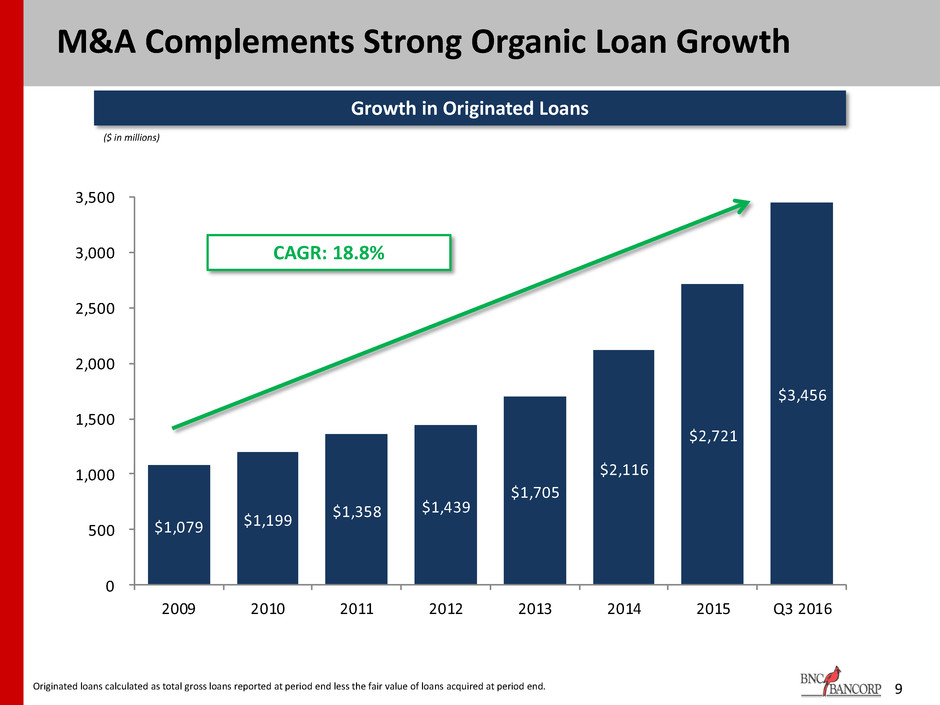
$1,079 $1,199 $1,358 $1,439 $1,705 $2,116 $2,721 $3,456 0 500 1,000 1,500 2,000 2,500 3,000 3,500 2009 2010 2011 2012 2013 2014 2015 Q3 2016 Growth in Originated Loans M&A Complements Strong Organic Loan Growth ($ in millions) 9 CAGR: 18.8% Originated loans calculated as total gross loans reported at period end less the fair value of loans acquired at period end.
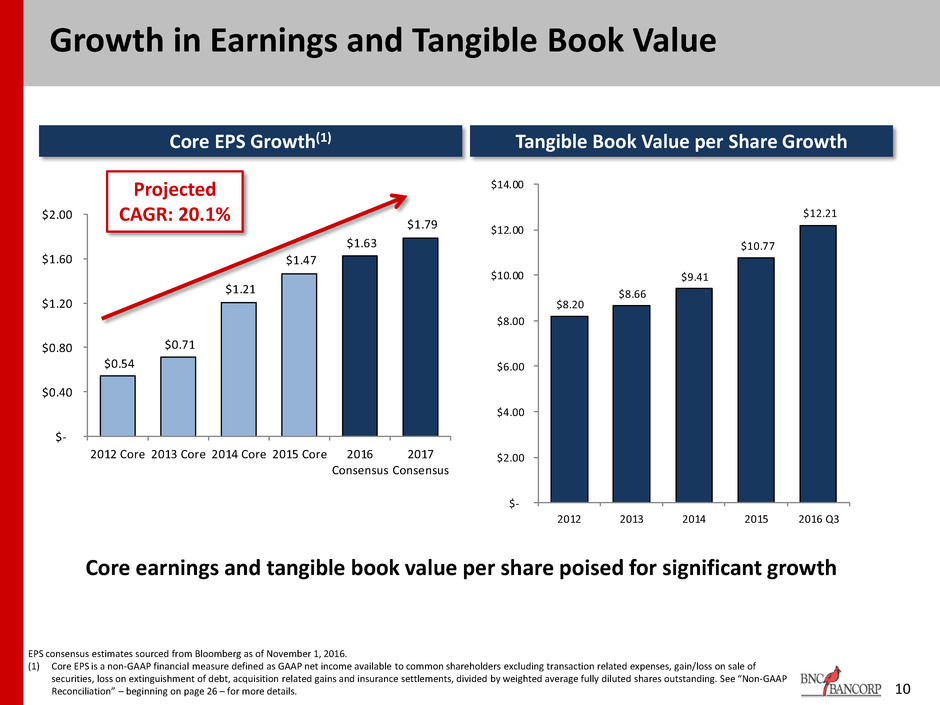
$0.54 $0.71 $1.21 $1.47 $1.63 $1.79 $- $0.40 $0.80 $1.20 $1.60 $2.00 2012 Core 2013 Core 2014 Core 2015 Core 2016 Consensus 2017 Consensus Growth in Earnings and Tangible Book Value EPS consensus estimates sourced from Bloomberg as of November 1, 2016. (1) Core EPS is a non-GAAP financial measure defined as GAAP net income available to common shareholders excluding transaction related expenses, gain/loss on sale of securities, loss on extinguishment of debt, acquisition related gains and insurance settlements, divided by weighted average fully diluted shares outstanding. See “Non-GAAP Reconciliation” – beginning on page 26 – for more details. 10 Core EPS Growth(1) Tangible Book Value per Share Growth Projected CAGR: 20.1% Core earnings and tangible book value per share poised for significant growth $8.20 $8.66 $9.41 $10.77 $12.21 $- $2.00 $4.00 $6.00 $8.00 $10.00 $12.00 $14.00 2012 2013 2014 2015 2016 Q3
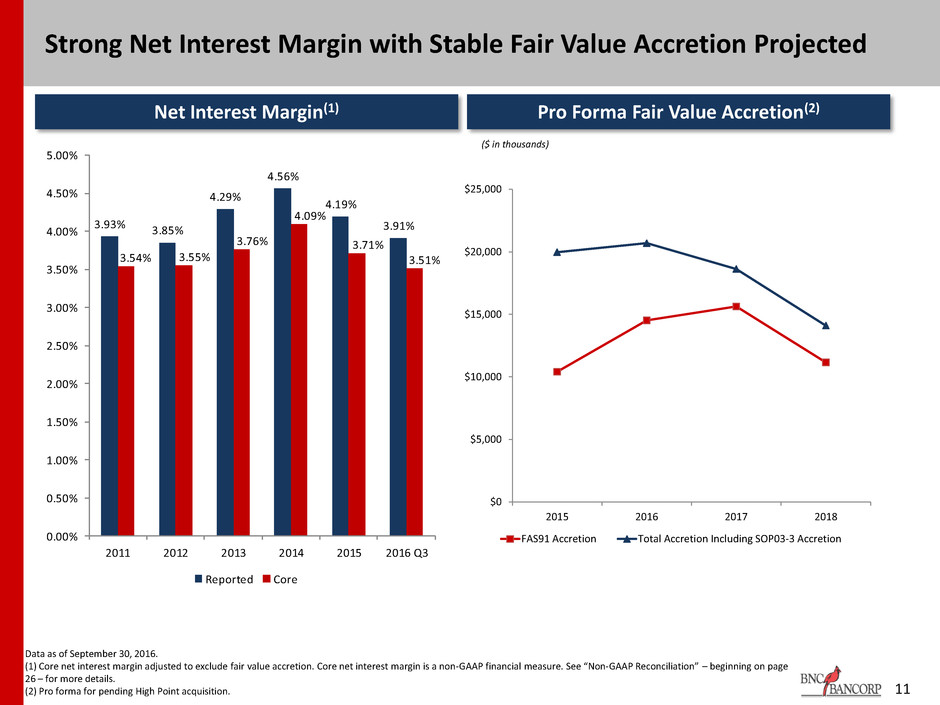
11 Strong Net Interest Margin with Stable Fair Value Accretion Projected Net Interest Margin(1) Pro Forma Fair Value Accretion(2) Data as of September 30, 2016. (1) Core net interest margin adjusted to exclude fair value accretion. Core net interest margin is a non-GAAP financial measure. See “Non-GAAP Reconciliation” – beginning on page 26 – for more details. (2) Pro forma for pending High Point acquisition. $0 $5,000 $10,000 $15,000 $20,000 $25,000 2015 2016 2017 2018 FAS91 Accretion Total Accretion Including SOP03-3 Accretion ($ in thousands) 3.93% 3.85% 4.29% 4.56% 4.19% 3.91% 3.54% 3.55% 3.76% 4.09% 3.71% 3.51% 0.00% 0.50% 1.00% 1.50% 2.00% 2.50% 3.00% 3.50% 4.00% 4.50% 5.00% 2011 2012 2013 2014 2015 2016 Q3 Reported Core
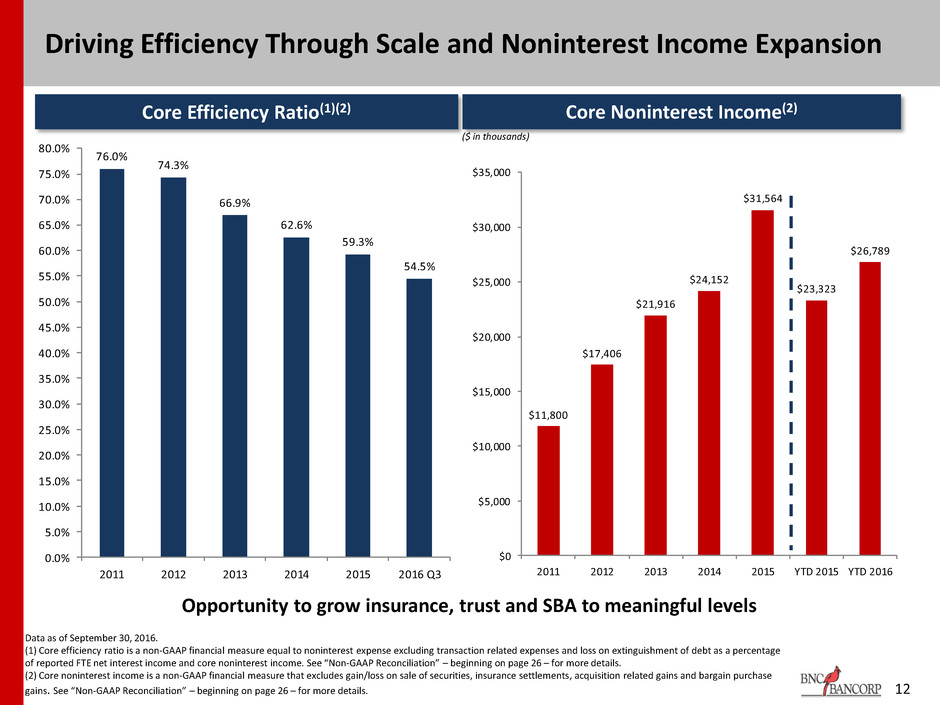
76.0% 74.3% 66.9% 62.6% 59.3% 54.5% 0.0% 5.0% 10.0% 15.0% 20.0% 25.0% 30.0% 35.0% 40.0% 45.0% 50.0% 55.0% 60.0% 65.0% 70.0% 75.0% 80.0% 2011 2012 2013 2014 2015 2016 Q3 $11,800 $17,406 $21,916 $24,152 $31,564 $23,323 $26,789 $0 $5,000 $10,000 $15,000 $20,000 $25,000 $30,000 $35,000 2011 2012 2013 2014 2015 YTD 2015 YTD 2016 12 Driving Efficiency Through Scale and Noninterest Income Expansion Core Efficiency Ratio(1)(2) Core Noninterest Income(2) Data as of September 30, 2016. (1) Core efficiency ratio is a non-GAAP financial measure equal to noninterest expense excluding transaction related expenses and loss on extinguishment of debt as a percentage of reported FTE net interest income and core noninterest income. See “Non-GAAP Reconciliation” – beginning on page 26 – for more details. (2) Core noninterest income is a non-GAAP financial measure that excludes gain/loss on sale of securities, insurance settlements, acquisition related gains and bargain purchase gains. See “Non-GAAP Reconciliation” – beginning on page 26 – for more details. ($ in thousands) Opportunity to grow insurance, trust and SBA to meaningful levels

RECENT ACQUISITIONS 13
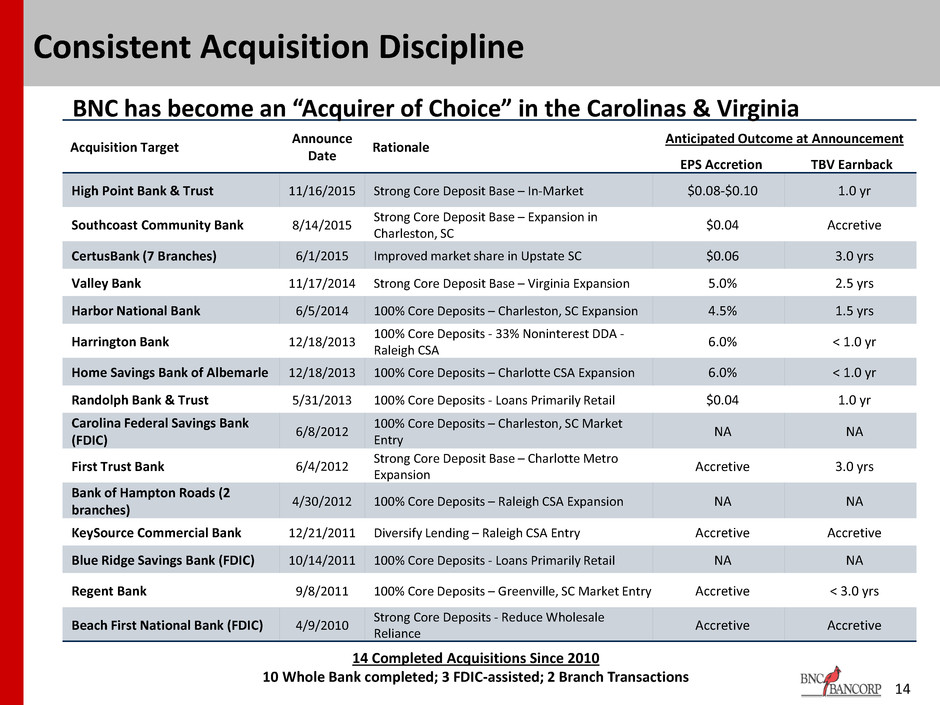
14 Consistent Acquisition Discipline 14 Completed Acquisitions Since 2010 10 Whole Bank completed; 3 FDIC-assisted; 2 Branch Transactions Acquisition Target Announce Date Rationale Anticipated Outcome at Announcement EPS Accretion TBV Earnback High Point Bank & Trust 11/16/2015 Strong Core Deposit Base – In-Market $0.08-$0.10 1.0 yr Southcoast Community Bank 8/14/2015 Strong Core Deposit Base – Expansion in Charleston, SC $0.04 Accretive CertusBank (7 Branches) 6/1/2015 Improved market share in Upstate SC $0.06 3.0 yrs Valley Bank 11/17/2014 Strong Core Deposit Base – Virginia Expansion 5.0% 2.5 yrs Harbor National Bank 6/5/2014 100% Core Deposits – Charleston, SC Expansion 4.5% 1.5 yrs Harrington Bank 12/18/2013 100% Core Deposits - 33% Noninterest DDA - Raleigh CSA 6.0% < 1.0 yr Home Savings Bank of Albemarle 12/18/2013 100% Core Deposits – Charlotte CSA Expansion 6.0% < 1.0 yr Randolph Bank & Trust 5/31/2013 100% Core Deposits - Loans Primarily Retail $0.04 1.0 yr Carolina Federal Savings Bank (FDIC) 6/8/2012 100% Core Deposits – Charleston, SC Market Entry NA NA First Trust Bank 6/4/2012 Strong Core Deposit Base – Charlotte Metro Expansion Accretive 3.0 yrs Bank of Hampton Roads (2 branches) 4/30/2012 100% Core Deposits – Raleigh CSA Expansion NA NA KeySource Commercial Bank 12/21/2011 Diversify Lending – Raleigh CSA Entry Accretive Accretive Blue Ridge Savings Bank (FDIC) 10/14/2011 100% Core Deposits - Loans Primarily Retail NA NA Regent Bank 9/8/2011 100% Core Deposits – Greenville, SC Market Entry Accretive < 3.0 yrs Beach First National Bank (FDIC) 4/9/2010 Strong Core Deposits - Reduce Wholesale Reliance Accretive Accretive BNC has become an “Acquirer of Choice” in the Carolinas & Virginia
• BNC is acquiring High Point Bank Corporation “HPTB” for $141.3 million in stock and cash • BNC’s cash consideration in the High Point transaction is at least $42.4 million • Accretive to 2017 EPS of $0.13 • Tangible Book Value Earnback less than 1 Year • Nearly 27% of HPTB’s deposits are noninterest-bearing 15 High Point Bank Transaction
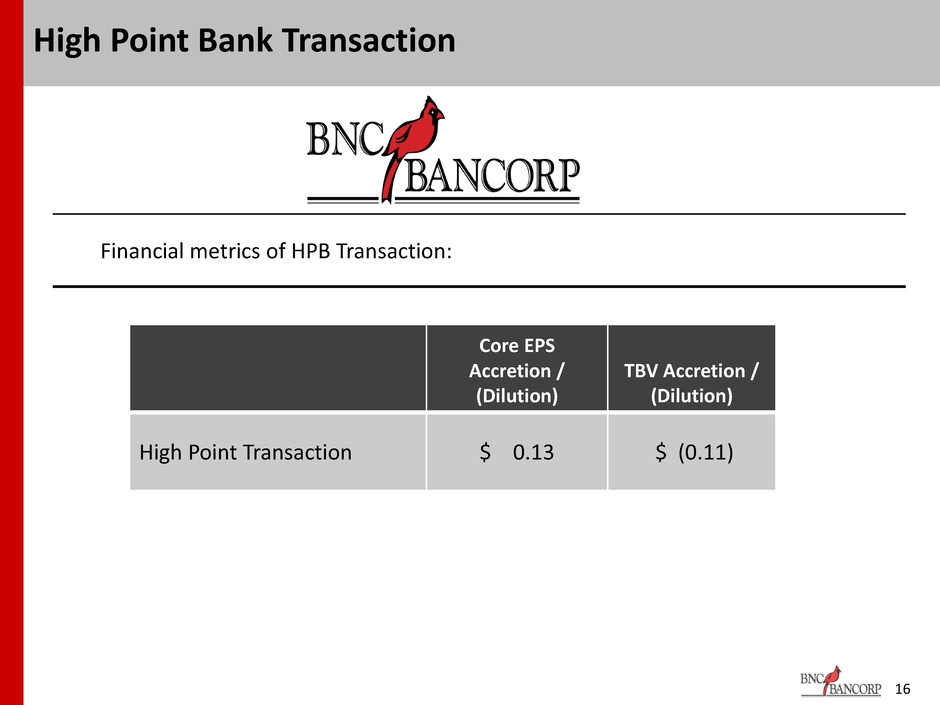
Financial metrics of HPB Transaction: 16 High Point Bank Transaction Core EPS Accretion / (Dilution) TBV Accretion / (Dilution) High Point Transaction $ 0.13 $ (0.11)
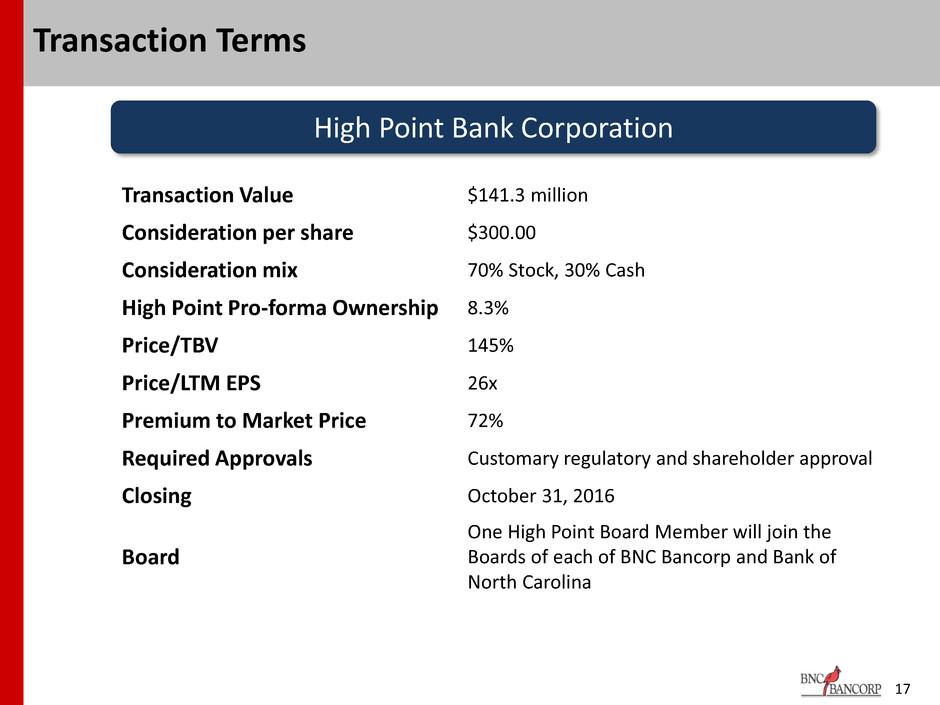
17 Transaction Terms High Point Bank Corporation Transaction Value $141.3 million Consideration per share $300.00 Consideration mix 70% Stock, 30% Cash High Point Pro-forma Ownership 8.3% Price/TBV 145% Price/LTM EPS 26x Premium to Market Price 72% Required Approvals Customary regulatory and shareholder approval Closing October 31, 2016 Board One High Point Board Member will join the Boards of each of BNC Bancorp and Bank of North Carolina

18 Transaction Assumptions Cost savings % savings of HPTB’s LTM non-interest expense realized: • 44% realized in 2016 • 50% realized in 2017 Revenue synergies None assumed One-time costs $12mm, pretax Core deposit intangible $6mm Fair value marks $18mm gross credit mark; expected $2mm write-up on carrying value of bank premises High Point Bank Corporation

Benefits to BNC Franchise Value
• 12 branches in attractive Greensboro-High Point, NC MSA (9) and Winston-Salem, NC MSA (3) – Branch consolidation opportunities • #1 Deposit market share among local banks in High Point MSA • 110-year-old bank with deep local roots and strong customer relationships • Nearly 27% of High Point’s deposits are noninterest-bearing • High Point Trust Division: Largest Community Bank Trust Division in NC • High Point Insurance Division: One of Triad’s largest independent Agencies 20 Benefits to BNC Franchise
• High Point Trust Division: Largest Community Bank Trust Division in NC • Over $800 million in managed funds, serving approximately 500 families • Annual revenue: Trust $3.5 million; Brokerage $0.7 million • Offers Trust and estate planning, investment management, and retirement plan services • Combined Pre-tax income of over $1.0 million 21 High Point Bank Trust and Brokerage Divisions
• One of Triad’s largest independent Agencies – 30 Licensed agents • Offers Commercial (51%), Personal (37%), and Employee Benefits (12%) • Insurance Division over 100 years old having completed three prior acquisitions • Named the Best Insurance Agency in the Triad in 2013 by local paper • Revenues of over $3.5 million 22 High Point Bank Insurance Division
• Both BNC and High Point are on the same core system – JHA Silverlake • Concentration of Seasoned Talent in Support Areas proficient at JHA Silverlake • High Point has state-of-the-art Operations Center with adequate space to support future growth • Provides space and talent to combine loan and deposit operations under one roof and drive greater efficiencies • “Best of Both” talent and processes will drive greater efficiency 23 Operational Synergies

LOAN PORTFOLIO AND ASSET QUALITY 24

1.74% 1.14% 0.96% 0.63% 0.28% 0.15% 0.15% 4.60% 4.29% 2.45% 1.17% 0.53% 0.30% 0.19% 6.34% 5.43% 3.41% 1.80% 0.81% 0.45% 0.34% 0.00% 1.00% 2.00% 3.00% 4.00% 5.00% 6.00% 7.00% 2010 2011 2012 2013 2014 2015 2016 Q3 Originated Acquired Diversified and Quality Loan Portfolio Data as of September 30, 2016. (1) Nonperforming loans defined as nonaccrual loans and accruing loans greater than 90 days past due. (2) Includes loans held for sale. 25 Nonperforming Loans / Total Loans(1) Reserves and acquisition discounts to total loans equal to 1.44% as of September 30, 2016 Loan Composition(2) ($ in millions) Total Loans: $5,036 Non-owner Occupied CRE $1,675 33.3% Residential Mortgage $1,2 1 25.6 Owner-Occupied CRE $786 15.6% Commerical & Industrial $443 8.8% Commercial Constr. $442 8.8% Multi-family $240 4.8% Residential Constr. $104 2.1% Leases $30 0.6% Consumer $22 0.4% Farmland $3 0.1%
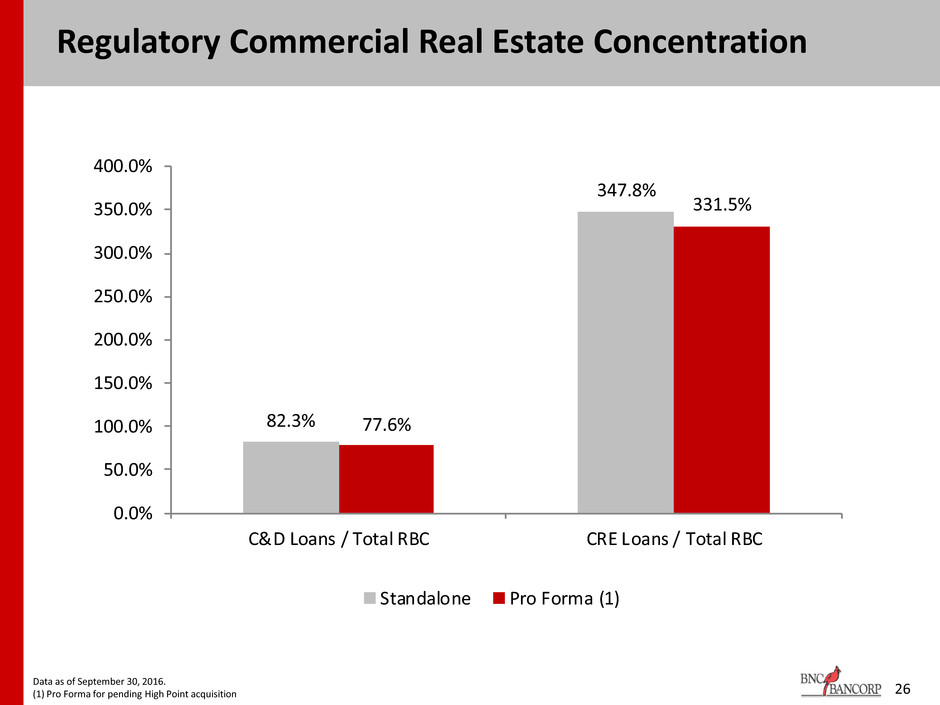
Regulatory Commercial Real Estate Concentration Data as of September 30, 2016. (1) Pro Forma for pending High Point acquisition 26 82.3% 347.8% 77.6% 331.5% 0.0% 50.0% 100.0% 150.0% 200.0% 250.0% 300.0% 350.0% 400.0% C&D Loans / Total RBC CRE Loans / Total RBC Standalone Pro Forma (1)
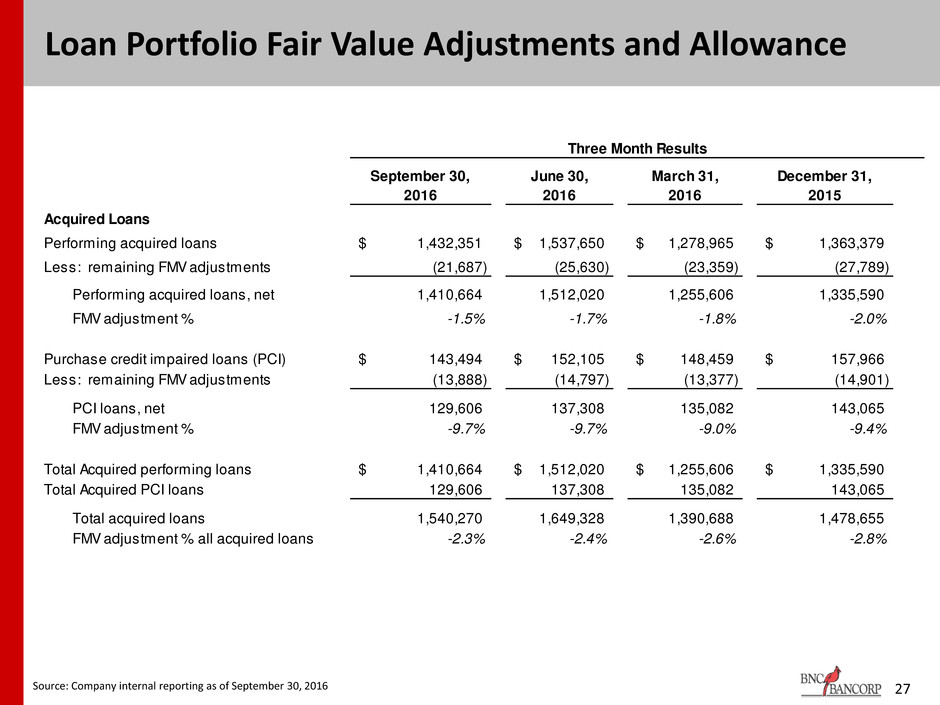
27 Loan Portfolio Fair Value Adjustments and Allowance Source: Company internal reporting as of September 30, 2016 September 30, 2016 June 30, 2016 March 31, 2016 December 31, 2015 Performing acquired loans 1,432,351$ 1,537,650$ 1,278,965$ 1,363,379$ Less: remaining FMV adjustments (21,687) (25,630) (23,359) (27,789) Performing acquired loans, net 1,410,664 1,512,020 1,255,606 1,335,590 FMV adjustment % -1.5% -1.7% -1.8% -2.0% Purchase credit impaired loans (PCI) 143,494$ 152,105$ 148,459$ 157,966$ Less: remaining FMV adjustments (13,888) (14,797) (13,377) (14,901) PCI loans, net 129,606 137,308 135,082 143,065 FMV adjustment % -9.7% -9.7% -9.0% -9.4% Total Acquired performing loans 1,410,664$ 1,512,020$ 1,255,606$ 1,335,590$ Total Acquired PCI loans 129,606 137,308 135,082 143,065 Total acquired loans 1,540,270 1,649,328 1,390,688 1,478,655 FMV adjustment % all acquired loans -2.3% -2.4% -2.6% -2.8% Acquired Loans Three Month Results
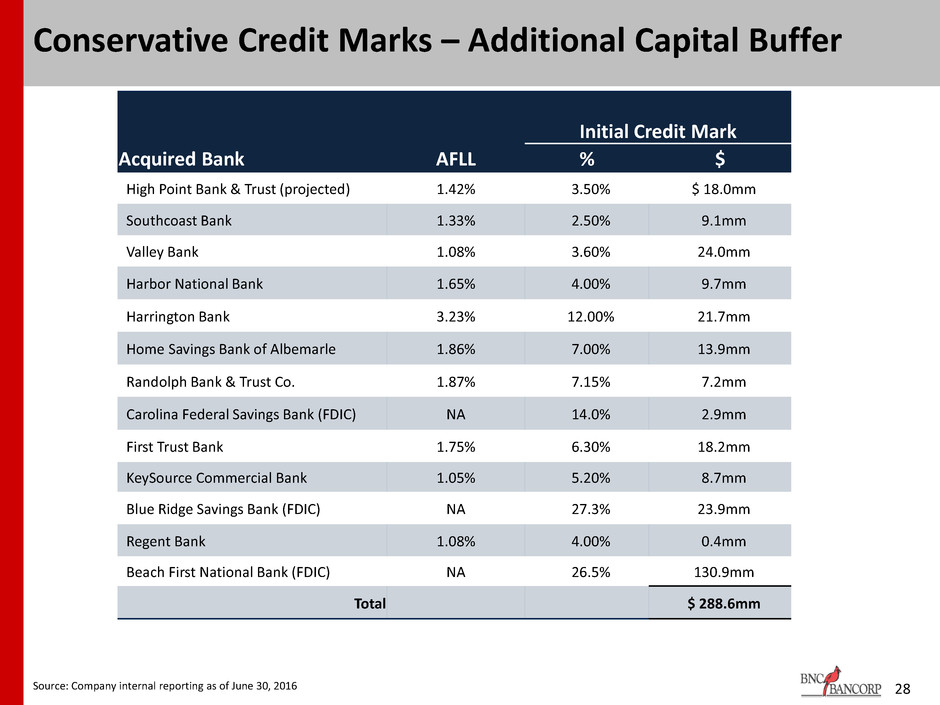
28 Conservative Credit Marks – Additional Capital Buffer Initial Credit Mark Acquired Bank AFLL % $ High Point Bank & Trust (projected) 1.42% 3.50% $ 18.0mm Southcoast Bank 1.33% 2.50% 9.1mm Valley Bank 1.08% 3.60% 24.0mm Harbor National Bank 1.65% 4.00% 9.7mm Harrington Bank 3.23% 12.00% 21.7mm Home Savings Bank of Albemarle 1.86% 7.00% 13.9mm Randolph Bank & Trust Co. 1.87% 7.15% 7.2mm Carolina Federal Savings Bank (FDIC) NA 14.0% 2.9mm First Trust Bank 1.75% 6.30% 18.2mm KeySource Commercial Bank 1.05% 5.20% 8.7mm Blue Ridge Savings Bank (FDIC) NA 27.3% 23.9mm Regent Bank 1.08% 4.00% 0.4mm Beach First National Bank (FDIC) NA 26.5% 130.9mm Total $ 288.6mm Source: Company internal reporting as of June 30, 2016

FUNDING AND LIQUIDITY 29
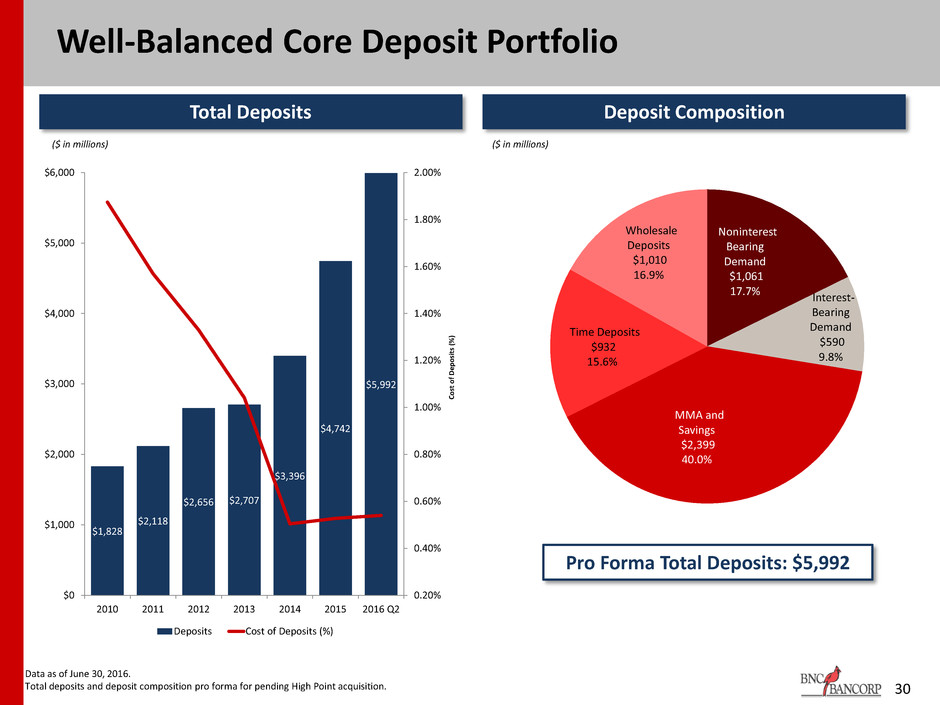
Well-Balanced Core Deposit Portfolio 30 Data as of June 30, 2016. Total deposits and deposit composition pro forma for pending High Point acquisition. Noninterest Bearing Demand $1,061 17.7% Interest- Bearing Demand $590 9.8% MMA and Savings $2,399 40.0% Time Deposits $932 15.6% Wholesale Deposits $1,010 16.9% $1,828 $2,118 $2,656 $2,707 $3,396 $4,742 $5,992 0.20% 0.40% 0.60% 0.80% 1.00% 1.20% 1.40% 1.60% 1.80% 2.00% $0 $1,000 $2,000 $3,000 $4,000 $5,000 $6,000 2010 2011 2012 2013 2014 2015 2016 Q2 C o st o f D e p o si ts ( % ) Deposits Cost of Deposits (%) ($ in millions) Total Deposits Deposit Composition Pro Forma Total Deposits: $5,992 ($ in millions) ($ in millions)
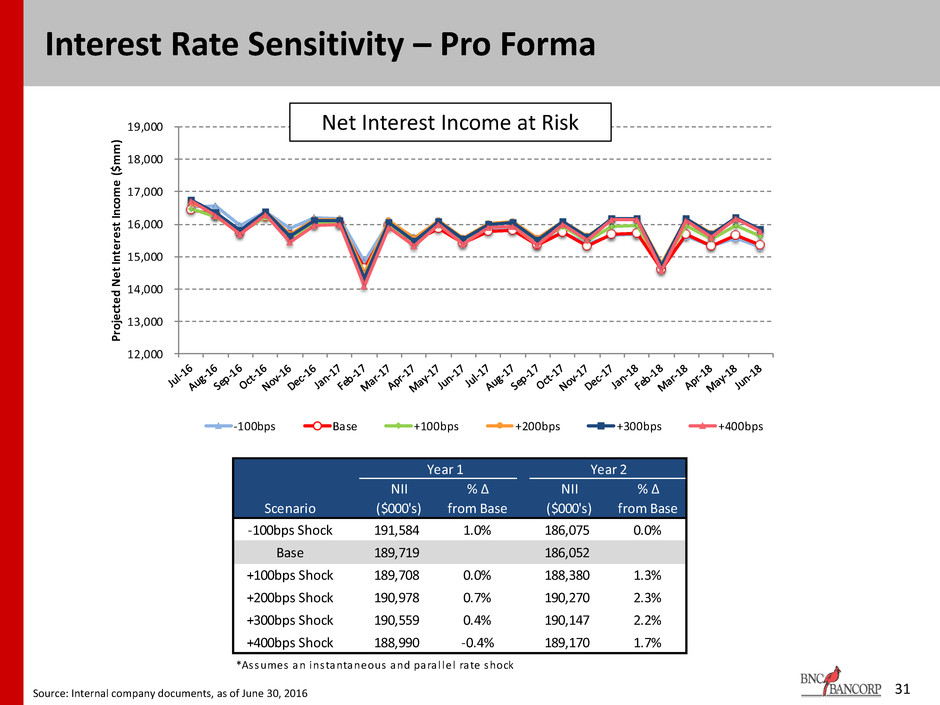
Year 1 Year 2 NII % Δ NII % Δ Scenario ($000's) from Base ($000's) from Base -100bps Shock 191,584 1.0% 186,075 0.0% Base 189,719 186,052 +100bps Shock 189,708 0.0% 188,380 1.3% +200bps Shock 190,978 0.7% 190,270 2.3% +300bps Shock 190,559 0.4% 190,147 2.2% +400bps Shock 188,990 -0.4% 189,170 1.7% *Assumes an instantaneous and para l lel rate shock 12,000 13,000 14,000 15,000 16,000 17,000 18,000 19,000 Pr oj ec te d N et In te re st In co m e ($ m m ) -100bps Base +100bps +200bps +300bps +400bps 31 Interest Rate Sensitivity – Pro Forma Source: Internal company documents, as of June 30, 2016 Net Interest Income at Risk
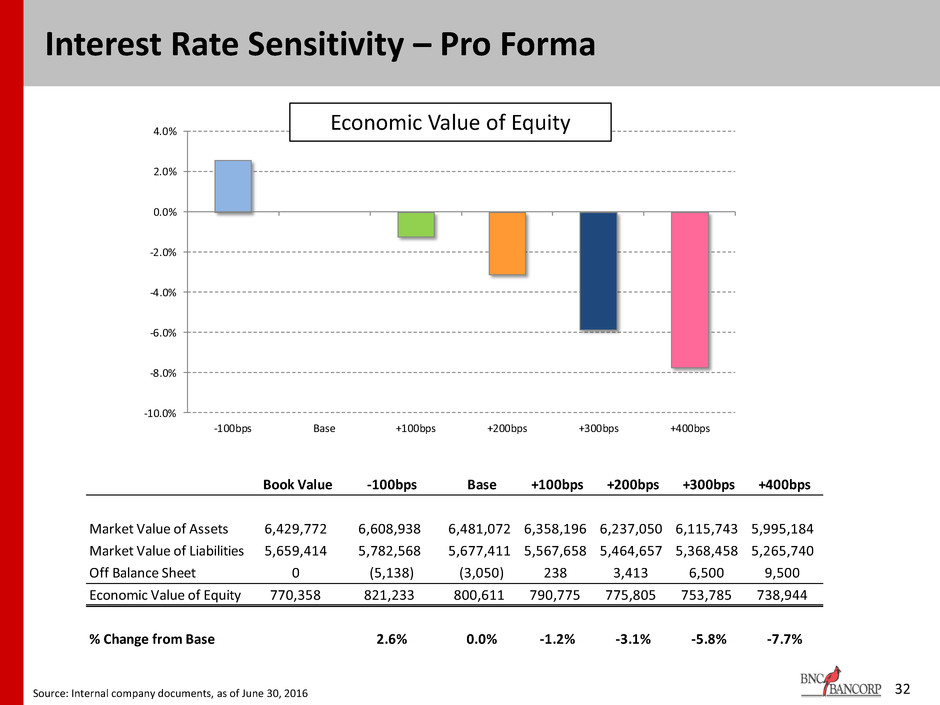
Book Value -100bps Base +100bps +200bps +300bps +400bps Market Value of Assets 6,429,772 6,608,938 6,481,072 6,358,196 6,237,050 6,115,743 5,995,184 Market Value of Liabilities 5,659,414 5,782,568 5,677,411 5,567,658 5,464,657 5,368,458 5,265,740 Off Balance Sheet 0 (5,138) (3,050) 238 3,413 6,500 9,500 Economic Value of Equity 770,358 821,233 800,611 790,775 775,805 753,785 738,944 % Change from Base 2.6% 0.0% -1.2% -3.1% -5.8% -7.7% -10.0% -8.0% -6.0% -4.0% -2.0% 0.0% 2.0% 4.0% -100bps Base +100bps +200bps +300bps +400bps 32 Interest Rate Sensitivity – Pro Forma Economic Value of Equity Source: Internal company documents, as of June 30, 2016

33 Non-GAAP Reconciliation ($ in thousands) Sept. 30, 2016 Sept. 30, 2015 2015 2014 2013 2012 2011 Core Return on Average Assets Net income available to common shareholders (GAAP) 47,222$ 31,711$ 44,450$ 29,390$ 16,187$ 8,049$ 4,526$ Transaction-related expenses, net of tax 4,920 5,650 8,364 5,641 3,634 3,310 819 Loss on extinguishment of debt, net of tax - 481 481 386 - - - Insurance settlement income, net of tax - - - 484 302 - - Acquisition-related gain, net of tax - - - - 453 - - Securities gains (losses), net of tax (1) 529 556 (322) (26) 1,922 763 Core earnings (non-GAAP) 52,143$ 37,313$ 52,739$ 35,255$ 19,092$ 9,437$ 4,582$ Average assets 6,027,183 4,481,400 4,720,107 3,561,719 3,009,367 2,544,718 2,208,525 Core return on average assets (non-GAAP) 1.16% 1.11% 1.12% 0.99% 0.63% 0.37% 0.21% Return on Average Tangible Common Equity Net income available to common shareholders (GAAP) 47,222$ 31,711$ 44,450$ 29,390$ 16,187$ 8,049$ 4,526$ Amortization of intangibles, net of tax 2,208 1,752 2,498 1,474 723 348 256 Tangible net income available to common shareholders (non-GAAP) 49,430 33,463 46,948 30,864 16,910 8,397 4,782 Average common shareholders equity 663,806 437,699 466,881 323,183 257,678 157,471 109,810 Average intangible assets 172,835 104,519 116,548 55,026 32,361 29,581 28,433 Average tangible common shareholders' equity (non-GAAP) 490,971 333,180 350,333 268,157 225,317 127,890 81,377 Return on average tangible common equity (non-GAAP) 13.45% 13.43% 13.40% 11.51% 7.50% 6.57% 5.88% Core Return on Average Tangible Common Equity (2) Net income available to common shareholders (GAAP) 47,222$ 31,711$ 44,450$ 29,390$ 16,187$ 8,049$ 4,526$ Amortization of intangibles, net of tax 2,208 1,752 2,498 1,474 723 348 256 Transaction-related expenses, net of tax 4,920 5,650 8,364 5,641 3,634 3,310 819 Loss on extinguishment of debt, net of tax - 481 481 386 - - - Insurance settlement income, net of tax - - - 484 302 - - Acquisition-related gain, net of tax - - - - 453 - - Securities gains (losses), net of tax (1) 529 556 (322) (26) 1,922 763 Core tangible net income available to common shareholders (non-GAAP) 54,350 39,065 55,237 36,729 19,815 9,785 4,838 Average common shareholders equity 663,806 437,699 466,881 323,183 257,678 157,471 109,810 Average intangible assets 172,835 104,519 116,548 55,026 32,361 29,581 28,433 Average tangible common shareholders' equity (non-GAAP) 490,971 333,180 350,333 268,157 225,317 127,890 81,377 Core return on average tangible common equity (non-GAAP) 14.79% 15.68% 15.77% 13.70% 8.79% 7.65% 5.95% Year Ended December 31,Nine Months Ended
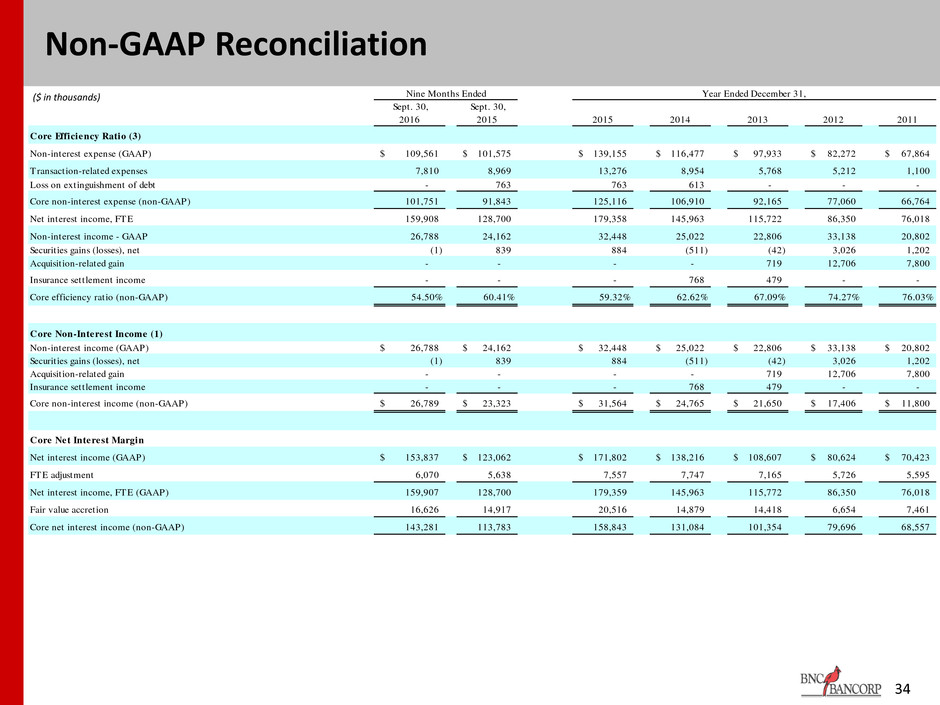
34 Non-GAAP Reconciliation ($ in thousands) Sept. 30, 2016 Sept. 30, 2015 2015 2014 2013 2012 2011 Core Efficiency Ratio (3) Non-interest expense (GAAP) 109,561$ 101,575$ 139,155$ 116,477$ 97,933$ 82,272$ 67,864$ Transaction-related expenses 7,810 8,969 13,276 8,954 5,768 5,212 1,100 Loss on extinguishment of debt - 763 763 613 - - - Core non-interest expense (non-GAAP) 101,751 91,843 125,116 106,910 92,165 77,060 66,764 Net interest income, FTE 159,908 128,700 179,358 145,963 115,722 86,350 76,018 Non-interest income - GAAP 26,788 24,162 32,448 25,022 22,806 33,138 20,802 Securities gains (losses), net (1) 839 884 (511) (42) 3,026 1,202 Acquisition-related gain - - - - 719 12,706 7,800 Insurance settlement income - - - 768 479 - - Core efficiency ratio (non-GAAP) 54.50% 60.41% 59.32% 62.62% 67.09% 74.27% 76.03% Core Non-Interest Income (1) Non-interest income (GAAP) 26,788$ 24,162$ 32,448$ 25,022$ 22,806$ 33,138$ 20,802$ Securities gains (losses), net (1) 839 884 (511) (42) 3,026 1,202 Acquisition-related gain - - - - 719 12,706 7,800 Insurance settlement income - - - 768 479 - - Core non-interest income (non-GAAP) 26,789$ 23,323$ 31,564$ 24,765$ 21,650$ 17,406$ 11,800$ Cor Net Interest Margin Net interest income (GAAP) 153,837$ 123,062$ 171,802$ 138,216$ 108,607$ 80,624$ 70,423$ FTE adjustment 6,070 5,638 7,557 7,747 7,165 5,726 5,595 Net interest income, FTE (GAAP) 159,907 128,700 179,359 145,963 115,772 86,350 76,018 Fair value accretion 16,626 14,917 20,516 14,879 14,418 6,654 7,461 Core net interest income (non-GAAP) 143,281 113,783 158,843 131,084 101,354 79,696 68,557 Nine Months Ended Year Ended December 31,
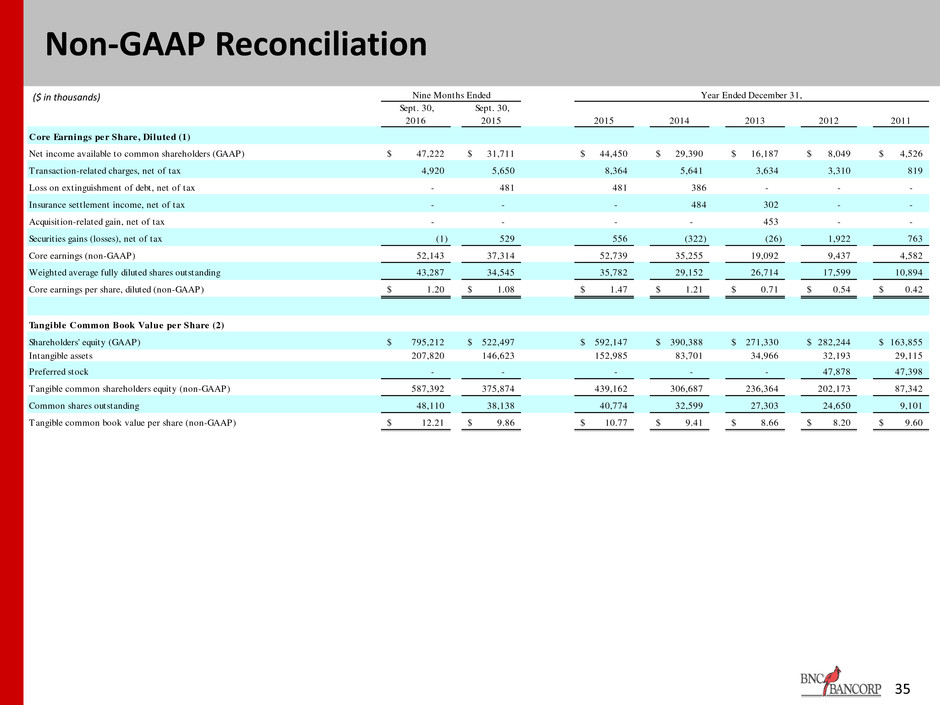
35 Non-GAAP Reconciliation ($ in thousands) Sept. 30, 2016 Sept. 30, 2015 2015 2014 2013 2012 2011 Core Earnings per Share, Diluted (1) Net income available to common shareholders (GAAP) 47,222$ 31,711$ 44,450$ 29,390$ 16,187$ 8,049$ 4,526$ Transaction-related charges, net of tax 4,920 5,650 8,364 5,641 3,634 3,310 819 Loss on extinguishment of debt, net of tax - 481 481 386 - - - Insurance settlement income, net of tax - - - 484 302 - - Acquisition-related gain, net of tax - - - - 453 - - Securities gains (losses), net of tax (1) 529 556 (322) (26) 1,922 763 Core earnings (non-GAAP) 52,143 37,314 52,739 35,255 19,092 9,437 4,582 Weighted average fully diluted shares outstanding 43,287 34,545 35,782 29,152 26,714 17,599 10,894 Core earnings per share, diluted (non-GAAP) 1.20$ 1.08$ 1.47$ 1.21$ 0.71$ 0.54$ 0.42$ Tangible Common Book Value per Share (2) Shar holders' equity (GAAP) 795,212$ 522,497$ 592,147$ 390,388$ 271,330$ 282,244$ 163,855$ Intangible assets 207,820 146,623 152,985 83,701 34,966 32,193 29,115 Preferred stock - - - - - 47,878 47,398 Tangible common shareholders equity (non-GAAP) 587,392 375,874 439,162 306,687 236,364 202,173 87,342 Common shares outstanding 48,110 38,138 40,774 32,599 27,303 24,650 9,101 Tangible common book value per share (non-GAAP) 12.21$ 9.86$ 10.77$ 9.41$ 8.66$ 8.20$ 9.60$ Nine Months Ended Year Ended December 31,
36 Contact Information Richard D. Callicutt II President & Chief Executive Officer David B. Spencer Senior Executive Vice President & Chief Financial Officer BNC Bancorp 3980 Premier Drive, Suite 210 High Point, NC 27265 (366) 869-9200 www.bankofnc.com
37 Forward Looking Statements This presentation contains certain forward-looking information about BNC Bancorp and subsidiaries (collectively, “BNCN”) that is intended to be covered by the safe harbor for “forward-looking statements” provided by the Private Securities Litigation Reform Act of 1995. All statements other than statements of historical fact, are forward-looking statements. In some cases, you can identify forward-looking statements by words such as “may,” “hope,” “will,” “should,” “expect,” “plan,” “anticipate,” “intend,” “believe,” “estimate,” “predict,” “potential,” “continue,” “could,” “future” or the negative of those terms or other words of similar meaning. You should carefully read forward-looking statements, including statements that contain these words, because they discuss the future expectations or state other “forward-looking” information about BNCN. Such statements involve inherent risks and uncertainties, many of which are difficult to predict and are generally beyond the control of BNCN. Forward-looking statements speak only as of the date they are made and BNCN assumes no duty to update such statements. In addition to factors previously disclosed in reports filed by BNCN with the Securities and Exchange Commission (“SEC”), additional risks and uncertainties may include, but are not limited to: the possibility that any of the anticipated benefits of the proposed mergers will not be realized or will not be realized within the expected time period; the risk that integration of operations with those of BNCN will be materially delayed or will be more costly or difficult than expected; the inability to complete the mergers due to the failure of shareholder approval to adopt the respective merger agreements; the failure to satisfy other conditions to completion of the mergers, including receipt of required regulatory and other approvals; the failure of the proposed mergers to close for any other reason; the effect of the announcement of the mergers on customer relationships and operating results; the possibility that the mergers may be more expensive to complete than anticipated, including as a result of unexpected factors or events; and general competitive, economic, political and market conditions and fluctuations. As stated previously, additional factors affecting BNCN are discussed in BNCN’s Annual Report on Form 10-K, its Quarterly Reports on Form 10-Q and its Current Reports on Form 8-K, filed with the SEC. Please refer to the SEC’s website at www.sec.gov where you can review those documents.


