 HUDSON HIGHLAND GROUP Q1 2009 EARNINGS CALL May 5, 2009 Exhibit 99.1 |
 2 Forward Looking Statements Please be advised that except for historical information, the statements made during this presentation and in these slides constitute forward- looking statements under applicable securities laws. Such forward-looking statements involve certain risks and uncertainties, including statements regarding the company's strategic direction, prospects and future results. Certain factors, including factors outside of our control, may cause actual results to differ materially from those contained in the forward-looking statements, including economic and other conditions in the markets in which we operate, risks associated with acquisitions, competition, seasonality and the other risks discussed in our filings made with the Securities and Exchange Commission. These forward-looking statements speak only as of the date of this presentation. The company assumes no obligation, and expressly disclaims any obligation, to review or confirm analysts' expectations or estimates or to update any forward-looking statements, whether as a result of new information, future events or otherwise. |
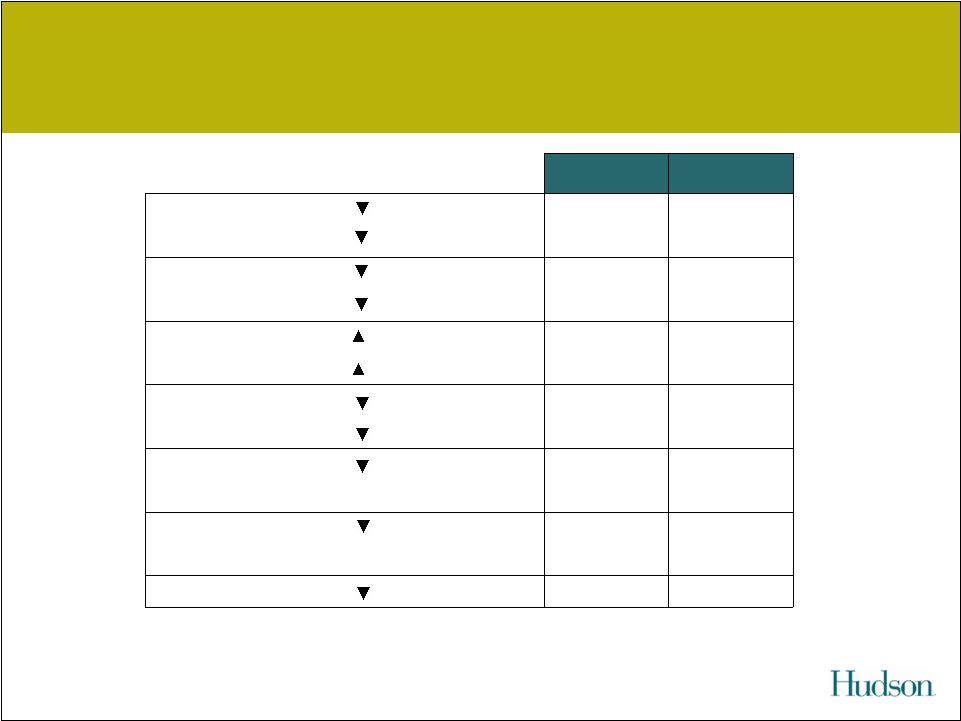 3 Q1 2009 Consolidated Financial Results $US in Millions (1) Adjusted EBITDA is a non-GAAP measure defined as earnings before interest, income taxes, depreciation, amortization, and also excludes merger and integration costs, business reorganization, acquisition-related compensation and impaired goodwill. A reconciliation of EBITDA to operating income (loss) is included in the presentation. (2) CC represents constant currency variance. $117.3 $72.3 38% SG&A CC 26% $0.05 ($0.22) Diluted EPS $1.4 ($5.6) Net Income $1.6 ($19.7) Op Income CC 249% $6.8 ($10.0) 246% Adj. EBITDA (1) CC 39% $124.2 $62.3 50% Gross Margin CC 31% $294.0 $165.0 44% Revenue Q1 2008 Q1 2009 B / W |
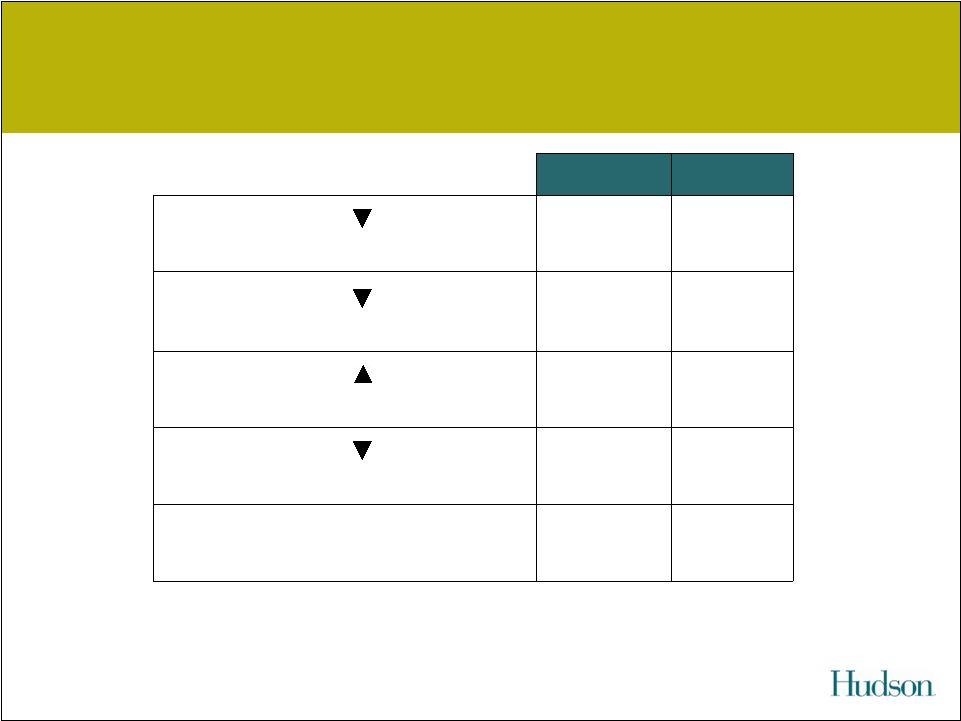 4 Q1 2009 Regional Data – Hudson Americas (1) Adjusted EBITDA is a non-GAAP measure defined as earnings before interest, income taxes, depreciation, amortization, and also excludes merger and integration costs, business reorganization, acquisition-related compensation and impaired goodwill. A reconciliation of EBITDA to operating income (loss) is included in the presentation. $21.6 $14.1 35% SG&A 1.5% (7.2%) Adj. EBITDA % $1.2 ($3.2) Adj. EBITDA (1) $22.8 $11.0 52% Gross Margin $83.3 $44.0 47% Revenue Q1 2008 Q1 2009 $US in Millions B / W |
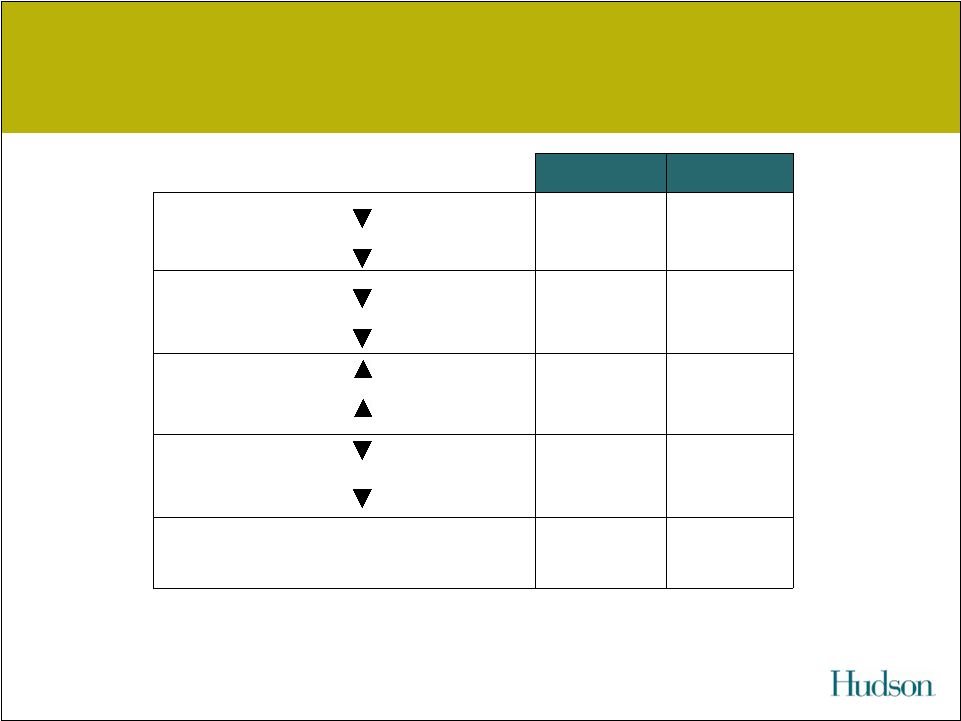 5 $52.7 $32.0 39% SG&A CC 24% 5.2% (2.1%) Adj. EBITDA % CC 134% $5.8 ($1.4) 124% Adj. EBITDA (1) CC 35% $58.5 $30.6 48% Gross Margin CC 24% $111.3 $66.2 41% Revenue Q1 2008 Q1 2009 Q1 2009 Regional Data – Hudson Europe (1) Adjusted EBITDA is a non-GAAP measure defined as earnings before interest, income taxes, depreciation, amortization, and also excludes merger and integration costs, business reorganization, acquisition-related compensation and impaired goodwill. A reconciliation of EBITDA to operating income (loss) is included in the presentation. $US in Millions B / W |
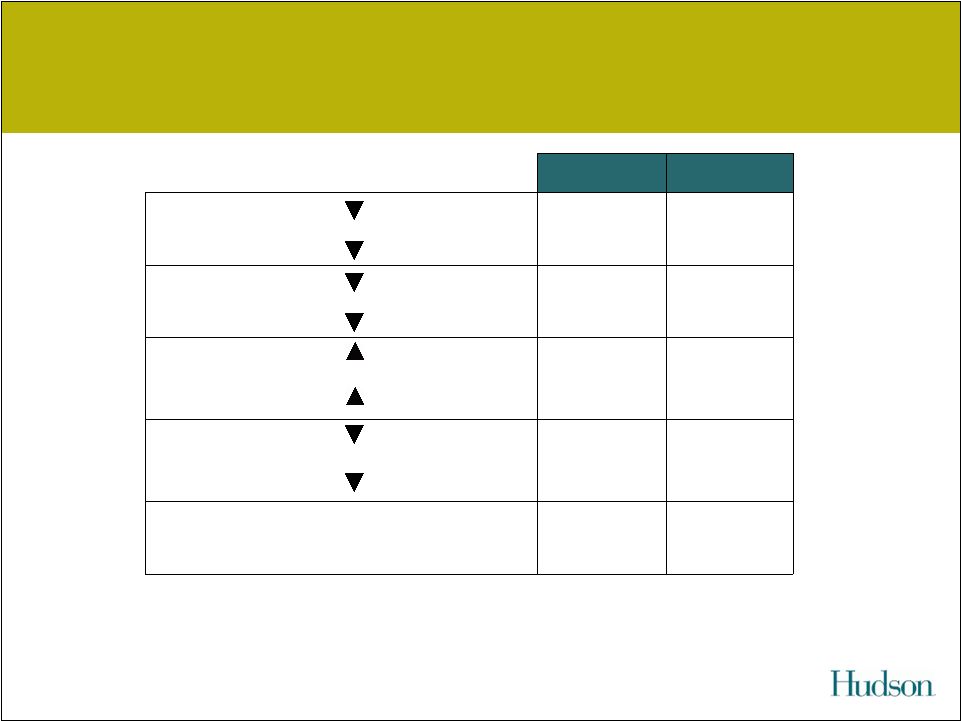 6 Q1 2009 Regional Data – Hudson Asia Pacific (1) Adjusted EBITDA is a non-GAAP measure defined as earnings before interest, income taxes, depreciation, amortization, and also excludes merger and integration costs, business reorganization, acquisition-related compensation and impaired goodwill. A reconciliation of EBITDA to operating income (loss) is included in the presentation. $37.1 $21.4 42% SG&A CC 26% 5.8% (1.3%) Adj. EBITDA % CC 105% $5.8 ($0.7) 112% Adj. EBITDA (1) CC 37% $42.9 $20.7 52% Gross Margin CC 25% $99.4 $54.7 45% Revenue Q1 2008 Q1 2009 $US in Millions B / W |
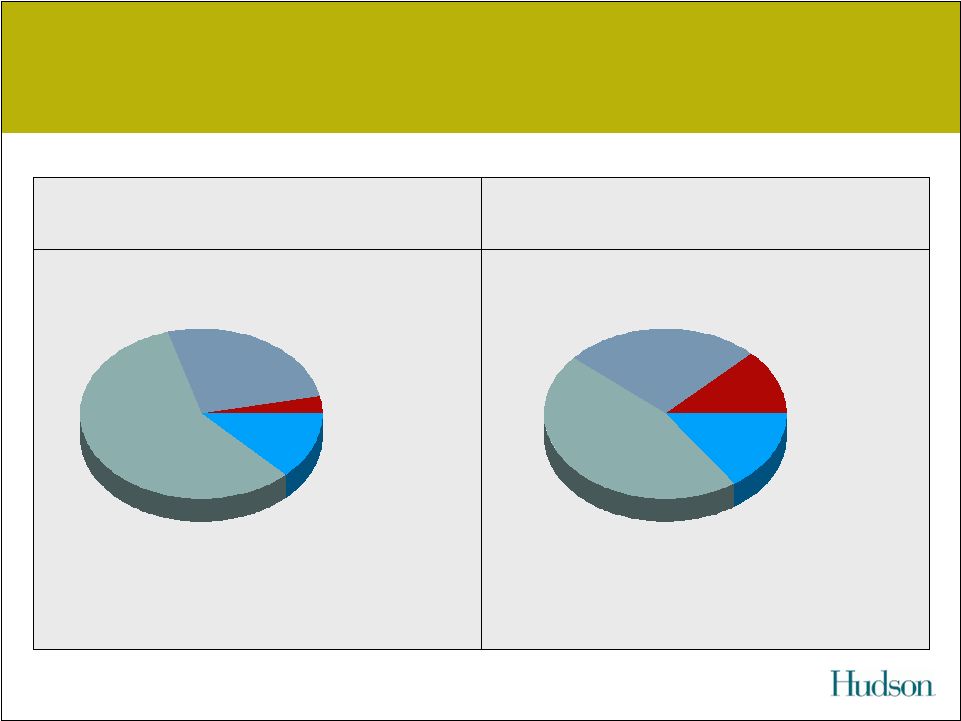
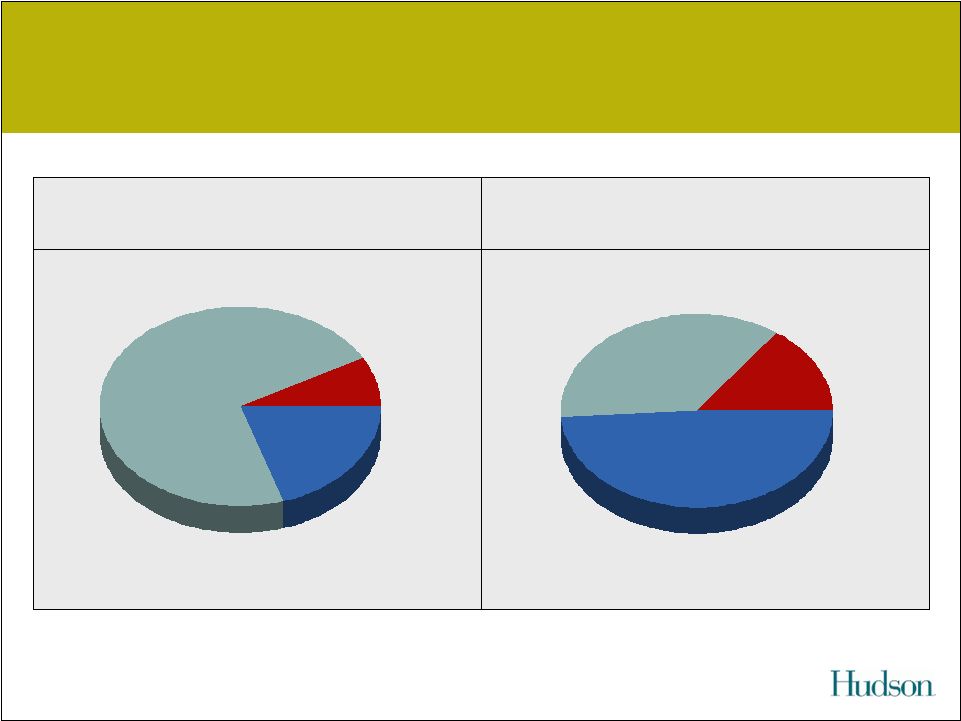 7 Q1 2009 Global Product Split Q1 2009 Gross Margin 43% 17% 40% Permanent Recruitment Temporary Contracting Talent Mgmt. 77% Temporary Contracting Permanent Recruitment Talent Mgmt. 16% 7% Q1 2009 Revenue (1) Product percentages above include “other revenue” or “other gross margin,” which are allocated to each category based on its percentage of total revenue or gross margin excluding “other revenue” or “other gross margin.” |
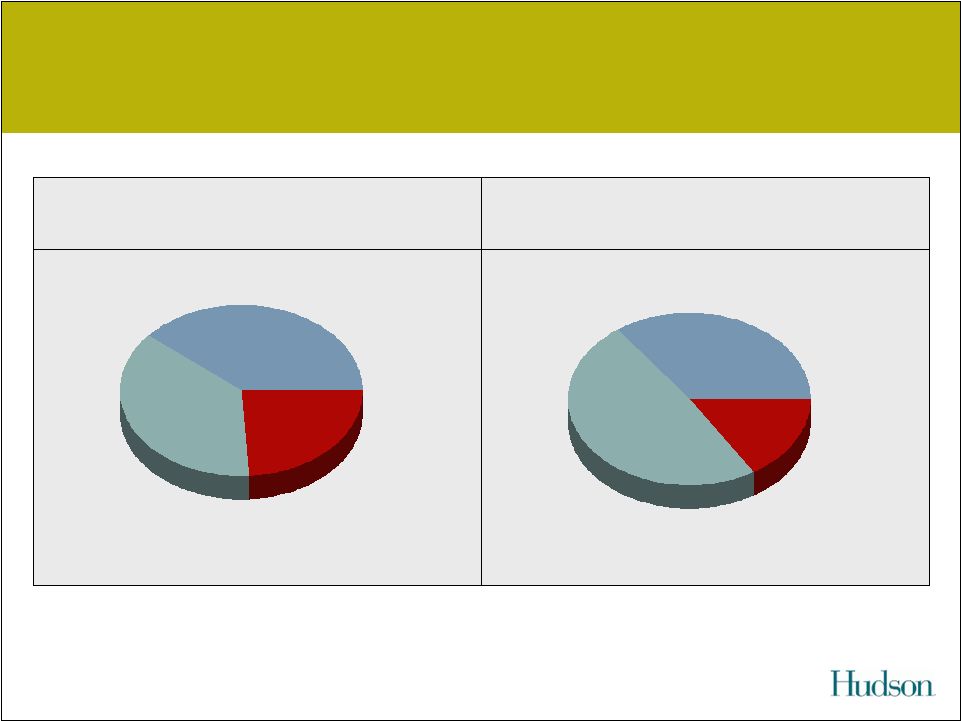 8 Q1 2009 Regional Split Q1 2009 Gross Margin Europe Asia Pacific Americas 49% 33% 18% Q1 2009 Revenue Europe Asia Pacific Americas 40% 33% 27% |
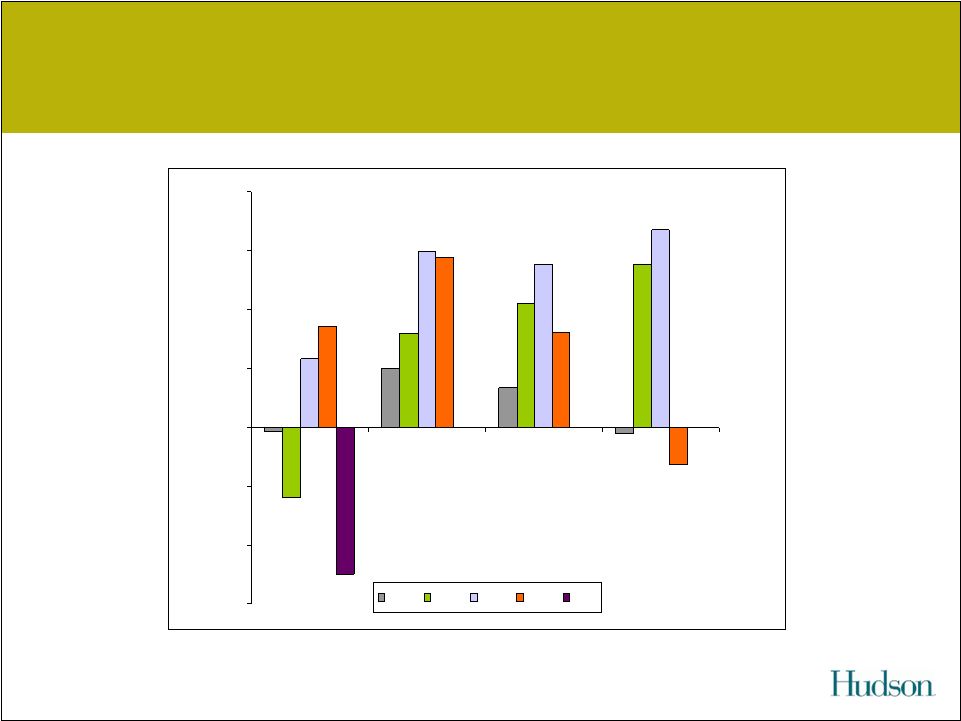 9 (1) Adjusted EBITDA is a non-GAAP measure defined as earnings before interest, income taxes, depreciation, amortization, and also excludes merger and integration costs, business reorganization, acquisition-related compensation and impaired goodwill. A reconciliation of EBITDA to operating income (loss) is included in the presentation. Adjusted EBITDA Progress $US in Millions ($0.4) $11.1 $13.4 $2.7 $4.0 ($0.3) $6.4 $8.4 $11.1 $(4.8) $4.7 $12.0 ($2.6) $6.5 $11.5 $6.8 $(10.0) (12.0) (8.0) (4.0) 0.0 4.0 8.0 12.0 16.0 Q1 Q2 Q3 Q4 2005 2006 2007 2008 2009 |
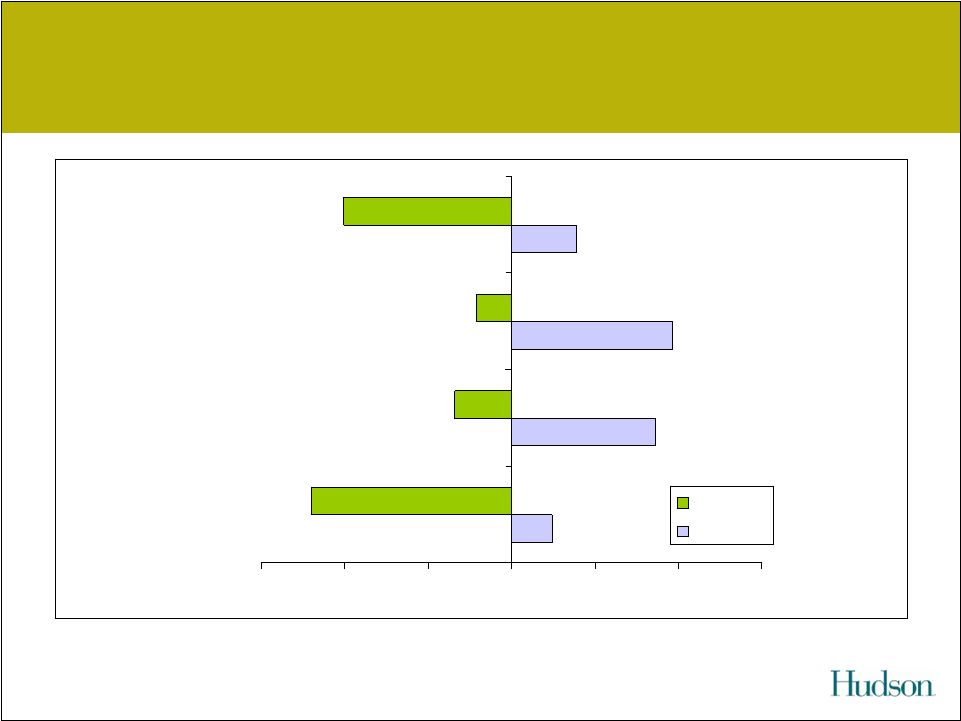 10 Q1 2009 vs Q1 2008 – Regional Adj. EBITDA Margin (1) Adjusted EBITDA is a non-GAAP measure defined as earnings before interest, income taxes, depreciation, amortization, and also excludes merger and integration costs, business reorganization, acquisition-related compensation and impaired goodwill. -2.1% -1.3% -6.1% 5.8% 5.2% 1.5% 2.3% -7.2% -9.0% -6.0% -3.0% 0.0% 3.0% 6.0% 9.0% Hudson Americas Hudson Europe Hudson Asia Pacific Total Q1 2009 Q1 2008 |
 11 Balance Sheet - Select Items $US in Millions 108 103 Shareholders' Equity $5 $11 Short-term Borrowings December 31, 2008 March 31, 2009 Selected Liabilities 128 104 Accounts Receivables $49 $46 Cash December 31, 2008 March 31, 2009 Selected Assets |
 12 Q1 Cash Flow Summary $US in Millions QTD QTD Mar-09 Mar-08 Net (loss) income (5.6) $ 1.4 $ Depreciation and amortization 3.8 4.0 Stock-based compensation 0.4 1.1 Gain on asset disposition (11.6) (2.8) Change in accounts receivable 23.0 (12.1) Change in accounts payable and other liabilities (18.4) (9.6) Other 0.8 (2.0) Cash from operations (7.6) (20.2) Capital expenditures (0.5) (2.2) Free cash flow (8.1) (22.3) Payments for acquisitions and intangibles, net - (0.6) Proceeds from the sale of assets - 11.0 Net borrowings (repayments) 6.0 1.6 Purchase of treasury shares (0.7) (5.3) Other (0.1) 0.0 Effect of exchange rates (0.1) 1.6 Change in cash (2.9) (14.0) |
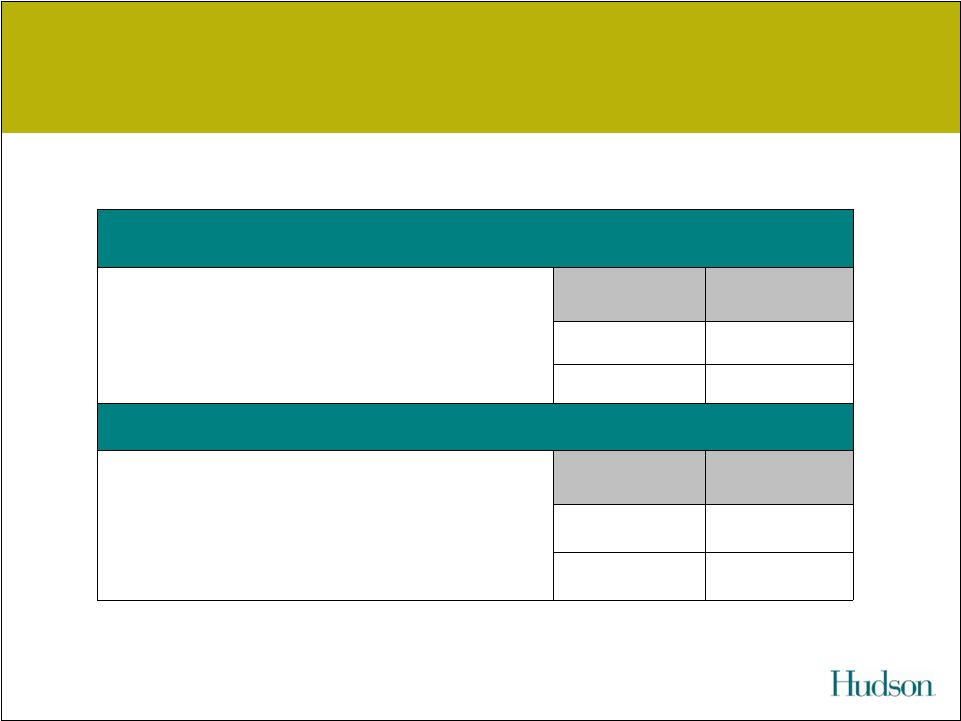
 13 Q1 2009: Hudson Americas Practice Groups Q1 2009 Revenue Legal IT&T 58% 26% 13% 3% Financial Solutions Q1 2009 Gross Margin Legal Recruitment & Talent Mgmt. 46% 26% 15% 13% Financial Solutions IT&T Recruitment & Talent Mgmt. |
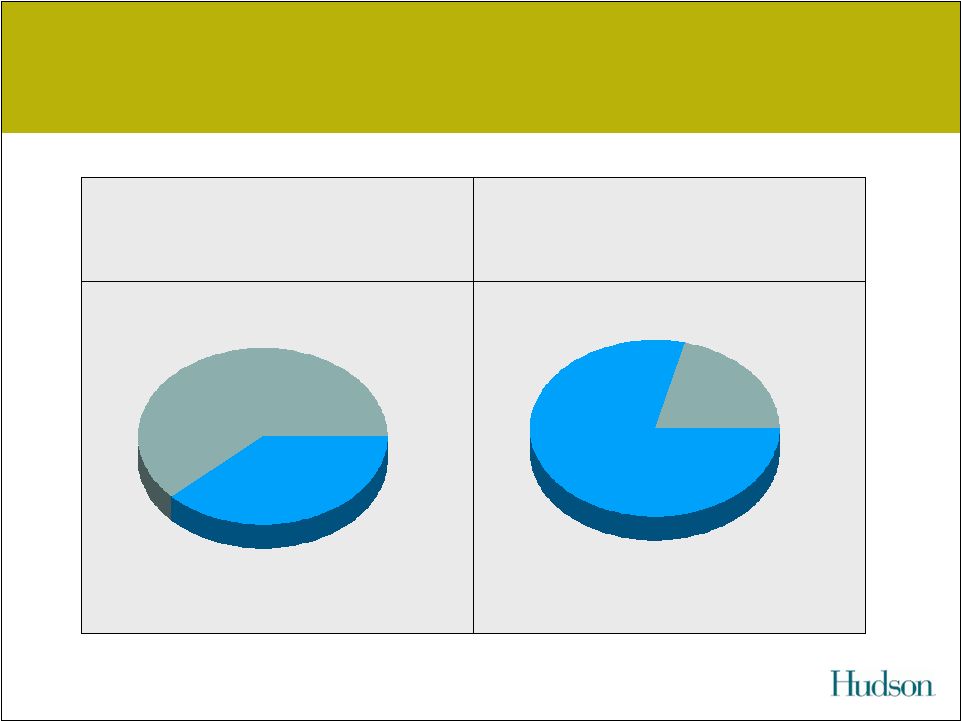 14 Q1 Regional Gross Margin Composition: Europe Q1 2009 Gross Margin: United Kingdom Continental Europe Asia Pacific Q1 2009 Gross Margin: Australia / New Zealand Asia 62% 38% 79% 21% |
 15 Q1 Temporary Contracting Gross Margin by Region 21.6% 20.5% HHGP Total 17.4% 16.8% Asia Pacific 23.0% 22.8% Europe 24.0% 21.7% Americas Q1 2008 Q1 2009 |
 |
 17 Appendix |
 18 Q1 09 - Regional Gross Margin Mix 15% 55% 30% Asia Pacific 40% 90% 40% 45% 45% 45% 15% Perm 35% 20% Cont Europe 20% 40% ANZ 10% -- Asia 20% 40% HHGP Total 5% 50% UK 25% 30% Europe -- 85% Americas Talent Mgmt Temp Approximate mix of gross margin by product around the globe |
 19 EBITDA Reconciliation, Full Year $US in Millions (1) Adjusted EBITDA is a non-GAAP measure defined as earnings before interest, income taxes, depreciation, amortization, and also excludes merger and integration costs, business reorganization, acquisition-related compensation and impaired goodwill. A reconciliation of EBITDA to operating income (loss) is included in the presentation. 2008 Americas Europe Asia Pac Corp Total Revenue 273.6 411.5 389.6 - 1,074.7 Gross margin 75.0 216.3 167.4 - 458.6 Adjusted EBITDA (1) 4.0 23.0 23.5 (28.3) 22.3 Acquisition-related exp - - - - - Reorg expense 3.1 3.0 4.3 1.0 11.4 M&I expense 0.0 0.0 - - 0.0 Goodwill and other impairment charges 40.7 19.6 6.7 - 67.1 EBITDA (1) (39.8) 0.4 12.5 (29.3) (56.2) D&A 4.6 5.8 4.0 0.2 14.7 Operating income (loss) (44.4) (5.4) 8.5 (29.5) (70.9) 2007 Americas Europe Asia Pac Corp Total Revenue 291.5 466.4 409.1 - 1,167.0 Gross margin 87.5 237.5 175.0 - 500.0 Adjusted EBITDA (1) (0.1) 33.4 34.4 (26.5) 41.1 Acquisition-related exp 3.6 1.7 - - 5.3 Reorg expense 0.5 2.4 (0.0) 1.4 4.4 M&I expense (0.1) - - (0.7) (0.8) EBITDA (1) (4.2) 29.2 34.4 (27.2) 32.2 D&A 4.4 6.0 3.7 0.3 14.4 Operating income (loss) (8.5) 23.1 30.7 (27.5) 17.8 Hudson Hudson 2006 Americas Europe Asia Pac Corp Total Revenue 306.7 454.4 382.0 - 1,143.1 Gross margin 91.5 207.6 148.9 - 447.9 Adjusted EBITDA (1) (5.4) 24.9 29.3 (27.7) 21.1 Acquisition-related exp - 1.7 - - 1.7 Reorg expense 1.8 2.7 0.7 0.7 5.9 M&I expense 0.4 0.0 (0.0) - 0.4 EBITDA (1) (7.6) 20.5 28.6 (28.4) 13.2 D&A 6.3 6.9 2.9 3.4 19.5 Operating income (loss) (13.9) 13.7 25.7 (31.8) (6.3) 2005 Americas Europe Asia Pac Corp Total Revenue 291.2 450.0 378.4 - 1,119.6 Gross margin 91.5 189.1 143.8 - 424.4 Adjusted EBITDA (1) 5.0 12.6 26.1 (37.4) 6.2 Acquisition-related exp - - - - - Reorg expense 0.5 (0.0) 0.0 - 0.5 M&I expense (0.0) - (0.0) - (0.1) EBITDA (1) 4.5 12.6 26.1 (37.4) 5.8 D&A 5.1 4.3 6.3 0.6 16.3 Operating income (loss) (0.6) 8.3 19.7 (38.0) (10.5) Hudson Hudson |
 20 EBITDA Reconciliation, Q1 $US in Millions (1) Adjusted EBITDA is a non-GAAP measure defined as earnings before interest, income taxes, depreciation, amortization, and also excludes merger and integration costs, business reorganization, acquisition-related compensation and impaired goodwill. A reconciliation of EBITDA to operating income (loss) is included in the presentation. Q1 2007 Americas Europe Asia Pac Corp Total Revenue 76.5 117.0 91.7 - 285.3 Gross margin 22.1 56.6 37.1 - 115.8 Adjusted EBITDA (1) (1.4) 6.6 5.7 (6.2) 4.7 Acquisition-related exp - 0.3 - 0.3 Reorg expense 0.7 2.4 - (0.1) 3.1 M&I expense - - - - - EBITDA (1) (2.1) 3.8 5.7 (6.2) 1.2 D&A 1.1 1.6 0.8 0.1 3.6 Operating income (loss) (3.2) 2.2 4.9 (6.3) (2.4) Q1 2006 Americas Europe Asia Pac Corp Total Revenue 72.8 110.3 88.6 - 271.7 Gross margin 18.4 48.6 33.7 - 100.7 Adjusted EBITDA (1) (6.8) 5.4 4.4 (7.9) (4.8) Acquisition-related exp - - - - - Reorg expense - - (0.0) - (0.0) M&I expense - - - - - EBITDA (1) (6.8) 5.4 4.4 (7.9) (4.8) D&A 1.5 1.6 0.7 0.2 4.0 Operating income (loss) (8.2) 3.8 3.8 (8.1) (8.8) Hudson Hudson Q1 2009 Americas Europe Asia Pac Corp Total Revenue 44.0 66.2 54.7 - 165.0 Gross margin 11.0 30.6 20.7 - 62.3 Adjusted EBITDA (1) (3.2) (1.4) (0.7) (4.7) (10.0) Acquisition-related exp - - - - - Reorg expense 1.6 2.4 1.9 - 5.9 M&I expense - - - - - EBITDA (1) (4.8) (3.8) (2.6) (4.7) (15.9) D&A 1.0 1.8 0.9 0.1 3.8 Operating income (loss) (5.8) (5.6) (3.5) (4.8) (19.7) Q1 2008 Americas Europe Asia Pac Corp Total Revenue 83.3 111.3 99.4 - 294.0 Gross margin 22.8 58.5 42.9 - 124.2 Adjusted EBITDA (1) 1.2 5.8 5.8 (5.9) 6.8 Acquisition-related exp - - - - - Reorg expense 1.5 (0.2) 0.1 - 1.3 M&I expense (0.0) 0.1 - - 0.1 EBITDA (1) (0.2) 5.9 5.7 (5.9) 5.4 D&A 1.2 1.6 1.0 0.1 3.8 Operating income (loss) (1.4) 4.3 4.7 (6.0) 1.6 Hudson Hudson |
 21 EBITDA Reconciliation, Q1 $US in Millions (1) Adjusted EBITDA is a non-GAAP measure defined as earnings before interest, income taxes, depreciation, amortization, and also excludes merger and integration costs, business reorganization, acquisition-related compensation and impaired goodwill. A reconciliation of EBITDA to operating income (loss) is included in the presentation. Q1 2005 Americas Europe Asia Pac Corp Total Revenue 74.5 114.2 88.1 - 276.8 Gross margin 22.6 47.4 32.4 - 102.4 Adjusted EBITDA (1) 0.9 3.1 5.9 (10.1) (0.3) Acquisition-related exp - - - - - Reorg expense 0.6 (0.1) (0.0) - 0.5 M&I expense (0.0) - - - (0.0) EBITDA (1) 0.3 3.2 5.9 (10.1) (0.8) D&A 0.9 0.9 2.4 0.1 4.4 Operating income (loss) (0.6) 2.3 3.5 (10.3) (5.1) Hudson |
 22 EBITDA Reconciliation, Q2 $US in Millions (1) Adjusted EBITDA is a non-GAAP measure defined as earnings before interest, income taxes, depreciation, amortization, and also excludes merger and integration costs, business reorganization, acquisition-related compensation and impaired goodwill. A reconciliation of EBITDA to operating income (loss) is included in the presentation. Q2 2008 Americas Europe Asia Pac Corp Total Revenue 71.5 116.8 115.9 - 304.3 Gross margin 20.2 64.5 50.9 - 135.6 Adjusted EBITDA (1) 1.7 10.0 9.0 (9.2) 11.5 Acquisition-related exp - - - - - Reorg expense 0.2 0.8 - - 1.1 M&I expense 0.0 (0.1) - - (0.0) EBITDA (1) 1.5 9.2 9.0 (9.2) 10.5 D&A 1.2 1.3 1.0 0.1 3.5 Operating income (loss) 0.3 7.9 8.0 (9.3) 7.0 Q2 2007 Americas Europe Asia Pac Corp Total Revenue 70.8 120.8 103.6 - 295.2 Gross margin 21.2 62.7 44.1 - 128.0 Adjusted EBITDA (1) (1.3) 10.6 9.2 (6.5) 12.0 Acquisition-related exp 3.6 0.3 - - 3.9 Reorg expense (0.0) (0.0) 0.0 1.6 1.6 M&I expense (0.0) - - - (0.0) EBITDA (1) (4.8) 10.3 9.2 (8.1) 6.6 D&A 1.2 1.6 0.9 0.1 3.8 Operating income (loss) (6.0) 8.7 8.3 (8.2) 2.8 Hudson Hudson Q2 2006 Americas Europe Asia Pac Corp Total Revenue 80.2 116.5 96.6 - 293.2 Gross margin 23.8 54.0 38.8 - 116.6 Adjusted EBITDA (1) (3.0) 7.9 8.3 (6.8) 6.4 Acquisition-related exp - - - - - Reorg expense 0.2 (0.1) - 0.3 0.5 M&I expense 0.1 - - - 0.1 EBITDA (1) (3.3) 8.0 8.3 (7.2) 5.8 D&A 1.3 1.7 0.7 0.2 3.8 Operating income (loss) (4.5) 6.3 7.6 (7.3) 2.0 Q2 2005 Americas Europe Asia Pac Corp Total Revenue 71.4 116.0 101.2 - 288.6 Gross margin 22.3 50.1 38.9 - 111.3 Adjusted EBITDA (1) 0.6 4.2 8.5 (9.4) 4.0 Acquisition-related exp - - - - - Reorg expense (0.1) - - - (0.1) M&I expense 0.0 - - - 0.0 EBITDA (1) 0.7 4.2 8.5 (9.4) 4.1 D&A 1.0 0.8 2.1 0.1 4.1 Operating income (loss) (0.3) 3.4 6.4 (9.5) (0.1) Hudson Hudson |
 23 EBITDA Reconciliation, Q3 $US in Millions (1) Adjusted EBITDA is a non-GAAP measure defined as earnings before interest, income taxes, depreciation, amortization, and also excludes merger and integration costs, business reorganization, acquisition-related compensation and impaired goodwill. A reconciliation of EBITDA to operating income (loss) is included in the presentation. Q3 2006 Americas Europe Asia Pac Corp Total Revenue 79.4 114.4 102.2 - 296.0 Gross margin 24.9 51.0 39.8 - 115.7 Adjusted EBITDA (1) 2.0 4.2 9.6 (7.4) 8.4 Acquisition-related exp - 0.8 - - 0.8 Reorg expense 1.2 0.6 0.1 0.2 2.1 M&I expense 0.0 0.0 - - 0.0 EBITDA (1) 0.8 2.8 9.6 (7.6) 5.5 D&A 1.1 1.7 0.7 0.2 3.7 Operating income (loss) (0.3) 1.1 8.9 (7.8) 1.9 Q3 2005 Americas Europe Asia Pac Corp Total Revenue 73.7 109.9 99.8 - 283.3 Gross margin 23.5 45.4 37.7 - 106.5 Adjusted EBITDA (1) 2.1 2.8 7.5 (9.8) 2.7 Acquisition-related exp - - - - - Reorg expense - - - - - M&I expense - - - - - EBITDA (1) 2.1 2.8 7.5 (9.8) 2.7 D&A 1.7 0.9 0.9 0.1 3.7 Operating income (loss) 0.4 1.9 6.6 (9.9) (1.0) Hudson Hudson Q3 2008 Americas Europe Asia Pac Corp Total Revenue 66.5 99.1 104.5 - 270.1 Gross margin 18.0 50.5 45.0 - 113.5 Adjusted EBITDA (1) 1.6 3.2 7.6 (6.0) 6.5 Acquisition-related exp - - - - - Reorg expense 0.1 0.8 1.9 - 2.8 M&I expense (0.0) 0.0 - - 0.0 EBITDA (1) 1.5 2.4 5.7 (6.0) 3.6 D&A 1.2 1.5 1.2 0.1 3.9 Operating income (loss) 0.3 0.9 4.6 (6.1) (0.3) Q3 2007 Americas Europe Asia Pac Corp Total Revenue 75.7 115.0 108.5 - 299.2 Gross margin 23.2 58.4 46.7 - 128.3 Adjusted EBITDA (1) 1.4 6.1 10.4 (6.8) 11.1 Acquisition-related exp - 0.3 - - 0.3 Reorg expense (0.1) (0.0) (0.0) 0.0 (0.1) M&I expense (0.0) - - (0.7) (0.8) EBITDA (1) 1.4 5.7 10.4 (6.0) 11.6 D&A 1.0 1.5 1.0 0.0 3.5 Operating income (loss) 0.4 4.3 9.4 (6.1) 8.1 Hudson Hudson |
 24 EBITDA Reconciliation, Q4 $US in Millions (1) Adjusted EBITDA is a non-GAAP measure defined as earnings before interest, income taxes, depreciation, amortization, and also excludes merger and integration costs, business reorganization, acquisition-related compensation and impaired goodwill. A reconciliation of EBITDA to operating income (loss) is included in the presentation. Q4 2008 Americas Europe Asia Pac Corp Total Revenue 52.4 84.2 69.8 - 206.4 Gross margin 14.0 42.8 28.6 - 85.4 Adjusted EBITDA (1) (0.5) 4.0 1.1 (7.1) (2.6) Acquisition-related exp - - - - - Reorg expense 1.2 1.6 2.3 1.0 6.2 M&I expense - 0.0 - - 0.0 Goodwill and other impairment charges 40.7 19.6 6.7 - 67.1 EBITDA (1) (42.5) (17.2) (8.0) (8.1) (75.8) D&A 1.1 1.3 0.9 0.1 3.4 Operating income (loss) (43.6) (18.5) (8.9) (8.2) (79.2) Q4 2007 Americas Europe Asia Pac Corp Total Revenue 68.5 113.6 105.3 - 287.3 Gross margin 21.0 59.8 47.1 - 127.9 Adjusted EBITDA (1) 1.2 10.1 9.1 (7.0) 13.4 Acquisition-related exp - 0.8 - - 0.8 Reorg expense (0.1) (0.0) (0.0) (0.1) (0.3) M&I expense 0.0 - - 0.0 0.0 EBITDA (1) 1.3 9.3 9.1 (6.9) 12.8 D&A 1.1 1.4 1.0 0.0 3.5 Operating income (loss) 0.3 7.9 8.1 (6.9) 9.3 Hudson Hudson Q4 2006 Americas Europe Asia Pac Corp Total Revenue 74.3 113.2 94.6 - 282.2 Gross margin 24.4 53.9 36.6 - 114.9 Adjusted EBITDA (1) 2.3 7.4 6.9 (5.5) 11.1 Acquisition-related exp - 0.9 - - 0.9 Reorg expense 0.3 2.2 0.7 0.1 3.3 M&I expense 0.3 - (0.0) - 0.3 EBITDA (1) 1.7 4.3 6.3 (5.7) 6.6 D&A 2.5 1.8 0.8 2.9 8.0 Operating income (loss) (0.8) 2.5 5.5 (8.6) (1.4) Q4 2005 Americas Europe Asia Pac Corp Total Revenue 71.6 110.0 87.1 - 268.7 Gross margin 23.1 46.2 32.6 - 101.9 Adjusted EBITDA (1) 1.4 2.5 3.8 (8.2) (0.4) Acquisition-related exp - - - - - Reorg expense - 0.0 0.0 - 0.1 M&I expense - - (0.0) - (0.0) EBITDA (1) 1.4 2.4 3.8 (8.2) (0.4) D&A 1.4 1.7 0.9 0.2 4.2 Operating income (loss) (0.0) 0.7 3.0 (8.3) (4.6) Hudson Hudson |