UNITED STATES
SECURITIES AND EXCHANGE COMMISSION
Washington, D.C. 20549
FORM 10-K
ý | ANNUAL REPORT PURSUANT TO SECTION 13 OR 15(d) OF THE SECURITIES EXCHANGE ACT OF 1934 | |
For the fiscal year ended January 31, 2009 | ||
OR | ||
o | TRANSITION REPORT PURSUANT TO SECTION 13 OR 15(d) OF THE SECURITIES EXCHANGE ACT OF 1934 | |
For the transition period from to | ||
Commission File Number 1-32315
NEW YORK & COMPANY, INC.
(Exact name of registrant as specified in its charter)
| DELAWARE (State or other jurisdiction of incorporation or organization) | 33-1031445 (I.R.S. Employer Identification No.) | |
450 West 33rd Street, 5th Floor, NEW YORK, NEW YORK (Address of principal executive offices) | 10001 (Zip Code) |
(212) 884-2000
(Registrant's telephone number, including area code)
Securities registered pursuant to Section 12(b) of the Act:
| Title of each class | Name of each exchange on which registered | |
|---|---|---|
| Common Stock, par value $0.001 per share | New York Stock Exchange |
Securities registered pursuant to Section 12(g) of the Act:None.
(Title of Class)
Indicate by check mark if the registrant is a well-known seasoned issuer, as defined in Rule 405 of the Securities Act. Yes o No ý
Indicate by check mark if the registrant is not required to file reports pursuant to Section 13 or 15(d) of the Act. Yes o No ý
Indicate by check mark whether the registrant (1) has filed all reports required to be filed by Section 13 or 15(d) of the Exchange Act during the preceding 12 months (or for such shorter period that the registrant was required to file such reports), and (2) has been subject to such filing requirements for the past 90 days. Yes ý No o
Indicate by check mark if disclosure of delinquent filers pursuant to Item 405 of Regulation S-K is not contained herein, and will not be contained, to the best of registrant's knowledge, in definitive proxy or information statements incorporated by reference in Part III of this Form 10-K or any amendment to this Form 10-K. ý
Indicate by check mark if the registrant is a large accelerated filer, an accelerated filer, a non-accelerated filer, or a smaller reporting company. See the definitions of "large accelerated filer," "accelerated filer" and "smaller reporting company" in Rule 12b-2 of the Exchange Act. (Check one):
| Large accelerated filer o | Accelerated filer ý | Non-accelerated filer o (Do not check if a smaller reporting company) | Smaller reporting company o |
Indicate by check mark whether the registrant is a shell company (as defined in Rule 12b-2 of the Exchange Act). Yeso Noý
The aggregate market value of common stock held by non-affiliates as of August 1, 2008 was approximately $255.7 million, using the closing price per share of $9.85, as reported on the New York Stock Exchange as of such date.
The number of shares of registrant's common stock outstanding as of March 31, 2009 was 60,385,782.
DOCUMENTS INCORPORATED BY REFERENCE:
Part III incorporates certain information by reference to the Proxy Statement for the 2009 Annual Meeting of Stockholders.
ANNUAL REPORT ON FORM 10-K INDEX
| | | Page | |||
|---|---|---|---|---|---|
PART I. | |||||
Item 1. | Business | 3 | |||
Item 1A. | Risk Factors | 10 | |||
Item 1B. | Unresolved Staff Comments | 20 | |||
Item 2. | Properties | 20 | |||
Item 3. | Legal Proceedings | 20 | |||
Item 4. | Submission of Matters to a Vote of Security Holders | 20 | |||
PART II. | |||||
Item 5. | Market for Registrant's Common Equity, Related Stockholder Matters and Issuer Purchases of Equity Securities | 21 | |||
Item 6. | Selected Financial Data | 24 | |||
Item 7. | Management's Discussion and Analysis of Financial Condition and Results of Operations | 26 | |||
Item 7A. | Quantitative and Qualitative Disclosures About Market Risk | 43 | |||
Item 8. | Financial Statements and Supplementary Data | 43 | |||
Item 9. | Changes in and Disagreements with Accountants on Accounting and Financial Disclosure | 43 | |||
Item 9A. | Controls and Procedures | 43 | |||
Item 9A(T). | Controls and Procedures | 44 | |||
Item 9B. | Other Information | 44 | |||
PART III. | |||||
Item 10. | Directors, Executive Officers and Corporate Governance | 45 | |||
Item 11. | Executive Compensation | 45 | |||
Item 12. | Security Ownership of Certain Beneficial Owners and Management and Related Stockholder Matters | 45 | |||
Item 13. | Certain Relationships and Related Transactions, and Director Independence | 45 | |||
Item 14. | Principal Accountant Fees and Services | 45 | |||
PART IV. | |||||
Item 15. | Exhibits and Financial Statement Schedules | 46 | |||
2
Overview
New York & Company, Inc. (together with its subsidiaries, collectively the "Company") is a leading specialty retailer of fashion-oriented, moderately-priced women's apparel. The Company designs and sources its proprietary branded New York & Company™ merchandise sold exclusively through its national network of retail stores and E-commerce store atwww.nyandcompany.com. The target customers for the Company's New York & Company merchandise are fashion-conscious, value-sensitive women between the ages of 25 and 45. As of January 31, 2009, the Company operated 589 stores with 3.295 million selling square feet in 44 states.
The Company offers a merchandise assortment consisting of casual and wear-to-work apparel and accessories, including pants, jackets, knit tops, blouses, sweaters, denim, t-shirts, activewear, handbags and jewelry. The Company's merchandise reflects current fashions and fulfills a broad spectrum of its customers' lifestyle and wardrobe requirements.
The Company positions its stores as a source of fashion, quality and value by providing its customers with an appealing merchandise assortment at attractive price points, generally below those of department stores and other specialty retailers. The Company believes its stores create an exciting shopping experience through the use of compelling window displays, creative and coordinated merchandise presentations and in-store promotional signage. The Company's stores are typically concentrated in large population centers of the United States and are located in shopping malls, lifestyle centers and off-mall locations, including urban street locations.
The Company was founded in 1918 and operated as a subsidiary of Limited Brands, Inc. ("Limited Brands") from 1985 to 2002. New York & Company, Inc., formerly known as NY & Co. Group, Inc., was incorporated in the state of Delaware on November 8, 2002. It was formed to acquire all of the outstanding stock of Lerner New York Holding, Inc. ("Lerner Holding") and its subsidiaries from Limited Brands, an unrelated company. On November 27, 2002, Irving Place Capital, formerly known as Bear Stearns Merchant Banking, completed the acquisition of Lerner Holding and its subsidiaries from Limited Brands (the "acquisition of Lerner Holding"). On October 6, 2004, the Company completed an initial public offering and listed its common stock on the New York Stock Exchange.
On October 18, 2007, the Company announced its decision to close all of the stores operated by the Company's subsidiary, Jasmine Company, Inc. ("JasmineSola"), by February 2, 2008. JasmineSola was a women's retailer of upscale and contemporary apparel, footwear and accessories sold through its chain of JasmineSola™ branded stores, which the Company acquired on July 19, 2005. The Company decided to exit the JasmineSola business after a thorough assessment and analysis. This decision enabled the Company to focus financial and management resources on its New York & Company brand. As of February 2, 2008, the Company completed the closure of all of the Company's JasmineSola stores and substantially completed all other exit procedures. As a result, the Company's financial statements reflect JasmineSola as discontinued operations for all periods presented. Unless otherwise noted, the description of the Company's business, financial and store operating data, in this Annual Report on Form 10-K relates to the New York & Company business.
The Company's Growth Strategies
Increase Sales of Apparel and Accessories
The Company intends to continue to grow sales of both apparel and accessories products. The Company believes that it can increase sales of apparel by providing its customers fashion, quality and value with an appealing merchandise assortment at attractive price points. The Company plans to drive higher margin sales with new fashion items and increased focus on its wear-to-work assortments. In an
3
effort to increase accessories sales, the Company has upgraded the fashion and quality of its accessories offerings, with a heightened focus on the jewelry and handbag businesses.
E-commerce Store
In November 2006, the Company launched its E-commerce store to offer customers the opportunity to view and purchase its merchandise on-line atwww.nyandcompany.com. The Company believes that its E-commerce store provides an effective means to reach its existing customers and more importantly attract new customers to the New York & Company brand. The E-commerce store is designed to cater to the customers' lifestyle needs by offering an easy alternative to shop, while also increasing brand awareness. During fiscal year 2008, net sales were $41.0 million, as compared to net sales of $22.3 million for fiscal year 2007. The Company believes that it can continue to grow sales with its E-commerce store by broadening its online assortment with new product exclusives and expanded product extensions. The Company is continuing to develop the infrastructure and functionality of the site to offer more merchandise on the E-commerce store and to enhance customer service on the site.
Expand the Company's Store Base
Increasing market penetration by opening new stores has been an important component of the Company's growth strategies. The Company continues to remodel its existing stores to improve sales productivity and the consistency of the customers' brand experience. The Company opened 25 stores in fiscal year 2008, adding 104,641 selling square feet. During fiscal year 2008, the Company also remodeled 14 stores and closed 14 stores, resulting in a reduction of 137,312 selling square feet. The reduction in non-productive selling square feet is an integral component of the Company's program to improve productivity and profitability. The Company ended the fiscal year operating 589 stores with 3.3 million selling square feet.
The Company continues to view the expansion of its store base and the remodeling of existing stores as a component of its long-term growth strategy; however, in response to the current economic downturn the Company plans to minimize new store openings and the remodeling of existing stores during fiscal year 2009 in order to conserve cash and position itself for growth once the macroeconomic environment begins to improve. The Company intends to continue to open a significant number of new stores in future years, while relocating and remodeling a portion of its existing store base annually.
Enhance Brand Image and Increase Customer Loyalty
The Company seeks to build and enhance the recognition, appeal and reach of its New York & Company brand through its merchandise assortment, customer service, direct marketing and advertising. The Company's brand has gained strong recognition and endorsement by its target customers. The Company believes a nationally recognized brand further drives brand awareness, merchandise sales and customer loyalty.
Design and Merchandising
The Company's product development group, led by its merchant and design teams, is dedicated to consistently delivering to its customers high-quality fashion apparel and accessories at competitive prices. New York & Company stores carry only New York & Company brand merchandise. The Company seeks to provide its customers with key fashion items of the season, as well as a broad assortment of coordinating apparel items and accessories that will complete their wardrobe. The Company's merchandising, marketing and promotional efforts encourage multiple unit and outfit purchases.
New product lines are introduced into the Company's stores in six major deliveries each year (spring, summer, transition, fall, holiday and pre-spring) that are updated with selected new items every four to six weeks to keep the merchandise current. Product line development begins with the introduction of design concepts, key styles and its initial assortment selection for the product line. The
4
Company's designers focus on overall concepts and identify and interpret the fashion trends for the season, identifying those particular apparel items and accessories that will appeal to its target customer, designing the product line and presenting it to the Company's merchants for review. The Company's merchants are responsible for developing seasonal strategies and a detailed list of desired apparel pieces and accessories to guide the designers, as well as buying, testing, editing and pricing the line during the season on an ongoing basis. This integrated approach to design, merchandising and sourcing enables the Company to carry a merchandise assortment that addresses customer demand while attempting to minimize inventory risk and maximize sales and profitability.
Sourcing
The Company's sourcing approach focuses on quality, speed and cost in order to provide timely delivery of quality goods. This is accomplished by closely managing the product development cycle, from raw materials and garment production to store-ready packaging, logistics and customs clearance.
Sourcing Relationships. The Company purchases apparel and accessories products both from importers and directly from manufacturers. The Company's relationships with its direct manufacturers are supported by independent buying agents, who help coordinate the Company's purchasing requirements with the factories. The Company's unit volumes, long-established vendor relationships and its knowledge of fabric and production costs, combined with a flexible, diversified sourcing base, enable it to buy high-quality, low-cost goods. The Company sources from approximately 20 countries and it is not subject to long-term production contracts with any of its vendors, manufacturers or buying agents. The Company's broad sourcing network allows it to meet its factory workplace standards, objectives of quality, cost, speed to market, and inventory efficiency by shifting merchandise purchases as required, and allows it to react quickly to changing market or regulatory conditions. In fiscal year 2008, the Company sourced nearly 100% of its merchandise from Cambodia, China, Hong Kong, India, Indonesia, Japan, Macau, Mexico, the Philippines, the Republic of Korea, Sri Lanka, Taiwan, Thailand, the United States and Vietnam. The Company's largest country sources are China, Macau and Hong Kong, which represented approximately 65% of purchases in fiscal year 2008.
Quality Assurance and Compliance Monitoring. As part of the Company's transition services agreement with Limited Brands, Independent Production Services ("IPS"), a unit of Limited Brands, provides the Company with monitoring of country of origin, point of fabrication compliance, code of business conduct and labor standards compliance, and supply chain security. In addition, all of the factories that manufacture merchandise for the Company sign a master sourcing agreement that details their obligations with respect to quality and ethical business practices. The Company's quality assurance field inspectors or IPS representatives visit each new apparel factory prior to its first bulk garment production to ensure that the factory quality control associates understand and comply with the Company's requirements. The Company's independent buying agents and importers also conduct in-line factory and final quality audits. Under the transition services agreement with Limited Brands, the Company's inbound shipments are further audited by Limited Brands for visual appearance and measurement.
The Company also engages two independent audit firms to visit each year a selection of factories that manufacture accessories for the Company to ensure that these factories understand and comply with code of business conduct and labor standards and supply chain security standards. All of the Company's jewelry suppliers are required to be in compliance with the Prop 65 Lead in Surface Coatings revisions enacted in the California Health & Safety Code, which includes manufacturing and product testing requirements that are audited by the Company's quality assurance and compliance teams.
Distribution and Logistics
Limited Brands provides the Company with certain warehousing and distribution services under the transition services agreement entered into on November 27, 2002, as amended, in connection with
5
the acquisition of Lerner Holding. All of the Company's merchandise is received, inspected, processed, warehoused and distributed through Limited Brands' distribution center in Columbus, Ohio. Details about each receipt are supplied to the Company's store inventory planners, who determine how the product should be distributed among the Company's stores based on current inventory levels, sales trends and specific product characteristics. Advance shipping notices are electronically communicated to the stores.
Under the transition services agreement, as amended on April 6, 2009, (See Exhibit 10.22 of this Annual Report on Form 10-K) these services will terminate upon the earliest of the following: (i) 24 months from the date that Limited Brands notifies the Company that Limited Brands wishes to terminate the services; (ii) 24 months from the date that the Company notifies Limited Brands that the Company wishes to terminate the services, which notice shall be no earlier than February 1, 2010; (iii) 60 days after the Company has given notice to Limited Brands that Limited Brands has failed to perform any material obligations under the agreement and such failure shall be continuing; (iv) 30 days after Limited Brands has given notice to the Company that the Company has failed to perform any material obligations under the agreement and such failure shall be continuing; (v) within 75 days of receipt of the annual proposed changes to the agreement schedules which outline the cost methodologies and estimated costs of the services for the coming year, if such proposed changes would result in a significant increase in the amount of service costs that the Company would be obligated to pay; (vi) 15 months after a change of control of the Company, at the option of Limited Brands; or (vii) upon reasonable notice under the prevailing circumstances by the Company to Limited Brands after a disruption of services due to force majeure that cannot be remedied or restored within a reasonable period of time. The Company believes that these services are provided at a competitive price and the Company anticipates continuing to use Limited Brands for these services.
Inventory and fulfillment for the Company's E-commerce operations are handled by a third-party warehouse facility located in Martinsville, Virginia. Merchandise is received in this location from Limited Brands' distribution center.
Real Estate
As of January 31, 2009, the Company operated 589 stores in 44 states, with an average of 5,594 selling square feet per store. All of the Company's stores are leased and are located in large population centers of the United States in shopping malls, lifestyle centers and off-mall locations, including urban street locations.
Fiscal Year | Total stores open at beginning of fiscal year | Number of stores opened during fiscal year | Number of stores closed during fiscal year | Number of stores remodeled during fiscal year | Total stores open at end of fiscal year | |||||||||||
|---|---|---|---|---|---|---|---|---|---|---|---|---|---|---|---|---|
2004 | 468 | 26 | (18 | ) | 40 | 476 | ||||||||||
2005 | 476 | 44 | (17 | ) | 40 | 503 | ||||||||||
2006 | 503 | 52 | (19 | ) | 35 | 536 | ||||||||||
2007 | 536 | 54 | (12 | ) | 25 | 578 | ||||||||||
2008 | 578 | 25 | (14 | ) | 14 | 589 | ||||||||||
Historical Selling Square Footage
Fiscal Year | Total selling square feet at beginning of fiscal year | Increase in selling square feet for stores opened during fiscal year | Reduction of selling square feet for stores closed during fiscal year | Reduction of selling square feet for stores remodeled during fiscal year | Total selling square feet at end of fiscal year | |||||||||||
|---|---|---|---|---|---|---|---|---|---|---|---|---|---|---|---|---|
2004 | 3,318,466 | 115,487 | (131,253 | ) | (112,930 | ) | 3,189,770 | |||||||||
2005 | 3,189,770 | 200,759 | (125,422 | ) | (57,480 | ) | 3,207,627 | |||||||||
2006 | 3,207,627 | 241,048 | (138,208 | ) | (73,927 | ) | 3,236,540 | |||||||||
2007 | 3,236,540 | 228,727 | (88,042 | ) | (49,775 | ) | 3,327,450 | |||||||||
2008 | 3,327,450 | 104,641 | (98,572 | ) | (38,740 | ) | 3,294,779 | |||||||||
6
Store Count by State as of January 31, 2009
State | # of Stores | State | # of Stores | State | # of Stores | |||||||||
|---|---|---|---|---|---|---|---|---|---|---|---|---|---|---|
| Alabama | 13 | Louisiana | 9 | North Carolina | 18 | |||||||||
| Arizona | 10 | Maine | 1 | North Dakota | 1 | |||||||||
| Arkansas | 4 | Maryland | 16 | Ohio | 25 | |||||||||
| California | 56 | Massachusetts | 12 | Oklahoma | 4 | |||||||||
| Colorado | 6 | Michigan | 13 | Pennsylvania | 34 | |||||||||
| Connecticut | 8 | Minnesota | 10 | Rhode Island | 3 | |||||||||
| Delaware | 1 | Mississippi | 6 | South Carolina | 11 | |||||||||
| Florida | 38 | Missouri | 13 | South Dakota | 1 | |||||||||
| Georgia | 22 | Nebraska | 4 | Tennessee | 16 | |||||||||
| Idaho | 1 | Nevada | 4 | Texas | 50 | |||||||||
| Illinois | 27 | New Hampshire | 3 | Utah | 2 | |||||||||
| Indiana | 10 | New Jersey | 29 | Virginia | 22 | |||||||||
| Iowa | 3 | New Mexico | 2 | Washington | 4 | |||||||||
| Kansas | 2 | New York | 57 | West Virginia | 4 | |||||||||
| Kentucky | 7 | Wisconsin | 7 | |||||||||||
| Grand Total | 589 | |||||||||||||
Site Selection. The Company's real estate management team is responsible for new store site selection. In selecting a specific location for a new store, the Company targets high-traffic, prime real estate in locations with demographics reflecting concentrations of the Company's target customers and a complementary tenant mix.
In response to the ongoing deterioration of the macroeconomic environment and the resulting impact on consumer spending in the retail sector, the Company initiated a comprehensive review of its business and on January 8, 2009 announced the launch of a multi-year restructuring and cost reduction program, which includes, among other cost-savings initiatives, the closure of 40 to 50 underperforming stores over a five-year period. For a further description of the restructuring and cost reduction program see Note 3, "Restructuring," in the Notes to Consolidated Financial Statements appearing elsewhere in this Annual Report on Form 10-K. During fiscal year 2009, the Company plans to minimize new store openings in order to preserve cash and position itself for growth once the macroeconomic environment begins to improve.
Store Display and Merchandising. The Company's stores are designed to effectively display its merchandise and create an upbeat atmosphere. Expansive front windows allow potential customers to see easily into the store and are used as a vehicle to highlight major merchandising and promotional events. The open floor design allows customers to readily view the majority of the merchandise on display, while store fixtures allow for the efficient display of garments and accessories. Merchandise displays are modified on a weekly basis based on sales trends and inventory receipts. The Company's in-store product presentation utilizes a variety of different fixtures to highlight the product line's breadth and versatility. Complete outfits are displayed throughout the store using garments from a variety of product categories. The Company displays complete outfits to demonstrate how its customers can combine different pieces in order to increase unit sales.
Pricing and Promotional Strategy. The Company's in-store pricing and promotional strategy is designed to drive customer traffic and promote brand loyalty. The promotional pricing strategy is designed to encourage multiple unit sales. Select key items are also prominently displayed in store windows at competitive prices to drive traffic into the stores.
7
Inventory Management. The Company's inventory management systems are designed to maximize merchandise profitability and increase inventory turns. The Company constantly monitors inventory turns on the selling floor and uses pricing and promotions to maximize sales and profitability and to achieve inventory turn goals. The Company has a refined inventory loss prevention program that is integrated with the store operations and finance departments of its business. This program includes electronic article surveillance systems in a majority of stores as well as the monitoring of merchandise returns, merchandise voids, employee sales and deposits, and educating store personnel on loss prevention.
Field Sales Organization. Store operations are organized into eight regions and 49 districts. Each region is managed by either a regional vice president or a regional sales leader, depending upon the size of the region. The Company staffs approximately 49 district sales leaders, with each typically responsible for the sales and operations of 12 stores on average. Each store is typically staffed with a store manager, a co-sales manager and an assistant sales manager, as required, in addition to hourly sales associates. The Company has approximately 1,800 in-store managers. The Company seeks to instill enthusiasm and dedication in its store management personnel by maintaining an incentive/bonus plan for its field managers. The program is based on monthly sales performance, effective labor management and seasonal inventory loss targets. The Company believes that this program effectively creates incentives for its senior field professionals and aligns their interests with the financial goals of the Company. The Company conducts independent surveys of customer satisfaction in all major stores on a recurring basis. The Company evaluates merchandise fill, fitting room service, checkout service, and store appearance. Stores are required to meet or exceed established corporate standards to ensure the quality of the Company's customers' shopping experience.
In connection with the restructuring and cost reduction program announced in January 2009, the Company reduced its field management staff by 12%, which is reflected in the numbers above. For a further description of the restructuring and cost reduction program see Note 3, "Restructuring," in the Notes to Consolidated Financial Statements appearing elsewhere in this Annual Report on Form 10-K.
Store Sales Associates. The Company typically employs between 7,000 and 11,000 full- and part-time store sales associates, depending on the Company's seasonal needs. The Company has well-established store operating policies and procedures and utilizes an in-store training program for all new store employees. Detailed product descriptions are also provided to sales associates to enable them to gain familiarity with product offerings.
Brand Building and Marketing
The Company believes that its New York & Company brand is among its most important assets. The Company's ability to continuously evolve its brand to appeal to the changing needs and priorities of its target customer is a key source of its competitive advantage. The Company believes that its combination of fashion-oriented apparel, accessories and attractive price points differentiates its brand from its competitors. The Company consistently communicates its brand image across all aspects of its business, including product design, store merchandising and shopping environments, channels of distribution, and marketing and advertising. The Company continues to invest in the development of this brand through, among other things, advertising, in-store marketing, direct mail marketing, and email communications. The Company also makes investments to enhance the overall client experience through the opening of new stores, the expansion and remodeling of existing stores, and a focus on client service.
The Company believes that it is strategically important to communicate on a regular basis directly with its current client base and with potential clients, through national and regional advertising, as well as through direct mail marketing, e-mail communications and in-store presentation. The Company uses
8
its customer database, which includes approximately 6 million customers who have made purchases within the last twelve months, to design marketing programs to its core customers.
In November 2006, the Company launched its E-commerce store to offer customers the opportunity to view and purchase its merchandise on-line atwww.nyandcompany.com. The Company believes that its E-commerce store caters to its customers' lifestyle needs by offering an easy alternative to shop, while also increasing brand awareness.
Customer Credit
The Company has a credit card processing agreement with a third party (the "administration company") that provides the services of the Company's proprietary credit card program. The Company allows payments on this credit card to be made at its stores as a service to its customers. The administration company owns the credit card accounts, with no recourse to the Company. All of the Company's proprietary credit cards carry the New York & Company brand. These cards provide purchasing power to customers and additional vehicles for the Company to communicate product offerings.
Information Technology
Information technology is a key component of the Company's business strategy and the Company is committed to utilizing technology to enhance its competitive position. The Company's information systems integrate data from the field sales, design, merchandising, planning and distribution, and financial reporting functions. The Company's core business systems consist of both purchased and internally developed software, operating on UNIX, AS400 and Windows NT platforms. These systems are accessed over a company-wide network and provide corporate employees with access to key business applications.
Sales, cash deposit and related credit card information are electronically collected from the stores' point-of-sale ("POS") terminals on a daily basis. During this process, the Company also obtains information concerning inventory receipts and transmits pricing, markdown and shipment notification data. In addition, the Company collects customer transaction data to update its customer database. The merchandising staff and merchandise planning staff evaluate the sales and inventory information collected from the stores to make key merchandise planning decisions, including orders and markdowns. These systems enhance the Company's ability to optimize sales while limiting markdowns, achieve planned inventory turns, reorder successful styles, and effectively distribute new inventory to the stores.
The Company continues to invest in technology to upgrade core systems to increase efficiencies and provide a competitive advantage. During fiscal year 2007, the Company partnered with Datavantage (a subsidiary of Micros Systems, Inc.) to implement a new POS system across its chain and partnered with JDA Software Group, Inc. to upgrade its existing merchandise planning system. The Company completed the implementation of the new POS system during fiscal year 2008 and expects to complete the upgrade of its merchandise planning system during fiscal year 2009.
Competition
The retail and apparel industries are highly competitive. The Company has positioned its stores as a source of fashion, quality and value by providing its customers with an appealing merchandise assortment at attractive price points generally below those of department stores and other specialty retailers. The Company competes with traditional department stores, specialty store retailers, discount apparel stores and direct marketers for, among other things, customers, raw materials, market share, retail space, finished goods, sourcing and personnel. The Company believes its competitors include Ann Taylor LOFT™, Express™, The Gap™, JCPenney™, Kohl's™, Old Navy™ and Target™, among others.
9
The Company differentiates itself from its competitors on the basis of its fashion and proprietary merchandise designs, value pricing, merchandise quality, in-store merchandise display and store service.
Intellectual Property
The Company believes that it has all of the registered trademarks it needs to protect its New York & Company™, Lerner™, Lerner New York™, City Crepe™, City Spa™, City Stretch™, New York Jeans™ and NY&C™ brands and it vigorously enforces all of its trademark rights.
Employees and Labor Relations
As of January 31, 2009, the Company had a total of 8,129 employees of which 2,358 were full-time employees and 5,771 were part-time employees, who are primarily store associates. The number of part-time employees fluctuates depending on the Company's seasonal needs. The Company's collective bargaining agreement with Local 1102 unit of the Retail, Wholesale and Department Store Union (RWDSU) AFL-CIO is set to expire on May 31, 2009. The Company anticipates the collective bargaining agreement with Local 1102 will be extended. Approximately 8% of the Company's total employees are covered by collective bargaining agreements and are primarily non-management store associates. The Company believes its relationship with its employees is good.
Government Regulation
The Company is subject to customs, truth-in-advertising and other laws, including consumer protection regulations and zoning and occupancy ordinances that regulate retailers generally and/or govern the promotion and sale of merchandise and the operation of retail stores and warehouse facilities. The Company undertakes to monitor changes in these laws and believes that it is in material compliance with applicable laws with respect to these practices.
The majority of the Company's merchandise is manufactured by factories located outside of the United States. These products are imported and are subject to U.S. customs laws, which impose tariffs for textiles and apparel. In addition, some of the Company's imported products are eligible for certain duty-advantaged programs; for example, the North American Free Trade Agreement, the Andean Trade Preference Act, the U.S. Caribbean Basin Trade Partnership Act and the Caribbean Basin Initiative.
Available Information
The Company makes available free of charge on its website,http://www.nyandcompany.com, copies of its Annual Report on Form 10-K, Quarterly Reports on Form 10-Q, Current Reports on Form 8-K and amendments to those reports filed or furnished pursuant to Section 13(a) or 15(d) of the Securities Exchange Act of 1934, as amended (the "Exchange Act") as soon as reasonably practicable after filing or furnishing such material electronically with the United States Securities and Exchange Commission. Copies of the charters of each of the Company's Audit Committee, Compensation Committee, and Nomination & Governance Committee, as well as the Company's Governance Guidelines, Code of Conduct for Associates, and Code of Conduct for Suppliers, are also available on the website or in print upon written request by any stockholder to the Corporate Secretary at 450 West 33rd Street, Fifth Floor, New York, New York 10001.
Economic conditions may cause a decline in business and consumer spending which could adversely affect the Company's business and financial performance.
The Company's business is impacted by general economic conditions and their effect on consumer confidence and the level of consumer spending on the merchandise the Company offers, which have
10
recently deteriorated significantly and may continue to do so for the foreseeable future. These economic factors include recessionary cycles, interest rates, currency exchange rates, economic growth, wage rates, unemployment levels, energy prices, availability of consumer credit, and consumer confidence, among others. The current downturn in the economy may continue to affect consumer purchases of the Company's merchandise and to adversely impact the Company's results of operations, liquidity and continued growth. In addition, the deteriorating economic conditions could negatively impact the Company's merchandise vendors and their ability to deliver products and sustain profits and sufficient liquidity. To counteract their cash flow problems, the Company's merchandise vendors may require letters-of-credit or attempt to increase prices, pass through increased costs or seek some other form of relief, which may adversely impact the Company's results of operations, liquidity and continued growth.
The Company's ability to successfully integrate its restructuring and cost reduction program.
On January 8, 2009, the Company announced a multi-year restructuring and cost reduction program as part of a major drive to enhance profitability and improve overall operating effectiveness. The key elements of the restructuring and cost reduction program include: strategic staff reductions in both the field and corporate office, optimization of the Company's store portfolio, a broad-based organizational cost reduction effort and the reduction of capital spending plans for fiscal year 2009. The estimated costs and charges associated with the restructuring program are preliminary and may vary materially based on various factors, including the timing in execution of the restructuring plan; outcome of negotiations with landlords and other third parties; inventory levels; and changes in management's assumptions and projections. As a result of these events and circumstances, delays and unexpected costs may occur, which could result in the Company not realizing all or any of the anticipated benefits of the restructuring and cost reduction program.
The Company's growth strategy includes the addition of a significant number of new stores each year and the potential relocation and remodeling of existing stores. The Company may not be able to successfully implement this strategy on a timely basis or at all. In addition, the Company's growth strategy may strain its resources and cause the performance of its existing stores to suffer.
The Company's growth will largely depend on its ability to open and operate new stores successfully and the availability of suitable store locations on acceptable terms. However, in response to the current economic downturn the Company plans to minimize new store openings during fiscal year 2009 in order to conserve cash and position itself for growth once the macroeconomic environment begins to improve. The Company intends to continue to open a significant number of new stores in future years, while relocating and remodeling a portion of its existing store base annually. The success of this strategy is dependent upon, among other things, the identification of suitable markets and sites for store locations, the negotiation of acceptable lease terms, the hiring, training and retention of competent sales personnel, and the effective management of inventory to meet the needs of new and existing stores on a timely basis. The Company's proposed expansion also will place increased demands on its operational, managerial and administrative resources. These increased demands could cause the Company to operate its business less effectively, which in turn could cause deterioration in the financial performance of its existing stores. In addition, to the extent that the Company's new store openings are in existing markets, the Company may experience reduced net sales volumes in existing stores in those markets. The Company expects to fund its expansion through cash flow from operations and, if necessary, by borrowings under its revolving credit facility; however, as mentioned above, if the Company experiences a decline in performance, the Company may slow or discontinue store openings. The Company may not be able to successfully execute any of these strategies on a timely basis. If the Company fails to successfully implement these strategies, its financial condition and results of operations would be adversely affected.
11
The Company's net sales, operating income and inventory levels fluctuate on a seasonal basis and decreases in sales or margins during the Company's peak seasons could have a disproportionate effect on its overall financial condition and results of operations. The Company's business experiences seasonal fluctuations in net sales and operating income, with a significant portion of its operating income typically realized during its fourth quarter. Any decrease in sales or margins during this period could have a disproportionate effect on the Company's financial condition and results of operations. You should refer to "Item 7. Management's Discussion and Analysis of Financial Condition and Results of Operations—Quarterly Results and Seasonality" for more information.
Seasonal fluctuations also affect the Company's inventory levels. The Company must carry a significant amount of inventory, especially before the holiday season selling period. If the Company is not successful in selling its inventory, it may have to write down the value of its inventory or sell it at significantly reduced prices or the Company may not be able to sell such inventory at all, which could have a material adverse effect on the Company's financial condition and results of operations.
Fluctuations in comparable store sales and results of operations could cause the price of the Company's common stock to decline substantially.
The Company's results of operations for its individual stores have fluctuated in the past and can be expected to fluctuate in the future. Since the beginning of fiscal year 2003 through fiscal year 2008, the Company's quarterly comparable store sales have ranged from an increase of 14.1% to a decrease of 14.0%. The Company cannot ensure that it will be able to achieve a high level of comparable store sales in the future.
The Company's comparable store sales and results of operations are affected by a variety of factors, including:
- •
- fashion trends;
- •
- mall traffic;
- •
- calendar shifts of holiday or seasonal periods;
- •
- the effectiveness of the Company's inventory management;
- •
- changes in the Company's merchandise mix;
- •
- the timing of promotional events;
- •
- weather conditions;
- •
- changes in general economic conditions and consumer spending patterns; and
- •
- actions of competitors or mall anchor tenants.
If the Company's future comparable store sales fail to meet expectations, then the market price of the Company's common stock could decline substantially. You should refer to the section entitled "Item 7. Management's Discussion and Analysis of Financial Condition and Results of Operations" for more information.
If the Company is not able to respond to fashion trends in a timely manner, develop new merchandise or launch new product lines successfully, it may be left with unsold inventory, experience decreased profits or incur losses or suffer reputational harm to its brand image.
The Company's success depends in part on management's ability to anticipate and respond to changing fashion tastes and consumer demands and to translate market trends into appropriate, saleable product offerings. Customer tastes and fashion trends change rapidly. If the Company is unable to successfully identify or react to changing styles or trends and misjudges the market for its products or any new product lines, its sales may be lower, gross margins may be lower and the
12
Company may be faced with a significant amount of unsold finished goods inventory. In response, the Company may be forced to increase its marketing promotions or price markdowns, which could have a material adverse effect on its financial condition and results of operations. The Company's brand image may also suffer if customers believe that it is no longer able to offer the latest fashions.
A reduction in the volume of mall traffic could significantly reduce the Company's sales and leave it with unsold inventory, reducing the Company's profits or creating losses.
Many of the Company's stores are located in shopping malls. Sales at these stores are derived, in part, from the volume of traffic in those malls. The Company's stores benefit from the ability of the mall's other tenants and other area attractions to generate consumer traffic in the vicinity of its stores and the continuing popularity of malls as shopping destinations. Sales volume and mall traffic may be adversely affected by economic downturns in a particular area, competition from internet retailers, non-mall retailers and other malls where the Company does not have stores and the closing of other stores in the malls in which the Company's stores are located. A reduction in mall traffic as a result of these or any other factors could materially adversely affect the Company's business.
The Company may lose key personnel.
The Company believes that it has benefited from the leadership and experience of its key personnel. The loss of the services of any of these individuals could have a material adverse effect on the business and the prospects of the Company. Competition for key personnel in the retail industry is intense and the Company's future success will also depend upon its ability to retain, recruit and train key personnel.
The Company faces risks arising from possible union legislation in the United States.
There is a possibility that the proposed Employee Free Choice Act ("EFCA") may be enacted, which would facilitate unionization. If the EFCA is passed, it could impact the Company's relationship with its associates, which may increase expenses and negatively impact the Company's business and its profitability. In addition, the Company's vendors and service providers may have their relationships with their workforce impacted by the EFCA leading to increased costs or disruptions in their operations, which could have an adverse effect on the Company's business and its results of operations.
Because of the Company's focus on keeping its inventory at the forefront of fashion trends, extreme and/or unseasonable weather conditions could have a disproportionately large effect on the Company's business, financial condition and results of operations because it would be forced to mark down inventory.
Extreme weather conditions in the areas in which the Company's stores are located could have a material adverse effect on the Company's business, financial condition and results of operations. For example, heavy snowfall or other extreme weather conditions over a prolonged period might make it difficult for the Company's customers to travel to its stores. The Company's business is also susceptible to unseasonable weather conditions. For example, extended periods of unseasonably warm temperatures during the winter season or cool weather during the summer season could render a portion of the Company's inventory incompatible with those unseasonable conditions. These prolonged unseasonable weather conditions could adversely affect the Company's business, financial condition and results of operations.
If third parties who manage some aspects of the Company's business do not adequately perform their functions, the Company might experience disruptions in its business, leaving it with inadequate or excess inventories, among other adverse effects, resulting in decreased profits or losses.
Limited Brands handles the distribution of the Company's merchandise through its distribution facility in Columbus, Ohio pursuant to a transition services agreement. The efficient operation of the
13
Company's stores is dependent on its ability to distribute merchandise to locations throughout the United States in a timely manner. The Company depends on Limited Brands to receive, sort, pack and distribute substantially all of the Company's merchandise. As part of the transition services agreement, Limited Brands contracts with third-party transportation companies to deliver the Company's merchandise from foreign ports to their warehouses and to the Company's stores. Any failure by any of these third parties to respond adequately to the Company's warehousing and distribution needs would disrupt the Company's operations and negatively impact its profitability.
Additional services are also provided by Limited Brands and its subsidiaries and affiliates pursuant to the transition services agreement. IPS assists the Company with its monitoring of country of origin and point of fabrication compliance for U.S. Customs. IPS also monitors compliance with the Company's code of business conduct and labor standards and its supply chain security. Any failure of Limited Brands or IPS to fulfill their obligations under the transition services agreement would disrupt the Company's operations and negatively impact its profitability.
Limited Brands may terminate those portions of the transition services agreement which provide for the distribution of the Company's merchandise and the compliance monitoring provided by IPS, upon providing the Company with 24-months advance notice of such termination, the occurrence of certain types of changes of control, or the Company's failure to perform any of its material obligations under the transition services agreement. If Limited Brands terminates a portion or all of the Company's transition services agreement, the Company may not be able to replace the services on terms acceptable to it or at all. The Company's failure to successfully replace the services could have a material adverse effect on the Company's business and prospects.
The Company uses a third-party for its E-commerce operations, including order management, order fulfillment, customer care, and channel management services. A failure by the third party to adequately manage the Company's E-commerce operations may negatively impact the Company's profitability.
The Company relies on third parties to monitor code of business conduct and labor standards compliance, supply chain security standards, and product quality requirements for its accessories business. Any failure by these third parties to adequately perform their functions may disrupt the Company's operations and negatively impact its reputation and its profitability.
The Company may rely on third parties for the implementation and/or management of certain aspects of its information technology infrastructure. Failure by any of these third parties to implement and/or manage the Company's information technology infrastructure effectively could disrupt its operations and negatively impact its profitability.
The Company relies on a third-party to administer its proprietary credit card program. The inability of the administration company to effectively service the credit card program could materially limit credit availability for the Company's customers, which would negatively impact the Company's revenues and, consequently, its profitability.
A work stoppage resulting from, among other things, a dispute over a collective bargaining agreement covering employees of a third party relied on by the Company or employees of the Company, may cause disruptions in the Company's business and negatively impact its profitability.
The raw materials used to manufacture the Company's products and its distribution and labor costs are subject to availability constraints and price volatility, which could result in increased costs. In addition, the Company faces the risk of increases in federal and state minimum wage rates, which could result in increased costs.
The raw materials used to manufacture the Company's products are subject to availability constraints and price volatility caused by high demand for petroleum-based synthetic fabrics, weather, supply conditions, government regulations, economic climate and other unpredictable factors. In
14
addition, the Company's transportation and labor costs are subject to price volatility caused by the price of oil, supply of labor, governmental regulations, economic climate and other unpredictable factors. Increases in demand for, or the price of, raw materials, distribution services and labor, including federal and state minimum wage rates, could have a material adverse effect on the Company's business, financial condition and results of operations.
Since the Company relies significantly on foreign sources of production, it is at risk from a variety of factors that could leave it with inadequate or excess inventories, resulting in decreased profits or losses.
The Company purchases apparel and accessories in foreign markets, with a significant portion coming from China, Macau and Hong Kong. The Company does not have any long-term merchandise supply contracts and many of its imports are subject to existing or potential duties and tariffs. The Company competes with other companies for production facilities.
The Company also faces a variety of other risks generally associated with doing business in foreign markets and importing merchandise from abroad, such as:
- •
- political or labor instability in countries where suppliers are located;
- •
- political or military conflict involving the United States, which could cause a delay in the transportation of the Company's products and an increase in transportation costs;
- •
- heightened terrorism security concerns, which could subject imported goods to additional, more frequent or more thorough inspections, leading to delays in deliveries or impoundment of goods for extended periods or could result in decreased scrutiny by customs officials for counterfeit goods, leading to lost sales and damage to the reputation of the Company's brand;
- •
- natural disasters, disease epidemics and health related concerns, which could result in closed factories, reduced workforces, scarcity of raw materials and scrutiny or embargoing of goods produced in infected areas;
- •
- the migration and development of manufacturers, which can affect where the Company's products are or will be produced;
- •
- imposition of regulations relating to imports and the Company's ability to adjust in a timely manner to changes in trade regulations, which among other things, could limit the Company's ability to source products from countries that have the labor and expertise needed to manufacture its products on a cost-effective basis;
- •
- imposition of duties, taxes and other charges on imports; and
- •
- currency volatility.
Any of the foregoing factors, or a combination thereof, could have a material adverse effect on the Company's business.
The Company's manufacturers may be unable to manufacture and deliver products in a timely manner or meet its quality standards, which could result in lost sales, cancellation charges or excessive markdowns.
The Company purchases apparel and accessories from importers and directly from third-party manufacturers. Similar to most other specialty retailers, the Company has short selling seasons for much of its inventory. Factors outside of the Company's control, such as manufacturing or shipping delays or quality problems, could disrupt merchandise deliveries and result in lost sales, product recalls, cancellation charges or excessive markdowns.
15
The Company's ability to successfully integrate new or acquired businesses into its existing business, to the extent it enters new lines of business or consummates acquisitions in the future, will affect the Company's financial condition and results of operations.
The process of integrating new or acquired businesses into the Company's existing operations may result in unforeseen difficulties and liabilities and may require a disproportionate amount of resources and management attention. Difficulties that the Company may encounter in integrating the operations of new or acquired businesses could have a material adverse effect on its results of operations and financial condition. Moreover, the Company may not realize any of the anticipated benefits of a new business or an acquisition and integration costs may exceed anticipated amounts. In addition, future acquisitions of businesses may require the Company to assume or incur additional debt financing, resulting in additional leverage.
The Company relies on its manufacturers to use acceptable ethical business practices, and if they fail to do so, the New York & Company brand name could suffer reputational harm and the Company's sales could decline or its inventory supply could be interrupted.
The Company requires its manufacturers to operate in compliance with applicable laws, rules and regulations regarding working conditions, employment practices, product quality and safety, and environmental compliance. Additionally, the Company imposes upon its business partners operating guidelines that require additional obligations in order to promote ethical business practices. The Company's staff, the staff of third party inspection services companies, and the staff of the Company's non-exclusive buying agents and importers periodically visit and monitor the operations of the Company's manufacturers to determine compliance. However, the Company does not control its manufacturers or their labor and other business practices. If one of the Company's manufacturers violates labor or other laws or implements labor or other business practices that are generally regarded as unethical in the United States, the shipment of finished products to the Company could be interrupted, orders could be canceled, relationships could be terminated and the Company's reputation could be damaged. Any of these events could have a material adverse effect on the Company's revenues and, consequently, its results of operations.
The Company may be unable to protect its trademarks, which could diminish the value of its brand.
The Company's trademarks are important to its success and competitive position. The Company's major trademarks are New York & Company, Lerner, Lerner New York, City Crepe, City Spa, City Stretch, New York Jeans and NY&C and are protected in the United States and internationally. The Company engages in the following steps to protect and enforce its trademarks: file and prosecute trademark applications for registration in those countries where the marks are not yet registered; response to office actions and examining attorneys in those countries where the marks are not yet registered; maintenance of its trademark portfolio in the United States and foreign countries; filings of statements of use, renewal documents, assignments, change of name and address forms; policing of marks and third party infringements; initiation and defense of opposition and/or cancellation proceedings, including discovery and preparation of evidence; and litigation, including filing enforcement lawsuits against third party infringers. The Company is susceptible to others imitating the Company's products and infringing on the Company's intellectual property rights. Imitation or counterfeiting of the Company's products or other infringement of the Company's intellectual property rights could diminish the value of its brand or otherwise adversely affect its revenues. The actions the Company has taken to establish and protect its trademarks may not be adequate to prevent imitation of its products by others or to prevent others from seeking to invalidate its trademarks or block sales of its products as a violation of the trademarks and intellectual property rights of others. In addition, others may assert rights in, or ownership of, trademarks and other intellectual property rights of the Company or in marks that are similar to the Company's or marks that the Company licenses and/or markets and the Company may not be able to successfully resolve these types of conflicts to its
16
satisfaction. In some cases, there may be trademark owners who have prior rights to the Company's marks because the laws of certain foreign countries may not protect intellectual property rights to the same extent as do the laws of the United States. In other cases, there may be holders who have prior rights to similar marks. Failure to protect the Company's trademarks could result in a material adverse effect on the Company's business.
The Company relies on its information technology infrastructure, which includes third party and internally developed software, and purchased or leased hardware that support the Company's information technology and various business processes. The Company's business, reputation and brand image could suffer if its infrastructure fails to perform as intended.
The Company relies on purchased or leased hardware and software licensed from third parties or internally developed in order to manage its business. The Company's ability to maintain and upgrade its information technology infrastructure is critical to the success of its business. This hardware and software may not continue to be available on commercially reasonable terms or at all. Any disruptions to the Company's infrastructure or loss of the right to use any of this hardware or software could affect the Company's operations, which could negatively affect the Company's business until corrected or until equivalent technology is either developed by the Company or, if available, is identified, obtained and integrated. In addition, the software underlying the Company's operations can contain undetected errors. The Company may be forced to modify its operations until such problems are corrected and, in some cases, may need to implement enhancements to correct errors that it does not detect. Problems with the software underlying the Company's operations could result in loss of revenue, unexpected expenses and capital costs, diversion of resources, loss of market share and damage to the Company's reputation which could adversely affect the Company's business, financial condition and results of operations.
Because the Company's brand is associated with all of its New York & Company merchandise in addition to its stores, the Company's success depends heavily on the value associated with its brand. The New York & Company name is integral to the Company's existing business, as well as to the implementation of its strategy for growing and expanding its business. The New York & Company brand could be adversely affected if the Company's public image or reputation were to be tarnished, which could result in a material adverse effect on the Company's business. If the value associated with the Company's brand were to diminish, the Company's sales could decrease, causing lower profits or losses.
The Company may be unable to compete favorably in the highly competitive retail industry, and if it loses customers to its competitors, its sales could decrease causing a decrease in profits or losses.
The sale of apparel and accessories is highly competitive. Increased competition could result in price reductions, increased marketing expenditures and loss of market share; all of which could have a material adverse effect on the Company's financial condition and results of operations.
The Company competes for sales with a broad range of other retailers, including individual and chain fashion specialty stores and department stores. The Company's competitors include Ann Taylor LOFT, Express, The Gap, JCPenney, Kohl's, Old Navy and Target, among others. In addition to the traditional store-based retailers, the Company also competes with direct marketers that sell similar lines of merchandise and target customers through catalogs and E-commerce.
Some of the Company's competitors may have greater financial, marketing and other resources available to them. In many cases, the Company's competitors sell their products in stores that are located in the same shopping malls as the Company's stores. In addition to competing for sales, the Company competes for favorable site locations and lease terms in shopping malls.
17
The Company's marketing efforts rely upon the effective use of customer information. Restrictions on the availability or use of customer information could adversely affect the Company's marketing program, which could result in lost sales and a decrease in profits.
The Company uses its customer database to market to its customers. Any limitations imposed on the use of such consumer data, whether imposed by federal or state governments or business partners, could have an adverse effect on the Company's future marketing activity. In addition, while the Company is compliant with Payment Card Industry Data Security Standards ("PCI DSS"), to the extent the Company's or its business partners' security procedures and protection of customer information prove to be insufficient or inadequate, the Company may become subject to litigation, which could expose it to liability and cause damage to its reputation or brand.
The Company is subject to numerous regulations that could affect its operations. Changes in such regulations could affect its profitability and impact the operation of its business through delayed shipments of its goods, fines or penalties.
The Company is subject to federal and state minimum wage laws, as well as various business customs, truth-in-advertising, truth-in-lending and other laws, including consumer protection regulations and zoning and occupancy ordinances that regulate retailers generally and/or govern the importation, promotion and sale of merchandise, the use of the Company's proprietary credit cards and the operation of retail stores and warehouse facilities. Although the Company undertakes to monitor changes in these laws, if these laws change without the Company's knowledge, or are violated by the Company's employees, importers, buying agents, manufacturers or distributors, the Company could experience delays in shipments and receipt of goods or be subject to fines or other penalties under the controlling regulations, any of which could have a material adverse effect on the Company's business, financial condition and results of operations.
The covenants in the Company's credit facilities impose restrictions that may limit its operating and financial flexibility.
The Company's credit facilities contain a number of significant restrictions and covenants that limit its ability to:
- •
- incur additional indebtedness;
- •
- declare dividends, make distributions or redeem or repurchase capital stock, including the Company's common stock, or to make certain other restricted payments or investments;
- •
- sell assets, including capital stock of restricted subsidiaries;
- •
- agree to payment restrictions affecting the Company's restricted subsidiaries;
- •
- consolidate, merge, sell or otherwise dispose of all or substantially all of the Company's assets;
- •
- incur liens;
- •
- alter the nature of the Company's business;
- •
- enter into sale/leaseback transactions;
- •
- conduct transactions with affiliates; or
- •
- designate the Company's subsidiaries as unrestricted subsidiaries.
In addition, the Company's credit facilities include other and more restrictive covenants and prohibit it from prepaying its other indebtedness while indebtedness under its credit facilities is outstanding. The agreement governing the Company's credit facilities also requires it to achieve
18
specified financial and operating results and maintain compliance with specified financial ratios. The Company's ability to comply with these ratios may be affected by events beyond the Company's control.
The restrictions contained in the agreement governing the Company's credit facilities could:
- •
- limit the Company's ability to plan for or react to market conditions or meet capital needs or otherwise restrict its activities or business plans; and
- •
- adversely affect the Company's ability to finance its operations, strategic acquisitions, investments or other capital needs or to engage in other business activities that would be in the Company's interest.
A breach of any of these restrictive covenants or the Company's inability to comply with the required financial ratios could result in a default under the agreement governing its credit facilities. If a default occurs, the lenders under the credit facilities may elect to declare all borrowings outstanding, together with accrued interest and other fees, to be immediately due and payable.
The lenders also have the right in these circumstances to terminate any commitments they have to provide further borrowings. If the Company is unable to repay outstanding borrowings when due, the lenders under the credit facilities also have the right to proceed against the collateral, including the Company's available cash, granted to them to secure the indebtedness.
The Company is a "controlled company," and the interests in its business of its controlling stockholders may be different from yours.
Pursuant to a stockholders agreement among certain stockholders of the Company, Irving Place Capital (formerly known as Bear Stearns Merchant Banking) is able to, subject to applicable law, designate a majority of the members of the Board of Directors of the Company and control actions to be taken by the Company and its Board of Directors, including amendments to the Company's restated certificate of incorporation and amended and restated bylaws and approval of significant corporate transactions, including mergers and sales of substantially all of the Company's assets. The directors so elected will have the authority, subject to the terms of the Company's indebtedness and the rules and regulations of the New York Stock Exchange, to issue additional stock, implement stock repurchase programs, declare dividends and make other decisions. Because Irving Place Capital owns more than 50% of the voting power of the Company, the Company is considered a "controlled company" for the purposes of the New York Stock Exchange listing requirements. As such, the Company is permitted to, and has opted out of, the New York Stock Exchange corporate governance requirements that its Board of Directors, its Compensation Committee and its Nomination and Governance Committee meet the standard of independence established by those corporate governance requirements. As a result, the Company's Board of Directors and those committees may have more directors who do not meet the New York Stock Exchange independence standards than they would if those independence standards were to apply. The New York Stock Exchange independence standards are intended to ensure that directors who meet the independence standard are free of any conflicting interest that could influence their actions as directors. Three of the Company's directors are employees of Irving Place Capital. It is possible that the interests of Irving Place Capital or that of an entity that controls Irving Place Capital may in some circumstances conflict with the Company's interests and the interests of its other stockholders.
Provisions in the Company's restated certificate of incorporation and Delaware law may delay or prevent the Company's acquisition by a third party.
The Company's restated certificate of incorporation contains a "blank check" preferred stock provision. Blank check preferred stock enables the Company's Board of Directors, without stockholders approval, to designate and issue additional series of preferred stock with such dividend, liquidation,
19
conversion, voting or other rights, including the right to issue convertible securities with no limitation on conversion, as the Company's Board of Directors may determine, including rights to dividends and proceeds in a liquidation that are senior to the common stock.
These provisions may make it more difficult or expensive for a third party to acquire a majority of the Company's outstanding voting common stock. The Company is also subject to certain provisions of Delaware law which could delay, deter or prevent the Company from entering into a merger, acquisition, tender offer, proxy contest or other transaction that might otherwise result in the Company's stockholders receiving a premium over the market price for their stock.
Item 1B. Unresolved Staff Comments
None.
All of the Company's stores, encompassing approximately 4.2 million total gross square feet as of January 31, 2009, are leased under operating leases. The typical store lease is for a ten-year term and requires the Company to pay real estate taxes, common area maintenance charges, utilities and other landlord charges. The Company also leases approximately 185,083 square feet of space at its headquarters located at 450 West 33rd Street, New York, New York under a lease which expires in 2015. Additionally, the Company owns a parcel of land located in Brooklyn, New York on which it operates one of its leased stores.
On April 29, 2008, a class action claim was filed in the Superior Court of the State of California for the County of Contra Costa captioned Jannika Schakow v. Lerner New York, Inc. and New York & Company, Inc. The class action was seeking relief for, among other things, meal and rest periods allegedly not provided or permitted to certain eligible employees in California.
On March 25, 2008, a class action claim was filed in the Superior Court of the State of California for the County of San Diego, the caption of which has been changed to Leslie Johnson v. Lerner New York, Inc. The class action was seeking relief for, among other things, collection of customers' personal information in a manner that is allegedly in violation of California law.
In January 2009, the Company reached settlements in principle with the plaintiffs of both class action claims in the State of California and recorded charges in connection with the settlements totaling $1.5 million.
There are various claims, lawsuits and pending actions against the Company arising in the normal course of the Company's business. It is the opinion of management that the ultimate resolution of these matters will not have a material effect on the Company's financial condition, results of operations or cash flows.
Item 4. Submission of Matters to a Vote of Security Holders
There were no matters submitted to a vote of security holders during the quarter ended January 31, 2009.
20
Item 5. Market for Registrant's Common Equity, Related Stockholder Matters and Issuer Purchases of Equity Securities
The Company's common stock has been listed and publicly traded on the New York Stock Exchange under the symbol "NWY" since October 7, 2004. The number of holders of record of common stock at March 31, 2009 was 192. The following table sets forth the high and low sale prices for the common stock on the New York Stock Exchange for the periods indicated:
| | Market Price | |||||||
|---|---|---|---|---|---|---|---|---|
| | High | Low | ||||||
Fiscal Year 2008 | ||||||||
Fourth quarter | $ | 3.00 | $ | 0.82 | ||||
Third quarter | $ | 12.12 | $ | 2.21 | ||||
Second quarter | $ | 9.97 | $ | 6.50 | ||||
First quarter | $ | 6.57 | $ | 4.49 | ||||
Fiscal Year 2007 | ||||||||
Fourth quarter | $ | 8.20 | $ | 3.65 | ||||
Third quarter | $ | 9.58 | $ | 5.69 | ||||
Second quarter | $ | 13.87 | $ | 8.76 | ||||
First quarter | $ | 16.20 | $ | 13.30 | ||||
The Company has not declared or paid any dividends on its common stock since the acquisition of the Company by Irving Place Capital in November 2002. The Company currently expects to retain future earnings, if any, for use in the operation and expansion of its business and does not anticipate paying any cash dividends in the foreseeable future. The Company's ability to pay dividends on its common stock is limited by the covenants of its credit facilities and may be further restricted by the terms of any of its future debt or preferred securities.
21
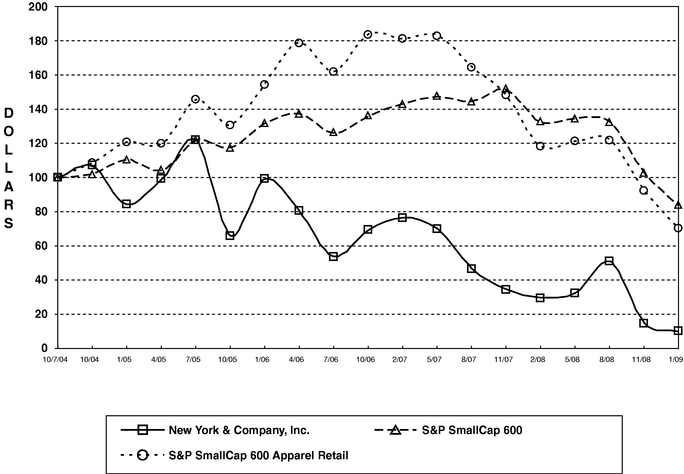
Performance Graph
The following graph shows a quarterly comparison of the cumulative total return on a $100 investment in the Company's common stock, the Standard & Poor's SmallCap 600 Index and the Standard & Poor's SmallCap 600 Apparel Retail Index. The cumulative total return for New York & Company, Inc. common stock assumes an initial investment of $100 in the common stock of the Company on October 7, 2004, which was the Company's first day of trading on the New York Stock Exchange after its initial public offering. The cumulative total return for the Standard & Poor's SmallCap 600 Index and the Standard & Poor's SmallCap 600 Apparel Retail Index assumes an initial investment of $100 on September 30, 2004. The comparison also assumes the reinvestment of any dividends.
22
Purchases of Equity Securities by the Issuer and Affiliated Purchasers
On November 26, 2008, the Company announced that its board of directors had authorized the repurchase of up to 3,750,000 shares over the next 12 months ending in November 2009. Repurchases, if any, would be made from time to time in the manner the Company believes appropriate, through open market or private transactions including through pre-established trading plans.
As of January 31, 2009, as set forth in the following table, the Company did not make any purchases of the Company's common stock, pursuant to the authorized share repurchase program, for the periods indicated:
Period | Total Number of Shares Purchased | Average Price Paid Per Share | Total Number of Shares Purchased as Part of Publicly Announced Program | Maximum Number of Shares that May Yet Be Purchased Under the Program | |||||||||
|---|---|---|---|---|---|---|---|---|---|---|---|---|---|
November 2, 2008 to November 29, 2008 | — | — | — | 3,750,000 | |||||||||
November 30, 2008 to January 3, 2009 | — | — | — | 3,750,000 | |||||||||
January 4, 2009 to January 31, 2009 | — | — | — | 3,750,000 | |||||||||
Total | — | — | — | 3,750,000 | |||||||||
23
Item 6. Selected Financial Data
The following table sets forth selected consolidated financial data for New York & Company, Inc. and its subsidiaries for each of the periods presented. The consolidated financial data for the 52-week fiscal year ended January 31, 2009, referred to as "fiscal year 2008," the 52-week fiscal year ended February 2, 2008, referred to as "fiscal year 2007," the 53-week fiscal year ended February 3, 2007, referred to as "fiscal year 2006," the 52-week fiscal year ended January 28, 2006, referred to as "fiscal year 2005," and the 52-week fiscal year ended January 29, 2005, referred to as "fiscal year 2004," have been derived from the audited consolidated financial statements of New York & Company, Inc. and its subsidiaries.
The selected consolidated financial data should be read in conjunction with "Item 7. Management's Discussion and Analysis of Financial Condition and Results of Operations" and the Company's consolidated financial statements and the notes thereto appearing elsewhere in this Annual Report on Form 10-K.
(amounts in thousands, except per share data) | Fiscal Year 2008 (52-weeks) | Fiscal Year 2007 (52-weeks) | Fiscal Year 2006 (53-weeks) | Fiscal Year 2005 (52-weeks) | Fiscal Year 2004 (52-weeks) | ||||||||||||
|---|---|---|---|---|---|---|---|---|---|---|---|---|---|---|---|---|---|
Statements of operations data(1): | |||||||||||||||||
Net sales | $ | 1,139,853 | $ | 1,194,944 | $ | 1,153,333 | $ | 1,112,950 | $ | 1,040,028 | |||||||
Cost of goods sold, buying and occupancy costs | 843,478 | 851,739 | 786,757 | 751,586 | 682,939 | ||||||||||||
Gross profit | 296,375 | 343,205 | 366,576 | 361,364 | 357,089 | ||||||||||||
Selling, general and administrative expenses | 306,101 | 298,325 | 284,664 | 258,642 | 262,201 | ||||||||||||
Restructuring charges(2) | 24,529 | — | — | — | — | ||||||||||||
Operating (loss) income | (34,255 | ) | 44,880 | 81,912 | 102,722 | 94,888 | |||||||||||
Interest expense, net of interest income | 726 | 1,200 | 1,663 | 5,726 | 9,256 | ||||||||||||
Accrued dividends—redeemable preferred stock(3) | — | — | — | — | 2,703 | ||||||||||||
Loss on modification and extinguishment of debt(3) | — | — | — | 933 | 2,034 | ||||||||||||
Loss on derivative instrument(3) | — | — | — | — | 29,398 | ||||||||||||
(Loss) income from continuing operations before income taxes | (34,981 | ) | 43,680 | 80,249 | 96,063 | 51,497 | |||||||||||
(Benefit) provision for income taxes | (14,683 | ) | 17,004 | 31,853 | 38,363 | 34,059 | |||||||||||
(Loss) income from continuing operations | (20,298 | ) | 26,676 | 48,396 | 57,700 | 17,438 | |||||||||||
Income (loss) from discontinued operations, net of taxes(1) | 491 | (31,533 | ) | (2,226 | ) | 788 | — | ||||||||||
Net (loss) income | $ | (19,807 | ) | $ | (4,857 | ) | $ | 46,170 | $ | 58,488 | $ | 17,438 | |||||
Basic (loss) earnings per share of common stock: | |||||||||||||||||
Basic (loss) earnings per share from continuing operations | $ | (0.34 | ) | $ | 0.46 | $ | 0.86 | $ | 1.07 | $ | 0.37 | ||||||
Basic earnings (loss) per share from discontinued operations | 0.01 | (0.54 | ) | (0.04 | ) | 0.01 | — | ||||||||||
Basic (loss) earnings per share | $ | (0.33 | ) | $ | (0.08 | ) | $ | 0.82 | $ | 1.08 | $ | 0.37 | |||||
Diluted (loss) earnings per share of common stock: | |||||||||||||||||
Diluted (loss) earnings per share from continuing operations | $ | (0.34 | ) | $ | 0.44 | $ | 0.81 | $ | 1.01 | $ | 0.33 | ||||||
Diluted earnings (loss) per share from discontinued operations | 0.01 | (0.52 | ) | (0.04 | ) | 0.01 | — | ||||||||||
Diluted (loss) earnings per share | $ | (0.33 | ) | $ | (0.08 | ) | $ | 0.77 | $ | 1.02 | $ | 0.33 | |||||
Weighted average shares outstanding: | |||||||||||||||||
Basic shares of common stock | 59,650 | 58,537 | 56,072 | 53,923 | 47,323 | ||||||||||||
Diluted shares of common stock | 59,650 | 61,028 | 60,031 | 57,316 | 52,726 | ||||||||||||
24
(amounts in thousands) | Fiscal Year 2008 | Fiscal Year 2007 | Fiscal Year 2006 | Fiscal Year 2005 | Fiscal Year 2004 | ||||||||||||
|---|---|---|---|---|---|---|---|---|---|---|---|---|---|---|---|---|---|
Balance sheet data (at period end): | |||||||||||||||||
Cash and cash equivalents (including cash at discontinued operations of $1, $223, $206 and $1,593, respectively) | $ | 54,281 | $ | 73,957 | $ | 68,064 | $ | 57,436 | $ | 85,161 | |||||||
Working capital | 70,599 | 84,479 | 69,964 | 47,701 | 83,105 | ||||||||||||
Total assets | 456,813 | 488,456 | 469,799 | 406,275 | 330,188 | ||||||||||||
Total debt(3) | 19,500 | 25,500 | 31,500 | 37,500 | 75,000 | ||||||||||||
Stockholders' equity | $ | 222,496 | $ | 239,961 | $ | 240,799 | $ | 179,050 | $ | 103,283 | |||||||
- (1)
- In connection with the decision to exit the JasmineSola business, the Company recorded a $35.2 million impairment charge in fiscal year 2007 related to the property and equipment, goodwill and trademarks of JasmineSola, a $1.3 million charge for severance costs and a $5.8 million charge for lease termination costs. As of February 2, 2008, all JasmineSola stores were closed and all other exit procedures were substantially complete; therefore, JasmineSola's results of operations are presented as discontinued operations in the current and prior periods presented.
- (2)
- In connection with the Company's multi-year restructuring and cost reduction program launched in January 2009, the Company recorded pre-tax restructuring charges totaling $24.5 million. These charges were comprised of a non-cash charge of $22.9 million related to the impairment of store assets and a $1.7 million cash charge primarily related to severance and other costs necessary to implement the restructuring and cost reduction program. For further information related to the restructuring and cost reduction program, please refer to Note 3, "Restructuring," in the Notes to Consolidated Financial Statements appearing elsewhere in this Annual Report on Form 10-K.
- (3)
- On March 16, 2004, the Company amended and restated its credit facility to include a three-year $75.0 million term loan ("March 16, 2004 term loan"). The Company used $75.0 million of term loan proceeds, together with $32.2 million of cash on-hand, to repay a $75.0 million principal amount, 10% subordinated note, plus $10.0 million of accrued interest to Limited Brands; repurchase from LFAS, Inc., an affiliate of Limited Brands, a common stock warrant for $20.0 million plus a contingent obligation; and pay $2.2 million of fees and expenses associated with these transactions. The Company measured the fair value of the contingent obligation ("derivative instrument") on March 16, 2004 and reported $16.3 million as a reduction of stockholders' equity and a liability on the consolidated balance sheet. During fiscal year 2004, the Company remeasured the fair value of the contingent obligation, which resulted in a charge to earnings of $29.4 million. On May 19, 2004, the Company entered into a new credit facility comprised of a five-year $75.0 million junior secured term loan ("May 19, 2004 term loan"). The Company used the $75.0 million loan proceeds to purchase substantially all of the Company's outstanding Series A preferred stock for $72.4 million, which included $62.5 million aggregate principal amount and $12.5 million accrued and unpaid dividends, and is presented net of $2.6 million of promissory notes receivable and $0.2 million of common stock subscription receivable. Additionally, cash on-hand was used to pay $1.9 million of fees and expenses related to these transactions. On October 13, 2004, the Company used approximately $75.2 million of the net proceeds received from the initial public offering to repay the $75.0 million May 19, 2004 term loan, plus accrued and unpaid interest of approximately $0.2 million. In connection with the early repayment of both the $75.0 million, 10% subordinated note to Limited Brands and the $75.0 million May 19, 2004 term loan during fiscal year 2004, the Company recorded $2.0 million of charges related to the write-off of unamortized deferred financing costs.
On January 4, 2006, the Company's credit facilities were amended to provide for, among other matters, an additional $37.5 million term loan facility maturing on March 17, 2009 bearing interest at the Eurodollar rate plus 2.50%. Using the $37.5 million of proceeds from the January 4, 2006 term loan plus cash on-hand, the Company prepaid in full the $75.0 million March 16, 2004 term loan, which was bearing interest at the Eurodollar rate plus 5.00%, and $0.5 million in fees related to the refinancing. The Company recorded a $0.9 million charge in January 2006 related to the write-off of unamortized deferred financing fees associated with the Company's March 16, 2004 term loan.
On August 22, 2007, the Company's credit facilities were further amended to provide for, among other matters, an extension of the term of the Company's existing $90.0 million revolving credit facility and existing term loan to March 17, 2012. As of January 31, 2009, the outstanding principal balance of the term loan was $19.5 million.
25
Item 7. Management's Discussion and Analysis of Financial Condition and Results of Operations
SPECIAL NOTE REGARDING FORWARD-LOOKING STATEMENTS
Certain matters discussed in "Item 7. Management's Discussion and Analysis of Financial Condition and Results of Operations" and other sections of this Annual Report on Form 10-K are forward-looking statements intended to qualify for safe harbors from liability established by the Private Securities Litigation Reform Act of 1995. Some of these statements can be identified by terms and phrases such as "anticipate," "believe," "intend," "estimate," "expect," "continue," "could," "may," "plan," "project," "predict" and similar expressions and include references to assumptions that the Company believes are reasonable and relate to its future prospects, developments and business strategies. Factors that could cause the Company's actual results to differ materially from those expressed or implied in such forward-looking statements, include, but are not limited to those discussed under the headings "Item 1A. Risk Factors" and "Item 7A. Quantitative and Qualitative Disclosures About Market Risk" in this Annual Report on Form 10-K and:
- •
- the Company's business is impacted by general economic conditions and their effect on consumer confidence and spending patterns, which have recently deteriorated significantly and may continue to do so for the foreseeable future;
- •
- the deteriorating economic conditions could negatively impact the Company's merchandise vendors and their ability to deliver products;
- •
- the Company's ability to successfully integrate its restructuring and cost reduction program;
- •
- the Company's ability to open and operate stores successfully and the potential lack of availability of suitable store locations on acceptable terms;
- •
- seasonal fluctuations in the Company's business;
- •
- the Company's ability to anticipate and respond to fashion trends, develop new merchandise and launch new product lines successfully;
- •
- the Company's dependence on mall traffic for its sales;
- •
- the Company's dependence on the success of its brand;
- •
- competition in the Company's market, including promotional and pricing competition;
- •
- the Company's reliance on the effective use of customer information;
- •
- the Company's ability to service any debt it incurs from time to time as well as its ability to maintain the requirements that the agreements related to such debt impose upon the Company;
- •
- the susceptibility of the Company's business to extreme and/or unseasonable weather conditions;
- •
- the Company's ability to retain, recruit and train key personnel;
- •
- the Company's reliance on third parties to manage some aspects of its business;
- •
- changes in the cost of raw materials, distribution services or labor, including federal and state minimum wage rates;
- •
- the potential impact of national and international security concerns on the retail environment, including any possible military action, terrorist attacks or other hostilities;
- •
- the Company's reliance on foreign sources of production, including the disruption of imports by labor disputes, political instability, legal and regulatory matters, duties, taxes, other charges, local business practices, potential delays in shipping and related pricing impacts and political issues and fluctuation in currency and exchange rates;
26
- •
- the potential impact of natural disasters and health concerns relating to outbreaks of widespread diseases, particularly on manufacturing operations of the Company's vendors;
- •
- the ability of the Company's manufacturers to manufacture and deliver products in a timely manner while meeting its quality standards;
- •
- the Company's ability to successfully integrate new or acquired businesses into its existing business;
- •
- the Company's reliance on manufacturers to maintain ethical business practices;
- •
- the Company's ability to protect its trademarks and other intellectual property rights;
- •
- the Company's ability to maintain, and its reliance on, its information technology infrastructure;
- •
- the effects of government regulation; and
- •
- the control of the Company by its sponsors and any potential change of ownership of those sponsors.
The Company undertakes no obligation to revise the forward-looking statements included in this Annual Report on Form 10-K to reflect any future events or circumstances.
The purpose of this section is to discuss and analyze the Company's consolidated financial condition, liquidity and capital resources, and results of operations. The following discussion should be read in conjunction with the Company's consolidated financial statements and the notes thereto appearing elsewhere in this Annual Report on Form 10-K.
Overview
The Company is a leading specialty retailer of fashion-oriented, moderately-priced women's apparel. The Company designs and sources its proprietary branded New York & Company merchandise sold exclusively through its national network of retail stores and E-commerce store atwww.nyandcompany.com. The target customers for the Company's merchandise are fashion-conscious, value-sensitive women between the ages of 25 and 45. As of January 31, 2009, the Company operated 589 stores in 44 states.
The Company's fiscal year is a 52 or 53 week year that ends on the Saturday closest to January 31. The 52-week years ended January 31, 2009 and February 2, 2008 and the 53-week year ended February 3, 2007 are referred to herein as "fiscal year 2008," "fiscal year 2007" and "fiscal year 2006," respectively. The 52-week year ending January 30, 2010 is referred to herein as "fiscal year 2009."
As of February 2, 2008, the Company completed the closure of all of the Company's 23 JasmineSola stores and substantially completed all other exit procedures. As a result, the Company's financial statements reflect JasmineSola as discontinued operations for all periods presented. Unless otherwise noted, the description of the Company's business, including all financial and store operating data, presented in this Annual Report on Form 10-K relate to the New York & Company business.
Fiscal Year 2008 Summary
The dramatic deterioration in financial markets and the adverse affect on the U.S. and global economy throughout the second half of fiscal year 2008 resulted in a significant reduction in consumer confidence and the level of consumer spending on the merchandise the Company offers. In response, the Company initiated a comprehensive review of its business and on January 8, 2009 announced the launch of a multi-year restructuring and cost reduction program that is expected to generate approximately $175 million in pre-tax savings over the next five years, of which approximately $30 million is expected to be realized in fiscal year 2009. This program is designed to streamline the
27
Company's organization by reducing costs and eliminating underperforming assets while enhancing efficiency and profitability.
�� The key components of the restructuring and cost reduction program include:
- •
- Strategic staff downsizing resulting in a permanent reduction of 12% of the Company's field management in its existing stores and approximately a 10% reduction of corporate office professionals;
- •
- The optimization of the Company's store portfolio, including the closure of 40 to 50 underperforming stores over a five year period;
- •
- A broad based cost reduction effort across all aspects of the Company's business; and
- •
- Significant reductions in capital expenditure plans as compared to fiscal year 2008.
During the fourth quarter of fiscal year 2008, the Company recorded a pre-tax restructuring charge of $24.5 million, comprised of a non-cash charge of $22.9 million related to the impairment of store assets and a $1.7 million cash charge primarily related to severance and other costs necessary to implement the restructuring and cost reduction program. The Company does not currently expect to record any material restructuring charges for these matters in fiscal year 2009.
The ongoing deterioration of the macroeconomic environment and the resulting impact on consumer spending during fiscal year 2008 contributed to a significant decrease in the Company's comparable store sales, which resulted in a loss of leverage on buying and occupancy costs and a decline in profit margins. Net sales for fiscal year 2008 were $1,139.9 million, as compared to net sales of $1,194.9 million for fiscal year 2007. Comparable store sales decreased 8.6% for fiscal year 2008, as compared to a comparable store sales decrease of 1.3% for fiscal year 2007. Loss from continuing operations in fiscal year 2008 was $20.3 million, or $0.34 per diluted share, inclusive of a loss of $0.29 per diluted share attributable to the restructuring charges discussed above, a $2.5 million charge incurred in connection with management changes during the third quarter of fiscal year 2008, and a $1.5 million charge related to legal settlements recorded during the fourth quarter of fiscal year 2008. This compares to income from continuing operations of $26.7 million, or $0.44 per diluted share, in fiscal year 2007. For a discussion of the more significant factors impacting these results, see "Results of Operations" below.
Capital spending for fiscal year 2008 was $44.6 million, as compared to $75.5 million for fiscal year 2007. The $44.6 million of capital spending represents $26.8 million related to the construction of new stores and the remodeling of existing stores and $17.8 million related to non-store capital projects, which principally represent information technology enhancements including, among other projects, a new POS system implemented across the chain and the upgrade of the Company's existing merchandise planning system. The Company completed the implementation of the new POS system during fiscal year 2008 and expects to complete the upgrade of its merchandise planning system during fiscal year 2009. During fiscal year 2008, the Company successfully opened 25 new stores, closed 14 stores, and completed 14 remodels, ending the fiscal year operating 589 stores in 44 states, as compared to 578 stores as of February 2, 2008. Total selling square footage as of January 31, 2009 was 3.295 million, compared to 3.327 million as of February 2, 2008.
As of January 31, 2009, the Company had cash and cash equivalents of $54.3 million, working capital of $70.6 million and availability under its revolving credit facility of $68.7 million. Looking forward to fiscal year 2009, the Company will focus on managing expenses and inventory tightly and conserving cash in order to position itself for growth once the macroeconomic environment begins to improve. Capital expenditures are estimated to be approximately $15.0 million in fiscal year 2009, down from $44.6 million in fiscal year 2008.
28
General
Net Sales. Net sales consist of sales from comparable and non-comparable stores and the Company's E-commerce store. A store is included in the comparable store sales calculation after it has completed 13 full fiscal months of operation from the store's original opening date or once it has been reopened after remodeling. Beginning in February 2008, sales from the Company's E-commerce store are included in comparable store sales. Non-comparable store sales include stores which have not completed 13 full fiscal months of operations, sales from closed stores, and sales from stores closed or in temporary locations during periods of remodeling. In addition, in a year with 53 weeks, sales in the last week of the year are not included in determining comparable store sales. Net sales from the sale of merchandise at the Company's stores are recognized when the customer takes possession of the merchandise and the purchases are paid for, primarily with either cash or credit card. Net sales from the sale of merchandise at the Company's E-commerce store are recognized when the merchandise is shipped to the customer. A reserve is provided for projected merchandise returns based on prior experience.
The Company issues gift cards which do not contain provisions for expiration or inactivity fees. The portion of the dollar value of gift cards that ultimately is not used by customers to make purchases is known as breakage. The Company estimates gift card breakage and records such amount as revenue as gift cards are redeemed. The Company's estimate of gift card breakage is based on analysis of historical redemption patterns as well as the remaining balance of gift cards for which the Company believes the likelihood of redemption to be remote.
Cost of Goods Sold, Buying and Occupancy Costs. Cost of goods sold, buying and occupancy costs is comprised of direct inventory costs for merchandise sold, distribution, payroll and related costs for design, sourcing, production, merchandising, planning and allocation personnel, and store occupancy and related costs.
Gross Profit. Gross profit represents net sales less cost of goods sold, buying and occupancy costs.
Selling, General and Administrative Expenses. Selling, general and administrative expenses include selling, store management and corporate expenses, including payroll and employee benefits, employment taxes, management information systems, marketing, insurance, legal, store pre-opening and other corporate level expenses. Store pre-opening expenses include store level payroll, grand opening event marketing, travel, supplies and other store opening expenses.
29
Results of Operations
The following tables summarize the Company's results of operations as a percentage of net sales and selected store operating data for fiscal year 2008, fiscal year 2007 and fiscal year 2006:
| | Fiscal Year 2008 | Fiscal Year 2007 | Fiscal Year 2006 | |||||||
|---|---|---|---|---|---|---|---|---|---|---|
| | (as a % of net sales) | |||||||||
Net sales | 100.0 | % | 100.0 | % | 100.0 | % | ||||
Cost of goods sold, buying and occupancy costs | 74.0 | % | 71.3 | % | 68.2 | % | ||||
Gross profit | 26.0 | % | 28.7 | % | 31.8 | % | ||||
Selling, general and administrative expenses | 26.8 | % | 24.9 | % | 24.7 | % | ||||
Restructuring charges | 2.2 | % | — | % | — | % | ||||
Operating (loss) income | (3.0 | )% | 3.8 | % | 7.1 | % | ||||
Interest expense, net | 0.1 | % | 0.1 | % | 0.1 | % | ||||
(Loss) income from continuing operations before income taxes | (3.1 | )% | 3.7 | % | 7.0 | % | ||||
(Benefit) provision for income taxes | (1.3 | )% | 1.5 | % | 2.8 | % | ||||
(Loss) income from continuing operations | (1.8 | )% | 2.2 | % | 4.2 | % | ||||
Income (loss) from discontinued operations, net of taxes | 0.1 | % | (2.6 | )% | (0.2 | )% | ||||
Net (loss) income | (1.7 | )% | (0.4 | )% | 4.0 | % | ||||
| | Fiscal Year 2008 | Fiscal Year 2007 | Fiscal Year 2006 | |||||||
|---|---|---|---|---|---|---|---|---|---|---|
| | (amounts in thousands, except square foot data) | |||||||||
Selected operating data: | ||||||||||
Comparable store sales decrease | (8.6 | )% | (1.3 | )% | (2.7 | )% | ||||
Net sales per average selling square foot(1) | $ | 344 | $ | 364 | $ | 358 | ||||
Net sales per average store(2) | $ | 1,952 | $ | 2,145 | $ | 2,218 | ||||
Average selling square footage per store(3) | 5,594 | 5,757 | 6,038 | |||||||
- (1)
- Net sales per average selling square foot is defined as net sales divided by the average of beginning and end of period selling square feet.
- (2)
- Net sales per average store is defined as net sales divided by the average of beginning and end of period number of stores.
- (3)
- Average selling square footage per store is defined as end of period selling square feet divided by end of period number of stores.
The following table includes store count and selling square feet:
| | Fiscal Year 2008 | Fiscal Year 2007 | Fiscal Year 2006 | ||||||||||||||||
|---|---|---|---|---|---|---|---|---|---|---|---|---|---|---|---|---|---|---|---|
| | Store Count | Selling Square Feet | Store Count | Selling Square Feet | Store Count | Selling Square Feet | |||||||||||||
Stores open, beginning of period | 578 | 3,327,450 | 536 | 3,236,540 | 503 | 3,207,627 | |||||||||||||
New stores | 25 | 104,641 | 54 | 228,727 | 52 | 241,048 | |||||||||||||
Closed stores | (14 | ) | (98,572 | ) | (12 | ) | (88,042 | ) | (19 | ) | (138,208 | ) | |||||||
Net impact of remodeled stores on selling square feet | — | (38,740 | ) | — | (49,775 | ) | — | (73,927 | ) | ||||||||||
Stores open, end of period | 589 | 3,294,779 | 578 | 3,327,450 | 536 | 3,236,540 | |||||||||||||
30
Fiscal Year 2008 Compared to Fiscal Year 2007
Net Sales. Net sales for fiscal year 2008 were $1,139.9 million, as compared to net sales of $1,194.9 million for fiscal year 2007. The dramatic deterioration in financial markets and the adverse effect on the U.S. and global economy throughout the second half of fiscal year 2008 resulted in a significant reduction in consumer confidence and the level of consumer spending on the merchandise the Company offers. The Company's comparable store sales decreased 8.6% for fiscal year 2008, which resulted in a loss of leverage on buying and occupancy costs and a decline in profit margins. This decrease in comparable store sales was partially offset by an increase in non-comparable store sales, driven by net sales from new store openings not yet included in comparable store sales. In the comparable store base, the average dollar sales per transaction decreased 1.9%, and the number of transactions per average store decreased 6.8%, as compared to last year.
Gross Profit. Gross profit decreased $46.8 million to $296.4 million, or 26.0% of net sales, during fiscal year 2008, as compared to $343.2 million, or 28.7% of net sales, during fiscal year 2007. During the first half of fiscal year 2008, the Company improved gross profit by 220 basis points, which was primarily the result of a 340 basis point improvement in merchandise margins, reflecting the success of the Company's strategy to improve margin through disciplined inventory control and targeted, well-planned promotions, partially offset by a 120 basis point increase in buying and occupancy costs as a percentage of net sales. As the impact of the economic downturn worsened during the second half of fiscal year 2008, the improvement in gross profit recognized during the first half of the fiscal year was more than offset by a decrease in gross profit realized during the second half of the fiscal year. For full fiscal year 2008, gross profit as a percentage of net sales decreased by 270 basis points, resulting primarily from a 230 basis point increase in buying and occupancy costs as a percentage of net sales primarily due to the lack of leverage resulting from negative comparable store sales. In addition, merchandise margins decreased by 40 basis points during fiscal year 2008 resulting from the decrease in comparable store sales and an increase in promotional and inventory clearance activity throughout the second half of the fiscal year.
Selling, General and Administrative Expenses. Selling, general and administrative expenses increased $7.8 million to $306.1 million, or 26.8% of net sales, during fiscal year 2008, as compared to $298.3 million, or 24.9% of net sales, during fiscal year 2007, primarily as a result of spending to support new stores. The increase in selling, general and administrative expenses as a percentage of net sales is primarily a result of the decrease in comparable store sales, partially offset by the impact of the Company's ongoing cost savings initiatives. In addition, selling, general and administrative expenses includes a $2.5 million charge related to management changes during the third quarter of fiscal year 2008 and a $1.5 million charge recognized during the fourth quarter of fiscal year 2008 in connection with the settlement of two separate class action lawsuits in the State of California. On an average store basis, selling general and administrative expenses declined by 2.1%, reflecting the success of the Company's expense control efforts.
Restructuring Charges. In connection with the Company's multi-year restructuring and cost reduction program launched in January 2009, the Company recorded pre-tax restructuring charges totaling $24.5 million, or 2.2% of net sales, during the fourth quarter of fiscal year 2008. The charges included a non-cash charge of $22.9 million related to the impairment of store assets and a $1.7 million cash charge primarily related to severance and other costs necessary to implement the restructuring and cost reduction program. For further information related to the restructuring and cost reduction program, please refer to Note 3, "Restructuring," in the Notes to Consolidated Financial Statements appearing elsewhere in this Annual Report on Form 10-K.
Operating (Loss) Income. For the reasons discussed above, operating loss for fiscal year 2008 was $34.3 million, or 3.0% of net sales, as compared to operating income of $44.9 million, or 3.8% of net sales, during fiscal year 2007.
31
Interest Expense, Net. Net interest expense decreased to $0.7 million during fiscal year 2008, as compared to $1.2 million during fiscal year 2007. The decrease in net interest expense is primarily related to a decrease in borrowings and fluctuations in interest rates.
(Benefit) Provision for Income Taxes. The effective tax rate during fiscal year 2008 reflects a benefit of 42.0%, as compared to a provision of 38.9% during fiscal year 2007. The change in effective tax rate for fiscal year 2008, as compared to fiscal year 2007, is primarily due to a tax benefit resulting from the reduction of tax positions for prior years.
(Loss) Income from Continuing Operations. For the reasons discussed above, loss from continuing operations was $20.3 million, or 1.8% of net sales, for fiscal year 2008. This compares to income from continuing operations of $26.7 million, or 2.2% of net sales, for fiscal year 2007.
Income (Loss) from Discontinued Operations, Net of Taxes. Income from discontinued operations, net of taxes, which represents the operations of JasmineSola, was $0.5 million for fiscal year 2008, as compared to a loss of $31.5 million for fiscal year 2007. The $31.5 million loss from discontinued operations, net of taxes in fiscal year 2007 is primarily related to the decision to exit the JasmineSola business and the related non-cash charges to impair certain assets of JasmineSola, including goodwill, trademarks and property and equipment, and cash charges for severance and lease termination costs.
Fiscal Year 2007 Compared to Fiscal Year 2006
Net Sales. Net sales for fiscal year 2007 were $1,194.9 million, as compared to net sales of $1,153.3 million for fiscal year 2006. The increase in net sales is primarily attributable to an increase in non-comparable store sales, driven by net sales from new store openings not yet included in comparable store sales, and a $21.1 million increase in net sales from the Company's E-commerce store launched in November 2006. These increases were partially offset by reduced sales due to a reduction in the number of weeks of selling in fiscal year 2007 compared to fiscal year 2006 (52 weeks in fiscal year 2007 versus 53 weeks in fiscal year 2006) and a 1.3% decrease in comparable store sales for the 52-weeks ended February 2, 2008, as compared to the 52-weeks ended February 3, 2007. Excluding $15.1 million of net sales from the extra week in fiscal year 2006, net sales in fiscal year 2007 increased 5.0%. In the comparable store base, the average dollar sales per transaction decreased 1.6%, while the number of transactions per average store increased 0.3%, as compared to last year.
Gross Profit. Gross profit decreased $23.4 million to $343.2 million, or 28.7% of net sales, during fiscal year 2007, as compared to $366.6 million, or 31.8% of net sales, during fiscal year 2006. The 310 basis point decrease in gross profit as a percentage of net sales during fiscal year 2007 is in part due to a decrease in comparable store sales and an increase in promotional and inventory clearance activity, which resulted in a 170 basis point decrease in merchandise margin. Also contributing to the decrease was a 140 basis point increase in buying and occupancy costs as a percentage of net sales, which was primarily caused by the lack of leverage resulting from negative comparable store sales combined with an increase in real estate costs related to the impact of new and remodeled stores.
Selling, General and Administrative Expenses. Selling, general and administrative expenses increased $13.7 million to $298.3 million, or 24.9% of net sales, during fiscal year 2007, as compared to $284.7 million, or 24.7% of net sales, during fiscal year 2006. The 20 basis point increase in selling, general and administrative expenses as a percentage of net sales during fiscal year 2007 is primarily the result of a reduction in marketing and corporate overhead spending, which largely offset an increase in store selling expenses and the reduction in leverage due to the decrease in comparable store sales.
Operating Income. For the reasons discussed above, operating income decreased $37.0 million to $44.9 million, or 3.8% of net sales, during fiscal year 2007, as compared to $81.9 million, or 7.1% of net sales, during fiscal year 2006.
32
Interest Expense, Net. Net interest expense decreased $0.5 million to $1.2 million during fiscal year 2007, as compared to $1.7 million during fiscal year 2006. The decrease in net interest expense is primarily related to a decrease in borrowings and fluctuations in interest rates.
Provision for Income Taxes. The effective tax rate during fiscal year 2007 was 38.9%, as compared to 39.7% during fiscal year 2006. The change in effective tax rate for fiscal year 2007 is primarily due to the recognition of $0.6 million of tax benefits due to the settlement of U.S. federal income tax examinations for the tax years 2003 through 2005.
Income from Continuing Operations. For the reasons discussed above, income from continuing operations decreased $21.7 million to $26.7 million, or 2.2% of net sales, for fiscal year 2007, from $48.4 million, or 4.2% of net sales, for fiscal year 2006.
Loss from Discontinued Operations, Net of Taxes. Loss from discontinued operations, net of taxes, which represents the operations of JasmineSola, was $31.5 million for fiscal year 2007, as compared to a loss of $2.2 million for fiscal year 2006. The increase in the loss from discontinued operations, net of taxes is directly related to the decision to exit the JasmineSola business and the related non-cash charges to impair certain assets of JasmineSola, including goodwill, trademarks and property and equipment, and cash charges for severance and lease termination costs.
Non-GAAP Financial Measure
The Company has provided a non-GAAP financial measure to adjust (loss) income from continuing operations for fiscal year 2008, fiscal year 2007 and fiscal year 2006. This information reflects, on a non-GAAP adjusted basis, the Company's (loss) income from continuing operations before interest expense, net; (benefit) provision for income taxes; depreciation and amortization; and loss from impairment charges ("EBITDA"). The calculation for EBITDA is provided to enhance the user's understanding of the Company's operating results. EBITDA is provided because management believes it is an important measure of financial performance commonly used to determine the value of companies and to define standards for borrowing from institutional lenders. The non-GAAP financial information should be considered in addition to, not as an alternative to, (loss) income from continuing operations, as an indicator of the Company's operating performance, and cash flows from operating activities of continuing operations, as a measure of the Company's liquidity, as determined in accordance with accounting principles generally accepted in the United States. The Company may calculate EBITDA differently than other companies.
Reconciliation of (Loss) Income from Continuing Operations to EBITDA
| | Fiscal Year 2008 | Fiscal Year 2007 | Fiscal Year 2006 | |||||||||||||||||
|---|---|---|---|---|---|---|---|---|---|---|---|---|---|---|---|---|---|---|---|---|
| | Amounts in thousands | As a % of net sales | Amounts in thousands | As a % of net sales | Amounts in thousands | As a % of net sales | ||||||||||||||
(Loss) income from continuing operations | $ | (20,298 | ) | (1.8 | )% | $ | 26,676 | 2.2 | % | $ | 48,396 | 4.2 | % | |||||||
Add back: | ||||||||||||||||||||
Interest expense, net | 726 | 0.1 | % | 1,200 | 0.1 | % | 1,663 | 0.1 | % | |||||||||||
(Benefit) provision for income taxes | (14,683 | ) | (1.3 | )% | 17,004 | 1.5 | % | 31,853 | 2.8 | % | ||||||||||
Depreciation and amortization | 43,939 | 3.9 | % | 38,500 | 3.2 | % | 31,607 | 2.7 | % | |||||||||||
Loss from impairment charges | 22,854 | 2.0 | % | — | — | % | — | — | % | |||||||||||
EBITDA | $ | 32,538 | 2.9 | % | $ | 83,380 | 7.0 | % | $ | 113,519 | 9.8 | % | ||||||||
33
Quarterly Results and Seasonality
The Company views the retail apparel market as having two principal selling seasons: spring (first and second quarter) and fall (third and fourth quarter). The Company's business experiences seasonal fluctuations in net sales and operating income, with a significant portion of its operating income typically realized during its fourth quarter. The following table sets forth the percentage of fiscal year net sales, operating income (loss) and income (loss) from continuing operations that was realized in each quarter of the last two fiscal years.
| | Fiscal Year 2008 | Fiscal Year 2007 | |||||||||||||||||||||||
|---|---|---|---|---|---|---|---|---|---|---|---|---|---|---|---|---|---|---|---|---|---|---|---|---|---|
| | Quarter ended | Quarter ended | |||||||||||||||||||||||
(as a % of fiscal year) | May 3, 2008 | August 2, 2008 | November 1, 2008 | January 31, 2009 | May 5, 2007 | August 4, 2007 | November 3, 2007 | February 2, 2008 | |||||||||||||||||
Net sales | 23.7 | % | 25.9 | % | 21.9 | % | 28.5 | % | 22.9 | % | 23.9 | % | 23.1 | % | 30.1 | % | |||||||||
Operating income (loss) | 33.2 | % | 42.2 | % | (38.3 | )% | (137.1 | )% | 19.9 | % | 19.2 | % | 18.6 | % | 42.3 | % | |||||||||
Income (loss) from continuing operations | 33.1 | % | 42.4 | % | (39.4 | )% | (136.1 | )% | 19.4 | % | 18.9 | % | 19.8 | % | 41.9 | % | |||||||||
Any decrease in sales or margins during either of the principal selling seasons in any given year could have a disproportionate effect on the Company's financial condition and results of operations. Seasonal fluctuations also affect inventory levels. The Company must carry a significant amount of inventory, especially before the holiday season selling period.
The following tables set forth the Company's quarterly consolidated statements of operations data for the last eight fiscal quarters and such information expressed as a percentage of net sales. This unaudited quarterly information has been prepared on the same basis as the annual audited financial statements appearing elsewhere in this Annual Report on Form 10-K and includes all necessary
34
adjustments, consisting only of normal recurring adjustments, that the Company considers necessary to present fairly the financial information for the quarters presented.
| | Fiscal Year 2008 | Fiscal Year 2007 | ||||||||||||||||||||||||
|---|---|---|---|---|---|---|---|---|---|---|---|---|---|---|---|---|---|---|---|---|---|---|---|---|---|---|
| | Quarter ended | Quarter ended | ||||||||||||||||||||||||
Statements of Operations data | May 3, 2008 | August 2, 2008 | November 1, 2008 | January 31, 2009 | May 5, 2007 | August 4, 2007 | November 3, 2007 | February 2, 2008 | ||||||||||||||||||
| | (Amounts in thousands, except per share data) | |||||||||||||||||||||||||
Net sales | $ | 270,069 | $ | 295,668 | $ | 249,027 | $ | 325,089 | $ | 274,186 | $ | 284,966 | $ | 276,379 | $ | 359,413 | ||||||||||
Gross profit | $ | 83,941 | $ | 88,382 | $ | 62,938 | $ | 61,114 | $ | 79,443 | $ | 78,691 | $ | 82,116 | $ | 102,955 | ||||||||||
Operating income (loss) | $ | 11,366 | $ | 14,454 | $ | (13,132 | ) | $ | (46,943 | ) | $ | 8,918 | $ | 8,640 | $ | 8,358 | $ | 18,964 | ||||||||
Income (loss) from continuing operations | $ | 6,723 | $ | 8,610 | $ | (7,992 | ) | $ | (27,639 | ) | $ | 5,177 | $ | 5,036 | $ | 5,291 | $ | 11,172 | ||||||||
Income (loss) from discontinued operations, net of taxes | $ | — | $ | 167 | $ | 68 | $ | 256 | $ | (4,375 | ) | $ | (1,537 | ) | $ | (21,321 | ) | $ | (4,300 | ) | ||||||
Net income (loss) | $ | 6,723 | $ | 8,777 | $ | (7,924 | ) | $ | (27,383 | ) | $ | 802 | $ | 3,499 | $ | (16,030 | ) | $ | 6,872 | |||||||
Basic earnings (loss) per share of common stock: | ||||||||||||||||||||||||||
Basic EPS— | $ | 0.11 | $ | 0.15 | $ | (0.13 | ) | $ | (0.46 | ) | $ | 0.09 | $ | 0.09 | $ | 0.09 | $ | 0.19 | ||||||||
Basic EPS— | $ | — | $ | — | $ | — | $ | — | $ | (0.08 | ) | $ | (0.03 | ) | $ | (0.36 | ) | $ | (0.07 | ) | ||||||
Basic earnings (loss) per share | $ | 0.11 | $ | 0.15 | $ | (0.13 | ) | $ | (0.46 | ) | $ | 0.01 | $ | 0.06 | $ | (0.27 | ) | $ | 0.12 | |||||||
Diluted earnings (loss) per share of common stock: | ||||||||||||||||||||||||||
Diluted EPS— | $ | 0.11 | $ | 0.14 | $ | (0.13 | ) | $ | (0.46 | ) | $ | 0.08 | $ | 0.08 | $ | 0.09 | $ | 0.18 | ||||||||
Diluted EPS— | $ | — | $ | — | $ | — | $ | — | $ | (0.07 | ) | $ | (0.02 | ) | $ | (0.35 | ) | $ | (0.07 | ) | ||||||
Diluted earnings (loss) per share | $ | 0.11 | $ | 0.14 | $ | (0.13 | ) | $ | (0.46 | ) | $ | 0.01 | $ | 0.06 | $ | (0.26 | ) | $ | 0.11 | |||||||
Weighted average shares outstanding: | ||||||||||||||||||||||||||
Basic shares of common stock | 59,274 | 59,426 | 59,858 | 60,040 | 57,805 | 58,262 | 58,845 | 59,237 | ||||||||||||||||||
Diluted shares of common stock | 61,232 | 61,395 | 59,858 | 60,040 | 60,869 | 60,954 | 61,074 | 61,214 | ||||||||||||||||||
35
| | Fiscal Year 2008 | Fiscal Year 2007 | |||||||||||||||||||||||
|---|---|---|---|---|---|---|---|---|---|---|---|---|---|---|---|---|---|---|---|---|---|---|---|---|---|
| | Quarter ended | Quarter ended | |||||||||||||||||||||||
(as a % of net sales) | May 3, 2008 | August 2, 2008 | November 1, 2008 | January 31, 2009 | May 5, 2007 | August 4, 2007 | November 3, 2007 | February 2, 2008 | |||||||||||||||||
Net sales | 100.0 | % | 100.0 | % | 100.0 | % | 100.0 | % | 100.0 | % | 100.0 | % | 100.0 | % | 100.0 | % | |||||||||
Gross profit | 31.1 | % | 29.9 | % | 25.3 | % | 18.8 | % | 29.0 | % | 27.6 | % | 29.7 | % | 28.6 | % | |||||||||
Operating income (loss) | 4.2 | % | 4.9 | % | (5.3 | )% | (14.4 | )% | 3.3 | % | 3.0 | % | 3.0 | % | 5.3 | % | |||||||||
Income (loss) from continuing operations | 2.5 | % | 2.9 | % | (3.2 | )% | (8.5 | )% | 1.9 | % | 1.8 | % | 1.9 | % | 3.1 | % | |||||||||
Liquidity and Capital Resources
The Company's primary uses of cash are to fund working capital, operating expenses, debt service and capital expenditures related primarily to the construction of new stores, remodeling of existing stores and development of the Company's information technology infrastructure. Historically, the Company has financed these requirements from internally generated cash flow. The Company intends to fund its ongoing capital and working capital requirements, as well as debt service obligations, primarily through cash flows from operations, supplemented by borrowings under its credit facilities, if needed. The Company is in compliance with all debt covenants.
As of January 31, 2009, the Company had cash and cash equivalents of $54.3 million, working capital of $70.6 million and availability under its revolving credit facility of $68.7 million. Looking forward to fiscal year 2009, the Company will focus on managing expenses and inventory tightly and conserving cash in order to position itself for growth once the macroeconomic environment begins to improve. Capital expenditures are estimated to be approximately $15.0 million in fiscal year 2009, down from $44.6 million in fiscal year 2008.
(Amounts in thousands) | January 31, 2009 | February 2, 2008 | February 3, 2007 | |||||||
|---|---|---|---|---|---|---|---|---|---|---|
Cash and cash equivalents (including cash at discontinued operations of $1, $223 and $206, respectively) | $ | 54,281 | $ | 73,957 | $ | 68,064 | ||||
Working capital | $ | 70,599 | $ | 84,479 | $ | 69,964 | ||||
(Amounts in thousands) | Fiscal Year 2008 | Fiscal Year 2007 | Fiscal Year 2006 | |||||||
|---|---|---|---|---|---|---|---|---|---|---|
Net cash provided by operating activities of continuing operations | $ | 34,463 | $ | 70,928 | $ | 84,479 | ||||
Net cash used in investing activities of continuing operations | $ | (44,352 | ) | $ | (75,464 | ) | $ | (77,536 | ) | |
Net cash (used in) provided by financing activities of continuing operations | $ | (3,635 | ) | $ | (1,798 | ) | $ | 9,596 | ||
Net cash (used in) provided by discontinued operations | $ | (6,152 | ) | $ | 12,227 | $ | (5,911 | ) | ||
Net (decrease) increase in cash and cash equivalents | $ | (19,676 | ) | $ | 5,893 | $ | 10,628 | |||
Operating Activities of Continuing Operations
Net cash provided by operating activities of continuing operations was $34.5 million during fiscal year 2008, as compared to net cash provided by operating activities of continuing operations of $70.9 million during fiscal year 2007. The decrease in net cash provided by operating activities of continuing operations during fiscal year 2008, as compared to fiscal year 2007, is primarily related to the loss from continuing operations in fiscal year 2008 and changes in prepaid expenses, accounts payable, deferred rent, and other assets and liabilities, partially offset by changes in accounts receivable, income taxes receivable, inventory, accrued expenses, and income taxes payable. Cash provided by deferred rent primarily consists of unamortized landlord allowances related to the Company's store expansion and remodel programs.
36
Net cash provided by operating activities of continuing operations was $70.9 million during fiscal year 2007, as compared to net cash provided by operating activities of continuing operations of $84.5 million during fiscal year 2006. The decrease in net cash provided by operating activities of continuing operations during fiscal year 2007, as compared to fiscal year 2006, is primarily related to a decrease in income from continuing operations and changes in accounts receivable, income taxes receivable, inventory, prepaid expenses, accrued expenses, income taxes payable and deferred rent, partially offset by changes in accounts payable and other assets and liabilities. Cash provided by deferred rent primarily consists of unamortized landlord allowances related to the Company's store expansion and remodel programs.
Investing Activities of Continuing Operations
Net cash used in investing activities of continuing operations was $44.4 million, $75.5 million and $77.5 million, during fiscal year 2008, fiscal year 2007 and fiscal year 2006, respectively. These amounts primarily reflect capital expenditures related to the construction of new stores, the remodeling of existing stores and non-store capital projects. During fiscal year 2008, the Company invested $17.8 million in non-store capital projects, which principally represent information technology enhancements including, among other projects, a new POS system being implemented across the chain and the upgrade of its existing merchandise planning system. The Company completed the implementation of the new POS system during fiscal year 2008 and expects to complete the upgrade of its merchandise planning system during fiscal year 2009.
The decrease in net cash used in investing activities of continuing operations during fiscal year 2008, as compared to fiscal year 2007, is due to the construction of 25 new stores and the remodeling of 14 existing stores during fiscal year 2008, as compared to 54 new stores and 25 remodeled stores in fiscal year 2007. During fiscal year 2006, the Company opened 52 new stores and remodeled 35 existing stores.
Financing Activities of Continuing Operations
Net cash used in financing activities of continuing operations was $3.6 million during fiscal year 2008, as compared to net cash used in financing activities of continuing operations of $1.8 million during fiscal year 2007. Net cash used in financing activities of continuing operations for fiscal year 2008 consisted of the following: quarterly payments against the Company's outstanding term loan totaling $6.0 million; $2.5 million of proceeds from the exercise of stock options and the related excess tax benefit to the Company; and payment of financing costs totaling $0.2 million in connection with the December 9, 2008 amendment of the Company's credit facilities. Net cash used in financing activities of continuing operations for fiscal year 2007 consisted primarily of the following: quarterly payments against the Company's outstanding term loan totaling $6.0 million; $4.7 million of proceeds from the exercise of stock options and the related excess tax benefit to the Company; and payment of financing costs totaling $0.4 million in connection with the August 22, 2007 amendment of the Company's credit facilities.
Net cash used in financing activities of continuing operations was $1.8 million during fiscal year 2007, as compared to net cash provided by financing activities of continuing operations of $9.6 million during fiscal year 2006. Net cash used in financing activities of continuing operations for fiscal year 2007 is explained in the preceding paragraph. Net cash provided by financing activities of continuing operations for fiscal year 2006 consisted of the following: proceeds of $2.3 million from the public offering of common stock, consummated on January 31, 2006; the payment of $0.4 million in fees and expenses related to the offering; quarterly payments against the Company's outstanding term loan totaling $6.0 million; and $13.7 million of proceeds from the exercise of stock options and the related excess tax benefit to the Company.
37
Discontinued Operations Cash Flows
Net cash used in discontinued operations was $6.2 million during fiscal year 2008, as compared to net cash provided by discontinued operations of $12.2 million during fiscal year 2007. Net cash used in discontinued operations during fiscal year 2008 consisted primarily of lease termination payments and the payment of other exit related liabilities. Net cash provided by discontinued operations for fiscal year 2007 consisted primarily of $12.6 million of cash provided by operating activities, which was largely the result of the tax benefit associated with the impairment charges related to JasmineSola trademarks, goodwill and property and equipment and the liquidation of JasmineSola inventory during the closeout period.
Net cash provided by discontinued operations was $12.2 million during fiscal year 2007, as compared to net cash used in discontinued operations of $5.9 million during fiscal year 2006. Net cash provided by discontinued operations for fiscal year 2007 is explained in the preceding paragraph. Net cash used in discontinued operations for fiscal year 2006 was related primarily to capital expenditures of $5.4 million for the construction of nine JasmineSola stores.
Long-Term Debt and Credit Facilities
On August 22, 2007, Lerner New York, Inc., Lernco, Inc. and Jasmine Company, Inc. entered into a Second Amended and Restated Loan and Security Agreement (the "Loan Agreement") with Wachovia Bank, National Association, as Agent for itself and the other lender party to the Loan Agreement. The Loan Agreement further amended and restated the Amended and Restated Loan and Security Agreement, dated March 16, 2004, among Lerner New York, Inc. and Lernco, Inc., as borrowers, together with the Agent and the lenders party thereto, as amended.
The Company's credit facilities currently consist of a term loan, of which $19.5 million was outstanding at January 31, 2009, and a $90.0 million revolving credit facility (which includes a sub-facility available for issuance of letters of credit of up to $75.0 million), both having a maturity date of March 17, 2012.
The revolving loans under the credit facilities bear interest, at the Company's option, either at a floating rate equal to the Eurodollar rate plus a margin of between 1.00% and 1.25% per year, depending upon the Company's financial performance, or the Prime rate. The Company pays the lenders under the revolving credit facility a monthly fee on outstanding commercial letters of credit at a rate of 0.625% per year and on standby letters of credit at a rate of between 1.00% and 1.25% per year, depending upon the Company's financial performance, plus a monthly fee on a proportion of the unused commitments under that facility at a rate of 0.20% per year. The term loan bears interest at a floating rate equal to the Eurodollar rate plus 2.50% per year. If any default were to exist under the revolving credit facility and for so long as such default were to continue, at the option of the agent or lenders, the monthly fee on outstanding standby letters of credit may increase to 3.25% per year, interest on the revolving loans may increase to 3.25% per year above the Eurodollar rate for Eurodollar rate loans and 2.00% per year above the Prime rate for all Prime rate loans, and interest on the term loan may increase to the Eurodollar rate plus 4.50% per year.
The Company's credit facilities contain certain covenants, including restrictions on the Company's ability to pay dividends on its common stock, incur additional indebtedness and to prepay, redeem, defease or purchase other debt. Subject to such restrictions, the Company may incur more debt for working capital, capital expenditures, stock repurchases, acquisitions and for other purposes. The terms of the Company's credit facilities also subject it to certain maintenance covenants, which were amended on December 9, 2008. The amendment removed the maximum leverage ratio of 2.75 to 1.00 and limited the application of the minimum fixed charge coverage ratio of 1.00 to 1.00, such that the Company is only subject to the minimum fixed charge coverage ratio if borrowing availability under its revolving credit facility plus qualified cash falls below specified minimum levels. Prior to the existing
38
term loan being repaid in full, the Company will only be subject to the minimum fixed charge coverage ratio in the event that borrowing availability under its revolving credit facility plus qualified cash falls below $30.0 million ($20.0 million during March and November). Should the Company fully repay its existing term loan, the Company will only be subject to the minimum fixed charge coverage ratio in the event that borrowing availability under its revolving credit facility falls below $12.5 million. In addition, the Company is required at all times to maintain minimum borrowing availability under its credit facility of $10.0 million. The Company is currently in compliance with the financial covenants referred to above.
The lenders have been granted a pledge of the common stock of Lerner Holding and certain of its subsidiaries, and a first priority security interest in substantially all other tangible and intangible assets of New York & Company, Inc. and its subsidiaries, as collateral for the Company's obligations under the credit facilities. In addition, New York & Company, Inc. and certain of its subsidiaries have fully and unconditionally guaranteed the credit facilities, and such guarantees are joint and several.
As of January 31, 2009, the Company had availability under its revolving credit facility of $68.7 million, net of letters of credit outstanding of $6.9 million, as compared to availability of $72.2 million, net of letters of credit outstanding of $6.8 million, as of February 2, 2008. As of January 31, 2009 and February 2, 2008, there were no loans outstanding under the revolving credit facility. Borrowings under the revolving credit facility are due March 17, 2012, and may be borrowed, repaid and reborrowed prior to maturity.
Cash Requirements
The Company believes that cash flows from operations, its current cash balance and funds available under its credit facilities will be sufficient to meet its working capital needs and planned capital expenditures through fiscal year 2009.
Off-Balance Sheet Arrangements
The Company does not have off-balance sheet arrangements.
Contractual Obligations
The following table summarizes the Company's contractual obligations as of January 31, 2009:
| | | Payments Due by Period(4) | ||||||||||||||
|---|---|---|---|---|---|---|---|---|---|---|---|---|---|---|---|---|
| | Total obligations | Less than one year | One to three years | Three to five years | More than five years | |||||||||||
| | (Amounts in thousands) | |||||||||||||||
Long-term debt(1) | $ | 19,500 | $ | 6,000 | $ | 13,500 | $ | — | $ | — | ||||||
Operating leases(2) | 732,688 | 109,232 | 203,472 | 185,894 | 234,090 | |||||||||||
Purchase obligations(3) | 97,536 | 90,036 | 7,500 | — | — | |||||||||||
Total contractual obligations | $ | 849,724 | $ | 205,268 | $ | 224,472 | $ | 185,894 | $ | 234,090 | ||||||
- (1)
- Does not include any scheduled interest payments.
- (2)
- Represents future minimum lease payments, under non-cancelable leases as of January 31, 2009. The minimum lease payments do not include common area maintenance ("CAM") charges, real estate taxes or other landlord charges, which are also contractual obligations under store and office operating leases. In many of the Company's leases, CAM charges are not fixed and can fluctuate from year to year. During fiscal year 2008, CAM charges and real estate taxes were $70.7 million and other landlord charges were $5.9 million.
39
- (3)
- Represents purchase orders for merchandise not yet received or recorded on the consolidated balance sheet, as well as a contractual obligation for distribution and logistics services used in the normal course of business.
- (4)
- Not included in the above table are net potential cash obligations of $3.6 million associated with unrecognized tax benefits and $3.5 million associated with an unfunded pension liability due to the high degree of uncertainty regarding the timing of future cash outflows associated with such obligations. For further information related to unrecognized tax benefits and the unfunded pension liability, please refer to Note 14, "Income Taxes" and Note 10, "Employee Benefit Plans," respectively, in the Notes to Consolidated Financial Statements appearing elsewhere in this Annual Report on Form 10-K.
Commercial Commitments
The following table summarizes the Company's commercial commitments as of January 31, 2009:
| | | Amount of Commitment Per Period(2) | ||||||||||||||
|---|---|---|---|---|---|---|---|---|---|---|---|---|---|---|---|---|
| | Total obligations | Less than one year | One to three years | Three to five years | More than five years | |||||||||||
| | (Amounts in thousands) | |||||||||||||||
Trade letters of credit outstanding(1) | $ | 101 | $ | 101 | $ | — | $ | — | $ | — | ||||||
Standby letters of credit(1) | 6,778 | 6,778 | — | — | — | |||||||||||
Total commercial commitments | $ | 6,879 | $ | 6,879 | $ | — | $ | — | $ | — | ||||||
- (1)
- Issued under its revolving credit facility. At January 31, 2009, there were no outstanding borrowings under this facility.
- (2)
- Excludes purchase orders for merchandise and supplies in the normal course of business.
Critical Accounting Policies
The preparation of financial statements in conformity with generally accepted accounting principles in the United States requires management to make estimates and assumptions that impact the amounts reported on the Company's consolidated financial statements and related notes. On an ongoing basis, management evaluates its estimates and judgments, including those related to inventories, long-lived assets, goodwill and other intangible assets. Management bases its estimate and judgments on historical experience and various other factors that are believed to be reasonable under the circumstances. Actual results may differ materially from these judgments. Management believes the following estimates and assumptions are most significant to reporting the Company's results of operations and financial position.
Inventory Valuation. Inventories are valued at the lower of average cost or market, on a weighted average cost basis, using the retail method. The Company records a charge to cost of goods sold, buying and occupancy costs for all inventory on-hand when a permanent retail price reduction is reflected in its stores. In addition, management makes estimates and judgments regarding, among other things, initial markup, markdowns, future demand and market conditions, all of which significantly impact the ending inventory valuation. If actual future demand or market conditions are different than those projected by management, future period merchandise margin rates may be unfavorably or favorably affected. Other significant estimates related to inventory include shrink and obsolete and excess inventory which are also based on historical results and management's operating projections.
Impairment of Long-Lived Assets. The Company evaluates long-lived assets in accordance with Statement of Financial Accounting Standards ("SFAS") No. 144, "Accounting for the Impairment or
40
Disposal of Long-Lived Assets" ("SFAS No. 144"). Long-lived assets are evaluated for recoverability in accordance with SFAS No. 144 whenever events or changes in circumstances indicate that an asset may have been impaired. In evaluating an asset for recoverability, the Company estimates the future cash flow expected to result from the use of the asset and eventual disposition. If the sum of the expected future undiscounted cash flow is less than the carrying amount of the asset, an impairment loss, equal to the excess of the carrying amount over the fair value of the asset, is recognized. An impairment loss could have a material adverse impact on the Company's financial condition and results of operations. In connection with the Company's multi-year restructuring and cost reduction program launched in January 2009, the Company recorded a non-cash charge of $22.9 million during the fourth quarter of fiscal year 2008 related to the impairment of store assets. In connection with the decision to exit the JasmineSola business, during the third quarter of fiscal year 2007, the Company recorded a non-cash charge of approximately $6.9 million related to JasmineSola property and equipment. The Company's evaluations during fiscal year 2006 resulted in no material asset impairment charges.
Goodwill and Other Intangible Assets. SFAS No. 142, "Goodwill and Other Intangible Assets" ("SFAS No. 142"), prohibits the amortization of goodwill and intangible assets with indefinite lives. The Company's intangible assets relate to the New York & Company trademarks and historically the JasmineSola trademarks and goodwill associated with the acquisition of JasmineSola on July 19, 2005, which were initially valued at $14.8 million, $17.2 million and $11.1 million, respectively. The trademarks were initially valued using the "relief from royalty method" and were determined to have indefinite lives by an independent appraiser. Goodwill represents the excess of the purchase price over the fair value of the net assets acquired.
The Company tests for impairment of goodwill and other intangible assets at least annually in the fourth quarter, or more frequently if events or circumstances indicate that the asset may be impaired, by comparing the fair value with the carrying amount for each individual asset. Goodwill impairment is determined using a two-step process. The first step of the goodwill impairment test is to identify a potential impairment by comparing the fair value of a reporting unit with its carrying amount, including the goodwill assigned to the reporting unit. The estimate of fair value of a reporting unit is determined using a discounted cash flow model. If the fair value of a reporting unit exceeds its carrying amount, goodwill of the reporting unit is not deemed to be impaired and the second step of the impairment test is not performed. If the carrying amount of a reporting unit exceeds its fair value, the second step of the goodwill impairment test is performed to measure the amount of impairment loss, if any. The second step of the goodwill impairment test compares the implied fair value of the reporting unit's goodwill with the carrying amount of that goodwill. If the carrying amount of the reporting unit's goodwill exceeds the implied fair value of that goodwill, an impairment loss is recognized in an amount equal to that excess. The implied fair value of goodwill is determined in the same manner as the amount of goodwill recognized in a business combination. In other words, the fair value of the reporting unit is allocated to all of the assets and liabilities of that unit (including any unrecognized intangible assets) as if the reporting unit had been acquired in a business combination and the fair value of the reporting unit was the purchase price paid to acquire the reporting unit.
The impairment test for other intangible assets not subject to amortization consists of a comparison of the fair value of the intangible asset with its carrying value. The estimates of fair value of intangible assets not subject to amortization, specifically trademarks, are determined using the "relief from royalty method." If the carrying value of the intangible asset exceeds its fair value, an impairment loss is recognized in an amount equal to that excess.
The calculation of estimated fair values used in the evaluation of goodwill and other intangible assets requires estimates of future cash flows, growth rates, discount rates and other variables, that are based on historical experience, knowledge, and market data. If actual experience differs materially from management's estimates or if changes in strategic direction occur, an impairment charge may be required. Management's estimates may be affected by factors such as those outlined in "Item 1A. Risk
41
Factors." An impairment loss could have a material adverse impact on the Company's results of operations. The Company's fiscal year 2008 impairment test did not result in any impairment. In connection with the decision to exit the JasmineSola business, during the third quarter of fiscal year 2007, the Company recorded non-cash impairment charges of $17.2 million and $11.1 million related to the JasmineSola trademarks and goodwill, respectively. The Company's fiscal year 2006 impairment test did not result in any impairment.
Income Taxes. Income taxes are calculated in accordance with SFAS No. 109, "Accounting for Income Taxes," which requires the use of the liability method. Deferred tax assets and liabilities are recognized based on the difference between the financial statement carrying amounts of assets and liabilities and their respective tax bases. Inherent in the measurement of deferred balances are certain judgments and interpretations of enacted tax laws and published guidance with respect to applicability to the Company's operations. Deferred tax assets are believed to be fully realizable as management expects future taxable income will be sufficient to recover the asset values and, as such, no related valuation allowance has been provided for. The Company adopted the provisions of FASB Interpretation No. 48, "Accounting for Uncertainty in Income Taxes—an interpretation of FASB Statement No. 109" in the first quarter of fiscal year 2007. This Interpretation prescribes a comprehensive model of how a company should recognize, measure, present and disclose in its financial statements uncertain tax positions that the company has taken or expects to take on a tax return. Under this Interpretation, the Company recognizes a tax benefit when a tax position is more-likely-than-not to be sustained upon examination, based solely on its technical merits. The Company measures the recognized tax benefit as the largest amount of tax benefit that has greater than a 50% likelihood of being realized upon the ultimate settlement with a taxing authority. The Company reverses a previously recognized tax benefit if it determines that the tax position no longer meets the more-likely-than-not threshold of being sustained. The Company accrues interest and penalties related to unrecognized tax benefits in income tax expense.
Adoption of New Accounting Standards
In September 2006, the FASB issued SFAS No. 157, "Fair Value Measurements" ("SFAS No. 157"). SFAS No. 157 establishes a common definition for fair value to be applied to US GAAP guidance requiring the use of fair value, establishes a framework for measuring fair value, and expands the disclosure about such fair value measurements. The application of SFAS No. 157 as it relates to financial assets and financial liabilities is effective for fiscal years beginning after November 15, 2007, and interim periods within those fiscal years. On February 12, 2008, the FASB issued FSP FAS 157-2, "Effective Date of FASB Statement No. 157," which delays the effective date of SFAS No. 157 for all nonfinancial assets and nonfinancial liabilities, except those that are recognized or disclosed at fair value in the financial statements on at least an annual basis, to fiscal years beginning after November 15, 2008, and interim periods within those fiscal years. The Company's adoption of SFAS No. 157 on February 3, 2008 for all financial assets and liabilities and any other assets and liabilities that are recognized or disclosed at fair value on a recurring basis did not impact the Company's consolidated financial statements. The provisions of SFAS No. 157 are to be applied prospectively as of the beginning of the fiscal year in which it is applied, with any transition adjustment recognized as a cumulative effect adjustment to the opening balance of retained earnings. The Company does not anticipate that the adoption of SFAS No. 157 for nonfinancial assets and liabilities measured at fair value on a non-recurring basis will have a material impact on its financial position and results of operations
In September 2006, the FASB issued SFAS No. 158, "Employers' Accounting for Defined Benefit Pension and Other Postretirement Plans, an amendment of FASB statements No. 87, 88, 106, and 132(R)" ("SFAS No. 158"). SFAS No. 158 requires recognition of the overfunded or underfunded status of defined benefit postretirement plans as an asset or liability in the statement of financial
42
position and requires companies to recognize changes in that funded status in comprehensive income (loss) in the year in which the changes occur. SFAS No. 158 also requires measurement of the funded status of a plan as of the date of the statement of financial position. SFAS No. 158 is effective for recognition of the funded status of benefit plans for fiscal years ending after December 15, 2006 and is effective for the measurement date provisions for fiscal years ending after December 15, 2008. The adoption of the recognition provisions at February 3, 2007 and the measurement date provisions at January 31, 2009 did not have a material impact on the Company's financial position and results of operations.
In May 2008, the FASB issued SFAS No. 162, "The Hierarchy of Generally Accepted Accounting Principles" ("SFAS No. 162"). SFAS No. 162 is intended to improve financial reporting by identifying a consistent framework, or hierarchy, for selecting accounting principles to be used in preparing financial statements that are presented in conformity with US GAAP for non-governmental entities. SFAS No. 162 is effective on November 15, 2008, which is 60 days following the SEC's September 16, 2008 approval of the Public Company Accounting Oversight Board amendments to AU Section 411, the meaning of "Present Fairly in Conformity with GAAP." Any effect of applying the provisions of SFAS No. 162 is to be reported as a change in accounting principle in accordance with FASB Statement No. 154, "Accounting Changes and Error Corrections." The Company's adoption of SFAS No. 162 will not have a material impact on its financial position and results of operations.
Item 7A. Quantitative and Qualitative Disclosures About Market Risk
Interest Rates. The Company's market risks relate primarily to changes in interest rates. The Company's credit facilities carry floating interest rates that are tied to the Eurodollar rate and the Prime rate and therefore, the consolidated statements of operations and the consolidated statements of cash flows will be exposed to changes in interest rates. A 1.0% interest rate increase would increase interest expenses by approximately $0.2 million annually. The Company historically has not engaged in interest rate hedging activities.
Currency Exchange Rates. The Company historically has not been exposed to currency exchange rate risks with respect to inventory purchases as such expenditures have been, and continue to be, denominated in U.S. Dollars. The Company purchases some of its inventory from suppliers in China, for which the Company pays U.S. Dollars. Since July 2005, China has been slowly increasing the value of the Chinese Yuan, which is now linked to a basket of world-currencies. If the exchange rate of the Chinese Yuan to the U.S. Dollar continues to increase, the Company may experience fluctuations in the cost of inventory purchased from China and the Company would adjust its supply chain accordingly.
Item 8. Financial Statements and Supplementary Data
The financial statements and schedule included in Part IV, "Item 15. Exhibits and Financial Statement Schedules" of this Annual Report on Form 10-K are incorporated herein by reference.
Item 9. Changes in and Disagreements with Accountants on Accounting and Financial Disclosure
None.
Item 9A. Controls and Procedures
- (a)
- Evaluation of disclosure controls and procedures
The Company carried out an evaluation, as of January 31, 2009, under the supervision and with the participation of the Company's management, including the Company's Principal Executive Officer and Principal Financial Officer, of the effectiveness of the design and operation of the Company's disclosure controls and procedures pursuant to Rule 13a-15(e) and 15d-15(e) of the Securities
43
Exchange Act of 1934, as amended. Based upon that evaluation, the Principal Executive Officer and Principal Financial Officer concluded that the Company's disclosure controls and procedures are effective in ensuring that all information required to be filed in this Annual Report on Form 10-K was (i) recorded, processed, summarized and reported within the time period specified in the Securities and Exchange Commission's rules and forms (ii) and that the disclosure controls and procedures include, without limitation, controls and procedures designed to ensure that information required to be disclosed by the Company in the reports that the Company files or submits under the Exchange Act is accumulated and communicated to the Company's management, including its Principal Executive and Principal Financial Officers, as appropriate to allow timely decisions regarding required disclosure.
- (b)
- Report of management on internal control over financial reporting
The Company's management is responsible for establishing and maintaining adequate internal control over financial reporting as defined in Rule 13a-15(f) and 15d-15(f) under the Securities Exchange Act of 1934, as amended. The Company's internal control over financial reporting is a process designed to provide reasonable assurance to the Company's management and Board of Directors regarding the reliability of financial reporting and the preparation and fair presentation of published financial statements in accordance with accounting principles generally accepted in the United States.
Because of its inherent limitations, internal control over financial reporting may not prevent or detect misstatements. Therefore, even those systems determined to be effective can provide only reasonable assurance with respect to financial statement preparation and presentation. Also, projections of any evaluation of the effectiveness to future periods are subject to the risk that controls may become inadequate because of changes in conditions, or that the degree of compliance with the policies or procedures may deteriorate.
Management assessed the effectiveness of the Company's internal control over financial reporting as of January 31, 2009. In making this assessment, management used the criteria established in theInternal Control—Integrated Framework report issued by the Committee of Sponsoring Organizations of the Treadway Commission (the "COSO criteria").
Based upon management's assessment and the COSO criteria, management believes that the Company maintained effective internal control over financial reporting as of January 31, 2009.
The Company's independent auditors, Ernst & Young LLP, a registered public accounting firm, have audited and reported on the consolidated financial statements of the Company and the effectiveness of the Company's internal control over financial reporting. The reports of the independent auditors appear on page 53 herein and expressed unqualified opinions on the consolidated financial statements and the effectiveness of the Company's internal control over financial reporting.
- (c)
- Changes in internal control over financial reporting
There has been no change in the Company's internal control over financial reporting identified in connection with the evaluation required by paragraph (d) of Exchange Act Rule 13a-15 or 15d-15 that occurred during the Company's last fiscal quarter (the Company's fourth fiscal quarter in the case of an annual report) that has materially affected, or is reasonably likely to materially affect, the Company's internal control over financial reporting.
Item 9A(T). Controls and Procedures
Not applicable.
None.
44
Item 10. Directors, Executive Officers and Corporate Governance
The information required by this Item is incorporated herein by reference from the Company's Proxy Statement for the Annual Meeting of Stockholders to be held June 29, 2009.
On July 24, 2008, the Company filed with the New York Stock Exchange ("NYSE") the Annual CEO Certification regarding the Company's compliance with the NYSE's corporate governance listing standards as required by Section 303A-12(a) of the NYSE Listed Company Manual. In addition, the Company has filed as exhibits to this annual report on Form 10-K and to the annual report on Form 10-K for the year ended February 2, 2008 the applicable certifications of its Chief Executive Officer and its Chief Financial Officer required under Section 302 of the Sarbanes-Oxley Act of 2002, regarding the quality of the Company's public disclosures.
Item 11. Executive Compensation
The information required by this Item is incorporated herein by reference from the Company's Proxy Statement for the Annual Meeting of Stockholders to be held June 29, 2009.
Item 12. Security Ownership of Certain Beneficial Owners and Management and Related Stockholder Matters
The information required by this Item is incorporated herein by reference from the Company's Proxy Statement for the Annual Meeting of Stockholders to be held June 29, 2009.
Item 13. Certain Relationships and Related Transactions, and Director Independence
The information required by this Item is incorporated herein by reference from the Company's Proxy Statement for the Annual Meeting of Stockholders to be held June 29, 2009.
Item 14. Principal Accountant Fees and Services
The information required by this Item is incorporated herein by reference from the Company's Proxy Statement for the Annual Meeting of Stockholders to be held June 29, 2009.
45
Item 15. Exhibits and Financial Statement Schedules
- (a)
- List of documents filed as part of this Annual Report:
- 1.
- The following consolidated financial statements of the Company are filed as part of this Annual Report:
- •
- Reports of Independent Registered Public Accounting Firm;
- •
- Consolidated Statements of Operations;
- •
- Consolidated Balance Sheets;
- •
- Consolidated Statements of Cash Flows;
- •
- Consolidated Statements of Stockholders' Equity; and
- •
- Notes to Consolidated Financial Statements.
- 2.
- Financial Statement Schedule II Valuation and Qualifying Accounts
Fiscal Year | Reserve Description | Balance at beginning of period | Additions Charged to Operations | Deductions | Balance at end of period | ||||||||||
|---|---|---|---|---|---|---|---|---|---|---|---|---|---|---|---|
| | | (Amounts in thousands) | |||||||||||||
2006 | Sales Return Reserve | $ | 2,113 | $ | 41,438 | $ | 41,578 | $ | 1,973 | ||||||
2007 | Sales Return Reserve | $ | 1,973 | $ | 39,800 | $ | 39,756 | $ | 2,017 | ||||||
2008 | Sales Return Reserve | $ | 2,017 | $ | 40,379 | $ | 40,717 | $ | 1,679 | ||||||
- 3.
- Exhibits
| Exhibit No. | Description | ||
|---|---|---|---|
| 3.1 | Restated Certificate of Incorporation.† | ||
| 3.2 | Amended and Restated Bylaws.†††† | ||
| 9.1 | Stockholders Agreement by and among New York & Company, Inc. and the stockholders party thereto, dated August 25, 2004.** | ||
| 9.2 | Amendment No. 4 to Stockholders Agreement by and among New York & Company, Inc. and the stockholders party thereto, dated May 22, 2006.††† | ||
| 9.3 | Amendment No. 5 to Stockholders Agreement by and among New York & Company, Inc. and the stockholders party thereto, dated August 16, 2006.+ | ||
| 10.1 | Second Amended and Restated Employment Agreement between New York & Company, Inc. and Richard P. Crystal, dated August 25, 2004.** | ||
| 10.2 | Amendment No. 1 to Second Amended and Restated Employment Agreement, dated August 25, 2004, between New York & Company, Inc. and Richard P. Crystal, as amended on December 22, 2006.++ | ||
| 10.3 | Amendment No. 2 to Second Amended and Restated Employment Agreement, dated August 25, 2004, between New York & Company, Inc. and Richard P. Crystal, as amended on May 4, 2007.++ | ||
| 10.4 | Amendment No. 3 to Second Amended and Restated Employment Agreement, dated August 25, 2004, between New York & Company, Inc. and Richard P. Crystal, as amended on April 10, 2008.++ | ||
46
| Exhibit No. | Description | ||
|---|---|---|---|
| 10.5 | Amendment No. 4 to Second Amended and Restated Employment Agreement, dated August 25, 2004, between New York & Company, Inc. and Richard P. Crystal, as amended on January 28, 2009. | ||
| 10.6 | Second Amended and Restated Employment Agreement between New York & Company, Inc. and Ronald W. Ristau, dated August 25, 2004.** | ||
| 10.7 | Amendment No. 1 to Second Amended and Restated Employment Agreement, dated August 25, 2004, between New York & Company, Inc. and Ronald W. Ristau, as amended on December 22, 2006.++ | ||
| 10.8 | Amendment No. 2 to Second Amended and Restated Employment Agreement, dated August 25, 2004, between New York & Company, Inc. and Ronald W. Ristau, as amended on April 10, 2008.++ | ||
| 10.9 | Separation Agreement and General Release between New York & Company, Inc., Lerner New York, Inc. and Ronald W. Ristau, dated November 19, 2008. T T T | ||
| 10.10 | Amendment No. 1 to Separation Agreement and General Release, dated November 19, 2008, between New York & Company, Inc., Lerner New York, Inc. and Ronald W. Ristau, as amended on January 27, 2009. | ||
| 10.11 | Employment Letter, dated as of March 13, 2006, between New York & Company, Inc. and Sandra Brooslin Viviano.†† | ||
| 10.12 | Employment Letter, dated as of March 13, 2006, between New York & Company, Inc. and John DeWolf.†† | ||
| 10.13 | Employment Letter, dated as of April 20, 2006, between New York & Company, Inc. and Leslie Goldmann. | ||
| 10.14 | Employment Letter, dated as of November 3, 2008, between New York & Company, Inc. and Sheamus Toal. | ||
| 10.15 | Amendment No.1 to Employment Letter, dated as of March 13, 2006, between New York & Company, Inc. and Sandra Brooslin Viviano, as amended December 22, 2006.††† | ||
| 10.16 | Amendment No.1 to Employment Letter, dated as of March 13, 2006 between New York & Company, Inc. and John DeWolf, as amended December 22, 2006.††† | ||
| 10.17 | Amendment No.1 to Employment Letter, dated as of April 20, 2006 between New York & Company, Inc. and Leslie Goldmann, as amended December 22, 2006. | ||
| 10.18 | Transition Services Agreement by and between Lerner New York Holding, Inc. and Limited Brands, Inc., dated as of November 27, 2002.* | ||
| 10.19 | Amendment No. 1 to Transition Services Agreement, dated as of November 27, 2002, between Lerner New York Holding, Inc., New York & Company, Inc. as successor-in-interest to NY & Co. Group, Inc. and Limited Brands, Inc., as amended on April 19, 2006. T | ||
| 10.20 | Amendment No. 2 to Transition Services Agreement, dated as of November 27, 2002, between Lerner New York Holding, Inc., New York & Company, Inc. as successor-in-interest to NY & Co. Group, Inc. and Limited Brands, Inc., as amended on October 11, 2007. | ||
| 10.21 | Amendment No. 3 to Transition Services Agreement, dated as of November 27, 2002, between Lerner New York Holding, Inc., New York & Company, Inc. as successor-in-interest to NY & Co. Group, Inc. and Limited Brands, Inc., as amended on July 17, 2008. | ||
| 10.22 | Amendment No. 4 to Transition Services Agreement, dated as of November 27, 2002, between Lerner New York Holding, Inc., New York & Company, Inc. as successor-in-interest to NY & Co. Group, Inc. and Limited Brands, Inc., as amended on April 6, 2009. | ||
47
| Exhibit No. | Description | ||
|---|---|---|---|
| 10.23 | Second Amended and Restated Loan and Security Agreement by and among Lerner New York, Inc., Lernco, Inc., Jasmine Company, Inc., Wachovia Bank, National Association, as Agent for itself and the other Lender named therein, dated as of August 22, 2007. T T | ||
| 10.24 | Amendment No. 1 to Second Amended and Restated Loan and Security Agreement by and among Lerner New York, Inc., Lernco, Inc., Jasmine Company, Inc., Wachovia Bank, National Association, as Agent for itself and the other Lender named therein, dated as of December 9, 2008. T T T | ||
| 10.25 | Second Amended and Restated Guarantee made by New York & Company, Inc., Lerner New York Holding, Inc., Nevada Receivable Factoring, Inc., Associated Lerner Shops of America, Inc. and Lerner New York GC, LLC in favor of Wachovia Bank, National Association, as Agent for itself and the other Lender named in the Second Amended and Restated Loan and Security Agreement, dated as of August 22, 2007. T T | ||
| 10.26 | Second Amended and Restated Collateral Assignment of Trademarks made among Lernco, Inc. and Jasmine Company, Inc. in favor of Wachovia Bank, National Association, as Agent for itself and the other Lender named in the Second Amended and Restated Loan and Security Agreement, dated as of August 22, 2007. T T | ||
| 10.27 | Amended and Restated Collateral Assignment of Trademarks made among Lerner New York, Inc. in favor of Wachovia Bank, National Association, as Agent for itself and the other Lender named in the Second Amended and Restated Loan and Security Agreement, dated as of August 22, 2007. T T | ||
| 10.28 | Second Amended and Restated Stock Pledge Agreement by and between Lerner New York, Inc. and Wachovia Bank, National Association, as Agent for itself and the other Lender named in the Second Amended and Restated Loan and Security Agreement, dated as of August 22, 2007. T T | ||
| 10.29 | Second Amended and Restated Stock Pledge Agreement by and between Lerner New York Holding, Inc. and Wachovia Bank, National Association, as Agent for itself and the other Lender named in the Second Amended and Restated Loan and Security Agreement, dated as of August 22, 2007. T T | ||
| 10.30 | Second Amended and Restated Stock Pledge Agreement by and between New York & Company, Inc. and Wachovia Bank, National Association, as Agent for itself and the other Lender named in the Second Amended and Restated Loan and Security Agreement, dated as of August 22, 2007. T T | ||
| 10.31 | Second Amended and Restated Intercompany Subordination Agreement made among the Obligors, as defined in the Second Amended and Restated Loan and Security Agreement, and Wachovia Bank, National Association, as Agent for itself and the other Lender named in the Second Amended and Restated Loan and Security Agreement, dated as of August 22, 2007. T T | ||
| 10.32 | Performance Unit Award Agreement, dated as of January 28, 2009, between New York & Company, Inc. and Richard P. Crystal. | ||
| 10.33 | Form of Amended and Restated 2002 Stock Option Plan that became effective immediately prior to the consummation of the Company's initial public offering.** | ||
| 10.34 | New York & Company, Inc. 2006 Long-Term Incentive Plan approved by the Company's Board of Directors and Stockholders on May 3, 2006 and June 21, 2006, respectively. +++ | ||
| 21.1 | Subsidiaries of the Registrant.†† | ||
| 23.1 | Consent of Ernst & Young LLP, Independent Registered Public Accounting Firm. | ||
| 31.1 | Certification by the Chairman and Chief Executive Officer, pursuant to Section 302 of the Sarbanes-Oxley Act of 2002, dated April 7, 2009. | ||
48
| Exhibit No. | Description | ||
|---|---|---|---|
| 31.2 | Certification by the Chief Financial Officer, pursuant to Section 302 of the Sarbanes-Oxley Act of 2002, dated April 7, 2009. | ||
| 32.1 | Written Statement of the Chief Executive Officer and the Chief Financial Officer pursuant to Section 906 of the Sarbanes-Oxley act of 2002, dated April 7, 2009. | ||
| † | Incorporated by reference from the Company's Annual Report on Form 10-K for the fiscal year ended January 29, 2005, as filed with the SEC on April 19, 2005. | |
| †† | Incorporated by reference from the Company's Annual Report on Form 10-K for the fiscal year ended January 28, 2006, as filed with the SEC on April 7, 2006. | |
| ††† | Incorporated by reference from the Company's Annual Report on Form 10-K for the fiscal year ended February 3, 2007, as filed with the SEC on April 6, 2007. | |
| †††† | Incorporated by reference from the Company's Annual Report on Form 10-K for the fiscal year ended February 2, 2008, as filed with the SEC on April 8, 2008. | |
| T | Incorporated by reference from the Company's Quarterly Report on Form 10-Q for the quarter ended April 29, 2006, as filed with the SEC on June 8, 2006. | |
| T T | Incorporated by reference from the Company's Quarterly Report on Form 10-Q for the quarter ended August 4, 2007, as filed with the SEC on September 7, 2007. | |
| T T T | Incorporated by reference from the Company's Quarterly Report on Form 10-Q for the quarter ended November 1, 2008, as filed with the SEC on December 11, 2008. | |
| * | Incorporated by reference from Amendment No. 1 to the Company's Registration Statement on Form S-1 as filed with the SEC on July 9, 2004. | |
| ** | Incorporated by reference from Amendment No. 3 to the Company's Registration Statement on Form S-1 as filed with the SEC on September 14, 2004. | |
| + | Incorporated by reference from the Company's Current Report on Form 8-K filed with the SEC on August 17, 2006. | |
| ++ | Incorporated by reference from the Company's Current Report on Form 8-K filed with the SEC on April 11, 2008. | |
| +++ | Incorporated by reference from the Company's 2006 Proxy Statement, as filed with the SEC on May 19, 2006. |
- (b)
- The exhibits listed in the Exhibit Index attached hereto are filed as part of this Annual Report on Form 10-K and are incorporated herein by reference.
- (c)
- Not applicable.
49
Pursuant to the requirements of Section 13 or 15(d) of the Securities Exchange Act of 1934, as amended, the registrant has duly caused this report to be signed on its behalf by the undersigned, thereunto duly authorized, on April 7, 2009.
| NEW YORK & COMPANY, INC. (REGISTRANT) | |||
/s/ SHEAMUS G. TOAL Sheamus G. Toal Executive Vice President and Chief Financial Officer (Principal financial officer and Principal accounting officer) | |||
Pursuant to the requirements of the Securities Exchange Act of 1934, as amended, this report has been signed below by the following persons on behalf of the registrant and in the capacities indicated.
Name | Title | Date | ||
|---|---|---|---|---|
| /s/ RICHARD P. CRYSTAL Richard P. Crystal | Chairman and Chief Executive Officer (Principal executive officer) | April 7, 2009 | ||
/s/ SHEAMUS G. TOAL Sheamus G. Toal | Executive Vice President and Chief Financial Officer (Principal financial officer and Principal accounting officer) | April 7, 2009 | ||
/s/ BODIL M. ARLANDER Bodil M. Arlander | Director | April 7, 2009 | ||
/s/ PHILIP M. CARPENTER III Philip M. Carpenter III | Director | April 7, 2009 | ||
/s/ DAVID H. EDWAB David H. Edwab | Director | April 7, 2009 | ||
/s/ JOHN D. HOWARD John D. Howard | Director | April 7, 2009 | ||
/s/ LOUIS LIPSCHITZ Louis Lipschitz | Director | April 7, 2009 |
50
Name | Title | Date | ||
|---|---|---|---|---|
| /s/ EDWARD W. MONEYPENNY Edward W. Moneypenny | Director | April 7, 2009 | ||
/s/ GRACE NICHOLS Grace Nichols | Director | April 7, 2009 | ||
/s/ RICHARD L. PERKAL Richard L. Perkal | Director | April 7, 2009 | ||
/s/ ARTHUR E. REINER Arthur E. Reiner | Director | April 7, 2009 | ||
/s/ PAMELA GRUNDER SHEIFFER Pamela Grunder Sheiffer | Director | April 7, 2009 |
51
New York & Company, Inc. and Subsidiaries
Consolidated Financial Statements
Index to Financial Statements
| | Page | |
|---|---|---|
Reports of Independent Registered Public Accounting Firm | 53 | |
Consolidated Statements of Operations for the years ended January 31, 2009, February 2, 2008, and February 3, 2007 | 55 | |
Consolidated Balance Sheets as of January 31, 2009 and February 2, 2008 | 56 | |
Consolidated Statements of Cash Flows for the years ended January 31, 2009, February 2, 2008, and February 3, 2007 | 57 | |
Consolidated Statements of Stockholders' Equity for the years ended January 31, 2009, February 2, 2008 and February 3, 2007 | 58 | |
Notes to Consolidated Financial Statements | 59 |
52
REPORT OF INDEPENDENT REGISTERED PUBLIC ACCOUNTING FIRM
To the Board of Directors and Shareholders of New York & Company, Inc. and subsidiaries
We have audited New York & Company, Inc. and subsidiaries' internal control over financial reporting as of January 31, 2009, based on criteria established in Internal Control—Integrated Framework issued by the Committee of Sponsoring Organizations of the Treadway Commission (the COSO criteria). New York & Company, Inc. and subsidiaries' management is responsible for maintaining effective internal control over financial reporting, and for its assessment of the effectiveness of internal control over financial reporting included in the accompanying Report of Management on Internal Control over Financial Reporting. Our responsibility is to express an opinion on the company's internal control over financial reporting based on our audit.
We conducted our audit in accordance with the standards of the Public Company Accounting Oversight Board (United States). Those standards require that we plan and perform the audit to obtain reasonable assurance about whether effective internal control over financial reporting was maintained in all material respects. Our audit included obtaining an understanding of internal control over financial reporting, assessing the risk that a material weakness exists, testing and evaluating the design and operating effectiveness of internal control based on the assessed risk, and performing such other procedures as we considered necessary in the circumstances. We believe that our audit provides a reasonable basis for our opinion.
A company's internal control over financial reporting is a process designed to provide reasonable assurance regarding the reliability of financial reporting and the preparation of financial statements for external purposes in accordance with generally accepted accounting principles. A company's internal control over financial reporting includes those policies and procedures that (1) pertain to the maintenance of records that, in reasonable detail, accurately and fairly reflect the transactions and dispositions of the assets of the company; (2) provide reasonable assurance that transactions are recorded as necessary to permit preparation of financial statements in accordance with generally accepted accounting principles, and that receipts and expenditures of the company are being made only in accordance with authorizations of management and directors of the company; and (3) provide reasonable assurance regarding prevention or timely detection of unauthorized acquisition, use, or disposition of the company's assets that could have a material effect on the financial statements.
Because of its inherent limitations, internal control over financial reporting may not prevent or detect misstatements. Also, projections of any evaluation of effectiveness to future periods are subject to the risk that controls may become inadequate because of changes in conditions, or that the degree of compliance with the policies or procedures may deteriorate.
In our opinion, New York & Company, Inc. and subsidiaries maintained, in all material respects, effective internal control over financial reporting as of January 31, 2009, based on the COSO criteria.
We also have audited, in accordance with the standards of the Public Company Accounting Oversight Board (United States), the consolidated balance sheets of New York & Company, Inc. and subsidiaries as of January 31, 2009 and February 2, 2008, and the related consolidated statements of operations, changes in stockholders' equity and cash flows for each of the three years in the period ended January 31, 2009 and our report dated March 18, 2009 expressed an unqualified opinion thereon.
/s/ ERNST & YOUNG LLP |
New York, New York
March 18, 2009
53
REPORT OF INDEPENDENT REGISTERED PUBLIC ACCOUNTING FIRM
To the Board of Directors and Shareholders of New York & Company, Inc. and subsidiaries
We have audited the accompanying consolidated balance sheets of New York & Company, Inc. and subsidiaries (the "Company") as of January 31, 2009 and February 2, 2008, and the related consolidated statements of operations, stockholders' equity, and cash flows for each of the three years in the period ended January 31, 2009. Our audits also included the financial statement schedule listed in the index at Item 15. These financial statements and schedule are the responsibility of the Company's management. Our responsibility is to express an opinion on these financial statements and schedule based on our audits.
We conducted our audits in accordance with the standards of the Public Company Accounting Oversight Board (United States). Those standards require that we plan and perform the audit to obtain reasonable assurance about whether the financial statements are free of material misstatement. An audit includes examining, on a test basis, evidence supporting the amounts and disclosures in the financial statements. An audit also includes assessing the accounting principles used and significant estimates made by management, as well as evaluating the overall financial statement presentation. We believe that our audits provide a reasonable basis for our opinion.
In our opinion, the financial statements referred to above present fairly, in all material respects, the consolidated financial position of New York & Company, Inc. and subsidiaries at January 31, 2009 and February 2, 2008, and the consolidated results of their operations and their cash flows for each of the three years in the period ended January 31, 2009, in conformity with U.S. generally accepted accounting principles. Also, in our opinion, the related financial statement schedule, when considered in relation to the basic financial statements taken as a whole, present fairly in all material respects the information set forth therein.
We also have audited, in accordance with the standards of the Public Company Accounting Oversight Board (United States), New York & Company, Inc. and subsidiaries' internal control over financial reporting as of January 31, 2009, based on criteria established in Internal Control—Integrated Framework issued by the Committee of Sponsoring Organizations of the Treadway Commission and our report dated March 18, 2009 expressed an unqualified opinion thereon.
/s/ ERNST & YOUNG LLP |
New York, New York
March 18, 2009
54
New York & Company, Inc. and Subsidiaries
Consolidated Statements of Operations
| | Fiscal year ended January 31, 2009 (52-weeks) | Fiscal year ended February 2, 2008 (52-weeks) | Fiscal year ended February 3, 2007 (53-weeks) | ||||||||
|---|---|---|---|---|---|---|---|---|---|---|---|
| | (Amounts in thousands, except per share amounts) | ||||||||||
Net sales | $ | 1,139,853 | $ | 1,194,944 | $ | 1,153,333 | |||||
Cost of goods sold, buying and occupancy costs | 843,478 | 851,739 | 786,757 | ||||||||
Gross profit | 296,375 | 343,205 | 366,576 | ||||||||
Selling, general and administrative expenses | 306,101 | 298,325 | 284,664 | ||||||||
Restructuring charges | 24,529 | — | — | ||||||||
Operating (loss) income | (34,255 | ) | 44,880 | 81,912 | |||||||
Interest expense, net of interest income of $1,026, $1,534 and $1,416, respectively | 726 | 1,200 | 1,663 | ||||||||
(Loss) income from continuing operations before income taxes | (34,981 | ) | 43,680 | 80,249 | |||||||
(Benefit) provision for income taxes | (14,683 | ) | 17,004 | 31,853 | |||||||
(Loss) income from continuing operations | (20,298 | ) | 26,676 | 48,396 | |||||||
Income (loss) from discontinued operations, net of taxes | 491 | (31,533 | ) | (2,226 | ) | ||||||
Net (loss) income | $ | (19,807 | ) | $ | (4,857 | ) | $ | 46,170 | |||
Basic (loss) earnings per share: | |||||||||||
Basic (loss) earnings per share from continuing operations | $ | (0.34 | ) | $ | 0.46 | $ | 0.86 | ||||
Basic earnings (loss) per share from discontinued operations | 0.01 | (0.54 | ) | (0.04 | ) | ||||||
Basic (loss) earnings per share | $ | (0.33 | ) | $ | (0.08 | ) | $ | 0.82 | |||
Diluted (loss) earnings per share: | |||||||||||
Diluted (loss) earnings per share from continuing operations | $ | (0.34 | ) | $ | 0.44 | $ | 0.81 | ||||
Diluted earnings (loss) per share from discontinued operations | 0.01 | (0.52 | ) | (0.04 | ) | ||||||
Diluted (loss) earnings per share | $ | (0.33 | ) | $ | (0.08 | ) | $ | 0.77 | |||
Weighted average shares outstanding: | |||||||||||
Basic shares of common stock | 59,650 | 58,537 | 56,072 | ||||||||
Diluted shares of common stock | 59,650 | 61,028 | 60,031 | ||||||||
See accompanying notes.
55
New York & Company, Inc. and Subsidiaries
Consolidated Balance Sheets
| | January 31, 2009 | February 2, 2008 | ||||||
|---|---|---|---|---|---|---|---|---|
| | (Amounts in thousands, except per share amounts) | |||||||
Assets | ||||||||
Current assets: | ||||||||
Cash and cash equivalents | $ | 54,280 | $ | 73,734 | ||||
Accounts receivable | 11,993 | 18,523 | ||||||
Income taxes receivable | 10,202 | 11,730 | ||||||
Inventories, net | 104,861 | 103,923 | ||||||
Prepaid expenses | 24,610 | 21,991 | ||||||
Other current assets | 2,390 | 1,913 | ||||||
Current assets of discontinued operations | 110 | 716 | ||||||
Total current assets | 208,446 | 232,530 | ||||||
Property and equipment, net | 217,248 | 239,557 | ||||||
Intangible assets | 14,879 | 14,843 | ||||||
Deferred income taxes | 14,897 | — | ||||||
Other assets | 1,343 | 1,500 | ||||||
Non-current assets of discontinued operations | — | 26 | ||||||
Total assets | $ | 456,813 | $ | 488,456 | ||||
Liabilities and stockholders' equity | ||||||||
Current liabilities: | ||||||||
Current portion—long-term debt | $ | 6,000 | $ | 6,000 | ||||
Accounts payable | 68,431 | 77,177 | ||||||
Accrued expenses | 61,121 | 53,618 | ||||||
Deferred income taxes | 2,020 | 3,928 | ||||||
Current liabilities of discontinued operations | 275 | 7,328 | ||||||
Total current liabilities | 137,847 | 148,051 | ||||||
Long-term debt, net of current portion | 13,500 | 19,500 | ||||||
Deferred income taxes | — | 3,747 | ||||||
Deferred rent | 75,848 | 72,537 | ||||||
Other liabilities | 7,122 | 4,660 | ||||||
Total liabilities | 234,317 | 248,495 | ||||||
Commitments and contingencies | ||||||||
Stockholders' equity: | ||||||||
Common stock, voting, par value $0.001; 300,000 shares authorized; 60,508 and 59,286 shares issued and outstanding at January 31, 2009 and February 2, 2008, respectively | 60 | 59 | ||||||
Additional paid-in capital | 152,330 | 148,208 | ||||||
Retained earnings | 72,158 | 91,974 | ||||||
Accumulated other comprehensive loss | (2,052 | ) | (280 | ) | ||||
Total stockholders' equity | 222,496 | 239,961 | ||||||
Total liabilities and stockholders' equity | $ | 456,813 | $ | 488,456 | ||||
See accompanying notes.
56
New York & Company, Inc. and Subsidiaries
Consolidated Statements of Cash Flows
| | Fiscal year ended January 31, 2009 (52-weeks) | Fiscal year ended February 2, 2008 (52-weeks) | Fiscal year ended February 3, 2007 (53-weeks) | |||||||||
|---|---|---|---|---|---|---|---|---|---|---|---|---|
| | (Amounts in thousands) | |||||||||||
Operating activities | ||||||||||||
Net (loss) income | $ | (19,807 | ) | $ | (4,857 | ) | $ | 46,170 | ||||
Less: Income (loss) from discontinued operations, net of taxes | 491 | (31,533 | ) | (2,226 | ) | |||||||
(Loss) income from continuing operations | (20,298 | ) | 26,676 | 48,396 | ||||||||
Adjustments to reconcile net (loss) income to net cash provided by operating activities of continuing operations: | ||||||||||||
Depreciation and amortization | 43,939 | 38,500 | 31,607 | |||||||||
Loss from impairment charges | 22,854 | — | — | |||||||||
Amortization of deferred financing costs | 232 | 234 | 277 | |||||||||
Share-based compensation expense | 1,575 | 1,660 | 1,665 | |||||||||
Deferred income taxes | (19,361 | ) | 1,262 | (1,326 | ) | |||||||
Changes in operating assets and liabilities: | ||||||||||||
Accounts receivable | 6,530 | (4,737 | ) | (1,117 | ) | |||||||
Income taxes receivable | 1,528 | (11,730 | ) | — | ||||||||
Inventories, net | (938 | ) | (1,667 | ) | 3,477 | |||||||
Prepaid expenses | (2,619 | ) | (2,408 | ) | (1,129 | ) | ||||||
Accounts payable | (8,746 | ) | 14,223 | (26,607 | ) | |||||||
Accrued expenses | 7,503 | (5,575 | ) | 4,109 | ||||||||
Income taxes payable | — | (6,391 | ) | 6,391 | ||||||||
Deferred rent | 3,311 | 18,704 | 19,217 | |||||||||
Other assets and liabilities | (1,047 | ) | 2,177 | (481 | ) | |||||||
Net cash provided by operating activities of continuing operations | 34,463 | 70,928 | 84,479 | |||||||||
Investing activities | ||||||||||||
Acquisition of trademarks | (36 | ) | — | — | ||||||||
Proceeds from sale of fixed assets | 260 | — | — | |||||||||
Capital expenditures | (44,576 | ) | (75,464 | ) | (77,536 | ) | ||||||
Net cash used in investing activities of continuing operations | (44,352 | ) | (75,464 | ) | (77,536 | ) | ||||||
Financing activities | ||||||||||||
Net proceeds from public offering | — | — | 2,295 | |||||||||
Payment of offering costs related to public offering | — | — | (439 | ) | ||||||||
Repayment of debt | (6,000 | ) | (6,000 | ) | (6,000 | ) | ||||||
Payment of financing costs | (183 | ) | (369 | ) | — | |||||||
Proceeds from exercise of stock options | 167 | 265 | 1,209 | |||||||||
Excess tax benefit from exercise of stock options | 2,381 | 4,481 | 12,531 | |||||||||
Other | — | (175 | ) | — | ||||||||
Net cash (used in) provided by financing activities of continuing operations | (3,635 | ) | (1,798 | ) | 9,596 | |||||||
Cash flows from discontinued operations | ||||||||||||
Operating cash flows | (6,152 | ) | 12,628 | (496 | ) | |||||||
Investing cash flows | — | (401 | ) | (5,415 | ) | |||||||
Financing cash flows | — | — | — | |||||||||
Net cash (used in) provided by discontinued operations | (6,152 | ) | 12,227 | (5,911 | ) | |||||||
Net (decrease) increase in cash and cash equivalents | (19,676 | ) | 5,893 | 10,628 | ||||||||
Cash and cash equivalents at beginning of period (including cash at discontinued operations of $223, $206 and $1,593, respectively) | 73,957 | 68,064 | 57,436 | |||||||||
Cash and cash equivalents at end of period (including cash at discontinued operations of $1, $223 and $206, respectively) | $ | 54,281 | $ | 73,957 | $ | 68,064 | ||||||
Cash paid during the period for interest | $ | 1,608 | $ | 2,571 | $ | 2,873 | ||||||
Cash paid during the period for taxes | $ | 3,555 | $ | 8,186 | $ | 11,130 | ||||||
See accompanying notes.
57
New York & Company, Inc. and Subsidiaries
Consolidated Statements of Stockholders' Equity
| | Common Stock | | | Accumulated Other Comprehensive Loss | | ||||||||||||||
|---|---|---|---|---|---|---|---|---|---|---|---|---|---|---|---|---|---|---|---|
| | Additional Paid-in Capital | Retained Earnings | | ||||||||||||||||
| | Shares | Amount | Total | ||||||||||||||||
| | (Amounts in thousands) | ||||||||||||||||||
Balance at January 28, 2006 | 54,629 | $ | 55 | $ | 126,490 | $ | 52,974 | $ | (469 | ) | $ | 179,050 | |||||||
Fees related to the public offering | — | — | (89 | ) | — | — | (89 | ) | |||||||||||
Stock options exercised | 2,872 | 2 | 1,207 | — | — | 1,209 | |||||||||||||
Restricted stock issued | 37 | — | — | — | — | — | |||||||||||||
Excess tax benefit from exercise of stock options | — | — | 12,531 | — | — | 12,531 | |||||||||||||
Share-based compensation expense | — | — | 1,665 | — | — | 1,665 | |||||||||||||
Net income | — | — | — | 46,170 | — | 46,170 | |||||||||||||
Minimum pension liability adjustment, net of tax | — | — | — | — | 263 | 263 | |||||||||||||
Comprehensive income, net of tax | — | — | — | — | — | 46,433 | |||||||||||||
Balance at February 3, 2007 | 57,538 | 57 | 141,804 | 99,144 | (206 | ) | 240,799 | ||||||||||||
Stock options exercised | 1,734 | 2 | 263 | — | — | 265 | |||||||||||||
Restricted stock issued | 14 | — | — | — | — | — | |||||||||||||
Excess tax benefit from exercise of stock options | — | — | 4,481 | — | — | 4,481 | |||||||||||||
Share-based compensation expense | — | — | 1,660 | — | — | 1,660 | |||||||||||||
Cumulative effect of adoption of FIN 48 | — | — | — | (2,313 | ) | — | (2,313 | ) | |||||||||||
Net loss | — | — | — | (4,857 | ) | — | (4,857 | ) | |||||||||||
Minimum pension liability adjustment, net of tax | — | — | — | — | (74 | ) | (74 | ) | |||||||||||
Comprehensive loss, net of tax | — | — | — | — | — | (4,931 | ) | ||||||||||||
Balance at February 2, 2008 | 59,286 | 59 | 148,208 | 91,974 | (280 | ) | 239,961 | ||||||||||||
Stock options exercised | 820 | 1 | 166 | — | — | 167 | |||||||||||||
Restricted stock issued | 410 | — | — | — | — | — | |||||||||||||
Restricted stock forfeits | (8 | ) | — | — | — | — | — | ||||||||||||
Excess tax benefit from exercise of stock options | — | — | 2,381 | — | — | 2,381 | |||||||||||||
Share-based compensation expense | — | — | 1,575 | — | — | 1,575 | |||||||||||||
Cumulative effect of adoption of SFAS 158 | — | — | — | (9 | ) | — | (9 | ) | |||||||||||
Net loss | — | — | — | (19,807 | ) | — | (19,807 | ) | |||||||||||
Minimum pension liability adjustment, net of tax | — | — | — | — | (1,772 | ) | (1,772 | ) | |||||||||||
Comprehensive loss, net of tax | — | — | — | — | — | (21,579 | ) | ||||||||||||
Balance at January 31, 2009 | 60,508 | $ | 60 | $ | 152,330 | $ | 72,158 | $ | (2,052 | ) | $ | 222,496 | |||||||
See accompanying notes.
58
New York & Company, Inc.
Notes to Consolidated Financial Statements
January 31, 2009
1. Organization and Basis of Presentation of Financial Statements
Formation of New York & Company, Inc.
New York & Company, Inc. (together with its subsidiaries, collectively the "Company") is a leading specialty retailer of fashion-oriented, moderately-priced women's apparel. The Company designs and sources its proprietary branded New York & Company™ merchandise sold exclusively through its national network of retail stores and E-commerce store atwww.nyandcompany.com. The target customers for the Company's New York & Company merchandise are fashion-conscious, value-sensitive women between the ages of 25 and 45. As of January 31, 2009, the Company operated 589 stores in 44 states.
The Company was founded in 1918 and operated as a subsidiary of Limited Brands, Inc. ("Limited Brands") from 1985 to 2002. New York & Company, Inc., formerly known as NY & Co. Group, Inc., was incorporated in the state of Delaware on November 8, 2002. It was formed to acquire all of the outstanding stock of Lerner New York Holding, Inc. ("Lerner Holding") and its subsidiaries from Limited Brands, an unrelated company. On November 27, 2002, Irving Place Capital, formerly known as Bear Stearns Merchant Banking, completed the acquisition of Lerner Holding and its subsidiaries from Limited Brands (the "acquisition of Lerner Holding"). On October 6, 2004, the Company completed an initial public offering and listed its common stock on the New York Stock Exchange.
Basis of Presentation and Principles of Consolidation
The Company's fiscal year is a 52 or 53 week year that ends on the Saturday closest to January 31. The accompanying consolidated financial statements include the accounts of the Company for the 52-weeks ended January 31, 2009 ("fiscal year 2008"), the 52-weeks ended February 2, 2008 ("fiscal year 2007"), and the 53-weeks ended February 3, 2007 ("fiscal year 2006"). Lerner Holding's wholly owned subsidiaries consist of Lerner New York, Inc. (and its wholly owned subsidiaries, which includes Jasmine Company, Inc.), Lernco, Inc., and Nevada Receivable Factoring, Inc. On a stand alone basis, without the consolidation of Lerner Holding and its subsidiaries, New York & Company, Inc. has no significant independent assets or operations. All significant intercompany balances and transactions have been eliminated in consolidation.
On October 18, 2007, the Company announced its decision to close all stores operated by the Company's subsidiary, Jasmine Company, Inc. ("JasmineSola"), by the end of the fourth quarter of fiscal year 2007. JasmineSola was a women's retailer of upscale and contemporary apparel, footwear and accessories sold through its chain of JasmineSola™ branded stores, which the Company acquired on July 19, 2005. The Company decided to exit the JasmineSola business after a thorough assessment and analysis. This decision enabled the Company to focus financial and management resources on its New York & Company brand. As of February 2, 2008, the Company completed the closure of all of the Company's JasmineSola stores and substantially completed all other exit procedures. As a result, the Company's financial statements reflect JasmineSola as discontinued operations for all periods. Unless otherwise noted, the information presented in these Notes to Consolidated Financial Statements relates to the New York & Company business.
59
New York & Company, Inc.
Notes to Consolidated Financial Statements (Continued)
January 31, 2009
2. Summary of Significant Accounting Policies
Revenue Recognition
Revenue from the sale of merchandise at the Company's stores is recognized at the time the customer takes possession of the related merchandise and the purchases are paid for, primarily with either cash or credit card. Revenue from the sale of merchandise at the Company's E-commerce store is recognized when the merchandise is shipped to the customer and the purchases are paid for. Revenue for gift certificate and gift card sales and store credits is recognized at redemption. Prior to their redemption, the gift certificates, gift cards and store credits are recorded as a liability. Discounts and promotional coupons offered to customers are accounted for as a reduction of sales revenue at the time the coupons are tendered by the customer. The Company presents sales taxes collected from customers on a net basis (excluded from revenues).
The Company issues gift cards which do not contain provisions for expiration or inactivity fees. The portion of the dollar value of gift cards that ultimately is not used by customers to make purchases is known as breakage. The Company estimates gift card breakage and records such amount as revenue as gift cards are redeemed. The Company's estimate of gift card breakage is based on analysis of historical redemption patterns as well as the remaining balance of gift cards for which the Company believes the likelihood of redemption to be remote.
Reserve for Returns
The Company reserves for sales returns through reductions in sales and gross margin based upon historical merchandise returns experience and current sales levels.
Cash and Cash Equivalents
Cash and cash equivalents include all cash in banks, cash on-hand, and all short-term investments with an original maturity of three months or less when purchased.
Inventories
Inventories are valued at the lower of average cost or market, on a weighted average cost basis, using the retail method.
Deferred Rent
The Company recognizes fixed minimum rent expense on non-cancelable leases on a straight-line basis over the term of each individual lease including the build-out period. The difference between recognized rental expense and amounts payable under the lease is recorded as a deferred lease liability. In addition, the Company recognizes landlord allowances as a deferred lease liability, which is amortized over the term of the related lease as a reduction to rent expense. For contingent rent expense based upon sales, the Company estimates annual contingent rent expense and recognizes a portion each month based on actual sales. At January 31, 2009 and February 2, 2008, the deferred lease liability was $75.8 million and $72.5 million, respectively, and is reported as deferred rent on the consolidated balance sheets. The increase in deferred rent during fiscal year 2008 is primarily related to the 25 new stores opened and 14 stores remodeled during the fiscal year.
60
New York & Company, Inc.
Notes to Consolidated Financial Statements (Continued)
January 31, 2009
2. Summary of Significant Accounting Policies (Continued)
Property and Equipment
Property and equipment are recorded at cost. Expenditures for new properties and improvements are capitalized, while the cost of repair and maintenance is charged to expense. Depreciation of property and equipment is provided on a straight-line basis over the estimated useful lives of the assets.
The estimated useful lives of property and equipment, for financial statement purposes, are as follows:
Depreciable Fixed Assets | Useful Life | |
|---|---|---|
Land | — | |
Store fixtures and equipment | 3-10 years | |
Office furniture, fixtures, and equipment | 3-10 years | |
Software | 3-5 years | |
Leasehold improvements | Lesser of the useful life or the term of the lease |
Cost of Goods Sold, Buying and Occupancy Costs
Cost of goods sold, buying and occupancy costs is comprised of direct inventory costs for merchandise sold, distribution, payroll and related costs for the Company's design, sourcing, production, merchandising, planning and allocation personnel, and store occupancy and related costs.
Share-Based Compensation
In December 2004, the Financial Accounting Standards Board ("FASB") published Statement of Financial Accounting Standards ("SFAS") No. 123 (Revised 2004), "Share-Based Payment" ("SFAS No. 123-R"). SFAS No. 123-R retains certain of the requirements of the original SFAS No. 123, "Accounting for Stock Based Compensation" ("SFAS No. 123") and requires that the cost resulting from all share-based payment transactions be treated as compensation and recognized in the consolidated financial statements. The Company adopted SFAS No. 123-R in December 2004, utilizing the modified prospective method. Prior to the Company's adoption of SFAS No. 123-R, the Company followed SFAS No. 123 and treated all forms of share-based payments as compensation recognized in the consolidated statements of operations. Therefore, the adoption of SFAS No. 123-R did not have a material impact on the consolidated financial statements.
Marketing
Marketing costs, which consist primarily of direct mail and point-of-sale ("POS") advertising costs, are expensed at the time the promotion is mailed or first appears in the store. For the following periods, marketing costs reported in selling, general, and administrative expenses on the consolidated statements of operations were as follows:
Fiscal Year | (Amounts in thousands) | |||
|---|---|---|---|---|
2008 | $ | 32,217 | ||
2007 | $ | 33,546 | ||
2006 | $ | 33,053 | ||
61
New York & Company, Inc.
Notes to Consolidated Financial Statements (Continued)
January 31, 2009
2. Summary of Significant Accounting Policies (Continued)
At January 31, 2009 and February 2, 2008, marketing costs reported in prepaid expenses on the consolidated balance sheets amounted to $1.5 million and $1.2 million, respectively.
Pre-Opening Expenses
Costs, such as advertising and payroll costs, incurred prior to the opening of a new store are expensed as incurred.
Store Supplies
The initial inventory and subsequent shipments of supplies for new stores, including, but not limited to, hangers, signage, packaging and POS supplies, are expensed as incurred.
Deferred Financing Costs
Costs related to the issuance of debt are capitalized as other assets in the consolidated balance sheets and amortized as interest expense over the terms of the related debt. When the Company repays debt prior to its maturity, the related unamortized deferred financing costs are written-off and reported as a loss on modification and extinguishment of debt in the consolidated statements of operations. At January 31, 2009 and February 2, 2008, deferred financing costs were $0.7 million and $0.7 million, net of accumulated amortization of $1.0 million and $0.8 million, respectively.
Interest Expense
Interest expense, net of interest income, includes interest primarily related to the Company's revolving credit facility, long-term debt and amortization of deferred financing costs.
Impairment of Long-lived Assets
The Company evaluates the impairment of long-lived assets in accordance with SFAS No. 144, "Accounting for the Impairment or Disposal of Long-lived Assets" ("SFAS No. 144"). Long-lived assets are evaluated for recoverability in accordance with SFAS No. 144 whenever events or changes in circumstances indicate that an asset may have been impaired. In evaluating an asset for recoverability, the Company estimates the future cash flows expected to result from the use of the asset and eventual disposition. If the sum of the expected future undiscounted cash flows is less than the carrying amount of the asset, an impairment loss, equal to the excess of the carrying amount over the fair value of the asset, is recognized.
Intangible Assets
The Company follows SFAS No. 142, "Goodwill and Other Intangible Assets" ("SFAS No. 142"), which prohibits the amortization of goodwill and intangible assets with indefinite lives. SFAS No. 142 requires that these assets be reviewed for impairment at least annually, or more frequently if events or circumstances indicate that the asset may be impaired. An impairment charge is recognized for the amount, if any, by which the carrying value of an intangible asset exceeds its fair value. Intangible assets with finite lives are amortized over their estimated useful lives.
62
New York & Company, Inc.
Notes to Consolidated Financial Statements (Continued)
January 31, 2009
2. Summary of Significant Accounting Policies (Continued)
Fair Value of Financial Instruments
The Company's financial instruments consist of cash and cash equivalents, short-term trade receivables, accounts payable, and long-term debt. The carrying values of cash and cash equivalents, short-term trade receivables, and accounts payable approximate their fair value due to the short-term maturities of such items.
At January 31, 2009 and February 2, 2008, the carrying amount of long-term debt approximated its fair value due to the variable interest rate it carries.
Income Taxes
Income taxes are calculated in accordance with SFAS No. 109, "Accounting for Income Taxes," which requires the use of the liability method. Deferred tax assets and liabilities are recognized based on the difference between the financial statement carrying amounts of assets and liabilities and their respective tax bases. Inherent in the measurement of deferred balances are certain judgments and interpretations of enacted tax laws and published guidance with respect to applicability to the Company's operations. Deferred tax assets are believed to be fully realizable as management expects future taxable income will be sufficient to recover the asset values and, as such, no related valuation allowance has been provided for. The Company adopted the provisions of FASB Interpretation No. 48, "Accounting for Uncertainty in Income Taxes—an interpretation of FASB Statement No. 109" in the first quarter of fiscal year 2007. This Interpretation prescribes a comprehensive model of how a company should recognize, measure, present and disclose in its financial statements uncertain tax positions that the company has taken or expects to take on a tax return. Under this Interpretation, the Company recognizes a tax benefit when a tax position is more-likely-than-not to be sustained upon examination, based solely on its technical merits. The Company measures the recognized tax benefit as the largest amount of tax benefit that has greater than a 50% likelihood of being realized upon the ultimate settlement with a taxing authority. The Company reverses a previously recognized tax benefit if it determines that the tax position no longer meets the more-likely-than-not threshold of being sustained. The Company accrues interest and penalties related to unrecognized tax benefits in income tax expense.
Comprehensive Income (Loss)
Comprehensive income (loss) is calculated in accordance with SFAS No. 130, "Reporting Comprehensive Income." Comprehensive income (loss) includes net income (loss) and other comprehensive income (loss). For fiscal year 2008, other comprehensive loss consisted of a minimum pension liability adjustment of $1.8 million, net of a $1.2 million tax benefit. For fiscal year 2007, other comprehensive loss consisted of a minimum pension liability adjustment of $0.1 million, net of taxes. For fiscal year 2006, other comprehensive income consisted of a minimum pension liability adjustment of $0.3 million, net of taxes of $0.2 million. Accumulated other comprehensive loss is reported separately in the consolidated statement of stockholders' equity.
Earnings Per Share
Basic earnings per share are computed by dividing net income by the weighted average number of shares of common stock outstanding for the period. Except when the effect would be anti-dilutive at the continuing operations level, diluted earnings per share are calculated based on the weighted
63
New York & Company, Inc.
Notes to Consolidated Financial Statements (Continued)
January 31, 2009
2. Summary of Significant Accounting Policies (Continued)
average number of outstanding shares of common stock plus the dilutive effect of stock options as if they were exercised and unvested restricted stock as if it were vested. A reconciliation between basic and diluted earnings per share is as follows:
| | Fiscal Year 2008 | Fiscal Year 2007 | Fiscal Year 2006 | ||||||||
|---|---|---|---|---|---|---|---|---|---|---|---|
| | (Amounts in thousands, except per share amounts) | ||||||||||
(Loss) income from continuing operations | $ | (20,298 | ) | $ | 26,676 | $ | 48,396 | ||||
Income (loss) from discontinued operations, net of taxes | 491 | (31,533 | ) | (2,226 | ) | ||||||
Net (loss) income | $ | (19,807 | ) | $ | (4,857 | ) | $ | 46,170 | |||
Basic (loss) earnings per share | |||||||||||
Weighted average shares outstanding: | |||||||||||
Basic shares of common stock | 59,650 | 58,537 | 56,072 | ||||||||
Basic (loss) earnings per share from continuing operations | $ | (0.34 | ) | $ | 0.46 | $ | 0.86 | ||||
Basic earnings (loss) per share from discontinued operations | 0.01 | (0.54 | ) | (0.04 | ) | ||||||
Basic (loss) earnings per share | $ | (0.33 | ) | $ | (0.08 | ) | $ | 0.82 | |||
Diluted (loss) earnings per share | |||||||||||
Weighted average shares outstanding: | |||||||||||
Basic shares of common stock | 59,650 | 58,537 | 56,072 | ||||||||
Plus impact of stock options and restricted stock | — | 2,491 | 3,959 | ||||||||
Diluted shares of common stock | 59,650 | 61,028 | 60,031 | ||||||||
Diluted (loss) earnings per share from continuing operations | $ | (0.34 | ) | $ | 0.44 | $ | 0.81 | ||||
Diluted earnings (loss) per share from discontinued operations | 0.01 | (0.52 | ) | (0.04 | ) | ||||||
Diluted (loss) earnings per share | $ | (0.33 | ) | $ | (0.08 | ) | $ | 0.77 | |||
The calculation of diluted (loss) earnings per share from continuing operations for fiscal year 2008, fiscal year 2007, and fiscal year 2006 excludes options to purchase 2,613,297 shares, 973,608 shares, and 805,062 shares, respectively, due to their antidilutive effect.
Recently Issued Accounting Pronouncements
In September 2006, the FASB issued SFAS No. 157, "Fair Value Measurements" ("SFAS No. 157"). SFAS No. 157 establishes a common definition for fair value to be applied to US GAAP guidance requiring the use of fair value, establishes a framework for measuring fair value, and expands the disclosure about such fair value measurements. The application of SFAS No. 157 as it relates to financial assets and financial liabilities is effective for fiscal years beginning after November 15, 2007, and interim periods within those fiscal years. On February 12, 2008, the FASB issued FSP FAS 157-2,
64
New York & Company, Inc.
Notes to Consolidated Financial Statements (Continued)
January 31, 2009
2. Summary of Significant Accounting Policies (Continued)
"Effective Date of FASB Statement No. 157," which delays the effective date of SFAS No. 157 for all nonfinancial assets and nonfinancial liabilities, except those that are recognized or disclosed at fair value in the financial statements on at least an annual basis, to fiscal years beginning after November 15, 2008, and interim periods within those fiscal years. The Company's adoption of SFAS No. 157 on February 3, 2008 for all financial assets and liabilities and any other assets and liabilities that are recognized or disclosed at fair value on a recurring basis did not impact the Company's consolidated financial statements. The provisions of SFAS No. 157 are to be applied prospectively as of the beginning of the fiscal year in which it is applied, with any transition adjustment recognized as a cumulative effect adjustment to the opening balance of retained earnings. The Company does not anticipate that the adoption of SFAS No. 157 for nonfinancial assets and liabilities measured at fair value on a non-recurring basis will have a material impact on its financial position and results of operations.
In September 2006, the FASB issued SFAS No. 158, "Employers' Accounting for Defined Benefit Pension and Other Postretirement Plans, an amendment of FASB statements No. 87, 88, 106, and 132(R)" ("SFAS No. 158"). SFAS No. 158 requires recognition of the overfunded or underfunded status of defined benefit postretirement plans as an asset or liability in the statement of financial position and requires companies to recognize changes in that funded status in comprehensive income (loss) in the year in which the changes occur. SFAS No. 158 also requires measurement of the funded status of a plan as of the date of the statement of financial position. SFAS No. 158 is effective for recognition of the funded status of benefit plans for fiscal years ending after December 15, 2006 and is effective for the measurement date provisions for fiscal years ending after December 15, 2008. The adoption of the recognition provisions at February 3, 2007 and the measurement date provisions at January 31, 2009 did not have a material impact on the Company's financial position and results of operations.
In May 2008, the FASB issued SFAS No. 162, "The Hierarchy of Generally Accepted Accounting Principles" ("SFAS No. 162"). SFAS No. 162 is intended to improve financial reporting by identifying a consistent framework, or hierarchy, for selecting accounting principles to be used in preparing financial statements that are presented in conformity with US GAAP for non-governmental entities. SFAS No. 162 is effective on November 15, 2008, which is 60 days following the SEC's September 16, 2008 approval of the Public Company Accounting Oversight Board amendments to AU Section 411, the meaning of "Present Fairly in Conformity with GAAP." Any effect of applying the provisions of SFAS No. 162 is to be reported as a change in accounting principle in accordance with FASB Statement No. 154, "Accounting Changes and Error Corrections." The Company's adoption of SFAS No. 162 will not have a material impact on its financial position and results of operations.
3. Restructuring
In response to the ongoing deterioration of the macroeconomic environment and the resulting impact on consumer spending in the retail sector, the Company initiated a comprehensive review of its business and on January 8, 2009 announced the launch of a multi-year restructuring and cost reduction program that is expected to generate approximately $175 million in pre-tax savings over the next five years, of which approximately $30 million is expected to be realized during the fiscal year ending January 30, 2010 ("fiscal year 2009"). This program is designed to streamline the Company's
65
New York & Company, Inc.
Notes to Consolidated Financial Statements (Continued)
January 31, 2009
3. Restructuring (Continued)
organization by reducing costs and eliminating underperforming assets while enhancing efficiency and profitability.
The key components of the restructuring and cost reduction program include:
- •
- Strategic staff downsizing resulting in a permanent reduction of 12% of the Company's field management in its existing stores and approximately a 10% reduction of corporate office professionals;
- •
- The optimization of the Company's store portfolio, including the closure of 40 to 50 underperforming stores over a five year period;
- •
- A broad based cost reduction effort across all aspects of the Company's business; and
- •
- Significant reductions in capital expenditure plans as compared to fiscal year 2008.
Strategic Staff Downsizing. The strategic staff reductions involve a streamlining of the Company's field management organization which will result in a permanent net reduction of approximately 260 management level positions in its existing stores. In addition, the Company has eliminated approximately 50 corporate office positions, consisting of salaried managers and support professionals. In accordance with SFAS No. 146, "Accounting for Costs Associated With Exit or Disposal Activities," the Company recorded a pre-tax charge of $1.7 million during the fourth quarter of fiscal year 2008 in connection with these reductions. These reductions are expected to result in pre-tax savings of approximately $12 million per year beginning in fiscal year 2009.
Optimization of Store Portfolio. The store optimization component of the restructuring involves the closure of approximately 40 to 50 underperforming stores and the related non-cash impairment of store assets in underperforming or closing stores. The Company conducted a review of the performance of each of its stores in order to identify stores that do not demonstrate the potential to deliver an acceptable long-term return on investment. The Company plans to close stores that do not meet this return on investment criteria in a staged approach over the next five years upon the termination of the respective leases or upon the exercise of kickout provisions, and as a result, the Company does not presently anticipate that it will incur significant lease exit costs associated with these decisions. In accordance with SFAS No. 144, the Company recorded a non-cash charge of $22.9 million related to the impairment of store assets in the fourth quarter of fiscal year 2008. In fiscal year 2008, these stores achieved approximately $60 to $70 million in sales and generated negative four-wall profit contribution. The Company currently expects to close 10 to 15 of these underperforming stores in fiscal year 2009, with the remainder of the planned store closures occurring over fiscal years 2010 to 2013. The Company currently estimates that these efforts will result in annualized pre-tax savings of $4 to $6 million beginning in fiscal year 2009.
Broad Based Cost Reductions. The Company has initiated a corporate-wide program to identify and implement strategic and structural cost improvements across all aspects of the Company's business including store operations, sourcing, real estate, marketing, and general home office operations. These efforts include the optimization of external resources, reduction of discretionary spending, consolidation of certain purchasing activities to leverage scale, and the renegotiation of existing agreements to achieve cost reductions. The Company currently estimates that these efforts will result in annualized pre-tax savings of approximately $14 to $17 million per year beginning in fiscal year 2009.
66
New York & Company, Inc.
Notes to Consolidated Financial Statements (Continued)
January 31, 2009
3. Restructuring (Continued)
Capital Expenditures. The Company plans to minimize new store openings in fiscal year 2009 and as a result, expects capital expenditures to approximate $15 million in fiscal year 2009, as compared to $44.6 million in fiscal year 2008.
In total, the Company recorded pre-tax restructuring charges of $24.5 million during the fourth quarter of fiscal year 2008, which includes a non-cash charge of $22.9 million related to the impairment of store assets and a $1.7 million cash charge related primarily to severance and other costs necessary to implement the restructuring and cost reduction program. Restructuring charges are reported as a separate line item in the consolidated statement of operations. As of January 31, 2009, approximately $1.0 million of severance related accruals are included in accrued expenses on the consolidated balance sheet and are expected to be paid in full during fiscal year 2009. The Company does not currently expect to record any material restructuring charges for these matters in fiscal year 2009.
4. Discontinued Operations
On October 18, 2007, the Company announced its decision to close all 23 JasmineSola stores by the end of the fourth quarter of fiscal year 2007. JasmineSola was a women's retailer of upscale and contemporary apparel, footwear and accessories sold through its chain of JasmineSola branded stores, which the Company acquired on July 19, 2005. The Company decided to exit the JasmineSola business after a thorough assessment and analysis. This decision enabled the Company to focus financial and management resources on its New York & Company brand. As of February 2, 2008, the Company completed the closure of all of the Company's JasmineSola stores and substantially completed all other exit procedures. As a result, the Company's financial statements reflect JasmineSola as discontinued operations for all periods presented in accordance with SFAS No. 144.
In accordance with SFAS No. 144 and SFAS No. 142, the Company recorded a $35.2 million non-cash charge in October 2007 related to the impairment of JasmineSola assets, including $17.2 million of trademarks, $11.1 million of goodwill, and $6.9 million of property and equipment. In accordance with SFAS No. 146, the Company recorded charges during the third and fourth quarters of fiscal year 2007 of $5.8 million for lease termination costs and $1.3 million for severance costs. As of February 2, 2008, approximately $3.4 million of lease termination accruals and $0.8 million of severance accruals are included in current liabilities of discontinued operations on the consolidated balance sheet. As of January 31, 2009, the Company had paid all lease termination and severance liabilities relating to the discontinued operations.
The operating results of JasmineSola, which are being presented as discontinued operations, are as follows:
| | Fiscal Year 2008 | Fiscal Year 2007 | Fiscal Year 2006 | |||||||
|---|---|---|---|---|---|---|---|---|---|---|
| | (Amounts in thousands) | |||||||||
Net sales | $ | — | $ | 43,227 | $ | 39,860 | ||||
Income (loss) from discontinued operations before income taxes | $ | 755 | $ | (52,112 | ) | $ | (3,730 | ) | ||
Income tax expense (benefit) | $ | 264 | $ | (20,579 | ) | $ | (1,504 | ) | ||
Income (loss) from discontinued operations, net of taxes | $ | 491 | $ | (31,533 | ) | $ | (2,226 | ) | ||
67
New York & Company, Inc.
Notes to Consolidated Financial Statements (Continued)
January 31, 2009
5. Significant Risks and Uncertainties
Use of Estimates
The preparation of consolidated financial statements in conformity with accounting principles generally accepted in the United States requires the Company's management to make estimates and assumptions that affect the reported amounts of assets and liabilities at the date of the financial statements and the reported amounts of revenues and expenses during the reporting period. Actual results could differ from these estimates.
Concentration of Risk
The Company is subject to concentration of credit risk relating to cash, primarily store depository accounts, which are maintained with major financial institutions. The Company monitors the relative credit standing of these financial institutions and other entities and limits the amount of credit exposure with any one entity. The Company also monitors the creditworthiness of the entities to which it grants credit terms in the normal course of business.
The Company utilizes three major apparel suppliers, which together represented approximately 72% of the Company's merchandise purchases during fiscal year 2008. The Company's largest country sources are China, Macau and Hong Kong, which represented approximately 65% of purchases in fiscal year 2008. No individual factory represented more than approximately 5% of the Company's merchandise purchases during fiscal year 2008.
Economic Uncertainty
The Company's business is impacted by general economic conditions and their effect on consumer confidence and the level of consumer spending on the merchandise the Company offers, which have recently deteriorated significantly and may continue to do so for the foreseeable future. The current downturn in the economy may continue to affect consumer purchases of the Company's merchandise and to adversely impact the Company's results of operations, liquidity and continued growth. In addition, the deteriorating economic conditions could negatively impact the Company's merchandise vendors and their ability to deliver products, which may also adversely impact the Company's results of operations, liquidity and continued growth.
6. Proprietary Credit Card
The Company has a credit card processing agreement with a third party (the "administration company"), which provides the services of the Company's proprietary credit card program. The Company allows payments on this credit card to be made at its stores as a service to its customers. The administration company owns the credit card accounts, with no recourse from the Company. The Company's receivable due from the administration company at any time represents the standard processing time of approximately three days. The amount due at January 31, 2009 and February 2, 2008 was $0.8 million and $1.8 million, respectively. The Company does not have any off-balance sheet arrangements.
7. Goodwill and Other Intangible Assets
SFAS No. 142, "Goodwill and Other Intangible Assets," prohibits the amortization of goodwill and intangible assets with indefinite lives. The Company's intangible assets relate to the New York & Company trademarks and historically the JasmineSola trademarks and goodwill associated with the
68
New York & Company, Inc.
Notes to Consolidated Financial Statements (Continued)
January 31, 2009
7. Goodwill and Other Intangible Assets (Continued)
acquisition of JasmineSola on July 19, 2005, which were initially valued at $14.8 million, $17.2 million and $11.1 million, respectively. The trademarks were initially valued using the "relief from royalty method" and were determined to have indefinite lives by an independent appraiser. Goodwill represents the excess of the purchase price over the fair value of the net assets acquired.
The Company tests for impairment of goodwill and other intangible assets at least annually in the fourth quarter, or more frequently if events or circumstances indicate that the asset may be impaired, by comparing the fair value with the carrying amount for each individual asset. Goodwill impairment is determined using a two-step process. The first step of the goodwill impairment test is to identify a potential impairment by comparing the fair value of a reporting unit with its carrying amount, including the goodwill assigned to the reporting unit. The estimate of fair value of a reporting unit is determined using a discounted cash flow model. If the fair value of a reporting unit exceeds its carrying amount, goodwill of the reporting unit is not deemed to be impaired and the second step of the impairment test is not performed. If the carrying amount of a reporting unit exceeds its fair value, the second step of the goodwill impairment test is performed to measure the amount of impairment loss, if any. The second step of the goodwill impairment test compares the implied fair value of the reporting unit's goodwill with the carrying amount of that goodwill. If the carrying amount of the reporting unit's goodwill exceeds the implied fair value of that goodwill, an impairment loss is recognized in an amount equal to that excess. The implied fair value of goodwill is determined in the same manner as the amount of goodwill recognized in a business combination. In other words, the fair value of the reporting unit is allocated to all of the assets and liabilities of that unit (including any unrecognized intangible assets) as if the reporting unit had been acquired in a business combination and the fair value of the reporting unit was the purchase price paid to acquire the reporting unit.
The impairment test for other intangible assets not subject to amortization consists of a comparison of the fair value of the intangible asset with its carrying value. The estimates of fair value of intangible assets not subject to amortization, specifically trademarks, are determined using the "relief from royalty method." If the carrying value of the intangible asset exceeds its fair value, an impairment loss is recognized in an amount equal to that excess.
The Company's fiscal year 2008 impairment test did not result in any impairment. In connection with the decision to exit the JasmineSola business, during the third quarter of fiscal year 2007, the Company recorded non-cash impairment charges of $17.2 million and $11.1 million related to the JasmineSola trademarks and goodwill, respectively. The Company's fiscal year 2006 impairment test did not result in any impairment.
69
New York & Company, Inc.
Notes to Consolidated Financial Statements (Continued)
January 31, 2009
8. Property and Equipment
Property and equipment at January 31, 2009 and February 2, 2008 consist of the following:
| | January 31, 2009 | February 2, 2008 | |||||
|---|---|---|---|---|---|---|---|
| | (Amounts in thousands) | ||||||
Land | $ | 117 | $ | 117 | |||
Store fixtures and equipment | 162,475 | 143,108 | |||||
Office furniture, fixtures, and equipment | 13,937 | 11,084 | |||||
Leasehold improvements | 183,473 | 168,387 | |||||
Software | 24,118 | 14,941 | |||||
Construction in progress | 3,431 | 10,892 | |||||
Total | 387,551 | 348,529 | |||||
Less accumulated depreciation | 170,303 | 108,972 | |||||
Property and equipment, net | $ | 217,248 | $ | 239,557 | |||
Depreciation expense amounted to approximately $43.8 million, $38.3 million and $31.3 million for fiscal year 2008, fiscal year 2007 and fiscal year 2006, respectively. In addition, during the fourth quarter of fiscal year 2008, the Company recorded a non-cash charge of $22.9 million related to the impairment of store assets in connection with its restructuring and cost reduction program.
9. Commitments and Contingencies
The Company leases retail business locations, office and warehouse facilities, copier equipment and automotive equipment under various noncancelable operating leases expiring in various years through 2020. Leases on retail business locations specify minimum rentals plus common area maintenance ("CAM") charges, real estate taxes, other landlord charges and possible additional rentals based upon percentages of sales. Most of the retail business location leases have an original term of 10 years and provide renewal options at rates specified in the leases. In the normal course of business, these leases are generally renewed or replaced by other leases.
A summary of rent expense is as follows:
| | Fiscal Year 2008 | Fiscal Year 2007 | Fiscal Year 2006 | |||||||
|---|---|---|---|---|---|---|---|---|---|---|
| | (Amounts in thousands) | |||||||||
Fixed minimum rentals | $ | 102,764 | $ | 100,046 | $ | 92,826 | ||||
Contingent rentals | 4,301 | 4,164 | 5,070 | |||||||
Total store rentals | 107,065 | 104,210 | 97,896 | |||||||
Office space rentals | 5,404 | 5,208 | 4,361 | |||||||
Equipment rentals | 1,115 | 976 | 1,003 | |||||||
Total rental expense | $ | 113,584 | $ | 110,394 | $ | 103,260 | ||||
Sublease rental income | $ | 668 | $ | 891 | $ | 1,021 | ||||
70
New York & Company, Inc.
Notes to Consolidated Financial Statements (Continued)
January 31, 2009
9. Commitments and Contingencies (Continued)
As of January 31, 2009 the aggregate minimum rent commitments under non-cancelable operating leases are as follows:
Fiscal Year | Fixed Minimum Rent | Sublease Rental Income | |||||
|---|---|---|---|---|---|---|---|
| | (Amounts in thousands) | ||||||
2009 | $ | 109,232 | $ | 482 | |||
2010 | 106,067 | 410 | |||||
2011 | 97,405 | 5 | |||||
2012 | 94,355 | — | |||||
2013 | 91,539 | — | |||||
Thereafter | 234,090 | — | |||||
Total | $ | 732,688 | $ | 897 | |||
The minimum lease payments above do not include CAM charges, real estate taxes or other landlord charges, which are also required contractual obligations under the Company's store and office operating leases. In many of the Company's leases, CAM charges are not fixed and can fluctuate from year to year. During fiscal year 2008, CAM charges and real estate taxes were $70.7 million and other landlord charges were $5.9 million.
As of January 31, 2009, the Company had open purchase commitments for merchandise totaling approximately $87.0 million.
Legal Proceedings
On April 29, 2008, a class action claim was filed in the Superior Court of the State of California for the County of Contra Costa captioned Jannika Schakow v. Lerner New York, Inc. and New York & Company, Inc. The class action was seeking relief for, among other things, meal and rest periods allegedly not provided or permitted to certain eligible employees in California.
On March 25, 2008, a class action claim was filed in the Superior Court of the State of California for the County of San Diego, the caption of which has been changed to Leslie Johnson v. Lerner New York, Inc. The class action was seeking relief for, among other things, collection of customers' personal information in a manner that is allegedly in violation of California law.
In January 2009, the Company reached settlements in principle with the plaintiffs of both class action claims in the State of California and recorded charges in connection with the settlements totaling $1.5 million, which is reported in selling, general and administrative expenses on the consolidated statement of operations.
There are various claims, lawsuits and pending actions against the Company arising in the normal course of the Company's business. It is the opinion of management that the ultimate resolution of these matters will not have a material effect on the Company's financial condition, results of operations or cash flows.
71
New York & Company, Inc.
Notes to Consolidated Financial Statements (Continued)
January 31, 2009
10. Employee Benefit Plans
Savings and Retirement Plan
The Company contributes to a defined contribution savings and retirement plan ("the SARP") qualifying under section 401(k) of the Internal Revenue Code. Participation in the SARP is available to all associates, if not covered by the pension plan discussed below, who have completed 1,000 or more hours of service with the Company during certain twelve-month periods and have attained the age of 21. Prior to January 1, 2008, participants could contribute an aggregate of up to 15% of their pay to the SARP, subject to Internal Revenue Service ("IRS") limits. Beginning in 2008, participants may contribute up to 100% of their pay to the SARP, subject to IRS limits. The Company matches 100% of the employee's contribution up to a maximum of 4% of the employee's eligible pay. The Company match is immediately vested. In addition, the Company makes a discretionary retirement contribution ranging from 3% to 8% of each participant's eligible base salary depending on the length of service. For retirement contributions made prior to January 1, 2007, the Company's retirement contribution vests 20% per year, beginning in the third year of service. As a result of the adoption of new pension plan legislation in 2006, beginning in 2007, the vesting period for new contributions made by the Company begins in the second year of service.
The Company's costs under this plan were as follows:
Fiscal Year | (Amounts in thousands) | |||
|---|---|---|---|---|
2008 | $ | 6,117 | ||
2007 | $ | 5,664 | ||
2006 | $ | 4,228 | ||
Pension Plan
The Company sponsors a single employer defined benefit pension plan ("plan") covering substantially all union employees. Employees covered by collective bargaining agreements are primarily non-management store associates, representing approximately 8% of the Company's workforce at January 31, 2009. The plan provides retirement benefits for union employees, consisting of non-management store associates, who have attained the age of 21 and complete 1,000 or more hours of service in any calendar year following the date of employment. The plan provides benefits based on length of service. The Company's funding policy for the pension plan is to contribute annually the amount necessary to provide for benefits based on accrued service. The Company does not anticipate the need for a material contribution to the plan during the twelve months ending January 30, 2010. The Company's pension plan weighted average asset allocation, by asset category, is as follows:
Asset Category | Fiscal Year 2008 | Fiscal Year 2007 | |||||
|---|---|---|---|---|---|---|---|
Equity securities | 53 | % | 59 | % | |||
Fixed income | 47 | % | 40 | % | |||
Cash and cash equivalents | — | % | 1 | % | |||
The Company's investment policy generally targets 60% to 65% in equity securities and 35% to 40% in fixed income.
72
New York & Company, Inc.
Notes to Consolidated Financial Statements (Continued)
January 31, 2009
10. Employee Benefit Plans (Continued)
In consideration of the fund's investment goals, demographics, time horizon available for investment and the overall risk tolerance of the board of trustees (consisting of two union trustees and two employer trustees) a long-term investment objective of long-term income and growth has been adopted for the fund's assets. This is a risk-averse balanced approach that seeks long-term growth in capital along with significant current income.
The following weighted average assumptions were used to determine benefit obligations:
| | Fiscal Year 2008 | Fiscal Year 2007 | |||||
|---|---|---|---|---|---|---|---|
Discount rate | 6.50 | % | 5.90 | % | |||
The following weighted average assumptions were used to determine net periodic benefit cost:
| | Fiscal Year 2008 | Fiscal Year 2007 | Fiscal Year 2006 | |||||||
|---|---|---|---|---|---|---|---|---|---|---|
Discount rate | 5.90 | % | 5.90 | % | 5.60 | % | ||||
Long-term rate of return on assets | 8.00 | % | 8.00 | % | 8.00 | % | ||||
In accordance with the recent adoption of the measurement date provisions of SFAS No. 158, the fiscal year 2008 measurement date is January 31, 2009 for the determination of benefit obligations. The
73
New York & Company, Inc.
Notes to Consolidated Financial Statements (Continued)
January 31, 2009
10. Employee Benefit Plans (Continued)
fiscal year 2007 measurement date is December 31, 2008 for the determination of benefit obligations. The following table provides information for the pension plan:
| | Fiscal Year 2008 | Fiscal Year 2007 | |||||
|---|---|---|---|---|---|---|---|
| | (Amounts in thousands) | ||||||
Change in benefit obligation: | |||||||
Benefit obligation, beginning of period | $ | 9,583 | $ | 9,690 | |||
Service cost | 245 | 360 | |||||
Interest | 550 | 547 | |||||
Actuarial gain | (446 | ) | (162 | ) | |||
Benefits paid | (909 | ) | (852 | ) | |||
SFAS No. 158 adjustment due to change in the measurement date | 48 | — | |||||
Benefit obligation, end of period | $ | 9,071 | $ | 9,583 | |||
Change in plan assets: | |||||||
Fair value of plan assets, beginning of period | $ | 9,087 | $ | 9,403 | |||
Actual return on plan assets | (2,679 | ) | 428 | ||||
Benefits paid | (909 | ) | (852 | ) | |||
Employer contributions | 99 | 108 | |||||
Fair value of plan assets, end of period | $ | 5,598 | $ | 9,087 | |||
Funded status | $ | (3,473 | ) | $ | (496 | ) | |
Unrecognized net actuarial loss | 3,432 | 468 | |||||
Net amount recognized | $ | (41 | ) | $ | (28 | ) | |
Amounts recognized in the consolidated balance sheets: | |||||||
Accrued pension liability | $ | (3,473 | ) | $ | (496 | ) | |
Accumulated other comprehensive loss | 3,432 | 468 | |||||
Net amount recognized | $ | (41 | ) | $ | (28 | ) | |
At January 31, 2009 and February 2, 2008, the Company reported a minimum pension liability of $3.5 million and $0.5 million, respectively, due to the underfunded status of the plan. The minimum pension liability is reported in other liabilities on the consolidated balance sheets. Included in accumulated other comprehensive loss at January 31, 2009 is a net loss of $0.1 million that is expected to be recognized in net periodic benefit cost during fiscal year 2009.
74
New York & Company, Inc.
Notes to Consolidated Financial Statements (Continued)
January 31, 2009
10. Employee Benefit Plans (Continued)
Net periodic benefit cost includes the following components:
| | Fiscal Year 2008 | Fiscal Year 2007 | Fiscal Year 2006 | |||||||
|---|---|---|---|---|---|---|---|---|---|---|
| | (Amounts in thousands) | |||||||||
Service cost | $ | 245 | $ | 360 | $ | 332 | ||||
Interest cost | 550 | 547 | 540 | |||||||
Expected return on plan assets | (691 | ) | (714 | ) | (719 | ) | ||||
Net periodic benefit cost | $ | 104 | $ | 193 | $ | 153 | ||||
The following schedule shows the expected benefit payments over the next 10 years:
Fiscal Year | (Amounts in thousands) | |||
|---|---|---|---|---|
2009 | $ | 935 | ||
2010 | 900 | |||
2011 | 883 | |||
2012 | 846 | |||
2013 | 823 | |||
2014-2018 | 3,660 | |||
Total | $ | 8,047 | ||
11. Share-Based Compensation
2006 Long-Term Incentive Plan. The Company's board of directors and stockholders approved the 2006 Long-Term Incentive Plan (the "2006 Plan") on May 3, 2006, and June 21, 2006, respectively. A total of 2,168,496 shares of the Company's common stock have been reserved for issuance under the 2006 Plan. The 2006 Plan provides for the grant of incentive or non-qualified stock options, stock appreciation rights, restricted stock, deferred stock and performance awards to eligible participants. Of the 2,168,496 shares of common stock reserved, the maximum number of shares which may be used for awards other than stock options or stock appreciation rights is 750,000 shares. These shares may be in whole or in part authorized and unissued or held by the Company as treasury shares.
Amended and Restated 2002 Stock Option Plan. The Company originally adopted the 2002 Stock Option Plan on November 27, 2002 and approved the Amended and Restated 2002 Stock Option Plan (the "2002 Plan") to become effective on October 13, 2004. The 2002 Plan provides for the grant of either incentive stock options or non-qualified stock options. The shares to be issued upon the exercise of the options may be in whole or in part authorized and unissued shares or held by the Company as treasury shares. Upon stockholder approval of the 2006 Plan, the 2002 Plan ceased to be available for the grants of new incentive awards, other than awards granted wholly from shares returned to the 2002 Plan by forfeiture or expiration after May 5, 2006; all other new incentive awards are to be granted under the 2006 Plan. There are options to purchase 3,038,090 shares of the Company's common stock that have been or will be subject to forfeiture or expiration under the 2002 Plan at January 31, 2009 and therefore will be potentially available for issuance under the 2002 Plan. Of these options, 504,503 had not yet vested as of January 31, 2009.
75
New York & Company, Inc.
Notes to Consolidated Financial Statements (Continued)
January 31, 2009
11. Share-Based Compensation (Continued)
Under both the 2002 Plan and the 2006 Plan (together, referred to herein as the "Plans"), the Company is able to grant share-based awards to its executives, consultants, directors, or other key employees. Options generally have a maximum term of up to 10 years. Upon grant, the compensation committee of the Company's board of directors will determine the exercise price and term of any option at its discretion. The exercise price of an incentive stock option, however, may not be less than 100% of the fair market value of a share of common stock on the date of grant. The exercise price of an incentive stock option awarded to a person who owns stock constituting more than 10% of the total combined voting power of all classes of stock of the Company may not be less than 110% of the fair market value on such date and the option must be exercised within five years of the date of grant. The aggregate fair market value of common stock for which an incentive stock option is exercisable for the first time during any calendar year, under all equity incentive plans of the Company, may not exceed $0.1 million. Vesting provisions for all share-based awards granted under the Plans are determined by the compensation committee of the Company's board of directors at the date of grant; however, subject to certain restrictions, all outstanding share-based awards may vest upon a sale of the Company. Shares that are not currently outstanding or reserved for outstanding performance units under the Plans and are available for issuance at January 31, 2009 amounted to 251,678.
There were 4,406,415 stock options outstanding as of January 31, 2009, of which 2,561,937 were vested. The 1,844,478 unvested stock options outstanding at January 31, 2009 vest subject to the passage of time through 2012.
A summary of the Company's stock options outstanding as of January 31, 2009 and activity for fiscal year 2008 is presented below:
| | Number of Shares | Weighted Average Exercise Price | Weighted Average Remaining Contractual Term (years) | Aggregate Intrinsic Value | |||||||||
|---|---|---|---|---|---|---|---|---|---|---|---|---|---|
| | (Amounts in thousands) | | | (Amounts in thousands) | |||||||||
Outstanding, beginning of period | 4,027 | $ | 4.31 | ||||||||||
Granted | 1,542 | 6.12 | |||||||||||
Exercised | (820 | ) | 0.20 | ||||||||||
Forfeited | (190 | ) | 9.72 | ||||||||||
Expired | (153 | ) | 5.43 | ||||||||||
Outstanding, end of period | 4,406 | $ | 5.44 | 5.9 | $ | 2,993 | |||||||
Exercisable, end of period | 2,562 | $ | 3.42 | 4.6 | $ | 2,922 | |||||||
Aggregate intrinsic value for both outstanding and exercisable options, in the table above, represents the total pre-tax intrinsic value (the difference between the Company's closing stock price on the last trading day of fiscal year 2008 and the exercise price, multiplied by the number of in-the-money options) that would have been received by the option holders had all option holders exercised their options on January 31, 2009. This amount changes based on the fair market value of the Company's common stock. Total intrinsic value of options exercised for fiscal year 2008, fiscal year 2007 and fiscal year 2006 (based on the difference between the Company's stock price on the respective exercise date
76
New York & Company, Inc.
Notes to Consolidated Financial Statements (Continued)
January 31, 2009
11. Share-Based Compensation (Continued)
and the respective exercise price, multiplied by the number of respective options exercised) was $5.9 million, $17.1 million and $38.7 million, respectively.
In accordance with the adoption provisions of SFAS No. 123-R, for compensation expense purposes, the fair value of each option granted, during the period the Company was a non-public entity, was estimated on the date granted using the Minimum-value option-pricing model for all employees and non-employee board members. In accordance with SFAS No. 123-R, for compensation expense purposes, the fair value of each option granted, as a public entity, is estimated on the date granted using the Black-Scholes option-pricing model for all employees and non-employee board members. The weighted average fair value for options granted during fiscal year 2008, fiscal year 2007 and fiscal year 2006 was $1.61, $7.31, and $8.37, respectively. The total fair value of stock options and restricted stock vested during fiscal year 2008, fiscal year 2007 and fiscal year 2006 was $1.1 million, $1.6 million and $1.6 million, respectively.
The following weighted average assumptions were used to value stock options:
| | Fiscal Year 2008 | Fiscal Year 2007 | Fiscal Year 2006 | |||||||
|---|---|---|---|---|---|---|---|---|---|---|
Expected volatility | 44.0 | % | 44.0 | % | 54.7 | % | ||||
Expected life | 4.6 years | 6.0 years | 5.6 years | |||||||
Risk-free interest rate | 2.20 | % | 4.50 | % | 4.71 | % | ||||
Expected dividend yield | — | % | — | % | — | % | ||||
The risk-free interest rate used to value stock options is based on the U.S. Treasury yield curve in effect at the time of grant with maturity dates that coincide with the expected life of the options. The expected life of stock options represents the weighted average period the stock options are expected to remain outstanding and is based primarily on industry averages, due to the Company's limited historical data for employee exercises. The Company's assumption for volatility is based primarily on the volatility factor of other publicly traded companies in the retail industry that are similar in size and financial leverage. In addition, the Company considers its historical volatility for the period of time since its initial public offering on October 6, 2004.
The following table summarizes the restricted stock outstanding at January 31, 2009 and activity for fiscal year 2008:
| | Shares | Weighted Average Grant Date Fair Value | |||||
|---|---|---|---|---|---|---|---|
| | (Amounts in thousands) | | |||||
Nonvested at February 2, 2008 | 37 | $ | 10.52 | ||||
Granted | 410 | 2.33 | |||||
Vested | (14 | ) | 7.44 | ||||
Forfeited | (8 | ) | 12.43 | ||||
Nonvested at January 31, 2009 | 425 | $ | 2.69 | ||||
77
New York & Company, Inc.
Notes to Consolidated Financial Statements (Continued)
January 31, 2009
11. Share-Based Compensation (Continued)
The 425,182 shares of restricted stock outstanding at January 31, 2009 consists of the following:
On August 16, 2006, the Company's Chairman and Chief Executive officer, Richard P. Crystal, was granted 15,000 shares of restricted stock, which may cliff vest on August 16, 2010 subject to the performance of the Company's diluted earnings per share growth in relation to a peer group and continuous employment from the grant date through August 16, 2010.
On November 19, 2008, 366,182 shares of restricted stock, subject to performance vesting requirements, were granted to certain key executives. The number of restricted shares that may vest ranges from zero to 366,182 shares, depending on the operating income level achieved for the first two fiscal quarters of fiscal year 2009 ("Spring 2009"). The executives who were awarded these performance-based restricted shares are no longer eligible for their target cash bonuses for Spring 2009 under the Company's Incentive Compensation Plan.
The remaining 44,000 shares of restricted stock outstanding at January 31, 2009 vest subject to the passage of time through 2012.
The fair value of restricted stock is based on the closing stock price of an unrestricted share of the Company's common stock on the grant date.
On January 28, 2009, Mr. Crystal was granted a performance unit award, which is subject to a performance vesting requirement and continued employment with the Company through February 11, 2011. In order to meet the performance vesting requirement, the average closing stock price of the Company's common stock for the 30 trading days prior to February 11, 2011 (the "Average Closing Stock Price") shall be equal to or greater than $11.00 per share. If the performance units become vested on February 11, 2011, Mr. Crystal will receive the number of shares of common stock equal to (i) $3,000,000 divided by the Average Closing Stock Price if such Average Closing Stock Price is equal or greater to $11.00 per share but less than $20.00 per share or (ii) $5,000,000 divided by the Average Closing Stock Price if the Average Closing Stock Price is greater or equal to $20.00 per share. The maximum number of shares Mr. Crystal can receive is limited to 272,727 shares. If Mr. Crystal's employment is terminated by the Company within six months prior to February 11, 2011 for any reason other than for Cause, as defined in his employment agreement, the performance unit award will vest as if he was still employed at February 11, 2011, and the performance conditions are otherwise satisfied. The fair value of the performance unit award was calculated on the grant date using the Monte Carlo simulation model, which resulted in a fair value of $0.1 million. The Monte Carlo model uses the same input assumptions as the Black-Scholes model; however, it also further incorporates into the fair value determination, the probability that the market condition may not be satisfied. The Monte Carlo simulation was computed using a risk-free rate of 0.83% and a volatility of 93.2%, which represents the Company's historical volatility for the two year period preceding the grant date. The Company's two year historical volatility was used, since the performance period of the award is two years.
Total share-based compensation expense attributable to all share-based awards granted since the inception of the Plans was $1.6 million, $1.7 million and $1.7 million in fiscal year 2008, fiscal year 2007 and fiscal year 2006, respectively. The Company recognizes share-based compensation expense in the consolidated statements of operations over the requisite service period for each stock option and restricted stock award. The Company recognized a tax benefit in the consolidated statements of operations related to share-based compensation expense of $0.6 million, $0.5 million and $0.5 million in
78
New York & Company, Inc.
Notes to Consolidated Financial Statements (Continued)
January 31, 2009
11. Share-Based Compensation (Continued)
fiscal year 2008, fiscal year 2007 and fiscal year 2006, respectively. Unamortized share-based compensation expense at January 31, 2009 was $4.9 million and will be recognized in the consolidated statements of operations over a weighted average period of 1.9 years.
12. Accrued Expenses
Accrued expenses consist of the following:
| | January 31, 2009 | February 2, 2008 | |||||
|---|---|---|---|---|---|---|---|
| | (Amounts in thousands) | ||||||
Gift cards and certificates | $ | 15,327 | $ | 15,976 | |||
Compensation and benefits | 11,779 | 11,091 | |||||
Other taxes | 6,042 | 5,066 | |||||
Construction in progress | 2,178 | 2,654 | |||||
Occupancy and related | 3,806 | 3,141 | |||||
Insurance | 4,488 | 5,044 | |||||
Other accrued expenses | 17,501 | 10,646 | |||||
Total accrued expenses | $ | 61,121 | $ | 53,618 | |||
13. Long-Term Debt and Credit Facilities
On August 22, 2007, Lerner New York, Inc., Lernco, Inc. and Jasmine Company, Inc. entered into a Second Amended and Restated Loan and Security Agreement (the "Loan Agreement") with Wachovia Bank, National Association, as Agent for itself and the other lender party to the Loan Agreement. The Loan Agreement further amended and restated the Amended and Restated Loan and Security Agreement, dated March 16, 2004, among Lerner New York, Inc. and Lernco, Inc., as borrowers, together with the Agent and the lenders party thereto, as amended.
The Company's credit facilities currently consist of a term loan, of which $19.5 million was outstanding at January 31, 2009, and a $90.0 million revolving credit facility (which includes a sub-facility available for issuance of letters of credit of up to $75.0 million), both having a maturity date of March 17, 2012.
The revolving loans under the credit facilities bear interest, at the Company's option, either at a floating rate equal to the Eurodollar rate plus a margin of between 1.00% and 1.25% per year, depending upon the Company's financial performance, or the Prime rate. The Company pays the lenders under the revolving credit facility a monthly fee on outstanding commercial letters of credit at a rate of 0.625% per year and on standby letters of credit at a rate of between 1.00% and 1.25% per year, depending upon the Company's financial performance, plus a monthly fee on a proportion of the unused commitments under that facility at a rate of 0.20% per year. The term loan bears interest at a floating rate equal to the Eurodollar rate plus 2.50% per year. If any default were to exist under the revolving credit facility and for so long as such default were to continue, at the option of the agent or lenders, the monthly fee on outstanding standby letters of credit may increase to 3.25% per year, interest on the revolving loans may increase to 3.25% per year above the Eurodollar rate for
79
New York & Company, Inc.
Notes to Consolidated Financial Statements (Continued)
January 31, 2009
13. Long-Term Debt and Credit Facilities (Continued)
Eurodollar rate loans and 2.00% per year above the Prime rate for all Prime rate loans, and interest on the term loan may increase to the Eurodollar rate plus 4.50% per year.
The Company's credit facilities contain certain covenants, including restrictions on the Company's ability to pay dividends on its common stock, incur additional indebtedness and to prepay, redeem, defease or purchase other debt. Subject to such restrictions, the Company may incur more debt for working capital, capital expenditures, stock repurchases, acquisitions and for other purposes. The terms of the Company's credit facilities also subject it to certain maintenance covenants, which were amended on December 9, 2008. The amendment removed the maximum leverage ratio of 2.75 to 1.00 and limited the application of the minimum fixed charge coverage ratio of 1.00 to 1.00, such that the Company is only subject to the minimum fixed charge coverage ratio if borrowing availability under its revolving credit facility plus qualified cash falls below specified minimum levels. Prior to the existing term loan being repaid in full, the Company will only be subject to the minimum fixed charge coverage ratio in the event that borrowing availability under its revolving credit facility plus qualified cash falls below $30.0 million ($20.0 million during March and November). Should the Company fully repay its existing term loan, the Company will only be subject to the minimum fixed charge coverage ratio in the event that borrowing availability under its revolving credit facility falls below $12.5 million. In addition, the Company is required at all times to maintain minimum borrowing availability under its credit facility of $10.0 million. The Company is currently in compliance with the financial covenants referred to above.
The lenders have been granted a pledge of the common stock of Lerner Holding and certain of its subsidiaries, and a first priority security interest in substantially all other tangible and intangible assets of New York & Company, Inc. and its subsidiaries, as collateral for the Company's obligations under the credit facilities. In addition, New York & Company, Inc. and certain of its subsidiaries have fully and unconditionally guaranteed the credit facilities, and such guarantees are joint and several.
As of January 31, 2009, the Company had availability under its revolving credit facility of $68.7 million, net of letters of credit outstanding of $6.9 million, as compared to availability of $72.2 million, net of letters of credit outstanding of $6.8 million, as of February 2, 2008. As of January 31, 2009 and February 2, 2008, there were no loans outstanding under the revolving credit facility. Borrowings under the revolving credit facility are due March 17, 2012, and may be borrowed, repaid and reborrowed prior to maturity.
The carrying amounts and fair values of debt as of January 31, 2009 and February 2, 2008, are as follows:
| | January 31, 2009 | February 2, 2008 | |||||||||||
|---|---|---|---|---|---|---|---|---|---|---|---|---|---|
| | Carrying Amount | Estimated Fair Value | Carrying Amount | Estimated Fair Value | |||||||||
| | (Amounts in thousands) | ||||||||||||
Term loan, due March 17, 2012 | $ | 19,500 | $ | 19,500 | $ | 25,500 | $ | 25,500 | |||||
Less: current portion | (6,000 | ) | (6,000 | ) | (6,000 | ) | (6,000 | ) | |||||
Total long-term debt, net of current | $ | 13,500 | $ | 13,500 | $ | 19,500 | $ | 19,500 | |||||
80
New York & Company, Inc.
Notes to Consolidated Financial Statements (Continued)
January 31, 2009
13. Long-Term Debt and Credit Facilities (Continued)
In accordance with the Loan Agreement, the $19.5 million outstanding principal amount of the term loan will be repaid as follows: $6.0 million in each of fiscal year 2009 and 2010 and $7.5 million in fiscal year 2011.
14. Income Taxes
Income taxes for continuing operations consist of:
| | Fiscal Year 2008 | Fiscal Year 2007 | Fiscal Year 2006 | ||||||||
|---|---|---|---|---|---|---|---|---|---|---|---|
| | (Amounts in thousands) | ||||||||||
Federal: | |||||||||||
Current | $ | 3,579 | $ | 11,078 | $ | 26,971 | |||||
Deferred | (15,518 | ) | 2,402 | (1,203 | ) | ||||||
State and Local: | |||||||||||
Current | 1,099 | 2,931 | 6,383 | ||||||||
Deferred | (3,843 | ) | 593 | (298 | ) | ||||||
| $ | (14,683 | ) | $ | 17,004 | $ | 31,853 | |||||
The approximate tax effect of items giving rise to the net deferred income tax assets and liabilities recognized in the Company's consolidated balance sheets is as follows:
| | January 31, 2009 | February 2, 2008 | |||||
|---|---|---|---|---|---|---|---|
| | (Amounts in thousands) | ||||||
Accrued expenses | $ | 14,324 | $ | 10,829 | |||
Fixed assets and intangible assets | 2,408 | (13,962 | ) | ||||
Inventory | 1,218 | 1,218 | |||||
Other assets | 3,119 | 2,216 | |||||
Prepaid costs | (8,192 | ) | (7,976 | ) | |||
Total deferred tax assets and (liabilities) | 12,877 | (7,675 | ) | ||||
Valuation allowance | — | — | |||||
Net deferred tax assets and (liabilities) | $ | 12,877 | $ | (7,675 | ) | ||
As of January 31, 2009, the Company had no federal net operating loss carryforwards.
81
New York & Company, Inc.
Notes to Consolidated Financial Statements (Continued)
January 31, 2009
14. Income Taxes (Continued)
A reconciliation of the statutory federal income tax expense for continuing operations is as follows:
| | Fiscal Year 2008 | Fiscal Year 2007 | Fiscal Year 2006 | |||||||
|---|---|---|---|---|---|---|---|---|---|---|
| | (Amounts in thousands) | |||||||||
Statutory 35% federal tax | $ | (12,243 | ) | $ | 15,288 | $ | 28,088 | |||
State and local income taxes, net of federal income tax benefit | (1,783 | ) | 2,291 | 4,035 | ||||||
Other, net | (657 | ) | (575 | ) | (270 | ) | ||||
Income tax (benefit) expense | $ | (14,683 | ) | $ | 17,004 | $ | 31,853 | |||
The Company files U.S. federal income tax returns and income tax returns in various state and local jurisdictions. In November 2008, the Internal Revenue Service began its examination of the Company's U.S. federal income tax return for the 2006 tax year. The Company is subject to a U.S. federal income tax examination for the 2007 tax year and state and local income tax examinations for the tax years 2005 through 2007.
On February 4, 2007, the Company adopted the provisions of FASB Interpretation No. 48, "Accounting for Uncertainty in Income Taxes—an interpretation of FASB Statement No. 109," which resulted in a cumulative effect reduction of retained earnings of $2.3 million and an increase in its liability for unrecognized tax benefits, including interest and penalties. A reconciliation of the beginning and ending amounts of unrecognized tax benefits is as follows:
| | Fiscal Year 2008 | Fiscal Year 2007 | |||||
|---|---|---|---|---|---|---|---|
| | (Amounts in thousands) | ||||||
Unrecognized tax benefits at beginning of period | $ | 4,317 | $ | 4,530 | |||
Additions based on tax positions related to the current year | 462 | 294 | |||||
Additions for tax positions of prior years | 981 | 451 | |||||
Reductions for tax positions of prior years | — | (958 | ) | ||||
Settlements | (142 | ) | — | ||||
Reductions for lapse of statute of limitations | (2,064 | ) | — | ||||
Unrecognized tax benefits at end of period | $ | 3,554 | $ | 4,317 | |||
At January 31, 2009, the Company reported a liability of $3.6 million in other liabilities on the consolidated balance sheet for unrecognized tax benefits, including interest and penalties, all of which would impact the Company's effective tax rate if recognized. The Company does not anticipate any significant increases or decreases to the balance of unrecognized tax benefits during the next twelve months.
The Company recognizes accrued interest and penalties related to unrecognized tax benefits in income tax expense. During both fiscal year 2008 and fiscal year 2007, the Company recorded a net benefit of $0.2 million for interest and penalties in the consolidated statement of operations. At January 31, 2009 and February 2, 2008, the Company had accrued $1.6 million and $1.9 million, respectively, for the potential payment of interest and penalties.
82
New York & Company, Inc.
Notes to Consolidated Financial Statements (Continued)
January 31, 2009
15. Fair Value Measurements
As described in Note 2, "Summary of Significant Accounting Policies," on February 3, 2008, the Company adopted SFAS No. 157, "Fair Value Measurements" ("SFAS No. 157") for financial assets and liabilities and any other assets and liabilities that are recognized or disclosed at fair value on a recurring basis. SFAS No. 157 establishes a common definition for fair value to be applied to US GAAP guidance requiring the use of fair value, establishes a framework for measuring fair value, and expands the disclosure about such fair value measurements. SFAS No. 157 establishes a three level fair value hierarchy that requires entities to maximize the use of observable inputs and minimize the use of unobservable inputs when measuring fair value. The three levels of inputs used to measure fair value are as follows:
- Level
- 1: Observable inputs such as quoted prices in active markets;
- Level
- 2: Inputs, other than the quoted prices in active markets, that are observable either directly or indirectly; and
- Level
- 3: Unobservable inputs in which there is little or no market data and require the reporting entity to develop its own assumptions.
At January 31, 2009 and February 2, 2008, the carrying amount of the Company's long-term debt approximated its fair value due to the variable interest rate it carries, and as such it is classified within level 2 of the fair value hierarchy.
16. Redeemable Preferred Stock
The Company is authorized to issue 5,000,000 shares of preferred stock, $0.001 par value. At January 31, 2009 and February 2, 2008, there were no shares of preferred stock outstanding.
17. Common Stock
The Company is authorized to issue 300,000,000 shares of common stock, $0.001 par value.
On January 25, 2006, the Company completed an offering of 8,050,000 shares of common stock, including the underwriters' over-allotment option, of which 130,000 shares were offered by the Company and 7,920,000 shares were offered by certain selling stockholders at a price to the public of $18.50 per share. Upon consummation of the public offering on January 31, 2006, net proceeds of $2.3 million and $139.8 million were distributed to the Company and selling stockholders, respectively. The net proceeds received by the Company were used to pay the fees and expenses of the offering, as well as for general corporate purposes.
The Company issued 819,582, 1,733,507 and 2,872,291 shares of common stock upon exercise of stock options during fiscal year 2008, fiscal year 2007 and fiscal year 2006, respectively. In addition, the Company issued 410,182, 14,000, and 36,500 shares of restricted stock during fiscal year 2008, fiscal year 2007 and fiscal year 2006, respectively.
83
| Exhibit No. | Description | ||
|---|---|---|---|
| 3.1 | Restated Certificate of Incorporation.† | ||
| 3.2 | Amended and Restated Bylaws.†††† | ||
| 9.1 | Stockholders Agreement by and among New York & Company, Inc. and the stockholders party thereto, dated August 25, 2004.** | ||
| 9.2 | Amendment No. 4 to Stockholders Agreement by and among New York & Company, Inc. and the stockholders party thereto, dated May 22, 2006.††† | ||
| 9.3 | Amendment No. 5 to Stockholders Agreement by and among New York & Company, Inc. and the stockholders party thereto, dated August 16, 2006.+ | ||
| 10.1 | Second Amended and Restated Employment Agreement between New York & Company, Inc. and Richard P. Crystal, dated August 25, 2004.** | ||
| 10.2 | Amendment No. 1 to Second Amended and Restated Employment Agreement, dated August 25, 2004, between New York & Company, Inc. and Richard P. Crystal, as amended on December 22, 2006.++ | ||
| 10.3 | Amendment No. 2 to Second Amended and Restated Employment Agreement, dated August 25, 2004, between New York & Company, Inc. and Richard P. Crystal, as amended on May 4, 2007.++ | ||
| 10.4 | Amendment No. 3 to Second Amended and Restated Employment Agreement, dated August 25, 2004, between New York & Company, Inc. and Richard P. Crystal, as amended on April 10, 2008.++ | ||
| 10.5 | Amendment No. 4 to Second Amended and Restated Employment Agreement, dated August 25, 2004, between New York & Company, Inc. and Richard P. Crystal, as amended on January 28, 2009. | ||
| 10.6 | Second Amended and Restated Employment Agreement between New York & Company, Inc. and Ronald W. Ristau, dated August 25, 2004.** | ||
| 10.7 | Amendment No. 1 to Second Amended and Restated Employment Agreement, dated August 25, 2004, between New York & Company, Inc. and Ronald W. Ristau, as amended on December 22, 2006.++ | ||
| 10.8 | Amendment No. 2 to Second Amended and Restated Employment Agreement, dated August 25, 2004, between New York & Company, Inc. and Ronald W. Ristau, as amended on April 10, 2008.++ | ||
| 10.9 | Separation Agreement and General Release between New York & Company, Inc., Lerner New York, Inc. and Ronald W. Ristau, dated November 19, 2008. T T T | ||
| 10.10 | Amendment No. 1 to Separation Agreement and General Release, dated November 19, 2008, between New York & Company, Inc., Lerner New York, Inc. and Ronald W. Ristau, as amended on January 27, 2009. | ||
| 10.11 | Employment Letter, dated as of March 13, 2006, between New York & Company, Inc. and Sandra Brooslin Viviano.†† | ||
| 10.12 | Employment Letter, dated as of March 13, 2006, between New York & Company, Inc. and John DeWolf.†† | ||
| 10.13 | Employment Letter, dated as of April 20, 2006, between New York & Company, Inc. and Leslie Goldmann. | ||
| 10.14 | Employment Letter, dated as of November 3, 2008, between New York & Company, Inc. and Sheamus Toal. | ||
| 10.15 | Amendment No.1 to Employment Letter, dated as of March 13, 2006, between New York & Company, Inc. and Sandra Brooslin Viviano, as amended December 22, 2006.††† | ||
| 10.16 | Amendment No.1 to Employment Letter, dated as of March 13, 2006 between New York & Company, Inc. and John DeWolf, as amended December 22, 2006.††† | ||
| 10.17 | Amendment No.1 to Employment Letter, dated as of April 20, 2006 between New York & Company, Inc. and Leslie Goldmann, as amended December 22, 2006. | ||
| 10.18 | Transition Services Agreement by and between Lerner New York Holding, Inc. and Limited Brands, Inc., dated as of November 27, 2002.* | ||
| Exhibit No. | Description | ||
|---|---|---|---|
| 10.19 | Amendment No.1 to Transition Services Agreement, dated as of November 27, 2002, between Lerner New York Holding, Inc., New York & Company, Inc. as successor-in-interest to NY & Co. Group, Inc. and Limited Brands, Inc., as amended on April 19, 2006. T | ||
| 10.20 | Amendment No. 2 to Transition Services Agreement, dated as of November 27, 2002, between Lerner New York Holding, Inc., New York & Company, Inc. as successor-in-interest to NY & Co. Group, Inc. and Limited Brands, Inc., as amended on October 11, 2007. | ||
| 10.21 | Amendment No. 3 to Transition Services Agreement, dated as of November 27, 2002, between Lerner New York Holding, Inc., New York & Company, Inc. as successor-in-interest to NY & Co. Group, Inc. and Limited Brands, Inc., as amended on July 17, 2008. | ||
| 10.22 | Amendment No. 4 to Transition Services Agreement, dated as of November 27, 2002, between Lerner New York Holding, Inc., New York & Company, Inc. as successor-in-interest to NY & Co. Group, Inc. and Limited Brands, Inc., as amended on April 6, 2009. | ||
| 10.23 | Second Amended and Restated Loan and Security Agreement by and among Lerner New York, Inc., Lernco, Inc., Jasmine Company, Inc., Wachovia Bank, National Association, as Agent for itself and the other Lender named therein, dated as of August 22, 2007. T T | ||
| 10.24 | Amendment No. 1 to Second Amended and Restated Loan and Security Agreement by and among Lerner New York, Inc., Lernco, Inc., Jasmine Company, Inc., Wachovia Bank, National Association, as Agent for itself and the other Lender named therein, dated as of December 9, 2008. T T T | ||
| 10.25 | Second Amended and Restated Guarantee made by New York & Company, Inc., Lerner New York Holding, Inc., Nevada Receivable Factoring, Inc., Associated Lerner Shops of America, Inc. and Lerner New York GC, LLC in favor of Wachovia Bank, National Association, as Agent for itself and the other Lender named in the Second Amended and Restated Loan and Security Agreement, dated as of August 22, 2007. T T | ||
| 10.26 | Second Amended and Restated Collateral Assignment of Trademarks made among Lernco, Inc. and Jasmine Company, Inc. in favor of Wachovia Bank, National Association, as Agent for itself and the other Lender named in the Second Amended and Restated Loan and Security Agreement, dated as of August 22, 2007. T T | ||
| 10.27 | Amended and Restated Collateral Assignment of Trademarks made among Lerner New York, Inc. in favor of Wachovia Bank, National Association, as Agent for itself and the other Lender named in the Second Amended and Restated Loan and Security Agreement, dated as of August 22, 2007. T T | ||
| 10.28 | Second Amended and Restated Stock Pledge Agreement by and between Lerner New York, Inc. and Wachovia Bank, National Association, as Agent for itself and the other Lender named in the Second Amended and Restated Loan and Security Agreement, dated as of August 22, 2007. T T | ||
| 10.29 | Second Amended and Restated Stock Pledge Agreement by and between Lerner New York Holding, Inc. and Wachovia Bank, National Association, as Agent for itself and the other Lender named in the Second Amended and Restated Loan and Security Agreement, dated as of August 22, 2007. T T | ||
| 10.30 | Second Amended and Restated Stock Pledge Agreement by and between New York & Company, Inc. and Wachovia Bank, National Association, as Agent for itself and the other Lender named in the Second Amended and Restated Loan and Security Agreement, dated as of August 22, 2007. T T | ||
| 10.31 | Second Amended and Restated Intercompany Subordination Agreement made among the Obligors, as defined in the Second Amended and Restated Loan and Security Agreement, and Wachovia Bank, National Association, as Agent for itself and the other Lender named in the Second Amended and Restated Loan and Security Agreement, dated as of August 22, 2007. T T | ||
| Exhibit No. | Description | ||
|---|---|---|---|
| 10.32 | Performance Unit Award Agreement, dated as of January 28, 2009, between New York & Company, Inc. and Richard P. Crystal. | ||
| 10.33 | Form of Amended and Restated 2002 Stock Option Plan that became effective immediately prior to the consummation of the Company's initial public offering.** | ||
| 10.34 | New York & Company, Inc. 2006 Long-Term Incentive Plan approved by the Company's Board of Directors and Stockholders on May 3, 2006 and June 21, 2006, respectively.+++ | ||
| 21.1 | Subsidiaries of the Registrant.†† | ||
| 23.1 | Consent of Ernst & Young LLP, Independent Registered Public Accounting Firm. | ||
| 31.1 | Certification by the Chairman and Chief Executive Officer, pursuant to Section 302 of the Sarbanes-Oxley Act of 2002, dated April 7, 2009. | ||
| 31.2 | Certification by the Chief Financial Officer, pursuant to Section 302 of the Sarbanes-Oxley Act of 2002, dated April 7, 2009. | ||
| 32.1 | Written Statement of the Chief Executive Officer and the Chief Financial Officer pursuant to Section 906 of the Sarbanes-Oxley act of 2002, dated April 7, 2009. | ||
- †
- Incorporated by reference from the Company's Annual Report on Form 10-K for the fiscal year ended January 29, 2005, as filed with the SEC on April 19, 2005.
- ††
- Incorporated by reference from the Company's Annual Report on Form 10-K for the fiscal year ended January 28, 2006, as filed with the SEC on April 7, 2006.
- †††
- Incorporated by reference from the Company's Annual Report on Form 10-K for the fiscal year ended February 3, 2007, as filed with the SEC on April 6, 2007.
- ††††
- Incorporated by reference from the Company's Annual Report on Form 10-K for the fiscal year ended February 2, 2008, as filed with the SEC on April 8, 2008.
- T
- Incorporated by reference from the Company's Quarterly Report on Form 10-Q for the quarter ended April 29, 2006, as filed with the SEC on June 8, 2006.
- TT
- Incorporated by reference from the Company's Quarterly Report on Form 10-Q for the quarter ended August 4, 2007, as filed with the SEC on September 7, 2007.
- TTT
- Incorporated by reference from the Company's Quarterly Report on Form 10-Q for the quarter ended November 1, 2008, as filed with the SEC on December 11, 2008.
- *
- Incorporated by reference from Amendment No. 1 to the Company's Registration Statement on Form S-1 as filed with the SEC on July 9, 2004.
- **
- Incorporated by reference from Amendment No. 3 to the Company's Registration Statement on Form S-1 as filed with the SEC on September 14, 2004.
- +
- Incorporated by reference from the Company's Current Report on Form 8-K filed with the SEC on August 17, 2006.
- ++
- Incorporated by reference from the Company's Current Report on Form 8-K filed with the SEC on April 11, 2008.
- +++
- Incorporated by reference from the Company's 2006 Proxy Statement, as filed with the SEC on May 19, 2006.