Cautionary Statement Regarding Forward Looking Statements This presentation contains forward-looking statements, including statements made within the meaning of the safe harbor provisions of the United States Private Securities Litigation Reform Act of 1995. Some of these statements can be identified by terms and phrases such as “expect,” “anticipate,” “believe,” “intend,” “estimate,” “continue,” “could,” “may,” “plan,” “project,” “predict,” and similar expressions and references to assumptions that the Company believes are reasonable and relate to its future prospects, developments and business strategies. Such statements are subject to various risks and uncertainties that could cause actual results to differ materially. These include, but are not limited to: (i) the Company’s dependence on mall traffic for its sales and the continued reduction in the volume of mall traffic; (ii) the Company’s ability to anticipate and respond to fashion trends; (iii) the impact of general economic conditions and their effect on consumer confidence and spending patterns; (iv) changes in the cost of raw materials, distribution services or labor; (v) the potential for economic conditions to negatively impact the Company's merchandise vendors and their ability to deliver products; (vi) the Company’s ability to open and operate stores successfully; (vii) seasonal fluctuations in the Company’s business; (viii) competition in the Company’s market, including promotional and pricing competition; (ix) the Company’s ability to retain, recruit and train key personnel; (x) the Company’s reliance on third parties to manage some aspects of its business; (xi) the Company’s reliance on foreign sources of production; (xii) the Company’s ability to protect its trademarks and other intellectual property rights; (xiii) the Company’s ability to maintain, and its reliance on, its information technology infrastructure; (xiv) the effects of government regulation; (xv) the control of the Company by its sponsors and any potential change of ownership of those sponsors; (xvi) the impact of tariff increases or new tariffs; and (xvii) other risks and uncertainties as described in the Company’s documents filed with the SEC, including its most recent Annual Report on Form 10-K and subsequent Quarterly Reports on Form 10-Q. The Company undertakes no obligation to revise the forward-looking statements included in this press release to reflect any future events or circumstances.
THE OPPORTUNITY RTW Retailwinds will be the premier incubator of lifestyle brands, leveraging expertise in celebrity, digital, customer, real estate, operations, and inventory optimization to identify accretive brand, customer, and profit opportunities.

RTW RETAILWINDS STRATEGIC PRIORITIES HARNESS THE POWER OF MULTI-BRAND FUEL BRAND INNOVATION DRIVE CUSTOMER ACQUISITION INVEST IN DIGITAL AND DATA Capture the full benefit of multi-brand structure and synergies. Accelerate product newness across all brands. Maximize opportunities to leverage existing customers and acquire new customers to the multi-brand portfolio. Develop capabilities to leverage customer and data analytics, enhanced with investments in digital experience.
SECOND QUARTER 2019 RESULTS

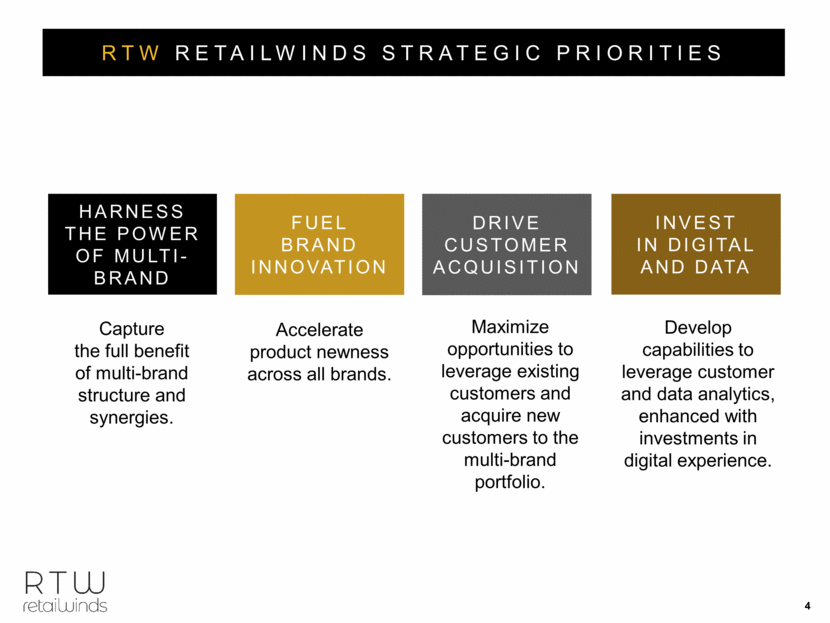
Accelerated total eCommerce comp growth from in-coming trend, driven by increased traffic and positive comp in NYCo and Fashion to Figure Positive comp increase in new customer counts, supported by re-allocated marketing spend to acquisition channels Celebrity growth continued to expand by double digit comp growth, representing nearly 10% of the business enhanced with margin growth Expansion of Fashion to Figure, on-going implementation of strategic plan supported with double digit eCommerce growth Expanded our digitally native brand Happy x Nature, Kate Hudson’s first ready-to-wear line Key additions to RTW leadership team, representing industry leaders in customer, marketing, digital, and technology. Approximately $83 million in cash on-hand or $1.28 per share, with no debt SECOND QUARTER 2019 KEY ACHIEVEMENTS
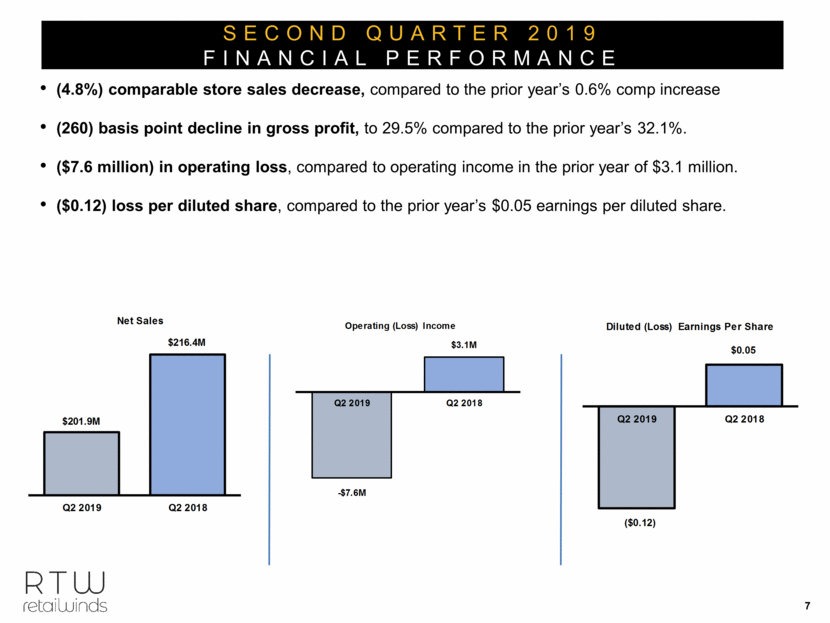
(4.8%) comparable store sales decrease, compared to the prior year’s 0.6% comp increase (260) basis point decline in gross profit, to 29.5% compared to the prior year’s 32.1%. ($7.6 million) in operating loss, compared to operating income in the prior year of $3.1 million. ($0.12) loss per diluted share, compared to the prior year’s $0.05 earnings per diluted share. SECOND QUARTER 2019 FINANCIAL PERFORMANCE $201.9M $216.4M Q2 2019 Q2 2018 Net Sales - $7.6M $3.1M Q2 2019 Q2 2018 Operating (Loss) Income ($0.12) $0.05 Q2 2019 Q2 2018 Diluted (Loss) Earnings Per Share
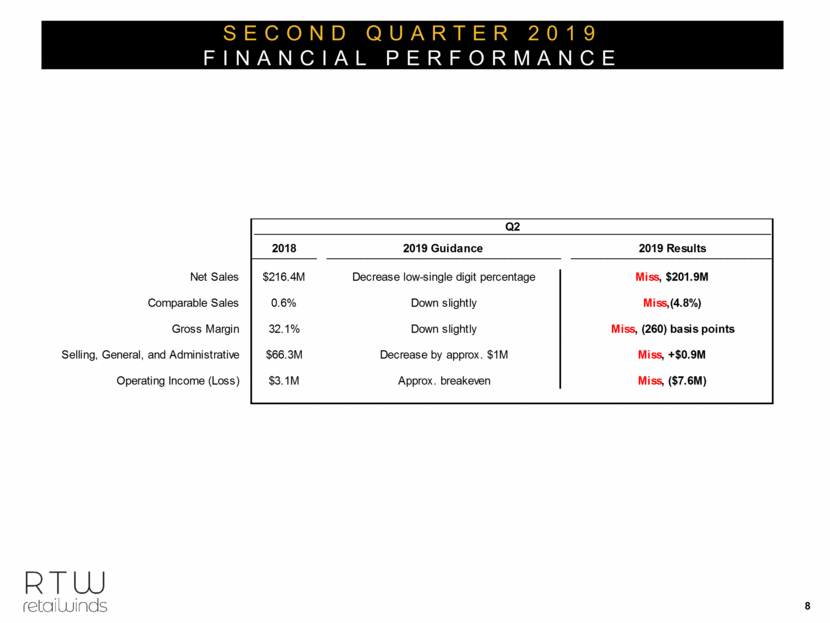
SECOND QUARTER 2019 FINANCIAL PERFORMANCE 2018 2019 Guidance 2019 Results Net Sales $216.4M Decrease low-single digit percentage Miss , $201.9M Comparable Sales 0.6% Down slightly Miss ,(4.8%) Gross Margin 32.1% Down slightly Miss , (260) basis points Selling, General, and Administrative $66.3M Decrease by approx. $1M Miss , +$0.9M Operating Income (Loss) $3.1M Approx. breakeven Miss , ($7.6M) Q2
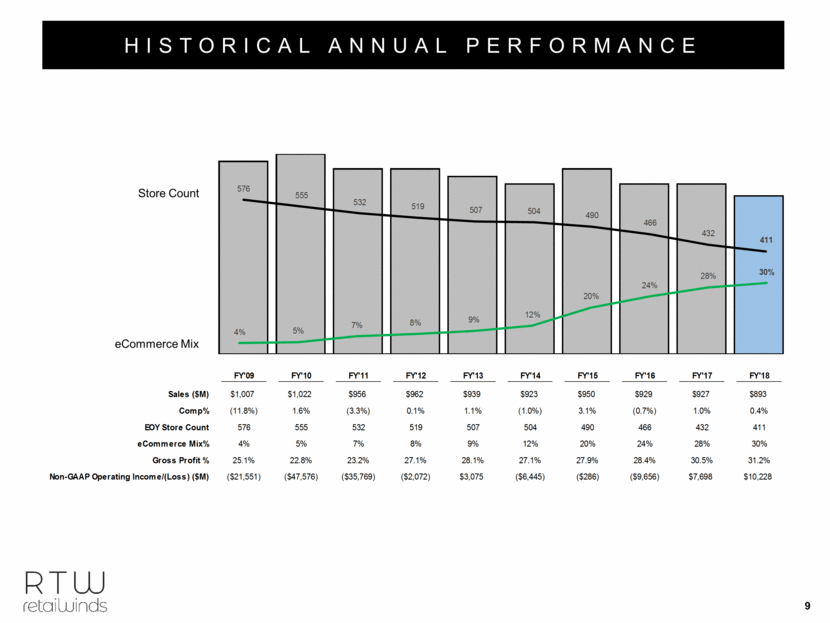
HISTORICAL ANNUAL PERFORMANCE eCommerce Mix Store Count FY'09 FY'10 FY'11 FY'12 FY'13 FY'14 FY'15 FY'16 FY'17 FY'18 Sales ($M) $1,007 $1,022 $956 $962 $939 $923 $950 $929 $927 $893 Comp% (11.8%) 1.6% (3.3%) 0.1% 1.1% (1.0%) 3.1% (0.7%) 1.0% 0.4% EOY Store Count 576 555 532 519 507 504 490 466 432 411 eCommerce Mix% 4% 5% 7% 8% 9% 12% 20% 24% 28% 30% Gross Profit % 25.1% 22.8% 23.2% 27.1% 28.1% 27.1% 27.9% 28.4% 30.5% 31.2% Non-GAAP Operating Income/(Loss) ($M) ($21,551) ($47,576) ($35,769) ($2,072) $3,075 ($6,445) ($286) ($9,656) $7,698 $10,228 576 555 532 519 507 504 490 466 432 411 4% 5% 7% 8% 9% 12% 20% 24% 28% 30%
Q3 2019 OUTLOOK

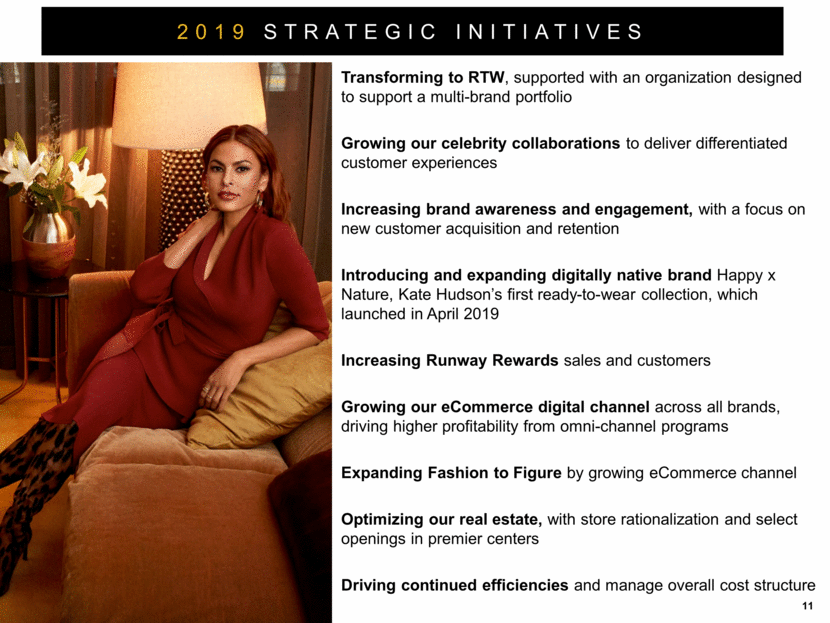
Transforming to RTW, supported with an organization designed to support a multi-brand portfolio Growing our celebrity collaborations to deliver differentiated customer experiences Increasing brand awareness and engagement, with a focus on new customer acquisition and retention Introducing and expanding digitally native brand Happy x Nature, Kate Hudson’s first ready-to-wear collection, which launched in April 2019 Increasing Runway Rewards sales and customers Growing our eCommerce digital channel across all brands, driving higher profitability from omni-channel programs Expanding Fashion to Figure by growing eCommerce channel Optimizing our real estate, with store rationalization and select openings in premier centers Driving continued efficiencies and manage overall cost structure 2019 STRATEGIC INITIATIVES
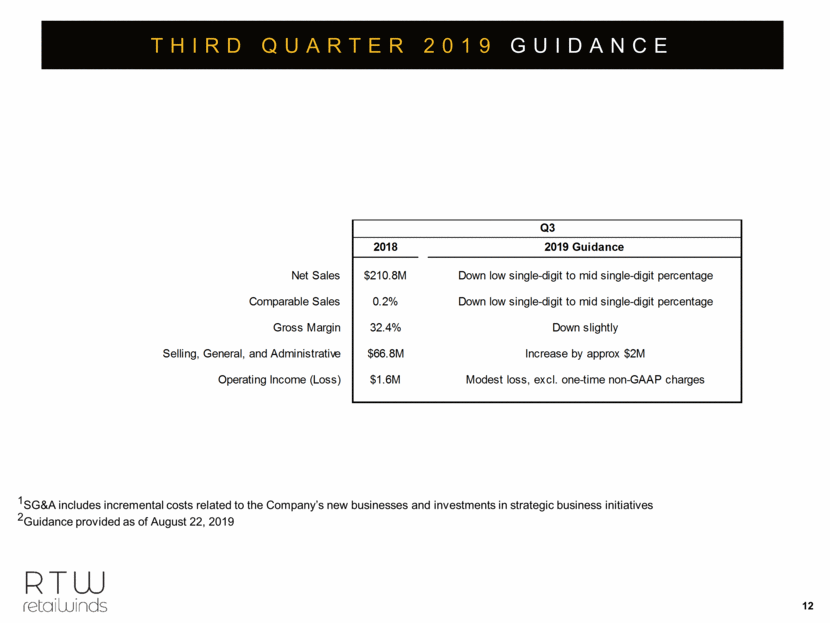
THIRD QUARTER 2019 GUIDANCE 1SG&A includes incremental costs related to the Company’s new businesses and investments in strategic business initiatives 2Guidance provided as of August 22, 2019 2018 2019 Guidance Net Sales $210.8M Down low single-digit to mid single-digit percentage Comparable Sales 0.2% Down low single-digit to mid single-digit percentage Gross Margin 32.4% Down slightly Selling, General, and Administrative $66.8M Increase by approx $2M Operating Income (Loss) $1.6M Modest loss, excl. one-time non-GAAP charges Q3
APPENDIX

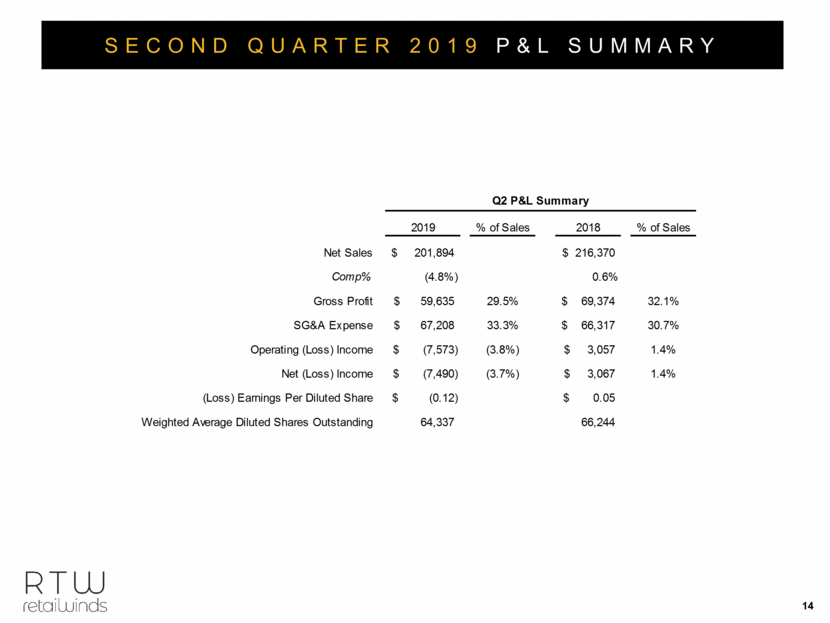
SECOND QUARTER 2019 P&L SUMMARY 2019 % of Sales 2018 % of Sales Net Sales 201,894 $ 216,370 $ Comp% (4.8%) 0.6% Gross Profit 59,635 $ 29.5% 69,374 $ 32.1% SG&A Expense 67,208 $ 33.3% 66,317 $ 30.7% Operating (Loss) Income (7,573) $ (3.8%) 3,057 $ 1.4% Net (Loss) Income (7,490) $ (3.7%) 3,067 $ 1.4% (Loss) Earnings Per Diluted Share (0.12) $ 0.05 $ Weighted Average Diluted Shares Outstanding 64,337 66,244 Q2 P&L Summary
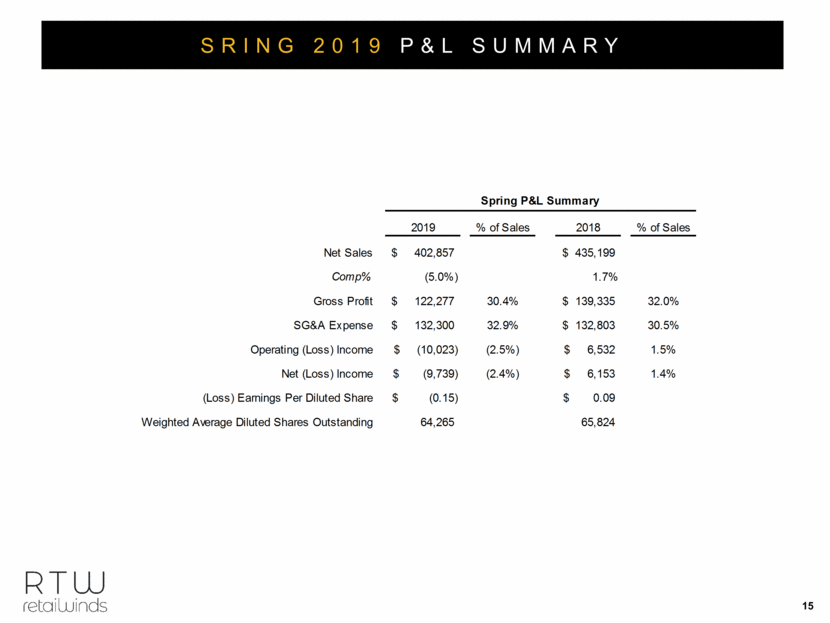
SRING 2019 P&L SUMMARY 2019 % of Sales 2018 % of Sales Net Sales 402,857 $ 435,199 $ Comp% (5.0%) 1.7% Gross Profit 122,277 $ 30.4% 139,335 $ 32.0% SG&A Expense 132,300 $ 32.9% 132,803 $ 30.5% Operating (Loss) Income (10,023) $ (2.5%) 6,532 $ 1.5% Net (Loss) Income (9,739) $ (2.4%) 6,153 $ 1.4% (Loss) Earnings Per Diluted Share (0.15) $ 0.09 $ Weighted Average Diluted Shares Outstanding 64,265 65,824 Spring P&L Summary
[LOGO]
