Exhibit (c)(2)

Project Cure PRESENTATI O N T O T H E S P E C I A L C O M M I T T E E J A N U A R Y 4 , 2 0 1 8 | C O N F I D E N T I A L
Table of Contents Page 1. Executive Summary 3 2. Financial Analyses 9 3. Appendices (Informational) 17 Weighted Average Cost of Capital 18 Observed Data 22 Illustrative Selected Transactions 25 Certain Observations 27 4. Disclaimer 35
Page 1. Executive Summary 3 2. Financial Analyses 9 3. Appendices (Informational) 17 4. Disclaimer 35
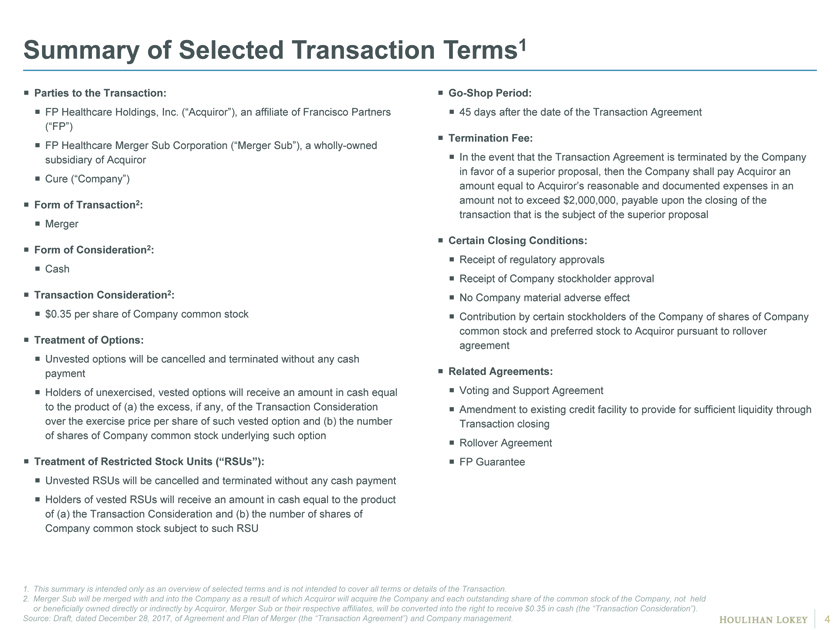
Summary of Selected Transaction Terms1 ï,¡ Parties to the Transaction: ï,¡ FP Healthcare Holdings, Inc. (“Acquiror”), an affiliate of Francisco Partners (“FP”)ï,¡ FP Healthcare Merger Sub Corporation (“Merger Sub”), a wholly-owned subsidiary of Acquirorï,¡ Cure (“Company”) ï,¡ Form of Transaction2: ï,¡ Merger ï,¡ Form of Consideration2: ï,¡ Cash ï,¡ Transaction Consideration2: ï,¡ $0.35 per share of Company common stock ï,¡ Treatment of Options: ï,¡ Unvested options will be cancelled and terminated without any cash paymentï,¡ Holders of unexercised, vested options will receive an amount in cash equal to the product of (a) the excess, if any, of the Transaction Consideration over the exercise price per share of such vested option and (b) the number of shares of Company common stock underlying such option ï,¡ Treatment of Restricted Stock Units (“RSUs”): ï,¡ Unvested RSUs will be cancelled and terminated without any cash paymentï,¡ Holders of vested RSUs will receive an amount in cash equal to the product of (a) the Transaction Consideration and (b) the number of shares of Company common stock subject to such RSU ï,¡Go-Shop Period: ï,¡ 45 days after the date of the Transaction Agreement ï,¡ Termination Fee: ï,¡ In the event that the Transaction Agreement is terminated by the Company in favor of a superior proposal, then the Company shall pay Acquiror an amount equal to Acquiror’s reasonable and documented expenses in an amount not to exceed $2,000,000, payable upon the closing of the transaction that is the subject of the superior proposal ï,¡ Certain Closing Conditions: ï,¡ Receipt of regulatory approvals ï,¡ Receipt of Company stockholder approvalï,¡ No Company material adverse effect ï,¡ Contribution by certain stockholders of the Company of shares of Company common stock and preferred stock to Acquiror pursuant to rollover agreement ï,¡ Related Agreements: ï,¡ Voting and Support Agreement ï,¡ Amendment to existing credit facility to provide for sufficient liquidity through Transaction closingï,¡ Rollover Agreementï,¡ FP Guarantee 1. This summary is intended only as an overview of selected terms and is not intended to cover all terms or details of the Transaction. 2. Merger Sub will be merged with and into the Company as a result of which Acquiror will acquire the Company and each outstanding share of the common stock of the Company, not held or beneficially owned directly or indirectly by Acquiror, Merger Sub or their respective affiliates, will be converted into the right to receive $0.35 in cash (the “Transaction Consideration”). Source: Draft, dated December 28, 2017, of Agreement and Plan of Merger (the “Transaction Agreement”) and Company management.
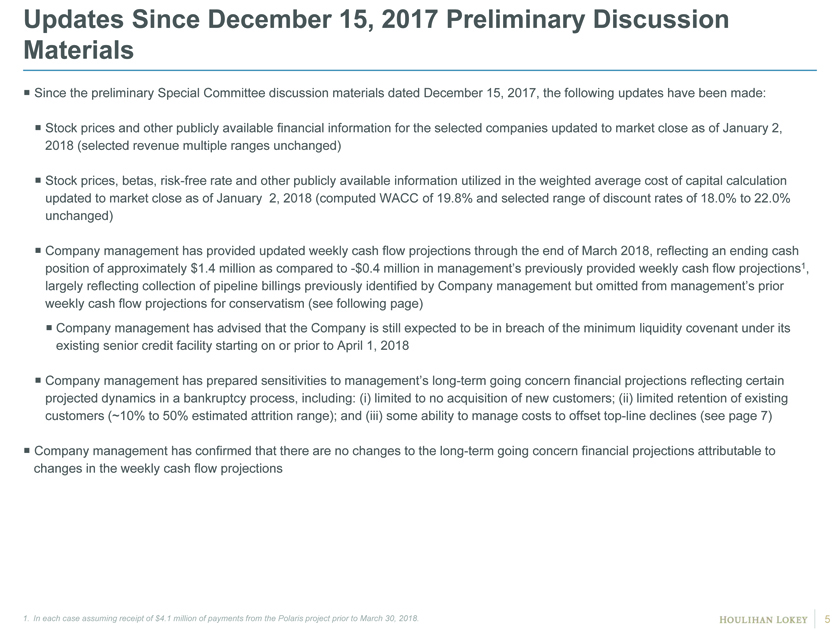
Updates Since December 15, 2017 Preliminary Discussion Materials ï,¡ Since the preliminary Special Committee discussion materials dated December 15, 2017, the following updates have been made: ï,¡ Stock prices and other publicly available financial information for the selected companies updated to market close as of January 2, 2018 (selected revenue multiple ranges unchanged) ï,¡ Stock prices, betas, risk-free rate and other publicly available information utilized in the weighted average cost of capital calculation updated to market close as of January 2, 2018 (computed WACC of 19.8% and selected range of discount rates of 18.0% to 22.0% unchanged) ï,¡ Company management has provided updated weekly cash flow projections through the end of March 2018, reflecting an ending cash position of approximately $1.4 million as compared to -$0.4 million in management’s previously provided weekly cash flow projections1, largely reflecting collection of pipeline billings previously identified by Company management but omitted from management’s prior weekly cash flow projections for conservatism (see following page)ï,¡ Company management has advised that the Company is still expected to be in breach of the minimum liquidity covenant under its existing senior credit facility starting on or prior to April 1, 2018 ï,¡ Company management has prepared sensitivities to management’s long-term going concern financial projections reflecting certain projected dynamics in a bankruptcy process, including: (i) limited to no acquisition of new customers; (ii) limited retention of existing customers (~10% to 50% estimated attrition range); and (iii) some ability to manage costs to offsettop-line declines (see page 7) ï,¡ Company management has confirmed that there are no changes to the long-term going concern financial projections attributable to changes in the weekly cash flow projections 1. In each case assuming receipt of $4.1 million of payments from the Polaris project prior to March 30, 2018.
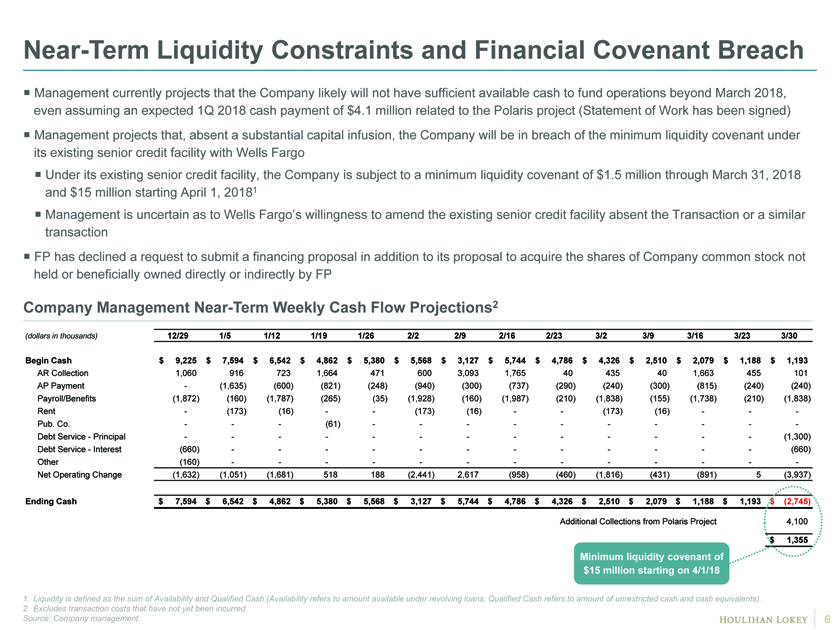
Near-Term Liquidity Constraints and Financial Covenant Breach ï,¡ Management currently projects that the Company likely will not have sufficient available cash to fund operations beyond March 2018, even assuming an expected 1Q 2018 cash payment of $4.1 million related to the Polaris project (Statement of Work has been signed)ï,¡ Management projects that, absent a substantial capital infusion, the Company will be in breach of the minimum liquidity covenant under its existing senior credit facility with Wells Fargoï,¡ Under its existing senior credit facility, the Company is subject to a minimum liquidity covenant of $1.5 million through March 31, 2018 and $15 million starting April 1, 20181ï,¡ Management is uncertain as to Wells Fargo’s willingness to amend the existing senior credit facility absent the Transaction or a similar transactionï,¡ FP has declined a request to submit a financing proposal in addition to its proposal to acquire the shares of Company common stock not held or beneficially owned directly or indirectly by FP Company Management Near-Term Weekly Cash Flow Projections2 (dollars in thousands) 12/29 1/5 1/12 1/19 1/26 2/2 2/9 2/16 2/23 3/2 3/9 3/16 3/23 3/30 Begin Cash $ 9,225 $ 7,594 $ 6,542 $ 4,862 $ 5,380 $ 5,568 $ 3,127 $ 5,744 $ 4,786 $ 4,326 $ 2,510 $ 2,079 $ 1,188 $ 1,193 AR Collection 1,060 916 723 1,664 471 600 3,093 1,765 40 435 40 1,663 455 101 AP Payment — (1,635) (600) (821) (248) (940) (300) (737) (290) (240) (300) (815) (240) (240) Payroll/Benefits (1,872) (160) (1,787) (265) (35) (1,928) (160) (1,987) (210) (1,838) (155) (1,738) (210) (1,838) Rent — (173) (16) — — (173) (16) — — (173) (16) — — -Pub. Co. — — — (61) — — — — — — — — — -Debt Service—Principal — — — — — — — — — — — — — (1,300) Debt Service—Interest (660) — — — — — — — — — — — — (660) Other (160) — — — — — — — — — — — — -Net Operating Change (1,632) (1,051) (1,681) 518 188 (2,441) 2,617 (958) (460) (1,816) (431) (891) 5 (3,937) Ending Cash $ 7,594 $ 6,542 $ 4,862 $ 5,380 $ 5,568 $ 3,127 $ 5,744 $ 4,786 $ 4,326 $ 2,510 $ 2,079 $ 1,188 $ 1,193 $ (2,745) Additional Collections from Polaris Project 4,100 $ 1,355 Minimum liquidity covenant of $15 million starting on 4/1/18 1. Liquidity is defined as the sum of Availability and Qualified Cash (Availability refers to amount available under revolving loans; Qualified Cash refers to amount of unrestricted cash and cash equivalents). 2. Excludes transaction costs that have not yet been incurred. Source: Company management. 6
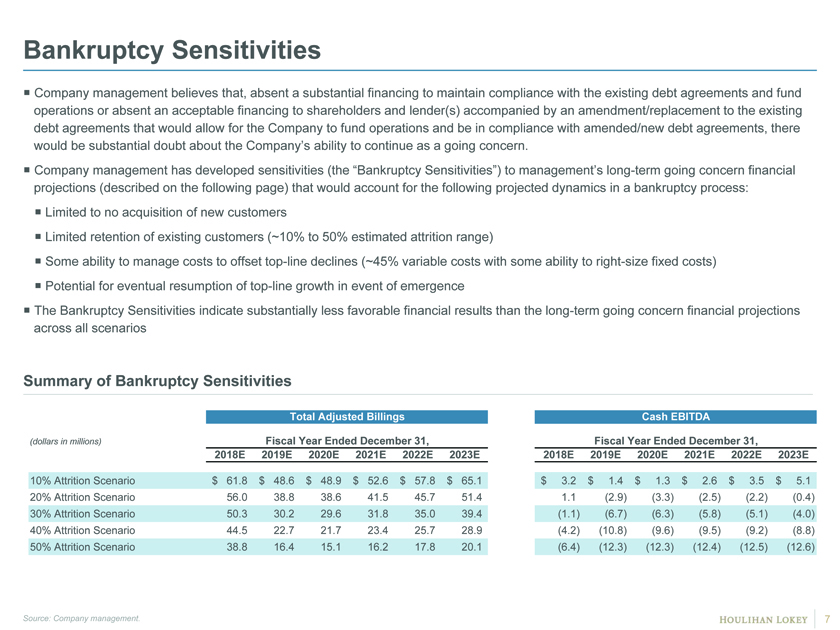
Bankruptcy Sensitivities ï,¡ Company management believes that, absent a substantial financing to maintain compliance with the existing debt agreements and fund operations or absent an acceptable financing to shareholders and lender(s) accompanied by an amendment/replacement to the existing debt agreements that would allow for the Company to fund operations and be in compliance with amended/new debt agreements, there would be substantial doubt about the Company’s ability to continue as a going concern. ï,¡ Company management has developed sensitivities (the “Bankruptcy Sensitivities”) to management’s long-term going concern financial projections (described on the following page) that would account for the following projected dynamics in a bankruptcy process: ï,¡ Limited to no acquisition of new customers ï,¡ Limited retention of existing customers (~10% to 50% estimated attrition range) ï,¡ Some ability to manage costs to offsettop-line declines (~45% variable costs with some ability toright-size fixed costs) ï,¡ Potential for eventual resumption oftop-line growth in event of emergence ï,¡ The Bankruptcy Sensitivities indicate substantially less favorable financial results than the long-term going concern financial projections across all scenarios Summary of Bankruptcy Sensitivities Total Adjusted Billings Cash EBITDA (dollars in millions) Fiscal Year Ended December 31, Fiscal Year Ended December 31, 2018E 2019E 2020E 2021E 2022E 2023E 2018E 2019E 2020E 2021E 2022E 2023E 10% Attrition Scenario $ 61.8 $ 48.6 $ 48.9 $ 52.6 $ 57.8 $ 65.1 $ 3.2 $ 1.4 $ 1.3 $ 2.6 $ 3.5 $ 5.1 20% Attrition Scenario 56.0 38.8 38.6 41.5 45.7 51.4 1.1 (2.9) (3.3) (2.5) (2.2) (0.4) 30% Attrition Scenario 50.3 30.2 29.6 31.8 35.0 39.4 (1.1) (6.7) (6.3) (5.8) (5.1) (4.0) 40% Attrition Scenario 44.5 22.7 21.7 23.4 25.7 28.9 (4.2) (10.8) (9.6) (9.5) (9.2) (8.8) 50% Attrition Scenario 38.8 16.4 15.1 16.2 17.8 20.1 (6.4) (12.3) (12.3) (12.4) (12.5) (12.6) Source: Company management.
Certain Business and Financial Matters Long-Term Going Concern Financial Projections ï,¡ Management’s long-term going concern financial projections assume the Company is able to raise sufficient external financing required to continue to operate as a going concernï,¡ Absent sufficient financing, Company management believes that the Company faces significant operating challenges that are not reflected in management’s long-term going concern financial projections, including that (i) acquisition of new customers will be unlikely and (ii) retention of existing customers will be more difficultï,¡ Financial projections methodology: ï,¡ Detailed 2018 budget – “bottoms up”top-line build, detailed expense buildï,¡ High-level estimates for 2019 – 2023 based onmid- to high-teen growth rates for the Medicare business (Over 65 segment) and, after an initial decline in the other business segment (Under 65 segment),mid-single digit tolow-teen growth rates for the rest of the business Support for Financial Analyses ï,¡ Review of near-term weekly cash flow forecast and Bankruptcy Sensitivities ï,¡ Given uncertainty regarding the particulars of a bankruptcy process and associated operating challenges, we have utilized management’s long-term going concern financial projections for purposes of our analyses but note the Company’s circumstances, the near-term weekly cash flow forecast and the Bankruptcy Sensitivities Certain Business Considerations ï,¡ Revenue contributions of “Over 65” and “Under 65” platforms ï,¡ Macro factors driving growth in Medicare platform (i.e., demographics, demand for drug comparison tool) ï,¡ Macro dynamics driving softer demand and increased churn in Under 65 market (i.e., health plan carriers withdrawing from the Individual and Family Plans (“IFPs”) market)ï,¡ Weaker / slower than expected adoption to date of customer-centric decision-making model ï,¡ Changes togo-to-market strategyï,¡ Benefits of scale in large payor marketplace Source: Company management.
Page 1. Executive Summary 3 2. Financial Analyses 9 3. Appendices (Informational) 17 4. Disclaimer 35
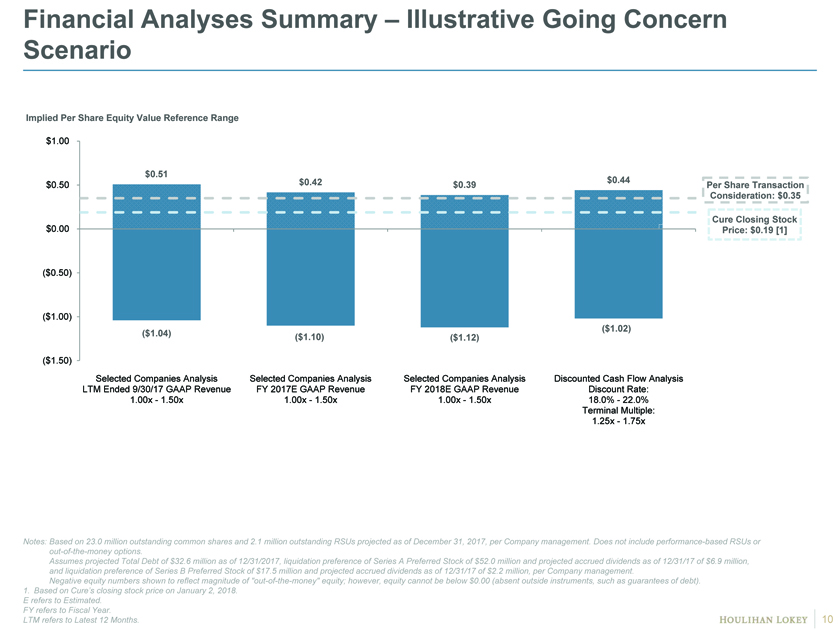
Financial Analyses Summary – Illustrative Going Concern Scenario Implied Per Share Equity Value Reference Range $1.00 $0.51 $0.42 $0.44 $0.50 $0.39 Per Share Transaction Consideration: $0.35 Cure Closing Stock $0.00 Price: $0.19 [1] ($0.50) ($1.00) ($1.02) ($1.04) ($1.10) ($1.12) ($1.50) Selected Companies Analysis Selected Companies Analysis Selected Companies Analysis Discounted Cash Flow Analysis LTM Ended 9/30/17 GAAP Revenue FY 2017E GAAP Revenue FY 2018E GAAP Revenue Discount Rate: 1.00x—1.50x 1.00x—1.50x 1.00x—1.50x 18.0%—22.0% Terminal Multiple: 1.25x—1.75x Notes: Based on 23.0 million outstanding common shares and 2.1 million outstanding RSUs projected as of December 31, 2017, per Company management. Does not include performance-based RSUs orout-of-the-money options. Assumes projected Total Debt of $32.6 million as of 12/31/2017, liquidation preference of Series A Preferred Stock of $52.0 million and projected accrued dividends as of 12/31/17 of $6.9 million, and liquidation preference of Series B Preferred Stock of $17.5 million and projected accrued dividends as of 12/31/17 of $2.2 million, per Company management. Negative equity numbers shown to reflect magnitude of“out-of-the-money” equity; however, equity cannot be below $0.00 (absent outside instruments, such as guarantees of debt). 1. Based on Cure’s closing stock price on January 2, 2018. E refers to Estimated. FY refers to Fiscal Year. LTM refers to Latest 12 Months.
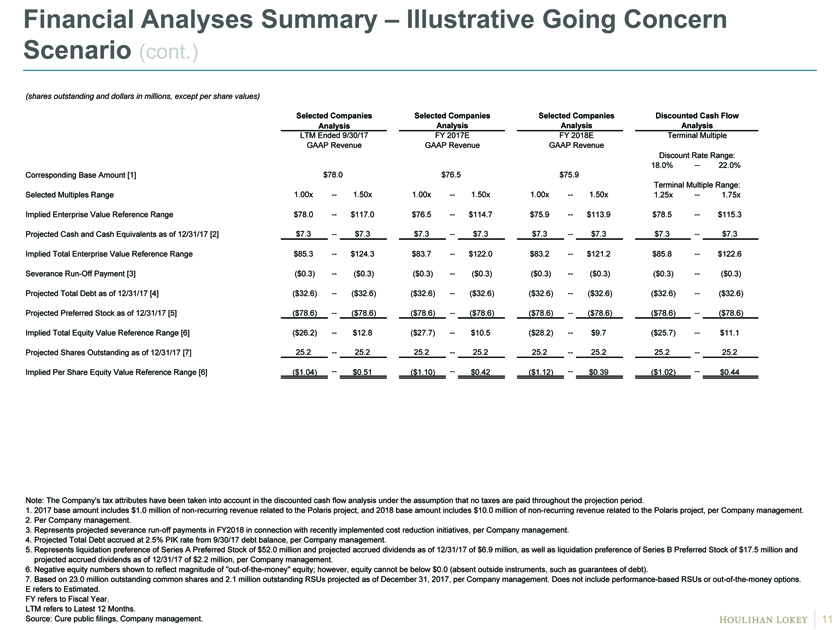
Financial Analyses Summary – Illustrative Going Concern Scenario (cont.) (shares outstanding and dollars in millions, except per share values) Selected Companies Selected Companies Selected Companies Discounted Cash Flow Analysis Analysis Analysis Analysis LTM Ended 9/30/17 FY 2017E FY 2018E Terminal Multiple GAAP Revenue GAAP Revenue GAAP Revenue Discount Rate Range: 18.0% — 22.0% Corresponding Base Amount [1] $78.0 $76.5 $75.9 Terminal Multiple Range: Selected Multiples Range 1.00x — 1.50x 1.00x — 1.50x 1.00x — 1.50x 1.25x — 1.75x Implied Enterprise Value Reference Range $78.0 — $117.0 $76.5 — $114.7 $75.9 — $113.9 $78.5 — $115.3 Projected Cash and Cash Equivalents as of 12/31/17 [2] $7.3 — $7.3 $7.3 — $7.3 $7.3 — $7.3 $7.3 — $7.3 Implied Total Enterprise Value Reference Range $85.3 — $124.3 $83.7 — $122.0 $83.2 — $121.2 $85.8 — $122.6 SeveranceRun-Off Payment [3] ($0.3) — ($0.3) ($0.3) — ($0.3) ($0.3) — ($0.3) ($0.3) — ($0.3) Projected Total Debt as of 12/31/17 [4] ($32.6) — ($32.6) ($32.6) — ($32.6) ($32.6) — ($32.6) ($32.6) — ($32.6) Projected Preferred Stock as of 12/31/17 [5] ($78.6) — ($78.6) ($78.6) — ($78.6) ($78.6) — ($78.6) ($78.6) — ($78.6) Implied Total Equity Value Reference Range [6] ($26.2) — $12.8 ($27.7) — $10.5 ($28.2) — $9.7 ($25.7) — $11.1 Projected Shares Outstanding as of 12/31/17 [7] 25.2 — 25.2 25.2 — 25.2 25.2 — 25.2 25.2 — 25.2 Implied Per Share Equity Value Reference Range [6] ($1.04) — $0.51 ($1.10) — $0.42 ($1.12) — $0.39 ($1.02) — $0.44 Note: The Company’s tax attributes have been taken into account in the discounted cash flow analysis under the assumption that no taxes are paid throughout the projection period. 1. 2017 base amount includes $1.0 million ofnon-recurring revenue related to the Polaris project, and 2018 base amount includes $10.0 million ofnon-recurring revenue related to the Polaris project, per Company management. 2. Per Company management. 3. Represents projected severancerun-off payments in FY2018 in connection with recently implemented cost reduction initiatives, per Company management. 4. Projected Total Debt accrued at 2.5% PIK rate from 9/30/17 debt balance, per Company management. 5. Represents liquidation preference of Series A Preferred Stock of $52.0 million and projected accrued dividends as of 12/31/17 of $6.9 million, as well as liquidation preference of Series B Preferred Stock of $17.5 million and projected accrued dividends as of 12/31/17 of $2.2 million, per Company management. 6. Negative equity numbers shown to reflect magnitude of“out-of-the-money” equity; however, equity cannot be below $0.0 (absent outside instruments, such as guarantees of debt). 7. Based on 23.0 million outstanding common shares and 2.1 million outstanding RSUs projected as of December 31, 2017, per Company management. Does not include performance-based RSUs orout-of-the-money options. E refers to Estimated. FY refers to Fiscal Year. LTM refers to Latest 12 Months. Source: Cure public filings, Company management.
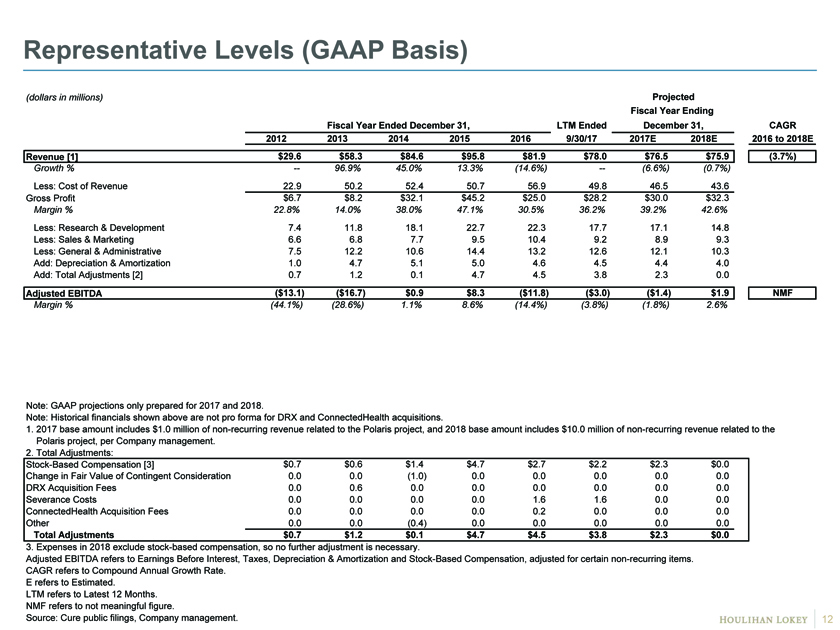
Representative Levels (GAAP Basis) (dollars in millions) Projected Fiscal Year Ending Fiscal Year Ended December 31, LTM Ended December 31, CAGR 2012 2013 2014 2015 2016 9/30/17 2017E 2018E 2016 to 2018E Revenue [1] $29.6 $58.3 $84.6 $95.8 $81.9 $78.0 $76.5 $75.9 (3.7%) Growth % — 96.9% 45.0% 13.3% (14.6%) — (6.6%) (0.7%) Less: Cost of Revenue 22.9 50.2 52.4 50.7 56.9 49.8 46.5 43.6 Gross Profit $6.7 $8.2 $32.1 $45.2 $25.0 $28.2 $30.0 $32.3 Margin % 22.8% 14.0% 38.0% 47.1% 30.5% 36.2% 39.2% 42.6% Less: Research & Development 7.4 11.8 18.1 22.7 22.3 17.7 17.1 14.8 Less: Sales & Marketing 6.6 6.8 7.7 9.5 10.4 9.2 8.9 9.3 Less: General & Administrative 7.5 12.2 10.6 14.4 13.2 12.6 12.1 10.3 Add: Depreciation & Amortization 1.0 4.7 5.1 5.0 4.6 4.5 4.4 4.0 Add: Total Adjustments [2] 0.7 1.2 0.1 4.7 4.5 3.8 2.3 0.0 Adjusted EBITDA ($13.1) ($16.7) $0.9 $8.3 ($11.8) ($3.0) ($1.4) $1.9 NMF Margin % (44.1%) (28.6%) 1.1% 8.6% (14.4%) (3.8%) (1.8%) 2.6% Note: GAAP projections only prepared for 2017 and 2018. Note: Historical financials shown above are not pro forma for DRX and ConnectedHealth acquisitions. 1. 2017 base amount includes $1.0 million ofnon-recurring revenue related to the Polaris project, and 2018 base amount includes $10.0 million ofnon-recurring revenue related to the Polaris project, per Company management. 2. Total Adjustments: Stock-Based Compensation [3] $0.7 $0.6 $1.4 $4.7 $2.7 $2.2 $2.3 $0.0 Change in Fair Value of Contingent Consideration 0.0 0.0 (1.0) 0.0 0.0 0.0 0.0 0.0 DRX Acquisition Fees 0.0 0.6 0.0 0.0 0.0 0.0 0.0 0.0 Severance Costs 0.0 0.0 0.0 0.0 1.6 1.6 0.0 0.0 ConnectedHealth Acquisition Fees 0.0 0.0 0.0 0.0 0.2 0.0 0.0 0.0 Other 0.0 0.0 (0.4) 0.0 0.0 0.0 0.0 0.0 Total Adjustments $0.7 $1.2 $0.1 $4.7 $4.5 $3.8 $2.3 $0.0 3. Expenses in 2018 exclude stock-based compensation, so no further adjustment is necessary. Adjusted EBITDA refers to Earnings Before Interest, Taxes, Depreciation & Amortization and Stock-Based Compensation, adjusted for certainnon-recurring items. CAGR refers to Compound Annual Growth Rate. E refers to Estimated. LTM refers to Latest 12 Months. NMF refers to not meaningful figure. Source: Cure public filings, Company management.
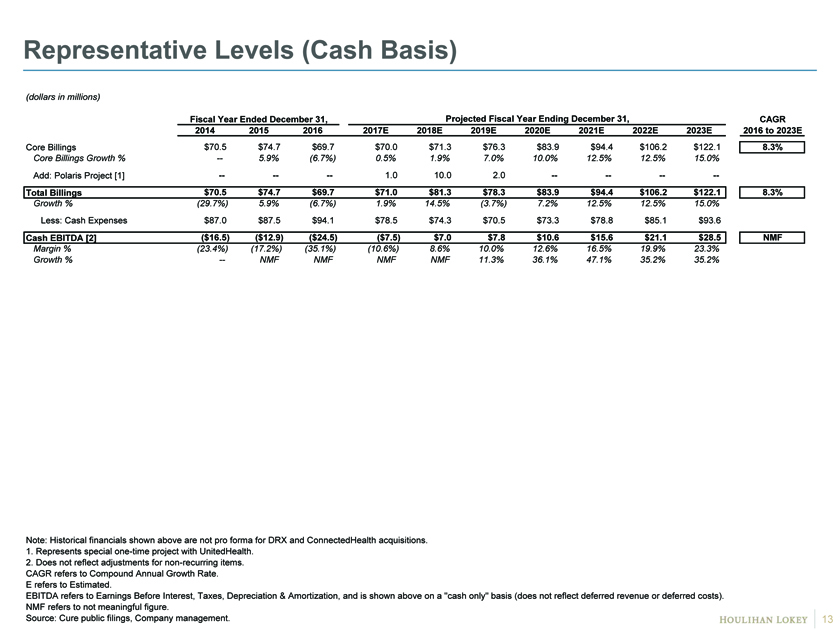
Representative Levels (Cash Basis) (dollars in millions) Fiscal Year Ended December 31, Projected Fiscal Year Ending December 31, CAGR 2014 2015 2016 2017E 2018E 2019E 2020E 2021E 2022E 2023E 2016 to 2023E Core Billings $ 70.5 $74.7 $69.7 $70.0 $71.3 $76.3 $83.9 $94.4 $106.2 $122.1 8.3% Core Billings Growth % — 5.9% (6.7%) 0.5% 1.9% 7.0% 10.0% 12.5% 12.5% 15.0% Add: Polaris Project [1] — — — 1.0 10.0 2.0 — — — — Total Billings $ 70.5 $74.7 $69.7 $71.0 $81.3 $78.3 $83.9 $94.4 $106.2 $122.1 8.3% Growth % (29.7%) 5.9% (6.7%) 1.9% 14.5% (3.7%) 7.2% 12.5% 12.5% 15.0% Less: Cash Expenses $ 87.0 $87.5 $94.1 $78.5 $74.3 $70.5 $73.3 $78.8 $85.1 $93.6 Cash EBITDA [2] ($ 16.5) ($12.9) ($24.5) ($7.5) $7.0 $7.8 $10.6 $15.6 $21.1 $28.5 NMF Margin % (23.4%) (17.2%) (35.1%) (10.6%) 8.6% 10.0% 12.6% 16.5% 19.9% 23.3% Growth % — NMF NMF NMF NMF 11.3% 36.1% 47.1% 35.2% 35.2% Note: Historical financials shown above are not pro forma for DRX and ConnectedHealth acquisitions. 1. Represents specialone-time project with UnitedHealth. 2. Does not reflect adjustments fornon-recurring items. CAGR refers to Compound Annual Growth Rate. E refers to Estimated. EBITDA refers to Earnings Before Interest, Taxes, Depreciation & Amortization, and is shown above on a “cash only” basis (does not reflect deferred revenue or deferred costs). NMF refers to not meaningful figure. Source: Cure public filings, Company management.
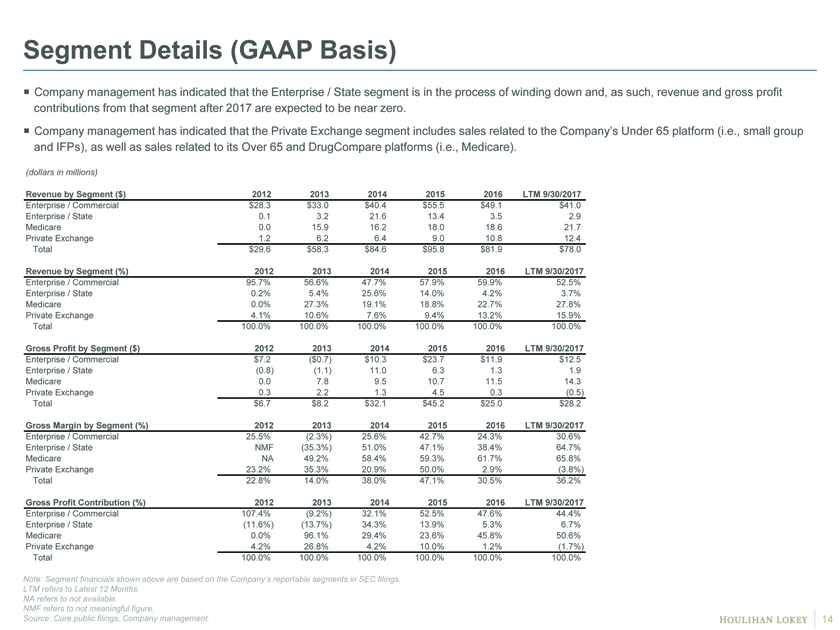
Segment Details (GAAP Basis) ï,¡ Company management has indicated that the Enterprise / State segment is in the process of winding down and, as such, revenue and gross profit contributions from that segment after 2017 are expected to be near zero. ï,¡ Company management has indicated that the Private Exchange segment includes sales related to the Company’s Under 65 platform (i.e., small group and IFPs), as well as sales related to its Over 65 and DrugCompare platforms (i.e., Medicare). (dollars in millions) Revenue by Segment ($) 2012 2013 2014 2015 2016 LTM 9/30/2017 Enterprise / Commercial $28.3 $33.0 $40.4 $55.5 $49.1 $41.0 Enterprise / State 0.1 3.2 21.6 13.4 3.5 2.9 Medicare 0.0 15.9 16.2 18.0 18.6 21.7 Private Exchange 1.2 6.2 6.4 9.0 10.8 12.4 Total $29.6 $58.3 $84.6 $95.8 $81.9 $78.0 Revenue by Segment (%) 2012 2013 2014 2015 2016 LTM 9/30/2017 Enterprise / Commercial 95.7% 56.6% 47.7% 57.9% 59.9% 52.5% Enterprise / State 0.2% 5.4% 25.6% 14.0% 4.2% 3.7% Medicare 0.0% 27.3% 19.1% 18.8% 22.7% 27.8% Private Exchange 4.1% 10.6% 7.6% 9.4% 13.2% 15.9% Total 100.0% 100.0% 100.0% 100.0% 100.0% 100.0% Gross Profit by Segment ($) 2012 2013 2014 2015 2016 LTM 9/30/2017 Enterprise / Commercial $7.2 ($0.7) $10.3 $23.7 $11.9 $12.5 Enterprise / State (0.8) (1.1) 11.0 6.3 1.3 1.9 Medicare 0.0 7.8 9.5 10.7 11.5 14.3 Private Exchange 0.3 2.2 1.3 4.5 0.3 (0.5) Total $6.7 $8.2 $32.1 $45.2 $25.0 $28.2 Gross Margin by Segment (%) 2012 2013 2014 2015 2016 LTM 9/30/2017 Enterprise / Commercial 25.5% (2.3%) 25.6% 42.7% 24.3% 30.6% Enterprise / State NMF (35.3%) 51.0% 47.1% 38.4% 64.7% Medicare NA 49.2% 58.4% 59.3% 61.7% 65.8% Private Exchange 23.2% 35.3% 20.9% 50.0% 2.9% (3.8%) Total 22.8% 14.0% 38.0% 47.1% 30.5% 36.2% Gross Profit Contribution (%) 2012 2013 2014 2015 2016 LTM 9/30/2017 Enterprise / Commercial 107.4% (9.2%) 32.1% 52.5% 47.6% 44.4% Enterprise / State (11.6%) (13.7%) 34.3% 13.9% 5.3% 6.7% Medicare 0.0% 96.1% 29.4% 23.6% 45.8% 50.6% Private Exchange 4.2% 26.8% 4.2% 10.0% 1.2% (1.7%) Total 100.0% 100.0% 100.0% 100.0% 100.0% 100.0% Note: Segment financials shown above are based on the Company’s reportable segments in SEC filings. LTM refers to Latest 12 Months. NA refers to not available. NMF refers to not meaningful figure. Source: Cure public filings, Company management.
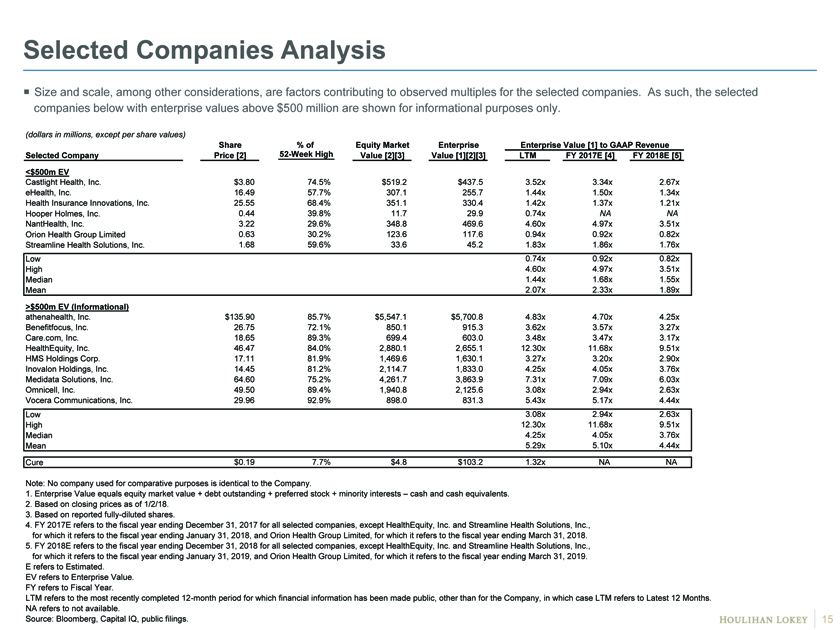
Selected Companies Analysis ï,¡ Size and scale, among other considerations, are factors contributing to observed multiples for the selected companies. As such, the selected companies below with enterprise values above $500 million are shown for informational purposes only. (dollars in millions, except per share values) Share % of Equity Market Enterprise Enterprise Value [1] to GAAP Revenue . Selected Company Price [2]52-Week High Value [2][3] Value [1][2][3] LTM FY 2017E [4] FY 2018E [5] <$500m EV Castlight Health, Inc. $3.80 74.5% ### $519.2 $437.5 3.52x ## 3.34x ## 2.67x eHealth, Inc. 16.49 57.7% ### 307.1 255.7 1.44x ## 1.50x ## 1.34x Health Insurance Innovations, Inc. 25.55 68.4% ### 351.1 330.4 1.42x ## 1.37x ## 1.21x Hooper Holmes, Inc. 0.44 39.8% ### 11.7 29.9 0.74x ## NA A NA NantHealth, Inc. 3.22 29.6% ### 348.8 469.6 4.60x ## 4.97x ## 3.51x Orion Health Group Limited 0.63 30.2% ### 123.6 117.6 0.94x ## 0.92x ## 0.82x Streamline Health Solutions, Inc. 1.68 59.6% ### 33.6 45.2 1.83x ## 1.86x ## 1.76x Low 0.74x 0.92x 0.82x High 4.60x 4.97x 3.51x Median 1.44x 1.68x 1.55x Mean 2.07x 2.33x 1.89x >$500m EV (Informational) athenahealth, Inc. $135.90 85.7% ### $5,547.1 $5,700.8 4.83x ## 4.70x ## 4.25x Benefitfocus, Inc. 26.75 72.1% ### 850.1 915.3 3.62x ## 3.57x ## 3.27x Care.com, Inc. 18.65 89.3% ### 699.4 603.0 3.48x ## 3.47x ## 3.17x HealthEquity, Inc. 46.47 84.0% ### 2,880.1 2,655.1 12.30x ## 11.68x ## 9.51x HMS Holdings Corp. 17.11 81.9% ### 1,469.6 1,630.1 3.27x ## 3.20x ## 2.90x Inovalon Holdings, Inc. 14.45 81.2% ### 2,114.7 1,833.0 4.25x ## 4.05x ## 3.76x Medidata Solutions, Inc. 64.60 75.2% ### 4,261.7 3,863.9 7.31x ## 7.09x ## 6.03x Omnicell, Inc. 49.50 89.4% ### 1,940.8 2,125.6 3.08x ## 2.94x ## 2.63x Vocera Communications, Inc. 29.96 92.9% ### 898.0 831.3 5.43x ## 5.17x ## 4.44x Low 3.08x 2.94x 2.63x High 12.30x 11.68x 9.51x Median 4.25x 4.05x 3.76x Mean 5.29x 5.10x 4.44x Cure $0.19 7.7% $4.8 $103.2 1.32x NA NA Note: No company used for comparative purposes is identical to the Company. 1. Enterprise Value equals equity market value + debt outstanding + preferred stock + minority interests – cash and cash equivalents. 2. Based on closing prices as of 1/2/18. 3. Based on reported fully-diluted shares. 4. FY 2017E refers to the fiscal year ending December 31, 2017 for all selected companies, except HealthEquity, Inc. and Streamline Health Solutions, Inc., for which it refers to the fiscal year ending January 31, 2018, and Orion Health Group Limited, for which it refers to the fiscal year ending March 31, 2018. 5. FY 2018E refers to the fiscal year ending December 31, 2018 for all selected companies, except HealthEquity, Inc. and Streamline Health Solutions, Inc., for which it refers to the fiscal year ending January 31, 2019, and Orion Health Group Limited, for which it refers to the fiscal year ending March 31, 2019. E refers to Estimated. EV refers to Enterprise Value. FY refers to Fiscal Year. LTM refers to the most recently completed12-month period for which financial information has been made public, other than for the Company, in which case LTM refers to Latest 12 Months. NA refers to not available. Source: Bloomberg, Capital IQ, public filings.
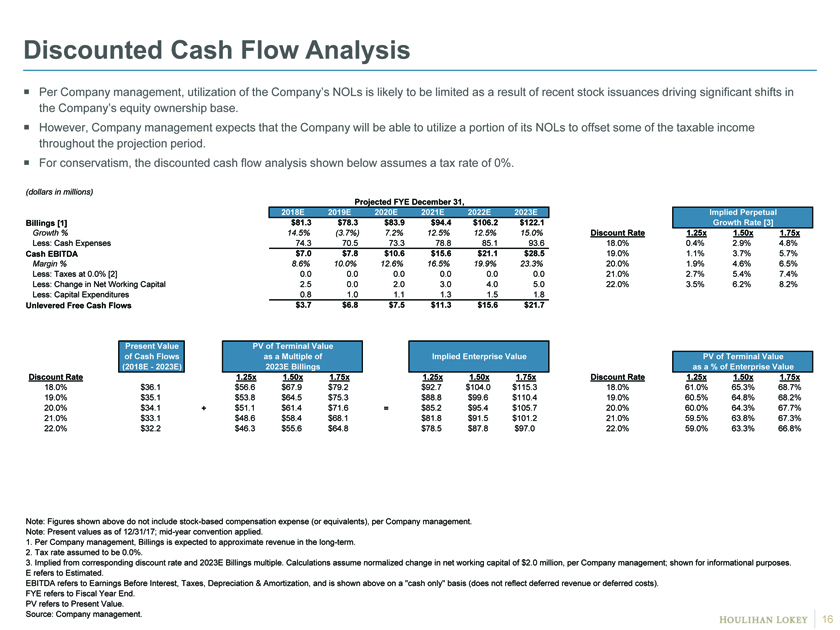
Discounted Cash Flow Analysis ï,¡ Per Company management, utilization of the Company’s NOLs is likely to be limited as a result of recent stock issuances driving significant shifts in the Company’s equity ownership base. ï,¡ However, Company management expects that the Company will be able to utilize a portion of its NOLs to offset some of the taxable income throughout the projection period. ï,¡ For conservatism, the discounted cash flow analysis shown below assumes a tax rate of 0%. (dollars in millions) Projected FYE December 31, 2018E 2019E 2020E 2021E 2022E 2023E Implied Perpetual Billings [1] $81.3 $78.3 $83.9 $94.4 $106.2 $122.1 Growth Rate [3] Growth % 14.5% (3.7%) 7.2% 12.5% 12.5% 15.0% Discount Rate 1.25x 1.50x 1.75x Less: Cash Expenses 74.3 70.5 73.3 78.8 85.1 93.6 18.0% 0.4% 2.9% 4.8% Cash EBITDA $7.0 $7.8 $10.6 $15.6 $21.1 $28.5 19.0% 1.1% 3.7% 5.7% Margin % 8.6% 10.0% 12.6% 16.5% 19.9% 23.3% 20.0% 1.9% 4.6% 6.5% Less: Taxes at 0.0% [2] 0.0 0.0 0.0 0.0 0.0 0.0 21.0% 2.7% 5.4% 7.4% Less: Change in Net Working Capital 2.5 0.0 2.0 3.0 4.0 5.0 22.0% 3.5% 6.2% 8.2% Less: Capital Expenditures 0.8 1.0 1.1 1.3 1.5 1.8 Unlevered Free Cash Flows $3.7 $6.8 $7.5 $11.3 $15.6 $21.7 Present Value PV of Terminal Value of Cash Flows as a Multiple of Implied Enterprise Value PV of Terminal Value (2018E—2023E) 2023E Billings as a % of Enterprise Value Discount Rate 1.25x 1.50x 1.75x 1.25x 1.50x 1.75x Discount Rate 1.25x 1.50x 1.75x 18.0% $36.1 $56.6 $67.9 $79.2 $92.7 $104.0 $115.3 18.0% 61.0% 65.3% 68.7% 19.0% $35.1 $53.8 $64.5 $75.3 $88.8 $99.6 $110.4 19.0% 60.5% 64.8% 68.2% 20.0% $34.1 + $51.1 $61.4 $71.6 = $85.2 $95.4 $105.7 20.0% 60.0% 64.3% 67.7% 21.0% $33.1 $48.6 $58.4 $68.1 $81.8 $91.5 $101.2 21.0% 59.5% 63.8% 67.3% 22.0% $32.2 $46.3 $55.6 $64.8 $78.5 $87.8 $97.0 22.0% 59.0% 63.3% 66.8% Note: Figures shown above do not include stock-based compensation expense (or equivalents), per Company management. Note: Present values as of 12/31/17;mid-year convention applied. 1. Per Company management, Billings is expected to approximate revenue in the long-term. 2. Tax rate assumed to be 0.0%. 3. Implied from corresponding discount rate and 2023E Billings multiple. Calculations assume normalized change in net working capital of $2.0 million, per Company management; shown for informational purposes. E refers to Estimated. EBITDA refers to Earnings Before Interest, Taxes, Depreciation & Amortization, and is shown above on a “cash only” basis (does not reflect deferred revenue or deferred costs). FYE refers to Fiscal Year End. PV refers to Present Value. Source: Company management.
Page 1. Executive Summary 3 2. Financial Analyses 9 3. Appendices (Informational) 17 Weighted Average Cost of Capital 18 Observed Data 22 Illustrative Selected Transactions 25 Certain Observations 27 4. Disclaimer 35
Page 1. Executive Summary 3 2. Financial Analyses 9 3. Appendices (Informational) 17 Weighted Average Cost of Capital 18 Observed Data 22 Illustrative Selected Transactions 25 Certain Observations 27 4. Disclaimer 35
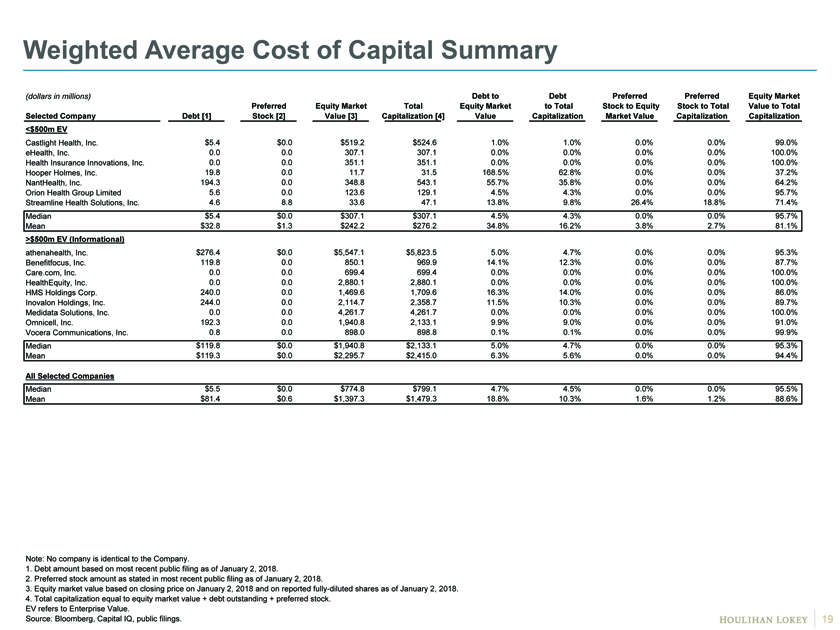
Weighted Average Cost of Capital Summary (dollars in millions) Debt to Debt Preferred Preferred Equity Market Preferred Equity Market Total Equity Market to Total Stock to Equity Stock to Total Value to Total Selected Company Debt [1] Stock [2] Value [3] Capitalization [4] Value Capitalization Market Value Capitalization Capitalization <$500m EV Castlight Health, Inc. $5.4 # $0.0 # $519.2 # $524.6 # 1.0% # 1.0% # 0.0% # 0.0% # 99.0% # eHealth, Inc. 0.0 # 0.0 # 307.1 # 307.1 # 0.0% # 0.0% # 0.0% # 0.0% # 100.0% # Health Insurance Innovations, Inc. 0.0 # 0.0 # 351.1 # 351.1 # 0.0% # 0.0% # 0.0% # 0.0% # 100.0% # Hooper Holmes, Inc. 19.8 # 0.0 # 11.7 # 31.5 # 168.5% # 62.8% # 0.0% # 0.0% # 37.2% # NantHealth, Inc. 194.3 # 0.0 # 348.8 # 543.1 # 55.7% # 35.8% # 0.0% # 0.0% # 64.2% # Orion Health Group Limited 5.6 # 0.0 # 123.6 # 129.1 # 4.5% # 4.3% # 0.0% # 0.0% # 95.7% # Streamline Health Solutions, Inc. 4.6 # 8.8 # 33.6 # 47.1 # 13.8% # 9.8% # 26.4% # 18.8% # 71.4% # Median $5.4 $0.0 $307.1 $307.1 4.5% 4.3% 0.0% 0.0% 95.7% Mean $32.8 $1.3 $242.2 $276.2 34.8% 16.2% 3.8% 2.7% 81.1% >$500m EV (Informational) athenahealth, Inc. $276.4 # $0.0 # $5,547.1 # $5,823.5 # 5.0% # 4.7% # 0.0% # 0.0% # 95.3% # Benefitfocus, Inc. 119.8 # 0.0 # 850.1 # 969.9 # 14.1% # 12.3% # 0.0% # 0.0% # 87.7% # Care.com, Inc. 0.0 # 0.0 # 699.4 # 699.4 # 0.0% # 0.0% # 0.0% # 0.0% # 100.0% # HealthEquity, Inc. 0.0 # 0.0 # 2,880.1 # 2,880.1 # 0.0% # 0.0% # 0.0% # 0.0% # 100.0% # HMS Holdings Corp. 240.0 # 0.0 # 1,469.6 # 1,709.6 # 16.3% # 14.0% # 0.0% # 0.0% # 86.0% # Inovalon Holdings, Inc. 244.0 # 0.0 # 2,114.7 # 2,358.7 # 11.5% # 10.3% # 0.0% # 0.0% # 89.7% # Medidata Solutions, Inc. 0.0 # 0.0 # 4,261.7 # 4,261.7 # 0.0% # 0.0% # 0.0% # 0.0% # 100.0% # Omnicell, Inc. 192.3 # 0.0 # 1,940.8 # 2,133.1 # 9.9% # 9.0% # 0.0% # 0.0% # 91.0% # Vocera Communications, Inc. 0.8 # 0.0 # 898.0 # 898.8 # 0.1% # 0.1% # 0.0% # 0.0% # 99.9% # Median $119.8 $0.0 $1,940.8 $2,133.1 5.0% 4.7% 0.0% 0.0% 95.3% Mean $119.3 $0.0 $2,295.7 $2,415.0 6.3% 5.6% 0.0% 0.0% 94.4% All Selected Companies Median $5.5 $0.0 $774.8 $799.1 4.7% 4.5% 0.0% 0.0% 95.5% Mean $81.4 $0.6 $1,397.3 $1,479.3 18.8% 10.3% 1.6% 1.2% 88.6% Note: No company is identical to the Company. 1. Debt amount based on most recent public filing as of January 2, 2018. 2. Preferred stock amount as stated in most recent public filing as of January 2, 2018. 3. Equity market value based on closing price on January 2, 2018 and on reported fully-diluted shares as of January 2, 2018. 4. Total capitalization equal to equity market value + debt outstanding + preferred stock. EV refers to Enterprise Value. Source: Bloomberg, Capital IQ, public filings.
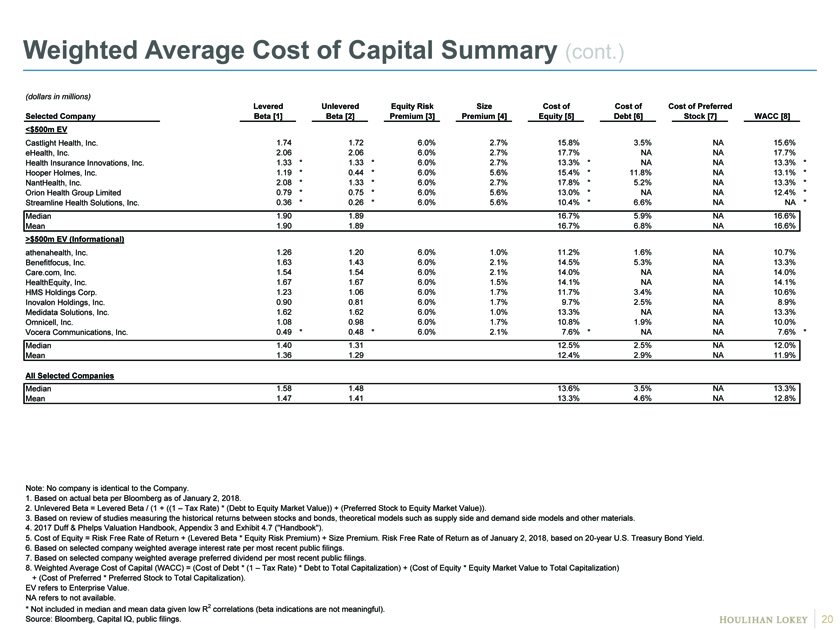
Weighted Average Cost of Capital Summary (cont.) (dollars in millions) Levered Unlevered Equity Risk Size Cost of Cost of Cost of Preferred Selected Company Beta [1] Beta [2] Premium [3] Premium [4] Equity [5] Debt [6] Stock [7] WACC [8] <$500m EV Castlight Health, Inc. 1.74 # 1.72 # 6.0% 2.7% 15.8% # 3.5% # NA 15.6% 0 eHealth, Inc. 2.06 # 2.06 # 6.0% 2.7% 17.7% # NA NA 17.7% 0 Health Insurance Innovations, Inc. 1.33 * 1.33 * 6.0% 2.7% 13.3% * NA NA 13.3% * Hooper Holmes, Inc. 1.19 * 0.44 * 6.0% 5.6% 15.4% * 11.8% # NA 13.1% * NantHealth, Inc. 2.08 * 1.33 * 6.0% 2.7% 17.8% * 5.2% # NA 13.3% * Orion Health Group Limited 0.79 * 0.75 * 6.0% 5.6% 13.0% * NA NA 12.4% * Streamline Health Solutions, Inc. 0.36 * 0.26 * 6.0% 5.6% 10.4% * 6.6% # NA NA * Median 1.90 1.89 16.7% 5.9% NA 16.6% Mean 1.90 1.89 16.7% 6.8% NA 16.6% >$500m EV (Informational) athenahealth, Inc. 1.26 # 1.20 # 6.0% 1.0% 11.2% # 1.6% # NA 10.7% 0 Benefitfocus, Inc. 1.63 # 1.43 # 6.0% 2.1% 14.5% # 5.3% # NA 13.3% 0 Care.com, Inc. 1.54 # 1.54 # 6.0% 2.1% 14.0% # NA * NA 14.0% 0 HealthEquity, Inc. 1.67 # 1.67 # 6.0% 1.5% 14.1% # NA * NA 14.1% 0 HMS Holdings Corp. 1.23 # 1.06 # 6.0% 1.7% 11.7% # 3.4% # NA 10.6% 0 Inovalon Holdings, Inc. 0.90 # 0.81 # 6.0% 1.7% 9.7% # 2.5% # NA 8.9% 0 Medidata Solutions, Inc. 1.62 # 1.62 # 6.0% 1.0% 13.3% # NA * NA 13.3% 0 Omnicell, Inc. 1.08 # 0.98 # 6.0% 1.7% 10.8% # 1.9% # NA 10.0% 0 Vocera Communications, Inc. 0.49 * 0.48 * 6.0% 2.1% 7.6% * NA * NA 7.6% * Median 1.40 1.31 12.5% 2.5% NA 12.0% Mean 1.36 1.29 12.4% 2.9% NA 11.9% All Selected Companies Median 1.58 1.48 13.6% 3.5% NA 13.3% Mean 1.47 1.41 13.3% 4.6% NA 12.8% Note: No company is identical to the Company. 1. Based on actual beta per Bloomberg as of January 2, 2018. 2. Unlevered Beta = Levered Beta / (1 + ((1 – Tax Rate) * (Debt to Equity Market Value)) + (Preferred Stock to Equity Market Value)). 3. Based on review of studies measuring the historical returns between stocks and bonds, theoretical models such as supply side and demand side models and other materials. 4. 2017 Duff & Phelps Valuation Handbook, Appendix 3 and Exhibit 4.7 (“Handbook”). 5. Cost of Equity = Risk Free Rate of Return + (Levered Beta * Equity Risk Premium) + Size Premium. Risk Free Rate of Return as of January 2, 2018, based on20-year U.S. Treasury Bond Yield. 6. Based on selected company weighted average interest rate per most recent public filings. 7. Based on selected company weighted average preferred dividend per most recent public filings. 8. Weighted Average Cost of Capital (WACC) = (Cost of Debt * (1 – Tax Rate) * Debt to Total Capitalization) + (Cost of Equity * Equity Market Value to Total Capitalization) + (Cost of Preferred * Preferred Stock to Total Capitalization). EV refers to Enterprise Value. NA refers to not available. * Not included in median and mean data given low R2 correlations (beta indications are not meaningful). Source: Bloomberg, Capital IQ, public filings.
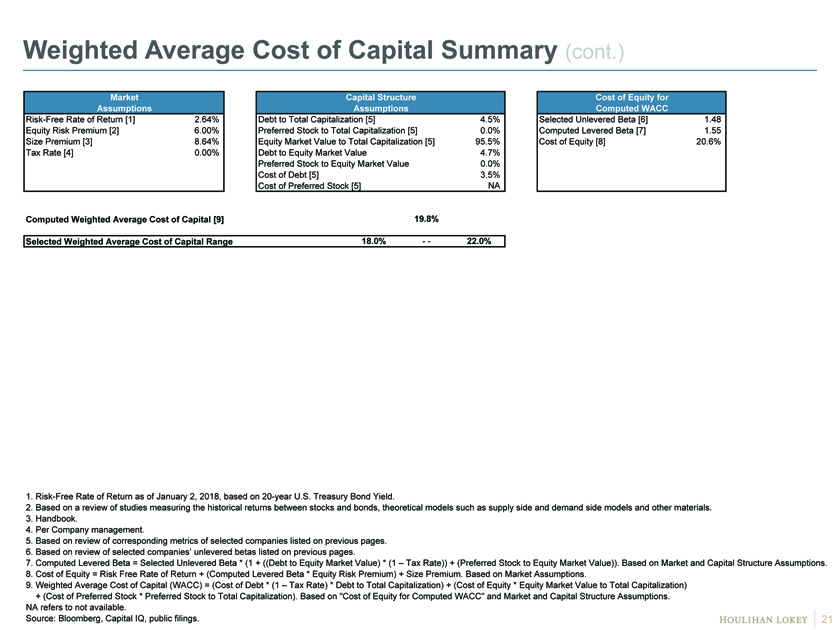
Weighted Average Cost of Capital Summary (cont.) Market Capital Structure Cost of Equity for Assumptions Assumptions Computed WACC Risk-Free Rate of Return [1] 2.64% Debt to Total Capitalization [5] 4.5% Selected Unlevered Beta [6] 1.48 Equity Risk Premium [2] 6.00% Preferred Stock to Total Capitalization [5] 0.0% Computed Levered Beta [7] 1.55 Size Premium [3] 8.64% Equity Market Value to Total Capitalization [5] 95.5% Cost of Equity [8] 20.6% Tax Rate [4] 0.00% Debt to Equity Market Value 4.7% Preferred Stock to Equity Market Value 0.0% Cost of Debt [5] 3.5% Cost of Preferred Stock [5] NA Company Specific Decile Beta 0.00 Computed Weighted Average Cost of Capital [9] 19.8% Selected Weighted Average Cost of Capital Range 18.0% — 22.0% 1. Risk-Free Rate of Return as of January 2, 2018, based on20-year U.S. Treasury Bond Yield. 2. Based on a review of studies measuring the historical returns between stocks and bonds, theoretical models such as supply side and demand side models and other materials. 3. Handbook. 4. Per Company management. 5. Based on review of corresponding metrics of selected companies listed on previous pages. 6. Based on review of selected companies’ unlevered betas listed on previous pages. 7. Computed Levered Beta = Selected Unlevered Beta * (1 + ((Debt to Equity Market Value) * (1 – Tax Rate)) + (Preferred Stock to Equity Market Value)). Based on Market and Capital Structure Assumptions. 8. Cost of Equity = Risk Free Rate of Return + (Computed Levered Beta * Equity Risk Premium) + Size Premium. Based on Market Assumptions. 9. Weighted Average Cost of Capital (WACC) = (Cost of Debt * (1 – Tax Rate) * Debt to Total Capitalization) + (Cost of Equity * Equity Market Value to Total Capitalization) + (Cost of Preferred Stock * Preferred Stock to Total Capitalization). Based on “Cost of Equity for Computed WACC” and Market and Capital Structure Assumptions. NA refers to not available. Source: Bloomberg, Capital IQ, public filings. 21
Page 1. Executive Summary 3 2. Financial Analyses 9 3. Appendices (Informational) 17 Weighted Average Cost of Capital 18 Observed Data 22 Illustrative Selected Transactions 25 Certain Observations 27 4. Disclaimer 35
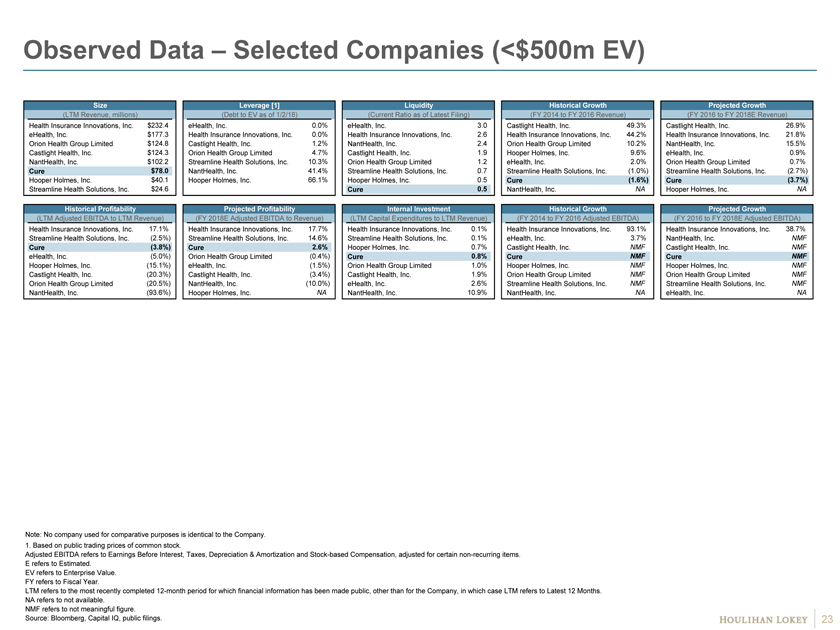
Observed Data – Selected Companies (<$500m EV) Size Leverage [1] Liquidity Historical Growth Projected Growth (LTM Revenue, millions) (Debt to EV as of 1/2/18) (Current Ratio as of Latest Filing) (FY 2014 to FY 2016 Revenue) (FY 2016 to FY 2018E Revenue) Health Insurance Innovations, Inc. $232.4 eHealth, Inc. 0.0% eHealth, Inc. 3.0 Castlight Health, Inc. 49.3% Castlight Health, Inc. 26.9% eHealth, Inc. $177.3 Health Insurance Innovations, Inc. 0.0% Health Insurance Innovations, Inc. 2.6 Health Insurance Innovations, Inc. 44.2% Health Insurance Innovations, Inc. 21.8% Orion Health Group Limited $124.8 Castlight Health, Inc. 1.2% NantHealth, Inc. 2.4 Orion Health Group Limited 10.2% NantHealth, Inc. 15.5% Castlight Health, Inc. $124.3 Orion Health Group Limited 4.7% Castlight Health, Inc. 1.9 Hooper Holmes, Inc. 9.6% eHealth, Inc. 0.9% NantHealth, Inc. $102.2 Streamline Health Solutions, Inc. 10.3% Orion Health Group Limited 1.2 eHealth, Inc. 2.0% Orion Health Group Limited 0.7% Cure $78.0 NantHealth, Inc. 41.4% Streamline Health Solutions, Inc. 0.7 Streamline Health Solutions, Inc. (1.0%) Streamline Health Solutions, Inc. (2.7%) Hooper Holmes, Inc. $40.1 Hooper Holmes, Inc. 66.1% Hooper Holmes, Inc. 0.5 Cure (1.6%) Cure (3.7%) Streamline Health Solutions, Inc. $24.6 ######## Cure 0.5 NantHealth, Inc. NA Hooper Holmes, Inc. NA Historical Profitability Projected Profitability Internal Investment Historical Growth Projected Growth (LTM Adjusted EBITDA to LTM Revenue) (FY 2018E Adjusted EBITDA to Revenue) (LTM Capital Expenditures to LTM Revenue) (FY 2014 to FY 2016 Adjusted EBITDA) (FY 2016 to FY 2018E Adjusted EBITDA) Health Insurance Innovations, Inc. 17.1% Health Insurance Innovations, Inc. 17.7% Health Insurance Innovations, Inc. 0.1% Health Insurance Innovations, Inc. 93.1% Health Insurance Innovations, Inc. 38.7% Streamline Health Solutions, Inc. (2.5%) Streamline Health Solutions, Inc. 14.6% Streamline Health Solutions, Inc. 0.1% eHealth, Inc. 3.7% NantHealth, Inc. NMF Cure (3.8%) Cure 2.6% Hooper Holmes, Inc. 0.7% Castlight Health, Inc. NMF Castlight Health, Inc. NMF eHealth, Inc. (5.0%) Orion Health Group Limited (0.4%) Cure 0.8% Cure NMF Cure NMF Hooper Holmes, Inc. (15.1%) eHealth, Inc. (1.5%) Orion Health Group Limited 1.0% Hooper Holmes, Inc. NMF Hooper Holmes, Inc. NMF Castlight Health, Inc. (20.3%) Castlight Health, Inc. (3.4%) Castlight Health, Inc. 1.9% Orion Health Group Limited NMF Orion Health Group Limited NMF Orion Health Group Limited (20.5%) NantHealth, Inc. (10.0%) eHealth, Inc. 2.6% Streamline Health Solutions, Inc. NMF Streamline Health Solutions, Inc. NMF NantHealth, Inc. (93.6%) Hooper Holmes, Inc. NA NantHealth, Inc. 10.9% NantHealth, Inc. NA eHealth, Inc. NA Note: No company used for comparative purposes is identical to the Company. 1. Based on public trading prices of common stock. Adjusted EBITDA refers to Earnings Before Interest, Taxes, Depreciation & Amortization and Stock-based Compensation, adjusted for certainnon-recurring items. E refers to Estimated. EV refers to Enterprise Value. FY refers to Fiscal Year. LTM refers to the most recently completed12-month period for which financial information has been made public, other than for the Company, in which case LTM refers to Latest 12 Months. NA refers to not available. NMF refers to not meaningful figure. Source: Bloomberg, Capital IQ, public filings.
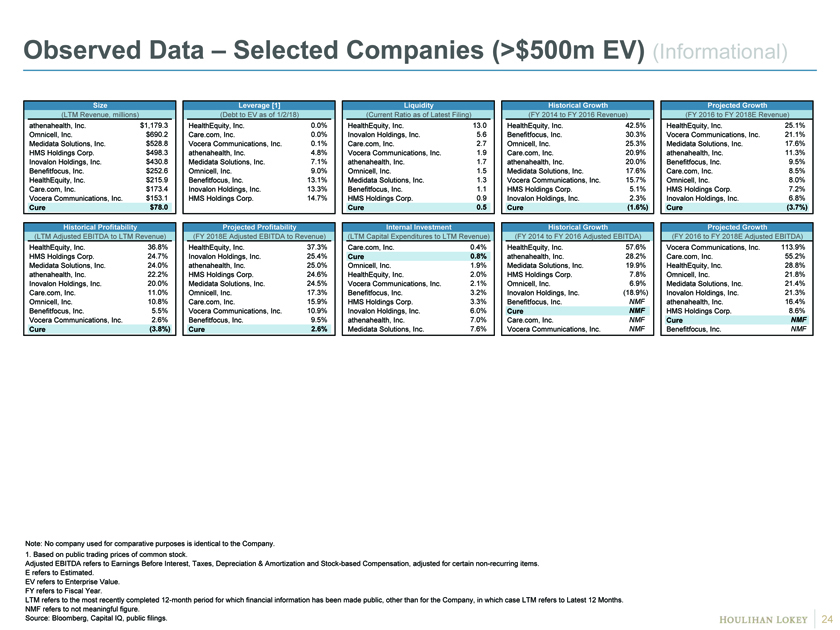
Observed Data – Selected Companies (>$500m EV) (Informational) Size Leverage [1] Liquidity Historical Growth Projected Growth (LTM Revenue, millions) (Debt to EV as of 1/2/18) (Current Ratio as of Latest Filing) (FY 2014 to FY 2016 Revenue) (FY 2016 to FY 2018E Revenue) athenahealth, Inc. $1,179.3 HealthEquity, Inc. 0.0% HealthEquity, Inc. 13.0 HealthEquity, Inc. 42.5% HealthEquity, Inc. 25.1% Omnicell, Inc. $690.2 Care.com, Inc. 0.0% Inovalon Holdings, Inc. 5.6 Benefitfocus, Inc. 30.3% Vocera Communications, Inc. 21.1% Medidata Solutions, Inc. $528.8 Vocera Communications, Inc. 0.1% Care.com, Inc. 2.7 Omnicell, Inc. 25.3% Medidata Solutions, Inc. 17.6% HMS Holdings Corp. $498.3 athenahealth, Inc. 4.8% Vocera Communications, Inc. 1.9 Care.com, Inc. 20.9% athenahealth, Inc. 11.3% Inovalon Holdings, Inc. $430.8 Medidata Solutions, Inc. 7.1% athenahealth, Inc. 1.7 athenahealth, Inc. 20.0% Benefitfocus, Inc. 9.5% Benefitfocus, Inc. $252.6 Omnicell, Inc. 9.0% Omnicell, Inc. 1.5 Medidata Solutions, Inc. 17.6% Care.com, Inc. 8.5% HealthEquity, Inc. $215.9 Benefitfocus, Inc. 13.1% Medidata Solutions, Inc. 1.3 Vocera Communications, Inc. 15.7% Omnicell, Inc. 8.0% Care.com, Inc. $173.4 Inovalon Holdings, Inc. 13.3% Benefitfocus, Inc. 1.1 HMS Holdings Corp. 5.1% HMS Holdings Corp. 7.2% Vocera Communications, Inc. $153.1 HMS Holdings Corp. 14.7% HMS Holdings Corp. 0.9 Inovalon Holdings, Inc. 2.3% Inovalon Holdings, Inc. 6.8% Cure $78.0 Cure 0.5 Cure (1.6%) Cure (3.7%) Historical Profitability Projected Profitability Internal Investment Historical Growth Projected Growth (LTM Adjusted EBITDA to LTM Revenue) (FY 2018E Adjusted EBITDA to Revenue) (LTM Capital Expenditures to LTM Revenue) (FY 2014 to FY 2016 Adjusted EBITDA) (FY 2016 to FY 2018E Adjusted EBITDA) HealthEquity, Inc. 36.8% HealthEquity, Inc. 37.3% Care.com, Inc. 0.4% HealthEquity, Inc. 57.6% Vocera Communications, Inc. 113.9% HMS Holdings Corp. 24.7% Inovalon Holdings, Inc. 25.4% Cure 0.8% athenahealth, Inc. 28.2% Care.com, Inc. 55.2% Medidata Solutions, Inc. 24.0% athenahealth, Inc. 25.0% Omnicell, Inc. 1.9% Medidata Solutions, Inc. 19.9% HealthEquity, Inc. 28.8% athenahealth, Inc. 22.2% HMS Holdings Corp. 24.6% HealthEquity, Inc. 2.0% HMS Holdings Corp. 7.8% Omnicell, Inc. 21.8% Inovalon Holdings, Inc. 20.0% Medidata Solutions, Inc. 24.5% Vocera Communications, Inc. 2.1% Omnicell, Inc. 6.9% Medidata Solutions, Inc. 21.4% Care.com, Inc. 11.0% Omnicell, Inc. 17.3% Benefitfocus, Inc. 3.2% Inovalon Holdings, Inc. (18.9%) Inovalon Holdings, Inc. 21.3% Omnicell, Inc. 10.8% Care.com, Inc. 15.9% HMS Holdings Corp. 3.3% Benefitfocus, Inc. NMF athenahealth, Inc. 16.4% Benefitfocus, Inc. 5.5% Vocera Communications, Inc. 10.9% Inovalon Holdings, Inc. 6.0% Cure NMF HMS Holdings Corp. 8.6% Vocera Communications, Inc. 2.6% Benefitfocus, Inc. 9.5% athenahealth, Inc. 7.0% Care.com, Inc. NMF Cure NMF Cure (3.8%) Cure 2.6% Medidata Solutions, Inc. 7.6% Vocera Communications, Inc. NMF Benefitfocus, Inc. NMF Note: No company used for comparative purposes is identical to the Company. 1. Based on public trading prices of common stock. Adjusted EBITDA refers to Earnings Before Interest, Taxes, Depreciation & Amortization and Stock-based Compensation, adjusted for certainnon-recurring items. E refers to Estimated. EV refers to Enterprise Value. FY refers to Fiscal Year. LTM refers to the most recently completed12-month period for which financial information has been made public, other than for the Company, in which case LTM refers to Latest 12 Months. NMF refers to not meaningful figure. Source: Bloomberg, Capital IQ, public filings.
Page 1. Executive Summary 3 2. Financial Analyses 9 3. Appendices (Informational) 17 Weighted Average Cost of Capital 18 Observed Data 22 Illustrative Selected Transactions 25 Certain Observations 27 4. Disclaimer 35
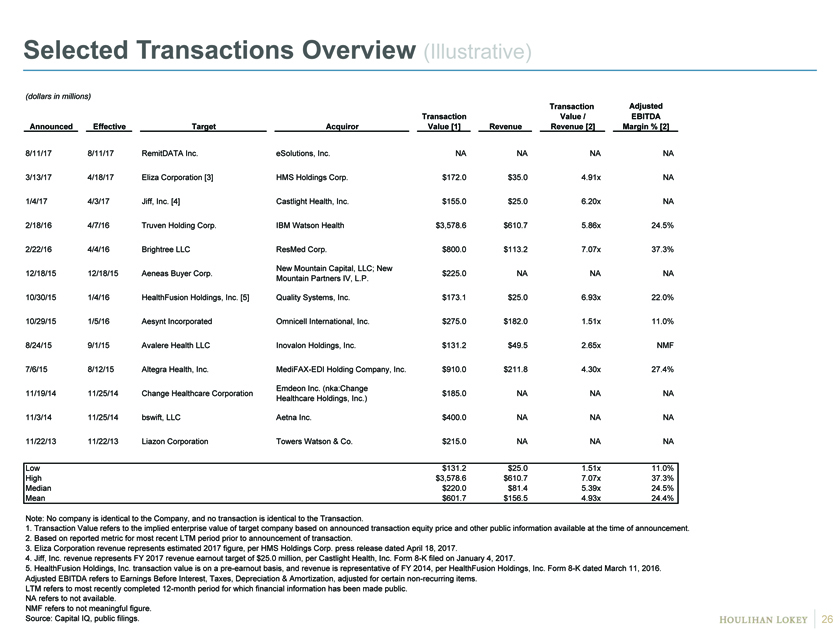
Selected Transactions Overview (Illustrative) (dollars in millions) Transaction Adjusted Transaction Value / EBITDA Announced Effective Target Acquiror Value [1] Revenue Revenue [2] Margin % [2] 8/11/17 8/11/17 RemitDATA Inc. eSolutions, Inc. NA N NA N NA A NA NA 3/13/17 4/18/17 Eliza Corporation [3] HMS Holdings Corp. $172.0 # $35.0 # 4.91x # NA NA 1/4/17 4/3/17 Jiff, Inc. [4] Castlight Health, Inc. $155.0 # $25.0 # 6.20x # NA NA 2/18/16 4/7/16 Truven Holding Corp. IBM Watson Health $3,578.6 # $610.7 # 5.86x # 24.5% 0. 2/22/16 4/4/16 Brightree LLC ResMed Corp. $800.0 # $113.2 # 7.07x # 37.3% 0. New Mountain Capital, LLC; New 12/18/15 12/18/15 Aeneas Buyer Corp. $225.0 # NA N NA A NA NA Mountain Partners IV, L.P. 10/30/15 1/4/16 HealthFusion Holdings, Inc. [5] Quality Systems, Inc. $173.1 # $25.0 # 6.93x # 22.0% 0. 10/29/15 1/5/16 Aesynt Incorporated Omnicell International, Inc. $275.0 # $182.0 # 1.51x # 11.0% 0. 8/24/15 9/1/15 Avalere Health LLC Inovalon Holdings, Inc. $131.2 # $49.5 # 2.65x # NMF NMF 7/6/15 8/12/15 Altegra Health, Inc.MediFAX-EDI Holding Company, Inc. $910.0 # $211.8 # 4.30x # 27.4% 0. Emdeon Inc. (nka:Change 11/19/14 11/25/14 Change Healthcare Corporation $185.0 # NA N NA A NA NA Healthcare Holdings, Inc.) 11/3/14 11/25/14 bswift, LLC Aetna Inc. $400.0 # NA N NA A NA NA 11/22/13 11/22/13 Liazon Corporation Towers Watson & Co. $215.0 # NA N NA A NA NA Low $131.2 $25.0 1.51x 11.0% High $3,578.6 $610.7 7.07x 37.3% Median $220.0 $81.4 5.39x 24.5% Mean $601.7 $156.5 4.93x 24.4% Note: No company is identical to the Company, and no transaction is identical to the Transaction. 1. Transaction Value refers to the implied enterprise value of target company based on announced transaction equity price and other public information available at the time of announcement. 2. Based on reported metric for most recent LTM period prior to announcement of transaction. 3. Eliza Corporation revenue represents estimated 2017 figure, per HMS Holdings Corp. press release dated April 18, 2017. 4. Jiff, Inc. revenue represents FY 2017 revenue earnout target of $25.0 million, per Castlight Health, Inc. Form8-K filed on January 4, 2017. 5. HealthFusion Holdings, Inc. transaction value is on apre-earnout basis, and revenue is representative of FY 2014, per HealthFusion Holdings, Inc. Form8-K dated March 11, 2016. Adjusted EBITDA refers to Earnings Before Interest, Taxes, Depreciation & Amortization, adjusted for certainnon-recurring items. LTM refers to most recently completed12-month period for which financial information has been made public. NA refers to not available. NMF refers to not meaningful figure. Source: Capital IQ, public filings.
Page 1. Executive Summary 3 2. Financial Analyses 9 3. Appendices (Informational) 17 Weighted Average Cost of Capital 18 Observed Data 22 Illustrative Selected Transactions 25 Certain Observations 27 4. Disclaimer 35
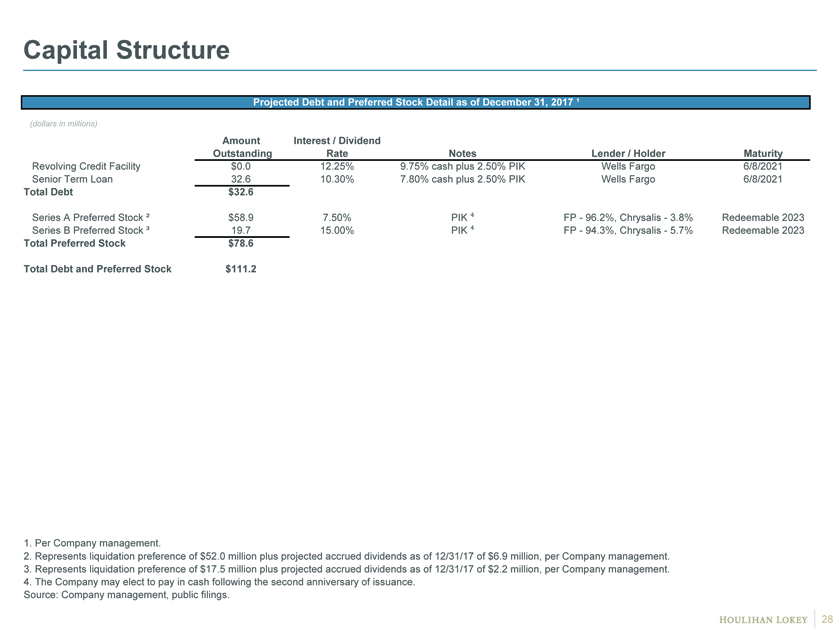
Capital Structure Projected Debt and Preferred Stock Detail as of December 31, 2017 ¹ (dollars in millions) Amount Interest / Dividend Outstanding Rate Notes Lender / Holder Maturity Revolving Credit Facility $0.0 12.25% 9.75% cash plus 2.50% PIK Wells Fargo 6/8/2021 Senior Term Loan 32.6 10.30% 7.80% cash plus 2.50% PIK Wells Fargo 6/8/2021 Total Debt $32.6 Series A Preferred Stock ² $58.9 7.50% PIK â´ FP—96.2%, Chrysalis—3.8% Redeemable 2023 Series B Preferred Stock ³ 19.7 15.00% PIK â´ FP—94.3%, Chrysalis—5.7% Redeemable 2023 Total Preferred Stock $78.6 Total Debt and Preferred Stock $111.2 1. Per Company management. 2. Represents liquidation preference of $52.0 million plus projected accrued dividends as of 12/31/17 of $6.9 million, per Company management. 3. Represents liquidation preference of $17.5 million plus projected accrued dividends as of 12/31/17 of $2.2 million, per Company management. 4. The Company may elect to pay in cash following the second anniversary of issuance. Source: Company management, public filings.
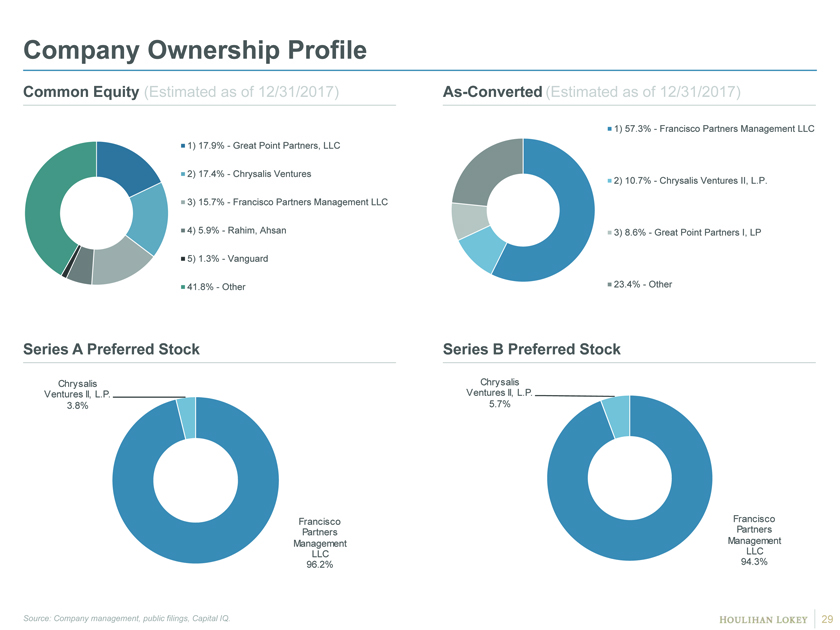
Company Ownership Profile Common Equity (Estimated as of 12/31/2017)As-Converted (Estimated as of 12/31/2017) 1) 57.3%—Francisco Partners Management LLC 1) 17.9%—Great Point Partners, LLC 2) 17.4%—Chrysalis Ventures 2) 10.7%—Chrysalis Ventures II, L.P. 3) 15.7%—Francisco Partners Management LLC 4) 5.9%—Rahim, Ahsan 3) 8.6%—Great Point Partners I, LP 5) 1.3%—Vanguard 41.8%—Other 23.4%—Other Series A Preferred Stock Series B Preferred Stock Chrysalis Chrysalis Ventures II, L.P. Ventures II, L.P. 3.8% 5.7% Francisco Francisco Partners Partners Management Management LLC LLC 96.2% 94.3% Source: Company management, public filings, Capital IQ.
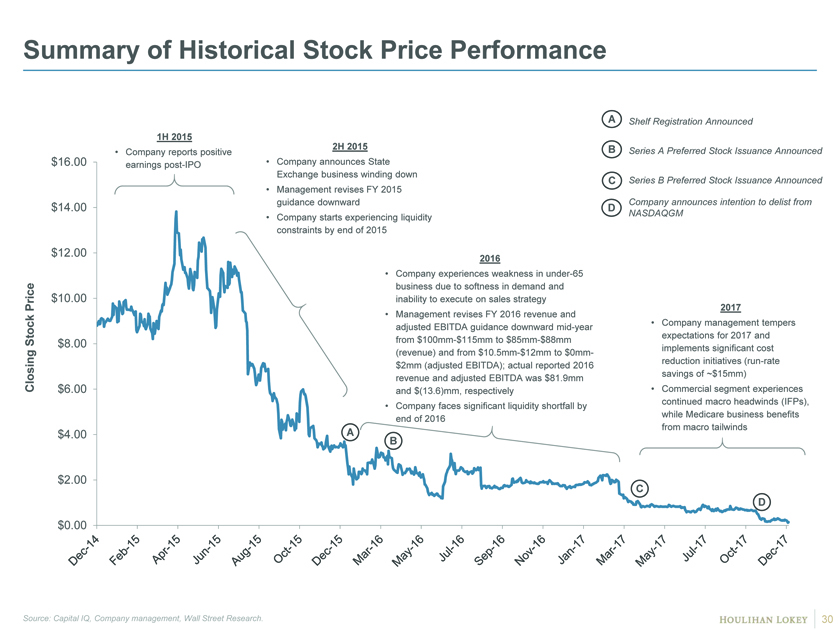
Summary of Historical Stock Price Performance A Shelf Registration Announced 1H 2015 2H 2015 B • Company reports positive Series A Preferred Stock Issuance Announced $16.00 earningspost-IPO • Company announces State Exchange business winding down C Series B Preferred Stock Issuance Announced • Management revises FY 2015 $14.00 guidance downward Company announces intention to delist from D • Company starts experiencing liquidity NASDAQGM constraints by end of 2015 $12.00 2016 • Company experiences weakness inunder-65 business due to softness in demand and Price $10.00 inability to execute on sales strategy 2017 • Management revises FY 2016 revenue and • Company management tempers adjusted EBITDA guidance downwardmid-year expectations for 2017 and Stock $8.00 from $100mm-$115mm to $85mm-$88mm (revenue) and from$10.5mm-$12mm to$0mm- implements significant cost reduction initiatives(run-rate $2mm (adjusted EBITDA); actual reported 2016 savings of ~$15mm) revenue and adjusted EBITDA was $81.9mm Closing $6.00 and $(13.6)mm, respectively • Commercial segment experiences continued macro headwinds (IFPs), • Company faces significant liquidity shortfall by while Medicare business benefits end of 2016 from macro tailwinds $4.00 A B $2.00 C D $0.00 Source: Capital IQ, Company management, Wall Street Research.
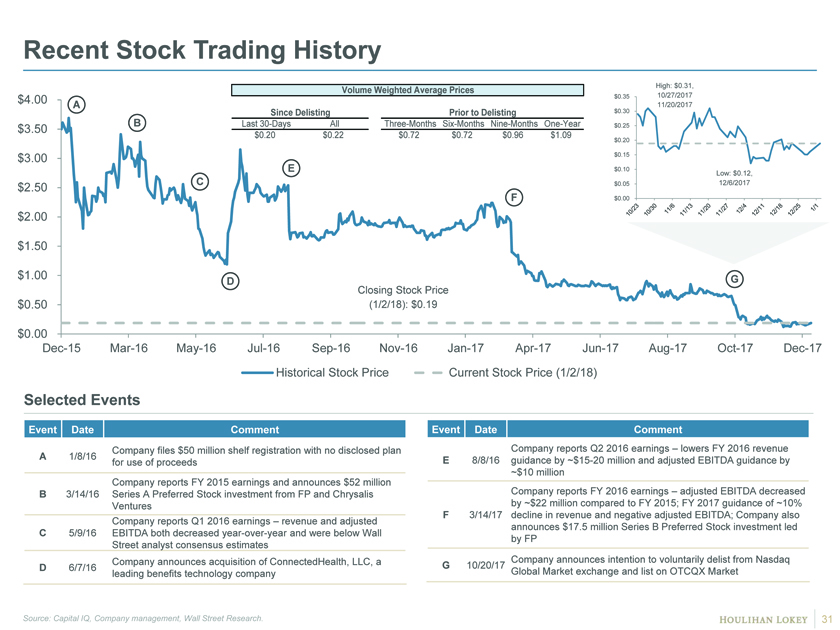
Recent Stock Trading History Volume Weighted Average Prices High: $0.31, $4.00 $0.35 10/27/2017 A Since Delisting Prior to Delisting $0.30 11/20/2017 B Last30-Days All Three-MonthsSix-Months Nine-MonthsOne-Year $0.25 $3.50 $0.20 $0.22 $0.72 $0.72 $0.96 $1.09 $0.20 $3.00 $0.15 E $0.10 Low: $0.12, $2.50 C $0.05 12/6/2017 F $0.00 $2.00 $1.50 $1.00 G D Closing Stock Price $0.50 (1/2/18): $0.19 $0.00Dec-15Mar-16May-16Jul-16Sep-16Nov-16Jan-17Apr-17Jun-17Aug-17Oct-17Dec-17 Historical Stock Price Current Stock Price (1/2/18) Selected Events Event Date Comment Event Date Comment Company files $50 million shelf registration with no disclosed plan Company reports Q2 2016 earnings – lowers FY 2016 revenue A 1/8/16 E 8/8/16 guidance by~$15-20 million and adjusted EBITDA guidance by for use of proceeds ~$10 million Company reports FY 2015 earnings and announces $52 million Company reports FY 2016 earnings – adjusted EBITDA decreased B 3/14/16 Series A Preferred Stock investment from FP and Chrysalis by ~$22 million compared to FY 2015; FY 2017 guidance of ~10% Ventures F 3/14/17 decline in revenue and negative adjusted EBITDA; Company also Company reports Q1 2016 earnings – revenue and adjusted announces $17.5 million Series B Preferred Stock investment led C 5/9/16 EBITDA both decreased year-over-year and were below Wall by FP Street analyst consensus estimates Company announces acquisition of ConnectedHealth, LLC, a Company announces intention to voluntarily delist from Nasdaq D 6/7/16 G 10/20/17 leading benefits technology company Global Market exchange and list on OTCQX Market Source: Capital IQ, Company management, Wall Street Research.
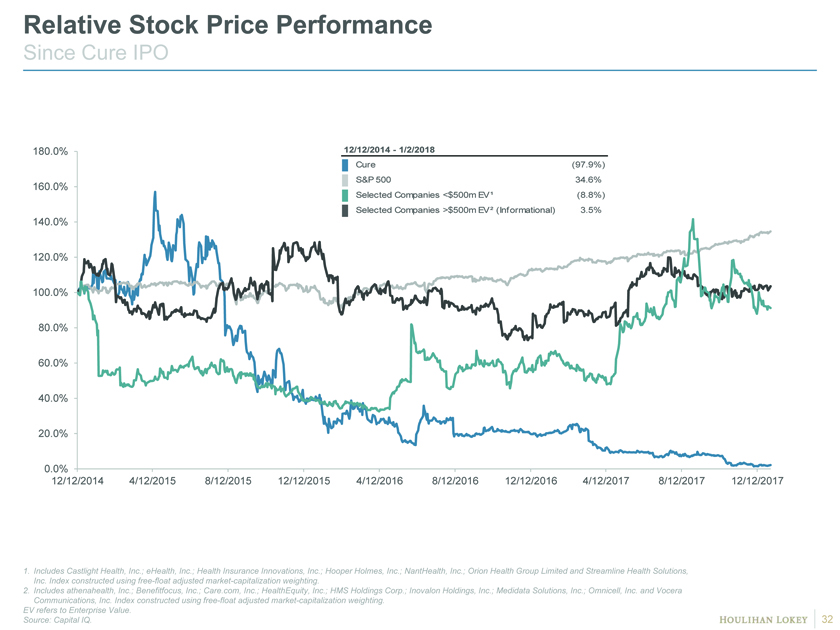
Relative Stock Price Performance Since Cure IPO 180.0% 12/12/2014—1/2/2018 Cure (97.9%) S&P 500 34.6% 160.0% Selected Companies <$500m EV¹ (8.8%) Selected Companies >$500m EV² (Informational) 3.5% 140.0% 120.0% 100.0% 80.0% 60.0% 40.0% 20.0% 0.0% 12/12/2014 4/12/2015 8/12/2015 12/12/2015 4/12/2016 8/12/2016 12/12/2016 4/12/2017 8/12/2017 12/12/2017 1. Includes Castlight Health, Inc.; eHealth, Inc.; Health Insurance Innovations, Inc.; Hooper Holmes, Inc.; NantHealth, Inc.; Orion Health Group Limited and Streamline Health Solutions, Inc. Index constructed using free-float adjusted market-capitalization weighting. 2. Includes athenahealth, Inc.; Benefitfocus, Inc.; Care.com, Inc.; HealthEquity, Inc.; HMS Holdings Corp.; Inovalon Holdings, Inc.; Medidata Solutions, Inc.; Omnicell, Inc. and Vocera Communications, Inc. Index constructed using free-float adjusted market-capitalization weighting. EV refers to Enterprise Value. Source: Capital IQ.
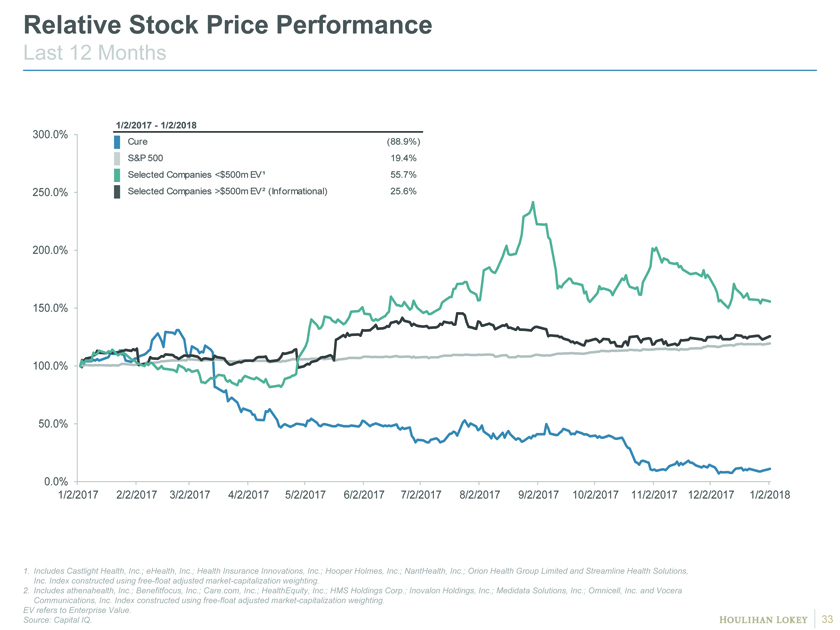
Relative Stock Price Performance Last 12 Months 300.0% 1/2/2017—1/2/2018 Cure (88.9%) S&P 500 19.4% Selected Companies <$500m EV¹ 55.7% 250.0% Selected Companies >$500m EV² (Informational) 25.6% 200.0% 150.0% 100.0% 50.0% 0.0% 1/2/2017 2/2/2017 3/2/2017 4/2/2017 5/2/2017 6/2/2017 7/2/2017 8/2/2017 9/2/2017 10/2/2017 11/2/2017 12/2/2017 1/2/2018 1. Includes Castlight Health, Inc.; eHealth, Inc.; Health Insurance Innovations, Inc.; Hooper Holmes, Inc.; NantHealth, Inc.; Orion Health Group Limited and Streamline Health Solutions, Inc. Index constructed using free-float adjusted market-capitalization weighting. 2. Includes athenahealth, Inc.; Benefitfocus, Inc.; Care.com, Inc.; HealthEquity, Inc.; HMS Holdings Corp.; Inovalon Holdings, Inc.; Medidata Solutions, Inc.; Omnicell, Inc. and Vocera Communications, Inc. Index constructed using free-float adjusted market-capitalization weighting. EV refers to Enterprise Value. Source: Capital IQ.
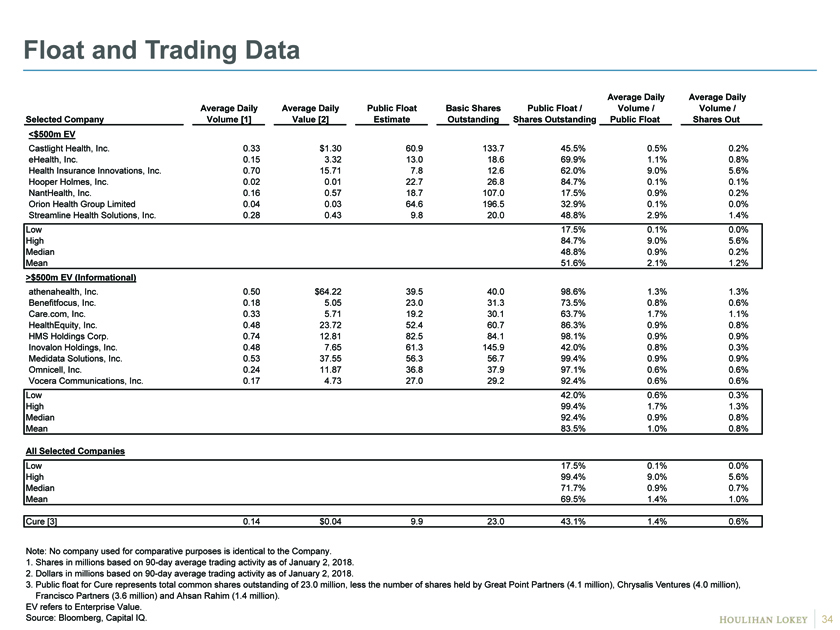
Float and Trading Data verage Daily Average Daily Average Daily Average Daily Public Float Basic Shares Public Float / Volume / Volume / Selected Company Volume [1] Value [2] Estimate Outstanding Shares Outstanding Public Float Shares Out <$500m EV Castlight Health, Inc. 0.33 $1.30 60.9 133.7 45.5% 0 0.5% 0 0.2% 0 eHealth, Inc. 0.15 3.32 13.0 18.6 69.9% 1 1.1% 0 0.8% 0 Health Insurance Innovations, Inc. 0.70 15.71 7.8 12.6 62.0% 1 9.0% 0 5.6% 0 Hooper Holmes, Inc. 0.02 0.01 22.7 26.8 84.7% 1 0.1% 0 0.1% 0 NantHealth, Inc. 0.16 0.57 18.7 107.0 17.5% 0 0.9% 0 0.2% 0 Orion Health Group Limited 0.04 0.03 64.6 196.5 32.9% 0 0.1% 0 0.0% 0 Streamline Health Solutions, Inc. 0.28 0.43 9.8 20.0 48.8% 0 2.9% 0 1.4% 0 Low 17.5% 0.1% 0.0% High 84.7% 9.0% 5.6% Median 48.8% 0.9% 0.2% Mean 51.6% 2.1% 1.2% >$500m EV (Informational) athenahealth, Inc. 0.50 $64.22 39.5 40.0 98.6% # 1.3% 0 1.3% # Benefitfocus, Inc. 0.18 5.05 23.0 31.3 73.5% # 0.8% 0 0.6% # Care.com, Inc. 0.33 5.71 19.2 30.1 63.7% # 1.7% 0 1.1% # HealthEquity, Inc. 0.48 23.72 52.4 60.7 86.3% # 0.9% 0 0.8% # HMS Holdings Corp. 0.74 12.81 82.5 84.1 98.1% # 0.9% 0 0.9% # Inovalon Holdings, Inc. 0.48 7.65 61.3 145.9 42.0% # 0.8% 0 0.3% # Medidata Solutions, Inc. 0.53 37.55 56.3 56.7 99.4% # 0.9% 0 0.9% # Omnicell, Inc. 0.24 11.87 36.8 37.9 97.1% # 0.6% 0 0.6% # Vocera Communications, Inc. 0.17 4.73 27.0 29.2 92.4% # 0.6% 0 0.6% # Low 42.0% 0.6% 0.3% High 99.4% 1.7% 1.3% Median 92.4% 0.9% 0.8% Mean 83.5% 1.0% 0.8% All Selected Companies Low 17.5% 0.1% 0.0% High 99.4% 9.0% 5.6% Median 71.7% 0.9% 0.7% Mean 69.5% 1.4% 1.0% Cure [3] 0.14 $0.04 9.9 23.0 43.1% 1.4% 0.6% Note: No company used for comparative purposes is identical to the Company. 1. Shares in millions based on90-day average trading activity as of January 2, 2018. 2. Dollars in millions based on90-day average trading activity as of January 2, 2018. 3. Public float for Cure represents total common shares outstanding of 23.0 million, less the number of shares held by Great Point Partners (4.1 million), Chrysalis Ventures (4.0 million), Francisco Partners (3.6 million) and Ahsan Rahim (1.4 million). EV refers to Enterprise Value. Source: Bloomberg, Capital IQ.
Page 1. Executive Summary 3 2. Financial Analyses 9 3. Appendices (Informational) 17 4. Disclaimer 35
Disclaimer This presentation, and any supplemental information (written or oral) or other documents provided in connection therewith (collectively, the “materials”), are provided solely for the information of the Special Committee (the “Committee”) of the Board of Directors (the “Board”) of Cure (the “Company” or “Cure”) by Houlihan Lokey in connection with the Committee’s consideration of a potential transaction (the “Transaction”) involving the Company. This presentation is incomplete without reference to, and should be considered in conjunction with, any supplemental information provided by and discussions with Houlihan Lokey in connection therewith. Any defined terms used herein shall have the meanings set forth herein, even if such defined terms have been given different meanings elsewhere in the materials. The materials are for discussion purposes only. Houlihan Lokey expressly disclaims any and all liability which may be based on the materials and any errors therein or omissions therefrom. The materials were prepared for specific persons familiar with the business and affairs of the Company for use in a specific context and were not prepared with a view to public disclosure or to conform with any disclosure standards under any state, federal or international securities laws or other laws, rules or regulations, and none of the Committee, the Company or Houlihan Lokey takes any responsibility for the use of the materials by persons other than the Committee. The materials are provided on a confidential basis solely for the information of the Committee and may not be disclosed, summarized, reproduced, disseminated or quoted or otherwise referred to, in whole or in part, without Houlihan Lokey’s express prior written consent. Notwithstanding any other provision herein, the Company (and each employee, representative or other agent of the Company) may disclose to any and all persons without limitation of any kind, the tax treatment and tax structure of any transaction and all materials of any kind (including opinions or other tax analyses, if any) that are provided to the Company relating to such tax treatment and structure. However, any information relating to the tax treatment and tax structure shall remain confidential (and the foregoing sentence shall not apply) to the extent necessary to enable any person to comply with securities laws. For this purpose, the tax treatment of a transaction is the purported or claimed U.S. income or franchise tax treatment of the transaction and the tax structure of a transaction is any fact that may be relevant to understanding the purported or claimed U.S. income or franchise tax treatment of the transaction. If the Company plans to disclose information pursuant to the first sentence of this paragraph, the Company shall inform those to whom it discloses any such information that they may not rely upon such information for any purpose without Houlihan Lokey’s prior written consent. Houlihan Lokey is not an expert on, and nothing contained in the materials should be construed as advice with regard to, legal, accounting, regulatory, insurance, tax or other specialist matters. Houlihan Lokey’s role in reviewing any information was limited solely to performing such a review as it deemed necessary to support its own advice and analysis and was not on behalf of the Committee. The materials necessarily are based on financial, economic, market and other conditions as in effect on, and the information available to Houlihan Lokey as of, the date of the materials. Although subsequent developments may affect the contents of the materials, Houlihan Lokey has not undertaken, and is under no obligation, to update, revise or reaffirm the materials, except as may be expressly contemplated by Houlihan Lokey’s engagement letter. The materials are not intended to provide the sole basis for evaluation of the Transaction and do not purport to contain all information that may be required. The materials do not address the underlying business decision of the Company or any other party to proceed with or effect the Transaction, or the relative merits of the Transaction as compared to any alternative business strategies or transactions that might be available for the Company or any other party. The materials do not constitute any opinion, nor do the materials constitute a recommendation to the Board, the Committee, the Company, any security holder of the Company or any other party as to how to vote or act with respect to any matter relating to the Transaction or otherwise or whether to buy or sell any assets or securities of any company. Houlihan Lokey’s only opinion is the opinion, if any, that is actually delivered to the Committee. The materials may not reflect information known to other professionals in other business areas of Houlihan Lokey and its affiliates. The preparation of the materials was a complex process involving quantitative and qualitative judgments and determinations with respect to the financial, comparative and other analytic methods employed and the adaption and application of these methods to the unique facts and circumstances presented and, therefore, is not readily susceptible to partial analysis or summary description. Furthermore, Houlihan Lokey did not attribute any particular weight to any analysis or factor considered by it, but rather made qualitative judgments as to the significance and relevance of each analysis and factor. Each analytical technique has inherent strengths and weaknesses, and the nature of the available information may further affect the value of particular techniques. Accordingly, the analyses contained in the materials must be considered as a whole. Selecting portions of the analyses, analytic methods and factors without considering all analyses and factors could create a misleading or incomplete view. The materials reflect judgments and assumptions with regard to industry performance, general business, economic, regulatory, market and financial conditions and other matters, many of which are beyond the control of the participants in the Transaction. Any estimates of value contained in the materials are not necessarily indicative of actual value or predictive of future results or values, which may be significantly more or less favorable. Any analyses relating to the value of assets, businesses or securities do not purport to be appraisals or to reflect the prices at which any assets, businesses or securities may actually be sold. The materials do not constitute a valuation opinion or credit rating. In preparing the materials, Houlihan Lokey has not conducted any physical inspection or independent appraisal or evaluation of any of the assets, properties or liabilities (contingent or otherwise) of the Company or any other party and has no obligation to evaluate the solvency of the Company or any other party under any law.
Disclaimer (cont.) All budgets, projections, estimates, financial analyses, reports and other information with respect to operations (including estimates of potential cost savings and expenses) reflected in the materials have been prepared by management of the relevant party or are derived from such budgets, projections, estimates, financial analyses, reports and other information or from other sources, which involve numerous and significant subjective determinations made by management of the relevant party and/or which such management has reviewed and found reasonable. The budgets, projections and estimates (including, without limitation, estimates of potential cost savings and synergies) contained in the materials may or may not be achieved and differences between projected results and those actually achieved may be material. Houlihan Lokey has relied upon representations made by management of the Company and other participants in the Transaction that such budgets, projections and estimates have been reasonably prepared in good faith on bases reflecting the best currently available estimates and judgments of such management (or, with respect to information obtained from public sources, represent reasonable estimates), and Houlihan Lokey expresses no opinion with respect to such budgets, projections or estimates or the assumptions on which they are based. The scope of the financial analysis contained herein is based on discussions with the Company (including, without limitation, regarding the methodologies to be utilized), and Houlihan Lokey does not make any representation, express or implied, as to the sufficiency or adequacy of such financial analysis or the scope thereof for any particular purpose. Houlihan Lokey has assumed and relied upon the accuracy and completeness of the financial and other information provided to, discussed with or reviewed by it without (and without assuming responsibility for) independent verification of such information, makes no representation or warranty (express or implied) in respect of the accuracy or completeness of such information and has further relied upon the assurances of the Company and other participants in the Transaction that they are not aware of any facts or circumstances that would make such information inaccurate or misleading. In addition, Houlihan Lokey has relied upon and assumed, without independent verification, that there has been no change in the business, assets, liabilities, financial condition, results of operations, cash flows or prospects of the Company or any other participant in the Transaction since the respective dates of the most recent financial statements and other information, financial or otherwise, provided to, discussed with or reviewed by Houlihan Lokey that would be material to its analyses, and that the final forms of any draft documents reviewed by Houlihan Lokey will not differ in any material respect from such draft documents. The materials are not an offer to sell or a solicitation of an indication of interest to purchase any security, option, commodity, future, loan or currency. The materials do not constitute a commitment by Houlihan Lokey or any of its affiliates to underwrite, subscribe for or place any securities, to extend or arrange credit, or to provide any other services. In the ordinary course of business, certain of Houlihan Lokey’s affiliates and employees, as well as investment funds in which they may have financial interests or with which they mayco-invest, may acquire, hold or sell, long or short positions, or trade or otherwise effect transactions, in debt, equity, and other securities and financial instruments (including loans and other obligations) of, or investments in, the Company, any Transaction counterparty, any other Transaction participant, any other financially interested party with respect to any transaction, other entities or parties that are mentioned in the materials, or any of the foregoing entities’ or parties’ respective affiliates, subsidiaries, investment funds, portfolio companies and representatives (collectively, the “Interested Parties”), or any currency or commodity that may be involved in the Transaction. Houlihan Lokey provides mergers and acquisitions, restructuring and other advisory and consulting services to clients, which may have in the past included, or may currently or in the future include, one or more Interested Parties, for which services Houlihan Lokey has received, and may receive, compensation. Although Houlihan Lokey in the course of such activities and relationships or otherwise may have acquired, or may in the future acquire, information about one or more Interested Parties or the Transaction, or that otherwise may be of interest to the Company, Houlihan Lokey shall have no obligation to, and may not be contractually permitted to, disclose such information, or the fact that Houlihan Lokey is in possession of such information, to the Company or to use such information on the Company’s behalf. Houlihan Lokey’s personnel may make statements or provide advice that is contrary to information contained in the materials.