Exhibit 99.2
(NYSE: WAL) April 22, 2014 Western Alliance Bancorporation 1st Quarter Earnings Call
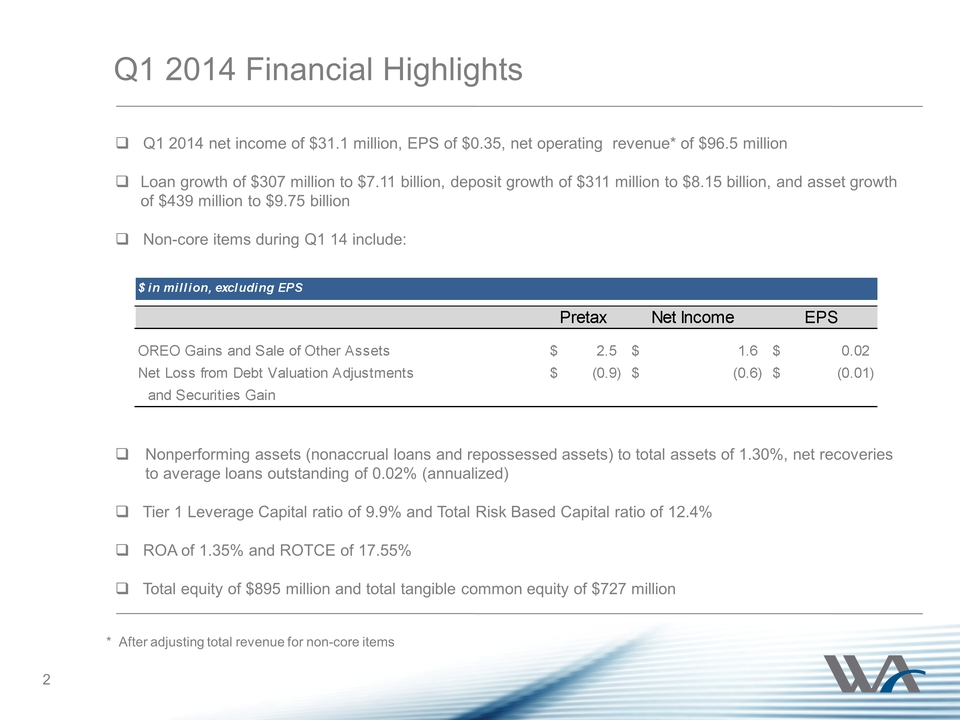
Q1 2014 Financial Highlights Q1 2014 net income of $31.1 million, EPS of $0.35, net operating revenue* of $96.5 million Loan growth of $307 million to $7.11 billion, deposit growth of $311 million to $8.15 billion, and asset growth of $439 million to $9.75 billion Non-core items during Q1 14 include: Nonperforming assets (nonaccrual loans and repossessed assets) to total assets of 1.30%, net recoveries to average loans outstanding of 0.02% (annualized) Tier 1 Leverage Capital ratio of 9.9% and Total Risk Based Capital ratio of 12.4% ROA of 1.35% and ROTCE of 17.55% Total equity of $895 million and total tangible common equity of $727 million 2 $ in million, excluding EPS Pretax Net Income EPS OREO Gains and Sale of Other Assets 2.5 $ 1.6 $ 0.02 $ Net Loss from Debt Valuation Adjustments (0.9) $ (0.6) $ (0.01) $ and Securities Gain * After adjusting total revenue for non-core items
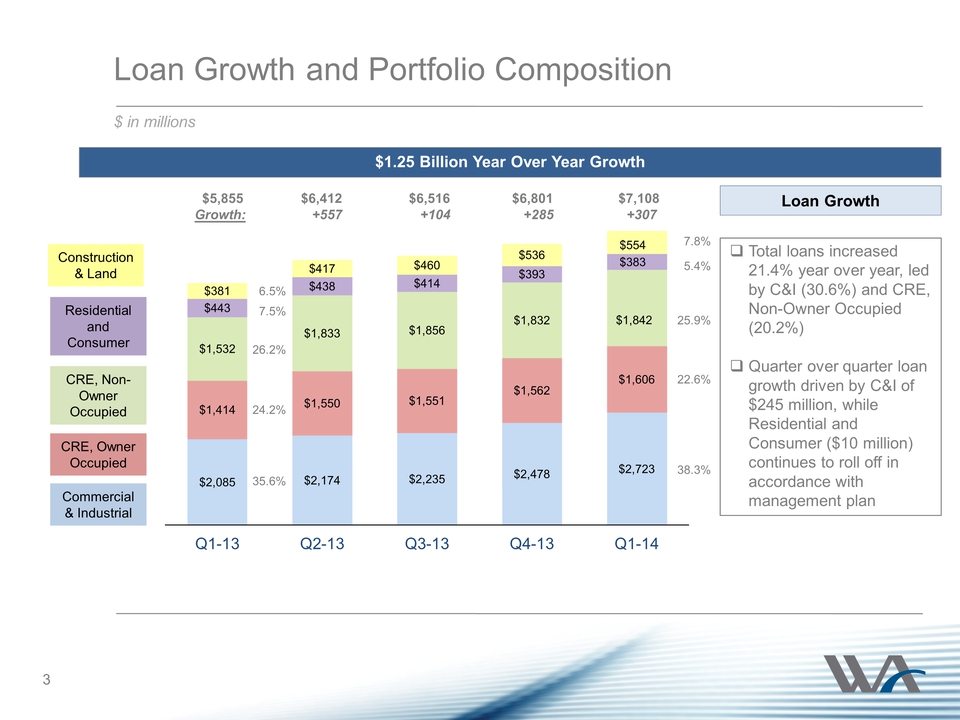
$2,085 $2,174 $2,235 $2,478 $2,723 $1,414 $1,550 $1,551 $1,562 $1,606 $1,532 $1,833 $1,856 $1,832 $1,842 $443 $438 $414 $393 $383 $381 $417 $460 $536 Q1-13 Q2-13 Q3-13 Q4-13 Q1-14 Loan Growth and Portfolio Composition $ in millions Commercial & Industrial CRE, Owner Occupied CRE, Non-Owner Occupied Construction & Land Residential and Consumer Loan Growth Total loans increased 21.4% year over year, led by C&I (30.6%) and CRE, Non-Owner Occupied (20.2%) Quarter over quarter loan growth driven by C&I of $245 million, while Residential and Consumer ($10 million) continues to roll off in accordance with management plan 7.8% 5.4% 25.9% 38.3% 22.6% 6.5% 7.5% 26.2% 35.6% 24.2% $1.25 Billion Year Over Year Growth 3 $554 $5,855 $6,412 $6,516 $6,801 $7,108 Growth: +557 +104 +285 +307
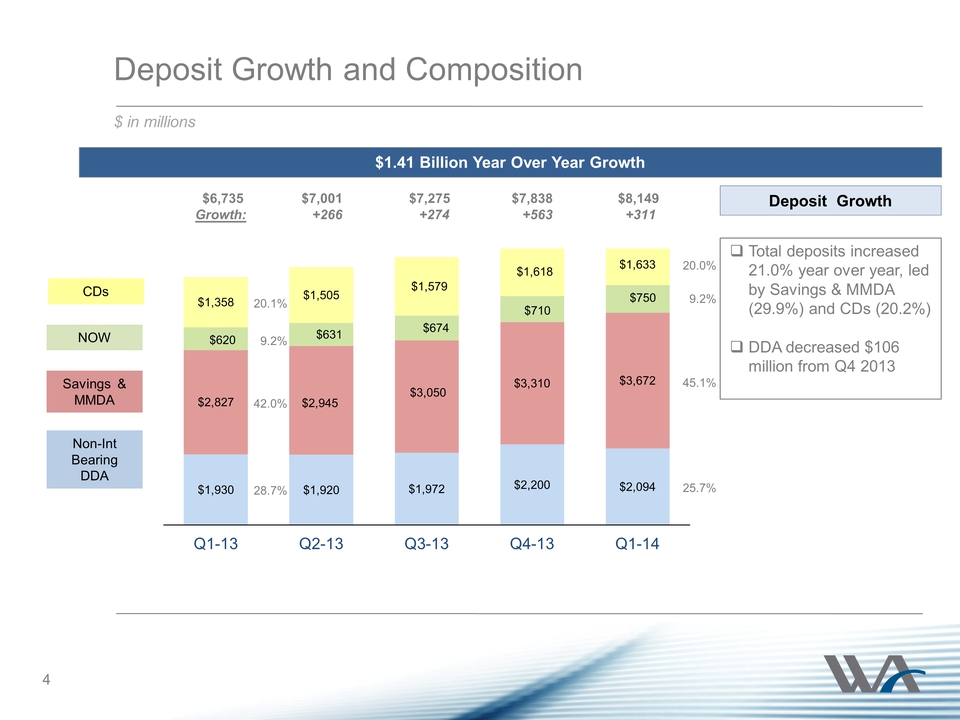
Deposit Growth and Composition $ in millions Savings & MMDA NOW CDs Non-Int Bearing DDA $1,930 $1,920 $1,972 $2,200 $2,094 $2,827 $2,945 $3,050 $3,310 $3,672 $620 $631 $674 $710 $750 $1,358 $1,505 $1,579 $1,618 $1,633 Q1-13 Q2-13 Q3-13 Q4-13 Q1-14 $6,735 $7,001 $7,275 $7,838 $8,149 Growth: +266 +274 +563 +311 Deposit Growth Total deposits increased 21.0% year over year, led by Savings & MMDA (29.9%) and CDs (20.2%) DDA decreased $106 million from Q4 2013 20.1% 9.2% 42.0% 28.7% 20.0% 9.2% 45.1% 25.7% $1.41 Billion Year Over Year Growth 4
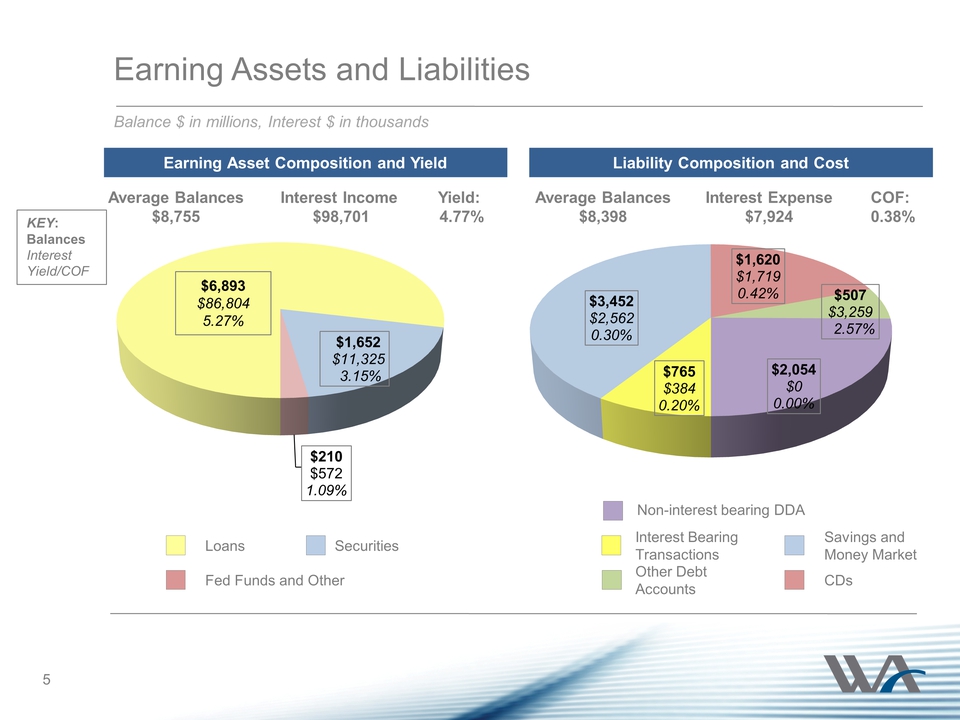
Earning Assets and Liabilities $1,652 $11,325 3.15% $210 $572 1.09% $6,893 $86,804 5.27% Balance $ in millions, Interest $ in thousands 5 Earning Asset Composition and Yield Liability Composition and Cost $765 $384 0.20% $3,452 $2,562 0.30% $1,620 $1,719 0.42% $507 $3,259 2.57% $2,054 $0 0.00% Loans Fed Funds and Other Securities Interest Bearing Transactions Other Debt Accounts Savings and Money Market CDs Average Balances $8,755 Yield: 4.77% Interest Income $98,701 Average Balances $8,398 COF: 0.38% Interest Expense $7,924 KEY: Balances Interest Yield/COF Non-interest bearing DDA
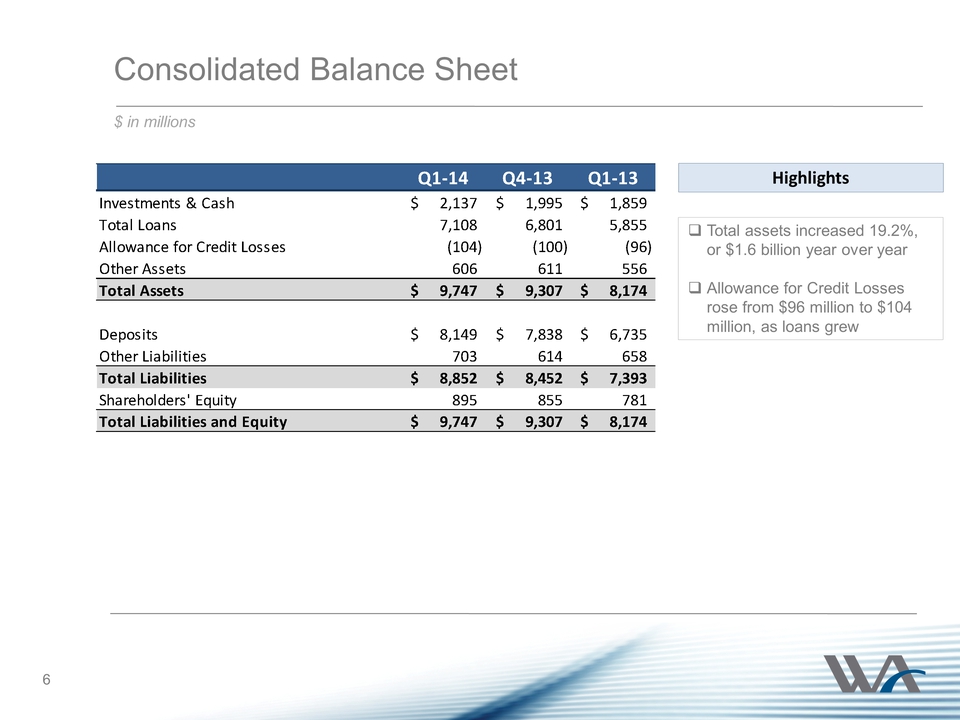
Consolidated Balance Sheet $ in millions Total assets increased 19.2%, or $1.6 billion year over year Allowance for Credit Losses rose from $96 million to $104 million, as loans grew Tangible Book Value/Share increased 18.2% to $8.32 6 Highlights Q1‐14 Q4‐13 Q1‐13 Investments & Cash 2,137 $ 1,995 $ 1,859 $ Total Loans 7,108 6,801 5,855 Allowance for Credit Losses (104) (100) (96) Other Assets 606 611 556 Total Assets 9,747 $ 9,307 $ 8,174 $ Deposits 8,149 $ 7,838 $ 6,735 $ Other Liabilities 703 614 658 Total Liabilities 8,852 $ 8,452 $ 7,393 $ Shareholders' Equity 895 855 781 Total Liabilities and Equity 9,747 $ 9,307 $ 8,174 $
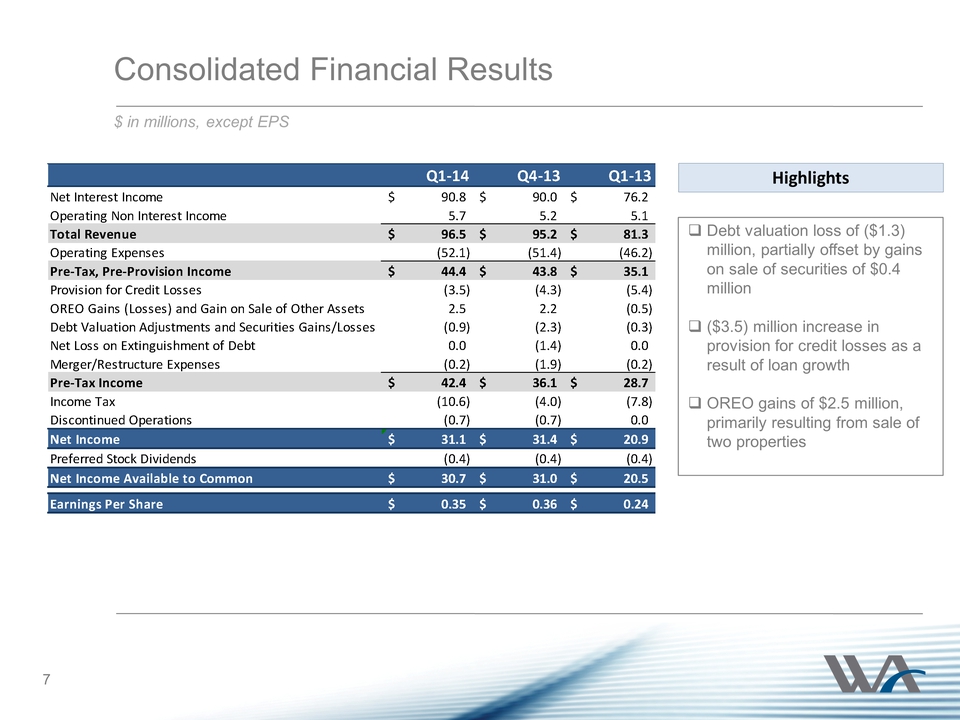
Consolidated Financial Results Highlights Debt valuation loss of ($1.3) million, partially offset by gains on sale of securities of $0.4 million ($3.5) million increase in provision for credit losses as a result of loan growth OREO gains of $2.5 million, primarily resulting from sale of two properties $ in millions, except EPS 7 Q1‐14 Q4‐13 Q1‐13 Net Interest Income 90.8 $ 90.0 $ 76.2 $ Operating Non Interest Income 5.7 5.2 5.1 Total Revenue 96.5 $ 95.2 $ 81.3 $ Operating Expenses (52.1) (51.4) (46.2) Pre‐Tax, Pre‐Provision Income 44.4 $ 43.8 $ 35.1 $ Provision for Credit Losses (3.5) (4.3) (5.4) OREO Gains (Losses) and Gain on Sale of Other Assets 2.5 2.2 (0.5) Debt Valuation Adjustments and Securities Gains/Losses (0.9) (2.3) (0.3) Net Loss on Extinguishment of Debt 0.0 (1.4) 0.0 Merger/Restructure Expenses (0.2) (1.9) (0.2) Pre‐Tax Income 42.4 $ 36.1 $ 28.7 $ Income Tax (10.6) (4.0) (7.8) Discontinued Operations (0.7) (0.7) 0.0 Net Income 31.1 $ 31.4 $ 20.9 $ Preferred Stock Dividends (0.4) (0.4) (0.4) Net Income Available to Common 30.7 $ 31.0 $ 20.5 $ Earnings Per Share 0.35 $ 0.36 $ 0.24 $
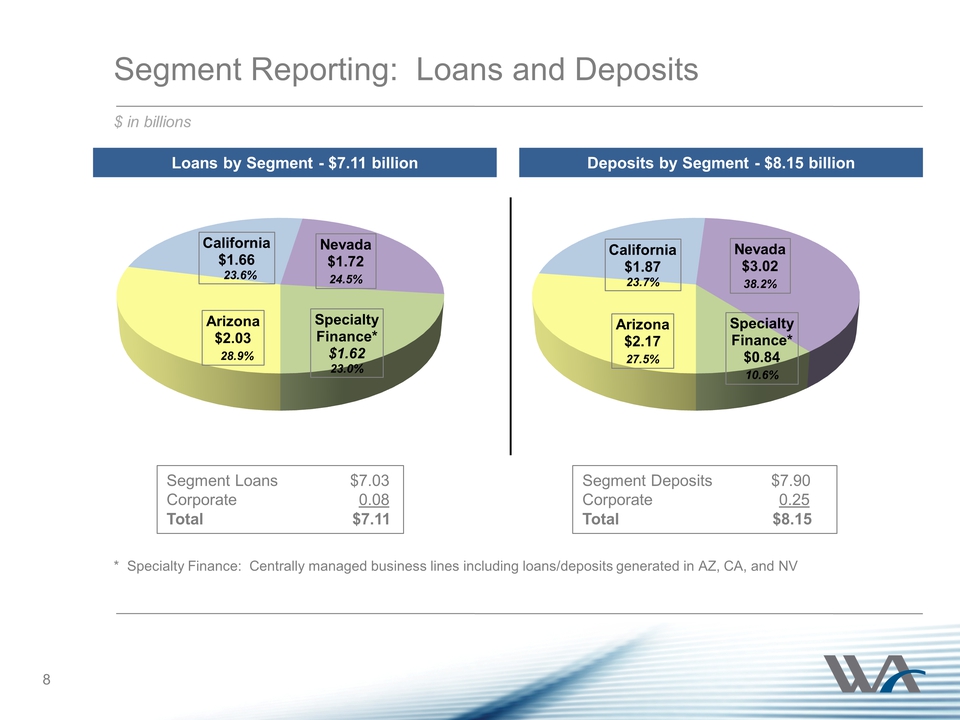
Arizona $2.17 27.5% California $1.87 23.7% Nevada $3.02 38.2% Specialty Finance* $0.84 10.6% Segment Reporting: Loans and Deposits Arizona $2.03 28.9% California $1.66 23.6% Nevada $1.72 24.5% Specialty Finance* $1.62 23.0% 8 Deposits by Segment - $8.15 billion Loans by Segment - $7.11 billion * Specialty Finance: Centrally managed business lines including loans/deposits generated in AZ, CA, and NV $ in billions Segment Loans $7.03 Corporate 0.08 Total $7.11 Segment Deposits $7.90 Corporate 0.25 Total $8.15
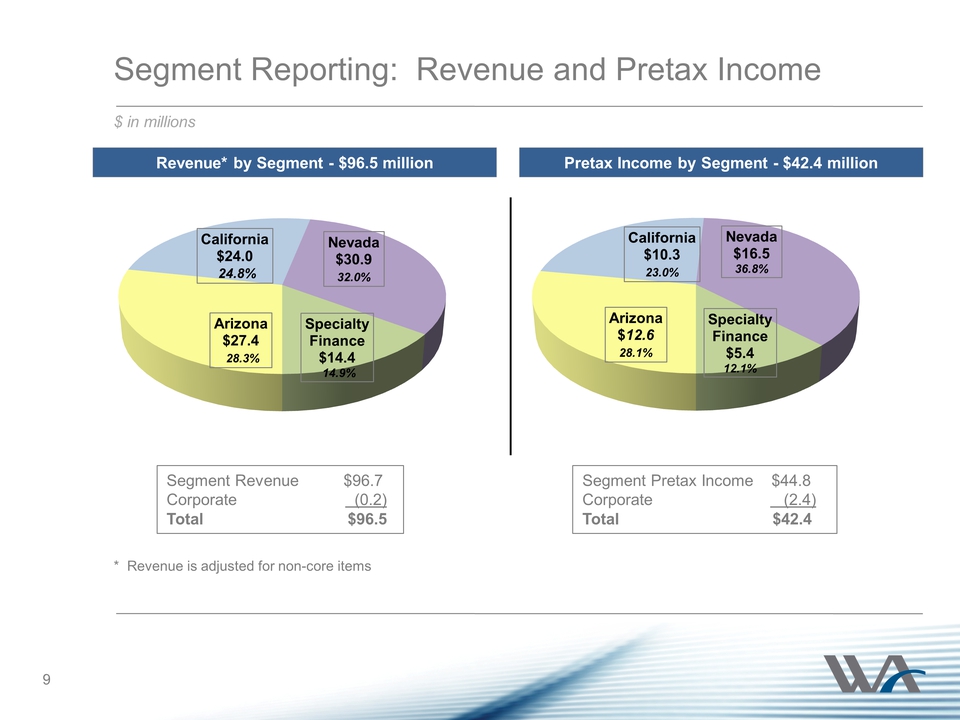
Arizona $12.5 27.9% California $10.3 23.0% Nevada $16.5 36.8% Specialty Finance $5.5 12.3% Segment Reporting: Revenue and Pretax Income Arizona $27.4 28.3% California $24.0 24.8% Nevada $30.9 32.0% Specialty Finance $14.4 14.9% Pretax Income by Segment - $42.4 million 9 Revenue* by Segment - $96.5 million $ in millions Segment Revenue $96.7 Corporate (0.2) Total $96.5 Segment Pretax Income $44.8 Corporate (2.4) Total $42.4 * Revenue is adjusted for non-core items
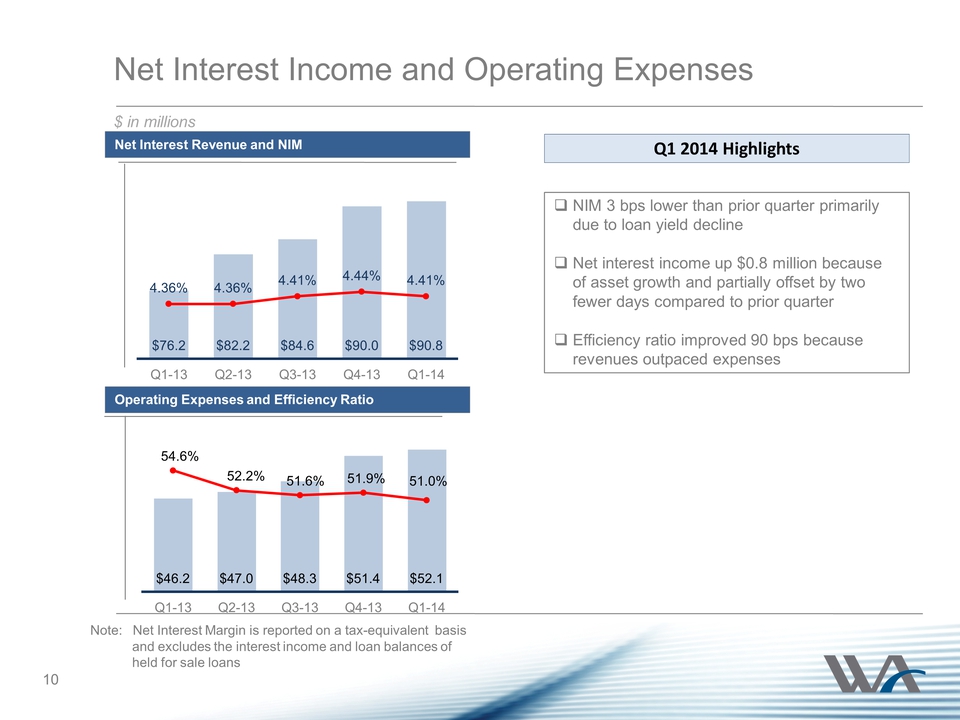
$76.2 $82.2 $84.6 $90.0 $90.8 4.36% 4.36% 4.41% 4.44% 4.41% Q1-13 Q2-13 Q3-13 Q4-13 Q1-14 Net Interest Income and Operating Expenses $ in millions Note: Net Interest Margin is reported on a tax-equivalent basis and excludes the interest income and loan balances of held for sale loans Q1 2014 Highlights NIM 3 bps lower than prior quarter primarily due to loan yield decline Net interest income up $0.8 million because of asset growth and partially offset by two fewer days compared to prior quarter Efficiency ratio improved 90 bps because revenues outpaced expenses Net Interest Revenue and NIM 10 $46.2 $47.0 $48.3 $51.4 $52.1 54.6% 52.2% 51.6% 51.9% 51.0% Q1-13 Q2-13 Q3-13 Q4-13 Q1-14 Operating Expenses and Efficiency Ratio
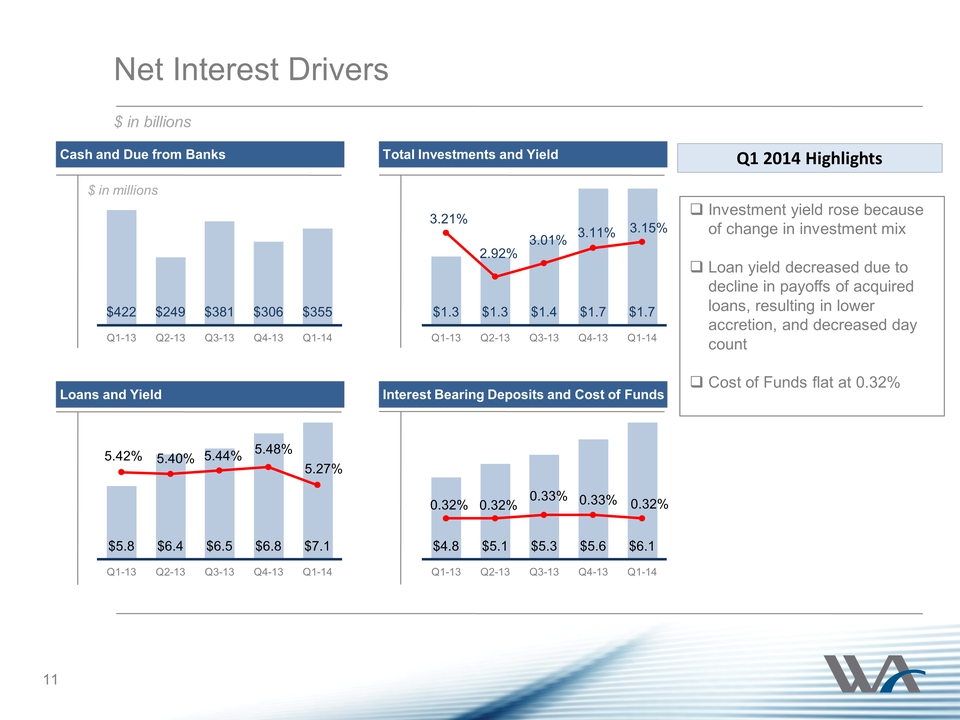
$5.8 $6.4 $6.5 $6.8 $7.1 5.42% 5.40% 5.44% 5.48% 5.27% Q1-13 Q2-13 Q3-13 Q4-13 Q1-14 $422 $249 $381 $306 $355 Q1-13 Q2-13 Q3-13 Q4-13 Q1-14 $1.3 $1.3 $1.4 $1.7 $1.7 3.21% 2.92% 3.01% 3.11% 3.15% Q1-13 Q2-13 Q3-13 Q4-13 Q1-14 $4.8 $5.1 $5.3 $5.6 $6.1 0.32% 0.32% 0.33% 0.33% 0.32% Q1-13 Q2-13 Q3-13 Q4-13 Q1-14 Net Interest Drivers $ in billions Cash and Due from Banks Loans and Yield Total Investments and Yield Interest Bearing Deposits and Cost of Funds $ in millions Q1 2014 Highlights 11 Investment yield rose because of change in investment mix Loan yield decreased due to decline in payoffs of acquired loans, resulting in lower accretion, and decreased day count Cost of Funds flat at 0.32%
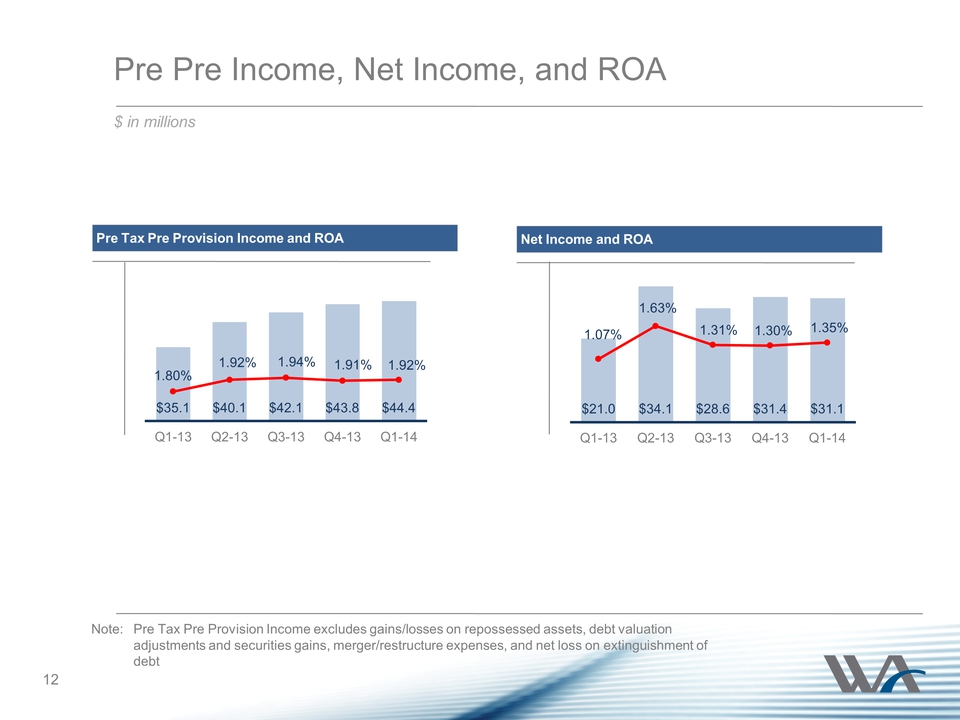
Pre Pre Income, Net Income, and ROA $ in millions $35.1 $40.1 $42.1 $43.8 $44.4 1.80% 1.92% 1.94% 1.91% 1.92% Q1-13 Q2-13 Q3-13 Q4-13 Q1-14 Note: Pre Tax Pre Provision Income excludes gains/losses on repossessed assets, debt valuation adjustments and securities gains, merger/restructure expenses, and net loss on extinguishment of debt Pre Tax Pre Provision Income and ROA $21.0 $34.1 $28.6 $31.4 $31.1 1.07% 1.63% 1.31% 1.30% 1.35% Q1-13 Q2-13 Q3-13 Q4-13 Q1-14 Net Income and ROA 12
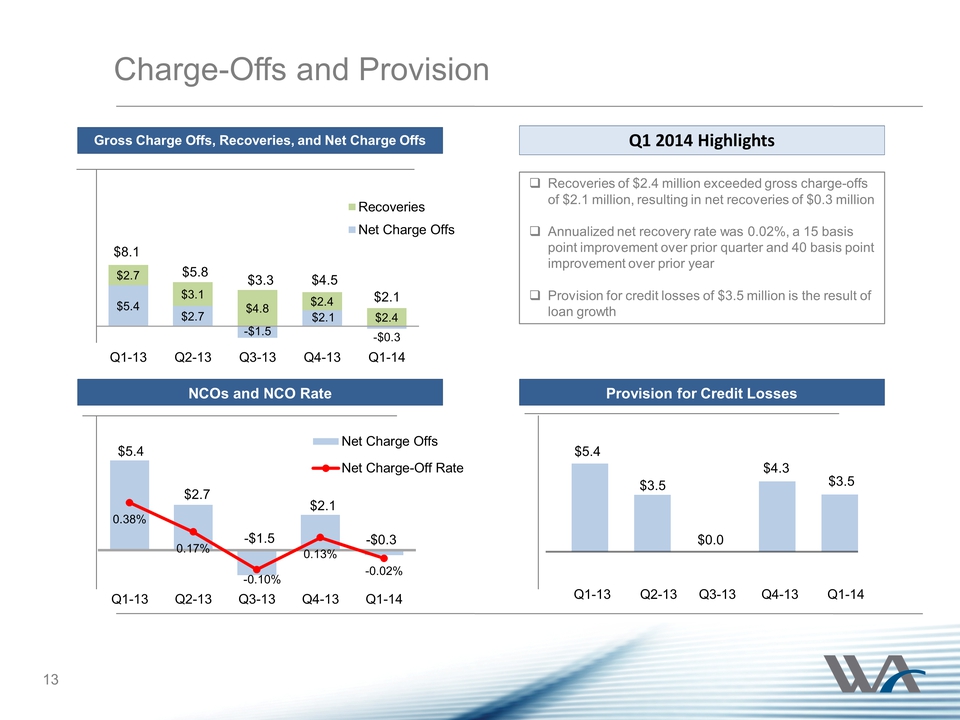
$5.4 $2.7 -$1.5 $2.1 -$0.3 $2.7 $3.1 $4.8 $2.4 $2.4 Q1-13 Q2-13 Q3-13 Q4-13 Q1-14 Recoveries Net Charge Offs $5.4 $2.7 -$1.5 $2.1 -$0.3 0.38% 0.17% -0.10% 0.13% -0.02% Q1-13 Q2-13 Q3-13 Q4-13 Q1-14 Net Charge Offs Net Charge-Off Rate Charge-Offs and Provision $5.4 $3.5 $0.0 $4.3 $3.5 Q1 2014 Highlights 13 $8.1 $5.8 $3.3 $4.5 Gross Charge Offs, Recoveries, and Net Charge Offs NCOs and NCO Rate Provision for Credit Losses $2.1 Recoveries of $2.4 million exceeded gross charge-offs of $2.1 million, resulting in net recoveries of $0.3 million Annualized net recovery rate was 0.02%, a 15 basis point improvement over prior quarter and 40 basis point improvement over prior year Provision for credit losses of $3.5 million is the result of loan growth
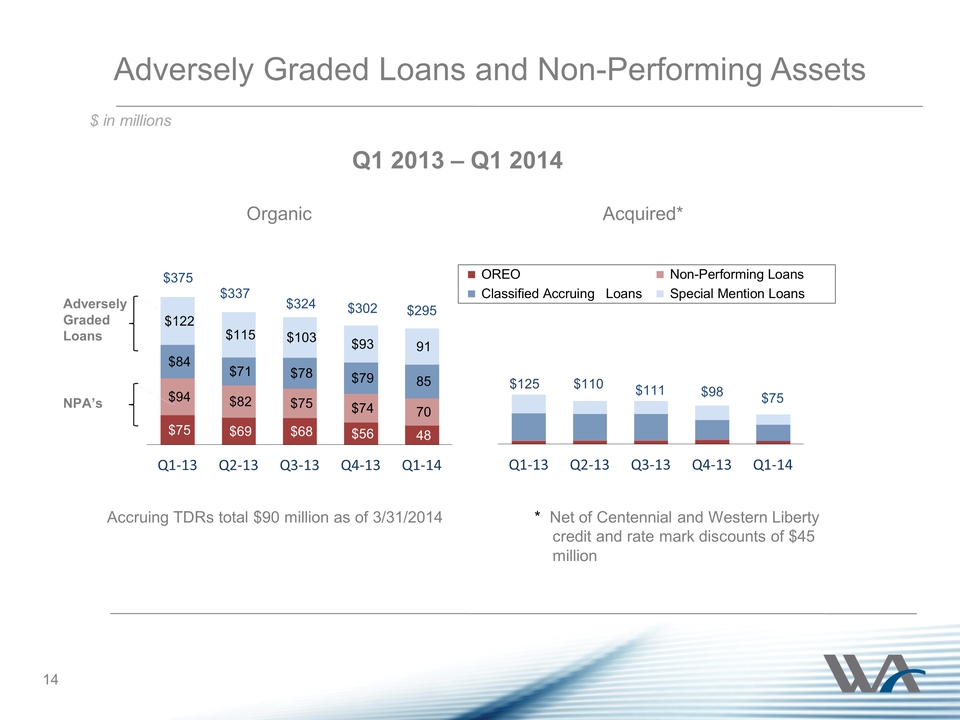
Q1-13 Q2-13 Q3-13 Q4-13 Q1-14 $75 $69 $68 $56 48 $94 $82 $75 $74 70 $84 $71 $78 $79 85 $122 $115 $103 $93 91 Q1‐13 Q2‐13 Q3‐13 Q4‐13 Q1‐14 Adversely Graded Loans and Non-Performing Assets $ in millions Q1‐13 Q2‐13 Q3‐13 Q4‐13 Q1‐14 OREO Non-Performing Loans Classified Accruing Loans Special Mention Loans $125 $110 $111 Organic Acquired* Q1 2013 – Q1 2014 NPA’s Adversely Graded Loans * Net of Centennial and Western Liberty credit and rate mark discounts of $45 million $302 $75 Accruing TDRs total $90 million as of 3/31/2014 $375 $337 $324 $98 $295 14
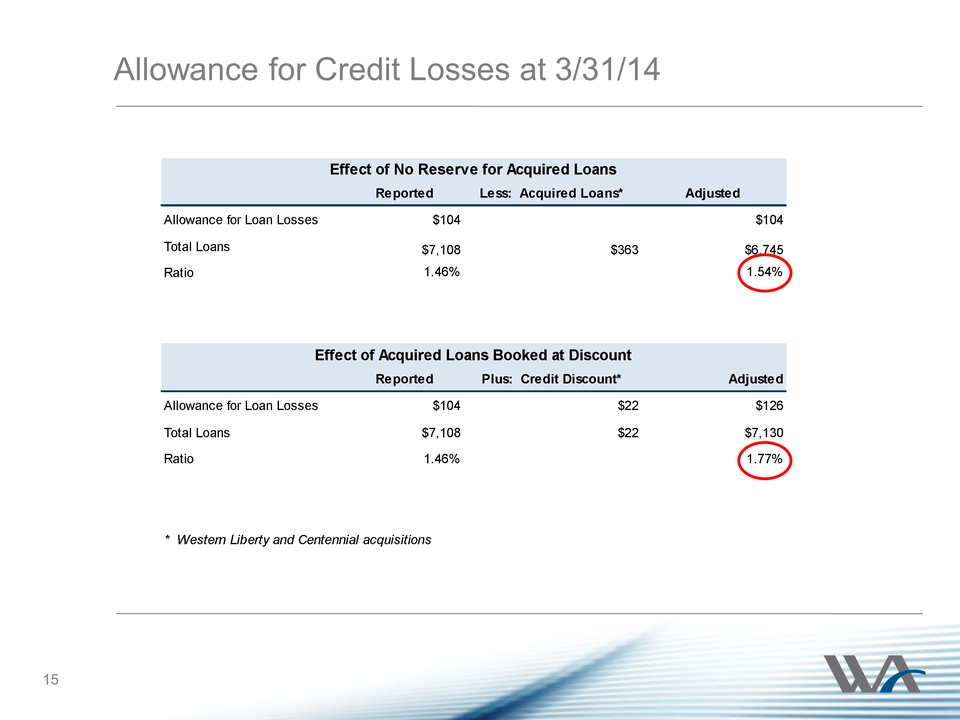
Reported Less: Acquired Loans* Adjusted Allowance for Loan Losses $104 $104 Total Loans $7,108 $363 $6,745 Ratio 1.46% 1.54% Reported Plus: Credit Discount* Adjusted Allowance for Loan Losses $104 $22 $126 Total Loans $7,108 $22 $7,130 Ratio 1.46% 1.77% * Western Liberty and Centennial acquisitions Effect of No Reserve for Acquired Loans Effect of Acquired Loans Booked at Discount Allowance for Credit Losses at 3/31/14 15
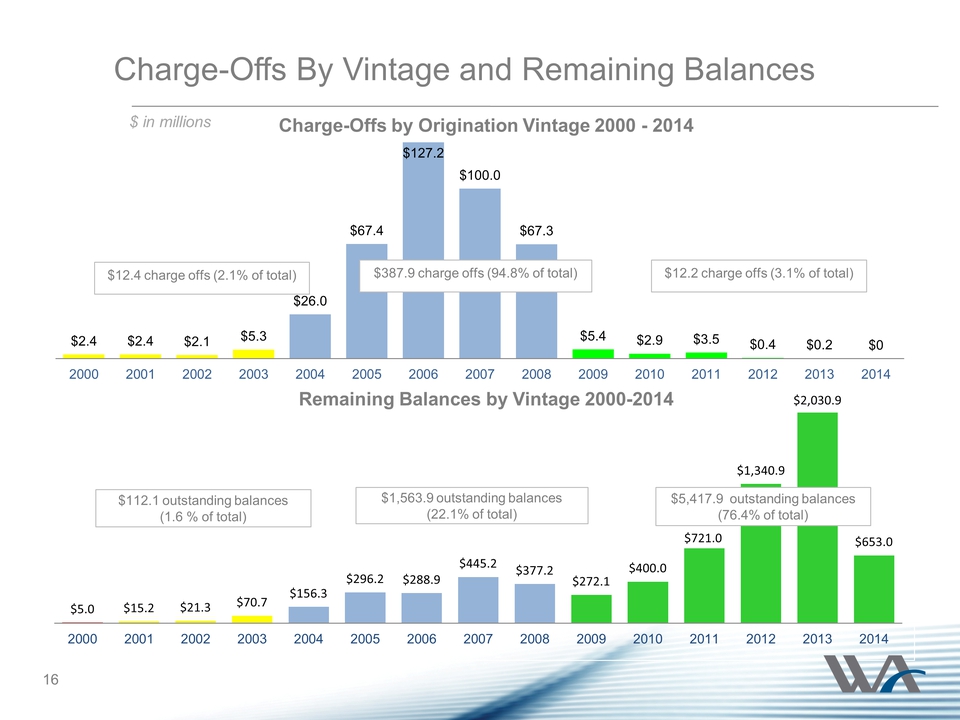
$5.0 $15.2 $21.3 $70.7 $156.3 $296.2 $288.9 $445.2 $377.2 $272.1 $400.0 $721.0 $1,340.9 $2,030.9 $653.0 2000 2001 2002 2003 2004 2005 2006 2007 2008 2009 2010 2011 2012 2013 2014 $112.1 outstanding balances (1.6 % of total) $1,563.9 outstanding balances (22.1% of total) $5,417.9 outstanding balances (76.4% of total) Charge-Offs By Vintage and Remaining Balances $ in millions $2.4 $2.4 $2.1 $5.3 $26.0 $67.4 $127.2 $100.0 $67.3 $5.4 $2.9 $3.5 $0.4 $0.2 $0 2000 2001 2002 2003 2004 2005 2006 2007 2008 2009 2010 2011 2012 2013 2014 $12.4 charge offs (2.1% of total) $387.9 charge offs (94.8% of total) $12.2 charge offs (3.1% of total) Charge-Offs by Origination Vintage 2000 - 2014 Remaining Balances by Vintage 2000-2014 16
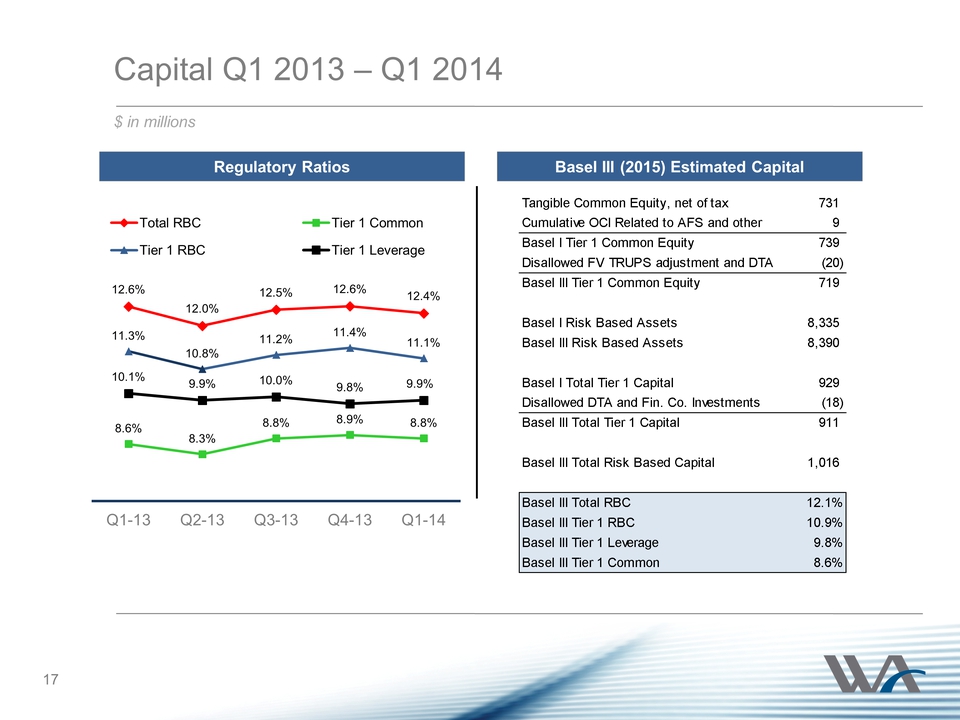
12.6% 12.0% 12.5% 12.6% 12.4% 8.6% 8.3% 8.8% 8.9% 8.8% 11.3% 10.8% 11.2% 11.4% 11.1% 10.1% 9.9% 10.0% 9.8% 9.9% Q1-13 Q2-13 Q3-13 Q4-13 Q1-14 Total RBC Tier 1 Common Tier 1 RBC Tier 1 Leverage Capital Q1 2013 – Q1 2014 Regulatory Ratios Basel III (2015) Estimated Capital $ in millions 17 Tangible Common Equity, net of tax 731 Cumulative OCI Related to AFS and other 9 Basel I Tier 1 Common Equity 739 Disallowed FV TRUPS adjustment and DTA (20) Basel III Tier 1 Common Equity 719 Basel I Risk Based Assets 8,335 Basel III Risk Based Assets 8,390 Basel I Total Tier 1 Capital 929 Disallowed DTA and Fin. Co. Investments (18) Basel III Total Tier 1 Capital 911 Basel III Total Risk Based Capital 1,016 Basel III Total RBC 12.1% Basel III Tier 1 RBC 10.9% Basel III Tier 1 Leverage 9.8% Basel III Tier 1 Common 8.6%
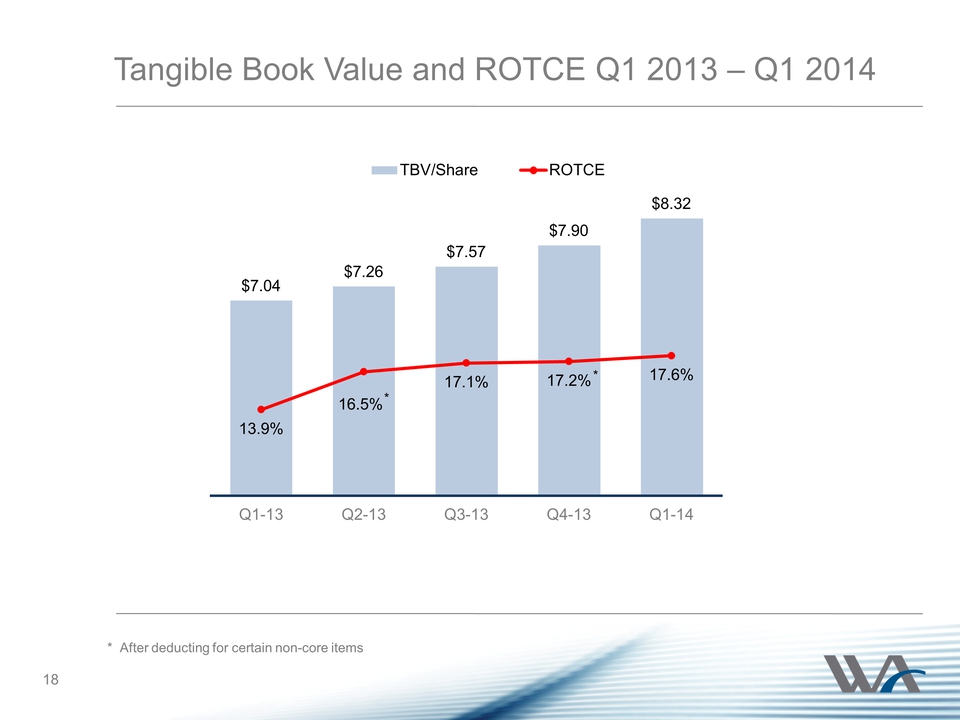
Tangible Book Value and ROTCE Q1 2013 – Q1 2014 $7.04 $7.26 $7.57 $7.90 $8.32 13.9% 16.5% 17.1% 17.2% 17.6% Q1-13 Q2-13 Q3-13 Q4-13 Q1-14 TBV/Share ROTCE 18 * * * After deducting for certain non-core items
Outlook 2nd Quarter 2014 19 Loan and Deposit Growth Interest Margin Operational Efficiency Asset Quality

Question & Answer 20
Forward-Looking Statements This presentation contains forward-looking statements that relate to expectations, beliefs, projections, future plans and strategies, anticipated events or trends and similar expressions concerning matters that are not historical facts. Examples of forward-looking statements include, among others, statements we make regarding guidance, outlook, or expectations relating to loan and deposit growth, interest margin, operating efficiency, and asset quality. The forwardlooking statements contained herein reflect our current views about future events and financial performance and are subject to risks, uncertainties, assumptions and changes in circumstances that may cause our actual results to differ significantly from historical results and those expressed in any forward-looking statement. Some factors that could cause actual results to differ materially from historical or expected results include, among others: the risk factors discussed in the Company’s Annual Report on Form 10-K for the year ended December 31, 2013 as filed with the Securities and Exchange Commission; changes in general economic conditions, either nationally or locally in the areas in which we conduct or will conduct our business; inflation, interest rate, market and monetary fluctuations; increases in competitive pressures among financial institutions and businesses offering similar products and services; higher defaults on our loan portfolio than we expect; changes in management’s estimate of the adequacy of the allowance for credit losses; legislative or regulatory changes or changes in accounting principles, policies or guidelines; supervisory actions by regulatory agencies which may limit our ability to pursue certain growth opportunities; management’s estimates and projections of interest rates and interest rate policy; the execution of our business plan; and other factors affecting the financial services industry generally or the banking industry in particular. Any forward-looking statement made by us in this presentation is based only on information currently available to us and speaks only as of the date on which it is made. We do not intend and disclaim any duty or obligation to update or revise any industry information or forward-looking statements, whether written or oral, that may be made from time to time, set forth in this presentation to reflect new information, future events or otherwise. 21