Exhibit 99.1
Bancshares of Florida, Inc.
Investor Presentation November 16, 2006
Financial Data at September 30, 2006 Valuation at October 30, 2006

Forward-Looking Statements
Statements contained in this presentation which are not historical facts are forward-looking statements as that item is defined in the Private Securities Litigation Reform Act of 1995. Such forward-looking statements are subject to risks and uncertainties which could cause actual results to differ materially from estimated results. Such risks and uncertainties are detailed in the Company’s filings with the Securities and Exchange Commission.
NASDAQ: BOFL
We Are Building
Florida’s Bank with
Vision Strength Momentum

Bank of Florida’s Story
Experienced management team Premier Florida markets Demonstrated high growth Excellent asset quality
Diminished competition through consolidation
Earnings momentum (6 consecutive rising quarters) Compelling valuation
Vision
Building’s Florida Best Bank
“The best vision, is in sight.”
- Malcolm Forbes Forbes Magazine
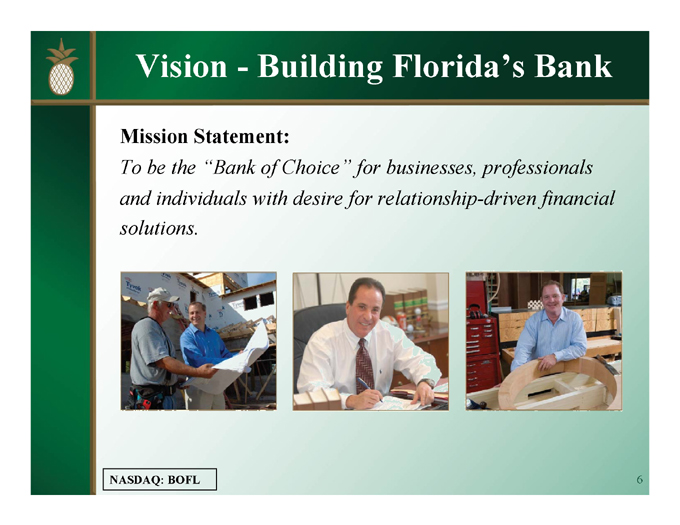
Vision—Building Florida’s Bank
Mission Statement:
To be the “Bank of Choice” for businesses, professionals and individuals with desire for relationship-driven financial solutions.
NASDAQ: BOFL
Vision—Building Florida’s Bank
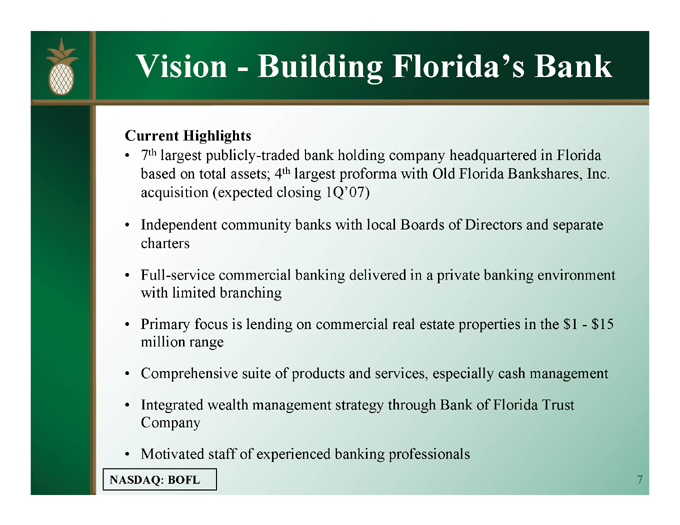
Current Highlights
7th largest publicly-traded bank holding company headquartered in Florida based on total assets; 4th largest proforma with Old Florida Bankshares, Inc. acquisition (expected closing 1Q’07)
Independent community banks with local Boards of Directors and separate charters
Full-service commercial banking delivered in a private banking environment with limited branching
Primary focus is lending on commercial real estate properties in the $1—$15 million range
Comprehensive suite of products and services, especially cash management
Integrated wealth management strategy through Bank of Florida Trust Company
Motivated staff of experienced banking professionals
NASDAQ: BOFL

Vision—Target Client Profile
Business owners
Entrepreneurs
Executives
Professionals (doctors, attorneys, accountants)
Professional associations
Businesses
Wealthy families and individuals
Foundations and estates
NASDAQ: BOFL
Vision – Bank Affiliates
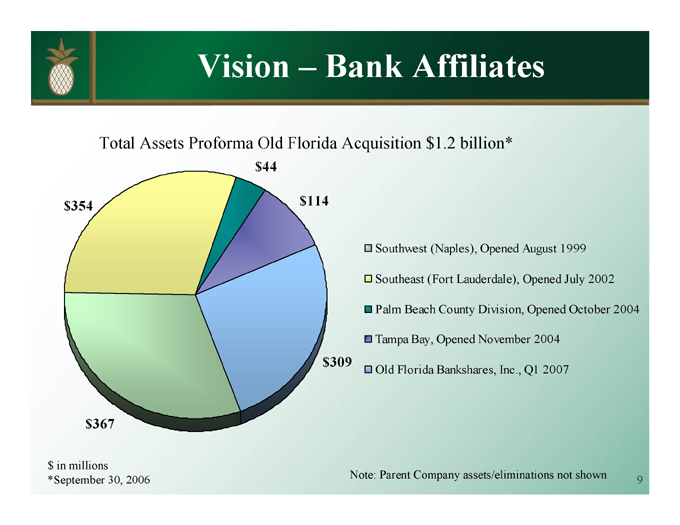
Total Assets Proforma Old Florida Acquisition $1.2 billion*
$354 $44 $114 $309 $367
Southwest (Naples), Opened August 1999 Southeast (Fort Lauderdale),
Opened July 2002 Palm Beach County Division, Opened October 2004
Tampa Bay, Opened November 2004 Old Florida Bankshares, Inc., Q1 2007
$in millions *September 30, 2006
Note: Parent Company assets/eliminations not shown
Vision – Bank of Florida Trust Company
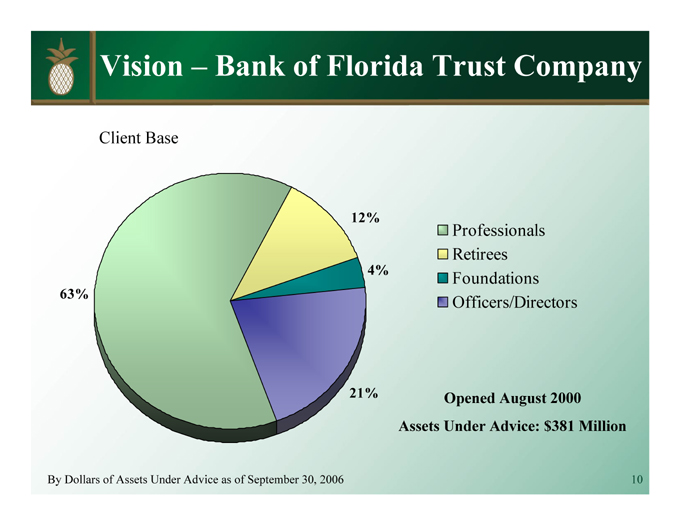
Client Base
63%
12%
4%
21%
Professionals Retirees Foundations Officers/Directors
Opened August 2000 Assets Under Advice: $381 Million
By Dollars of Assets Under Advice as of September 30, 2006
Vision – Market Expansion Opportunities
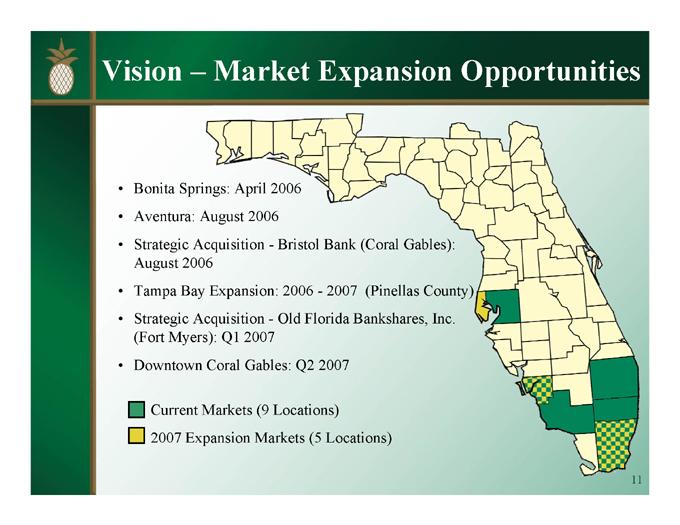
Bonita Springs: April 2006 Aventura: August 2006
Strategic Acquisition—Bristol Bank (Coral Gables): August 2006 Tampa Bay Expansion: 2006—2007 (Pinellas County) Strategic Acquisition—Old Florida Bankshares, Inc. (Fort Myers): Q1 2007 Downtown Coral Gables: Q2 2007
Current Markets (9 Locations) 2007 Expansion Markets (5 Locations)
Vision – Bristol Bank Consolidation
Successfully closed this $90 million-asset acquisition – BOFL’s first – on August 25, 2006, building Bank of Florida – Southeast’s franchise to over $350 million in assets.
Operational integration fully completed in early September, building valuable team skills for future acquisitions
Implemented in excess of $800,000 in annualized cost savings; impact to be realized in 4Q’06
New leadership in place with extensive experience in the Miami-Dade County market; recruiting of other key hires underway
Additional Downtown Coral Gables Banking Center site secured with expected opening in 2Q’07
Vision – Old Florida Bankshares Acquisition
Great Cultural Fit—emphasis on decentralized decision-making, responsive customer service, quality management team
Great Strategic Fit—an in-market transaction, increasing the combined market share in two of Florida’s top markets—Ft. Myers and Naples MSAs—from 17th to 10th
Great Financial Fit—expected to be meaningfully accretive to EPS and profitability ratios in first year
Commercial Real Estate and Construction Focus match BOFL’s core competencies, with opportunity to diversify via leveraging our new C&I team
Historically Strong Asset Quality, with lenders and many borrowers already well known to BOFL’s lending team
Deposit Mix provides opportunity to leverage BOFL’s cash management capabilities
Old Florida’s Customer Base becomes new market for BOF Trust Company’s wealth management services
Builds Combined Company to $1.2 billion in Assets and $250 million in market cap, increasing liquidity and visibility
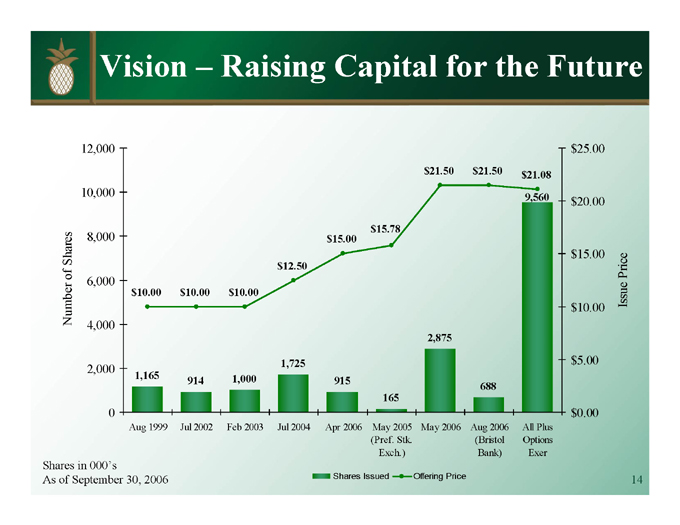
Vision – Raising Capital for the Future
Shares in 000’s
As of September 30, 2006
Number of Shares
12,000
10,000
8,000
6,000
4,000
2,000
0
$10.00 1,165 Aug 1999 $10.00 1,000 Jul 2002 $10.00 914 Feb 2003 $12.50 1,725 Jul 2004 $15.00 915 Apr 2006 $15.78 165 May 2005 (Pref. Stk. Exch.) $21.50 2,875 May 2006 $21.50 688 Aug 2006 (Bristol Bank) $21.08 9,560 All Plus Options Exer
$25.00
$20.00
$15.00
$10.00
$5.00
$0.00
Shares Issued Offering Price
Issue Price
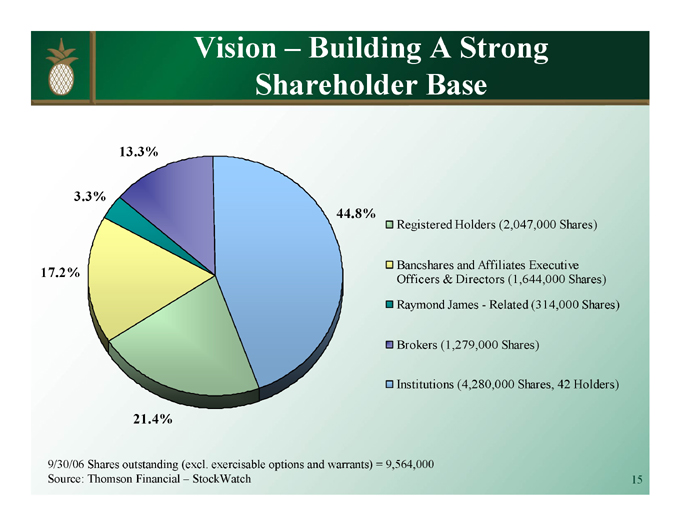
Vision – Building A Strong Shareholder Base
13.3%
44.8%
21.4%
17.2%
3.3%
Registered Holders (2,047,000 Shares)
Bancshares and Affiliates Executive Officers & Directors (1,644,000 Shares) Raymond James—Related (314,000 Shares)
Brokers (1,279,000 Shares)
Institutions (4,280,000 Shares, 42 Holders)
9/30/06 Shares outstanding (excl. exercisable options and warrants) = 9,564,000 Source: Thomson Financial – StockWatch
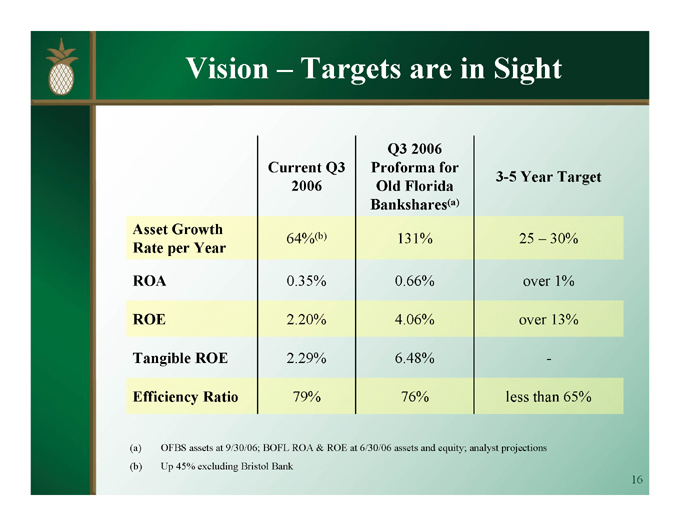
Vision – Targets are in Sight
Current Q3 2006 Q3 2006 Proforma for Old Florida Bankshares(a) 3-5 Year Target
Asset Growth
64%(b) 131% 25 – 30%
Rate per Year
ROA 0.35% 0.66% over 1%
ROE 2.20% 4.06% over 13%
Tangible ROE 2.29% 6.48% -
Efficiency Ratio 79% 76% less than 65%
(a) OFBS assets at 9/30/06; BOFL ROA & ROE at 6/30/06 assets and equity; analyst projections (b) Up 45% excluding Bristol Bank

Strength
Right Talent & Right Markets
“My strength lies solely in tenacity.”
- Louis Pasteur
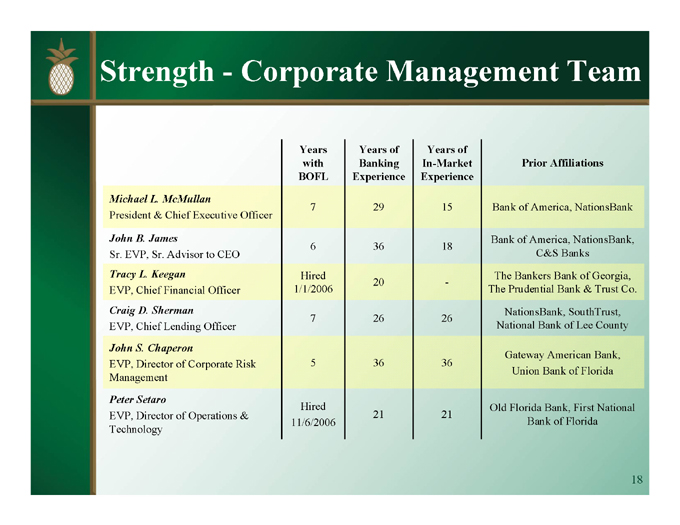
Strength—Corporate Management Team
Years with BOFL Years of Banking Experience Years of In-Market Experience Prior Affiliations
Michael L. McMullan
7 29 15 Bank of America, NationsBank
President & Chief Executive Officer
John B. James Bank of America, NationsBank,
6 36 18
Sr. EVP, Sr. Advisor to CEO C&S Banks
Tracy L. Keegan Hired The Bankers Bank of Georgia,
20 —
EVP, Chief Financial Officer 1/1/2006 The Prudential Bank & Trust Co.
Craig D. Sherman NationsBank, SouthTrust,
7 26 26
EVP, Chief Lending Officer National Bank of Lee County
John S. Chaperon
Gateway American Bank,
EVP, Director of Corporate Risk 5 36 36
Union Bank of Florida
Management
Peter Setaro
Hired Old Florida Bank, First National
EVP, Director of Operations & 21 21
11/6/2006 Bank of Florida
Technology
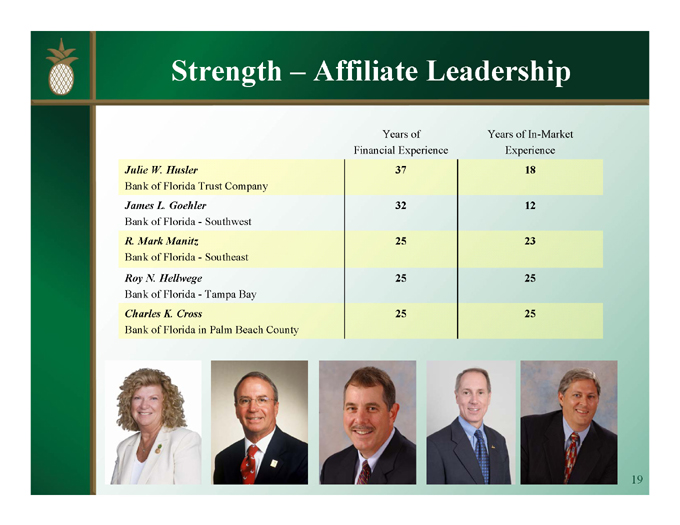
Strength – Affiliate Leadership
Years of Years of In-Market
Financial Experience Experience
Julie W. Husler 37 18
Bank of Florida Trust Company
James L. Goehler 32 12
Bank of Florida—Southwest
R. Mark Manitz 25 23
Bank of Florida—Southeast
Roy N. Hellwege 25 25
Bank of Florida—Tampa Bay
Charles K. Cross 25 25
Bank of Florida in Palm Beach County
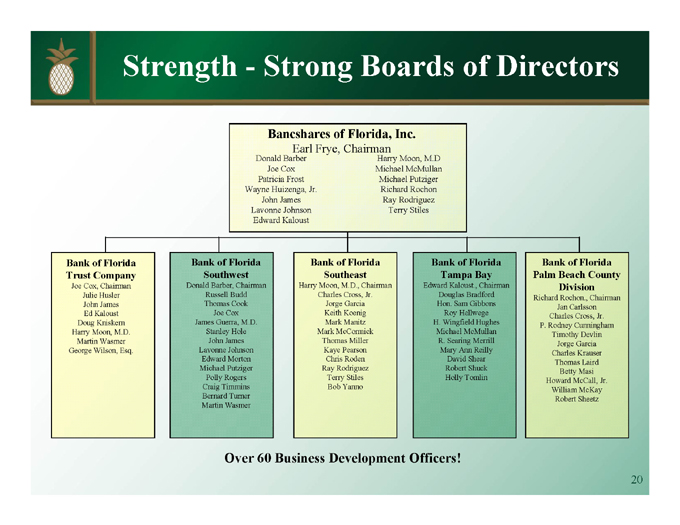
Strength—Strong Boards of Directors
Bancshares of Florida, Inc.
Earl Frye, Chairman
Donald Barber Joe Cox Patricia Frost Wayne Huizenga, Jr. John James Lavonne Johnson Edward Kaloust
Harry Moon, M.D Michael McMullan Michael Putziger Richard Rochon Ray Rodriguez Terry Stiles
Bank of Florida Trust Company
Joe Cox, Chairman Julie Husler John James Ed Kaloust Doug Kniskern Harry Moon, M.D. Martin Wasmer George Wilson, Esq.
Bank of Florida Southwest
Donald Barber, Chairman Russell Budd Thomas Cook Joe Cox James Guerra, M.D. Stanley Hole John James Lavonne Johnson Edward Morton Michael Putziger Polly Rogers Craig Timmins Bernard Turner Martin Wasmer
Bank of Florida Southeast
Harry Moon, M.D., Chairman Charles Cross, Jr. Jorge Garcia Keith Koenig Mark Manitz Mark McCormick Thomas Miller Kaye Pearson Chris Roden Ray Rodriguez Terry Stiles Bob Yanno
Bank of Florida Tampa Bay
Edward Kaloust., Chairman Douglas Bradford Hon. Sam Gibbons Roy Hellwege H. Wingfield Hughes Michael McMullan R. Searing Merrill Mary Ann Reilly David Shear Robert Shuck Holly Tomlin
Bank of Florida Palm Beach County Division
Richard Rochon., Chairman Jan Carlsson Charles Cross, Jr. P. Rodney Cunningham Timothy Devlin Jorge Garcia Charles Krauser Thomas Laird Betty Masi Howard McCall, Jr. William McKay Robert Sheetz
Over 60 Business Development Officers!
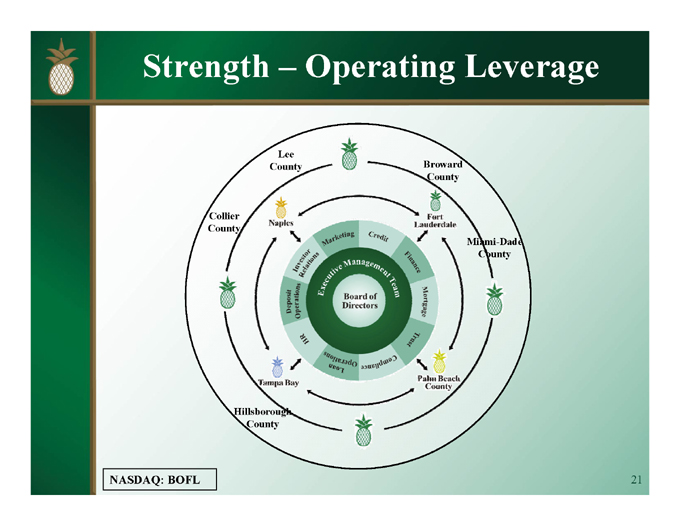
Strength – Operating Leverage
NASDAQ: BOFL
Collier County Lee County Broward County Fort Lauderdale Miami-Date County Palm Beach County Naples Tampa Bay Hillsborough County
Investor Relations Marketing Credit Finance Mortgage Trust Compliance Loan Operations HR Deposit Operations
Strength—The Florida Market
Based on the latest Nationwide data…
Florida created the highest number of new jobs of all states in the nation
Florida had the fastest job growth rate and the lowest unemployment rate of the ten most populous states
Florida ranks among the top 10 “Best States for Business” in the first-ever rankings by Forbes.com
Florida is one of just four states to boast “net in-migration” (more people moving into the state than leaving)
Sources: Florida Research and Economic Database, SNL, eFlorida.com
NASDAQ: BOFL
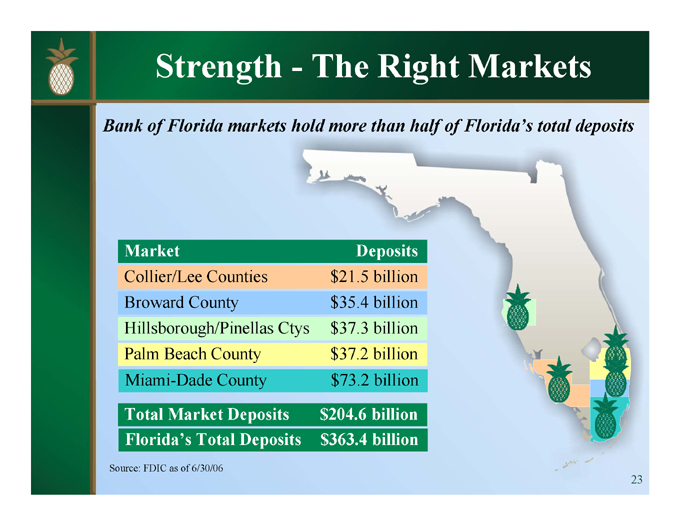
Strength—The Right Markets
Bank of Florida markets hold more than half of Florida’s total deposits
Market Deposits
Collier/Lee Counties $21.5 billion
Broward County $35.4 billion
Hillsborough/Pinellas Ctys $37.3 billion
Palm Beach County $37.2 billion
Miami-Dade County $73.2 billion
Total Market Deposits $204.6 billion
Florida’s Total Deposits $363.4 billion
Source: FDIC as of 6/30/06
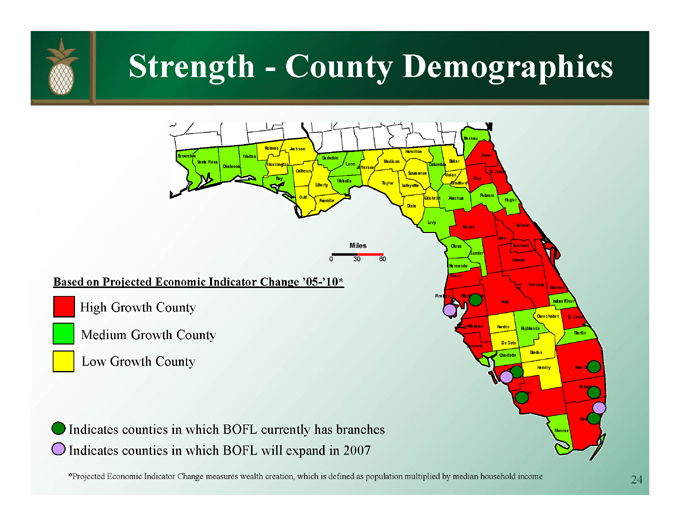
Strength—County Demographics
Nassau
Holmes Jackson
Hamilton
Escambia Walton Duval
Gadsden
Santa Rosa Madison Baker
Okaloosa Washington Columbia
Leon Jefferson
Calhoun St. Johns
Suwannee Union
Bay Clay
Wakulla
Liberty Taylor Bradford
Lafayette
Gulf Putnam
Gilchrist Alachua Flagler
Franklin
Dixie
Levy
Marion Volusia
Lake
Citrus Seminole
Sumter
Orange
Hernando
Pasco
Osceola
Brevard
Pinellas Hillsborough
Polk Indian River
Okeechobee St. Lucie
Manatee Hardee
Highlands
Martin
De Soto
Sarasota
Glades
Charlotte
Hendry Palm Beach
Lee
Broward
Collier
Dade
Monroe
Miles
Based on Projected Economic Indicator Change ‘05-’10*
High Growth County Medium Growth County Low Growth County
Indicates counties in which BOFL currently has branches Indicates counties in which BOFL will expand in 2007
*Projected Economic Indicator Change measures wealth creation, which is defined as population multiplied by median household income
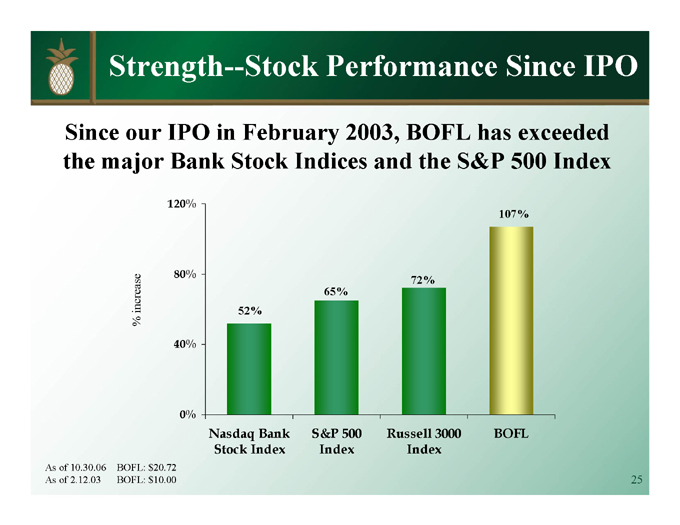
Strength—Stock Performance Since IPO
% increase
120%
80%
40%
0%
52% Nasdaq Bank Stock Index 65% S&P 500 Index 72% Russell 3000 Index 107% BOFL
Since our IPO in February 2003, BOFL has exceeded the major Bank Stock Indices and the S&P 500 Index
As of 10.30.06 BOFL: $20.72
As of 2.12.03 BOFL: $10.00
Momentum
Sustainable Growth & Rising Profitability
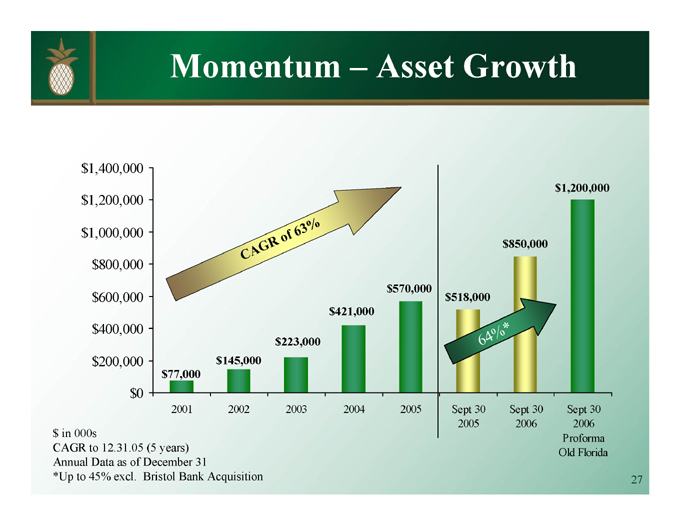
Momentum – Asset Growth
$1,400,000
$1,200,000
$1,000,000
$800,000
$600,000
$400,000
$200,000
$0
CAGR of 63%
$77,000 $145,000 $223,000 $421,000 570,000 $518,000 $850,000 $1,200,000
64%*
2001 2002 2003 2004 2005 Sept 30 2005 Sept 30 2006 Sept 30 2006 Proforma Old Florida
$in 000s
CAGR to 12.31.05 (5 years) Annual Data as of December 31
*Up to 45% excl. Bristol Bank Acquisition
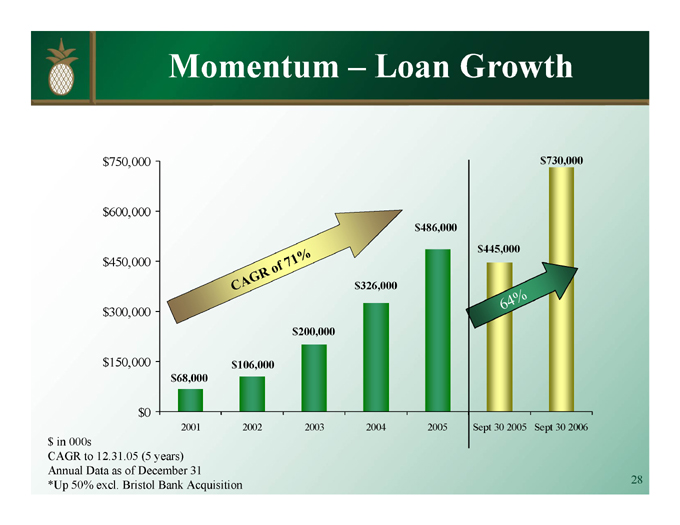
Momentum – Loan Growth
$750,000
$600,000
$450,000
$300,000
$150,000
$0
CAGR of 71%
$68,000 $106,000 $200,000 $326,000 $486,000 $445,000 $730,000
64%
2001 2002 2003 2004 2005 Sept 30 2005 Sept 30 2006
$in 000s
CAGR to 12.31.05 (5 years) Annual Data as of December 31 *Up 50% excl. Bristol Bank Acquisition
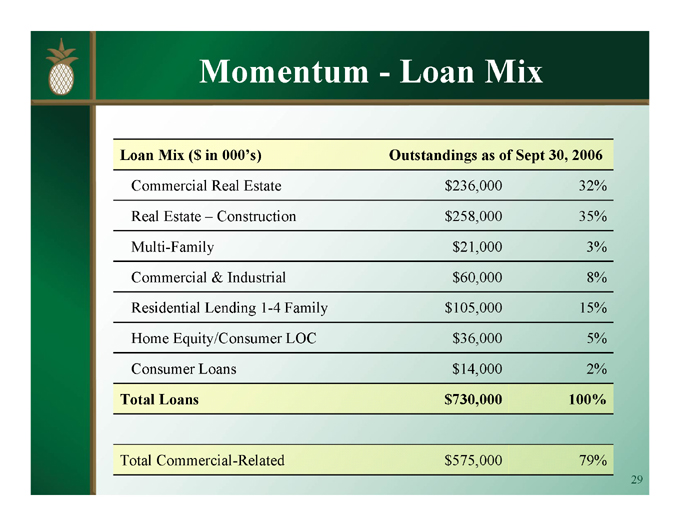
Momentum—Loan Mix
Loan Mix ($in 000’s) Outstandings as of Sept 30, 2006
Commercial Real Estate $236,000 32%
Real Estate – Construction $258,000 35%
Multi-Family $21,000 3%
Commercial & Industrial $60,000 8%
Residential Lending 1-4 Family $105,000 15%
Home Equity/Consumer LOC $36,000 5%
Consumer Loans $14,000 2%
Total Loans $730,000 100%
Total Commercial-Related $575,000 79%
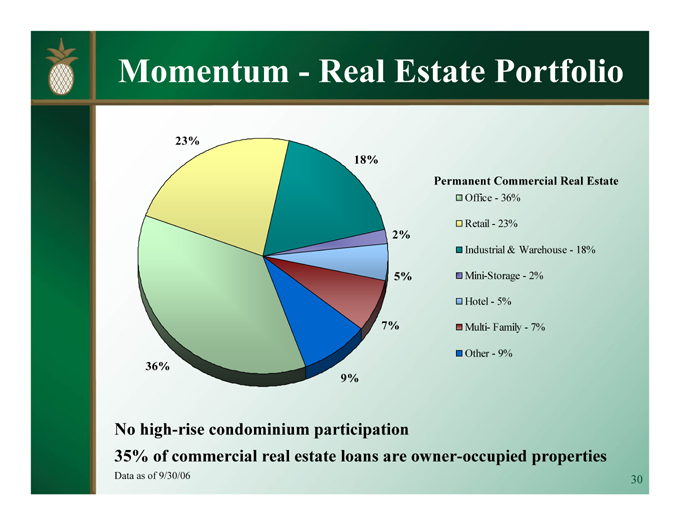
Momentum—Real Estate Portfolio
23%
18%
2%
5%
7%
9%
36%
Permanent Commercial Real Estate
Office—36%
Retail—23%
Industrial & Warehouse—18% Mini-Storage—2% Hotel—5% Multi- Family—7% Other—9%
No high-rise condominium participation
35% of commercial real estate loans are owner-occupied properties
Data as of 9/30/06
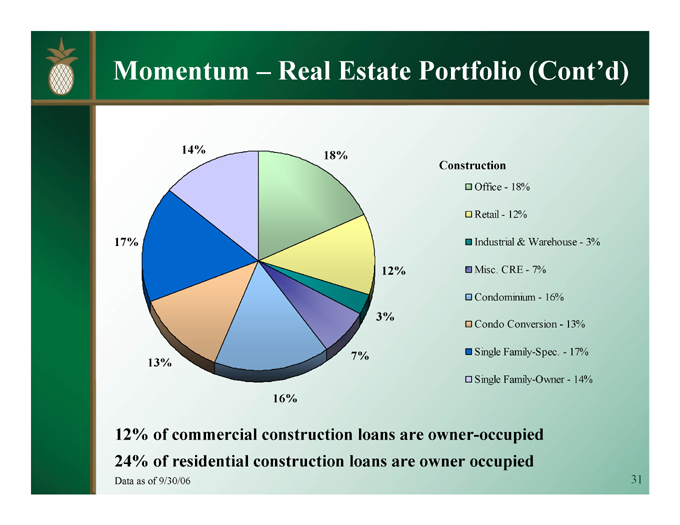
Momentum – Real Estate Portfolio (Cont’d)
14%
18%
12%
3%
7%
16%
13%
17%
Construction
Office—18%
Retail—12%
Industrial & Warehouse—3%
Misc. CRE—7%
Condominium—16%
Condo Conversion—13%
Single Family-Spec.—17%
Single Family-Owner—14%
12% of commercial construction loans are owner-occupied 24% of residential construction loans are owner occupied
Data as of 9/30/06
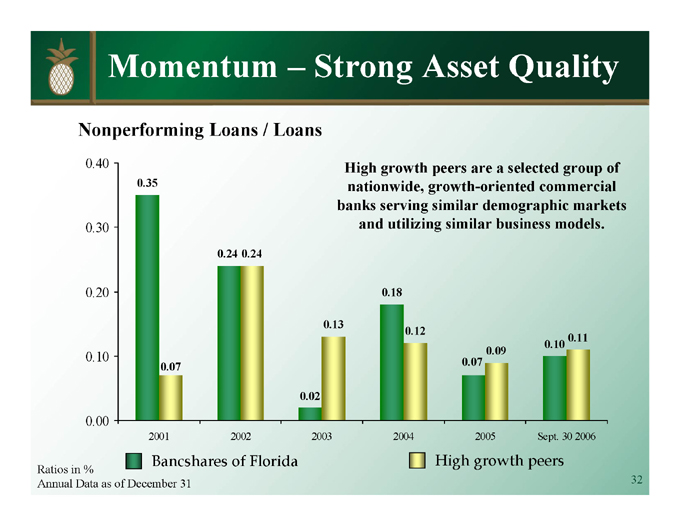
Momentum – Strong Asset Quality
Nonperforming Loans / Loans
High growth peers are a selected group of nationwide, growth-oriented commercial banks serving similar demographic markets and utilizing similar business models.
0.40
0.30
0.20
0.10
0.00
0.35 0.07
0.24 0.24 0.02 0.13 0.18 0.12 0.07 0.09 0.10 0.11
2001 2002 2003 2004 2005 Sept. 30 2006
Bancshares of Florida High growth peers
Ratios in %
Annual Data as of December 31
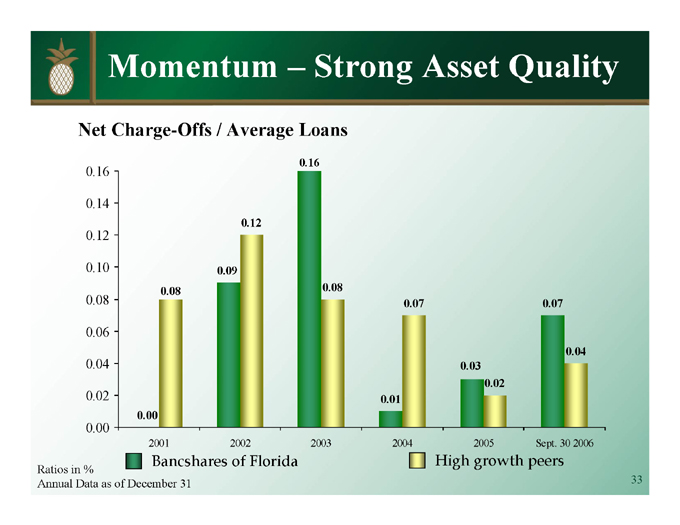
Momentum – Strong Asset Quality
0.16
0.14
0.12
0.10
0.08
0.06
0.04
0.02
0.00
2001 2002 2003 2004 2005 Sept. 30 2006
0.00 0.08 0.09 0.12 0.16 0.08 0.01 0.07 0.03 0.02 0.07 0.04
Bancshares of Florida High growth peers
Net Charge-Offs / Average Loans
Ratios in %
Annual Data as of December 31
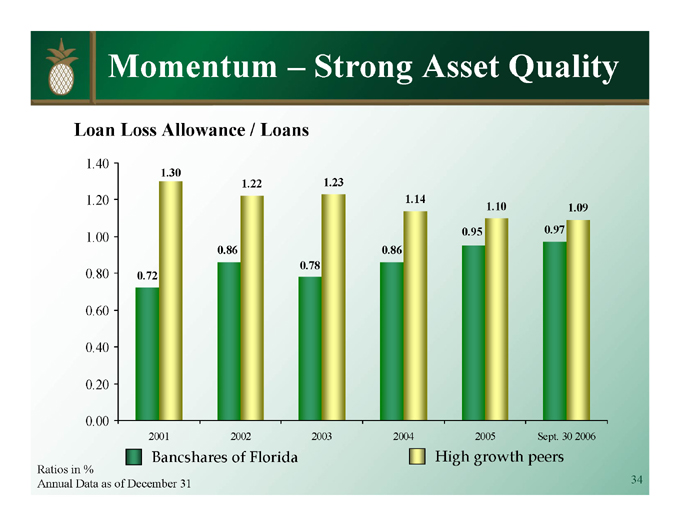
Momentum – Strong Asset Quality
Loan Loss Allowance / Loans
1.40
1.20
1.00
0.80
0.60
0.40
0.20
0.00
0.72 1.30 0.86 1.22 0.78 1.23 0.86 1.14 0.95 1.10 0.97 1.09
2001 2002 2003 2004 2005 Sept. 30 2006
Bancshares of Florida High growth peers
Ratios in %
Annual Data as of December 31
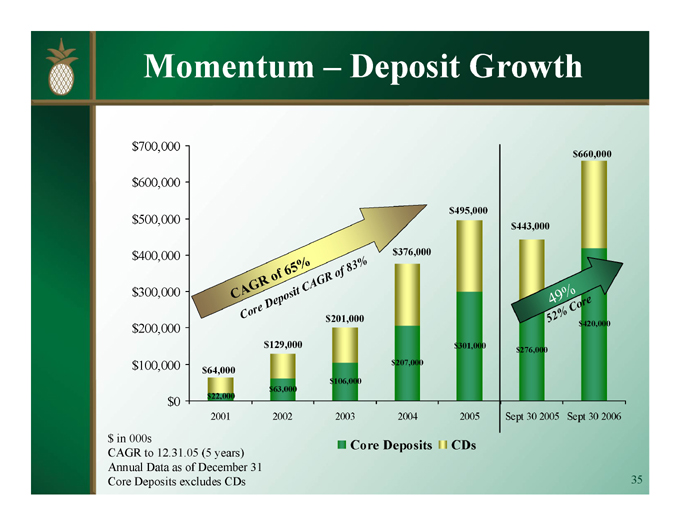
Momentum – Deposit Growth $in 000s
$700,000 $600,000 $500,000 $400,000 $300,000 $200,000 $100,000 $0
CAGR of 65%
Core Deposit of CAGR of 83%
$64,000 $22,000 2001 $129,000 $63,000 2002
$201,000 $106,000 2003
$376,000 $207,000 2004
$495,000 $301,000 2005
$443,000 $276,000 Sept 30 2005
$660,000 $420,000 Sept 30 2006
49%
52% Core
Core Deposits CDs
CAGR to 12.31.05 (5 years) Annual Data as of December 31 Core Deposits excludes CDs
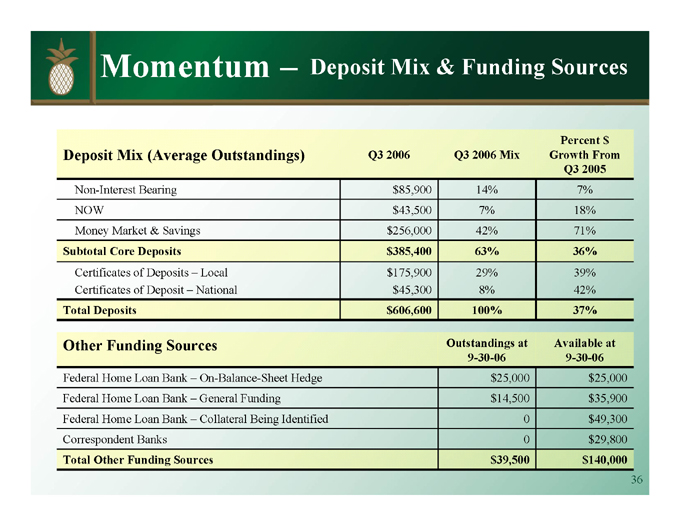
Momentum – Deposit Mix & Funding Sources
Deposit Mix (Average Outstandings) Q3 2006 Q3 2006 Mix Percent $ Growth From Q3 2005
Non-Interest Bearing $85,900 14% 7%
NOW $43,500 7% 18%
Money Market & Savings $256,000 42% 71%
Subtotal Core Deposits $385,400 63% 36%
Certificates of Deposits – Local $175,900 29% 39%
Certificates of Deposit – National $45,300 8% 42%
Total Deposits $606,600 100% 37%
Other Funding Sources Outstandings at Available at
9-30-06 9-30-06
Federal Home Loan Bank – On-Balance-Sheet Hedge $25,000 $25,000
Federal Home Loan Bank – General Funding $14,500 $35,900
Federal Home Loan Bank – Collateral Being Identified 0 $49,300
Correspondent Banks 0 $29,800
Total Other Funding Sources $39,500 $140,000
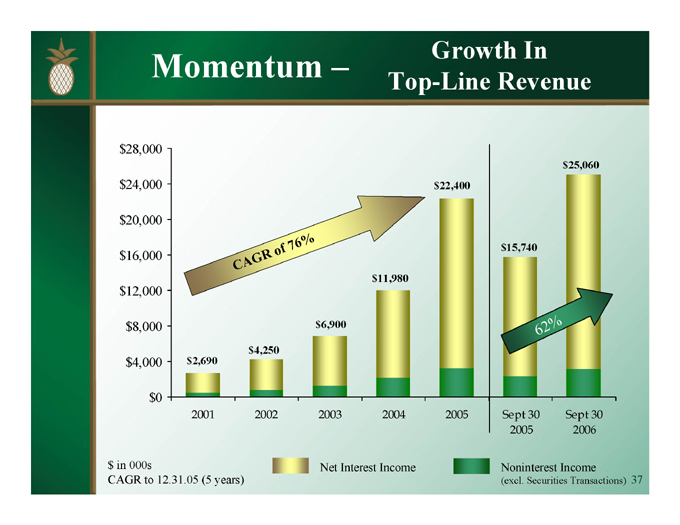
Momentum – Growth In
$28,000 $24,000 $20,000 $16,000 $12,000 $8,000 $4,000 $0
CAGR of 76%
$2,690
2001
$4,250
2002
$6,900
2003
$11, 980
2004
$22,400
2005
$15,740
Sept 30 2005 $25,060
Sept 30 2006
Net Interest Income Noninterest Income
(excl. Securities Transactions)
Top-Line Revenue $ in 000s
CAGR to 12.31.05 (5 years)
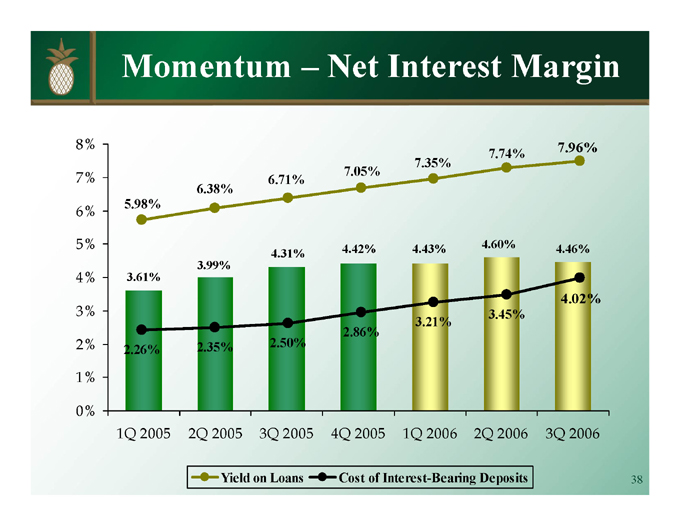
Momentum – Net Interest Margin
8%
7%
6%
5%
4%
3%
2%
1%
0%
5.98% 3.61% 2.26% 1Q 2005
6.38% 3.99% 2.35% 2Q 2005
6.71% 4.31% 2.50% 3Q 2005
7.05% 4.42% 2.86% 4Q 2005
7.35% 4.43% 3.21% 1Q 2006
7.74% 4.60% 3.45% 2Q 2006
7.96% 4.46% 4.02% 3Q 2006
Yield on Loans Cost of Interest-Bearing Deposits
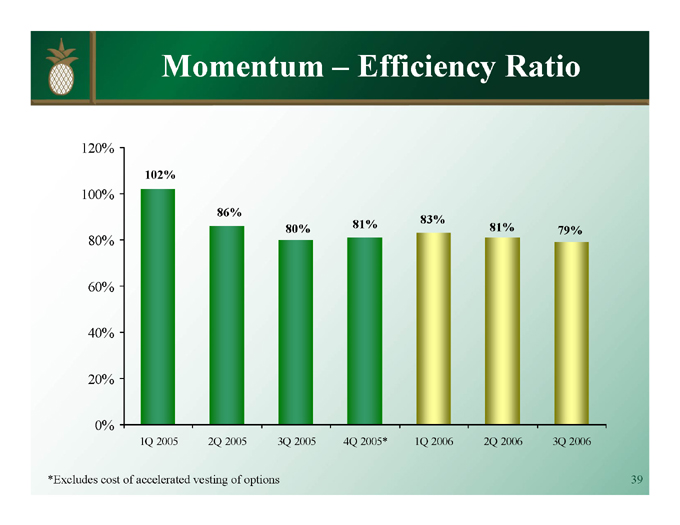
Momentum – Efficiency Ratio
120%
100%
80%
60%
40%
20%
0%
102% 1Q 2005 86% 2Q 2005 80% 3Q 2005 81% 4Q 2005* 83% 1Q 2006 81% 2Q 2006 79% 3Q 2006
*Excludes cost of accelerated vesting of options
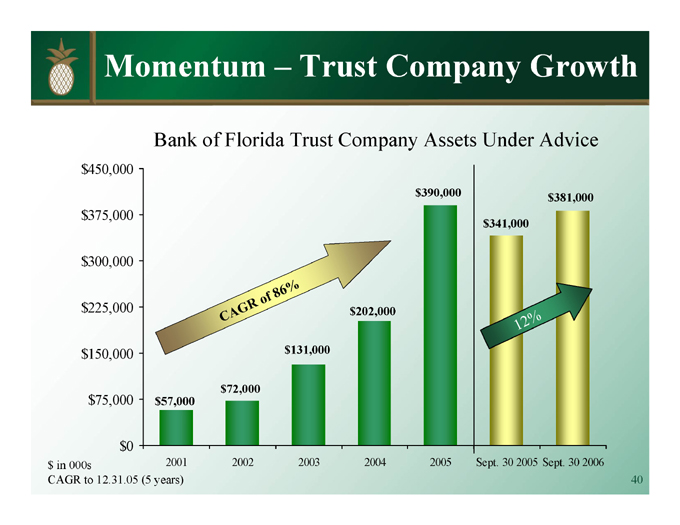
Momentum – Trust Company Growth
$450,000
$375,000
$300,000
$225,000
$150,000
$75,000
$0
CAGR of 86%
$57,000 2001 $72,000 2002
$131,000 2003
$202,000 2004
$390,000 2005
$341,000 Sept. 30 2005
$381,000 Sept. 30 2006
12%
Bank of Florida Trust Company Assets Under Advice $in 000s
CAGR to 12.31.05 (5 years)
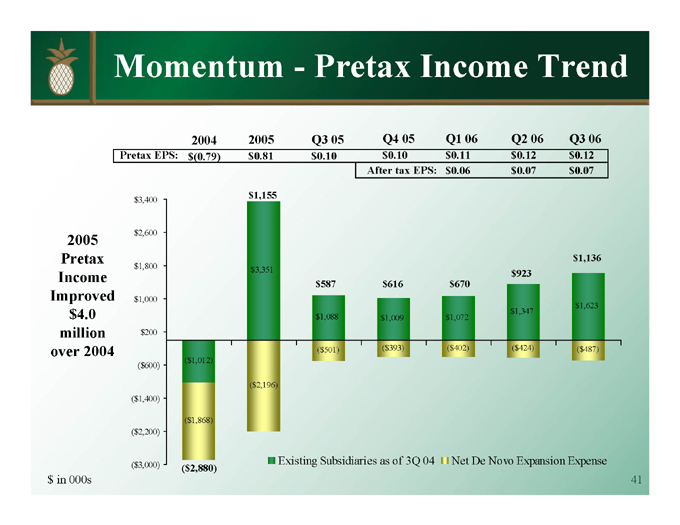
Momentum—Pretax Income Trend $in 000s
2004 2005 Q3 05 Q4 05 Q1 06 Q2 06 Q3 06
Pretax EPS: $(0.79) $0.81 $0.10 $0.10 $0.11 $0.12 $0.12
After tax EPS: $0.06 $0.07 $0.07
2005 Pretax Income Improved $4.0 million over 2004
$3,400
$2,600
$1,800
$1,000
$200
($600)
($1,400)
($2,200)
($3,000)
($1,012) ($1,868) ($2,880) $1,155 $3,351 ($2,196) $587 $1,088 ($501) $616 $1,009 ($393) $670 $1,072 ($402) $923 $1,347 ($424) $1,136 $1,623 ($487)
Existing Subsidiaries as of 3Q 04 Net De Novo Expansion Expense
Valuation
A Compelling Story
Valuation – The Right Markets
“They’re expanding in probably three of the largest and fastest-growing markets in Florida, being in the Greater Miami market, the Fort Myers/Naples market area and then, third, the Tampa market. You add on top of that they have two non-banking companies, if you will — they have a mortgage company and a wealth management company — so they really have all of their bases covered down there, so we think the prospects are very bright for them.”
Wilson L. .Smith, CFA Director of Financial Services Research Boenning & Scattergood, Inc.
NASDAQ: BOFL
Valuation – The Right Markets
“We are initiating coverage of Bancshares of Florida, Inc. with an investment rating of Outperform. Bancshares is rapidly emerging as one of Florida’s largest and fastest growing community banks (loans, deposits and EPS), capitalizing on an attractive competitive landscape in one of the nation’s premier banking environments. We expect several years of rapid EPS growth (50%-plus), rising profitability, and increasing franchise value as management leverages the company’s substantial infrastructure and capital base.”
John A. Pandtle, CFA Senior Vice President Financial Services Equity Research Raymond James & Associates
NASDAQ: BOFL
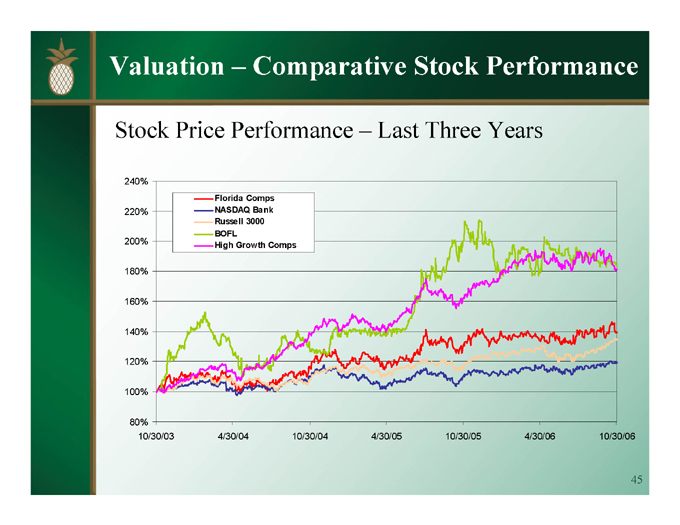
Valuation – Comparative Stock Performance
240%
220%
200%
180%
160%
140%
120%
100%
80%
Florida Comps NASDAQ Bank Russell 3000 BOFL
High Growth Comps
10/30/03 4/30/04 10/30/04 4/30/05 10/30/05 4/30/06 10/30/06
Stock Price Performance – Last Three Years
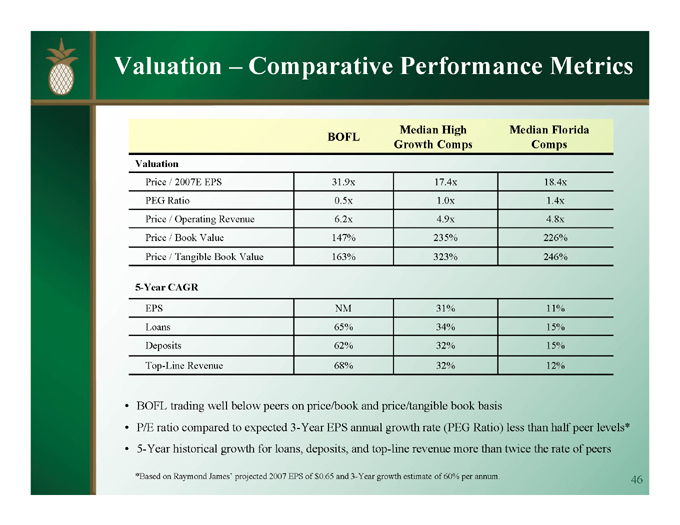
Valuation – Comparative Performance Metrics
BOFL Median High Growth Comps Median Florida Comps
Valuation
Price / 2007E EPS 31.9x 17.4x 18.4x
PEG Ratio 0.5x 1.0x 1.4x
Price / Operating Revenue 6.2x 4.9x 4.8x
Price / Book Value 147% 235% 226%
Price / Tangible Book Value 163% 323% 246%
5-Year CAGR
EPS NM 31% 11%
Loans 65% 34% 15%
Deposits 62% 32% 15%
Top-Line Revenue 68% 32% 12%
BOFL trading well below peers on price/book and price/tangible book basis
P/E ratio compared to expected 3-Year EPS annual growth rate (PEG Ratio) less than half peer levels*
5-Year historical growth for loans, deposits, and top-line revenue more than twice the rate of peers
*Based on Raymond James’ projected 2007 EPS of $0.65 and 3-Year growth estimate of 60% per annum.
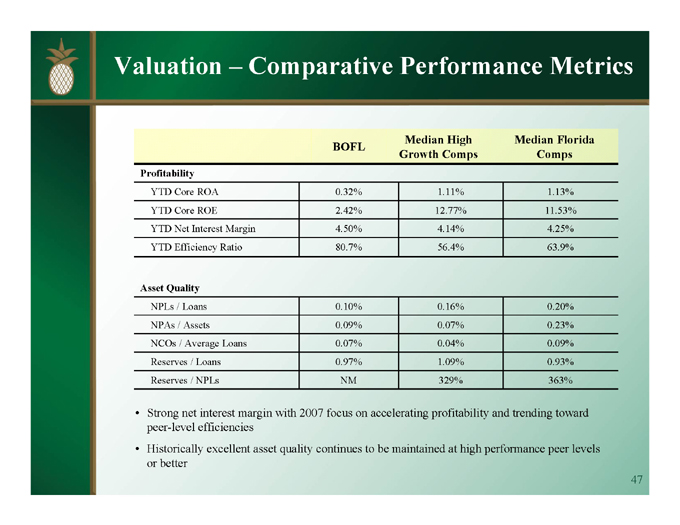
Valuation – Comparative Performance Metrics
BOFL Median High Growth Comps Median Florida Comps
Profitability
YTD Core ROA 0.32% 1.11% 1.13%
YTD Core ROE 2.42% 12.77% 11.53%
YTD Net Interest Margin 4.50% 4.14% 4.25%
YTD Efficiency Ratio 80.7% 56.4% 63.9%
Asset Quality
NPLs / Loans 0.10% 0.16% 0.20%
NPAs / Assets 0.09% 0.07% 0.23%
NCOs / Average Loans 0.07% 0.04% 0.09%
Reserves / Loans 0.97% 1.09% 0.93%
Reserves / NPLs NM 329% 363%
Strong net interest margin with 2007 focus on accelerating profitability and trending toward peer-level efficiencies
Historically excellent asset quality continues to be maintained at high performance peer levels or better
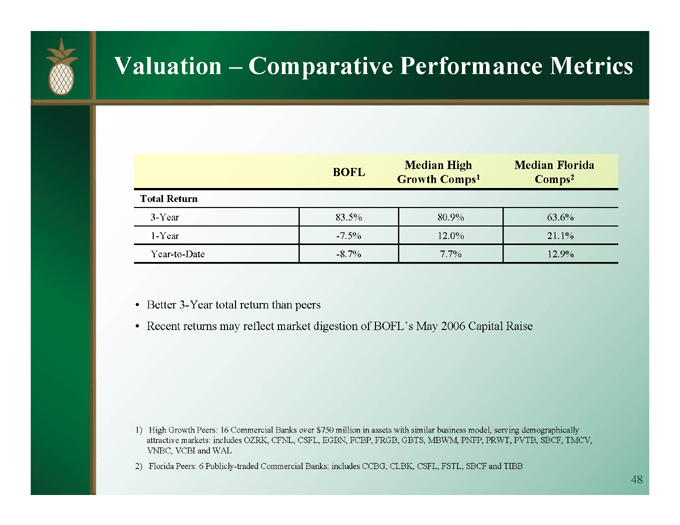
Valuation – Comparative Performance Metrics
BOFL Median High Growth Comps1 Median Florida Comps2
Total Return
3-Year 83.5% 80.9% 63.6%
1-Year -7.5% 12.0% 21.1%
Year-to-Date -8.7% 7.7% 12.9%
Better 3-Year total return than peers
Recent returns may reflect market digestion of BOFL’s May 2006 Capital Raise
1) High Growth Peers: 16 Commercial Banks over $750 million in assets with similar business model, serving demographically attractive markets: includes OZRK, CFNL, CSFL, EGBN, FCBP, FRGB, GBTS, MBWM, PNFP, PRWT, PVTB, SBCF, TMCV, VNBC, VCBI and WAL
2) Florida Peers: 6 Publicly-traded Commercial Banks: includes CCBG, CLBK, CSFL, FSTL, SBCF and TIBB

Investment Considerations
Experienced management team
Premier Florida markets
Demonstrated high growth
Excellent asset quality
Diminished competition through consolidation
Earnings momentum (6 consecutive rising quarters)
Compelling valuation
NASDAQ: BOFL

Questions & Answers
Closing Remarks Thank You!