
As filed with the Securities and Exchange Commission on March 3, 2003
Registration No. 333-102826
SECURITIES AND EXCHANGE COMMISSION
WASHINGTON, DC 20549
AMENDMENT NO. 1
TO
FORM F-1
REGISTRATION STATEMENT UNDER
THE SECURITIES ACT OF 1933
TELKOM SA LIMITED
(Exact name of registrant as specified in its charter)
The Republic of South Africa
4813
Not Applicable
(State or other jurisdiction
(Primary Standard Industrial
(I.R.S. Employer
of Incorporation or Organization)
Classification Code Number)
Identification Number)
Telkom Towers North
152 Proes Street
Pretoria 0002
The Republic of South Africa
(27) (12) 321 5808
(Address, including zip code, and telephone number of registrant's principal executive offices)
CT Corporation System
1633 Broadway
New York, New York 10019
(1) (212) 664-1666
(Name, address, including zip code, and telephone number, of agent for service)
Copies to:
Daniel G. Bergstein, Esq.
Adrian J.S. Deitz, Esq.
Tom Joyce, Esq.
Marie Censoplano, Esq.
Scott V. Simpson, Esq.
Sarah C. Murphy, Esq.
Paul, Hastings, Janofsky & Walker LLP
Skadden, Arps, Slate, Meagher & Flom LLP
Freshfields Bruckhaus Deringer
75 East 55th Street
One Canada Square
65 Fleet Street
New York, New York 10022
Canary Wharf
London EC4Y 1HS
(1) (212) 318-6000
London E14 5DS
England
England
(44) (207) 936-4000
(44) (207) 519-7000
Approximate date of commencement of proposed sale to the public: As soon as practicable after the effective date of this
Registration Statement.
If any of the securities being registered on this Form are to be offered on a delayed or continuous basis pursuant to Rule 415 under
the Securities Act of 1933, please check the following box:
If this Form is filed to register additional securities for an offering pursuant to Rule 462(b) under the Securities Act of 1933, check
the following box and list the Securities Act registration statement number of the earlier effective registration statement for the same
offering:
If this Form is a post-effective amendment filed pursuant to Rule 462(c) under the Securities Act of 1933, please check the
following box and list the Securities Act registration statement number of the earlier effective registration statement for the same
offering:
If this Form is a post-effective amendment filed pursuant to Rule 462(d) under the Securities Act of 1933, check the following
box and list the Securities Act registration statement number of the earliest effective registration statement for the same
offering:
If delivery of the prospectus is expected to be made pursuant to Rule 434 under the Securities Act of 1933, check the following
box:
The registrant hereby amends this registration statement on such date or dates as may be necessary to delay its effective date
until the registrant shall file a further amendment which specifically states that this registration statement shall thereafter
become effective in accordance with Section 8(a) of the Securities Act of 1933 or until the registration statement shall become
effective on such date as the Commission, acting pursuant to said Section 8(a), may determine.

SUBJECT TO COMPLETION, DATED MARCH 3, 2003
Telkom SA Limited
incorporated in the Republic of South Africa
Registration number 1991/005476/06
139,257,954 Ordinary Shares
offered in the form of Ordinary Shares or American Depositary Shares, or ADSs, each representing 4 Ordinary Shares
This is an initial public offering of ordinary shares, having a par value of R10 each in the capital of Telkom SA Limited, by
the Government of the Republic of South Africa. This global offering is expected to be 139,257,954 ordinary shares. The
global offering is being made in the United States and the Republic of South Africa and to institutional investors outside of
those jurisdictions. 48,740,284 of the ordinary shares offered in the global offering are being registered under the US
Securities Act of 1933 for initial offer and sale in the United States and for any resales into the United States. Initial offers
and sales outside the United States are not being registered under the US Securities Act of 1933.
We currently estimate that the initial public offering price will be:
• between R27.00 and R30.00 per ordinary share; and
• between $13.30 and $14.80 per ADS, based on an exchange rate of R8.10 per $1.00, rounded down to the nearest
10 US Cents.
All of the ordinary shares to be sold in the global offering are being offered by the Government of the Republic of South
Africa. We will not receive any of the proceeds from the sale of the ordinary shares in the global offering.
Prior to this global offering, there has been no public market for the ordinary shares or ADSs. The JSE Securities
Exchange, South Africa has agreed to list all the ordinary shares in the "Telecommunications Services" sector of the list of
the JSE Securities Exchange, South Africa under the symbol "TKG" and ISIN Code "ZAE000044897," subject to the
attainment of a spread of shareholders acceptable to the JSE Securities Exchange, South Africa and the submission of all
supporting documents required by the JSE Securities Exchange, South Africa. The ADSs have been approved for listing on
the New York Stock Exchange under the symbol "TKG," subject to official notice of issuance. Please see page 174 of this
prospectus for a description of the views of the JSE Securities Exchange, South Africa on the creation of the class A
ordinary share and class B ordinary share in the share capital of Telkom on the JSE Securities Exchange, South
Africa listing date and the rights afforded to the holders thereof.
Investing in Telkom's ordinary shares and ADSs involves risks. See "Risk Factors" beginning on page 17 of this
prospectus.
Underwriting
Proceeds to the
Discounts and
Government of the
Price to Public Commissions
(1)
Republic of South Africa
Per ordinary share . . . . . . . . . . . . . .
R
R
R
Per ADS . . . . . . . . . . . . . . . . . . .
$
$
$
Total
(2)
. . . . . . . . . . . . . . . . . . . .
$
$
$
(1)
Underwriting discounts and commissions do not include fees of up to R that may be payable at the discretion of the Government of
the Republic of South Africa.
(2)
Assumes that all ordinary shares are sold in the form of ADSs.
The Government of the Republic of South Africa has granted the joint global coordinators, on behalf of the underwriters, a
30-day option to purchase up to a maximum of 20,888,693 additional ordinary shares on the same terms and conditions set
forth above solely to cover over-allotments, if any.
Neither the US Securities and Exchange Commission, the South African Registrar of Companies, the JSE nor any
other regulatory body has approved or disapproved of these securities or passed on the adequacy or accuracy of this
prospectus as truthful or complete. Any representation to the contrary is a criminal offense.
This prospectus does not constitute an offer for sale of ordinary shares or ADSs in the Republic of South Africa and
may not be distributed in South Africa.
It is expected that the ordinary shares and ADSs will be delivered on or about March 7, 2003.
Deutsche Bank Securities
JPMorgan
Prospectus dated
, 2003
The information in this prospectus is not complete and may be changed. We and the Government of the Republic of South Africa may not
We and the Go
vernment of the Republic of South
Africa ma
y not sell these securities until the
sell these securities until the registration statement filed with the Securities and Exchange Commission is effective. This prospectus is not an
ve.
This prospectus is not an of
fer to sell t
hese securities and it is not soliciting an
offer to sell these securities and it is not soliciting an offer to buy these securities in any jurisdiction where the offer or sale is not permitted.
uy these securities in an
y jurisdiction where the of
fer or sale is not permitted.
(before expenses)
You should rely only on the information contained in this prospectus. We and the Government of the Republic of
South Africa have not authorized anyone to provide you with different information. We and the Government of the
Republic of South Africa are not offering to sell or soliciting offers to buy the ordinary shares or ADSs in places where
such offers and sales are not permitted by applicable law. You should not assume that the information in this prospectus is
accurate as of any date other than the date on the front of this prospectus.
TABLE OF CONTENTS
Page
Prospectus Summary . . . . . . . . . . . . . . . . . . . . . . . . . . . . . . . . . . . . . . . . . . . . . . . . . . .
1
Risk Factors . . . . . . . . . . . . . . . . . . . . . . . . . . . . . . . . . . . . . . . . . . . . . . . . . . . . . . .
17
Special Note Regarding Forward-Looking Statements . . . . . . . . . . . . . . . . . . . . . . . . . . . . . . . . .
27
Use of Proceeds . . . . . . . . . . . . . . . . . . . . . . . . . . . . . . . . . . . . . . . . . . . . . . . . . . . . .
28
Dividends and Dividend Policy . . . . . . . . . . . . . . . . . . . . . . . . . . . . . . . . . . . . . . . . . . . . .
29
Exchange Rates . . . . . . . . . . . . . . . . . . . . . . . . . . . . . . . . . . . . . . . . . . . . . . . . . . . . .
31
Capitalization . . . . . . . . . . . . . . . . . . . . . . . . . . . . . . . . . . . . . . . . . . . . . . . . . . . . . . .
32
Selected Historical Consolidated Financial and Other Data of the Telkom Group . . . . . . . . . . . . . . . . . . .
33
Management's Discussion and Analysis of Financial Condition and Results of Operations . . . . . . . . . . . . . .
39
The South African Telecommunications Industry . . . . . . . . . . . . . . . . . . . . . . . . . . . . . . . . . . . .
95
Business . . . . . . . . . . . . . . . . . . . . . . . . . . . . . . . . . . . . . . . . . . . . . . . . . . . . . . . . .
98
Legal Proceedings . . . . . . . . . . . . . . . . . . . . . . . . . . . . . . . . . . . . . . . . . . . . . . . . . . . .
130
Regulation and License Requirements . . . . . . . . . . . . . . . . . . . . . . . . . . . . . . . . . . . . . . . . . .
131
Management . . . . . . . . . . . . . . . . . . . . . . . . . . . . . . . . . . . . . . . . . . . . . . . . . . . . . . .
141
Relationship with Major Shareholders and Related Transactions . . . . . . . . . . . . . . . . . . . . . . . . . . . .
156
Relationship with Vodacom and Related Transactions . . . . . . . . . . . . . . . . . . . . . . . . . . . . . . . . .
164
Description of Shares . . . . . . . . . . . . . . . . . . . . . . . . . . . . . . . . . . . . . . . . . . . . . . . . . .
166
Description of American Depositary Receipts . . . . . . . . . . . . . . . . . . . . . . . . . . . . . . . . . . . . . .
180
Nature of the South African Trading Market . . . . . . . . . . . . . . . . . . . . . . . . . . . . . . . . . . . . . .
185
Taxation . . . . . . . . . . . . . . . . . . . . . . . . . . . . . . . . . . . . . . . . . . . . . . . . . . . . . . . . .
186
Exchange Controls . . . . . . . . . . . . . . . . . . . . . . . . . . . . . . . . . . . . . . . . . . . . . . . . . . . .
192
The Global Offering . . . . . . . . . . . . . . . . . . . . . . . . . . . . . . . . . . . . . . . . . . . . . . . . . . .
195
Underwriting . . . . . . . . . . . . . . . . . . . . . . . . . . . . . . . . . . . . . . . . . . . . . . . . . . . . . . .
201
Legal Matters . . . . . . . . . . . . . . . . . . . . . . . . . . . . . . . . . . . . . . . . . . . . . . . . . . . . . . .
204
Experts . . . . . . . . . . . . . . . . . . . . . . . . . . . . . . . . . . . . . . . . . . . . . . . . . . . . . . . . . .
205
Expenses Relating to the Global Offering . . . . . . . . . . . . . . . . . . . . . . . . . . . . . . . . . . . . . . . .
206
Enforcement of Civil Liabilities . . . . . . . . . . . . . . . . . . . . . . . . . . . . . . . . . . . . . . . . . . . . .
207
Where You Can Find More Information . . . . . . . . . . . . . . . . . . . . . . . . . . . . . . . . . . . . . . . . .
208
Documents Available for Inspection . . . . . . . . . . . . . . . . . . . . . . . . . . . . . . . . . . . . . . . . . . .
209
Additional Information . . . . . . . . . . . . . . . . . . . . . . . . . . . . . . . . . . . . . . . . . . . . . . . . . .
210
Index to Financial Statements . . . . . . . . . . . . . . . . . . . . . . . . . . . . . . . . . . . . . . . . . . . . . .
F-1
Republic of South Africa . . . . . . . . . . . . . . . . . . . . . . . . . . . . . . . . . . . . . . . . . . . . . . . . .
A-1
Extracts from Telkom's new memorandum and articles of association . . . . . . . . . . . . . . . . . . . . . . . . .
B-1
-ii-

1
PROSPECTUS SUMMARY
Overview
Telkom is one of the largest companies registered in the Republic of South Africa and we are the largest communications
services provider on the African continent based on operating revenue and assets. We had consolidated operating revenue of
R34.2 billion ($3.2 billion), net profit of R1.2 billion ($116 million) and cash flow from operating activities of R8.2 billion
($775 million) in the year ended March 31, 2002 and we had total assets of R55.2 billion ($5.2 billion) and shareholders'
equity of R16.8 billion ($1.6 billion) as of March 31, 2002. We had consolidated operating revenue of R18.3 billion
($1.7 billion), net profit of R0.6 billion ($61 million) and cash flow from operating activities of R3.5 billion ($328 million)
in the six months ended September 30, 2002 and we had total assets of R54.6 billion ($5.2 billion) and shareholders' equity
of R17.5 billion ($1.7 billion) as of September 30, 2002.
We offer business, residential and payphone customers a wide range of services and products, including:
•fixed-line voice services, including subscriptions and connections services, local, long distance, fixed-to-mobile and
international voice services, interconnection and transit communications services, value-added voice services,
customer premises equipment sales and directory services;
•fixed-line data services, including domestic and international data transmission services, such as leased lines and
packet-based services, managed data networking services and internet access and related information technology
services; and
•mobile communications services, including voice and data services, value-added services and handset sales through
our joint venture, Vodacom, a company incorporated in the Republic of South Africa.
We had the exclusive right to provide public switched telecommunications services, including international voice
services, in South Africa until May 7, 2002. We are currently the only national provider of these services in South Africa,
although a process has been commenced to liberalize the South African communications market, which will introduce
competition in a number of our business areas. In 1997, we embarked on an extensive five year capital investment program
in our fixed-line business. Our fixed-line capital investment for the five years ended March 31, 2002 was R41.7 billion
($4.0 billion), of which R27.9 billion ($2.6 billion) was for network modernization and line roll-out in order to comply with
our license obligations and prepare for competition. As of September 30, 2002, we had 4.9 million telephone access lines in
service and 99.8% of our telephone access lines were connected to digital exchanges.
Vodacom is our mobile communications joint venture with Vodafone Group Plc, a company incorporated in England and
Wales, and VenFin Limited, a company incorporated in the Republic of South Africa. Vodacom is the largest mobile
communications network operator in South Africa with a market share of approximately 59% as of September 30, 2002
based on total reported customers. Vodacom had 7.7 million customers as of September 30, 2002, of which 7.1 million were
in South Africa. Vodacom has investments in mobile communications network operators in Lesotho, Tanzania and the
Democratic Republic of the Congo. Vodacom had consolidated revenue of R16.2 billion ($1.5 billion), net profit of
R2.4 billion ($225 million) and cash flow from operating activities of R3.8 billion ($362 million) in the year ended March 31,
2002 and total assets of R15.4 billion ($1.5 billion) and shareholders' equity of R5.5 billion ($518 million) as of March 31,
2002. Vodacom had consolidated revenue of R9.4 billion ($895 million), net profit of R0.9 billion ($87 million) and cash
flow from operating activities of R1.6 billion ($155 million) in the six months ended September 30, 2002 and total assets of
R17.3 billion ($1.6 billion) and shareholders' equity of R6.3 billion ($601 million) as of September 30, 2002.
We believe that we have a number of competitive strengths that will enable us to increase our profitability and cash flow
and successfully meet competition. Our competitive strengths include our leading market position in the South African fixed-
line communications market, our state-of-the-art, fully digital fixed-line network and the financial, operational and
managerial expertise of our strategic equity investor, Thintana Communications LLC, a Delaware limited liability company,
which is 60% beneficially owned by SBC Communications, Inc., a Delaware corporation, and 40% beneficially owned by
Telekom Malaysia S.D.N. Berhard, a company incorporated in Malaysia. In addition, Vodacom is the leading South African
mobile communications network operator with strong brand recognition, extensive network coverage and distribution
channels, experienced local and international shareholders and management and Vodacom is expanding its operations in
other select sub-Saharan Africa countries.
2
In order to achieve our goals, we intend to pursue the following strategies:
•compete effectively in our core fixed-line markets and grow selected markets;
•continue to reduce operating expenses and enhance capital investment efficiencies in our fixed-line business;
•expand our integrated service offerings through the increased sale of existing data products and the development of
new data and fixed-mobile products;
•continue to invest in our fixed-line employees to foster a highly competitive corporate culture and to enhance skills
retention; and
•capitalize on the growing mobile communications market through Vodacom.
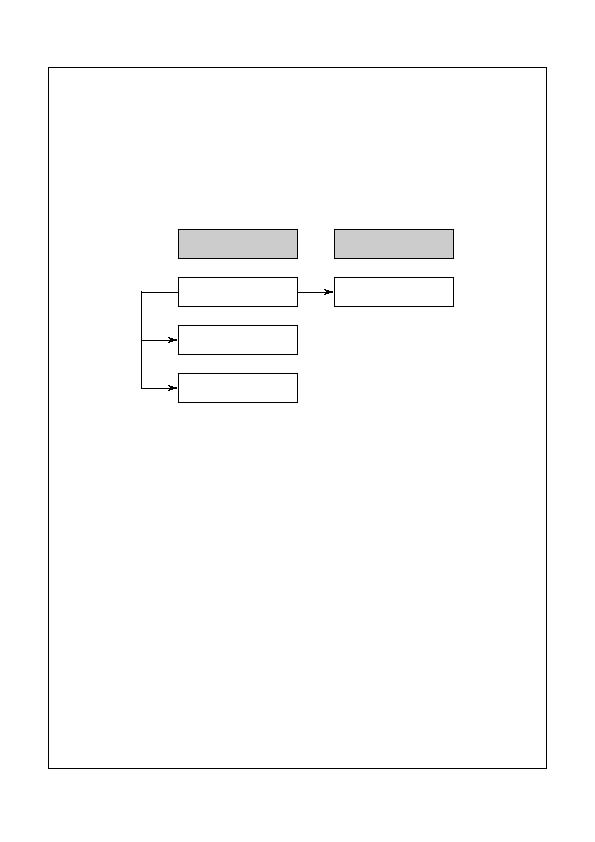
Group operational structure
Our business segments and group operational structure are as follows:
History
Telkom was incorporated on September 30, 1991 as a public limited liability company registered under the South African
Companies Act, 61 of 1973, as amended. On that same date, the Government of the Republic of South Africa transferred the
entire telecommunications enterprise of the then Department of Posts and Telecommunications of the Republic of South
Africa to Telkom. Telkom remained a wholly state-owned enterprise until May 14, 1997, when the Government sold a 30%
equity interest in Telkom to Thintana Communications as part of its policy to liberalize the telecommunications market in
South Africa. On March 30, 2001, the Government sold another 3% equity interest in Telkom from its holdings to Ucingo
Investments (Proprietary) Limited, a company incorporated in the Republic of South Africa comprising a consortium of
black empowerment investors, leaving the Government with 67% of Telkom's issued and outstanding ordinary share capital.
As part of the sale to Thintana Communications, the then Minister of Posts, Telecommunications and Broadcasting of the
Republic of South Africa entered into an agreement with Thintana Communications under which Thintana Communications
undertook significant operational and managerial responsibilities and acquired the ability to exercise effective operational
and managerial control over us until May 2002. Since May 2002, our strategic equity investors no longer exercise effective
operational and managerial control over us, but they continue to provide us with strategic direction as their nominees
continue to occupy key managerial positions and participate in Telkom's operating committee.
Upon completion of the global offering, the Government of the Republic of South Africa will own approximately 42% of
Telkom's issued and outstanding ordinary share capital, or approximately 38% if the underwriters exercise their over-
allotment option in full, and Thintana Communications will own approximately 30% of Telkom's issued and outstanding
ordinary share capital.
Telkom's registration number is 1991/005476/06. Telkom's principal executive offices are located at Telkom Towers
North, 152 Proes Street, Pretoria 0002, Gauteng Province, South Africa. Telkom's telephone number is (27) (12) 321 5808
and its internet address is www.telkom.co.za. Information contained on Telkom's website is not a part of this prospectus.
Unless the context requires otherwise, references to "we," "us," "our" and the "Telkom Group" in this prospectus refer to
Telkom SA Limited and its subsidiaries and its 50% interest in Vodacom, and references to "Telkom" in this prospectus refer
only to Telkom SA Limited. References to "Vodacom" in this prospectus refer to Telkom's 50% owned joint venture,
Vodacom Group (Proprietary) Limited, and its subsidiaries. We do not control Vodacom, the management of which requires
consensus agreement among its shareholders who are party to Vodacom's joint venture agreement.
Fixed-line
Mobile
Telkom SA Limited
Telkom Directory Services
(Proprietary) Limited
Swiftnet (Proprietary)
Limited
Vodacom Group
(Proprietary) Limited
64.9%
100.0%
50.0%

3
THE GLOBAL OFFERING
The Global Offering
A global offering of 139,257,954 ordinary shares by the Government of the Republic
of South Africa in the US and International offerings and the South African retail
offering. 48,740,284 of the ordinary shares offered in the global offering are being
registered under the US Securities Act of 1933 for initial offer and sale in the United
States and for any resales into the United States. Offers and sales of ordinary shares
and ADSs outside the United States, including all ordinary shares and ADSs offered to
South African retail and institutional investors, are being offered pursuant to Regulation
S under the US Securities Act of 1933 and are not covered by the registration statement
filed with the US Securities and Exchange Commission.
US and International Offerings
Made to retail and institutional investors in the United States and to institutional
investors outside of the United States, including institutional investors in the Republic
of South Africa, in the form of ordinary shares or ADSs.
South African Retail Offering
• Made to individuals in possession of a valid South African identity number and who
provide a South African postal address and groups of such individuals, known as
stokvels, at a 20% discount to the initial public offering price, rounded down to the
nearest SA Cent, for up to R5,000 of ordinary shares per individual and up to
R5,000 of ordinary shares per member of a stokvel, subject to a maximum of
R50,000 of ordinary shares per stokvel, in the form of ordinary shares. This offering
is referred to as the Khulisa offer. Ordinary shares purchased in this offering may
not be sold for three months following the date of the listing of the shares on the
JSE. The Government of the Republic of South Africa will also award investors
under this offer one ordinary share for every five ordinary shares purchased and held
in trust until the second anniversary of the JSE listing date.
• Made to individuals in possession of a valid South African identity number and who
provide a South African postal address at a 5% discount to the initial public offering
price, rounded down to the nearest SA Cent, in the form of ordinary shares.
See "The Global Offering" beginning on page 195 of this prospectus.
Offering Price
Between R27.00 and R30.00 per ordinary share. This is equivalent to between $13.30
and $14.80 per ADS at a ratio of 4 ordinary shares per ADS and an exchange rate of
R8.10 per $1.00, rounded down to the nearest 10 US Cents. The initial public offering
price may be outside one or both of the price range indications referred to above.
Ordinary shares sold in the South African retail offering will be at the discounts set out
above. The initial public offering price will be inclusive of uncertificated securities tax.
Over-Allotment Option
The Government of the Republic of South Africa has granted the joint global
co-ordinators, on behalf of the underwriters, a 30-day option to purchase up to a
maximum of 20,888,693 additional ordinary shares on the same terms and conditions
set forth above solely to cover over-allotments, if any.
Ownership of Controlling
Following the completion of this global offering, Telkom's controlling shareholders
Global Offering
will own the following shares:
• The Government will own the one issued and outstanding class A ordinary share and
approximately 42% of Telkom's issued and outstanding ordinary share capital, or
approximately 38% if the underwriters exercise their over-allotment option in full.
• Thintana Communications will own the one issued and outstanding class B ordinary
share and approximately 30% of Telkom's issued and outstanding ordinary share
capital.
See "Description of Shares" beginning on page 166 of this prospectus for a description
of the rights attaching to the class A ordinary share and the class B ordinary share.
In connection with the global offering, the Government of the Republic of South Africa
intends to grant to eligible current and former employees of Telkom options to
purchase up to 11,140,636 of its ordinary shares, representing 2% of Telkom's issued
and outstanding ordinary share capital, through the Diabo Share Trust established for
that purpose at R33.81 per share, which is the price at which Thintana
Communications invested in Telkom in 1997. See "Management Other employee
share ownership arrangements" beginning on page 152 of this prospectus.

4
Information in this prospectus related to the size of the global offering and the
ownership of ordinary shares by the Government of the Republic of South Africa does
not include any sale of ordinary shares through the Diabo Share Trust for the benefit of
former and current employees described above.
Voting Rights
The ordinary shares will generally vote together as a single class with the class A
ordinary share held by the Government of the Republic of South Africa and the class B
ordinary share held by Thintana Communications, except as required by law and as
provided for by Telkom's new memorandum and articles of association. However,
certain actions cannot be taken by Telkom or by its subsidiaries without the
authorization of representatives appointed by the Government of the Republic of South
Africa and Thintana Communications, as significant shareholders, respectively. See
"Management Reserved matters" beginning on page 147 of this prospectus and
"Relationship with Major Shareholders and Related Transactions Shareholder
arrangements New shareholders' agreement" beginning on page 157 of this
prospectus.
American Depositary Shares
Investors outside of South Africa may purchase ordinary shares in the form of ADSs.
Each ADS represents 4 ordinary shares and is evidenced by an American Depositary
Receipt, or ADR.
The ADS depositary is The Bank of New York.
Use of Proceeds
We will not receive any proceeds from the sale of ordinary shares or ADSs in the
global offering.
Listings
The JSE has agreed to list the ordinary shares in the "Telecommunications Services"
sector of the JSE list under the symbol "TKG," subject to the attainment of a spread of
shareholders acceptable to the JSE and the submission of all supporting documents
required by the JSE. The ADSs have been approved for listing on the New York Stock
Exchange under the symbol "TKG," subject to official notice of issuance.
Lock-Up Agreements
Telkom, Thintana Communications and the Government of the Republic of South
Africa have agreed with the underwriters that none of them will sell additional Telkom
ordinary shares for 180 days following the date of the underwriting agreement, subject
to certain exceptions. In addition, the Government has agreed with Thintana
Communications that the Government will not sell its Telkom ordinary shares for a
further 545-day period after the expiration of the lock-up period described above.
Ucingo Investments has agreed with the Government and the underwriters that it will
not sell or dispose of ordinary shares in Telkom for 180 days following the date of the
listing of Telkom's ordinary shares on the JSE Stock Exchange without approval from
the Government and the underwriters, such approval not to be unreasonably withheld.
For a further description of the lock-ups and their exceptions, see "Underwriting"
beginning on page 201 of this prospectus.
Expected Timetable
We expect the timetable for the global offering to be as follows:
January 30, 2003: South African retail offering opens and US and international
offerings commence.
March 4, 2003: Announcement of the initial public offering price and commencement
of conditional trading of the ordinary shares on the JSE and trading of the ADSs on the
New York Stock Exchange.
March 7, 2003: Payment and delivery of ordinary shares and ADSs in the US and
International Offerings.
March 11, 2003: Dispatch of shareholder statements in the South African retail
offering.
Payment and Settlement
Delivery of the ordinary shares and ADSs in the US and International Offerings is
expected to take place against payment therefor in immediately available funds on or
about March 7, 2003. As described in "The Global Offering" beginning on page 195 of
this prospectus, investors in the South African retail offering will have to make
payment prior to this date. The ordinary shares will be delivered in dematerialized or
electronic entry form through the facilities of Share Transactions Totally Electronic
Limited, or STRATE. The ADSs will be delivered in book entry form through the
facilities of The Depository Trust Company.
The identification numbers for the ordinary shares and the ADSs are:
Ordinary shares
ISIN: ZAE000044897
ADSs
CUSIP: 879603108
ISIN and CUSIP are codes which uniquely identify a particular securities issue.
Risk Factors
For a discussion of certain factors that should be considered in evaluating an
investment in Telkom's ordinary shares or ADSs, see "Risk Factors" beginning on
page 17 of this prospectus.
5

6
SUMMARY HISTORICAL CONSOLIDATED FINANCIAL
AND OTHER DATA OF THE TELKOM GROUP
The following table sets forth summary consolidated financial and other data of the Telkom Group as of and for each of
the three years in the period ended March 31, 2002 and as of and for each of the six month periods ended September 30,
2002 and 2001. Information in the following table includes our 50% interest in the results, assets, liabilities and
shareholders' equity of Vodacom, which we proportionately consolidate.
The following summary historical consolidated financial data of the Telkom Group as of and for each of the three years
ended March 31, 2002 was derived from the Telkom Group's historical consolidated financial statements beginning on
page F-48 of this prospectus, which have been audited by Ernst & Young, Registered Accountants and Auditors, Chartered
Accountants (SA). The following summary historical consolidated financial data of the Telkom Group as of September 30,
2002 and for each of the six month periods ended September 30, 2002 and 2001 was derived from the Telkom Group's
unaudited condensed consolidated financial statements beginning on page F-2 of this prospectus, which, in the opinion of
our management, have been prepared on the same basis as the Telkom Group's audited consolidated financial statements
and reflect all adjustments, consisting of normal recurring adjustments, necessary for a fair presentation of the Telkom
Group's results of operations and financial position for such periods. Results for the six month periods ended September 30,
2002 and 2001 are not necessarily indicative of results that may be expected for the entire year.
The consolidated financial statements of the Telkom Group have been prepared in accordance with International
Accounting Standards, or IAS, which differs in certain respects from US Generally Accepted Accounting Principles, or
US GAAP. For a description of the principal differences between IAS and US GAAP relevant to the consolidated financial
statements of the Telkom Group and a reconciliation to US GAAP of net income and profit and shareholders' equity, see
note 41 of the notes to the audited consolidated financial statements of the Telkom Group as of and for the three years
ended March 31, 2002 beginning on page F-97 of this prospectus and note 21 of the notes to the unaudited condensed
consolidated financial statements of the Telkom Group as of September 30, 2002 and for each of the six month periods
ended September 30, 2002 and 2001 beginning on page F-15 of this prospectus.
Headline earnings per share is a disclosure requirement of the JSE and is not a recognized measure under US GAAP.
Headline earnings represents net profit, excluding profit on the disposal of property, plant and equipment; profit on the
disposal of subsidiaries and joint ventures; property, plant and equipment impairment losses; goodwill amortization; and tax
and minority interest impacts. EBITDA represents operating profit before income tax, finance charges, investment income
and depreciation and amortization. We believe that EBITDA provides meaningful additional information to investors since
it is widely accepted by analysts and investors as a basis for comparing a company's underlying operating profitability with
that of other companies as it is not influenced by past capital expenditures or business acquisitions, a company's capital
structure or the relevant tax regime. This is particularly the case in a capital-intensive industry such as communications. It
is also a widely accepted indicator of a company's ability to service its long-term debt and other fixed obligations and to
fund its continued growth. EBITDA is not a US GAAP or IAS measure. You should not construe EBITDA as an alternative
to operating profit or cash flows from operating activities determined in accordance with US GAAP or IAS or as a measure
of liquidity. EBITDA is not defined in the same manner by all companies and may not be comparable to other similarly
titled measures of other companies unless the definition is the same. In addition, because the calculation of EBITDA in the
maintenance covenants contained in our credit facilities is based on accounting policies in use at the time the indebtedness
was incurred, EBITDA for purposes of those covenants is not calculated in the same manner as it is calculated in the
following table.
Fixed access lines are comprised of public switched telecommunications network lines, or PSTN lines, including
integrated services digital network, or ISDN, channels, public and private payphones and internal lines in service. We
calculate fixed-line penetration, or teledensity, based on the total number of telephone lines in service at the end of the
period per 100 persons in the population of South Africa. Population is the estimated South African population at the
mid year in the periods indicated as published by Statistics South Africa, a South African governmental department. We
calculate fixed-line traffic, other than international outgoing mobile traffic and international interconnection traffic, by
dividing traffic revenues for the particular category by the weighted average tariff for such category during the relevant
period. Fixed-line international outgoing mobile traffic and international interconnection traffic are based on the actual
traffic registered through the respective exchanges and reflected in international interconnection invoices. We calculate
revenue per fixed access line by dividing total fixed-line revenue during the period, excluding data and directories and other
revenue, by the average number of fixed lines during the period. We calculate our number of fixed lines per fixed-line
employee on the basis of fixed lines in service at period end divided by the number of employees in our fixed-line segment
at period end, excluding employees from our two subsidiaries, Telkom Directory Services and Swiftnet, which do not
provide public switched telecommunications services.

7
Rand amounts as of and for the year ended March 31, 2002 and as of and for the six months ended September 30, 2002
have been translated into Dollars solely for your convenience at R10.54 per $1.00, the Rand noon buying rate discussed in
"Exchange Rates" on page 31 of this prospectus on September 30, 2002, the date of the Telkom Group's most recent
consolidated balance sheet included in this prospectus. These translations should not be construed as representations that
the Rand amounts could actually be converted into US dollars at these rates or at all.
You should read the following information together with "Risk Factors" beginning on page 17, "Capitalization" on
page 32, "Selected Historical Consolidated Financial and Other Data of the Telkom Group" beginning on page 33,
"Management's Discussion and Analysis of Financial Condition and Results of Operations" beginning on page 39 and the
consolidated financial statements and the notes thereto of the Telkom Group and Vodacom beginning on page F-2 of this
prospectus.

8
THE TELKOM GROUP
Summary Income Statement Data
Six months ended
Year ended March 31,
September 30,
2000
2001
2002
2002
2001
2002
2002
ZAR
ZAR
ZAR
USD
ZAR
ZAR
USD
Amounts in accordance with IAS
(unaudited)
(in millions, except per share amounts)
Operating revenue . . . . . . . . . . . . . . .
27,113
31,352
34,197
3,244
16,523
18,316
1,738
Employee expenses1
. . . . . . . . . . . . .
7,713
6,590
7,166
680
3,590
3,707
352
Payments to other operators . . . . . . . . .
4,241
4,983
5,762
547
2,654
3,105
294
Selling, general and administrative2
. . . . .
5,324
6,971
8,237
781
3,794
3,795
360
Services rendered . . . . . . . . . . . . . .
1,439
1,539
2,194
208
1,091
1,108
105
Operating leases . . . . . . . . . . . . . . .
340
1,292
1,217
115
583
684
65
Depreciation and amortization . . . . . . . .
4,174
5,052
5,408
513
2,643
3,106
295
Operating expenses . . . . . . . . . . . . . .
23,231
26,427
29,984
2,844
14,355
15,505
1,471
Operating profit . . . . . . . . . . . . . . . .
3,882
4,925
4,213
400
2,168
2,811
267
Investment income . . . . . . . . . . . . . .
641
617
490
46
306
152
14
Finance charges . . . . . . . . . . . . . . .
(2,482)
(3,137)
(2,550)
(242)
(1,845)
(1,779)
(169)
Profit before tax . . . . . . . . . . . . . . . .
2,041
2,405
2,153
204
629
1,184
112
Taxation . . . . . . . . . . . . . . . . . . .
(501)
(715)
(873)
(83)
(206)
(456)
(43)
Profit after tax . . . . . . . . . . . . . . . . .
1,540
1,690
1,280
121
423
728
69
Minority interests . . . . . . . . . . . . . .
(13)
(68)
(59)
(5)
(52)
(84)
(8)
Net profit . . . . . . . . . . . . . . . . . . .
1,527
1,622
1,221
116
371
644
61
Number of ordinary shares outstanding
(millions)
Basic . . . . . . . . . . . . . . . . . . . . .
557
557
557
557
557
557
557
Diluted . . . . . . . . . . . . . . . . . . . .
557
557
557
557
557
557
557
Earnings per share (cents)
Basic . . . . . . . . . . . . . . . . . . . . .
274.1
291.2
219.2
20.8
66.6
115.6
11.0
Diluted . . . . . . . . . . . . . . . . . . . .
274.1
291.2
219.2
20.8
66.6
115.6
11.0
Dividends per share (cents) . . . . . . . . . .
59.6
-
-
-
-
-
-
Amounts in accordance with US GAAP
Net revenue . . . . . . . . . . . . . . . . . . .
n/a
26,413
27,947
2,653
13,657
14,605
1,386
Operating income . . . . . . . . . . . . . . . .
n/a
3,716
2,498
237
1,711
2,219
211
Net income . . . . . . . . . . . . . . . . . . .
n/a
1,598
1,317
125
481
757
73
Earnings per share (cents)
Basic . . . . . . . . . . . . . . . . . . . . .
n/a
286.9
236.5
22.4
86.4
135.9
12.9
Diluted . . . . . . . . . . . . . . . . . . . .
n/a
286.9
236.5
22.4
86.4
135.9
12.9

9
Summary Balance Sheet Data
As of
As of March 31,
September 30,
2000
2001
2002
2002
2002
2002
ZAR
ZAR
ZAR
USD
ZAR
USD
Amounts in accordance with IAS
(unaudited)
(in millions, except per share amounts)
Total assets . . . . . . . . . . . . . . . . . . .
47,276
53,537
55,208
5,238
54,581
5,178
Current assets . . . . . . . . . . . . . . . . . .
11,010
12,674
10,968
1,041
11,195
1,062
Cash and cash equivalents . . . . . . . . . .
1,953
1,801
724
69
1,085
103
Other current assets . . . . . . . . . . . . .
9,057
10,873
10,244
972
10,110
959
Non-current assets . . . . . . . . . . . . . . .
36,266
40,863
44,240
4,197
43,386
4,116
Total liabilities3
. . . . . . . . . . . . . . . . .
33,879
38,449
38,243
3,628
36,892
3,500
Current liabilities . . . . . . . . . . . . . . . .
14,371
15,447
12,646
1,200
15,552
1,475
Short-term debt4
. . . . . . . . . . . . . . .
6,046
6,425
2,868
272
7,322
694
Other current liabilities . . . . . . . . . . .
8,325
9,022
9,778
928
8,230
781
Non-current liabilities . . . . . . . . . . . . .
19,508
23,002
25,597
2,428
21,340
2,025
Long-term debt5
. . . . . . . . . . . . . . .
15,928
19,843
22,533
2,138
18,144
1,722
Other non-current liabilities . . . . . . . . .
3,580
3,159
3,064
290
3,196
303
Minority interests . . . . . . . . . . . . . . .
47
116
133
13
214
20
Shareholders' equity . . . . . . . . . . . . . .
13,350
14,972
16,832
1,597
17,475
1,658
Amounts in accordance with US GAAP
Total assets . . . . . . . . . . . . . . . . . . .
n/a
49,524
50,943
4,836
49,458
4,693
Total liabilities . . . . . . . . . . . . . . . . .
n/a
35,626
35,280
3,349
33,076
3,138
Shareholders' equity . . . . . . . . . . . . . .
n/a
13,776
15,535
1,475
16,220
1,539
Six months ended
Year ended March 31,
September 30,
2000
2001
2002
2002
2001
2002
2002
ZAR
ZAR
ZAR
USD
ZAR
ZAR
USD
Summary Cash Flow Data
(unaudited)
Amounts in accordance with IAS
(in millions)
Cash flow from operating activities . . . . . .
4,917
6,165
8,171
775
3,301
3,462
328
Cash flow from/(used in) investing activities . .
(9,107)
(9,964)
(9,294)
(882)
(3,653)
(2,453)
(233)
Cash flow from/(used in) financing activities .
5,051
3,439
110
10
(973)
(1,178)
(112)
Summary Other Data
Headline earnings per share (cents)6
. . . . . .
199.9
341.8
299.3
28.4
70.2
123.9
11.8
Net asset value per share (cents) (at period end)7 2,396.6
2,687.8
3,021.7
286.7
n/a
3,137.2
297.6
Net asset value per share excluding
intangibles (cents) (at period end)7 . . . . . . . 2,312.3
2,613.3
2,926.6
277.7
n/a
3,057.8
290.1
EBITDA8
. . . . . . . . . . . . . . . . . . . .
8,056
9,977
9,621
913
4,811
5,917
562
Total debt (at period end)9
. . . . . . . . . . .
21,974
26,268
25,401
2,410
25,359
25,466
2,416
Capital expenditures excluding intangibles . . .
9,461
9,889
9,004
854
3,641
2,346
223

10
Summary Fixed-Line Statistical Data
Six months ended
Year ended March 31,
September 30,
2000
2001
2002
2001
2002
Fixed access lines (thousands) (at period end)10
. . . . .
5,493
4,962
4,924
4,986
4,895
Postpaid
PSTN11
. . . . . . . . . . . . . . . . . . . . . . . . . . .
4,668
3,930
3,554
3,761
3,407
ISDN channels . . . . . . . . . . . . . . . . . . . . . . .
271
374
467
421
522
Prepaid . . . . . . . . . . . . . . . . . . . . . . . . . . . .
381
480
708
615
780
Payphones12
. . . . . . . . . . . . . . . . . . . . . . . . . .
173
178
195
189
186
Fixed-line penetration rate (%) (at period end) . . . . . . .
12.8
11.4
11.1
11.1
10.8
Revenue per fixed access line (ZAR) . . . . . . . . . . .
3,869
4,297
4,729
2,294
2,456
Total fixed-line traffic (millions of minutes) . . . . . . .
31,127
32,915
32,973
16,620
16,145
Local13
. . . . . . . . . . . . . . . . . . . . . . . . . . .
19,471
20,388
20,252
10,246
9,870
Long distance . . . . . . . . . . . . . . . . . . . . . . .
5,222
4,938
4,895
2,492
2,445
Fixed-to-mobile . . . . . . . . . . . . . . . . . . . . . .
3,659
4,319
4,390
2,221
2,079
International outgoing . . . . . . . . . . . . . . . . . .
344
357
375
184
219
Interconnection . . . . . . . . . . . . . . . . . . . . . .
2,431
2,913
3,061
1,477
1,532
Number of full-time, fixed-line employees (at period end)14
49,128
43,758
39,444
42,110
38,009
Fixed lines per fixed-line employee (at period end)14
. . . .
112
113
125
118
129
1
Employee expenses include retrenchment expenses of R373 million, R132 million and R303 million in the years ended March 31,
2002, 2001 and 2000, respectively, and R169 million and R195 million in the six months ended September 30, 2002 and 2001,
respectively.
2
Selling, general and administrative expenses include asset write-offs of R445 million and R230 million in the years ended March 31,
2002 and 2001, respectively, and provisions for potential damages related to Telkom's arbitration with Telcordia of R375 million in the
year ended March 31, 2002.
3
As of September 30, 2002, R3,621 million of our long-term debt was guaranteed by the Government of the Republic of South Africa.
4
Includes short-term portion of finance leases and utilized credit facilities.
5
Includes long-term portion of finance leases.
6
Headline earnings per share is a disclosure requirement of the JSE and is not a recognized measure under US GAAP. The following is
a reconciliation between net profit and headline earnings in accordance with IAS for the periods indicated:
Six months ended
Year ended March 31,
September 30,
2000
2001
2002
2001
2002
ZAR
ZAR
ZAR
ZAR
ZAR
(unaudited)
(in millions, except per share amounts)
Net profit
1,527
1,622
1,221
371
644
Adjustments:
Profit on disposal of property, plant and equipment . . . . . . . . . . .
(493)
(29)
(22)
(6)
(7)
Profit on disposal of subsidiaries and joint ventures . . . . . . . . . . .
(83)
-
(8)
-
-
Property, plant and equipment impairment losses . . . . . . . . . . . .
-
279
445
-
16
Goodwill amortization . . . . . . . . . . . . . . . . . . . . . . . . . .
18
75
66
26
36
Tax and outside shareholders effects . . . . . . . . . . . . . . . . . . .
145
(43)
(35)
-
1
Headline earnings . . . . . . . . . . . . . . . . . . . . . . . .
1,114
1,904
1,667
391
690
Headline earnings per share (cents) . . . . . . . . . . . . . . . . .
199.9
341.8
299.3
70.2
123.9
7
Net asset value per share including and excluding intangibles are requirements of the JSE. Net asset value per share excluding
intangibles is not a recognized measure under US GAAP. Net asset value per share including intangibles is based on net assets of
R16,832 million, R14,972 million and R13,350 million as of March 31, 2002, 2001 and 2000, respectively, and R17,475 million as of
September 30, 2002. Net asset value per share excluding intangibles is based on net assets of R16,302 million, R14,557 million and
R12,880 million as of March 31, 2002, 2001 and 2000, respectively, and R17,033 million as of September 30, 2002.

11
8
EBITDA can be reconciled to operating profit by subtracting depreciation and amortization from EBITDA as follows:
Six months ended
Year ended March 31,
September 30,
2000
2001
2002
2002
2001
2002
2002
ZAR
ZAR
ZAR
USD
ZAR
ZAR
USD
(unaudited)
(in millions)
EBITDA . . . . . . . . . . . . . . . . . . . . . .
8,056
9,977
9,621
913
4,811
5,917
562
Depreciation and Amortization . . . . . . . . . .
4,174
5,052
5,408
513
2,643
3,106
295
Operating Profit . . . . . . . . . . . . . . . . .
3,882
4,925
4,213
400
2,168
2,811
267
9
Includes short-term and long-term debt, finance lease obligations and utilized credit facilities.
10
Including Telkom internal lines of 162,460, 151,986 and 145,302 as of March 31, 2002, 2001 and 2000, respectively, and 136,459 and
157,942 as of September 30, 2002 and 2001, respectively. Each PSTN line includes one access channel, each basic ISDN line includes
two access channels and each primary ISDN line includes 30 access channels.
11
Excluding ISDN channels.
12
Includes public and private payphones.
13
Local traffic includes internet traffic.
14
Excluding employees of Telkom Directory Services and Swiftnet.

12
SUMMARY HISTORICAL CONSOLIDATED FINANCIAL
AND OTHER DATA OF VODACOM
The following table sets forth summary consolidated financial and other data of Vodacom as of and for each of the three
years in the period ended March 31, 2002 and as of and for each of the six month periods ended September 30, 2002 and
2001. Information in the Vodacom table reflects 100% of Vodacom's results of operations. Information with respect to
Vodacom's other African operations in the Vodacom table reflects 100% of the operations of Vodacom's subsidiaries in
Lesotho and Tanzania and 51% of Vodacom's joint venture in the Democratic Republic of the Congo, unless otherwise
indicated. We proportionately consolidate our 50% interest in Vodacom in the Telkom Group's consolidated financial
statements. Vodacom's direct network operating costs, depreciation, other operating income, employee expenses, marketing
expenses, administrative expenses, amortization of intangible assets and integration costs, disposals of operations and
impairment costs are presented as separate line items in Vodacom's consolidated financial statements, but have been
combined under the heading "operating expenses" in the table set forth below.
The following summary historical consolidated financial data of Vodacom as of and for each of the three years ended
March 31, 2002 have been derived from Vodacom's historical consolidated financial statements beginning on page F-115 of
this prospectus, which were audited by PricewaterhouseCoopers, Inc. and Deloitte & Touche, Registered Accountants and
Auditors, Chartered Accountants (SA). The following summary historical consolidated financial data of Vodacom as of
September 30, 2002 and for each of the six month periods ended September 30, 2002 and 2001 was derived from
Vodacom's unaudited condensed consolidated financial statements beginning on page F-25 of this prospectus, which, in the
opinion of Vodacom's management, have been prepared on the same basis as Vodacom's audited consolidated financial
statements and reflect all adjustments, consisting of normal recurring adjustments, necessary for a fair presentation of
Vodacom's results of operations and financial position for such periods. Results for the six month periods ended
September 30, 2002 and 2001 are not necessarily indicative of results that may be expected for the entire year.
The consolidated financial statements of Vodacom have been prepared in accordance with IAS, which differs in certain
respects from US GAAP. For a description of the principal differences between IAS and US GAAP relevant to the financial
statements of Vodacom and a reconciliation to US GAAP of net income and shareholders' equity, see note 45 of the notes
to the audited consolidated financial statements of Vodacom as of and for the three years ended March 31, 2002 beginning
on page F-176 of this prospectus and note 20 of the notes to the unaudited condensed consolidated financial statements of
Vodacom as of September 30, 2002 and for each of the six month periods ended September 30, 2002 and 2001 beginning
on page F-40 of this prospectus.
EBITDA represents operating profit before income tax, finance charges, investment income and depreciation and
amortization. We believe that EBITDA provides meaningful additional information to investors since it is widely accepted
by analysts and investors as a basis for comparing a company's underlying operating profitability with that of other
companies as it is not influenced by past capital expenditures or business acquisitions, a company's capital structure or the
relevant tax regime. This is particularly the case in a capital-intensive industry such as communications. It is also a widely
accepted indicator of a company's ability to service its long-term debt and other fixed obligations and to fund its continued
growth. EBITDA is not a US GAAP or IAS measure. You should not construe EBITDA as an alternative to operating profit
or cash flows from operating activities determined in accordance with US GAAP or IAS or as a measure of liquidity.
EBITDA is not defined in the same manner by all companies and may not be comparable to other similarly titled measures
of other companies unless the definition is the same.
Vodacom's customer totals are based on the total number of customers registered on Vodacom's network, which have
not been disconnected, including inactive customers, as of the end of the period indicated. See "Business - Mobile
communications - South Africa - Customers" beginning on page 122 of this prospectus for a discussion of Vodacom's
procedures with respect to disconnections and inactive customers. Vodacom's churn is calculated by dividing the average
monthly number of disconnections during the period by the average monthly total reported customer base during the
period. Vodacom calculates penetration, or teledensity, based on the total number of customers at the end of the period per
100 persons in the population of South Africa. Population is the estimated South African population at the mid-year in the
periods indicated as published by Statistics South Africa, a South African governmental department. Vodacom's traffic
comprises total traffic registered on Vodacom's network, including bundled minutes, outgoing international roaming calls
and calls to free services, but excluding national and incoming international roaming calls. Vodacom's average monthly
revenue per customer, or ARPU, is calculated by dividing the average monthly revenue during the period by the average
monthly total reported customer base during the period. ARPU excludes revenue from equipment sales, other sales and
services and revenue from national and international users roaming on Vodacom's networks. Vodacom's average monthly
minutes of use per customer, or MOU, is calculated by dividing the average monthly minutes during the period by the

average monthly total reported customer base during the period. MOU excludes calls to free services, bundled minutes and
data minutes. Cumulative network capital expenditure per customer is the cumulative network capital expenditure since the
launch of Vodacom's South African network divided by Vodacom's average customers in South Africa for the period.
Rand amounts as of and for the year ended March 31, 2002 and as of and for the six months ended September 30, 2002
have been translated into Dollars solely for your convenience at R10.54 per $1.00, the Rand noon buying rate discussed in
"Exchange Rates" on page 31 of this prospectus on September 30, 2002, the date of Vodacom's most recent balance sheet
included in this prospectus. These translations should not be construed as representations that the Rand amounts could
actually be converted into US dollars at these rates or at all.
You should read the following information together with "Risk Factors" beginning on page 17, "Selected Historical
Consolidated Financial and Other Data of the Telkom Group" beginning on page 33, "Management's Discussion and
Analysis of Financial Condition and Results of Operations" beginning on page 39 and the consolidated financial statements
and the notes thereto of the Telkom Group and Vodacom beginning on page F-2 of this prospectus.
13

14
VODACOM
Summary Income Statement Data
Six months ended
Year ended March 31,
September 30,
2000
2001
2002
2002
2001
2002
2002
ZAR
ZAR
ZAR
USD
ZAR
ZAR
USD
Amounts in accordance with IAS
(unaudited)
(in millions, except per share amounts)
Revenue . . . . . . . . . . . . . . . . . . . .
9,572
13,276
16,151
1,532
7,522
9,441
895
Operating expenses . . . . . . . . . . . . .
7,208
10,723
12,530
1,189
5,947
7,603
721
Operating profit . . . . . . . . . . . . . . .
2,364
2,553
3,621
343
1,575
1,838
174
Investment income . . . . . . . . . . . . .
32
25
32
3
17
16
2
Finance charges . . . . . . . . . . . . . . .
(567)
(504)
(60)
(5)
(123)
(315)
(30)
Profit before tax . . . . . . . . . . . . . . .
1,829
2,074
3,593
341
1,469
1,539
146
Taxation . . . . . . . . . . . . . . . . . . .
(514)
(765)
(1,190)
(113)
(445)
(525)
(50)
Profit after tax . . . . . . . . . . . . . . . .
1,315
1,309
2,403
228
1,024
1,014
96
Minority interests . . . . . . . . . . . . . .
-
9
(30)
(3)
(16)
(96)
(9)
Net profit . . . . . . . . . . . . . . . . . . .
1,315
1,318
2,373
225
1,008
918
87
Amounts in accordance with US GAAP
Net profit for the year . . . . . . . . . . . . .
n/a
1,249
2,120
201
932
839
80
Summary Balance Sheet Data
As of
As of March 31,
September 30,
2000
2001
2002
2002
2002
2002
ZAR
ZAR
ZAR
USD
ZAR
USD
Amounts in accordance with IAS
(unaudited)
(in millions)
Total assets . . . . . . . . . . . . . . . . . . . . . . .
9,864
12,342
15,359
1,457
17,319
1,643
Current assets . . . . . . . . . . . . . . . . . . . . . .
2,788
3,470
4,145
393
5,451
517
Cash and cash equivalents . . . . . . . . . . . . . .
936
798
719
68
1,564
148
Other current assets . . . . . . . . . . . . . . . . . .
1,852
2,672
3,426
325
3,887
369
Non-current assets . . . . . . . . . . . . . . . . . . . .
7,076
8,872
11,214
1,064
11,868
1,126
Total liabilities . . . . . . . . . . . . . . . . . . . . .
7,195
8,847
9,884
938
10,880
1,032
Current liabilities . . . . . . . . . . . . . . . . . . . .
5,883
7,267
7,990
758
8,080
766
Short-term debt1
. . . . . . . . . . . . . . . . . . .
3,370
2,547
3,517
334
4,207
399
Other current liabilities . . . . . . . . . . . . . . . .
2,513
4,720
4,473
424
3,873
367
Non-current liabilities . . . . . . . . . . . . . . . . . .
1,312
1,580
1,894
180
2,800
266
Long-term debt2
. . . . . . . . . . . . . . . . . . .
817
896
780
74
1,592
151
Other non-current liabilities . . . . . . . . . . . . .
495
684
1,114
106
1,208
115
Minority interests . . . . . . . . . . . . . . . . . . .
(2)
(11)
11
1
102
10
Shareholders' equity . . . . . . . . . . . . . . . . . .
2,671
3,506
5,464
518
6,337
601
Amounts in accordance with US GAAP
Shareholders' equity . . . . . . . . . . . . . . . . . .
n/a
3,195
4,874
462
5,654
536

15
Six months ended
Year ended March 31,
September 30,
2000
2001
2002
2002
2001
2002
2002
ZAR
ZAR
ZAR
USD
ZAR
ZAR
USD
Summary Cash Flow Data
Amounts in accordance with IAS
(unaudited)
(in millions)
Cash flow from operating activities . . . . .
2,341
3,610
3,815
362
n/a
1,637
155
Cash flow from/(used in) investing activities
(3,338)
(2,853)
(4,543)
(431)
n/a
(2,415)
(229)
Cash flow from/(used in) financing activities
646
(1,038)
571
54
n/a
494
47
Summary Other Data
EBITDA
3
. . . . . . . . . . . . . . . . . .
3,462
4,189
5,691
540
n/a
3,027
287
Total debt (at period end)
4
. . . . . . . . . .
4,187
3,443
4,297
408
n/a
5,799
550
Capital expenditures including intangibles
2,032
3,184
4,279
406
n/a
1,718
163
South Africa . . . . . . . . . . . . . . . .
2,011
2,830
3,291
312
n/a
1,121
106
Other African countries . . . . . . . . . .
21
354
988
94
n/a
597
57
Summary Statistical Data
Six months ended
Year ended March 31,
September 30,
2000
2001
2002
2001
2002
South Africa
Total mobile customers (thousands) (at period end)
5
. .
3,069
5,108
6,557
5,657
7,130
Contract . . . . . . . . . . . . . . . . . . . . . . . . . .
963
1,037
1,090
1,062
1,139
Prepaid . . . . . . . . . . . . . . . . . . . . . . . . . . .
2,082
4,046
5,439
4,569
5,961
Community services telephones . . . . . . . . . . . . . .
24
25
28
26
30
Churn (%) . . . . . . . . . . . . . . . . . . . . . . . . . .
31.8
23.3
27.2
31.3
30.7
Contract . . . . . . . . . . . . . . . . . . . . . . . . . .
17.4
18.7
14.5
16.6
13.2
Prepaid . . . . . . . . . . . . . . . . . . . . . . . . . . .
40.5
24.8
30.1
34.8
34.3
Mobile market share (%) (at period end) . . . . . . . . . .
59
61
61
61
59
Mobile penetration (%) (at period end) . . . . . . . . . . .
12.1
19.1
24.2
20.6
26.6
Total mobile traffic (millions of minutes) . . . . . . . . .
5,669
7,472
8,881
4,229
5,007
Outgoing . . . . . . . . . . . . . . . . . . . . . . . . . .
2,885
4,052
4,967
2,307
2,994
Incoming . . . . . . . . . . . . . . . . . . . . . . . . . .
2,784
3,420
3,914
1,922
2,013
Average monthly revenue per customer (ZAR)
6
. . . . .
266
208
182
190
181
Contract
6
. . . . . . . . . . . . . . . . . . . . . . . . . .
481
493
560
551
612
Prepaid . . . . . . . . . . . . . . . . . . . . . . . . . . .
132
98
93
94
88
Community services . . . . . . . . . . . . . . . . . . . .
n/a
1,453
1,719
1,710
1,766
Average monthly minutes of use per customer . . . . . .
158
137
111
114
102
Contract . . . . . . . . . . . . . . . . . . . . . . . . . .
274
270
264
265
269
Prepaid . . . . . . . . . . . . . . . . . . . . . . . . . . .
90
70
58
59
53
Community services . . . . . . . . . . . . . . . . . . . .
1,593
2,859
3,354
3,246
3,215
Cumulative network capital expenditure per customer (ZAR)
(at period end) . . . . . . . . . . . . . . . . . . . . . . . .
2,543
2,053
1,991
2,048
1,980
Number of mobile employees (at period end)
1
. . . . . .
4,048
4,102
3,984
4,384
3,845
Number of mobile customers per mobile employee
(at period end)
7
. . . . . . . . . . . . . . . . . . . . . . . .
758
1,245
1,646
1,290
1,854

Summary Statistical Data
Six months ended
Year ended March 31,
September 30,
2000
2001
2002
2001
2002
Other African countries
Number of mobile customers (thousands) (at period end)
12
104
306
164
540
Average monthly revenue per customer
Lesotho (ZAR) . . . . . . . . . . . . . . . . . . . . . .
n/a
n/a
144
n/a
87
Tanzania (USD) . . . . . . . . . . . . . . . . . . . . . .
n/a
31
27
n/a
23
Democratic Republic of the Congo (USD) . . . . . . . .
n/a
n/a
n/a
n/a
22
Number of mobile employees (at period end)7
. . . . . .
43
170
369
201
397
Number of customers per mobile employee (at period end)7
279
612
830
816
1,360
1
Includes short-term portion of finance leases and utilized credit facilities.
2
Includes long-term portion of finance leases.
3
EBITDA includes a net gain of R56 million, a net loss of R213 million and a net gain of R129 million in the 2002, 2001 and 2000
financial years, respectively, and a net gain of R25.5 million and nil in the six months ended September 30, 2001 and 2002,
respectively, for integration costs, disposals of operations and impairments.
4
Includes interest-bearing debt, shareholder loans and bank overdrafts.
5
13.9% of Vodacom's total reported customers, 15.9% of its prepaid customers and 3.8% of its contract customers in South Africa were
inactive as of March 31, 2002. 15.1% of Vodacom's total reported customers, 17.0% of its prepaid customers and 4.9% of its contract
customers in South Africa were inactive as of September 30, 2002.
6
Value added service revenue from previously partially owned service providers is included in contract and total average monthly
revenue per customer from October 1, 2001, at which time Vodacom consolidated these previously partially owned service providers.
7
Includes 423, 553 and 96 total temporary employees as of March 31, 2002, 2001 and 2000, respectively, and 140 and 335 total
temporary employees as of September 30, 2002 and 2001, respectively.
END OF PROSPECTUS SUMMARY
16
RISK FACTORS
You should carefully consider the risks described below and the other information in this prospectus before making a
decision to purchase the ordinary shares or ADSs, including the consolidated financial statements of the Telkom Group and
Vodacom and the related notes thereto beginning on page F-2 of this prospectus.
Risks Related to our Business
Increased competition in the South African telecommunications market may result in a reduction in overall average
tariffs and market share in our fixed-line business, which could cause our growth rates, operating revenue and net profit
to decline.
We had the exclusive right to provide public switched telecommunications services, including international telephone
services, in the Republic of South Africa until May 7, 2002, but for a number of years have competed with mobile
operators and value-added network operators in connection with the provision of other services. The Independent
Communications Authority of South Africa, or ICASA, issued an international carrier of carriers license and a multimedia
license to Sentech Limited, a company incorporated in the Republic of South Africa, in May 2002. In addition, a process
has commenced to issue an additional license to provide public switched telecommunications services to a second national
operator and to issue additional licenses to small business operators to provide telecommunications services in areas with a
teledensity of less than 5%. ICASA has indicated that it expects to issue these licenses in 2003 or early 2004. Further
competition may arise as a result of an assessment by the Minister of Communications of the feasibility of issuing
additional licenses from May 2005. As competition intensifies, the main challenges our fixed-line business faces are
continuing to improve customer loyalty and maintaining its leadership in the South African communications market. As a
result of increasing competition, we anticipate a reduction in overall average tariffs and market share in our fixed-line
business, which could cause our growth rates, operating revenue and net profit to decline.
Competition from the three existing mobile communications network operators in South Africa has resulted in
significant customer migration and substitution from fixed-line to mobile services. If this migration and substitution
continue, our growth rates, operating revenue and net profit could decline.
Telkom competes with the three existing mobile communications network operators, Vodacom, Mobile Telephone
Network Holdings (Proprietary) Limited, a company incorporated in the Republic of South Africa, or MTN, and Cell C
(Proprietary) Limited, a company incorporated in the Republic of South Africa, or Cell C, for customers. Telkom also
competes with mobile operators who use least cost routing technology that enables fixed-to-mobile calls from corporate
private branch exchanges to bypass our fixed-line network by being transferred directly to mobile networks. Telkom has
experienced significant customer migration from fixed-line services to mobile services, as well as substitution of calls
placed using mobile services rather than our fixed-line service, in recent years with the increase in mobile penetration in
South Africa. If this migration continues, our growth rates, operating revenue and net profit could decline.
Increased competition in the mobile communications market in South Africa may result in a reduction of Vodacom's
average tariffs and Vodacom's market share and increased customer acquisition and retention costs, which could cause
Vodacom's growth rates, revenue and net profit to decline.
There are currently three operators in the South African mobile communications market, Vodacom, MTN and Cell C.
At September 30, 2002, Vodacom held approximately 59%, MTN held approximately 36% and Cell C held approximately
5% of the South African mobile communications market, based on total reported customers. Cell C only commenced
operations in November 2001. In addition, ICASA has indicated that it intends to license global mobile personal
communications services in 2003 or later and to conduct a feasibility study on the licensing of a fourth mobile operator in
2004 or later. This increased competition, together with the further liberalization of the South African telecommunications
industry, may result in a reduction in Vodacom's overall average tariffs and market share and increase its customer
acquisition and retention costs, which could cause Vodacom's growth rates, revenue and net profit to decline.
If we are not able to implement a reduction in our existing fixed-line employees and employee expenses or if significant
labor unrest results from the implementation of our fixed-line employee reduction program, our ability to compete may
be harmed and our net profit could decline.
The number of our fixed-line employees, excluding Telkom Directory Services (Proprietary) Limited and Swiftnet
(Proprietary) Limited, both of which are companies incorporated in the Republic of South Africa, declined by
approximately 18,800 positions from March 31, 1997 through September 30, 2002. We intend to continue to reduce our
fixed-line headcount over the next five years. Our ability to implement employee reductions is limited by South African
17
18
labor laws. In addition, legal requirements make such reductions costly. We also face pressure from labor unions in South
Africa who oppose employee reductions and may encounter resistance from the Government of the Republic of South
Africa if the reductions conflict with the Government's social objectives at the time. If we are unable to reduce the number
of our fixed-line employees and employee expenses or if significant labor unrest results from implementation of our fixed-
line employee reduction program, our ability to compete may be harmed and our net profit could decline.
If customer non-payments in our fixed-line business continue to be high or increase, our net profit could decline.
We have experienced a significant number of customer non-payments in our fixed-line business, particularly in
impoverished areas where we were required to expand our network pursuant to our license obligations. In response to these
non-payments, we disconnected a substantial number of telephone lines beginning in our 2001 financial year and incurred
bad debt expense of R965 million, R671 million and R560 million in our fixed-line segment during the years ended March 31,
2002, 2001 and 2000, respectively, and R75 million and R510 million in the six months ended September 30, 2002 and
2001, respectively. To control our bad debts, we have implemented a more rapid disconnection policy for non-payments,
continued and improved credit vetting and controls, instituted a better collection program and continued to promote our
prepaid fixed-line services. If these measures prove ineffective and customer non-payments continue to be high or increase
in the future and if we are unable to increase our tariffs to cover the cost of bad debts, our net profit could decline.
The value of Vodacom's investments outside of South Africa and Vodacom's revenue and net profit may decline as a
result of political, economic, regulatory and legal developments in the countries where Vodacom has invested.
Vodacom currently has investments in mobile communications network operators in Lesotho, Tanzania and the
Democratic Republic of the Congo. These countries have political, economic, regulatory and legal systems that are still in
the process of transformation and are less developed than those in the Republic of South Africa. Political or economic
upheaval or changes in laws and regulations or in their application may harm the operations of the companies in which
Vodacom invests and impair the value of these investments. The regulatory environments in these countries often lack
clarity in a number of areas and are subject to varying interpretations. These economies have a history of extreme poverty
and are susceptible to civil strife, political conflict and political mismanagement, all of which could cause the value of
Vodacom's investments in these countries and Vodacom's revenue and net profit to decline.
Most of the fixed-line operators in these countries are still state controlled. As a result, the mobile communications
network operators in which Vodacom has invested may encounter difficulties in negotiating commercially acceptable
interconnection agreements and collecting amounts due under interconnection agreements. There are foreign exchange
control restrictions in South Africa, which may restrict Vodacom's ability to fund its investments in these countries, and
there are foreign exchange controls in a majority of these countries, which may restrict Vodacom's ability to extract value
from these investments. In addition, a number of jurisdictions in which Vodacom invests have imposed price controls,
particularly for interconnection, which could reduce Vodacom's net profit and cause the value of Vodacom's investments in
these other African countries to decline.
If our strategic equity investors do not continue to provide us strategic services or if we lose a number of our key
employees provided by our strategic equity investors, our business operations could be disrupted and our ability to
compete could be harmed.
We have benefited from the experience and knowledge of our strategic equity investors through their participation on our
operating committee and their employees who serve in key management positions. Pursuant to a strategic services
agreement with our strategic equity investors, our strategic equity investors provided us with 30 of our employees as of
September 30, 2002, including our chief operating officer, chief financial officer and chief strategic officer, two of whom
participate on Telkom's operating committee. If our strategic equity investors do not continue to provide these services to
us or if our key personnel who are employees of our strategic equity investors terminate their employment with us, our
business operations could be disrupted and our ability to compete could be harmed.
If we lose our key personnel or if we are unable to hire and retain highly qualified employees, our business operations
could be disrupted and our ability to compete could be harmed.
Our success depends in large part on our ability to hire and retain highly qualified employees who possess the requisite
qualifications and technical skills. Telkom does not have formal employment agreements with a majority of its executive
officers, any of whom may terminate their employment with us at any time. The loss of key personnel could disrupt our
business operations if we are unable to replace them with similarly qualified individuals. We expect that competition for
employees in the South African communications industry will increase as new competitors enter the market. If we lose a
number of our key employees to our competitors, our business operations could be disrupted and our ability to compete
could be harmed.
19
We do not have the right to appoint a majority of Vodacom's directors or members of its directing committee and the
Vodacom joint venture agreement contains approval rights that may limit our flexibility and ability to implement our
preferred strategies.
Although we are a 50% shareholder in Vodacom, our flexibility and ability to implement our preferred strategies may be
limited by the fact that we do not have the right to appoint a majority of Vodacom's directors or members of its directing
committee. In addition, under our memorandum and articles of association, Thintana Communications and the Government
are entitled to nominate the directors we appoint to the Vodacom board. The Vodacom joint venture agreement, which
governs the relationship between Telkom and the other shareholders of Vodacom, requires each of Vodacom's shareholders
who owns 10% or more of Vodacom's shares to approve certain material transactions. As a result of these factors, we may
not be able to impose strategies on Vodacom which we believe to be beneficial to us without the approval of Vodacom's
other shareholders.
If Vodacom does not continue to make distributions to Telkom, Telkom may not be able to fund its operating
expenditures and service its debt and other financial obligations. In addition, Telkom may not have sufficient funds to
pay dividends and could be required to lower or defer capital expenditures, which could cause the trading prices of
Telkom's ordinary shares and ADSs to decline.
Telkom receives dividends and other distributions from Vodacom which Telkom uses to fund its capital and operating
expenditures and service its debt and other financial obligations. Vodacom is legally distinct from Telkom and has no
obligation to make funds available to Telkom. Vodacom's ability to pay dividends and repay intercompany loans to Telkom
may be restricted by, among other things, its operations and the availability of funds and the terms of credit and debt
arrangements entered into by it, as well as statutory and other legal restrictions. In addition, Vodacom's ability to make
distributions to Telkom and its other shareholders requires the approval of Vodacom's other shareholders who own 10% or
more of Vodacom's shares. To the extent that Vodacom is unable to, or otherwise does not, make distributions to Telkom in
the future, Telkom may not be able to fund its operating expenditures and service its debt and other financial obligations. In
addition, Telkom may not have sufficient funds to pay dividends and could be required to lower or defer capital
expenditures, which could cause the trading prices of Telkom's ordinary shares and ADSs to decline.
We have a significant amount of indebtedness and negative working capital, which may impair our operating and
financial flexibility and could make it difficult for us to borrow additional funds for working capital, capital expenditures
or other general corporate purposes.
We have a significant amount of indebtedness, the majority of which is related to our fixed-line business, and negative
working capital. As of September 30, 2002, we had R25.5 billion of total consolidated indebtedness, before cash and cash
equivalents. We need to dedicate a substantial portion of our operating cash flows to service debt, which reduces the funds
available for working capital, capital expenditures and other general corporate purposes. In addition, some of the
instruments governing our indebtedness require us to maintain specified financial ratios and impose operating restrictions
on us. Our failure to comply with these restrictions could lead to a default under the terms of the relevant indebtedness even
though we are able to meet our debt service obligations. Some of our debt contains cross-default provisions
. Moreover, our
high level
of debt and the restrictive covenants contained in our debt agreements could limit our ability to borrow additional
funds for
working capital, capital expenditures or other general corporate purposes.
If we continue to experience high rates of theft, vandalism, network fraud and lost revenue due to non-licensed
operators in our fixed-line business, our fixed-line fault rates could increase and our operating revenue and net profit
could decline.
We have experienced significant cable theft, theft of solar panels and wireless communications equipment, vandalism of
payphones and network fraud, such as non-licensed calls, in our fixed-line business. Theft and vandalism have caused our
fixed-line fault rates to increase, and the repair time on our network and the network downtime associated with such faults
have resulted in lost operating revenue and increased costs. We have also lost operating revenue to non-licensed operators
providing telecommunications services in South Africa. We estimate that we lost revenue of R174 million in the year ended
March 31, 2002 from network fraud. If we are unable to minimize theft, vandalism and network fraud, or if we continue to
lose operating revenue to non-licensed operators in our fixed-line business, our fixed-line fault rates could increase and our
operating revenue and net profit could decline.
If we are not able to improve our management information and other systems, our ability to compete may be harmed.
Our information systems do not provide management on a real time basis certain operating data and financial
information and have made our budgeting and planning processes difficult. We have recently implemented improved
systems and processes, but they became operational only after April 1, 2002. It may take up to twelve months for these new
systems to be fully tested in an operating environment. In addition, our billing and information systems are not integrated
and therefore we cannot provide a single bill for customers with multiple locations and the bill post-processing systems
20
fixed-line network. To address these problems, we intend to reduce the number of current billing systems in place and to
introduce appropriate monitoring systems capable of deriving better operational, financial and accounting information.
To the extent we are not able to improve and fully implement these systems, our ability to effectively compete in the
increasingly liberalized South African communications market may be harmed. In addition, the information systems in
Vodacom's other African operations in the Democratic Republic of the Congo are new and not fully tested and are not
capable of providing management on a real time basis reliable operating data and financial information.
Delays in the development and supply of communications equipment may hinder the deployment of new technologies
and services and cause our growth rates and net profit to decline.
Our operations, including the operations of Vodacom, depend in part upon the successful and timely supply of evolving
fixed and mobile communications technologies, such as general packet radio services, or GPRS. We use technologies from
a number of vendors and make significant capital expenditures in connection with communications technologies. If
technologies are not developed by our suppliers on time or do not perform according to expectations or achieve commercial
acceptance, we may be required to delay service introductions and make additional capital expenditures and we could be
required to write-off investments in failed technology, which could cause our growth rates and net profit to decline.
Continuing rapid changes in technologies could increase competition or require us to make substantial additional
investments, which could disrupt our business operations and reduce our net profit.
The services we offer are technology-intensive. The development of new technologies, such as fixed-wireless services
and packet radio services, could increase competition and make our technology obsolete. We may have to make substantial
additional investments in new technologies to remain competitive. New technologies we choose may not prove to be
commercially successful. As a result, we could lose customers, fail to attract new customers or incur substantial costs in
order to maintain our customer bases, which could disrupt our business operations and reduce our net profit.
Actual or perceived health risks relating to mobile handsets or transmission masts and any related publicity or litigation
could make it difficult to find attractive sites for base stations and reduce Vodacom's growth rates, customer base,
average usage per customer and net profit.
Concern has been expressed that the electromagnetic signals from mobile handsets and base stations, which serve as
antennae for transmitting radio signals, may pose health risks. Actual or perceived risks of mobile handsets or base stations
and related publicity or litigation, could make it difficult to find attractive sites for base stations and reduce Vodacom's
growth rates, customer base, average usage per customer and net profit.
Risks Related to Telkom's Ownership by the Government of South Africa and Thintana Communications
Telkom's major shareholders will continue to exercise control over our strategic direction and major corporate actions.
The Government of the Republic of South Africa and Thintana Communications, the investment vehicle of our strategic
equity investors, will together continue to hold a majority of Telkom's ordinary shares after the global offering. Through the
ownership and voting arrangements provided for in a new shareholders' agreement and Telkom's new memorandum and
articles of association, the Government and Thintana Communications will be able to exert considerable influence over
Telkom's corporate governance, strategic direction and major corporate actions and to appoint directors of Telkom's
subsidiaries and joint venture, Vodacom.
In the new shareholders' agreement, the Government and Thintana Communications have, among other things, agreed to
vote together on specific matters. See "Relationship with Major Shareholders and Related Transactions" beginning on
page 156 of this prospectus for a description of the Government's and Thintana Communications' rights under the new
shareholders' agreement. In addition, Telkom's new memorandum and articles of association require Telkom to obtain
written consent from the Government before taking actions that would limit Telkom's ability to provide public switched
telecommunication services. Telkom's new memorandum and articles of association also require the approval of directors
appointed by the Government and Thintana Communications in order for Telkom or any of its subsidiaries, including
Vodacom, to enter into major corporate actions and transactions, including amendments to Telkom's management structure
and the powers of Telkom's operating committee, the approval of Telkom's dividend policy and payment of dividends,
increases in Telkom's indebtedness beyond certain limits and changes of control. As a result, without the approval and
participation of the Government and Thintana Communications, Telkom will not be able to consummate transactions
involving an actual or potential change of control, including transactions in which you might otherwise receive a premium
for your ordinary shares or ADSs over market prices. Because the Government and Thintana Communications will continue
to exercise control over Telkom after the global offering, investors purchasing ordinary shares and ADSs in the global
offering will lack meaningful power to approve decisions of Telkom's board of directors or to influence our strategic
direction and major corporate actions.
21
The Government of the Republic of South Africa may use its position as shareholder, policymaker for, and customer of,
the telecommunications industry in a manner that may be favorable to our competitors and unfavorable to us.
Following the global offering, the Government of the Republic of South Africa will own approximately 42% of
Telkom's issued and outstanding ordinary shares, or approximately 38% if the underwriters exercise their over-allotment
option in full. The Government also holds significant equity stakes in other industry participants, including Sentech
Limited, and is expected to have an indirect 30% equity interest in the second national operator. To further its policy of
liberalization of the telecommunications industry, the Government may adopt and implement policies and exercise its right
to approve regulations that benefit our competitors but are not beneficial to us. In addition, to further other political or
social objectives, the Government may act in a manner that may be detrimental to our business but advantageous to our
competitors.
The Government of the Republic of South Africa is also one of our customers. The Government accounted for
approximately 9% of our fixed-line operating revenue, excluding directories and other operating revenue, in the six months
ended September 30, 2002. The Government could transfer some or all of its business to the second national operator or
other operators when they commence operations. Legislation has been enacted to centralize all procurement by the
Government through one agency. If the Government transfers some or all of its business to other operators, our operating
revenue and net profit would decline.
Risks Related to Regulatory and Legal Matters
The regulatory environment for the telecommunications industry in South Africa is evolving and final regulations
addressing a number of significant matters have not yet been issued. The interpretation of existing regulations, or the
adoption of new policies or regulations that are unfavorable to us, could disrupt our business operations and could
cause our net profit and the trading prices of Telkom's ordinary shares and ADSs to decline.
The provision of telecommunications services in the Republic of South Africa is subject to extensive regulation. The
regulatory environment is developing, lacks clarity in a number of areas and is subject to interpretation, review and
amendment as the telecommunications industry is further developed and liberalized. In addition, the regulatory process
entails a public comment process, which, in light of the politicized issue of privatization of industries such as
telecommunications in South Africa, makes the outcome of the regulations uncertain and may cause delays in the
regulatory process. A number of significant matters have not been addressed or clarified, including:
•the terms and conditions of the second national operator's license;
• whether and the extent to which our licenses may be amended as a result of the licensing of the second national
operator;
• whether any additional obligations may be imposed on us at that time or thereafter;
• the extent to which our fixed-line business will be required to make its facilities or access lines available to the
second national operator to provide services, other than public switched telecommunications services, during the first
two years of its license and beyond;
• the extent to which our fixed-line business may be required to unbundle its local loop after two years; and
• the extent to which we will be required to contribute to the universal service fund.
In addition, ICASA was only established in 2000. Upon its establishment, ICASA inherited a legacy of regulatory
problems from its predecessors. It has been reported that ICASA may currently lack adequate resources to effectively fulfill
its regulatory and licensing functions and to deal with regulatory challenges that continue to change given the rapidly
evolving telecommunications environment. This combination of factors creates further uncertainties in the regulatory arena
and the ability of ICASA to effectively fulfill its functions. We cannot predict the outcome or timing of any amendments or
modifications to applicable regulations or the interpretation thereof, the release of new regulations or their impact on us.
Although we have no reason to believe that ICASA will act in a manner that is prejudicial to our interests, we have in the
past had conflicts with ICASA and its predecessor, including litigation against them with regard to price cap regulations
and interconnection and facilities guidelines. Changes in the regulation of telecommunications services in South Africa, the
imposition of unfavorable terms in our licenses or the loss or unfavorable amendment of any license could disrupt our
business operations and could cause our net profit and the trading prices of Telkom's ordinary shares and ADSs to decline.
In addition, we may be affected by new laws and regulations which may require our business customers to make use of
suppliers complying with black economic empowerment requirements. If such new laws and regulations are promulgated,
and if our shareholder base does not qualify under the ownership requirements of these black economic empowerment
initiatives or restrictions, some of our business customers may be required or elect to obtain all or some of their
telecommunications services from our competitors who may fulfill such ownership requirements.
22
If Telcordia Technologies Incorporated, a New Jersey corporation, were able to recover substantial damages in its
arbitration proceedings against Telkom, Telkom would be required to fund such payments from cash flows or drawings
on its existing credit facilities, which could cause Telkom's indebtedness to increase and its net profit to decline.
Telcordia instituted arbitration proceedings against Telkom in March 2001 seeking to recover approximately
$130 million for monies outstanding and damages, plus interest at a rate of 15.5% per year. The proceedings relate to the
cancellation of an agreement entered into between Telkom and Telcordia during June 1999 for the development and supply
of an integrated end-to-end customer assurance and activation system by Telcordia. In September 2002, a partial ruling was
issued by the arbitrator in favor of Telcordia. The arbitration proceedings and the amount of Telkom's liability are not
expected to be finalized until late 2003 or early 2004. Telkom has provided R373 million for its estimate of probable
liabilities, including interest, in respect of the Telcordia claim in the Telkom Group's consolidated financial statements as of
September 30, 2002. Telkom is currently unable to predict the amount that it may eventually be required to pay Telcordia.
If Telcordia recovers substantial damages from Telkom, Telkom would be required to fund such payments from cash flows
or drawings on its existing credit facilities, which could cause its indebtedness to increase and its net profit to decline.
If we are unable to negotiate favorable terms, rates and conditions for the provision of interconnection services and
facilities and leasing services, our business operations could be disrupted and our net profit could decline.
Telkom is required to provide interconnection services to the mobile operators, the second national operator and all
other entities that lawfully provide telecommunications services in South Africa and to lease or otherwise make our
telecommunications facilities available to any entity lawfully providing or utilizing telecommunications services in South
Africa. We will also be required to allow the second national operator to use all of our telecommunications facilities for the
provision of public switched telecommunications services on a resale basis for the first two years of its license. We may
also be required to lease or otherwise make our telecommunications facilities available to the second national operator for
the provision of services, other than public switched telecommunications services, during the first two years of its license
and beyond. The terms and conditions for the provision of these services and facilities are, or will be, set out in
interconnection agreements and facilities lease agreements negotiated and agreed to by us with these other entities. ICASA
is entitled to issue, and has issued, regulations relating to interconnection and facilities leasing. Certain of these regulations,
while currently only in draft format, contemplate an asymmetrical interconnection regime between Telkom and the
underserviced area licensees, with a terminating tariff differential of at least 30% in favor of these licensees. To the extent
that we are unable to reach agreement with these entities for the provision of these services, including the applicable tariffs,
or to the extent that the terms and conditions of our agreements are inconsistent with relevant legislation or regulations,
such terms and conditions may be determined and imposed on us by ICASA. Sentech has applied to the South African
High Court for an order seeking to set aside supplementary facilities leasing guidelines on the basis of procedural errors.
ICASA has filed a notice of no opposition to this application. As a result, there is a risk that the guidelines will be
remanded back to ICASA for further deliberations. If the guidelines are unfavorable to us when revised, or if we are unable
to negotiate favorable terms and conditions for the provision of the services and facilities covered by the guidelines or
ICASA otherwise imposes terms and conditions that are unfavorable to us, our business operations could be disrupted and
our net profit could decline.
If we are unable to recover the substantial capital and operational costs associated with the implementation of carrier
pre-selection and number portability or are unable to implement these requirements in a timely manner, our business
operations could be disrupted and our net profit could decline.
We are required to implement carrier pre-selection in our fixed-line business, which will enable customers to choose and
vary their fixed-line telecommunications carrier for long distance and international calls, by December 31, 2003. We are
also required to implement number portability, which will enable customers to retain their fixed-line and mobile telephone
numbers if they switch fixed-line operators or mobile operators, by 2005. We will incur substantial set-up and maintenance
time and costs in connection with the implementation of carrier pre-selection and number portability, which could disrupt
our business operations. The extent of recoverability of these costs have not yet been determined and finalized by ICASA.
Although we are required to implement carrier pre-selection by December 31, 2003 pursuant to regulations imposed by
ICASA, we will not be able to fully implement carrier pre-selection until the second national operator is licensed and the
second national operator's interconnection systems and the inter-operator processes and systems to support carrier pre-
selection become available, which may not occur until after December 31, 2003. To the extent that we are unable to comply
with these requirements in the required timeframes or are unable to substantially recover these costs of compliance, our
business operations could be disrupted and our net profit could decline.
23
Our tariffs are subject to approval by the regulatory authorities, which may limit our flexibility in pricing and could
reduce our net profit. Vodacom's revenue and net profit could decline if wholesale price controls are imposed on it.
Our public switched telecommunications services license imposes a price cap formula on our overall tariffs for a basket
of specified services and any individual product or service within the basket of specified services that we previously had the
exclusive right to provide. The overall tariffs for all services in the basket may not be increased by more than 1.5% below
inflation in South Africa, based on the consumer price index and measured using revenue for the services in the basket at
constant volumes for the prior year. In addition, effective January 1, 2003, the price of any individual product or service
within the basket may not be increased by more than 5% above inflation in South Africa in any year. Our tariffs for these
services are filed with ICASA for approval. Revenue from these services may not be used to subsidize competitive products
and services. These limitations on our customer tariffs limit our pricing flexibility and could reduce our net profit. In
addition, Vodacom's revenue and net profit could decline if additional price controls are imposed on it.
If Vodacom does not obtain a license to use adequate amounts of 1800MHz radio frequency spectrum or a license for
radio frequency spectrum for the provision of third generation services on commercially reasonable terms, Vodacom's
future growth rates, revenue and net profit could decline.
Vodacom has a statutory right to obtain a license to use 1800MHz radio frequency spectrum and radio frequency
spectrum for the provision of third generation services pursuant to amendments to the Telecommunications Act, 103 of
1996. The amount of spectrum that will be licensed and the fees that will be required to obtain the 1800MHz radio
frequency spectrum and radio frequency spectrum for the provision of third generation services have not yet been
determined. In the event Vodacom is not able to obtain sufficient additional capacity on the 1800MHz radio frequency
spectrum or radio frequency spectrum for the adequate provision of third generation services, or if the fees or terms of such
licenses are unfavorable, Vodacom's growth rates, revenue and net profit could decline.
If Telkom is required to comply with the provisions of the South African Public Finance Management Act, 1 of 1999, or
PFMA, Telkom could incur increased expenses and its net profit could decline and compliance with the PFMA could
result in the delisting of Telkom's ordinary shares and ADSs from the JSE and New York Stock Exchange.
Telkom is required to comply with the provisions of the South African Public Finance Management Act, 1 of 1999, or
PFMA. Telkom applied for and obtained a temporary exemption from many of the provisions of the PFMA until November
2004. If Telkom does not obtain a further exemption from the PFMA or if its existing exemption is revoked for any reason
or it is otherwise required to comply with the PFMA, Telkom may be compelled to prepare a second set of financial
statements in compliance with accounting principles and practices prescribed by the Government of the Republic of South
Africa which do not correlate with IAS or US GAAP and would require Telkom to incur additional costs. Telkom would
also be required to comply with, what it believes to be, extremely prescriptive treasury regulations issued pursuant to the
PFMA, to provide the Government with advance access to proprietary and potentially price sensitive information and to
seek the prior approval of South African governmental authorities to enter into certain material agreements, to maintain
certain bank accounts, to formulate and implement certain investment strategies or to discharge its auditors, which would
preclude Telkom from acting in the same manner as its competitors and other listed companies. If Telkom is required to
comply with the PFMA, Telkom may not be able to comply with the Listings Requirements of the JSE or the listing rules
of the NYSE and Telkom's ordinary shares and ADSs could be delisted.
Risks Related to the Republic of South Africa
Fluctuations in the value of the Rand could have a significant impact on the amount of Telkom's dividends, the trading
prices of Telkom's ordinary shares and ADSs, our net profit and on the comparability of our results between financial
periods.
In recent years, the value of the Rand as measured against the Dollar has declined considerably. The Rand declined from
R5.90 per $1.00 at December 31, 1998 to R12.00 per $1.00 at December 31, 2001. The exchange rate between the Rand
and the Dollar was R10.54 per $1.00 as of September 30, 2002 and R8.10 per $1.00 as of February 25, 2003.
Fluctuations in the exchange rate between the Rand and the Dollar could have an adverse impact on:
•the Dollar equivalent of any dividends and distributions on Telkom's ordinary shares and ADSs payable in Rands;
•the Dollar equivalent of the Rand denominated prices of Telkom's ordinary shares; and
•the market value of Telkom's ADSs in the United States.

24
These fluctuations could also increase the amount in Rand terms of our non-Rand denominated debt, increase our non-
Rand denominated financing costs and operating and capital expenditures and cause our net profit to decline. Since
September 30, 2002, the value of the Rand has increased as measured against the Dollar and the Euro. Due to this increase.
the Telkom Group's net income is likely to be significantly negatively affected by foreign exchange losses in the year ended
March 31, 2003. See "Management's Discussion and Analysis of Financial Condition and Results of Operations Principal
factors that affect our results of operations Volatility of the Rand and adoption of IAS 39" on page 42 of this prospectus.
In addition, fluctuations in currency exchange rates between the South African Rand and the currencies in African countries
where Vodacom invests could decrease the value of these businesses and Vodacom's and our net profit.
The high levels of unemployment, poverty and crime in South Africa could cause the size of the South African
communications market and our growth rates, operating revenue and net profit, as well as the trading prices of Telkom's
ordinary shares and ADSs, to decline.
While South Africa features a highly developed financial and legal infrastructure at the core of its economy, it has high
levels of unemployment, poverty and crime. These problems have hindered investment into South Africa, have prompted
emigration of skilled workers and have impacted economic growth negatively. Recently, the South African economy has
been growing at a relatively slow rate, inflation and unemployment have been high by comparison with developed countries
and foreign reserves have been relatively low. Although it is difficult to predict the effect of these problems on South
African businesses or the Government of the Republic of South Africa's efforts to solve them, these problems could cause
the size of the communications market and our growth rates, operating revenue and net profit, as well as the trading prices
of Telkom's ordinary shares and ADSs, to decline. For additional information on the Republic of South Africa, see
"Republic of South Africa" beginning on page A1.
The high rates of HIV infection in South Africa could cause the size of the South African communications market and
our growth rates, operating revenue and net profit to decline.
South Africa has one of the highest HIV infection rates in the world. The exact impact of increased mortality rates due
to AIDS deaths on the cost of doing business in South Africa and the potential growth in the economy is unclear at this
time although employee related costs in South Africa are expected to increase as a result of the AIDS epidemic and the size
of the South African population and communications market could decline. Our growth rates, operating revenue and net
profit could decline if employee related expenses increase or the size of the African population and communications market
decline.
Significant labor disputes, work stoppages, increased employee expenses as a result of collective bargaining and the cost
of compliance with South African labor laws could disrupt our fixed-line business operations and reduce our net profit.
Trade unions represented 75% of our fixed-line employees, excluding our Telkom Directory Services and Swiftnet
subsidiaries, as of September 30, 2002. Trade unions have publicly opposed our privatization and have instituted and in the
future could institute work stoppages to oppose changes in our shareholding structure or gain leverage in negotiating
collective bargaining agreements. Telkom's bargaining agreement covering its unionized employees is scheduled to expire
on March 31, 2003. In addition, a number of South African trade unions, including the trade unions of our employees, have
close links to various political parties and have had a significant influence in South Africa as vehicles for social and
political reform and in the collective bargaining process. Since 1995 South Africa has enacted various labor laws that
enhance the rights of employees, which have imposed costs on us. Significant labor disputes, work stoppages, increased
employee expenses as a result of collective bargaining and the cost of compliance with labor laws could disrupt our fixed-
line business operations and reduce our net profit.
South African exchange control restrictions could hinder our ability to make foreign investments and procure foreign
denominated financings.
South Africa's exchange control regulations restrict transactions between residents of the Common Monetary Area,
which consists of South Africa, the Republic of Namibia, and the Kingdoms of Lesotho and Swaziland, and non-residents
of the Common Monetary Area. In particular, South African companies:
•are generally not permitted to export capital from South Africa or to hold foreign currency in excess of certain limits
without the approval of the South African exchange control authorities;
•are generally required to repatriate to South Africa profits of foreign operations; and
•are limited in their ability to utilize profits of one foreign business to finance operations of a different foreign
business.
These restrictions could hinder our ability to make foreign investments and procure foreign denominated financings.
While the South African Government has relaxed exchange controls in recent years, it is difficult to predict whether or how
it will further relax or abolish exchange control measures in the future. See "Exchange Controls" beginning on page 192 of
this prospectus.
Risks Related to the Global Offering
You may be prevented from owning more than 15% of any class of Telkom's issued shares for a period of three months
following the listing on the JSE and more than a direct or indirect 5% ownership interest in Telkom or Vodacom and in
any other licensed operator providing the same category of services.
You may not be permitted to acquire more than 15% of Telkom's ordinary shares. Pursuant to Telkom's new
memorandum and articles of association, for a period of three months following the listing on the JSE, if a single
shareholder acquires direct or indirect ownership of more than 15% of any class of shares, Telkom's board may require that
shareholder to dispose of such shares in excess of 15% or in some instances Telkom can dispose of the shares. Telkom's
board may also refuse to register the transfer of any shares that will result in you holding in excess of 15% of its ordinary
shares. This three-month period may be extended by legislation. If you are not a passive institutional investor who does not
participate in our management, you may be prevented from holding a direct or indirect 5% ownership interest in Telkom or
Vodacom and a 5% or greater ownership interest in any other licensed operator providing the same category of
telecommunications services as Telkom or Vodacom in a concentrated market where there are less than five licensees.
The future sale of a substantial number of Telkom's ordinary shares or ADSs could cause the trading prices of Telkom's
ordinary shares and ADSs to decline.
Following this global offering, the Government of the Republic of South Africa will own approximately 42% of
Telkom's issued and outstanding ordinary share capital, or approximately 38% if the underwriters exercise their over-
allotment option in full, Thintana Communications will own approximately 30% of Telkom's issued and outstanding
ordinary share capital and Ucingo Investments will own approximately 3% of Telkom's issued and outstanding ordinary
share capital. In addition, the Government intends to grant to eligible past and present employees of Telkom, options to
purchase 11,140,636 of its ordinary shares, representing 2% of Telkom's issued and outstanding ordinary share capital,
which will become exercisable over a period of three years in four equal tranches commencing six months after the public
offering. Telkom may also adopt one or more management and employee incentive plans that provide for the issue of
ordinary shares. Ordinary shares in the Khulisa offer are being offered at a 20% discount to the initial public offering price
and may not be sold for three months following the date of the listing of the shares on the JSE. Sales of substantial amounts
of shares by Telkom's shareholders or by Telkom, or the appearance that a large number of shares is available for sale,
following this global offering could cause the trading prices of Telkom's ordinary shares and ADSs to decline. Telkom, the
Government and Thintana Communications have agreed with the underwriters to certain restrictions on the sale of ordinary
shares and ADSs for 180 days from the date of the underwriting agreement as described in "Underwriting" beginning on
page 201 and "Relationship with Major Shareholders and Related Transactions" beginning on page 156 of this prospectus,
but these lock-up agreements can be waived by the joint global co-ordinators in their sole discretion. Ucingo Investments
has also agreed with the Government and the underwriters that it will not sell or dispose of ordinary shares in Telkom for
180 days following the date of the underwriting agreement without the approval from the Government and the underwriters,
such approval not to be unreasonably withheld. In addition, the Government has agreed with Thintana Communications that
the Government will not sell any of its ordinary shares for a further 545 day period after the expiration of its lock-up period
with the underwriters.
Your rights as a shareholder will be governed by South African law, which differs in material respects from the rights of
shareholders under the laws of other jurisdictions.
Telkom is a public limited liability company incorporated under the laws of the Republic of South Africa. The rights of
holders of Telkom's ordinary shares and therefore many of the rights of Telkom's ADS holders are governed by Telkom's
memorandum and articles of association and by South African law. These rights differ in material respects from the rights
of shareholders in companies incorporated elsewhere, such as in the United States. In particular, South African law
significantly limits the circumstances under which shareholders of South African companies may institute litigation on
behalf of a company. For a description of the differences between shareholders' rights under South African law and
Delaware law, See "Description of Shares Comparison of shareholders' rights under South African and Delaware law"
beginning on page 175 of this prospectus.
25
It may not be possible for you to effect service of legal process, enforce judgments of courts outside of South Africa or
bring actions based on securities laws of jurisdictions other than South Africa against Telkom or against members of its
board.
Telkom and a majority of the members of its board of directors and executive officers are residents of South Africa.
In addition, Telkom's assets and a major portion of the assets of members of its board of directors and executive officers are
located in whole or in substantial part in South Africa. As a result, it may not be possible for you to effect service of legal
process within the United States or elsewhere outside of the Republic of South Africa upon most of our directors or
officers, including with respect to matters arising under US federal securities laws or applicable state securities laws.
Moreover, it may not be possible for you to enforce against Telkom or the members of its board of directors and executive
officers judgments obtained in courts outside South Africa, including the United States, based on the civil liability
provisions of the securities laws of those countries, including those of the United States. A foreign judgment is not directly
enforceable in South Africa, but constitutes a cause of action which may be enforced by South African courts with the
approval of the South African Minister of Trade and Industry. In addition, awards of punitive damages will not be
enforceable in South Africa. Although it is possible for an investor to bring an action against Telkom in a South African
civil court to enforce rights in terms of US federal securities laws, these laws will not be enforced if they are penal or
revenue or taxation laws or laws which are contrary to South African public policy. It is not possible therefore for an
investor to seek to impose criminal liability on us in a South African court arising from a violation of US federal
securities laws.
Your ability to sell a substantial number of ordinary shares and ADSs may be restricted by the limited liquidity of
ordinary shares traded on the JSE.
The principal trading market for Telkom's ordinary shares is expected to be the JSE. Historically, trading volumes and
liquidity of shares listed on the JSE have been low in comparison with other major markets. The ability of a holder to sell a
substantial number of ordinary shares on the JSE in a timely manner, especially by means of a large block trade, may be
restricted by the limited liquidity of ordinary shares listed on the JSE. The limited liquidity of the ordinary shares could
depress the overall liquidity and trading prices of the ADSs.
26
SPECIAL NOTE REGARDING FORWARD-LOOKING STATEMENTS
Many of the statements included in this prospectus are forward-looking statements that involve risks and uncertainties.
You can generally identify forward-looking statements by the use of terminology such as "may," "will," "expect," "intend,"
"plan," "estimate," "anticipate," "believe," or similar phrases. All statements, other than statements of historical facts,
including, among others, statements regarding our future financial position, business strategy, projected levels of growth in
the communications market, projected costs, estimates of capital expenditures and plans and objectives of management for
future operation, are forward-looking statements. Our actual future performance could differ materially from these forward-
looking statements. Important factors that could cause actual results to differ materially from our expectations include those
risks identified in the foregoing "Risk Factors" beginning on page 17 of this prospectus, as well as other matters not yet
known to us or not currently considered material by us.
We caution you not to place undue reliance on these forward-looking statements. All written and oral forward-looking
statements attributable to us or persons acting on our behalf are qualified in their entirety by these cautionary statements.
Moreover, unless we are required by law to update these statements, we will not necessarily update any of these statements
after the date of this prospectus, either to conform them to actual results or to changes in our expectations.
27
28
USE OF PROCEEDS
We will not receive any proceeds from the sale of ordinary shares or ADSs in the global offering. The purpose of the
global offering is to enable the Government of the Republic of South Africa to continue its restructuring of state-owned
enterprises and to broaden Telkom's shareholder base.

29
DIVIDENDS AND DIVIDEND POLICY
All of Telkom's issued and outstanding ordinary shares rank equal for dividends. The following table sets forth the
annual dividends declared per ordinary share based on 557,031,819 ordinary shares issued and outstanding in the years
ended March 31, 2000 and 1999 and 3,899,222,728 ordinary shares in the year ended March 31, 1998, which for the year
ended March 31, 1998 represents the ordinary shares issued and outstanding at the date the dividend was declared in the
1997 financial year. Annual dividends are expressed in Rands and translated into Dollars at the Rand noon buying rate
described in "Exchange Rates" on page 31 of this prospectus on the relevant dividend payment date.
Dividends paid per
ordinary share
Total dividends
Dividend
(cents)
(millions)
cover1
Year ended March 31,
ZAR
USD
ZAR
USD
2002 . . . . . . . . . . . . .
-
-
-
-
n/a
2001 . . . . . . . . . . . . .
-
-
-
-
n/a
2000 . . . . . . . . . . . . .
59.6
9.7
331.7
53.9
4.6x
1999 . . . . . . . . . . . . .
98.1
16.7
546.6
93.0
3.4x
1998 . . . . . . . . . . . . .
10.3
2.0
400.0
78.7
5.9x
1
Dividend cover is calculated by dividing net profit for the year after minority interest by the dividend for the year.
Dividends paid by Telkom in the past reflected its status as being majority-owned by the Government of the Republic of
South Africa and should not be considered indicative of Telkom's ability to pay future dividends. Telkom did not declare
any dividends in the two years ended March 31, 2002 in order to reinvest profits in its fixed-line network modernization,
rehabilitation and line-rollout program.
Telkom does not expect to pay dividends for the year ended March 31, 2003. Telkom's board of directors has currently
recommended that a dividend be paid for the year ended March 31, 2004 of up to 33% of the Telkom Group's reported
after tax net profit for that period, subject to South African law, the provisions of Telkom's memorandum and articles of
association and the factors described below. We cannot assure you that any dividend will actually be paid or what the
timing or amount of any future dividends will be. Telkom's current dividend policy aims to provide shareholders with a
competitive return on their investment, while assuring sufficient reinvestment of profits to enable us to achieve our strategy.
Telkom may revise its dividend policy from time to time. The determination to pay dividends, and the amount of the
dividends, will depend upon, among other things, the following:
• our earnings;
•our financial condition;
•our capital requirements;
•the impact of currency exchange rate fluctuations;
•general business conditions and strategies;
•contractual restrictions on the payment of dividends;
•the possible effects on our credit worthiness;
•the pay-out and dividend ratios of other major South African companies and other telecommunications operators; and
•other factors our board of directors may deem relevant, including future growth prospects.
Under South African law, a company may make payments to its shareholders if authorized thereto by its organizational
documents. A company may not make any payment, in whatever form, to its shareholders if there are reasonable grounds
for believing that:
•the company is or would, after the payment, be unable to pay its debts as they become due in the ordinary course of
business; or
• the consolidated assets of the company fairly valued, after the payment, would be less than the consolidated liabilities
of the company.
Under South African law, a shareholder is liable to a company for any payments received by the shareholder from the
company in violation of these restrictions.
30
Pursuant to Telkom's new memorandum and articles of association, for so long as either the Government or Thintana
Communications is a significant shareholder, Telkom's dividend policy and all declarations of dividends and payments to
shareholders will have to be approved by the directors appointed by the Government and Thintana Communications.
Pursuant to Telkom's new memorandum and articles of association, a significant shareholder is a shareholder who holds the
class A ordinary share or class B ordinary share in the capital of Telkom and at least 15% of Telkom's issued ordinary
shares. This percentage will be reduced from time to time to reflect the dilutive effect of issuances of new ordinary shares,
but may not be less than 10%. Furthermore, in the new shareholders' agreement, the Government and Thintana
Communications have agreed to vote their shares together in relation to the declaration and payment of dividends.
Telkom's ability to make future dividend payments will be determined based upon its financial position under IAS. The
following table sets forth a reconciliation of retained earnings in accordance with IAS to distributable reserves in
accordance with IAS for the periods indicated.
As of March 31,
As of September 30,
2001
2002
2002
2002
2002
ZAR
ZAR
USD
ZAR
USD
(unaudited)
(in millions)
Retained earnings in accordance with IAS . . . . . . . . . .
6,679
8,449
802
9,070
861
Share of non-distributable retained earnings in Vodacom . . .
(1,754)
(2,678)
(254)
(3,139)
(298)
Distributable reserves in accordance with IAS . . . . . . .
4,925
5,771
548
5,931
563
Retained earnings of Vodacom are restricted since Telkom requires the consent of the other shareholders of Vodacom to
declare dividends. As described in "Taxation" beginning on page 186 of this prospectus, Telkom is required to pay
secondary tax on companies at a flat rate of 12.5% in respect of the amount of certain dividends declared by it. As a result
of the payment of secondary tax on companies, the amount of dividends that may actually be paid is less than the amount
of distributable reserves. Distributable reserves are available for distribution based on Telkom's dividend policy. Telkom's
board of directors decides on an annual basis the amount of distributable reserves to be reinvested in operations and the
amount of any remaining funds that are available for distribution to shareholders.
Telkom expects to pay any cash dividends solely in Rands. Cash dividends payable to holders of ADSs listed on the
New York Stock Exchange will be paid to the depositary's custodian, which will convert the dividends into Dollars, at the
rate of exchange applicable on the date such dividends are paid, for disbursement to holders. Fluctuations in the exchange
rate between Rands and Dollars and expenses of the depositary will affect the Dollar amounts actually received by holders
of ADSs upon conversion by the depositary of such cash dividends. See "Description of American Depositary Receipts
Dividends and other distributions" beginning on page 180 of this prospectus.
Provided that the relevant share certificate is endorsed "non-resident" or an entry is made to such effect in the relevant
electronic register, there is currently a blanket approval under the South African exchange control regulations for the free
transferability of cash dividends to holders of ordinary shares or ADSs. See "Exchange Controls" beginning on page 192 of
this prospectus.
In addition to the corporate tax on taxable income of South African companies at the current rate of 30%, South African
companies pay secondary tax on companies as described above. Capitalization shares or stock dividends distributed to
holders of ordinary shares do not incur secondary tax on companies. Because of this tax treatment, it has become common
practice in South Africa for companies to offer capitalization shares in lieu of cash dividends. Capitalization shares are
shares issued by a company, the payment for which is allocated out of the company's reserves, including share premium, or
unappropriated profits.
For a discussion of the material South African and US federal income tax provisions regarding the taxation of dividends
on ordinary shares and ADSs, see "Taxation" beginning on page 186 of this prospectus.

31
EXCHANGE RATES
Unless otherwise specified, as used in this prospectus:
•references to "Rand," "R," "ZAR" and "SA Cents" are to South African Rand and Cents, the currency of the
Republic of South Africa;
•references to "Dollars," "$," "USD" and "US Cents" are to the United States Dollar and Cents, the currency
of the United States; and
•references to the "Rand noon buying rate" are to the noon buying rates in New York City for cable transfers
in Rands as certified for customs purposes by the US Federal Reserve Bank of New York expressed in Rands
per $1.00.
For your convenience, this prospectus contains translations of certain Rand amounts into Dollars. You should not
assume, however, that Rands could have been exchanged into Dollars at any particular rate or at all. Unless otherwise
stated, translations of Rand amounts into Dollars have been made at R10.54 per $1.00, the Rand noon buying rate on
September 30, 2002, the date of the Telkom Group's most recent balance sheet included in this prospectus. These
translations should not be construed as representations that the Rand amounts could actually be converted into US dollars at
these rates or at all.
The table below shows the high, low, average and end of period Rand noon buying rates. The end of period Rand noon
buying rate is computed on the last business day of the relevant period and the average Rand noon buying rate is computed
using the Rand noon buying rate on the last business day of each month during the period indicated.
Year ended March 31,
High
Low
Average
End of period
1998 . . . . . . . . . . . . . . . .
5.04
4.41
4.74
5.04
1999 . . . . . . . . . . . . . . . .
6.64
5.03
5.85
6.17
2000 . . . . . . . . . . . . . . . .
6.58
5.98
6.19
6.54
2001 . . . . . . . . . . . . . . . .
8.04
6.56
7.34
8.04
2002 . . . . . . . . . . . . . . . .
13.60
7.91
9.64
11.38
The table below shows the high and low Rand noon buying rates for each month during the six months prior to the date
of this prospectus:
Year 2002
High
Low
August . . . . . . . . . . . . . . . . . . . . . . . . . . . . . . . . . . . . . .
10.90
10.24
September . . . . . . . . . . . . . . . . . . . . . . . . . . . . . . . . . . . .
10.74
10.48
October . . . . . . . . . . . . . . . . . . . . . . . . . . . . . . . . . . . . . .
10.53
10.00
November . . . . . . . . . . . . . . . . . . . . . . . . . . . . . . . . . . . .
9.98
9.25
December . . . . . . . . . . . . . . . . . . . . . . . . . . . . . . . . . . . . .
9.27
8.59
Year 2003
High
Low
January . . . . . . . . . . . . . . . . . . . . . . . . . . . . . . . . . . . . . .
9.05
8.44
On February 25, 2003, the Rand noon buying rate was R8.10 per $1.00.
Fluctuations in the exchange rate between the Rand and the Dollar will affect the Dollar amounts received by holders of
ADSs on conversion of dividends, if any, paid in Rands on the ordinary shares and may affect the Dollar trading price of
the ADSs on the New York Stock Exchange.
32
CAPITALIZATION
The following table sets forth the capitalization of the Telkom Group as of September 30, 2002 in accordance with IAS.
The Telkom Group's capitalization includes our 50% interest in Vodacom, which we proportionately consolidate in the
Telkom Group's consolidated financial statements.
Rand amounts have been translated into Dollars solely for your convenience at R10.54 per $1.00, the Rand noon buying
rate on September 30, 2002, the date of the Telkom Group's most recent consolidated balance sheet included in this
prospectus. These translations should not be construed as representations that the Rand amounts could actually be
converted in US dollars at these rates or at all.
You should read the following information together with "Risk Factors" beginning on page 17, "Selected Historical
Consolidated Financial and Other Data of the Telkom Group" beginning on page 33, "Management's Discussion and
Analysis of Financial Condition and Results of Operations" beginning on page 39 and the consolidated financial statements
and notes thereto of the Telkom Group and Vodacom beginning on page F-2 of this prospectus.
As of September 30, 20021
ZAR
USD
(unaudited)
(millions)
Short-term
Local unsecured debt2
. . . . . . . . . . . . . . . . . . . . . . . . . . . . . . . . . .
1,364
129
Current portion of long-term debt3
. . . . . . . . . . . . . . . . . . . . . . . . . . .
5,958
565
Local debt . . . . . . . . . . . . . . . . . . . . . . . . . . . . . . . . . . . . . . . .
5,897
559
Unsecured . . . . . . . . . . . . . . . . . . . . . . . . . . . . . . . . . . . . . . .
5,607
532
Secured . . . . . . . . . . . . . . . . . . . . . . . . . . . . . . . . . . . . . . . .
290
27
Government guaranteed . . . . . . . . . . . . . . . . . . . . . . . . . . . . . . .
Foreign debt . . . . . . . . . . . . . . . . . . . . . . . . . . . . . . . . . . . . . . .
61
6
Secured . . . . . . . . . . . . . . . . . . . . . . . . . . . . . . . . . . . . . . . .
29
3
Government guaranteed . . . . . . . . . . . . . . . . . . . . . . . . . . . . . . .
32
3
Total short-term debt . . . . . . . . . . . . . . . . . . . . . . . . . . . . . . . . .
7,322
694
Long-term3
Local debt . . . . . . . . . . . . . . . . . . . . . . . . . . . . . . . . . . . . . . . .
12,058
1,144
Unsecured . . . . . . . . . . . . . . . . . . . . . . . . . . . . . . . . . . . . . . .
7,550
716
Secured . . . . . . . . . . . . . . . . . . . . . . . . . . . . . . . . . . . . . . . .
1,047
99
Government guaranteed . . . . . . . . . . . . . . . . . . . . . . . . . . . . . . .
3,461
329
Foreign debt . . . . . . . . . . . . . . . . . . . . . . . . . . . . . . . . . . . . . . .
6,086
578
Unsecured . . . . . . . . . . . . . . . . . . . . . . . . . . . . . . . . . . . . . . .
5,306
504
Secured . . . . . . . . . . . . . . . . . . . . . . . . . . . . . . . . . . . . . . . .
293
28
Bank guaranteed . . . . . . . . . . . . . . . . . . . . . . . . . . . . . . . . . . .
359
34
Government guaranteed . . . . . . . . . . . . . . . . . . . . . . . . . . . . . . .
128
12
Total long-term debt . . . . . . . . . . . . . . . . . . . . . . . . . . . . . . . . .
18,144
1,722
Shareholder equity
Share capital . . . . . . . . . . . . . . . . . . . . . . . . . . . . . . . . . . . . . . . .
5,570
529
(1,000,000,000 ordinary shares of R10 each authorized, 557,031,819 ordinary shares issued
and outstanding as of September 30, 2002)
Share premium . . . . . . . . . . . . . . . . . . . . . . . . . . . . . . . . . . . . . . .
2,723
258
Non-distributable reserves . . . . . . . . . . . . . . . . . . . . . . . . . . . . . . . . .
112
11
Retained earnings . . . . . . . . . . . . . . . . . . . . . . . . . . . . . . . . . . . . .
9,070
860
Total shareholders' equity . . . . . . . . . . . . . . . . . . . . . . . . . . . . . . . .
17,475
1,658
Total capitalization . . . . . . . . . . . . . . . . . . . . . . . . . . . . . . . . . . . .
42,941
4,074
1
There have been no material changes to the Telkom Group's capitalization and indebtedness from September 30, 2002 through
January 16, 2003, the last practical day on which this information could be compiled, except for the following:
• the repayment of the R359 million European Investment Bank loan;
• the repayment of R397 million of short-term instruments;
• exchange rate movements of R566 million; and
• our 50% share of Vodacom's total interest bearing debt has decreased by R1.2 billion as a function of the normal monthly working
capital cycle.
2
Credit facilities utilized.
3
Long-term debt and related current portion of long-term debt include finance lease obligations.
33
SELECTED HISTORICAL CONSOLIDATED FINANCIAL
AND OTHER DATA OF THE TELKOM GROUP
The following table sets forth selected historical consolidated financial and other data of the Telkom Group as of and for
each of the five years in the period ended March 31, 2002 and as of and for each of the six month periods ended September
30, 2002 and 2001. Information in the following table includes our 50% interest in the results, assets, liabilities and
shareholders' equity of Vodacom, which we proportionately consolidate.
The following selected historical consolidated financial data of the Telkom Group as of and for each of the three years
ended March 31, 2002 was derived from the Telkom Group's historical consolidated financial statements beginning on
page F-48 of this prospectus, which have been audited by Ernst & Young, Registered Accountants and Auditors, Chartered
Accountants (SA). The following selected consolidated financial data as of March 31, 1999 and March 31, 1998 and for
each of the two years ended March 31, 1999 was derived from the Telkom Group's unaudited consolidated financial
statements not included in this prospectus, which are presented in accordance with IAS. The following selected historical
consolidated financial data of the Telkom Group as of September 30, 2002 and for each of the six month periods ended
September 30, 2002 and 2001 was derived from the Telkom Group's unaudited condensed consolidated financial statements
beginning on page F-2 of this prospectus, which, in the opinion of our management, have been prepared on the same basis
as the Telkom Group's audited consolidated financial statements and reflect all adjustments, consisting of normal recurring
adjustments, necessary for a fair presentation of the Telkom Group's results of operations and financial position for such
periods. Results for the six month periods ended September 30, 2002 and 2001 are not necessarily indicative of results that
may be expected for the entire year.
The consolidated financial statements of the Telkom Group have been prepared in accordance with IAS, which differs in
certain respects from US GAAP. For a description of the principal differences between IAS and US GAAP relevant to the
consolidated financial statements of the Telkom Group and a reconciliation to US GAAP of net income and profit and
shareholders' equity, see note 41 of the notes to the audited consolidated financial statements of the Telkom Group
beginning on page F-97 of this prospectus and note 21 of the notes to the unaudited condensed consolidated financial
statements of the Telkom Group as of September 30, 2002 and for each of the six month periods ended September 30, 2002
and 2001 beginning on page F-15 of this prospectus.
Headline earnings per share is a disclosure requirement of the JSE and is not a recognized measure under US GAAP.
Headline earnings represents net profit, excluding profit on the disposal of property, plant and equipment; profit on the
disposal of subsidiaries and joint ventures; property, plant and equipment impairment losses; goodwill amortization; and tax
and minority interest impacts. EBITDA represents operating profit before income tax, finance charges, investment income
and depreciation and amortization. We believe that EBITDA provides meaningful additional information to investors since
it is widely accepted by analysts and investors as a basis for comparing a company's underlying operating profitability with
that of other companies as it is not influenced by past capital expenditures or business acquisitions, a company's capital
structure or the relevant tax regime. This is particularly the case in a capital-intensive industry such as communications. It
is also a widely accepted indicator of a company's ability to service its long-term debt and other fixed obligations and to
fund its continued growth. EBITDA is not a US GAAP or IAS measure. You should not construe EBITDA as an alternative
to operating profit or cash flows from operating activities determined in accordance with US GAAP or IAS or as a measure
of liquidity. EBITDA is not defined in the same manner by all companies and may not be comparable to other similarly
titled measures of other companies unless the definition is the same. In addition, because the calculation of EBITDA in the
maintenance covenants contained in our credit facilities is based on accounting policies in use at the time the indebtedness
was incurred, EBITDA for purposes of those covenants is not calculated in the same manner as it is calculated in the
following table.
Fixed access lines are comprised of PSTN lines, including ISDN channels, public and private payphones and internal
lines in service. We calculate fixed-line penetration, or teledensity, based on the total number of telephone lines in service at
the end of the period per 100 persons in the population of South Africa. Population is the estimated South African
population at the mid year in the periods indicated as published by Statistics South Africa, a South African governmental
department. We calculate fixed-line traffic, other than international outgoing mobile traffic and international interconnection
traffic, by dividing traffic operating revenues for the particular category by the weighted average tariff for such category
during the relevant period. Fixed-line international outgoing mobile traffic and international interconnection traffic is based
on the actual traffic registered through the respective exchanges and reflected in international interconnection invoices. We
calculate revenue per fixed access line by dividing total fixed-line revenue during the period, excluding data and directories
and other revenue, by the average number of fixed lines during the period. We calculate our number of fixed lines per
34
fixed-line employee on the basis of fixed lines in service at period end divided by the number of employees in our fixed-
line segment at period end, excluding employees from our two subsidiaries, Telkom Directory Services and Swiftnet, which
do not provide public switched telecommunications services.
Information with respect to Vodacom's statistical data reflects 100% of Vodacom's results of operations and information
with respect to Vodacom's other African operations reflects 100% of the operations of Vodacom's subsidiaries in Lesotho
and Tanzania and 51% of Vodacom's joint venture in the Democratic Republic of the Congo, unless otherwise indicated.
Vodacom's customer totals are based on the total number of customers registered on Vodacom's network, which have not
been disconnected, including inactive customers, as of the end of the period indicated. See "Business Mobile
communications South Africa Customers" on beginning page 122 of this prospectus for a discussion of Vodacom's
procedures with respect to disconnections and inactive customers. Vodacom's churn is calculated by dividing the average
monthly number of disconnections during the period by the average monthly total reported customer base during the
period. Vodacom calculates penetration, or teledensity, based on the total number of customers at the end of the period per
100 persons in the population of South Africa. Population is the estimated South African population at the mid year in the
periods indicated as published by Statistics South Africa. Vodacom's traffic comprises total traffic registered on Vodacom's
network, including bundled minutes, outgoing international roaming calls and calls to free services, but excluding national
and incoming international roaming calls. Vodacom's ARPU is calculated by dividing the average monthly revenue during
the period by the average monthly total reported customer base during the period. ARPU excludes revenue from equipment
sales, other sales and services and revenue from national and international users roaming on Vodacom's networks. MOU is
calculated by dividing the average monthly minutes during the period by the average monthly total reported customer base
during the period. MOU excludes calls to free services, bundled minutes and data minutes. Cumulative network capital
expenditure per customer is the cumulative network capital expenditure since the launch of Vodacom's South African
network divided by Vodacom's average customers in South Africa for the period.
Rand amounts as of and for the year ended March 31, 2002 and as of and for the six months ended September 30, 2002
have been translated into Dollars solely for your convenience at R10.54 per $1.00, the Rand noon buying rate discussed in
"Exchange Rates" on page 31 of this prospectus on September 30, 2002, the date of the Telkom Group's most recent
consolidated balance sheet included in this prospectus. These translations should not be construed as representations that
the Rand amounts could actually be converted into US dollars at these rates or at all.
You should read the following information together with "Risk Factors" beginning on page 17, "Capitalization" on
page 32, "Management's Discussion and Analysis of Financial Condition and Results of Operations" beginning on page 39
and the consolidated financial statements and the notes thereto of the Telkom Group and Vodacom beginning on page F2
of this prospectus.
35
THE TELKOM GROUP
Income Statement Data
Six months ended
Year ended March 31,
September 30,
1998
1999
2000
2001
2002
2002
2001
2002
2002
ZAR
ZAR
ZAR
ZAR
ZAR
USD
ZAR
ZAR
USD
Amounts in accordance with IAS
(unaudited)
(unaudited)
(in millions, except per share amounts)
Operating revenue . . . . . . . . .
19,495
23,029
27,113
31,352
34,197
3,244
16,523
18,316
1,738
Employee expenses
1
. . . . . . .
n/a
2
n/a
2
7,713
6,590
7,166
680
3,590
3,707
352
Payments to other operators . . .
n/a
2
n/a
2
4,241
4,983
5,762
547
2,654
3,105
294
Selling, general and administrative
3
n/a
2
n/a
2
5,324
6,971
8,237
781
3,794
3,795
360
Services rendered . . . . . . . . .
n/a
2
n/a
2
1,439
1,539
2,194
208
1,091
1,108
105
Operating leases . . . . . . . . .
n/a
2
n/a
2
340
1,292
1,217
115
583
684
65
Depreciation and amortization . .
n/a
2
n/a
2
4,174
5,052
5,408
513
2,643
3,106
295
Operating expenses . . . . . . . .
15,498 19,617 23,231 26,427 29,984
2,844 14,355 15,505
1,471
Operating profit . . . . . . . . .
3,997
3,412
3,882
4,925
4,213
400
2,168
2,811
267
Investment income . . . . . . .
997
436
641
617
490
46
306
152
14
Finance charges . . . . . . . . .
(1,585) (1,283) (2,482) (3,137) (2,550)
(242) (1,845) (1,779)
(169)
Profit before tax . . . . . . . . .
3,409
2,565
2,041
2,405
2,153
204
629
1,184
112
Taxation . . . . . . . . . . . . .
(1,032)
(657)
(501)
(715)
(873)
(83)
(206)
(456)
(43)
Profit after tax . . . . . . . . . .
2,377
1,908
1,540
1,690
1,280
121
423
728
69
Minority interests . . . . . . . . .
(13)
(55)
(13)
(68)
(59)
(5)
(52)
(84)
(8)
Net profit . . . . . . . . . . . . .
2,364
1,853
1,527
1,622
1,221
116
371
644
61
Number of ordinary shares
outstanding (millions)
Basic . . . . . . . . . . . . . .
557
557
557
557
557
557
557
557
557
Diluted . . . . . . . . . . . . .
557
557
557
557
557
557
557
557
557
Earnings per share (cents)
Basic . . . . . . . . . . . . . .
424.4
332.7
274.1
291.2
219.2
20.8
66.6
115.6
11.0
Diluted . . . . . . . . . . . . .
424.4
332.7
274.1
291.2
219.2
20.8
66.6
115.6
11.0
Dividends per share (cents) . . .
10.3
98.1
59.6
-
-
-
-
-
-
Amounts in accordance with
US GAAP
Net revenue . . . . . . . . . . . .
n/a
n/a
n/a 26,413 27,947
2,653 13,657 14,605
1,386
Operating income . . . . . . . . .
n/a
n/a
n/a
3,716
2,498
237
1,711
2,219
211
Net income . . . . . . . . . . . .
n/a
n/a
n/a
1,598
1,317
125
481
757
73
Earnings per share (cents)
Basic . . . . . . . . . . . . . .
n/a
n/a
n/a
286.9
236.5
22.4
86.4
135.9
12.9
Diluted . . . . . . . . . . . . .
n/a
n/a
n/a
286.9
236.5
22.4
86.4
135.9
12.9
36
Balance Sheet Data
As of
As of March 31,
September 30,
1998
1999
2000
2001
2002
2002
2002
2002
ZAR
ZAR
ZAR
ZAR
ZAR
USD
ZAR
USD
Amounts in accordance with IAS
(unaudited)
(unaudited)
(in millions, except per share amounts)
Total assets . . . . . . . . . . . . . . . . .
26,012
37,420
47,276
53,537
55,208
5,238
54,581
5,178
Current assets . . . . . . . . . . . . . . . .
5,692
7,580
11,010
12,674
10,968
1,041
11,195
1,062
Cash and cash equivalents . . . . . . . .
n/a
n/a
1,953
1,801
724
69
1,085
103
Other current assets . . . . . . . . . . . .
n/a
n/a
9,057
10,873
10,244
972
10,110
959
Non-current assets . . . . . . . . . . . . . .
20,320
29,840
36,266
40,863
44,240
4,197
43,386
4,116
Total liabilities
4
. . . . . . . . . . . . . . .
13,011
24,496
33,879
38,449
38,243
3,628
36,892
3,500
Current liabilities . . . . . . . . . . . . . .
6,643
12,985
14,371
15,447
12,646
1,200
15,552
1,475
Short-term debt
5
. . . . . . . . . . . . . .
n/a
n/a
6,046
6,425
2,868
272
7,322
694
Other current liabilities . . . . . . . . . .
n/a
n/a
8,325
9,022
9,778
928
8,230
781
Non-current liabilities . . . . . . . . . . . .
6,368
11,511
19,508
23,002
25,597
2,428
21,340
2,025
Long-term debt
6
. . . . . . . . . . . . . .
n/a
n/a
15,928
19,843
22,533
2,138
18,144
1,722
Other non-current liabilities . . . . . . .
n/a
n/a
3,580
3,159
3,064
290
3,196
303
Minority interests . . . . . . . . . . . . .
19
84
47
116
133
13
214
20
Shareholders' equity . . . . . . . . . . . .
12,982
12,840
13,350
14,972
16,832
1,597
17,475
1,658
Amounts in accordance with US GAAP . . .
Total assets . . . . . . . . . . . . . . . . .
n/a
n/a
n/a
49,524
50,943
4,836
49,458
4,693
Total liabilities . . . . . . . . . . . . . . . .
n/a
n/a
n/a
35,626
35,280
3,349
33,076
3,138
Shareholders' equity . . . . . . . . . . . . .
n/a
n/a
n/a
13,776
15,535
1,475
16,220
1,539
Six months ended
Year ended March 31,
September 30,
1998
1999
2000
2001
2002
2002
2001
2002
2002
ZAR
ZAR
ZAR
ZAR
ZAR
USD
ZAR
ZAR
USD
Cash Flow Data
(unaudited)
(unaudited)
Amounts in accordance with IAS
(in millions)
Cash flow from operating activities .
3,976
6,123
4,917
6,165
8,171
775
3,301
3,462
328
Cash flow from/(used in) investing
activities . . . . . . . . . . . . . . .
(6,942) (12,658) (9,107) (9,964) (9,294)
(882) (3,653) (2,453)
(233)
Cash flow from/(used in) financing
activities . . . . . . . . . . . . . . .
1,218
6,383
5,051
3,439
110
10
(973) (1,178)
(112)
Other Data
Headline earnings per share (cents)
7
n/a
n/a
199.9
341.8
299.3
28.4
70.2
123.9
11.8
Net asset value per share (cents)
8
(at period end) . . . . . . . . . . . .
2,330.6 2,305.1 2,396.6 2,687.8 3,021.7
286.7
n/a 3,137.2
297.6
Net asset value per share excluding
intangibles (cents) (at period end)
8
.
2,323.9 2,289.1 2,312.3 2,613.3 2,926.6
277.7
n/a 3,057.8
290.1
EBITDA . . . . . . . . . . . . . . .
6,433
6,363
8,056
9,977
9,621
913
4,811
5,917
562
Total debt (at period end)
9
. . . . .
n/a
n/a
21,974
26,268
25,401
2,410
25,359
25,466
2,416
Capital expenditure excluding
intangibles . . . . . . . . . . . . . .
7,030
12,690
9,461
9,889
9,004
854
3,641
2,346
223

37
Six months ended
Year ended March 31,
September 30,
1998
1999
2000
2001
2002
2001
2002
Fixed-Line Statistical Data (Telkom)
Fixed access lines (thousands)
(at period end)
10
. . . . . . . . . . . . . . . . .
4,645
5,075
5,493
4,962
4,924
4,986
4,895
Postpaid
PSTN
11
. . . . . . . . . . . . . . . . . . . .
4,518
4,768
4,668
3,930
3,554
3,761
3,407
ISDN . . . . . . . . . . . . . . . . . . . . .
-
154
271
374
467
421
522
Prepaid . . . . . . . . . . . . . . . . . . . . .
n/a
n/a
381
480
708
615
780
Payphones
12
. . . . . . . . . . . . . . . . . . .
127
153
173
178
195
189
186
Fixed-line penetration rate
(%) (at period end) . . . . . . . . . . . . . . . .
11.3
12.1
12.8
11.4
11.1
11.1
10.8
Revenue per fixed access line (ZAR) . . . . .
n/a
n/a
3,869
4,297
4,729
2,294
2,456
Total fixed-line traffic
(millions of minutes) . . . . . . . . . . . . . .
n/a
n/a
31,127
32,915
32,973
16,620
16,145
Local
13
. . . . . . . . . . . . . . . . . . . . .
n/a
n/a
19,471
20,388
20,252
10,246
9,870
Long distance . . . . . . . . . . . . . . . . .
n/a
n/a
5,222
4,938
4,895
2,492
2,445
Fixed-to-mobile . . . . . . . . . . . . . . . .
n/a
n/a
3,659
4,319
4,390
2,221
2,079
International outgoing . . . . . . . . . . . .
n/a
n/a
344
357
375
184
219
Interconnection . . . . . . . . . . . . . . . .
n/a
n/a
2,431
2,913
3,061
1,477
1,532
Number of full-time, fixed-line
employees (at period end)
14
. . . . . . . . . .
56,480
61,237
49,128
43,758
39,444
42,110
38,009
Fixed lines per fixed-line employee
(at period end)
14
. . . . . . . . . . . . . . . . .
82
83
112
113
125
118
129
Vodacom Statistical Data (100% of Vodacom)
South Africa
Total mobile customers (thousands)
(at period end)
15
. . . . . . . . . . . . . . .
1,137
1,991
3,069
5,108
6,557
5,657
7,130
Contract . . . . . . . . . . . . . . . . . .
695
866
963
1,037
1,090
1,062
1,139
Prepaid . . . . . . . . . . . . . . . . . . .
426
1,101
2,082
4,046
5,439
4,569
5,961
Community services telephones . . . . . .
16
23
24
25
28
26
30
Churn (%) . . . . . . . . . . . . . . . . . .
28.2
26.5
31.8
23.3
27.2
31.3
30.7
Contract . . . . . . . . . . . . . . . . . .
17.1
16.1
17.4
18.7
14.5
16.6
13.2
Prepaid . . . . . . . . . . . . . . . . . . .
30.0
39.3
40.5
24.8
30.1
34.8
34.3
Mobile market share (%) (at period end) . .
62
60
59
61
61
61
59
Mobile penetration (%) (at period end) . . .
4.5
8.0
12.1
19.1
24.2
20.6
26.6
Total mobile traffic (millions of minutes) .
-
-
5,669
7,472
8,881
4,229
5,007
Outgoing . . . . . . . . . . . . . . . . . .
n/a
n/a
2,885
4,052
4,967
2,307
2,994
Incoming . . . . . . . . . . . . . . . . . .
n/a
n/a
2,784
3,420
3,914
1,922
2,013
Average monthly revenue per customer
(ZAR)
16
. . . . . . . . . . . . . . . . . . . .
394
358
266
208
182
190
181
Contract
16
. . . . . . . . . . . . . . . . .
n/a
n/a
481
493
560
551
612
Prepaid . . . . . . . . . . . . . . . . . . .
n/a
n/a
132
98
93
94
88
Community services . . . . . . . . . . . .
n/a
n/a
n/a
1,453
1,719
1,710
1,766
Average monthly minutes of use per
customer . . . . . . . . . . . . . . . . . . .
n/a
n/a
158
137
111
114
102
Contract . . . . . . . . . . . . . . . . . .
n/a
n/a
274
270
264
265
269
Prepaid . . . . . . . . . . . . . . . . . . .
n/a
n/a
90
70
58
59
53
Community services . . . . . . . . . . . .
n/a
n/a
1,593
2,859
3,354
3,246
3,215
Cumulative network capital expenditure per
customer (ZAR) (at period end) . . . . . . .
n/a
n/a
2,543
2,053
1,991
2,048
1,980
Number of mobile employees
(at period end)
17
. . . . . . . . . . . . . . .
2,050
3,446
4,048
4,102
3,984
4,384
3,845
Number of mobile customers per mobile
employee (at period end)
17
. . . . . . . . . .
555
578
758
1,245
1,646
1,290
1,854
38
Six months ended
Year ended March 31,
September 30,
1998
1999
2000
2001
2002
2001
2002
Other African countries
Number of mobile customers
(thousands) (at period end) . . . . . . .
3
5
12
104
306
164
540
Average monthly revenue per customer
Lesotho (ZAR) . . . . . . . . . . . . .
n/a
n/a
n/a
n/a
144
n/a
87
Tanzania (USD) . . . . . . . . . . . . .
n/a
n/a
n/a
31
27
n/a
23
Democratic Republic of the
Congo (USD) . . . . . . . . . . . . . .
n/a
n/a
n/a
n/a
n/a
n/a
22
Number of mobile employees
(at period end)
17
. . . . . . . . . . . . . .
n/a
n/a
43
170
369
201
397
Number of mobile customers per mobile
employee (at period end)
17
. . . . . . . . .
n/a
n/a
279
612
830
816
1,360
1
Employee expenses include retrenchment costs of R373 million, R132 million and R303 million in the years ended March 31, 2002,
2001 and 2000, respectively, and R169 million and R195 million in the six months ended September 30, 2002 and 2001, respectively.
2
Not available because we changed the categories contained in our consolidated financial statements in the year ended March 31, 2000.
3
Selling, general and administrative expenses include asset write-offs of R445 million and R230 million in the years ended March 31,
2002 and 2001, respectively, and provisions for potential damages related to Telkom's arbitration with Telcordia of R375 million in the
year ended March 31, 2002.
4
As of September 30, 2002, R3,621 million of our long-term debt was guaranteed by the Government of the Republic of South Africa.
5
Includes short-term portion of finance leases and utilized credit facilities.
6
Includes long-term portion of finance leases.
7
Headline earnings per share is a disclosure requirement of the JSE and is not a recognized measure under US GAAP. The following is
a reconciliation between net profit and headline earnings in accordance with IAS for the periods indicated:
Six months ended
Year ended March 31,
September 30,
2000
2001
2002
2001
2002
ZAR
ZAR
ZAR
ZAR
ZAR
(unaudited)
(in millions, except per share amounts)
Net profit . . . . . . . . . . . . . . . . . . . . . . . . . . . . . . .
1,527
1,622
1,221
371
644
Adjustments:
Profit on disposal of property, plant and equipment . . . . . . . . .
(493)
(29)
(22)
(6)
(7)
Profit on disposal of subsidiaries and joint ventures . . . . . . . . .
(83)
-
(8)
-
-
Property, plant and equipment impairment losses . . . . . . . . . .
-
279
445
-
16
Goodwill amortization . . . . . . . . . . . . . . . . . . . . . . . .
18
75
66
26
36
Tax and outside shareholders effects . . . . . . . . . . . . . . . . .
145
(43)
(35)
-
1
Headline earnings . . . . . . . . . . . . . . . . . . . . . . . . . .
1,114
1,904
1,667
391
690
Headline earnings per share (cents) . . . . . . . . . . . . . . . .
199.9
341.8
299.3
70.2
123.9
8
Net asset value per share including and excluding intangibles are disclosure requirements of the JSE. Net asset value per share excluding intangibles is
not a recognized measure under US GAAP. Net asset value per share including intangibles is based on net assets of R16,832 million, R14,972 million,
R13,350 million, R12,840 million and R12,982 million as of March 31, 2002, 2001, 2000, 1999 and 1998, respectively, and R17,475 million as of
September 30, 2002. Net asset value per share excluding intangibles is based on net assets of R16,302 million, R14,557 million, R12,880 million,
R12,751 million and R12,945 million as of March 31, 2002, 2001, 2000, 1999 and 1998, respectively, and R17,033 million as of September 30, 2002.
9
Includes short-term and long-term debt, finance lease obligations and utilized credit facilities.
10
Including Telkom internal lines of 162,460, 151,986 and 145,302 as of March 31, 2002, 2001 and 2000, respectively, and 136,459 and 157,942 as of
September 30, 2002 and 2001, respectively. Each PSTN line includes one access channel, each basic ISDN line includes two access channels and each
pricing ISDN line includes 30 access channels.
11
Excluding ISDN channels.
12
Includes public and private pay phones.
13
Local traffic includes internet traffic.
14
Excluding employees of Telkom Directory Services and Swiftnet.
15
13.9% of Vodacom's total reported customers, 15.9% of its prepaid customers and 3.8% of its contract customers in South Africa were inactive as of
March 31, 2002. 15.1% of Vodacom's total reported customers, 17.0% of its prepaid customers and 4.9% of its contract customers in South Africa were
inactive as of September 30, 2002.
16
Value added service revenue from previously partially owned service providers is included in contract and total average monthly revenue per customer
from October 1, 2001, at which time Vodacom consolidated these previously partially owned service providers.
17
Includes 423, 553 and 96 total temporary employees as of March 31, 2002, 2001 and 2000, respectively, and 140 and 335 total temporary employees as
of September 30, 2002 and 2001, respectively.
39
MANAGEMENT'S DISCUSSION AND ANALYSIS OF FINANCIAL CONDITION
AND RESULTS OF OPERATIONS
You should read the following discussion together with the consolidated financial statements of the Telkom Group and
Vodacom and the notes thereto beginning on page F2 included elsewhere in this prospectus. The Telkom Group and
Vodacom have prepared their financial statements in accordance with IAS, which differs in certain respects from US GAAP.
For a description of the principal differences between IAS and US GAAP relevant to the financial statements of the Telkom
Group and Vodacom and a reconciliation to US GAAP of net income and profit and shareholders' equity, see note 41 of the
notes to the audited consolidated financial statements of the Telkom Group as of and for the three years ended March 31,
2002 beginning on page F97 of this prospectus, note 21 of the notes to the unaudited condensed consolidated financial
statements of the Telkom Group as of September 30, 2002 and for each of the six month periods ended September 30, 2002
and 2001 beginning on page F15 of this prospectus, note 45 of the notes to the audited consolidated financial statements
of Vodacom as of and for the three years ended March 31, 2002 beginning on page F176 of this prospectus and note 20 of
the notes to the unaudited condensed consolidated financial statements of Vodacom as of September 30, 2002 and for each
of the six month periods ended September 30, 2002 and 2001 beginning on page F40 of this prospectus.
Overview of our business
We are currently the sole provider of public switched telecommunications services in South Africa, providing fixed-line
voice and data services. In addition, we participate in the South African mobile communications market through our 50%
interest in Vodacom, the largest mobile communications network operator in South Africa based on total reported
customers. We also provide directory services and other services through our subsidiaries, Telkom Directory Services
(Proprietary) Limited and Swiftnet (Proprietary) Limited, both of which are companies incorporated in the Republic of
South Africa.
We offer business, residential and payphone customers a wide range of services and products, including:
•fixed-line voice services, including subscription and connections services, local, long distance, fixed-to-mobile and
international voice services, interconnection and transit communications services, value-added voice services,
customer premises equipment sales and directory services;
•fixed-line data services, including domestic and international data transmission services, such as leased lines and
packet-based services, managed data networking services and internet access and related information technology
services; and
•mobile communications services, including voice and data services, value-added services and handset sales through
Vodacom.
Principal factors that affect our results of operations
Liberalization of the South African telecommunications market and increasing competition
We had the exclusive right to provide public switched telecommunications services, including international telephone
services, in the Republic of South Africa until May 7, 2002. In May 2002, Sentech Limited was issued licenses to provide
international carrier of carriers services and multimedia services. Due to the continuing liberalization of the
communications market, we expect to face competition from a second national operator. We also expect to face additional
competition by small business operators in areas with a teledensity of less than 5%. ICASA has indicated that it expects to
issue these licences in 2003 or early 2004. The only two bids for the second national operator that we received at the close
of the bid process were rejected by ICASA and an alternative bid process has been commenced by the Minister of
Communications.. Further competition may arise as a result of an assessment by the Minister of Communications of the
feasibility of issuing additional licenses from May 2005. In addition, our fixed-line business has faced competition from
mobile communications network operators, including Vodacom, and value-added network operators for a number of years.
In recent periods, our fixed-line business has experienced significant migration from our fixed-line services to mobile
services, as well as substitution of calls placed using mobile services rather than our fixed-line service. We also compete
with mobile operators who use least cost routing technology that enables fixed-to-mobile calls from corporate private
branch exchanges to bypass our network by being transferred directly to mobile networks.
The current South African mobile communications market is dominated by two mobile communications network
operators, Vodacom and MTN, and a third mobile communications network operator, Cell C, has competed in this market
since November 2001. In addition, ICASA has indicated that it intends to license global mobile personal communications
services in 2003 or later and to conduct a feasibility study on the licensing of a fourth mobile operator in 2004 or later.
We expect competition in the fixed-line and mobile communications sectors to continue to increase. As competition
intensifies, the main challenges our fixed-line business faces are continuing to improve customer loyalty and maintaining its
leadership in the South African communications market. As a result of increasing competition, we anticipate a reduction in
overall average tariffs and market share in our fixed-line business. Vodacom has maintained its market share to date, despite
the introduction of Cell C, but customer acquisition and retention costs have increased. The introduction of future
competition may result in a reduction in Vodacom's overall average tariffs and market share and an increase in its customer
acquisition and retention costs. However, we expect competition to stimulate overall market demand for communications
services.
40
South African fixed-line communications market
While South Africa features a highly developed financial and legal infrastructure at the core of its economy, it also
suffers from high levels of unemployment and income disparity. With respect to the economically disadvantaged portion of
the population, communications providers must compete with other basic service providers for customers' limited
resources. In a number of areas of the country and for particular portions of the population, mobile services are the
preferred alternative to fixed-line services.
To substantially meet our license targets, we installed a significant number of access lines that proved to be uneconomic
and have since been disconnected. Taking into account recent disconnections, the number of our fixed lines in service grew
by a compound annual rate of only 3.0% over the five years ending March 31, 2002. Although the fixed-line penetration
rate in South Africa was only 10.8% as of September 30, 2002, due to the diverse rural geography and demographic factors
in South Africa, we do not expect fixed-line penetration rates to increase significantly in the near-term. In light of these
market conditions, we will seek to maximize the utilization of existing capacity, largely through increased sales of our
prepaid and other products.
Significant growth in mobile communications market
South Africa has experienced significant growth in the number of mobile users since Global System for Mobile
Technology, or GSM, mobile services were launched in the country in 1994. The penetration rate for mobile users
increased from 2.4% at March 31, 1997 to 24.2% at March 31, 2002 and 26.6% at September 30, 2002. As a result,
Vodacom's revenues increased 21.6% and 38.7% in the 2002 and 2001 financial years, respectively, and 25.5% in the six
months ended September 30, 2002 as compared to the six months ended September 30, 2001. While we believe the mobile
penetration rate will continue to increase, we do not expect that it will continue to grow at the same high rates that it has
experienced in the recent past. Consequently, Vodacom is placing increased focus on customer retention and providing
value-added services in addition to its previous focus on customer acquisition, as well as selective growth in other African
countries.
A large part of the growth in mobile services was due to the success of prepaid services. Approximately 83.6% of
Vodacom's South African mobile customers were prepaid customers at September 30, 2002. Vodacom expects the number
of prepaid mobile users to continue to grow as a percentage of total mobile users. The increasing percentage of prepaid
users, who tend to have lower average usage, has resulted in decreasing overall average revenue per customer, despite
increasing average revenue per contract customer. In the future, as the mobile market matures and growth in the prepaid
market slows, average revenue per customer is expected to stabilize.
Tariff rebalancing
We have substantially completed a five-year tariff rebalancing program in our fixed-line business. This has reduced the
need for future tariff adjustments in the face of competition. We have decreased the ratio of tariffs for long distance calls to
all destinations over 200km compared to tariffs for local calls from 13.2:1 as of March 31, 1997 to 2.7:1 as of March 31,
2002. In addition, the weighted average effective price per minute to all international destinations decreased approximately
44% from January 1, 1998 to March 31, 2002. The following table shows our long distance to local call ratio for the
periods indicated.
As of March 31,
1997
1998
1999
2000
2001
2002
Long distance to local call ratio
13.2
9.2
7.7
6.9
5.8
2.7
The rebalancing of tariffs was performed within a price cap mechanism imposed by regulations that limited increases in
the overall tariffs in a basket of specified services that we previously had the exclusive right to provide. More than 80% of
Telkom's operating revenue is included in this basket. The overall tariffs for all services in the basket may not be increased
by more than 1.5% below inflation in South Africa, based on the consumer price index and measured using revenue for the
services in the basket at constant volumes for the prior year. In addition, prior to January 1, 2003, the price of any
individual product or service included in the basket of specified services could not be increased by more than 20% above
inflation in South Africa in any year. Effective January 1, 2003, the price of any individual product or service included in
the basket may not be increased by more than 5% above inflation in South Africa in any year. In December 2002, ICASA
approved our tariff filing providing for a 9.5% increase in the overall tariffs for all services in the basket effective January 1,
2003, based on the increase in the consumer price index for September 2002 of 12.5%. Average inflation in South Africa
was 5.7% in the year ended December 31, 2001 and 5.4% in the year ended December 31, 2000. See "Business Fixed-
line communications Fees and tariffs Tariff rebalancing" beginning on page 108 of this prospectus.
41
Interconnection agreements
Telkom amended its interconnection agreements with Vodacom and MTN and entered into a new interconnection
agreement with Cell C effective in November 2001. Telkom's amended interconnection agreements increased the portion of
fixed-to-mobile tariffs retained by Telkom effective from November 1, 2001. The adjustments also eliminated volume
discounts previously offered to mobile operators for termination of mobile-to-fixed calls on our fixed-line network and
equalized termination rates payable by Telkom to mobile operators for incoming international calls with national fixed-to-
mobile termination rates. Telkom's amended interconnection agreements also increased the discount offered on outgoing
international calls originating on the mobile networks in order to better prepare us for increased competition from Sentech
Limited and the second national operator and from small business operators in areas with a teledensity of less than 5%.
Telkom's interconnection agreements provide for annual increases in the portion of fixed-to-mobile tariffs retained by
Telkom and the termination rates payable by Telkom to the mobile operators as well as the termination rates payable to
Telkom from the mobile operators for mobile-to-fixed calls commencing in January 2003.
Effective in November 2001, Vodacom and MTN entered into an amended interconnection agreement with each other
and new interconnection agreements with Cell C. These agreements increased the amounts mobile operators are required to
pay one another for the termination of mobile-to-mobile calls from November 2001. These amendments also introduced an
interconnection rate of 4 SA Cents for the termination of calls by mobile operators for calls originating from other mobile
operator's community service phones, whereas previously these calls were terminated at no charge. These amendments
have increased Vodacom's payments to other operators, while increasing the interconnection revenues received by
Vodacom.
See "Business Fixed-line communications Fees and tariffs Interconnection tariffs" on page 111 of this prospectus.
Fixed-line license obligations
Our public switched telecommunications services license included service and fixed line roll-out targets that were
required to be met through May 7, 2002. We substantially met all of our fixed-line service and line roll-out targets with the
exception of our residential fault rate target, our aggregate fixed-line roll-out target and targets which required us to provide
service to underserviced villages and to replace analog lines with digital lines.
We elected not to roll-out lines in our last year of exclusivity in areas where it was not economical. As a result, we
missed our aggregate fixed-line roll-out target by 16,448 lines. Our license required us to pay penalties for missing these
license targets. We have provided for our estimate of the total penalties for failing to meet these targets of approximately
R15 million in the Telkom Group's financial statements for the year ended March 31, 2002 based on the previous
requirements contained in our existing license. This amount is subject to review by ICASA. We do not currently anticipate
that we will have any additional fixed line roll-out targets.
Fixed-line network modernization and line roll-out program
In 1997, we embarked on an extensive five year capital investment program in our fixed-line business. Our fixed-line
capital investment for the five years ended March 31, 2002 was R41.7 billion, of which R27.9 billion was for network
modernization and line roll-out. Our fixed-line capital investment program was mainly initiated to satisfy our license
obligations and prepare for competition by making substantial improvements to our fixed-line network services.
The following table shows the amounts included in our total fixed-line capital expenditure for the periods indicated.
Fixed-line capital expenditure
Six months ended
Year ended March 31,
September 30,
1998
1999
2000
2001
2002
2001
2002
ZAR
ZAR
ZAR
ZAR
ZAR
ZAR
ZAR
(unaudited)
(unaudited)
(in millions)
Network modernization . . . . . . . .
962
1,674
1,244
1,209
2,192
733
371
Line roll-out . . . . . . . . . . . . . .
3,658
6,971
4,230
3,994
1,769
849
318
Total network modernization and
line-roll-out . . . . . . . . . . . . .
4,620
8,645
5,474
5,203
3,961
1,582
689
Operational support systems . . . . . .
778
1,533
2,194
2,453
2,369
791
743
Company support and other . . . . . .
1,115
1,279
800
641
632
257
55
Total fixed-line capital expenditure .
6,513
11,457
8,468
8,297
6,962
2,630
1,487
Capital expenditure as a percentage
of fixed-line operating revenue (%) .
n/a
n/a
36
31
25
19
10
42
In the future, we intend to selectively invest in our fixed-line segment on a smaller scale based on customer demand and
economic viability. Having substantially completed our fixed-line roll-out, we expect future fixed-line capital expenditures
to be primarily for improving the quality of our network and our operational support systems. We have budgeted to spend
approximately R4.9 billion in the year ended March 31, 2003 on fixed-line capital expenditures.
Customer non-payments
We have experienced significant bad debts in our fixed-line business, particularly in impoverished areas where we were
required to expand our network pursuant to our license obligations. In response to these non-payments, we disconnected a
substantial number of telephone lines beginning in our 2001 financial year and incurred bad debt expenses of R965 million,
R671 million and R560 million in our fixed-line segment during the years ended March 31, 2002, 2001, and 2000,
respectively, and R75 million and R510 million in the six months ended September 30, 2002 and 2001, respectively. To
control our bad debts, we have implemented a more rapid disconnection policy for non-payments, continued and improved
credit vetting and controls, instituted a better collection program and continued to promote our prepaid fixed-line services.
Transformation of our fixed-line business from a majority government owned entity to a market and profit-oriented
enterprise
We are in the final stages of changing the orientation of our fixed-line business from a majority governmental owned
entity to a market and profit-oriented business. To achieve this, we began a transformation program in 1997 with the help of
our strategic equity investors to reorganize our fixed-line business along functional lines. Our focus was to change our
corporate culture, improve the skills of our South African employees, increase the focus of our marketing efforts, outsource
non-core operations and manage revenue generation and operating expenses more effectively.
Employee-related expenses are a significant component of our total fixed-line operating expenses. The number of our
fixed-line employees, excluding Telkom Directory Services and Swiftnet, declined by approximately 18,800 positions from
March 31, 1997 through September 30, 2002. We spent R373 million, R132 million and R303 million in the years ended
March 31, 2002, 2001 and 2000, respectively, and R169 million and R195 million in the six months ended September 30,
2002 and 2001, respectively, on our employee restructuring program. We intend to continue to reduce our fixed-line
headcount over the next five years.
In addition, we have identified and outsourced six non-core activities since March 31, 2000. Through March 31, 2002,
we received R804 million from our outsourcing program. We recently announced our intention to dispose of our property
portfolio through a sale and leaseback transaction. See " Recent developments Property portfolio" on page 43 of this
prospectus.
Volatility of the Rand and adoption of IAS 39
In recent years, the value of the Rand as measured against the Dollar has declined considerably. The Rand declined from
R5.90 per $1.00 at December 31, 1998 to R12.00 per $1.00 at December 31, 2001. The exchange rate between the Rand
and the Dollar was R10.54 per $1.00 as of September 30, 2002 and R8.10 per $1.00 as of February 25, 2003. Telkom's
policy is to fully hedge its foreign denominated debt and operating and capital expenditures. Vodacom's policy is to hedge
its foreign denominated operating and capital expenditures for its South African operations. Further decreases in the value
of the Rand as measured against other currencies could increase the future cost in Rand terms of our foreign denominated
debt, our foreign denominated financing costs and our foreign denominated operating and capital expenditures.
During the year ended March 31, 2002, Telkom and Vodacom prospectively adopted IAS 39 Recognition and
Measurement of Financial Instruments. Under this standard, fair value adjustments on financial instruments are recorded in
the Telkom Group's consolidated financial statements in the period they occur. The effect of the application of this new
standard increased our consolidated opening retained earnings balance by R584 million and increased our consolidated
profit before tax by R635 million on a non-cash basis in the 2002 financial year. In the six months ended September 30,
2002, the effect of the application of this standard decreased our consolidated profit before tax by R367 million on a non-
cash basis. Future exchange rate volatility is expected to continue to materially impact our future results due to the large
volume of foreign exchange contracts entered into by us to cover our foreign currency denominated debt, financing and
operating costs and capital expenditures. Since September 30, 2002, the value of the Rand has increased as measured
against the Dollar and the Euro. Due to this increase, the Telkom Group's net income is likely to be significantly negatively
affected by foreign exchange losses in the year ended March 31, 2003.
Strategic equity investor participation
We have significantly benefited over the past five years from the knowledge and experience of our strategic equity
investors, SBC Communications and Telekom Malaysia. We are a party to a strategic services agreement with our strategic
equity investors pursuant to which they had the ability to exercise effective operational and managerial control over us until
May 2002. Our strategic equity investors provided us with a number of management and operational services, including
43
participation in Telkom's operating committee and provided us with a number of key employees who served in various
management and executive officer positions. Since May 2002, our strategic equity investors no longer exercise effective
operational and managerial control over us, but their nominees continue to occupy key managerial positions, including
chief operating officer, chief financial officer and chief strategic officer, and they participate in Telkom's operating
committee and continue to provide us with strategic direction. We paid R219 million, R260 million and R260 million in the
years ended March 31, 2002, 2001 and 2000, respectively, and R115 million and R141 million in the six months ended
September 30, 2002 and 2001, respectively, to our strategic equity investors for the strategic services they provided to us
pursuant to the strategic services agreement. We expect to continue to make payments to our strategic equity investors for
these services. See "Relationship with Major Shareholders and Related Transactions Shareholder arrangements
Strategic services agreement" beginning on page 160 of this prospectus.
Telcordia dispute
Telkom spent R594 million in the 2000 and 2001 financial years for the development and supply of an integrated end-to-
end customer assurance and activation system by Telcordia. In the 2001 financial year, the agreement with Telcordia was
terminated. Telkom wrote off R119 million of this investment in the 2001 financial year. Following an assessment of the
viability of the assets related to the Telcordia initiative, Telkom wrote-off the balance of these assets of R346 million in the
2002 financial year. In March 2001, Telcordia instituted arbitration proceedings against Telkom, seeking approximately
$130 million for monies outstanding and damages, plus interest at a rate of 15.5% per year. In September 2002, a partial
ruling was issued by the arbitrator in favor of Telcordia. Telkom has launched review proceedings in the South African
High Court in respect of this partial ruling. The arbitration proceedings and the amount of Telkom's liability are not
expected to be finalized until late 2003 or early 2004. Telkom has provided R373 million for its estimate of probable
liabilities, including interest, in respect of the Telcordia claim in the Telkom Group's consolidated financial statements as of
September 30, 2002. See "Risk Factors Risks Related to Regulatory and Legal Matters If Telcordia Technologies
Incorporated, a New Jersey corporation, were able to recover substantial damages in its arbitration proceedings against
Telkom, Telkom would be required to fund such payments from cash flows or drawings on its existing credit facilities,
which could cause Telkom's indebtedness to increase and its net profit to decline" on page 22 and "Legal Proceedings" on
page 130 of this prospectus.
Vodacom's sale of non-core assets
Vodacom has sold off all its non-core assets in line with its strategy to focus on its core mobile business. These
companies included Teljoy Holdings (Proprietary) Limited, a television rental company incorporated in the Republic of
South Africa; Vodacom World Online (Proprietary) Limited, an internet company incorporated in the Republic of South
Africa; and Vodacom Sport & Entertainment (Proprietary) Limited, Vodacom's former sponsorship and event management
company incorporated in the Republic of South Africa. The sale of Vodacom's non-core assets in 2002, the write-off of
Vodacom's investment in Globalstar, a satellite network, in 2001, and the costs incurred in restructuring Vodacom's service
providers in 2001, resulted in a profit of R56 million in the year ended March 31, 2002, a loss of R213 million in the year
ended March 31, 2001 and a profit of R129 million in the year ended March 31, 2000. These amounts are attributable to
our interest in Vodacom, 50% of which are included in the Telkom Group's consolidated operating expenses. Vodacom
intends to avoid future investment in non-core interests.
Theft, vandalism, network fraud and non-licensed operators
We have experienced significant cable theft, theft of solar panels and wireless communications equipment, vandalism of
payphones and network fraud, such as non-licensed calls, in our fixed-line business. Theft and vandalism have caused our
fixed-line fault rates to increase, and the repair time on our network and network downtime associated with such faults have
resulted in lost operating revenue and increased costs. We have also lost operating revenue to non-licensed operators
providing telecommunications services in South Africa. We estimate that we lost revenue of R174 million in the year ended
March 31, 2002 from network fraud. If we are unable to minimize theft, vandalism and network fraud, or if we continue to
lose operating revenue to non-licensed operators in our fixed-line business, our fixed-line fault rates could increase and our
operating revenue and net profit could decline.
Recent developments
Property portfolio
On September 1, 2002, we issued an information memorandum inviting potential investors to provide to us by
November 2002, preliminary submissions to purchase a substantial portion of our fixed-line property portfolio and lease
that property back to us. This transaction is expected to involve over 1,400 properties ranging from warehouses and
exchange buildings to our national network operations center and is intended to further our strategy of focusing on our core
businesses. We are currently reviewing the bids we have received to date after having completed a due diligence process.

44
Summary of operations
Our operating results reflect the factors and changing patterns described in " Principal factors that affect our results of
operations" beginning on page 39 of this prospectus. The key business changes during the three years ended March 31,
2002, 2001 and 2000 and each of the six month periods ended September 30, 2002 and 2001 were:
•increased revenues and profitability from our mobile segment due to an increased number of mobile customers;
•increased revenues and profitability from our mobile and fixed-line data services;
• increased fixed-line local traffic revenues and decreased fixed-line long distance and international traffic revenues due
to tariff rebalancing;
•increased fixed-to-mobile traffic revenues;
•reduced numbers of employees as we focused on improving the profitability of our fixed-line segment; and
•significant capital expenditures to meet fixed-line license obligations in South Africa and support mobile expansion in
South Africa and other sub-Saharan African countries.
Our operating structure comprises two segments, fixed-line and mobile. Our fixed-line segment provides fixed-line voice
and data communications services through Telkom; directory services through our 64.9% owned subsidiary, Telkom
Directory Services; and wireless data services through our wholly-owned subsidiary, Swiftnet. Our mobile segment consists
of our 50% interest in Vodacom.
We proportionately consolidate Vodacom's results into the Telkom Group's consolidated financial statements. This
means that we include 50% of Vodacom's results in each of the line items in the Telkom Group's consolidated financial
statements and in the period-to-period discussion below. We fully consolidate our Telkom Directory Services and Swiftnet
subsidiaries in the Telkom Group's consolidated financial statements.
Results of operations
Six months ended September 30, 2002 compared to six months ended September 30, 2001
Consolidated results
The following table shows information related to our operating revenue, operating expenses, operating profit, net profit,
profit margin, EBITDA and EBITDA margin for the periods indicated.
Telkom Group's segmental results
Six months ended September 30,
Six months
2001
2002
2002/2001
ZAR
%
ZAR
%
% change
(unaudited)
(in millions, except percentages)
Operating revenue . . . . . . . . . . .
16,523
100.0
18,316
100.0
10.9
Fixed-line . . . . . . . . . . . . . . . .
13,658
82.6
14,563
79.5
6.6
Mobile . . . . . . . . . . . . . . . . . .
3,762
22.8
4,720
25.8
25.5
Intercompany eliminations . . . . . . . .
(897)
(5.4)
(967)
(5.3)
7.8
Operating expenses . . . . . . . . . . .
14,355
100.0
15,505
100.0
8.0
Fixed-line . . . . . . . . . . . . . . . .
12,243
85.3
12,669
81.7
3.5
Mobile . . . . . . . . . . . . . . . . . .
2,975
20.7
3,800
24.5
27.7
Intercompany eliminations . . . . . . . .
(863)
(6.0)
(964)
(6.2)
11.7
Operating profit . . . . . . . . . . . . .
2,168
100.0
2,811
100.0
29.7
Fixed-line . . . . . . . . . . . . . . . .
1,415
65.3
1,894
67.4
33.9
Mobile . . . . . . . . . . . . . . . . . .
787
36.3
920
32.7
16.9
Intercompany eliminations . . . . . . . .
(34)
(1.6)
(3)
(0.1)
91.2
Net profit . . . . . . . . . . . . . . . .
371
100.0
644
100.0
73.6
Profit margin (%) . . . . . . . . . . . .
2.2
3.5
EBITDA
1
. . . . . . . . . . . . . . . .
4,811
100
5,917
100.0
23.0
Fixed-line . . . . . . . . . . . . . . . .
3,572
74.2
4,396
74.3
23.1
Mobile . . . . . . . . . . . . . . . . . .
1,271
26.5
1,515
25.6
19.2
Intercompany eliminations . . . . . . . .
(32)
(0.7)
6
0.1
(118.8)
EBITDA margin (%) . . . . . . . . . .
29.1
32.3

45
1
EBITDA represents operating profit before income tax, finance charges, investment income and depreciation and amortization. We
believe that EBITDA provides meaningful additional information to investors since it is widely accepted by analysts and investors as a
basis for comparing a company's underlying operating profitability with that of other companies as it is not influenced by past capital
expenditures or business acquisitions, a company's capital structure or the relevant tax regime. This is particularly the case in a capital-
intensive industry such as communications. It is also a widely accepted indicator of a company's ability to service its long-term debt
and other fixed obligations and to fund its continued growth. EBITDA is not a US GAAP or IAS measure. You should not construe
EBITDA as an alternative to operating profit or cash flows from operating activities determined in accordance with US GAAP or IAS or
as a measure of liquidity. EBITDA is not defined in the same manner by all companies and may not be comparable to other similarly
titled measures of other companies unless the definition is the same. In addition, because the calculation of EBITDA in the maintenance
covenants contained in our credit facilities is based on accounting policies in use at the time the indebtedness was incurred, EBITDA
for purposes of those covenants is not calculated in the same manner as it is calculated in the above table. Mobile EBITDA includes a
net gain of R12.8 million and nil in the six months ended September 30, 2001 and 2002, respectively, for our 50% share of Vodacom's
integration costs, disposals of operations and impairments.
Operating revenue
Operating revenue increased 10.9% in the six months ended September 30, 2002 compared to the six months ended
September 30, 2001 primarily due to increased average tariffs in our fixed-line segment and customer growth in our mobile
segment. Fixed-line operating revenue accounted for 79.5% of our consolidated operating revenue before intercompany
eliminations during the six months ended September 30, 2002.
Operating expenses
Operating expenses increased 8.0% in the six months ended September 30, 2002 compared to the six months ended
September 30, 2001 due to increased operating expenses in our fixed-line and mobile segments. The increase in fixed-line
operating expenses was primarily due to increased depreciation, payments to other network operators and employee
expenses. These increases were partially offset by lower bad debt expense during the period and a reduction of the bad debt
provision on our balance sheet resulting from an improvement in the aging of receivables made possible by improvements
in debtor management. The increase in mobile operating expenses was primarily due to increased payments to other
network operators, depreciation associated with increased capital expenditures and selling and distribution expenses as a
result of the growth in our mobile segment.
Operating profit
Operating profit increased 29.7% in the six months ended September 30, 2002 compared to the six months ended
September 30, 2001 due to increased operating profit in our fixed-line and mobile segments. Operating profit in our
fixed-line segment increased 33.9% in the six months ended September 30, 2002 compared to the six months ended
September 30, 2001 as higher revenue driven by tariff increases outpaced slower growth in operating expenses. Operating
profit in our mobile segment increased 16.9% in the six months ended September 30, 2002 compared to the six months
ended September 30, 2001 primarily due to substantial increases in the number of Vodacom's mobile customers and
revenue and slower growth in operating expenses.
Investment income
Investment income consists of interest received on trade receivables, short-term investments and bank accounts and
income received from our investments, including satellite companies. Investment income decreased 50.3% to R152 million
in the six months ended September 30, 2002 from R306 million in the six months ended September 30, 2001. The decrease
was primarily due to lower interest received as a result of lower average balances in investments and bank accounts, the
collection of an R844 million receivable from the South African Revenue Services in the six months ended September 30,
2002 and a more rapid collection of trade debtors.
Finance charges
Finance charges include interest paid on local and foreign borrowings, amortized discounts on bonds and commercial
paper bills, fair value gains and losses on financial instruments and foreign exchange gains and losses. We prospectively
adopted IAS 39 in the 2002 financial year. Accordingly, the impact of IAS 39 was included in both six month periods
ended September 30, 2002 and 2001. The following table sets forth information related to our finance charges for the
periods indicated.
46
Finance Charges
Six months ended
Six months
September 30,
2002/2001
2001
2002
% change
ZAR
ZAR
ZAR
(unaudited)
(in millions, except percentages)
Interest expense . . . . . . . . . . . . . . . . . . . . . . . . . . . .
1,420
1,412
(0.6)
Local loans . . . . . . . . . . . . . . . . . . . . . . . . . . . . .
1,226
1,281
4.5
Foreign loans . . . . . . . . . . . . . . . . . . . . . . . . . . . .
261
228
(12.6)
Finance charges capitalized . . . . . . . . . . . . . . . . . . . . .
(67)
(97)
44.8
Net fair value losses/(gains) on financial instruments . . . . . . .
425
367
(13.6)
Total finance charges . . . . . . . . . . . . . . . . . . . . . . . . .
1,845
1,779
(3.6)
Finance charges decreased 3.6% in the six months ended September 30, 2002 compared to the six months ended
September 30, 2001 due to a 13.6% decrease in net fair value losses on financial instruments and a 0.6% decrease in
interest expense. The decrease in net fair value losses was primarily due to lower foreign denominated bank loans and
foreign currency denominated purchases. The decrease in interest expense was primarily due to lower balances on foreign
loans and increased finance charges capitalized due to an increased number of qualifying assets completed during the
period, partially offset by increased balances on local loans.
Taxation
Our consolidated tax expense increased significantly to R456 million in the six months ended September 30, 2002 from
R206 million in the six months ended September 30, 2001. Our consolidated effective tax rate was 38.5% and 32.8% in the
six months ended September 30, 2002 and 2001, respectively. Telkom's effective tax rate was 48.4% and 21.6% in the six
months ended September 30, 2002 and 2001, respectively. The increase in Telkom's consolidated effective tax rate was due
to an increase in non-deductible expenses primarily relating to expenses associated with the initial public offering.
Vodacom's effective tax rate was 34.1% and 30.3%, respectively, in the six months ended September 30, 2002 and 2001.
The increase in consolidated tax expense in the six months ended September 30, 2002 was primarily due to increased
operating profit. South African companies became subject to capital gains tax on October 1, 2001. As a result, we were
previously not required to pay capital gains tax. See "Taxation" beginning on page 186 of this prospectus.
Minority interests
Minority interests in the income of subsidiaries increased 61.5% to R84 million in the six months ended September 30,
2002 from R52 million in the six months ended September 30, 2001 due to increased profits in our Telkom Directory
Services and Swiftnet subsidiaries despite the decrease in minority ownership in these subsidiaries during the 2002
financial year. We acquired a further 10% interest in Telkom Directory Services in October 2001 and the remaining 40%
interest in Swiftnet in May 2001.
Net profit
Net profit increased 73.6% to R644 million in the six months ended September 30, 2002 from R371 million in the six
months ended September 30, 2001 primarily due to increased operating profit in both our fixed-line and mobile segments
and decreased finance charges, partially offset by lower investment income.
Fixed-line segment
The following is a discussion of the results of operations from our fixed-line segment before eliminations of
intercompany transactions with Vodacom. Our fixed-line segment is our largest segment based on revenue and profit
contribution and includes all the operating activities derived from Telkom's fixed-line voice and data communications
services business, as well as directory services through our 64.9% owned Telkom Directory Services subsidiary, and
wireless data services through our wholly-owned Swiftnet subsidiary.
47
Fixed-line operating revenue
Our fixed-line operating revenue is derived principally from fixed-line subscriptions and connections; traffic, which
comprises local and long-distance traffic, fixed-to-mobile traffic and international outgoing traffic; and interconnection,
which comprises terminating and transiting traffic. We also derive fixed-line operating revenue from our data business,
which includes data transmission services, managed data networking services and internet access and related information
technology services; and our directory businesses. The following table shows operating revenue for our fixed-line segment
broken down by major business areas and as a percentage of total revenue for our fixed-line segment and the percentage
change by business area for the periods indicated.
Fixed-line operating revenue
Six months ended September 30,
2001
2002
Six months
% of
% of
2002/2001
ZAR
revenue
ZAR
revenue
% change
(unaudited)
(in millions, except percentages)
Subscriptions and connections . . . . . .
2,208
16.2
2,239
15.4
1.4
Traffic . . . . . . . . . . . . . . . . . . .
8,495
62.2
8,911
61.2
4.9
Local . . . . . . . . . . . . . . . . . .
2,377
17.4
2,723
18.7
14.6
Long-distance . . . . . . . . . . . . . .
1,994
14.6
1,787
12.3
(10.4)
Fixed-to-mobile . . . . . . . . . . . . .
3,508
25.7
3,770
25.9
7.5
International outgoing . . . . . . . . . .
616
4.5
631
4.3
2.4
Interconnection . . . . . . . . . . . . . .
705
5.1
907
6.2
28.7
Data . . . . . . . . . . . . . . . . . . . .
1,881
13.8
2,112
14.5
12.3
Directories and other services . . . . . .
369
2.7
394
2.7
6.8
Fixed-line operating revenue . . . . . .
13,658
100.0
14,563
100.0
6.6
Operating revenue from our fixed-line segment increased 6.6% in the six months ended September 30, 2002 compared
to the six months ended September 30, 2001 primarily due to increased average tariffs, partially offset by a decline in the
number of fixed access lines in service as a result of disconnections due to customer non-payments and customer migration
to mobile services. Traffic decreased 3.5% in the six months ended September 30, 2002 compared to the six months ended
September 30, 2001. Revenue per fixed access line continued to improve, increasing 7.1% to R2,456 in the six months
ended September 30, 2002 compared to R2,294 in the six months ended September 30, 2001 as we increased our
penetration of value-added voice services and higher revenue generating access services and decreased the number of our
fixed access lines. We also increased our data revenues in the six months ended September 30, 2002 as demand for data
services increased.
Subscriptions and connections. Revenue from subscriptions and connections consists of revenue from connection fees,
monthly rental charges, value-added voice services and the sale and rental of customer premises equipment for postpaid
and prepaid PSTN lines, which includes ISDN channels, and private payphones. We launched asynchronous digital
subscriber line, or ADSL, service in August 2002. Subscription and connection revenue is principally a function of the
number and mix of residential and business lines in service, the number of private payphones in service and the
corresponding charges.
48
The following table sets forth information related to our fixed-line subscription and connection revenue during the
periods indicated.
Fixed-line subscription and connection revenue
Six months ended September 30,
Six months
2002/2001
2001
2002
% change
(unaudited)
Total subscriptions and connections revenue
(ZAR millions, except percentages) . . . . . . . . . . . . . . . .
2,208
2,239
1.4
Total subscription access lines (thousands, except percentages)
1
4,821
4,727
(1.9)
Postpaid . . . . . . . . . . . . . . . . . . . . . . . . . . . . . .
4,182
3,929
(6.0)
PSTN
2
. . . . . . . . . . . . . . . . . . . . . . . . . . . . . .
3,761
3,407
(9.4)
ISDN channels . . . . . . . . . . . . . . . . . . . . . . . . .
421
522
24.0
Prepaid . . . . . . . . . . . . . . . . . . . . . . . . . . . . . .
615
780
26.8
Private payphones . . . . . . . . . . . . . . . . . . . . . . . . .
24
18
(25.0)
1
Total subscription access lines are comprised of PSTN lines, including ISDN lines, private payphones and internal lines in service, but
excludes public payphones. Telkom had 136,459 and 157,942 internal lines as of September 30, 2002 and 2001, respectively. Each
PSTN line includes one access channel, each basic ISDN line includes two access channels and each primary ISDN line includes
30 access channels.
2
PSTN lines include copper cable, ADSL, digital enhanced cordless technology, or DECT, and fiber.
Revenue from subscriptions and connections increased 1.4% in the six months ended September 30, 2002 compared to
the six months ended September 30, 2001 primarily due to an increase in average monthly subscriptions and connections
tariffs, partially offset by the lower number of fixed access lines in service as a result of disconnections due to customer
non-payments and customer migration to mobile services. The decrease in postpaid PSTN lines in the six months ended
September 30, 2002 was partially offset by increases in the number of postpaid ISDN channels, which have higher
subscription rates than PSTN lines, and in the number of prepaid PSTN lines. The increases in the number of postpaid
ISDN channels was driven by increased demand for higher bandwidth and functionality. The increase in prepaid lines was
mainly due to our continued marketing efforts for our prepaid telephone services in the six months ended September 30,
2002, particularly to first-time residential customers with poor or no credit histories.
For a discussion of our connection and rental fees, see "Business Fixed-line communications Fees and tariffs
Subscription and connection tariffs" on page 109 of this prospectus and for a discussion of the number of customers during
the periods, see "Business Fixed-line communications Products and services" beginning on page 104 of this prospectus.
Traffic. Traffic revenue consists of revenue from local, long distance, fixed-to-mobile and international outgoing calls.
Traffic revenue is principally a function of tariffs and the number, duration and mix between relatively more expensive
domestic long distance, international and fixed-to-mobile calls and less expensive local calls.
The following table sets forth information related to our total fixed-line traffic revenue for the periods indicated.
Total fixed-line traffic revenue
Six months ended September 30,
Six months
2002/2001
2001
2002
% change
(unaudited)
Total traffic revenue (ZAR millions, except percentages) . . . . . .
8,495
8,911
4.9
Traffic (millions of minutes, except percentages)
1
. . . . . . . . .
15,143
14,613
(3.5)
Average monthly traffic minutes per average monthly access line
(minutes)
2
. . . . . . . . . . . . . . . . . . . . . . . . . . . . . . .
523
512
(2.1)
1
Traffic is calculated by dividing total traffic revenues by the weighted average tariff during the relevant period. Traffic includes internet
traffic.
2
Average traffic minutes per average monthly access line are calculated by averaging the total traffic during each month in the period
divided by the average number of access lines in each month during the period.
Traffic revenue increased 4.9% in the six months ended September 30, 2002 compared to the six months ended
September 30, 2001 primarily due to increased local and fixed-to-mobile traffic tariffs, partially offset by lower long-
distance and international traffic tariffs. Traffic decreased 3.5% in the six months ended September 30, 2002 compared to
the six months ended September 30, 2001 primarily due to lower local, fixed-to-mobile and long distance traffic, partially
offset by increased international traffic. Traffic was adversely affected in the six months ended September 30, 2002 by a
49
decrease in the number of fixed access lines in service as a result of disconnections due to customer non-payments and
customer migration to mobile services. In addition, traffic was adversely affected by the increasing substitution of calls
placed using mobile services rather than our fixed-line service.
For a discussion of our traffic tariffs, see "Business - Fixed-line communications - Fees and tariffs - Traffic tariffs"
beginning on page 110 of this prospectus and for a discussion of our traffic during the periods discussed, see "Business
Fixed-line communications - Traffic" beginning on page 105 of this prospectus.
The following table sets forth information related to our fixed-line local traffic revenues for the periods indicated.
Local traffic revenue
Six months ended September 30,
Six months
2002/2001
2001
2002
% change
(unaudited)
Local traffic revenue (ZAR millions, except percentages) . . . . .
2,377
2,723
14.6
Local traffic (millions of minutes, except percentages)
1
. . . . . .
10,246
9,870
(3.7)
1
Local traffic is calculated by dividing total local traffic revenue by the weighted average local traffic tariff during the relevant period.
Local traffic includes internet traffic.
Local traffic revenue increased 14.6% in the six months ended September 30, 2002 compared to the six months ended
September 30, 2001 primarily due to increased local traffic tariffs and a change in the mix of call packages, partially offset
by a decline in local traffic. Local traffic decreased 3.7% in the six months ended September 30, 2002 compared to the six
months ended September 30, 2001. Local traffic was adversely affected by a decrease in the number of fixed access lines in
service in the six months ended September 30, 2002 as a result of disconnections due to customer non-payments and
customer migration to mobile services. In addition, local traffic was adversely affected by the increasing substitution of
local calls placed using mobile services rather than our fixed-line service.
The following table sets forth information related to our fixed-line long distance traffic revenue for the periods indicated.
Long distance traffic revenue
Six months ended September 30,
Six months
2002/2001
2001
2002
% change
(unaudited)
Long distance traffic revenue (ZAR millions, except percentages) .
1,994
1,787
(10.4)
Long distance traffic (millions of minutes, except percentages)
1
. .
2,492
2,445
(1.9)
1
Long distance traffic is calculated by dividing total long distance traffic revenue by the weighted average long distance traffic tariff
during the relevant period.
Long distance traffic revenue decreased 10.4% in the six months ended September 30, 2002 compared to the six months
ended September 30, 2001 primarily due to decreased long distance traffic tariffs and decreased long distance traffic.
Long distance traffic decreased 1.9% in the six months ended September 30, 2002 compared to the six months ended
September 30, 2001. Long distance traffic was adversely impacted by a decrease in the number of fixed access lines in
service during the six months ended September 30, 2002 as a result of disconnections due to customer non-payments and
customer migration to mobile services. In addition, long distance traffic was adversely affected by the increasing
substitution of national long distance calls using mobile services rather than our fixed-line long distance service.
Historically, fixed-line long distance traffic tariffs were higher than the price of mobile calls, which are not distance
dependent. We have reduced our long-distance traffic tariffs to below mobile tariffs over the past five years as a result of
our tariff rebalancing program.
Revenue from fixed-to-mobile traffic consists of revenue from calls made by our fixed-line customers to the three mobile
networks in South Africa and is primarily a function of fixed-to-mobile traffic tariffs and the number, duration and mix of
calls between fixed-line and mobile customers.
50
The following table sets forth information related to our fixed-to-mobile traffic revenue for the periods indicated.
Fixed-to-mobile traffic revenue
Six months ended September 30,
Six months
2002/2001
2001
2002
% change
(unaudited)
Fixed-to-mobile traffic revenue (ZAR millions, except percentages)
3,508
3,770
7.5
Fixed-to-mobile traffic (millions of minutes, except percentages) 1
2,221
2,079
(6.4)
1
Fixed-to-mobile traffic is calculated by dividing total fixed-to-mobile traffic revenue by the weighted average fixed-to-mobile traffic
tariff during the relevant period.
Fixed-to-mobile traffic revenue increased 7.5% in the six months ended September 30, 2002 compared to the six months
ended September 30, 2001 primarily due to fixed-to-mobile traffic tariff increases as a result of the amendment of our
interconnection agreement with MTN and Vodacom and our new interconnection agreement with Cell C effective in
November 2001, partially offset by a decrease in fixed-to-mobile traffic and a change in the mix of call packages and
associated discounts. Fixed-to-mobile traffic decreased 6.4% in the six months ended September 30, 2002 compared to the
six months ended September 30, 2001 as a result of an effective 15.5% increase in tariffs in November 2001 and a decrease
in the number of fixed-line subscribers due to disconnections for customer non-payments and customer migration to mobile
services and due to the growth in mobile users resulting in the increasing substitution of mobile-to-mobile calls that are not
routed over our fixed-line network.
Revenue from international outgoing traffic consists of revenue from calls made by our fixed-line customers to
international destinations and is a function of tariffs and the number, duration and mix of calls to destinations outside South
Africa.
The following table sets forth information related to our international outgoing traffic revenue for the periods indicated.
International outgoing traffic revenue
Six months ended September 30,
Six months
2002/2001
2001
2002
% change
(unaudited)
International outgoing traffic revenue (ZAR millions, except percentages)
616
631
2.4
International outgoing traffic (millions of minutes, except percentages) 1
-
184
219
19.0
1
International outgoing traffic is calculated by dividing total international outgoing traffic revenue by the weighted average international
outgoing traffic tariff during the relevant period.
International outgoing traffic revenue increased 2.4% in the six months ended September 30, 2002 compared to the six
months ended September 30, 2001 primarily due to increased international outgoing traffic and a change in the mix of
calling destinations, partially offset by decreases in average international outgoing traffic tariffs as a result of our tariff
rebalancing program. International outgoing traffic increased 19.0% in the six months ended September 30, 2002 compared
to the six months ended September 30, 2001 primarily due to lower tariffs associated with our tariff rebalancing program
and increased marketing efforts.
Interconnection. We generate revenue from interconnection services for traffic from calls made by other operators'
subscribers that terminate on or transit through our network. Revenue from interconnection services includes payments
from domestic mobile and international operators regardless of where the traffic originates or terminates.
51
The following table sets forth information related to interconnection service revenue for the periods indicated.
Interconnection revenue
Six months ended September 30,
Six months
2002/2001
2001
2002
% change
(unaudited)
Interconnection revenue (ZAR millions, except percentages) . .
705
907
28.7
Domestic mobile interconnection
Interconnection revenue from domestic mobile operators
(ZAR millions, except percentages) . . . . . . . . . . . . . . . .
261
284
8.8
Domestic mobile interconnection traffic (millions of minutes,
except percentages) 1 . . . . . . . . . . . . . . . . . . . . . . . .
975
1,034
6.1
International interconnection
Interconnection revenue from international operators
(ZAR millions, except percentages) . . . . . . . . . . . . . . . .
444
623
40.3
International interconnection traffic (millions of minutes,
except percentages) 2 . . . . . . . . . . . . . . . . . . . . . . . .
502
498
(0.8)
1
Domestic mobile-to-fixed interconnection traffic is calculated by dividing total domestic mobile-to-fixed interconnection traffic revenue
by the weighted average domestic mobile-to-fixed interconnection traffic tariff during the relevant period. International outgoing mobile
traffic is based on the actual traffic registered through the respective exchanges and reflected in invoices.
2
International interconnection traffic is based on the actual traffic registered through the respective exchanges and reflected in invoices.
Interconnection revenue from domestic mobile operators includes revenue for call termination and international
outgoing calls from domestic mobile networks, as well as access to other services, such as emergency services and
directory enquiry services. Interconnection revenue from domestic mobile operators increased 8.8% in the six months
ended September 30, 2002 compared to the six months ended September 30, 2001 due to a reduction in the number of time
bands for peak and off peak tariffs from three to two, effectively increasing mobile termination rates, and increased mobile-
to-fixed terminating traffic. The increase in mobile-to-fixed terminating traffic was due to an overall increase in mobile calls
as a result of the introduction of per second billing by mobile operators and the entrance of Cell C into the mobile market.
Interconnection revenue from domestic operators includes fees paid to our fixed-line business by Vodacom of
R164 million in the six months ended September 30, 2002 and R159 million in the six months ended September 30, 2001.
Fifty percent of these amounts were attributable to our interest in Vodacom and were eliminated from the Telkom Group's
revenue in consolidation. We expect interconnection revenue from domestic operators to increase as a result of the entrance
of the second national operator in 2003 or the first quarter of 2004 and the further liberalization of the South African
telecommunications industry.
Interconnection revenue from international operators includes amounts paid by foreign operators for the use of our
network to terminate calls made by customers of such operators and payments from foreign operators for interconnection
transiting traffic through our network to other foreign networks. International interconnection traffic consists of
international termination traffic and international transiting traffic. Interconnection revenue from international operators
increased 40.3% in the six months ended September 30, 2002 compared to the six months ended September 30, 2001 due
to an increase in international interconnection tariffs, increases in the Rand value of international settlement rates due to a
decline in the value of the Rand against the SDR, the notional currency in which international traffic settlement rates are
determined, and increases in international termination traffic. These increases were partially offset by decreases in
international transiting traffic due to aggressive competition from other international carriers.
Data. Data services comprise data transmission services, including leased lines and packet-based services, managed data
networking services and internet access and related information technology services. In addition, data services include
revenue from ADSL, which we launched in August 2002. Revenue from data services is principally a function of tariffs, the
terms of a customer's service level agreement and monthly rentals.
52
The following table sets forth information related to revenue from data services for the periods indicated.
Data services revenue
Six months ended September 30,
Six months
2002/2001
2001
2002
% change
(unaudited)
Data services revenue (ZAR millions, except percentages) . . .
1,881
2,112
12.3
Leased lines and other data revenue
1
. . . . . . . . . . . . . . .
1,476
1,621
9.8
Leased line facilities revenue from mobile operators . . . . . . .
405
491
21.2
Number of leased lines 2 . . . . . . . . . . . . . . . . . . . . . . .
n/a
355,533
n/a
Number of managed network sites - . . . . . . . . . . . . . . . .
5,113
6,636
29.8
1
Leased lines and other data revenue includes all data services revenue other than leased line facilities revenue from mobile operators.
2
Converted into voice grade equivalents using 64 kilobits per second, excludes leased lines to mobile operators. We replaced our data
billing and customer care systems in July 2002. Our new systems exclude non-revenue generating lines from the definition of leased
lines.
As a result, we are not able to provide comparable leased lines for the six months ended September 30, 2001.
Our data services revenue increased 12.3% in the six months ended September 30, 2002 compared to the six months
ended September 30, 2001. The increase was primarily due to increased penetration of leased lines to mobile operators and
increased penetration of leased lines in corporate and business markets, increased demand for bandwidth with higher
capacity and increased numbers of customers using data managed networking services. Revenue from leased line facilities
to mobile operators increased 21.2% in the six months ended September 30, 2002 compared to the six months ended
September 30, 2001 primarily due to growth in the mobile market and the introduction of Cell C in November 2001.
Operating revenue from our data services included R231 million and R191 million in revenue received by our fixed-line
business from Vodacom in the six months ended September 30, 2002 and 2001, respectively. Fifty percent of these amounts
were attributable to our interest in Vodacom and were eliminated from the Telkom Group's revenue in consolidation.
For a discussion of our data services, see "Business - Fixed-line communications - Products and services - Data
communications services" beginning on page 106 of this prospectus.
Directories and other services. Revenue from directories and other services consists primarily of advertising revenue
from our subsidiary, Telkom Directory Services, and, to a substantially lesser degree, wireless data services revenue from
our subsidiary, Swiftnet, and other miscellaneous revenue, including revenue from the sale of materials. Revenue from
directories and other services increased 6.8% in the six months ended September 30, 2002 compared to the six months
ended September 30, 2001 due to increases in directory services revenue from Telkom Directory Services as a result of
increased marketing efforts resulting in increased spending on advertising by existing customers and additional advertising
revenue from new customers.
Fixed-line operating expenses
The following table shows the operating expenses of our fixed-line segment broken down by expense category as a
percentage of total revenue and the percentage change by operating expense category for the periods indicated.
Fixed-line operating expenses
Six months ended September 30,
2001
2002
Six months
% of
% of
2002/2001
ZAR
revenue
ZAR
revenue
% change
(unaudited)
(in millions, except percentages)
Employee expenses . . . . . . . . . . . .
3,341
24.5
3,460
23.7
3.6
Payments to other network operators - . .. .. .
3,161
23.1
3,443
23.6
8.9
Selling, general and administrative
expenses . . . . . . . . . . . . . . . . .
1,943
14.2
1,595
11.0
(17.9)
Services rendered . . . . . . . . . . . . .
1,073
7.9
1,086
7.5
1.2
Operating leases . . . . . . . . . . . . . .
567
4.1
583
4.0
2.8
Depreciation and amortization . . . . . . .
2,158
15.8
2,502
17.2
15.9
Fixed-line operating expenses . . . . . .
12,243
89.6
12,669
87.0
3.5
Employee expenses. Employee expenses consist mainly of salaries and wages for employees, including bonuses and
other incentives, benefits and employee retrenchment expenses.

53
The following table sets forth information related to our employee expenses for the periods indicated.
Fixed-line employee expenses
Six months ended September 30,
Six months
2002/2001
2001
2002
% change
(unaudited)
(ZAR millions, except percentages and
number of employees)
Salaries and wages . . . . . . . . . . . . . . . . . . . . . . . . . .
2,231
1,990
(10.8)
Benefits . . . . . . . . . . . . . . . . . . . . . . . . . . . . . . . .
1,235
1,470
19.0
Employee retrenchment expenses . . . . . . . . . . . . . . . . . .
195
169
(13.3)
Employee related expenses capitalized . . . . . . . . . . . . . . .
(320)
(169)
(47.2)
Employee expenses . . . . . . . . . . . . . . . . . . . . . . . . .
3,341
3,460
3.6
Number of full-time, fixed-line employees (at period end)
1
. . .
42,573
38,589
(9.4)
1
Includes employees of Telkom Directory Services and Swiftnet.
Employee expenses increased 3.6% in the six months ended September 30, 2002 compared to the six months ended
September 30, 2001 primarily due to higher benefits and lower employee related expenses capitalized, partially offset by
lower salaries and wages and employee retrenchment expenses.
Salaries and wages decreased 10.8% in the six months ended September 30, 2002 compared to the six months ended
September 30, 2001 primarily due to a decrease in the number of employees in the six months ended September 30, 2002
as a result of our staff reduction program, reduced overtime and reduced part-time and temporary workers, partially offset
by a 7.5% increase in base salaries and wages pursuant to collective bargaining agreements.
Benefits includeallowances, such as travel and housing, bonuses, company contributions to medical aid, pension and
retirement funds, leave provisions, workmen's compensation and levies payable for skills development. Benefits increased
19.0% in the six months ended September 30, 2002 compared to the six months ended September 30, 2001 primarily due
to the accrual of bonuses in that period. Bonuses were not accrued in the six months ended September 30, 2001 because
our financial and performance targets were not met during the first half of the 2002 financial year.
Employee retrenchment expenses include the cost of voluntary early retirement and termination severance packages
offered to employees. Employee retrenchment expenses also include the cost of social plan expenses to equip redundant
employees for new careers outside Telkom. Employee retrenchment expenses decreased 13.3% in the six months ended
September 30, 2002 compared to the six months ended September 30, 2001 as lower numbers of employees were
retrenched during this period. Employee retrenchment expenses in the six months ended September 30, 2002 includes a
R110 million provision for employees identified as of September 30, 2002 for retrenchment in future periods pursuant to
our current retrenchment program. We retrenched 498 employees in the six months ended September 30, 2002 compared to
1,102 employees in the six months ended September 30, 2001. For additional information related to our fixed-line
employee numbers, see "Business Fixed-line communications Employees" beginning on page 118 of this prospectus.
Employee related expenses capitalized include employee related expenses associated with construction and
infrastructure development projects that are recorded as work-in-progress until construction is completed. Employee related
expenses capitalized decreased 47.2% in the six months ended September 30, 2002 compared to the six months ended
September 30, 2001 primarily due to reduced capital expenditures during the period. Capital expenditures were 43.5%
lower in the six months ended September 30, 2002 compared to the six months ended September 30, 2001.
Payments to other network operators. Payments to other network operators include settlement payments paid to the three
South African mobile communications network operators for terminating calls on their networks and to international
network operators for terminating outgoing international calls and traffic transiting through their networks.
The following table sets forth information related to our payments to other network operators for the periods indicated.
Fixed-line payments to other network operators
Six months ended September 30,
2001
2002
Six months
2002/2001
ZAR
ZAR
% change
(unaudited)
(in millions, except percentages)
Payments to mobile communications network operators . . . . . .
2,570
2,683
4.4
Payments to international network operators . . . . . . . . . . . .
591
760
28.6
Payments to other network operators . . . . . . . . . . . . . . .
3,161
3,443
8.9
54
Payments to other network operators increased 8.9% in the six months ended September 30, 2002 compared to the six
months ended September 30, 2001. The increase was primarily due to increased termination rates from November 2001
pursuant to our amended interconnection agreements with the mobile operators, increases in the Rand value of international
settlement rates due to the decline in the value of the Rand against the SDR and increased international outgoing traffic.
Payments to other network operators include payments made by our fixed-line business to Vodacom, which were
R1,518 million in the six months ended September 30, 2002 and R1,426 million in the six months ended September 30,
2001. Fifty percent of these amounts were attributable to our interest in Vodacom and were eliminated from the Telkom
Group's expenses in consolidation.
Selling, general and administrative expenses. Selling, general and administrative expenses include materials and
maintenance costs, marketing expenditures, bad debts, asset write-offs, theft and other expenses, including obsolete stock,
costs of sales and the profit or loss on the sale of assets.
The following table sets forth information related to our fixed-line selling, general and administrative expenses for the
periods indicated.
Fixed-line selling, general and administrative expenses
Six months ended September 30,
2001
2002
Six months
2002/2001
ZAR
ZAR
% change
(unaudited)
(in millions, except percentages)
Materials and maintenance . . . . . . . . . . . . . . . . . . . . . .
1,082
1,068
(1.3)
Marketing . . . . . . . . . . . . . . . . . . . . . . . . . . . . . . .
136
116
(14.7)
Bad debts . . . . . . . . . . . . . . . . . . . . . . . . . . . . . . .
510
75
(85.3)
Asset write-offs . . . . . . . . . . . . . . . . . . . . . . . . . . . .
14
6
(57.1)
Other . . . . . . . . . . . . . . . . . . . . . . . . . . . . . . . . .
201
330
64.2
Selling, general and administrative expenses . . . . . . . . . . .
1,943
1,595
(17.9)
Selling, general and administrative expenses decreased 17.9% in the six months ended September 30, 2002 compared to
the six months ended September 30, 2001 primarily due to reduced bad debts, materials and maintenance, marketing
expenses and asset write-offs, partially offset by expenses associated with the initial public offering in the six months ended
September 30, 2002 and higher capitalized expenses in the six months ended September 30, 2001.
Materials and maintenance expenses include stock write-offs, subcontractors' payments and consumables required to
maintain our network. Materials and maintenance expenses decreased 1.3% in the six months ended September 30, 2002
compared to the six months ended September 30, 2001 due to improved efficiencies.
Marketing expenses decreased 14.7% in the six months ended September 30, 2002 compared to the six months ended
September 30, 2001 primarily due to the delayed implementation of advertising and customer retention programs. We
expect marketing expenses to increase in the second half of the 2003 financial year in preparation for increased competition
from the second national operator.
Bad debts decreased 85.3% in the six months ended September 30, 2002 compared to the six months ended
September 30, 2001. We implemented a new receivables aging system during the six months ended September 30, 2001
that enabled us to better manage receivables. As a result, bad debt expense declined due to the application of our improved
credit management and vetting policies during the period and a reduction of the bad debt provision on our balance sheet by
R178 million as of September 30, 2002.
Asset write-offs decreased 57.1% in the six months ended September 30, 2002 compared to the six months ended
September 30, 2001 primarily due to the write off of fewer network assets in the six months ended September 30, 2002
following an intensive asset verification process through March 31, 2002.
Other expenses include obsolete stock, cost of sales, subsistence and travel, the profit or loss on the sale of assets, an
offset from bad debts recovered and costs and expenses related to our initial public offering. Other expenses increased
64.2% in the six months ended September 30, 2002 compared to the six months ended September 30, 2001 primarily due
to - expenses related to our initial public offering, higher costs of goods sold for customer premises equipment in the six
months ended September 30, 2002 and higher capitalized expenses in the six months ended September 30, 2001. On
December 30, 2002, we disposed of our participating interests in Intelsat.
55
Services rendered. Services rendered include payments in respect of the management of our properties, consultants and
security. Consultants comprise fees paid to debtors and collection agents and to providers of other professional services,
such as Thintana Communications. Security refers to contracts to ensure a safe work environment, such as guard services.
The following table sets forth information relating to services rendered expenses for the periods indicated.
Fixed-line services rendered
Six months ended September 30,
2001
2002
Six months
2002/2001
ZAR
ZAR
% change
(unaudited)
(in millions, except percentages)
Property management . . . . . . . . . . . . . . . . . . . . . . . .
515
534
3.7
Consultants and security . . . . . . . . . . . . . . . . . . . . . . .
558
552
(1.1)
Services rendered . . . . . . . . . . . . . . . . . . . . . . . . . .
1,073
1,086
1.2
Property management increased 3.7% in the six months ended September 30, 2002 compared to the six months ended
September 30, 2001 as a result of increases in utilities and maintenance expenses. Consultants and security payments
remained relatively flat, decreasing 1.1% in the six months ended September 30, 2002 compared to the six months ended
September 30, 2001. Consultants and security payments included R115 million and R141 million of fees paid to our
strategic equity investor, Thintana Communications, in the six months ended September 30, 2002 and 2001, respectively,
pursuant to our strategic services agreement. A portion of payments made to Thintana Communications relate to projects
and have been capitalized.
Operating leases. Operating leases include payments in respect of equipment, buildings and vehicles. Operating leases
increased 2.8% in the six months ended September 30, 2002 compared to the six months ended September 30, 2001
primarily due to increased expenses in connection with surveillance and monitoring equipment leases to protect against
theft and partially due to increased vehicle lease expenses. The decrease in expenses due to the decrease in our vehicle fleet
from 18,630 vehicles at September 30, 2001 to 15,133 vehicles at September 30, 2002 was offset by significant expenses
associated with upgrades to our vehicle fleet.
Depreciation and amortization. Depreciation and amortization increased 15.9% in the six months ended September 30,
2002 compared to the six months ended September 30, 2001 primarily due to investment in support equipment and
buildings in prior periods. Investment in network support equipment increased due to increased investment in payphones,
cables, switching and transmission equipment and process control and surveillance equipment for our national network
operations center. Capital investment in the six months ended September 30, 2002 shifted to assets with shorter useful lives
as our capital expenditure program shifted from network rollout to network support and infrastructure.
Fixed-line operating profit
The following table shows information related to the operating profit and EBITDA for our fixed-line segment for the
periods indicated.
Fixed-line operating profit
Six months ended September 30,
Six months
2002/2001
2001
2002
% change
(unaudited)
(in millions, except percentages)
Operating profit (ZAR) . . . . . . . . . . . . . . . . . . . . . . . .
1,415
1,894
33.9
Operating margin (%) . . . . . . . . . . . . . . . . . . . . . . . .
10.4
13.0
EBITDA (ZAR)
1
. . . . . . . . . . . . . . . . . . . . . . . . . . .
3,572
4,396
23.1
EBITDA margin (%) . . . . . . . . . . . . . . . . . . . . . . . . .
26.2
30.2
1
Our fixed-line EBITDA represents fixed-line operating profit before income tax, finance charges, investment income and depreciation
and amortization. We believe that EBITDA provides meaningful additional information to investors since it is widely accepted by
analysts and investors as a basis for comparing a company's underlying operating profitability with that of other companies as it is not
influenced by past capital expenditures or business acquisitions, a company's capital structure or the relevant tax regime. This is
particularly the case in a capital-intensive industry such as communications. It is also a widely accepted indicator of a company's
ability to service its long-term debt and other fixed obligations and to fund its continued growth. EBITDA is not a US GAAP or IAS
measure. You should not construe EBITDA as an alternative to operating profit or cash flows from operating activities determined in
accordance with US GAAP or IAS or as a measure of liquidity. EBITDA is not defined in the same manner by all companies and may
not be comparable to other similarly titled measures of other companies unless the definition is the same.
56
Fixed-line operating profit increased 33.9% in the six months ended September 30, 2002 compared to the six months
ended September 30, 2001 primarily due to higher revenue driven by tariff increases outpacing slower growth in operating
expense, primarily due to improved controls of expenses, including debtors, and a one-time adjustment in the reserve for
bad debt of R178 million.
Mobile segment
Mobile is our fastest growing segment and encompasses all the operating activities of our 50% joint venture investment
in Vodacom, the largest mobile operator in South Africa with an approximate 59% market share as of September 30, 2002
based on total reported customers. - In addition to its South African operations,Vodacom has investments in mobile
communications network operators in Lesotho, Tanzania and the Democratic Republic of the Congo. Vodacom commenced
its network rollout in the Democratic Republic of the Congo in December 2001 and relaunched under the Vodacom brand
in May 2002. Vodacom is the largest mobile operator in Africa based on total reported customers. Vodacom's operations
outside of South Africa are at an earlier stage in their expansion and market penetration than its operations in South Africa.
As a result, Vodacom's customer acquisition costs and capital expenditures per customer for its other African operations are
higher and its operating margins are generally lower than for its South African operations. Customers in other African
countries increased 229% to 540,328 in the six months ended September 30, 2002 compared to the six months ended
September 30, 2001. A substantial portion of the growth was from prepaid services. Services outside of South Africa are
mainly prepaid due to the lack of banking systems and credit histories.
The following table shows information related to our 50% share of Vodacom's operating revenue and operating profit
broken down by Vodacom's South African operations and operations in other African countries for the periods indicated.
All amounts in this table and the discussion of our mobile segment that follows represent 50% of Vodacom's results of
operations unless otherwise stated and are before the elimination of intercompany transactions with us.
Mobile operating revenues and profits
Six months ended September 30,
Six months
2001
2002
2002/2001
ZAR
%
ZAR
%
% change
(unaudited)
(in millions, except percentages)
Operating revenue . . . . . . . . . . . .
3,762
100.0
4,720
100.0
25.5
South Africa . . . . . . . . . . . . . . . .
3,648
97.0
4,446
94.2
21.9
Other African countries . . . . . . . . . .
114
3.0
274
5.8
140.4
Operating profit . . . . . . . . . . . . .
787
100.0
920
100.0
16.9
South Africa . . . . . . . . . . . . . . . .
787
100.0
943
102.6
19.8
Other African countries . . . . . . . . . .
-
-
(23)
(2.6)
n/a
EBITDA
1
. . . . . . . . . . . . . . . . .
1,271
100.0
1,515
100.0
19.2
South Africa . . . . . . . . . . . . . . . .
1,253
98.6
1,483
97.9
18.4
Other African countries . . . . . . . . . .
18
1.4
32
2.1
77.8
1
Our mobile EBITDA comprises our 50% share of Vodacom's EBITDA, which represents mobile operating profit before income tax,
finance charges, investment income and depreciation and amortization. We believe that EBITDA provides meaningful additional
information to investors since it is widely accepted by analysts and investors as a basis for comparing a company's underlying
operating profitability with that of other companies as it is not influenced by past capital expenditures or business acquisitions, a
company's capital structure or the relevant tax regime. This is particularly the case in a capital-intensive industry such as
communications. It is also a widely accepted indicator of a company's ability to service its long-term debt and other fixed obligations
and to fund its continued growth. EBITDA is not a US GAAP or IAS measure. You should not construe EBITDA as an alternative to
operating profit or cash flows from operating activities determined in accordance with US GAAP or IAS or as a measure of liquidity.
EBITDA is not defined in the same manner by all companies and may not be comparable to other similarly titled measures of other
companies unless the definition is the same. Mobile EBITDA includes a net gain of R12.8 million and nil in the six months ended
September 30, 2001 and 2002, respectively, for our 50% share of Vodacom's integration costs, disposals of operations and impairments.
Mobile operating revenue
Vodacom derives revenue from mobile services as well as other related or value added goods and services. Vodacom's
revenue is mainly in the form of airtime charges, primarily airtime payments from customers registered on Vodacom's
network; interconnection revenue from other operators for the termination of calls on Vodacom's network and national
roaming revenue from Cell C; revenue from equipment sales, including sales of handsets and accessories; and revenue from
international services, including airtime charges for the use of Vodacom's network through roaming of customers from
other international networks.
57
The following table shows our 50% share of Vodacom's revenue broken down by major business area and as a
percentage of total operating revenue for our mobile segment and the percentage change by business area for the periods
indicated.
Mobile operating revenue
Six months ended September 30,
Six months
2001
2002
2002/2001
ZAR
%
ZAR
%
% change
(in millions, except percentages)
(unaudited)
Airtime . . . . . . . . . . . . . . . . . . .
2,219
59.0
2,531
53.6
14.1
Interconnection . . . . . . . . . . . . . .
959
25.5
1,277
27.1
33.2
Equipment sales . . . . . . . . . . . . . .
376
10.0
653
13.8
73.7
International services . . . . . . . . . . .
113
3.0
171
3.6
51.3
Other sales and services . . . . . . . . . .
95
2.5
88
1.9
(7.4)
Mobile operating revenue . . . . . . . .
3,762
100.0
4,720
100.0
25.5
The following table sets forth non-financial operational data of Vodacom for the periods indicated. The amounts stated
for customers and traffic minutes reflect 100% of Vodacom's customers and traffic minutes.
Six months ended September 30,
Six months
2001
2002
2002/2001
ZAR
ZAR
% change
(unaudited)
South Africa
Customers (thousands) (at period end)
1
. . . . . . . . . . . . . .
5,657
7,130
26.0
Contract . . . . . . . . . . . . . . . . . . . . . . . . . . . . . .
1,062
1,139
7.3
Prepaid . . . . . . . . . . . . . . . . . . . . . . . . . . . . . . .
4,569
5,961
30.5
Community services . . . . . . . . . . . . . . . . . . . . . . . .
26
30
15.4
Traffic minutes (millions of minutes)
2
. . . . . . . . . . . . . . .
4,229
5,007
18.4
Outgoing . . . . . . . . . . . . . . . . . . . . . . . . . . . . . .
2,307
2,994
29.8
Incoming (Interconnection) . . . . . . . . . . . . . . . . . . . .
1,922
2,013
4.7
MOU (minutes)
3
. . . . . . . . . . . . . . . . . . . . . . . . . . .
114
102
(10.5)
Contract . . . . . . . . . . . . . . . . . . . . . . . . . . . . . .
265
269
1.5
Prepaid . . . . . . . . . . . . . . . . . . . . . . . . . . . . . . .
59
53
(10.2)
Community services . . . . . . . . . . . . . . . . . . . . . . . .
3,246
3,215
(1.0)
ARPU (ZAR)
4, 5
. . . . . . . . . . . . . . . . . . . . . . . . . . .
190
181
(4.7)
Contract
5
. . . . . . . . . . . . . . . . . . . . . . . . . . . . . .
551
612
11.1
Prepaid . . . . . . . . . . . . . . . . . . . . . . . . . . . . . . .
94
88
(6.4)
Community services . . . . . . . . . . . . . . . . . . . . . . . .
1,710
1,766
3.3
Churn (%)
6
. . . . . . . . . . . . . . . . . . . . . . . . . . . . .
31.3
30.7
(1.9)
Contract . . . . . . . . . . . . . . . . . . . . . . . . . . . . . .
16.6
13.2
(20.5)
Prepaid . . . . . . . . . . . . . . . . . . . . . . . . . . . . . . .
34.8
34.3
(1.4)
Other African countries
Customers (thousands) (at period end)
1
. . . . . . . . . . . . . .
164
540
229.3
Lesotho . . . . . . . . . . . . . . . . . . . . . . . . . . . . . . .
30
92
206.7
Tanzania . . . . . . . . . . . . . . . . . . . . . . . . . . . . . .
134
306
128.4
Democratic Republic of the Congo . . . . . . . . . . . . . . . .
n/a
142
n/a
ARPU
4
Lesotho (ZAR) . . . . . . . . . . . . . . . . . . . . . . . . . . .
n/a
87
n/a
Tanzania (USD) . . . . . . . . . . . . . . . . . . . . . . . . . .
n/a
23
n/a
Democratic Republic of the Congo (USD) . . . . . . . . . . . .
n/a
22
n/a
58
1
Customer totals are based on the total number of customers registered on Vodacom's network, which have not been disconnected,
including inactive customers, as of the end of the period indicated. 15.1% of Vodacom's total reported customers, 17.0% of its prepaid
customers and 4.9% of its contract customers in South Africa were inactive as of September 30, 2002. See "Business - Mobile
communications - South Africa - Customers" beginning on page 122 of this prospectus for a discussion of Vodacom's procedures with
respect to disconnections and inactive customers.
2
Vodacom's traffic comprises total traffic registered on Vodacom's network, including bundled minutes, outgoing international roaming
calls and calls to free services, but excluding national and incoming international roaming calls.
3
Vodacom's MOU is calculated by dividing the average monthly minutes during the period by the average monthly total reported
customer base during the period. MOU excludes calls to free services, bundled minutes and data minutes.
4
ARPU is calculated by dividing the average monthly revenue during the period by the average monthly total reported customer base
during the period. ARPU excludes revenue from equipment sales, other sales and services and revenue from national and international
users roaming on Vodacom's networks.
5
Value added service revenue from previously partially owned service providers is included in contract and total average monthly
revenue per customer from October 1, 2001, at which time Vodacom consolidated these previously partially owned service providers.
6
Churn is calculated by dividing the average monthly total number of disconnections during the period by the average monthly total
reported customer base during the period.
Vodacom's operating revenue increased 25.5% in the six months ended September 30, 2002 compared to the six months
ended September 30, 2001 primarily due to customer growth. Vodacom's revenue from operations outside of South Africa
increased from R114 million in the six months ended September 30, 2001 to R274 million in the six months ended
September 30, 2002 primarily due to a substantial increase in the number of customers in Vodacom's Tanzania, Democratic
Republic of the Congo and Lesotho operations. Revenue from Vodacom's operations outside of South Africa as a
percentage of Vodacom's total mobile operating revenue increased to 5.8% in the six months ended September 30, 2002
from 3.0% in the six months ended September 30, 2001.
In South Africa, Vodacom's total ARPU decreased 4.7% in the six months ended September 30, 2002 compared to the
six months ended September 30, 2001 primarily due to the increase in the percentage of prepaid customers in Vodacom's
total customer base from 80.8% as of September 30, 2001 to 83.6% as of September 30, 2002 and a decrease in average
prepaid ARPUs. Prepaid customers on average tend to use fewer minutes and generate lower revenue than contract
customers. As a result, average monthly minutes per customer and ARPU are lower for prepaid customers. Vodacom's
contract ARPU increased 11.1% in the six months ended September 30, 2002 compared to the six months ended
September 30, 2001. Prepaid ARPU decreased 6.4% in the six months ended September 30, 2002 compared to the six
months ended September 30, 2001 primarily due to a decrease in average monthly minutes per prepaid customer as newer
prepaid customers tend to be in lower income tiers. Vodacom expects that the decline in its total ARPU in recent years will
stabilize in the future based on the impact of new, higher ARPU prepaid products, such as 4U, the continued growth in
contract ARPU and slower growth rates in overall customers.
Service providers in South Africa generally subsidize handset sales for contract customers. Handsets for prepaid
customers are not subsidized. Subsidized handset sales give customers an incentive to switch operators to obtain new
handsets and have contributed to churn. Vodacom's churn rate for contract customers decreased to 13.2% in the six months
ended September 30, 2002 from 16.6% in the six months ended September 30, 2001 primarily due to a revised equipment
upgrade policy and a greater focus on retention. Vodacom's churn rate for prepaid customers remained relatively constant
and was 34.3% in the six months ended September 30, 2002 and 34.8% in the six months ended September 30, 2001.
Vodacom was able to maintain relatively constant churn rates despite the entrance of Cell C into the market in November
2001 by offering prepaid products at increased discounts. For a discussion of Vodacom's churn rate, see "Business - Mobile
communications - South Africa - Customers" on page 122 of this prospectus.
Airtime. Vodacom derives airtime revenue from connection and monthly rental fees and airtime usage fees paid by
Vodacom's contract customers for use of its mobile networks. Airtime revenue also includes fees paid by Vodacom's
prepaid phone customers for prepaid starter phone packages, airtime recharge vouchers and incomer vouchers, which entitle
customers to receive unlimited incoming calls for 365 days, and revenue from mobile data, including short messaging
services, or SMSs. Airtime revenue depends on the total number of customers, traffic volume, mix of prepaid and contract
customers and tariffs.
Vodacom's airtime revenue increased 14.1% in the six months ended September 30, 2002 compared to the six months
ended September 30, 2001 primarily due to the increase in the number of Vodacom's customers. Customers increased
31.8% in the six months ended September 30, 2002 compared to the six months ended September 30, 2001 primarily due
to strong prepaid customer growth in South Africa and significant customer growth in Vodacom's operations outside of
South Africa. New products and services also contributed substantially to Vodacom's customer growth for the six months
ended September 30, 2002. Vodacom launched 4U, its prepaid SMS and per second billing product, in October 2001 in
anticipation of increased competition from Cell C, which commenced operations in November 2001. Vodacom connected
over 1.3 million 4U customers in the first six months of launching the product, a portion of which were migrated from
existing prepaid customers.
For a discussion of Vodacom's customers and traffic see "Business - Mobile communications - South Africa
Customers" on page 122 of this prospectus and "Business - Mobile communications - South Africa - Traffic" on page 123
of this prospectus.
59
Mobile data revenue increased 23.7% to R120 million in the six months ended September 30, 2002 from R97 million in
the six months ended September 30, 2001. Vodacom's SMS traffic increased over the period primarily due to new packages
and services, such as 4U which are priced to encourage SMS usage. Vodacom transmitted 653 million SMSs over its
network in the six months ended September 30, 2002 compared to 363 million SMSs in the six months ended September 30,
2001.
Interconnection. Vodacom generates interconnection revenue when a call originating from our fixed-line network or one
of the other mobile operators' networks terminates on Vodacom's network. Interconnection revenue includes revenue from
Cell C for national roaming services. Vodacom generates national roaming revenue when its mobile network carries a call
made from a Cell C customer. Interconnection revenue depends on the volume of traffic terminating on Vodacom's network,
the interconnection termination rates payable by ourselves and the other mobile operators to Vodacom and national roaming
rates and volumes.
Vodacom's interconnection revenue increased 33.2% in the six months ended September 30, 2002 compared to the six
months ended September 30, 2001 primarily due to an increase in interconnection rates and the number of mobile calls
terminating on Vodacom's network as a result of the increased number of Vodacom's customers and South African mobile
users generally during the period. Increased interconnection revenue by Vodacom Tanzania and Vodacom Congo further
contributed to the increase. The increases were partially offset by a decrease in the number of fixed calls from Telkom's
network terminating on Vodacom's network. Interconnection revenue in our mobile segment included R759 million and
R712 million in the six months ended September 30, 2002 and 2001, respectively, for services received from our fixed-line
business, which were eliminated from the Telkom Group's revenues in consolidation.
Equipment sales. Vodacom generates revenue from equipment sales primarily from the sale of mobile phones and
accessories to its customers. Vodacom purchases handsets for itself and for external service providers in bulk at purchase
discounts in order to lower the cost of handset subsidization. Equipment sales revenue fluctuates based on whether external
providers and Vodacom's other African operators source equipment from Vodacom in South Africa or purchase equipment
from third party service providers. Vodacom's revenue from equipment sales increased 73.7% in the six months ended
September 30, 2002 compared to the six months ended September 30, 2001 primarily due to large volumes of equipment
sales by Vodacom Congo.
International services. Vodacom generates fees from international services when its mobile network carries a call made
by a customer of another international mobile communications network operator. Vodacom's revenue from international
services increased 51.3% in the six months ended September 30, 2002 compared to the six months ended September 30,
2001 primarily due to increased call activity in South Africa and other African operations and exchange rate fluctuations.
Other. Other revenue includes revenue from other operations, including Vodacom's Teljoy television rental business,
which was sold in March 2002, and value-added services. Vodacom's other revenue decreased 7.4% in the six months
ended September 30, 2002 compared to the six months ended September 30, 2001 primarily due to the sale of non-core
assets.
Mobile operating expenses
The following is a discussion of our mobile segment's operating expenses which are comprised of our 50% interest in
Vodacom's operating expenses. Vodacom's operating expense line items are presented in accordance with the line items
reflected in the Telkom Group's consolidated operating expenses, which are different from the operating expense line items
contained in Vodacom's consolidated financial statements. The following table shows our 50% share of Vodacom's
operating expenses and the percentage change for the periods indicated.
Mobile operating expenses
Six months ended September 30,
2001
2002
Six months
2002/2001
ZAR
ZAR
% change
(unaudited)
(in millions, except percentages)
Employee expenses . . . . . . . . . . . . . . . . . . . . . . . . . .
254
251
(1.2)
Payments to other network operators . . . . . . . . . . . . . . . .
284
491
72.9
Selling, general and administrative expenses . . . . . . . . . . . .
1,817
2,220
22.2
Services rendered . . . . . . . . . . . . . . . . . . . . . . . . . . .
34
35
2.9
Operating leases . . . . . . . . . . . . . . . . . . . . . . . . . . .
103
209
102.9
Depreciation and amortization . . . . . . . . . . . . . . . . . . . .
483
594
23.0
Mobile operating expenses . . . . . . . . . . . . . . . . . . . . .
2,975
3,800
27.7
60
Employee expenses. Employee expenses consist mainly of salaries and wages of employees as well as contributions to
employee pension and medical aid funds and benefits.
Vodacom's employee expenses decreased 1.2% in the six months ended September 30, 2002 compared to the six months
ended September 30, 2001 primarily due to a 7.5% decrease in the number of employees. The decrease in the number of
employees was partially offset by an overall increase in average salaries for employees of approximately 9.0% in the six
months ended September 30, 2002. Employee productivity, as measured by customers per employee, increased 42.4%
to 1,808 customers per employee as of September 30, 2002 from 1,270 customers per employee as of September 30, 2001.
Payments to other network operators. Payments to other network operators consist mainly of interconnection payments
made by Vodacom's South African and other African operations for terminating calls on other operators' networks.
Vodacom's payments to other network operators increased 72.9% in the six months ended September 30, 2002
compared to the six months ended September 30, 2001 as a result of increased outgoing traffic from South Africa and other
African countries in line with increased customer growth and, to a lesser degree, the increase in interconnection tariffs in
South Africa under Vodacom's interconnection agreements from November 2001 for traffic terminating on other mobile
networks and our fixed-line network. Payments to other network operators also increased due to the increasing amount of
outgoing traffic terminating on the other mobile networks, rather than our fixed-line network, as the cost of terminating
calls on other mobile networks is higher than calls terminating on our fixed-line network.
Payments to other network operators in our mobile segment included R80 million and R82 million in the six months
ended September 30, 2002 and 2001, respectively, for interconnection fees paid to our fixed-line segment, which were
eliminated from the Telkom Group's operating expenses in consolidation.
Selling, general and administrative expenses. Selling, general and administrative expenses include subscriber acquisition
and retention costs, packaging, distribution, marketing, regulatory license fees, bad debts and various other general
administrative expenses, including insurance, accommodations and social investments.
The following table sets forth information related to our 50% share of Vodacom's selling, general and administrative
expenses for the periods indicated.
Mobile selling, general and administrative costs
Six months ended September 30,
Six months
2001
2002
2002/2001
ZAR
ZAR
% change
(unaudited)
(in millions, except percentages)
Selling, distribution and other . . . . . . . . . . . . . . . . . . . .
1,549
1,913
23.5
Marketing . . . . . . . . . . . . . . . . . . . . . . . . . . . . . . .
154
182
18.2
Regulatory and license fees . . . . . . . . . . . . . . . . . . . . .
94
114
21.3
Bad debts . . . . . . . . . . . . . . . . . . . . . . . . . . . . . . .
33
11
(66.7)
Asset write-offs
1
. . . . . . . . . . . . . . . . . . . . . . . . . . .
(13)
-
-
Selling, general and administrative expenses . . . . . . . . . . .
1,817
2,220
22.2
1
Integration costs, disposals of operations and impairments.
Vodacom's selling, general and administrative expenses increased 22.2% in the six months ended September 30, 2002
compared to the six months ended September 30, 2001 primarily due to an increase in selling, distribution and other
expenses, marketing expenses and regulatory and licence fees to support the growth in operations. Selling, distribution and
other expenses include cost of goods sold, commissions, subscriber acquisition and retention expenses and distribution
expenses. Although overall selling and distribution costs increased in line with increases in operating revenue, selling and
distribution incentive costs increased faster than revenue growth as competition in the South African market increased. The
increase in marketing expense was mainly due to significant marketing expense incurred by Vodacom Congo to establish
itself in the market. The increase in regulatory and license fees was directly related to the increase in operating revenues.
Services rendered. Services rendered include consultancy services for technical, administrative and managerial services,
audit fees, insurance, legal fees and communication and information technology costs. Services rendered increased 2.9% in
the six months ended September 30, 2002 compared to the six months ended September 30, 2001 primarily due to an
increase in support services for Vodacom's other African operations.
Operating leases. Operating leases include payments in respect of rentals of GSM transmission lines as well as office
accommodation, office equipment and motor vehicles. Vodacom's operating leases increased 102.9% in the six months
ended September 30, 2002 compared to the six months ended September 30, 2001 primarily due to the cost of leasing base
station sites required for its network in the Democratic Republic of the Congo.

61
Operating leases in our mobile segment included R115 million and R95 million in the six months ended September 30,
2002 and 2001, respectively, for operating lease payments to our fixed-line segment, which were eliminated from the
Telkom Group's operating expenses in consolidation.
Depreciation and amortization. Vodacom's depreciation and amortization increased 23.0% in the six months ended
September 30, 2002 compared to the six months ended September 30, 2001 primarily due to depreciation and amortization
of capital expenditures Vodacom incurred in building out its network in South Africa and other sub-Saharan African
countries, partially offset by a decrease in the amortization of intangible assets as a result of the sale of Teljoy Holdings
(Proprietary) Limited and Vodacom World Online Holdings (Proprietary) Limited and the elimination of related goodwill
from its balance sheet.
Mobile operating profit
The following table shows information related to the operating profit and EBITDA for our mobile segment, which
comprises 50% of Vodacom's results for the periods indicated.
Mobile operating profit
Six months ended September 30,
Six months
2002/2001
2001
2002
% change
(unaudited)
(in millions, except percentages)
Operating profit (ZAR) . . . . . . . . . . . . . . . . . . . . . . . .
787
920
16.9
Operating margin (%) . . . . . . . . . . . . . . . . . . . . . . . .
20.9
19.5
EBITDA (ZAR)
1
. . . . . . . . . . . . . . . . . . . . . . . . . . .
1,271
1,515
19.2
EBITDA margin (%) . . . . . . . . . . . . . . . . . . . . . . . . .
33.8
32.1
1
Our mobile EBITDA comprises our 50% share of Vodacom's EBITDA, which represents mobile operating profit before income tax,
finance charges, investment income and depreciation and amortization. We believe that EBITDA provides meaningful additional
information to investors since it is widely accepted by analysts and investors as a basis for comparing a company's underlying
operating profitability with that of other companies as it is not influenced by past capital expenditures or business acquisitions, a
company's capital structure or the relevant tax regime. This is particularly the case in a capital-intensive industry such as
communications. It is also a widely accepted indicator of a company's ability to service its long-term debt and other fixed obligations
and to fund its continued growth. EBITDA is not a US GAAP or IAS measure. You should not construe EBITDA as an alternative to
operating profit or cash flows from operating activities determined in accordance with US GAAP or IAS or as a measure of liquidity.
EBITDA is not defined in the same manner by all companies and may not be comparable to other similarly titled measures of other
companies unless the definition is the same. Mobile EBITDA includes a net gain of R12.8 million and nil in the six months ended
September 30, 2001 and 2002, respectively, for our 50% share of Vodacom's integration costs, disposals of operations and impairments.
Mobile operating profit increased 16.9% in the six months ended September 30, 2002 compared to the six months
ended September 30, 2001 primarily due to the significant growth in mobile customers and traffic over the period.
Operating profit as a percentage of revenue decreased marginally from 20.9% in the six months ended September 30,
2001 to 19.5% in the six months ended September 30, 2002.

62
Year ended March 31, 2002 compared to year ended March 31, 2001 and year ended March 31, 2001 compared to year
ended March 31, 2000
Consolidated results
The following table shows information related to our operating revenue, operating expenses, operating profit, net profit,
profit margin, EBITDA and EBITDA margin for the periods indicated.
Telkom Group's segmental results
Year ended March 31,
2000
2001
2002
2001/2000 2002/2001
ZAR
%
ZAR
%
ZAR
% % change % change
(in millions, except percentages)
Operating revenue . . .
27,113
100.0
31,352
100.0
34,197
100.0
15.6
9.1
Fixed-line . . . . . . . .
23,838
87.9
26,439
84.3
27,976
81.8
10.9
5.8
Mobile . . . . . . . . . .
4,786
17.7
6,638
21.2
8,075
23.6
38.7
21.6
Intercompany eliminations
(1,511)
(5.6)
(1,725)
(5.5)
(1,854)
(5.4)
14.2
7.5
Operating expenses . .
23,231
100.0
26,427
100.0
29,984
100.0
13.8
13.5
Fixed-line . . . . . . . .
21,283
91.6
22,680
85.8
25,529
85.1
6.6
12.6
Mobile . . . . . . . . . .
3,604
15.5
5,361
20.3
6,259
20.9
48.8
16.8
Intercompany eliminations
(1,656)
(7.1)
(1,614)
(6.1)
(1,804)
(6.0)
(2.5)
11.8
Operating profit . . . .
3,882
100.0
4,925
100.0
4,213
100.0
26.9
(14.5)
Fixed-line . . . . . . . .
2,555
65.8
3,759
76.3
2,447
58.1
47.1
(34.9)
Mobile . . . . . . . . .
1,182
30.5
1,277
25.9
1,816
43.1
8.0
42.2
Intercompany eliminations
145
3.7
(111)
(2.2)
(50)
(1.2)
(176.6)
55.0
Net profit . . . . . . . .
1,527
100.0
1,622
100.0
1,221
100.0
6.2
(24.7)
Profit margin (%) . . .
5.6
5.2
3.6
EBITDA
1
. . . . . . . .
8,056
100.0
9,977
100.0
9,621
100.0
23.8
(3.6)
Fixed-line . . . . . . . .
6,180
76.7
7,993
80.1
6,810
70.8
29.3
(14.8)
Mobile . . . . . . . . . .
1,731
21.5
2,095
21.0
2,851
29.6
21.0
36.1
Intercompany eliminations
145
1.8
(111)
(1.1)
(40)
(0.4)
(176.6)
64.0
EBITDA margin (%) . .
29.7
31.8
28.1
1
EBITDA represents operating profit before income tax, finance charges, investment income and depreciation and amortization. We
believe that EBITDA provides meaningful additional information to investors since it is widely accepted by analysts and investors as a
basis for comparing a company's underlying operating profitability with that of other companies as it is not influenced by past capital
expenditures or business acquisitions, a company's capital structure or the relevant tax regime. This is particularly the case in a capital-
intensive industry such as communications. It is also a widely accepted indicator of a company's ability to service its long-term debt
and other fixed obligations and to fund its continued growth. EBITDA is not a US GAAP or IAS measure. You should not construe
EBITDA as an alternative to operating profit or cash flows from operating activities determined in accordance with US GAAP or IAS or
as a measure of liquidity. EBITDA is not defined in the same manner by all companies and may not be comparable to other similarly
titled measures of other companies unless the definition is the same. In addition, because the calculation of EBITDA in the maintenance
covenants contained in our credit facilities is based on accounting policies in use at the time, the indebtedness was incurred, EBITDA
for purposes of those covenants is not calculated in the same manner as it is calculated in the above table. Mobile EBITDA includes a
net gain of R28 million, a net loss of R107 million and a net gain of R65 million in the 2002, 2001 and 2000 financial years,
respectively, for our 50% share of Vodacom's integration costs, disposals of operations and impairments.
Operating revenue
Operating revenue increased 9.1% and 15.6% in the years ended March 31, 2002 and 2001, respectively, primarily due
to increased average tariffs in our fixed-line segment and customer growth in our mobile segment. Fixed-line operating
revenue accounted for 81.8% of our consolidated operating revenue before intercompany eliminations during this period.
The aggregate increases in operating revenue exceeded average inflation in South Africa, which was 5.7% in the year ended
December 31, 2001 and 5.4% in the year ended December 31, 2000.
Operating expenses
Operating expenses increased 13.5% and 13.8% in the years ended March 31, 2002 and 2001, respectively, due to
increased operating expenses in our fixed-line and mobile segments. The increase in fixed-line operating expenses in the
2002 financial year was primarily due to increased services rendered expenses as a result of the outsourcing of our property
management operations, payments to other operators, provisions for potential damages related to our dispute with
Telcordia, bad debts, employee retrenchment expenses related to headcount reductions and write-offs of Telcordia related
63
Operating profit
Operating profit decreased 14.5% in the year ended March 31, 2002 primarily due to the significant increase in
operating expenses in our fixed-line business. The decrease was partially offset by an increase in operating profit from our
mobile segment as a result of substantial increases in the number of Vodacom's mobile customers and revenue while
Vodacom maintained its operating margins. Operating profit increased 26.9% in the year ended March 31, 2001 primarily
due to an increase in operating profit from our fixed-line segment and, to a lesser extent, our mobile segment.
Investment income
Investment income consists of interest received on trade receivables, short-term investments and bank accounts and
income received from our investments, including satellite companies. Investment income decreased 20.6% to R490 million
in the year ended March 31, 2002 and 3.7% to R617 million in the year ended March 31, 2001 from R641 million in the
year ended March 31, 2000. The decreases were primarily due to lower interest received on lower average balances in
investments and bank accounts.
Finance charges
Finance charges include interest paid on local and foreign borrowings, amortized discounts on bonds and commercial
paper bills, fair value gains and losses on financial instruments and foreign exchange gains and losses. Fair value losses and
gains on financial instruments are not comparable over the three years ended March 31, 2002, due to the prospective
application of IAS 39 in 2002.
The following table sets forth information related to our finance charges for the periods indicated.
Finance Charges
Year ended March 31,
2000
2001
2002
2001/2000
2002/2001
ZAR
ZAR
ZAR
% change
% change
(in millions, except percentages)
Interest expense . . . . . . . . . . . . . . . . . .
2,147
2,572
3,185
19.8
23.8
Local loans . . . . . . . . . . . . . . . . . . .
2,342
2,173
2,690
(7.2)
23.8
Foreign loans . . . . . . . . . . . . . . . . . .
137
559
599
308.0
7.2
Finance charges capitalized . . . . . . . . . . .
(332)
(160)
(104)
(51.8)
(35.0)
Net fair value losses/(gains) on
financial instruments . . . . . . . . . . . . . . .
(40)
(12)
(635)
(70.0)
-
Fair value adjustments on derivative instruments
-
-
(3,036)
-
-
Foreign exchange (gains)/losses . . . . . . . .
(40)
(12)
2,401
(70.0)
-
Foreign exchange contract premiums . . . . . .
375
577
-
53.9
-
Total finance charges . . . . . . . . . . . . . . .
2,482
3,137
2,550
26.4
(18.7)
Excluding the net fair value of gains on financial instruments of R635 million in the 2002 financial year, finance charges
increased in the 2002 financial year due to increased interest expense. Finance charges increased in the 2001 financial year
due to the costs of hedging our new foreign denominated debt issued in that year as well as increased interest expense.
Interest expense increased 23.8% and 19.8% in the years ended March 31, 2002 and 2001, respectively, due to higher
weighted average interest rates in each year, and higher long-term debt balances.
Taxation
Our consolidated tax expense increased 22.1% to R873 million in the year ended March 31, 2002 and 42.7% to
R715 million in the year ended March 31, 2001 from R501 million in the year ended March 31, 2000. Our consolidated
effective tax rate was 40.5% in the 2002 financial year, 29.8% in the 2001 financial year and 24.5% in the 2000 financial
year. Telkom's effective tax rate was 53.8%, 18.1% and 19.6%, respectively, and Vodacom's effective tax rate was 33.3%,
36.9% and 28.1%, respectively, during the 2002, 2001 and 2000 financial years. The increase in consolidated tax expense in
the year ended March 31, 2002 was primarily due to the high amount of non-deductible expenses at Telkom related to
Telcordia write-offs and reserves established for potential losses as a result of the arbitration ruling and depreciation on
buildings, Telkom's election to suspend the application of Section 32 of the South African Tax Code related to the

64
the year ended March 31, 2002 was primarily due to the high amount of non-deductible expenses at Telkom related to
Telcordia write-offs and reserves established for potential losses as a result of the arbitration ruling and depreciation on
buildings, Telkom's election to suspend the application of Section 32 of the South African Tax Code related to the
exemption from tax of international interconnection revenue generated from transmitting messages internationally in the
Telkom Group's consolidated financial statements and additional tax paid by Vodacom on dividends distributed to Telkom.
The increase in consolidated tax expense in the year ended March 31, 2001 was primarily due to the increase in our pretax
income and additional tax paid by Vodacom on dividends distributed to Telkom. South African companies became subject
to capital gains tax on October 1, 2001. As a result, we were previously not required to pay capital gains tax. See
"Taxation" beginning on page 186 of this prospectus.
Minority interests
Minority interests in the income of subsidiaries decreased 13.2% to R59 million in the year ended March 31, 2002
primarily due to our increased ownership in our Swiftnet and Telkom Directory Services subsidiaries during the 2002
financial year, partially offset by increased profits from these subsidiaries. We acquired the remaining 40% interest in
Swiftnet in May 2001 and a further 10% interest in Telkom Directory Services in October 2001. Minority interests in the
income of subsidiaries increased by R55 million to R68 million in the year ended March 31, 2001 from R13 million in the
year ended March 31, 2000. The increase was attributable to increased profits from our Telkom Directory Services and
Swiftnet subsidiaries.
Net profit
Net profit decreased 24.7% to R1,221 million in the year ended March 31, 2002 primarily due to lower operating profit
in our fixed-line segment. The decrease was partially offset by the fair value foreign exchange gain recognized in the 2002
financial year as a result of the prospective application of IAS 39 and an increase in operating profit in our mobile segment.
Net profit increased 6.2% to R1,622 million in the year ended March 31, 2001 from R1,527 million in the year ended
March 31, 2000 primarily due to increased operating profit in our fixed-line and mobile segments. The increase was
partially offset by significantly higher finance charges associated with higher average interest bearing debt and foreign
exchange hedging costs related to the issuance of foreign denominated debt in that year.
Fixed-line segment
The following is a discussion of the results of operations from our fixed-line segment before eliminations of
intercompany transactions with Vodacom. Our fixed-line segment is our largest segment based on revenue and profit
contribution and includes all the operating activities derived from Telkom's fixed-line voice and data communications
services business, as well as directory services through our 64.9% owned Telkom Directory Services subsidiary, and
wireless data services through our wholly-owned Swiftnet subsidiary.
Fixed-line operating revenue
The following table shows operating revenue for our fixed-line segment broken down by major business areas and as a
percentage of total revenue for our fixed-line segment and the percentage change by business area for the periods indicated.
Fixed-line operating revenue
Year ended March 31,
2000
2001
2002
% of
% of
% of 2001/2000 2002/2001
ZAR
revenue
ZAR
revenue
ZAR
revenue % change % change
(in millions, except percentages)
Subscriptions and
connections . . . . . . . .
4,085
17.1
4,197
15.9
4,410
15.8
2.7
5.1
Traffic . . . . . . . . . . .
14,991
62.9
16,409
62.1
17,168
61.3
9.5
4.6
Local . . . . . . . . . . .
3,836
16.1
4,237
16.0
4,876
17.4
10.5
15.1
Long-distance . . . . . .
4,317
18.1
4,043
15.3
3,794
13.6
(6.3)
(6.2)
Fixed-to-mobile . . . . .
5,325
22.3
6,845
25.9
7,323
26.1
28.5
7.0
International outgoing .
1,513
6.4
1,284
4.9
1,175
4.2
(15.1)
(8.5)
Interconnection . . . . . .
1,366
5.7
1,854
7.0
1,798
6.4
35.7
(3.0)
Data . . . . . . . . . . . .
2,764
11.6
3,328
12.6
3,913
14.0
20.4
17.6
Directories and other
services . . . . . . . . . .
632
2.7
651
2.4
687
2.5
3.0
5.5
Fixed-line operating revenue
23,838
100.0
26,439
100.0
27,976
100.0
10.9
5.8
65
Operating revenue from our fixed-line segment increased 5.8% and 10.9% in the years ended March 31, 2002 and 2001,
respectively, primarily due to increased average tariffs, partially offset by a decline in the number of fixed access lines in
service as a result of disconnections due to customer non-payments and customer migration to mobile services. Traffic
remained relatively flat during the 2002 financial year after an increase of 4.6% in the 2001 financial year. We also
increased our data revenues in both years as demand for data services increased. Traffic revenue per fixed access line
continued to improve, increasing 11.1% and 10.1% from R3,869 in the 2000 financial year to R4,297 in the 2001 financial
year and R4,729 in the 2002 financial year as we increased our penetration of value-added voice services and higher
revenue generating access services and decreased the number of our fixed access lines.
Subscriptions and connections. The following table sets forth information related to our fixed-line subscription and
connection revenue during the periods indicated.
Fixed-line subscription and connection revenue
Year ended March 31,
2001/2000
2002/2001
2000
2001
2002
% change
% change
Total subscriptions and connections revenue
(ZAR millions, except percentages) . . . . . . .
4,085
4,197
4,410
2.7
5.1
Total subscription access lines (thousands,
except percentages)
1
. . . . . . . . . . . . . . .
5,356
4,809
4,750
(10.2)
(1.2)
Postpaid
PSTN
2
. . . . . . . . . . . . . . . . . . . . .
4,668
3,930
3,554
(15.8)
(9.6)
ISDN channels . . . . . . . . . . . . . . . .
271
374
467
38.0
24.9
Prepaid . . . . . . . . . . . . . . . . . . . . .
381
480
708
26.0
47.5
Private payphones . . . . . . . . . . . . . . . .
36
25
21
(30.6)
(16.0)
1
Total subscription access lines are comprised of PSTN lines, including ISDN lines, private payphones and internal lines in service, but
exclude public payphones. Telkom had 162,460, 151,986 and 145,302 internal lines as of March 31, 2002, 2001 and 2000,
respectively. Each PSTN line includes one access channel, each basic ISDN line includes two access channels and each primary ISDN
line includes 30 access channels.
2
PSTN lines include copper cable, ADSL, digital enhanced cordless technology, or DECT, and fiber.
Revenue from subscriptions and connections increased 5.1% and 2.7% in the years ended March 31, 2002 and 2001,
respectively, primarily due to an increase in average monthly subscriptions and connections tariffs, partially offset by the
lower number of fixed access lines in service as a result of disconnections due to customer non-payments and customer
migration to mobile services. The decreases in postpaid PSTN lines in the years ended March 31, 2002 and 2001 were
partially offset by increases in the number of postpaid ISDN channels, which have higher subscription rates than PSTN
lines, and in the number of prepaid PSTN lines. The increase in the number of postpaid ISDN channels was driven by
increased demand for higher bandwidth and functionality. The increase in prepaid lines was mainly due to our increased
marketing efforts for our prepaid telephone services in the 2002 and 2001 financial years, particularly to first-time
residential customers with poor or no credit histories.
For a discussion of our connection and rental fees, see "Business - Fixed-line communications - Fees and tariffs
Subscription and connection tariffs" on page 109 of this prospectus and for a discussion of the number of customers during
the periods, see "Business - Fixed-line communications - Products and services" beginning on page 104 of this prospectus.
Traffic. The following table sets forth information related to our total fixed-line traffic revenue for the periods indicated.
Total fixed-line traffic revenue
Year ended March 31,
2001/2000
2002/2001
2000
2001
2002
% change
% change
Total traffic revenue (ZAR millions, except
percentages) . . . . . . . . . . . . . . . . . . . .
14,991
16,409
17,168
9.5
4.6
Traffic (millions of minutes, except percentages) 1 . .
28,696
30,002
29,912
4.6
(0.3)
Average monthly traffic minutes per average
monthly access line (minutes) 2 . . . . . . . . . . .
472
494
518
4.7
4.9
1
Traffic is calculated by dividing total traffic revenue by the weighted average tariff during the relevant period. Traffic includes internet
traffic.
2
Average traffic minutes per average monthly access line are calculated by averaging the total traffic during each month in the year
divided by the average number of access lines in each month during the year.

66
Traffic revenue increased 4.6% in the year ended March 31, 2002 primarily due to increased local and fixed-to-mobile
traffic tariffs, partially offset by lower long distance and international traffic tariffs. Traffic decreased 0.3% in the 2002
financial year. Traffic revenue increased 9.5% in the year ended March 31, 2001 primarily due to increased traffic, local
traffic tariffs and a change in the pricing of fixed-to-mobile traffic. Telkom changed the pricing of fixed-to-mobile traffic
from per second billing to billing for the first sixty second increment and in increments of thirty seconds thereafter,
effective in September 1999. Traffic increased 4.6% in the 2001 financial year, primarily due to increased fixed-to-mobile,
local and international traffic, partially offset by lower long distance traffic. Traffic was adversely affected in both the 2002
and 2001 financial years by a decrease in the number of fixed access lines in service as a result of disconnections due to
customer non-payments and customer migration to mobile services. In addition, traffic was adversely affected by the
increasing substitution of calls placed using mobile services rather than our fixed-line service.
For a discussion of our traffic tariffs, see "Business Fixed-line communications Fees and tariffs Traffic tariffs"
beginning on page 110 of this prospectus and for a discussion of our traffic during the periods discussed, see "Business
Fixed-line communications Traffic" on page 105 of this prospectus.
The following table sets forth information related to our fixed-line local traffic revenue for the periods indicated.
Local traffic revenue
Year ended March 31,
2001/2000
2002/2001
2000
2001
2002
% change
% change
Local traffic revenue (ZAR millions,
except percentages) . . . . . . . . . . . . . . .
3,836
4,237
4,876
10.5
15.1
Local traffic (millions of minutes,
except percentages)
1
. . . . . . . . . . . . . .
19,471
20,388
20,252
4.7
(0.7)
1
Local traffic is calculated by dividing total local traffic revenue by the weighted average local traffic tariff during the relevant period.
Local traffic includes internet traffic.
Local traffic revenue increased 15.1% in the year ended March 31, 2002 primarily due to increased local traffic tariffs.
Local traffic decreased 0.7% in the 2002 financial year. Local traffic revenue increased 10.5% in the year ended March 31,
2001 primarily due to increased local traffic tariffs and local traffic. Local traffic revenue was adversely affected by a
change in the mix of call packages and associated discounts and by a decrease in the number of fixed access lines in service
during the 2002 and 2001 financial years as a result of disconnections due to customer non-payments and customer
migration to mobile services. In addition, local traffic was adversely affected by the increasing substitution of local calls
placed using mobile services rather than our fixed-line service.
The following table sets forth information related to our fixed-line long distance traffic revenue for the periods indicated.
Long distance traffic revenue
Year ended March 31,
2001/2000
2002/2001
2000
2001
2002
% change
% change
Long distance traffic revenue (ZAR millions,
except percentages) . . . . . . . . . . . . . . .
4,317
4,043
3,794
(6.3)
(6.2)
Long distance traffic (millions of minutes,
except percentages)
1
. . . . . . . . . . . . . .
5,222
4,938
4,895
(5.4)
(0.9)
1
Long distance traffic is calculated by dividing total long distance traffic revenue by the weighted average long distance traffic tariff
during the relevant period.
Long distance traffic revenue decreased 6.2% and 6.3% in the years ended March 31, 2002 and 2001, respectively,
primarily due to decreased long distance traffic tariffs and decreased long distance traffic. Long distance traffic decreased
0.9% in the 2002 financial year and 5.4% in the 2001 financial year. Long distance traffic was adversely impacted by a
decrease in the number of fixed access lines in service during the 2002 and 2001 financial years as a result of
disconnections due to customer non-payments and customer migration to mobile services. In addition, long distance traffic
was adversely affected by the increasing substitution of national long distance calls using mobile services rather than our
fixed-line long distance service. Historically, fixed-line long distance traffic tariffs were higher than the price of mobile
calls, which are not distance dependent. We have reduced our long-distance traffic tariffs to below mobile tariffs over the
past five years as a result of our tariff rebalancing program.
67
The following table sets forth information related to our fixed-to-mobile traffic revenue for the periods indicated.
Fixed-to-mobile traffic revenue
Year ended March 31,
2001/2000
2002/2001
2000
2001
2002
% change
% change
Fixed-to-mobile traffic revenue (ZAR millions,
except percentages) . . . . . . . . . . . . . . . .
5,325
6,845
7,323
28.5
7.0
Fixed-to-mobile traffic (millions of minutes,
except percentages) 1 . . . . . . . . . . . . . . . .
3,659
4,319
4,390
18.0
1.6
1
Fixed-to-mobile traffic is calculated by dividing total fixed-to-mobile traffic revenue by the weighted average fixed-to-mobile traffic
tariff during the relevant period.
Fixed-to-mobile traffic revenue increased 7.0% in the year ended March 31, 2002 primarily due to fixed to mobile traffic
tariff increases as a result of the amendment of our interconnection agreement with MTN and Vodacom and our new
interconnection agreement with Cell C effective in November 2001 and a 1.6% increase in fixed-to-mobile traffic. The
increase in fixed-to-mobile traffic was primarily due to an increased number of mobile users and an increase in the number
of calls. Fixed-to-mobile traffic was adversely impacted by a decrease in the number of fixed-line subscribers due to
disconnections for non-payments and customer migration to mobile services and due to the growth in mobile users
resulting in the increasing substitution of mobile-to-mobile calls that are not routed over our fixed-line network as well as a
15.5% effective tariff increase in November 2001. Fixed-to-mobile traffic revenue increased 28.5% in the year ended
March 31, 2001 primarily due to growth in fixed-to-mobile traffic and a change in the pricing of fixed-to-mobile traffic
from per second billing to billing for the first sixty second increment and in increments of thirty seconds thereafter.
Fixed-to-mobile traffic increased 18% as a result of an increased number of mobile users and an increase in the number
of calls.
The following table sets forth information related to our international outgoing traffic revenue for the periods indicated.
International outgoing traffic revenue
Year ended March 31,
2001/2000
2002/2001
2000
2001
2002
% change
% change
International outgoing traffic revenue (ZAR millions,
except percentages) . . . . . . . . . . . . . . . .
1,513
1,284
1,175
(15.1)
(8.5)
International outgoing traffic (millions of minutes,
except percentages) 1 . . . . . . . . . . . . . . . .
344
357
375
3.8
5.0
1
International outgoing traffic is calculated by dividing total international outgoing traffic revenue by the weighted average international
outgoing traffic tariff during the relevant period.
International outgoing traffic revenue decreased 8.5% and 15.1% in the years ended March 31, 2002 and 2001,
respectively, primarily due to decreases in average international outgoing traffic tariffs as a result of our tariff rebalancing
program. International outgoing traffic increased 5.0% and 3.8% in the 2002 and 2001 financial years, respectively.