QuickLinks -- Click here to rapidly navigate through this document
As filed with the Securities and Exchange Commission on June 25, 2004
UNITED STATES
SECURITIES AND EXCHANGE COMMISSION
Washington, D.C. 20549
FORM 20-F
| (Mark One) | |
o | REGISTRATION STATEMENT PURSUANT TO SECTION 12(b) or (g) OF THE SECURITIES EXCHANGE ACT OF 1934 |
ý | ANNUAL REPORT PURSUANT TO SECTION 13 OR 15(d) OF THE SECURITIES EXCHANGE ACT OF 1934 |
For the fiscal year ended March 31, 2004 | |
Or | |
o | TRANSITION REPORT PURSUANT TO SECTION 13 OR 15(d) OF THE SECURITIES EXCHANGE ACT OF 1934 |
For the transition period from to . | |
Commission file number: 001-31609
TELKOM SA LIMITED
(Exact name of Registrant as specified in its charter)
THE REPUBLIC OF SOUTH AFRICA
(Jurisdiction of incorporation or organization)
Telkom Towers North
152 Proes Street
Pretoria 0002
The Republic of South Africa
(27)(12)311-3566
(Address of principal executive offices)
Securities registered or to be registered pursuant to Section 12(b) of the Act:
| Title of each class | Name of each exchange on which registered | |
| American Depositary Shares, each representing four (4) Ordinary Shares, par value R10 per share | New York Stock Exchange, Inc. | |
| Ordinary Shares, par value R10 per share | New York Stock Exchange, Inc.* |
- *
- Listed, not for trading, but only in connection with the registration of American Depositary Shares, pursuant to the requirements of the Securities and Exchange Commission.
Securities registered or to be registered pursuant to Section 12(g) of the Act.
NONE
Securities for which there is a reporting obligation pursuant to Section 15(d) of the Act
NONE
The number of outstanding shares of each of the issuer's classes of capital or common stock as of the close of the period covered by the annual report:
| Ordinary Shares, par value R10 per share | 553,846,083 | |
| Class A Ordinary Share, par value R10 per share | 1 | |
| Class B Ordinary Share, par value R10 per share | 1 |
Indicate by check mark whether the Registrant (1) has filed all reports required to be filed by Section 13 or 15(d) of the Securities Exchange Act of 1934 during the preceding 12 months (or for such shorter period that the Registrant was required to file such reports), and (2) has been subject to such filing requirements for the past 90 days.
[x] Yes [ ] No
Indicate by check mark which financial statement item the registrant has elected to follow.
[ ] Item 17 [x] Item 18
Unless the context requires otherwise, references to "we," "us," "our" and the "Telkom Group" in this annual report refer to Telkom SA Limited and its subsidiaries and its 50% interest in Vodacom, and references to "Telkom" in this annual report refer only to Telkom SA Limited. References to "Vodacom" in this annual report refer to Telkom's 50% owned joint venture, Vodacom Group (Proprietary) Limited, and its subsidiaries. We do not control Vodacom, the management of which requires consensus agreement among its shareholders who are party to Vodacom's joint venture agreement.
SPECIAL NOTE REGARDING FORWARD-LOOKING STATEMENTS
Many of the statements included in this annual report, as well as oral statements that may be made by us or by officers, directors or employees acting on behalf of us, constitute or are based on forward-looking statements within the meaning of the U.S. Private Securities Litigation Reform Act of 1995, specifically Section 21E of the U.S. Securities Exchange Act of 1934, as amended. All statements, other than statements of historical facts, including, among others, statements regarding our future financial position and plans, strategies, objectives, capital expenditures, projected costs and anticipated cost savings and financing plans, as well as projected levels of growth in the communications market, are forward-looking statements. Forward-looking statements can generally be identified by the use of terminology such as "may," "will," "should," "expect," "envisage," "intend," "plan," "project," "estimate," "anticipate," "believe," "hope," "can," "is designed to" or similar phrases, although the absence of such words does not necessarily mean that a statement is not forward-looking. These forward-looking statements involve a number of known and unknown risks, uncertainties and other factors that could cause our actual results and outcomes to be materially different from historical results or from any future results expressed or implied by such forward-looking statements. Among the factors that could cause our actual results or outcomes to differ materially from our expectations are those risks identified in Item 3. "Key Information—Risk Factors," including, but not limited to, increased competition in the South African fixed-line and mobile communications markets; continued reductions in Vodacom's and Telkom's net interconnect margins; developments in the regulatory environment; our ability to reduce expenditure; the outcome of legal or arbitration proceedings, including the outcome of Telkom's hearing before the Competition Commission related to the VANs litigation and its proceedings with Telcordia Technologies Incorporated; the impact of the Municipal Property Rates Act; Vodacom's ability to expand its operations in other African countries and the general economic, political, social and legal conditions in South Africa and in other countries where Vodacom invests; fluctuations in the value of the Rand and inflation rates; our ability to retain key personnel; customer non-payments, theft and bad debt; and other matters not yet known to us or not currently considered material by us.
We caution you not to place undue reliance on these forward-looking statements. All written and oral forward-looking statements attributable to us, or persons acting on our behalf, are qualified in their entirety by these cautionary statements. Moreover, unless we are required by law to update these statements, we will not necessarily update any of these statements after the date of this annual report, either to conform them to actual results or to changes in our expectations.
i
PART I | ||||
Item 1. | Identity of Directors, Senior Management and Advisors | 1 | ||
| Item 2. | Offer Statistics and Expected Timetable | 1 | ||
| Item 3. | Key Information | 1 | ||
| Item 4. | Information on the Company | 33 | ||
| Item 5. | Operating and Financial Review and Prospects | 105 | ||
| Item 6. | Directors, Senior Management and Employees | 163 | ||
| Item 7. | Major Shareholders and Related Party Transactions | 190 | ||
| Item 8. | Financial Information | 204 | ||
| Item 9. | The Offer and Listing | 206 | ||
| Item 10. | Additional Information | 206 | ||
| Item 11. | Quantitative and Qualitative Disclosures About Market Risk | 236 | ||
| Item 12. | Description of Securities Other than Equity Securities | 243 | ||
PART II | ||||
Item 13. | Defaults, Dividend Arrearages and Delinquencies | 244 | ||
| Item 14. | Material Modifications to the Rights of Security Holders and Use of Proceeds | 244 | ||
| Item 15. | Controls and Procedures | 244 | ||
| Item 16A. | Audit Committee Financial Expert | 244 | ||
| Item 16B | Code of Ethics | 244 | ||
| Item 16C | Principal Accountant Fees and Services | 245 | ||
| Item 16D | Exemptions From the Listing Standards for Audit Committees | 245 | ||
| Item 16E | Purchases of Equity Securities by the Issuer and Affiliated Purchasers | 245 | ||
PART III | ||||
Item 17. | Financial Statements | 246 | ||
| Item 18. | Financial Statements | 247 | ||
| Item 19. | Exhibits | 247 | ||
ii
Item 1. Identity of Directors, Senior Management and Advisors
Not applicable.
Item 2. Offer Statistics and Expected Timetable
Not applicable.
SELECTED HISTORICAL CONSOLIDATED FINANCIAL
AND OTHER DATA OF THE TELKOM GROUP
The following table sets forth selected historical consolidated financial and other data of the Telkom Group as of and for each of the five years ended March 31, 2004. Information in the following table includes our 50% interest in the results, assets, liabilities and shareholders' equity of Vodacom, which we proportionately consolidate. Unless otherwise indicated, fixed-line statistical data is derived from the results of operations of our fixed-line segment, which provides fixed-line voice and data communications services through Telkom; directory services through our 64.9% owned subsidiary, Telkom Directory Services; and wireless data services through our wholly-owned subsidiary, Swiftnet. Reclassifications to prior periods have occurred in each of the years ending March 31, 2003 and 2004. In the 2003 financial year, we reclassified some of the items previously included in selling, general and administrative operating expenses and investment income into other income, a new line item in the Telkom Group's consolidated income statements. The reclassifications in the 2003 financial year reduced operating profit and EBITDA by R22 million in the 2002 financial year and increased operating profit and EBITDA by R59 million in the 2001 financial year. In the 2004 financial year, we reclassified discounts offered on mobile-to-fixed interconnect and discounts on leased line facilities to mobile operators from payments to other operators in operating expenses to an offset to operating revenue. We also reclassified costs in respect of asset write-offs from selling, general and administrative expenses to depreciation, amortization, impairments and asset write-offs; costs in respect of losses on the disposal of property, plant and equipment and investments from selling, general and administrative expenses to other income; and insurance costs paid to Debis for our vehicle fleet from operating leases to services rendered in the 2004 financial year. In addition, we revised our presentation to remove other income from operating expense. The reclassifications in the 2004 financial year had no effect on operating profit in prior years, but reduced operating revenue by R98 million, R109 million, R110 million and R93 million and increased EBITDA by R0 million, R279 million, R445 million and R205 million in the 2000, 2001, 2002 and 2003 financial years, respectively. The Telkom Group's consolidated income statements included in this annual report and the following financial information for each of the five years ended March 31, 2004 reflect all such reclassifications.
The following selected historical consolidated financial data of the Telkom Group as of and for each of the three years ended March 31, 2004 was extracted from the Telkom Group's historical consolidated financial statements included in this annual report, which have been audited by Ernst & Young, Independent Accountants and Auditors, Chartered Accountants (SA). The following selected historical consolidated financial data of the Telkom Group as of and for each of the two years ended March 31, 2001 was extracted from the Telkom Group's consolidated financial statements not included in this annual report, which have also been audited by Ernst & Young, Independent Accountants and Auditors, Chartered Accountants (SA).
1
The consolidated financial statements of the Telkom Group have been prepared in accordance with International Financial Reporting Standards, or IFRS, which differs in certain respects from US Generally Accepted Accounting Principles, or US GAAP. For a description of the principal differences between IFRS and US GAAP relevant to the consolidated financial statements of the Telkom Group and a reconciliation to US GAAP of net income and profit and shareholders' equity, see note 47 of the notes to the audited consolidated financial statements of the Telkom Group as of and for each of the three years ended March 31, 2004 included in this annual report.
EBITDA represents net profit before minority interests, taxation, finance charges, investment income and depreciation, amortization, impairment and write-offs. We believe that EBITDA provides meaningful additional information to investors since it is widely accepted by analysts and investors as a basis for comparing a company's underlying operating profitability with that of other companies as it is not influenced by past capital expenditures or business acquisitions, a company's capital structure or the relevant tax regime. This is particularly the case in a capital-intensive industry such as communications. It is also a widely accepted indicator of a company's ability to service its long-term debt and other fixed obligations and to fund its continued growth. EBITDA is not a US GAAP or IFRS measure. You should not construe EBITDA as an alternative to operating profit or cash flows from operating activities determined in accordance with US GAAP or IFRS or as a measure of liquidity. EBITDA is not defined in the same manner by all companies and may not be comparable to other similarly titled measures of other companies unless the definition is the same. In addition, because the calculation of EBITDA in the maintenance covenants contained in our credit facilities is based on accounting policies in use, consistently applied from the time the indebtedness was incurred. EBITDA for purposes of those covenants is not calculated in the same manner as it is calculated in the table below.
Fixed access lines are comprised of public switched telecommunications network lines, or PSTN lines, including integrated services digital network channels, or ISDN channels, public and private payphones and internal lines in service. We calculate fixed-line penetration, or teledensity, based on the total number of telephone lines in service at the end of the period per 100 persons in the population of South Africa. Population is the estimated South African population at the mid year in the periods indicated as published by Statistics South Africa, a South African governmental department. We calculate fixed-line traffic, other than international outgoing mobile traffic and international interconnection traffic, by dividing traffic operating revenue for the particular category by the weighted average tariff for such category during the relevant period. Fixed-line international outgoing mobile traffic and international interconnection traffic are based on the actual traffic registered through the respective exchanges and reflected in international interconnection invoices. We calculate revenue per fixed access line by dividing total fixed-line revenue during the period, excluding data and directories and other revenue, by the average number of fixed access lines during the period. We calculate our number of fixed lines per fixed-line employee on the basis of fixed access lines in service at period end divided by the number of employees of Telkom at period end.
Rand amounts as of and for the year ended March 31, 2004 have been translated into Dollars solely for your convenience at R6.32 per $1.00, the Rand noon buying rate discussed in Item 3. "Key Information—Exchange Rates" on March 31, 2004, the date of the Telkom Group's most recent consolidated balance sheet included in this annual report. These translations should not be construed as representations that the Rand amounts could actually be converted into US dollars at these rates or at all.
You should read the following information together with Item 3. "Key Information—Risk Factors," Item 5. "Operating and Financial Review and Prospects" and the consolidated financial statements and the notes thereto of the Telkom Group and Vodacom Group included in this annual report.
2
| | Year ended March 31, | |||||||||||||
|---|---|---|---|---|---|---|---|---|---|---|---|---|---|---|
| | 2000 | 2001 | 2002 | 2003 | 2004 | 2004 | ||||||||
| | ZAR | ZAR | ZAR | ZAR | ZAR | USD | ||||||||
| | (in millions, except per share amounts) | |||||||||||||
| Income Statement Data | ||||||||||||||
| Amounts in accordance with IFRS | ||||||||||||||
| Operating revenue(1) | 27,015 | 31,243 | 34,087 | 37,507 | 40,795 | 6,455 | ||||||||
| Other income(2)(7) | 621 | 192 | 143 | 233 | 98 | 15 | ||||||||
| Operating expenses | (23,728 | ) | (26,451 | ) | (30,039 | ) | (31,226 | ) | (31,805 | ) | (5,032 | ) | ||
| Employee expenses(3) | (7,713 | ) | (6,590 | ) | (7,166 | ) | (7,208 | ) | (7,408 | ) | (1,172 | ) | ||
| Payments to other operators(4) | (4,143 | ) | (4,874 | ) | (5,652 | ) | (6,092 | ) | (5,985 | ) | (947 | ) | ||
| Selling, general and administrative(5)(6)(7) | (5,919 | ) | (6,825 | ) | (7,956 | ) | (7,682 | ) | (7,971 | ) | (1,261 | ) | ||
| Services rendered(8) | (1,439 | ) | (1,604 | ) | (2,273 | ) | (2,622 | ) | (2,269 | ) | (359 | ) | ||
| Operating leases(8) | (340 | ) | (1,227 | ) | (1,139 | ) | (1,124 | ) | (923 | ) | (146 | ) | ||
| Depreciation, amortization, impairments and write-offs(6) | (4,174 | ) | (5,331 | ) | (5,853 | ) | (6,498 | ) | (7,249 | ) | (1,147 | ) | ||
| Operating profit | 3,908 | 4,984 | 4,191 | 6,514 | 9,088 | 1,438 | ||||||||
| Investment income | 615 | 558 | 512 | 424 | 479 | 75 | ||||||||
| Finance charges | (2,482 | ) | (3,137 | ) | (2,550 | ) | (4,154 | ) | (3,264 | ) | (516 | ) | ||
| Profit before tax | 2,041 | 2,405 | 2,153 | 2,784 | 6,303 | 997 | ||||||||
| Taxation | (501 | ) | (715 | ) | (873 | ) | (1,049 | ) | (1,711 | ) | (271 | ) | ||
| Profit after tax | 1,540 | 1,690 | 1,280 | 1,735 | 4,592 | 726 | ||||||||
| Minority interests | (13 | ) | (68 | ) | (59 | ) | (105 | ) | (69 | ) | (11 | ) | ||
| Net profit | 1,527 | 1,622 | 1,221 | 1,630 | 4,523 | 715 | ||||||||
| Number of ordinary shares outstanding | ||||||||||||||
| Basic | 557 | 557 | 557 | 557 | 554 | 554 | ||||||||
| Diluted | 557 | 557 | 557 | 557 | 554 | 554 | ||||||||
| Earnings per share (cents) | ||||||||||||||
| Basic | 274.1 | 291.2 | 219.2 | 292.6 | 812.0 | 128.5 | ||||||||
| Diluted | 274.1 | 291.2 | 219.2 | 292.6 | 812.0 | 128.5 | ||||||||
| Dividends per share (cents) | 59.6 | — | — | — | 90.0 | 14.2 | ||||||||
| Amounts in accordance with US GAAP | ||||||||||||||
| Operating revenue | n/a | 26,304 | 27,837 | 29,605 | 30,541 | 4,832 | ||||||||
| Operating income | n/a | 3,775 | 2,476 | 4,595 | 6,696 | 1,059 | ||||||||
| Net income | n/a | 1,598 | 1,317 | 1,704 | 4,230 | 669 | ||||||||
| Earnings per share (cents) | ||||||||||||||
| Basic | n/a | 286.9 | 236.5 | 305.9 | 759.4 | 120.1 | ||||||||
| Diluted | n/a | 286.9 | 236.5 | 305.9 | 759.4 | 120.1 | ||||||||
3
| | Year ended March 31, | ||||||||||||
|---|---|---|---|---|---|---|---|---|---|---|---|---|---|
| | 2000 | 2001 | 2002 | 2003 | 2004 | 2004 | |||||||
| | ZAR | ZAR | ZAR | ZAR | ZAR | USD | |||||||
| | (in millions) | ||||||||||||
| Balance Sheet Data | |||||||||||||
| Amounts in accordance with IFRS | |||||||||||||
| Total assets(9) | 47,276 | 53,537 | 55,316 | 53,229 | 52,984 | 8,384 | |||||||
| Current assets(10) | 11,010 | 12,674 | 10,997 | 9,921 | 11,061 | 1,750 | |||||||
| Cash and cash equivalents | 1,953 | 1,801 | 724 | 1,117 | 3,218 | 509 | |||||||
| Other current assets(10) | 9,057 | 10,873 | 10,273 | 8,804 | 7,843 | 1,241 | |||||||
| Non-current assets(9)(10) | 36,266 | 40,863 | 44,319 | 43,308 | 41,923 | 6,634 | |||||||
| Total liabilities(9)(11) | 33,879 | 38,449 | 38,351 | 34,687 | 30,726 | 4,862 | |||||||
| Current liabilities(9)(12)(13) | 14,382 | 15,314 | 12,765 | 14,197 | 14,443 | 2,286 | |||||||
| Short-term debt(9)(14) | 6,046 | 6,425 | 2,976 | 5,039 | 4,473 | 708 | |||||||
| Other current liabilities(12)(13) | 8,336 | 8,889 | 9,789 | 9,158 | 9,970 | 1,578 | |||||||
| Non-current liabilities(11)(12)(13) | 19,497 | 23,135 | 25,586 | 20,490 | 16,283 | 2,576 | |||||||
| Long-term debt(11)(15) | 15,928 | 19,843 | 22,533 | 17,453 | 12,703 | 2,010 | |||||||
| Other non-current liabilities(12)(13) | 3,569 | 3,292 | 3,053 | 3,037 | 3,580 | 566 | |||||||
| Minority interests | 47 | 116 | 133 | 194 | 200 | 32 | |||||||
| Shareholders' equity | 13,350 | 14,972 | 16,832 | 18,348 | 22,058 | 3,490 | |||||||
| Amounts in accordance with US GAAP | |||||||||||||
| Total assets | n/a | 49,535 | 50,944 | 48,991 | 46,933 | 7,426 | |||||||
| Total liabilities | n/a | 35,637 | 35,281 | 31,828 | 26,408 | 4,178 | |||||||
| Shareholders' equity | n/a | 13,776 | 15,535 | 17,013 | 20,371 | 3,223 | |||||||
| | Year ended March 31, | ||||||||||||
|---|---|---|---|---|---|---|---|---|---|---|---|---|---|
| | 2000 | 2001 | 2002 | 2003 | 2004 | 2004 | |||||||
| | ZAR | ZAR | ZAR | ZAR | ZAR | USD | |||||||
| | (in millions) | ||||||||||||
| Cash Flow Data | |||||||||||||
| Amounts in accordance with IFRS | |||||||||||||
| Cash flow from operating activities | 4,917 | 6,165 | 8,171 | 9,748 | 13,884 | 2,197 | |||||||
| Cash flow used in investing activities(16) | (9,107 | ) | (9,964 | ) | (9,250 | ) | (5,731 | ) | (5,423 | ) | (858 | ) | |
| Cash flow (used in)/from financing activities(16) | 5,051 | 3,439 | 66 | (3,026 | ) | (6,481 | ) | (1,025 | ) | ||||
Other Data | |||||||||||||
| EBITDA(17) | 8,082 | 10,315 | 10,044 | 13,012 | 16,337 | 2,585 | |||||||
| Total debt (at period end)(9)(11)(18) | 21,974 | 26,268 | 25,509 | 22,492 | 17,176 | 2,718 | |||||||
| Capital expenditures excluding intangibles | 9,461 | 9,889 | 9,004 | 5,712 | 5,307 | 840 | |||||||
4
| | Year ended March 31, | ||||||||||
|---|---|---|---|---|---|---|---|---|---|---|---|
| | 2000 | 2001 | 2002 | 2003 | 2004 | ||||||
| Fixed-Line Statistical Data | |||||||||||
| Fixed access lines (thousands) (at period end)(19) | 5,493 | 4,962 | 4,924 | 4,844 | 4,821 | ||||||
| Postpaid | |||||||||||
| PSTN(20) | 4,668 | 3,930 | 3,554 | 3,285 | 3,134 | ||||||
| ISDN channels | 271 | 374 | 467 | 563 | 656 | ||||||
| Prepaid | 381 | 480 | 708 | 817 | 856 | ||||||
| Payphones(21) | 173 | 178 | 195 | 179 | 175 | ||||||
| Fixed-line penetration rate (%) (at period end) | 12.8 | 11.4 | 11.1 | 10.7 | 10.4 | ||||||
| Revenue per fixed access line (ZAR) | 3,859 | 4,287 | 4,722 | 4,987 | 5,169 | ||||||
| Total fixed-line traffic (millions of minutes)(22) | 31,127 | 32,863 | 33,084 | 32,868 | 32,942 | ||||||
| Local(23) | 19,471 | 20,387 | 20,538 | 20,396 | 20,547 | ||||||
| Long distance | 5,222 | 4,900 | 4,747 | 4,728 | 4,616 | ||||||
| Fixed-to-mobile | 3,659 | 4,307 | 4,364 | 4,135 | 3,980 | ||||||
| International outgoing | 344 | 356 | 374 | 439 | 427 | ||||||
| International voice over internet protocol | — | — | — | — | 25 | ||||||
| Interconnection | 2,431 | 2,913 | 3,061 | 3,170 | 3,347 | ||||||
| Data Communications Services | |||||||||||
| Managed network sites (at period end) | 3,138 | 4,634 | 5,684 | 7,729 | 9,061 | ||||||
| Retail internet customers (at period end) | 23,205 | 37,122 | 48,995 | 98,690 | 142,208 | ||||||
| Number of full-time, fixed-line employees (at period end)(24) | 49,128 | 43,758 | 39,444 | 35,361 | 32,358 | ||||||
| Fixed lines per fixed-line employee (at period end)(24) | 112 | 113 | 125 | 137 | 149 | ||||||
- (1)
- Includes an offset for discounts offered on mobile-to-fixed interconnect which had previously been included in operating expenses under payments to other operators in the 2003, 2002, 2001 and 2000 financial years. The discounts were R9 million, R11 million, R33 million, R48 million and R50 million, or 1.3%, 1.8%, 5.9%, 9.1% and 10.0% of gross interconnection revenues from domestic mobile operators for the years ended March 31, 2004, 2003, 2002, 2001 and 2000, respectively. Includes an offset for discounts on leased line facilities to mobile operators which had previously been included in operating expenses under payments to other operators in the 2003, 2002, 2001 and 2000 financial years. The discounts were R77 million, R82 million, R77 million, R61 million and R48 million, or 7.8%, 8.1%, 9.2%, 8.7% and 8.2% of leased line facilities rental from mobile operators for the years ended March 31, 2004, 2003, 2002, 2001 and 2000, respectively. Revenue for the 2003, 2002, 2001 and 2000 financial years has been revised to reflect the new presentation.
- (2)
- Other income includes profit and losses on disposal of investments and property, plant and equipment.
- (3)
- Employee expenses include retrenchment costs of R302 million, R244 million, R373 million, R132 million and R303 million in the years ended March 31, 2004, 2003, 2002, 2001 and 2000, respectively.
- (4)
- Discounts offered on mobile-to-fixed interconnect of R9 million, R11 million, R33 million, R48 million and R50 million in the 2004, 2003, 2002, 2001 and 2000 financial years, respectively, and discounts on leased line facilities to mobile operators of R77 million, R82 million, R77 million, R61 million and R48 million in the 2004, 2003, 2002, 2001 and 2000 financial years, respectively, were reclassified from payments to other operators in operating expenses to an offset to operating revenue in the 2004 financial year. Payments to other operators for the 2003, 2002, 2001 and 2000 financial years have been revised to reflect the new presentation.
5
- (5)
- Selling, general and administrative expense includes provisions for potential liabilities related to Telkom's arbitration with Telcordia of R325 million in the year ended March 31, 2002, excluding interest and legal fees. In the year ended March 31, 2003, we recorded a R117 million gain related to this provision in terms of IAS21 and IAS39 in finance charges as a result of the strengthening of the Rand. In addition, we included provisions for interest of R40 million and R50 million related to Telcordia in finance charges in the years ended March 31, 2003 and 2002, respectively, and a provision for legal fees of R58 million related to Telcordia is included in services rendered in the year ended March 31, 2003. In the year ended March 31, 2004, all of these provisions were reversed.
- (6)
- Costs in respect of asset write-offs of R350 million, R205 million, R445 million, R279 million and R0 million in the 2004, 2003, 2002, 2001 and 2000 financial years, respectively, were reclassified from selling, general and administrative expenses to depreciation, amortization, impairments and asset write-offs in the 2004 financial year. Selling, general and administrative expenses and depreciation, amortization, impairments and asset write-offs for the 2003, 2002 and 2001 financial years have been revised to reflect the new presentation.
- (7)
- Costs in respect of losses on the disposal of property, plant and equipment and investments of R6 million, R1 million, R1 million, R14 million and R9 million in the 2004, 2003, 2002, 2001 and 2000 financial years, respectively, were reclassified from selling, general and administrative expenses to other income in the 2004 financial year. Selling, general and administrative expenses and other income have been revised to reflect the new presentation.
- (8)
- Insurance costs paid to Debis for our vehicle fleet of R81 million, R81 million, R78 million and R65 million in the 2004, 2003, 2002, and 2001 financial years, respectively, were reclassified from operating leases to services rendered in the 2004 financial year. Operating leases and services rendered for the 2003, 2002, 2001 and 2000 financial years have been revised to reflect the new presentation.
- (9)
- In the 2004 financial year, Vodacom reclassified its investment in the preference shares of Vodacom Congo (RDC) s.p.r.l. Previously, the investment and short term interest bearing debt of R150.3 million and R215.8 million in the 2003 and 2002 financial years, respectively, were netted off. Vodacom has revised its presentation to move the liabilities associated with its investment to short term debt. Non-current assets and short term debt for the 2003 and 2002 financial years have been revised to reflect the new presentation.
- (10)
- Short-term investments of R29 million were reclassified from non-current assets to current assets in the year ended March 31, 2002.
- (11)
- As of March 31, 2004, R3.9 billion of our long-term debt was guaranteed by the Government of the Republic of South Africa.
- (12)
- Long-term provisions for the phantom share scheme of R144 million were reclassified from current liabilities to non-current liabilities in the year ended March 31, 2001.
- (13)
- Telephone rebate provisions of R12 million, R14 million and R11 million were reclassified from non-current to current liabilities in the years ended March 31, 2004, 2003 and 2002, respectively.
- (14)
- Includes short-term portion of finance leases and utilized credit facilities.
- (15)
- Includes long-term portion of finance leases.
- (16)
- Costs of R44 million related to our initial public offering were reclassified from cash flow used in investing activities to cash flow from financing activities in the year ended March 31, 2002.
6
- (17)
- EBITDA can be reconciled to net profit as follows:
| | Year ended March 31, | ||||||||||||
|---|---|---|---|---|---|---|---|---|---|---|---|---|---|
| | 2000 | 2001 | 2002 | 2003 | 2004 | 2004 | |||||||
| | ZAR | ZAR | ZAR | ZAR | ZAR | USD | |||||||
| | (in millions) | ||||||||||||
| EBITDA | 8,082 | 10,315 | 10,044 | 13,012 | 16,337 | 2,585 | |||||||
| Depreciation, amortization, impairments and write-offs | (4,174 | ) | (5,331 | ) | (5,853 | ) | (6,498 | ) | (7,249 | ) | (1,147 | ) | |
| Investment income | 615 | 558 | 512 | 424 | 479 | 75 | |||||||
| Finance charges | (2,482 | ) | (3,137 | ) | (2,550 | ) | (4,154 | ) | (3,264 | ) | (516 | ) | |
| Taxation | (501 | ) | (715 | ) | (873 | ) | (1,049 | ) | (1,711 | ) | (271 | ) | |
| Minority interests | (13 | ) | (68 | ) | (59 | ) | (105 | ) | (69 | ) | (11 | ) | |
| Net Profit | 1,527 | 1,622 | 1,221 | 1,630 | 4,523 | 715 | |||||||
- (18)
- Includes short-term and long-term debt, finance lease obligations and utilized credit facilities.
- (19)
- Including Telkom internal lines of 140,950, 134,972, 162,460, 151,986 and 145,302 as of March 31, 2004, 2003, 2002, 2001 and 2000, respectively. Each PSTN line includes one access channel, each basic ISDN line includes two access channels and each primary ISDN line includes 30 access channels.
- (20)
- Excluding ISDN channels. PSTN lines are provided using copper cable, DECT and fiber.
- (21)
- Includes public and private payphones.
- (22)
- In the 2003 financial year, we revised the calculation of the weighted average tariffs for certain prepaid calls and our ShareCall product. We have recalculated the traffic for the 2002 and 2001 financial years accordingly. Calculated on the original basis, local traffic was 20,252 and 20,388 millions of minutes, long-distance traffic was 4,895 and 4,938 millions of minutes, fixed-to-mobile traffic was 4,390 and 4,319 millions of minutes, international outgoing traffic was 375 and 357 millions of minutes and total traffic was 32,973 and 32,915 millions of minutes in the 2002 and 2001 financial years, respectively.
- (23)
- Local traffic includes internet traffic.
- (24)
- Includes employees of Telkom only.
7
SELECTED HISTORICAL CONSOLIDATED FINANCIAL
AND OTHER DATA OF VODACOM GROUP
The following table sets forth selected consolidated financial and other data of Vodacom as of and for each of the five years ended March 31, 2004. Information in the Vodacom table reflects 100% of Vodacom's results of operations. Unless otherwise indicated, information with respect to Vodacom's other African operations in the Vodacom table reflects 100% of the operations of Vodacom's subsidiaries in Lesotho, Tanzania and Mozambique and 51% of Vodacom's joint venture in the Democratic Republic of the Congo that is proportionately consolidated in Vodacom's consolidated financial statements. We proportionately consolidate our 50% interest in Vodacom in the Telkom Group's consolidated financial statements. Vodacom's other operating income, direct network operating costs, depreciation, staff expenses, marketing and advertising expenses, general administration expenses, amortization of intangible assets and integration costs, disposal of operations and impairments are presented as separate line items in Vodacom's consolidated financial statements, but have been combined under the heading "operating expenses" in the table set forth below.
The following selected historical consolidated financial data of Vodacom as of and for each of the three years ended March 31, 2004 have been extracted from Vodacom's historical consolidated financial statements included in this annual report, which were audited by Deloitte & Touche Registered Accountants and Auditors, Chartered Accountants (SA) in the 2004 financial year and were audited by each of PricewaterhouseCoopers, Inc. and Deloitte & Touche, Registered Accountants and Auditors, Chartered Accountants (SA) in the 2003 and 2002 financial years. The following selected historical consolidated financial data of Vodacom as of and for each of the two years ended March 31, 2001 have been extracted from Vodacom's historical consolidated financial statements not included in this annual report, which were also audited by PricewaterhouseCoopers, Inc. and Deloitte & Touche, Registered Accountants and Auditors, Chartered Accountants (SA).
The consolidated financial statements of Vodacom have been prepared in accordance with IFRS, which differs in certain respects from US GAAP. For a description of the principal differences between IFRS and US GAAP relevant to the financial statements of Vodacom and a reconciliation to US GAAP of net income and shareholders' equity, see note 48 of the notes to the audited consolidated financial statements of Vodacom as of and for each of the three years ended March 31, 2004 included in this annual report.
EBITDA represents net profit before minority interests, taxation, finance charges, investment income and depreciation and amortization. We believe that EBITDA provides meaningful additional information to investors since it is widely accepted by analysts and investors as a basis for comparing a company's underlying operating profitability with that of other companies as it is not influenced by past capital expenditures or business acquisitions, a company's capital structure or the relevant tax regime. This is particularly the case in a capital-intensive industry such as communications. It is also a widely accepted indicator of a company's ability to service its long-term debt and other fixed obligations and to fund its continued growth. EBITDA is not a US GAAP or IFRS measure. You should not construe EBITDA as an alternative to operating profit or cash flows from operating activities determined in accordance with US GAAP or IFRS or as a measure of liquidity. EBITDA is not defined in the same manner by all companies and may not be comparable to other similarly titled measures of other companies unless the definition is the same.
Vodacom's customer totals are based on the total number of customers registered on Vodacom's network, which have not been disconnected, including inactive customers, as of the end of the period indicated. See Item 4. "Information on the Company—Business Overview—Mobile Communications—South Africa—Customers" for a discussion of Vodacom's procedures with respect to disconnections and inactive customers. Vodacom's churn is calculated by dividing the average monthly number of disconnections during the period by the average monthly total reported customer base during the
8
period. Vodacom's market share is derived from Vodacom's total customers, MTN's total reported mobile subscribers and Cell C's total estimated mobile subscribers. Vodacom calculates penetration, or teledensity, based on the total number of customers at the end of the period per 100 persons in the population of South Africa. Population is the estimated South African population at the mid-year in the periods indicated as published by Statistics South Africa, a South African governmental department. Vodacom's traffic comprises total traffic registered on Vodacom's network, including bundled minutes, outgoing international roaming calls and calls to free services, but excluding national and incoming international roaming calls. Vodacom's average monthly revenue per customer, or ARPU, is calculated by dividing the average monthly revenue during the period by the average monthly total reported customer base during the period. ARPU excludes revenue from equipment sales, other sales and services and revenue from national and international users roaming on Vodacom's networks. Vodacom's average monthly minutes of use per customer, or average MOU, is calculated by dividing the average monthly minutes during the period by the average monthly total reported customer base during the period. MOU excludes calls to free services, bundled minutes and data minutes. Cumulative network capital expenditure per customer is the cumulative network capital expenditure since the launch of Vodacom's South African network divided by Vodacom's average customers in South Africa for the period.
Rand amounts as of and for the year ended March 31, 2004 have been translated into Dollars solely for your convenience at R6.32 per $1.00, the Rand noon buying rate discussed in Item 3. "Key Information—Exchange Rates," on March 31, 2004, the date of Vodacom's most recent balance sheet included in this annual report. These translations should not be construed as representations that the Rand amounts could actually be converted into US dollars at these rates or at all.
You should read the following information together with Item 3. "Key Information—Risk Factors," Item 5. "Operating and Financial Review and Prospects" and the consolidated financial statements and the notes thereto of the Telkom Group and Vodacom Group included in this annual report.
9
| | Year ended March 31, | |||||||||||||
|---|---|---|---|---|---|---|---|---|---|---|---|---|---|---|
| | 2000 | 2001 | 2002 | 2003 | 2004 | 2004 | ||||||||
| | ZAR | ZAR | ZAR | ZAR | ZAR | USD | ||||||||
| | (in millions) | |||||||||||||
| Income Statement Data | ||||||||||||||
| Amounts in accordance with IFRS | ||||||||||||||
Revenue | 9,572 | 13,276 | 16,151 | 19,779 | 23,478 | 3,715 | ||||||||
| Operating expenses(1) | (7,208 | ) | (10,723 | ) | (12,530 | ) | (15,449 | ) | (18,244 | ) | (2,887 | ) | ||
| Operating profit | 2,364 | 2,553 | 3,621 | 4,330 | 5,234 | 828 | ||||||||
| Investment income(2) | 32 | 28 | 840 | 742 | 657 | 104 | ||||||||
| Finance charges(2) | (567 | ) | (507 | ) | (868 | ) | (1,546 | ) | (1,108 | ) | (175 | ) | ||
| Profit before tax | 1,829 | 2,074 | 3,593 | 3,526 | 4,783 | 757 | ||||||||
| Taxation | (514 | ) | (765 | ) | (1,190 | ) | (1,199 | ) | (1,725 | ) | (273 | ) | ||
| Profit after tax | 1,315 | 1,309 | 2,403 | 2,327 | 3,058 | 484 | ||||||||
| Minority interests | — | 9 | (30 | ) | (112 | ) | (26 | ) | (4 | ) | ||||
| Net profit | 1,315 | 1,318 | 2,373 | 2,215 | 3,032 | 480 | ||||||||
Amounts in accordance with US GAAP | ||||||||||||||
Net profit for the year | n/a | 1,249 | 2,120 | 2,099 | 2,997 | 474 | ||||||||
As of March 31, | |||||||||||||
|---|---|---|---|---|---|---|---|---|---|---|---|---|---|
| | 2000 | 2001 | 2002 | 2003 | 2004 | 2004 | |||||||
| | ZAR | ZAR | ZAR | ZAR | ZAR | USD | |||||||
| | (in millions) | ||||||||||||
| Balance Sheet Data | |||||||||||||
| Amounts in accordance with IFRS | |||||||||||||
Total assets(3) | 9,864 | 12,342 | 15,574 | 16,966 | 20,098 | 3,180 | |||||||
| Current assets | 2,788 | 3,470 | 4,145 | 4,690 | 6,904 | 1,092 | |||||||
| Cash and cash equivalents | 936 | 798 | 719 | 1,207 | 2,370 | 375 | |||||||
| Other current assets | 1,852 | 2,672 | 3,426 | 3,483 | 4,534 | 717 | |||||||
| Non-current assets(3) | 7,076 | 8,872 | 11,429 | 12,276 | 13,194 | 2,088 | |||||||
| Total liabilities(3) | 7,195 | 8,847 | 10,099 | 10,041 | 12,402 | 1,962 | |||||||
| Current liabilities(3) | 5,883 | 7,267 | 8,205 | 7,159 | 9,833 | 1,556 | |||||||
| Short-term debt(3)(4) | 3,370 | 2,547 | 3,732 | 1,919 | 1,616 | 256 | |||||||
| Other current liabilities | 2,513 | 4,720 | 4,473 | 5,240 | 8,217 | 1,300 | |||||||
| Non-current liabilities | 1,312 | 1,580 | 1,894 | 2,882 | 2,569 | 406 | |||||||
| Long-term debt(5) | 817 | 896 | 780 | 1,732 | 1,217 | 192 | |||||||
| Other non-current liabilities | 495 | 684 | 1,114 | 1,150 | 1,352 | 214 | |||||||
| Minority interests | (2 | ) | (11 | ) | 11 | 88 | 93 | 15 | |||||
| Shareholders' equity | 2,671 | 3,506 | 5,464 | 6,837 | 7,603 | 1,203 | |||||||
Amounts in accordance with US GAAP | |||||||||||||
Shareholders' equity | n/a | 3,195 | 4,874 | 6,086 | 6,788 | 1,074 | |||||||
10
| | Year ended March 31, | |||||||||||||
|---|---|---|---|---|---|---|---|---|---|---|---|---|---|---|
| | 2000 | 2001 | 2002 | 2003 | 2004 | 2004 | ||||||||
| | ZAR | ZAR | ZAR | ZAR | ZAR | USD | ||||||||
| | (in millions) | |||||||||||||
| Cash Flow Data | ||||||||||||||
| Amounts in accordance with IFRS | ||||||||||||||
| Cash flow from operating activities | 2,341 | 3,610 | 3,815 | 4,342 | 4,790 | 758 | ||||||||
| Cash flow used in investing activities | (3,338 | ) | (2,853 | ) | (4,543 | ) | (3,243 | ) | (3,000 | ) | (475 | ) | ||
| Cash flow from (used in) financing activities | 646 | (1,038 | ) | 571 | 518 | (798 | ) | (126 | ) | |||||
Other Data | ||||||||||||||
| EBITDA(6) | 3,462 | 4,189 | 5,691 | 6,704 | 7,767 | 1,229 | ||||||||
| Total debt (at period end)(7) | 4,187 | 3,443 | 4,513 | 3,652 | 2,833 | 448 | ||||||||
| Capital expenditures including intangibles | 2,032 | 3,184 | 4,279 | 3,399 | 3,012 | 477 | ||||||||
| South Africa | 2,011 | 2,830 | 3,291 | 2,488 | 1,666 | 264 | ||||||||
| Other African countries | 21 | 354 | 988 | 911 | 1,346 | 213 | ||||||||
| | Year ended March 31, | ||||||||||
|---|---|---|---|---|---|---|---|---|---|---|---|
| | 2000 | 2001 | 2002 | 2003 | 2004 | ||||||
| Statistical Data | |||||||||||
| South Africa | |||||||||||
| Total mobile customers (thousands) (at period end)(8) | 3,069 | 5,108 | 6,557 | 7,874 | 9,725 | ||||||
| Contract | 963 | 1,037 | 1,090 | 1,181 | 1,420 | ||||||
| Prepaid | 2,082 | 4,046 | 5,439 | 6,664 | 8,282 | ||||||
| Community services telephones | 24 | 25 | 28 | 29 | 23 | ||||||
| Total inactive mobile customers (%) (at period end)(9) | n/a | n/a | 13.9 | 18.2 | 17.6 | ||||||
| Contract | n/a | n/a | 3.8 | 5.3 | 5.7 | ||||||
| Prepaid | n/a | n/a | 15.9 | 20.5 | 19.7 | ||||||
| Mobile churn (%)(10) | 31.8 | 23.3 | 27.2 | 30.4 | 36.6 | ||||||
| Contract | 17.4 | 18.7 | 14.5 | 11.9 | 10.1 | ||||||
| Prepaid | 40.5 | 24.8 | 30.1 | 34.0 | 41.3 | ||||||
| Mobile market share (%) (at period end) | 59 | 61 | 61 | 57 | 54 | ||||||
| Mobile penetration (%) (at period end) | 12.1 | 19.1 | 24.2 | 30.2 | 39.0 | ||||||
| Total mobile traffic (millions of minutes) | 5,669 | 7,472 | 8,881 | 10,486 | 12,297 | ||||||
| Outgoing | 2,885 | 4,052 | 4,967 | 6,343 | 7,772 | ||||||
| Incoming | 2,784 | 3,420 | 3,914 | 4,143 | 4,525 | ||||||
| Mobile ARPU (ZAR)(11) | 266 | 208 | 182 | 183 | 177 | ||||||
| Contract(10) | 481 | 493 | 560 | 629 | 634 | ||||||
| Prepaid | 132 | 98 | 93 | 90 | 90 | ||||||
| Community services | n/a | 1,453 | 1,719 | 1,861 | 2,155 | ||||||
| Average MOU | 158 | 137 | 111 | 101 | 96 | ||||||
| Contract | 274 | 270 | 264 | 269 | 263 | ||||||
| Prepaid | 90 | 70 | 58 | 54 | 56 | ||||||
| Community services | 1,593 | 2,859 | 3,354 | 3,162 | 3,061 | ||||||
| Cumulative network capital expenditure per customer (ZAR) (at period end) | 2,543 | 2,053 | 1,991 | 1,933 | 1,720 | ||||||
| Number of mobile employees (at period end)(12) | 4,048 | 4,102 | 3,859 | 3,904 | 3,848 | ||||||
| Number of mobile customers per mobile employee (at period end)(12) | 758 | 1,245 | 1,699 | 2,017 | 2,527 | ||||||
11
Other African countries | |||||||||||
| Number of mobile customers (thousands) (at period end)(13) | 12 | 104 | 306 | 773 | 1,492 | ||||||
| ARPU | |||||||||||
| Lesotho (ZAR) | n/a | n/a | 144 | 104 | 125 | ||||||
| Tanzania (USD) | n/a | 31 | 27 | 22 | 18 | ||||||
| Democratic Republic of the Congo (USD) | n/a | n/a | n/a | 20 | 21 | ||||||
| Mozambique (USD) | n/a | n/a | n/a | n/a | 15 | ||||||
| Number of mobile employees (at period end)(12) | 43 | 170 | 494 | 502 | 761 | ||||||
| Number of mobile customers per mobile employee (at period end)(12)(13) | 279 | 612 | 619 | 1,540 | 1,961 | ||||||
- (1)
- Includes other income of R57.6 million, R68.0 million, R29.2 million, R48.5 million and R14.5 million in the years ended March 31, 2004, 2003, 2002, 2001 and 2000, respectively.
- (2)
- Foreign exchange related items were reclassified between investment income and finance charges in the 2001 and 2002 financial years.
- (3)
- In the 2004 financial year, Vodacom reclassified its investment in the preference shares of Vodacom Congo (RDC) s.p.r.l. Previously, the investment and short term interest bearing debt of R150.3 million and R215.8 million in the 2003 and 2002 financial years, respectively, were netted off. Vodacom has revised its presentation to move the liabilities associated with its investment to short term debt. Non-current assets and short term debt for the 2003 and 2002 financial years have been revised to reflect the new presentation.
- (4)
- Includes short-term portion of finance leases, shareholder loans and non-interest bearing debt, as well as utilized credit facilities.
- (5)
- Includes long-term portion of finance leases.
- (6)
- EBITDA includes a net gain of R56 million, a net loss of R213 million and a net gain of R129 million in the 2002, 2001 and 2000 financial years, respectively, for integration costs, disposals of operations and impairments.
EBITDA can be reconciled to net profit as follows:
| | Year ended March 31, | |||||||||||||
|---|---|---|---|---|---|---|---|---|---|---|---|---|---|---|
| | 2000 | 2001 | 2002 | 2003 | 2004 | 2004 | ||||||||
| | ZAR | ZAR | ZAR | ZAR | ZAR | USD | ||||||||
| | (in millions) | |||||||||||||
| EBITDA | 3,462 | 4,189 | 5,691 | 6,704 | 7,767 | 1,229 | ||||||||
| Depreciation, amortization, impairments and asset write-offs | (1,098 | ) | (1,636 | ) | (2,070 | ) | (2,374 | ) | (2,533 | ) | (401 | ) | ||
| Investment income | 32 | 28 | 840 | 742 | 657 | 104 | ||||||||
| Finance charges | (567 | ) | (507 | ) | (868 | ) | (1,546 | ) | (1,108 | ) | (175 | ) | ||
| Taxation | (514 | ) | (765 | ) | (1,190 | ) | (1,199 | ) | (1,725 | ) | (273 | ) | ||
| Minority interests | 0 | 9 | (30 | ) | (112 | ) | (26 | ) | (4 | ) | ||||
| Net profit | 1,315 | 1,318 | 2,373 | 2,215 | 3,032 | 480 | ||||||||
- (7)
- Includes interest-bearing and non-interest bearing debt, shareholder loans and utilized credit facilities.
- (8)
- Includes inactive customers.
12
- (9)
- Vodacom's inactive customers are defined as all customers registered on Vodacom's network for which no revenue generating activity has been recorded for a period of three consecutive months.
- (10)
- Vodacom's contract customers are disconnected when they terminate their contract, or their service provider who carries the credit risk terminates their contract due to non-payment. Prepaid customers were disconnected if they did not recharge their vouchers after being in time window lock for six months for periods prior to November and December 2002, for four months for periods from November and December 2002 until April 2003 and for three months from April 2003 until December 2003. Time window lock occurs when a customer's paid active time window, or access period expires. In December 2003, Vodacom changed the deactivation rule for prepaid customers to align itself with European and industry standards. From December 2003, prepaid customers are disconnected from its network if they record no revenue generating activity within a period of 215 consecutive days. See "Item 4. "Information on the Company—Business Overview—Mobile communications—South Africa—Customers."
- (11)
- Value added service revenue from previously partially owned service providers is included in contract and total average monthly revenue per customer from October 1, 2001.
- (12)
- Vodacom had a total of 280, 219, 423, 553 and 96 temporary employees as of March 31, 2004, 2003, 2002, 2001 and 2000, respectively. The calculation of total mobile employees between South Africa and other African countries has been restated from 3,984 and 369, respectively, in the year ended March 31, 2002. Includes 100% of Vodacom's employees in the Democratic Republic of the Congo.
- (13)
- Includes 100% of mobile customers in the Democratic Republic of the Congo.
13
All of Telkom's issued and outstanding ordinary shares, including the class A ordinary share and the class B ordinary share, rank equal for dividends. No dividend may be declared to a holder of the class A ordinary share or class B ordinary share, unless the same dividend is declared to holders of all ordinary shares. The following table sets forth information with respect to the annual dividends declared. Dividends per ordinary share are based on 557,031,819 ordinary shares issued and outstanding, which includes the one class A ordinary share and the one class B ordinary share created on March 4, 2003 by the conversion of the two ordinary shares. Annual dividends are expressed in Rands and translated, solely for the convenience of the reader, into Dollars at the Rand noon buying rate described in Item 3. "Key Information—Exchange Rates" below on the relevant dividend payment date. The actual rate that cash dividends are converted to Dollars by the depositary may not equal the Rand noon buying rate on the dividend payment date.
| | Dividends paid per Ordinary Share | Dividends paid per ADS | Total dividends (millions) | Dividend cover(1) | ||||||||||
|---|---|---|---|---|---|---|---|---|---|---|---|---|---|---|
| Year ended March 31, | SA Cents | US Cents | ZAR | US Cents | ZAR | USD | ||||||||
| 2004(2) | 90 | 14.2 | 3.60 | 57.0 | 501.3 | 79.3 | 9.0x | |||||||
| 2003 | — | — | — | — | — | — | n/a | |||||||
| 2002 | — | — | — | — | — | — | n/a | |||||||
| 2001 | — | — | — | — | — | — | n/a | |||||||
| 2000 | 59.6 | 9.7 | n/a | n/a | 331.7 | 53.9 | 4.6x | |||||||
- (1)
- Dividend cover is calculated by dividing net profit for the year after minority interest by the dividend for the year.
- (2)
- The 2004 financial year Interim dividend No.8 of 90 SA Cents per share was paid on December 29, 2003. As of March 31, 2004, we had 3,185,736 of the 557,031,819 issued shares held in treasury.
On June 3, 2004, Telkom's board of directors declared a 2004 financial year final dividend No. 9 of 110 SA cents per share to be paid on July 9, 2004.
Dividends paid by Telkom prior to listing on the JSE Securities Exchange, South Africa and the New York Stock Exchange, or NYSE, reflected its status as being majority-owned by the Government of the Republic of South Africa and should not be considered indicative of Telkom's ability to pay future dividends. Telkom did not declare any dividends in the three years ended March 31, 2003 in order to repay debt and reinvest profits in its fixed-line network modernization, rehabilitation and line-rollout program.
We cannot assure you that any dividend will actually be paid or what the timing or amount of any future dividends will be. Telkom's current dividend policy aims to provide shareholders with a competitive return on their investment, while assuring sufficient reinvestment of profits to enable us to achieve our strategy. Telkom may revise its dividend policy from time to time. The determination to pay dividends, and the amount of the dividends, will depend upon, among other things, the following:
- •
- our earnings;
- •
- our financial condition;
- •
- our capital requirements;
- •
- the impact of currency exchange rate and inflation fluctuations;
- •
- general business conditions and strategies;
14
- •
- contractual restrictions on the payment of dividends;
- •
- the possible effects on our credit worthiness;
- •
- the pay-out and dividend ratios of other major South African companies and other communications providers;
- •
- dividends received from Vodacom; and
- •
- other factors our board of directors may deem relevant, including future growth prospects.
Under South African law, a company may make payments to its shareholders if authorized thereto by its organizational documents. A company may not make any payment, in whatever form, to its shareholders if there are reasonable grounds for believing that:
- •
- the company is or would, after the payment, be unable to pay its debts as they become due in the ordinary course of business; or
- •
- the consolidated assets of the company fairly valued, after the payment, would be less than the consolidated liabilities of the company.
Under South African law, a shareholder is liable to a company for any payments received by the shareholder from the company in violation of these restrictions.
Pursuant to Telkom's memorandum and articles of association, for so long as either the Government of the Republic of South Africa or Thintana Communications is a significant shareholder, Telkom's dividend policy and all declarations of dividends and payments to shareholders will have to be approved by the directors appointed by the Government and Thintana Communications. Pursuant to Telkom's memorandum and articles of association and the shareholders' agreement, a significant shareholder is a shareholder who holds the class A ordinary share or class B ordinary share in the capital of Telkom and at least 15% of Telkom's issued ordinary shares. This percentage will be reduced from time to time to reflect the dilutive effect of issuances of new ordinary shares, but may not be less than 10%. Furthermore, in the shareholders' agreement, the Government and Thintana Communications have agreed to vote their shares together in relation to the declaration and payment of dividends.
Telkom's ability to make future dividend payments will be determined based upon its financial position under IFRS. The following table sets forth a reconciliation of retained earnings in accordance with IFRS to distributable reserves in accordance with IFRS for the periods indicated.
| | Year ended March 31, | ||||||||
|---|---|---|---|---|---|---|---|---|---|
| | 2002 | 2003 | 2004 | 2004 | |||||
| | ZAR | ZAR | ZAR | USD | |||||
| | (in millions) | ||||||||
| Retained earnings in accordance with IFRS | 8,449 | 10,066 | 13,899 | 2,199 | |||||
| Share of non-distributable retained earnings in Vodacom | (2,678 | ) | (3,485 | ) | (3,951 | ) | (625 | ) | |
| Distributable reserves in accordance with IFRS | 5,771 | 6,581 | 9,948 | 1,574 | |||||
The distribution of retained earnings of Vodacom are restricted, as Telkom requires the consent of the other shareholders of Vodacom to declare dividends. As described in Item 10. "Additional Information—Taxation," Telkom is required to pay secondary tax on companies at a flat rate of 12.5% in respect of the amount of certain dividends declared by it net of any dividends received from our joint venture and subsidiaries. As a result of the payment of secondary tax on companies, the amount of dividends that may actually be paid is less than the amount of distributable reserves. Distributable reserves are available for distribution based on Telkom's dividend policy. Telkom's board of directors decides on an annual basis the amount of distributable reserves to be reinvested in operations and the amount of any remaining funds that are available for distribution to shareholders.
15
Telkom expects to pay any cash dividends solely in Rands. Cash dividends payable to holders of American Depository Shares, or ADSs, listed on the New York Stock Exchange will be paid to the depositary's custodian, which will convert the dividends into Dollars, at the rate of exchange applicable on the date such dividends are paid, for disbursement to holders. Fluctuations in the exchange rate between Rands and Dollars and expenses of the depositary will affect the Dollar amounts actually received by holders of ADSs upon conversion by the depositary of such cash dividends.
Provided that the relevant share certificate is endorsed "non-resident" or an entry is made to such effect in the relevant electronic register, there is currently a blanket approval under the South African exchange control regulations for the free transferability of cash dividends to holders of ordinary shares or ADSs. See Item 10. "Additional Information—Exchange Controls."
In addition to the corporate tax on taxable income of South African companies at the current rate of 30%, South African companies pay secondary tax on companies as described above. Capitalization shares or stock dividends distributed to holders of ordinary shares do not incur secondary tax on companies. Because of this tax treatment, it has become common practice in South Africa for companies to offer capitalization shares in lieu of cash dividends. Capitalization shares are shares issued by a company, the payment for which is allocated out of the company's reserves, including share premium, or unappropriated profits.
For a discussion of the material South African and US federal income tax provisions regarding the taxation of dividends on ordinary shares and ADSs, see Item 10. "Additional Information—Taxation."
Shares Repurchases
As authorized by its shareholders at an annual general meeting held on January 27, 2004, Telkom embarked on a share repurchase program for purposes of the Telkom conditional share plan.
In the year ended March 31, 2004, Rossol No 65 (Proprietary) Limited, a wholly-owned subsidiary of Telkom, repurchased 3,185,736 shares at a volume weighted averaged price of R74.58 per share, including costs, which are being held in treasury. On June 4, 2004, Telkom purchased Acajou (Pty) Limited for share repurchase activities other than repurchases for the Telkom conditional share plan. Between June 7, 2004 and June 21, 2004, Acajou (Pty) Limited purchased 2,337,000 shares at a volume weighted average price of R76.88 per share, including costs, which are also being held in treasury.
In terms of the South African Companies Act, 61 of 1973, a subsidiary company may not acquire more than 10% of the shares in its holding company.
Telkom plans on continuing its buy back strategy based on certain criteria.
Taxation
A share repurchase and subsequent cancellation of shares by a South African company is deemed to be a dividend in terms of the South African Income Tax Act, 58 of 1962, on the difference between the nominal value of the share and the value purchased, unless purchased from the share premium of the company that does not comprise capitalized profit. The tax on such a deemed dividend is payable by the company at a rate of 12.5%.
16
Unless otherwise specified, as used in this annual report:
- •
- references to "Rand," "R," "ZAR" and "SA Cents" are to South African Rand and Cents, the currency of the Republic of South Africa;
- •
- references to "Dollars," "$," "USD" and "US Cents" are to the United States Dollar and Cents, the currency of the United States; and
- •
- references to the "Rand noon buying rate" are to the noon buying rates in New York City for cable transfers in Rands as certified for customs purposes by the US Federal Reserve Bank of New York expressed in Rands per $1.00.
For your convenience, this annual report contains translations of certain Rand amounts into Dollars. You should not assume, however, that Rands could have been exchanged into Dollars at any particular rate or at all. Unless otherwise stated, translations of Rand amounts into Dollars have been made at R6.32 per $1.00, the Rand noon buying rate on March 31, 2004, the date of the Telkom Group's most recent balance sheet included in this annual report. These translations should not be construed as representations that the Rand amounts could actually be converted into US dollars at these rates or at all.
The table below shows the high, low, average and end of period Rand noon buying rates for the periods indicated. The end of period Rand noon buying rate is computed on the last business day of the relevant period and the average Rand noon buying rate is computed using the Rand noon buying rate on the last business day of each month during the period indicated for financial years and the average of the month for months.
| Year ended March 31, | High | Low | Average | End of period | ||||
|---|---|---|---|---|---|---|---|---|
| 2000 | 6.58 | 5.98 | 6.19 | 6.54 | ||||
2001 | 8.04 | 6.56 | 7.34 | 8.04 | ||||
2002 | 13.60 | 7.91 | 9.64 | 11.38 | ||||
2003 | 11.36 | 7.90 | 9.74 | 7.90 | ||||
2004 | 8.24 | 6.26 | 7.17 | 6.32 |
Year 2003 | High | Low | ||
|---|---|---|---|---|
| December | 6.94 | 6.26 |
Year 2004 | High | Low | ||
|---|---|---|---|---|
| January | 7.31 | 6.36 | ||
February | 7.07 | 6.57 | ||
March | 6.92 | 6.32 | ||
April | 6.94 | 6.27 | ||
May | 7.05 | 6.52 | ||
June (through June 18, 2004) | 6.64 | 6.40 |
On June 18, 2004, the Rand noon buying rate was R6.40 per $1.00.
Fluctuations in the exchange rate between the Rand and the Dollar will affect the Dollar amounts received by holders of American Depositary Shares, or ADSs, each representing four ordinary shares of Telkom, on conversion of dividends, if any, paid in Rands on the ordinary shares and may affect the Dollar trading price of the ADSs on the New York Stock Exchange.
17
You should carefully consider the risks described below in conjunction with the other information and the consolidated financial statements of the Telkom Group and Vodacom and the related notes thereto included elsewhere in this annual report before making an investment decision with respect to Telkom's ordinary shares or ADSs.
Risks Related to our Business
Increased competition in the South African telecommunications market may result in a reduction in overall average tariffs and market share in our fixed-line business, which could cause our growth rates, operating revenue and net profit to decline.
Telkom had the exclusive right to provide public switched telecommunications services, including international telephone services, in the Republic of South Africa until May 7, 2002, but for a number of years has competed with mobile operators and value-added network operators in connection with the provision of other services. The Independent Communications Authority of South Africa, or ICASA, issued an international carrier of carriers license and a multimedia license to Sentech Limited, formerly known as Sentech (Proprietary) Limited and referred to herein as Sentech, in May 2002. In addition, on December 18, 2003, the Minister of Communications announced that she would grant an additional license to provide public switched telecommunications services to a second national operator that will be 30% owned by two entities beneficially owned by the South African Government, 19% owned by a black economic empowerment consortium and 26% owned by two other consortiums, with the remaining 25% of the second national operator being held by the Government for sale to a strategic equity investor to be identified. The Minister of Communications has indicated that she expects ICASA to issue the second public switched telecommunications services license in 2004. A process has also commenced to issue additional licenses to small business operators to provide telecommunications services in areas with a teledensity of less than 5%. ICASA has submitted its recommendations to the Minister of Communications for the granting of licenses to successful bidders in seven of the ten areas in which licenses could have been issued. The Minister of Communications has granted licenses to four successful bidders on June 3, 2004 and it is expected that these licenses will be issued in 2004. Further competition may arise as a result of an assessment by the Minister of Communications of the feasibility of issuing additional licenses from May 2005. As competition intensifies, the main challenges our fixed-line business faces are continuing to improve customer loyalty and maintaining its leadership in the South African communications market. As a result of increasing competition, we anticipate a reduction in overall average tariffs and market share in our fixed-line business, which could cause our growth rates, operating revenue and net profit to decline.
Competition from the three existing mobile communications network operators in South Africa has resulted in significant customer migration and call substitution from fixed-line to mobile services. If this customer migration and call substitution continues, our growth rates, operating revenue and net profit could decline.
Telkom competes with the three existing mobile communications network operators, Vodacom, Mobile Telephone Network Holdings (Proprietary) Limited, or MTN, and Cell C (Proprietary) Limited or Cell C, for customers. Telkom also competes with other service providers who use least cost routing technology that enables fixed-to-mobile calls from corporate private branch exchanges to bypass our fixed-line network by being transferred directly to mobile networks. Telkom has experienced significant customer migration in recent years from fixed-line services to mobile services, as well as substitution of calls placed using mobile services rather than our fixed-line service, with the increase in mobile penetration in South Africa. If this migration continues, our growth rates, operating revenue and net profit could decline.
18
The rapid growth in the mobile market in South Africa has resulted in a significant increase in the number of Vodacom and Telkom calls terminating on other mobile networks as opposed to our fixed-line network. Vodacom's and Telkom's margins and net profit could decline if this trend continues.
Vodacom and Telkom have experienced a significant change in the traffic mix as mobile customers increased relative to fixed-line customers. This resulted in an increasing percentage of calls from Vodacom's network and our fixed-line network terminating on other mobile networks rather than our fixed-line network. Vodacom's interconnection payments have increased and its margins have decreased because the cost of terminating calls on other mobile networks is higher than the cost of terminating calls on Telkom's fixed-line network. As a result, Vodacom's South African net interconnect revenue has been declining in recent years. Similarly, Telkom has incurred increased payments to other operators as a result of the growth in interconnection traffic for fixed-line calls terminating on other mobile networks. If mobile customers continue to increase and there is little or no growth in fixed-line customers, this trend could continue and Vodacom's and Telkom's margins and net profit could decline.
Increased competition in the mobile communications market in South Africa may result in a reduction of Vodacom's average tariffs and Vodacom's market share and increased customer acquisition and retention costs, which could cause Vodacom's growth rates, revenue and net profit to decline.
There are currently three operators in the South African mobile communications market, Vodacom, MTN and Cell C. At March 31, 2004, Vodacom estimates that it held approximately 54%, MTN held approximately 35% and Cell C held approximately 11% of the South African mobile communications market, based on total estimated customers. Increased competition from Cell C in 2004 has resulted in an estimated 3% decline in market share for Vodacom. In addition, ICASA has indicated that it intends to license global mobile personal communications services by satellite and to conduct a feasibility study on the licensing of a fourth mobile operator in 2004 or later. This increased competition, together with the further liberalization of the South African telecommunications industry, may result in a reduction in Vodacom's overall average tariffs and further loss of market share and increased customer acquisition and retention costs, which could cause Vodacom's growth rates, revenue and net profit to decline.
If we are not able to implement a reduction in our existing fixed-line employees and employee expenses or if significant labor unrest results from the implementation of our fixed-line employee reduction program, our ability to compete may be harmed and our net profit could decline.
The number of our fixed-line employees of Telkom declined by approximately 24,453 positions from March 31, 1997 through March 31, 2004. We intend to continue to reduce our fixed-line headcount over the next few years. Our ability to implement optimal employee reductions is limited by South African labor laws. In addition, legal requirements make such reductions costly. We also face pressure from labor unions in South Africa who oppose employee reductions and may encounter resistance from the Government of the Republic of South Africa if the reductions conflict with the Government's social objectives at the time. If we are unable to reduce the number of our fixed-line employees and employee expenses or if significant labor unrest results from implementation of our fixed-line employee reduction program, our ability to compete may be harmed and our net profit could decline.
The value of Vodacom's investments outside of South Africa and Vodacom's revenue and net profit may decline as a result of political, economic, regulatory and legal developments in the countries where Vodacom has invested.
Vodacom currently has investments in mobile communications network operators in Lesotho, Tanzania, the Democratic Republic of the Congo and Mozambique. These countries have political,
19
economic, regulatory and legal systems that are still in the process of transformation and are less developed than those in the Republic of South Africa. Political or economic upheaval or changes in laws and regulations or in their application may harm the operations of the companies in which Vodacom invests and impair the value of these investments. The regulatory environments in these countries often lack clarity in a number of areas and are subject to varying interpretations. These countries, particularly the Democratic Republic of the Congo, suffer from extreme poverty and are experiencing civil strife, political conflict and political mismanagement, all of which could cause the value of Vodacom's investments in these countries and Vodacom's revenue and net profit to decline.
Most of the fixed-line operators in these countries are still state controlled. As a result, the mobile communications network operators in which Vodacom has invested may encounter difficulties in negotiating commercially acceptable interconnection agreements and collecting amounts due under interconnection agreements. In particular, Vodacom Tanzania has been unable to collect approximately $800,000 in outstanding interconnection payments from the Tanzania Telecommunications Company Limited, the partially government owned fixed line operator in Tanzania, and has been forced to refer the matter to formal arbitration, and there have been disagreements regarding the validity of the interconnect agreements in the Democratic Republic of the Congo. The amounts in question have been written-off even though Vodacom Tanzania continues its attempt to collect these debts. In addition, a number of jurisdictions in which Vodacom invests have imposed price controls, particularly for interconnection, which could reduce Vodacom's net profit and cause the value of Vodacom's investments in these other African countries to decline. There are also foreign exchange control restrictions in South Africa, which may restrict Vodacom's ability to fund its investments in these countries, and there are foreign exchange controls in a majority of these countries, which may restrict Vodacom's ability to extract value from these investments.
The number of mobile operators and mobile licenses available for acquisition in other African countries is limited. Moreover, Vodacom's acquisition of mobile operators and licenses in other African countries may be unsuccessful, which could have a material adverse effect on Vodacom's future growth.
A substantial part of Vodacom's future growth is expected to be from acquisitions of mobile operators or licenses in other African countries. There are a limited number of mobile operators and licenses in other African countries available for acquisition and there is substantial competition for the types of mobile operators and licenses Vodacom targets. In addition, there are significant risks associated with Vodacom's ability to acquire mobile operators in other African countries, including those discussed above under "Risk Factors—Risks Related to Our Business—The value of Vodacom's investments outside of South Africa and Vodacom's revenue and net profit may decline as a result of political, economic, regulatory and legal developments in the countries where Vodacom has invested." For instance, Vodacom spent considerable time entering into a five year management agreement with VEE Networks Limited effective April 1, 2004, pursuant to which Vodacom would have managed VEE Networks' cellular network operations in Nigeria with the intention of acquiring an equity stake in the business. On May 31, 2004, however, Vodacom announced that it had elected to terminate the management contract and abandon its plan to make an equity investment in the business of VEE networks in Nigeria. To the extent securities analysts and investors anticipate that Vodacom will continue to grow through acquisitions and Vodacom does not do so, our stock price could decline. Moreover, Vodacom could expend a substantial amount of time and capital pursuing acquisitions it does not consummate, such as happened in Nigeria, which could adversely affect its business, financial condition, results of operations and growth.
The expansion of Vodacom's other African operations may place a significant strain on its management, financial and other resources. Vodacom's ability to manage future growth in its other African operations will depend upon its ability to monitor operations, maintain effective quality controls and significantly expand its internal management, technical and accounting systems, all of
20
which will result in higher operating expenses. The integration of acquired mobile operators or licenses in other African countries may involve, among other things, integration of switching, transmission, technical, sales, marketing, billing, accounting, quality control, management, personnel, payroll, regulatory compliance and other systems and operating hardware and software, some of which may be incompatible with Vodacom's existing systems and therefore may need to be replaced. In addition, mobile operators generally experience higher customer and employee turnover rates during and after an acquisition or launch of service. We cannot assure you that Vodacom will be able to integrate successfully the mobile operators or mobile licenses it may acquire in other African countries.
If we lose key personnel or if we are unable to hire and retain highly qualified employees, our business operations could be disrupted and could impact on the company's ability to compete successfully.
Our success, including the success of Vodacom, depends in large part on our ability to hire and retain highly qualified employees who possess the requisite qualifications and technical skills. Telkom and Vodacom do not have formal employment agreements with a majority of their senior management, any of whom may terminate their employment with us at any time. The loss of key personnel could disrupt our business operations if we are unable to replace them with similarly qualified individuals. We expect that competition for employees in the South African communications industry will increase as new competitors enter the market. If we lose a number of our key employees to our competitors, our business operations could be disrupted and our ability to compete could be harmed.
We do not have the right to appoint a majority of Vodacom's directors or members of its directing committee and the Vodacom joint venture agreement contains approval rights that may limit our flexibility and ability to implement our preferred strategies.
Although we are a 50% shareholder in Vodacom, our flexibility and ability to implement our preferred strategies may be limited by the fact that we do not have the right to appoint a majority of Vodacom's directors or members of its directing committee. In addition, under our memorandum and articles of association, Thintana Communications and the Government are entitled to nominate the directors we appoint to the Vodacom board. The Vodacom joint venture agreement, which governs the relationship between Telkom and the other shareholders of Vodacom, requires each of Vodacom's shareholders who own 10% or more of Vodacom's shares to approve certain material transactions. As a result of these factors, we may not be able to impose strategies on Vodacom that we believe to be beneficial to us without the approval of Vodacom's other shareholders.
If Vodacom does not continue to pay dividends or make distributions to Telkom, Telkom may not be able to fund its operating expenditures and service its debt and other financial obligations. In addition, Telkom may not have sufficient funds to pay dividends and could be required to lower or defer capital expenditures, which could cause the trading prices of Telkom's ordinary shares and ADSs to decline.
Telkom receives dividends and other distributions from Vodacom which Telkom uses to fund its capital and operating expenditures and service its debt and other financial obligations. Vodacom is legally distinct from Telkom and has no obligation to pay dividends or make distributions to Telkom. Vodacom's ability to pay dividends and make other distributions to Telkom may be restricted by, among other things, its operations and the availability of funds and the terms of credit and debt arrangements entered into by it, as well as statutory and other legal restrictions. In addition, Vodacom's ability to make distributions to Telkom and its other shareholders requires the approval of Vodacom's shareholders who own 10% or more of Vodacom's shares. To the extent that Vodacom is unable to, or otherwise does not, pay dividends or make other distributions to Telkom in the future, Telkom may not be able to fund its operating expenditures and service its debt and other financial obligations. In addition, Telkom may not have sufficient funds to pay dividends and could be required to lower or
21
defer capital expenditures, which could cause the trading prices of Telkom's ordinary shares and ADSs to decline.
If we experience high rates of theft, vandalism, network fraud, and payphone fraud and lost revenue due to non-licensed operators in our fixed-line business, our fixed-line fault rates could increase and our operating revenue and net profit could decline.
We have historically experienced significant cable theft, theft of solar panels and wireless communications equipment, vandalism of payphones, network fraud, such as non-licensed calls, and payphone fraud in our fixed-line business. Theft and vandalism have caused our fixed-line fault rates to increase, and the repair time on our network and the network downtime associated with such faults and network fraud and payphone fraud have resulted in lost operating revenue and significant costs. We have also lost operating revenue to non-licensed operators providing telecommunications services in South Africa. If we are unable to continue to minimize theft, vandalism, network fraud and payphone fraud or if we continue to lose operating revenue to non-licensed operators in our fixed-line business, our fixed-line fault rates could increase and our operating revenue and net profit could decline.
If we are not able to continue to improve and maintain our management information and other systems, our ability to provide accurate and comprehensive operating information and to compete may be harmed.
Our management information systems do not provide management with certain operating data and financial information on a real time basis and at times has made our budgeting and planning processes difficult. In addition, our billing and other information systems are not yet fully integrated and therefore are not capable of providing us with comprehensive and detailed operating, financial and accounting information, including the traffic carried on our fixed-line network and we cannot provide a single bill for customers with multiple locations and products. To address these problems, we have reduced, and intend to further reduce the number of current billing systems in place and to introduce appropriate monitoring systems capable of deriving better operational, financial and accounting information. The full integration between our various operational support systems is not expected to be complete until 2006 or 2007. Since November 2003, we have renewed our focus on information risk management and have identified several requirements for improved security of Telkom's information technology systems. A comprehensive analysis was completed on all systems, assessing their then-current vulnerabilities and identifying additional security measures. A project was then initiated to address all findings and implement additional security measures to address these new requirements. Completion and compliance verification is expected during the fourth quarter of the 2005 financial year. To the extent we are not able to improve and fully implement these systems, our ability to provide accurate and comprehensive operating information and to compete effectively in the increasingly liberalized South African communications market may be harmed. In addition, some of the information systems in Vodacom's other African operations are new and are not capable of providing management on a real time basis with operating data and financial information.
We have a significant amount of indebtedness and negative working capital, which may impair our operating and financial flexibility and could make it difficult for us to borrow additional funds for working capital, capital expenditures or other general corporate purposes.
We have a significant amount of indebtedness, the majority of which is related to our fixed-line business, and negative working capital. As of March 31, 2004, we had R17.2 billion of total consolidated indebtedness, before cash and cash equivalents. We need to dedicate a substantial portion of our operating cash flows to service debt, which reduces the funds available for working capital, capital expenditures and other general corporate purposes. In addition, some of the instruments governing our indebtedness require us to maintain specified financial ratios and impose operating
22
restrictions on us. Our failure to comply with these restrictions could lead to a default under the terms of the relevant indebtedness even though we are able to meet our debt service obligations. Some of our debt instruments also contain cross-default provisions. Moreover, our high level of debt and the restrictive covenants contained in our debt agreements could limit our ability to borrow additional funds for working capital, capital expenditures or other general corporate purposes.
We had negative consolidated working capital of R3.4 billion as of March 31, 2004 compared to negative consolidated working capital of R4.3 billion as of March 31, 2003. Negative working capital arises when current liabilities are greater than current assets. We intend to fund current liabilities through a combination of operating cash flows, new borrowings and borrowings available under existing credit facilities. We had R3.0 billion available under existing credit facilities as of March 31, 2004. If we are unable to generate sufficient operating cash flows or borrowings to fund our current liabilities, we may have to defer capital expenditures and may not be able to pay dividends and our business operations and financial condition could be negatively impacted.
If our strategic equity investors are not able to successfully transfer knowledge and skills to our personnel or do not continue to provide us strategic services or if we lose a number of our key employees provided by our strategic equity investors, our business operations could be disrupted and our ability to compete could be harmed.
We have benefited from the experience and knowledge of our strategic equity investors through their participation on our operating committee and their employees who serve in key management positions. Pursuant to a strategic services agreement with our strategic equity investors, our strategic equity investors provided us with 18 of our employees as of March 31, 2004, including our chief operating officer, chief strategic officer and financial controller, two of whom are board members. The number of employees to be provided by our strategic equity investors is scheduled to decrease over the next two years pursuant to our strategic services agreement. If our strategic equity investors are not able to successfully transfer knowledge and skills to our personnel or do not continue to provide us these services or if our key personnel who are employees of our strategic equity investors terminate their employment with us, our business operations could be disrupted and our ability to compete could be harmed.
If customer non-payments in our fixed-line business increase, our net profit could decline.
We have historically experienced a significant number of customer non-payments in our fixed-line business, particularly in impoverished areas where we were required to expand our network pursuant to our license obligations. We disconnected a substantial number of telephone lines in response to these non-payments primarily in our 2002 and 2001 financial years and incurred bad debt expense of R965 million and R671 million in our fixed-line segment during the years ended March 31, 2002 and 2001, respectively. To control our bad debts, we implemented a more rapid disconnection policy for non-payments, continued and improved credit vetting and controls, implemented usage limits based on customer credit limits, instituted a better collection program, continued to promote our prepaid fixed-line services and encouraged non paying contract customers to migrate to prepaid services. Bad debt expense in our fixed-line segment was R228 million and R215 million in the 2004 and 2003 financial years, respectively. We cannot assure you that bad debt expense and bad debt write-offs in our fixed-line segment will remain at these levels and will not increase in the future. If customer non-payments increase in the future and if we are unable to increase our tariffs to cover the cost of bad debts, our net profit could decline.
23
Continuing rapid changes in technologies could increase competition or require us to make substantial additional investments in technologies, which could reduce our return on investment and net profit.
The services we offer are technology-intensive. The development of new technologies, such as fixed-wireless services and packet radio services, could increase competition and make our technology obsolete. We may have to make substantial additional investments in new technologies to remain competitive. New technologies we choose may not prove to be commercially successful. As a result, we could lose customers, fail to attract new customers or incur substantial costs in order to maintain our customer bases, which could reduce our return on investments and net profit.
Delays in the development and supply of communications equipment may hinder the deployment of new technologies and services and cause our growth rates and net profit to decline.
Our operations, including the operations of Vodacom, depend in part upon the successful and timely supply of evolving fixed and mobile communications technologies. We use technologies from a number of vendors and make significant capital expenditures in connection with communications technologies. If technologies are not developed by our suppliers on time or do not perform according to expectations or achieve commercial acceptance, we may be required to delay service introductions and make additional capital expenditures and we could be required to write-off investments in technology, which could cause our growth rates and net profit to decline.
Actual or perceived health risks relating to mobile handsets or transmission masts and any related publicity or litigation could make it difficult to find attractive sites for base stations and reduce Vodacom's growth rates, customer base, average usage per customer and net profit.
Concern has been expressed that the electromagnetic signals from mobile handsets and base stations, which serve as antennae for transmitting radio signals, may pose health risks. Actual or perceived risks of mobile handsets or base stations and related publicity or litigation, could make it difficult to find attractive sites for base stations and reduce Vodacom's growth rates, customer base, average usage per customer and net profit.
Risks Related to Telkom's Ownership by the Government of South Africa and Thintana Communications
Telkom's major shareholders exercise control over our strategic direction and major corporate actions.
The Government of the Republic of South Africa and Thintana Communications, the investment vehicle of our strategic equity investors, together hold a majority of Telkom's ordinary shares. Through the ownership and voting arrangements provided for in a shareholders' agreement and Telkom's memorandum and articles of association, the Government and Thintana Communications are able to exert considerable influence over Telkom's corporate governance, strategic direction and major corporate actions and to appoint directors of Telkom's subsidiaries and the Vodacom joint venture.
24
In the shareholders' agreement, the Government and Thintana Communications have, among other things, agreed to vote together on specific matters. See Item 7. "Major Shareholders and Related Party Transactions," for a description of the Government's and Thintana Communications' rights under the shareholders' agreement. In addition, Telkom's memorandum and articles of association require Telkom to obtain written consent from the Government before taking actions that would limit Telkom's ability to provide public switched telecommunication services. Telkom's memorandum and articles of association also require the approval of directors appointed by the Government and Thintana Communications in order for Telkom or any of its subsidiaries, including Vodacom, to enter into major corporate actions and transactions, including amendments to Telkom's management structure and the powers of Telkom's operating committee, the approval of Telkom's dividend policy and payment of dividends, increases in Telkom's indebtedness beyond certain limits and changes of control. As a result, without the approval and participation of the Government and Thintana Communications, Telkom is not able to consummate transactions involving an actual or potential change of control, including transactions in which you might otherwise receive a premium for your ordinary shares or ADSs over market prices. Because the Government and Thintana Communications exercise control over Telkom, holders of ordinary shares and ADSs lack meaningful power to approve decisions of Telkom's board of directors or to influence our strategic direction and major corporate actions.
The Government of the Republic of South Africa may use its positions as shareholder of Telkom and, policymaker for and customer of, the telecommunications industry in a manner that may be favorable to our competitors and unfavorable to us.
The Government of the Republic of South Africa currently owns 38.3% of Telkom's issued and outstanding ordinary shares. The Government also holds significant equity stakes in other industry participants, including Sentech, and will have an indirect 30% equity interest in the second national operator and will retain an additional 25% equity interest in the second national operator to be sold to a strategic equity investor in the future. To further its policy of liberalization of the telecommunications industry, the Government may adopt and implement policies and exercise its right to approve regulations that benefit our competitors but are not beneficial to us. In addition, to further other political or social objectives, the Government may act in a manner that may be detrimental to our business but advantageous to our competitors.
The Government of the Republic of South Africa is also one of our customers. The Government, excluding Government owned parastatal companies, accounted for approximately 9% of our fixed-line operating revenue, excluding directories and other operating revenue, in the year ended March 31, 2004. The Government could transfer some or all of its business to the second national operator or other operators when they commence operations. Legislation has been enacted to centralize all procurement of telecommunications and information technology services by the Government, through one agency. If the Government transfers some or all of its business to other operators, our operating revenue and net profit would decline.
Risks Related to Regulatory and Legal Matters
The regulatory environment for the telecommunications industry in South Africa is evolving and final regulations addressing a number of significant matters have not yet been issued. The interpretation of existing regulations, or the adoption of new policies or regulations that are unfavorable to us, could disrupt our business operations and could cause our net profit and the trading prices of Telkom's ordinary shares and ADSs to decline.
The provision of telecommunications services in the Republic of South Africa is subject to extensive regulation. The regulatory environment is developing, lacks clarity in a number of areas and is subject to interpretation, review and amendment as the telecommunications industry is further developed and liberalized. In addition, the regulatory process entails a public comment process and a convergence colloquium, which, in light of the politicized issue of privatization of industries such as
25
telecommunications in South Africa, makes the outcome of the regulations uncertain and may cause delays in the regulatory process. A number of significant matters have not been addressed or clarified, including:
- •
- the terms and conditions of the second national operator's license;
- •
- whether and the extent to which our licenses may be amended as a result of the licensing of the second national operator;
- •
- whether any additional obligations may be imposed on us at that time or thereafter;
- •
- the extent to which our fixed-line business will be required to make its facilities or access lines available to the second national operator to provide services, other than public switched telecommunications services, during the first two years of its license and beyond; and
- •
- the extent to which our fixed-line business may be required to unbundle its local loop after two years.
In addition, ICASA was only established in 2000. Upon its establishment, ICASA inherited a legacy of regulatory problems from its predecessors. It has been reported that ICASA may currently lack adequate resources to effectively fulfill its regulatory and licensing functions and to deal with regulatory challenges that continue to change given the rapidly evolving telecommunications environment. This combination of factors creates further uncertainties in the regulatory arena and the ability of ICASA to effectively fulfill its functions. We cannot predict the outcome or timing of any amendments or modifications to applicable regulations or the interpretation thereof, the release of new regulations or their impact on us. We have in the past had conflicts with ICASA and its predecessor, including litigation against them with regard to price cap regulations and interconnection and facilities leasing guidelines. Changes in the regulation of telecommunications services in South Africa, the imposition of unfavorable terms in our licenses or the loss or unfavorable amendment of any license could disrupt our business operations and could cause our net profit and the trading prices of Telkom's ordinary shares and ADSs to decline.
In addition, new laws and regulations that may require our business customers to make use of suppliers complying with black economic empowerment requirements may affect us. If such new laws and regulations are promulgated, and if our shareholder base does not qualify under the ownership requirements of these black economic empowerment initiatives or restrictions, some of our business customers may be required or elect to obtain all or some of their telecommunications services from our competitors who may fulfill such ownership requirements.
Our tariffs are subject to approval by the regulatory authorities, which may limit our flexibility in pricing and could reduce our net profit. Vodacom's revenue and net profit could decline if wholesale price controls are imposed on it.
Our public switched telecommunications services license imposes a price cap formula on our overall tariffs for a basket of specified services and any individual product or service within the basket of specified services that we previously had the exclusive right to provide. The overall tariffs for all services in the basket may not be increased by more than 1.5% below inflation in South Africa, based on the consumer price index and measured using revenue for the services in the basket at constant volumes for the prior year. In addition, from January 1, 2003, the price of any individual product or service within the basket may not be increased by more than 5% above inflation in South Africa in any year. Our tariffs for these services are filed with ICASA for approval. Revenue from these services may not be used to subsidize competitive products and services. These limitations on our customer tariffs limit our pricing flexibility and could reduce our net profit. ICASA has indicated its intention to conduct a review of the price control regime before the end of 2004 that could have a further negative impact on our net profit. In addition, Vodacom's revenue and net profit could decline if wholesale price controls are imposed on it.
26
If the Competition Commission of the Republic of South Africa were to conclude that Telkom had committed a prohibited practice, as set out in the Competitions Act of 1998, Telkom could incur a penalty, its business and financial condition could be materially adversely effected and its revenue and net profit could decline.
The South African Value Added Network Services Association, an association of value added network service providers, or VANS providers, filed complaints against Telkom at the Competition Commission of the Republic of South Africa regarding alleged anti-competitive practices on the part of Telkom. The Competition Commission found, among other things, that several aspects of Telkom's conduct contravened the Competition Act, 89 of 1998, and referred certain of the complaints to the Competition Tribunal for adjudication. The complaints deal with Telkom's alleged refusal to provide telecommunications facilities to certain VANS providers to construct their networks, refusal to lease access facilities to VANS providers, provision of bundled and cross-subsidized competitive services with monopoly services, discriminatory pricing with regard to leased line services and alleged refusal to peer with certain VANS providers. Telkom has brought an application in the South African High Court challenging the Competition Tribunal's jurisdiction to adjudicate this matter. These matters and the amount of Telkom's liability are not expected to be finalized within the next 2 years. If these complaints are upheld, however, Telkom could be required to cease these practices and fined an amount of up to 10% of Telkom's South African turnover or be ordered to divest itself of the relevant business. Telkom is currently unable to predict the amount that it may eventually be required to pay. If Telkom is required to cease these practices, divest itself of the relevant business or pay significant fines, Telkom's business and financial condition could be materially adversely effected and its revenue and net profit could decline.
If Telcordia Technologies Incorporated, a New Jersey corporation, were able to recover substantial damages in its arbitration proceedings against Telkom, Telkom would be required to fund such payments from cash flows or drawings on its existing credit facilities, which could cause Telkom's indebtedness to increase and its net profit to decline.
Telcordia instituted arbitration proceedings against Telkom in March 2001 seeking to recover approximately $130 million for monies outstanding and damages, plus costs and interest at a rate of 15.5% per year. The arbitration proceedings relate to the cancellation of an agreement entered into between Telkom and Telcordia during June 1999 for the development and supply of an integrated end-to-end customer assurance and activation system by Telcordia. In September 2002, a partial award was issued by the arbitrator in favor of Telcordia. Telkom subsequently filed an application in the South African High Court to review and set aside the partial award. On November 27, 2003, the South African High Court set aside the partial award and issued a cost order in favor of Telkom. On May 3, 2004, the South African High Court dismissed an application by Telcordia for leave to appeal and ordered Telcordia to pay the legal costs of Telkom. Telcordia also petitioned the United States District Court for the District of Columbia to confirm the partial award, which petition was dismissed, along with a subsequent appeal. As a result, the Telcordia dispute has been referred back to arbitration. The dispute between Telkom and Telcordia and the amount of Telkom's possible liability are not expected to be finalized until late 2004 or early 2005. Telkom is currently unable to predict the amount that it may eventually be required to pay Telcordia, if any, and has reversed all of its provisions for estimated liabilities, including interest and legal fees. If Telcordia recovers substantial damages from Telkom, Telkom would be required to fund such payments from cash flows or drawings on its existing credit facilities, which could cause its indebtedness to increase and its net profit to decline.
If we are unable to negotiate favorable terms, rates and conditions for the provision of interconnection services and facilities leasing services, our business operations could be disrupted and our net profit could decline.
Telkom is required to provide interconnection services to the mobile operators, the second national operator and all other entities that lawfully provide telecommunications services in South Africa and to lease or otherwise make our telecommunications facilities available to any entity lawfully providing or
27
utilizing telecommunications services in South Africa. Telkom will also be required to allow the second national operator to use all of its telecommunications facilities for the provision of public switched telecommunications services on a resale basis for the first two years of its license. Telkom may also be required to lease or otherwise make its telecommunications facilities available to the second national operator for the provision of services, other than public switched telecommunications services, during the first two years of its license and beyond. The terms and conditions for the provision of these services and facilities are, or will be, set out in interconnection agreements and facilities lease agreements negotiated and agreed to by Telkom with these other entities.
ICASA is entitled to issue, and has issued, regulations relating to interconnection and facilities leasing. Telkom has been declared a major operator, and consequently will have to provide essential services and facilities at cost based prices to public operators, such as MTN, Vodacom, Cell C, Sentech, the small business operators and eventually the second national operator. None of these operators have been declared to be major operators. To the extent that we are unable to reach agreement with these entities for the provision of these services, including the applicable tariffs, or to the extent that the terms and conditions of our agreements are found to be inconsistent with the relevant legislation or regulations, such terms and conditions may be determined and imposed on us by ICASA. If we are unable to negotiate favorable terms and conditions for the provision of the services and facilities covered by the guidelines or ICASA otherwise imposes terms and conditions that are unfavorable to us, our business operations could be disrupted and our net profit could decline.
If we are unable to recover the substantial capital and operational costs associated with the implementation of carrier pre-selection, number portability and monitoring and interception or are unable to implement these requirements in a timely manner, our business operations could be disrupted and our net profit could decline.
We were required to implement carrier pre-selection in our fixed-line business, which will enable customers to choose and vary their fixed-line telecommunications carrier for long distance and international calls, by December 31, 2003. We are required to implement number portability, which will enable customers to retain their fixed-line and mobile telephone numbers if they switch fixed-line operators or mobile operators, by 2005. In addition, commencing in July 2003, all licensees, including Telkom and Vodacom have been required to install equipment and put in place procedures that will allow certain agencies in the Government of the Republic of South Africa to intercept and monitor communications over our respective networks and retain records and copies of such communications. We will incur substantial set-up and maintenance time and costs in connection with the implementation of these requirements, which could disrupt our business operations. The extent of recoverability of these costs have not yet been determined and finalized by ICASA. Telkom has conditioned its exchanges to handle call-by-call carrier pre-selection by December 2003. We will not be able to fully implement carrier pre-selection until the second national operator is licensed and the second national operator's interconnection systems and the inter-operator process and systems to support carrier pre-selection become available, and the necessary regulations are issued. The procedures and timetable for the full implementation of the interception and monitoring legislation requirements have not been finalized. However, Telkom and Vodacom have not been able to comply with the time frame contemplated by the current drafts of this legislation. To the extent that we have not complied with these requirements or are unable to substantially recover these costs of compliance, our business operations could be disrupted and our net profit could decline.
If Vodacom does not obtain a license to use adequate amounts of 1800MHz radio frequency spectrum or a license for radio frequency spectrum for the provision of third generation services on commercially reasonable terms, Vodacom's future growth rates, revenue and net profit could decline.
Vodacom has a statutory right to obtain a license to use 1800MHz radio frequency spectrum and radio frequency spectrum for the provision of third generation services pursuant to amendments to the
28
Telecommunications Act, 103 of 1996. Although the fees that will be required to obtain the 1800MHz radio frequency spectrum have been announced by The Minister of Communications, the license has not yet been issued. In addition, the amount of spectrum that will be licensed for the 1800MHz radio frequency and the amount of spectrum and the fees that will be required to obtain the radio frequency spectrum for the provision of third generation services have not yet been determined. In the event Vodacom is not able to obtain sufficient additional capacity on the 1800MHz radio frequency spectrum or radio frequency spectrum for the adequate provision of third generation services, or if the terms of such licenses are unfavorable, Vodacom's growth rates, revenue and net profit could decline.
If Telkom is required to comply with the provisions of the South African Public Finance Management Act, 1 of 1999, or PFMA, Telkom could incur increased expenses and its net profit could decline and compliance with the PFMA could result in the delisting of Telkom's ordinary shares and ADSs from the JSE and New York Stock Exchange.
Telkom is required to comply with the provisions of the South African Public Finance Management Act, 1 of 1999, or PFMA. Telkom applied for and obtained a temporary exemption from many of the provisions of the PFMA until November 2004 and submitted an application for an exemption from the provisions of the PFMA for another three years. If Telkom does not obtain a further exemption from the PFMA or if its existing exemption is revoked for any reason or it is otherwise required to comply with the PFMA, Telkom may be compelled to prepare a second set of financial statements in compliance with accounting principles and practices prescribed by the Government of the Republic of South Africa which do not correlate with IFRS or US GAAP and would require Telkom to incur additional costs. Telkom would also be required to comply with, what it believes to be, extremely prescriptive treasury regulations issued pursuant to the PFMA, to provide the Government with advance access to proprietary and potentially price sensitive information and to seek the prior approval of South African governmental authorities to enter into certain material agreements, to maintain certain bank accounts, to formulate and implement certain investment strategies or to discharge its auditors, which would preclude Telkom from acting in the same manner as its competitors and other listed companies. If Telkom is required to comply with the PFMA, Telkom may not be able to comply with the Listings Requirements of the JSE or the listing rules of the NYSE and Telkom's ordinary shares and ADSs could be delisted.
Our total property tax expense could increase significantly and our net profit could decline as a result of the enactment of the South African Municipal Property Rates Act, 6 of 2004.
On May 11, 2004, the South African Municipal Property Rates Act, 6 of 2004, was enacted. Pursuant to this new Act, municipalities are required to levy property tax in accordance with a rates policy that must be adopted and regularly reviewed by municipalities with community participation facilitated through the municipalities annual budget process. Due in part to the fact that no rate has to date been prescribed, it is too early to assess exactly how the new Act would affect us. As a substantial landowner in South Africa, our total property tax expense could increase significantly and our net profit could decline as a result of the implementation of this Act.
Risks Related to the Republic of South Africa
Fluctuations in the value of the Rand and inflation rates in South Africa could have a significant impact on the amount of Telkom's dividends, the trading prices of Telkom's ordinary shares and ADSs, our operating revenue, operating expenses; net profit and capital expenditures and on the comparability of our results between financial periods.
The value of the Rand as measured against the Dollar has fluctuated considerably in recent years. The Rand declined from R5.90 per $1.00 at December 31, 1998 to R12.00 per $1.00 at December 31, 2001. However, during the years ended March 31, 2003 and 2004, the value of the Rand as measured
29
against the Dollar has increased from R11.38 per $1.00 as of March 29, 2002 to R7.90 per $1.00 as of March 31, 2003 and R6.32 per $1.00 as of March 31, 2004.
Fluctuations in the exchange rate between the Rand and the Dollar could have an adverse impact on:
- •
- the Dollar equivalent of any dividends and distributions on Telkom's ordinary shares and ADSs payable in Rands;
- •
- the Dollar equivalent of the Rand denominated prices of Telkom's ordinary shares; and
- •
- the market value of Telkom's ADSs in the United States.
These fluctuations could also impact the amount in Rand terms of our non-Rand denominated debt, impact our non-Rand denominated financing costs and operating and capital expenditures and cause our net profit to fluctuate. In addition, the increase in the value of the Rand as measured against the Dollar and the Euro in the years ended March 31, 2003 and March 31, 2004 resulted in significant net foreign exchange losses in each of these years in terms of IAS 39. See Item 5. "Operating and Financial Review and Prospects—Operating Results—Principal Factors That Affect our Results of Operations—Volatility of the Rand and adoption of IAS 39." Fluctuations in currency exchange rates between the South African Rand and the currencies in African countries where Vodacom invests could decrease the value of these businesses and Vodacom's and our net profit.
In addition, our tariffs and a number of our operating expenses are based on inflation rates in South Africa. As a result, significant fluctuations in inflation rates in South Africa could adversely impact our operating margins and net profit.
The high levels of unemployment, poverty and crime in South Africa could cause the size of the South African communications market and our growth rates, operating revenue and net profit, as well as the trading prices of Telkom's ordinary shares and ADSs, to decline.
While South Africa features a highly developed financial and legal infrastructure at the core of its economy, it has high levels of unemployment, poverty and crime. These problems have hindered investment into South Africa, have prompted emigration of skilled workers and have impacted economic growth negatively. Recently, the South African economy has been growing at a relatively slow rate, inflation and unemployment have been high by comparison with developed countries and foreign reserves have been relatively low. Although it is difficult to predict the effect of these problems on South African businesses or the Government of the Republic of South Africa's efforts to solve them, these problems could cause the size of the communications market and our growth rates, operating revenue and net profit, as well as the trading prices of Telkom's ordinary shares and ADSs, to decline.
The high rates of HIV infection in South Africa could cause the size of the South African communications market and our growth rates, operating revenue and net profit to decline.
South Africa has one of the highest HIV infection rates in the world. The exact impact of increased mortality rates due to AIDS deaths on the cost of doing business in South Africa and the potential growth in the economy is unclear at this time although employee related costs in South Africa are expected to increase as a result of the AIDS epidemic and the size of the South African population and communications market could decline. Our growth rates, operating revenue and net profit could decline if employee related expenses increase or our labor supply or the size of the South African population and communications market decline.
30
Significant labor disputes, work stoppages, increased employee expenses as a result of collective bargaining and the cost of compliance with South African labor laws could disrupt our fixed-line business operations and reduce our net profit.
Trade unions represented approximately 74% of our total Telkom fixed-line employees, as of March 31, 2004. Trade unions have publicly opposed our privatization and have instituted and in the future could institute work stoppages to oppose changes in our shareholding structure or gain leverage in negotiating collective bargaining agreements. In addition, a number of South African trade unions, including the trade unions of our employees, have close links to various political parties and have had a significant influence in South Africa as vehicles for social and political reform and in the collective bargaining process. Since 1995 South Africa has enacted various labor laws that enhance the rights of employees, which have imposed costs on us. If we experience significant labor disputes, work stoppages, increased employee expenses as a result of collective bargaining or increased costs of compliance with labor laws, our fixed-line business operations could be disrupted and our net profit could be reduced.
South African exchange control restrictions could hinder our ability to make foreign investments and procure foreign denominated financings.
South Africa's exchange control regulations restrict transactions between residents of the Common Monetary Area, which consists of South Africa, the Republic of Namibia, and the Kingdoms of Lesotho and Swaziland, and non-residents of the Common Monetary Area. In particular, South African companies:
- •
- are generally not permitted to export capital from South Africa or to hold foreign currency in excess of certain limits without the approval of the South African exchange control authorities;
- •
- are generally required to repatriate to South Africa profits of foreign operations; and
- •
- are limited in their ability to utilize profits of one foreign business to finance operations of a different foreign business.
These restrictions could hinder our ability to make foreign investments and procure foreign denominated financings. While the South African Government has relaxed exchange controls in recent years, it is difficult to predict whether or how it will further relax or abolish exchange control measures in the future. See Item 10. "Additional Information—Exchange Controls."
Risks Related to Ownership of Telkom's Ordinary Shares and ADSs
The future sale of a substantial number of Telkom's ordinary shares or ADSs could cause the trading prices of Telkom's ordinary shares and ADSs to decline.
The Government of the Republic of South Africa currently owns 38.3% of Telkom's issued and outstanding ordinary share capital and Thintana Communications currently owns 15.1% of Telkom's issued and outstanding ordinary share capital. As part of the global offering, the Government of the Republic of South Africa agreed to award one bonus share for every five shares of the 4,967,914 ordinary shares privileged by individuals and stockvels in the Khulisa offer if they allow the ordinary shares purchased by them in the Khulisa offer to be held in the Khulisa trust until the second anniversary of the JSE listing date. On March 4, 2003, the Government granted to persons employed by Telkom on March 4, 2003 and eligible former employees of Telkom, options to purchase 11,140,636 of its ordinary shares, representing 2% of Telkom's issued and outstanding ordinary share capital, which are exercisable in four equal tranches over a period of three years commencing six months after March 4, 2003. In addition Telkom has adopted a management and employee incentive plan that provides for the issue or grant of 22,281,272 ordinary shares. Sales of substantial amounts of shares by Telkom's shareholders, or by Telkom, or the appearance that a large number of shares is available for sale, could cause the trading prices of Telkom's ordinary shares and ADSs to decline. Telkom has entered into a registration rights agreement with the Government of the Republic of South Africa and Thintana Communications. Pursuant to the agreement, Thintana Communications and the Government
31
have the right to cause Telkom to either effect a JSE public offering in South Africa, or register with the Securities and Exchange Commission all or part of their ordinary shares, or both. The Government has agreed, however, with Thintana Communications that the Government will not sell any of its ordinary shares until February 26, 2005 and that Thintana Communications shall be entitled to demand two such registrations or listings prior to the Government becoming entitled to demand any offering or registration. Thintana Communications has announced that it had agreed with the investment banks that conducted the sale of its 15.1% interest in Telkom in June 2004 not to sell any of its remaining interest in Telkom prior to the date of the release of Telkom's interim financial results expected to occur in November 2004, subject to certain exceptions.
Your rights as a shareholder are governed by South African law, which differs in material respects from the rights of shareholders under the laws of other jurisdictions.
Telkom is a public limited liability company incorporated under the laws of the Republic of South Africa. The rights of holders of Telkom's ordinary shares and therefore many of the rights of Telkom's ADS holders are governed by Telkom's memorandum and articles of association and by South African law. These rights differ in material respects from the rights of shareholders in companies incorporated elsewhere, such as in the United States. In particular, South African law significantly limits the circumstances under which shareholders of South African companies may institute litigation on behalf of a company. For a description of the differences between shareholders' rights under South African law and Delaware law, see Item 10. "Additional Information—Memorandum and Articles of Incorporation—Comparison of Shareholders' Rights Under South African and Delaware Law."
It may not be possible for you to effect service of legal process, enforce judgments of courts outside of South Africa or bring actions based on securities laws of jurisdictions other than South Africa against Telkom or against members of its board.
Telkom and a majority of the members of its board of directors and executive officers are residents of South Africa. In addition, Telkom's assets and a major portion of the assets of members of its board of directors and executive officers are located in whole or in substantial part in South Africa. As a result, it may not be possible for you to effect service of legal process within the United States or elsewhere outside of the Republic of South Africa upon most of our directors or officers, including with respect to matters arising under US federal securities laws or applicable state securities laws. Moreover, it may not be possible for you to enforce against Telkom or the members of its board of directors and executive officers judgments obtained in courts outside South Africa, including the United States, based on the civil liability provisions of the securities laws of those countries, including those of the United States. A foreign judgment is not directly enforceable in South Africa, but constitutes a cause of action, which may be enforced by South African courts with the approval of the South African Minister of Trade and Industry. In addition, awards of punitive damages will not be enforceable in South Africa. Although it is possible for an investor to bring an action against Telkom in a South African civil court to enforce rights in terms of US federal securities laws, these laws will not be enforced if they are penal or revenue or taxation laws or laws which are contrary to South African public policy. It is not possible therefore for an investor to seek to impose criminal liability on us in a South African court arising from a violation of US federal securities laws.
Your ability to sell a substantial number of ordinary shares and ADSs may be restricted by the limited liquidity of ordinary shares traded on the JSE.
The principal trading market for Telkom's ordinary shares is the JSE. Historically, trading volumes and liquidity of shares listed on the JSE have been low in comparison with other major markets. In addition, as of March 31, 2004, only 1% of the 176,518,307 ordinary shares publicly traded were represented by ADSs trading on the NYSE. The limited liquidity of the ordinary shares and ADSs could depress the trading prices of the ordinary shares and ADSs and could limit your ability to sell a substantial number of ordinary shares or ADSs in a timely manner, especially by means of a large block trade.
32
Item 4. Information on the Company
HISTORY AND DEVELOPMENT OF THE COMPANY
Telkom was incorporated on September 30, 1991 as a public limited liability company registered under the South African Companies Act, 61, of 1973, as amended. Telkom's registration number is 1991/005476/06. Telkom's principal executive offices are located at Telkom Towers North, 152 Proes Street, Pretoria 0002, Gauteng Province, South Africa. Telkom's telephone number is (27) (12) 311 3566 and its internet address is http://www.telkom.co.za. Information contained on Telkom's website is not part of this annual report.
Recent Developments
Sale of Thintana shares
Thintana Communications announced that it sold a 14.9% interest in Telkom to South African and certain international institutional investors in June 2004. Following the completion of this sale, Thintana Communications beneficially owns a 15.1% interest in Telkom and remains a significant shareholder under its shareholder agreement and the terms of the strategic services agreement are still in force. Thintana Communications also announced that it had agreed not to sell any of its remaining interest prior to the date of the release of Telkom's interim financial results expected to occur in November 2004, subject to certain exceptions for public tender or exchange offers; Telkom's share repurchase program; to affiliates of SBC Communications or its benefit plans provided they agree to the same transfer restrictions; or with the prior written consent of the investment banks conducting the sale to institutional investors.
Vodacom's Nigerian operations
Vodacom entered into a five year management agreement with VEE Networks Limited effective April 1, 2004, pursuant to which Vodacom would have managed VEE Networks' cellular network operations in Nigeria with the intention of acquiring an equity stake in the business. On May 31, 2004, however, Vodacom announced that it had elected to terminate the management contract and abandon its plan to make an equity investment in the business of VEE Networks in Nigeria. Vodacom will continue to provide technical support to VEE Networks for a period of up to six months. Vodacom is currently a defendant in certain legal proceedings related to its activities in Nigeria prior to the termination of the Management Agreement. Vodacom is not currently able to estimate the outcome or extent of any claims or damages for which it may be liable if it is not successful in defending these claims.
Vodacom's acquisition of 51% of Smartphone SP (Proprietary) Limited
As part of its broader strategy of margin leadership in South Africa, Vodacom is continuing the process of obtaining control of its service providers. On March 1, 2004, Vodacom purchased 51% of Smartphone for R234 million acquiring an additional 2.5 million prepaid customers. On April 16, 2004, Smartphone purchased an 85.75% equity stake in Smartcom (Proprietary) Limited for R77.2 million acquiring an additional 40,000 contract customers. Vodacom directly controlled 65.3% of its total customer base, 70.6% of its contract customer base and 97.8% of its prepaid customer base in South Africa as of March 31, 2004.
Liberalization of South African communications market
A process has commenced to issue an additional license to provide public switched telecommunications services to a second national operator. At the end of the original bid process for
33
the second national operator, the only two bids received were rejected by ICASA. Subsequently, the Minister of Communications initiated an alternative bid process. An evaluation committee appointed by the Minister of Communications recommended that the Minister pre-qualify two of the four bidders for this license for consideration by ICASA. On December 18, 2003, the Minister of Communications announced that she would grant a license to a second national operator that will be 30% owned by two entities beneficially owned by the South African Government, 19% owned by a black economic empowerment consortium and 26% owned by the two bidders recommended by the evaluation committee for pre-qualification in the alternative bid process, with the remaining 25% of the second national operator being held by the Government for sale to a strategic equity investor to be identified in the future. The Minister of Communications has indicated that she expects ICASA to issue the second public switched telecommunications services license in 2004.
A process has also commenced to issue additional licenses to small business operators to provide telecommunications services in areas with a teledensity of less than 5%. The Minister of Communications has identified 27 of these underserviced areas and has issued an invitation to apply for licenses in ten of them. ICASA has submitted its recommendations to the Minister of Communications for the granting of the licenses to successful bidders in seven of the ten areas in which licenses could have been issued. The Minister of Communications has granted licenses to four successful bidders on June 3, 2004 and it is expected that these licenses will be issued in 2004. Further competition may arise as a result of an assessment by the Minister of Communications of the feasibility of issuing additional licenses from May 2005.
Historical Background
Privatization
Prior to 1991, the then Department of Posts and Telecommunications of the Republic of South Africa provided telecommunications and post office services in South Africa on an exclusive basis. In 1991, the Government of the Republic of South Africa transferred the entire telecommunications enterprise of the defunct Department of Posts and Telecommunications of the Republic of South Africa to Telkom as part of a commercialization process intended to liberalize certain sectors of South Africa's economy. Telkom remained a wholly state-owned enterprise until May 14, 1997, when the Government of the Republic of South Africa sold a 30% equity interest in Telkom to Thintana Communications LLC, a Delaware limited liability company, which is 60% beneficially owned by SBC Communications, Inc., a Delaware corporation, and 40% beneficially owned by Telekom Malaysia S.D.N. Berhard, a company incorporated in Malaysia, as part of its policy to liberalize the telecommunications market in South Africa. As part of this sale, the Government reserved the right to transfer up to 10% of its ordinary shares to previously disadvantaged groups. On March 30, 2001, the Government sold another 3% equity interest in Telkom from its holdings to Ucingo Investments, a consortium of black empowerment investors. These actions left the Government with 67% of Telkom's issued and outstanding ordinary share capital prior to our initial public offering. Due to funding constraints Ucingo disposed of it's entire shareholding on September 17, 2003. Thintana Communications announced that it sold a 14.9% interest in Telkom in June 2004, leaving it with a 15.1% beneficial interest in Telkom.
As part of the sale to Thintana Communications, the then Minister of Posts, Telecommunications and Broadcasting of the Republic of South Africa entered into an agreement with Thintana Communications under which Thintana Communications undertook significant operational and managerial responsibilities and acquired the ability to exercise effective operational and managerial control over us until May 2002. Pursuant to the agreement, Thintana Communications had the power to staff certain management positions, including those of chief operating officer, chief financial officer and chief strategic officer. Consequently, the individuals occupying these positions were seconded to Telkom from SBC Communications and Telekom Malaysia. In addition, Thintana Communications and
34
the Government were entitled to appoint a number of directors to Telkom's board of directors, based on their ownership of Telkom, and a number of our corporate actions were subject to specific approval by Thintana Communications and the Government or their board representatives. These matters generally included approval of business plans, annual budgets, training programs and payment of dividends. Until May 2002, Thintana Communications was also entitled to appoint a majority of the members of Telkom's operating committee, thus granting it control over many of our significant operational matters. These matters generally included the preparation and implementation of business plans and annual budgets for approval by Telkom's board of directors and the performance of obligations and the exercise of rights under Telkom's public switched telecommunications services license.
Since May 2002, our strategic equity investors no longer exercise effective operational and managerial control over us, but they continue to provide us strategic direction as their nominees continue to occupy key managerial positions, including those of chief operating officer, chief strategic officer and financial controller, two of whom are board members, and participate in Telkom's executive committee. Where initially our strategic equity investors provided us with up to approximately 75 employees, they provided us with 18 employees as of March 31, 2004. See Item 7. "Major Shareholders and Related Party Transactions—Related Party Transactions—Shareholder Arrangements—Strategic Services Agreement."
Initial public offering
On March 7, 2003, we completed our initial public offering pursuant to which the Government of the Republic of South Africa sold a total of 154,199,467 ordinary shares, including 14,941,513 ordinary shares through the exercise of an over-allotment option. The initial public offering price was R28.00 per ordinary share and $13.98 per ADS. As part of the global offering, the Government of the Republic of South Africa sold 4,967,914 ordinary shares to individuals in possession of a valid South African identify number and who provided a South African postal address and groups of such individuals, known as stokvels, at a 20% discount to the initial public offering price in a Khulisa offer targeted at historically disadvantaged individuals and stokvels. The Government of the Republic of South Africa agreed to reward one bonus share for every five shares purchased by individuals and stokvels in the Khulisa offer if they allow the ordinary shares purchased by them in the Khulisa offer to be held in the Khulisa Trust until the second anniversary of the JSE listing date. In addition, the Government of the Republic of South Africa sold 7,045,078 ordinary shares to individuals in possession of a valid South African identity number and who provided a South African postal address at a 5% discount to the initial public offering price.
Fixed-line transformation program
As a first step in preparing for the liberalization of the fixed-line telecommunications market in South Africa, we began a transformation program in May 1997 to change the orientation of our fixed-line business from a majority governmental owned entity to a market and profit-oriented business. Our transformation program aimed to reorganize our fixed-line business along functional lines from the previous regional structure, change our corporate culture and improve the skills of our South African employees, increase our marketing efforts, outsource non-core operations and manage revenue generation and operating expenses more effectively.
Employee-related expenses are a significant component of our total fixed-line operating expenses. The number of our Telkom fixed-line employees declined by approximately 24,453 positions from March 31, 1997 through March 31, 2004. We spent R302 million, R244 million and R373 million in the years ended March 31, 2004, 2003, and 2002, respectively, on our employee restructuring program. We intend to continue to reduce our fixed-line headcount over the next few years. Our fixed-line transformation program has benefited significantly from the management, marketing, technical and
35
financial expertise of our strategic equity investors. Our number of fixed lines per fixed-line employee increased from 82 as of March 31, 1998 to 149 as of March 31, 2004.
As part of our fixed-line transformation program we identified and outsourced a number of non-core activities. Since March 31, 2000, we have outsourced our motor vehicle fleet, certain security operations, electronic workshop, light engineering workshop, catering services and buildings management operations. We received R804 million from our outsourcing program, which we have utilized to further upgrade and expand our fixed-line network, invest in our core operations and reduce debt.
Business Summary
Telkom is one of the largest companies registered in the Republic of South Africa and we are the largest communications services provider on the African continent based on operating revenue and assets. We had consolidated operating revenue of R40.8 billion ($6.5 billion), net profit of R4.5 billion ($715 million) and cash flow from operating activities of R13.9 billion ($2.2 billion) in the year ended March 31, 2004 and we had total assets of R53.0 billion ($8.4 billion) and shareholders' equity of R22.1 billion ($3.5 billion) as of March 31, 2004.
We offer business, residential and payphone customers a wide range of services and products, including:
- •
- fixed-line voice services, including subscriptions and connections services, local, long distance, fixed-to-mobile and international voice services, interconnection and transit communications services, international voice over internet protocol services, subscription based value-added voice services, customer premises equipment sales and directory services;
- •
- fixed-line data services, including domestic and international data transmission services, such as leased lines, ADSL services, and packet-based services, managed data networking services and internet access and related information technology services;
- •
- directory and wireless data services through our Telkom Directory Services and Swiftnet subsidiaries; and
- •
- mobile communications services, including voice and data services, value-added services and handset sales through Vodacom.
We had the exclusive right to provide public switched telecommunications services, including international voice services, in South Africa until May 7, 2002. We are currently the only national provider of these services in South Africa, although a process has been commenced to liberalize the South African communications market, which will introduce competition in a number of our business areas.
In 1997, we embarked on an extensive five year capital investment program in our fixed-line business. Our fixed-line capital investment for the five years ended March 31, 2002 was R41.7 billion ($6.6 billion), of which R27.9 billion ($4.4 billion) was for network modernization and line roll-out in order to comply with our license obligations and to prepare for competition. Our five-year line roll-out program in our fixed-line business was largely completed in 2002. We spent approximately R3.9 billion ($617 million) on fixed-line capital expenditures in the year ended March 31, 2004. As of March 31, 2004, we had approximately 4.8 million telephone access lines in service and 99.9% of our telephone access lines were connected to digital exchanges.
Vodacom is our mobile communications joint venture with Vodafone Group Plc and VenFin Limited. Vodacom is the largest mobile communications network operator in South Africa with an
36
estimated market share of approximately 54% as of March 31, 2004 based on total estimated customers. Vodacom had 11.2 million customers as of March 31, 2004, of which 9.7 million were in South Africa. Vodacom has investments in mobile communications network operators in Lesotho, Tanzania, the Democratic Republic of the Congo and Mozambique. Vodacom had consolidated revenue of R23.5 billion ($3.7 billion), net profit of R3.0 billion ($480 million) and cash flow from operating activities of R4.8 billion ($758 million) in the year ended March 31, 2004 and total assets of R20.1 billion ($3.2 billion) and shareholders' equity of R7.6 billion ($1.2 billion) as of March 31, 2004.
Regulatory Background
Between 1991, when Telkom was incorporated, and 1996, when the South African Telecommunications Act, 103 of 1996, was enacted, we were the exclusive provider of public switched telecommunications services, including international voice services in South Africa, acting pursuant to the now repealed South African Post Office Act, 44 of 1958. As a partially privatized network operator, we continued to act as the exclusive public switched telecommunications service provider until May 7, 2002, when our period of exclusivity expired. During that period and with the assistance of our two strategic equity investors, we prepared for competition in the public switched telecommunications services sector. As part of the fixed-line telecommunications liberalization program, ICASA issued an international carrier of carriers license and a multimedia license to Sentech Limited in May 2002. In addition, the South African Minister of Communications and ICASA initiated a process to issue a license to a second national operator, which will introduce competition for us in the public switched telecommunications services sector. They are also planning to issue additional licenses to small business operators to provide telecommunications services in areas with a teledensity of less than 5%. On December 18, 2003, the Minister of Communications announced that she would grant a license to a second national operator that will be 30% owned by two entities beneficially owned by the South African Government, 19% owned by a black economic empowerment consortium and 26% owned by the two bidders recommended by the evaluation committee for pre-qualification in the alternative bid process, with the remaining 25% of the second national operator being held by the Government for sale to a strategic equity investor to be identified in the future. The Minister of Communications has indicated that she expects ICASA to issue the second public switched telecommunications services license in 2004. ICASA has submitted its recommendations to the Minister of Communications for the granting of the license to successful bidders in seven of the ten underserviced areas in which licenses could have been issued. The Minister of Communications granted licenses to four successful bidders on June 3, 2004 and it is expected that these licenses will be issued in 2004. Further competition may arise as a result of an assessment by the Minister of Communications on the feasibility of issuing additional licenses from May 2005.
In the mobile communications market, Vodacom, our 50% owned joint venture, and MTN were awarded licenses under the Post Office Act, 44 of 1958, in 1993 to provide mobile cellular telecommunications services in South Africa. These licenses continued in force under the Telecommunications Act, 103 of 1996, until they were confirmed and re-issued on August 19, 2002. Until November 2001, Vodacom and MTN were the only two licensed mobile communications network operators in South Africa. In November 2001, Cell C commenced operations as a third mobile communications network operator.
37
Our Competitive Strengths
We believe that we are well-positioned to strengthen our business, increase our profitability and cash flows and successfully meet future competition based on the following:
We have the leading market position and are well placed to face competition in the South African fixed-line communications market.
We believe our leading market position and our strong brand recognition will enable us to successfully meet competition in the fixed-line communications market without significant future fixed-line roll-out and with reduced levels of investment in our fixed-line segment. Key to achieving our objectives is our focus on rigorous cost management and efficiency improvements, reduced levels of investment and the successful implementation of our business strategy.
Customer retention is one of our key focus areas and we have undertaken the following actions to ensure we retain our customers:
- •
- refocused our sales and marketing force into more specialized divisions and entered into long term contracts with a number of our larger corporate and business customers;
- •
- improved the efficiency and quality of our network and achieved high service quality targets; and
- •
- successfully rebalanced our fixed-line tariffs to be more closely aligned with the costs of providing services, thereby reducing the need for future tariff adjustments and placing us in a stronger competitive position.
- •
- improved distribution channels through the launch of TelkomDirect and enhanced Vodashop distribution.
We have a fully digital fixed-line network that provides service to every major urban area in South Africa.
We believe our extensive digital fixed-line network places us in a strong position to compete with new providers of communications services as it enables us to sell value-added voice and data services. Since 1997, we have:
- •
- largely completed our fixed-line network modernization and line roll-out program in 2002 and, as of March 31, 2004, had 99.9% of our telephone access lines connected to digital exchanges;
- •
- modernized and enhanced our fixed-line network's resiliency and performance through the deployment of synchronous digital hierarchy managed self-healing optical fiber rings and by increasing our use of optical fiber;
- •
- deployed a national network operations center with the ability to proactively monitor our network and offer managed data networking services to global and corporate customers; and
- •
- invested in the South Atlantic Telecommunications Cable-3/West African Submarine Cable/South Africa Far East, or SAT-3/WASC/SAFE, submarine cable system, which provides increased fiber optic transmission capability between South Africa and international destinations.
We are an integrated communications service provider of bundled voice, data, video and internet services with the expertise to expand our service offerings.
Our network and resources enable us to provide customers with a wide range of integrated communications services, including voice services, data communications services, video services and
38
internet services. We have undertaken the following actions to strengthen our data communications service capabilities and improve our integrated communications service offerings:
- •
- successfully launched ISDN in 1995 and ADSL in August 2002 to business and residential customers;
- •
- developed extensive experience in designing and operating customized data communications and managed data networking products and services, including managed local and wide area networks;
- •
- established contracts with a number of leading communications equipment and software suppliers such as Amdocs, MDSI, Marconi, Alcatel, Siemens, Cisco Systems, Hughes Network Systems and Sun Microsystems to provide fully integrated communications solutions over our core fixed-line network;
- •
- deployed an extensive voice-over-internet protocol, or VOIP, network, and launched a voice over internet protocol regional clearing house to serve as a hub for voice traffic on the African continent; and
- •
- successfully introduced a full range of private branch exchange, or PBX, systems sourced from LG Electronics, with capability to integrate with IP and DSL technologies.
We benefit, from the financial, operational and managerial expertise of our two strategic equity investors.
SBC Communications is a leading provider of communications services in the United States and has significant experience operating in highly deregulated and competitive communications markets. Telekom Malaysia is the leading communications service provider in Malaysia with both fixed-line and mobile businesses. We benefit from the experience and knowledge of our strategic equity investors through:
- •
- their participation on our operating committee and their employees who serve as our officers; and
- •
- the skills they transfer to our South African management team.
Vodacom is the leading South African mobile communications network operator with strong brand recognition, extensive network coverage and distribution channels.
Vodacom is the largest mobile communications network operator in South Africa with an estimated market share of approximately 54% as of March 31, 2004 based on total estimated customers. Vodacom has an extensive network that covers approximately 95% of South Africa's population based on the last official census conducted in 2001 and approximately 65% of the total land surface area of South Africa as of March 31, 2004. Vodacom has a broad distribution network consisting of Vodacom owned shops and sales forces and independent dealers, franchises and national chains.
Vodacom is leveraging its successful experience in South Africa to selectively expand into other African countries, primarily in Sub-Saharan Africa.
Vodacom is pursuing future growth through select expansion initiatives in other African markets, primarily in Sub-Saharan Africa, that are complementary to its core business in South Africa. Investments outside of South Africa are evaluated and monitored against key investment criteria, focusing primarily on countries with stable economic and political conditions or good prospects for growth, market leadership and profitability. Other key factors include Vodacom's ability to gain majority ownership, develop strong local partnership relationships and obtain non-recourse financing. Other African operations are branded under the "Vodacom" name.
39
Vodacom benefits from an experienced and long-serving management team complemented by its experienced local and international shareholders, Vodafone, VenFin and us.
Vodacom has an experienced, long-serving management team with a record of innovation as the first mobile communications network operator in the world to offer prepaid mobile communications services on an intelligent network platform and to offer its customers coverage across the whole of Africa where commercial roaming based on the Global System for Mobile, or GSM, communications technology is available. Vodacom was also the first South African mobile communications network operator to provide nationwide coverage in South Africa. In addition, Vodacom launched "My Life" in October 2002, offering 24-hour internet access, photo messaging and text messages of unlimited length by blending together general packet radio service, or GPRS, and multimedia messaging service, or MMS, technologies. Vodacom benefits from the financial, operational and managerial expertise of its strategic shareholders, Vodafone, VenFin and us. Through a new royalty agreement with Vodafone, Vodacom now has increased access to Vodafone research and development and products such as 3G.
Our Group Strategy
Our group strategic goals are to increase shareholder value by increasing profitability and cash flows, while maintaining our market leadership in the South African fixed-line and mobile communications markets. We also are seeking to increase the synergies between our fixed-line business and Vodacom and support Vodacom's strategy of establishing and maintaining leading positions in other African mobile markets, primarily in Sub-Saharan Africa. We believe that increased competition and emerging technologies place greater importance on the need to further develop our group strategy. Our strategy was previously driven largely by Telkom's fixed-line strategy as a result of regulatory requirements. We intend to continue working closely with Vodacom to build synergies on a commercial basis for both companies. In order to achieve our goals, we intend to pursue the following strategies:
- •
- Compete effectively in our core fixed-line markets and grow selected markets.
- •
- Continue to reduce operating expenses and enhance capital investment efficiencies in our fixed-line business.
- •
- Expand our integrated service offerings through the increased sale of existing data products and the development of new data and fixed-mobile products.
- •
- Continue to invest in our fixed-line employees to foster a highly competitive corporate culture and to enhance skills retention.
- •
- Capitalize on the growing mobile communications market through Vodacom.
Compete effectively in our core fixed-line markets and grow selected markets.
In order to successfully compete and grow revenue in our fixed-line business, we intend to encourage our customers to increase their usage on our network through the following strategies:
- •
- Market new services to our existing customers. We intend to increase fixed-line revenue per customer by continuing to develop and market innovative, value-added voice service packages to our residential fixed-line customers, aggressively marketing our price advantages and entering into long-term contracts with corporate and business customers. In the 2004 financial year, we have launched free basic voicemail to approximately one million voicemail customers.
- •
- Promote increased network usage and revenue. We intend to stimulate network usage and revenue by increasing the penetration of higher speed internet access through ISDN and ADSL. In the 2004 financial year we continued to see strong demand for ISDN and ADSL, with 16.5% growth in ISDN channels to approximately 656,000, and significant growth in ADSL customers to approximately 20,313 customers as of March 31, 2004. We plan to introduce new packages and
40
- •
- Grow selected markets and maximize revenue. We intend to offer commercial interconnection and facilities leasing agreements to the second national operator and other national operators. In addition, we will seek to maximize the number of customers connected to our network through a targeted deployment of our prepaid offerings where we have existing capacity. In addition to growing our hubbing business, we intend to expand our presence in Africa through Vodacom, as well as pursuing new viable business opportunities, such as offering third party products and services to African operators and resellers. In the 2004 financial year, prepaid lines grew 4.8% to approximately 856,000 customers, representing 17.8% of our total fixed access lines as of March 31, 2004, as compared to 16.9% as of March 31, 2003. In October 2003, TelkomInternet also became powered by satellite, a broadband based internet access offering.
- •
- Improve our customer service. We intend to continue to improve customer service and satisfaction through improved distribution channels by relocating and transforming service branches, and enhancing operations support and network reliability, as well as aggressively building stronger customer association with the Telkom brand. We improved distribution through on-line ordering of products and services for TelkomDirect and Vodashops, and on-line viewing of customer accounts.
will seek to increase the penetration of existing packages and calling plan through improved sales channels. In the 2004 financial year, we have launched a bundled ADSL service with a free modem, have entered into real estate development contracts in affluent areas, have launched international voice over internet protocol services to 14 major customers and have launched Xtratime in March 2004.
Continue to reduce operating expenses and enhance capital investment efficiencies in our fixed-line business.
We will seek to increase operational and capital expenditure efficiencies to improve operating margins and increase cash flows in our fixed-line business. We intend to continue to streamline and improve our business operations through the following strategies:
- •
- Continue to reduce headcount. We will continue to reduce headcount by utilizing voluntary severance and retirement packages, natural attrition and other employee optimization initiatives. In the 2004 financial year, Telkom employees declined 8.5% to 32,358 and our number of fixed lines per fixed-line employee increased to 149 as of March 31, 2004.
- •
- Continue to reduce operating expenses. We will seek to continue implementing a strict cost management policy and further operating expense reduction initiatives. In the 2004 financial year, our cost-saving program in our fixed-line business contributed to an approximate 3.5% decrease in total fixed-line operating expenses, while materials and maintenance expenses declined approximately 16.0% as we realized benefits from our network investment and saw fault rates and losses in respect of cable theft decrease. Our current initiatives include cable alarm systems, enhanced fraud management, consolidation of stores, space optimization and continual reduction of our vehicle fleet.
- •
- Invest in operational support systems. We will continue to invest in operational support systems that permit integrated billing, workforce management and fault handling to improve customer service and enhance operational efficiencies. During the 2004 financial year, we implemented the first phase of our new workforce management system. This system controls the scheduling, routing, dispatching and ticketing of the surveillance control and analysis division in our national network operations center, as well as the dispatchable field technicians in our network field organization. Workforce management includes scheduling, routing, dispatching and tracking of the dispatchable workforce.
41
- •
- Implement a focused and disciplined capital investment program. We will continue to institute a disciplined business oriented capital investment program to ensure that capital investments are tied to demand and are only deployed where strategically required, such as operating support systems, or where returns can be achieved in excess of our cost of capital. Our more stringent investment criteria for capital investment contributed in part to the 42.4% decline in fixed-line capital expenditure in the 2003 financial year and a further 3.8% reduction in the 2004 financial year.
Expand our integrated service offerings through the increased sale of existing data products and the development of new data and fixed-mobile products.
We have developed the following strategies to ensure that we are able to capitalize on the projected growth in the data and fixed-mobile businesses and develop additional long-term corporate customer relationships:
- •
- Promote existing data products. We intend to increase corporate and business penetration of data transmission products by increasing our focused selling and distribution efforts and leveraging our extensive corporate customer relationships. Through our strong sales force we intend to increase sales of managed data networking services, internet access services, internet protocol based communications services and related data center and connectivity services, such as web hosting, server hosting, storage and security. In the 2004 financial year, fixed-line data services revenue increased 13.5% to R5.0 billion.
42
- •
- Develop new fixed-mobile products. We intend to develop new business and residential bundled fixed-mobile products, together with our 50% owned Vodacom joint venture, in preparation for increased competition and the emergence of new technologies. Telkom and Vodacom entered into a commercial agreement relating to joint distribution and procurement initiatives, which they began implementing in the 2004 financial year. In addition, Vodacom and Telkom are testing fixed-mobile products, such as WiFi, but no products are currently ready for launch.
Continue to invest in our fixed-line employees to foster a highly competitive corporate culture and to enhance skills retention.
We intend to continue to change our fixed-line corporate culture and increase productivity through the following strategies:
- •
- Implement training and skills retention programs. We intend to continue to maintain and leverage the experience of our strategic equity investors to improve and transfer skills to our employees. In addition, we plan to improve retention of critical skills through employee retention programs such as the implementation of appropriate employee share ownership plans. A new employee share ownership plan, the Telkom conditional share plan, was approved at our annual general meeting held on January 27, 2004. We have also initiated leadership and management development programs and targeted development initiatives.
- •
- Continue to develop long-term relationships with our trade unions. We intend to continue to develop long-term relationships with our trade unions through the development of mutually beneficial guidelines for managing our employees. Telkom signed a new collective recognition agreement on April 1, 2004 with ATU designed to enhance the relationship between shop stewards and management. Telkom is currently seeking to add CWU to the agreement. On November 27, 2002, we launched "The Agency" an alternative strategy to assist employees seeking alternative employment and avoid disruptions from job losses.
- •
- Entrench a competitive culture. We will seek to foster a competitive culture through the continued roll-out of company-wide programs aimed at educating our employees to better respond to future competition and creating an entrepreneurial culture. In the 2004 financial year, we began to roll-out the "Mentorship" program, a learning relationship pursuant to which a more experienced, often more senior person, shares their knowledge, skills and experience with a less experienced, usually more junior person. The "Mentorship" program is designed to reap business benefits by improving skills, achieving greater employee satisfaction and building and retaining talent.
Capitalize on the growing mobile communications market through Vodacom.
We intend to continue our participation in the South African mobile communications market through Vodacom and will support its strategic objectives. Vodacom's strategic objectives are to achieve sustainable growth in profits and cash flow, while maintaining its leading market position in South Africa, growing its operations in other African countries and establishing new operations in select African countries, primarily in sub-Saharan Africa. In order to achieve these objectives, Vodacom intends to pursue the following strategies:
- •
- Achieve sustainable growth in profits and cash flows. Vodacom will continue to strive for growth in profits and cash flows by growing customer numbers, while carefully managing its existing customer base, customer acquisition and retention costs, capital expenditures and operating expenses. Vodacom also intends to streamline its relationship with its customers by seeking increased direct ownership of service providers. On March 1, 2004, Vodacom purchased 51% of Smartphone and on April 16, 2004, Smartphone purchased an 85.75% equity stake in Smartcom (Proprietary) Limited. Vodacom now directly controls 70.6% of its contract customers and 97.8%
43
- •
- Expand data and fixed-mobile products. Vodacom intends to increase its revenue and profits by continuing to expand its range of offerings of value-added data and content services over its network, such as multimedia messaging services, information and banking services and location based services through alliances with content service providers, while remaining focused on its core mobile business. Vodacom will seek to develop and market in co-operation with us, new business and residential bundled fixed-mobile products. In the 2004 financial year, Vodacom launched Look4me, Look4it and Office Anywhere.
- •
- Increase revenue from Vodacom's other African operations. Vodacom intends to increase revenue from its other African operations, initially by growing its existing operations in Africa, and by selectively acquiring additional mobile licenses or operators in other African markets in the future, focusing primarily on countries in sub-Saharan Africa that have stable economic and political conditions and good prospects for growth, market leadership and profitability. In its other African operations, Vodacom seeks to gain majority ownership, develop strong local partnership relationships and obtain non-recourse financing. Vodacom's revenue from other African operations increased 21.2% in the year ended March 31, 2004 to R1.5 billion and 66.7% in the year ended March 31, 2003 to R1.2 billion from R741 million in the year ended March 31, 2002, 50% of which is included in the Telkom Group's revenue.
of its prepaid customers in South Africa. In addition, Vodacom believes more aggressive capital spending in the short term will ensure sustained growth.
Fixed-line Communications
Overview
Our fixed-line segment is our largest business segment and includes our fixed-line voice, data, directory services and wireless data services businesses. Our fixed-line services consist of:
- •
- fixed-line subscription and connection services to postpaid, prepaid and private payphone customers using PSTN lines, including ISDN and the sale of subscription based value-added voice services and customer premises equipment;
- •
- fixed-line traffic services to postpaid, prepaid and payphone customers, including local, long distance, fixed-to-mobile, international outgoing and international voice over internet protocol traffic services;
- •
- interconnection services, including terminating traffic from South African mobile operators and terminating and transiting traffic from international operators;
- •
- fixed-line data services, including domestic and international data transmission services, such as leased lines, ADSL services, packet-based services, managed data networking services and internet access and related information technology services; and
- •
- directory services, through our Telkom Directory Services subsidiary, and wireless data services, through our Swiftnet subsidiary.
Products and services
Subscriptions and connections
We provide postpaid, prepaid and private payphone customers with digital and analog fixed-line access services, including PSTN lines, ISDN lines, and wireless access between a customer's premises and our fixed-line network. Each PSTN line includes one access channel, each basic ISDN line includes two access channels and each primary ISDN line includes 30 access channels. Each ISDN line transmits signals at speeds of 64 kilobits per second per channel. Subscriptions to ADSL are included in our data
44
services revenue. We expect growth in the provisioning of ISDN lines will increase our revenue, as subscription fees for ISDN lines are higher than those for PSTN lines.
We were the first fixed-line operator in the world to provide prepaid service on a fixed-line network. Our prepaid service offers customers an alternative to the conventional postpaid fixed-line telephone service. All costs, including installation, telephone equipment, line rental and call charges, are paid in advance so that there are no monthly phone bills. We target our prepaid service mainly at first time homephone customers who do not have sufficient credit history and are located in areas where we can provide access to our network without significant additional investment. Customers who have previously had their telephone service disconnected due to non-payment are also encouraged to migrate to our prepaid service option in order to reduce future non-payments while satisfying demand for our services.
We also offer subscriptions to value-added voice services. We offer a broad range of value-added voice services on a subscription or usage basis, including call forwarding, call waiting, conference calling, voice-mail, toll free calling, ShareCall, which permits callers and recipients to share call costs, speed dialing, enhanced fax services and calling card services for payphones. These services complement our basic voice services and provide us with additional revenue while satisfying customer demand, enhancing our brand and increasing customer loyalty.
We provide payphone services throughout South Africa. As of March 31, 2004, we operated approximately 160,470 public payphones and approximately 14,700 private payphones, of which approximately 39% were coin operated and combination payphones and the remainder were card operated payphones.
The following table sets forth information regarding our postpaid and prepaid lines and payphones as of the dates indicated, including our internal lines:
| | As of March 31, | | | |||||||||
|---|---|---|---|---|---|---|---|---|---|---|---|---|
| | 2003/2002 % change | 2004/2003 % change | ||||||||||
| | 2002 | 2003 | 2004 | |||||||||
| | (in thousands, except percentages) | |||||||||||
| Postpaid PSTN(1) | 3,554 | 3,285 | 3,134 | (7.6 | ) | (4.6 | ) | |||||
| Business | 1,578 | 1,494 | 1,463 | (5.3 | ) | (2.1 | ) | |||||
| Residential | 1,976 | 1,791 | 1,671 | (9.4 | ) | (6.7 | ) | |||||
| Prepaid PSTN(1) | 708 | 817 | 856 | 15.4 | 4.8 | |||||||
| ISDN channels | 467 | 563 | 656 | 20.6 | 16.5 | |||||||
| Payphone(2) | 195 | 179 | 175 | (8.2 | ) | (2.2 | ) | |||||
| Total fixed access lines(3) | 4,924 | 4,844 | 4,821 | (1.6 | ) | (0.5 | ) | |||||
- (1)
- Excluding ISDN channels. PSTN lines are provided using copper cable, DECT and fiber.
- (2)
- Includes public and private payphones.
- (3)
- Total fixed access lines are comprised of PSTN lines, including ISDN channels, public and private payphones and internal lines in service. Telkom had 140,950, 134,972 and 162,460 internal lines as of March 31, 2004, 2003 and 2002, respectively. Each PSTN line includes one access channel, each basic ISDN line includes two access channels and each primary ISDN line includes 30 access channels.
In accordance with the installation performance targets in our public switched telecommunications service license, we were required to roll-out 2.7 million access lines and 120,000 payphones from May 1997 to May 2002. We substantially met all of our line roll-out targets. We elected not to roll-out lines in our last year of exclusivity where it was not economical to do so. As a result, we missed our fixed-line roll-out target by 16,448 lines, or 0.6%. Based on the previous requirements contained in our existing license, we incurred total penalties for failing to meet these targets of approximately
45
R15 million. The amount of these penalties has not been challenged by ICASA. We do not currently anticipate that we will have any additional fixed line roll-out targets.
During the three years ended March 31, 2004, our total fixed access lines were adversely impacted by customer migration to mobile services and lower connections, as well as high disconnections due to customer non-payments primarily in the 2002 and 2003 financial years. The decrease in postpaid PSTN lines was partially offset by an increase in postpaid ISDN channels and prepaid lines. The high level of disconnections due to customer non-payments occurred primarily in the 2002 and 2001 financial years and resulted largely from the fixed access lines we rolled out in impoverished areas in accordance with the targets contained in our license and the consequent non-payment by a number of these customers. We instituted a number of measures aimed at reducing bad debts, including implementing a more rapid disconnection policy for non-payments, continuing and improving credit vetting and controls, implementing usage limits based on customer credit limits, instituting a better collection program, continuing to promote our prepaid fixed-line services and encouraging non-paying customers to migrate to prepaid services.
The following table shows information related to the number of our fixed access lines in service, net line growth and churn for the periods provided. Churn is calculated by dividing the number of disconnections by the average number of fixed access lines in service during the period.
| | As of March 31, | | | |||||||||
|---|---|---|---|---|---|---|---|---|---|---|---|---|
| | 2003/2002 % change | 2004/2003 % change | ||||||||||
| | 2002 | 2003 | 2004 | |||||||||
| | (in thousands, except percentages and churn) | |||||||||||
| Opening balance | 4,962 | 4,924 | 4,844 | (0.8 | ) | (1.6 | ) | |||||
| Net line growth | (38 | ) | (80 | ) | (23 | ) | (110.5 | ) | (71.3 | ) | ||
| Connections | 1,037 | 936 | 819 | (9.7 | ) | (12.5 | ) | |||||
| Disconnections | (1,075 | ) | (1,016 | ) | (842 | ) | (5.5 | ) | (17.1 | ) | ||
| Closing balance | 4,924 | 4,844 | 4,821 | (1.6 | ) | (0.5 | ) | |||||
| Churn (%) | 21.7 | 20.8 | 17.4 | (4.1 | ) | (16.3 | ) | |||||
Connections include new line orders resulting primarily from changes in service and, to a lesser extent, new line roll-out. Disconnections include both customer initiated disconnections and Telkom initiated disconnections. Included in disconnections and churn are those customers who have terminated their service with Telkom and subsequently subscribed to a new service with Telkom as a result of relocation of premises or change of subscription to a different type of service. The decrease in churn over the three years ended March 31, 2004 is directly related to the lower level of disconnections, partially offset by the lower number of fixed access lines in service, real estate development contracts in affluent areas, changes in credit policies, get-connected campaigns and lengthened prepaid suspension time.
We also offer telecommunications equipment sales, such as telephones and private branch exchange systems, or PBX systems, related post-sales maintenance and service for residential and business customers in South Africa. During the 2004 financial year, we launched our voice over internet protocol PBX product called Opticon. The market in South Africa for such equipment and systems, commonly known as customer premises equipment, is characterized by high competition and low profit margins. We believe, however, that the supply and servicing of customer premises equipment is an essential element of providing a full service to our customers.
Traffic
We offer local, long distance, fixed-to-mobile, international outgoing and international voice over internet protocol services to business, residential and payphone customers throughout South Africa at
46
tariffs that vary depending on the destination, distance and the length and time of day of call. Local traffic services are for calls made to destinations less than 50km from origination. Long distance traffic services are for calls made to national destinations greater than 50km from origination. We provide international outgoing telephone services, including both voice and data traffic. All international traffic to and from South Africa was legally required to be routed through our network until May 7, 2002. We provide direct international dialing access to over 230 destinations. In the 2004 financial year, we implemented a new service available to major customers offering voice over internet protocol to provide these customers a low cost alternative to international access services.
The following table sets forth information regarding our fixed-line traffic, excluding interconnection traffic, for the periods indicated. We calculate fixed-line traffic by dividing fixed-line traffic revenues for the particular category by the weighted average tariff for such category during the relevant period.
| | Year ended March 31, | | | ||||||||
|---|---|---|---|---|---|---|---|---|---|---|---|
| | 2003/2002 % change | 2004/2003 % change | |||||||||
| | 2002(2) | 2003 | 2004 | ||||||||
| | | (millions of minutes, except percentages) | | ||||||||
| Local(1) | 20,538 | 20,396 | 20,547 | (0.7 | ) | 0.7 | |||||
| Long distance | 4,747 | 4,728 | 4,616 | (0.4 | ) | (2.4 | ) | ||||
| Fixed-to-mobile | 4,364 | 4,135 | 3,980 | (5.2 | ) | (3.7 | ) | ||||
| International outgoing | 374 | 439 | 427 | 17.4 | (2.7 | ) | |||||
| International voice over internet protocol | — | — | 25 | — | — | ||||||
| Total traffic(2) | 30,023 | 29,698 | 29,595 | (1.1 | ) | (0.3 | ) | ||||
- (1)
- Local traffic includes internet traffic.
- (2)
- In the 2003 financial year, we revised the calculation of the weighted average tariffs for certain prepaid calls and our ShareCall product. We have recalculated the traffic for the 2002 financial year accordingly. Calculated on the original basis, local traffic was 20,252 millions of minutes, long-distance traffic was 4,895 millions of minutes, fixed-to-mobile traffic was 4,390 millions of minutes, international outgoing traffic was 375 millions of minutes and total traffic was 32,973 millions of minutes in the 2002 financial year.
Traffic was adversely affected by a decrease in the number of fixed access lines in service during the three years ended March 31, 2004 primarily as a result of customer migration to mobile services and disconnections due to customer non-payments as well as lower connections primarily in the year ended March 31, 2003 and 2004. In addition, traffic was adversely affected by the increasing substitution of calls placed using mobile services rather than our fixed-line services. We have implemented a number of measures designed to stem the decline in traffic minutes, including increasing the sale of voicemail accounts to approximately 968,000 as of March 31, 2004, introducing new calling products and services, such as launching Xtratime in March 2004, and continuing our rate education campaigns to highlight the price advantages of fixed-line calls.
Long distance traffic was also adversely affected by increases in sales of our SmartAccess products in the financial years ended March 31, 2003 and 2004, as well as the fact that fixed line long distance traffic tariffs were historically higher than the price of mobile calls, which are not distance dependent. We have reduced our long-distance traffic tariffs to below mobile tariffs over the past six years as a result of our traffic rebalancing program and continue to educate the market on our tariffs. The decrease in fixed-to-mobile traffic in the years ended March 31, 2003 and 2004 was primarily due to an increase in the number of mobile subscribers, resulting in increased mobile-to-mobile traffic and less fixed-to-mobile traffic and an effective 15.5% increase in tariffs in November 2001 and a weighted average 5.5% increase in tariffs in January 2003. International outgoing traffic decreased in the 2004 financial year mainly due to the substitution of fixed-line calls with mobile calls, and increased in the
47
2003 financial year primarily due to lower effective tariffs and increased marketing efforts. During the 2004 financial year, we launched our voice over internet protocol service to 14 of our major customers.
Interconnection services
We provide interconnection services to the three mobile operators, Vodacom, MTN and Cell C, and other entities that lawfully provide licensed telecommunications services in South Africa consisting of call termination and call transit, as well as access, through our network, to other services, including FreeCall 080, ShareCall 0860 and HomeFree, emergency services and directory enquiry services. We will also be required to provide interconnection services to the second national operator and to other licensees.
We also provide interconnection services to international operators in respect of incoming international calls and transiting traffic through South Africa to other countries. We are seeking to establish ourselves as the principal international telecommunications hub for Africa through our investments in undersea cables and our network and our arrangements with other fixed-line operators in Africa in order to continue to increase international transiting traffic revenue.
The following table sets forth information regarding interconnection traffic terminating on or transiting through our network for the periods indicated. We calculate interconnection traffic, other than international outgoing mobile traffic and international interconnection traffic, by dividing interconnection revenue for the particular category by the weighted average tariff for such category during the relevant period. Fixed-line international outgoing mobile traffic and international interconnection traffic are based on the actual traffic registered through the respective exchanges and reflected in international interconnection invoices.
| | Year ended March 31, | | | ||||||||
|---|---|---|---|---|---|---|---|---|---|---|---|
| | 2003/2002 % change | 2004/2003 % change | |||||||||
| | 2002 | 2003 | 2004 | ||||||||
| | (millions of minutes, except percentages) | ||||||||||
| Domestic mobile interconnection traffic | 2,008 | 2,099 | 2,159 | 4.5 | 2.9 | ||||||
| International interconnection traffic | 1,053 | 1,071 | 1,188 | 1.7 | 10.9 | ||||||
| Total | 3,061 | 3,170 | 3,347 | 3.6 | 5.6 | ||||||
The increase in domestic mobile interconnection traffic in the years ended March 31, 2003 and 2004 was primarily due to an overall increase in mobile calls as a result of growth in the mobile market, partially offset by increased mobile-to-mobile calls bypassing our network.
International interconnection traffic consists of international termination traffic and international transiting traffic. International interconnection traffic increased in the years ended March 31, 2003 and 2004 primarily due to growth in the international market, partially offset by aggressive competition from other international carriers and Sentech.
Data communications services
We offer a wide range of national and international data communications services, including:
- •
- data transmission services, such as leased lines, ADSL and packet-based services;
- •
- managed data networking services;
- •
- global products; and
- •
- internet access and related information technology services.
48
Data Transmission Services
Data transmission services provide the connection of information technology applications over wide area networks. These services include leased lines and packet-based services. We have a growing portfolio of data transmission products tailored to different customer needs from high bandwidth mission critical applications to low bandwidth best effort applications. We also offer our customers tailor-made cost effective customer specific solutions.
Leased lines. We are presently the sole provider of national and international leased lines in South Africa. Leased lines are fixed connections between locations, which are secure and exclusive to the user, and are mainly used for high volume data or multimedia transmission. Leased lines are our principal data transmission service and include Diginet, Diginet Plus and Megaline services. We also provide leased lines to broadcasters for audio and video services. Our leased line customers pay an initial installation charge and a recurring fee based on the type, length and capacity of the leased line. In recent years, leased line charges have increased only slightly, but in real terms our prices have reduced. However, we expect that competition will result in further pressure on prices in the future.
49
With the growth in traffic carried on the mobile networks, a need was identified for the deployment within these networks of transmission links with transmission speeds higher than the 2Mb/s provided by existing agreements. We entered broadband fixed link leasing agreements with Vodacom and MTN in the 2004 financial year and have currently negotiated a similar agreement with Cell C. These agreements offer speeds of 45 Mb/s and 155 Mb/s and include formalized service level agreements and a term and volume discount structure, as a counter to the competitive challenges that are expected to occur in this area of the business.
The following table sets forth the bandwidth capacity of our Diginet, Diginet Plus, Megaline and broadcasting data transmission services:
| Leased Line | Bandwidth | ||
|---|---|---|---|
| Diginet | 9.6 Kbit/s to 64 Kbit/s | ||
| Diginet Plus | 128 Kbit/s to 2 Mbit/s | ||
| Megaline | 2 Mbit/s to 155 Mbit/s | ||
| Broadcasting | |||
| Audio | 64 Kbit/s | ||
| Video | 34 Mbit/s | ||
ADSL Services. ADSL allows the provisioning of high speed connections over existing copper wires using digital compression. ADSL transmits signals at speeds of 512 kilobits per second downstream and 256 kilobits per second upstream. We now offer a new ADSL package, including a free modem, with a 24 month contract.
Packet-based services. Packet-based services are based on a statistical multiplexing technique that allows customers to share bandwidth more cost effectively based on a virtual private network concept. Our packet-based services include packet-switched services, frame relay services, asynchronous transfer mode services and internet protocol services.
Our packet-switched service is Saponet-P, which allows data communications for a range of applications, such as database searches, electronic funds transfers and e-mail. We use the X.25 protocol, which is a worldwide standard for transmitting data using packet-switched networks. Packet-switched services are based on a mature technology and account for a significant but declining amount of our data transmission service revenue. Although traffic still has shown some growth in recent years, we are increasingly offering migration to other packet based services, such as frame relay based services, asynchronous transfer mode based services and internet protocol services.
Our frame relay service, branded as Frame Express, is a high speed open protocol that is more efficient than X.25 packet-switching and is well suited for data intensive applications, such as connecting local area networks. Instead of leasing high capacity lines in order to accommodate occasional or intermittent high data volumes, customers using frame relay pay for capacity sufficient to satisfy their average requirements. Frame relay based services account for a growing percentage of our data transmission service revenue. This is due primarily to the significant increase in the amount of internet and corporate local access network traffic carried on our frame relay networks and the growing number of applications that require the speed and flexibility of more advanced technologies.
Our asynchronous transfer mode based services include ATM Express, which we launched in 2002, and Megaline Plus. ATM Express provides digital transmission services for wide area networks at speeds from 2 megabits per second up to 155 megabits per second. ATM Express provides a medium for companies to transmit high volumes of information at high speeds over their wide area network with high quality and reliable connections. Voice, video and data applications can be supported simultaneously over a connection. Megaline Plus is a broadband service providing for the carrying of voice and video at a constant bit rate across our asynchronous transfer mode network. ATM Express
50
and Megaline Plus serve as an integral component of our integrated virtual private network service offering that allows for the convergence of voice, data, video, e-commerce and web services across a single access medium over our network. We expect our asynchronous transfer mode based service revenue to grow as a result of customers' growing demand for bandwidth, flexibility and reliability.
Our primary internet protocol data transmission products, ViPLink and ViPDial have been superceded by our flagship IP-based VPN product, branded VPN Supreme. On the international front we have invested in an internet protocol and voice-over internet protocol network and launched a regional clearinghouse to serve as a hub for voice traffic on the African continent. We intend to launch additional internet protocol data transmission products in the future.
Managed data networking services
Our managed data networking services combine our data transmission services discussed above with active network management provided from our state-of-the-art national network operations center. We offer a wide range of integrated and customized networking services, including planning, installation, management and maintenance of corporate wide data, voice and video communications networks, as well as other value-added services, such as capacity, configuration and software version management on customers' networks. To support our service commitment, we offer guaranteed service level agreements on a wide range of our products, which guarantee availability, or uptime, of the network, through the use of our national network operations center.
Our managed data networking services include our customer network care service, which facilitates the network management of all our data transmission services using the leased lines or packet-based services discussed above, and our Spacestream and IVSat products, which are satellite based products. Spacestream is a high quality, flexible satellite networking service that supports data, voice, fax, video and multimedia applications, both domestically and into the rest of Africa.
Managed data networking services are billed on a monthly basis and vary by customer depending on the particular services provided and the number of network sites under management. The following table sets forth information regarding the number of managed network sites for each of our managed data networking services as of the dates indicated.
| | As of March 31, | | | |||||||
|---|---|---|---|---|---|---|---|---|---|---|
| | 2003/2002 % change | 2004/2003 % change | ||||||||
| | 2002 | 2003 | 2004 | |||||||
| | (number of sites, except percentages) | |||||||||
| Terrestrial based | 2,139 | 3,511 | 4,794 | 64.1 | 36.5 | |||||
| Satellite-based | 3,545 | 4,218 | 4,267 | 19.0 | 1.2 | |||||
| Total managed network sites | 5,684 | 7,729 | 9,061 | 36.0 | 17.2 | |||||
Global services
Our portfolio of global international products consists of a number of different products. We have international private line circuits, which are our Diginet equivalent to international destinations with bandwidths ranging from 9,600 b/s up to 155 Mb/s. The international private line circuits use both cable infrastructures, such as submarine cables, or satellite infrastructure. This product is complimented by our three global alliances with Infonet, Equant and BT, which are used to offer customers connectivity based on these companies' global networks. Our global alliances have coverage throughout the world and it is easier for customers to use them from an ordering, installation and support point of view, as they have physical presence or formally appointed partners in each country. Due to the packet-based nature of these global networks, the cost efficiencies inherent in these networks can be passed on to customers to ensure more affordable services.
51
Internet access services and other related information technology services
Internet access services. We are one of the leading internet access providers in South Africa in the wholesale internet access provision market and are focused on growing our position in the retail internet access market. We also package our TelkomInternet product with ADSL and ISDN services, as well as our newly introduced satellite access products, SpaceStream Express and SpaceStream Office.
Our South African internet exchange, or SAIX, is South Africa's largest internet access provider offering dedicated and dial-up internet connectivity. SAIX has offered fixed-line network internet access through dial up service since 1997. SAIX derives revenue for its access services primarily from fees paid by customers for its dial up services.
We launched TelkomInternet in January 2000. TelkomInternet provides dial up internet access service for residential and small businesses as well as dedicated internet access and private label internet service provider services to corporate customers. These services include e-mail, web page hosting, administration, technical support, virus protection and domain name registration. TelkomInternet derives revenue primarily from fees paid by customers for its dial up services.
In October 2003, TelkomInternet also became powered by satellite. This broadband based internet access offering was launched as a full commercial service. It is a Vsat product offering that allows effective sharing of the satellite platform making the service more affordable. Following the successful introduction of TelkomInternet via satellite, Telkom is now expanding its SpaceStream Express product into Africa.
In January 2004 Telkom introduced a new online activation service which enables customers to order their TelkomInternet service and connect within minutes.
The following table sets forth information regarding our wholesale and retail internet services and customers as of the dates indicated.
| | As of March 31, | | | |||||||
|---|---|---|---|---|---|---|---|---|---|---|
| | 2003/2002 % change | 2004/2003 % change | ||||||||
| | 2002 | 2003 | 2004 | |||||||
| Wholesale | ||||||||||
| Internet leased lines | 778 | 1,156 | 1,687 | 48.6 | 45.9 | |||||
| Internet leased lines—equivalent 64kb/s | 2,876 | 4,635 | 7,588 | 61.2 | 63.7 | |||||
| Dial-up ports | 8,557 | 12,411 | 14,329 | 45.0 | 15.5 | |||||
Retail | ||||||||||
| Internet customers | 48,995 | 98,690 | 142,208 | 101.4 | 44.1 | |||||
Our wholesale internet services are billed on a bandwidth basis while our retail internet services are billed on a monthly subscription basis. We also generate fixed-line traffic revenue from internet traffic routed over our fixed-line network.
Information technology and related services. We have recently expanded our data offering to selected information technology services, including local area network services, data center hosting services, managed infrastructure hosting, web application hosting, security services, disaster recovery and storage services and application service provider hosting. Our local area network services include structured cabling, local area network management services, local area network equipment supply and shared local area network applications. Our security services include firewalls, intrusion detection, certificate authority and virus protection.
We also offer e-commerce products and services, including electronic data interchange, hosted procurement market place, payment gateways, electronic storefronts, electronic bill presentment and message translation services. CyberTrade, our web based e-commerce service provider, provides users
52
with a secure platform to perform online banking and stock market trading, to buy and sell goods and products from electronic merchants and to access critical information. During the 2004 financial year, we introduced an online bill service for residential and small business customers that enables them to control and manage their accounts more effectively. In September 2003, we introduced Cyber Trade Mall, an electronic shopping portal that enables online shopping in a secure environment.
Directory and other services
Directory services. We own 64.9% of Telkom Directory Services, the largest directory publisher in South Africa providing white and yellow pages directory services and electronic white pages. As of March 31, 2004, Telkom Directory Services published approximately 7.46 million white and yellow directories. Telkom Directory Services also provides electronic yellow pages and value added content through full color advertisements. Telkom Directory Services has improved the accessibility and distribution of the directories through door-to-door delivery and electronic media. We also provide national telephone inquiries and directory services.
Wireless data application services. We own 100% of Swiftnet, which operates under the name Fastnet Wireless Service. Fastnet is a wireless network providing asynchronous wireless access on our X.25 network, Saponet-P, to its customer base. Services include retail credit card and check point of sale terminal verification, telemetry, security and vehicle tracking.
Fees and tariffs
Tariff rebalancing
We have made significant progress since 1997 in rebalancing tariffs in our fixed-line segment in order to reduce the need for future tariff adjustments in the face of competition. Our tariff rebalancing program has resulted in a decrease in the ratio of tariffs for long distance calls to all destinations over 200 km compared to tariffs for local calls from 13.2:1 as of March 31, 1997 to 2.7:1 as of March 31, 2002. The weighted average effective price per minute to all international destinations decreased approximately 44% from January 1, 1998 to March 31, 2002. The ratio of tariffs for long distance calls to all destinations over 200 km compared to tariffs for local calls was 2.6:1 as of March 31, 2004. By and large we have completed our tariff rebalancing program and on January 1, 2003, we increased our long distance tariffs by 12.5% based on the increase in the consumer price index for the twelve months ended September 30, 2002 and increased the average tariff to all international destinations by approximately 5.0%. The following table shows our long distance to local call ratio for the periods indicated.
| | As of March 31, | |||||||
|---|---|---|---|---|---|---|---|---|
| | 2001 | 2002 | 2003 | 2004 | ||||
| Long distance to local call ratio | 5.8 | 2.7 | 2.7 | 2.6 | ||||
The Telecommunications Act, 103 of 1996, and regulations made under the Act impose a price cap formula on a basket of specified services that we previously had the exclusive right to provide, including installations; prepaid and postpaid line rental; local, long distance and international calls; fixed-to-mobile calls; public payphone calls; ISDN services; our Diginet product; and our Megaline product. Approximately 80% of Telkom's operating revenue in the year ended March 31, 2004 was included in this basket. Prices on these services are filed with ICASA for approval. Revenue from services in the basket may not be used to subsidize other products and services outside the basket. Currently, the overall tariffs for all services in the basket may not be increased by more than 1.5% below inflation in South Africa, based on the consumer price index and measured using revenue for the services in the basket at constant volumes for the prior year. In addition, the overall tariffs for a sub-basket of services provided to residential customers may not be increased by more than 1.5% below
53
inflation in South Africa, based on the consumer price index and measured using revenue for the services in the basket at constant values for the prior year. In addition, prior to January 1, 2003, the price of any individual product or service included in the basket could not be increased by more than 20% above inflation in South Africa in any year. Effective January 1, 2003, the price of individual services in the basket may not be increased by more than 5% above inflation in South Africa in any year.
In December 2002, as a result of an out of court settlement related to our tariff increase in the prior year, ICASA approved our tariff filing providing for a 9.5% increase in the overall tariffs for all services in the basket effective January 1, 2003, based on the increase in the consumer price index for the twelve months ended September 30, 2002 of 12.5%. Statistics South Africa Limited subsequently revised the calculation of the consumer price index for the twelve months ended September 30, 2002 downward to 11.2%, although our tariffs were not affected. ICASA approved a 2.2% increase in the overall tariffs for all services in the basket effective January 1, 2004. ICASA has indicated its intention to conduct a review of the price control regime in 2004, however, a process and timetable for the review has not been announced. See Item 3. "Key Information—Risk Factors—Risks Related to Regulatory and Legal Matters—Our tariffs are subject to approval by the regulatory authorities, which may limit our flexibility in pricing and could reduce our net profit. Vodacom's revenue and net profit could decline if wholesale price controls are imposed on it." and "—Regulation and License Requirements" below. All tariffs include value added tax at a rate of 14%.
Subscription and connection tariffs
We provide reduced installation charges to most packaged services and provide discounts to other customer specific solutions. In order to attract high volume corporate and business customers we offer PrimeNet, which provides volume discounts for intracompany traffic between different company premises, and rate stability programs on certain data products that fix rates at the lower of the prevailing rates or the rate at the time of the contract. We also offer term discounts on our ISDN primary service.
The following tables show our subscriptions and connections tariffs as of January 1, 2004, 2003 and 2002.
| | As of January 1, 2004 | |||||||
|---|---|---|---|---|---|---|---|---|
| | PSTN Postpaid | PSTN Prepaid | ISDN2 Basic | ISDN30 Primary | ||||
| | (ZAR, including value-added tax) | |||||||
| Business | ||||||||
| Installation | 274.35 | n/a | 384.75 | 20,721.00 | ||||
| Monthly rental | 108.80 | n/a | 216.82 | 3,264.00 | ||||
Residential | ||||||||
| Installation | 274.35 | 158.40 | 384.75 | n/a | ||||
| Monthly rental | 81.90 | 50.80 | 184.28 | n/a | ||||
| | As of January 1, 2003 | |||||||
|---|---|---|---|---|---|---|---|---|
| | PSTN Postpaid | PSTN Prepaid | ISDN2 Basic | ISDN30 Primary | ||||
| | (ZAR, including value-added tax) | |||||||
| Business | ||||||||
| Installation | 268.98 | n/a | 377.19 | 20,314.80 | ||||
| Monthly rental | 101.23 | n/a | 201.78 | 3,036.96 | ||||
Residential | ||||||||
| Installation | 268.98 | 155.27 | 377.19 | n/a | ||||
| Monthly rental | 76.20 | 47.23 | 171.50 | n/a | ||||
54
| | As of January 1, 2002 | |||||||
|---|---|---|---|---|---|---|---|---|
| | PSTN Postpaid | PSTN Prepaid | ISDN2 Basic | ISDN30 Primary | ||||
| | (ZAR, including value-added tax) | |||||||
| Business | ||||||||
| Installation | 239.00 | n/a | 377.19 | 20,314.80 | ||||
| Monthly rental | 89.97 | n/a | 186.77 | 2,698.92 | ||||
| Residential | ||||||||
| Installation | 239.00 | 138.00 | 377.19 | n/a | ||||
| Monthly rental | 67.72 | 41.98 | 158.75 | n/a | ||||
Traffic tariffs
Local, long distance and fixed-to-mobile
When setting local and long distance call pricing, a number of variables are considered in order to generate an optimal level of revenue and to balance demand and affordability within our price cap limitations. These include the duration of the call, the distance between the points of origin and destination, and the time of day and day of the week the call is made.
For calls from our fixed-line customers to mobile users, we bill our customer the standard retail tariff, retain a fixed portion of the retail tariff and pay the remainder of the tariff to the mobile operator.
The following table sets forth our postpaid and prepaid traffic tariffs as of January 1, 2004, 2003 and 2002.
| | As of January 1, 2004 | As of January 1, 2003 | As of January 1, 2002 | |||||||||
|---|---|---|---|---|---|---|---|---|---|---|---|---|
| | Peak rates(1) | Off peak rates(2) | Peak rates(1) | Off peak rates(2) | Peak rates(1) | Off peak rates(2) | ||||||
| | (ZAR, including value-added tax) | |||||||||||
| Postpaid services (residential and business) | ||||||||||||
| Local minimum call charge (0-50km) for first unit(3) | 0.56 | 0.56 | 0.55 | 0.55 | 0.49 | 0.49 | ||||||
| Local call rate per minute (0-50km) after first unit(3) | 0.38 | 0.15 | 0.37 | 0.14 | 0.33 | 0.12 | ||||||
| Long distance minimum call charge (>50km) for first unit(4) | 0.99 | 0.99 | 0.99 | 0.99 | 0.88 | 0.88 | ||||||
| Long distance call rate per minute (>50km) after first unit(4) | 0.99 | 0.50 | 0.99 | 0.50 | 0.88 | 0.44 | ||||||
| Fixed-to-mobile call rate per minute (Vodacom)(5)(6) | 1.84 | 1.13 | 1.88 | 1.11 | 1.78 | 1.06 | ||||||
| Fixed-to-mobile call rate per minute (MTN)(6)(7) | 1.84 | 1.13 | 1.88 | 1.11 | 1.78 | 1.06 | ||||||
| Fixed-to-mobile call rate per minute (Cell C)(6)(8) | 1.84 | 1.13 | 1.88 | 1.11 | 1.62 | 1.06 | ||||||
Prepaid services (residential only) | ||||||||||||
| Local minimum call charge (0-50km) for first unit(9) | 0.56 | 0.56 | 0.55 | 0.55 | 0.49 | 0.49 | ||||||
| Local call rate per minute (0-50km) after first unit(9) | 0.43 | 0.17 | 0.42 | 0.16 | 0.38 | 0.14 | ||||||
| Long distance minimum call charge (>50km) for first unit(10) | 0.99 | 0.99 | 0.99 | 0.99 | 0.88 | 0.88 | ||||||
55
| Long distance call rate per minute (>50km) after first unit(10) | 1.17 | 0.59 | 1.17 | 0.59 | 1.04 | 0.52 | ||||||
| Fixed-to-mobile call rate per minute (Vodacom)(5)(6) | 1.84 | 1.13 | 1.88 | 1.11 | 1.78 | 1.06 | ||||||
| Fixed-to-mobile call rate per minute (MTN)(6)(7) | 1.84 | 1.13 | 1.88 | 1.11 | 1.78 | 1.06 | ||||||
| Fixed-to-mobile call rate per minute (Cell C)(6)(8) | 1.84 | 1.13 | 1.88 | 1.11 | 1.62 | 1.06 |
- (1)
- Monday to Friday 7 a.m. to 7 p.m. for local and long distance calls. Monday to Friday 7 a.m. to 8 p.m. for fixed-to-mobile calls.
- (2)
- Monday to Thursday 7 p.m. to 7 a.m. the next morning, and Friday 7 p.m. to Monday 7 a.m. for local and long distance calls. Monday to Thursday 8 p.m. to 7 a.m. the next morning, and Friday 8 p.m. to Monday 7 a.m. for fixed-to-mobile calls.
- (3)
- The first unit for peak calls is 89 seconds and for off peak calls is 222.5 seconds. (January 1, 2003: 238 seconds)
- (4)
- The first unit for peak calls is 60 seconds and for off peak calls is 120 seconds.
- (5)
- The peak fixed-to-mobile call rate per minute for Vodacom was reduced to R1.82 as of July 1, 2003 to December 31, 2003. On January 1, 2004, the rate increased to R1.84.
- (6)
- Calls are charged in increments of 60 seconds for the first minute and in increments of 30 seconds thereafter.
- (7)
- The peak fixed-to-mobile call rate per minute for MTN was reduced to R1.84 as of February 1, 2003 through June 30, 2003 and to R1.82 as of July 1, 2003 through December 31, 2003. On January 1, 2004, the rate increased to R1.84.
- (8)
- The peak fixed-to-mobile call rate per minute for Cell C was reduced to R1.82 as of August 1, 2003 through December 31, 2003. On January 1, 2004, the rate increased to R1.84.
- (9)
- The first unit for peak calls is 78 seconds and for off peak calls is 194.5 seconds. (January 1, 2003: 207 seconds)
- (10)
- The first unit for peak calls is 51 seconds and for off peak calls is 101 seconds.
International outgoing
Our outgoing international call tariffs and payments are based on settlement rates negotiated with other international carriers on a bilateral basis. The following table sets forth our international
56
outgoing traffic tariffs per minute as of January 1, 2004, 2003 and 2002 for residential and business customers to the ten most frequently called countries.
| | As of January 1, 2004 | As of January 1, 2003 | As of January 1, 2002 | |||||||||
|---|---|---|---|---|---|---|---|---|---|---|---|---|
| | Peak rates(1) | Off peak rates(2) | Peak rates(1) | Off peak rates(2) | Peak rates(1) | Off peak rates(2) | ||||||
| | (ZAR, including value-added tax) | |||||||||||
| United Kingdom | 3.12 | 2.81 | 3.35 | 3.01 | 3.41 | 3.07 | ||||||
| Zimbabwe | 1.66 | 1.30 | 1.58 | 1.24 | 1.58 | 1.24 | ||||||
| United States | 3.33 | 3.02 | 3.57 | 3.24 | 3.64 | 3.29 | ||||||
| Namibia | 1.66 | 1.30 | 1.58 | 1.24 | 1.58 | 1.24 | ||||||
| Botswana | 1.66 | 1.30 | 1.58 | 1.24 | 1.58 | 1.24 | ||||||
| Mozambique | 2.86 | 2.50 | 2.72 | 2.38 | 2.72 | 2.38 | ||||||
| Germany | 2.60 | 2.39 | 2.79 | 2.56 | 2.84 | 2.61 | ||||||
| Swaziland | 1.66 | 1.30 | 1.58 | 1.24 | 1.58 | 1.24 | ||||||
| Australia | 3.01 | 2.70 | 3.22 | 2.90 | 3.28 | 2.95 | ||||||
| Lesotho | 1.66 | 1.30 | 1.58 | 1.24 | 1.58 | 1.24 | ||||||
- (1)
- Monday to Friday 8 a.m. to 8 p.m.
- (2)
- Monday to Thursday 8 p.m. to 8 a.m. the next morning, and Friday 8 p.m. to Monday 8 a.m.
Interconnection tariffs
Interconnection termination rates for mobile operators are distance independent and are based on aggregated measurements of traffic crossing the points of interconnection measured on a per-second basis. For national calls from mobile users to fixed-line customers, the mobile operator pays us a termination fee. The risk of uncollectibles is carried by the originating operator. For incoming international calls destined for mobile users, we pay the mobile operator a termination rate which is the same as the rate we pay for fixed-to-mobile calls, and for outgoing international calls originating from mobile users, the mobile operators pay to us our standard retail rate for international calls, less a discount.
Our current interconnection tariffs are set out in interconnection agreements negotiated and agreed by us and the other operators. ICASA is entitled to issue, and has issued, regulations relating to interconnection between South African licensed operators. The following table sets forth our fixed-to-mobile retail interconnection tariffs, including our termination rates paid to mobile operators and our retention rates, and our mobile-to-fixed interconnection tariffs as of January 1, 2004, 2003 and
57
2002. Fixed-to-mobile tariffs are billed for the first 60 seconds and 30 second increments thereafter. Termination rates paid to mobile operators are paid on a per second basis.
| | As of January 1, 2004 | As of January 1, 2003 | As of January 1, 2002 | |||||||||
|---|---|---|---|---|---|---|---|---|---|---|---|---|
| | Peak rates(1) | Off peak rates(2) | Peak rates(1) | Off peak rates(2) | Peak rates(1) | Off peak rates(2) | ||||||
| | (ZAR, including value-added tax) | | ||||||||||
| Fixed-to-mobile retail rate (Vodacom) | 1.84 | 1.13 | 1.88 | (3) | 1.11 | 1.78 | 1.06 | |||||
| Termination rate paid to mobile operators | 1.40 | 0.86 | 1.46 | (5) | 0.86 | 1.40 | 0.83 | |||||
| Retention rate | 0.44 | 0.27 | 0.42 | 0.25 | 0.38 | 0.23 | ||||||
| Fixed-to-mobile retail rate (MTN) | 1.84 | 1.13 | 1.88 | (3) | 1.11 | 1.78 | 1.06 | |||||
| Termination rate paid to mobile operators | 1.40 | 0.86 | 1.46 | (5) | 0.86 | 1.40 | 0.83 | |||||
| Retention rate | 0.44 | 0.27 | 0.42 | 0.25 | 0.38 | 0.23 | ||||||
| Fixed-to-mobile retail rate (Cell C) | 1.84 | 1.13 | 1.88 | (4) | 1.11 | 1.62 | 1.06 | |||||
| Termination rate paid to mobile operator | 1.40 | 0.86 | 1.46 | (6) | 0.86 | 1.24 | 0.83 | |||||
| Retention rate | 0.44 | 0.27 | 0.42 | 0.25 | 0.38 | 0.23 | ||||||
| Mobile-to-fixed retail rate (Vodacom, MTN and Cell C) | ||||||||||||
| Termination rate paid to Telkom | 0.29 | 0.16 | 0.27 | 0.14 | 0.24 | 0.11 | ||||||
- (1)
- Monday to Friday 7 a.m. to 8 p.m.
- (2)
- Monday to Thursday 8 p.m. to 7 a.m. the next morning and Friday 8 p.m. to Monday 7 a.m.
- (3)
- The peak period retail rate for calls to MTN customers was reduced from R1.88 per minute to R1.84 per minute with effect from February 1, 2003, and with effect July 1, 2003, the peak period retail rate for calls to Vodacom and MTN customers was reduced to R1.82 per minute.
- (4)
- The peak period retail rate for calls to Cell C was reduced from R1.88 to R1.82 per minute with effect from August 1, 2003.
- (5)
- The peak period termination rate paid by Telkom to Vodacom and MTN was reduced to R1.40 per minute with effect from January 6, 2003.
- (6)
- The peak period termination rate paid to Cell C was reduced to R1.24 per minute with effect from January 6, 2003, and later increased to R1.40 per minute with effect from March 1, 2003.
58
Data tariffs
We charge monthly fees for leased lines, which vary based on bandwidth and distance, and monthly service charges for ADSL, which are not distance dependent. The following table sets forth the monthly tariffs for our data leased lines using 20 km distances and ADSL service as of the dates indicated. Subscription to ADSL service also requires the subscription to a PSTN postpaid line.
| | As of January 1, | ||||||
|---|---|---|---|---|---|---|---|
| | 2004 | 2003 | 2002 | ||||
| | (ZAR, including value-added tax) | ||||||
| ADSL installation charges | |||||||
| Residential | 404 | 404 | n/a | ||||
| Business | 404 | 404 | n/a | ||||
| ADSL access rental charges | |||||||
| Residential | 680 | 680 | n/a | ||||
| Business | 800 | 800 | n/a | ||||
| Diginet (64kbs) | 2,196 | 2,066 | 1,919 | ||||
| Diginet Plus (512kbs) | 6,165 | 6,286 | 5,943 | ||||
| Megalines | |||||||
| 2 Mbit/s | 16,963 | 16,188 | 15,333 | ||||
| 34 Mbit/s | 143,412 | 136,800 | 129,675 | ||||
| 140 Mbit/s | 483,588 | 461,244 | 437,304 | ||||
Managed data networking services are billed on a monthly basis and vary by customer depending on the particular services provided and the number of network sites under management.
Sales and marketing
We group our fixed-line customer base into the following three categories in order to more effectively target and service our customers:
- •
- business customers;
- •
- residential customers; and
- •
- payphone customers.
Business customers
Business customers are comprised of global and corporate customers, business and government customers and wholesale customers. We have separate sales and marketing departments geared to each of the sub-categories within our business customer category. Our business customer category accounted for approximately 72% of our total fixed-line operating revenue, excluding directories and other revenue, in the year ended March 31, 2004 and approximately 43% of our total fixed access lines as of March 31, 2004.
Global and corporate
Global and corporate customers comprise over 200 of South Africa's largest financial, retail, manufacturing and mining companies with domestic and international operations as of March 31, 2004. Global and corporate customers accounted for approximately 15% of our total fixed line operating revenue, excluding directories and other revenue, in the year ended March 31, 2004 and approximately 12% of our total fixed access lines as of March 31, 2004. We have increased our sales and marketing efforts aimed at our large global and corporate customers in order to continue to improve customer loyalty. We offer tailored packaged solutions and seek to enter into long-term relationships with our
59
global and corporate customers in order to maintain our leadership position in this customer market. We market and sell our products and services to these customers primarily through corporate account managers, supported by a team of specialists in the field of pre-sales consulting, project management and post-sales service managers.
Business and government
Business and government customers comprise approximately 550,000 large, medium and small business and governmental accounts as of March 31, 2004. Government customers, including certain Government owned parastatal companies, accounted for approximately 9% of our total fixed-line operating revenue, excluding directories and other revenue, in the year ended March 31, 2004 and approximately 4% of our total fixed access lines as of March 31, 2004. We separately target the top 500 business customers within this category. We also offer tailored packaged solutions and seek to enter into long term relationships with our customers in this category. In addition, we established a customer relation unit to focus on retaining business customers. We market and sell our products and services to these customers primarily through customer account managers and representatives, the Telkom Business Call Center and customer service branches. As of March 31, 2004, we had approximately 135 customer service branches located throughout South Africa to assist our business customers in finding the products and end user equipment that best fits their needs. We have seen increased demand for value added products by our business segment in the year ended March 31, 2004, such as Teleconferencing, SmartAccess and Intelligent Call Forwarding. In the 2004 financial year, we have been successful in signing our business customers to long term service agreements. We have also been successful in growing our PBX and ADSL products and services.
Wholesale
Wholesale customers comprise mobile operators, domestic licensed network operators, international operators and service providers and domestic value-added network service providers. We expect wholesale revenue from domestic operators to increase with the entrance of the second national operator and the further liberalization of the South African telecommunications industry. Products sold to wholesale customers primarily include mobile and international voice termination services, data services and international transiting services. We also provide internet protocol services to internet service providers. We are currently focusing on developing wholesale products that cater to the needs of a more liberalized fixed-line market in terms of the second national operator and the underserviced area licensees in South Africa by providing interconnection and facilities leasing. We are also expanding our wholesale product portfolio to go into non-traditional markets outside of South Africa. Our marketing and sales strategy for the wholesale services market is to be the carrier of choice for other operators and the connectivity provider of choice for domestic and other African service providers. We believe our digital network both in South Africa and in our international undersea cables provides a solid foundation from which we can leverage these services. We continuously revisit destinations for wholesale voice termination services. We intend to focus on expanding our relationships with international operators and further increasing the penetration of our transiting and connectivity services to international operators, including other African operators, for traffic into and out of Africa.
Residential customers
Residential customers comprise both prepaid and postpaid residential customers using PSTN, ISDN and ADSL services. Residential customers accounted for approximately 25% of our total fixed-line revenue, excluding directories and other revenue, in the year ended March 31, 2004 and approximately 54% of our total fixed access lines as of March 31, 2004. Prepaid residential customers accounted for approximately 33% of our residential fixed access lines as of March 31, 2004.
60
We are seeking to compete in the residential market by offering communications packages focused on improving convenience and security to enhance consumers' lifestyles, while at the same time increasing revenue per customer. We intend to continue to introduce calling plans that target high use customers and are designed to increase consumers' value for money. We conduct extensive advertising campaigns aimed at educating residential customers about our tariffs and price advantages. We market and sell our residential products through our customer call centers, customer service branches, mobile vans, Vodacom's customer service branches, the South African Post Office, independent distributors and vendors and through telemarketing. We are focused on increasing the penetration of our ISDN and ADSL services to retail and high-end residential customers through targeted direct advertising to high internet usage subscribers. We have grown our consumer ISDN channels by more than 50% and TelkomInternet subscribers by more than 40% in the 2004 financial year. In the 2004 financial year, we also have implemented free reconnect services for customers who move from one location to another provided they reconnect within 3 months. We also grant a 50% discount to customers ordering a second line.
Payphone customers
Payphones comprise our public and private payphone units. Payphones accounted for approximately 3% of our total fixed-line revenue, excluding directories and other revenue, in the year ended March 31, 2004 and approximately 4% of our total fixed access lines as of March 31, 2004.
In order to increase sales in our payphone services business, we seek to provide easy access to our services through the effective placement of our phones and phonecard outlets in high traffic areas. Our key focus area is the premier market, which includes municipalities, prisons, gas stations, shopping malls, taxi stands, bus stops and train stations. In furtherance of this goal, we target and enter into nationwide contracts with multi location telephone providers to ensure wider distribution of our payphones. We market and sell our payphone products through our sales managers and representatives and sales call centers. In order to improve efficiencies in public services and telephony, Telkom implemented a quality management system in compliance with the South African Bureau of Standards (SABS) ISO9001:2000 standards, which was certified by the South African Bureau of Standards in 2003. The aim was to develop products and services based on these quality standards in an effort to grow and improve public telephony revenues and create a customer relations center. Telkom's aim was also to provide a "one-stop-shop" for support to all our customers.
Customer care and service
Customer care is one of our top priorities. We offer a number of customer care initiatives tailored to our different customer segments. We allocate service managers to each of our global and corporate customers, who are responsible for ensuring that all new installations and repairs are performed in a satisfactory and timely manner. In addition, we have established a corporate customer call center in Cape Town for our global and corporate customers, capable of making minor infrastructure changes from a single location. We also use professional program managers to manage the implementation of complex network solutions. We offer service level agreements on a number of our existing data communications products where technology allows us to do so and our goal is to introduce service level agreements on all new data communications products in the future. We confer VIP status on each of our global and corporate customers and other selected customers that allows them direct access to key people within our organization to ensure quick resolution of any problems they may have regarding our products and services.
We initiated an ambassador program in 2000 for our medium and small business customers. Under this program, participating managers each adopt a few business customers and act as a single point of contact for those customers in the event of any problems with our products and services. In addition, our Telkom Business Center provides customer support for our medium and small business customers.
61
We also offer service level agreements for our data communications products to our medium and small business customers. We offer a broad range of internet based customer care tools. We operate, for example, an e-mail service center where our customers can contact and receive responses from our customer service representatives by e-mail. We also provide a website with answers to frequently asked questions, service bulletin boards and tools to change passwords and other personal data on line. In addition business customers also have the option to receive their bills electronically through Telkom Online Bill.
We also provide our customers with a free SMS payment reminder where a cellular phone number is provided to avoid suspending of late paying customers.
In May 2003, Telkom, together with Standard Bank SA, introduced a new PrepaidFone electronic voucher recharge service that enables customers to purchase recharge vouchers at automated teller machines 24 hours a day, seven days a week. We have also extended this program to First National Bank, ABSA and Vodacom.
Network
Network quality
The improvements in customer service that we have made have been facilitated by our investments in our national network operations center and our new data center. These investments have increased our ability to identify and anticipate future customer needs more rapidly and to provide the appropriate solutions and services. In order to take advantage of economies of scale in scheduling, we have consolidated our six voice installation and fault management centers into two centers to address faults, installation and service appointment scheduling and have consolidated our six data installation and fault management centers into two centers.
62
The following table sets forth information regarding our installation and repair times and service quality during the periods indicated. We have changed the measurements of the installation measures for ISDN, 2Mb data and subrates as of March 31, 2004 from a mean to an average calculation.
| | Year ended March 31, | ||||||
|---|---|---|---|---|---|---|---|
| | 2004 | 2003 | 2002 | ||||
| Installation | |||||||
| Average time to install residential voice (days) | 8 | 9 | 8 | ||||
| Average time to install business voice (days) | 4 | 2 | 5 | ||||
| Average time to install corporate voice (days) | 2 | 0.4 | 3 | ||||
| Average time to install ISDN (days)(1) | 16 | 15 | 31 | ||||
| Average time to install 2Mb data (days)(1) | 20 | 26 | 35 | ||||
| Average time to install subrates data (days)(1) | 14 | 20 | 23 | ||||
Repair | |||||||
| Average time to repair business voice (hours) | 14 | 13 | 16 | ||||
| Average time to repair corporate voice (hours) | 7 | 7 | 14 | ||||
| Average time to repair 2Mb leased lines (hours) | 3 | 3 | 3 | ||||
| Average time to repair subrate leased lines (hours) | 4 | 4 | 6 | ||||
Service measures | |||||||
| Number of residential faults per 1,000 lines | 476 | 482 | 528 | ||||
| Number of business faults per 1,000 lines | 234 | 242 | 265 | ||||
| Number of faults per 1,000 subrates | 880 | 847 | 919 | ||||
| Number of faults per 1,000 2Mb | 498 | 669 | 925 | ||||
| Percentage of coin payphones in service (percentage) | 96 | 96 | 95 | ||||
| Percentage of card payphones in service (percentage) | 98 | 98 | 98 | ||||
- (1)
- In the 2004 financial year, we revised the calculation of the installation measures for ISDN, 2Mb data and subrates data from a mean to an average calculation. Calculated on the original basis, the average time to install ISDN, 2Mb data and subrates data in the 2004 financial year would have been 12, 19 and 17 days, respectively.
63
Overall, we have significantly improved installation and repair times and service quality, however, our fault rates have been adversely affected by theft and vandalism primarily in the year ended March 31, 2002. We have introduced a number of efforts to curb theft and vandalism, including the introduction of alarms, security patrols and other technologies. In 2003 and 2004, we have continued with the implementation of a number of additional measures to combat theft, including the concrete encasing of copper cable routes, installation of security manhole lids, burying cables, constructing new overhead optic fiber and upgrading existing copper routes with technology less prone to theft. As a result of our focus to reduce theft and vandalism we have seen an approximately 28% reduction in incidents in the 2004 financial year.
Infrastructure and technology
In 1997, we embarked on an extensive five year capital investment program in our fixed-line business. Our total fixed-line investment for the five years ended March 31, 2002 was R41.7 billion ($6.6 billion), of which R27.9 billion ($4.4 billion) was for network modernization and line roll out in order to comply with our license obligations and prepare for competition. Our five-year line roll-out program in our fixed-line business was largely completed in 2002. We spent approximately R3.9 billion ($617 million) on fixed-line capital expenditure in the year ended March 31, 2004.
As of March 31, 2004, we had approximately 4.8 million telephone access lines in service. As a result of the line roll-out targets contained in our license, customer migration to mobile services and disconnections due to customer non-payments, as well as lower connections primarily in the year ended March 31, 2003, we have excess capacity on our fixed-line network. We plan to use this capacity where possible to expand our prepaid services. Our strategy is to increase the number of access lines on our network by selectively expanding our network in economically viable areas where projected revenue exceeds the cost of construction.
The following table sets forth information related to the digitalization and upgrade of our network at the dates indicated.
| | As of March 31, | |||||||||||||
|---|---|---|---|---|---|---|---|---|---|---|---|---|---|---|
| | 1998 | 1999 | 2000 | 2001 | 2002 | 2003 | 2004 | |||||||
| Digitalization (percentage of lines) | 82.0 | 92.5 | 99.0 | 99.6 | 99.8 | 99.8 | 99.9 | |||||||
| ATM switches | — | 45 | 116 | 129 | 195 | 197 | 189 | |||||||
| Digital exchange units | 3,019 | 3,512 | 3,697 | 3,894 | 4,083 | 4,292 | 4,321 | |||||||
National network operations center
In 2000, we opened a state-of-the-art national network operations center, capable of monitoring our core network and coordinating and dispatching core network repair personnel from one control point based at our Techno Park in Centurion, Pretoria. Our national network operations center enables us to be more proactive in anticipating, localizing and isolating problems, such as congestion and cable breaks, so that they can be corrected promptly. It has a 120 meter wide video wall providing an up to the minute, real time visual summary of the status of our entire network. Our national network operations center includes an emergency restoration and control center that manages all network failure restorations. Network service management specialists are able to obtain up to the minute information from this center in order to proactively update global and corporate customers who have services affected by any major network failure, including voice and data network services.
Switching network
An important part of our fixed-line network modernization program has been switch digitalization. As of March 31, 2004, 99.9% of our telephone access lines were connected to digital exchanges. Switch
64
digitalization has made our network more efficient and has enabled us to offer new value-added voice and data services, including caller line identification, electronic call answering and the provisioning of innovative billing systems. We have converted our switching network infrastructure from a four-tier architecture that historically was based on analog switching technology to a two-tier structure based on large capacity digital switches. The upper, or primary, tier is used for the switching of long distance and international traffic and the lower, or secondary, tier is used for the switching of regional and local traffic.
The primary tier consists of eight switching centers and two international switching centers. Each of the switching centers includes two switches for redundancy purposes and in order to handle larger volumes during peak times. Each of the primary switching centers is interconnected by at least two self healing diverse routes. Interconnection between our network and the networks of the three South African mobile operators takes place at primary level switches in the main centers. Two international telephone switching centers serve as the international gateways. Secondary switching centers are connected to the primary switching centers by at least two self-healing diverse routes. Each secondary switching center includes one switch with internal redundancy mechanisms.
Transmission network
A priority of our investment program has been to make our transmission network more resilient. We have enhanced our transmission network's resiliency through the deployment of synchronous digital hierarchy managed self healing optical fiber rings.
As a result of our efforts, the overall number of fault reports per 1,000 subrates has decreased 4.2% in the past three years from 919 as of March 31, 2002 to 880 as of March 31, 2004. The number of fault reports per 1,000 business lines has decreased 11.7% in the past three years from 265 in the year ended March 31, 2002 to 234 in the year ended March 31, 2004.
Our national transmission network comprises a synchronous digital hierarchical and wave division-multiplexing network. Both the primary and the secondary tier consist of interlocking self healing rings, which provide a dual path to each connection point. The primary tier consists of eight rings, while the secondary tier consists of 470 rings. The synchronous digital hierarchy network, with its network management capability, provides for faster provision and modification of service, improved grade of service and lower maintenance costs. Telkom is investing in additional capacity to meet requirements for growth in data traffic and leased lines.
Access network
Access for our PSTN and data communications network is primarily via copper. Fiber in the loop has been deployed in the form of optical fiber distributed concentrators and digital line concentrators as well as fiber to mainly corporate customer sites. Telkom is deploying additional access network infrastructure to enable the provisioning of ISDN and ADSL services on demand. In addition, Telkom is focusing on the rehabilitation of its existing access network infrastructure to improve the reliability of its network.
Asynchronous transfer mode network
We have rolled out an asynchronous transfer mode network to deliver broadband services to global and corporate customers. We plan on migrating all of our data networks onto our asynchronous transfer mode network. As of March 31, 2004, we had 189 switches in our asynchronous transfer mode network. The present available bandwidth between the core switches on our asynchronous transfer mode network is 105 STM-1s or 15.7 Gbit/s, while the available bandwidth between the core switches and the services access switches is 320 STM-1s or 47.9 Gbit/s. Access to our asynchronous transfer mode network is primarily provided via fiber.
65
Public broadband internet protocol network
Our public broadband internet protocol network comprises a three tier hierarchical network consisting of eight core sites, 16 edge sites and 63 access locations, including over 20,300 modems with an estimated dial up base of greater than 370,000 customers, including Telkom and other internet service providers. Our internet protocol network is powered by Cisco equipment.
We introduced ADSL as a new access technology in August 2002 for our internet protocol network. The ADSL rollout has been designed to provide maximum coverage in terms of prospective ADSL customers. Our ADSL footprint consisted of 312 digital subscriber line access multiplexers, covering 61% of our exchanges serving 20,313 customers as of March 31, 2004, an increase from 2,669 customers as of March 31, 2003. This network is managed from our national network operations center.
Voice over internet protocol network
Our voice over internet protocol network terminates calls of international voice carriers into our fixed-line network. The network can terminate 52 media gateways, or 25,200 voice circuits. Our voice over internet protocol network is presently transit switching voice over internet protocol calls to ten African countries. The media gateways compress the traditional voice channels of 64 kbit/s to 8 kbit/s channels thus enabling us to reduce the cost of international calls.
International connectivity
We offer international connectivity from two international switching centers to terrestrial, satellite and submarine cable routes. The satellite earth station is situated at Hartebeeshoek, west of Pretoria. Further international connectivity has been provided with the deployment of very small aperture terminals and other satellite transmitters located at strategic locations throughout the country.
We have investments in three cable systems connecting Africa and international destinations. A submarine cable system, SAT-2, exists between Cape Town and Europe. We are the largest capacity owner on the SAT-2 submarine cable system with the right to use approximately 65% of the combined capacity. Consistent with our strategy of increasing international carrier traffic on our network, we have invested approximately $85 million in the SAFE and SAT-3/WASC submarine cable systems that were introduced into service during 2002. The cable systems provide fiber optic connectivity between South Africa and international destinations. These cable systems utilize the latest technology available in order to provide improved high speed voice, data, video and other on demand high bandwidth services and have increased fiber optic bandwidth between Europe and Africa significantly. We have the right to approximately 20% of the combined capacity on the SAFE and SAT-3/WASC submarine cable systems, making us the largest capacity owner in these cable systems out of the 36 telecommunications operators who have invested over $650 million in these cables. We believe we are uniquely positioned to exploit the synergies between our extensive fixed-line network in South Africa and our investments in these cables in order to become the communications hub of Africa. The length of the SAFE cable is approximately 13,100 km and the SAT-3/WASC is approximately 14,300 km.
Information technology/operations support systems
The quality of our operations support systems, which store, manage and analyze essential business information, is critical to the success of our business. Our operations support systems permit us to make timely and informed business decisions and respond to our customers' needs with tailored solutions. We have dedicated significant resources to the design and implementation of our new operations support systems based on a comprehensive and well defined information technology strategy.
In 2000, we opened a new data center called Technopark in Centurion, Pretoria in order to improve internal information technology service levels and offer external internet and related services
66
such as managed data center hosting services. The center is safeguarded by state of the art environmental and security systems capable of performing maintenance without impacting service or availability. The complex houses a 2,100 square meter data center and over 9,000 square meters of usable office space and includes a twenty four hour command / operations center. The command center contains a large video wall that enables operational and customer personnel to keep abreast of the current state of our information technology infrastructure twenty four hours a day.
The data center has been leveraged to include both our internal support systems and our external hosted offerings. Telkom has a business continuity and disaster recovery plan utilizing both its Centurion and its sister data center site in Bellville locations for redundancy purposes. Both operations can be monitored and operated from either location via service management tools and critical systems have data transferred between these sites for rapid disaster recovery should it be necessary. In addition to the growth and leveraging of operational functionality, the power support systems have been upgraded to add one more level of environmental redundancy. This redundancy is shared between the data center and the new national business solutions center building to reduce cost.
67
In June 2003, Telkom officially inaugurated a center known as the national business solution center. This center was built alongside the national network operations center and the data center providing Telkom with a centralized information technology backbone. The national business solutions center was commissioned and eleven of our external hosting clients have been relocated into this building for hosting and support. Both the data center and the national business solution center are operated from a command center and now provides an additional 3,000 square meters of computer room space designed to the same specifications as our primary data center requirements. In addition, this new facility gives Telkom the ability to provide high availability configurations that are split between both buildings for redundancy purposes. Network reliability has also been enhanced by creating a totally redundant, shared network environment between the data center, the national business solution center building and the national network operations center. Our retail billing systems have been upgraded. In 1999, the Amdocs guiding, rating and error management modules were implemented and in June 2001, the Amdocs Accounts Receivable module was implemented for voice services. We have also replaced our data billing system to facilitate the billing of more complex price plans. A new wholesale/interconnect billing process was implemented in 1999. In addition, we implemented a fraud management system during 2000, to detect network and subscription fraud. During the 2003 financial year we implemented a new data product system, Intercare, and integrated it with our billing system to improve costs and internal controls. In September 2002, we completed a project to standardize our desktop personal computer and workgroup infrastructure designed to increase efficiencies and decrease operational costs.
Telkom is currently in the process of implementing a number of management information and other operating systems, which are expected to continue in order to respond to the increased liberalization of the South African telecommunications industry. These systems include an initiative aimed at providing an automated mechanism to manage and optimize the workforce, a provisioning/fulfillment system designed to manage the end-to-end delivery of products and services, a customer assurance system designed to track and resolve customer service problems and a customer care system designed to better manage customer relationships. The first phase of the workforce management system was complete in the 2004 financial year.
Competition
We expect that increased competition from the liberalization of the South African communications market could result in decreased tariffs and loss in market share that could negatively impact our results of operations and growth. However, we expect competition also to stimulate overall market demand for communications services.
We had the exclusive right to provide public switched telecommunications services in the Republic of South Africa, including international telephone services, until May 7, 2002, but for a number of years we have competed with mobile operators and value-added network operators in connection with the provision of other services. ICASA issued an international carrier of carriers license and multimedia license to Sentech Limited in May 2002. Sentech Limited is wholly owned by the Government of the Republic of South Africa and is a provider of broadcasting signal distribution services on the African continent. In addition, on December 18, 2003, the Minister of Communications announced that she would grant a license to a second national operator that will be 30% owned by two entities beneficially owned by the South African Government, 19% owned by a black economic empowerment consortium and 26% owned by two other consortiums, with the remaining 25% of the second national operator being held by the Government for sale to a strategic equity investor to be identified in the future. The Minister of Communications has indicated that she expects ICASA to issue the second public switched telecommunications services license in 2004. A process has also commenced to issue additional licenses to small business operators to provide telecommunications services in areas with a teledensity of less than 5%. ICASA has submitted its recommendations to the Minister of Communications for the
68
granting of licenses to successful bidders in seven of the ten areas in which licenses could have been issued. The Minister of Communications granted licenses to four successful bidders on June 3, 2004 and it is expected that these licenses will be issued in 2004. The South African Telecommunications Act, 103 of 1996, requires the Minister of Communications to conduct an assessment of the feasibility of issuing additional licenses from May 2005.
We also compete with Vodacom, our 50% owned joint venture, MTN, and Cell C, the three existing mobile operators, for telephone customers and for corporate mobile carrier services. In addition, we compete with other service providers who use least cost routing technology that enables fixed-to-mobile calls from corporate private branch exchanges to be transferred directly to mobile networks. As a result of increasing competition, the main challenge we face is continuing to improve customer service and loyalty and maintaining our leadership in the South African telecommunications market during liberalization.
We compete primarily on the basis of customer service, dependability and price in those areas where we currently face competition and where we expect to compete for public switched telecommunications services in the future. We intend to introduce new products and services and tariff structures with the aim of gaining additional revenue and increasing current revenue generated from existing products.
In addition, we compete with other telecommunication services providers in those areas that are fully liberalized, such as the provision of value-added data network services. The entry of multinational corporations to South Africa is expected to be a further incentive for global communications operators, which already service these corporations abroad, to establish or enhance their presence in South Africa.
Procurement
We utilize a transparent multi disciplined approach to purchasing and supplier management in order to ensure that we receive the best products and services from reliable suppliers at the best overall price. We have established cross functional sourcing teams staffed with individuals from different areas of our organization to evaluate and make recommendations on large bids, which, depending on size, require the further approval of our executive committee and notification to our board of directors. Bid requests are published in our weekly tender bulletin and on our web site. We are required to adopt affirmative procurement policies that favor historically disadvantaged suppliers. We seek to utilize at least two suppliers for all critical equipment where possible in order to minimize supply risk. In the year ended March 31, 2004, our top twenty suppliers accounted for approximately 58% of all purchases and our main supplier was Total Facilities Management Company, which accounted for approximately 17% of all expenditure.
Mobile Communications
Overview
We participate in the South African mobile communications market through our 50% interest in Vodacom. Vodacom is the largest mobile communications network operator in the Republic of South Africa with an estimated market share of approximately 54% as of March 31, 2004 based on total estimated customers. In addition, Vodacom has investments in mobile communications network operators in Lesotho, Tanzania, the Democratic Republic of the Congo and Mozambique.
Vodacom's other shareholders are:
- •
- Vodafone, the world's largest mobile telecommunications company, that beneficially owns 35% of Vodacom; and
- •
- VenFin that beneficially owns 15% of Vodacom.
69
South Africa
Vodacom had approximately 9.7 million customers in South Africa as of March 31, 2004. As of March 31, 2004, Vodacom's 5,713 base stations were capable of reaching approximately 43 million people in South Africa, representing approximately 95% of the country's population based on the last official census conducted in 2001 and approximately 65% of the total land surface of the country. The estimated penetration rate for mobile communications in the Republic of SouthAfrica has increased to 39.0% as of March 31, 2004 from an estimated 2.4% as of March 31, 1997.
Vodacom offers mobile communications services based on GSM technology. Vodacom was granted a mobile cellular telecommunications license in South Africa in September 1993 and commenced service in June 1994. This mobile cellular telecommunications service license was confirmed and reissued in August 2002 pursuant to the Telecommunications Act, 103 of 1996.
Products and services
Vodacom offers a wide range of mobile voice and data communications products and services, including value-added services such as caller identification, call forwarding, call waiting, voice-mail, entertainment, information and commerce services, short messaging services, multimedia messaging services, mobile internet access, fax services and twin call services, which enable customers to use two mobile phones under the same number. Vodacom's services also include the sale of handsets. Vodacom has a record of innovation as the first mobile communications network operator in the world to offer prepaid mobile communications services on an intelligent network platform and to offer its customers coverage across the whole of Africa where commercial GSM roaming is available. Vodacom was also the first mobile communications network operator in South Africa with nationwide coverage. In the 2004 financial year, Vodacom launched Call Sponsor and SMS-only roaming and promotional offerings such as MMS and SMS bundles. Vodacom's Call Sponsor offering enables contract customers to sponsor the calls of up to three prepaid customers. The Top Up package, which combines the benefits of a contract service with the financial control offered by a prepaid service, was also a successful launch during the 2004 financial year. Vodacom launched "My Life," in October 2002, offering 24-hour internet access, photo messaging and text messages of unlimited length by blending together GPRS and MMS technologies. Vodacom has access to Vodafone's extensive research related to its products, services and technology, including its international benchmarking studies. In the future, Vodacom will continue to focus on offering premier interactive voice response, premium short messaging services, general packet radio services, multimedia services and fixed-to-mobile products.
Contract subscription services
As of March 31, 2004, 14.6% of Vodacom's South African customers were contract customers. Contract subscription is typically for an initial 24-month contract. Vodacom offers contract customers a range of mobile service packages designed to appeal to specific customer segments. Vodacom offers two broad categories of contract subscription packages, leisure packages, such as Weekend Everyday for residential customers, and business packages, such as Business Call for business customers.
The monthly subscription and call charges vary with each of the packages. All contract packages make available voice, fax and data services, voice-mail, caller identification, call forwarding, call waiting and short message service capabilities. Depending on the contract package, customers either pay a fixed monthly charge and receive a set number of free minutes or pay a monthly subscription for access plus a per minute or per second fee. In addition, Vodamail Executive is available to all contract packages on request. This is an integrated voice and fax mailbox that offers features such as Faxmail, group distribution list and voice-mail messaging.
70
Prepaid services
As of March 31, 2004, 85.2% of Vodacom's South African customers were prepaid customers. Vodacom has two prepaid products, Vodago and 4U. In November 1996, Vodacom launched Vodago, a prepaid, no contract, no credit, mobile communications service based on the Siemens Intelligent Network platform. Since its introduction, Vodago has experienced rapid growth and has been a significant element in the growth of Vodacom's mobile customer base. In October 2001, Vodacom launched 4U, a new prepaid per second billing product targeted at the youth market who have higher usage of SMS and a need for per second billing. Since its inception, the number of 4U subscribers has increased significantly and as of March 31, 2004, approximately 67.9% of Vodacom's prepaid customers were 4U customers. Vodago and 4U provide instant access to the Vodacom network and enable low volume customers to control mobile telephone costs based on usage because there are no long term contracts. Fax and certain data services are not available to Vodago customers. Vodacom offers seven prepaid vouchers, ranging from R29 worth of airtime value and a 90 day usage time window to R1,100 worth of airtime value and a 365 day usage time window. Remaining airtime value and time window are accumulated provided the customer recharges a voucher before the time window expires. The accumulated time window cannot exceed 24 months. Vodacom also offers a voucher that entitles customers to receive unlimited incoming calls for 365 days. This voucher does not entitle the customer to make outgoing calls, but can be combined with other vouchers that entitle the customer to make outgoing calls as well as accumulate airtime.
A wide variety of retail outlets, such as handset dealers, gas stations, tobacco shops and post offices, sell recharge vouchers for Vodacom's prepaid customers. Recharging can also take place electronically and through the use of banking networks. Because prepaid customers pay in advance for their mobile service, the risk of bad debts is eliminated and the risk of fraud is substantially reduced. In addition, prepaid services provide cost savings to Vodacom as bills do not need to be sent to prepaid customers and handsets for prepaid customers are not subsidized. There are less service offerings for the prepaid mobile communications market than there are for the contract base market. Following the launch of 4U, Vodacom is continuing to implement initiatives to expand its prepaid mobile communications service offerings and to gain a greater understanding of its prepaid customer base and its requirements.
Community services
In 1996, Vodacom, jointly with Siemens and Psitek, developed community telephone units that are installed throughout communities either on an individual basis or grouped in a container with the Vodacom brand. Community service phones are purchased by local entrepreneurs who resell community phone services. Community service phones are preloaded with airtime and can be recharged electronically by telephone shop operators when the airtime on the phone expires.
The demand for community service phones has been strong since its introduction. Vodacom had deployed approximately 24,767 community service phones as of March 31, 2004, exceeding its aggregate license target of 22,000 community service phones. The development of community service phones has made it possible to provide mobile access to the more than 20 million South Africans who live in communities where there is less than one telephone line per hundred people and have improved the quality of life for many South Africans who previously had no access to telecommunications. Community service phones have also been a cost effective method of significantly increasing traffic revenue on Vodacom's network due to their low roll-out costs to Vodacom and low barriers to entry for customers. Community service phones generated ARPUs of more than 12 times Vodacom's average overall ARPUs in the year ended March 31, 2004. Vodacom intends to appropriately adopt its business model for community service phones in its other African operations.
71
Value-added mobile voice and data services
Vodacom offers an extensive portfolio of value-added mobile voice and data services, including caller identification, call forwarding, call waiting, voice-mail, entertainment, mobile information and commerce services, short messaging services, mobile multimedia services, data services, mobile internet access, fax services and twin call services, the latter of which enable customers to use two mobile phones under the same number. Vodacom has experienced substantial growth in the use of its value-added voice and data services, resulting in increased traffic revenue on its network. Short messaging services were the key contributor to Vodacom's R1.0 billion and R654 million of data revenue in South Africa in the years ended March 31, 2004 and 2003, respectively. Vodacom transmitted approximately 2.0 billion short messaging services over its network in the year ended March 31, 2004, up from approximately 1.5 billion and 911 million in the years ended March 31, 2003 and 2002, respectively.
In the 2004 financial year, Vodacom revised the presentation of its operating revenue to include data revenue, which was previously included in airtime revenue, as a new line item in its financial statements. Data revenue contributed 4.4% of Vodacom's total mobile network service revenues in the year ended March 31, 2004, up from 3.3% in the year ended March 31, 2003 and 2.8% in the year ended March 31, 2002. However, Vodacom believes that more sophisticated mobile messaging data and internet services are still in their infancy, with broad application hampered by low transmission speeds. Vodacom expects that the broad introduction of "always on" faster response and generally higher speed packet-switched data services, such as GPRS and universal mobile telecommunications system, or UMTS, will provide the platform for future value-added services. Vodacom launched MyLife, its MMS and GPRS network service, on October 17, 2002, Office Anywhere in August 2003, Look4me in February 2004 and Look4it in March 2004.
Handset sales
Service providers offer handsets for sale at subsidized prices to contract customers depending on the airtime and tariff plan and type of handset purchased. Vodacom purchases handsets at current market prices. Mobile users may use any handset on the Vodacom or any other network if the handset contains a sim-card for Vodacom or the other network. No modifications, other than the replacement of the sim-card, are required to utilize handsets on either the Vodacom or other mobile communications network operators' networks, unless the handset is network locked. During 2002, Vodacom began network locking lower-end handset sales for some of its prepaid products, such as those sold with subsidized starter-packs, as it had done for a small number of handsets sold prior to April 1999. Handset sales for the 2004 financial year exceeded 2.1 million units, a year-on-year growth of approximately 40.5% and 37% from the 2003 and 2002 financial years, respectively.
We anticipate that sales of camera phones with higher colour resolution and camera technology, with increased memory capacity, will increase in the future. We also believe that smartphones and personal digital assistant, or PDA, devices with GSM technology built-in, will become more readily available in the future years.
Interconnection services
Vodacom provides interconnection services to the other two South African mobile operators, our fixed-line business, Sentech and to the local operators in each of the African countries in which Vodacom operates. Vodacom will also provide these services to the second national operator and other South African communications licensees when they commence operations.
National roaming services
Vodacom concluded a fifteen year roaming agreement with Cell C, effective November 1, 2001. This roaming agreement enables Cell C to provide national coverage to its customers, by allowing the
72
routing of calls over Vodacom's mobile communications network. The new Cell C national roaming agreement has been amended to allow for continuous roaming in certain urban areas.
International roaming services
International roaming enables Vodacom's contract customers to make and receive calls with their mobile telephones in countries using the networks of operators with whom Vodacom has entered into international roaming agreements. As of March 31, 2004, Vodacom had international roaming agreements with 249 mobile communications network operators in 132 countries. In the fourth quarter of 1998, Vodacom became the first South African mobile communications network operator to sign a digital GSM roaming agreement with an American mobile communications operator and in November 2002, it provided complete roaming coverage of the African continent where commercial GSM roaming is available. Vodacom also receives revenue from its roaming partners for calls made in South Africa by their customers.
Customers
Vodacom has experienced substantial growth in its mobile customer base since its inception in 1994. As of March 31, 2004, there were an estimated 18.1 million mobile communications customers in South Africa, which represents an estimated penetration rate of 39.0% of the population. As of March 31, 2004, Vodacom estimated that its customers represented approximately 54% of South African mobile communications customers making Vodacom the leading mobile communications network provider in South Africa based on total estimated customers.
The following table sets forth customer data for Vodacom's mobile communications services in the Republic of South Africa as of the dates indicated.
| | As of March 31, | | | ||||||||
|---|---|---|---|---|---|---|---|---|---|---|---|
| | 2003/2002 % change | 2004/2003 % change | |||||||||
| | 2002 | 2003 | 2004 | ||||||||
| South Africa: | |||||||||||
| Customers (thousands)(1) | 6,557 | 7,874 | 9,725 | 20.1 | 23.5 | ||||||
| Contract | 1,090 | 1,181 | 1,420 | 8.3 | 20.2 | ||||||
| Prepaid | 5,439 | 6,664 | 8,282 | 22.5 | 24.3 | ||||||
| Community services | 28 | 29 | 23 | 3.6 | (20.7 | ) | |||||
| Total inactive mobile customers (%) (at period end)(2) | 13.9 | 18.2 | 17.6 | 30.9 | (3.3 | ) | |||||
| Contract | 3.8 | 5.3 | 5.7 | 39.5 | 7.5 | ||||||
| Prepaid | 15.9 | 20.5 | 19.7 | 28.9 | (3.9 | ) | |||||
| Gross connections (thousands) | 3,038 | 3,495 | 4,998 | 15.0 | 43.0 | ||||||
| Contract | 199 | 197 | 377 | (1.0 | ) | 91.4 | |||||
| Prepaid | 2,836 | 3,295 | 4,617 | 16.2 | 40.1 | ||||||
| Community services | 3 | 3 | 4 | 0.0 | 33.3 | ||||||
| Churn (percentage)(3) | 27.2 | 30.4 | 36.6 | 11.8 | 20.4 | ||||||
| Contract | 14.5 | 11.9 | 10.1 | (17.9 | ) | (15.1 | ) | ||||
| Prepaid | 30.1 | 34.0 | 41.3 | 13.0 | 21.5 | ||||||
- (1)
- Customer totals are based on the total number of customers registered on Vodacom's network, which have not been disconnected, including inactive customers, as of the end of the period indicated.
- (2)
- Vodacom's inactive customers are defined as all customers registered on Vodacom's network for which no revenue generating activity has been recorded for a period of three consecutive months.
73
- (3)
- Churn is calculated by dividing the average monthly number of disconnections during the period by the average monthly total reported customer base during the period, including inactive customers. See below for a discussion of when customers are disconnected from its network.
Vodacom's contract customers are disconnected when they terminate their contract, or their service provider who carries the credit risk terminates their contract due to non-payment. Prepaid customers were disconnected if they did not recharge their vouchers after being in time window lock for six months for periods prior to November and December 2002, for four months for periods from November and December 2002 until April 2003 and for three months from April 2003 until December 2003. Time window lock occurs when a customer's paid active time window, or access period, expires. In December 2003, Vodacom changed the deactivation rule for prepaid customers to align itself with European and industry standards. From December 2003, prepaid customers are disconnected from its network if they record no revenue generating activity within a period of 215 consecutive days.
Vodacom believes the significant year on year growth in customer numbers since inception is due primarily to historical pent up demand for basic voice telephone services, particularly in underserviced and rural, outlying areas of South Africa. Vodacom also attributes its growth to the launch of its prepaid services, which have enabled those that lack access to credit and steady income to obtain telephone service. Vodacom believes that its aggressive marketing campaign, the creation of strong distribution channels for Vodacom's products and services and the introduction of new value-added voice and data services have further fuelled growth. The significant year on year growth for the year ended March 31, 2004 was due to higher numbers of gross connections achieved and lower churn in the contract base, partially offset by increased churn in the prepaid base.
Vodacom expects that the number of contract customers in South Africa will eventually level off and that the number of prepaid customers in South Africa will continue to grow in the medium term driven by the continued demand for basic voice telephone services. Vodacom believes that mobile communications services provide a cost effective means of telephone services for customers in underserviced and rural, outlying areas. Vodacom's efforts will therefore continue to focus on growing customer numbers while carefully managing its existing customer base, marginal revenue per customer and customer related acquisition and retention costs. Vodacom, MTN and Cell C each provide connection commissions to service providers and dealers, or agents. These are often utilized by agents to subsidize handsets as an incentive for customers to switch operators to obtain a new handset and to reduce the cost of access. As a result, Vodacom focuses on keeping its contract churn rate low and retaining high value customers through focused handset upgrade policies and other retention measures, while continuously monitoring customer acquisition and retention costs. Vodacom also actively manages churn through customer relationship management systems, developing its own distribution and logistics capabilities and other retention initiatives. Prepaid customer churn is negatively affected by the high rate of unemployment in South Africa and the low cost of access.
Traffic
The following table sets forth information related to the traffic volume of Vodacom's customers in South Africa for the periods indicated. Traffic comprises outgoing calls made in South Africa and
74
abroad and incoming calls received by Vodacom's customers in South Africa, excluding national and incoming international calls.
| | Year ended March 31, | | | ||||||||
|---|---|---|---|---|---|---|---|---|---|---|---|
| | 2003/2002 % change | 2004/2003 % change | |||||||||
| | 2002 | 2003 | 2004 | ||||||||
| Total Traffic (millions of minutes) | 8,881 | 10,486 | 12,297 | 18.1 | 17.3 | ||||||
| Outgoing | 4,967 | 6,343 | 7,772 | 27.7 | 22.5 | ||||||
| Incoming (interconnection) | 3,914 | 4,143 | 4,525 | 5.9 | 9.2 | ||||||
Tariffs
Vodacom's tariffs are subject to regulatory scrutiny, and, in certain circumstances, approval of ICASA. The contract tariff packages are designed to appeal to leisure and business customers. Vodacom sets its contract subscription package tariffs utilizing a balanced mix of access and usage. For those tariff packages where voice usage is high, the per minute rate is lowered and the monthly subscription tariff is raised. For those packages where the voice usage is low, the per minute tariff rate is increased and the monthly subscription tariff is lowered. For those users where the monthly subscription tariff is a barrier to entry, Vodacom offers prepaid packages with no monthly subscription tariff, but sets the per minute voice tariff rate higher. Tariff rates for SMS messaging are based on the fact that lower cost channels are used to carry SMS traffic.
The following table sets forth selected tariff information as of March 31, 2004 for a leisure contract package, a business contract package and a prepaid package. Peak hours are weekdays between 7:00 a.m. and 8:00 p.m. Off peak hours are all other times and all day during public holidays. Tariffs for international calls vary according to the destination country of the call. In November 2001, Vodacom launched new products for its contract and prepaid packages where calls are charged in one second increments. The following tariffs for Vodacom's packages are charged in time units of one minute for the first minute and thereafter in units of 30 seconds. Vodacom's annual tariff increases
75
were lodged on May 12, 2003 and approved by ICASA on May 19, 2003. The average tariff increase is 5%, effective July 1, 2003.
| | As of March 31, 2004 | ||||||
|---|---|---|---|---|---|---|---|
| | Leisure(1) | Contract(2) | Prepaid(3) | ||||
| | (ZAR, including value-added tax) | ||||||
| Connection fee | 97.00 | 97.00 | — | ||||
| Monthly charge/subscription | 135.00 | 180.00 | — | ||||
| National calls (per minute) | |||||||
| Mobile-to-fixed peak calls | 2.70 | 1.76 | 2.85 | ||||
| Mobile-to-fixed off peak calls | 0.90 | 0.90 | 1.55 | ||||
| Mobile-to-mobile peak calls—own network | 1.80 | 1.76 | 2.85 | ||||
| Mobile-to-mobile off peak calls—own network | 0.90 | 0.90 | 1.55 | ||||
| Mobile-to-mobile peak calls—other networks | 2.75 | 2.30 | 2.85 | ||||
| Mobile-to-mobile off peak calls—other networks | 1.05 | 1.05 | 1.55 | ||||
| International calls (per minute) | |||||||
| Peak | 1.72+ Telkom peak | 1.72+ Telkom peak | 5.50, 7.50, 10.00, 12.50, 15.00 or 17.50 depending on zone | ||||
| Off peak | 0.90+ Telkom off peak | 0.90+ Telkom off peak | 5.50, 7.50, 10.00, 12.50, 15.00 or 17.50 depending on zone | ||||
| SMS per message | |||||||
| Peak | 0.80 | 0.80 | 0.80 | ||||
| Off peak | 0.34 | 0.34 | 0.34 | ||||
- (1)
- Tariff for "Weekend Everyday," Vodacom's contract leisure package. Vodacom's "Weekend Everyday" contract includes 120 free off-peak minutes per month. Calls are charged for the first 60 second increment and 30 second increments thereafter. As of March 31, 2004, "Weekend Everyday" customers accounted for 33.5% of Vodacom's total contract customers.
- (2)
- Tariff for "Business Call," Vodacom's contract business package. Vodacom's "Business Call" contract includes no free minutes per month. Calls are charged for the first 60 second increment and 30 second increments thereafter. As of March 31, 2004, "Business Call" customers accounted for 11.6% of Vodacom's total contract customers.
- (3)
- Tariff for "Vodago," Vodacom's standard prepaid package. Calls are charged for the first 60 second increment and 30 second increments thereafter.
Sales and marketing
Vodacom's sales and marketing strategy is split into two focus areas, marketing and brand building and sales and distribution. Vodacom's promotional strategy seeks to build a brand that is widely recognized by customers. Vodacom's advertising and promotion campaign is focused on television advertising and sponsorship of sporting and entertainment events.
76
The sale and distribution of Vodacom's products and services and the acquisition and retention of customers are performed by Vodacom's wholly owned subsidiary, Vodacom Service Provider Company (Proprietary) Limited, a company incorporated in the Republic of South Africa, and the other independent and exclusive service providers. In recent years, Vodacom has purchased a number of the previously independent service providers and consolidated its sales and distribution operations into Vodacom Service Provider Company. On March 1, 2004, Vodacom purchased 51% of Smartphone acquiring an additional 2.5 million prepaid customers and on April 16, 2004, Smartphone purchased an 85.75% equity stake in Smartcom acquiring an additional 40,000 contract customers. As a result of its acquisition of Smartphone, Vodacom directly controlled 65.3% of its total customer base, 70.6% of its contract customer base and 97.8% of its prepaid customer base in South Africa as of March 31, 2004.
77
In addition, Vodacom Service Provider Company seeks to enter into exclusive relationships with leading national retailers, wholesalers, dealers and franchisees in order to acquire and retain contract and prepaid customers. Vodacom utilized three exclusive service providers and three independent non-exclusive service providers as of March 31, 2004. As of March 31, 2004, 95.1% of Vodacom's total customer base, 76.5% of its contract customer base and 98.6% of its prepaid customer base in South Africa was managed by exclusive service providers or controlled directly by Vodacom as of March 31, 2004.
Vodacom currently targets four market segments, namely:
- •
- Corporate market—services to corporations and enterprises;
- •
- Developed market—services to customers in the higher income groups;
- •
- Developing market—services to customers in underserviced areas and lower income groups, who increasingly participate in the economy; and
- •
- Youth market—services specifically designed for the needs of the youth.
The more aggressive acquisition of customers and incentives in the 2004 financial year resulted in a larger customer base with associated improved revenues and profits but also resulted in margin pressure due to connection costs.
Since most customers in the developed market already have cell phones, Vodacom's objective in the short to medium term is to retain market share and attract new customers through attractive products. Loyalty and retention programs played an integral role in achieving this objective. Vodacom also expanded its contract customer base by migrating appropriate high-end prepaid customers to contracts in the 2004 financial year.
As of March 31, 2004, Vodacom's distribution network consisted of:
- •
- Vodaworld—A unique one stop mobile telecommunications mall, showcasing the latest technology in mobile hardware.
- •
- Dealers and franchises��1,586 company and independently owned mobile dealer and franchise outlets, including recently launched 4U stores
- •
- National chains—4,945 retail outlets.
- •
- Vodacom Direct—Vodacom's call center based selling division.
- •
- Corporate solutions—An extensive direct sales division within Vodacom which concentrates on the sale of contracts, data products and value-added services to businesses; and
- •
- Wholesale—A significant channel representing underserviced areas and street vendors.
Dealer incentives
Vodacom pays the following incentive commissions to its service providers and dealers:
Contract connection incentive commissions. These commissions are paid to service providers or dealers for the acquisition of new customers for all contract packages. A commission is paid to the service provider or dealer for each new activation.
Contract retention incentive commissions. These commissions are paid to service providers or dealers for the retention of all contract packages, excluding Vodacom 4U. The purpose of these incentives is to minimize customer churn.
Prepaid incentive commissions. These commissions are paid to service providers or dealers for the acquisition of new customers for all prepaid packages. A commission is paid to service providers or dealers for each new activation.
78
Distribution incentive commissions. These commissions are paid to service providers or dealers to maintain and increase their loyalty to, and exclusivity with, Vodacom. These incentives include exclusivity payments and advances to service providers in respect of purchases of assets for stores and providing distribution outlets with distribution subsidies to maintain the loyalty of distribution outlets through the stimulation of sales.
Handset incentive commissions. These incentives are offered by Vodacom to dealers for Vodacom sourced handsets provided to customers, which are recorded as a net against revenue.
Customer care
Vodacom services customer needs through a variety of channels such as call centers, walk-in centers which are now established in Cape Town, Durban and Midrand, interactive voice response, via e-mail and through Vodacom's web sites. Consequently, Vodacom has significantly improved its customer information systems and become increasingly proactive in developing relationships with its customers, particularly in the high revenue segment of the market. Vodacom is currently planning to establish more walk-in centers in other parts of the country.
Vodacom has developed a customer relationship management package that enables it to create a historical profile of customers so that customer information can be shared among the group and used in Vodacom's customer retention initiatives. Although customer focus has always been important to Vodacom, during the last three years customer relationship management has become a key strategic focus area and an important philosophy in Vodacom. The current year saw ongoing integration of support systems and staff training as part of improving this continuously challenging area. Vodacom strives to improve relationships with customers by understanding their needs, their likes, dislikes, how they use our products and how they would like Vodacom to interact with them. Vodacom reassures its performance through independent customer satisfaction surveys designed by Vodafone and conducted on a quarterly basis. Vodacom launched its Vodacom Customer Reward Program to recognize and reward for influential and high spending contract individuals, which it believes, has contributed to a very low churn in this sector.
In addition, Vodacom has undertaken a number of other initiatives, including the development of distribution and logistics capabilities to better service customers, called Vodacare. The Vodacare infrastructure consists of 26 branches and franchises in all the major centers providing walk-in customer support to Vodacom customers, and an advanced repair center hub for high-level repairs situated in Midrand. Vodacom believes that, with an average of 31,000 repairs per month, this dedicated customer service support infrastructure differentiates Vodacom's service from that of its competitors. During the 2004 financial year, Vodacom launched a new 48 hour swap program to further increase service levels. The primary focus is to manage and facilitate the process of putting the customer back on the air with as little interruption as possible and is achieved by using a combination of repairs, swaps, refurbished handsets, loan handsets, and managed repairs through third parties.
Vodacom plans to continue to invest in sophisticated information systems to facilitate the interface between operational support systems, administrative systems, billing systems, distribution systems and customer service systems. Vodacom believes that the new information systems will allow for the development of enhanced service management processes.
Vodacom's contract customers receive itemized bills and are encouraged to pay by direct debit transfer. Vodacom has a flexible billing system for corporate customers allowing it to offer multiple tariff rates, more customized billing information and GPRS services. Vodacom monitors its exposure to credit loss and customer fraud through a credit scoring system that evaluates potential contract customers. The evaluation process has led to decreases in contract customer churn rates and increases in the overall credit quality of its mobile customers. For its prepaid customers, Vodacom offers the option to recharge over the telephone using credit cards in order to make the recharge process quicker and easier.
79
Infrastructure and technology
Vodacom operates the largest mobile communications network on the African continent using digital GSM technology within the GSM 900/1800 frequency band based on total reported customers.
In South Africa, the network's core GSM infrastructure is characterized by mobile switching centers (including visitor location register, or VLR, and gateways), base station controllers, base transceiver stations, including transceivers and GPRS functionality across the network.
| | As of March 31, | |||||||||
|---|---|---|---|---|---|---|---|---|---|---|
| | 2000 | 2001 | 2002 | 2003 | 2004 | |||||
| Macro base transceiver stations | 2,977 | 3,401 | 3,670 | 3,906 | 4,158 | |||||
| Micro base transceiver stations | 1,221 | 1,292 | 1,380 | 1,487 | 1,555 | |||||
| Total | 4,198 | 4,693 | 5,050 | 5,393 | 5,713 | |||||
Prepaid services are supported by the same GSM technology as contract services. In addition, prepaid services utilize a network of intelligent network nodes and associated front-ends and mediation systems for a variety of interactive voice response and electronic recharging options, including commercial bank ATM and point of sale terminal recharging.
Vodacom's transmission network comprises more than 13,066 E1 links and 30 STM-1 link systems leased from Telkom, which are managed by a comprehensive digital cross-connect infrastructure. In addition, Vodacom operates an extensive data network for its internal requirements, based on internet protocol, point-to-point frame relay and X.25 services, which is supported by the cross-connect network and more than 50 packet/frame/circuit nodes.
This network enables Vodacom to provide value-added voice and data services supported by voice-mail platforms, short messaging service centers, a wireless application protocol platform, a mobile internet gateway platform supporting advanced SIM toolkit applications and an intelligent network platform.
Vodacom has designed its mobile communications network using scaleable technology in order to be able to increase capacity in an economic manner as demand dictates. The network is capable of providing a high level of service quality despite an extremely varied distribution of traffic, difficult terrain conditions and a complex regulatory environment. In the year ended March 31, 2004, Vodacom had a busy hour dropped call rate of 0.78% and call success rate of 98.6% in South Africa.
Vodacom intends to install additional base station controllers, micro base stations and micro base transceiver stations in order to increase capacity and improve network quality in areas where required. As of March 31, 2004, Vodacom had already installed dual band (GSM900/GSM1800) base transceiver stations in 574 locations, including 258 locations in Johannesburg, 180 locations in Pretoria, 68 locations in KwaZulu Natal, 43 locations in the Western Cape, 19 locations in the Eastern Cape and 6 locations in the Central region. In addition, all base transceiver stations in metropolitan areas have been upgraded with dual band antennas and feeder cables to accommodate GSM1800 equipment.
In the design of its network, Vodacom has paid careful attention to the needs of customers and to the environment by making an extensive effort to implement sites in the most discrete manner possible. Furthermore, attention has been paid to management of electromagnetic emissions to ensure compliance with recognized international environmental standards such as those developed by the International Commission on Non Ionizing Radiation Protection.
Vodacom has implemented a new billing system to allow for the billing of GPRS services, such as multi-media messaging services and other content-based services. Unlike traditional GSM services where calls are billed on a per second or per minute basis, customers utilizing GPRS services are billed according to the number of bytes of data sent or received.
80
Vodacom believes its 3G license will stimulate further growth in products and services to satisfy customer demand. As a result, during the 2005 financial year Vodacom intends to increase its capital spend in such areas.
Competition
The current South African mobile telecommunications market consists of three mobile communications network operators, Vodacom, MTN, a wholly-owned subsidiary of MTN Group Limited, a public company listed on the JSE, and Cell C. Cell C is 60% beneficially owned by a Saudi Arabian based group owned by the Hariri family and 40% beneficially owned by a consortium of mainly black empowerment groups. Cell C commenced operations in November 2001. As of March 31, 2004, Vodacom was the market leader with an approximately 54% market share based on the total estimated customers in the South African mobile communications market, while MTN had an approximately 35% market share and Cell C had an approximately 11% market share. Vodacom competes primarily on the basis of product quality, availability and network coverage. Vodacom believes that increased competition could have an adverse impact on its tariffs and churn rate.
Operations in other African countries
Vodacom intends to increase revenue from its other African operations, initially by growing its existing operations primarily in sub-Saharan Africa, and, in the future, by selectively acquiring additional mobile licenses or operators primarily in other sub-Saharan African markets. Investments outside of South Africa are evaluated and monitored against key investment criteria, focusing primarily on countries with stable economic and political conditions or good prospects for growth, market leadership and profitability. Other key factors include Vodacom's ability to gain majority ownership, develop strong local partnership relationships and obtain non-recourse financing. Other African operators are branded under the "Vodacom" name.
Vodacom has investments in mobile communications network operators in Lesotho, Tanzania, the Democratic Republic of the Congo and Mozambique. After almost two years of negotiations, Vodacom launched commercial operations in the Republic of Mozambique on December 15, 2003. The number of customers served by Vodacom's operations outside South Africa has grown significantly to 1,492,027 as of March 31, 2004 from 772,821 as of March 31, 2003 and 306,156 as of March 31, 2002. Revenue from Vodacom's operations outside of South Africa has grown to R1,497 million in the year ended March 31, 2004 from R1,235 million in the year ended March 31, 2003 and R741 million in the year ended March 31, 2002. Our share of Vodacom's operating loss from other African operations was R33 million in the year ended March 31, 2004, compared to R2 million in the year ended March 31, 2003 and a R41 million profit in the year ended March 31, 2002.
Vodacom entered into a five year management agreement with VEE Networks Limited effective April 1, 2004, pursuant to which Vodacom would have managed VEE Networks' cellular network operations in Nigeria with the intention of acquiring an equity stake in the business. On May 31, 2004, however, Vodacom announced that it had elected to terminate the management contract and abandon its plan to make an equity investment in the business of VEE Networks in Nigeria. Vodacom will continue to provide technical support to VEE Networks for a period of up to six months. Vodacom is currently a defendant in certain legal proceedings related to its activities in Nigeria. Vodacom is not currently able to estimate the outcome or extent of any claims or damages for which it may be liable if it is not successful in defending these claims.
81
The following table sets forth customer data for Vodacom's mobile communications networks in its other African operations as of the dates specified. The table reflects 100% of all of Vodacom's operations.
| | Year ended March 31, | | | |||||||||
|---|---|---|---|---|---|---|---|---|---|---|---|---|
| | 2003/2002 % change | 2004/2003 % change | ||||||||||
| | 2002 | 2003 | 2004 | |||||||||
| Other African countries | ||||||||||||
| Customers (thousands) (at period end)(1) | 306 | 773 | 1,492 | 152.6 | 93.0 | |||||||
| Lesotho | 57 | 78 | 80 | 36.8 | 2.6 | |||||||
| Tanzania | 228 | 447 | 684 | 96.1 | 53.0 | |||||||
| Democratic Republic of the Congo | 21 | 248 | 670 | 1,081.0 | 170.2 | |||||||
| Mozambique | — | — | 58 | — | — | |||||||
| Gross connections (thousands at period end) | ||||||||||||
| Lesotho | 45 | 76 | 51 | 68.9 | (32.9 | ) | ||||||
| Tanzania | 154 | 262 | 404 | 70.1 | 54.2 | |||||||
| Democratic Republic of the Congo | 21 | 260 | 513 | 1,138.1 | 97.3 | |||||||
| Mozambique | — | — | 58 | — | — | |||||||
| Penetration (%) (at period end)(2) | ||||||||||||
| Lesotho | 2.6 | 4.3 | 5.1 | 65.4 | 18.6 | |||||||
| Tanzania | 1.1 | 2.2 | 3.3 | 100.0 | 50.0 | |||||||
| Democratic Republic of the Congo | 0.3 | 1.0 | 2.3 | 233.3 | 130.0 | |||||||
| Mozambique | — | — | 15 | — | — | |||||||
| ARPU(3) | ||||||||||||
| Lesotho (ZAR) | 144 | 104 | 125 | (27.8 | ) | 20.2 | ||||||
| Tanzania (USD) | 27 | 22 | 18 | (18.5 | ) | (18.2 | ) | |||||
| Democratic Republic of the Congo (USD) | n/a | 20 | 21 | — | 5.0 | |||||||
| Mozambique (USD) | — | — | 15 | — | — | |||||||
| Number of employees (at period end) | 494 | 502 | 761 | 1.6 | 51.6 | |||||||
| Lesotho | 71 | 74 | 68 | 4.2 | (8.1 | ) | ||||||
| Tanzania | 188 | 224 | 316 | 19.1 | 41.1 | |||||||
| Democratic Republic of the Congo | 235 | 204 | 334 | (13.2 | ) | 63.7 | ||||||
| Mozambique | — | — | 43 | — | — | |||||||
- (1)
- Customer totals are based on the total number of customers registered on Vodacom's network, which have not been disconnected, including inactive customers, as of the end of the period indicated.
- (2)
- Penetration calculations are estimates in the 2004 and 2003 financial years and are based on ITU Telecommunications indicators as of December 31, 2001 in the 2002 financial year.
- (3)
- ARPU is calculated by dividing the average monthly revenue during the period by the average monthly total reported customer base during the period. ARPU excludes revenue from equipment sales, other sales and services and revenue from national and international users roaming on Vodacom's networks.
Lesotho
Vodacom owns an 88.3% interest in Vodacom Lesotho (Pty) Limited, a company incorporated in the Kingdom of Lesotho. Vodacom Lesotho's network was commercially launched in May 1996. Vodacom Lesotho's license has a term of 15 years with 13 years remaining.
Although Vodacom Lesotho is a very small operation by South African standards, its strategic geographical importance in terms of Vodacom's market share in neighboring South Africa justifies its
82
inclusion in the Vodacom portfolio. The network has 41 base transceiver stations, one mobile service switching center, two base station controllers, one short message service center and one intelligent network platform. Vodacom Lesotho's cumulative capital expenditures through March 31, 2004 were R201 million, compared to R185 million through March 31, 2003.
Vodacom Lesotho offers a variety of prepaid and post paid services to customers and also offers public pay phone services. Vodacom Lesotho's new Corporate Direct service allows corporate customers to connect their private automatic branch exchanges directly to the Vodacom Lesotho network. Vodacom Lesotho has six Vodashops, a walk-in customer care center and an interactive voice response for customer care services.
Vodacom Lesotho managed to increase its customer base by 2.6% to 80,000 as of March 31, 2004 from 78,000 as of March 31, 2003. The prepaid plan is the most popular package and accounts for 98.8% of Vodacom Lesotho's total customers as of March 31, 2004, compared to 93.8% as of March 31, 2003. The small net increase in total customers in the year ended March 31, 2004 is the result of 51,000 gross connections for the year, compared to 76,000 in the year ended March 31, 2003, coupled with a high churn rate. The high churn rate is the result of an ongoing process of cleaning up the inactive customer base which was connected in the 2003 financial year.
Econet-Ezicell, a subsidiary of Lesotho Telecommunications Corporation which commenced operations in April 2002, is the only other competition in Lesotho, and they offer coverage that equals Vodacom Lesotho's coverage. Econet-Ezicell has a signed interconnect agreement with Vodacom Lesotho. Vodacom Lesotho had an estimated 80% market share as of March 31, 2004 and 2003.
The headcount for Vodacom Lesotho decreased to 68 employees as of March 31, 2004 from 74 employees as of March 31, 2003. The number of customers per employee improved as a result by 12.3% from 1,047 to 1,176. During the 2004 financial year, Mervyn Visagie was appointed managing director of Vodacom Lesotho.
The regulatory environment in Lesotho has continued to prove challenging. The situation has reached a point where the intervention of the Lesotho Telecommunications Authority, or LTA, has been sought. Following futile attempts to have Lesotho Telecommunication Corporation remedy the poor quality of service provided in respect of calls terminating on South African mobile phones, Vodacom has been forced to lodge a formal complaint with the LTA. Vodacom has also challenged Econet alleging that it is routing some of its calls destined to Vodacom's network via Lesotho Telecommunication Corporation at a lower termination rate.
In November 2000, the Privatization Unit of Lesotho and the Sekha-Metsi Consortium Ltd, a company incorporated in the United Republic of Lesotho, entered into an agreement pursuant to which the Sekha-Metsi Consortium Limited acquired the other 11.7% in Vodacom Lesotho that was previously owned by Lesotho Telecommunications Corporation.
Tanzania
Vodacom owns a 65% interest in Vodacom Tanzania Limited, a company incorporated in the United Republic of Tanzania, while Planetel Communication Limited, a company incorporated in Tanzania, owns a 16% interest in Vodacom Tanzania, and Caspian Construction Proprietary Limited, a company incorporated in Tanzania, owns a 19% interest Vodacom Tanzania. Vodacom Tanzania has a 15 year license to operate a GSM network in Tanzania, which became effective on December 21, 1999. The roll-out of the network commenced in March 2000 and the commercial launch of the network occurred in August 2000. Vodacom Tanzania became the largest mobile communications network operator in Tanzania within one year of launching. Vodacom Tanzania's cumulative capital expenditures through 2004 was $181 million. Network coverage expanded to approximately 9% of the land surface of Tanzania and approximately 38% of the population as of March 31, 2004, compared to approximately 6% of the land surface and approximately 25% of the population as of March 31, 2003.
83
Vodacom Tanzania's current package offerings are Vodago, its prepaid product, Vodachoice, its postpaid product, and Vodatariffa, an SMS based information service. The peoples phone "Adondo" continues to form an integral part of the company's public phone offering and strategy. Vodacom Tanzania launched an interactive voice response in the 2004 financial year to improve customer service levels. Customers can now be served in 2 languages, namely Kiswahili and English.
The Vodacom Tanzania market profile was 98.8% prepaid as of March 31, 2004, compared to 98.4% as of March 31, 2003, and this is not expected to change significantly in the near future. Despite challenging market conditions, Vodacom Tanzania has increased the number of customers registered on its network by 53.0% to approximately 684,000 as of March 31, 2004 from approximately 447,000 as of March 31, 2003 mainly because of a 54.2% increase in gross connections to approximately 404,000 in the year ended March 31, 2004, compared to approximately 262,000 in the year ended March 31, 2003, partially affected by the significantly higher churn of 30.0% for the 2004 financial year due to the higher level of competition in Tanzania. Vodacom Tanzania was the first operator in Tanzania to introduce per second billing on October 3, 2003. Per second billing has proved highly successful and at March 31, 2004 approximately 400,000 of Vodacom Tanzania's customers were utilizing this service. Vodacom Tanzania currently offers international roaming on 127 networks in 65 countries.
There are three other mobile operators licensed in Tanzania, Mobitel, Zantel, which operated almost exclusively on Zanzibar, and Celtel, the mobile arm of the parastatal mainland fixed-line operator the Tanzania Telecommunication Company Limited, or TTCL. TTCL is the sole fixed-line operator licensed to provide basic telecommunications services in mainland Tanzania. Dutch based MSI Cellular Investments Holdings B.V. owns 35% of TTCL and has management control of the company. In Zanzibar, Zantel is the sole operator granted a fixed line license, with international gateway rights for traffic originating on its own network.
Zantel's market share remained relatively constant during the 2004 financial year at approximately 4%. Mobitel failed to adequately expand their network during the 2004 financial year, resulting in continued quality deterioration leading to a loss in market share from approximately 19% as of March 31, 2003 to an approximate 14% as of March 31, 2004. Celtel, the wholly-owned subsidiary of TTCL, has been the most aggressive competitor and has managed to establish itself as a formidable competitor.
Intense pricing competition has led to a price war between the operators and has significantly affected ARPU's in Tanzania. Despite the increased competition, Vodacom Tanzania has managed to increase its market share to approximately 57% as of March 31, 2004, compared to approximately 53% as of March 31, 2003.
Vodacom Tanzania had a total headcount of 316 employees as of March 31, 2004, 10 of whom were expatriates, compared to 224 employees as of March 31, 2003. Effective April 1, 2004, a new managing director, Jose dos Santos, took over from Bruce Sherwood, who returned to South Africa.
Vodacom Tanzania views effective employee relations as the key to ensuring that staff are happy when fulfilling their day-to-day activities. All staff issues are addressed via a consultative committee where staff are given a platform to address issues and actions agreed are monitored on a monthly basis.
During the 2004 financial year, Vodacom Tanzania undertook an internal audit to determine the extent to which it had met its roll-out obligations. The audit found that Vodacom Tanzania had already met all the obligations for the ten-year period, except for the rural areas of Sadani, Kondoa and Seronera. Vodacom Tanzania has drafted a report for submission to the National Regulatory Agency proposing improved quality of service parameters than those contained in Vodacom's current license.
Vodacom requested during the 2004 financial year that the Tanzanian Government permit Vodacom Tanzania and the other mobile operators to lease excess capacity on their fixed links and to operate an international gateway for their own subscribers. A response is pending with the Minister regarding the request for a relaxation of TTCL's exclusivity.
84
In an attempt to address the problems surrounding the collection of interconnect revenue from TTCL, Vodacom Tanzania commissioned Visual Wireless of Sweden to undertake a reconciliation of historic interconnection payments between Vodacom Tanzania and TTCL for the period of August 2000 through October 2001. The process was completed in early February 2004, but has met with resistance from TTCL, who have refused to accept the conclusion of the reconciliation. The matter has now been referred to formal arbitration. Mobitel has also initiated legal proceedings against TTCL related to outstanding interconnection payments and a court case is still pending with the Appeal Court of Tanzania.
Democratic Republic of the Congo
In late 2001, Vodacom, together with Congolese Wireless Network s.p.r.l., a company incorporated in the Democratic Republic of the Congo, formed Vodacom Congo (RDC) s.p.r.l., a company incorporated in the Democratic Republic of the Congo. Vodacom owns a 51% interest in Vodacom Congo, while Congolese Wireless Network owns the remaining 49% interest in Vodacom Congo. Congolese Wireless Network s.p.r.l. had a limited existing network in the Democratic Republic of the Congo. Although Vodacom has a majority voting interest in Vodacom Congo, the other shareholders have certain approval and veto rights granting them joint control over the joint venture. Vodacom is ultimately responsible for the funding of the operations of Vodacom Congo for the first three years pursuant to its shareholders agreement. Vodacom Congo's network was officially launched under the Vodacom brand in May 2002. Vodacom Congo has 14 years remaining on its license.
Vodacom Congo is currently performing well under challenging circumstances. An aggressive coverage strategy was the main contributing factor in achieving the success in subscriber growth and profitability during the 2004 financial year.
Vodacom embarked on an aggressive roll out program and achieved the implementation of the first true national network in the Congo. Network coverage has been rolled out in all of the nine provinces of the Democratic Republic of the Congo, including 71 towns and consisted of 227 base stations and four mobile service switching centers as of March 31, 2004, compared to 27 towns, 117 base stations and three mobile service switching centers as of March 31, 2003. Network capacity in the main centers has also been upgraded to maintain quality and service. Vodacom covered approximately 25% of the geographical area of the Democratic Republic of the Congo and approximately 55% of the population as of March 31, 2004.
Vodacom Congo is financing its roll-out in the Democratic Republic of the Congo with vendor and bridge financing and equity contributions and will ultimately seek to obtain non-recourse project finance. Vodacom Congo's cumulative capital expenditures through March 31, 2004 were $227 million, compared to $119 million through March 31, 2003, of which 51% is proportionately consolidated into Vodacom's consolidated financial statements.
Vodacom Congo currently offers three products, a post-paid service, a prepaid service and a public phone service. The post-paid product is aimed at the corporate market with the focus on customer service. The prepaid and public phone products are aimed at the general Congolese market with the main competitive advantage being coverage and network quality.
Vodacom Congo's customer care center has been significantly improved during the 2004 financial year, with customers being served in their choice of French, English, Lingala, Kingongo, Swahili and Tshiluba. Vodacom Congo's interactive voice response handled in excess of 3,800 calls per day as of March 31, 2004. Vodacom Congo has been successful in establishing international roaming agreements with 136 operators.
Vodacom Congo's customer base consisted 97.5% of prepaid customers as of March 31, 2004, compared to 95.6% as of March 31, 2003. Vodacom Congo increased customers significantly in the 2004 financial year to approximately 670,000 customers from approximately 248,000 customers as of March 31, 2003 as a result of approximately 513,000 gross connections and a low churn percentage of 20.2%, compared to approximately 260,000 gross connections and a churn percentage of 24.2% in the year ended March 31, 2003. Vodacom believes that its success is the result of an improved and more effective distribution channel and access to new areas through the success of the coverage roll out.
85
Celtel, a subsidiary of the MSI Group of companies, is the main competitor in the Democratic Republic of the Congo. Celtel is focusing its coverage in the main city centers. Since the launch of Vodacom Congo, Celtel has embarked on an aggressive pricing campaign and further coverage rollout. Celtel had a market share of approximately 45% as of March 31, 2004, compared to approximately 50% as of March 31, 2003. The other competitors in the Democratic Republic of the Congo share an 8% market share with the two bigger operators, SAIT and Congo Chine at approximately 4% and approximately 2% market share, respectively. Vodacom Congo had an estimated market share of approximately 47% as of March 31, 2004, compared to approximately 44% as of March 31, 2003.
Vodacom Congo had 334 employees as of March 31, 2004, which consisted of 320 local Congolese employees and 14 expatriates. The process of evaluation, identifying and training of local staff is a continuous focus of the company as part of the skills transfer process. Effective April 1, 2004, Dietlof Mare was appointed Managing Director of Vodacom Congo. The position was previously held by Willem Swart who was appointed CEO of VEE networks in Nigeria on the same date.
There are a number of disagreements among the stakeholders in the mobile industry in the Democratic Republic of the Congo with respect to the current interconnection agreements. The World Bank proposed a seminar on the costing of interconnection, and awaiting this seminar, the Ministry has accepted the Celtel and Vodacom interconnect charges without a downward adjustment. The date of the seminar to be hosted by the World Bank has not yet been fixed. The President of the National Regulatory Agency confirmed that a draft of guidelines for wholesale pricing and interconnection is currently being prepared. This document will be submitted for discussion by network operators. SuperCell was previously granted a license on a regional basis by the Rassemblement Congolais pour la Democratic, or RCD, political organization. The new political order established RCD as a recognized political power and Super Cell is lobbying the government of the Democratic Republic of the Congo to acknowledge their license. Although the issue remains unresolved, the National Regulatory Agency's position is currently that no local interconnection is allowed with Super cell.
Mozambique
Vodacom Mozambique was established on October 23, 2003 and launched commercial operations on December 15, 2003. Vodacom owns 98% of VM (S.A.R.L.) trading as Vodacom Mozambique and the remaining 2% is held by a local consortium named EMOTEL. Vodacom Mozambique was awarded its license in August of 2002, but due to the fixed line operator and the cellular operator being one company with no interconnect rates applicable, the license was not accepted until August 2003 when the issues were satisfactorily resolved. The license is a 2G GSM license and will expire in December 2018.
Vodacom Mozambique's infrastructure roll-out consisted of one mobile services switching center, four base station controllers and 101 base transceiver stations as of March 31, 2004. The network had a capacity of 80,000 customers as of March 31, 2004, with an increase to a capacity of 240,000 planned for 2005. Vodacom Mozambique's cumulative capital expenditures through March 31, 2004 were $57 million.
Vodacom Mozambique offers customers post-paid and prepaid plans and is planning to roll-out public phones in the 2005 financial year. The post-paid products are mainly aimed at the corporate and business market, while the prepaid products are aimed at the large informal market. Vodacom Mozambique has an interactive voice response in place and customer care can handle customer queries in two languages, namely Portuguese and English.
Vodacom Mozambique has managed to connect 58,000 customers to its network as of March 31, 2004. Vodacom Mozambique will aim to increase market share further by offering competitive coverage through aggressive roll-out in the coming years.
Vodacom Mozambique's only competition is Telecomunicações Móveis de Moçambique, Lda, or mCel, a company owned by Telecomunicações de Moçambique, or TDM, who is also the national fixed line operator. Vodacom Mozambique has managed to secure an approximately 11% market share as of March 31, 2004, despite mCel lowering prices and increasing discounts to distributors in anticipation of Vodacom Mozambique's entry into the market. This has put pressure on ARPU and revenues.
Vodacom Mozambique employed 43 people as of March 31, 2004, of which 22 were expatriates. A number of the expatriates were required during the initial roll-out and are on short-term contracts. They are expected to return to South Africa in the near future.
86
On April 22, 2004, the Mozambique parliament approved a new law of telecommunications. The new legislation has not yet been tabled and Vodacom Mozambique is now waiting for final approval. A number of other regulatory processes are currently under way, such as amending interconnect agreements.
Vodacom Mozambique has an international gateway in operation using leased Telecomunicações de Mocambique, or TDM, transmission. Telkom will seek approval from ICASA for a direct cross border microwave link between Vodacom Mozambique and Telkom and is expected to start commissioning the direct link soon.
Vodacom qualified for exemption from a variety of taxes and import duties in terms of Mozambique's Investment Law for a period of ten years starting from January 1, 2004.
Procurement
Vodacom solicits bids for all goods and services in excess of R500,000. Bids are through a closed tender system by invitation only. A multi-disciplinary cross-functional team evaluates and awards bids to the best supplier based on the best overall score, taking into account technical specification, delivery time, price, financial viability and the participation of black economic empowerment partners.
Vodacom seeks to utilize at least two suppliers for all critical equipment where possible to minimize supply risk. Vodacom's main technology suppliers are Siemens, Alcatel and Motorola.
For information relating to our capital expenditures, see Item 5. "Operating and Financial Review and Prospects—Liquidity and Capital Resources—Group Liquidity and Capital Resources."
REGULATION AND LICENSE REQUIREMENTS
Regulation
We are primarily subject to the South African Telecommunications Act, 103 of 1996, and its ongoing amendments, the regulations promulgated under that Act and the various licenses issued to us. Many of these regulations are relatively new and are subject to amendment and finalization as the telecommunications industry is further developed and liberalized. We cannot predict the outcome or timing of any amendments or modifications to the applicable regulations or their interpretation or the impact on us. In some instances, final regulations have not yet been promulgated.
Overview
In 1991, the Minister of Posts and Telecommunications incorporated two companies to succeed the telecommunications and postal enterprises of the then Department of Posts and Telecommunications and Telkom was incorporated as the successor of the telecommunications enterprise. The Postmaster-General and the Department of Posts and Telecommunications, however, retained general regulatory functions and continued to regulate the telecommunications industry until the Telecommunications Act, 103 of 1996, came into effect in 1996. On September 30, 1993, under the regulatory regime of the Postmaster-General, the Department of Posts and Telecommunications and the Post Office Act, 44 of 1958, Vodacom and MTN were issued two national mobile cellular telecommunications licenses. These licenses were the first major commercial licenses granted to direct competitors of Telkom.
In 1996 and 1997, the Telecommunications Act, 103 of 1996, completely overhauled the legislative and regulatory framework of the telecommunications industry in South Africa, replaced virtually all the telecommunications provisions of the Post Office Act, 44 of 1958, established the South African Telecommunications Regulatory Authority, which was replaced in 2000 by ICASA when the South African Telecommunications Regulatory Authority and the Independent Broadcasting Authority were merged, and vested the South African Telecommunications Regulatory Authority with almost all regulatory functions relating to the telecommunications and broadcasting industries, including a major role in the issuance of telecommunications licenses. However, certain types of licenses, including licenses for public switched telecommunications services, mobile cellular telecommunications services, national long distance and international telecommunications services, may not be issued or applied for without a prior public invitation by the Minister of Communications setting out the criteria for their issuance. These licenses can only be
87
granted by the Minister of Communications on recommendation from ICASA. In addition, the Telecommunications Act, 103 of 1996, gives the Minister of Communications authority to grant licenses using alternative methods such as by way of auction or tender. The Minister of Communications has a policy-making role, entitling her to issue policy directions consistent with the objectives of the Telecommunications Act and giving her the ability to issue invitations to apply for the above-mentioned licenses and the granting thereof.
The former Department of Posts and Telecommunications is now known as the Department of Communications. The head of the Department of Communications is now known as the Director-General. The Director-General does not, however, have any regulatory powers under the Telecommunications Act, 103 of 1996.
The Telecommunications Act, 103 of 1996, deemed us to be the holder of a public switched telecommunications license, a value-added network services license and a radio spectrum license which enable us to continue providing the telecommunications services we provided prior to commencement of the Telecommunications Act, 103 of 1996. On May 7, 1997, we were issued with a formal written public switched telecommunications services license, a value-added network services license and a radio frequency spectrum license under this new regulatory regime. We operate under these licenses today.
In 2001, the Telecommunications Act, 103 of 1996, was substantially amended in order, among other things, to facilitate and regulate the introduction of competition in the telecommunications sector of the Republic of South Africa. The Telecommunications Act, 103 of 1996, now makes provision for the issue of an additional license to provide public switched telecommunications services to a second national operator and for the issue of additional licenses to small business operators to provide telecommunications services in areas with a teledensity of less than 5%. At the end of the original bid process for the second national operator, the only two bids received were rejected by ICASA. Subsequently, the Minister of Communications initiated an alternative bid process. An evaluation committee appointed by the Minister of Communications has recommended that the Minister pre-qualify two of the four bidders for this license for consideration by ICASA. ICASA also initially rejected the two bidders the evaluation committee recommended that the Minister pre-qualify in the alternative bid process. On December 18, 2003, however, the Minister of Communications announced that she would grant a license to a second national operator that will be 30% owned by two entities beneficially owned by the South African Government, 19% owned by a black economic empowerment consortium and 26% owned by the two bidders recommended by the evaluation committee for pre-qualification in the alternative bid process, with the remaining 25% of the second national operator being held by the Government for sale to a strategic equity investor to be identified in the future. The Minister of Communications has indicated that she expects ICASA to issue the second public switched telecommunications services license in 2004. The Minister of Communications has identified 27 underserviced areas for the issue of additional licenses to small business operators and has issued an invitation to apply for licenses in ten of them. ICASA has submitted its recommendations to the Minister of Communications for the granting of licenses to successful bidders in seven of the ten areas in which licenses could have been issued. The Minister of Communications granted licenses to four successful bidders on June 3, 2004 and it is expected that these licenses will be issued in 2004.
The amended Telecommunications Act, 103 of 1996, also provided for the issue of an international carrier of carriers license and a multimedia license to Sentech Limited that were issued in May 2002. The relevant amendments introduce the possibility of further competition from May 2005 should the Minister of Communications, after conducting a feasibility assessment, determine that one or more additional public switched telecommunications services licenses should be awarded.
As a further measure to liberalize the South African telecommunications sector and to increase competition, the amended Telecommunications Act, 103 of 1996, expressly provides that the second national operator, Telkom, Vodacom and MTN will each be entitled to obtain a license to use radio frequency spectrum in the 1800 MHz band and spectrum for the provision of third generation services. Cell C's existing license already includes the right to use radio frequency spectrum in the 1800 MHz band. Finally, the amended Telecommunications Act, 103 of 1996, requires the introduction of carrier pre-selection by the end of 2003 and number portability by 2005. Telkom has conditioned its exchanges to provide call-by-call carrier selection by December 2003. Since the second national operator has not been issued the service is not provided. Full carrier pre-selection will only be provided on request by the second national operator. A lead time of 12 to 18 months is foreseen in finalizing the draft regulations, which have not yet been finalized.
88
ICASA has also indicated that it intends to conduct a feasibility study on the licensing of a fourth mobile cellular operator in 2004, or later. Thus far there has been no progress in this regard.
On December 3, 2003 the Department of Communications published a draft convergence bill. The bill was tabled in parliament in February 2004 and is expected to receive parliamentary attention in the second quarter of 2004. The bill aims to supplement or replace current sector-specific legislation and change the market structure from a vertically integrated infrastructure based market structure to a horizontally integrated service based technology neutral market structure. In this four-tier market, the following licenses would be awarded: infrastructure service licenses, communications network service license, communications applications service license and communications content service licenses.
Regulatory authority
In 2000, the Independent Communications Authority of South Africa Act, 13 of 2000, created ICASA, a new regulatory body for the telecommunications and broadcasting industries. ICASA took over all functions of the dissolved South African Telecommunications Regulatory Authority and the Independent Broadcasting Authority, which previously acted as regulators of the telecommunications and the broadcasting industries, respectively. Deriving its powers from the Telecommunications Act, 103 of 1996, the Independent Communications Authority of South Africa Act, 13 of 2000, and the Independent Broadcasting Authority Act, 153 of 1993, ICASA currently serves as the primary regulatory and licensing authority for the South African communications industry, except with respect to those specific licenses that can only be granted by the Minister of Communications. In respect of these specific licenses, ICASA is empowered to evaluate license applications made in response to invitations issued by the Minister of Communications and to make recommendations to the Minister, who is vested with the final power to issue the licenses. Upon its establishment, ICASA inherited a legacy of regulatory problems from its predecessors. It has been reported that ICASA may currently lack adequate resources to effectively fulfill its regulatory and licensing functions and to deal with regulatory challenges that continue to change given the rapidly evolving telecommunications environment.
Policy directions and regulations
The Telecommunications Act, 103 of 1996, entitles the Minister of Communications, after a public comment period, in consultation with ICASA and after referral to Parliament for comment, to issue and publish policy directions consistent with the objectives of the Telecommunications Act, 103 of 1996. Once such policy directions have been issued, ICASA is obliged to perform its regulatory and other functions in accordance with such directions. In addition, the Telecommunications Act, 103 of 1996, entitles ICASA to make regulations, drafts of which must, except where the public interest otherwise requires, first be published in the Government Gazette for public comment before final regulations can be prescribed and published in the Government Gazette by the Minister of Communications.
Under South African law, it is possible for licensees such as Vodacom and Telkom and for other interested parties to have the regulations and rulings issued by ICASA reviewed and tested in a court of law for compliance with the objectives and other provisions of the Telecommunications Act, 103 of 1996, and other relevant laws such as the South African Constitution.
The Telecommunications Act, 103 of 1996, is not entirely clear on a number of issues which are expected to be addressed by regulation. In addition, because ICASA was only established in 2000 and the regulations governing the telecommunications industry in the Republic of South Africa are evolving, lack of clarity exists in a number of areas and that are still subject to interpretation, review and amendment. Therefore there is some degree of regulatory uncertainty for Telkom and Vodacom and other communications providers.
The regulatory process entails a public comment process which, in light of the politicized issue of the privatization of industries such as telecommunications in the Republic of South Africa, makes the outcome of the process uncertain and may cause delays.
Interconnection
The Telecommunications Act, 103 of 1996, establishes the general conditions for interconnection among licensed operators. In particular, the Telecommunications Act, 103 of 1996, guarantees the right of any
89
licensed operator to interconnect with operators licensed to provide public switched telecommunication services, including the second national operator. The Telecommunications Act, 103 of 1996, empowers ICASA to prescribe guidelines as to the terms and conditions of interconnection agreements which must be negotiated between the parties and it confers on ICASA powers to intervene and propose, or to set its own terms and conditions where the parties are unable to reach an agreement or the agreed terms are not consistent with the relevant guidelines. Any terms and conditions of an interconnection agreement set by ICASA are binding between the parties.
In 2000, ICASA issued, and the Minister of Communications approved and promulgated, interconnection guidelines, which stipulate, among other things, that certain operators may be declared to be "Public Operators," that certain operators may be declared to be "Major Operators," and that certain telecommunication services may be declared to be "Essential Services." A Major Operator must provide Essential Services to Public Operators at the Long Run Incremental Cost, or LRIC, of those facilities, including a reasonable allocation of common costs.
Supplementary interconnection guidelines, approved by the Minister of Communications, were issued by ICASA in 2002. These guidelines declare Telkom to be a Major Operator, its interconnection services to be Essential Services and the second national operator, the mobile cellular operators and the underserviced area licensees to be Public Operators. The guidelines further prescribe that the Essential Services must be made available at the "Fully Allocated Cost" of those services for the first two years, and thereafter, LRIC based interconnection prices will become mandatory.
In April 2003, Cell C applied to ICASA to have MTN and Vodacom declared major operators, which would have required them to offer interconnection at long run incremental cost based prices in terms of international guidelines. After long and protracted discussions, the application was withdrawn on October 17, 2003. ICASA has also agreed to do a proper market study before imposing any wholesale price regulation in the future.
The public comment process for draft supplementary interconnection guidelines relating to interconnection with the underserviced area licensees was recently completed. However, these draft guidelines were subsequently withdrawn. In current form, the draft regulations contemplate an asymmetrical interconnection regime between Telkom and the underserviced area licensees, with a terminating tariff in favor of these licensees equal to or greater than 1.10 times the highest prevailing termination charge on Telkom's fixed-line network. These draft guidelines do not make any specific reference to cost based pricing, but being supplementary in nature it may be that cost based pricing will be addressed as part of the overall interconnection regulatory regime. These draft regulations have since been withdrawn.
Draft regulations on interconnection pricing for under-serviced area licenses, or USALs, which would have obliged Vodacom to provide interconnection to USALs at subsidized rates, were also substituted with regulations which stipulate that Vodacom must provide interconnection to a USAL at its best commercial tariff. To date, four letters of intent from bidders to utilize the Vodacom network, should they be awarded a USAL license, have been secured. Vodacom has also received notification from seven other bidders regarding their willingness to switch to Vodacom.
The interconnection agreements between Telkom and Vodacom and MTN that preceded the Telecommunications Act, 103 of 1996, were renegotiated and amended in 2001. An interconnection agreement, on substantially the same terms, was negotiated and concluded with Cell C at the same time.
Facilities leasing
As in the case of interconnection, the Telecommunications Act, 103 of 1996, establishes the general conditions for the leasing of telecommunications facilities. The Telecommunications Act, 103 of 1996, guarantees the right of licensed operators to obtain telecommunications facilities from operators licensed to provide public switched telecommunication services, including the second national operator, and it empowers ICASA to prescribe guidelines for facilities leasing agreements. The Telecommunications Act, 103 of 1996, confers on ICASA powers to intervene and propose, or to set its own terms and conditions where the parties are unable to reach an agreement or where the agreed terms are not consistent with the relevant guidelines, regulations or the Telecommunications Act, 103 of 1996. Any terms and conditions of a facilities leasing agreement set by ICASA are binding between the parties.
90
In addition, the Telecommunications Act, 103 of 1996, requires us to allow the second national operator to use all of our telecommunications facilities for the first two years of its license, on a resale basis, for the purpose of providing public switched telecommunication services. It is unclear whether this shared access relates only to the provision of public switched telecommunication services by the second national operator during such two years or to other services as well, although the guidelines issued by ICASA may be interpreted to deal with such other services. It is also unclear whether we will be required to allow shared access to the second national operator at LRIC-based prices beyond such two year period in respect of other services, although the guidelines issued by ICASA may be interpreted to prescribe that beyond the two year period, LRIC prices will become mandatory as described below. As a result, we may also be required under the Telecommunications Act, 103 of 1996, to lease or otherwise make our telecommunications facilities available to the second national operator for the provision of services, other than public switched telecommunications services, during the first two years of its license and beyond.
The supplementary facilities leasing guidelines issued by ICASA and approved and promulgated by the Minister of Communications in 2002, list a set of Telkom's facilities that are declared to be Essential Facilities. Among those essential facilities is shared access to the local loop by the second national operator for the first two years of its license. The guidelines further prescribe that the Essential Facilities must be made available at the Fully Allocated Cost of those facilities for the first two years and thereafter LRIC based prices will become mandatory. Although Sentech had applied to the South African High Court for an order that the supplementary facilities leasing guidelines be declared invalid, unlawful and unconstitutional due to procedural errors, Sentech has subsequently withdrawn its application. If we are unable to negotiate favorable terms and conditions for the provision of the services and facilities covered by the guidelines or ICASA otherwise imposes terms and conditions that are unfavorable to us, our business operations could be disrupted and our net profit could decline.
Tariffs
The Telecommunications Act, 103 of 1996, and regulations made under the Act impose a price cap formula on a basket of specified services that we previously had the exclusive right to provide, including: installations; prepaid and postpaid line rental; local, long distance and international calls; fixed-to-mobile calls; public payphone calls; ISDN services; our Diginet product; and our Megaline product. Prices on these services are filed with ICASA for approval. Revenue from services in the basket may not be used to subsidize other products and services outside the basket. Currently, the overall tariffs for all services in the basket may not be increased by more than 1.5% below inflation in South Africa, based on the consumer price index and measured using revenue for the services in the basket at constant volumes for the prior year. In addition, prior to January 1, 2003, the price of any individual product or service included in the basket could not be increased by more than 20% above inflation in South Africa in any year. Effective January 1, 2003, the price of any individual product or service included in the basket may not be increased by more than 5% above inflation in South Africa in any year. In addition, the overall tariffs for a sub-basket of services provided to residential customers may not be increased by more than 1.5% below inflation in South Africa, based on the consumer price index and measured using revenue for the services in the basket at constant values for the prior year. In December 2002, as a result of an out of court settlement related to our tariff increase in the prior year, ICASA approved our tariff filing providing for a 9.5% increase in the overall tariffs for all services in the basket effective January 1, 2003, based on the increase in the consumer price index for the twelve months ended September 30, 2002 of 12.5%. Statistics South Africa Limited subsequently revised the calculation of the consumer price index for the twelve months ended September 30, 2002 downward to 11.2%, although our tariffs were not affected. ICASA approved a 2.2% increase in the overall tariffs for all services in the basket effective January 1, 2004. ICASA has indicated its intention to conduct a review of the price control regime in 2004, however, a process and timetable for the review has not been announced. See Item 3. "Key Information—Risk Factors—Risks Related to Regulatory and Legal Matters—Our tariffs are subject to approval by the regulatory authorities, which may limit our flexibility in pricing and could reduce our net profit. Vodacom's revenue and net profit could decline if wholesale price controls are imposed on it."
Pursuant to its mobile cellular telecommunications license, Vodacom has to lodge all tariff plans or any amendments to existing tariff plans with ICASA. No increase in the price of any service or in some cases, a basket of services, greater than the percentage annual increase in the consumer price index is allowed
91
without ICASA's approval. Vodacom's annual tariff increases were lodged on May 12, 2003 and approved by ICASA on May 19, 2003. The average tariff increase was 5%, effective July 1, 2003.
Universal service obligations
As part of our five year exclusivity period ended May 7, 2002, we had 16 service quality and line roll-out targets for our fixed-line business, including the following universal service obligations:
- •
- to build 2.69 million new access lines, including 1.67 million lines in underserviced areas;
- •
- to connect 3,204 villages; and
- •
- to install 120,000 payphones.
We substantially met all of our fixed-line service and line roll-out targets with the exception of our residential fault rate target, our aggregate fixed-line roll-out target and targets which required us to provide service to underserviced villages and to replace analog lines with digital lines. We elected not to roll-out lines in our last year of exclusivity where it was not economical to do so. As a result we missed our line roll-out target by 16,448 lines, or 0.6%. Our license required us to pay penalties for missing the service quality and line roll-out targets contained in our license. Based on the previous requirements contained in our existing license, we incurred total penalties for failing to meet these targets of approximately R15 million. The amount of these penalties has not been challenged by ICASA. We do not currently anticipate that we will have any additional fixed line roll-out targets.
Our public switched telecommunications license requires us to provide basic voice telephone service to every person in South Africa who requests such service, who can afford it and who enters into a contract with us for such service, and to install, connect, maintain and repair a telephone to use such service, and provide access to emergency organizations and directory information services. However, we are not required to provide the foregoing services where ICASA determines that the demand for such services can be met by other means and, as a result, it would be unduly burdensome in the circumstances for us to provide the telecommunications service requested.
The Minister of Communications issued a public statement in 2002 describing our future obligations to assist in the continued development of communications services to the South African population. The obligation will be a contribution to the Universal Service Fund, or USF, and ongoing universal service obligations imposed on us through the generic terms of our license. In the past we had to contribute to the USF R10 million per annum escalated by inflation from 1997. Beginning in the 2005 financial year, such contribution is set at 0.2% of revenue for our fixed-line business. The first such payment is due in July 2005 based on the 2004 financial year's revenue, pro-rated from September 1, 2003. Vodacom's USF obligation was 0.2% of annual turnover at March 31, 2004, with payment due in July 2004. New social obligations may be imposed with new licenses, such as 1800MHz licenses and third generation technology licenses.
In terms of the Minister's budget speech in May 2003, a 15 year 1800MHz spectrum license will require the licensees to collectively provide 250,000 phones/numbers to emergency service organizations and 4 million SIM cards to needy persons. The phone and SIM card obligations will be shared among the three mobile operators over a period of 5 years. A working group consisting of representatives of the Departments of Communications, Education, Finance, Treasury and the mobile operators will consult and agree on how responsibility for the phones and SIM cards will be distributed among the three mobile operators.
Vodacom's mobile cellular telecommunications license contains an obligation that required Vodacom to provide 22,000 community services, or public access, telephones in underserviced areas by June 1, 1999, which Vodacom satisfied. More than 24,500 community service telephones were deployed as of March 31, 2004. Two deployment methods are in use, namely a phone shop based telephone and portable telephone deployed at educational or other community institutions. Good progress has been made with the phasing out of the portable handsets and replacing them with phone shop based telephones, called Sigis. Approximately 1,962 operators who operate from 5,015 phone shops owned more than 23,000 Sigi telephones as of March 31, 2004.
The training of the community services telephone operators in business skills received significant attention during the 2004 financial year. Vodacom funded the training of 512 community services telephone operators in areas such as financial management and marketing. Vodacom's future universal service obligations will also consist of a contribution to the USF, and possible new universal access obligations.
92
Regulatory accounts
Under the Telecommunications Act, 103 of 1996, and our public switched telecommunications service license, we are required to report and account to ICASA, our retail and wholesale activities using a specific accounting methodology set out in a Chart of Accounts and Cost Allocation Manual, or COA/CAM. The adoption of this methodology by us requires the aggregating and disaggregating of general ledger accounts in a different manner than we prepare accounts in accordance with generally accepted accounting principals. It also requires a reconciliation of the accounts. We were required to put the necessary accounting and management information systems, which would have enabled us to prepare such reports and accounts, in place by May 7, 2002, subject to ICASA issuing the COA/CAM regulations. The regulations, however, were only published on July 19, 2002. The regulations required the first submission of our regulatory financial statements to take place by September 30, 2003. However, the regulations also recognized the burden placed by the reporting requirements on operators and subsequently adopted a phased implementation approach. Accordingly, we have made written submissions to ICASA setting out the steps to be taken, work involved and proposed timeframes to implement systems to comply with the reporting obligations of the regulations. These regulations also require us to develop a procedures manual that sets out how we will implement the COA/CAM accounting methodology in practice, which manual must be reviewed and approved by ICASA. In accordance with the timing of the introduction of this reporting requirement, we are in the process of preparing a COA/CAM manual. ICASA will have to approve the manual that we prepare. On June 5, 2003, ICASA accepted Telkom's proposal to extend the deadlines under COA/CAM regulations to require Telkom to provide a draft procedure manual by June 30, 2003, which Telkom has done, to provide a final procedures manual by September 30, 2003 and to provide audited regulatory financial statements on a historic cost basis by June 30, 2004, and on a current cost basis, including LRIC statements, by June 30, 2005. Telkom does not currently believe that it will be able to provide audited regulatory financial statements on a historic cost basis by June 30, 2004. ICASA has granted Telkom an extention until August 31, 2004 to provide audited regulatory financial statements.
Carrier pre-selection
We were required to implement carrier pre-selection, with call-by-call override capabilities, by no later than December 31, 2003 pursuant to regulations imposed by ICASA. Telkom has conditioned its exchanges to provide call-by-call carrier selection by December 2003. We will not be able to fully implement carrier pre-selection until the second national operator is licensed and the second national operator's interconnection systems and the inter-operator process and systems to support carrier pre-selection become available and the necessary regulations become available. Full carrier pre-selection will only be provided on request by the second national operator. A lead time of 12 to 18 months is foreseen in finalizing the draft regulations, which have not yet been finalized. Regulations indicate that the system set-up costs will be recovered as part of the prescribed annual review of fees and charges, but no further detail is available. We are currently engaged with ICASA to define the manner in which such costs could be recovered.
Slamming, which is the transfer of a user from one operator to another without such user's knowledge or authorization, is to be prohibited. There is a risk that the procedure to combat slamming may not be effective and would result in further market share losses. Carrier pre-selection is not applicable to mobile cellular operators. On April 1, 2004 government approved an amendment to the Telecommunications Act to define multi-media and carrier of carriers licensee Sentech as a public operator.
93
The Telecommunications Act, 103 of 1996, mandates that number portability enabling customers to retain their fixed-line and mobile telephone numbers if they switch between fixed-line operators and between mobile cellular operators will be introduced in 2005. The draft guidelines published by ICASA in relation to number portability in 2001 have been withdrawn. The set-up and per-operator costs are typically the largest cost components of implementing number portability. Similar to carrier pre-selection, there is a risk of not fully recovering system set-up costs. New draft guidelines are expected soon. The delay in licensing the second national operator has reduced the urgency, however, the statutory deadline remains in force.
Unbundling the local loop
Given that the only existing public fixed-line network is operated by Telkom under its license, and that Vodacom, MTN and Cell C each operate independent mobile communications networks, there are no rules dealing specifically with equal and unbundled access to shared resources.
While the Telecommunications Act, 103 of 1996, currently provides that we will not be required to unbundle our local loop for a period of two years after the issue of the second national operator's license, it is envisioned that as the industry is further liberalized, operators such as us with existing facilities and access lines, will be obliged to make these available to new entrants. The second national operator will be entitled to lease our telecommunications facilities for a period of two years after being licensed. Furthermore, although it is not our interpretation, the relevant provisions may be interpreted that the second national operator may have shared access to the local loop, which is understood to mean access to the higher bandwidth for xDSL applications beyond such two years. The foregoing is an exception to the generic provision that the local loop will not be unbundled during the first two years of the second national operator's license.
Licenses
Fixed-line telephone services
Public switched telecommunications services
On November 15, 1996, we were deemed to be the holder of a license to provide public switched telecommunication services under the Telecommunications Act, 103 of 1996, and on May 7, 1997, we were issued a written license by the Minister for Posts, Telecommunications and Broadcasting to provide public switched telecommunications services in South Africa for a minimum period of 25 years, which included our exclusivity period of five years ended May 7, 2002.
Under this license we are authorized to provide, among other things, the following:
- •
- national long distance telecommunications services;
- •
- international telecommunications services;
- •
- local access telecommunications services;
- •
- public pay telephone services;
- •
- fixed-lines, infrastructure and facilities required to provide the above services;
- •
- telecommunications facilities to be used by any person for the provision of value-added network services;
- •
- telecommunications facilities comprising fixed-lines to be used by operators for the provision of mobile communications services and any other telecommunications services;
94
- •
- telecommunications facilities to be used by any person for the provision of any private telecommunications network, with the exception of certain private telecommunications networks situated on a single piece of land or two or more contiguous pieces of land owned by the same person, or maintained by Transnet or Eskom as authorized under the Telecommunications Act, 103 of 1996;
- •
- connection to our network of any other licensed telecommunications system or service both inside and outside of South Africa; and
- •
- conveyance of signals to and from telecommunications systems and equipment connected to our network, together with any switching or other services incidental to such conveyance.
Additionally, we are entitled under the Telecommunications Act, 103 of 1996, to manufacture, sell, supply, distribute and maintain certain telecommunication facilities and equipment, including customer premises equipment and software, provided that ICASA consents to the commercial marketing, distribution or sale of such facilities or equipment.
Furthermore, the 2001 amendment to the Telecommunications Act, 103 of 1996, provides for fixed-mobile services to be deemed a new public switched telecommunications service that may be provided with a public switched telecommunications service license or an underserviced area license. A fixed-mobile service is a service that permits a customer of the licensee to access the public switched telecommunications network of the licensee and obtain telecommunications services from such licensee from either a fixed point or while in motion within the local exchange area, but does not permit or include call handover between cells. Our public switched telecommunications service license has not yet been amended to include fixed-mobile services and it is not expected that it will be so amended until a license is issued to a second national operator.
The license fee payable by us under this license amounts to 0.1% of our annual revenues generated from the provision of the licensed public switched telecommunications services.
Our public switched telecommunications services license may be revoked by ICASA if we repeatedly fail to comply with an order made by ICASA pursuant to the Telecommunications Act, 103 of 1996, and fail to correct the non compliance within 90 days of being requested to comply, or if we are placed in final liquidation or put under a provisional or final judicial management order. Our license required us to pay penalties for missing the service quality and line-rollout targets contained in our license. Based on the previous requirements contained in our existing license, we incurred total penalties for failing to meet these targets of approximately R15 million. The amount of these penalties has not been challenged by ICASA. We do not currently anticipate that we will have any additional fixed line roll-out targets.
We are also obliged to publish our charges and the manner which we adopt for determining those charges in respect of the various telecommunications services provided by us. Provision is also made for the protection of customer confidentiality and other information that we receive from our customers in the course of providing telecommunications services to them. Bills to our customers must reflect the type of service, the units for which charges are made, and at a minimum, the starting time of each connection, the number called and the duration and number of units for each call. Our records must identify for customers the basis for the amount charged for the use of our services and we are required to retain such information to allow ICASA the ability to have an independent quality assurance check performed to ensure that the billing process complies with the aforesaid requirements.
Our license also requires us to establish efficient procedures, taking into account predominant regional languages and to provide assistance to customers with complaints during normal business hours. Our procedures for dealing with customer complaints must include a procedure for referring any disputes relating to such complaints to an affordable independent arbitration procedure instead of a court. Finally, we are required, in consultation with ICASA, to prepare and publish a code of practice
95
that duly takes account of predominant regional languages, giving guidance to our customers in respect of any disputes with or complaints from such customers relating to the provision of telecommunications services.
ICASA has indicated that they may seek to review and possibly amend the terms of our public switched telecommunications services license in the 2005 financial year. It is not clear whether this will happen or to what extent ICASA will seek to impose new service and installation targets in our public switched telecommunications services license or impose additional obligations on us. However, under our existing license, such a review and amendment can, in some instances, only be effected through a public comment process with our participation, and in other instances, only with our consent. We cannot, however, predict the outcome of such a contemplated review.
Other licenses
On November 15, 1996, we were deemed to be the holder of a license to provide value-added network services under the Telecommunications Act, 103 of 1996, and on May 7, 1997, we were issued a written license by the Minister for Posts, Telecommunications and Broadcasting to provide value-added network services on a non-exclusive basis for a period of 25 years.
Our value-added network service license may be revoked by ICASA if we repeatedly fail to comply with an order made by ICASA and fail to correct the non-compliance within 90 days, or if we are placed in final liquidation or under a provisional or final judicial management order.
On February 21, 1997, we were deemed to be the holder of a radio frequency spectrum license to provide telecommunication services and facilities, and on May 7, 1997, we were issued a written license by the Minister for Posts, Telecommunications and Broadcasting to use the relevant bands of radio frequency spectrum. We use the radio spectrum for the provision of fixed links within our network, both land based and satellite, and for wireless local loop applications. Where these bands were licensed to us on a shared or non-exclusive basis, ICASA is to ensure that any other licenses issued to other entities do not create harmful interference with our use of the radio frequency spectrum. Our use of the radio frequency spectrum is subject to our compliance with the relevant provisions of international telecommunications conventions, the radio regulations and the International Telecommunications Union radio regulations agreed to or adopted by the Republic of South Africa. We are only authorized to use our assigned frequency bands for the provision of public switched telecommunication services.
Our radio frequency spectrum license may be revoked by ICASA if we repeatedly fail to comply with an order made by it and fail to correct the non-compliance within 90 days of being requested to comply, or if we are placed in final liquidation or under a provisional or final judicial management order. Additionally, our radio frequency license will terminate if our public switched telecommunication services license is terminated.
Under the Telecommunications Act, 103 of 1996, each of Vodacom, MTN, Telkom and the second national operator will all be entitled to apply for, and acquire, licenses for the use of 1800MHz radio frequency spectrum and radio frequency spectrum for the provision of third generation services in the near future. Cell C's existing license already includes the right to use radio frequency spectrum in the 1800 MHz band. The amount of spectrum that will be licensed and the fees that will be required to obtain the 1800 MHz radio frequency spectrum and radio frequency spectrum for the provision of third generation services have not yet been determined.
Our Swiftnet subsidiary has been granted a telecommunications license and a radio frequency spectrum license providing for:
- •
- Swiftnet to construct, maintain and operate a national wireless data network and to provide wireless data telecommunication services; and
96
- •
- interconnection with our network.
Under our interconnection agreement with Swiftnet, we must charge Swiftnet those tariffs recommended by ICASA and approved by the Minister of Communications.
Swiftnet is currently in violation of its license that requires it to have a 30% BEE partner. Telkom and Swiftnet have been unable to find a partner to remedy this breach, but continue to address this issue.
Mobile cellular telephone services
On September 30, 1992, a multiparty implementation agreement was concluded between us, Vodacom, MTN, the Postmaster-General and the South African Government dealing with the licensing of Vodacom and MTN. On the same date, Vodacom was issued with a mobile cellular telecommunications license for a validity period of 15 years.
On July 1, 1997, Vodacom was deemed to be the holder of a license to provide mobile cellular telecommunications services in accordance with the Telecommunications Act, 103 of 1996, subject to the terms and conditions of the written mobile cellular telecommunications license issued by the Postmaster-General and the multiparty implementation agreement, and on August 19, 2002, Vodacom was issued a written mobile cellular telecommunications service license by the Minister of Communications and ICASA, pursuant to the Telecommunications Act, 103 of 1996, incorporating the terms and conditions of the original license and agreement, subject to certain legislatively mandated changes. Under this license, Vodacom is authorized to construct, maintain and use its public land mobile communications network for the provision of mobile cellular telecommunications services, and to interconnect with our public switched telecommunications network and the public land mobile communications networks of other licensed mobile cellular telecommunications service providers. An initial license fee of R100,000,000 was payable by Vodacom and an ongoing license fee of 5% of Vodacom's audited net operational income generated from the provision of the licensed services is payable by Vodacom quarterly in arrears.
Vodacom's mobile cellular telecommunications license may be revoked by ICASA, with the approval of the Minister of Communications, if Vodacom is placed in liquidation or under judicial management, or if there is a change in the direct or indirect ownership of 25% of the issued voting share capital of Vodacom in any one transfer or a change in the ownership of any of the issued voting share capital of Vodacom that results in a change to the composition of one-quarter of Vodacom's board of directors, in either case without ICASA's prior written approval, Vodacom takes steps to deregister itself or is deregistered, or Vodacom fails to pay the required license fee after due demand by ICASA.
Vodacom's use of its public land mobile communications network is authorized for the provision of a GSM based national mobile cellular telecommunications service and the connection of fixed and mobile terminal equipment using GSM cellular telephony technology. For the duration of this license, Vodacom's network must conform to the GSM specification standards and recommendations of the International Telecommunications Union as adopted by South Africa, as well as with the GSM specifications set by the European Technical Standards Institute, or ETSI. ICASA is in the process of amending Vodacom's license to authorize dual band GSM900/1800 operation, consistent with recent legislative provisions mandating that ICASA grant 1800MHz spectrum to Vodacom upon application, which has been made.
Vodacom was required to comply with service and installation targets that were set forth in the terms of its mobile cellular telecommunications license and to maintain the lines so installed. Vodacom's license required it to install and thereafter to maintain 22,000 community service telephones in rural and previously disadvantaged communities or areas by June 1, 1999 and to provide network
97
coverage to 60% of the South African population within two years, and 70% within four years. In addition, one of the conditions to Vodacom's license was a requirement that it generate R1 billion of economic activity over ten years. All license requirements were achieved by Vodacom within or prior to the required time periods.
Vodacom's mobile cellular telecommunications license requires Vodacom to provide facilities to enable a caller, free of charge, to communicate with an emergency organization as swiftly as practicable and sets out certain customer service standards with which Vodacom is required to comply. This license also requires Vodacom to use reasonable endeavors to ensure that certain information is kept confidential. Vodacom is obliged to provide directory services and to liaise with other licensees in that regard. Vodacom and its service providers are not entitled to show any undue preference to any person or class of person and Vodacom must develop, publish and enforce guidelines for use by its personnel when handling inquiries and complaints from customers to whom it supplies telecommunications facilities. These guidelines must be included in its contracts with service providers and must be published and available to customers. Vodacom's license prescribes that the guidelines must address the following areas of the provision of customer services:
- •
- procedures for handling customer complaints;
- •
- the time frame for handling customer complaints through such procedures;
- •
- further recourse available to a customer who is dissatisfied with Vodacom's complaint handling procedures;
- •
- procedures adopted by Vodacom to check the accuracy of a customer's telephone account;
- •
- procedures to be adopted by Vodacom to assist customers in disaster situations; and
- •
- availability to customers of quality of service information relating to Vodacom's network services.
Vodacom was also issued a radio frequency spectrum license simultaneously with its mobile cellular telecommunications license permitting it to use the 890.2/935.2MHz to 900.0/945.0MHz radio frequency spectrum for purposes of providing mobile cellular telecommunications services, valid for the duration of Vodacom's mobile telecommunications license of fifteen years. Vodacom was also granted a license, effective July 1, 1995 for the use of an additional 1 × 2 MHz of GSM900 radio frequency spectrum under its mobile cellular telecommunications license. Pursuant to the Telecommunications Act, 103 of 1996, the three mobile cellular licensees were given the right, upon application, to be granted licenses to use 1800MHz frequency spectrum on payment of fees as determined by the Minister of Communications. In certain cases, there are existing users of this spectrum so that it may be necessary to clear the 1800MHz frequency spectrum before it can be licensed. The Telecommunications Act, 103 of 1996, envisaged that unless the Minister of Communications extended the May 30, 2002 deadline for applications, the spectrum would be issued by the end of June 2002. The Minister of Communications did not extend the May 30, 2002 deadline. Vodacom applied for 1800 MHz frequency spectrum on May 30, 2002, but has not yet been licensed. Although the Minister of Communications has announced the spectrum price on May 29, 2002, the determination has not yet been published in the Government Gazette.
In terms of the Minister's budget vote speech, the 1800 MHz spectrum price, for a 1800 MHz spectrum assignment valid for 15 years, in respect of mobile operators will comprise of the following:
- •
- R5 million per annum access fee (same as 900 MHz spectrum);
- •
- R100 000 per 1 MHz pair (same as 900 MHz spectrum fee);
- •
- 250,000 phones/numbers to emergency service organizations; and
- •
- 4 million SIM cards to needy persons.
98
A working group consisting of representatives of the departments, Education, Finance, Treasury and the operators will consult and agree on how the phones and SIM cards described above will be distributed. The phone and SIM card obligation will be shared among the three mobile operators over a period of 5 years.
Vodacom has officially requested ICASA to commence with the processing of Vodacom's application for a "permanent" assignment of the 1800 MHz spectrum, which was submitted on May 30, 2002, to ensure the issuance of the 15 year spectrum license prior to the expiration of the temporary spectrum license.
Vodacom was also issued a license to provide value-added network services on October 20, 1998. This license is a temporary license and is valid until three months after the promulgation of final regulations applicable to value-added network services by ICASA. To date, final regulations relating to value-added network services have not been promulgated. As a result of the uncertainty surrounding the regulatory regime applicable to value-added network services, ICASA adopted the practice of issuing temporary value-added network services licenses, valid up until three months after promulgation of final value-added network services regulations. This would allow final licenses to be issued incorporating the relevant regulations. Licensees will be required to reapply for licenses to provide value-added network services once final regulations are issued.
Vodacom is currently providing commercial mobile telecommunication service using 900 MHz and 1800 MHz radio frequency spectrum using a three-month temporary license scheduled to expire on July 14, 2004. The current temporary license was preceded by similar three-month temporary licenses. The current temporary license, or any future successor temporary licenses, may terminate fourteen days after the Minister's 1800 MHz spectrum price determination has been published in the Government Gazette.
Vodacom is obliged to keep and maintain statistics on complaints made to it by its customers. The statistics must be provided to ICASA at least once every six months and ICASA may, after consultation with Vodacom, publish these statistics.
All of Vodacom's number applications to ICASA were successful. As a result Vodacom has been allocated a total of 20 million numbers included in the full 072 and 082 number ranges. Vodacom has also applied for a new national destination code 076 to be allocated no later than July 2004.
Ownership Restrictions
Pursuant to the ownership regulations issued under the Telecommunications Act, 103 of 1996, Telkom is a public switched telecommunications services licensee operating in a "concentrated market," which is a market where there are fewer than five licensees. Pursuant to these regulations, no person who holds a direct or indirect 5% ownership interest in Telkom, other than the Government of the Republic of South Africa and passive institutional investors who do not participate in our management, is entitled to hold a 5% or greater ownership interest in any other licensed operator providing the same category of telecommunications services as Telkom in that concentrated market, such as the second national operator. The same prohibition applies in relation to a person holding such an ownership interest in both Vodacom and another mobile cellular telecommunications service licensee. In addition, licensees such as Telkom and Vodacom are required to maintain accurate and detailed records indicating the name, address, telephone number, e-mail address and other contact details of all persons holding a direct or indirect ownership interest of 5% or more in the licensee, the number of shares or other ownership interests owned of record by each such person, the identity of each such person entitled to vote, and must annually file such information with ICASA. ICASA is entitled, at the request of the licensee, to waive the licensee's obligations with respect to maintaining certain of the information where the licensee's issued share capital is listed on the JSE or any other internationally recognized securities exchange and the information is not kept in the ordinary course with respect to
99
such listed issued share capital and is not otherwise required by such exchanges. Under the same regulations, licensees such as Telkom and Vodacom are required to obtain the prior written approval of ICASA, in an application that is signed by the licensee, the transferor and the transferee, for any transfer of a control interest in the licensee. A control interest in a licensee includes a direct or indirect:
- •
- beneficial ownership of more than 25% of the issued share capital of that licensee;
- •
- entitlement to vote a majority of the votes that may be cast at a general meeting of that licensee;
- •
- ability to appoint or veto the appointment of a majority of the directors of that licensee;
- •
- holding company of that licensee; or
- •
- ability to direct or cause the direction of the management and policies of that licensee in a way similar to the foregoing.
The criterion to be used by ICASA in considering the application is whether the licensee will be able to satisfy its obligations under its licenses and comply with the Telecommunications Act, 103 of 1996, and the regulations thereunder after the transfer concerned. Any transfer in violation of these regulations is void.
Other Regulatory Issues
We are subject to the provisions of the Competition Act, 89 of 1998, which, together with the Telecommunications Act, 103 of 1996, regulates uncompetitive behavior in the communications industry in South Africa. The Competition Commission and ICASA have come to an arrangement regarding jurisdictional issues existing between the two regulations. Under the provision of these two Acts, we may not act uncompetitively or unfairly discriminate against any person.
The Republic of South Africa is a member of the World Trade Organization and is a signatory to the Basic Agreement on Telecommunications. The commitments made by the Republic of South Africa are embodied in the provisions of the Telecommunications Act, 103 of 1996, in respect of the liberalization of the South African telecommunications industry.
The Regulation of Interception of Communications and Provisioning of Communication-related Information Act, 70 of 2002, requires Telkom, Vodacom and other licensees to install equipment and put in place procedures that would allow certain agencies of the Government of the Republic of South Africa to intercept and monitor communications over our respective networks and to retain records and copies of such communications for a prescribed period of time commencing in July 2003. The Minister of Communications has not, however, prescribed the type of communications related information to be stored and the manner and period such information must be stored. The storage period is expected to be between three and five years from the date of transmission. Telecommunications service providers must obtain and retain full information relating to the identity of each customer. Telkom's and Vodacom's compliance with this requirement will require Telkom and Vodacom to incur substantial set-up and maintenance time and costs. Our estimated capital expenditure and the extent of the cost recoverability have not been determined.
In certain South African judgments, we have been regarded as an organ of state. In addition, some legislation, notably the South African Promotion of Administrative Justice Act, 3 of 2000, have provisions that identify us as rendering a public service. As a result, some decisions that would otherwise be normal business decisions in other listed companies need to go through a consultative process with the Government before we can make them.
100
Finally, our subsidiary Swiftnet is required, in terms of its license, to have at least 30% of its shares held by historically disadvantaged individuals or entities. In accordance with such requirement, a black economic empowerment investor acquired a 40% equity stake in Swiftnet, subject to its ability to raise the necessary funding. The black economic empowerment investor failed to meet its obligations resulting in Telkom reacquiring this stake thus placing Swiftnet in breach of its license requirement. ICASA has required Swiftnet to remedy the breach of its license. If not remedied, there is a risk of Swiftnet's license being revoked. Telkom, in consultation with ICASA, is in the process of openly tendering to obtain a suitable black economic empowerment partner. ICASA is being kept informed of all proceedings.
The Information Communication and Technology, or ICT, black economic empowerment charter process commenced on September 16, 2003 at a meeting held in Johannesburg which was attended by all major ICT industry stakeholders and the Government of the Republic of South Africa. The ICT Charter seeks to establish a self-regulatory framework for the promotion of transformation in the ICT sector through the establishment of a balanced scorecard on empowerment. The scoring of the balanced scorecard will ultimately determine the black economic empowerment status of a company intending to engage Government when applying for a license in a regulated economic activity, entering into a public-private partnership, or engaging in any economic activity in South Africa. As such this process is of vital importance to Telkom and Vodacom. Telkom and Vodacom have been actively involved in the development of the BEE Charter for the ICT sector. The charter is expected to be finalized by June 25, 2004.
101
Our business consists of two segments:
- •
- a fixed-line segment; and
- •
- a mobile segment.
Our fixed-line segment consists of our fixed-line business, which provides fixed-line access and data communications services through Telkom; directory services through our 64.9% owned Telkom Directory Services subsidiary; and wireless data services through our wholly-owned Swiftnet subsidiary. Our mobile segment consists of our 50% interest in Vodacom, our joint venture. Our group operational structure is as follows:
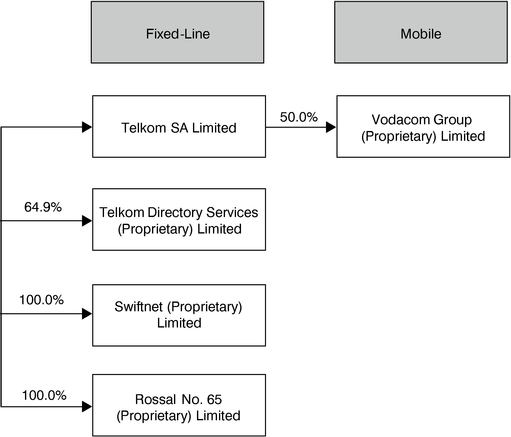
102
Fixed-line
Our principal executive offices are located at Telkom Towers North, 152 Proes Street, Pretoria 0002, Republic of South Africa and comprise approximately 27,000 square meters of office space. In addition, our information technology center comprises approximately 22,000 square meters and our network operations center comprises approximately 24,000 square meters. Our executive offices are leased from the Telkom Retirement Fund under a lease agreement which will expire on January 31, 2019. The total area of all our properties as of March 31, 2004 comprised approximately 2.5 million square meters consisting of approximately 1.8 million square meters of owned and other type properties and approximately 700,000 square meters of leased properties. As of March 31, 2004, we leased approximately 234,000 square meters of office space pursuant to lease agreements. Except as stated to the contrary below, our leases expire at various times ranging from one month to five years.
Our properties primarily consist of 2,459 electronic telephone exchanges, 49 microwave transmission towers, three satellite stations, 136 customer service branches, 252 customer service centers, three information technology centers and one network management center.
Details of the principal immovable property leased and owned by our fixed-line business as of March 31, 2004 are as follows:
| Type of Property | Leased or Owned | Lessor | Lessee | Location | Current Monthly Rental | Expiration date | ||||||
|---|---|---|---|---|---|---|---|---|---|---|---|---|
| Head office | Leased | Telkom Retirement Fund | Telkom | 152 Proes Street, Pretoria South Africa | R1,075,950 | Jan 31, 2019 | ||||||
| Equipment related | Leased | Telkom Retirement Fund | Telkom | 178 Vermeulen Street, Pretoria South Africa | R358,314 | Jan 31, 2019 | ||||||
| Information technology center | Leased | Telkom Retirement Fund | Telkom | 21 Teddington Street, Tygerberg, Bellville South Africa | R890,555 | Jan 31, 2019 | ||||||
| Network operations center | Owned | n/a | n/a | 55 Oak Avenue, Highveld, Centurion South Africa | n/a | n/a | ||||||
| Information Technology, Technopark | Owned | n/a | n/a | 91 Oak Avenue Highveld, Centurion, South Africa | n/a | n/a | ||||||
| National Business Solutions Center | Owned | n/a | n/a | 61 Oak Avenue, Highveld, Centurion, South Africa | n/a | n/a | ||||||
| Hillbrow microwave tower | Owned | n/a | n/a | Claim Street, Hillbrow, Johannesburg South Africa | n/a | n/a | ||||||
| Pretoria microwave tower | Owned | n/a | n/a | Devenish Street, Groenkloof, Pretoria South Africa | n/a | n/a | ||||||
| Hartebeesthoek satellite station | Owned | n/a | n/a | Old Krugersdrop Road, On The Farm Hartebeesthoek South Africa | n/a | n/a | ||||||
| Electronic telephone exchange | Owned | n/a | n/a | Sivewright Street, New Doornfontein, Johannesburg South Africa | n/a | n/a |
Our leased and owned property facilities are managed pursuant to a management agreement with Total Facilities Management Company (Proprietary) Limited, a company incorporated in the Republic of South Africa, of Meersig Building, 48 West Avenue, Centurion. The consideration paid to Total
103
Facilities Management Company for management services in the year ended March 31, 2004 was R196 million. The management agreement terminates on March 31, 2011.
Mobile Communications
Vodacom's principal executive offices are located at Vodacom Corporate Park, 082 Vodacom Boulevard, Vodavalley, Midrand, 1683, Republic of South Africa. Vodacom's South African properties primarily consist of 5,713 base transceiver stations, 231 base station controllers, 33 mobile switching centers including VLR's and gateways, a network management center and a customer service center. The total leased area of all of Vodacom's properties, excluding its network and retail outlets, was approximately 149,800 square meters as of March 31, 2004, consisting of approximately 102,000 square meters of owned properties and approximately 47,500 square meters of leased properties. Vodacom's leases expire at various times ranging from 1 month to 15 years.
Vodacom leases transmission lines from Telkom under a lease agreement for the provision of its backbone infrastructure.
104
Item 5. Operating and Financial Review and Prospects
You should read the following discussion together with the consolidated financial statements of the Telkom Group and Vodacom and the notes thereto included elsewhere in this annual report. The Telkom Group and Vodacom have prepared their financial statements in accordance with IFRS, which differs in certain respects from US GAAP. For a description of the principal differences between IFRS and US GAAP relevant to the financial statements of the Telkom Group and Vodacom and a reconciliation to US GAAP of net income and profit and shareholders' equity, see note 47 of the notes to the audited consolidated financial statements of the Telkom Group as of and for the three years in the period ended March 31, 2004 and note 48 of the notes to the audited consolidated financial statements of Vodacom as of and for the three years in the period ended March 31, 2004.
Overview of our Business
We are currently the sole provider of public switched telecommunications services in South Africa, providing fixed-line voice and data services. In addition, we participate in the South African mobile communications market through our 50% interest in Vodacom, the largest mobile communications network operator in South Africa based on total reported customers. We also provide directory services and other services through our subsidiaries, Telkom Directory Services (Proprietary) Limited and Swiftnet (Proprietary) Limited.
We offer business, residential and payphone customers a wide range of services and products, including:
- •
- fixed-line voice services, including subscription and connection services, local, long distance, fixed-to-mobile and international voice services, interconnection and transit communications services, international voice over internet protocol services, subscription based value-added voice services, customer premises equipment sales and directory services;
- •
- fixed-line data services, including domestic and international data transmission services, such as leased lines and packet-based services, managed data networking services and internet access and related information technology services;
- •
- directory and wireless data services through our Telkom Directory Services and Swiftnet subsidiaries; and
- •
- mobile communications services, including voice and data services, value-added services and handset sales through Vodacom.
Principal Factors That Affect our Results of Operations
Liberalization of the South African telecommunications market and increasing competition
We had the exclusive right to provide public switched telecommunications services, including international telephone services, in the Republic of South Africa until May 7, 2002. In May 2002, Sentech was issued licenses to provide international carrier of carriers services and multimedia services. Due to the continuing liberalization of the communications market, we expect to face competition from a second national operator. At the end of the original bid process for the second national operator, the only two bids received were rejected by ICASA. Subsequently, the Minister of Communications initiated an alternative bid process. An evaluation committee appointed by the Minister of Communications recommended that the Minister pre-qualify two of the four bidders for this license for consideration by ICASA. On December 18, 2003, the Minister of Communications announced that she would grant a license to a second national operator that will be 30% owned by two entities beneficially owned by the South African Government, 19% owned by a black economic empowerment consortium
105
and 26% owned by the two bidders recommended by the evaluation committee for pre-qualification in the alternative bid process, with the remaining 25% of the second national operator being held by the Government for sale to a strategic equity investor to be identified in the future. The Minister of Communications has indicated that she expects ICASA to issue the second public switched telecommunications services license in 2004.
We also expect to face additional competition from small business operators in areas with a teledensity of less than 5%. The Minister of Communications has identified 27 of these underserviced areas and has issued an invitation to apply for licenses in ten of them. ICASA has submitted its recommendations to the Minister of Communications for the granting of the licenses to successful bidders in seven of the ten areas in which licenses could have been issued. The Minister of Communications has granted licenses to four successful bidders on June 3, 2004 and it is expected that these licenses will be issued in 2004. Further competition may arise as a result of an assessment by the Minister of Communications of the feasibility of issuing additional licenses from May 2005.
In addition, our fixed-line business has faced competition from mobile communications network operators, including Vodacom and value-added network operators for a number of years. In recent periods, our fixed-line business has experienced significant customer migration from our fixed-line services to mobile services, as well as substitution of calls placed using mobile services rather than our fixed-line service. We also compete with other service providers who use least cost routing technology that enables fixed-to-mobile calls from corporate private branch exchanges to bypass our network by being transferred directly to mobile networks.
The current South African mobile communications market consists of three mobile communications network operators, Vodacom, MTN and Cell C. While the mobile market in South Africa has continued to grow in the year ended March 31, 2004, Cell C has captured an estimated 11% market share since its inception in November 2001. Vodacom's customer acquisition and retention costs have increased primarily as a result of increased competition in the South African mobile communications market. ICASA has indicated that it intends to license global mobile personal communications services by satellite and to conduct a feasibility study on the licensing of a fourth mobile operator in 2004 or later. Sentech owns and operates satellite transmission systems and in August 2003 launched a packaged, always-on, bi-directional broadband service via satellite that allows users anywhere in South Africa to get connected, regardless of whether landlines are available. In January 2004, Sentech launched a wireless high-speed internet access service offering speeds equivalent to fixed-line options like ADSL.
We expect competition in the fixed-line and mobile communications sectors to continue to increase. As competition intensifies, the main challenges our fixed-line business faces are continuing to improve customer loyalty and maintaining our leadership in the South African communications market. As a result of increasing competition, we anticipate a reduction in overall average tariffs and market share in our fixed-line business. Increased future competition may result in a reduction in Vodacom's overall average tariffs and market share and an increase in its customer acquisition and retention costs. However, we expect competition to stimulate overall market demand for communications services.
South African fixed-line communications market
While South Africa features a highly developed financial and legal infrastructure at the core of its economy, it also suffers from high levels of unemployment and income disparity. With respect to the economically disadvantaged portion of the population, communications providers must compete with other basic necessities for customers' limited resources. In a number of areas of the country and for particular portions of the population, mobile services are the preferred alternative to fixed-line services.
To substantially meet our license targets, we installed a significant number of access lines that proved to be uneconomic and have since been disconnected. Taking into account recent disconnections,
106
the number of our fixed lines in service decreased by a compound annual rate of 1.0% over the five years ending March 31, 2004. Although the fixed-line penetration rate in South Africa was only 10.4% as of March 31, 2004, due to the diverse rural geography and demographic factors in South Africa, we do not expect fixed-line penetration rates to increase significantly in the near term. In light of these market conditions, we will seek to maximize the utilization of existing capacity, largely through increased sales of our prepaid and other products.
Significant growth in mobile communications market
South Africa has experienced significant growth in the number of mobile users since GSM mobile services were launched in the country in 1994. The penetration rate for mobile users increased from an estimated 2.4% at March 31, 1997 to an estimated 39.0% at March 31, 2004. As a result, Vodacom's revenues increased 18.7%, 22.5% and 21.6% in the 2004, 2003 and 2002 financial years, respectively. While we believe the mobile penetration rate will continue to increase, we do not expect that it will continue to grow at the same high rates that it has experienced in the recent past. Consequently, Vodacom is placing increased focus on customer retention and maintaining its market leadership by providing innovative value-added services and superior customer service in addition to its previous focus on customer acquisition, as well as selective growth in other African countries.
A large part of the growth in mobile services was due to the success of prepaid services. Approximately 85.2% of Vodacom's South African mobile customers were prepaid customers at March 31, 2004. Vodacom expects the number of prepaid mobile users to continue to grow as a percentage of total mobile users. The increasing percentage of prepaid users, who tend to have lower average usage, has resulted in decreasing overall average revenue per customer, despite increasing average revenue per contract customer. Vodacom believes that the overall decline in its total ARPU in South Africa in recent years has begun to slow primarily due to the impact of new, higher ARPU prepaid products, such as 4U, the continued growth in contract ARPU and slower growth rates in overall customers. In the 2004 financial year, total ARPU in South Africa declined by 3.3% due to the continued dilution as a result of the higher proportion of new, lower ARPU prepaid connections than contract connections. In the 2003 financial year, Vodacom's total ARPU in South Africa remained relatively constant, increasing 0.5%. Since its inception, the 4U offering has proved highly successful and at March 31, 2004, 67.9% of Vodacom's prepaid customers in South Africa were 4U customers.
Tariff rebalancing
We have made significant progress since 1997 in rebalancing tariffs in our fixed-line segment in order to reduce the need for future tariff adjustments in the face of competition. Our tariff rebalancing program has resulted in a decrease in the ratio of tariffs for long distance calls to all destinations over 200 km compared to tariffs for local calls from 13.2:1 as of March 31, 1997 to 2.7:1 as of March 31, 2002. The ratio of tariffs for long distance calls to all destinations over 200 km compared to tariffs for local calls was 2.6:1 as of March 31, 2004. The weighted average effective price per minute to all international destinations decreased approximately 44% from January 1, 1998 to March 31, 2002. We have largely completed our tariff rebalancing program and on January 1, 2003, we increased our long distance tariffs by 12.5% based on the increase in the consumer price index for the twelve months ended September 30, 2002 and increased the average tariff to all international destinations by approximately 5.0%.
The rebalancing of tariffs was performed within a price cap mechanism imposed by regulations that limited increases in the overall tariffs in a basket of specified services that we previously had the exclusive right to provide. Approximately 80% of Telkom's operating revenue in the year ended March 31, 2004 was included in this basket. Prices on these services are filed with ICASA for approval. Revenue from services in the basket may not be used to subsidize other products and services outside the basket. Currently, the overall tariffs for all services in the basket may not be increased by more
107
than 1.5% below inflation in South Africa, based on the consumer price index and measured using revenue for the services in the basket at constant volumes for the prior year. In addition, the overall tariffs for a sub-basket of services provided to residential customers may not be increased by more than 1.5% below inflation in South Africa, based on the consumer price index and measured using revenue for the services in the basket at constant volumes for the prior year. In addition, prior to January 1, 2003, the price of any individual product or service included in the basket could not be increased by more than 20% above inflation in South Africa in any year. Effective January 1, 2003, the price of any individual product or service included in the basket may not be increased by more than 5% above inflation in South Africa in any year.
In December 2002, as a result of an out-of-court settlement related to our tariff increase in the prior year, ICASA approved our tariff filing providing for a 9.5% increase in the overall tariffs for all services in the basket effective January 1, 2003, based on the increase in the consumer price index for the twelve months ended September 30, 2002 of 12.5%. Statistics South Africa Limited subsequently revised the calculation of the consumer price index for the twelve months ended September 30, 2002 downward to 11.2%, although our tariffs were not affected. ICASA approved a 2.2% increase in the overall tariffs for all services in the basket effective January 1, 2004. ICASA has indicated its intention to conduct a review of the price control regime in 2004, however, a process and timetable for the review have not been announced. See Item 3. "Key Information—Risk Factors—Risks Related to Regulatory and Legal Matters—Our tariffs are subject to approval by the regulatory authorities, which may limit our flexibility in pricing and could reduce our net profit. Vodacom's revenue and net profit could decline if wholesale price controls are imposed on it." and Item 4. "Information on the Company—Business Overview—Fixed-line Communications—Fees and Tariffs—Tariff Rebalancing" and Item 4. "Information on the Company—Regulation and License Requirements."
Interconnection agreements
Telkom amended its interconnection agreements with Vodacom and MTN and entered into a new interconnection agreement with Cell C effective in November 2001. Telkom's amended interconnection agreements increased the portion of fixed-to-mobile tariffs retained by Telkom. The adjustments also eliminated volume discounts previously offered to mobile operators for termination of mobile-to-fixed calls on our fixed-line network and equalized termination rates payable by Telkom to mobile operators for incoming international calls with national fixed-to-mobile termination rates. Telkom's amended interconnection agreements also increased the discount offered on outgoing international calls originating on the mobile networks in order to better prepare us for increased competition from Sentech Limited and the second national operator and from small business operators in areas with a teledensity of less than 5%. Telkom's interconnection agreements provide for annual increases in the portion of fixed-to-mobile tariffs retained by Telkom and the termination rates payable by Telkom to the mobile operators as well as the termination rates payable to Telkom from the mobile operators for mobile-to-fixed calls commencing in January 2003.
Effective in November 2001, Vodacom and MTN entered into an amended interconnection agreement with each other and new interconnection agreements with Cell C. These agreements increased the amounts mobile operators are required to pay one another for the termination of mobile-to-mobile calls from November 2001. These amendments also introduced an interconnection rate of 4 SA Cents for the termination of calls by mobile operators for calls originating from other mobile operator's community service phones, whereas previously these calls were terminated at no charge. These amendments have increased Vodacom's payments to other operators, while increasing the interconnection revenue received by Vodacom.
See Item 4. "Information on the Company—Business Overview—Fixed-line Communications—Fees and tariffs—Interconnection tariffs."
108
Vodacom's and Telkom's increasing interconnection payments
Vodacom and Telkom have experienced a significant change in the traffic mix as mobile customers increased relative to fixed-line customers. This resulted in an increasing percentage of calls from Vodacom's network and our fixed-line network terminating on other mobile networks rather than our fixed-line network. Vodacom's interconnection payments have increased and its margins have decreased because the cost of terminating calls on other mobile networks is higher than the cost of terminating calls on Telkom's fixed-line network. As a result, Vodacom's South African net interconnect revenue has been declining in recent years. Similarly, Telkom has incurred increased payments to other operators as a result of the growth in interconnection traffic for fixed-line calls terminating on other mobile networks. If mobile customers continue to increase and there is little or no growth in fixed-line customers, this trend could continue and Vodacom's and Telkom's margins and net profit could decline.
Fixed-line network modernization and line roll-out program
We spent approximately R3.9 billion ($617 million) on fixed-line capital expenditures in the year ended March 31, 2004, which was lower than budgeted fixed-line capital expenditure for the 2004 financial year of R5.0 billion primarily as a result of more stringent investment criteria for capital investment in our fixed-line segment and savings resulting from the relative strength of the Rand against the US Dollar and Euro. In the future, we intend to continue to selectively invest in our fixed-line segment on a smaller scale based on customer demand and economic viability. We also intend to concentrate capital expenditures in growing business areas, such as data services, and for improving the quality and efficiency of our network and support systems. We have budgeted to spend approximately R4.6 billion in the year ended March 31, 2005 on fixed-line capital expenditures. The increase in budgeted fixed-line capital expenditures in the 2005 financial year is due to increased capital investment on operational support systems and increased provisions for regulatory capital investment, primarily carrier pre-selection and monitoring and interception. Our capital expenditures are continuously examined and evaluated against the economic benefit and may be revised in light of changing business conditions, investment opportunities and other business factors.
The following table shows the amounts included in our total fixed-line capital expenditure for the periods indicated.
Fixed-line capital expenditure
| | Year ended March 31, | |||||||||
|---|---|---|---|---|---|---|---|---|---|---|
| | 2000 | 2001 | 2002 | 2003 | 2004 | |||||
| | ZAR | ZAR | ZAR | ZAR | ZAR | |||||
| | (unaudited) (in millions) | |||||||||
| Base expansion and core network | 5,011 | 4,797 | 2,831 | 1,662 | 1,632 | |||||
| Network evolution | 954 | 985 | 1,906 | 968 | 668 | |||||
| Efficiencies and improvements | 1,827 | 1,985 | 1,743 | 1,226 | 1,201 | |||||
| Company support and other | 676 | 530 | 482 | 157 | 361 | |||||
| Total fixed-line capital expenditure | 8,468 | 8,297 | 6,962 | 4,013 | 3,862 | |||||
| Capital expenditure as a percentage of fixed-line operating revenue (%) | 36 | 31 | 25 | 14 | 13 | |||||
Volatility of the Rand and adoption of IAS39
The value of the Rand as measured against the Dollar has fluctuated considerably in recent years. The Rand declined from R5.90 per $1.00 at December 31, 1998 to R12.00 per $1.00 at December 31, 2001. However, during the years ended March 31, 2003 and 2004, the value of the Rand as measured
109
against the Dollar has increased from R11.38 per $1.00 as of March 29, 2002 to R7.90 per $1.00 as of March 31, 2003 and R6.32 per $1.00 as of March 31, 2004. Telkom's policy is to hedge its foreign denominated debt and operating and capital expenditures. Vodacom's policy is to hedge its foreign denominated commitments for operating and capital expenditures for its South African operations. Decreases in the value of the Rand as measured against other currencies could increase the future cost in Rand terms of our foreign denominated debt, our foreign denominated financing costs and our foreign denominated operating and capital expenditures. During the year ended March 31, 2002, Telkom and Vodacom prospectively adopted IAS39—Recognition and Measurement of Financial Instruments. Under this standard, fair value adjustments on financial instruments are recorded in the Telkom Group's consolidated financial statements in the period they occur. The effect of the application of this new standard and foreign currency revaluations increased our consolidated opening retained earnings balance by R584 million and increased our consolidated profit before tax by R635 million in the 2002 financial year. The effect of the application of this standard decreased our consolidated profit before tax by R1,285 million and R776 million in the 2003 and 2004 financial years, respectively, due to the increase in the value of the Rand as measured against the Dollar and the Euro in those years. Future exchange rate volatility is expected to continue to materially impact our future results due to the large volume of foreign exchange contracts entered into by us to cover our foreign currency denominated debt, financing and operating costs and capital expenditures.
Strategic equity investor participation
We have significantly benefited over the past seven years from the knowledge and experience of our strategic equity investors, SBC Communications and Telekom Malaysia. We are a party to a strategic services agreement with our strategic equity investors pursuant to which they had the ability to exercise effective operational and managerial control over us until May 2002. Our strategic equity investors provided us with a number of management and operational services, including participation in Telkom's executive committee and provided us with a number of key employees who served in various management and executive officer positions. Since May 2002, our strategic equity investors no longer exercise effective operational and managerial control over us, but their nominees continue to occupy key managerial positions, including chief operating officer, chief strategic officer and financial controller, two of whom are board members, and they participate in Telkom's executive committee and assist us with strategic direction. At March 31, 2004, we had 18 strategic equity investor employees compared to 32 at March 31, 2003 and 39 at March 31, 2002. From May 2004, Thintana Communications only has the right to appoint six positions, but Telkom has requested 12 additional positions to be filled by our strategic equity investors pursuant to the strategic services agreement. We make payments to our strategic equity investors for these services as described in Item 7. "Major Shareholders and Related Party Transactions—Related Party Transactions—Shareholder Arrangements—Strategic Services Agreement."
Vodacom's sale of non-core assets and restructuring of service providers and continued consolidation of service providers.
In the 2002 and 2001 financial years Vodacom sold off all its non-core assets in line with its strategy to focus on its core mobile business. These companies included Film Fun Holdings (Proprietary) Limited, a television rental company; Vodacom World Online (Proprietary) Limited, an internet company; and Vodacom Sport & Entertainment (Proprietary) Limited, Vodacom's former sponsorship and event management company. In the 2001 financial year, Vodacom consolidated a number of previously partially owned service providers. The sale of Vodacom's non-core assets in the 2002 financial year, the write-off of Vodacom's investment in Globalstar, a satellite network in the 2001 financial year and the costs incurred in restructuring Vodacom's service providers in the 2001 financial year resulted in a profit of R56 million in the 2002 financial year. These amounts are attributable to our interest in Vodacom, 50% of which are included in the Telkom Group's consolidated operating
110
expenses. In the future, Vodacom intends to focus on its core mobile business. See also "—Recent Developments—Vodacom's acquisition of 51% of Smartphone SP (Proprietary) Limited."
Theft, vandalism, network fraud, payphone fraud and non-licensed operators
We have historically experienced significant cable theft, theft of solar panels and wireless communications equipment, vandalism of payphones, network fraud, such as non-licensed calls, and payphone fraud in our fixed-line business. Theft and vandalism have caused our fixed-line fault rates to increase, and the repair time on our network and the downtime associated with such faults and network fraud and payphone fraud have resulted in lost operating revenue and significant costs. We have also lost operating revenue to non-licensed operators providing telecommunications services in South Africa. If we are unable to minimize theft, vandalism, network fraud and payphone fraud, or if we continue to lose operating revenue to non-licensed operators in our fixed-line business, our fixed-line fault rates could increase and our operating revenue and net profit could decline.
Customer non-payments
We have historically experienced significant bad debts in our fixed-line business, particularly in impoverished areas where we were required to expand our network pursuant to our license obligations. We disconnected a substantial number of telephone lines in response to these non-payments primarily in our 2002 and 2001 financial years. We incurred bad debt expenses of R965 million and R671 million in our fixed-line segment during the years ended March 31, 2002 and 2001, respectively. To control our bad debts, we implemented a more rapid disconnection policy for non-payments, continued and improved credit vetting and controls, implemented usage limits based on customer credit limits, instituted a better collection program, continued to promote our prepaid fixed-line services and encouraged non-paying postpaid customers to migrate to prepaid services. Bad debt expense in our fixed-line segment was R228 million and R215 million in the 2004 and 2003 financial years, respectively. We cannot assure you that bad debt expense and bad debt write-offs in our fixed-line segment will remain at these levels and will not increase in the future.
Fixed-line license obligations
Our public switched telecommunications services license included service and fixed line roll-out targets that were required to be met through May 7, 2002. We substantially met all of our fixed-line service and line roll-out targets with the exception of our residential fault rate target, our aggregate fixed-line roll-out target and targets which required us to provide service to underserviced villages and to replace analog lines with digital lines.
We elected not to roll-out lines in our last year of exclusivity in areas where it was not economical. As a result, we missed our line roll-out target by 16,448 lines. Our license required us to pay penalties for missing the service quality and line roll-out targets contained in our license. Based on the previous requirements contained in our existing license, we incurred total penalties for failing to meet these targets of approximately R15 million. The amount of these penalties has not been challenged by ICASA. We do not currently anticipate that we will have any additional fixed line roll-out targets.
Transformation of our fixed-line business from a majority government owned entity to a market and profit-oriented enterprise
We are in the final stages of changing the orientation of our fixed-line business from a majority governmental owned entity to a market and profit-oriented business. To achieve this, we began a transformation program in 1997 with the help of our strategic equity investors to reorganize our fixed-line business along functional lines. Our focus was to change our corporate culture and improve
111
the skills of our South African employees, increase our marketing efforts, outsource non-core operations and manage revenue generation and operating expenses more effectively.
Employee-related expenses are a significant component of our total fixed-line operating expenses. The number of Telkom's employees declined by approximately 24,453 positions from March 31, 1997 through March 31, 2004. We spent R302 million, R244 million and R373 million in the years ended March 31, 2004, 2003 and 2002, respectively, on our employee restructuring program. We intend to continue to reduce our fixed-line headcount over the next few years.
In addition, we have identified and outsourced six non-core activities since March 31, 2000. We received R804 million from our outsourcing program, which we have utilized to further upgrade and expand our fixed-line network, invest in our core operations and reduce debt.
Recent Developments
Vodacom's Nigerian operations
Vodacom entered into a five year management agreement with VEE Networks Limited effective April 1, 2004, pursuant to which Vodacom would have managed VEE Networks' cellular network operations in Nigeria with the intention of acquiring an equity stake in the business. On May 31, 2004, however, Vodacom announced that it had elected to terminate the management contract and abandon its plan to make an equity investment in VEE Networks in Nigeria. Vodacom will continue to provide technical support to VEE Networks for a period of up to six months. Vodacom is currently a defendant in certain legal proceedings related to its activities in Nigeria prior to the termination of the Management Agreement. Vodacom is not currently able to estimate the outcome or extent of any claims or damages for which it may be liable if it is not successful in defending these claims.
Vodacom's acquisition of 51% of Smartphone SP (Proprietary) Limited
As part of its broader strategy of margin leadership in South Africa, Vodacom is continuing the process of obtaining control of its service providers. On March 1, 2004, Vodacom purchased 51% of Smartphone for R234 million acquiring an additional 2.5 million prepaid customers. On April 16, 2004, Smartphone purchased an 85.75% equity stake in Smartcom (Proprietary) Limited for R77.2 million acquiring an additional 40,000 contract customers. Vodacom directly controlled 65.3% of its total customer base, 70.6% of its contract customer base and 97.8% of its prepaid customer base in South Africa as of March 31, 2004.
Summary of Operations
Our operating results reflect the factors and changing patterns described in "—Principal Factors That Affect Our Results of Operations" above. The key business changes during the three years ended March 31, 2004 were:
- •
- increased revenue and profitability from our mobile segment due to an increased number of mobile customers;
- •
- increased revenue and profitability in our fixed-line segment;
- •
- increased revenue and profitability from our mobile and fixed-line data services;
- •
- decreased fixed access lines in service primarily as a result of customer migration to mobile services and lower connections, as well as higher disconnections primarily in the 2002 and 2003 financial years, all of which adversely impacted fixed-line revenue;
- •
- increased substitution of calls placed using mobile services rather than our fixed-line service adversely impacting fixed-line traffic revenue;
112
- •
- increased weighted average fixed-line local traffic tariffs and decreased weighted average fixed-line long distance traffic tariffs and international traffic tariffs in the 2002 and 2003 financial years due to tariff rebalancing, although we increased fixed-line long distance and international traffic tariffs as of January 1, 2003 as we have completed our tariff rebalancing;
- •
- decreased net South African interconnection margins in our mobile segment and fixed-line segment due to the increasing percentage of calls from Vodacom's network and our fixed-line network terminating on other mobile networks rather than our fixed-line network and the fact that the cost of terminating calls on other mobile networks is higher than the cost of terminating calls on Telkom's fixed-line network, as well as higher interconnection tariffs under the amended interconnection agreements;
- •
- improved operating efficiency in our fixed-line segment by reducing the numbers of employees and vehicles and consolidating properties as we focused on improving the profitability of our fixed-line segment;
- •
- reduced fixed-line capital expenditure after having made significant capital expenditures in prior years for network modernization and line roll out in order to comply with our license obligations and prepare for competition, however, fixed-line capital expenditure is currently budgeted to increase in the 2005 financial year due to increased capital investment on operational support systems and increased provisions for regulatory capital investment, primarily carrier pre-selection and monitoring and interception; and
- •
- continued capital expenditure in our mobile segment throughout the period to support mobile expansion in South Africa and other African countries.
Our operating structure comprises two segments, fixed-line and mobile. Our fixed-line segment provides fixed-line voice and data communications services through Telkom; directory services through our 64.9% owned subsidiary, Telkom Directory Services; and wireless data services through our wholly-owned subsidiary, Swiftnet. Our mobile segment consists of our 50% interest in Vodacom.
We proportionately consolidate Vodacom's results into the Telkom Group's consolidated financial statements. This means that we include 50% of Vodacom's results in each of the line items in the Telkom Group's consolidated financial statements and in the period-to-period discussion below. We fully consolidate our Telkom Directory Services and Swiftnet subsidiaries in the Telkom Group's consolidated financial statements.
Reclassifications have occurred in each of the years ending March 31, 2003 and 2004. In the 2003 financial year, we reclassified some of the items previously included in selling, general and administrative operating expenses and investment income into other income, a new line item in the Telkom Group's consolidated income statements. The reclassifications in the 2003 financial year reduced operating profit and EBITDA by R22 million in the 2002 financial year. In the 2004 financial year, we reclassified discounts offered on mobile-to-fixed interconnect and discounts on leased line facilities to mobile operators from payments to other operators in operating expenses to an offset to operating revenue. We also reclassified costs in respect of asset write-offs from selling, general and administrative expenses to depreciation, amortization, impairments and asset write-offs; costs in respect of losses on the disposal of property, plant and equipment and investments from selling, general and administrative expenses to other income; and insurance costs paid to Debis for our vehicle fleet from operating leases to services rendered in the 2004 financial year. In addition, we revised our presentation to remove other income from operating expense. The reclassifications in the 2004 financial year had no effect on operating profit in prior years, but reduced operating revenue by R110 million and R93 million and increased EBITDA by R445 million and R205 million in the 2002 and 2003 financial years, respectively. Other income has been excluded from fixed-line and mobile operating revenue and operating expenses in the segmental discussion below.
113
Results of Operations
Year ended March 31, 2004 compared to year ended March 31, 2003 and year ended March 31, 2002
Consolidated results
The following table shows information related to our operating revenue, operating expenses, operating profit, net profit, profit margin, EBITDA and EBITDA margin for the periods indicated.
Telkom Group's segmental results
| | Year ended March 31, | | | ||||||||||||||
|---|---|---|---|---|---|---|---|---|---|---|---|---|---|---|---|---|---|
| | 2002 | 2003 | 2004 | 2003/2002 | 2004/2003 | ||||||||||||
| | ZAR | % | ZAR | % | ZAR | % | % change | % change | |||||||||
| | (in millions, except percentages) | ||||||||||||||||
| Operating revenue(1) | 34,087 | 100.0 | 37,507 | 100.0 | 40,795 | 100.0 | 10.0 | 8.8 | |||||||||
| Fixed-line | 27,866 | 81.7 | 29,542 | 78.8 | 30,906 | 75.8 | 6.0 | 4.6 | |||||||||
| Mobile | 8,075 | 23.7 | 9,890 | 26.4 | 11,739 | 28.8 | 22.5 | 18.7 | |||||||||
| Intercompany eliminations | (1,854 | ) | (5.4 | ) | (1,925 | ) | (5.2 | ) | (1,850 | ) | (4.6 | ) | 3.8 | (3.9 | ) | ||
| Other Income(2) | 143 | 100.0 | 233 | 100.0 | 98 | 100.0 | 62.9 | (57.9 | ) | ||||||||
| Fixed-Line | 127 | 88.8 | 198 | 85.0 | 73 | 74.5 | 55.9 | (63.1 | ) | ||||||||
| Mobile | 16 | 11.2 | 35 | 15.0 | 25 | 25.5 | 118.8 | (28.6 | ) | ||||||||
| Operating expenses(3) | 30,039 | 100.0 | 31,226 | 100.0 | 31,805 | 100.0 | 4.0 | 1.9 | |||||||||
| Fixed-line | 25,568 | 85.1 | 25,392 | 81.3 | 24,508 | 77.1 | (0.7 | ) | (3.5 | ) | |||||||
| Mobile | 6,275 | 20.9 | 7,759 | 24.9 | 9,147 | 28.8 | 23.6 | 17.9 | |||||||||
| Intercompany eliminations | (1,804 | ) | (6.0 | ) | (1,925 | ) | (6.2 | ) | (1,850 | ) | (5.9 | ) | 6.7 | (3.9 | ) | ||
| Operating profit | 4,191 | 100.0 | 6,514 | 100.0 | 9,088 | 100.0 | 55.4 | 39.5 | |||||||||
| Fixed-line | 2,425 | 57.9 | 4,348 | 66.7 | 6,471 | 71.2 | 79.3 | 48.8 | |||||||||
| Mobile | 1,816 | 43.3 | 2,166 | 33.3 | 2,617 | 28.8 | 19.3 | 20.8 | |||||||||
| Intercompany eliminations(4) | (50 | ) | (1.2 | ) | 0 | 0.0 | 0 | 0.0 | n/a | n/a | |||||||
| Operating profit margin (%) | 12.3 | 17.4 | 22.3 | ||||||||||||||
| Fixed Line | 8.7 | 14.7 | 20.9 | ||||||||||||||
| Mobile | 22.5 | 21.9 | 22.3 | ||||||||||||||
| Intercompany eliminations | 2.7 | — | — | ||||||||||||||
| Net profit | 1,221 | 100.0 | 1,630 | 100.0 | 4,523 | 100.0 | 33.5 | 177.5 | |||||||||
| Net profit margin (%) | 3.6 | 4.3 | 11.1 | ||||||||||||||
| EBITDA(5) | 10,044 | 100.0 | 13,012 | 100.0 | 16,337 | 100.0 | 29.5 | 25.6 | |||||||||
| Fixed-line | 7,233 | 72.0 | 9,658 | 74.2 | 12,454 | 76.2 | 33.5 | 29.0 | |||||||||
| Mobile | 2,851 | 28.4 | 3,354 | 25.8 | 3,883 | 23.8 | 17.6 | 15.8 | |||||||||
| Intercompany eliminations(4) | (40 | ) | (0.4 | ) | 0 | 0.0 | 0 | 0.0 | n/a | n/a | |||||||
| EBITDA margin (%) | 29.5 | 34.7 | 40.0 | ||||||||||||||
- (1)
- Includes an offset for discounts offered on mobile-to-fixed interconnect which had previously been included in operating expenses under payments to other operators in the 2003 and 2002 financial years. The discounts were R9 million, R11 million and R33 million, or 1.3%, 1.8% and 5.9% of gross interconnection revenues from domestic mobile operators for the years ended March 31, 2004, 2003 and 2002, respectively. Includes an offset for discounts on leased line facilities to mobile operators which had previously been included in operating expenses under payments to other operators in the 2003 and 2002 financial years. The discounts were R77 million, R82 million and R77 million, or 7.8%, 8.1% and 9.2% of leased line facilities rental from mobile operators for the years ended March 31, 2004, 2003 and 2002, respectively. Revenue for the 2003 and 2002 financial years has been revised to reflect the new presentation.
114
- (2)
- Other income includes profit on disposal of investments and property, plant and equipment. Includes costs in respect of losses on the disposal of property, plant and equipment and investments of R6 million, R1 million and R1 million in the 2004, 2003 and 2002 financial years, respectively, which had previously been included in selling, general and administrative expenses in the 2003 and 2002 financial years. Other income for the 2003 and 2002 years has been revised to reflect the new presentation.
- (3)
- Discounts offered on mobile-to-fixed interconnect of R9 million, R11 million and R33 million in the 2004, 2003 and 2002 financial years, respectively, and discounts on leased line facilities to mobile operators of R77 million, R82 million and R77 million in the 2004, 2003 and 2002 financial years, respectively, were reclassified from payments to other operators in operating expenses to an offset to operating revenue in the 2004 financial year. Costs in respect of losses on the disposal of property, plant and equipment and investments of R6 million, R1 million and R1 million in the 2004, 2003 and 2002 financial years, respectively, were reclassified from selling, general and administrative expenses to other income in the 2004 financial year. Operating expenses for the 2003 and 2002 financial years have been revised to reflect the new presentation.
- (4)
- In the year ended March 31, 2002, intercompany eliminations included intercompany transactions with our Telkom Directory Services and Swiftnet subsidiaries. In the years ended March 31, 2004 and 2003, these intercompany eliminations were included in the fixed-line segment.
- (5)
- Total EBITDA and mobile EBITDA represent net profit before minority interests, taxation, finance charges, investment income and depreciation, amortization, impairments and asset write-offs. See footnotes 17 and 6 in Item 3. "Key Information—Selected Historical Consolidated Financial and Other Data of the Telkom Group" and footnote 6 in Item 3. "Key Information—Selected Historical Consolidated Financial and Other Data of Vodacom Group" for a reconciliation of EBITDA of the Telkom Group and Vodacom, respectively, to net profit. Fixed line EBITDA represents operating profit before taxation, finance charges, investment income, depreciation, amortization, impairments and asset write-offs. We believe that EBITDA provides meaningful additional information to investors since it is widely accepted by analysts and investors as a basis for comparing a company's underlying operating profitability with that of other companies as it is not influenced by past capital expenditures or business acquisitions, a company's capital structure or the relevant tax regime. This is particularly the case in a capital-intensive industry such as communications. It is also a widely accepted indicator of a company's ability to service its long-term debt and other fixed obligations and to fund its continued growth. EBITDA is not a US GAAP or IFRS measure. You should not construe EBITDA as an alternative to operating profit or cash flows from operating activities determined in accordance with US GAAP or IFRS or as a measure of liquidity. EBITDA is not defined in the same manner by all companies and may not be comparable to other similarly titled measures of other companies unless the definition is the same. In addition, because the calculation of EBITDA in the maintenance covenants contained in our credit facilities is based on accounting policies in use at the time the indebtedness was incurred, EBITDA for purposes of those covenants is not calculated in the same manner as it is calculated in the above table. Mobile EBITDA includes a net gain of R28 million in the 2002 financial year, for our 50% share of Vodacom's integration costs, disposals of operations and impairments.
115
Fixed-line EBITDA can be reconciled to operating profit as follows:
| | Year ended March 31, | ||||||
|---|---|---|---|---|---|---|---|
| | 2002 | 2003 | 2004 | ||||
| | ZAR | ZAR | ZAR | ||||
| EBITDA | 7,233 | 9,658 | 12,454 | ||||
| Depreciation, amortization, impairments and asset write-offs | (4,808 | ) | (5,310 | ) | (5,983 | ) | |
| Operating profit | 2,425 | 4,348 | 6,471 | ||||
Mobile EBITDA can be reconciled to operating profit as follows: | |||||||
| EBITDA | 2,851 | 3,354 | 3,883 | ||||
| Depreciation | (928 | ) | (1,082 | ) | (1,158 | ) | |
| Amortization of Intangible Assets | (107 | ) | (106 | ) | (108 | ) | |
| Operating Profit | 1,816 | 2,166 | 2,617 | ||||
116
Operating revenue
Operating revenue increased 8.8% and 10.0% in the years ended March 31, 2004 and 2003, respectively, due to increased operating revenue in our fixed-line and mobile segments. The increase in fixed-line operating revenue in the 2004 financial year was primarily due to increased subscription and connection tariffs, growth in data services, increased long-distance, local, international and fixed-to-mobile traffic tariffs and increased interconnection traffic, partially offset by lower long-distance and fixed-to-mobile traffic. The increase in fixed-line operating revenue in the 2003 financial year was primarily due to increased subscription and connection tariffs, local traffic tariffs and fixed-to-mobile traffic tariffs and growth in data services. Mobile operating revenue increased primarily due to strong customer growth. Fixed-line operating revenue accounted for 75.8%, 78.8% and 81.7% of our consolidated operating revenue before intercompany eliminations in the years ended March 31, 2004, 2003 and 2002, respectively. The aggregate increase in operating revenue in the 2004 financial year exceeded average inflation in South Africa in the 2004 financial year and was in line with average inflation in South Africa in the 2003 financial year.
Other income
Other income includes profit on the sale of assets and investments. Fixed-line other income decreased 63.1% to R73 million in the year ended March 31, 2004 and increased 55.9% to R198 million in the year ended March 31, 2003 from R127 million in the year ended March 31, 2002. The decrease in fixed-line other income in the 2004 year was due to reduced non-recurring profit from the sale of our investment in Inmarsat and other Telkom assets as compared to the profit on sale of Intelsat in the 2003 financial year. The increase in fixed-line other income in the 2003 financial year was driven by the non-recurring profit on the sale of our investment in Intelsat on December 30, 2002 and other Telkom assets.
Operating expenses
Operating expenses increased 1.9% in the year ended March 31, 2004 primarily due to increased operating expenses in our mobile segment. Fixed-line operating expenses decreased 3.5% in the 2004 financial year primarily due to reduced payments to other network operators, selling, general and administrative expenses, services rendered and operating leases, partially offset by increased depreciation, amortization, impairments and asset write-offs. Payments to other network operators decreased primarily due to lower volumes of calls from our fixed-line network to the mobile networks and favorable exchange rates resulting in lower international settlement rates. Selling, general and administrative expenses were significantly impacted by the reversal of the R325 million provision for the Telcordia dispute. Selling, general and administration expenses decreased primarily due to lower materials and maintenance expenses impacted mainly by improved efficiencies and cost saving initiatives, reduced cable theft and a favorable exchange rate. Services rendered was lower due to non-recurring expenses related to our initial public offering incurred in the 2003 financial year and the reduction in fees paid to Thintana Communications as a result of fewer key personnel, reduced management fees and a more favorable exchange rate. Operating leases decreased primarily due to a decrease in the number of vehicles in our fleet, the continued relocation of employees from leased properties to owned properties and improvements in overall space utilization. Employee expenses increased marginally due to our retrenchment program. The increase in mobile operating expenses in the 2004 financial year was primarily due to increased selling, general and administrative expenses as a result of customer growth and increased competition requiring higher incentive costs, increased payments to other network operators due to higher outgoing traffic and the increased incidence of outgoing traffic terminating on other mobile networks, higher staff costs associated with increased headcount and increased depreciation, amortization, impairments and asset write-offs.
117
Operating expenses increased 4.0% in the year ended March 31, 2003 due to increased operating expenses in our mobile segment. Fixed-line operating expenses were relatively flat in the 2003 financial year, decreasing 0.7% primarily due to reduced selling, general and administrative expenses and, to a lesser extent, reduced payments to other network operators, partially offset by increased depreciation, amortization, impairments and asset write-offs and services needed. Selling, general and administrative expenses were impacted in the 2002 financial year by the inclusion of a R325 million provision, excluding interest and legal fees, related to the Telcordia dispute. Excluding these items, selling, general and administrative expenses decreased primarily due to reduced bad debts as a result of lower bad debt write-offs and a R276 million reduction in the provision for doubtful accounts on our balance sheet, as well as lower marketing and materials expenses due to cost cutting initiatives and reduced losses in respect of cable theft. The decrease in fixed-line operating expenses was partially offset by increased depreciation and amortization and services rendered while operating leases and employee expenses remained relatively constant. A decrease in salaries and wages and employee retrenchment expenses in the 2003 financial year was partially offset by an increase in benefits in that year. The increase in mobile operating expenses in the 2003 financial year was primarily due to increased selling, general and administrative expenses, as a result of customer growth and increased competition requiring higher incentive costs, increased payments to other network operators and increased depreciation, amortization, impairments and asset write-offs associated with increased capital expenditures.
Operating profit
Operating profit increased significantly in the year ended March 31, 2004 primarily due to a 48.8% increase in operating profit in our fixed-line segment and a 20.8% increase in operating profit in our mobile segment. The increase in fixed-line operating profit in the year ended March 31, 2004 was due to higher revenue and a decline in operating expenses. Mobile operating profit increased in the year ended March 31, 2004 primarily due to increased mobile operating revenue as a result of customer growth.
Operating profit increased significantly in the year ended March 31, 2003 primarily due to a 79.3% increase in operating profit in our fixed-line segment and a 19.3% increase in operating profit in our mobile segment. Fixed-line operating profit increased significantly in the year ended March 31, 2003 due to higher revenue driven by increased subscription tariffs, local traffic tariffs and fixed-to-mobile traffic tariffs and data revenue growth, while fixed-line operating expenses declined slightly. Mobile operating profit increased in the year ended March 31, 2003 primarily due to substantial increases in the number of Vodacom's customers and revenue.
Investment income
Investment income consists of interest received on trade receivables, short-term investments and bank accounts and income received from our investments. Investment income increased 13.0% to R479 million in the year ended March 31, 2004 primarily due to increased interest received associated with higher average balances in investments and bank accounts.
Investment income decreased 17.2% to R424 million in the year ended March 31, 2003 from R512 million in the year ended March 31, 2002 primarily due to a more rapid collection of trade debtors, lower interest received due to lower average balances in investments and bank accounts and reduced interest on the receivable owing from the South African Revenue Services as they repaid R844 million on September 3, 2002 of their balance outstanding of R1,081 million on March 31, 2002.
118
Finance charges
Finance charges include interest paid on local and foreign borrowings, amortized discounts on bonds and commercial paper bills, fair value gains and losses on financial instruments and foreign exchange gains and losses.
The following table sets forth information related to our finance charges for the periods indicated.
Finance Charges
| | Year ended March 31, | | | |||||||||
|---|---|---|---|---|---|---|---|---|---|---|---|---|
| | 2002 | 2003 | 2004 | | | |||||||
| | 2003/2002 % change | 2004/2003 % change | ||||||||||
| | ZAR | ZAR | ZAR | |||||||||
| | (in millions, except percentages) | |||||||||||
| Interest expense | 3,185 | 2,869 | 2,488 | (9.9 | ) | (13.3 | ) | |||||
| Local loans | 2,690 | 2,642 | 2,253 | (1.8 | ) | (14.7 | ) | |||||
| Foreign loans | 599 | 375 | 303 | (37.4 | ) | (19.2 | ) | |||||
| Finance charges capitalized | (104 | ) | (148 | ) | (68 | ) | 42.3 | (54.1 | ) | |||
| Net fair value and exchange losses/(gains) on financial instruments | (635 | ) | 1,285 | 776 | 302.4 | (39.6 | ) | |||||
| Fair value adjustments on derivative instruments | (3,036 | ) | 2,046 | 1,144 | 167.4 | (44.1 | ) | |||||
| Foreign exchange (gains)/losses | 2,401 | (761 | ) | (368 | ) | (131.7 | ) | 51.6 | ||||
| Total finance charges | 2,550 | 4,154 | 3,264 | 62.9 | (21.4 | ) | ||||||
Finance charges decreased in the year ended March 31, 2004 due to reduced net fair value and exchange losses on financial instruments, lower interest bearing debt levels and lower interest expense, which included the Telcordia interest reversal. The net fair value and exchange losses on financial instruments decreased by 39.6% from R1,285 million in the 2003 financial year to R776 million in the 2004 financial year, due to the reduced fair value losses on derivative instruments for foreign loans and purchases of foreign goods and services, partially offset by lower foreign exchange gains on foreign liabilities as a result of the appreciation of the Rand.
Finance charges increased significantly in the year ended March 31, 2003 due to a significant increase in net fair value and exchange losses on financial instruments, from a net gain of R635 million in the 2002 financial year to a net loss of R1,285 million in the 2003 financial year, which was partially offset by a 9.9% decrease in interest expense. The significant increase in net fair value and exchange losses on financial instruments was primarily due to the fair value loss on derivative instruments for foreign loans and purchases of foreign goods and services as required by IAS 39, partially offset by foreign exchange gains on foreign liabilities as a result of the appreciation of the Rand. The decrease in interest expense in the 2003 financial year was primarily due to lower balances on foreign and local loans and increased finance charges capitalized due to an increased number of qualifying assets completed during the period.
Taxation
Our consolidated tax expense increased 63.1% to R1,711 million in the year ended March 31, 2004 and 20.2% to R1,049 million in the year ended March 31, 2003 from R873 million in the year ended March 31, 2002. Our consolidated effective tax rate was 27.2% in the 2004 financial year, 37.7% in the 2003 financial year and 40.5% in the 2002 financial year. Telkom's effective tax rate was 15.6%, 34.7% and 46.4%, respectively, and Vodacom's effective tax rate was 36.1%, 34.0% and 33.1%, respectively, during the 2004, 2003 and 2002 financial years. The reason for the significant decrease in the effective tax rate of Telkom and the Telkom Group in the 2004 financial year is primarily due to the reversal of the provision for Telcordia in the 2004 financial year, which increased the net income of Telkom and
119
the Telkom Group, but were not taxable to Telkom or the Telkom Group. In addition, the Telkom effective tax rate was further impacted by the receipt of approximately R1.2 billion in dividends from subsidiaries and joint ventures, which increased Telkom's net income, but were not taxable to Telkom. The increases in consolidated tax expense in the year ended March 31, 2004 and March 31, 2003 were primarily due to the increase in our pre-tax income. South African companies became subject to capital gains tax on October 1, 2001. We were previously not required to pay capital gains tax. See Item 10. "Additional Information—Taxation."
Minority interests
Minority interests in the income of subsidiaries decreased 34.3% to R69 million in the year ended March 31, 2004 primarily due to a 24.6% reduction in profits at Vodacom Tanzania. Minority interests in the income of subsidiaries increased 78.0% to R105 million in the year ended March 31, 2003 due to increased profits in Vodacom Tanzania and in our Telkom Directory Services subsidiary despite the decrease in minority ownership in our Telkom Directory Services subsidiary during the 2002 financial year. We acquired a further 10% interest in Telkom Directory Services in October 2001 and the remaining 40% interest in Swiftnet in May 2001.
Net profit
Net profit increased significantly to R4,523 million in the year ended March 31, 2004 and 33.5% to R1,630 million in the year ended March 31, 2003 from R1,221 million in the year ended March 31, 2002 primarily due to significantly increased operating profit in our fixed-line segment as well as increased operating profit in our mobile segment. The increase in net profit in the 2004 financial year was bolstered by lower interest expense and lower net fair value and exchange losses on financial instruments in that year as well as increased investment income, partially offset by increased taxes. The increase in net profit in the 2003 financial year was partially offset by a significant increase in finance charges due to the fair value loss on derivative instruments for foreign loans and purchases of foreign goods and services as required by IAS 39, increased taxation and decreased investment income, partially offset by foreign exchange gains on foreign liabilities as a result of the appreciation of the Rand and decreased interest expense.
Fixed-line segment
The following is a discussion of the results of operations from our fixed-line segment before eliminations of intercompany transactions with Vodacom. Our fixed-line segment is our largest segment based on revenue and profit contribution.
Fixed-line operating revenue
Our fixed-line operating revenue is derived principally from fixed-line subscriptions and connections; traffic, which comprises local and long-distance traffic, fixed-to-mobile traffic and international outgoing traffic and international voice over internet protocol services; and interconnection, which comprise terminating and transiting traffic. We also derive fixed-line operating revenue from our data business, which includes data transmission services, managed data networking services and internet access and related information technology services and our wireless data services and directory businesses.
The following table shows operating revenue for our fixed-line segment broken down by major revenue streams and as a percentage of total revenue for our fixed-line segment and the percentage change by major revenue stream for the periods indicated.
120
Fixed-line operating revenue
| | Year ended March 31, | | | |||||||||||||||
|---|---|---|---|---|---|---|---|---|---|---|---|---|---|---|---|---|---|---|
| | 2002 | 2003 | 2004 | | | |||||||||||||
| | ZAR | % of revenue | ZAR | % of revenue | ZAR | % of revenue | 2003/2002 % change | 2004/2003 % change | ||||||||||
| | (in millions, except percentages) | |||||||||||||||||
| Subscriptions and connections | 4,410 | 15.8 | 4,595 | 15.6 | 5,024 | 16.3 | 4.2 | 9.3 | ||||||||||
| Traffic | 17,168 | 61.6 | 18,001 | 60.9 | 18,313 | 59.3 | 4.9 | 1.7 | ||||||||||
| Local | 4,876 | 17.5 | 5,616 | 19.0 | 5,910 | 19.1 | 15.2 | 5.2 | ||||||||||
| Long-distance | 3,794 | 13.6 | 3,562 | 12.1 | 3,770 | 12.2 | (6.1 | ) | 5.8 | |||||||||
| Fixed-to-mobile | 7,323 | 26.3 | 7,539 | 25.5 | 7,321 | 23.7 | 2.9 | (2.9 | ) | |||||||||
| International outgoing | 1,175 | 4.2 | 1,284 | 4.3 | 1,312 | 4.3 | 9.3 | 2.2 | ||||||||||
| Interconnection(1) | 1,765 | 6.4 | 1,762 | 6.0 | 1,643 | 5.3 | (0.2 | ) | (6.8 | ) | ||||||||
| Data(2) | 3,836 | 13.8 | 4,425 | 15.0 | 5,023 | 16.3 | 15.4 | 13.5 | ||||||||||
| Directories and other services | 687 | 2.4 | 759 | 2.5 | 903 | 2.8 | 10.5 | 19.0 | ||||||||||
| Fixed-line operating revenue(1)(2) | 27,866 | 100.0 | 29,542 | 100.0 | 30,906 | 100.0 | 6.0 | 4.6 | ||||||||||
- (1)
- Includes an offset for discounts offered on mobile-to-fixed interconnect which had previously been included in operating expenses under payments to other operators in the 2003 and 2002 financial years. The discounts were R9 million, R11 million and R33 million, or 1.3%, 1.8% and 5.9% of gross interconnection revenues from domestic mobile operators for the years ended March 31, 2004, 2003 and 2002, respectively. Interconnection revenue for the 2003 and 2002 financial years has been revised to reflect the new presentation.
- (2)
- Includes an offset for discounts on leased line facilities to mobile operators which had previously been included in operating expenses under payments to other operators in the 2003 and 2002 financial years. The discounts were R77 million, R82 million and R77 million, or 7.8%, 8.1% and 9.2% of leased line facilities rental from mobile operators for the years ended March 31, 2004, 2003 and 2002, respectively. Data revenue for the 2003 and 2002 financial years has been revised to reflect the new presentation.
Operating revenue from our fixed-line segment increased 4.6% and 6.0% in the years ended March 31, 2004 and 2003, respectively. The increase in fixed-line operating revenue in the 2004 financial year was primarily due to increased subscription and connection tariffs, growth in data services, increased long-distance, local, international and fixed-to-mobile traffic tariffs and increased interconnection traffic, partially offset by lower long-distance and fixed-to-mobile traffic. The increase in fixed-line operating revenue in the 2003 financial year was primarily due to increased subscription and connection tariffs, local traffic tariffs and fixed-to-mobile traffic tariffs and growth in data services. These increases were partially offset by a decline in the number of fixed access lines in service, lower traffic and declining international interconnection revenue due to lower settlement rates and the appreciation of the Rand. Fixed-line operating revenue was adversely impacted in the 2004 and 2003 financial years due to the decrease in the number of fixed access lines in service primarily as a result of customer migration to mobile services and lower connections, as well as disconnections due to customer non-payments primarily in the 2002 and 2003 financial years. Traffic declined 0.3% and 1.1% in the years ended March 31, 2004 and 2003, respectively. Traffic was adversely affected in both the 2004 and 2003 financial years by the increasing substitution of calls placed using mobile services rather than our fixed-line service. Revenue per fixed access line continued to improve, increasing 5.6% from R4,722 million in the 2002 financial year to R4,987 million in the 2003 financial year and 3.6% to R5,169 million in the 2004 financial year. The increased revenue per access line is due to increased subscription and connection tariffs and traffic tariffs, as well as increased penetration of subscription based value-added voice services and higher revenue generating access services such as ISDN and a decrease in the number of our fixed access lines in service. Data revenue increased 13.5% and 15.4% in the years ended March 31, 2004 and 2003, respectively, mainly due to higher demand for data services.
Subscriptions and connections. Revenue from subscriptions and connections consists of revenue from connection fees, monthly rental charges, value-added voice services and the sale and rental of customer premises equipment for postpaid and prepaid PSTN lines, including ISDN channels and
121
private payphones. Subscription and connection revenue is principally a function of the number and mix of residential and business lines in service, the number of private payphones in service and the corresponding charges. The following table sets forth information related to our fixed-line subscription and connection revenue during the periods indicated.
Fixed-line subscription and connection revenue
| | Year ended March 31, | 2003/2002 | 2004/2003 | ||||||||||
|---|---|---|---|---|---|---|---|---|---|---|---|---|---|
| | 2002 | 2003 | 2004 | % change | % change | ||||||||
| Total subscriptions and connections revenue (ZAR millions, except percentages) | 4,410 | 4,595 | 5,024 | 4.2 | 9.3 | ||||||||
| Total subscription access lines (thousands, except percentages)(1) | 4,750 | 4,682 | 4,661 | (1.4 | ) | (0.4 | ) | ||||||
| Postpaid | |||||||||||||
| PSTN(2) | 3,554 | 3,285 | 3,134 | (7.6 | ) | (4.6 | ) | ||||||
| ISDN channels | 467 | 563 | 656 | 20.6 | 16.5 | ||||||||
| Prepaid | 708 | 817 | 856 | 15.4 | 4.8 | ||||||||
| Private payphones | 21 | 17 | 15 | (19.0 | ) | (11.8 | ) | ||||||
- (1)
- Total subscription access lines are comprised of PSTN lines, including ISDN lines, private payphones and internal lines in service, but exclude public payphones. Telkom had 140,950, 134,972 and 162,460 internal lines as of March 31, 2004, 2003 and 2002, respectively. Each PSTN line includes one access channel, each basic ISDN line includes two access channels and each primary ISDN line includes 30 access channels.
- (2)
- Excluding ISDN channels. PSTN lines are provided using copper cable, DECT and fiber.
Revenue from subscriptions and connections increased 9.3% and 4.2% in the years ended March 31, 2004 and 2003, respectively, mainly due to an increase in average monthly subscriptions and connections tariffs and increased sales and rental of customer premises equipment primarily in the 2004 financial year, partially offset by the lower number of fixed access lines in service primarily as a result of customer migration to mobile services and lower connections, as well as disconnections due to customer non-payments primarily in the 2002 and 2003 financial years. The decreases in postpaid PSTN lines in the years ended March 31, 2004 and 2003 were partially offset by increases in the number of postpaid ISDN channels, which have higher subscription rates than PSTN lines, and in the number of prepaid PSTN lines. The increase in the number of postpaid ISDN channels was driven by increased demand for higher bandwidth and functionality. The increase in prepaid lines was mainly due to our increased marketing efforts for our prepaid telephone services, particularly to first-time residential customers with poor or no credit histories, and postpaid customers encouraged to migrate to prepaid services due to late payments and credit difficulties.
For a discussion of our connection and rental fees, see Item 4. "Information on the Company—Business Overview—Fixed-line communications—Fees and tariffs—Subscription and connection tariffs" and for a discussion of the number of customers during the periods, see Item 4. "Information on the Company—Business Overview—Fixed-line communications—Products and services."
Traffic. Traffic revenue consists of revenue from local, long distance, fixed-to-mobile and international outgoing calls and international voice over internet protocol services. Traffic revenue is principally a function of tariffs and the number, duration and mix between relatively more expensive domestic long distance, international and fixed-to-mobile calls and less expensive local calls.
122
The following table sets forth information related to our total fixed-line traffic revenue for the periods indicated.
Total fixed-line traffic revenue
| | Year ended March 31, | | | ||||||||
|---|---|---|---|---|---|---|---|---|---|---|---|
| | 2003/2002 % change | 2004/2003 % change | |||||||||
| | 2002 | 2003 | 2004 | ||||||||
| Total traffic revenue (ZAR millions, except percentages) | 17,168 | 18,001 | 18,313 | 4.9 | 1.7 | ||||||
| Traffic (millions of minutes, except percentages)(1) | 30,023 | (2) | 29,698 | 29,595 | (1.1 | )(2) | (0.3 | ) | |||
| Average monthly traffic minutes per average monthly access line (minutes)(3) | 520 | (2) | 521 | 526 | 0.2 | (2) | 1.0 | ||||
- (1)
- Traffic is calculated by dividing total traffic revenue by the weighted average tariff during the relevant period. Traffic includes internet traffic.
- (2)
- In the 2003 financial year, we revised the calculation of the weighted average tariffs for certain prepaid calls and our ShareCall product. We have recalculated the traffic for the 2002 financial year accordingly. Calculated on the original basis, total traffic, excluding interconnection, was 29,912 millions of minutes in the 2002 financial year.
- (3)
- Average monthly traffic minutes per average monthly access line are calculated by dividing the total traffic by the cumulative number of monthly access lines in the period.
Traffic revenue increased 1.7% and 4.9% in the years ended March 31, 2004 and 2003, respectively. The increase in traffic revenue in the 2004 financial year was mainly due to increased long-distance, local, international and fixed-to-mobile traffic tariffs and increased interconnection traffic, partially offset by lower long distance and fixed-to-mobile traffic. The increase in traffic revenue in the 2003 financial year was primarily due to increased local and fixed-to-mobile traffic tariffs, partially offset by lower average long distance and international traffic tariffs. We increased our fixed-line long distance and average international outgoing traffic tariffs on January 1, 2003 as we completed our tariff rebalancing. In December 2002, as a result of an out-of-court settlement related to our tariff increase in the prior year, ICASA approved our tariff filing providing for a 9.5% increase in the overall tariffs for all services in the basket effective January 1, 2003 and ICASA approved a 2.2% increase in the overall tariffs for all services in the basket effective January 1, 2004. Traffic decreased 0.3% in the 2004 financial year primarily as a result of decreased long distance, fixed to mobile and international outgoing traffic, slightly offset by increased local and interconnection traffic. Traffic decreased 1.1% in the 2003 financial year primarily due to lower long distance and fixed-to-mobile traffic, partially offset by increased international outgoing and interconnection traffic. Traffic was adversely affected by a decrease in the number of fixed access lines in service during the 2004 and 2003 financial years primarily as a result of customer migration to mobile services and lower connections, as well as disconnections due to customer non-payments primarily in the 2002 and 2003 financial years. In addition, traffic was adversely affected by the increasing substitution of calls placed using mobile services rather than our fixed-line service. We have implemented a number of measures designed to stem the decline in traffic minutes, including increasing the sale of voicemail accounts to approximately 968,000 as of March 31, 2004, introducing new calling products and services, such as launching Xtratime in March 2004, and continuing our rate education campaigns to highlight the price advantages of fixed-line calls.
For a discussion of our traffic tariffs, see Item 4. "Information on the Company—Business Overview—Fixed-line communications—Fees and tariffs—Traffic tariffs" and for a discussion of our traffic during the periods discussed, see Item 4. "Information on the Company—Business Overview—Fixed-line communications—Traffic."
123
The following table sets forth information related to our fixed-line local traffic revenue for the periods indicated.
Local traffic revenue
| | Year ended March 31, | | | |||||||
|---|---|---|---|---|---|---|---|---|---|---|
| | 2003/2002 % change | 2004/2003 % change | ||||||||
| | 2002 | 2003 | 2004 | |||||||
| Local traffic revenue (ZAR millions, except percentages) | 4,876 | 5,616 | 5,910 | 15.2 | 5.2 | |||||
| Local traffic (millions of minutes, except percentages)(1) | 20,538(2) | 20,396 | 20,547 | (0.7 | )(2) | 0.7 | ||||
- (1)
- Local traffic is calculated by dividing total local traffic revenue by the weighted average local traffic tariff during the relevant period. Local traffic includes internet traffic.
- (2)
- In the 2003 financial year, we revised the calculation of the weighted average tariffs for certain prepaid calls and our ShareCall product. We have recalculated the local traffic for the 2002 financial year accordingly. Calculated on the original basis, local traffic was 20,252 millions of minutes in the 2002 financial year.
Local traffic revenue increased 5.2% and 15.2% in the years ended March 31, 2004 and 2003, respectively, primarily due to increased local traffic tariffs partially offset by increased growth in our discount and calling plans designed to combat mobile substitution primarily in the 2004 financial year. Local traffic was relatively flat during the 2004 and 2003 financial years, increasing 0.7% in the 2004 financial year and decreasing 0.7% in the 2003 financial year. Local traffic was adversely affected by a decrease in the number of fixed access lines in service during the 2004 and 2003 financial years and the increasing substitution of local calls placed using mobile services rather than our fixed-line service.
The following table sets forth information related to our fixed-line long distance traffic revenue for the periods indicated.
Long distance traffic revenue
| | Year ended March 31, | | | ||||||||
|---|---|---|---|---|---|---|---|---|---|---|---|
| | 2003/2002 % change | 2004/2003 % change | |||||||||
| | 2002 | 2003 | 2004 | ||||||||
| Long distance traffic revenue (ZAR millions, except percentages) | 3,794 | 3,562 | 3,770 | (6.1 | ) | 5.8 | |||||
| Long distance traffic (millions of minutes, except percentages)(1) | 4,747(2) | 4,728 | 4,616 | (0.4 | )(2) | (2.4 | ) | ||||
- (1)
- Long distance traffic is calculated by dividing total long distance traffic revenue by the weighted average long distance traffic tariff during the relevant period.
- (2)
- In the 2003 financial year, we revised the calculation of the weighted average tariffs for certain prepaid calls and our ShareCall product. We have recalculated the long distance traffic for the 2002 financial year accordingly. Calculated on the original basis, long-distance traffic was 4,895 millions of minutes in the 2002 financial year.
Long distance traffic revenue increased 5.8% in the year ended March 31, 2004 mainly due to increased long distance traffic tariffs, partially offset by decreased long distance traffic. Long distance traffic revenue decreased 6.1% in the year ended March 31, 2003 primarily due to decreased average long distance traffic tariffs and decreased long distance traffic. We increased our fixed-line long distance traffic tariffs on January 1, 2003 as we have completed our tariff rebalancing. Long distance traffic decreased 2.4% and 0.4% in the 2004 and 2003 financial years, respectively. Long distance traffic
124
was adversely impacted by a decrease in the number of fixed access lines in service during 2004 and 2003 financial years and the increasing substitution of national long distance calls using mobile services rather than our fixed-line long distance service. Long distance traffic was also adversely affected by increased sales of our SmartAccess products in the 2003 and 2004 financial years, as well as the fact that fixed-line long distance traffic tariffs were historically higher than the price of mobile calls, which are not distance dependent. We have reduced our long-distance traffic tariffs to below mobile tariffs over the past five years as a result of our tariff rebalancing program and continue to educate the market on our tariffs.
Revenue from fixed-to-mobile traffic consists of revenue from calls made by our fixed-line customers to the three mobile networks in South Africa and is primarily a function of fixed-to-mobile traffic tariffs and the number, duration and mix of calls between fixed-line and mobile customers.
The following table sets forth information related to our fixed-to-mobile traffic revenue for the periods indicated.
Fixed-to-mobile traffic revenue
| | Year ended March 31, | | | ||||||||
|---|---|---|---|---|---|---|---|---|---|---|---|
| | 2003/2002 % change | 2004/2003 % change | |||||||||
| | 2002 | 2003 | 2004 | ||||||||
| Fixed-to-mobile traffic revenue (ZAR millions, except percentages) | 7,323 | 7,539 | 7,321 | 2.9 | (2.9 | ) | |||||
| Fixed-to-mobile traffic (millions of minutes, except percentages)(1) | 4,364(2) | 4,135 | 3,980 | (5.2 | )(2) | (3.7 | ) | ||||
- (1)
- Fixed-to-mobile traffic is calculated by dividing total fixed-to-mobile traffic revenue by the weighted average fixed-to-mobile traffic tariff during the relevant period.
- (2)
- In the 2003 financial year, we revised the calculation of the weighted average tariffs for certain prepaid calls. We have recalculated the fixed-to-mobile traffic for the 2002 financial year accordingly. Calculated on the original basis, fixed-to-mobile traffic was 4,390 millions of minutes in the 2002 financial year.
Fixed-to-mobile traffic revenue decreased 2.9% in the year ended March 31, 2004 primarily due to lower fixed-to-mobile traffic, partially offset by increased traffic tariffs. We increased discounts on fixed-to-mobile calls in the 2004 financial year to combat mobile substitution. Fixed-to-mobile traffic revenue increased 2.9% in the year ended March 31, 2003 primarily due to fixed-to-mobile traffic tariff increases in November 2001 and January 2003 as a result of the amendment of our interconnection agreement with MTN and Vodacom and our new interconnection agreement with Cell C effective in November 2001, partially offset by a decrease in fixed-to-mobile traffic. Fixed-to-mobile traffic decreased 3.7% and 5.2% in the years ended March 31, 2004 and 2003, respectively, primarily as a result of an increase in the number of mobile subscribers, resulting in increased mobile-to-mobile traffic and less fixed-to-mobile traffic and an effective 5.5% increase in tariffs in January 2003 and a 1.1% increase in tariffs in January 2004. Additionally, fixed-to-mobile traffic was adversely impacted by a decrease in the number of fixed access lines in service during the 2004 and 2003 financial years.
Revenue from international outgoing traffic consists of revenue from calls made by our fixed-line customers to international destinations and from international voice over internet protocol services and is a function of tariffs and the number, duration and mix of calls to destinations outside South Africa.
The following table sets forth information related to our international outgoing traffic revenue for the periods indicated.
125
International outgoing traffic revenue
| | Year ended March 31, | | | ||||||||
|---|---|---|---|---|---|---|---|---|---|---|---|
| | 2003/2002 % change | 2004/2003 % change | |||||||||
| | 2002 | 2003 | 2004 | ||||||||
| International outgoing traffic revenue (ZAR millions, except percentages) | 1,175 | 1,284 | 1,312 | 9.3 | 2.2 | ||||||
| International outgoing traffic (millions of minutes, except percentages)(1) | 374(2) | 439 | 427 | 17.4 | (2) | (2.7 | ) | ||||
| International voice over internet protocol | — | — | 25 | n/a | n/a | ||||||
- (1)
- International outgoing traffic is calculated by dividing total international outgoing traffic revenue by the weighted average international outgoing traffic tariff during the relevant period.
- (2)
- In the 2003 financial year, we revised the calculation of the weighted average tariffs for certain prepaid calls. We have recalculated the international outgoing traffic for the 2002 financial year accordingly. Calculated on the original basis, international outgoing traffic was 375 millions of minutes in the 2002 financial year.
International outgoing traffic revenue increased 2.2% in the year ended March 31, 2004 primarily due to international outgoing traffic tariff increases, a change in the mix of calling destinations, partially offset by lower international outgoing traffic. International outgoing traffic revenue increased 9.3% in the year ended March 31, 2003 primarily due to increased international outgoing traffic and a change in the mix of calling destinations, partially offset by decreases in average international outgoing traffic tariffs in the 2003 financial year. We increased our average fixed-line international outgoing traffic tariffs on January 1, 2003 as we have completed our tariff rebalancing. International outgoing traffic decreased 2.7% in the year ended March 31, 2004 mainly due to substitution of fixed line calls with mobile and increased competition from Sentech. International outgoing traffic increased 17.4% in the 2003 financial year primarily due to lower effective tariffs and increased marketing efforts.
Interconnection. We generate revenue from interconnection services for traffic from calls made by other operators' subscribers that terminate on or transit through our network. Revenue from interconnection services includes payments from domestic mobile and international operators regardless of where the traffic originates or terminates. The following table sets forth information related to interconnection revenue for the periods indicated.
126
Interconnection revenue
| | Year ended March 31, | | | ||||||||
|---|---|---|---|---|---|---|---|---|---|---|---|
| | 2003/2002 % change | 2004/2003 % change | |||||||||
| | 2002 | 2003 | 2004 | ||||||||
| Interconnection revenue (ZAR millions, except percentages)(1) | 1,765 | 1,762 | 1,643 | (0.2 | ) | (6.8 | ) | ||||
Domestic mobile interconnection(1) | |||||||||||
| Interconnection revenue from domestic mobile operators (ZAR millions, except percentages) | 524 | 597 | 697 | 13.9 | 16.8 | ||||||
| Domestic mobile interconnection traffic (millions of minutes, except percentages)(2) | 2,008 | 2,099 | 2,159 | 4.5 | 2.9 | ||||||
International interconnection | |||||||||||
| Interconnection revenue from international operators (ZAR millions, except percentages) | 1,241 | 1,165 | 946 | (6.1 | ) | (18.8 | ) | ||||
| International interconnection traffic (millions of minutes, except percentages)(3) | 1,053 | 1,071 | 1,188 | 1.7 | 10.9 | ||||||
- (1)
- Includes an offset for discounts offered on mobile-to-fixed interconnect which had previously been included in operating expenses under payments to other operators in the 2003 and 2002 financial years. The discounts were R9 million, R11 million and R33 million, or 1.3%, 1.8% and 5.9% of gross interconnection revenues from domestic mobile operators for the years ended March 31, 2004, 2003 and 2002, respectively. Interconnection revenue for the 2003 and 2002 financial years has been revised to reflect the new presentation.
- (2)
- Domestic mobile-to-fixed interconnection traffic is calculated by dividing total domestic mobile-to-fixed interconnection traffic revenue by the weighted average domestic mobile-to-fixed interconnection traffic tariff during the relevant period.
- (3)
- International interconnection traffic is based on the actual traffic registered through the respective exchanges and reflected on invoices.
Interconnection revenue from domestic mobile operators includes revenue for call termination and international outgoing calls from domestic mobile networks, as well as access to other services, such as emergency services and directory enquiry services. Interconnection revenue from domestic mobile operators increased 16.8% in the year ended March 31, 2004 due to tariff increases and increased mobile-to-fixed terminating traffic. In addition, a reduction in discounts also contributed to the increased revenue in the 2004 and 2003 financial years. Interconnection revenue from domestic mobile operators increased 13.9% in the year ended March 31, 2003 due to a reduction in the number of time bands for peak and off peak tariffs from three to two on November 1, 2001, effectively increasing mobile termination rates, and increased mobile-to-fixed terminating traffic. Domestic mobile interconnection traffic increased 2.9% and 4.5% in the years ended March 31, 2004 and 2003, respectively, due to an overall increase in mobile calls as a result of growth in the mobile market, partially offset by increased mobile to mobile calls bypassing our network.
Interconnection revenue from domestic operators includes fees paid to our fixed-line business by Vodacom of R417 million in the year ended March 31, 2004, R349 million in the year ended March 31, 2003 and R306 million in the year ended March 31, 2002. Fifty percent of these amounts were attributable to our interest in Vodacom and were eliminated from the Telkom Group's revenue on consolidation. We expect interconnection revenue from domestic operators to increase as a result of the entrance of the second national operator in the future and the further liberalization of the South African telecommunications industry.
127
Interconnection revenue from international operators includes amounts paid by foreign operators for the use of our network to terminate calls made by customers of such operators and payments from foreign operators for interconnection transiting traffic through our network to other foreign networks. International interconnection traffic consists of international termination traffic and international transiting traffic. Interconnection revenue from international operators decreased 18.8% in the year ended March 31, 2004 primarily due to further decreases in the international interconnection tariffs in line with international trends, a decrease in the Rand value of international settlement rates due to the appreciation of the Rand against the SDR, the notional currency in which international settlement rates are determined. The decrease was partially offset by increased international interconnect traffic as a result of the growth in the international market. Interconnection revenue from international operators decreased 6.1% in the year ended March 31, 2003 due to a decrease in international interconnection tariffs in line with international trends and decreased international transiting traffic due to aggressive competition from other international carriers, partially offset by increases in the Rand value of international settlement rates due to a decline in the value of the Rand against the SDR and increases in international termination traffic.
Data. Data services comprise data transmission services, including leased lines and packet-based services, managed data networking services and internet access and related information technology services. In addition, data services include revenue from ADSL, which we launched in August 2002. Revenue from data services is mainly a function of the number of subscriptions, tariffs, bandwidth and distance. The following table sets forth information related to revenue from data services for the periods indicated.
Data services revenue
| | Year ended March 31, | | | ||||||||
|---|---|---|---|---|---|---|---|---|---|---|---|
| | 2003/2002 % change | 2004/2003 % change | |||||||||
| | 2002 | 2003 | 2004 | ||||||||
| Data services revenue (ZAR millions, except percentages)(1) | 3,836 | 4,425 | 5,023 | 15.4 | 13.5 | ||||||
| Leased lines and other data revenue(2) | 3,079 | 3,496 | 4,114 | 13.5 | 17.7 | ||||||
| Leased line facilities revenues from mobile operators(1) | 757 | 929 | 909 | 22.7 | (2.2 | ) | |||||
| Number of managed network sites (at period end) | 5,684 | 7,729 | 9,061 | 36.0 | 17.2 | ||||||
- (1)
- Includes an offset for discounts on leased line facilities to mobile operators which had previously been included in operating expenses under payments to other operators in the 2003 and 2002 financial years. The discounts were R77 million, R82 million and R77 million, or 7.8%, 8.1% and 9.2% of leased line facilities rental from mobile operators for the years ended March 31, 2004, 2003 and 2002, respectively. Data revenue for the 2003 and 2002 financial years has been revised to reflect the new presentation.
- (2)
- Leased lines and other data revenue includes all data services revenue other than leased line facilities revenue from mobile operators.
Our data services revenue increased 13.5% and 15.4% in the years ended March 31, 2004 and 2003, respectively. The increases were primarily due to increased penetration of leased lines in corporate and business markets, increased demand for bandwidth with higher capacity, increased numbers of customers using data managed networking services, increased tariffs and, in the 2003 financial year, increased penetration of leased lines to mobile operators. In addition, internet access and related services revenue increased significantly in the year ended March 31, 2004. Revenue from leased line facilities from mobile operators decreased 2.2% in the year ended March 31, 2004 due to network optimization initiatives by the mobile operators. Revenue from leased line facilities to mobile
128
operators increased 22.7% in the year ended March 31, 2003 primarily due to growth in the mobile market and the introduction of Cell C in November 2001.
Operating revenue from our data services included R466 million, R482 million and R368 million in revenue received by our fixed-line business from Vodacom in the years ended March 31, 2004, 2003 and 2002, respectively. Fifty percent of these amounts were attributable to our interest in Vodacom and were eliminated from the Telkom Group's revenue on consolidation.
For a discussion of our data services, see Item 4. "Information on the Company—Business Overview—Fixed-line communications—Products and services—Data communications services."
Directories and other services. Revenue from directories and other services consists primarily of advertising revenue from our subsidiary, Telkom Directory Services, and, to a substantially lesser degree, wireless data services revenue from our subsidiary, Swiftnet, and other miscellaneous revenue, including revenue from the sale of materials. Revenue from directories and other services increased 19.0% and 10.5% in the years ended March 31, 2004 and 2003, respectively. These increases were primarily due to increases in directory services revenue from Telkom Directory Services as a result of increased marketing efforts resulting in increased spending on advertising by existing customers and additional advertising revenue from new customers.
Fixed-line operating expenses
The following table shows the operating expenses of our fixed-line segment broken down by expense category as a percentage of total revenue and the percentage change by operating expense category for the periods indicated. In the 2004 financial year, we revised our presentation to remove other income from operating expense.
Fixed-line operating expenses
| | Year ended March 31, | | | ||||||||||||||
|---|---|---|---|---|---|---|---|---|---|---|---|---|---|---|---|---|---|
| | 2002 | 2003 | 2004 | | | ||||||||||||
| | ZAR | % of revenue | ZAR | % of revenue | ZAR | % of revenue | 2003/2002 % change | 2004/2003 % change | |||||||||
| | (in millions, except percentages) | ||||||||||||||||
| Employee expenses(1) | 6,611 | 23.7 | 6,698 | 22.7 | 6,743 | 21.8 | 1.3 | 0.7 | |||||||||
| Payments to other network operators(2) | 6,649 | 23.9 | 6,633 | 22.5 | 6,063 | 19.6 | (0.2 | ) | (8.6 | ) | |||||||
| Selling, general and administrative expenses(3)(4)(5) | 4,214 | 15.1 | 3,107 | 10.5 | 2,638 | 8.5 | (26.3 | ) | (15.1 | ) | |||||||
| Services rendered(6) | 2,216 | 8.0 | 2,570 | 8.7 | 2,202 | 7.2 | 16.0 | (14.3 | ) | ||||||||
| Operating leases(6) | 1,070 | 3.8 | 1,074 | 3.6 | 879 | 2.8 | 0.4 | (18.2 | ) | ||||||||
| Depreciation, amortization, impairments and asset write-offs(4) | 4,808 | 17.3 | 5,310 | 18.0 | 5,983 | 19.4 | 10.4 | 12.7 | |||||||||
| Fixed-line operating expenses | 25,568 | 91.8 | 25,392 | 86.0 | 24,508 | 79.3 | (0.7 | ) | (3.5 | ) | |||||||
- (1)
- Employee expenses include retrenchment costs of R302 million, R244 million and R373 million in the years ended March 31, 2004, 2003 and 2002, respectively.
- (2)
- Discounts offered on mobile-to-fixed interconnect of R9 million, R11 million and R33 million in the 2004, 2003 and 2002 financial years, respectively, and discounts on leased line facilities to mobile operators of R77 million, R82 million and R77 million in the 2004, 2003 and 2002 financial years, respectively, were reclassified from payments to other operators in operating expenses to an offset to operating revenue in the 2004 financial year. Payments to other operators for the 2003 and 2002 financial years have been revised to reflect the new presentation.
129
- (3)
- Selling, general and administrative expenses include provisions for potential liabilities related to Telkom's arbitration with Telcordia of R325 million in the year ended March 31, 2002, excluding interest and legal fees. In the year ended March 31, 2003 we recorded a R117 million gain related to this provision in terms of IAS21 and IAS39 in finance charges as a result of the strengthening of the Rand. In addition, we included provisions for interest of R40 million and R50 million related to Telcordia in finance charges in the years ended March 31, 2003 and 2002, respectively, and a provision for legal fees of R58 million related to Telcordia is included in services rendered in the year ended March 31, 2003. In the year ended March 31, 2004, all of these provisions were reversed.
- (4)
- Costs in respect of asset write-offs of R350 million, R205 million and R445 million in the 2004, 2003 and 2002 financial years, respectively, were reclassified from selling, general and administrative expenses to depreciation, amortization, impairments and asset write-offs in the 2004 financial year. Selling, general and administrative expenses and depreciation, amortization, impairments and asset write-offs for the 2003 and 2002 financial years have been revised to reflect the new presentation.
- (5)
- Costs in respect of losses on the disposal of property, plant and equipment and investments of R6 million, R1 million and R1 million in the 2004, 2003 and 2002 financial years, respectively, were reclassified from selling, general and administrative expenses to other income in the 2004 financial year and R9 million of profit on sale of assets in the 2002 financial year was reclassified from selling, general and administrative expenses to other income in the 2004 financial year. Selling, general and administrative expenses has been revised to reflect the new presentation.
- (6)
- Insurance costs paid to Debis for our vehicle fleet of R81 million, R81 million and R78 million in the 2004, 2003 and 2002 financial years, respectively, were reclassified from operating leases to services rendered in the 2004 financial year. Operating leases and services rendered for the 2003 and 2002 financial years have been revised to reflect the new presentation.
Employee expenses. Employee expenses consist mainly of salaries and wages for employees, including bonuses and other incentives, benefits and employee retrenchment expenses.
The following table sets forth information related to our employee expenses for the periods indicated.
Fixed-line employee expenses
| | Year ended March 31, | | | ||||||||
|---|---|---|---|---|---|---|---|---|---|---|---|
| | 2003/2002 % change | 2004/2003 % change | |||||||||
| | 2002 | 2003 | 2004 | ||||||||
| | (ZAR millions, except percentages and number of employees) | ||||||||||
| Salaries and wages(1)(2) | 5,044 | 4,825 | 4,795 | (4.3 | ) | (0.6 | ) | ||||
| Benefits(2) | 1,786 | 2,127 | 2,161 | 19.1 | 1.6 | ||||||
| Employee retrenchment expenses | 373 | 244 | 302 | (34.6 | ) | 23.8 | |||||
| Employee related expenses capitalized | (592 | ) | (498 | ) | (515 | ) | (15.9 | ) | 3.4 | ||
| Employee expenses | 6,611 | 6,698 | 6,743 | 1.3 | 0.7 | ||||||
| Number of full-time, fixed-line employees (at period end)(1) | 40,030 | 35,942 | 32,934 | (10.2 | ) | (8.4 | ) | ||||
- (1)
- Includes employees of our Telkom Directory Services and Swiftnet subsidiaries.
- (2)
- Homeowner's allowances, motor allowances, standby and related allowances of R728 million, R751 million and R721 million in the 2004, 2003 and 2002 financial years, respectively, were reclassified from benefits to salaries and wages in the 2004 financial year as they form part of basic remuneration packages. Benefits and salaries and wages for the 2003 and 2002 financial years have been revised to reflect the new presentation.
130
Employee expenses increased 0.7% in the year ended March 31, 2004 primarily due to higher retrenchment costs, salary increases and benefits, partially offset by reduced overtime and lower headcount. Employee expenses increased 1.3% in the year ended March 31, 2003 primarily due to higher benefits as a result of increased bonuses paid under our team award and other incentive programs as we met our financial and operational performance targets during the 2003 financial year and lower employee related expenses capitalized resulting from lower capital expenditure during the 2003 financial year, partially offset by lower salaries and wages and employee retrenchment expenses.
Salaries and wages decreased 0.6% in the year ended March 31, 2004 primarily due to lower overtime, enabled by the implementation of a multiple shift schedule, the ongoing decrease in the number of employees as a result of our employee reduction program and reduced part-time and temporary workers, partially offset by a 9% increase in base salaries and wages resulting from collective bargaining agreements. Salaries and wages decreased 4.3% in the year ended March 31, 2003 primarily due to reduced overtime as a result of the implementation of a multiple shift schedule, a decrease in the number of employees and reduced part-time and temporary workers, partially offset by a 7.5% increase in base salaries and wages pursuant to collective bargaining agreements during the year.
Benefits include allowances, such as bonuses, company contributions to medical aid, pension and retirement funds, leave provisions, workmen's compensation and levies payable for skills development. Benefits increased 1.6% in the 2004 financial year due to a requirement to include contributions for pension and medical aid in the leave provision, partially offset by the reduced number of employees. Benefits increased 19.1% in the year ended March 31, 2003 primarily due to increased bonuses paid under our team award and other incentive programs as we met our financial and operational performance targets during the 2003 financial year. Bonuses were lower in the 2002 financial year because our financial targets were not met and performance targets were only partially achieved during the 2002 financial year. Employee retrenchment expenses include the cost of voluntary early retirement, termination severance packages offered to employees and the cost of social plan expenses to equip redundant employees for new careers outside Telkom.
Employee retrenchment expenses increased 23.8% in the year ended March 31, 2004 due to the offering and acceptance of enhanced packages aimed primarily at staff on management level resulting in the average retrenchment package per employee increasing substantially. Employee retrenchment expenses decreased 34.6% in the year ended March 31, 2003 as lower numbers of employees were retrenched during the year. We retrenched, or notified of retrenchment, 1,633 employees in the 2004 financial year compared to 2,124 employees in the 2003 financial year and 2,960 in the 2002 financial year. For additional information related to our fixed-line employee numbers, see Item 4. "Information on the Company—Business Overview—Fixed-line communications—Employees."
Employee related expenses capitalized include employee related expenses associated with construction and infrastructure development projects. Employee related expenses capitalized increased 3.4% in the year ended March 31, 2004 due to the substitution of internal labor in lieu of subcontractors. Employee related expenses capitalized decreased 15.9% in the year ended March 31, 2003 primarily due to reduced capital expenditures.
Payments to other network operators. Payments to other network operators include settlement payments paid to the three South African mobile communications network operators for terminating calls on their networks and to international network operators for terminating outgoing international calls and traffic transiting through their networks.
The following table sets forth information related to our payments to other network operators for the periods indicated.
131
Fixed-line payments to other network operators
| | Year ended March 31, | | | ||||||||
|---|---|---|---|---|---|---|---|---|---|---|---|
| | 2002 | 2003 | 2004 | | | ||||||
| | 2003/2002 % change | 2004/2003 % change | |||||||||
| | ZAR | ZAR | ZAR | ||||||||
| | | (in millions, except percentages) | | ||||||||
| Payments to mobile communications network operators(1) | 5,199 | 5,235 | 5,041 | 0.7 | (3.7 | ) | |||||
| Payments to international network operators | 1,450 | 1,398 | 1,022 | (3.6 | ) | (26.9 | ) | ||||
| Payments to other network operators | 6,649 | 6,633 | 6,063 | (0.2 | ) | (8.6 | ) | ||||
- (1)
- Discounts offered on mobile-to-fixed interconnect of R9 million, R11 million and R33 million in the 2004, 2003 and 2002 financial years, respectively, and discounts on leased line facilities to mobile operators of R77 million, R82 million and R77 million in the 2004, 2003 and 2002 financial years, respectively, were reclassified from payments to other operators in operating expenses to an offset to operating revenue in the 2004 financial year. Payments to other operators for the 2003 and 2002 financial years have been revised to reflect the new presentation.
Payments to other network operators decreased 8.6% in the year ended March 31, 2004 primarily due to lower volumes of calls from our fixed-line network to the mobile networks and the strength of the Rand against the SDR, resulting in lower international settlement rates. Payments to other network operators remained relatively constant, decreasing 0.2% in the year ended March 31, 2003. The decrease was primarily due to the strength of the Rand against the SDR, resulting in lower international settlement rates. The decrease was partially offset by increased termination rates from November 2001 pursuant to our amended interconnection agreement with mobile operators and increased outgoing traffic. Payments to other network operators include payments made by our fixed-line business to Vodacom, which were R2,764 million in the year ended March 31, 2004, R2,978 million in the year ended March 31, 2003 and R2,968 million in the year ended March 31, 2002. Fifty percent of these amounts were attributable to our interest in Vodacom and were eliminated from the Telkom Group's expenses on consolidation.
Selling, general and administrative expenses. Selling, general and administrative expenses include materials and maintenance costs, marketing expenditures, bad debts, theft and other expenses, including obsolete stock and cost of sales.
132
The following table sets forth information related to our fixed-line selling, general and administrative expenses for the periods indicated.
Fixed-line selling, general and administrative expenses
| | Year ended March 31, | | | ||||||||
|---|---|---|---|---|---|---|---|---|---|---|---|
| | 2002 | 2003 | 2004 | | | ||||||
| | 2003/2002 % change | 2004/2003 % change | |||||||||
| | ZAR | ZAR | ZAR | ||||||||
| | (in millions, except percentages) | ||||||||||
| Materials and maintenance | 2,093 | 1,932 | 1,623 | (7.7 | ) | (16.0 | ) | ||||
| Marketing | 346 | 296 | 306 | (14.5 | ) | 3.4 | |||||
| Bad debts | 965 | 215 | 228 | (77.7 | ) | 6.0 | |||||
| Other | 810 | 664 | 481 | (18.0 | ) | (27.6 | ) | ||||
| Selling, general and administrative expenses(1) | 4,214 | 3,107 | 2,638 | (26.3 | ) | (15.1 | ) | ||||
- (1)
- Selling, general and administrative expenses include provisions for potential liabilities related to Telkom's arbitration with Telcordia of R325 million in the year ended March 31, 2002, excluding interest and legal fees. In the year ended March 31, 2003, we recorded a R117 million gain related to this provision in terms of IAS21 and IAS39 in finance charges as a result of the strengthening of the Rand. In addition, we included provisions for interest of R40 million and R50 million related to Telcordia in finance charges in the years ended March 31, 2003 and 2002, respectively, and a provision for legal fees of R58 million related to Telcordia is included in services rendered in the year ended March 31, 2003. In the year ended March 31, 2004, all of these provisions were reversed. Costs in respect of asset write-offs of R350 million, R205 million and R445 million in the 2004, 2003 and 2002 financial years, respectively, were reclassified from selling, general and administrative expenses to depreciation, amortization, impairments and asset write-offs in the 2004 financial year. Costs in respect of losses on the disposal of property, plant and equipment and investments of R6 million, R1 million and R1 million in the 2004, 2003 and 2002 financial years, respectively, were reclassified from selling, general and administrative expenses to other income in the 2004 financial year and R9 million of profit on sale of assets in the 2002 financial year was reclassified from selling, general and administrative expenses to other income in the 2004 financial year. Selling, general and administrative expenses for the 2003 and 2002 financial years have been revised to reflect the new presentation.
Selling, general and administrative expenses decreased 15.1% in the year ended March 31, 2004. Selling, general and administrative expenses were significantly impacted by the reversal of the R325 million provision for the Telcordia dispute and lower materials and maintenance expenses impacted mainly by improved efficiencies and cost saving initiatives, reduced cable theft and a favorable exchange rate. The decrease in selling, general and administrative expenses in the 2004 financial year was partially offset by slightly higher bad debts and marketing expense. Selling, general and administrative expenses decreased 26.3% in the year ended March 31, 2003. Selling, general and administrative expenses were impacted in the 2002 financial year by the inclusion of a R325 million provision, excluding interest and legal fees, related to the Telcordia dispute. Excluding these items, selling, general and administrative expenses decreased in the year ended March 31, 2003 primarily due to reduced bad debts as a result of lower bad debt write-offs and a R276 million reduction in the provision for doubtful accounts on our balance sheet, as well as lower marketing and materials and maintenance expenses due to cost cutting initiatives and reduced losses in respect of cable theft.
Materials and maintenance expenses include stock write-offs, subcontractors' payments and consumables required to maintain our network. Materials and maintenance expenses decreased 16.0% in the year ended March 31, 2004 primarily due to the impact of improved efficiencies and cost saving initiatives, a lower incidence of theft and faults in the network and a favorable exchange rate. Materials
133
and maintenance expenses decreased 7.7% in the year ended March 31, 2003 due to improved efficiencies.
Marketing expenses increased 3.4% in the year ended March 31, 2004 primarily due to increased branding cost to support South Africa's 2010 soccer world cup bid being partially offset by lower expenses for education and other image campaigns. Marketing expenses decreased 14.5% in the year ended March 31, 2003 primarily due to reduced operational marketing expense as a result of cost containment initiatives. We expect marketing expenses to continue to increase in the future in response to increased competition from the second national operator and the further liberalization of the South African communications industry generally.
Bad debt increased R13 million in the year ended March 31, 2004 following revenue growth of R1.4 billion in the same period. Bad debt as a percent of revenue was 0.7%, 0.7% and 3.5% in the years ending 2004, 2003 and 2002, respectively. Our bad debt expense in 2002 was significantly higher than subsequent years due to the roll-out of our mandated fixed-line targets to underserviced areas. Since then our improved credit management and credit vetting policies combined with only targeted line roll-out where it is economical has significantly reduced our bad debt expense.
Other expenses include obsolete stock, cost of sales, subsistence and travel and an offset for bad debts recovered. Other expenses decreased 27.6% in the year ended March 31, 2004 primarily due to reversal of the R325 million provision for the Telcordia dispute following the judgment handed down by the South African High Court on November 27, 2003, setting aside the partial award and issuing a cost order in favor of Telkom. On May 3, 2004, the South African High Court dismissed an application by Telcordia for leave to appeal and ordered Telcordia to pay the legal costs of Telkom. As a result, the Telcordia dispute has been referred back to arbitration. Other expenses decreased 18.0% in the year ended March 31, 2003. Other expenses in the 2002 financial year were impacted by the inclusion of a R325 million provision, excluding interest and legal fees, related to the Telcordia dispute. Excluding the reversal of the Telcordia provision in the 2004 financial year, other expense increased in the 2004 financial year. Excluding the Telcordia provision in the 2002 financial year, other expenses increased in the 2003 financial year primarily due to the inclusion of an R80 million provision for a probable expense relating to certain services rendered to international carriers, a R61 million provision for penalties payable pursuant to our strategic services agreement for failing to meet certain training targets and higher capitalized expenses in the 2002 financial year.
Services rendered. Services rendered include payments in respect of the management of our properties, consultants and security. Consultants comprise fees paid to collection agents and to providers of other professional services, such as Thintana Communications and external auditors. Security refers to services to safeguard the network and contracts to ensure a safe work environment, such as guard services.
The following table sets forth information relating to services rendered expenses for the periods indicated.
134
Fixed-line services rendered
| | Year ended March 31, | | | ||||||||
|---|---|---|---|---|---|---|---|---|---|---|---|
| | 2002 | 2003 | 2004 | | | ||||||
| | 2003/2002 % change | 2004/2003 % change | |||||||||
| | ZAR | ZAR | ZAR | ||||||||
| | | (in millions, except percentages) | | ||||||||
| Property management(1) | 1,241 | 1,233 | 1,164 | (0.6 | ) | (5.6 | ) | ||||
| Consultants, security and other(1)(2) | 975 | 1,337 | 1,038 | 37.1 | (22.4 | ) | |||||
| Services rendered | 2,216 | 2,570 | 2,202 | 16.0 | (14.3 | ) | |||||
- (1)
- Management fees paid to TFMC relating to property management expenses of R146 million, R147 million and R145 million in the 2004, 2003 and 2002 financial years, respectively, were reclassified from consultants, security and other to property management in the 2004 financial year. Consultants, security and other and property management for the 2003 and 2002 financial years have been revised to reflect the new presentation.
- (2)
- Insurance costs paid to Debis for our vehicle fleet of R81 million, R81 million and R78 million in the 2004, 2003 and 2002 financial years, respectively, were reclassified from operating leases to services rendered in the 2004 financial year. Services rendered for the 2003 and 2002 financial years have been revised to reflect the new presentation.
Property management decreased 5.6% in the year ended March 31, 2004 primarily due to consolidation of properties and general efficiencies in maintenance, cleaning and utilities usage. Property management decreased 0.6% in the year ended March 31, 2003 primarily due to lower maintenance and cleaning expense as a result of renegotiated contracts and reduced service level agreements, partially offset by increased utilities and retrenchments costs for contractors' staff.
Payments to consultants decreased 22.4% in the year ended March 31, 2004 primarily due to the non-recurring professional services expenses related to our initial public offering in the 2003 financial year and a reduction in fees paid to Thintana Communications as a result of fewer key personnel, reduced management fees and a more favorable exchange rate, and a reversal of legal fees related to Telcordia. Consultants, security and other payments increased 37.1% in the year ended March 31, 2003 primarily due to increased costs and expenses for auditors, legal and management costs related to our initial public offering, the provisioning of dollar denominated amounts paid under the strategic services agreement at spot rate in accordance with IAS39, increased provisions for legal fees related to our dispute with Telcordia Technologies and increased insurance costs. Amounts paid for the strategic services agreement were accounted for in our financial statements at the forward rate after taking into account the hedged amounts under foreign currency contracts in the year ended March 31, 2002 and at the spot rate in the years ended March 31, 2003 and 2004. Consultants, security and other payments included R213 million of expenses related to our initial public offering in the year ended March 31, 2003. Consultants, security and other payments include expenses of R154 million, R273 million and R219 million in the years ended March 31, 2004, 2003 and 2002, respectively, for the strategic services provided by our strategic equity investor, Thintana Communications, pursuant to our strategic service agreement. The fees paid to Thintana Communications at the forward cover rate were R126 million in the 2003 financial year and the spot rate for such fees was R396 million in the 2002 financial year. A portion of payments made to Thintana Communications relate to capital projects and have been capitalized.
Operating leases. Operating leases include payments in respect of equipment, buildings and vehicles. Insurance costs paid to Debis for our vehicle fleet of R81 million, R81 million and R78 million in the 2004, 2003 and 2002 financial years, respectively, were reclassified from operating
135
leases to services rendered in the 2004 financial year. Operating leases for the 2003 and 2002 financial years have been revised to reflect the new presentation.
Operating leases decreased 18.2% in the year ended March 31, 2004 primarily due to a 6% decrease in the number of vehicles in our fleet from 12,601 vehicles as of March 31, 2003 to 11, 849 vehicles as of March 31, 2004. Our space optimization program, which relocated employees from leased premises to owned premises and improved overall space utilization, also contributed to a 33.2% decline in lease expense. Operating leases remained relatively constant, increasing 0.4% in the year ended March 31, 2003 primarily due to increased vehicle lease expenses and, to a lesser extent, increased expense in connection with surveillance and monitoring equipment leases to protect against theft, partially offset by a decrease in building leases. The decrease in vehicle lease expenses associated with the decrease in our vehicle fleet from 16,627 vehicles at March 31, 2002 to 12,601 vehicles at March 31, 2003 was offset by significant expenses associated with equipment upgrades to our vehicle fleet, increased lease payments tied to inflation and interest rates and increased fuel cost.
Depreciation, amortization, impairments and asset write-offs. Costs in respect of asset write-offs of R350 million, R205 million and R445 million in the 2004, 2003 and 2002 financial years, respectively, were reclassified from selling, general and administrative expenses to depreciation, amortization, impairments and asset write-offs in the 2004 financial year. Depreciation, amortization, impairments and asset write-offs for the 2003 and 2002 financial years have been revised to reflect the new presentation.
Depreciation, amortization, impairments and asset write-offs increased 12.7% in the year ended March 31, 2004 primarily due to ongoing investment in telecommunications equipment, data processing and support equipment and higher impairments and asset write-offs due to the write-off of an increased level of assets and the additional impairment of network related assets. Depreciation, amortization, impairments and asset write-offs increased 10.4% in the year ended March 31, 2003 primarily due to investment in telecommunications equipment, data processing equipment, support equipment and buildings, including investment in payphones, cables, switching and transmission equipment and process control and surveillance equipment with shorter lives.
Asset write-offs decreased significantly in the years ended March 31, 2004 and 2003 primarily due to the inclusion of the R346 million write-off of Telcordia related assets in the 2002 financial year and the write-off of fewer network assets in the 2003 and 2004 financial years. We incurred a R149 million impairment of Telkom's satellite earth station at Hartebeespoort in the 2004 financial year.
Fixed-line operating profit
Fixed-line operating profit increased significantly in the year ended March 31, 2004 due to higher revenue and a decline in operating expenses. The increase in fixed-line operating revenue in the 2004 financial year was primarily due to increased subscription and connection tariffs, growth in data services, increased long-distance, local, international and fixed-to-mobile traffic tariffs and increased interconnection traffic, partially offset by lower long distance and fixed-to-mobile traffic. Fixed-line operating expenses decreased 3.5% in the 2004 financial year primarily due to reduced payments to other network operators, selling, general and administrative expenses, services rendered and operating leases, partially offset by increased depreciation, amortization, impairments and asset write-offs. Payments to other network operators decreased primarily due to lower volumes of calls from our fixed-line network to the mobile networks and favorable exchange rates resulting in lower international settlement rates. Selling, general and administrative expenses were significantly impacted by the reversal of the R325 million provision for the Telcordia dispute. Selling, general and administrative expenses decreased primarily due to lower materials and maintenance expenses impacted mainly by improved efficiencies and cost saving initiatives, reduced theft and a favorable exchange rate. Services rendered was lower due to non-recurring expenses related to our initial public offering incurred in the 2003
136
financial year and the reduction in fees paid to Thintana Communications as a result of fewer key personnel, reduced management fees and a more favorable exchange rate. Operating leases decreased primarily due to a decrease in the number of vehicles in our fleet, the continued relocation of employees from leased properties to owned properties and improvements in overall space utilization. Employee expenses increased marginally due to our retrenchment program.
Fixed-line operating profit increased significantly in the year ended March 31, 2003 due to higher revenue driven by increased subscription tariffs, local traffic tariffs and fixed-to-mobile traffic tariffs and data revenue growth, while fixed-line operating expense declined slightly. The decline in fixed-line operating expenses was primarily due to reduced selling, general and administrative expenses and, to a lesser extent, reduced payments to other network operators, partially offset by increased depreciation, amortization, impairments and asset write-offs and services rendered. Selling, general and administrative expenses were impacted in the 2002 financial year by the inclusion of a R325 million provision, excluding interest and legal fees, related to the Telcordia dispute. Excluding these items, selling, general and administrative expenses decreased primarily due to reduced bad debts as a result of lower bad debt write-offs and a R276 million reduction in the provision for doubtful accounts on our balance sheet, as well as lower marketing and materials expenses due to cost cutting initiatives and reduced losses in respect of cable theft. The decrease in fixed-line operating expenses was partially offset by increased depreciation, amortization, impairments and asset write-offs while operating leases and employee expenses remained relatively constant. A decrease in salaries and wages and employee retrenchment expenses in the 2003 financial year was partially offset by an increase in benefits in that year.
Mobile segment
Mobile is our fastest growing segment and encompasses all the operating activities of our 50% joint venture investment in Vodacom, the largest mobile operator in South Africa with an approximate 54% market share as of March 31, 2004 based on total estimated customers in South Africa. In addition to its South African operations, Vodacom has investments in mobile communications network operators in Lesotho, Tanzania, the Democratic Republic of the Congo and Mozambique. Although Vodacom had entered into a management agreement with VEE Networks in Nigeria, Vodacom has subsequently announced that it has elected to terminate the management contract and abandon its plan to make an equity investment in Econet Wireless in Nigeria. Vodacom's operations outside of South Africa are at an earlier stage in their expansion and market penetration than its operations in South Africa. As a result, Vodacom's customer acquisition costs and capital expenditures per customer for its other African operations are generally higher than for its South African operations. Customers in other African countries increased significantly over the past three financial years to 1,492,000 as of March 31, 2004 from 772,821 as of March 31, 2003 and 306,146 as of March 31, 2002. A substantial portion of the growth was from prepaid services. Services outside of South Africa are mainly prepaid due to the lack of banking systems and credit histories.
The following table shows information related to our 50% share of Vodacom's operating revenue and operating profit broken down by Vodacom's South African operations and operations in other African countries for the periods indicated. All amounts in this table and the discussion of our mobile segment that follows represent 50% of Vodacom's results of operations unless otherwise stated and are before the elimination of intercompany transactions with us.
137
Mobile operating revenue and profits
| | Year ended March 31, | | | |||||||||||||
|---|---|---|---|---|---|---|---|---|---|---|---|---|---|---|---|---|
| | 2002 | 2003 | 2004 | | | |||||||||||
| | ZAR | % of total | ZAR | % of total | ZAR | % of total | 2003/2002 % change | 2004/2003 % change | ||||||||
| | | | (in millions, except percentages) | | | |||||||||||
| Operating revenue | 8,075 | 100.0 | 9,890 | 100.0 | 11,739 | 100.0 | 22.5 | 18.7 | ||||||||
| South Africa | 7,705 | 95.4 | 9,272 | 93.8 | 10,991 | 93.6 | 20.3 | 18.5 | ||||||||
| Other African countries | 370 | 4.6 | 618 | 6.2 | 748 | 6.4 | 67.0 | 21.0 | ||||||||
| Operating profit(1) | 1,816 | 100.0 | 2,166 | 100.0 | 2,617 | 100.0 | 19.3 | 20.8 | ||||||||
| South Africa | 1,775 | 97.7 | 2,168 | 100.1 | 2,650 | 101.3 | 22.1 | 22.2 | ||||||||
| Other African countries | 41 | 2.3 | (2 | ) | (0.1 | ) | (33 | ) | (1.3 | ) | n/a | n/a | ||||
| EBITDA(2) | 2,851 | 100.0 | 3,354 | 100.0 | 3,883 | 100.0 | 17.6 | 15.8 | ||||||||
- (1)
- Vodacom's foreign exchange gains and losses included in operating expenses have been reclassified in the consolidation of the Telkom Group in the 2002 financial year under finance charges.
- (2)
- Our mobile EBITDA comprises our 50% share of Vodacom's EBITDA, which represents mobile net profit before minority interests, taxation, finance charges, investment income and depreciation, amortization, impairments and asset write-offs. See footnote 6 in Item 3. "Key Information—Selected Historical Consolidated Financial and Other Data of Vodacom" for a reconciliation of EBITDA of Vodacom to net profit. See footnote 5 in the table under Item 5. "Operating and Financial Review and Prospects—Results of Operations—Year ended March 31, 2004 compared to year ended March 31, 2003 and year ended March 31, 2002—Consolidated results" for a reconciliation of mobile EBITDA to operating profit. We believe that EBITDA provides meaningful additional information to investors since it is widely accepted by analysts and investors as a basis for comparing a company's underlying operating profitability with that of other companies as it is not influenced by past capital expenditures or business acquisitions, a company's capital structure or the relevant tax regime. This is particularly the case in a capital-intensive industry such as communications. It is also a widely accepted indicator of a company's ability to service its long-term debt and other fixed obligations and to fund its continued growth. EBITDA is not a US GAAP or IFRS measure. You should not construe EBITDA as an alternative to operating profit or cash flows from operating activities determined in accordance with US GAAP or IFRS or as a measure of liquidity. EBITDA is not defined in the same manner by all companies and may not be comparable to other similarly titled measures of other companies unless the definition is the same. Mobile EBITDA includes a net gain of R28 million in the 2002 financial year for our 50% share of Vodacom's integration costs, disposals of operations and impairments.
Mobile operating revenue
Vodacom derives revenue from mobile services as well as other related or value added goods and services. Vodacom's revenue is mainly in the form of airtime charges, primarily airtime payments from customers registered on Vodacom's network; interconnection revenue from other operators for the termination of calls on Vodacom's network and national roaming revenue from Cell C; revenue from equipment sales, including sales of handsets and accessories; and revenue from international services, including airtime charges for the use of Vodacom's network through roaming of customers from other international networks and Vodacom customers who roam abroad.
The following table shows our 50% share of Vodacom's revenue broken down by major revenue type and as a percentage of total operating revenue for our mobile segment and the percentage change by revenue type for the periods indicated. In the 2004 financial year, Vodacom revised the segmental
138
presentation of its operating revenue to include data revenue, which was previously included in airtime revenue, as a new line item in its financial statements.
Mobile operating revenue
| | Year ended March 31, | | | ||||||||||||||
|---|---|---|---|---|---|---|---|---|---|---|---|---|---|---|---|---|---|
| | 2002 | 2003 | 2004 | | | ||||||||||||
| | ZAR | % of total | ZAR | % of total | ZAR | % of total | 2003/2002 % change | 2004/2003 % change | |||||||||
| | (in millions, except percentages) | ||||||||||||||||
| Airtime | 4,515 | 55.9 | 5,323 | 53.8 | 6,369 | 54.3 | 17.9 | 19.7 | |||||||||
| Data | 228 | 2.8 | 327 | 3.3 | 520 | 4.4 | 43.4 | 59.0 | |||||||||
| Interconnection | 2,150 | 26.6 | 2,655 | 26.8 | 2,892 | 24.6 | 23.5 | 8.9 | |||||||||
| Equipment sales | 814 | 10.1 | 1,132 | 11.4 | 1,449 | 12.3 | 39.1 | 28.0 | |||||||||
| International airtime | 151 | 1.9 | 270 | 2.7 | 330 | 2.8 | 78.8 | 22.2 | |||||||||
| Other sales and services | 217 | 2.7 | 183 | 2.0 | 179 | 1.6 | (15.7 | ) | (2.2 | ) | |||||||
| Mobile operating revenue | 8,075 | 100.0 | 9,890 | 100.0 | 11,739 | 100.0 | 22.5 | 18.7 | |||||||||
139
The following table sets forth non-financial operational data of Vodacom for the periods indicated. The amounts stated for customers and traffic minutes reflect 100% of Vodacom's customers and traffic minutes.
| | Year ended March 31, | | | |||||||||
|---|---|---|---|---|---|---|---|---|---|---|---|---|
| | 2003/2002 % change | 2004/2003 % change | ||||||||||
| | 2002 | 2003 | 2004 | |||||||||
| South Africa | ||||||||||||
| Customers (thousands) (at period end)(1) | 6,557 | 7,874 | 9,725 | 20.1 | 23.5 | |||||||
| Contract | 1,090 | 1,181 | 1,420 | 8.3 | 20.2 | |||||||
| Prepaid | 5,439 | 6,664 | 8,282 | 22.5 | 24.3 | |||||||
| Community services | 28 | 29 | 23 | 3.6 | (20.7 | ) | ||||||
| Total inactive mobile customers (%) (at period end)(2) | 13.9 | 18.2 | 17.6 | 30.9 | (3.3 | ) | ||||||
| Contract | 3.8 | 5.3 | 5.7 | 39.5 | 7.5 | |||||||
| Prepaid | 15.9 | 20.5 | 19.7 | 28.9 | (3.9 | ) | ||||||
| Traffic minutes (millions of minutes)(3) | 8,881 | 10,486 | 12,297 | 18.1 | 17.3 | |||||||
| Outgoing | 4,967 | 6,343 | 7,772 | 27.7 | 22.5 | |||||||
| Incoming (Interconnection) | 3,914 | 4,143 | 4,525 | 5.9 | 9.2 | |||||||
| Average MOU (minutes)(4) | 111 | 101 | 96 | (9.0 | ) | (5.0 | ) | |||||
| Contract | 264 | 269 | 263 | 1.9 | (2.2 | ) | ||||||
| Prepaid | 58 | 54 | 56 | (6.9 | ) | 3.7 | ||||||
| Community services | 3,354 | 3,162 | 3,061 | (5.7 | ) | (3.2 | ) | |||||
| ARPU (ZAR)(5)(6) | 182 | 183 | 177 | 0.5 | (3.3 | ) | ||||||
| Contract(6) | 560 | 629 | 634 | 12.3 | 0.8 | |||||||
| Prepaid | 93 | 90 | 90 | (3.2 | ) | — | ||||||
| Community services | 1,719 | 1,861 | 2,155 | 8.3 | 15.8 | |||||||
| Churn (%)(7) | 27.2 | 30.4 | 36.6 | 11.8 | 20.4 | |||||||
| Contract | 14.5 | 11.9 | 10.1 | (17.9 | ) | (15.1 | ) | |||||
| Prepaid | 30.1 | 34.0 | 41.3 | 13.0 | 21.5 | |||||||
| Other African countries | ||||||||||||
| Customers (thousands) (at period end)(1) | 306 | 773 | 1,492 | 152.6 | 93.0 | |||||||
| Lesotho | 57 | 78 | 80 | 36.8 | 2.6 | |||||||
| Tanzania | 228 | 447 | 684 | 96.1 | 53.0 | |||||||
| Democratic Republic of the Congo | 21 | 248 | 670 | 1,081.0 | 170.2 | |||||||
| Mozambique | — | — | 58 | — | — | |||||||
| ARPU(5) | ||||||||||||
| Lesotho (ZAR) | 144 | 104 | 125 | (27.8 | ) | 20.2 | ||||||
| Tanzania (USD) | 27 | 22 | 18 | (18.5 | ) | (18.2 | ) | |||||
| Democratic Republic of the Congo (USD) | n/a | 20 | 21 | n/a | 5.0 | |||||||
| Mozambique (USD) | — | — | 15 | n/a | n/a | |||||||
- (1)
- Customer totals are based on the total number of customers registered on Vodacom's network, which have not been disconnected, including inactive customers, as of the end of the period indicated.
- (2)
- Vodacom's inactive customers are defined as all customers registered on Vodacom's network for which no revenue generating activity has been recorded for a period of three consecutive months.
- (3)
- Vodacom's traffic comprises total traffic registered on Vodacom's network, including bundled minutes, outgoing international roaming calls and calls to free services, but excluding national and incoming international roaming calls.
140
- (4)
- Vodacom's average MOU is calculated by dividing the average monthly minutes during the period by the average monthly total reported customer base during the period. MOU excludes calls to free services, bundled minutes and data minutes.
- (5)
- ARPU is calculated by dividing the average monthly revenue during the period by the average monthly total reported customer base during the period. ARPU excludes revenues from equipment sales, other sales and services and revenues from national and international users roaming on Vodacom's networks.
- (6)
- Value added service revenue from previously partially owned service providers is included in contract and total average monthly revenue per customer from October 1, 2001.
- (7)
- Churn is calculated by dividing the average monthly total number of disconnections during the period by the average monthly total reported customer base during the period. Vodacom's contract customers are disconnected when they terminate their contract, or their service provider who carries the credit risk terminates their contract due to non-payment. Prepaid customers were disconnected if they did not recharge their vouchers after being in time window lock for six months for periods prior to November and December 2002, for four months for periods from November and December 2002 until April 2003 and for three months from April 2003 until December 2003. Time window lock occurs when a customer's paid active time window, or access period, expires. In December 2003, Vodacom changed the deactivation rule for prepaid customers to align itself with European and industry standards. From December 2003, prepaid customers are disconnected from its network if they record no revenue generating activity within a period of 215 consecutive days. See Item 4. "Information on the Company—Business Overview—Mobile communications—South Africa—Customers."
Vodacom's operating revenue increased 18.7% in the year ended March 31, 2004 primarily driven by strong customer growth and standard tariff increases. Equipment sales increased primarily due to Vodacom's expanded customer base in its Vodacom Congo operations and the significant increase in sales of new handsets in South Africa fuelled by cheaper Rand-prices of MMS- and GPRS-enabled handsets coupled with the added functionality of the new phones, such as built in digital cameras, as well as increased connections. Our 50% share of Vodacom's revenue from operations outside of South Africa increased to R748 million in the year ended March 31, 2004 from R618 million in the year ended March 31, 2003. The increase was due to substantial increases in the number of customers in Vodacom's operations in the Democratic Republic of Congo and Tanzania, partially offset by the strength of the Rand, which resulted in lower US Dollar denominated tariffs. Revenue from Vodacom's operations outside of South Africa as a percentage of Vodacom's total mobile operating revenue increased to 6.4% in the year ended March 31, 2004 from 6.2% in the year ended March 31, 2003.
Vodacom's operating revenue increased 22.5% in the year ended March 31, 2003 primarily driven by customer growth and to a lesser extent by standard tariff increases. The increase in Vodacom's operating revenue was further boosted by a R317 million increase in equipment sales primarily due to sales in the Democratic Republic of the Congo and Tanzania, as well as an uptake of 2.5 generation handsets in South Africa. Our 50% share of Vodacom's revenue from operations outside of South Africa increased to R618 million in the year ended March 31, 2003 from R370 million in the year ended March 31, 2002. The increases were due to substantial increases in the number of customers in Vodacom's operations in Tanzania and the Democratic Republic of Congo. Revenue from Vodacom's operations outside of South Africa as a percentage of Vodacom's total mobile operating revenue increased to 6.2% in the year ended March 31, 2003 from 4.6% in the year ended March 31, 2002.
A large part of the growth in mobile services was due to the success of prepaid services. Approximately 85.2% of Vodacom's South African mobile customers were prepaid customers at March 31, 2004. Vodacom expects the number of prepaid mobile users to continue to grow as a percentage of total mobile users. Prepaid customers on average tend to use fewer minutes and generate
141
lower revenue than contract customers. As a result, average monthly minutes of use per customer and ARPU are lower for prepaid customers. The increasing percentage of prepaid users has resulted in decreasing overall average revenue per customer, despite increasing average revenue per contract customer. Vodacom believes that the decline in its total ARPU in South Africa in recent years has begun to slow primarily due to the impact of new, higher ARPU prepaid products, such as 4U, the continued growth in contract ARPU and slower growth rates in overall customers. In the 2004 financial year, however, total ARPU in South Africa declined by 3.3% due to the continued dilution as a result of the higher proportion of prepaid connections with lower ARPU than contract customers. South African contract ARPU grew by 0.8% to R634 per month for the year ended March 31, 2004, as compared to R629 per month in the year ended March 31, 2003, while prepaid ARPU over the same period remained stable at R90 per month. Community services ARPU in South Africa increased 15.8% and 8.3% in the years ended March 31, 2004 and 2003, respectively. In the 2004 financial year, one community service phone was equivalent to 38 prepaid customers on an outgoing revenue basis and nearly 127 prepaid customers on a usage basis since calls from community services phones are subsidized.
In South Africa, Vodacom's total ARPU remained relatively constant, increasing 0.5% in the year ended March 31, 2003 primarily due to the introduction of new, higher ARPU, such as 4U, the continued growth in contract ARPU in South Africa and competition. In South Africa, Vodacom's total ARPU decreased 12.5% in the year ended March 31, 2002 primarily due to the increase in the percentage of prepaid customers in Vodacom's total customer base from 79% as of March 31, 2001 to 83% as of March 31, 2002. Vodacom's contract ARPU in South Africa increased 12.3% and 13.6% in the years ended March 31, 2003 and 2002, respectively. Prepaid ARPU in South Africa decreased 3.2% and 5.1% in the years ended March 31, 2003 and 2002, respectively, primarily due to a decrease in average monthly minutes of use per prepaid customer as newer prepaid customers tend to be in lower income tiers. Community services ARPU in South Africa increased 8.3% and 18.3% in the years ended March 31, 2003 and 2002, respectively.
Service providers in South Africa generally subsidize handset sales for contract customers. Subsidized handset sales give customers an incentive to switch operators to obtain new handsets and have contributed to churn. Handsets for prepaid customers are not subsidized by Vodacom as these users have the freedom of switching operators and contribute to churn. Vodacom is more vulnerable to churn than other mobile communications providers in South Africa since it has the largest number of customers in South Africa.
Vodacom's churn rate for contract customers in South Africa decreased to 10.1%, in the year ended March 31, 2004 from 11.9% in the year ended March 31, 2003 and 14.5% in the year ended March 31, 2002. Vodacom's churn rate for prepaid customers in South Africa increased to 41.3% in the year ended March 31, 2004 and 34.0% in the year ended March 31, 2003 from 30.1% in the year ended March 31, 2002. The high prepaid churn is associated with an increasingly competitive market, lower barriers to entry for prepaid customers in South Africa and the volatile nature of the prepaid customer base, as well as changes to Vodacom's policy governing disconnections. Prepaid customers were disconnected if they did not recharge their vouchers after being in time window lock for six months for periods prior to November and December 2002, for four months for periods from November and December 2002 until April 2003 and for three months from April 2003 until December 2003. Time window lock occurs when a customer's paid active time window, or access period, expires. In December 2003, Vodacom changed the deactivation rule for prepaid customers to align itself with European and industry standards. From December 2003, prepaid customers are disconnected from its network if they record no revenue generating activity within a period of 215 consecutive days. For a discussion of Vodacom's churn rate, see Item 4. "Information on the Company—Business Overview—Mobile communications—South Africa—Customers."
142
Airtime. Vodacom derives airtime revenue from connection and monthly rental fees and airtime usage fees paid by Vodacom's contract customers for use of its mobile networks. Airtime revenue also includes fees paid by Vodacom's prepaid phone customers for prepaid starter phone packages, airtime recharge vouchers and incomer vouchers, which entitle customers to receive unlimited incoming calls for 365 days. Airtime revenue depends on the total number of customers, traffic volume, mix of prepaid and contract customers and tariffs.
Vodacom's airtime revenue increased 19.7% and 17.9% in the years ended March 31, 2004 and 2003, respectively, primarily due to the increase in the number of Vodacom's customers, and, to a lesser extent, standard tariff increases. As Vodacom's primary market in South Africa continues to mature and Vodacom continues to connect more marginal customers in its South African operations, Vodacom expects that growth in airtime in South Africa will continue to slow. Total customers increased 29.7% and 26.0% in the years ended March 31, 2004 and 2003, respectively, primarily due to strong prepaid customer growth in South Africa and significant customer growth in Vodacom's operations outside of South Africa. New products, packages and services also had a substantial role in Vodacom's customer growth in the 2004 and 2003 financial years. Vodacom introduced Call Sponsor, which enables contract customers to sponsor the calls of up to 3 prepaid customers. For a discussion of Vodacom's customers and traffic see Item 4. "Information on the Company—Business Overview—Mobile communications—South Africa—Customers" and Item 4. "Information on the Company—Business Overview—Mobile communications—South Africa—Traffic."
Data revenue. Vodacom derives data revenue from mobile data, including short messaging services, or SMSs, and multimedia messaging services, or MMSs. Vodacom's mobile data revenue increased 59.0% to R1,039 million in the year ended March 31, 2004 and 43.1% to R654 million in the year ended March 31, 2003 from R457 million in the year ended March 31, 2002, 50% of which is included in the Telkom Group's revenue. Vodacom's data revenue increased primarily due to increased SMS usage, while traffic increased to 2.0 billion SMSs over its network in the year ended March 31, 2004 from 1.5 billion SMSs in the year ended March 31, 2003 and 911 million SMSs in the year ended March 31, 2002. Vodacom introduced SMS only roaming and a number of promotional offerings such as MMS and SMS bundles in the 2004 financial year. SMS roaming affords customers the ability to activate SMS-only roaming.
Interconnection. Vodacom generates interconnection revenue when a call originating from our fixed-line network or one of the other mobile operators' networks terminates on Vodacom's network. Interconnection revenue includes revenue from Cell C for national roaming services. Vodacom does not have a roaming agreement with MTN. Vodacom generates national roaming revenue when its mobile network carries a call made from a Cell C customer. Interconnection revenue depends on the volume of traffic terminating on Vodacom's network, the interconnection termination rates payable by ourselves and the other mobile operators to Vodacom and national roaming rates and volumes.
Vodacom's interconnection revenue increased 8.9% and 23.5% in the years ended March 31, 2004 and 2003, respectively, primarily due to an increase in the number of calls terminating on Vodacom's network as a result of the increased number of Vodacom's customers and South African mobile users generally. Adding to the growth in interconnection revenue in the 2003 and 2004 financial years was a strong increase in Cell C's customer base and the resultant increase in national roaming revenue as well as increased interconnection revenue from Vodacom's other African operations. The increases were partially offset by a decrease in the number of fixed-line calls from Telkom's network terminating on Vodacom's network. Interconnection revenue in our mobile segment included R1,387 million, R1,489 million and R1,484 million in the years ended March 31, 2004, 2003 and 2002, respectively, for services received from our fixed-line business, which were eliminated from the Telkom Group's revenue on consolidation.
143
Equipment sales. Vodacom generates revenue from equipment sales primarily from the sale of mobile phones and accessories. Vodacom purchases handsets for itself and for external service providers in bulk at purchase discounts in order to lower the cost of handset subsidization. Equipment sales revenue fluctuates based on whether external providers and Vodacom's other African operators source equipment from Vodacom in South Africa or purchase equipment from third party service providers.
Vodacom's revenue from equipment sales increased 28.0% in the year ended March 31, 2004 primarily due to Vodacom's expanded customer base in its Vodacom Congo operations and the significant increase in sales of new handsets in South Africa fuelled by cheaper Rand-prices of MMS-and GPRS-enabled handsets coupled with the added functionality of the new phones, such as built in digital cameras, as well as increased connections.
Vodacom's revenue from equipment sales increased 39.1% in the year ended March 31, 2003 primarily due to large volumes of equipment sales by Vodacom Tanzania and Vodacom Congo, as well as the roll-out of 2.5 generation phones, which are second generation phones with feature enhancements, in South Africa. The introduction of MMS and GPRS, as well as other value-added services, contributed to the increase in 2.5 generation equipment sales, which was driven by Vodacom's service providers and dealers.
International airtime. Vodacom generates fees for international airtime from international roaming by its customers abroad, when its mobile network carries a call made by a customer of another international mobile communications network operator and from Vodacom customers making international calls. Vodacom's revenue from international airtime increased 22.2% and 78.8% in the years ended March 31, 2004 and 2003, respectively, primarily due to increased call activity in South Africa and other African countries. The increase in the call activity during the 2004 and 2003 financial years was primarily due to a 30.5% and 23.8% increase in Vodacom's South African customers roaming internationally and a 12.5% and 32.6% increase in international visitors roaming in South Africa, respectively.
Other. Other revenue includes, among other things, revenue from other operations. Vodacom's other revenue decreased 2.2% and 15.7% in the years ended March 31, 2004 and 2003. The decrease in the 2003 financial year was primarily due to a decline in the sale of non-core assets, such as Teljoy television, which was sold in March 2002.
Mobile operating expenses
The following is a discussion of our mobile segment's operating expenses which are comprised of our 50% interest in Vodacom's operating expenses. Vodacom's operating expense line items are presented in accordance with the line items reflected in the Telkom Group's consolidated operating expenses, which are different from the operating expense line items contained in Vodacom's consolidated financial statements. In the 2004 financial year, we revised our presentation to remove other income from operating expense.
144
The following table shows our 50% share of Vodacom's operating expenses and the percentage change for the periods indicated.
| | Year ended March 31, | | | ||||||||
|---|---|---|---|---|---|---|---|---|---|---|---|
| | 2002 | 2003 | 2004 | | | ||||||
| | 2003/2002 % change | 2004/2003 % change | |||||||||
| | ZAR | ZAR | ZAR | ||||||||
| | (in millions, except percentages) | ||||||||||
| Employee expense | 568 | 509 | 666 | (10.4 | ) | 30.8 | |||||
| Payments to other network operators | 689 | 1,109 | 1,495 | 61.0 | 34.8 | ||||||
| Selling, general and administrative expenses(1) | 3,690 | 4,615 | 5,389 | 25.1 | 16.8 | ||||||
| Services rendered | 56 | 65 | 65 | 16.1 | — | ||||||
| Operating leases | 237 | 273 | 266 | 15.2 | (2.6 | ) | |||||
| Depreciation and amortization | 1,035 | 1,188 | 1,266 | 14.8 | 6.6 | ||||||
| Mobile operating expenses | 6,275 | 7,759 | 9,147 | 23.6 | 17.9 | ||||||
- (1)
- Profit on the disposal of property, plant and equipment and investments of R1 million and R1 million in the 2003 and 2002 financial years, respectively, were reclassified from selling, distribution and other expenses to other income in the 2004 financial year. Selling, distribution and other expenses for the 2003 and 2002 financial years have been revised to reflect the new presentation.
Employee expenses. Employee expenses consist mainly of salaries and wages of employees as well as contributions to employee pension, medical aid funds and benefits and the deferred bonus incentive scheme.
Vodacom's employee expenses increased 30.8% in the year ended March 31, 2004 primarily due to the employee deferred bonus incentive accrual resulting from Vodacom's higher net profit, an average group-wide salary increase of 8.0% and a 4.6% increase in the number of employees. Vodacom increased the total number of its employees by 51.6% in it's other African operations and reduced the total number of employees by 1.4% in its operations in South Africa as of March 31, 2004. Employee productivity in South Africa and other African countries, as measured by customers per employee, increased 23.9% to 2,433 customers per employee as of March 31, 2004.
Vodacom's employee expenses decreased 10.4% in the year ended March 31, 2003 primarily due to lower deferred bonus incentive accruals as a result of Vodacom's lower net profit, which was adversely impacted by IAS 39 in the 2003 financial year. Vodacom decreased the number of its temporary employees from 423 as of March 31, 2002 to 219 as of March 31, 2003 primarily in its operations in South Africa and the Democratic Republic of the Congo, which further contributed to the decrease in employee expense in the 2003 financial year as temporary employees are generally more expensive than permanent employees. The decrease in employee expense in the 2003 financial year was partially offset by an 8.0% overall increase in average employee salaries and a 1.2% increase in employees. Employee productivity in South Africa and other African countries, as measured by customers per employee, increased 24.5% to 1,963 customers per employee as of March 31, 2003 from 1,577 customers per employee as of March 31, 2002.
Payments to other network operators. Payments to other network operators consist mainly of interconnection payments made by Vodacom's South African and other African operations for terminating calls on other operators' networks. Vodacom's payments to other network operators increased significantly in both the years ended March 31, 2004 and 2003 as a result of increased outgoing traffic in line with increased customer growth and the increasing percentage of outgoing traffic terminating on the other mobile networks rather than Telkom's fixed-line network as the cost of terminating calls on other mobile networks is higher than calls terminating on Telkom's fixed-line
145
network. The increase was also due to the increase in interconnection tariffs under Vodacom's interconnection agreements in November 2001 and January 2003 for traffic terminating on other mobile networks and Telkom's fixed-line network. As the mobile communications market continues to grow in South Africa, Vodacom expects that interconnection charges will continue to increase and adversely impact Vodacom's profit margins.
Payments to other network operators in our mobile segment included R209 million, R174 million and R153 million in the years ended March 31, 2004, 2003 and 2002, respectively, for interconnection fees paid to our fixed-line segment, which were eliminated from the Telkom Group's operating expenses on consolidation.
Selling, general and administrative expenses. Selling, general and administrative expenses include subscriber acquisition and retention costs, packaging, distribution, marketing, regulatory license fees, bad debts and various other general administrative expenses, including accommodation, information technology costs, office administration, consultants' expenses, social economic investment and insurance.
The following table sets forth information related to our 50% share of Vodacom's selling, general and administrative expenses for the periods indicated.
Mobile selling, general and administrative expenses
| | Year ended March 31, | | | |||||||
|---|---|---|---|---|---|---|---|---|---|---|
| | 2002 | 2003 | 2004 | | | |||||
| | 2003/2002 % change | 2004/2003 % change | ||||||||
| | ZAR | ZAR | ZAR | |||||||
| | | (in millions, except percentages) | | |||||||
| Selling, distribution and other(1) | 3,204 | 4,014 | 4,739 | 25.3 | 18.1 | |||||
| Marketing | 271 | 326 | 351 | 20.3 | 7.7 | |||||
| Regulatory and license fees | 192 | 252 | 275 | 31.3 | 9.1 | |||||
| Bad debts | 23 | 23 | 24 | — | 4.3 | |||||
| Selling, general and administrative expenses | 3,690 | 4,615 | 5,389 | 25.1 | 16.8 | |||||
- (1)
- Profit on the disposal of property, plant and equipment and investments of R1 million and R1 million in the 2003 and 2002 financial years, respectively, were reclassified from selling, distribution and other expenses to other income in the 2004 financial year. Selling, distribution and other expenses for the 2003 and 2002 financial years have been revised to reflect the new presentation.
Vodacom's selling, general and administrative expenses increased 16.8% and 25.1% in the years ended March 31, 2004 and 2003, respectively, primarily due to an increase in selling, distribution and other expenses, incentive costs, regulatory and license fees and marketing expenses to support the growth in Vodacom's South African and other African operations and increased competition. Selling, distribution and other expenses include cost of goods sold, commissions, subscriber acquisition and retention expenses, distribution expenses and insurance. The increase in selling and distribution expenses over the three year period was directly related to the increase in customer connections, competition and operating revenue, although the selling and distribution incentive costs increased faster than revenue growth in the 2003 financial year as competition in the South African market intensified. The increase in selling, distribution and other expense in the 2003 and 2004 financial years also included significant expense due to Vodacom's continued expansion into Africa as well as the pursuit of operations in Nigeria, including expenses related to secondees to other African countries and high overhead costs such as accommodation, insurance and consulting fees. The increase in marketing expenses in the 2003 financial year was mainly due to significant marketing expense incurred launching Vodacom Congo and the increase in marketing expenses in the 2004 financial year was mainly due to
146
inflationary increases in South African expenditure and the marketing expenses incurred launching Vodacom Mozambique, partially offset by decreases in Rand terms in Vodacom Tanzania, Vodacom Congo and Vodacom Lesotho. The increase in regulatory and license fees during the same period was also directly related to the increase in operating revenues and corresponding payments under Vodacom's existing licenses, coupled with payments made to secure temporary licenses for GSM 1800 frequency spectrum in South Africa.
Services rendered. Services rendered include consultancy services for technical, administrative and managerial services, audit fees, legal fees and communication and information technology costs. Services rendered was flat for the year ended March 31, 2004 and increased 16.1% in the year ended March 31, 2003 primarily due to an increase in support, audit and consulting services for Vodacom's other African operations, particularly Vodacom Congo and Vodacom Tanzania, as well as an increase in information technology costs due to expansion and upgrades in the 2002 financial year.
Operating leases. Operating leases include payments in respect of rentals of GSM transmission lines as well as office accommodation, office equipment and motor vehicles. Vodacom's operating leases decreased 2.6% in the year ended March 31, 2004 as Vodacom elected to purchase certain buildings that were previously leased. Vodacom's operating leases increased 15.2% in the year ended March 31, 2003 primarily due to the cost of transmission and data lines required for its South African network and in the Democratic Republic of the Congo. Operating leases in our mobile segment included R233 million, R241 million and R184 million in the years ended March 31, 2004, 2003 and 2002, respectively, for operating lease payments to our fixed-line segment, which were eliminated from the Telkom Group's operating expenses on consolidation.
Depreciation and amortization. Vodacom's depreciation and amortization increased 6.6% and 14.8% in the years ended March 31, 2004 and 2003, respectively. The increases were primarily the result of depreciation and amortization of capital expenditures Vodacom incurred in building out its network in South Africa and other sub-Saharan African countries. Amortization of intangibles increased slightly in the year ended March 31, 2004, increasing 2.4% to R216 million and remained relatively constant in the 2003 financial year, decreasing 0.9% to R211 million from R213 million in the year ended March 31, 2002. Vodacom's declining growth in depreciation results from the substantial completion of its major capital investments in South Africa. In addition, because of the significant strengthening of the Rand against the U.S. dollar in the year ended March 31, 2004 and 2003, depreciation on foreign-denominated capital expenditure in its other African operations for the 2004 financial year has been translated at a lower exchange rate than in the past, which resulted in a relatively lower depreciation charge for the 2004 financial year.
Mobile operating profit
Mobile operating profit increased 20.8% and 19.3% in the years ended March 31, 2004 and 2003, respectively, primarily due to the significant growth in customers and revenue. Operating profit as a percentage of revenue increased to 22.3% in the 2004 financial year and decreased to 21.9% in the 2003 financial year from 22.5% in the 2002 financial year.
147
LIQUIDITY AND CAPITAL RESOURCES
Group Liquidity and Capital Resources
Cash flows
The following table shows information regarding our consolidated cash flows for the periods indicated.
| | Year ended March 31, | | | ||||||||
|---|---|---|---|---|---|---|---|---|---|---|---|
| | 2002 | 2003 | 2004 | | | ||||||
| | 2003/2002 % change | 2004/2003 % change | |||||||||
| | ZAR | ZAR | ZAR | ||||||||
| | | (in millions, except percentages) | | ||||||||
| Cash flows from operating activities | 8,171 | 9,748 | 13,884 | 19.3 | 42.4 | ||||||
| Cash flows used in investing activities | (9,250 | ) | (5,731 | ) | (5,423 | ) | (38.0 | ) | (5.4 | ) | |
| Cash flows (used in)/from financing activities(1) | 66 | (3,026 | ) | (6,481 | ) | n/a | 114.2 | ||||
| Net increase/(decrease) in cash and cash equivalents | (1,013 | ) | 991 | 1,980 | (197.8 | ) | 99.8 | ||||
| Effect of foreign exchange rate differences | 48 | (56 | ) | (21 | ) | (216.7 | ) | (62.5 | ) | ||
| Net cash and cash equivalents at the beginning of the year | 867 | (98 | ) | 837 | (111.3 | ) | n/a | ||||
| Net cash and cash equivalents at the end of the year | (98 | ) | 837 | 2,796 | n/a | 234.1 | |||||
- (1)
- Includes costs related to our initial public offering of R154 million and R44 million in the years ended March 31, 2003 and March 31, 2002 respectively.
Cash flows from operating activities
Our primary sources of liquidity are cash flows from operating activities and borrowings. In the future, we intend to fund our expenses, indebtedness and working capital requirements from our operations and from capital raised in the markets. Cash flows from operating activities increased over the three year period by 42.4% to R13,884 million in the 2004 financial year and 19.3% to R9,748 million in the 2003 financial year from R8,171 million in the 2002 financial year. The increase in the 2004 financial year was primarily due to higher cash receipts from customers, lower cash paid to suppliers and decreased interest expense, partially offset by dividends and increased taxes paid. The increase in the 2003 financial year was primarily due to higher cash receipts from customers, tax refunds and decreased interest expense, partially offset by increased cash paid to suppliers and Vodacom employees.
Cash flows used in investing activities
Cash flows used in investing activities relate primarily to investments in our fixed-line network and our 50% share of Vodacom's investments in its mobile networks in South Africa and other African countries. Cash flows used in investing activities decreased by 5.4% to R5,423 million in the 2004 financial year and 38.0% to R5,731 million in the 2003 financial year from R9,250 million in the 2002 financial year. The decrease in the 2004 financial year was primarily due to an overall reduction in capital expenditure, mainly in our mobile segment. The decrease in the 2003 financial year was primarily due to a reduction in capital expenditure in our fixed-line network and, to a lesser extent, in mobile operations.
Cash flows (used in)/from financing activities
Cash flows from financing activities are primarily a function of borrowing activities.
148
In the 2004 financial year, loans and finance leases repaid, the purchase of treasury shares and the increase in interest-bearing investments exceeded loans raised by R6,379 million. We repaid a R4,311 million 10.75% unsecured local bond due September 30, 2003 and a R1,201 million 13% unsecured local bond due May 31, 2004. A net R67 million of commercial paper bills was repaid and we also settled R140 million of repurchase agreements and bills of exchange of R1,978 million. Vodacom repaid R920 million of shareholder loans in the 2004 financial year. Vodacom Congo (RDC) s.p.r.l., a subsidiary of Vodacom, entered into a Euro revolving credit facility of 11.5 million Euro (R186.9 million) and Vodacom Tanzania Limited, a subsidiary of Vodacom, repaid $4 million and TSH 4,388 million (R 56 million) in the 2004 financial year. Telkom's 50% share of the Vodacom debt is included in Telkom's consolidated statements.
In the 2003 financial year, loans repaid and the increase in interest-bearing investments exceeded loans raised and finance leases raised by R2,872 million. We repaid a net of R1,371 million of commercial paper bills, a R689 million 10.75% unsecured local bond due September 20, 2003, a R359 million loan from European Investment Bank and a R200 million 12.5% coupon, unsecured loan stock due April 15, 2002 in the 2003 financial year. We increased our interest bearing investments, including repurchase agreements and bills of exchange, by R468 million. We also incurred R154 million in costs related to our initial public offering in the 2003 financial year. Vodacom repaid R426 million of its debt including the repayment of R400 million of funding loans, in the 2003 financial year. Telkom's 50% share of R213 million is included in loans repaid. Vodacom raised foreign debt of R932 million primarily as a result of a R336 million utilization of an extended credit facility for Vodacom Congo and a R502 million draw down of a project financing facility in Tanzania. Telkom's 50% share of R419 million is included in loans raised.
In the 2002 financial year, loans raised and the decrease in interest-bearing investments exceeded loans repaid by R110 million. We repaid three syndicated loans of $185 million, $150 million and $250 million in the 2002 financial year. We also repaid net R392 million of commercial paper bills during the year. We decreased our interest bearing investments, including repurchase agreements and bills of exchange, by R865 million. During the 2002 financial year, we issued R2,300 million aggregate principal amount of 10.75% bonds due 2003 and R1,500 million aggregate principal amount of 10.5% bonds due 2006. We also incurred R44 million in costs related to our initial public offering in the 2002 financial year.
Working capital
We had negative consolidated working capital of R3.4 billion as of March 31, 2004 compared to negative consolidated working capital of R4.3 billion as of March 31, 2003 and R1.8 billion as of March 31, 2002. Negative working capital arises when current liabilities are greater than current assets. We redeemed R1.2 billion of our consolidated R3.5 billion of indebtedness that was due in the 2005 financial year, which contributed to the improvement in working capital in the 2004 financial year. The decline in our working capital in the 2003 financial year was mainly due to the R4.7 billion of indebtedness that was required to be repaid in the 2004 financial year. Telkom is of the opinion that the Telkom Group's cash flows from operations, together with proceeds from liquidity available under credit facilities and in the capital markets, will be sufficient to meet the Telkom Group's present working capital requirements for the twelve months following the date of this annual report. We intend to fund current liabilities through a combination of operating cash flows, new borrowings and borrowings available under existing credit facilities.
Capital expenditures and investments
We have made significant capital expenditures in connection with our five year fixed-line network modernization and roll-out program, while Vodacom has also made significant capital expenditures in building and upgrading its mobile network in South Africa and other African countries.
149
The following table shows the Telkom Group's investments in property, plant and equipment excluding intangibles, including our 50% share of Vodacom's investments, for the periods indicated.
| | Year ended March 31, | |||||
|---|---|---|---|---|---|---|
| | 2002 | 2003 | 2004 | |||
| | ZAR | ZAR | ZAR | |||
| | (in millions) | |||||
| Group capital expenditure | ||||||
| Fixed-line | 6,962 | 4,013 | 3,862 | |||
| Base expansion and core network | 2,831 | 1,662 | 1,632 | |||
| Network evolution | 1,906 | 968 | 668 | |||
| Efficiencies and improvements | 1,743 | 1,226 | 1,201 | |||
| Company support and other | 482 | 157 | 361 | |||
| Mobile | 2,042 | 1,699 | 1,445 | |||
| Total investment in property, plant and equipment | 9,004 | 5,712 | 5,307 | |||
We spent approximately R3.9 billion ($617 million) on fixed-line capital expenditures in the year ended March 31, 2004, which was lower than budgeted fixed-line capital expenditure for the 2004 financial year of R5.0 billion and 3.8% less than fixed-line capital expenditures in the 2003 fiscal year, primarily as a result of more stringent investment criteria for capital investment in our fixed-line segment, and savings resulting from the relative strength of the Rand against the US Dollar and Euro. In the future, we intend continue to selectively invest in our fixed-line segment on a smaller scale based on customer demand and economic viability. We also intend to concentrate capital expenditures in growing business areas such as data services and for improving the quality and efficiency of our network and support systems. Our consolidated capital expenditures in property, plant and equipment for the 2005 financial year is budgeted to be approximately R6.6 billion, of which approximately R4.6 billion is budgeted to be spent in our fixed-line segment and approximately R2.0 billion is budgeted to be spent in our mobile segment, which is our 50% share of Vodacom's capital expenditure of approximately R4.0 billion. Our capital expenditures are continuously examined and evaluated against the economic benefit and may be revised in light of changing business conditions, investment opportunities and other business factors.
150
We estimate our commitments in respect of property, plant and equipment leases in the next five years to be approximately R1.3 billion. Our annual commitments under operating leases, as of March 31, 2004, are as follows:
| | Total | Within one year | Between one and five years | Over five years | |||||
|---|---|---|---|---|---|---|---|---|---|
| | (in millions) | ||||||||
| Buildings | 809 | 141 | 365 | 303 | |||||
| Rental receivable on buildings | (227 | ) | (57 | ) | (125 | ) | (45 | ) | |
| Transmission and data lines | 64 | 17 | 46 | 1 | |||||
| Equipment | 37 | 23 | 14 | — | |||||
| Vehicles | 540 | 540 | — | — | |||||
| Sport and marketing contracts | 364 | 149 | 215 | — | |||||
| Total | 1,587 | 813 | 515 | 259 | |||||
Telkom has entered into a full maintenance lease agreement for its vehicles with Debis Fleet Management (Proprietary) Limited, a company incorporated in the Republic of South Africa. The master lease agreement is for a period of five years and expires on March 31, 2005. As there is no minimum usage clause in the master lease agreement, only the lease payments for the one year renewal period are included in the table above. The leases of individual vehicles are renewed annually.
Contingent liabilities
The South African Value Added Network Services Association, an association of value added network service providers, or VANS providers, filed complaints against Telkom at the Competition Commission of the Republic of South Africa regarding alleged anti-competitive practices on the part of Telkom. The Competition Commission found, among other things, that several aspects of Telkom's conduct contravened the Competition Act, 89 of 1998, and referred certain of the complaints to the Competition Tribunal for adjudication. The complaints deal with Telkom's alleged refusal to provide telecommunications facilities to certain VANS providers to construct their networks, refusal to lease access facilities to VANS providers, provision of bundled and cross-subsidized competitive services with monopoly services, discriminatory pricing with regard to leased line services and alleged refusal to peer with certain VANS providers. Telkom has brought an application in the South African High Court challenging the Competition Tribunal's jurisdiction to adjudicate this matter. These matters and the amount of Telkom's liability are not expected to be finalized within the next two years. If these complaints are upheld, however, Telkom could be required to cease these practices and fined an amount of up to 10% of Telkom's South African turnover or be ordered to divest itself of the relevant business. Telkom is currently unable to predict the amount that it may eventually be required to pay. If Telkom is required to cease these practices, divest itself of the relevant business or pay significant fines, Telkom's business and financial condition could be materially adversely effected and its revenue and net profit could decline. See Item 3. "Key Information—Risk Factors—Risks Related to Regulatory and Legal Matters—If the Competition Commission of the Republic of South Africa were to conclude that Telkom had committed a prohibited practice, as set out in the Competitions Act of 1988, Telkom could incur a penalty, its business and financial condition could be materially adversely effected and its revenue and net profit could decline."
Telcordia instituted arbitration proceedings against Telkom in March 2001 seeking to recover approximately $130 million for monies outstanding and damages, plus costs and interest at a rate of 15.5% per year. The arbitration proceedings relate to the cancellation of an agreement entered into between Telkom and Telcordia during June 1999 for the development and supply of an integrated
151
end-to-end customer assurance and activation system by Telcordia. In September 2002, a partial award was issued by the arbitrator in favor of Telcordia. Telkom subsequently filed an application in the South African High Court to review and set aside the partial award. On November 27, 2003, the South African High Court set aside the partial award and issued a cost order in favor of Telkom. On May 3, 2004, the South African High Court dismissed an application by Telcordia for leave to appeal and ordered Telcordia to pay the legal costs of Telkom. Telcordia also petitioned the United States District Court for the District of Columbia to confirm the partial award, which petition was dismissed, along with a subsequent appeal. The dispute between Telkom and Telcordia and the amount of Telkom's possible liability are not expected to be finalized until late 2004 or early 2005. Telkom is currently unable to predict the amount that it may eventually be required to pay Telcordia, if any, and has reversed all of its provisions for estimated liabilities, including interest and legal fees. As a result, as of March 31, 2004, Telkom had no provision for this claim. If Telcordia recovers substantial damages from Telkom, Telkom would be required to fund such payments from cash flows or drawings on its existing credit facilities, which could cause its indebtedness to increase and its net profit to decline. See Item 3. "Key Information—Risk Factors—Risks Related to Regulatory and Legal Matters—If Telcordia Technologies Incorporated, a New Jersey corporation, were able to recover substantial damages in its arbitration proceedings against Telkom, Telkom would be required to fund such payments from cash flows or drawings on its existing credit facilities, which could cause Telkom's indebtedness to increase and its net profit to decline" and Item 8. "Financial Information—Consolidated Financial Statements and Other Financial Information—Legal Proceedings."
See also note 38 to the notes to the audited consolidated financial statements of the Telkom Group as of and for each of the three years in the period ended March 31, 2004 and note 37 to the notes to the audited consolidated financial statements of Vodacom as of and for each of the three years in the period ended March 31, 2004 for additional information related to contingent liabilities of the Telkom Group and Vodacom, respectively.
Employee benefit special purpose entity
We had liabilities of R2,420 million, R2,289 million and R2,154 million in the years ended March 31, 2004, 2003 and 2002, respectively, in respect of post retirement medical aid obligations for current and retired employees. We set up a special purpose entity in the 2002 financial year for the purpose of funding these post retirement obligations. This special purpose entity is purely used as a financing tool as we still retain our obligation to provide post retirement medical aid benefits to retired employees. As a result, it does not meet the definition of a plan asset in terms of IAS19—Employee Benefits. Our interest in the special purpose entity is by way of equity, and this entity is fully consolidated in the Telkom Group's financial statements. The cumulative value of the funds in this special purpose entity was R1,370 million, R938 million and R560 million as of March 31, 2004, 2003 and 2002, respectively.
Off-Balance Sheet Transactions
We did not have any off-balance sheet transactions during the year ended March 31, 2004.
Funding sources
To date, we have financed our operations primarily from cash flows from operations and by borrowings in the South African and international capital markets. Access to international capital markets and its associated cost of funding depends in part on our credit ratings. We maintain an active dialog with the principal credit rating agencies who review our ratings periodically. Standard & Poor's International Ratings, LLC, a division of McGraw-Hill Companies Inc., and Moody's Investors Services Inc, have rated our foreign debt BBB- and Baa3, respectively. We have not solicited a rating on our local Rand denominated debt due to our long standing relationships with Rand denominated investors.
152
As of March 31, 2004, 73.4% of our debt was local debt, compared to 77.3% as of March 31, 2003 and 77.8% as of March 31, 2002. Our Rand denominated debt bears interest at rates ranging from 10 basis points to 70 basis points above treasuries and the effective interest rate for the year ended March 31, 2004 was 15.1%. Although 86.9% of our debt was fixed rate debt as of March 31, 2004, a significant portion of our debt becomes due in the next 18 months, allowing us to refinance our debt structure.
The following table sets forth our consolidated indebtedness including finance leases as of March 31, 2004.
| | | | | Nominal amount outstanding as of March 31, 2004 | Maturing Year ended March 31, | | ||||||||||||||
|---|---|---|---|---|---|---|---|---|---|---|---|---|---|---|---|---|---|---|---|---|
| | Interest payment dates | | Outstanding as of March 31, 2004 | After 2009 | ||||||||||||||||
| | Interest rate | 2005 | 2006 | 2007 | 2008 | 2009 | ||||||||||||||
| | (%) | ZAR | ZAR | ZAR | ZAR | ZAR | ZAR | ZAR | ZAR | |||||||||||
| | | (in millions) | | | | | | | | | ||||||||||
| TELKOM | ||||||||||||||||||||
| Bonds | ||||||||||||||||||||
| 10% statutorily guaranteed local bond due not later than March 31, 2008 (TK01)(1)(2)(3) | March 31, September 30 | 10 | 3,812 | 4,609 | — | — | — | 4,609 | — | — | ||||||||||
| 13% unsecured local bond due May 31, 2004 (TL08)(1)(4) | May 31, November 30 | 13 | 2,286 | 2,299 | 2,299 | — | — | — | — | — | ||||||||||
| 10.75% unsecured local bond due September 30, 2003 (TL03)(1)(5) | March 31, September 30 | |||||||||||||||||||
| 10.5% unsecured local bond due October 31, 2006 (TL06)(1)(6) | April 30, October 31 | 10.5 | 1,440 | 1,455 | — | — | 1,455 | — | — | — | ||||||||||
| 6% unsecured local bond due February 24, 2020 (TL20)(7) | February 22 | 6 | 1,155 | 2,500 | — | — | — | — | — | 2,500 | ||||||||||
| Zero coupon unsecured loan stock due September 30, 2010 (PP02)(8) | — | — | 174 | 430 | — | — | — | — | — | 430 | ||||||||||
| Zero coupon unsecured loan stock due June 15, 2010 (PP03)(9) | — | — | 545 | 1,350 | — | — | — | — | — | 1,350 | ||||||||||
| 7.125% unsecured Euro bond due April 12, 2005(10) | April 12 | 7.125 | 3,894 | 3,894 | — | 3,894 | — | — | — | — | ||||||||||
| Finance leases | n/a | 13.44-15.28 | 754 | 754 | — | — | — | — | — | 754 | ||||||||||
| Repurchase agreements | n/a | n/a | 27 | 27 | 27 | — | — | — | — | — | ||||||||||
153
| Commercial paper | Various | Various | 1,542 | 1,708 | 1,446 | 262 | — | — | — | — | ||||||||||
| Zero coupon unsecured commercial paper bills with a maturity not later than April 4, 2005. The average discount rate on these commercial paper bills is 9.95% per annum. | ||||||||||||||||||||
| Bank facilities | ||||||||||||||||||||
| R111.5 million unsecured overdraft facility with ABSA Bank Limited, repayable on demand | — | Prime Rate | 35 | 35 | 35 | — | — | — | — | — | ||||||||||
| R485 million unsecured overdraft facility with The Standard Bank of South Africa Limited, repayable on demand | — | Prime Rate | Not utilized | Not utilized | — | — | — | — | — | — | ||||||||||
| R150 million unsecured overdraft facility with Firstrand Bank Limited, repayable on demand | — | Mutually agreed | Not utilized | Not utilized | — | — | — | — | — | — | ||||||||||
| R150 million unsecured overdraft facility with Commerzbank AG, repayable on demand | — | Prime rate | Not utilized | Not utilized | — | — | — | — | — | — | ||||||||||
| $35 million unsecured short term loan facility with Credit Agricole Indosuez, various repayment dates | — | Mutually agreed | Not utilized | Not utilized | — | — | — | — | — | — | ||||||||||
| Various bank loans(3) | Various | Various | 94 | 94 | 3 | 3 | 3 | — | — | 85 | ||||||||||
| Bank overdraft and other short-term debt | — | — | — | — | — | — | — | — | — | — | ||||||||||
| Total Telkom | 15,758 | 19,155 | 3,810 | 4,159 | 1,458 | 4,609 | — | 5,119 | ||||||||||||
154
| VODACOM(11) | ||||||||||||||||||||
| $10 million shareholders loan with Planetel Communications Limited(12) | — | LIBOR+ 5% | 18 | 18 | — | — | — | — | 18 | — | ||||||||||
| $8.4 million shareholders loan with Caspian Construction Company Limited(12) | — | LIBOR+ 5% | 21 | 21 | — | — | — | — | 21 | — | ||||||||||
| $27.3 Euro 11.5 and TSH 15,356 million project finance for Vodacom Tanzania Limited(13) | — | 4.9-11.6 | 174 | 174 | 33 | 42 | 55 | 44 | — | — | ||||||||||
| Various finance leases(14) | — | 12.1-16.9 | 443 | 443 | 14 | 26 | 40 | 57 | 96 | 210 | ||||||||||
| $35.4 million and Euro 11.5 million revolving credit facility of Vodacom Congo (RDC) s.p.r.l. | — | LIBOR+1.5% and EURIBOR + 1.5% | 156 | 156 | 156 | — | — | — | — | — | ||||||||||
| Euro 38.8 million Vodacom Congo (RDC) s.p.r.l. extended credit facility | — | EURIBOR + 1.5% - EURIBOR + 1.75% | 155 | 155 | 155 | — | — | — | — | — | ||||||||||
| $8.8 million loan to Vodacom Group, repayable on July 1, 2003 | — | LIBOR + 1.5% | — | — | — | — | — | — | — | — | ||||||||||
| $18.9 million aggregate liquidation amount of preference shares issued by Vodacom Congo (RDC) s.p.r.l.(15) | — | 4% | 60 | 60 | 60 | — | — | — | — | — | ||||||||||
| Various other short-term loans | Various | Various | 4 | 4 | 4 | — | — | — | — | — | ||||||||||
| Bank overdrafts and other short-term debt | — | — | 387 | 387 | 387 | — | — | — | — | — | ||||||||||
| Total Vodacom(11) | — | — | 1,418 | 1,418 | 809 | 68 | 95 | 101 | 135 | 210 | ||||||||||
| TOTAL | — | — | 17,176 | 20,573 | 4,619 | 4,227 | 1,553 | 4,710 | 135 | 5,329 |
- (1)
- Listed on the Bond Exchange of South Africa.
- (2)
- Open ended bond issue, and number of bonds issued varies from time to time. As of March 31, 2004, R4,609 million of these bonds were in issue.
- (3)
- R3,906 million of Telkom's indebtedness outstanding as of March 31, 2004 was guaranteed by the Government of the Republic of South Africa.
- (4)
- 2,000 of these bonds were issued on November 30, 1998 at a yield to maturity of 17.3% and a further 1,500 of these bonds were issued on July 29, 1999 at an interest rate of 15.52%. R1,201 million aggregate principal amount in nominal terms of these bonds were repurchased during the current financial year.
155
- (5)
- The TL03 bond was repaid during the year.
- (6)
- 1,500 of these bonds were issued on October 31, 2001 at a yield to maturity of 10.87%. R46 million aggregate principal amount of these bonds are held by the company as an investment against the Post Retirement Medical liability.
- (7)
- 2,500 of these bonds were issued on February 22, 2000 at a yield to maturity of 15.00%.
- (8)
- Issued on February 25, 2000. Original amount issued was R430 million. The yield to maturity of this instrument issued by Telkom is 14.37%.
- (9)
- Issued on June 15, 2000. Original amount issued was R1,350 million. The yield to maturity of this instrument is 15.175%.
- (10)
- Listed on the London Stock Exchange. An aggregate principal amount of Euro 500 million was issued on April 12, 2000.
- (11)
- Represents Telkom's 50% share of Vodacom's indebtedness.
- (12)
- Repayable on approval of at least 60% of the shareholders of Vodacom Tanzania Limited.
- (13)
- Payable on agreement of all shareholders.
- (14)
- Secured by land and buildings.
- (15)
- The preference shares are redeemable, but only after the first 3 years from date of issuance and only on the basis that the shareholders are repaid simultaneously and in proportion to their shareholding.
We expect to repay the indebtedness and other obligations in the above table with cash flows from operations and/or new capital raised in the markets. None of the outstanding indebtedness in the above table is convertible into other securities and, being debt instruments, were not offered or issued to our existing shareholders. The bonds in the above table were issued to, and are currently held by, a number of third parties pursuant to public offers and private placements undertaken by us. Telkom's special purpose entity established to fund post retirement obligations indirectly held R46 million in nominal value of Telkom's 10.5% unsecured local bond due October 31, 2006 (TL06) and 260,699 of Telkom's ordinary shares as of March 31, 2004.
The funds raised through the issuances of the above indebtedness were used for the extension and modernization of our communications networks, the provision of additional communications services and for general working capital purposes.
The debt instruments in the above table do not contain any restrictive covenants except a number of the instruments contain provisions limiting our ability to create liens. Some of our debt contains cross-default provisions. In addition, our R2.5 billion 6% local bonds due February 24, 2020 contain financial maintenance covenants requiring the Telkom Group to maintain the following ratios:
- •
- EBITDA to net interest expense ratio of no less than 3.5:1 in the 2003 financial year, increasing to 4.0:1 in the 2004 financial year and 5.0:1 thereafter; and
- •
- net interest bearing debt to EBITDA ratio of no greater than 2.0:1.
The above ratios are calculated semi-annually based on accounting policies in use at the time the indebtedness was incurred. Because the above ratios are calculated based on accounting policies in use at the time the indebtedness was incurred, EBITDA for purposes of the ratios is not calculated in the same manner as it is calculated elsewhere in this document. We were in compliance with the above ratios during the year ended March 31, 2004.
All debt incurred by Telkom prior to 1991 is guaranteed by the Government of the Republic of South Africa pursuant to Section 35 of the South African Exchequer Act, 66 of 1975. The Government of the Republic of South Africa does not guarantee debt incurred thereafter or Vodacom's debt. As of March 31, 2004, R3.9 billion of our total debt of R17.2 billion was guaranteed by the Government of the Republic of South Africa.
The only material loan made by Telkom or any of its subsidiaries as of March 31, 2004 is the advance of R249 million to Rossal No. 65, which is not reflected in the table above and is unsecured. This advance was our only material intercompany financing arrangement as of March 31, 2004. No
156
loans have been furnished by Telkom or any of its subsidiaries for the benefit of any director or any member of our senior management team as of March 31, 2004.
Telkom's policy is to hedge its exposure to foreign exchange rate fluctuations. Interest rate risk is converted to Rands and managed per our policy and control manual which stipulates guidelines on exposure to fixed and floating rate debt. Telkom's philosophy is to target a fixed/floating debt ratio of at least 65% fixed, adjusted to market conditions considering the interest rates at that time. If interest rates are low, Telkom will establish a higher than 65% fixed/floating debt ratio and when interest rates are high, Telkom seeks to establish the ratio closer to a 65% fixed/floating debt ratio.
Report by Directors as to Material Changes
Telkom reports that there have been no material changes in its financial or trading position or that of its subsidiaries since March 31, 2004, other than in the ordinary course of business or as set out in this annual report.
The consolidated financial statements of the Telkom Group and of Vodacom have been prepared in accordance with IFRS, which differs in certain respects from US GAAP. The significant differences between IFRS and US GAAP and the effects on net income and shareholders' equity, relating to the consolidated financial statements of the Telkom Group are described in note 47 to the Telkom Group's consolidated financial statements included elsewhere in this annual report. The description of the differences and the effects on net income and shareholders' equity of Vodacom are included in note 48 of Vodacom's consolidated financial statements included elsewhere in this annual report. As further discussed in those financial statements, the most significant differences between IFRS and US GAAP relating to the Telkom Group's consolidated financial statements include revenue recognition, sale and leaseback transactions, derivative financial instruments, goodwill, share issue expenses and deferred income taxes and for Vodacom they include derivative financial instruments, goodwill, joint venture accounting, deferred bonus incentive schemes and deferred income taxes.
Critical Accounting Policies and Estimates
The preparation of our financial statements requires management to make estimates and assumptions that affect the reported results of our operations. Management believes the following critical accounting policies, among others, affect its more significant judgments and estimates used in the preparation of our consolidated financial statements and are critical to the business operations and the understanding of the results of our operations.
General
We evaluate our estimates, including those relating to bad debts, inventories, investments, intangible assets, income taxes, pension and other post retirement benefits and contingencies and litigation on an ongoing basis. We base our estimates on historical experience and on various other assumptions that we believe to be reasonable under the circumstances, the results of which form the basis for making our judgments about carrying values of assets and liabilities that are not readily available from other sources. Actual results may differ from those resulting from estimates made under different assumptions and conditions.
Revenue recognition
Revenue, excluding value added taxation and sales between group companies, represents the invoiced value of goods and services supplied by us. We measure revenue at the fair value of the consideration received or receivable. Revenue is recognized only when it is probable that the economic benefits associated with a transaction will flow to us and the amount of revenue, and associated costs incurred or to be incurred can be reliably measured.
157
Revenue from usage and network access is recognized as services are provided. Revenue is recognized on a usage basis commencing on the date of activation of services with any revenue on prepaid airtime or phone cards forfeited being recognized on expiration date. Revenue from the sale of equipment is recognized when the customer accepts delivery. Other revenue is recognized when the right to receive payment has been established.
Useful life of intangible assets
In assessing the recoverability of goodwill and other intangible assets, we must make assumptions regarding estimated future cash flows and other factors to determine the fair value of the respective assets. If these estimates or their fair value assessments change in the future, we may need to record impairment charges for these assets not previously recorded. Goodwill associated with the excess purchase price over the fair value of assets acquired and other identifiable intangible assets, such as trademarks and licenses, are currently amortized on a straight line basis, over their estimated useful lives.
Useful life of long-lived assets
In assessing the useful life of long-lived assets, we use estimates of future cash flows and expectations regarding the future utilization pattern of the assets to determine the depreciation to be charged on a straight line basis over the estimated useful lives of the assets. On a regular basis, we review the useful lives and economic capacity of the long-lived assets with reference to any events or circumstances that may indicate that an adjustment to the depreciation period is necessary.
Given the significance of long-lived assets to our financial statements, any change in the depreciation period could have a material impact on our results of operations and financial condition.
Impairment of long-lived assets
We periodically evaluate our long-lived assets for potential impairment indicators. Our judgments regarding the existence of impairment indicators are based on legal factors, market conditions and operational performance. Future events could cause us to conclude that impairment indicators exist and that the specified long-lived asset is impaired. The fair values determined are dependent upon the forecasted performance of our business, changes in the telecommunications industry and the overall economic environment. We measure any impairment based upon a comparison of the carrying amounts of the asset to its fair value, which is determined by using a forecasted discounted cash flow method.
In assessing the recoverability of our long-lived assets, we must make assumptions regarding estimated future cash flows and other factors to determine the fair value of the respective assets. If these estimates, or their fair value assessments, change in the future or if the forecasts are not met, we may have to record additional impairment charges not previously recognized. Any resulting additional impairment loss could have a material impact on our results of operations and financial condition.
Trade receivables—estimation of provision for doubtful debts
We maintain allowances for doubtful accounts for estimated losses resulting from the inability of our customers to make required payments. In order to estimate the appropriate level for this allowance, we analyze historical bad debts, customer concentrations, current customer credit-worthiness, current economic trends and changes in our customer payment patterns. If the financial condition of our customers were to deteriorate, resulting in an impairment of their ability to make payments, additional allowances may be required. A considerable amount of judgment is required in assessing the ultimate realization of these receivables including the current credit-worthiness of each customer.
158
Deferred taxation assets
Significant judgment is required in determining our provision for income taxes and our deferred tax assets and liabilities.
We estimate our current tax exposure based on the positions utilized in filing our tax returns together with the temporary differences resulting from different treatment of items, such as deferred revenue and depreciation for tax or accounting purposes. These temporary differences result in deferred tax assets and liabilities being recognized. We must then assess the probability of our deferred tax assets being recoverable from future taxable income. To the extent that we believe that recovery is not likely, we will establish a valuation allowance. The carrying value of our net deferred tax assets assumes that we will be able to generate sufficient future taxable income in certain tax jurisdictions, based on estimates and assumptions. While we have considered future taxable income and ongoing prudent and feasible tax planning strategies in assessing the need for the valuation allowance, in the event that we were to determine that we would not be able to realize our deferred tax assets in the future, a valuation allowance may be required which would reduce income in the period that such determination was made.
159
Post employment benefits
We have significant pension and postretirement benefit costs and credits that are developed from actuarial valuations and calculations. We follow the guidance of IAS19, "Employee Benefits" and SFAS 106, "Employers' Accounting for Post Retirement Benefits Other Than Pensions" for these benefits. Under these accounting standards, assumptions are made regarding the valuation of benefit obligations and performance of plan assets. The guiding principle of these standards is delayed recognition of differences between actual results and those assumed. This allows for a smoothed recognition of changes in benefit obligations and plan performance over the estimated working lives of the employees who benefit under these plans.
Inherent to these valuations and calculations are key assumptions, including discount rates and expected return on assets. The primary assumptions used are as follows:
- •
- Discount rate—The discount rate is used to record the value of benefits, which are based on future projections, in terms of today's Rand-value.
- •
- Expected return on plan assets—Management projects the future return on plan assets based principally on prior performance. An increase in the projected future value of assets reduces the benefit obligation a company will record.
- •
- Rate of compensation increase—Management estimates pay increases, which are used to project employees' pension benefits after retirement.
- •
- Health care cost trend—Management projects the expected increases in the cost of health care.
- •
- Amortization of gains or losses—Management selected to recognize gains and losses through the corridor approach over ten years. These gains or losses are created when actual results differ from estimated results based on the above assumptions.
We are required to consider current market conditions, including changes in interest rates and healthcare inflation, in selecting these assumptions. Changes in the related pension and post employment benefit costs and credits may occur in the future in addition to changes resulting from fluctuations in our related headcount.
Inventory
We write down our inventory for estimated obsolescence or unmarketable inventory equal to the difference between the cost of inventory and the estimated market value, based upon assumptions about future demand and market conditions. If actual market conditions are less favorable than those projected by management, additional inventory write-downs may be required.
Commitments and contingencies
Management's current estimated range of liabilities relating to certain pending litigation and arbitration proceedings is based on claims for which management can estimate the amount of loss. We have recorded the minimum estimated liability related to those claims where there is a range of loss. Because of the uncertainties relating to both the outcome and the amount and range of the loss on the pending litigation and arbitration proceedings, management is unable to make a reasonable estimate of the liability that could result from an unfavorable outcome. As additional information becomes available, we will assess the potential liability related to our pending litigation and arbitration proceedings and revise our estimates. Such revisions in our estimates of the potential liability could materially impact our results of operation and financial position. See Item 8. "Financial Information—Consolidated Financial Statements and Other Financial Information—Legal Proceedings."
160
Incentive compensation
Management incentive plans are tied to various financial performance metrics. Bonus accruals made throughout the year related to the various incentive plans are based on management's best estimate of the achievements of the specific financial metrics. Adjustments to accruals are made on a quarterly basis as forecasts of financial performance are updated. At year-end, the accruals are adjusted to reflect the actual results achieved.
Fair value estimations of financial instruments
Fair values are based on listed market prices, where available. If listed market prices are not available, fair value is determined based on other relevant factors, including dealers' price quotations and price quotations for similar instruments traded in different markets. Fair value for certain derivatives are based on pricing models that consider current market and contractual prices for the underlying financial instruments or commodities, as well as the time value and yield curve or volatility factors underlying the positions. Pricing models and their underlying assumptions impact the amount and timing of unrealized gains and losses recognized, and the use of different pricing models or assumptions could produce different financial results.
Leasing
We apply the provisions of IAS17 to all leasing transactions. In general, there are two types of leases from a lessee's perspective: operating leases, which are leases accounted for off-balance sheet, and capital leases, which are leases capitalized on the balance sheet.
In accounting for leases, management makes assumptions, including the discount rate, fair market value of the leased assets and their estimated useful life. Changes in these assumptions could result in a change to the amounts recognized in the financial statements.
In addition to uncertainty inherent in management assumptions, leasing transactions become increasingly complex when they involve sale/leaseback accounting, which are leasing transactions where the lessee previously owned the leased assets. In these instances it is important to analyze the facts relating to the transactions to determine whether the transactions are finance/capital leases or operating leases, which will result in either on-balance sheet or off-balance sheet recognition, respectively.
Any changes in the assumptions used by management could significantly impact the value of assets and liabilities in our consolidated accounts.
Provisions
Telkom applies IAS37 in making assessments about the appropriate amount of provisions to be recognized for commitments and contingencies. Provisions are recognized when the Telkom Group has a present obligation, legal or constructive, as a result of a past event and it is probable that an outflow of resources will be required to settle the obligation. Provisions are reviewed at each balance sheet date and adjusted to reflect management's best estimate. While management does not anticipate any significant changes to the provisions reflected in the accompanying consolidated financial statements, changes in assumptions or related facts and circumstances could result in significant changes in the future.
Any changes in the assumptions used by management could significantly impact on the value of assets and liabilities in the group accounts.
Dealer incentives
Telkom provides incentives to its retail payphone card distributors as trade discounts. Incentives are based on sales volume and value. Revenue for retail payphone cards is recorded as traffic revenue, net of these discounts as the cards are used.
161
Vodacom acts as a principle in its relationship with its dealers and service providers. Dealers and service providers are not permitted to purchase and resell Vodacom airtime, they simply pass on to the subscriber the airtime that arises from the subscribers' use of the Vodacom network.
The role of the dealers and service providers is to undertake sales and marketing of airtime services, including connection and renewal of contract subscribers and sales to pre-paid customers, and certain administrative services in relation to customers connected to the Vodacom network, such as sales force and customer care and billing of individual customers for which they are compensated by Vodacom. In effect, Vodacom has simply outsoursed these functions, which they would otherwise have performed internally, incurred and recorded as expenses, and the contract between Vodacom and their dealers and service providers specifies what these functions are and how they will be compensated by incentive commissions.
The following incentive commissions are paid by Vodacom to its dealers and service providers:
Contract connection incentive commissions
These commissions are paid to service providers or dealers for the acquisition of new customers for all contract packages. A commission is paid to the service provider or dealer for each new activation. The cost of paying the commission is recognized as an expense in the period of the connection as part of customer acquisition costs. Vodacom accounts for the incentive paid as an expense, rather than netting the expense against revenue, on the basis that dealers and service providers are agents of Vodacom.
Contract retention incentive commissions
These commissions are paid to service providers or dealers for all contract packages, excluding Vodacom 4U. Vodacom calculates the incentive paid monthly and the expense is recognized in the period it is earned by the service provider or dealer.
Prepaid incentive commissions
These commissions are paid to service providers or dealers for the acquisition of new customers for all prepaid packages. A commission is paid to service providers or dealers for each new activation. The cost of paying the commission is recognized as an expense in the period of the connection as part of customer acquisition costs. Vodacom accounts for the incentive paid as an expense, rather than netting the expense against revenue, on the basis that dealers and service providers are agents of Vodacom.
Distribution incentive commissions
These commissions are paid to service providers or dealers to maintain and increase their loyalty to, and exclusivity with, Vodacom. These incentives include exclusivity payments and advances to service providers in respect of purchases of assets for stores and providing distribution outlets with distribution subsidies to maintain the loyalty of distribution outlets through the stimulation of sales. These incentives are accounted for as follows:
- •
- exclusivity payment costs incurred are paid annually and are deferred and recognized ratably over the contractual relationship period;
- •
- advances for purchases of distribution assets are capitalized and expensed over 24 to 36 months, the period of the contractual relationship period with the distributors; and
- •
- distribution subsidies are expensed based on the terms of the agreement. Typical terms are either at a fixed rate per customer or a fixed monthly rate.
162
Handset incentive commissions
The incentives are offered by Vodacom to dealers for Vodacom sourced handsets provided to customers, which are received as a net against revenue.
Item 6. Directors, Senior Management and Employees
DIRECTORS AND SENIOR MANAGEMENT
Directors and Senior Management of Telkom
Directors of Telkom
The management of Telkom is vested in its board of directors, which consists of eleven members. In accordance with Telkom's articles of association, the Government and Thintana Communications are entitled to appoint directors based on the percentage of the issued ordinary shares owned by them. As of the date hereof, the Government and Thintana Communications are each entitled to appoint five directors, including two executive directors, to Telkom's board of directors. The remaining member of the board is the CEO. One of the Government appointed directors must be an employee representative. The chief executive officer is Telkom's most senior executive and the exercise of his authority is subject to the authority and direction of the board of directors. Telkom's articles of association provide that the chief executive officer shall be an executive director nominated and appointed at least every three years by the board of directors, after consultation with each of the Government and Thintana Communications, for so long as they are significant shareholders. Pursuant to Telkom's articles of association, a significant shareholder is any person that holds either a class A ordinary share or a class B ordinary share and at least 15% of Telkom's issued ordinary shares, subject to adjustment to reflect additional issuances of ordinary shares by Telkom after March 4, 2003, provided that the percentage will not be lower than 10%. As of the date hereof, the Government and Thintana Communications are the only significant shareholders.
Telkom's shareholders are entitled to appoint, in a general meeting, that number of directors, if any, that are not appointed by the Government, Thintana Communications or the board of directors. The shareholders in a general meeting are not entitled to fill a vacancy created by a director appointed by either the Government or Thintana Communications. If, as of March 4, 2011, the class A ordinary share and class B ordinary share have not otherwise been converted into ordinary shares under the terms of Telkom's articles of association, they will be so converted and the rights of the Government and Thintana Communications as holders of the class A ordinary share and class B ordinary share, respectively, including their rights to appoint members of Telkom's board of directors will be terminated.
Under the shareholders' agreement between the Government and Thintana Communications, the parties are obligated to use their reasonable efforts to identify and appoint directors from members of historically disadvantaged groups in order to achieve a composition of the board that is representative of the demographics of the Republic of South Africa, provided that Thintana Communications is entitled to appoint two directors in its sole discretion. The parties further agreed that, to the extent the total number of directors appointed by them by virtue of their respective ownership of the class A ordinary share and the class B ordinary share is less than eleven, the balance of the directors, other than the chief executive officer, shall comprise independent directors. The Government and Thintana Communications will form a committee to nominate the remaining independent directors to the board for so long as they are significant shareholders, as more fully described under Item 10. "Additional Information—Memorandum and Articles of Association—Significant Shareholder." To the extent that the committee cannot agree on nominations for independent directors, then the Government and Thintana Communications are entitled to nominate a number of independent directors in proportion to their relative shareholding. The nominations will then be voted upon by all of Telkom's shareholders in a general meeting in the normal course of business. The Government and Thintana Communications
163
have agreed that they will exercise their voting rights in favor of any independent director nominated in accordance with the shareholders' agreement.
Pursuant to Telkom's articles of association, the board of directors is required to meet at least once a quarter. The following are Telkom's directors as of the date hereof. All of Telkom's directors are citizens of the Republic of South Africa unless otherwise indicated.
Directors
| Name | Year of Birth | Business Address | Position | Term of Office | Year of Appointment | |||||
|---|---|---|---|---|---|---|---|---|---|---|
| Nomazizi Mtshotshisa(1) | 1944 | Beslin House, 10 Koningkramer Road, New Germany, 3610 | Chairperson of the Board; Non-executive Director | 3 years | 2002 | |||||
| Jonathan Paul Klug, Sr.(2)(3) | 1956 | 175 E Houston, San Antonio, Texas, 78230, U.S.A. | Non-executive director | Indefinite | 2003 | |||||
| Tan Sri Dato'Ir. Md. Radzi Mansor(2)(4) | 1941 | Level 55, North Wing, Menara Telekom, off Jalan Pantai Baharu, 50672 Kuala Lumpur, Malaysia | Non-executive director | Indefinite | 1999 | |||||
| Shawn McKenzie(2)(3) | 1958 | Telkom Towers North 152 Proes Street, Pretoria, South Africa | Chief Operating Officer; executive director | Indefinite | 2002 | |||||
| Richard Menell(1) | 1955 | 56 Main Street Johannesburg, South Africa | Non-executive director | 3 years | 2000 | |||||
| Peter Moyo(1) | 1962 | Old Mutual Park, Jan Smuts Drive Pinelands Cape Town, South Africa | Non-executive director | 3 years | 2001 | |||||
| Sizwe Nxasana | 1957 | Telkom Towers North 152 Proes Street Pretoria, South Africa | Chief Executive Officer; executive director | 3 years, extended for a further 2 years | 1998 | |||||
| Tlhalefang Sekano(1)(5) | 1959 | 26 Baker Street, Rosebank Johannesburg, South Africa | Non-executive director | 3 years | 2001 | |||||
| Chian Khai Tan(2)(4) | 1950 | Telkom Towers North 152 Proes Street Pretoria, South Africa | Chief Strategic Officer; executive director | Indefinite | 2002 | |||||
| Charles Valkin(2) | 1934 | 9th Floor Twin Towers West, Sandton City Sandton, South Africa | Non-executive director | Indefinite | 1997 | |||||
| Themba Vilakazi(1) | 1946 | 4th Floor, IS Building, 158 Jan Smuts Avenue Rosebank Johannesburg, South Africa | Non-executive director | 3 years | 2002 |
- (1)
- Government representative.
- (2)
- Thintana Communications representative.
- (3)
- American.
- (4)
- Malaysian.
- (5)
- Employee representative.
164
Nomazizi Mtshotshisa has served as the chairperson of the board since August 2002. In addition, she has been a director of Admiral Industries (Proprietary) Limited since 1999, the chairman of Majweng Resources since 2001, the chairman of Chris Hani Baragwanath Reconstruction Trust since 2001, the chairman of Eco-Electrica (Pty) Limited since 2004, the chairman of Arch Equity (Pty) Limited since 2004, a director of Links Capital (Pty) Limited since 2003, a director of Woman's Development Micro Finance since 2001 and a director of Mvelaphanda Resources since 2004. Prior to 1999, she was an executive director at Vula Communications Holdings (Proprietary) Limited, an investment company, from July 1997 to October 1999. During the past five years, she has served as executive director of Vula Communications Holdings (Proprietary) Limited; partner and chairperson of Maluti Resources (Proprietary) Limited (Mining); chairperson of Midi TV (Proprietary) Limited (eTV); a director of the Industrial Development Corporation of South Africa Limited, Mossgas (Proprietary) Limited and Soekor (Proprietary) Limited; and a chairperson of Khumama Mining (Proprietary) Limited. Ms. Mtshotshisa holds a B. Curis degree from the University of South Africa.
Jonathan Paul Klug, Sr was appointed to the board in January 2003. He has been the vice president—finance—international of SBC Communications since May 2002. Prior to May 2002, Mr. Klug served as chief financial officer—Bell Canada for SBC Communications from May 2000 until May 2002, as vice president—partner channels and alliances of SBC Communications from October 1999 until May 2000, as president—Arkansas of Southwestern Bell Telephone from December 1998 to October 1999 and as managing director—corporate development of SBC Communications from June 1993 until November 1998. He is currently a director of TDC, America Movil and ADSB Telecommunications B.V. During the past five years he has served as a director of Belgacom S.A, Manitoba Telecom Services Inc. and Bimcor Inc. He holds a Bachelor of Business Administration degree from the University of Notre Dame and a Masters in Business Administration degree from St. Louis University.
Tan Sri Dato' Ir. Md. Radzi Mansor was appointed to the board in October 1999. Mr. Mansor was a consultant and advisor to Multimedia Development Corporation from April 1997 to June 2000. Mr. Mansor was appointed chairperson of Telekom Malaysia in July 1999. He currently serves as a director of TM International Sdn Bhd, Menara Kuala Lumpur Sdn Bhd, and Universiti Telekom Sdn Bhd. During the past five years, he has served as chairman of Fiberail Sdn Bhd, chairman of Telekom Smart School Sdn Bhd, chairman of TM International Leasing Incorporated, director of Radzi-San Enterprise Sdn Bhd, chairman of MTN Network (Pte) Ltd, Sri Lanka, chairman of TMI Mauritius Limited, director of Sotelgui sa (Societe Des Telecommunication De Guinee), director of Telekom Networks Malawi Limited and director of Thintana Communications. He holds an Engineering diploma from Faraday Engineering College and a Master of Science degree in Technological Economics from Stirling University.
Shawn McKenzie was appointed to the board and as chief operating officer in July 2002. Prior to joining Telkom he was the president—Texas, Southwestern Bell Telephone Company, a subsidiary of SBC Communications, from June 2001 until July 2002. Mr. McKenzie also served as president—Kansas, Southwestern Bell Telephone from October 1997 until June 2001. Prior to 1997, Mr. McKenzie served in a variety of marketing, technical and external affairs positions for Southwestern Bell Telephone Company since joining SBC Communications in 1979. He is currently a director of Vodacom Group (Proprietary) Limited. He has a Bachelor of Science degree in Business Administration and Political Science from the College of the Ozarks and he serves on the College's Board of Trustees.
Richard Menell was appointed to the board in July 2000. He is currently deputy chairman of African Rainbow Mineral. He was chairman of Anglovaal Mining from June 2002 to May 2004. Prior to June 2002, he was the chief executive officer and deputy chairman of Anglovaal Mining Limited since January 1997. Mr. Menell is the chairperson of the South African Tourism Board and a trustee of the South African National Business Trust. Mr Menell is a director of more than 30 companies in South Africa and elsewhere, both private and public. These directorships include appointments to the
165
boards of Harmony Gold Mining Company Limited, The Standard Bank of South Africa Limited and Mutual and Federal Insurance Company Limited. Mr. Menell holds a a Master of Science degree in Mineral Exploration and Management from Stanford University and a Master of Arts degree in Geology, Natural Sciences from Trinity College, Cambridge, England.
Peter Moyo was appointed to the board in September 2001. He has been the deputy managing director of Old Mutual Life Assurance Company (South Africa) Limited since September 2000. Prior to September 2000, Mr. Moyo held the position of executive general manager of Old Mutual Life Assurance Company Limited (South Africa) from September 1998 until August of 2000. From September 1997 until June 1998 he held the position of divisional manager of Old Mutual Life Assurance Company (South Africa) Limited and from June 1998 until August 1998 he held the position of general manager. Mr. Moyo was a partner at Ernst & Young, Registered Accountants and Auditors, Chartered Accountants (SA), until August of 1997. In the past five years, he has served as chairman of Old Mutual alternative Risk Transfer Limited, Old Mutual Asset Managers (Namibia) (Proprietary) Limited, Old Mutual Health Insurance Limited, Old Mutual Healthcare (South Africa) (Proprietary) Limited, Old Mutual Properties (Proprietary) Limited, Old Mutual Portfolio Holdings (Namibia) (Proprietary)Limited, Old Mutual Unit Trust Management Company Namibia Limited and as deputy chairman of Old Mutual Holdings (Namibia) (Proprietary) Limited. He has also served as a director of Bulawayo Electrical Supplies (Proprietary) Limited, Jobco—The Business Trust (Association incorporated in terms of section 21), Old Mutual Foundation Management (Proprietary Limited, Old Mutual Investment Administrators (Proprietary) Limited, Old Mutual Life Assurance Co (Namibia) Limited, Old Mutual Life Assurance Company (Zimbabwe) Limited, Old Mutual Life Holdings (South Africa) Limited, Old Mutual Specialised Finance (Proprietary) Limited, Old Mutual Technology Holdings (Proprietary) Limited; as alternate director of Old Mutual Life Assurance Company Zimbabwe Limited; and as a deputy managing director of Old Mutual (South Africa) Limited, Old Mutual Life Assurance Company (South Africa) Limited; and as trustee of Old Mutual (Namibia) dividend Access Trust, STS Trust, T.D. Investment Trust, The Business Section 18A (c) (i) Education Trust, The Business Section 18A (c) (ii) Education Trust, The Business Section 18A (d) Education Trust, Old Mutual (South Africa) Foundation and the Old Mutual (Namibia) Foundation. He holds a Bachelor of Accounting Science (Honors) degree from the University of South Africa (association incorporated in terms of Section 21), and a Higher Diploma in Tax Law from the University of the Witwatersrand, and is a Chartered Accountant (South Africa).
Sizwe Nxasana was appointed to the board and as chief executive officer in April 1998. Prior to joining Telkom in March 1998, he was the national managing partner for Nkonki Sizwe Ntsaluba Inc. from June 1996 to March 1998. He is a director of Vodacom Group (Proprietary) Limited, Business Against Crime—South Africa (Association incorporated in terms of Section 21), Zenex 1995 Trust and Zenex Foundation, Telkom Directory Services (Proprietary) Limited and First Rand Bank and Holdings Limited and chairman of the Audit Committee of the South African Revenue Service Board and was, during the past five years, a director of Co-ordinated Network Investments (Proprietary) Limited. He holds a Bachelor of Commerce degree and was recently awarded an honorary doctorate from the University of Fort Hare and a Bachelor of Accounting Science (honors) degree from the University of South Africa and is a Chartered Accountant (South Africa).
Tlhalefang Sekano was appointed to the board in September 2001. He has been the executive chairperson of the Communication Workers Investment Company since 1996. He is also a director of Ucingo Investments (Proprietary) Limited since May 2001, a director of Telesafe since April 2001, a director of Wireless Business Solutions since 1999, a director of Recharge Zone since 2001 and a director of Letlapa Financial Services since November 2001. During the past five years, he served as president of the Communications Workers' Union, director of Union Alliance Media Limited and Nextcom Cellular (Proprietary) Limited and chairperson of Letlape Group (Proprietary) Limited.
166
Chian Khai Tan was appointed to the board and as chief strategic officer in July 2002. Prior to joining Telkom, he was senior vice president, consumer and business sales at Telekom Malaysia from February 2001 to June 2002, general manager special project focus group at Telekom Malaysia from June 1998 until October 2000 and general manager, major business sales at Telekom Malaysia from April 1997 until May 1998. During the past five years, Mr. Tan has served as a director of Citifon Sdn Bhd and Telekom Publication Sdn Bhd, both subsidiaries of Telekom Malaysia. Mr. Tan is a director of Vodacom Group (Proprietary) Limited and TMI Mauritius Limited. He holds a Bachelor of Engineering (honors) degree from the University of Liverpool.
Charles Valkin was appointed to the board in April 1997. He has been an attorney and is a senior partner with the South African law firm of Bowman Gilfillan Inc. where he has worked since 1964. He currently serves as a non-executive director of Reunert Limited. Mr. Valkin holds a Bachelor of Commerce degree, a Bachelor of Laws degree and a Higher Diploma in Taxation from the University of the Witwatersrand.
Themba Vilakazi was appointed to the board in July 2002. He has been the executive chairman of Scientific Resource Management since July 1995. He is the founder and chairman of the South African Development Fund, Inc., located in Boston, Massachusetts, which he managed from 1985 until 1996. He currently serves as chairman of Transponder Technologies (Proprietary) Limited and Intenda (Proprietary) Limited and a director of Zamile Consulting (Proprietary) Limited, NDC Mining and Zalco (Proprietary) Limited. He holds a Bachelor of Science degree in Biology from Boston University.
167
Alternate directors of Telkom
The following are alternate directors who have been appointed in accordance with Telkom's articles of association. Each of these alternate directors is entitled to act in the place and stead of his appointing director at all board proceedings in which such appointing director is not present.
| Name | Year of Birth | Business Address | Position | Year of Appointment as Alternate | ||||
|---|---|---|---|---|---|---|---|---|
| John Gibson(1) | 1953 | Telkom Towers North, 152 Proes Street, Pretoria, South Africa | Group Executive— Corporate Development and alternate director to Jonathan Klug | 2002 | ||||
Dato' Md. Khir Abdul Rahman(2) | 1947 | Level 51 North Wing, Menara Telekom, off Jalan Pantai Baharu 50672 Kuala Lumpur Malaysia | Alternate director to Tan Sri Dato' Ir. Muhammad Radzi Mansor | 2001 | ||||
Brian Manning(1)(3) | 1951 | Telkom Towers North, 152 Proes Street, Pretoria, South Africa | Controller: Finance and alternate director to Shawn McKenzie | 2003 |
- (1)
- American.
- (2)
- Malaysian.
- (3)
- Appointed on October 24, 2003.
Anthony Lewis resigned as an alternate director to Charles Valkin on September 17, 2003 to return to SBC Communications Inc. as President—Finance, SBC Southwest.
John Gibson was appointed as an alternate director in January 2003 and as group executive—corporate development and IPO of Telkom in September 2002. Prior to joining Telkom, he was a general attorney—international at SBC Communications from April 1997 until May 2000 and general attorney and assistant general counsel—mergers and acquisitions from May 2000 until September 2002. During the past five years he has been an alternate director of Telmex and of TDC (TeleDanmark). He holds a Bachelor of Arts degree from the University of Wyoming and a Juris Doctorate from the Washburn School of Law in Kansas.
Dato' Md Khir Abdul Rahman was appointed as an alternate director in January 2002 and has served as a director and the chief executive of Telekom Malaysia since May 2000. Prior to May 2000, he served as deputy chief executive/general manager of Malaysia Electronics Payment System Sdn Bhd from October 1999 until May 2000, a director of Oriental Bank Bhd from September 1999 until April 2000 and as a managing director of Mejati Technologies Ltd from April 1996 until September 1999. He previously served as a non-executive director of Technology Resources Industries and has held various senior positions at the Central Bank of Malaysia. He is currently a director of Multimedia Development Corporation and Malaysian Industry—Government Group for High Technology. He holds a Bachelor of Science degree in mathematics from the University of Malaya, Malaysia, a Masters in Agricultural Development degree and a Doctorate of Science in Computing Statistics from the State University of Ghent, Belgium.
Brian Manning was appointed as an alternate director on October 24, 2003. Mr. Manning joined Telkom in July 2000 as financial controller. Mr. Manning also serves as a director for Telkom Directory Services (Proprietary) Limited and Swiftnet (Proprietary) Limited. Prior to joining Telkom, he was the executive director of finance for Matav (HTC) Hungary the Hungarian parastatal telephone company, and controller of Ameritech Advanced Data Services. He holds a Bachelor of Arts degree in Accounting from Cleveland State University and is a certified public accountant in the United States.
168
He is a member of the American Institute of Certified Public Accountants, the Ohio Society of Certified Public Accountants and the Illinois Society of Certified Public Accountants.
Senior management of Telkom
The following are members of senior management of Telkom:
| Name | Year of Birth | Position | Year of Employment | |||
|---|---|---|---|---|---|---|
| Sizwe Nxasana(1) | 1957 | Chief Executive Officer | 1998 | |||
| Shawn McKenzie(1)(2)(3) | 1958 | Chief Operating Officer | 2002 | |||
| Kaushik Patel | 1962 | Chief Financial Officer | 2000 | |||
| Chian Khai Tan(1)(2)(4) | 1950 | Chief Strategic Officer | 2002 | |||
| Nombulelo Moholi | 1960 | Chief Sales and Marketing Officer | 1994 | |||
| Reuben September | 1957 | Chief Technical Officer | 1977 |
- (1)
- Biographies set forth above.
- (2)
- Thintana Communications representative.
- (3)
- American.
- (4)
- Malaysian.
The business address of each of Telkom's executive officers is Telkom Towers North, 152 Proes Street, Pretoria, South Africa.
Nombulelo Moholi was appointed as chief sales and marketing officer in April 2002. Ms. Moholi joined Telkom in 1994 as general manager of payphones and became a group executive of regulatory affairs in October 1995 and managing executive of international and special markets in 1999. Prior to joining Telkom, she worked for GEC and Siemens (South Africa). She is chairperson of the South African Bureau of Standards and holds a Bachelor of Science degree in Electrical and Electronic Engineering from the University of Cape Town.
Reuben September was appointed chief technical officer in May 2002. Prior to this appointment, he served as managing executive of technology and network services since March 1, 2000. He has worked in various engineering and commercial positions in Telkom since 1977. He is a member of the Professional Institute of Engineers of South Africa (ECSA) and holds a Bachelor of Science degree in Electrical and Electronic Engineering from the University of Cape Town.
Kaushik Patel was appointed chief financial officer in January 2004. He joined Telkom and served as deputy chief financial officer since December, 2000. Prior to joining Telkom, he served as financial director for Teba Bank Ltd from April 1999 to November 2000 and finance executive for the African Bank Ltd since March 1998. He holds a Bachelor of Accounting Science (Honours) degree from the University of South Africa and is a Chartered Accountant (South Africa).
There are no family relationships between any of Telkom's directors or members of senior management.
169
Senior Management of Vodacom
The following are members of senior management of Vodacom:
| Name | Year of Birth | Position | Year of Employment | |||
|---|---|---|---|---|---|---|
| Alan Knott-Craig | 1952 | Chief Executive Officer of Vodacom Group | 1993 | |||
| Andrew Mthembu | 1956 | Deputy Chief Executive Officer of Vodacom Group and Managing Director of Vodacom International Holdings (Pty) Ltd | 1998 | |||
| Leon Crouse | 1953 | Finance Director of Vodacom Group | 1993 | |||
| Shameel Aziz-Joosub | 1971 | Managing Director of Vodacom Service Provider Company (Pty) Ltd. | 1994 | |||
| Pieter Uys | 1962 | Managing Director of Vodacom (Pty) Ltd and Group Chief Operating Officer of Vodacom Group | 1993 |
The business address of each of Vodacom's executive officers is Vodacom Corporate Park, 082 Vodacom Boulevard, Vodavalley, Midrand, South Africa.
Alan Knott-Craig has served as a managing director of Vodacom (Proprietary) Limited since 1993 and chief executive officer of Vodacom Group since October 1996. Prior to 1993, Mr. Knott-Craig was the senior general manager of mobile communications at Telkom until 1993, when he left to form Vodacom. Mr Knott-Craig is also a director of the following other companies within the Vodacom Group: Vodacom (Proprietary) Limited, Vodacom Service Provider Company (Proprietary) Limited and Vodacom International Holdings (Proprietary) Limited. Mr. Knott-Craig holds a Bachelor of Science degree in Electrical Engineering cum laude from the University of Cape Town and a Master of Business Leadership degree from the University of South Africa. He was inducted as one of the eight Gold Members of the GSM Association's 2001 inaugural "Roll of Honour" He serves as a Commissioner on the Presidential National Commission on Information Society & Development for ICTs.
Andrew Mthembu has served as a director since he joined Vodacom in January 1998 and served as the deputy chief executive officer of Vodacom Group from November 2001 until May 2004. Prior to 1998, Mr. Mthembu was managing director at Tolcon, a toll road concession company, from 1995 until December 1997. Mr. Mthembu is also the Managing Director of Vodacom International Holdings (Proprietary) Limited. Mr. Mthembu holds a Bachelor of Science degree in Chemistry and Biology from the University of Botswana and Swaziland, a Bachelor of Science degree in Civil Engineering from the University of Calgary, Canada and a Masters of Science degree in Construction Management from the University of Reading, England.
Leon Crouse has served as finance director of Vodacom Group since October 1996. Prior to 1996, Mr. Crouse served as Vodacom's general manager of Finance since Vodacom's inception in 1993. Mr. Crouse is also a director of Vodacom (Proprietary) Limited, Vodacom Service Provider Company (Proprietary) Limited and Vodacom International Holdings (Proprietary) Limited. Mr. Crouse holds a Bachelor of Commerce degree and a Certificate in the Theory of Accounting from the University of Port Elizabeth and is a Chartered Accountant (South Africa).
Shameel Aziz-Joosub has served as a director and as the managing director of Vodacom Service Provider Company (Proprietary) Limited since September 2000. Prior to September 2000, Mr. Joosub worked in Vodacom's finance department since 1994 and was managing director and founder of Vodacom Equipment Company (Proprietary) Limited, the handset distribution company in the Vodacom Group, before merging it with Vodacom Service Provider Company (Proprietary) Limited. Shameel Aziz-Joosub also serves as director of Vodacom Group (Proprietary) Limited. Mr. Joosub holds a Bachelor of Commerce (Honors) degree from the University of South Africa and holds a
170
Masters of Business Administration degree from the University of Southern Queensland, Australia, and is an Associated General Accountant and Commercial and Financial Accountant (South Africa).
Pieter Uys has served as managing director of Vodacom (Proprietary) Limited since December 2001 and as chief operating officer of Vodacom (Proprietary) Limited since February 2001. Mr. Uys joined Vodacom as a member of Vodacom's initial engineering team in 1993. Mr. Uys holds a Bachelor of Science degree in Engineering and a Masters in Engineering degree from the University of Stellenbosch and a Master of Business Administration degree from the Stellenbosch Business School. Mr. Uys joined Vodacom in 1993 as a member of the initial engineering team.
Reserved Matters
Pursuant to Telkom's articles of association, for so long as the Government is a significant shareholder, neither Telkom nor any of its subsidiaries may take action with respect to certain reserved matters unless authorized by the board, if, and to the extent that, the matters are not within the scope of the exclusive powers and authority delegated to the operating committee referred to below. In addition, the authorizing resolution of the board relating to any Government reserved matter must have received the affirmative vote of at least two of the directors appointed by the Government. The following are Government reserved matters:
- •
- the approval or amendment of Telkom's strategic objectives or those of any subsidiary;
- •
- any determination of or amendment to Telkom's management structure or schedule of authorizations granted by the board to management;
- •
- prior to May 8, 2004, any determination by the board of directors with respect to the scope or revocation of the exclusive powers and authority of the operating committee or the human resources review committee referred to below, and at any time, the countermanding, amending or supplementing of any decision or action made or taken by the operating committee or the human resources review committee before May 8, 2004;
- •
- the formation of any committee of, or the delegation of any authority to such committee, by the board of directors, other than as expressly set out in the articles of association;
- •
- an increase or reduction in the issued share capital of Telkom or its subsidiaries;
- •
- any issue, conversion or allotment of shares or securities by Telkom or any subsidiary;
- •
- the approval or making of the dividend policy from time to time and the declaration or distribution of any dividends by Telkom or by its subsidiaries;
- •
- any material change in Telkom's business or that of its subsidiaries;
- •
- the incurrence, creation or assumption by Telkom of any indebtedness which would cause the debt/equity ratio of Telkom, or the Telkom Group on a consolidated basis, to exceed 1.00;
- •
- any merger or consolidation involving Telkom or any transfer of any of Telkom's assets or liabilities or those of its subsidiaries where the consideration or purchase price, as the case may be, exceeds minimum thresholds;
- •
- the execution, renewal, amendment or termination of any contract between Telkom or its subsidiaries and any shareholder who owns in excess of 10% of the ordinary shares, unless the Government has an interest in the contract in question that conflicts with the interest of Telkom or the applicable subsidiary;
- •
- the establishment by Telkom of any subsidiary;
- •
- any change to the name under which Telkom or any subsidiary does business;
171
- •
- any change in Telkom's financial or tax year;
- •
- any winding-up or liquidation of Telkom or any of its subsidiaries;
- •
- after May 7, 2004 and subject to the audit and risk management committee's exclusive authority referred to below, the appointment of Telkom's auditors insofar as the South African Companies Act, 61 of 1973, requires such appointment to be made by directors;
- •
- any material alteration of the terms of any employee share ownership scheme approved by a general meeting; and
- •
- any change in the number of directors making up the board.
Pursuant to the shareholders' agreement, the approval and amendment of the business plans and annual budgets of Telkom and its subsidiaries will be included as additional Government reserved matters if the Government agrees to be bound by an undertaking not to directly or indirectly compete with Telkom's licensed business activities or those of its subsidiaries or Vodacom and divests itself of all ownership interests that would constitute a violation of such undertaking. Thintana Communications and the Government must give Telkom written notice of such event.
The Minister of Communications, who holds the class A ordinary share on behalf of the Government, may transfer the class A ordinary share only to other ministries and governmental departments of the Republic of South Africa and only if the Minister transfers the class A ordinary share together with sufficient ordinary shares to make the transferee a significant shareholder, without taking into account any other ordinary shares already held by or on behalf of the transferee, and only after consultation with Thintana Communications. In these circumstances, the transferee will acquire the rights enjoyed in respect of the reserved matters referenced above. If at any time the Government ceases to hold the class A ordinary share, the class A ordinary share will be converted into an ordinary share.
For so long as Thintana Communications is a significant shareholder, neither Telkom nor any of its subsidiaries may take action with respect to certain reserved matters unless authorized by the board, if, and to the extent that the matters are not within the exclusive powers and authority delegated to the operating committee referred to below. In addition, the authorizing resolution of the board relating to any Thintana Communications reserved matter must have received the affirmative vote of a majority of the directors appointed by Thintana Communications. These reserved matters include the Government reserved matters referred to above as well as the following:
- •
- the approval or amendment of any business plan or any annual budget or the strategic objectives of Telkom or any subsidiary;
- •
- the appointment, dismissal and replacement of members of management provided to Telkom by, or with Telkom's consent on behalf of, Thintana Communications, which is in breach of or otherwise than in accordance with the requirements of the strategic services agreement referred to under Item 7. "Major Shareholders and Related Party Transactions—Related Party Transactions—Shareholder Arrangements—Strategic Services Agreement;"
- •
- establishing any new or materially amending any existing employee compensation policies or plans;
- •
- the approval of Telkom's annual financial statements and those of its subsidiaries;
- •
- any material change in the accounting policies of Telkom or any subsidiary, other than a change that brings Telkom's accounting policies into conformity with IAS or Telkom's licenses;
- •
- the granting by Telkom or any of its subsidiaries of any guarantee or encumbrance not authorized in an annual budget which exceed minimum thresholds;
172
- •
- the entering into by Telkom or any subsidiary of any single transaction or series of transactions that requires a payment in excess of minimum thresholds unless Thintana Communications has a material interest in the transaction which conflicts with Telkom's or such subsidiary's interest;
- •
- any transfer of, amendment to, renewal or termination of, any telecommunications or broadcasting license held by Telkom or by its subsidiaries;
- •
- the commencement or settlement by Telkom or its subsidiaries of material litigation, unless Thintana Communications is a party to, and has a conflicting interest in, such litigation;
- •
- Telkom or any subsidiary entering into an agreement that restricts its business;
- •
- any change in the financial or tax year of any subsidiary;
- •
- the incurrence or assumption by any subsidiary of any indebtedness that would cause the debt/equity ratio of that subsidiary to exceed 1.00;
- •
- the commencement of any new business by Telkom or any of its subsidiaries; and
- •
- the establishment by Telkom or any subsidiary of Telkom of any subsidiary or any joint venture, partnership or similar arrangement.
Thintana Communications may transfer the class B ordinary share and its ordinary shares, subject to certain restrictions. See Item 7. "Major Shareholders and Related Party Transactions—Related Party Transactions—Shareholder Arrangements—Shareholders' Agreement." If Thintana Communications transfers the class B ordinary share and sufficient ordinary shares to make the transferee a significant shareholder, without taking into account any other ordinary shares already held by or on behalf of such transferee, and only after consultation with the Government, the transferee will acquire the rights Thintana Communications enjoyed in respect of the reserved matters referred to above. If there is a subsequent transfer of the class B ordinary share and sufficient ordinary shares to constitute the second transferee a significant shareholder, certain of these reserved matters will fall away. If Thintana Communications, as holder of the class B ordinary share, ceases to hold at least 5% of the issued and outstanding shares in the capital of Telkom, then the class B ordinary share will be converted into an ordinary share. If the class B ordinary share is converted into an ordinary share, the class A ordinary share will automatically be converted into an ordinary share.
If, and to the extent that, any of the actions which are reserved matters are within the exclusive powers and authority granted to the operating committee, such action may only be taken if authorized by the operating committee and the authorizing resolution receives the affirmative vote of at least one operating committee member appointed by each of the Government and Thintana Communications, for so long as they are significant shareholders.
Telkom's articles of association provide that the articles relating to these reserved matters will fall away on March 4, 2011.
173
Compensation of Directors
The following table sets forth in Rands, the cash and non-cash compensation, paid by Telkom to its executive and non-executive directors in the year ended March 31, 2004:
| Name and Position | Directors Fees | Basic Salary | Board Committee Fees | Bonuses/ Performance Related Payments | Pension Fund Contributions | Other Benefits | Total | |||||||
|---|---|---|---|---|---|---|---|---|---|---|---|---|---|---|
| Executive director | ||||||||||||||
| Sizwe Nxasana (Chief Executive Officer) | — | 1,864,845 | — | 8,200,991 | 242,430 | 832,300 | 11,140,566 | |||||||
Non-executive directors | ||||||||||||||
| Nomazizi Mtshotshisa (Chairperson) | 666,666 | — | — | — | — | — | 666,666 | |||||||
| Richard Menell | 108,000 | — | — | — | — | — | 108,000 | |||||||
| Tlhalefang Sekano | 96,000 | — | — | — | — | — | 96,000 | |||||||
| Charles Valkin | 108,000 | — | — | — | — | — | 108,000 | |||||||
| Peter Moyo | 115,500 | — | — | — | — | — | 115,500 | |||||||
| Tan Sri Dato 'Ir Md. Randzi Mansor | 90,000 | — | — | — | — | — | 90,000 | |||||||
| Themba Vilakazi | 108,000 | — | — | — | — | — | 108,000 |
In addition, in the year ended March 31, 2004, Telkom paid SBC Communications and Telekom Malaysia R29.9 million and R5.7 million, respectively, in respect of services rendered. In the year ended March 31, 2004, the aggregate consolidated compensation of Telkom's directors and members of senior management, paid or accrued, was R48.0 million.
Bonus and Profit Sharing
Senior management and executive directors participate in the Telkom top management incentive scheme. The incentive scheme consists of two components, namely the team award and the individual award. The team award constitutes 80% and the individual award 20% of the overall award. The team award is based 70% on Telkom financial drivers and 30% on Telkom performance drivers. The individual award is based on the performance of the individual. Payment of bonuses for the 2004 financial year took place in June 2004.
Remuneration of Non-Executive Directors
Fees for Telkom's non-executive directors are determined by the board of directors based on market practice, within the restrictions contained in Telkom's articles of association. Telkom's non-executive directors receive no other pay or benefits, with the exception of reimbursement of expenses incurred in connection with their directorships. The non-executive directors do not participate in the share schemes, bonus schemes or incentive plans outlined herein and are not eligible for pension scheme membership.
Loans
Telkom has not made any loans to any of its directors or senior management referred to herein.
Service Agreements
Telkom has entered into service agreements with Sizwe Nxasana, Nombulelo Moholi,Reuben September and Kaushik Patel. Shawn McKenzie and Chian Khai Tan are seconded to Telkom pursuant to the strategic services agreement referred to in Item 7. "Major Shareholders and Related Party Transactions—Related Party Transactions—Shareholder Arrangements—Strategic Services Agreement" below. The service agreement for Mr. Nxasana has a three year term, with two years remaining, and is
174
subject to termination by either party upon six months notice. The service agreements for Ms. Moholi, Mr. September and Mr. Patel are of indefinite duration, but are subject to termination by either party upon three months notice. Each of Ms. Moholi and Mr. September has entered into a retention agreement and a restraint, or non-compete, agreement. Certain amounts are payable to them pursuant to their retention agreements, which amounts are repayable or forfeited if he or she resigns from Telkom prior to March 31, 2005.
Incentive Plans
At Telkom's Annual General Meeting held on January 27, 2004, Telkom's shareholders approved a conditional share plan for all employees. A maximum of 22,281,272 ordinary shares may be made available for purposes of the plan, representing 4% of Telkom's issued ordinary share capital as of March 31,2004. Allocation to management employees in terms of this plan shall not exceed 2% of Telkom's issued ordinary share capital. The remaining 2% is reserved for the remainder of the staff. No one participant in the plan may acquire more than 0.05% of Telkom's issued ordinary share capital.
The board may determine the maximum number of shares that will be provisionally awarded to each participant in a conditional contract. Each conditional contract obligates Telkom to allot and issue to the employee or procure the transfer to the employee, free of cash, the provisional number of shares awarded to the employee, subject to certain performance criteria applicable to him or her being met within a specified period. The number of shares ultimately awarded to the employee, however, is dependent upon the extent to which the employee meets certain performance criteria and, in any event, must not exceed the provisional number awarded. For a management employee, the performance criteria have to be met within three years. For a non-management employee, the performance criteria have to be met for one-third of his or her provisional shares at the end of two years, for the next third at the end of three years and for the last third at the end of four years, each from the date of his or her conditional contract. At the end of these periods, the rights of the employees will vest, provided that each performance criterion has been met and the employee is still a Telkom employee. Subject to the board's discretion, if the employee is terminated due to death, other than suicide, retrenchment where he or she does not receive a voluntary severance package, outsourcing, normal retirement or retrenchment due to ill health, his or her rights will remain unaffected; otherwise, the employee will lose his or her rights to acquire any shares apart from the rights that have already vested. A Telkom employee cannot receive any dividends for awarded shares or be entitled to vote, with respect to awarded shares until their rights to shares are vested. In addition, a Telkom employee may not assign any of his or her rights or obligations under this plan.
On March 17, 2004, the Telkom Board of Directors approved guidelines for the allocation of shares. The process of actual allocation has not yet begun, but will be based on the following:
- •
- the Telkom share price on the JSE based on the last ten trading days prior to March 30, 2004; and
- •
- the Telkom's final financial results for the 2004 financial year as measured by the team award.
For officers, executives and managers, the number of ordinary shares will be based on a percentage of the individual's total remuneration and the individual's performance assessed through Telkom's
175
performance enhancement process. The following illustrates how individual performance influences the number of shares:
| Performance | % by which award will be modified | |
|---|---|---|
| Did not meet targets | 0% | |
| Met all targets | 100% | |
| Exceeded all targets** | 100%+ |
- **
- Subject to Board discretion
For employees in Telkom's collective bargaining unit, the number of ordinary shares will be based on a percentage applied to the weighted average remuneration per job level, regardless of the individual's performance as assessed through Telkom's performance and development management system. However, the number of ordinary shares will depend on a sliding scale of the Telkom financial performance, as measured by Telkom's gain-sharing plan. The following table illustrates the sliding scale:
| Overall % achievement of Telkom financial targets | % by which award will be modified | |
|---|---|---|
| Less than 90% | 0% | |
| Between 90% and 95% | 50% | |
| Between 95.1% and 99.9% | 75% | |
| 100% and above | 100%** |
- **
- Subject to Board discretion.
Telkom had a phantom scheme that was phased out on April 1, 2002 with all outstanding shares payable not later than September 30, 2003. The rules of the phantom scheme did not provide employees with a mechanism to acquire ordinary shares. Telkom has not awarded rights under the phantom scheme since July 1, 2002. Only a selected number of employees participated in the scheme and shares were allocated on merit and individual performance.
Government Option Grants
On March 4, 2003, the Government granted share options to purchase up to 11,140,636 of its ordinary shares, representing 2% of Telkom's issued and outstanding ordinary share capital, through the Diabo Share Trust, established for the benefit of:
- •
- persons employed by Telkom at 9:00 a.m. (S.A. time) on March 4, 2003; and
- •
- former employees, who were employed by Telkom on or after October 1, 1999 up to 8:59 a.m. (S.A. time) on March 4, 2003, including deceased estates of such employees. Employees who resigned voluntarily or were dismissed on grounds of misconduct, fraud or other grounds justifying summary dismissal at common law before 8:59 a.m. (S.A. time) on March 4, 2003 were excluded from participation in this scheme.
The options entitle these persons to acquire ordinary shares from the Government at R33.81 per share, which is the price at which Thintana Communications invested in Telkom in 1997, plus any stamp duty, brokerage and related costs payable on the transfer of these ordinary shares. The shares will be delivered over a period of three years in four equal tranches. Two tranches were exercised in September 2003 and March 2004. These persons may also elect to have some or all of the shares disposed of for their benefit. Such persons did not need to remain employed with Telkom after 9:00 a.m. (S.A. time) on March 4, 2003 in order to continue participating in the scheme and persons
176
who were employed by Telkom after 9:00 a.m. (S.A. time) on March 4, 2003 will not otherwise have the right to participate in the scheme.
Corporate Governance Statement
Corporate Governance
The board is committed to ensuring that the affairs of Telkom are conducted with integrity and in accordance with principles set out in the King Report on Corporate Governance 2002, or King II, and the Sarbanes-Oxley Act of 2002.
Compliance with the King Code and JSE listing requirements
By virtue of its listing on the JSE, Telkom is obliged to comply with the Code of Corporate Practices and Conduct contained in King II and in accordance with the JSE new listing requirements promulgated in September 2003. Telkom is required to disclose the extent of its compliance with King II and provide reasons for non-compliance.
Telkom complies in all material respects with the principles of King II. While it acknowledges the importance of good governance, the Board is aware that Telkom does not strictly comply with certain principles set out in King II. These areas of non-compliance stem mainly from certain provisions in Telkom's articles of association, which were framed to safeguard the interests of the two controlling shareholders, namely, the Government of the Republic of South Africa and Thintana Communications. Most of the areas of non-compliance will be resolved by no later than March 5, 2011, when the provisions of Telkom's articles of association resulting in non-compliance with King II fall away or earlier if the controlling shareholders' shareholding falls below certain stipulated levels.
177
The board of directors comprises three executive and eight non-executive directors. The Government of the Republic of South Africa and Thintana Communications are Telkom's controlling shareholders. Based on their current shareholding, the Government and Thintana Communications, are each entitled to appoint five directors, including two executive directors, to the board.
The non-executive directors have a wide range of skills and significant commercial experience, which enable them to bring independent judgment to bear to the board's deliberations and decisions. No single director or block of directors dominates decision-making at board meetings.
The roles of chairman and chief executive officer do not reside in the same person. The chairman is a non-executive director appointed by the class A shareholder, the Government, in consultation with the class B shareholder, Thintana Communications. The chief executive officer is appointed by the board, on a renewable, three-year service contract, in consultation with the class A and class B shareholders.
The board meets at least once a quarter, including for sessions devoted to discussing strategy and business planning. Extraordinary board meetings are convened when necessary to deliberate on issues that require board resolutions between scheduled meetings. Certain members of senior management are in attendance at board meetings. Other members of management are periodically invited to make presentations on particular issues of interest to the board.
Board papers and other relevant documentation are timeously circulated, giving board members sufficient time to consider the issues on the agenda, thus enabling them to make informed decisions on the issues at hand.
Telkom has a formal induction program for newly appointed directors. The induction of newly appointed directors is conducted by the chairman and chief executive officer with input from the company secretary. Where a newly appointed director has no or limited board experience, the induction program is structured to meet the individual director's specific needs.
In terms of Telkom's articles of association, board decisions on certain specified matters require the affirmative vote of at least two of the class A shareholder directors, appointed by the Government, and/or majority of the class B shareholder directors, appointed by Thintana Communications.
The board encourages attendance at annual general meetings by the directors and members of management. The members of the board, audit and risk management committee and the remuneration committee attend the annual general meeting of shareholders.
A number of standing committees have been established to assist the board and the directors in the effective discharge of their responsibilities. Where deemed necessary, special committees are established by the board to consider specific issues and make recommendations to the board. Board and special committees are free to take independent professional advice at the cost of Telkom in carrying out their delegated duties.
178
Directors' Attendance of Board Meetings
| | Scheduled | Special | ||||||
|---|---|---|---|---|---|---|---|---|
| | Number of Meetings(1) | Attendance | Number of Meetings(1) | Attendance | ||||
| Non-executive | ||||||||
| NE Mtshotshisa (Chairman) | 4 | 4 | 5 | 5 | ||||
| JP Klug, Sr. | 4 | 4 | 5 | 3 | ||||
| Tan Sri Dato' Ir. Md. Radzi Mansor | 4 | 4 | 5 | 5 | ||||
| RP Menell | 4 | 3 | 5 | 3 | ||||
| TA Sekano | 4 | 4 | 5 | 4 | ||||
| CL Valkin | 4 | 4 | 5 | 5 | ||||
| TG Vilakazi | 4 | 3 | 5 | 5 | ||||
| MP Moyo | 4 | 4 | 5 | 2 | ||||
| Executive | ||||||||
| SE Nxasana | 4 | 4 | 5 | 5 | ||||
| SM McKenzie | 4 | 4 | 5 | 5 | ||||
| Chian Khai Tan | 4 | 4 | 5 | 5 | ||||
| Alternate | ||||||||
| AJ Lewis (alternate to CL Valkin) (resigned August 18, 2003) | 2 | 2 | 0 | 0 | ||||
| Dato' Md. Khir Abdul Rahman (alternate to Tan Sri Dato' Ir. Md. Radzi Mansor) | 4 | 0 | 5 | 0 | ||||
| JB Gibson (alternate to JP Klug, Sr.) | 3 | 3 | 3 | 3 | ||||
| BP Manning (alternate to SM McKenzie) (appointed October 24, 2003) | 2 | 1 | 3 | 3 | ||||
- (1)
- Four scheduled board meetings and five special meetings were held during the year. The following table presents the possible meetings based on the appointment and resignation of members.
Operating committee
The board had established an operating committee, which has the exclusive power and authority to, among other things:
- •
- implement approved business plans, annual budgets and all other matters and issues relating to the achievement of Telkom's obligations under its licenses; and
- •
- prepare, review and recommend to the board business plans and budgets and any amendments thereto.
The operating committee consisted of five ex-officio voting members and three ex-officio non-voting members. Each of the Government and Thintana Communications had the right, for as long as it is a significant shareholder, to appoint two voting and two non-voting members. The fifth voting member was the chief executive officer who was the chairman of the committee. Decisions at meetings of the operating committee were taken by a majority vote of the voting members. In the event of an equality of votes, a voting member of the class A shareholder had a casting vote.
The operating committee ceased to exist after May 7, 2004.
The following were the voting members of the operating committee as of May 7, 2004:
- •
- SE Nxasana, Chairman
- •
- SM McKenzie
179
- •
- RJ September
- •
- C Khai Tan
- •
- NT Moholi
The following were the non-voting members of the operating committee as of May 7, 2004:
- •
- BMC Ngcobo
- •
- GNV Magashula
- •
- JB Gibson
Following the termination of the operating committee, the board established an executive committee to advise the chief executive officer comprised of the chief operating officer, the chief financial officer, the chief sales and marketing officer, the chief technical officer and the chief strategic officer.
Members' Attendance of Operating Committee Meetings
| | Scheduled | Special | ||||||
|---|---|---|---|---|---|---|---|---|
| | Number of Meetings(1) | Attendance | Number of Meetings(1) | Attendance | ||||
| SE Nxasana (Chairman) | 12 | 12 | 3 | 3 | ||||
| SM McKenzie | 12 | 12 | 3 | 3 | ||||
| JK Raley (resigned June 30, 2003) | 2 | 2 | 1 | 1 | ||||
| RJ September | 12 | 10 | 3 | 3 | ||||
| CK Tan | 12 | 12 | 3 | 3 | ||||
| NT Moholi | 12 | 11 | 3 | 2 | ||||
| BMC Ngcobo | 12 | 11 | 3 | 3 | ||||
| GNV Magashula | 12 | 11 | 3 | 3 | ||||
| AJ Lewis (resigned August 18, 2003) | 3 | 3 | 1 | 1 | ||||
| JB Gibson (appointed August 18, 2003) | 12 | 9 | 3 | 2 | ||||
- (1)
- Twelve scheduled operating committee meetings and these special meetings were held during the year. The following table presents the possible meetings based on appointment and resignation dates of members.
Audit and risk management committee
The audit and risk management committee comprises three non-executive directors. A non-executive director who is not the chairman of the board chairs the committee. No member of the audit and risk management committee may, other than in his or her capacity as a member of that committee, the board or any other committee of the board, accept any consulting, advisory or other compensatory fee from Telkom or any subsidiary of Telkom or be an affiliated person of Telkom or any subsidiary or vendor of Telkom. See Directors Interest in note 40 of the Consolidated Financial Statements.
The responsibilities of the audit and risk management committee include, among other things, the following:
- •
- appoint or, insofar as that is not permitted by the South African Companies Act, 61 of 1973, recommend for appointment, Telkom's auditors, determine their compensation and oversee their work;
180
- •
- resolve disagreements between Telkom's management and its auditors in regard to financial reporting;
- •
- establish procedures for the treatment of complaints regarding accounting or auditing matters and for the confidential anonymous submission by employees of concerns regarding questionable accounting or auditing matters;
- •
- engage independent counsel and other advisors, as determined necessary to carry out its duties;
- •
- make determinations with respect to payment of remuneration and other compensation to Telkom's auditors for the purpose of rendering or issuing an audit report and to any advisors employed by the committee;
- •
- conduct internal audits;
- •
- review the interim and final financial statements;
- •
- review and recommend changes to Telkom's statutory audit;
- •
- monitor Telkom's internal accounting and auditing systems;
- •
- conduct a corporate governance audit; and
- •
- review and monitor Telkom's risk management performance and provide a high-level risk assessment for the board on an ongoing basis.
During the 2004 financial year, Telkom's audit committee adopted a pre-approval policy for services by external auditors, which does not allow for certain services, including bookkeeping, financial system design, valuation services, actuarial services, internal audit outsourcing services and legal services not related to the audit. At the beginning of the 2004 financial year, the committee pre-approved the engagement of the independent auditors to provide audit services based on fee estimates. The committee also pre-approves proposed audit related services, tax services and other permissible services. The pre-approval policy requires all auditing and non-audit services provided by the external auditors to be pre-approved by the audit and risk management committee. The chairman of the audit and risk management committee is the primary member of the audit committee that has the authority to pre-approve audit and non-audit services outside of the meetings and, in his absence, any member of the audit and risk management committee.
Telkom has in place a policy to address the potential hiring of audit team members to avoid issues of independence.
The audit and risk management committee has a process in place where they obtain confirmation from the external auditors that none of the directors or officers have behaved in a manner to fraudulently influence, coerce, manipulate or mislead the external auditors intentionally or through negligent actions.
The following are the members of the audit and risk management committee as of the date hereof:
- •
- MP Moyo, Chairman
- •
- CL Valkin
- •
- TG Vilakazi
Telkom's board of directors has determined that the chairman of our audit committee, Mr. Peter Moyo, is an audit committee financial expert within the meaning of Item 16A. (b) and (c) of the requirements of Form 20-F of the SEC. The SEC has determined that the audit committee financial expert designation does not impose on the person with that designation, any duties, obligations or liability that are greater than the duties, obligations or liabilities imposed on such person as a member
181
of the audit committee of the board of directors in the absence of such designation. He is a chartered accountant by profession and was a partner at Ernst & Young until 1997.
The chief executive officer, chief operating officer, chief financial officer, financial controller, head of legal services, head of internal audit and head of risk management attend meetings of the audit and risk management committee by invitation. The external auditors are invited when appropriate to attend the audit and risk management committee meetings.
Members' Attendance of Audit and Risk Management Committee Meetings
| | Scheduled | Special | ||||||
|---|---|---|---|---|---|---|---|---|
| | Number of Meetings | Attendance | Number of Meetings | Attendance | ||||
| MP Moyo (Chairman) | 4 | 4 | 1 | 1 | ||||
| CL Valkin (appointed June 17, 2003) | 4 | 4 | 1 | 1 | ||||
| TG Vilakazi (appointed June 17, 2003) | 4 | 4 | 1 | 1 | ||||
Remuneration committee
The remuneration committee consists entirely of non-executive directors and is chaired by the chairman of the board. The committee must include at least one member appointed by Thintana Communications. The remuneration committee reviews the terms upon which Telkom's executive directors, except for executive directors appointed by Thintana Communications, and senior management are employed and compensated and upon which Telkom's non-executive directors are compensated and makes recommendations to the board with respect to such matters.
The following are members of the remuneration committee as of the date hereof:
- •
- NE Mtshotshisa, Chairman
- •
- JP Klug, Sr.
- •
- RP Menell
- •
- TA Sekano
- •
- Tan Sri Dato' Ir. Md. Radzi Mansor
The chief executive officer, chief operating officer and head of human resources attend meetings of the remuneration committee by invitation.
Members' Attendance of Remuneration Committee Meetings
| | Scheduled | Special | ||||||
|---|---|---|---|---|---|---|---|---|
| | Number of Meetings | Attendance | Number of Meetings | Attendance | ||||
| NE Mtshotshisa (Chairman) | 4 | 4 | 1 | 1 | ||||
| Tan Sri Dato' Ir. Md. Radzi Mansor | 4 | 4 | 1 | 1 | ||||
| TA Sekano | 4 | 4 | 1 | 1 | ||||
| JP Klug, Sr. | 4 | 4 | 1 | 1 | ||||
| RP Menell | 4 | 4 | 1 | 0 | ||||
182
Human resources review committee
The board has established a human resources review committee comprising of at least seven members, including four non-executive directors. Two members of the committee must be appointed by Thintana Communications. No action may be taken at a meeting of the human resources review committee, other than a decision to dissolve or adjourn the meeting, unless a member of that committee appointed by Thintana Communications is present. Actions of the human resources review committee must be approved by a majority vote of its members. In the event of an equality of votes, the chairman of the human resources review committee shall have a casting vote. The human resources review committee's exclusive powers and authorities include, among other things, the following:
- •
- recommending to the board policy guidelines on human resource development; and
- •
- recommending to the board guidelines for affirmative action and empowerment programs and monitoring compliance with those guidelines.
The human resources review committee ceased to exist after May 7, 2004. After May 7, 2004, all the powers, authority and any powers previously held by the Human Resources Review Committee reverted to the Remuneration Committee.
The following were the voting members of the human resources review committee as of May 7, 2004:
- •
- Nomazizi Mtshotshisa, Chairman
- •
- Sizwe Nxasana
- •
- George Magashula
- •
- Tan Sri Dato' Ir. Md. Radzi Mansor
- •
- Shawn McKenzie
- •
- Richard Menell
- •
- Tlhalefang Sekano
Previously, CK Mokoena was a non-voting member of the human resources review committee.
Members' Attendance of Human Resources Review Committee Meetings
| | Scheduled | |||
|---|---|---|---|---|
| | Number of Meetings | Attendance | ||
| NE Mtshotshisa (Chairman) | 5 | 5 | ||
| Tan Sri Dato' Ir. Md. Radzi Mansor | 5 | 5 | ||
| TA Sekano | 5 | 5 | ||
| RP Menell | 5 | 4 | ||
| SE Nxasana | 5 | 5 | ||
| SM McKenzie | 5 | 4 | ||
| GNV Magashula | 5 | 5 | ||
| CK Mokoena | 5 | 3 | ||
Directors' remuneration
Telkom believes that the levels and make-up of the remuneration packages offered to the directors of Telkom, especially the executive directors and the chief executive officer, are sufficient to attract and retain the directors needed to run Telkom's business successfully. In order to avoid paying more than is
183
necessary and to ensure that Telkom offers competitive packages, Telkom constantly benchmarks itself against its peer group.
In determining specific remuneration packages for the chief executive officer and non-executive directors, the remuneration committee consults with the chairman, and is sensitive to the remuneration and employment conditions elsewhere in the Telkom Group. In doing so, performance-related elements of the remuneration constitute a large proportion of the total remuneration package of the chief executive officer and are specifically designed to align his interests with those of shareholders and to give such executive directors incentives to perform at the highest level. Remuneration of executive directors appointed by Thintana Communications is not subject to review by the remuneration committee. Telkom does not make payments directly to Thintana Communications' executive directors, but pays management fees to Thintana Communications for such services determined in accordance with the strategic services agreement.
Should the service of any of Telkom's executive directors be terminated early, other than those appointed by Thintana Communications, the remuneration committee will tailor its approach in respect of compensation commitments to the circumstances of the case with the broad aim of avoiding rewarding poor performance, while dealing fairly with cases where departure is not due to poor performance.
No director is involved in deciding his or her own remuneration. In addition, Telkom has adopted a formal and transparent procedure for developing a policy on executive directors' remuneration.
Telkom's articles of association provide that the remuneration of the directors for their services shall be determined by the directors, after taking into account the recommendations of the remuneration committee. Non-executive directors are not, as part of their remuneration, allocated shares in Telkom but may purchase shares in Telkom.
Directors' remuneration and interests are detailed in note 40 to the Telkom Group's consolidated annual financial statements included elsewhere herein.
Company secretary and professional advice
The directors have unrestricted access to the services and advice of the company secretary. Directors are entitled, after consultation with the chairman of the board, to seek independent professional advice about the affairs of Telkom at Telkom's expense.
The termination of the services of the company secretary is a matter to be decided by the board.
Directors' and officers' dealings
The board has adopted an insider trading policy in terms of which the directors, officers and employees of Telkom are prohibited from dealing in Telkom's securities when in possession of price-sensitive information that has not yet been made public. In addition, Telkom imposes a "closed period" from the end of the reporting periods (i.e., year-end and half year-end) until the publication of the results during which period the directors, officers and employees of Telkom are prohibited from dealing in Telkom's securities.
Outside the closed periods directors and officers of Telkom are required to obtain prior approval from the insider trading compliance officer before dealing in Telkom's securities. Where the chief executive officer needs to deal in Telkom's shares outside closed periods, the chairman must give the approval. Where the chairman needs to deal in Telkom's shares outside the closed periods, prior approval must be obtained from the insider trading compliance officer. Directors' dealings in Telkom's securities are published on SENS within the regulated timeframes.
184
Risk management
The Telkom Group has adopted a continuous, systematic enterprise-wide risk management process, which aims to ensure all material risks are identified, evaluated and addressed. The board of directors continuously monitors treasury policies, risk limits and control procedures. The audit and risk management committee reviews the effectiveness of the risk management processes and reports to the board on an annual basis.
The Telkom Group's risk exposure and management thereof is discussed in note 39 "Financial instruments and risk management" to the consolidated annual financial statements.
Internal controls
The board of directors, through the audit and risk management committee, annually conducts a review of the effectiveness of its system of internal controls and reports to shareholders the results of such a review. The board also believes that this system of internal controls provides reasonable assurance that Telkom's assets are safeguarded, that Telkom's transactions are authorized and recorded properly and that material errors and irregularities are either detected or prevented in a timely manner.
The board of directors, through the audit and risk management committee, is responsible for the total risk management and governance process within Telkom and its subsidiaries. Management is accountable to the board and has established a system of internal controls to manage significant risks, encompassing business and operational risk.
Telkom's management is required to provide the board with appropriate and timely information about the business, operations and general affairs of the Telkom Group. In addition, Telkom's directors are encouraged to make further enquiries where necessary should the information volunteered by management not be sufficient in all circumstances. The chairman ensures that Telkom's board members are all properly briefed on issues arising at board meetings, using external advisors where necessary.
Telkom's directors have unrestricted and unhindered access to all information, records, documents and property and the board receives information that goes beyond the assessment of Telkom's quantitative performance.
Qualitative factors include customer satisfaction, market share, environmental performance and human resource performance.
Financial statements
The board of directors is responsible for preparing Telkom's financial statements. In this regard, it is the board's responsibility to present a balanced and understandable assessment of both interim and annual financial information as well as other price sensitive public reports, including any reports to ICASA and other information that Telkom is statutorily obliged to disclose.
The directors report on the business as a going concern with supporting assumptions and qualifications as and when necessary at the time of Telkom's interim and annual financial statements, and have established a formal and transparent arrangement for considering the financial reporting and internal control principles.
185
Code of ethics
Telkom has adopted a business code of ethics that seeks to instill in its employees the spirit of fairness, respect and ethical standards in dealing with Telkom's customers, competitors, suppliers, investors and shareholders to ensure that Telkom's integrity is not compromised.
In business dealings on behalf of Telkom, employees are expected to avoid activities that might give rise to conflicts of interest. Employees are expected to act in the exclusive interest of Telkom. Procedures have been put in place to deal with conflicts of interest where these arise in the course of employees' day-to-day activities.
Telkom has established a confidential hotline service to encourage and enable whistle blowing. As part of the business code of ethics, there is a policy to protect whistleblowers from discrimination and harassment.
The business code of ethics is reviewed regularly to ensure that it keeps up with developments both inside and outside Telkom. The business code of ethics is published on Telkom's website on www.telkom.co.za/ir. Information contained on Telkom's website is not a part of this annual report.
Employment equity
Telkom has in place an employment equity policy, which seeks to promote equity in the workplace by promoting equal opportunity and fair treatment through the elimination of unfair discrimination against people in the workplace. Unfair discrimination in the workplace on the basis of gender, race, culture, belief, etc., is prohibited.
The main objectives of this policy are to:
- •
- create an environment in which the best-qualified person is employed regardless of gender, religion, color or race;
- •
- create within Telkom a balanced profile of employees that reflects the composition of South African society at large;
- •
- correct racial and social imbalances of the past; and
- •
- provide for Telkom's current and future requirements for skilled staff.
Relationship with shareholders
Telkom is and remains ready, when practical and legal, to enter into dialogue with shareholders and make such information publicly available to all shareholders. Telkom will make every effort to keep its shareholders intelligently informed. Telkom has established an investor relations function and an investor relations portal (www.telkom.co.za/ir) for communication with investors. Information contained on Telkom's investor portal is not a part of this annual report.
US Sarbanes-Oxley Act of 2002
The United States Public Company Accounting Reform and Investor Protection Act of 2002, also known as the Sarbanes-Oxley Act of 2002, was enacted on July 30, 2002 and contains significant new rules on corporate governance for United States and foreign companies listed or reporting in the United States, especially in the area of audit committee composition and authority. As a result of its listing on the New York Stock Exchange Telkom is subject to the Sarbanes-Oxley Act. Many of the provisions of the Sarbanes-Oxley Act are new and are subject to SEC rulemaking and interpretation and will become effective in the course of this year.
186
In particular, the Sarbanes-Oxley Act calls for audit committees of listed US companies, such as Telkom, to be composed entirely of independent board members as defined by the Sarbanes-Oxley Act and to be exclusively responsible for the engagement and removal of and oversight over a company's external auditors. As a result, Telkom may be required to alter the composition of its board of directors and audit and risk management committee in order to comply with the Sarbanes-Oxley Act.The Sarbanes-Oxley Act also requires US reporting companies, such as Telkom, to disclose whether they have adopted a code of ethics and business conduct and, if not, why. Telkom has adopted a business code of ethics that, taken together with its disclosure of information policy, are designed to comply with the requirements of Item 16B. of Form 20-F. Telkom has filed its business code of ethics and disclosure of information policy as exhibits to this annual report. US reporting companies, such as Telkom, will also be required to publicly disclose any waiver from the provisions of such code. Telkom will publicly be disclosing waivers granted in relation to such code.
Telkom is closely monitoring SEC rulemaking proceedings pursuant to the Sarbanes-Oxley Act to ensure its compliance with any rules as they become applicable to Telkom as a foreign private issuer.
187
Fixed-line Employees
The following table sets forth the number of our full time employees in our fixed-line segment.
| | As of March 31, | | | |||||||||
|---|---|---|---|---|---|---|---|---|---|---|---|---|
| | 2003/2002 % change | 2004/2003 % change | ||||||||||
| | 2002 | 2003 | 2004 | |||||||||
| Telkom | 39,444 | 35,361 | 32,358 | (10.4 | ) | (8.5 | ) | |||||
| Network and technology | 28,343 | 25,074 | 23,679 | (11.5 | ) | (5.6 | ) | |||||
| Marketing and sales | 8,230 | 7,616 | 6,282 | (7.5 | ) | (17.5 | ) | |||||
| Support and other | 2,871 | 2,671 | 2,397 | (7.0 | ) | (10.3 | ) | |||||
| Subsidiaries | 586 | 581 | 576 | (0.9 | ) | (0.9 | ) | |||||
| Total | 40,030 | 35,942 | 32,934 | (10.2 | ) | (8.4 | ) | |||||
In addition to our full time employees, Telkom had 1,196 temporary employees on March 31, 2004. Our employees are represented by the Alliance of Telkom Unions, comprising the South African Communications Union, the Solidarity Union, the Post and Telecommunications Association of South Africa and the Communication Workers Union. Some of our employees also belong to other unions that are not recognized by Telkom for collective bargaining purposes, including the Postal Union, the Society of Telkom Engineers and the South African State and Allied Workers Union. As of March 31, 2004, approximately 74% of our total fixed-line employees, excluding our Telkom Directory Services and Swiftnet subsidiaries, were union members.
Telkom is a party to a collective agreement on substantive matters covering the terms and conditions of employment of its fixed-line unionized employees and other non-management employees in Telkom's bargaining unit, excluding our Telkom Directory Services and Swiftnet subsidiaries, with ATU and CWU. In addition, Telkom signed a new collective recognition agreement on April 1, 2004 with ATU designed to enhance the relationship between shop stewards and management. Telkom is currently seeking to add CWU to the agreement.
In terms of the shareholders' agreement, one of the members on our board of directors appointed by the Government of the Republic of South Africa, Tlhalefang Sekano, executive chairperson of the Communication Workers Investment Company, is the union representative. A number of South African trade unions, including the trade unions of our employees, have close links to various political parties. In the past, trade unions have had a significant influence in South Africa as vehicles for social and political reform and in the collective bargaining process. Since 1995, South Africa has enacted various labor laws that enhance the rights of employees and have resulted in increased compliance costs.
These laws:
- •
- confirm the right of employees to belong to trade unions;
- •
- guarantee employees the right to strike, the right to picket and the right to participate in secondary strikes in prescribed circumstances;
- •
- provide for mandatory compensation in the event of termination of employment due to redundancy;
- •
- limit the maximum ordinary hours of work;
- •
- increase the rate of pay for overtime;
188
- •
- require large employers, such as us, to implement affirmative action policies to benefit previously disadvantaged groups and impose significant monetary penalties for non compliance; and
- •
- provide for the financing of training programs by means of a levy grant system and a national skills fund.
We believe that the relationship between our management and our employees and labor unions is good. We believe that investment in employee training and development is essential to implementing corporate cultural change and improving customer satisfaction. In order to improve the skill levels of our employees, we invested R390 million in employee training and development in the year ended March 31, 2004.
We are leveraging the experience of our strategic equity investors to improve and transfer skills to our South African management team. Leadership development continues to remain our primary priority, with specific focus on previously disadvantaged groups. We have launched a number of initiatives designed to train our employees and encourage employee retention.
Employee-related expenses are a significant component of our total fixed-line operating expenses. The number of Telkom's employees declined by approximately 24,453 positions from March 31, 1997 through March 31, 2004. In October 2002, Telkom and its recognized trade unions agreed to embark on a process of implementing alternative strategies and approaches to avoid and minimize job losses and to create new career opportunities for Telkom employees. On November 27, 2002, we launched "The Agency for Career Opportunities" as an alternative strategy to assist employees seeking alternative employment and avoid disruptions from job losses.
Mobile Employees
The following table sets forth the number of Vodacom's employees including contractors and temporary employees as of the dates indicated.
| | As of March 31, | | | ||||||||
|---|---|---|---|---|---|---|---|---|---|---|---|
| | 2003/2002 % change | 2004/2003 % change | |||||||||
| | 2002 | 2003 | 2004 | ||||||||
| South Africa | 3,859 | 3,904 | 3,848 | 1.2 | (1.4 | ) | |||||
| Other African | 494 | 502 | 761 | 1.6 | 51.6 | ||||||
| Total(1) | 4,353 | 4,406 | 4,609 | 1.2 | 4.6 | ||||||
- (1)
- Includes 280, 219 and 423 total temporary employees as of March 31, 2004, 2003 and 2002, respectively. The calculation of total mobile employees between South Africa and other African countries has been restated from 3,984 and 369, respectively, in the year ended March 31, 2002. Includes 100% of Vodacom's employees in the Democratic Republic of the Congo.
Vodacom is an equal opportunity employer committed to empowerment and has developed an employment equity policy that is available to all employees. Vodacom's South African employees' participation in unions was approximately 7.9% as of March 31, 2004, approximately 6.4% as of March 31, 2003 and approximately 5.8% as of March 31,2002. Vodacom believes that the relationship between its management and its employees and labor unions is good.
189
As of March 31, 2004, none of Telkom's directors or senior management had any beneficial or non-beneficial interest in any of Telkom's shares except as stated below:
| | Beneficial | Non-beneficial | | % of Telkom Outstanding Shares | ||||||||
|---|---|---|---|---|---|---|---|---|---|---|---|---|
| Directors' shareholding | Direct | Indirect | Direct | Indirect | Total | |||||||
| 2004 | ||||||||||||
| Executive—S E Nxasana | 373 | 223 | 446 | 223 | 1,265 | ** | ||||||
| Non-executive | — | — | — | 16,700,276 | 16,700,276 | 3.0 | ||||||
| NE Mtshotshisa | — | — | — | 88 | 88 | ** | ||||||
| MP Moyo* | — | — | — | 16,700,000 | 16,700,000 | 3.0 | ||||||
| TG Vilakazi | — | — | — | 188 | 188 | ** | ||||||
| Total | 373 | 223 | 446 | 16,700,499 | 16,701,541 | 3.0 | ||||||
2003 | ||||||||||||
| Executive—S E Nxasana | 223 | 223 | 446 | 223 | 1,115 | ** | ||||||
| Non-executive | — | — | — | 33,411,231 | 33,411,231 | 6.0 | ||||||
| NE Mtshotshisa | — | — | — | 88 | 88 | ** | ||||||
| MP Moyo* | — | — | — | 16,700,000 | 16,700,000 | 3.0 | ||||||
| TA Sekano* | — | — | — | 16,710,955 | 16,710,955 | 3.0 | ||||||
| TG Vilakazi | — | — | — | 188 | 188 | ** | ||||||
| Total | 223 | 223 | 446 | 33,411,454 | 33,412,346 | 6.0 | ||||||
- *
- The shares are beneficially owned by Old Mutual and Ucingo of which MP Moyo and TA Sekano are directors respectively. The directors' shareholding did not change between the balance sheet date and the date of issue of the financial statements.
- **
- Less than 1%.
As of March 31, 2004, Telkom's directors and senior management (14 persons) collectively held 16,720,368 ordinary shares, including the 16,700,000 ordinary shares beneficially owned by Old Mutual, which were attributed to MP Moyo. The 16,720,368 ordinary shares represented 3.02% of Telkom's issued and outstanding ordinary shares as of March 31, 2004. These amounts do not include the ordinary shares held by Thintana Communications, which has four representatives on Telkom's board. In June 2004, Telkom allocated 17,341 ordinary shares to Sizwe Nxasana, 5,534 ordinary shares to Kaushik Patel, 6,638 ordinary shares to Nombulelo Moholi and 6,549 ordinary shares to Reuben September under its conditional share plan. These shares do not vest until three years from the date of grant.
Item 7. Major Shareholders and Related Party Transactions
Overview
Telkom and its predecessors have been responsible for the exclusive provision of public switched telecommunication services in the Republic of South Africa from 1910 through May 2002. Prior to 1991, Telkom's business was conducted as a division of the Department of Posts and Telecommunications of the Government of the Republic of South Africa. On September 30, 1991, the Government of the Republic of South Africa embarked upon a commercialization process through which the Department of Posts and Telecommunications transferred its telecommunications enterprise
190
to Telkom. Telkom remained a wholly state-owned entity until May 14, 1997, when the Government of the Republic of South Africa sold a 30% equity stake in Telkom to Thintana Communications, which is 60% beneficially owned by SBC Communications and 40% beneficially owned by Telekom Malaysia. In March 2001, the Government sold a 3% equity stake in Telkom from its holdings to Ucingo Investments, a consortium of black empowerment investors. In March 2003, the Government sold 154,199,467 of its ordinary shares in a global offering. Prior to the global offering, the Government owned 67% of Telkom's issued and outstanding ordinary shares. Due to funding constraints, Ucingo disposed of its entire shareholding on September 17, 2003. As of the date hereof, the Government owns 38.3% of Telkom's issued and outstanding ordinary shares, Thintana Communications owns 15.1% of Telkom's issued and outstanding ordinary shares and 46.6% of Telkom's issued and outstanding ordinary shares are held by the public. Pursuant to Telkom's memorandum and articles of association, Thintana Communications may not hold in excess of 49% of the issued shares of any class of shares of Telkom, other than the class B ordinary share, for so long as it is a significant shareholder. The Government granted to current and former employees of Telkom, options to purchase, through the Diabo Share Trust established for that purpose, up to 11,140,636 of its ordinary shares, representing 2% of Telkom's issued and outstanding ordinary share capital.
As of May 31, 2004, the following persons had interests in 5% or more of Telkom's issued and outstanding ordinary shares:
| Name of Shareholder | Number of Ordinary Shares | Percentage of Class | ||
|---|---|---|---|---|
| Government of the Republic of South Africa | 213,403,965(1) | 38.3 | ||
| Thintana Communications | 167,109,545(2) | 30.0 |
- (1)
- Excludes one class A ordinary share held in the Republic of South Africa by the Government, which represents 100% of the class.
- (2)
- Excludes one class B ordinary share held by Thintana Communications, which represents 100% of the class.
Thintana Communications announced that it sold a 14.9% interest in Telkom in June 2004, leaving it with a 15.1% beneficial interest in Telkom.
As of March 31, 2004, ADRs evidencing approximately 426,754 ADSs were held of record by approximately 2 record holders. The 1,707,016 ordinary shares represented by those ADRs (approximately 0.3% of Telkom's issued and outstanding ordinary shares) were registered in the name of Standard Bank of South Africa. As of May 31, 2004, ADRs evidencing approximately 430,654 ADSs were held of record by approximately 2 record holders. The 1,722,616 ordinary shares represented by those ADRs (approximately 0.3% of Telkom's issued and outstanding ordinary shares) were registered in the name of Standard Bank of South Africa. Some of these ADRs were held of record by persons outside the United States. In addition, as of March 31, 2004, we estimate that approximately 220 million publicly traded ordinary shares were held of record outside of South Africa. Since certain of Telkom's ADRs and ordinary shares are held by brokers or other nominees, the number of ADRs and ordinary shares held of record and the number of record holders outside of South Africa may not be representative of the location of where the beneficial holders are resident.
Telkom's special purpose entity established to fund post retirement obligations indirectly held R46 million in nominal value of Telkom's 10.5% unsecured local bond due October 31, 2006 (TL06) and approximately 260,699 of Telkom's ordinary shares as of March 31, 2004.
As authorized by its shareholders at an annual general meeting held on January 27, 2004, Telkom embarked on a share repurchase program for purposes of the Telkom conditional share plan.
191
In the year ended March 31, 2004, Rossal No 65 (Proprietary) Limited, a wholly-owned subsidiary of Telkom, repurchased 3,185,736 shares at a volume weighted average price of R74.58 per share, including costs, which are being held in treasury. On June 4, 2004, Telkom purchased Acajou (Pty) Limited for share repurchase activities other than repurchases for the Telkom conditional share plan. Between June 7, 2004 and June 21, 2004, Acajou (Pty) Limited purchased 2,337,000 shares at a volume weighted average price of R76.88 per share, including costs, which are also being held in treasury.
In terms of the South African Companies Act, 61 of 1973, a subsidiary company may not acquire more than 10% of the shares in its holding company.
Telkom plans on continuing its buy back strategy based on certain criteria.
Except as stated under Item 6. "Directors, Senior Management and Employees—Share Ownership," none of Telkom's directors or senior management is the beneficial owner of any of Telkom's ordinary share capital. Except as disclosed above, Telkom is not directly or indirectly owned or controlled by any other corporation, foreign government or any other natural or legal person severally or jointly and Telkom is not aware of any arrangements, the operation of which may at a subsequent date result in a change of control of Telkom. The Government and Thintana Communications have different voting rights than the other shareholders of Telkom. These rights are more fully described in Item 6. "Directors, Senior Management and Employees" below.
Shareholder Arrangements
Shareholders' Agreement
The Government, represented by the Minister of Communications, and Thintana Communications have entered into a shareholders' agreement. Telkom is not a party to the shareholders' agreement.
Pursuant to the shareholders' agreement and Telkom's articles of association, the Government and Thintana Communications have certain special rights as "significant shareholders." The rights of the Government and Thintana Communications as significant shareholders pursuant to the articles of association will terminate on the conversion of the class A ordinary share and class B ordinary share into ordinary shares, which conversion will automatically occur, if it has not already occurred in accordance with Telkom's articles of association, on March 4, 2011. See Item 10. "Additional Information." However, if the Government and Thintana Communications have not otherwise ceased to be significant shareholders prior to March 4, 2011, the Government and Thintana Communications will continue, after that date and as between themselves only, to have rights as significant shareholders pursuant to the shareholders' agreement for so long as they own at least 15% of Telkom's issued ordinary shares, which percentage will be adjusted from time to time to reflect the dilutive effect of any issuance of new ordinary shares by Telkom, provided that the percentage will not be lower than 10%.
Under the shareholders' agreement, the Government and Thintana Communications have agreed to exercise their respective voting and other rights, as shareholders in Telkom, to ensure, among other things, that, to the extent legally possible:
- •
- Telkom and its subsidiaries operate in accordance with the provisions of the shareholders' agreement, articles of association, business plan, annual budget and strategic services agreement;
- •
- Telkom complies with its obligations under its licenses;
- •
- Telkom complies with the provisions of its articles of association regarding the appointment or removal of persons duly nominated to or removed from the human resources review committee, the establishment and operation of the audit and risk management committee and the right of
192
- •
- Telkom procures that the powers granted to the operating committee by the articles of association are not withdrawn or modified in any way except as provided in the articles;
- •
- Telkom complies with the provisions of the strategic services agreement;
- •
- for so long as Thintana Communications is a significant shareholder, Telkom does not issue, and the Government does not, without prior written consent of Thintana Communications, transfer any ordinary shares to, or encumber any ordinary shares in favor of, any transferee whose business involves the provision of telecommunications services and whose annual revenues exceeds $100 million, except in a distribution on any securities exchange where neither the seller nor any person acting on its behalf is aware that the relevant transaction has been pre-arranged with a buyer that is a telecommunications provider;
- •
- Telkom pursues strategic objectives to operate in a commercial manner designed to maximize Telkom's value and to achieve the highest levels of efficiency, productivity and profitability, to make Telkom a world class communications operator responsive to the needs of the customer, to satisfy economically viable demands for basic telephony needs in South Africa and to increase coverage of priority customers, such as educational and medical facilities, community centers and governmental agencies, through an accelerated network roll-out program, to enable genuine economic empowerment of South African disadvantaged groups, to transform Telkom into a company representative of South African demographics, to create training and skills-development opportunities in the telecommunications sector, to create economic growth and employment opportunities through the creation of an "information society" and to ensure that these strategic objectives are incorporated into Telkom's business plan;
- •
- Telkom first prepays its borrowings from or guaranteed by the Government before prepaying its other medium or long-term indebtedness where, after consultation, the Government and Thintana Communications agree that it would be preferable for Telkom to do so;
- •
- Telkom has, in addition to any other independent auditors otherwise required, at least two joint firms of independent auditors, one nominated by the Government and the other by Thintana Communications with the prior approval of the other party; and
- •
- Telkom distributes by way of dividend profits commercially and prudently available for such distribution in each financial year in accordance with Telkom's articles of association.
Thintana Communications to perform a financial and/or operations audit and risk management of Telkom and its subsidiaries;
In addition, the Government and Thintana Communications have agreed that, for so long as both of them are significant shareholders, they will meet prior to any general meetings of ordinary shareholders and attempt to reach consensus on how to vote their shares in respect of every item that is on the agenda for the relevant meeting. If they do reach consensus, the Government and Thintana Communications have undertaken to vote all of their respective ordinary shares in accordance with such agreement. If, after implementation of an escalation procedure, they fail to reach consensus, the Government and Thintana Communications are free to vote their ordinary shares as they deem fit, unless the relevant matter is a shareholder reserved matter. Shareholder reserved matters include:
- •
- the approval of special resolutions;
- •
- the amendment of Telkom's articles of association and any change to the name under which Telkom does business;
- •
- any change in Telkom's share capital or capital structure, other than any issue, allotment, consolidation, division or buy-back, the authority for which has been delegated to the board of directors by a resolution of a general meeting;
193
- •
- the adoption of, or material amendment to, any employee share ownership plan;
- •
- any change of Telkom's joint auditors after May 7, 2004;
- •
- Telkom's winding-up or liquidation;
- •
- the approval of Telkom's annual financial statements; and
- •
- any significant acquisition, merger or material transaction.
If the relevant matter on which consensus is not reached is a shareholder reserved matter and Thintana Communications wishes to vote against the matter at a general meeting, the shareholders' agreement allows Thintana Communications, for so long as it is a significant shareholder, to require the Government to vote against the relevant shareholder reserved matter as well. The shareholders' agreement also allows the Government, for so long as it is a significant shareholder, the right to require Thintana Communications to vote against the relevant shareholder reserved matter if the Government wishes to vote against it, but only if the Government agrees in writing to be bound to the non-competition provisions of the shareholders' agreement and at the same time divests itself of all ownership interests in Telkom's competitors, competitors of any of Telkom's subsidiaries and Vodacom's competitors that would violate such non-competition provisions.
If the Government does not agree or is otherwise unable to so bind itself to the non-competition provisions or does not so divest competing ownership interests, the Government must abstain from voting its ordinary shares on the reserved matter at the relevant general meeting, may not be present at the relevant general meeting for the consideration of that matter and Thintana Communications may vote only that number of its ordinary shares that represents the percentage that the total number of ordinary shares held by shareholders, other than the Government and Thintana Communications, bears to the total number of ordinary shares held by shareholders, other than Thintana Communications. Currently, the Government is not bound by such non-competition provisions, but Thintana Communications is.
The shareholders' agreement provides that the Government and Thintana Communications shall exercise their respective voting and other rights, as shareholders in Telkom, to ensure that, to the extent legally possible, Telkom's board of directors consists of a maximum of eleven directors. To the extent that the Government holds more ordinary shares in Telkom than Thintana Communications, the Government and Thintana Communications shall use their best endeavors to procure that the chairperson of Telkom's board of directors shall be a candidate nominated by the Government from among the non-executive directors and, to the extent that the Government holds fewer ordinary shares than Thintana Communications, the chairperson of Telkom's board of directors will be appointed by Telkom's board of directors from among the non-executive directors. The Government and Thintana Communications also undertake to use reasonable efforts to ensure the membership of Telkom's board is representative of South African demographics, provided that Thintana Communications is entitled to appoint up to two directors in its sole discretion.
194
The shareholders' agreement contains provisions relating to the appointment by Telkom of directors to the board of directors of its subsidiaries and its Vodacom joint venture. For so long as either the Government or Thintana Communications is a significant shareholder, a director of Telkom nominated by the Government and Thintana Communications, respectively, is entitled to nominate for appointment by the Telkom board of directors, a number of members on each of the boards of directors of each of Telkom's subsidiaries. The number shall be a proportion of the total number of members on such board of directors that Telkom is entitled to appoint based on the ratio of the number of shares owned by the significant shareholder who nominates such director to the sum of the shares owned by the Government and Thintana Communications, but in any event at least one member on each such board of directors. With respect to Vodacom, for so long as Telkom has the right to appoint four directors to Vodacom's board and Thintana Communications is a significant shareholder and continues to hold indirectly 10% or more of Vodacom's share capital, a director of Telkom nominated by Thintana Communications will be entitled to nominate two of these four directors which Telkom will appoint to Vodacom's board of directors. If Thintana Communications is a significant shareholder, but neither of these other conditions is satisfied, then a director of Telkom nominated by Thintana Communications will have the same right to nominate directors for appointment to Vodacom's board as it does in relation to Telkom's subsidiaries. If at any time Telkom has the right to appoint only one director to Vodacom's board and Thintana Communications is at such time a significant shareholder, a director of Telkom nominated by Thintana Communications will be entitled to nominate that director for appointment, after consultation with Telkom. The director so appointed must, however, in carrying out his or her responsibilities, act as Telkom's nominee.
The Government has agreed with Thintana Communications not to sell its shares in Telkom for a further 545 day period, after the expiration of or release from the 180 day lock up period entered into with the underwriters in connection with the initial public offering. The Government and Thintana Communications have reciprocal rights of first offer for the purchase of each other's shares. Neither the Government nor Thintana Communications may transfer any ordinary shares it holds, and in the case of the Thintana Communications, the class B ordinary share, without first offering the shares in question for sale to the other party at a price and upon terms and conditions determined by the offering party. These rights of first offer are subject to the following exemptions:
- •
- certain transfers by the Government to "eligible ministries," disadvantaged groups and past and present employees of Telkom, as more fully described below;
- •
- listed public offerings;
- •
- transfers under exempted and brokers' transactions or block trades permitted under United States and South African securities laws; and
- •
- any forced purchase of all of Thintana Communications' shares at their fair market value by the Government, or by a third party designated by the Government, if, among other things, Thintana Communications ceases to be controlled by Telkom's strategic equity investors, acting together or separately; or breaches the non-competition obligations set forth in the shareholders' agreement; or is unable to pay its debts in the ordinary course of business; or becomes subject to liquidation or bankruptcy procedures that are not discharged within ninety days; or an order is made or a resolution is passed for its winding-up.
If the Government does not exercise its first right to purchase any shares so offered to it, Thintana Communications may transfer the offered shares to any bona fide third party, provided that:
- •
- the consent of the Government is required for the transfer of the class B ordinary share if the class B ordinary share is part of the offered shares, subject to the qualifications mentioned below; and the Government's consent is also required for the transfer of the other shares, being ordinary shares, to a South African person; and
195
- •
- the class B ordinary share may, in any event, be transferred only if, as part of the transfer, the transferee acquires a number of Thintana Communications' ordinary shares as would be sufficient to constitute the transferee as a significant shareholder without taking into account any other ordinary shares already held by or on behalf of the transferee.
The qualifications mentioned above are that the Government's consent to the transfer of the class B ordinary share may not be unreasonably withheld for a transferee whose business involves the provision of telecommunications services and has annual revenues from such services in excess of $1.5 billion and, in any event, is not required for a transfer to any one of the telecommunications companies to which such a transfer is specifically permitted under the shareholders' agreement. Thintana Communications is entitled to freely transfer its shares in Telkom to its members, provided that the class B ordinary share is transferred to the same transferee as to whom the ordinary shares are transferred and such transferee binds itself to the shareholders' agreement.
The Government may transfer its shares in Telkom, including its class A ordinary share, to one or several eligible ministries of the Government and, where the Government transfers its class A ordinary share, only after consultation with Thintana Communications and only if it transfers its class A ordinary share together with enough ordinary shares as would result in the relevant ministry becoming a significant shareholder without taking into account any other ordinary shares already held by or on behalf of such ministry. An "eligible ministry" of the Government is any ministry or department of the Government which has signed a written acknowledgement, in a form reasonably acceptable to Thintana Communications, to be bound by the shareholders' agreement. In addition, the Government may transfer up to 7%, which includes the shares required for the implementation of the offering by the Government of options to past and present employees of Telkom for 2% of Telkom's share capital, of the total issued shares of Telkom, or such greater percentage as Thintana Communications may consent to, for the purpose of empowering disadvantaged groups, provided that the Government imposes certain transfer restrictions on the transferee and that such transferee agrees to be bound thereby.
The shareholders' agreement prohibits Thintana Communications, subject to limited exceptions, from engaging in any business activity which competes with any of Telkom's licensed business activities, or those of its subsidiaries or Vodacom, in the Republic of South Africa. Thintana Communications must also use reasonable efforts to offer to Telkom an opportunity to participate, on mutually agreed and commercially reasonable terms and conditions, in any telecommunications investments which it or any of its affiliates proposes making in sub-Saharan Africa.
The Government has agreed to indemnify Thintana Communications against a violation by Telkom of environmental laws in certain circumstances, against the exercises of certain authority under the Telecommunications Act, 103 of 1996, in relation to Telkom which could reasonably be expected to have an adverse effect on Telkom, its business or prospects or Thintana Communications' investment in Telkom and against certain amendments to Telkom's licenses made without Telkom's consent if such amendment has a material adverse effect on Telkom, its business or prospects or Thintana Communications' investment in Telkom.
Strategic Services Agreement
Telkom was party to a strategic services agreement with Thintana Communications, SBC International Management Services Inc., or SBC Management, and Telekom Management Services Sdn. Bhd, or Telekom Management. Pursuant to that agreement, Thintana Communications was entitled and obliged, with the right to request others, including SBC Management and Telekom Management and their affiliates, to provide personnel to Telkom. Pursuant to the agreement, SBC Management and Telekom Management provided personnel to Telkom, as requested by Thintana Communications. These personnel filled certain key managerial positions, such as the chief operating officer, chief strategic officer and financial controller, in which they provided strategic services for Telkom. The strategic
196
services related to the following: business management, oversight of personnel matters, development and implementation of marketing plans and other corporate strategies, network planning and supervision, network operations, budget planning, payroll processing, internal financial support services, technical advice and assistance, regulatory compliance, customer billing and other related services.
When the original strategic services agreement commenced, up to approximately 75 managerial positions were filled by personnel provided by SBC Management and Telekom Management pursuant to the agreement. As of March 31, 2004, that number had been reduced to 18 such positions. Since May 7, 2002, Thintana Communications has been obliged to make reasonable efforts to fill any of the managerial positions which it is entitled to fill, with members of South African groups historically discriminated against on the grounds of race, color, origin or gender. Telkom paid a fee for the services of each person provided to it pursuant to the strategic services agreement.
Telkom, and the other parties to the original strategic services agreement executed a new strategic services agreement on January 16, 2003. This new strategic services agreement became effective on January 16, 2003. Under this new strategic services agreement, Thintana Communications continued to be entitled and obliged to provide personnel to Telkom to fill approximately 20 key management positions and certain additional senior managers during the financial years ending March 31, 2003 and 2004. Since May 2004, Thintana Communications only has the right to appoint six positions. Telkom itself is entitled to request, if and when it requires, certain additional senior managers during those same two financial years. All the personnel are to be appointed to provide the same strategic services as those to be provided under the original strategic services agreement. As and when vacancies occur in those positions, personnel are to be selected by Thintana Communications and provided to Telkom, for appointment by Telkom to fill the vacancies, in accordance with the requirements of the new strategic services agreement. These requirements include a consultative process between Telkom and Thintana Communications for the appointments. They also provide for a gradual decrease in the number of the more senior personnel to be provided by Thintana Communications. In any event, wherever it is feasible, vacancies are required to be filled by suitably qualified historically disadvantaged individuals. Telkom is required to continue to pay to Thintana Communications, or any other personnel provider who provides personnel at the request of Thintana Communications, a fee for the services of each person provided to Telkom under the new strategic services agreement. Telkom has requested, and our strategic equity investors have agreed to provide, 12 additional positions pursuant to the strategic services agreement.
The new strategic services agreement automatically terminates on the liquidation or dissolution of either Telkom or Thintana Communications. It also automatically terminates upon the earlier of ten days after Thintana Communications ceases to be a significant shareholder in Telkom, in which event Telkom may request a continuance of the agreement for a further period not exceeding 120 days, and May 8, 2007. The new strategic services agreement may also be terminated by Thintana Communications:
- •
- in the event of certain breaches of the agreement by Telkom;
- •
- if the relevant exchange control approvals required by Telkom to effect the payments terminate without renewal;
- •
- if the shareholders' agreement is terminated for any reason or a material term thereof is breached by the Government;
- •
- if any of the rights granted to Thintana Communications under the shareholders' agreement or Telkom's articles of association become unenforceable; or
- •
- if Telkom ceases to be a significant provider of telecommunications services for any reason whatsoever.
197
Either of SBC Communications or Telekom Malaysia may also terminate the new agreement, insofar as it relates to that party, if that party declares bankruptcy or seeks legal protection from its creditors or if SBC International South Africa LLC or any of its affiliates or Telekom Malaysia Africa Sdn. Bhd. or any of its affiliates, as the case may be, ceases to hold an equity interest in Thintana Communications.
Telkom paid R132 million and R22 million to SBC Management and Telekom Malaysia, respectively, in the 2004 financial year pursuant to the original and the new strategic services agreements. These amounts were payable in dollars and were provided for in the Telkom Group's consolidated financial statements at the spot rate in terms of IAS21.
Registration Rights Agreement
Telkom has entered into a registration rights agreement with the Government and Thintana Communications. Pursuant to the agreement, Thintana Communications has the right to cause Telkom to either effect a JSE public offering in South Africa, or register with the Securities and Exchange Commission all or part of its ordinary shares, or both, at any time after the expiration of the 180-day lockup period. The Government has the same right, but it can exercise this right only starting after the Minister's 545 day lock-up period after the expiration of or release from the 180-day lockup period. Each of Thintana Communications and the Government can demand any number of successive registrations, but no more than one in any calendar year, provided that Thintana Communications is entitled to two such registrations prior to the Government becoming entitled to demand any registrations. In addition, both Thintana Communications and the Government have the right to have their ordinary shares registered or sold in a listed public offering any time that Telkom or any other person seeks registration of, or a listed public offering for, Telkom's issued and outstanding ordinary shares.
Pursuant to the registration rights agreement, in the event that either the Government or Thintana Communications exercise its right to include shares held by it in a JSE public offering or US registration of Telkom shares that is sought by Telkom or by any other person, Telkom would be required to bear and pay all expenses incurred in connection with such offering or registration, including all registration, listing and filing and qualification fees, as well as underwriting discount and commissions. However, in the event that either the Government or Thintana Communications exercise its right to demand Telkom to effect a JSE public offering or US registration of ordinary shares held by it, Telkom would be required to bear and pay all expenses incurred in connection with registration, listing and filing or qualifications, however, certain fees relating to such registration or listing shall be borne by the relevant shareholders selling shares in proportion to the number of shares issued or sold. In that case, underwriting discounts and commissions will be borne by each relevant party based on the number of shares issued or sold by that party. Telkom is required to indemnify certain parties, including the selling shareholders and the underwriters and their respective directors, officers, employees and agents against certain losses in connection with such public offering or registration.
Relationship with the Government of the Republic of South Africa
The Government of the Republic of South Africa is Telkom's largest shareholder and is responsible for the telecommunications industry policy in the Republic of South Africa. The Ministry of Communications has the most direct role in our business. However, we have interactions with several other Ministries, including the Ministry of Finance for matters relating to taxation, the Ministry of Labour for matters relating to employment and the Ministry of Trade and Industry for matters relating to the communications industry.
198
The Government of the Republic of South Africa as regulator
Ministry of Communications
The Ministry of Communications has a number of roles that, directly or indirectly, affect us:
- •
- The Ministry of Communications represents the Government of the Republic of South Africa as Telkom's shareholder. The Minister has the powers and duties conferred on a shareholder of a public limited liability company by South African law, Telkom's articles of association and the shareholders' agreement between the Government and Thintana Communications.
- •
- The Ministry is responsible for the development of telecommunications policy and for proposing legislation to implement such policy, subject to supervision by the Cabinet of the Republic of South Africa. The Ministry is also responsible for administering the Telecommunications Act, 103 of 1996, and the Independent Communications Authority of South Africa Act, 13 of 2000.
The Ministry has the following primary powers under the Telecommunications Act, 103 of 1996:
- •
- it may issue policy directives to ICASA, binding it to perform its functions under the Telecommunications Act, 103 of 1996, in accordance with such policy directives;
- •
- any regulation made by ICASA needs to be approved and published by the Ministry, which may reject such approval, before it becomes valid and enforceable; and
- •
- the Ministry has the sole power to approve the grant of any license for a public switched telecommunications service, a national long distance telecommunications service, an international telecommunications service or a mobile telecommunications service.
ICASA
ICASA is the regulatory body for the telecommunications and broadcasting industries. ICASA derives its powers from the Independent Communications Authority of South Africa Act, 13 of 2000, and, with respect to telecommunications, from the Telecommunications Act, 103 of 1996. ICASA serves as the primary regulatory and licensing authority for the South African telecommunications and broadcasting industries, except for specific licenses that can only be granted by the Minister of Communications.
ICASA's primary powers under the Telecommunications Act are to:
- •
- conduct public inquiries in any matter relevant to the achievement of the objectives of the Telecommunications Act or to the performance of its functions in terms of the Telecommunications Act;
- •
- plan, control and manage the radio frequency spectrum and license its usage;
- •
- make recommendations to the Minister of Communications on the granting of telecommunication licenses for which the Minister of Communications has issued an invitation to apply and, in all other cases grant and issue telecommunication licenses;
- •
- make regulations as provided for in the Telecommunications Act, subject to ratification by the Minister of Communications;
- •
- approve, amend or reject agreements entered into by telecommunications licensees relating to interconnection or the leasing of telecommunications facilities, in accordance with the relevant regulations; and
- •
- investigate and adjudicate alleged contraventions of the Telecommunications Act, regulations or license conditions by licensees and, where appropriate, impose sanctions provided in the Telecommunications Act.
199
Public Finance Management Act
Telkom is required to report certain aspects of its business and operations, such as its corporate and business plans, to the Minister of Communications in her capacity as executive authority of Telkom pursuant to the Public Finance Management Act, 1 of 1999. Telkom has obtained a temporary exemption from certain provisions of the Public Finance Management Act, 1 of 1999 until November 2004 and submitted an application for an exemption from the provisions of the PFMA for another three years. Telkom submitted an application to the National Treasury to motivate amending the Public Finance Management Act so as to exclude companies listed on the JSE, such as Telkom, from the provisions of the Act while such companies remain so listed. See Item 3. "Key Information—Risk Factors—Risks Related to Regulatory and Legal Matters—If Telkom is required to comply with the provisions of the South African Public Finance Management Act, 1 of 1999, or PFMA, Telkom could incur increased expenses and its net profit could decline and compliance with the PFMA could result in the delisting of Telkom's ordinary shares and ADSs from the JSE and the New York Stock Exchange."
The Government of the Republic of South Africa as a customer
The departments and agencies of the Government of the Republic of South Africa in the aggregate comprise one of our largest customers. Generally, we deal with the various departments and agencies of the Government as separate customers, and the provision of services to any one department or agency does not constitute a material part of our revenues. Legislation has been enacted to centralize all procurement by the Government through one agency. We estimate that in the year ended March 31, 2004, our overall operating revenue from all departments and agencies of the Government, excluding Government owned parastatal companies, amounted to approximately 9% of our total fixed-line revenue, excluding directory services and other revenue. If the Government transfers some or all of its business to other operators, our operating revenue and net profit could decline.
The Government of the Republic of South Africa guarantees
Pursuant to Section 35 of the South African Exchequer Act, 66 of 1975, the Government of the Republic of South Africa guaranteed Telkom's borrowings incurred prior to 1991. As of March 31, 2004, R3.9 billion of our total indebtedness of R17.2 billion was guaranteed by the Government of the Republic of South Africa.
Relationship with Vodacom and Related Transactions
Vodacom Joint Venture Agreement
We acquired a 50% equity interest in Vodacom in 1993. Our rights as a shareholder of Vodacom are governed by a joint venture agreement, which was entered into on March 29, 1995, among Telkom, Vodafone, VenFin, Vodacom and other related parties.
Governance
The Vodacom joint venture agreement sets the number of directors of the board of directors of Vodacom at a minimum of twelve. Telkom has the right to appoint four directors, Vodafone has the right to appoint three directors, VenFin has the right to appoint one director and the remaining four directors are appointed by shareholders holding 10% or more of the issued shares of Vodacom who are a party to the joint venture agreement. Currently, the only shareholders holding beneficially 10% or more of the issued shares in Vodacom are Telkom, Vodafone and VenFin and the four board members appointed by Telkom and these shareholders are senior management of Vodacom.
200
Under the Vodacom joint venture agreement, the Vodacom board was required to establish a directing committee and delegate all its power, functions and authority to act on behalf of Vodacom to this committee. This authority cannot be revoked without the prior written consent of the shareholders holding 10% or more of the issued shares of Vodacom. The directing committee comprises all directors appointed to Vodacom's board by shareholders holding 10% or more of the issued shares of Vodacom. Currently, the directing committee consists of eight members comprising four directors appointed by Telkom, three directors appointed by Vodafone and one director appointed by VenFin.
The unanimous written agreement of those shareholders holding 10% or more of the issued shares of Vodacom is required for, among other things, the following consensus matters prior to Vodacom or any of its subsidiaries that are a party to the joint venture agreement taking any of the following actions:
- •
- changing the nature of or discontinuing its business;
- •
- disposing of a material part of assets, shares or claims against its subsidiaries;
- •
- making material acquisitions, merging with another company or entering into a change of control transaction;
- •
- altering or affecting its capital structure, including the issuance of any shares, the granting of options or the issue of convertible debentures;
- •
- proposing any special resolution;
- •
- altering its dividend policy;
- •
- incurring certain interest bearing debt which exceeds 50% of the consolidated shareholders' funds;
- •
- establishing any employee bonus or share incentive scheme;
- •
- appointing or removing any director to or from its board of directors, otherwise than in accordance with the joint venture agreement;
- •
- entering into any agreement with any of its shareholders or affiliates;
- •
- agreeing to any material alteration of its rights flowing from any license held by it or its subsidiaries enabling such companies to do their business;
- •
- approving or amending the business plan of Vodacom; and
- •
- appointing or removing the chairperson of the board or chief executive officer.
If the shareholders holding 10% or more of the issued shares of Vodacom fail to reach agreement on an above consensus matter, they are required to exercise all the powers that they have to ensure the consensus matter is not consummated. Should any dispute arise between the shareholders holding 10% or more of the issued shares of Vodacom regarding the failure of those shareholders to reach consensus, the dispute is to be referred for determination to the chairperson of those shareholders at the request of any shareholder holding 10% or more of the issued shares of Vodacom. If the chairperson fails to reach agreement on the consensus matter in question, each shareholder is entitled to enforce any rights through any competent court.
Pursuant to the Vodacom joint venture agreement, all members of the directing committee are required to agree on certain matters and, in the event of disagreement, the issue is treated as a consensus matter requiring the unanimous written consent of those shareholders holding 10% or more of the issued shares of Vodacom. The following matters require unanimous approval:
- •
- the approval or amendment of any subsidiary company business plans;
201
- •
- expenditures that are in excess of 10% of total budgeted expenditures;
- •
- non-budgeted capital expenditures that are in excess of 5% of the consolidated shareholders' funds;
- •
- the encumbrance of any assets or the issuance of guarantees where the liability secured is in excess of the lower of 5% of the consolidated shareholders' funds or R10 million;
- •
- any agreement with any shareholder of Vodacom; and
- •
- the appointment of the company secretary.
The approval of at least six directors appointed to the directing committee is required to take action with respect to:
- •
- the approval or adoption of the terms and conditions and any amendments to the interconnect and transmission agreements concluded with Telkom;
- •
- the setting or adjustment of tariffs; and
- •
- the approval of terms and conditions of supply and associated agreements with the suppliers of infrastructure.
Non-competition
Each party to the Vodacom joint venture agreement has agreed that neither it nor its affiliates will form a similar joint-venture relationship, or invest in any competitive business in the Republic of South Africa. This restraint lapses with respect to each party two years after the date such party ceases to be a shareholder of Vodacom or upon termination of the joint venture agreement.
In addition, each party to the Vodacom joint venture agreement has agreed that it will not own, manage or otherwise become engaged in any GSM mobile telecommunications entity or analogue system or otherwise participate in any mobile telecommunications activities in any African country, a major portion of which is situated below the equator, unless the party proposing to engage in such activity first offers Vodacom the opportunity to pursue such activity and Vodacom declines. Any decision by Vodacom to become involved in a GSM or analogue system in this territory requires the written consent of those shareholders holding 10% or more of the issued shares of Vodacom.
Right of first offer
If any Vodacom shareholder that is a party to the joint venture agreement wishes to sell any of the shares held by it, it must offer to sell such shares and an equivalent portion of its claims on loan accounts in Vodacom to the other parties to the joint venture agreement. If none of the non-transferring parties accepts such an offer to purchase all of the shares and claims offered on the terms in the notice, then the selling shareholder has the right to sell the shares and an equivalent portion of its claims to a third party at a price not lower than the price, and upon the terms, set forth in the seller's original offer.
Loan agreement
Telkom was a party to a loan agreement, dated as of March 29, 1995, with Vodafone Holdings SA (Proprietary) Limited, a subsidiary of Vodafone, VenFin Finansiële Beleggings Limited, a subsidiary of VenFin, and Vodacom. Under this agreement Telkom and the subsidiaries of Vodafone and VenFin agreed to lend and advance to Vodacom, in proportion to each of their respective shareholdings, R1.08 billion or such higher amount as was agreed upon. The total capital amount outstanding to Telkom under this loan was R460 million as of March 31, 2003. This loan bore interest at a rate equal to the prime lending rate of Vodacom's bankers from time to time plus 2%. The average effective
202
interest rate was 18.74% and 18.35% in the year ended March 31, 2004 and 2003, respectively. The largest amount outstanding during the period was R460 million. Vodacom repaid R460 million outstanding on the loan and all interest due on June 30, 2003.
Other related transactions with Vodacom
We market and sell our residential products through our customer call center, customer service branches, mobile customer service branches, kiosks, the South African Post Office, independent distributors and vendors and through telemarketing.
Other Related Transactions
Mr. Peter Moyo, one of Telkom's board members, holds 1,000 ordinary shares of R0.01 in Old Mutual Alternative Risk Transfer Ltd as a nominee of Old Mutual South Africa Limited, one ordinary share of R0.01 in Old Mutual Health Insurance Ltd as a nominee of Old Mutual South Africa Ltd, and one ordinary share of N$1.00 in Old Mutual Unit Trust Management Company Namibia Ltd as a nominee of Old Mutual (Namibia) Ltd. Old Mutual holds 16.7 million shares in Telkom SA Limited. He is also a board member of Old Mutual.
Some of our directors and senior management beneficially own shares in our strategic equity investors, which in the aggregate represent less than an indirect 1% beneficial interest in Telkom.
Mr. Tlhalefang Sekano, the employee representative on Telkom's board, is a member of the board of directors of Ucingo Investments which held 3% of the ordinary shares of Telkom until September 17, 2003, when it was sold, and is also the chairperson of Letlapa Security and a director of Telesafe Security. Letlapa Security owns an interest in Telesafe Security, a security company which provides physical security to Telkom. Telkom paid R39.3 million to Telesafe Security in the year ended March 31, 2004 for these services. In addition, Letlapa Security had an option to purchase 10% of Rebserve Ltd., which together with Atkins Facilities Management, formed the joint venture, Total Facilities Management Company (Proprietary) Limited, which has been awarded a ten year contract expiring on March 31, 2011 to deliver facilities management services to Telkom's South African properties portfolio. Telkom paid R1.6 billion to TFMC in the year ended March 31 2004 for these services.
Ms. Nomazizi Mtshotshisa, Telkom's chairperson, serves on the board of directors of Admiral Industries (Proprietary) Limited, which has a contract to supply Telkom with Beslin Sethuni workwear. Telkom paid R5.4 million to Beslin Sithunzi Workwear in the year ended March 31, 2004 for these services.
Mr. Charles Valkin, one of Telkom's board members, is a senior partner with the South African law firm of Bowman Gilfillan Inc., which provides legal services to Telkom from time to time. Telkom paid R90,000 to Bowman Gilfillan Inc. in the year ended March 31, 2004 for these services.
Messrs. Shawn McKenzie, Jonathan P. Klug Sr., Charles Valkin, Chian Khai Tan and Tan Sri Dato'Ir Muhammad Radzi Mansor, five of Telkom's board members, are Thintana Communications' representatives on Telkom's board of directors. In addition, a number of our senior management are appointed through Thintana Communications. See Item 7. "Major Shareholders and Related Party Transactions" for a discussion of the arrangements between Thintana Communications and us and the fees Telkom paid to Thintana Communications for strategic services in the year ended March 31, 2004. SBC Communications paid Bowman Gilfillan Inc. a total of R380,107 in fees during the year ended March 31, 2004 for Mr. Valkin's services as a director of Telkom.
Messrs. Mtshotshisa, Menell, Moyo, Sekano and Vilakazi, five of Telkom's board members, are the Government's representatives on Telkom's board of directors.
203
CONSOLIDATED FINANCIAL STATEMENTS AND
OTHER FINANCIAL INFORMATION
Consolidated Financial Statements
Reference is made to Item 18 of this annual report for this information.
Legal Proceedings
On May 7, 2002, the South African Value-added Network Services Providers' Association, or VANS Association, lodged a formal complaint with the Competition Commission under the South African Competition Act, 89 of 1998, alleging that Telkom was abusing its leading position in contravention of the Competition Act, 89 of 1998, and that it was engaged in price discrimination. The Competition Commission found, among other things, that several aspects of Telkom's conduct contravened the Competition Act, 89 of 1998, and referred certain of the complaints to the Competition Tribunal for adjudication. The complaints deal with Telkom's alleged refusal to provide telecommunications facilities to certain VANS providers to construct their networks, refusal to lease access facilities to VANS providers, provision of bundled and cross-subsidized competitive services with monopoly services, discriminatory pricing with regard to leased line services and alleged refusal to peer with certain VANS providers. Telkom has brought an application in the South African High Court challenging the Competition Tribunal's jurisdiction to adjudicate this matter. These matters and the amount of Telkom's liability are not expected to be finalized within the next 2 years. If these complaints are upheld, however, Telkom could be required to cease these practices and fined an amount of up to 10% of Telkom's South African turnover or be ordered to divest itself of the relevant business. Telkom is currently unable to predict the amount that it may eventually be required to pay. If Telkom is required to cease these practices, divest itself of the relevant business or pay significant fines, Telkom's business and financial condition could be materially adversely effected and its revenue and net profit could decline.
Telcordia instituted arbitration proceedings against Telkom in March 2001 before a single arbitrator of the International Court of Arbitration, operating under the auspices of the International Chamber of Commerce, which is seated in Paris, France. The seat of the arbitration is in Johannesburg, South Africa. Telcordia is seeking to recover approximately $130 million for monies outstanding and damages, plus costs and interest at a rate of 15.5% per year. The arbitration proceedings relate to the cancellation of an agreement entered into between Telkom and Telcordia during June 1999 for the development and supply of an integrated end-to-end customer assurance and activation system by Telcordia. In September 2002, a partial award was issued by the arbitrator in favor of Telcordia. Telkom subsequently filed an application in the South African High Court to review and set aside the partial award. On November 27, 2003, the South African High Court set aside the partial award and issued a cost order in favor of Telkom. On May 3, 2004, the South African High Court dismissed an application by Telcordia for leave to appeal and ordered Telcordia to pay the legal costs of Telkom. Telcordia also petitioned the United States District Court for the District of Columbia to confirm the partial award, which petition was dismissed, along with a subsequent appeal. As a result, the Telcordia dispute has been referred back to arbitration. The dispute between Telkom and Telcordia and the amount of Telkom's possible liability are not expected to be finalized until late 2004 or early 2005. Telkom is currently unable to predict the amount that it may eventually be required to pay Telcordia, if any, and has reversed all of its provisions for estimated liabilities, including interest and legal fees. If Telcordia recovers substantial damages from Telkom, Telkom would be required to fund such payments from cash flows or drawings on its existing credit facilities, which could cause its indebtedness to increase and its net profit to decline.
204
As competition continues to increase in our fixed-line business, we expect that in the normal and ordinary course of our business we will become involved in an increasing number of disputes regarding the legality of services and products provided by us and/or by third parties. These disputes may range from court lawsuits to complaints laid by or against us with various regulatory bodies. For instance, Telkom is involved in court litigation proceedings against various providers of least cost routing technology that enables fixed-to-mobile calls from corporate branch exchanges to be transferred directly to mobile networks. We cannot, however, predict the outcome of this matter and it is difficult to assess the additional revenue which may accrue to Telkom if it is successful in the matter. In a related proceeding, one of these providers, on April 17, 2003, filed a complaint and launched interim proceedings against Telkom with the South African competition authorities. The complaint and proceedings relate to certain discount plans that Telkom has in place or is negotiating with some of its business customers. The complainant alleges that Telkom is specifically targeting the complainant's customers, who would otherwise be using the least cost routing technology provided by the complainant and that Telkom's actions are exclusionary and based on predatory pricing. Telkom opposes the relief sought. If, however, the complainant is successful, Telkom may be ordered to cease and desist from offering these discount plans or could be fined an amount of up to 10% of Telkom's South African turnover or be ordered to divest itself of the relevant business.
We are parties to various additional proceedings and lawsuits in the ordinary course of our business, which our management do not believe will have a material adverse impact on us.
Dividend Policy
For a discussion of Telkom's dividend policy, see Item 3. "Key Information—Dividends and Dividend Policy."
Except as disclosed elsewhere in this annual report, there have been no significant changes in Telkom's business since March 31, 2004, the date of the annual financial statements included in this annual report.
205
Markets
Telkom's ordinary shares are listed on the JSE Securities Exchange, South Africa in the "Telecommunications Services" sector under the symbol "TKG" and ISIN Code "ZAE000044897" and its ADSs are listed on the New York Stock Exchange, Inc. under the symbol "TKG." The ADSs are evidenced by American Depositary Receipts, or ADRs, issued by The Bank of New York, as depositary, under the Deposit Agreement, dated as of March 3, 2003, among Telkom, The Bank of New York, as depositary, and the registered and beneficial owners from time to time of ADRs. The following table sets forth, for the periods indicated:
- •
- the reported high and low market quotations as reported by the JSE; and
- •
- the reported high and low sales prices on the NYSE Composite Tape of the ADSs:
| | JSE (ZAR per Ordinary Share) | NYSE (USD per ADS) | ||||||||
|---|---|---|---|---|---|---|---|---|---|---|
| | High | Low | High | Low | ||||||
| 2003 Financial Year(1) | 30.75 | 27.80 | 14.78 | 13.65 | ||||||
| 2004 Financial Year | 78.80 | 29.55 | 49.60 | 14.85 | ||||||
| First Quarter | ||||||||||
| April 2003 | 34.75 | 29.10 | 18.25 | 14.68 | ||||||
| May 2003 | 34.00 | 30.50 | 17.70 | 15.58 | ||||||
| June 2003 | 38.75 | 31.30 | 20.80 | 15.75 | ||||||
| Second Quarter | ||||||||||
| July 2003 | 45.00 | 38.80 | 24.35 | 21.20 | ||||||
| August 2003 | 43.02 | 40.00 | 23.44 | 21.46 | ||||||
| September 2003 | 44.07 | 40.30 | 25.34 | 22.15 | ||||||
| Third Quarter | ||||||||||
| October 2003 | 53.50 | 43.30 | 30.90 | 24.90 | ||||||
| November 2003 | 65.30 | 53.20 | 40.50 | 30.75 | ||||||
| December 2003 | 70.51 | 62.80 | 43.10 | 37.70 | ||||||
| Fourth Quarter | ||||||||||
| January 2004 | 75.01 | 62.50 | 44.90 | 35.00 | ||||||
| February 2004 | 77.60 | 67.25 | 45.05 | 40.85 | ||||||
| March 2004 | 78.80 | 68.45 | 49.60 | 41.60 | ||||||
| 2005 Financial Year | ||||||||||
| April 2004 | 87.00 | 75.50 | 54.80 | 43.75 | ||||||
| May 2004 | 79.40 | 72.50 | 47.26 | 42.45 | ||||||
| June 2004 (through June 18) | 85.80 | 73.49 | 52.75 | 45.25 | ||||||
- (1)
- From March 4, 2003, the date the ordinary shares commenced trading on the JSE and the ADSs commenced trading on the NYSE through March 31, 2004.
On June 18, 2004, the last trading price of the ordinary shares as reported by the JSE was R76.99 per share and the last trading price of the ADSs on the NYSE Composite Tape was $48.40.
Item 10. Additional Information
MEMORANDUM AND ARTICLES OF ASSOCIATION
Set forth below is a summary of material information relating to Telkom's share capital, including summaries of certain provisions of Telkom's memorandum and articles of association, the South African
206
Companies Act, 61 of 1973, and the Listings Requirements of the JSE. This summary is qualified in its entirety by the provisions of Telkom's memorandum and articles of association and by the applicable provisions of South African law and the Listings Requirements of the JSE. You should refer to the full text of Telkom's new memorandum and articles of association, which is incorporated by reference as an exhibit to this annual report.
General
Telkom was incorporated on September 30, 1991, as a public limited liability company registered under the South African Companies Act with registration number 1991/005476/06. Telkom is governed by its memorandum and articles of association and the provisions of the South African Companies Act, 61 of 1973. Telkom is also subject to the Listings Requirements of the JSE and the New York Stock Exchange.
Telkom's main object and business is to supply telecommunications, broadcasting, multimedia technology and information services to the general public in the Republic of South Africa.
Share Capital
Pursuant to a special resolution passed at a general meeting of Telkom held on January 16, 2003, Telkom's authorized and issued share capital was, with effect from March 4, 2003, altered by the conversion of one ordinary share held by the Government into one class A ordinary share with a par value of R10 and one ordinary share held by Thintana Communications into one class B ordinary share with a par value of R10. As a result, as of March 31, 2004, the date of Telkom's most recent balance sheet included in this annual report, and as of the date of this annual report, Telkom's authorized share capital was R10,000,000,000, divided into 999,999,998 ordinary shares with a par value of R10 each, one class A ordinary share with a par value of R10 and one class B ordinary share with a par value of R10, and its issued share capital was R5,570,318,190, divided into 557,031,817 ordinary shares with a par value of R10 each, one class A ordinary share with a par value of R10 and one class B ordinary share with a par value of R10. Only ordinary shares are listed on the JSE and ADSs listed on the New York Stock Exchange only represent ordinary shares. The class A and B ordinary shares are not listed on any stock exchange.
Before the alteration of Telkom's authorized and issued share capital on March 4, 2003, Telkom's authorized share capital was R10,000,000,000, divided into 1,000,000,000 ordinary shares with a par value of R10 each, and its issued share capital was R5,570,318,190, divided into 557,031,819 ordinary shares with a par value of R10 each and its share premium was R2,723,000,000. No alterations to Telkom's share capital occurred during the five years preceding the date of this annual report, other than the alteration of Telkom's authorized and issued share capital on March 4, 2003.
All of Telkom's issued and outstanding ordinary shares rank equally with each other and are fully paid and not subject to calls for additional payments of any kind. Except as specified in Telkom's articles of association, selected provisions of which are described in this annual report, the class A ordinary share and the class B ordinary share rank equally with the ordinary shares.
In March 2003, the government granted share options to purchase up to 11,140,636 of its ordinary shares, representing 2% of Telkom's issued and outstanding ordinary share capital, through the Diabo Share Trust. The exercise price is R33.81 per share. The share options are excercisable in four equal tranches. Two tranches were exercised in September 2003 and March 2004. The remaining share options are exercisable during March 4, 2005 to March 10, 2005 and March 6, 2006 to March 10, 2006.
207
Significant Shareholder
Pursuant to Telkom's articles of association, a "significant shareholder" is the registered holder of the class A ordinary share or the class B ordinary share and, in addition, of at least 15% of the issued ordinary shares, which percentage will be adjusted from time to time to reflect the dilutive effect of any issuance of new ordinary shares by Telkom after March 4, 2003, provided that the percentage will not be lower than 10%. A significant shareholder has certain specific rights in terms of Telkom's memorandum and articles of association as more fully described below. As of the date hereof, the Government and Thintana Communications are the only significant shareholders.
If, by March 4, 2011, the class A ordinary share and class B ordinary share have not otherwise been converted into ordinary shares under the terms of Telkom's articles of association, they will automatically be so converted and the rights of the Government and Thintana Communications as holders of the class A ordinary share and class B ordinary share, respectively, including their rights as significant shareholders, will be terminated under Telkom's articles of association, but not under the shareholders' agreement.
Dividends
Telkom's shareholders, in a general meeting, or its board, from time to time, may declare a dividend to be paid to the registered holders of one or more classes of shares; provided that Telkom's shareholders may not declare a greater dividend in a general meeting than is recommended by the board and provided further that no dividend may be declared to a holder of the class A ordinary share or class B ordinary share, unless the same dividend is declared to holders of all ordinary shares. In addition, for so long as either the Government or Thintana Communications is a significant shareholder, the declaration or distribution of dividends or other distributions must be approved by the board as a reserved matter. See Item 6. "Directors, Senior Management and Employees—Directors and Senior Management—Reserved Matters."
Pursuant to Telkom's articles of association, dividends on ordinary shares will not bear interest. Dividends are declared payable to shareholders registered as such on a date subsequent to the date of publication of the announcement of the declaration of the dividend. This date may not be sooner than 14 days after the date of such publication. All unclaimed dividends may be invested or otherwise utilized by the board for Telkom's benefit until claimed, provided that dividends unclaimed after a period of three years shall be forfeited. Forfeited dividends revert to Telkom or its assigns.
Any dividend or other sum payable in cash to a shareholder may be transmitted by ordinary post to the address of the shareholder recorded in the register or any other address the shareholder may previously have given to Telkom in writing or by electronic transfer to such bank account as the shareholder may previously have given to Telkom in writing. Telkom will not be responsible for any loss in transmission. Subject to the approval of shareholders in a general meeting, any dividend may be paid and satisfied, either wholly or in part, by the distribution of specific assets as the board may determine and direct at the time of declaring the dividend.
Any cash dividends paid by Telkom will be declared in South African Rands. The shareholders in a general meeting, or the board of directors, may at the time of declaring a dividend, stipulate that the dividend be paid to shareholders having registered addresses outside South Africa or who have given written instructions requesting payment at addresses outside South Africa, shall be paid in a currency other than South African currency. Holders of ADSs on the relevant record date will be entitled to receive any dividends payable in respect of the ordinary shares underlying the ADSs, subject to the terms of the deposit agreement. Cash dividends paid in Rands will be converted by the depositary to Dollars and paid by the depositary to holders of ADSs, net of conversion expenses of the depositary, in accordance with the deposit agreement, a copy of which is incorporated by reference to Exhibit 2.2 to this annual report.
208
Voting Rights
Subject to any rights or restrictions attached to any class of shares, every shareholder present at a general meeting in person, by proxy or by representation will, on a show of hands, have one vote only and, in the case of a poll, that proportion of the total votes which the aggregate amount of the nominal value of the shares held by that shareholder bears to the aggregate of the nominal value of all the shares issued by Telkom. For a description of shareholders' rights to request a poll, see Item 10. "Additional Information—Memorandum and Articles of Association—General Meetings of Shareholders." A shareholder is entitled to appoint a proxy to attend, speak and vote at any meeting on the shareholder's behalf. The proxy need not be a shareholder of Telkom.
Issue of Additional Shares and Pre-emptive Rights
Subject to the provisions of the South African Companies Act, 61 of 1973, the JSE Listings Requirements and any rights or restrictions attached to any class of shares, shareholders in a general meeting may authorize the board to allot and issue shares or grant options over unissued shares to such persons at such times, and generally on such terms and conditions, and for such consideration, whether payable in cash or otherwise, as it may decide. Telkom's shareholders granted to the board the authority to allot and issue up to 22,281,272, representing 4% of Telkom's issued ordinary share capital, ordinary shares to the participants under Telkom's conditional share plan in a general meeting held on January 27, 2004. For so long as either the Government or Thintana Communications is a significant shareholder, there may not be any increase or reduction in Telkom's issued share capital or that of any of its subsidiaries without the authorization of the board as a reserved matter. See Item 6. "Directors, Senior Management and Employees—Directors and Senior Management—Reserved Matters." Any changes in Telkom's capital structure is also a shareholder reserved matter under the new shareholders' agreement as described more fully in Item 7. "Major Shareholders and Related Party Transactions—Related Party Transactions—Shareholder Arrangements—Shareholders' Agreement." No change in the number of issued class A ordinary shares or class B ordinary shares may be made without the approval of the Government and Thintana Communications, respectively.
The Listings Requirements of the JSE require Telkom's unissued ordinary shares to be offered first to existing shareholders in proportion to their holdings of ordinary shares unless these shares are issued for the acquisition of assets. The shareholders may, however, grant either a general approval in a general meeting authorizing the directors to issue ordinary shares for cash or a specific approval for a particular issue of ordinary shares, without first offering them to existing shareholders. Issues of ordinary shares for cash pursuant to a general approval in the aggregate in any one financial year may not exceed 15% of the issued share capital of that class. The maximum discount at which securities may be issued under a general approval is 10% of the weighted average trading price of those securities over 30 business days on the JSE prior to the date that the price of the issue is determined or agreed by the directors. A specific approval to issue ordinary shares is subject to, among other things, the disclosure of the number, or maximum number, of securities to be issued and disclosure of whether the discount at which the securities are to be issued is unlimited and, if not, the limit. A general and specific approval are each subject to the requirement of approval of a 75% majority of votes cast by shareholders present or represented by proxy at a general meeting, excluding controlling shareholders and various other associated parties, in the case of a specific approval. The Government and Thintana Communications may be regarded as controlling shareholders for these purposes. As of the date hereof, no general or specific approval authorizing the directors to issue shares for cash has been granted to the board by the shareholders of Telkom.
Subject to the South African Companies Act, 61 of 1973, the directors or Telkom's shareholders may resolve in a general meeting to utilize all or any part of Telkom's reserves, or any amount available for distribution as a dividend and not required for the payment or provision of dividends on preference
209
shares, to pay for Telkom's authorized but unissued shares to be issued as fully paid capitalization shares to shareholders entitled to receive such distributions as a dividend.
Transfer of Shares
Telkom's articles of association do not contain any restriction on the right to transfer ordinary shares, except as described in this Item "—Major Shareholders and Related Party Transactions." Ordinary shares may be transferred by an instrument in writing in any usual common form or in such other form as the board of directors may approve if such transfer does not arise pursuant to a trade of such shares on the JSE. The transferor will be deemed to remain the holder of the ordinary shares until the name of the transferee is entered in Telkom's share register in respect of the transferred ordinary shares. Every instrument of transfer presented for registration must be accompanied by the certificate representing the ordinary shares to be transferred and/or such other evidence Telkom may require to prove the title of the transferor or the transferor's right to transfer the ordinary shares.
Although shareholders are entitled to hold their ordinary shares in certificated form, ordinary shares may only be traded on the JSE if they have been dematerialized through Share Transactions Totally Electronic Limited, or STRATE. A dematerialized share is not evidenced by a share certificate and may not be transferred by an instrument in writing, but is represented and transferred by means of electronic book entries.
The Minister of Communications, which holds the class A ordinary share on behalf of the Government, may transfer the class A ordinary share only to other ministries and governmental departments of the Republic of South Africa and only if the Minister transfers the class A ordinary share together with as many ordinary shares as would be sufficient to constitute the transferee a significant shareholder without taking into account any other ordinary shares already held by or on behalf of the transferee, and only after consultation with Thintana Communications. If so transferred, the transferee will acquire the rights of the Government as the holder of the class A ordinary share. If at any time the Government ceases to hold the class A ordinary share, the class A ordinary share will be converted into an ordinary share by operation of Telkom's articles of association.
The class B ordinary share may be transferred if it is transferred together with as many ordinary shares as would be sufficient to constitute the transferee a significant shareholder without taking account any other ordinary shares already held by or on behalf of such transferee, and only after consultation with the Government. The first transferee who becomes a significant shareholder pursuant to such transfer will acquire the rights Thintana Communications enjoyed as a significant shareholder, but certain of the reserved matters will fall away on the second transfer of such shares. See Item 6. "Directors, Senior Management and Employees—Directors and Senior Management—Reserved Matters." If Thintana Communications, as the holder of the class B ordinary share, ceases to hold at least 5% of the issued and outstanding shares in the capital of Telkom, then the class B ordinary share will be converted into an ordinary share. If the class B ordinary share is converted into an ordinary share, the class A ordinary share will automatically be converted into an ordinary share.
The class A ordinary share and class B ordinary share will automatically be converted into ordinary shares on March 4, 2011 if those shares have not otherwise been converted under Telkom's articles of association before that date. See "—Significant shareholder."
There are other restrictions on the Government and Thintana Communication's ability to transfer their shares. These restrictions are set out in Telkom's shareholders' agreement and described in Item 7. "Major Shareholders and Related Party Transactions—Related Party Transactions—Shareholder Arrangements—Shareholders' Agreement."
210
Disclosure of Interest in Shares
Pursuant to the South African Companies Act, 61 of 1973, registered shareholders are required at the end of every calendar quarter to disclose to the issuer the identity of each other person who has a beneficial interest in the shares held by the registered holder and the number and class of those shares. Moreover, an issuer of shares may, by notice in writing, require a person who is a registered holder of, or whom the issuer knows or has reasonable cause to believe, has a beneficial interest in, a share issued by the issuer to identify to the issuer the person on whose behalf a share is held. The addressee of the notice may also be required to give particulars of the extent of the beneficial interest held during the three years preceding the date of the notice. All issuers of shares are obliged to establish and maintain a register of the disclosures described above and to publish in their annual financial statements a list of the persons who hold beneficial interests equal to or in excess of 5% of the total number of shares of that class issued by the issuer together with the extent of those beneficial interests.
Register of Members
Telkom keeps a register of its members, being shareholders whose names have been included in this register, in South Africa. Telkom may keep a branch share register in any foreign country, subject to the approval of the South African Reserve Bank.
General Meetings of Shareholders
Telkom is required by the South African Companies Act, 61 of 1973, to hold an annual general meeting not later than nine months after the end of every financial year and within 15 months after the date of its last preceding annual general meeting. The 11th annual general meeting of Telkom was originally scheduled for August 27, 2003, but due to information omitted on the notice to shareholders and a new JSE Listing Requirement, permission was granted from the Registrar of Companies to hold the Annual General Meeting by no later than February 2004. The meeting was held on January 27, 2004. The board may convene a general meeting whenever it thinks fit and must do so on the request of 100 shareholders or of shareholders holding, at the date of request, not less than one-twentieth of shares carrying voting rights.
Telkom is required by the South African Companies Act, 61 of 1973, to provide at least 21 "clear days" intervening notice for annual general meetings and for general meetings at which special resolutions are proposed, and at least 14 "clear days" intervening notice for all other general meetings. "Clear days" exclude the date on which notice is given, span the date on which the meeting is held, weekends and public holidays.
A holder of shares may by notice require Telkom to record an address within South Africa which shall be deemed to be his or her address for the purpose of the service of notices. Telkom's articles of association require notices of general meetings to be in writing and to be given or served on any shareholder either by sending the notice, or a message advising that the notice is available on a website and containing the address of such website by electronic mail or telefacsimile to an electronic mail address or telefacsimile number notified to Telkom for this purpose. Alternatively, the written notice may be given by delivery in person or by sending it through the post, properly addressed, to a shareholder at his or her address shown in the register of shareholders or to a beneficial holder of Telkom's shares at the address which has been disclosed to Telkom and recorded in its register of such disclosures. Notice may be given to any beneficial holder of Telkom's shares who has not disclosed his or her address, electronic mail address or telefacsimile number to Telkom, by publishing that notice or an advertisement that such notice is available on a website, in the South African Government Gazette and any newspaper determined by Telkom's directors. Any notice to shareholders must simultaneously be given to the secretary or other suitable official of any recognized stock exchange on which Telkom's shares are listed in accordance with the requirements of the stock exchange. Every notice shall be
211
deemed to have been received on the date on which it is so delivered and, if it is sent by post, on the day on which it is posted. If it is published in the South African Government Gazette or if it is advertised in the Government Gazette, it is deemed to have been received on the date it appears in the Government Gazette. If it is sent by electronic mail or telefacsimile, it is deemed to have been sent on the day it is sent or transmitted.
No business may be transacted at any general meeting unless the requisite quorum is present when the meeting proceeds to business. A quorum is at least three shareholders present in person or, in the case of a shareholder which is a company, by representation, and entitled to vote, provided that no quorum will be constituted if the class A shareholder and class B shareholder are not duly represented. If within thirty minutes from the time appointed for the meeting a quorum is not present, the meeting will stand adjourned to the same day in the next week, or if that day is a South African public holiday or a Saturday or Sunday, the next succeeding day other than a South African public holiday, Saturday or Sunday, at the same time and place. The quorum at the adjourned meeting shall be three shareholders present in person or by representation. If a quorum at the initial meeting was not established because of the absence of the class A shareholder or class B shareholder, the presence of the absent shareholder is not required to establish a quorum at the adjourned meeting. In order to pass a special resolution, shareholders holding in the aggregate not less than one fourth of the total votes of all shareholders entitled to vote must be present in person or by proxy at the meeting.
At a general meeting, a resolution put to the vote will be decided by a show of hands unless a poll is demanded by:
- •
- the chairman of the meeting;
- •
- not less than five shareholders having the right to vote at such meeting; or
- •
- a shareholder or shareholders representing not less than one tenth of the total voting rights of all shareholders having the right to vote at the meeting or a shareholder or shareholders entitled to vote and holding in aggregate not less than one tenth of Telkom's issued share capital.
Subject to the rights of the Government and Thintana Communications as significant shareholders described in Item 7. "Major Shareholders and Related Party Transactions—Related Party Transactions—Shareholder Arrangements—Shareholders' Agreement," resolutions will be carried by a majority of the votes recorded at the meeting except in the case of a special resolution which must be passed either on a show of hands, by not less than three fourths of the number of Telkom's shareholders entitled to vote who are present in person, by proxy or by representation or, where a poll has been demanded, by not less than three fourths of the total votes to which the shareholders present in person, by proxy or by representation are entitled.
Annual Report and Accounts
Telkom's board is required to keep such accounting records and books of account as are prescribed by the South African Companies Act, 61 of 1973. Generally, no shareholder, other than a director, has any right to inspect any of Telkom's accounting record books, accounts or documents, except that for so long as Thintana Communications is a significant shareholder, it has the right, at its sole expense, to perform or have performed a financial and/or operations audit of Telkom and its subsidiaries.
The board is required, in respect of each of Telkom's financial years, to prepare annual consolidated financial statements and present them before the annual general meeting.
Pursuant to the Listings Requirements of the JSE, unaudited interim reports must be distributed to all shareholders within three months after the end of the first six months of Telkom's financial year.
Telkom's consolidated financial statements must, in conformity with IFRS, fairly present the state of affairs and business of Telkom and all of its consolidated subsidiaries at the end of the financial year
212
concerned and the profit or loss of Telkom and all of its consolidated subsidiaries for that financial year.
Changes in Capital
Telkom may from time to time by special resolution:
- •
- consolidate, divide or sub-divide all or any part of Telkom's issued or unissued capital;
- •
- increase or cancel all or any part of Telkom's unissued capital;
- •
- convert any of Telkom's shares, whether issued or not, into shares of another class;
- •
- convert all or any of Telkom's paid-up shares into stock and reconvert such stock into paid-up shares; or
- •
- convert any shares having a par value into shares having no par value andvice versa.
Telkom may from time to time reduce its issued share capital, share premium, stated capital, reserves and/or any capital redemption reserve fund with the approval of an ordinary resolution of Telkom's shareholders in a general meeting and with a resolution of Telkom's directors. Any increase or reduction in Telkom's issued share capital or that of any of Telkom's subsidiaries must be approved by directors as a reserved matter. See Item 6. "Directors, Senior Management and Employees—Directors and Senior Management—Reserved Matters." In addition, any change in Telkom's capital structure is a shareholder reserved matter under the shareholders' agreement, as described more fully in Item 7. "Major Shareholders and Related Party Transactions—Related Party Transactions—Shareholder Arrangements—Shareholders' Agreement," unless such power is capable of, and has been, delegated to Telkom's board by a resolution of the shareholders of Telkom.
Variation of Rights
Whenever Telkom's capital is divided into different classes of shares, the rights attached to any class of shares in issue may be varied, modified or abrogated by special resolution, provided that no variation that adversely affects those rights may be made without the written consent or ratification of the holders of three-fourths of the issued shares of that class or a resolution passed in the same manner as a special resolution at a separate general meeting of the holders of such shares.
The affirmative vote or consent of the Government and Thintana Communications, as the case may be, is required for any amendment, alteration or cancellation of any of the provisions of Telkom's memorandum and articles of association that would alter or change the powers, preferences or special rights of the class A ordinary share or class B ordinary share or the holder of the class A ordinary share or class B ordinary share, as the case may be, so as to affect either adversely. Telkom's memorandum and articles of association further require Telkom to obtain written consent from the Government before issuing any securities or amending any existing securities in a manner that would adversely affect the Government's right under a special condition set forth in Telkom's memorandum of association, including the creation of a new class of shares or the amendment of the rights attached to an existing class of shares to provide them with rights superior to or equal to or adversely affecting the rights of Government under this condition. This special condition provides that Telkom must obtain written consent from the Government before:
- •
- taking any action that would result in Telkom's ceasing to provide telecommunications services under its public switched telecommunications services license in the Republic of South Africa; or
- •
- disposing of assets, the effect of which would materially impair Telkom's ability to fulfill its obligation under its public switched telecommunications services license.
213
The rights conferred upon the holders of the shares of any class will be deemed not to be directly or indirectly adversely affected by the creation or issue of further shares ranking equally with them or the cancellation of any shares of any other class.
Distribution of Assets on Liquidation
If Telkom is liquidated, whether voluntarily or compulsorily, the assets remaining after the payment of all of Telkom's liabilities and the costs of winding-up shall be distributed among the shareholders in proportion to the numbers of shares held by them, subject to the rights of any shareholders to whom shares have been issued on special conditions and subject to Telkom's right to set-off unpaid capital or premium against the liability, if any, of shareholders. Furthermore, with the authority of a special resolution, the liquidator may divide among the shareholders, in specie or kind, the whole or any part of the assets, whether or not those assets consist of property of one kind or different kinds.
For so long as the Government and Thintana Communications are significant shareholders, any winding up or liquidation of Telkom must be authorized as a board reserved matter. See Item 6. "Directors, Senior Management and Employees—Directors and Senior Management—Reserved Matters." Any winding up or liquidation of Telkom is also a shareholder reserved matter under the shareholders' agreement as more fully described under Item 7. "Major Shareholders and Related Party Transactions—Related Party Transactions—Shareholder Arrangements—Shareholders' Agreement."
Purchase of Shares
The South African Companies Act, 61 of 1973, permits loans by a company to its employees, other than directors, for the purpose of purchasing or subscribing for shares of that company or of its holding company.
The procedure for acquisition by a company of its own shares is regulated both by the South African Companies Act, 61 of 1973, and the Listings Requirements of the JSE. The South African Companies Act, 61 of 1973, provides that a company may, by special resolution, if authorized by its memorandum and articles of association, approve the acquisition of its shares; provided that a company may not make any payment in whatever form to acquire any share issued by that company if there are reasonable grounds for believing that the company is or would, after the payment, be unable to pay its debts or if the consolidated assets of the company fairly valued would, after the payment, be less than the consolidated liabilities of the company. The South African Companies Act, 61 of 1973, also provides that:
- •
- a subsidiary may acquire up to a maximum of 10% in the aggregate of the number of issued shares of its holding company, or parent company; and
- •
- a company may make payments to its shareholders if authorized by its memorandum and articles of association, subject to the provisions referred to above relating to its ability to pay debts and solvency.
Under South African law and the Listings Requirements of the JSE, the shareholders in a general meeting may approve a specific acquisition by the company of its issued shares or grant the company a general authority to acquire its issued shares by way of a renewable mandate which is valid until the company's next annual general meeting, provided that such authority may not extend beyond 15 months from the date of the granting of the general authority. The general authority is subject to, among other things, the following:
- •
- the acquisition of ordinary shares must be on the "open market" of the JSE;
- •
- the number of ordinary shares that may be acquired pursuant to the general authority may not, in the aggregate, exceed 20% of Telkom's issued share capital in any one financial year; and
214
- •
- the ordinary shares may not be acquired at a price that is more than 10% above the weighted average of the market value of the ordinary shares for the five business days immediately preceding the date on which the acquisition is agreed.
At Telkom's annual general meeting held on January 27, 2004, the shareholders of Telkom granted Telkom, through a special resolution, the authority for Telkom or a subsidiary of Telkom to acquire Telkom's issued and outstanding ordinary share capital from time to time, upon such terms and conditions and in such amounts as the directors of Telkom and/or its subsidiaries may from time to time decide, but always subject to the Companies Act, 61 of 1973, as amended, and the listing requirements from time to time of the JSE, which general approval shall endure until the following annual general meeting of Telkom.
Directors
Pursuant to Telkom's articles of association, the Government and Thintana Communications, for so long as they hold the class A ordinary share and the class B ordinary share, respectively, are entitled to appoint directors based on the percentage of the issued ordinary shares owned by them as follows:
- •
- if either shareholder owns at least 25% of the issued ordinary shares, it has the right to appoint five directors, including two executive directors;
- •
- if either shareholder owns at least 20%, but less than 25% of the issued ordinary shares, it has the right to appoint four directors, including, in the case of Thintana Communications, two executive directors and, in the case of the Government, one executive director;
- •
- if either shareholder owns at least 15%, but less than 20% of the issued ordinary shares, it has the right to appoint three directors, including, in the case of Thintana Communications, two executive directors and, in the case of the Government, three non-executive directors;
- •
- if either shareholder owns at least 10%, but less than 15% of the issued ordinary shares, it has the right to appoint two directors, including, in the case of Thintana Communications, two executive directors and, in the case of the Government, two non-executive directors; and
- •
- if either shareholder owns at least 5%, but less than 10% of the issued ordinary shares, it has the right to appoint one director, including, in the case of Thintana Communications, one executive director and, in the case of the Government, one non-executive director.
Neither the Government nor Thintana Communications will have the right to appoint more than five directors, regardless of their share ownership.
The remaining directors, if any, other than Telkom's chief executive officer who is appointed by Telkom's board of directors, may be appointed by a general meeting. A general meeting is not entitled to fill a vacancy of a director appointed by the Government or Thintana Communications, as holders of the class A ordinary share and the class B ordinary share, respectively.
At each of Telkom's annual general meetings, at least one third of Telkom's directors appointed by a general meeting, excluding executive directors, directors appointed by the Government and Thintana Communications and any directors appointed by the directors after the conclusion of Telkom's preceding annual general meeting, are required to retire from office but are eligible for re-election. The directors to retire are those who have been longest in office or, as between directors appointed by a general meeting who have been in office for an equal length of time, in the absence of agreement, determined by lot. If, after such retirements, there would remain in office any director appointed by a general meeting who would have held office for three years since his last election, he shall also retire at such annual general meeting. In addition, those directors appointed by a general meeting since the last annual general meeting are required to retire from office. A retiring director is eligible for re-election. Directors appointed by the Government or Thintana Communications, as the case may be, can be
215
removed and replaced at any time upon receipt by Telkom of written notice from the Government or Thintana Communications, as the case may be.
The remuneration of Telkom's directors shall be determined from time to time by its directors, taking into account the recommendations of the remuneration committee appointed by Telkom's directors. Telkom's directors shall be paid all their traveling and other expenses properly incurred by them in the execution of their duties in or about Telkom's business, which are approved or ratified by Telkom's directors.
Any director who serves on any committee, devotes special attention to Telkom's business, goes or resides outside of the Republic of South Africa for any of Telkom's purposes, or performs any services that are outside the scope of ordinary duties of a director, may be paid such extra remuneration or allowances as Telkom's directors, excluding the director in question, may determine.
Telkom's articles of association provide that a director shall not vote in respect of any contract or arrangement or any other proposal whatsoever in which he or she has a material interest, other than by virtue of his or her interest in securities in Telkom and in certain other limited circumstances. A director may not be counted in the quorum of a meeting in relation to any resolution in which he or she is not permitted to vote.
The directors are not obliged to hold any qualification shares.
Telkom's articles of association grant a director appointed by the Government and/or Thintana Communications the right, for so long as they are significant shareholders, to nominate certain of the directors that Telkom is entitled to appoint to the boards of directors of its subsidiaries and Vodacom. These rights are the same as those contained in the shareholders' agreement referred to under Item 7. "Major Shareholders and Related Party Transactions—Related Party Transactions—Shareholder Arrangements—Shareholders' Agreement."
If the class A ordinary share and/or class B ordinary share are converted into ordinary shares, the rights of the Government and/or Thintana Communications as holders of the class A ordinary share and class B ordinary share, respectively, including their rights of appointment of directors to Telkom's board of directors and the boards of directors of Telkom's subsidiaries and Vodacom, will be terminated.
Borrowing Powers
The directors may exercise all of Telkom's powers to borrow money and to mortgage or encumber Telkom's property or any part thereof and to issue debentures, whether secured or unsecured, whether outright or as security for any debt, liability or obligation of Telkom or of any third party. For this purpose, the borrowing powers of the directors are unlimited. Telkom's borrowing powers have not been exceeded during the past three years. Telkom's borrowing powers are unlimited.
Non-South African Shareholders
Other than as described under "—Major Shareholders and Related Party Transactions." there are no limitations in Telkom's memorandum or articles of association on the right of non-South African shareholders to hold or exercise voting rights attaching to any of its ordinary shares.
Rights of Minority Shareholders and Fiduciary Duties
Majority shareholders of South African companies have no fiduciary obligations under South African common law to minority shareholders. However, under provisions in the South African Companies Act, 61 of 1973, a shareholder may, under certain circumstances, seek relief from the court if the shareholder has been unfairly prejudiced. These provisions are designed to provide relief for
216
oppressed shareholders without necessarily overruling the majority's decision. There may also be common law and statutory personal actions available to a shareholder of a company.
The fiduciary obligations of directors may differ from those in the United States and certain other countries. Under South African law, the directors of a company are required to adhere to and act in accordance with two main fiduciary duties, the duty to act in the best interests of the company and the duty to act with due care and skill. The fiduciary duty to act in the best interests of the company includes a duty that the directors must avoid a conflict between their personal interests and the interests of the company, prohibits the directors from using their fiduciary position for personal benefit, prohibits the directors from exceeding the powers of the company and prohibits the directors from exercising any power for an improper or collateral purpose. The fiduciary duty to act with due care and skill includes the requirement that the directors must not act negligently, fraudulently or recklessly and must exercise judgment as to what is in the best interests of the company. South African law provides for personal liability of directors if they conduct the business of the company fraudulently or recklessly. Under Delaware law, the fiduciary duties of directors consist of the duty of care, the duty of loyalty and the duty of disclosure. The fiduciary duty of care requires directors to inform themselves of all material information reasonably available to them prior to making a business decision. The fiduciary duty of loyalty prohibits directors from using their position of trust and confidence to further their private interests. The fiduciary duty of disclosure requires directors to disclose to stockholders all material facts germane to a transaction involving stockholder approval.
Comparison of Shareholders' Rights Under South African and Delaware Law
The following describes some of the material differences between the rights of shareholders under South African and Delaware law.
Voting rights, generally
South Africa
Under South African law, every shareholder in a public company has a vote in respect of the shares held by such shareholder in the issued share capital of the company. The number of votes exercisable by that shareholder is that proportion of the total votes in the company which the aggregate amount of the nominal value of the shares held by that shareholder bears to the total amount of the nominal value of all the shares in the company. Any shareholder of a company entitled to attend and vote at a meeting of the company is entitled to appoint another person or persons, whether a member or not, to act for such shareholder by proxy.
217
Delaware
Under Delaware law, each stockholder is entitled to one vote for each share of capital stock held by the stockholder, unless otherwise provided in the certificate of incorporation of the company. Each stockholder entitled to vote at a meeting of stockholders may authorize another person or persons to act for the stockholder by proxy for up to three years from its date, or for a longer period if the proxy specifically provides.
Preemptive rights
South Africa
Under South African law, no shareholder shall have preemptive rights to purchase additional securities of a company unless the organizational documents of the company expressly grant preemptive rights. However, the Listings Requirements of the JSE require that unissued ordinary shares of a company listed on the JSE be offered first to existing shareholders in proportion to their holdings of shares of that company unless the shares are issued for the acquisition of assets. See this Item "—Memorandum and Articles of Association—Issue of Additional Shares and Preemption Rights."
Delaware
Delaware law provides that no stockholder shall have preemptive rights to purchase additional securities of the company unless the certificate of incorporation of the company expressly grants these rights.
Cumulative voting
Cumulative voting is a system for electing directors whereby the number of votes a shareholder is entitled to vote in an election of directors equals the number of shares held by the shareholder multiplied by the number of open directorships. Under cumulative voting, a shareholder may cast all or any number of the shareholder's votes for a single candidate or for any number of candidates.
South Africa
Under South African law, shareholders do not have the right to elect directors by cumulative voting. The number of votes that a shareholder may cast in respect of the appointment of each individual director equals the number of votes generally exercisable by that shareholder. South African law provides that at a general meeting of a company, a motion for the appointment of two or more persons as directors of the company by a single resolution shall not be moved, unless a resolution that it shall be so moved has first been agreed to by the meeting without any vote being given against it.
Delaware
Under Delaware law, stockholders do not have the right to elect directors by cumulative vote unless the right is granted in the company's certificate of incorporation.
Shareholder approval of corporate matters by written consent
South Africa
Under South African law, any action required to be taken at any annual or other general meeting of a company, other than actions requiring a special resolution, may be taken without a meeting, without prior notice and without a formal vote, if the required written consent setting forth that action to be taken and waiving the required prior notice is signed by all shareholders.
218
Delaware
Under Delaware law, any action required to be taken at any annual or special meeting of the stockholders may be taken without a meeting, without prior written notice and without a vote, if a written consent setting forth the action to be taken is signed by the number of holders of outstanding stock that would be necessary to authorize or take the action at a meeting at which all shares entitled to vote thereon were present and voted, unless otherwise provided in the certificate of incorporation of the company. Prompt notice of the taking of any action by less than unanimous consent must be given to shareholders who did not consent to the action.
Anti-takeover provisions
South Africa
Under the South African Companies Act, 61 of 1973, the South African Securities Regulation Panel, or SRP, regulates certain transactions and schemes aimed at the take-over of companies such as Telkom in order to ensure the equal treatment of shareholders. For this purpose, the SRP has promulgated a code, which is loosely based on the U.K. City Code on Take-Overs and Mergers, setting out general principles and specific rules regulating take-overs and mergers. The SRP requires that a mandatory offer be made to shareholders, at specified prices, in circumstances where:
- •
- the offeror acquires more than 35% of the votes exercisable at a general meeting of a company, if the offeror, prior to the acquisition, held less than 35% of such votes; or
- •
- the offeror acquires more than 5% of such votes during any twelve month period, if the offeror, prior to the acquisition, held more than 35%, but less than 50% of such votes.
The SRP code also sets out comprehensive rules regulating the procedures to be followed and the manner in which the offer should be made. In addition, under the JSE Listings Requirements, a company listed on the JSE is required to obtain shareholder approval for any transaction between that company and a "material" shareholder if the JSE considers that shareholder to have a significant interest in or influence over the company. A "material" shareholder is any person who is or within twelve months preceding the date of the transaction was entitled to exercise or controls the exercise of 10% or more of the votes permitted to be cast at a general meeting of the company.
Delaware
Delaware law contains a business combination statute that protects Delaware companies from hostile takeovers and from actions following the takeover by prohibiting some transactions once an acquirer has gained a significant holding in the company.
Section 203 of the Delaware General Corporation Law prohibits "business combinations," including mergers, sales and leases of assets, issuances of securities and similar transactions by a company or a subsidiary with an interested stockholder that beneficially owns 15% or more of a company's voting stock, within three years after the person becomes an interested stockholder, unless:
- •
- the transaction that will cause the person to become an interested stockholder is approved by the board of directors of the target prior to the transaction;
- •
- after the completion of the transaction in which the person becomes an interested stockholder, the interested stockholder holds at least 85% of the voting stock of the company not including shares owned by persons who are directors and also officers of interested stockholders and shares owned by specified employee benefit plans; or
219
- •
- after the person becomes an interested stockholder, the business combination is approved by the board of directors of the company and holders of at least 66.67% of the outstanding voting stock, excluding shares held by the interested stockholder.
A Delaware company may elect not to be governed by Section 203 by a provision contained in the original certificate of incorporation of the company or an amendment to the original certificate of incorporation or to the bylaws of the company, which amendment must be approved by a majority of the shares entitled to vote and may not be further amended by the board of directors of the company. This amendment is not effective until twelve months following its adoption.
Shareholder access to and inspection of corporate records
South Africa
According to South African law, the register of members of a company is open to inspection by any shareholder or his or her duly authorized agent. Any person may apply to a company for a copy of or extract from the register of shareholders, and the company shall either furnish such copy or extract or afford such person adequate facilities for making such copy or extract. If access to the register of shareholders for the purpose of making any inspection or any copy or extract or facilities for making any copy or extract is refused or not granted or furnished within fourteen days after a written request to that effect has been delivered to the company, the company, and any director or officer of the company who knowingly is a party to the refusal or default, shall be guilty of an offense. The person denied access may apply to court for relief.
Delaware
Delaware law allows any stockholder to inspect and make copies of the stock ledger and the other books and records of a Delaware company for a purpose reasonably related to that person's interest as a stockholder. If the company refuses to permit an inspection or does not reply to the demand within five business days, the stockholder may apply to the Delaware Court of Chancery for an order to compel the inspection.
Duties of directors and officers
South Africa
According to South African law, the business and affairs of every company are managed by the board of directors as provided in the company's organizational documents. The board of directors shall consist of one or more members, each of whom shall be a natural person. The actual number of directors shall be fixed by the company's organizational documents. Directors need not be shareholders unless required by the organizational documents. The organizational documents may prescribe other qualifications for directors as well.
According to South African law, a public company such as Telkom is required to appoint a company secretary and a public officer. In addition, a public company may appoint further officers in accordance with its organizational documents with such titles and duties as may be set out in the organizational documents or as may be determined by the company. Any share certificates signed by two directors of the company, or one director and one other officer of the company authorized by the directors for such purpose, evidences title to the shares concerned. The duties of the company secretary of a company include ensuring that minutes of all shareholders' meetings, directors' meetings and meetings of any board committees are properly recorded.
220
Delaware
According to Delaware law, the business and affairs of every company are managed by the board of directors as provided in the company's certificate of incorporation. The board of directors consists of one or more members, each of whom is a natural person. The actual number of directors shall be fixed by the company's bylaws or in its certificate of incorporation. Directors need not be stockholders unless required by the bylaws or certificate of incorporation. The bylaws or certificate of incorporation may prescribe other qualifications for directors as well.
Delaware law also requires every company to have officers with titles and duties as are stated in the bylaws or in a resolution of the board of directors, which is not inconsistent with the bylaws and as may be necessary to enable the company to sign instruments and stock certificates. One of the officers shall have the duty to record the proceedings of the meetings of the stockholders and directors. Officers are chosen in the manner and hold their offices for the terms prescribed by the bylaws or determined by the board of directors or other governing body.
Meetings
South Africa
South African law requires every company to hold an annual general meeting not more than nine months after the end of every financial year of the company and within not more than fifteen months after the date of the last annual general meeting of the company. If for any reason an annual general meeting of the company is not or cannot be held in this manner, the South African Registrar of Companies may, on application by the company or any shareholder or its legal representative, call or direct the calling of a general meeting of the company which shall be deemed to be an annual general meeting. South African law requires that the annual financial statements of the company as well as group financial statements be considered at the annual general meeting. Furthermore, the company's auditor must be appointed at the annual general meeting and the meeting must address the business which is required to be dealt with pursuant to the organizational documents of the company. Directors are appointed by a general meeting, unless otherwise provided in the organizational documents of the company. The JSE Listings Requirements require that the appointment of a director to fill a casual vacancy or as an addition to the board must be confirmed at the next annual general meeting of the company.
General meetings of the company may, except insofar as is otherwise provided in the organizational documents of the company, be called by the board of directors in accordance with the organizational documents of the company or by two or more shareholders holding not less than one tenth of its issued share capital.
Delaware
Under Delaware law, unless directors are elected by written consent in lieu of an annual meeting, an annual meeting of the stockholders shall be held for the election of directors on a date and at a time designated by the company's bylaws. Stockholders may, unless the certificate of incorporation provides otherwise, act by written consent to elect directors. In addition, any other proper business may be transacted at the annual meeting. If an annual meeting is not held within 30 days of the date designated for such a meeting, or is not held for a period of 13 months after the last annual meeting, the Delaware Court of Chancery may summarily order a meeting to be held upon the application of any shareholder or director.
Delaware law also permits special meetings of shareholders to be called by the board of directors and by other persons authorized to do so by the company's certificate of incorporation or bylaws.
221
Dividends
South Africa
Under South African law, a company may make payments to its shareholders if authorized thereto by its organizational documents. A company may not make any payment, in whatever form, to its shareholders if there are reasonable grounds for believing that:
- •
- the company is or would, after the payment, be unable to pay its debts as they become due in the ordinary course of business; or
- •
- the consolidated assets of the company fairly valued, after the payment, would be less than the consolidated liabilities of the company.
Delaware
Under Delaware law, the directors of a company may declare and pay dividends out of surplus or, when no surplus exists, out of net profits for the fiscal year in which the dividend is declared or the preceding fiscal year, subject to any restrictions in the company's certificate of incorporation. Dividends may not be paid out of net profits if, after payment of the dividend, the capital of the company would be less than the capital represented by the issued and outstanding stock of all classes having a preference upon the distribution of assets.
Repurchase or redemption of shares
South Africa
South African law provides that a company may, by special resolution, if authorized by its memorandum and articles of association, repurchase or redeem its shares; provided that a company shall not make any payment to repurchase any shares issued by the company if there are reasonable grounds for believing that the company is or would, after the payment, be unable to pay its debts or if the consolidated assets of the company would, after the payment, be less than the consolidated liabilities of the company.
Delaware
Delaware law permits a company to repurchase or redeem its shares, provided, however, that no company shall do so when the capital of the company is impaired or when the purchase or redemption would cause any impairment of the capital of the company, except that a company may purchase or redeem out of its capital any of its own shares which are entitled upon any distribution of the company's assets, whether by dividend or liquidation, to a preference over another class or series of its stock, or, if no shares entitled to such a preference are outstanding, any of its own shares, if the shares will be retired upon their acquisition and the capital of the company reduced in accordance with Delaware law.
Limitations of liability of directors
South Africa
Under South African law, any provision, whether contained in the organizational documents of a company or in any contract with a company, that purports to exempt any director or officer of the company from any liability which by law would otherwise attach to such person in respect of any negligence, default, breach of duty or breach of trust of which the person may be guilty in relation to the company or to indemnify the person against any such liability is void. A company may, however, indemnify a director or officer as described in this Item "—Indemnification of officers and directors—South Africa." If, in any proceedings for negligence, default, breach of duty or breach of trust against
222
any director or officer of a company, it appears to the court that the person concerned is or may be liable, but that the person has acted honestly and reasonably, and that, considering all facts and circumstances of the case, including those concerned with the person's appointment, the person ought fairly to be excused for the wrongdoing, the court may relieve the person, either wholly or partly, from liability on terms determined by the court.
Delaware
Delaware law permits a company to include a provision in its certificate of incorporation eliminating or limiting the personal liability of a director to the company or its shareholders for damages for breach of the director's fiduciary duty, provided that a director's liability shall not be limited:
- •
- for any breach of the director's duty of loyalty to the company or its shareholders;
- •
- for acts or omissions not in good faith or which involve intentional misconduct or a knowing violation of law;
- •
- under Section 174 of the Delaware General Corporation Law, which concerns unlawful payments of dividends, stock purchases or redemption; or
- •
- for any transaction from which the director derived an improper personal benefit.
Indemnification of officers and directors
South Africa
Under South African law, the organizational documents of a company may contain a provision indemnifying any director or officer or auditor in respect of any liability incurred by such person in defending any proceedings, whether civil or criminal, in which judgment is given in the person's favor, in which the person is acquitted or the proceedings are abandoned or in connection with any application in which the court relieves the person from liability on the basis that the person acted honestly and reasonably and that the person ought fairly to be excused for negligence, default, breach of duty or breach of trust.
Delaware
Delaware law provides that, subject to certain limitations in the case of derivative suits brought by a company's stockholders in its name, a company may indemnify any individual who is made a party to any third-party suit or proceeding on account of being a director, officer, employee or agent of the company against expenses, including attorneys' fees, judgments, fines and amounts paid in settlement reasonably incurred by the officer or director in connection with the action, through, among other things, a majority vote of a quorum consisting of directors who were not parties to the suit or proceeding, if the individual:
- •
- acted in good faith and in a manner the officer or director reasonably believed to be in or not opposed to the best interests of the company or, in some circumstances, at least not opposed to its best interests; and
- •
- in a criminal proceeding, had no reasonable cause to believe the officer's or director's conduct was unlawful.
To the extent a director, officer, employee or agent is successful in the defense of the action, suit or proceeding, the company is required by Delaware law to indemnify the individual for reasonable expenses incurred thereby.
223
Material Contracts
See Item 4. "Information on the Company—Business Overview—Fixed-line Communications—Fees and tariffs—Interconnection tariffs" and Item 7. "Major Shareholders and Related Party Transactions" for certain material agreements we have entered into.
The following is a summary of the material South African exchange control measures, which has been derived from publicly available documents. The following summary is not a comprehensive description of all of the exchange control regulations and does not cover exchange control consequences that depend upon your particular circumstances. We recommend that you consult your own advisor about the exchange control consequences in your particular situation. The discussion in this section is based on current South African laws and regulations. Changes in laws may alter the exchange control provisions that apply to you, possibly on a retroactive basis.
Introduction
Dealing in foreign currency, the export of capital and/or revenue, incurring of liabilities by residents to non-residents and various other exchange control matters in South Africa are regulated by the South African exchange control regulations. The South African exchange control regulations form part of the general monetary policy of South Africa. The regulations are issued pursuant to section 9 of the Currency and Exchanges Act, 9 of 1933. Pursuant to the regulations, the control over South African capital and/or revenue reserves, as well as their accruals and spending, is vested in the Minister of Finance.
The Minister of Finance has delegated the administration of exchange controls to the Exchange Control Department of the South African Reserve Bank, or Excon, which is responsible for the day to day administration and functioning of exchange controls. Excon has wide discretion but exercises its powers within certain policy guidelines. Within prescribed limits, authorized dealers in foreign exchange are permitted to deal in foreign exchange in accordance with the provisions and requirements of the exchange control rulings, which rulings are issued by Excon, as the delegatee of the Minister of Finance, and contain certain administrative measures, as well as conditions and limits applicable to transactions in foreign exchange, which may be undertaken by authorized dealers. Non-residents have been granted general approval, pursuant to the rulings, to deal in South African assets and to invest and disinvest in South Africa.
The Republic of South Africa's exchange control regulations provide for restrictions on exporting capital from the Common Monetary Area, consisting of the Republic of South Africa, the Republic of Namibia, and the Kingdoms of Lesotho and Swaziland. Transactions between residents of the Common Monetary Area, on the one hand, including companies, and non-residents of the Common Monetary Area, on the other hand, are subject to these exchange control regulations.
There are many inherent disadvantages of exchange controls including the distortion of the price mechanism, the problems encountered in the application of monetary policy, the detrimental effects on inward foreign investment and the administrative costs associated therewith. The South African Minister of Finance has indicated that all remaining exchange controls are likely to be dismantled as soon as circumstances permit. There has, since 1996, been a gradual relaxation of exchange controls. The gradual approach to the abolition of exchange controls adopted by the Government of South Africa is designed to allow the economy to adjust more smoothly to the removal of controls that have been in place for a considerable period of time. The stated objective of the authorities is equality of treatment between residents and non-residents with respect to inflows and outflows of capital. The focus of regulation, subsequent to the abolition of exchange controls, is expected to favor the positive aspects of prudential financial supervision.
224
The present exchange control system in South Africa is used principally to control capital movements. South African companies are not permitted to maintain foreign bank accounts and, without the approval of Excon, are generally not permitted to export capital from South Africa or hold foreign currency. In addition, South African companies are required to obtain the approval of Excon prior to raising foreign funding on the strength of their South African balance sheets, which would permit recourse to South Africa in the event of defaults. Where 75% or more of a South African company's capital, voting power, power of control or earnings is directly or indirectly controlled by non-residents, such a company is designated an affected person by the South African Reserve Bank, and certain restrictions are placed on its ability to obtain local financial assistance. Telkom is not, and has never been, designated an affected person by the South African Reserve Bank.
Foreign investment and outward loans by South African companies are also restricted. In addition, without the approval of Excon, South African companies are generally required to repatriate to South Africa profits of foreign operations and are limited in their ability to utilize profits of one foreign business to finance operations of a different foreign business. South African companies establishing subsidiaries, branches, offices or joint ventures abroad are generally required to submit financial statements on these operations to Excon on an annual basis. As a result, a South African company's ability to raise and deploy capital outside the Common Monetary Area is restricted.
Although exchange controls have been gradually relaxed since 1996, unlimited outward transfers of capital are not permitted at this stage. It is not possible to predict when existing exchange controls will be abolished or modified by the South African Government in the future, although some of the more salient changes to the South African exchange control provisions over the past few years have been as follows:
- •
- companies wishing to invest in countries outside the Common Monetary Area may, in addition to what is set out below, apply for permission to enter into corporate asset/share swap and share placement transactions to acquire foreign investments. The latter mechanism entails the placement of the locally quoted company's shares with long-term overseas holders who, in payment for the shares, provide the foreign currency abroad which the company then uses to acquire the target investment. Since February 2001, institutional investors are no longer entitled to make use of the asset swap mechanism but are, however, entitled to invest either 15% or 20%, depending on the type of institutional investor, of total assets in foreign investments;
- •
- companies wishing to establish new overseas ventures are permitted to transfer offshore up to R1 billion to finance approved investments abroad and up to R2 billion, per new investment to finance approved new investments in Africa. However, the approval of Excon is required in advance. On application to Excon, companies are also allowed to use part of their local cash holdings to finance up to 20% of approved new foreign investments where the cost of these investments exceeds the current limits. In addition, South African companies may utilize part of their cash holdings in South Africa to repay up to 20% of outstanding foreign debt raised to finance foreign investments, provided the facility is for a minimum period of two years; and
- •
- remittance of directors' fees payable to persons permanently resident outside the Common Monetary Area may be approved by authorized dealers, pursuant to the rulings.
Authorized dealers in foreign exchange may, against the production of suitable documentary evidence, provide forward cover to South African residents in respect of fixed and ascertained foreign exchange commitments covering the movement of goods.
225
Persons who emigrate from South Africa are entitled to take limited amounts of money out of South Africa as a settling-in allowance. The balance of the emigrant's funds are blocked and held under the control of an authorized dealer. These blocked funds may only be invested in:
- •
- blocked current, savings, interest bearing deposit accounts in the books of an authorized dealer in the banking sector;
- •
- securities listed on the JSE and financial instruments listed on the Bond Exchange of South Africa which are deposited with an authorized dealer and not released except temporarily for switching purposes, without the approval of Excon. Authorized dealers must at all times be able to demonstrate that listed securities or financial instruments which are dematerialized or immobilized in a central securities depositary are being held subject to the control of the authorized dealer concerned;
- •
- mutual funds units; or
- •
- the South African Futures Exchange.
Aside from the investments referred to above, blocked Rands may only be utilized for very limited purposes. Capitalization shares and dividends declared out of capital gains or out of income earned prior to emigration remain subject to the blocking procedure. The Minister of Finance stated on February 26, 2003 that emigrants' blocked assets are to be unwound and such emigrants are entitled, on application to Excon and subject to an exiting schedule and an exit charge of 10% to exit such blocked assets from South Africa.
Further Steps in Exchange Control Liberalization
The Government has announced its intention to remain committed to a gradual approach to exchange control liberalization. Part of this process of gradual exchange control liberalization and financial sector strengthening is the shift to a system of prudential regulation. Prudential regulations are applied internationally to protect policyholders and pensioners from excessive risk, and typically include restrictions on foreign asset holdings. Institutional investors will be allowed to invest, on approval, up to existing foreign asset limits. These foreign asset limits are 15% of total assets for long term insurers, pension funds and fund managers and 20% of total assets for unit trust companies. The previous restriction based on 10% of the prior year's net inflow of funds will no longer apply. The Exchange Control Department of the South African Reserve Bank reserves the right to stagger transfer of such funds in the interest of overall financial stability. The new dispensation became operational May 1, 2003.
The global expansion by South African firms holds significant benefits for the economy, including expanded market access, increased exports and improved competitiveness. In October 2002, the exchange control allowance for foreign direct investment into Africa was increased from R750 million to R2 billion, in line with South Africa's commitment to the New Partnership for Africa's Development, or NEPAD. In order to facilitate global expansion of South African companies from a domestic base, the exchange control allowances for direct investment outside of Africa was increased from R500 million to R1 billion.
It is anticipated that the global expansion by South African firms should result in inflows from dividends and other income earned. The current tax and exchange control dispensation presents a disincentive for the repatriation of dividends and income. Accordingly, it is proposed that dividends repatriated from foreign subsidiaries should be eligible for an exchange control credit, which will allow them to be re-exported, upon application, for approved foreign direct investments. This change will be synchronized with the removal of the foreign dividends tax, where the taxpayer has a meaningful say in the foreign subsidiary paying the dividend.
226
A system of exchange control allowances for the export of funds when persons emigrate has been in place in South Africa for a number of decades. Emigrants' funds in excess of the emigration allowance were placed in "emigrants' blocked accounts" in order to preserve foreign reserves. These blocked assets are now being unwound. The following new dispensation currently apply:
- •
- The distinction between the settling-in allowance for emigrants and the private individual foreign investment allowance for residents is to fall away and there will now be a common foreign allowance for both residents and emigrants of R750,000 per individual (or R1.5 million in respect of family units).
- •
- Amounts up to R750,000 (inclusive of amounts already exited) will be eligible for exiting without charge. Holders of blocked assets wishing to exit more than R750,000 (inclusive of amounts already exited) must apply to the Exchange Control Department of the South African Reserve Bank to do so. Approval will be subject to an exiting schedule and an exit charge of 10% of the amount. The same dispensation will apply for new emigrants.
The South African Reserve Bank has announced its intention to adjust various other limits pertaining to travel, study, gift, maintenance and alimony allowances.
Sales of Shares
Under present regulations, our ordinary shares and ADSs are freely transferable outside the Common Monetary Area between non-residents of the Common Monetary Area. In addition, the proceeds from the sale of ordinary shares on the JSE on behalf of shareholders who are not residents of the Common Monetary Area are freely remittable to such shareholders. Share certificates held by non-residents will be endorsed with the words "non-resident."
Dividends
Other than non-cash dividends and dividends of a capital nature, which require specific Excon approval, dividends declared in respect of shares held by a non-resident in a company whose shares are listed on the JSE are freely remittable. See Item 3. "Dividends and Dividend Policy."
Any cash dividends paid by us are expected to be paid in Rands. Holders of ADSs on the relevant record date will be entitled to receive any dividends payable in respect of the shares underlying the ADSs, subject to the terms of the deposit agreement. Subject to exceptions provided in the deposit agreement, cash dividends paid in Rands will be converted by the depositary to Dollars and paid by the depositary to holders of ADSs, net of conversion expenses of the depositary, in accordance with the deposit agreement. The depositary will charge holders of ADSs, to the extent applicable, taxes and other governmental charges and specified fees and other expenses. See Item 3. "Dividends and Dividend Policy."
Shareholders who are not residents of the Common Monetary Area who are in receipt of scrip dividends and who elect to dispose of the relevant shares, may remit the proceeds arising from the sale of the relevant shares.
The following is a summary of the material South African and US tax consequences in connection with the acquisition, ownership and disposition of Telkom's ordinary shares and ADSs. The following summary is not a comprehensive description of all of the tax considerations that may be relevant to a decision to acquire purchase, own or dispose of Telkom's shares or ADSs and does not cover tax consequences that depend upon your particular tax circumstances. This discussion is only a general discussion; it is not a substitute for tax advice. We believe and the summary assumes that we are not and will not become a foreign personal holding company ("FPHC") for US federal income tax purposes, but there can be no
227
assurance that we will not become a FPHC in the future. Currently proposed legislation would eliminate the special rules applicable to foreign personal holding companies; however, there can be no assurance that any such legislation will be enacted.
We recommend that you consult your own tax advisor about the consequences of holding Telkom's ordinary shares or ADSs, as applicable, in your particular situation. The discussion in this section is based on current law. Changes in laws may alter the tax treatment of Telkom's ordinary shares or ADSs, as applicable, possibly on a retroactive basis.
South African Tax Matters
Withholding tax on dividends
Effective October 1, 1995, the Republic of South Africa repealed all legislation imposing any withholding tax on dividends. Accordingly, we are not obliged to withhold any tax on dividends paid by us to our shareholders whether or not such shareholder is resident in the Republic of South Africa. Any future decision to re-impose a withholding tax on dividends declared by South African residents to non-resident shareholders is generally permissible under the terms of a reciprocal tax treaty entered into between the Republic of South Africa and the United States in 1997. That treaty, however, provides that any withholding tax introduced in the future shall be limited to:
- •
- 5% of the gross amount of the dividends declared, provided that the beneficial owner of the shares on which the relevant dividends are declared is a company holding at least 10% of the voting stock of the relevant company declaring such dividend; and
- •
- 15% of the gross amount of the dividends declared by the relevant company in all other cases.
Although no withholding tax is payable on dividends declared by a South African resident, South Africa has a secondary tax on companies, or STC, which is 12.5% of the net amount of the dividend. Although the STC is the liability of the South African resident company which declares the dividend, it would reduce the amount available for distribution. See this Item "—Secondary tax on companies."
Income taxes relating to shareholders
In principle, South African residents are taxed on their worldwide income regardless of the source thereof. Non-residents are, subject to certain exemptions, taxed in relation to income derived from a source within or deemed to be within the Republic of South Africa. These exceptions include normal dividends received from South African companies, such as Telkom; interest received from certain sources, including stocks or securities issued by the government, provided the non-resident is not a resident in a neighboring country, was physically absent from South Africa for at least 183 days during the particular year and does not carry on a business in South Africa; and interest received where the non-resident meets certain requirements regarding physical absence from South Africa, is not a resident of any of the countries in the common monetary area and does not carry on a trade in South Africa.
Under South African tax law, a natural person is deemed to be a resident if the person is ordinarily resident in the Republic of South Africa or, if not ordinarily resident during any particular year of assessment for tax purposes, the person was physically present in the Republic of South Africa for certain prescribed periods in the three years prior to and during the tax year in question. Non-natural persons, including companies and trusts, are deemed to be resident in the Republic of South Africa for tax purposes if they were incorporated or formed in the Republic of South Africa or have their place of effective management in the Republic of South Africa.
Generally, income tax is payable on the profits derived from the disposal of shares in a South African company by residents of the Republic of South Africa if the profits derived from such disposal are of a revenue nature as opposed to a capital nature. Essentially, a profit is viewed as being of a
228
revenue nature if it is made pursuant to the operation of a business or scheme of profit making and not incidentally or as a result of a mere realization of a share held for long-term investment purposes. In determining whether the income derived from the disposal of such shares is of a capital or revenue nature, the South African tax authorities and courts look at, among other things, the intention of the holder of the shares to determine whether the disposal gave rise to a capital or a revenue profit. Currently profits derived from the disposal of South African shares held as long-term investments are generally regarded to be profits of a capital nature and are not subject to South African income tax; however, please see this Item "—Capital gains tax" for a discussion of the imposition of capital gains tax. The distribution of profits by way of dividends paid by a South African resident company, such as Telkom, in the ordinary course, is not deductible by the company and is exempt from South African taxation for the recipient.
If a non-resident shareholder trades in South African shares, such non-resident shareholder would be subject to South African income tax if the proceeds from the disposal would be seen as being from a South African source, which would generally be the case where the trading activities take place in South Africa.
To the extent that any share is acquired at a discount to market price, there is a risk that the relevant discount could be regarded as an income tax taxable benefit in the hands of the relevant shareholder if that shareholder is an employee or director of Telkom and that share was acquired from Telkom, its associated institutions or a third party by arrangement with it, or if that shareholder is an employee of the Government of the Republic of South Africa and that share was acquired from the Government, its associated institutions or a third party by arrangement with it.
Should a non-resident be subject to South African tax pursuant to the South African legislation, the tax treaty between South Africa and the United States may provide such non-resident with tax relief. The tax treaty between South Africa and the United States provides that profits of an enterprise of a US resident shall only be taxed in South Africa if such US resident carries on a business in South Africa through a permanent establishment situated in South Africa. Thus if South Africa has taxing rights to any profits generated by the disposal of shares by a US resident to the extent that such US resident carries on business through a permanent establishment in South Africa and the share dealing activities form part of such permanent establishment's business, the US resident will, in principle, be taxed on the profits of the disposal to the extent that such profits are from a source within or deemed to be within South Africa.
Income taxes
As discussed above, income tax is levied in the Republic of South Africa only on income which is classified to be of a revenue nature. South African companies are subject to corporate income tax of 30% of their taxable income. See also this Item "—Secondary tax on companies."
229
Capital gains tax
Capital gains tax was introduced into the South African taxation system with effect from October 1, 2001. Capital gains tax was introduced by way of an amendment to the South African Income Tax Act, 58 of 1962, to incorporate therein a substantive new schedule known as the Eighth Schedule. The relevant capital gains tax rates are summarized in the table below.
Capital gains tax is imposed on certain capital gains arising from the disposal or deemed disposal of an asset and a prescribed portion of the capital gain, as set out in the table below, will be included in a taxpayer's taxable income. An asset is very broadly defined in the legislation and includes shares in a South African company. If, however, the profits of the disposal were subject to income tax, no capital gains tax liability would arise.
Capital gains or losses are calculated separately with respect to each asset disposed of and then aggregated to ultimately calculate the taxpayer's total taxable capital gain or loss. Each capital gain is determined by deducting from the proceeds accruing to the taxpayer from the relevant disposal, the base cost of the asset and each portion of the proceeds already subject to income tax. The base cost includes all direct costs in respect of the acquisition, improvement and disposal of the asset. The net capital gain, in the case of natural persons only, is reduced by an annual exclusion of R10,000.
The following table sets out the prescribed portion of a capital gain that would be included in a taxpayers' taxable income, the normal tax rates applicable to taxpayers and, consequently, the effective rate at which capital gains are taxed:
| Type of taxpayer | Prescribed portion of the capital gain included in taxable income expressed as a percentage (%) | Statutory income tax rate (%) | Effective rate (%) | ||||
|---|---|---|---|---|---|---|---|
| Individuals | 25 | 0-40 | 0-10 | ||||
| Retirement funds | n/a | n/a | n/a | ||||
Trusts | |||||||
| Special | 25 | 0-40 | 0-10 | ||||
| Other | 50 | 40 | 20 | ||||
Life assurers | |||||||
| Individual policyholder fund | 25 | 30 | 7.5 | ||||
| Company policyholder fund | 50 | 30 | 15 | ||||
| Corporate fund | 50 | 30 | 15 | ||||
| Untaxed policyholder fund | 0 | 0 | 0 | ||||
Companies | 50 | 30 | 15 | ||||
| Permanent establishments (branches) | 50 | 35 | 17.5 | ||||
| Small business corporations | 50 | 15-30 | 7.5-15 | ||||
| Employment companies | 50 | 35 | 17.5 | ||||
| Collective investment schemes | 0-50 | 0-30 | 0-15 | ||||
The legislation makes provision, in certain circumstances, for a set-off of capital losses against capital gains and a carry forward of capital losses.
To the extent a non-resident makes a capital gain on the disposal of shares, such gain will be taxed in South Africa if the shares form part of the assets of a permanent establishment through which trade is carried on in South Africa. Capital gains tax applies where a non-resident, alone or with any connected person, holds at least 20% of the equity of a company or other entity and 80% or more of the non-trading assets of such company or other entity such as Telkom comprise immovable property
230
located in South Africa. However, pursuant to the tax treaty between South Africa and the United States, South Africa only has taxing rights to the extent that the shares disposed of form part of the business property of a permanent establishment in South Africa.
Stamp duty
South African stamp duty, or uncertificated securities tax in an electronic environment, is payable by companies upon the issue of shares, at a rate of 0.25% of the value or issue price of the shares.
On a subsequent registration of transfer of shares, South African stamp duty is generally payable for off-market transactions, which are transactions other than through a stockbroker, and a marketable securities tax is generally payable for on-market transactions, which are transactions through a stockbroker, each at 0.25% of the arm's length consideration payable for the share concerned. In respect of transactions involving uncertificated or dematerialized shares, uncertificated securities tax is payable at the same rates as set out above on every change in beneficial ownership thereof pursuant to the Uncertificated Securities Tax Act, 31 of 1998. Uncertificated shares are shares that are not evidenced by a certificate and are transferable without a written instrument.
South African stamp duty and marketable securities taxes are generally payable on shares in a South African company regardless of whether the transfer is executed within or outside South Africa. There are certain exceptions to the payment of stamp duty and marketable securities tax where, for example, the instrument of transfer is executed outside South Africa and registration of transfer is effected in any branch register kept by the relevant company, subject to certain provisions set forth in the South African Stamp Duties Act, 77 of 1968. Transfers of ADSs between non-residents of South Africa are not subject to South African stamp duty or marketable securities tax; however, if shares are withdrawn from the deposit facility, stamp duty or marketable securities tax is payable on the subsequent transfer of the shares. An acquisition of shares from the depositary in exchange for ADSs representing the shares, including an acquisition upon termination of a deposit arrangement, renders an investor liable to South African stamp duty or marketable securities tax at the same rate as stamp duty or marketable securities tax on a subsequent transfer of shares, upon the registration of the investor as the holder of shares on a company's register.
Secondary tax on companies
STC is payable in the Republic of South Africa by resident companies of the Republic of South Africa at a rate of 12.5% based on the net amount of dividends declared by a company during any dividend cycle. The net amount of dividends declared by a company is the excess of the dividends declared by the company over the amount of most dividends accruing to the company during the relevant dividend cycle. A dividend cycle runs from the date of declaration of a dividend to the date of declaration of the next dividend. Any excess of dividends accruing to a company in a relevant dividend cycle, excluding those foreign dividends which are not exempt from South African income tax, over the dividends paid in such cycle are carried forward by the company to the succeeding dividend cycle as an STC credit.
The imposition of STC, together with the corporate income tax discussed above, effectively imposes a dual corporate tax system in the Republic of South Africa with the liability for each of STC and normal corporate income tax being separately determined. Accordingly, a company without a normal tax liability may have a liability for STC, and vice versa, and may be liable for both normal tax and STC on profits distributed. STC creates an effective tax rate on companies of 37.78%. Capitalization shares awarded and distributed in lieu of cash dividends do not incur STC at that stage and it has become common practice for listed South African companies to offer capitalization shares in lieu of cash dividends. No South African tax, including withholding tax, is payable in respect of the receipt of these shares by the recipients thereof. However, STC will arise to the extent capitalized
231
profits used to award the capitalization shares are subsequently paid to shareholders whether in connection with a liquidation of the company or a share buy-back.
United States Tax Matters
The following discussion sets forth the material US federal income tax consequences of the ownership and disposition of our ordinary shares or ADSs relevant to US holders, and in certain circumstances, non-US holders, as of the date of this annual report. This discussion is based on the US Internal Revenue Code of 1986, as amended, and existing final, temporary and proposed Treasury Regulations, rulings and judicial decisions, all as of the date hereof and all of which are subject to prospective or retroactive changes, which could affect the tax consequences as described below.
This discussion does not purport to address all US federal income tax consequences that may be relevant to a particular investor. This discussion applies to you only if you hold our ordinary shares or ADSs, as applicable, as a capital asset for tax purposes, generally, for investment purposes, within the meaning of Section 1221 of the US Internal Revenue Code of 1986. This discussion does not address the tax consequences that may be relevant to you if you are a member of a class of holders subject to special rules, including:
- •
- dealers in securities or currencies;
- •
- traders in securities that elect to use a mark-to-market method of accounting for securities holdings;
- •
- banks or other financial institutions;
- •
- insurance companies;
- •
- tax-exempt organizations;
- •
- persons that hold our ordinary shares or ADSs as part of a straddle or a hedging, integrated, constructive sale or conversion transaction for tax purposes;
- •
- persons whose functional currency, as defined in Section 985 of the US Internal Revenue Code of 1986, for tax purposes is not the Dollar;
- •
- persons resident or ordinarily resident in South Africa;
- •
- persons liable for alternative minimum tax;
- •
- persons that own, or are treated as owning, directly, indirectly or constructively, ten percent or more of the total combined voting power of our ordinary shares or ADSs;
- •
- a US expatriate or former long-term resident of the US;
- •
- a person who acquired the shares as compensation;
- •
- a regulated investment company; or
- •
- a real estate investment trust.
Further, this discussion does not address the indirect consequences to holders of equity interests in entities, for instance, partnerships, that own ordinary shares or ADSs. In addition, this discussion does not address any aspect of US federal gift or estate tax, or the state, local or foreign tax consequences of an investment in the ordinary shares or ADSs.
For purposes of the discussion below, you are a US holder if you are a beneficial owner of our ordinary shares or ADSs who or which is:
- •
- a citizen or resident of the United States;
232
- •
- a corporation, or entity taxable as a corporation, that was created or organized in or under the laws of the United States or any state of the United States, including the District of Columbia;
- •
- an estate, the income of which is subject to US federal income tax regardless of its source; or
- •
- a trust if: (a) a court within the United States is able to exercise primary supervision over its administration and one or more US persons have the authority to control all substantial decisions of the trust; or (b) the trust was in existence on August 20, 1996, and on August 19, 1996 was treated as a domestic trust and has elected to be treated as a US person.
A non-US holder is a beneficial owner of our ordinary shares or ADSs who is not a US holder.
Tax consequences to US holders
For US federal income tax purposes, if you are the beneficial owner of ADSs you will be treated as the beneficial owner of the underlying shares represented by the ADSs.
Distributions
Subject to the passive foreign investment company discussion below, distributions, other than ordinary shares, if any, distributed pro rata to all our shareholders, including holders of ADSs, with respect to ordinary shares or ADSs will be a dividend to the extent those distributions are made out of our current and accumulated earnings and profits, as determined for US federal income tax purposes. Any such distribution generally will be included in your gross income as foreign source dividend income on the date the distribution is received, which in the case of a US holder of ADSs will be the date of receipt by the depositary. Distributions in excess of our current and accumulated earnings and profits will be treated first as a nontaxable return of capital, reducing your tax basis in the ordinary shares or ADSs. Any such distribution in excess of your tax basis in the ordinary shares or ADSs will be treated as capital gain and will be either long-term or short-term depending upon whether you have held the ordinary shares or ADSs for more than one year.
Dividends paid by us will not be eligible for the dividends received deduction available to certain US corporate shareholders. Because we do not calculate our earnings and profits under US rules, you will not be able to demonstrate that a distribution is not out of earnings and profits.
We expect to pay distributions on the ordinary shares and ADSs in South African Rands. Dividends paid in South African Rands generally will be included in your gross income in a US Dollar amount calculated by reference to the exchange rate in effect on the day you, in the case of ordinary shares, or the depositary, in the case of ADSs, receive the dividend whether or not the payment is converted into Dollars at that time. Any gain or loss that you recognize on a subsequent conversion of Rands into Dollars will be US source ordinary income or loss.
Dispositions
Subject to the passive foreign investment company discussion below, you generally will realize capital gain or loss upon the sale or other disposition of the ordinary shares or ADSs measured by the difference between the amount realized on the sale or other disposition and your tax basis in the ordinary shares or ADSs, which is generally the cost of the ordinary shares or ADSs reduced by any previous distributions that are not characterized as dividends. Any recognized gain or loss will be long-term capital gain or loss if the ordinary shares or ADSs have been held for more than one year on the date of the sale or other disposition. In general, any capital gain or loss recognized will be treated as US source income or loss, as the case may be, for US foreign tax credit purposes. Your ability to deduct capital losses may be subject to limitations.
233
If you receive Rands upon the sale or other disposition of our shares, you will realize an amount equal to the US Dollar value of the Rands on the date of the sale or other disposition, or in the case of cash basis and electing accrual basis taxpayers, the settlement date. You will have a tax basis in the Rands received equal to the US Dollar amount of the Rands received. Any gain or loss you realize on a subsequent conversion of Rands into US Dollars generally will be US source ordinary income or loss.
You may incur South African stamp duty or MST, in connection with a subsequent registration or transfer of ordinary shares. See Item 10. "Additional Information—Taxation—South African Tax Matters—Stamp duty." In such case, stamp duty or MST, as applicable, will not be a creditable tax for US foreign tax credit purposes.
Passive foreign investment company
We do not believe that we are, for US federal tax purposes, a passive foreign investment company, or PFIC, and expect to continue our operations in such a manner that we will not become a PFIC. A determination of whether a non-US company is a PFIC must be made on an annual basis, and our status could change depending among other things upon changes in our activities and assets and upon the gross receipts of corporations of which we own a 25 percent or more interest, but which we do not control. If we were to become a PFIC, US holders would be subject to additional federal income taxes on any excess distributions received and any gain realized from the sale or other disposition of the ordinary shares or ADSs plus an interest charge on certain taxes treated as having been deferred by US holders under the PFIC rules whether or not we continue to be a PFIC.
US holders should consult their own tax advisors concerning the United States federal income tax consequences of holding ordinary shares or ADSs if we are considered a PFIC in any taxable year, including the advisability and availability of making certain elections that may alleviate the tax consequences referred to above.
New tax legislation
The Jobs and Growth Act of 2003, which was enacted into law, reduces the maximum tax rate on qualified dividends to 15% for individuals for tax years 2003 through 2008. We expect our dividends to be qualified dividends as long as our ordinary shares or ADSs continue to be readily tradable on the New York Stock Exchange, you have held our ordinary shares or ADSs for more than 60 days, we are not a PFIC or a FPHC for US federal income tax purposes in the taxable year in which we pay a dividend and we were not a PFIC or a FPHC in the preceding taxable year. In addition, the Jobs and Growth Act of 2003 established a maximum tax rate of 15% on net long-term capital gains of non-corporate taxpayers with respect to transactions after May 5, 2003 through December 31, 2008.
Tax consequences for non-US holders
You generally will not be subject to US federal income tax or withholding tax on dividends received from us with respect to ordinary shares or ADSs unless that income is considered effectively connected with the conduct of a US trade or business, and if an applicable income tax treaty so requires as a condition for you to be subject to US federal income tax on a net income basis in respect of income from our ordinary shares or ADSs, as applicable, such dividends are attributable to a permanent establishment that you maintain in the United States.
You generally will not be subject to US federal income tax on any gain realized upon the sale or exchange of ordinary shares or ADSs, unless:
- •
- that gain is effectively connected with the conduct of a US trade or business, and if an applicable income tax treaty so requires as a condition for you to be subject to US federal income tax on a net income basis in respect of gain from the sale or other disposition of our
234
- •
- you are an individual and are present in the United States for at least 183 days in the taxable year of the sale or other disposition, and either your gain is attributable to an office or other fixed place of business that you maintain in the United States or you have a tax home in the United States.
ordinary shares or ADSs, as applicable, such gain is attributable to a permanent establishment maintained by you in the United States; or
If you are engaged in a US trade or business, the income from ordinary shares or ADSs, including dividends and the gain from the disposition of ordinary shares or ADSs, that is effectively connected with the conduct of that trade or business generally will be subject to regular US federal income tax in the same manner as income of a US Holder, as discussed above. In addition, if you are a corporation, your earnings and profits that are attributable to that effectively connected income, subject to certain adjustments, may be subject to an additional branch profits tax at a rate of 30%, or any lower rate as may be specified by an applicable tax treaty.
Information reporting and backup withholding
Backup withholding and information reporting requirements may apply to payments within the United States on our ordinary shares or ADS, including certain payments on the proceeds of a sale or redemption of our ordinary shares or ADSs, to US holders. We, our agent, a broker, the trustee or any paying agent, as the case may be, may be required to withhold tax from any payment that is subject to backup withholding if the US holder fails to furnish the US holder's taxpayer identification number, to certify that such US holder is not subject to backup withholding, or to otherwise comply with the applicable requirements of the backup withholding rules. The backup withholding rate is currently 28%. This legislation is scheduled to expire and the backup withholding rate will be 31% for amounts paid after December 31, 2010 unless Congress enacts legislation providing otherwise. US holders required to establish their exempt status must generally provide such certification on IRS Form W-9, entitled Request for Taxpayer Identification Number. Certain US holders, including, among others, corporations, are not subject to the backup withholding and information reporting requirements.
Non-US holders generally are not subject to information reporting or back-up withholding with respect to dividends paid on, or upon the disposition of, our ordinary shares or ADSs, provided that such a non-US holder provides a taxpayer identification number, certifies to its foreign status, or otherwise establishes an exemption. Non-US holders required to establish their exempt status must generally provide such certification on IRS Form W8-BEN, entitled Certificate of Foreign Status.
The amount of any back-up withholding will be allowed as a credit against a holder's US federal income tax liability and may entitle such holder to a refund, provided that certain information is furnished to the IRS.
PROSPECTIVE PURCHASERS OF ORDINARY SHARES OR ADSs SHOULD CONSULT WITH THEIR OWN TAX ADVISORS REGARDING THE APPLICATION OF THE US FEDERAL INCOME TAX LAWS TO THEIR PARTICULAR SITUATIONS AS WELL AS TO ANY ADDITIONAL TAX CONSEQUENCES RESULTING FROM PURCHASING, HOLDING OR DISPOSING OF SHARES, INCLUDING THE APPLICABILITY AND EFFECT OF THE TAX LAWS OF ANY STATE, LOCAL OR FOREIGN JURISDICTION, AND ESTATE, GIFT, AND INHERITANCE LAWS.
We are subject to the informational requirements of the Securities Exchange Act of 1934, as amended, or the Exchange Act, as they apply to foreign private issuers, and file reports and other information with the SEC. As a foreign private issuer, we are exempt from Exchange Act rules
235
regarding the content and furnishing of proxy statements to shareholders and rules relating to short swing profit reporting and liability.
Our SEC filings are available to the public over the internet at the SEC's website athttp://www.sec.gov. You may also read and copy any document we file at the public reference facilities of the SEC located at 450 Fifth Street, N.W., Washington, D.C. 20549, United States. You may obtain more information concerning the operation of the public reference section of the SEC by calling the SEC at 1-800-SEC-0330. In addition, the reports and other information we file with the SEC are also available for reading and copying at the offices of the New York Stock Exchange, 11 Wall Street, New York, New York 10005, United States. We also maintain an internet site at http://www.telkom.co.za. Our website and the information contained therein or connected thereto shall not be deemed to be incorporated into or a part of this annual report.
Item 11. Quantitative and Qualitative Disclosures About Market Risk
Financial Instruments and Financial Risk Management
Exposure to continuously changing market conditions has highlighted the importance of financial risk management as an element of control. Treasury policies, risk limits and control procedures are continuously monitored by Telkom's board of directors through its audit and risk management committee.
We hold or issue financial instruments to finance our operations, for the temporary investment of short-term funds and to manage currency and interest rate risks. In addition, financial instruments, for example trade debtors and trade creditors, arise directly from our operations.
We finance our operations primarily by a mixture of issued share capital, retained profit and long-term and short-term loans. We use derivative financial instruments to manage our exposure to market risks from changes in interest and foreign exchange rates. The derivatives used for this purpose are principally interest rate swaps, currency swaps and forward exchange contracts.
Market Sensitive Instruments—Other than for Trading Purposes
Interest rate risk management
Interest rate risk arises from the repricing of our forward cover and floating rate debt as well as incremental funding or new borrowings and the refinancing of existing borrowings.
Our policy is to manage interest cost through the utilization of a mix of fixed and variable rate debt. In order to manage this mix in a cost efficient manner, we make use of interest rate derivatives as approved pursuant to our group policy. Fixed rate debt represented 86.9%, 90.1% and 85.8% of our total consolidated debt as of March 31, 2004, 2003 and 2002, respectively. A debt profile of mainly fixed rate debt has been maintained to limit our exposure to interest rate increases given the substantial size of the group's debt portfolio.
236
The following table shows our fixed and variable rate debt for the periods indicated.
| | At March 31, 2004 | | | | |||||||||||||
|---|---|---|---|---|---|---|---|---|---|---|---|---|---|---|---|---|---|
| | 2005 | 2006 | 2007 | 2008 | 2009 | Thereafter | Total | Fair value | |||||||||
| | (in ZAR millions, except percentages) | ||||||||||||||||
| Long-term debt | |||||||||||||||||
| Telkom | |||||||||||||||||
| Fixed rate (ZAR denominated) | |||||||||||||||||
| Long-term debt, including current portion | 2,299 | — | 1,455 | 4,609 | — | 4,280 | 12,643 | 11,274 | |||||||||
| Average interest rate(1) | 16.54 | % | — | 10.87 | % | 16.01 | % | — | 14.99 | % | 15.17 | % | — | ||||
| Finance leases | — | — | — | — | — | 754 | 754 | 754 | |||||||||
| Fixed rate (EURO denominated) | |||||||||||||||||
| Long-term debt | — | 3,894 | — | — | — | — | 3,894 | 4,085 | |||||||||
| Average interest rate(1) (percentage) | — | 7.13 | % | — | — | — | — | 7.13 | % | — | |||||||
| Variable rate (ZAR denominated) | |||||||||||||||||
| Variable rate | 28 | — | — | — | — | — | 28 | 28 | |||||||||
| Average interest rate (percentage)(2) | 9.30 | % | — | — | — | — | — | 9.30 | % | — | |||||||
| Commercial paper bills | 1,446 | 262 | — | — | — | — | 1,708 | 1,597 | |||||||||
| Average interest rate(2) | 14.27 | % | 14.06 | % | — | — | — | — | 14.24 | % | — | ||||||
| Variable rate (EURO denominated) | |||||||||||||||||
| Variable rate | 3 | 3 | 3 | — | — | 85 | 94 | 94 | |||||||||
| Average interest rate(2)(3) | 6.81 | % | 6.81 | % | 6.81 | % | — | — | 0.128 | % | 0.71 | % | — | ||||
| Variable rate (USD denominated) | |||||||||||||||||
| Variable rate | — | — | — | — | — | — | — | — | |||||||||
| Average interest rate(2)(3) | — | — | — | — | — | — | — | — | |||||||||
| Vodacom(4) | |||||||||||||||||
| Fixed (ZAR denominated) | |||||||||||||||||
| Finance leases and other | 16 | 26 | 40 | 57 | 96 | 210 | 445 | 480 | |||||||||
| Fixed rate (USD denominated) | |||||||||||||||||
| Long term debt, including current portion | 14 | 13 | 12 | 13 | — | — | 52 | 52 | |||||||||
| Average interest rate(2) | 7.75 | % | 6.45 | % | 6.45 | % | 6.45 | % | — | — | 6.80 | % | — | ||||
| Variable rate (EURO denominated) | |||||||||||||||||
| Long term debt, including current portion | 204 | 9 | 12 | 19 | — | — | 244 | 244 | |||||||||
| Average interest rate(3) | |||||||||||||||||
| Variable rate (USD denominated) | |||||||||||||||||
| Long term debt, including current portion | 175 | 7 | 13 | 12 | 39 | — | 246 | 246 | |||||||||
| Average interest rate(3) | |||||||||||||||||
| Variable rate (TSH denominated) | |||||||||||||||||
| Long term debt, including current portion | 12 | 13 | 18 | — | — | — | 43 | 43 | |||||||||
| Average interest rate(3) | |||||||||||||||||
- (1)
- Weighted average yield to maturity.
- (2)
- Weighted average interest rate.
- (3)
- Variable rate equals the current reset rate applicable on reporting date.
- (4)
- Represents Telkom's 50% share of Vodacom's interest bearing indebtedness.
237
The following table shows our interest rate swaps for the periods indicated.
| | At March 31, 2004 | | | | ||||||||||||||
|---|---|---|---|---|---|---|---|---|---|---|---|---|---|---|---|---|---|---|
| | | | Fair value | |||||||||||||||
| | 2005 | 2006 | 2007 | 2008 | 2009 | Thereafter | Total | |||||||||||
| | (in ZAR millions, except percentages) | |||||||||||||||||
| Telkom | ||||||||||||||||||
| ZAR Pay fixed, receive floating | 150 | — | — | 1,000 | — | — | 1,150 | (159 | ) | |||||||||
| Average pay rate(1)(3) | 12.92 | % | — | — | 14.67 | % | — | — | 14.44 | % | — | |||||||
| Average receive rate(1) | 7.96 | % | — | — | 8.00 | % | — | — | 7.99 | % | — | |||||||
| Vodacom(2) | ||||||||||||||||||
| ZAR Receive fixed, pay floating | — | — | — | — | 56 | 62 | 118 | 18 | ||||||||||
| Average pay rate(1)(3) | — | — | — | — | 9.98 | % | 9.81 | % | 9.90 | % | — | |||||||
| Average receive rate(1) | — | — | — | — | 14.90 | % | 14.96 | % | 14.93 | % | — | |||||||
- (1)
- Weighted average interest rate.
- (2)
- Represents Telkom's 50% share of Vodacom's indebtedness.
- (3)
- Variable rate calculated as of March 31, 2004
238
The following table shows our currency swaps for the periods indicated.
| | Year ended March 31, 2004 | | | ||||||||||||
|---|---|---|---|---|---|---|---|---|---|---|---|---|---|---|---|
| | | Fair value | |||||||||||||
| | 2005 | 2006 | 2007 | 2008 | Thereafter | Total | |||||||||
| | (in ZAR millions, except percentages) | ||||||||||||||
| Telkom | |||||||||||||||
| EURO | |||||||||||||||
| Receive fixed EURO, pay fixed ZAR | — | 2,177 | — | — | — | 2,177 | 560 | ||||||||
| Average contractual exchange rate (EURO/ZAR) | — | 6.22 | — | — | — | 6.22 | — | ||||||||
| Average pay rate(1) | — | 15.89 | % | — | — | — | 15.89 | % | — | ||||||
| Average receive rate(1) | — | 7.13 | % | — | — | — | 7.13 | % | — | ||||||
| Receive fixed EURO, pay floating ZAR | — | 630 | — | — | — | 630 | 215 | ||||||||
| Average contractual exchange rate (EURO/ZAR) | — | 6.30 | — | — | — | 6.30 | — | ||||||||
| Average pay rate(1) | — | 11.55 | % | — | — | — | 11.55 | % | — | ||||||
| Average receive rate(1) | — | 7.13 | % | — | — | — | 7.13 | % | — | ||||||
- (1)
- Weighted average interest rate.
Foreign currency exchange rate risk
We manage our foreign exchange rate risk by hedging all identifiable exposures via various financial instruments suitable to our risk exposure.
Cross currency swaps and forward foreign exchange contracts have been entered into to reduce the foreign currency exposure on our operations and our liabilities. We also enter into forward foreign exchange contracts to hedge interest expense and purchase and sale commitments denominated in foreign currencies, principally US Dollars and Euros. The purpose of our foreign currency hedging activities is to protect us from the risk that the eventual net flows will be adversely affected by changes in exchange rates.
We make use of foreign debt funding when the opportunity exists to fund at a lower than local cost of funding.
239
The following table sets forth our liabilities and related derivative instruments subject to foreign exchange risk for the periods indicated.
| | Year ended March 31, 2004 | | | | ||||||||||||
|---|---|---|---|---|---|---|---|---|---|---|---|---|---|---|---|---|
| | | | Fair value | |||||||||||||
| | 2005 | 2006 | 2007 | 2008 | 2009 | Thereafter | Total | |||||||||
| | (in ZAR millions, except percentages) | |||||||||||||||
| Telkom | ||||||||||||||||
| Long term debt | ||||||||||||||||
| Fixed rate (EURO denominated)(2) | — | 3,894 | — | — | — | — | 3,894 | 4,085 | ||||||||
| Average interest rate(1) | — | 7.13 | % | — | — | — | — | 7.13 | % | — | ||||||
| Variable rate (EURO denominated)(2) | 3 | 3 | 3 | — | — | 85 | 94 | 94 | ||||||||
| Average interest rate(1) | 6.81 | % | 6.81 | % | 6.81 | % | — | — | 0.13 | % | 0.71 | % | — | |||
| Accounts payable (EURO denominated)(2) | 148 | — | — | — | — | — | 148 | 148 | ||||||||
| Accounts payable (USD denominated)(3) interest free | 341 | — | — | — | — | — | 341 | 341 | ||||||||
| Account payable (GBP denominated)(4) interest free | 12 | — | — | — | — | — | 12 | 12 | ||||||||
Vodacom | ||||||||||||||||
| Fixed rate (USD denominated)(3) | 14 | 13 | 12 | 13 | — | — | 52 | 52 | ||||||||
| Variable rate (EURO denominated)(2) | 204 | 9 | 12 | 19 | — | — | 244 | 244 | ||||||||
| Variable rate (USD denominated)(3) | 175 | 7 | 13 | 12 | 39 | — | 246 | 246 | ||||||||
| Variable rate (TSH denominated)(5) | 12 | 13 | 18 | — | — | — | 43 | 43 | ||||||||
- (1)
- Weighted average interest rate.
- (2)
- EURO converted at the spot rate quoted on Reuters of R7.7898 EURO on March 31, 2004.
- (3)
- USD converted at the spot rate quoted on Reuters of R6.3575 USD on March 31, 2004.
- (4)
- GBP converted at the spot rate quoted on Reuters of R11.6793 GBP on March 31, 2004.
- (5)
- TSH converted at the spot rate quoted on Reuters of R0.006 TSH on March 31, 2004.
240
The following tables set forth our foreign currency forward exchange contracts for the periods indicated.
Forward contracts to buy foreign currencies and sell ZAR
| | At March 31, 2004 | | | | |||||||||||||
|---|---|---|---|---|---|---|---|---|---|---|---|---|---|---|---|---|---|
| | | | Fair value | ||||||||||||||
| | 2005 | 2006 | 2007 | 2008 | 2009 | Thereafter | Total | ||||||||||
| | (ZAR) | ||||||||||||||||
| Telkom | |||||||||||||||||
| US Dollar | |||||||||||||||||
| Notional Amount (millions) | 1,669 | 226 | — | — | — | — | 1,895 | (225 | ) | ||||||||
| Average contractual exchange rate | 7.37 | 10.29 | — | — | — | — | 7.63 | — | |||||||||
| EURO | |||||||||||||||||
| Notional Amount (millions) | 646 | 369 | — | — | — | — | 1,015 | 4 | |||||||||
| Average contractual exchange rate | 8.92 | 6.89 | — | — | — | — | 8.05 | — | |||||||||
| Pound Sterling | |||||||||||||||||
| Notional Amount (millions) | 92 | — | — | — | — | — | 92 | (4 | ) | ||||||||
| Average contractual exchange rate | 12.43 | — | — | — | — | — | 12.43 | — | |||||||||
| Swedish Krona | |||||||||||||||||
| Notional Amount (millions) | 19 | — | — | — | — | — | 19 | (2 | ) | ||||||||
| Average contractual exchange rate | 0.98 | — | — | — | — | — | 0.98 | — | |||||||||
| Japanese Yen | |||||||||||||||||
| Notional Amount (millions) | 2 | — | — | — | — | — | 2 | (0.1 | ) | ||||||||
| Average contractual exchange rate | 0.07 | — | — | — | — | — | 0.07 | — | |||||||||
Vodacom | |||||||||||||||||
| US Dollar | |||||||||||||||||
| Notional Amount (millions) | 37 | — | — | — | — | — | 37 | (3.5 | ) | ||||||||
| Average contractual exchange rate | 7.03 | — | — | — | — | — | 7.03 | — | |||||||||
| EURO | |||||||||||||||||
| Notional Amount (millions) | 378 | — | — | — | — | — | 378 | (21 | ) | ||||||||
| Average contractual exchange rate | 8.25 | — | — | — | — | — | 8.25 | — | |||||||||
| Pound Sterling | |||||||||||||||||
| Notional Amount (millions) | 115 | — | — | — | — | — | 115 | (8.1 | ) | ||||||||
| Average contractual exchange rate | 12.58 | — | — | — | — | — | 12.58 | — | |||||||||
| Swiss Franc | |||||||||||||||||
| Notional Amount (millions) | 0.3 | — | — | — | — | — | 0.3 | (0.021 | ) | ||||||||
| Average contractual exchange rate | 5.18 | — | — | — | — | — | 5.18 | — | |||||||||
241
Forward contracts to buy foreign currencies and sell USD
| | 2005 | 2006 | 2007 | 2008 | 2009 | Thereafter | Total | Fair value | |||||||||
|---|---|---|---|---|---|---|---|---|---|---|---|---|---|---|---|---|---|
| | (ZAR) | ||||||||||||||||
| Telkom | |||||||||||||||||
| EURO | |||||||||||||||||
| Notional Amount (millions) | 95 | — | — | — | — | — | 95 | (2 | ) | ||||||||
| Average contractual exchange rate | 1.25 | — | — | — | — | — | 1.25 | — | |||||||||
Forward contracts to sell foreign currencies and buy ZAR
| | 2005 | 2006 | 2007 | 2008 | 2009 | Thereafter | Total | Fair value | ||||||||
|---|---|---|---|---|---|---|---|---|---|---|---|---|---|---|---|---|
| | | | | (ZAR) | | | | |||||||||
| Telkom | ||||||||||||||||
| US Dollar | ||||||||||||||||
| Notional Amount (millions) | 606 | 82 | 89 | 275 | — | — | 1,052 | 159 | ||||||||
| Average contractual exchange rate | 7.53 | 9.39 | 10.17 | 10.94 | — | — | 8.55 | — | ||||||||
| EURO | ||||||||||||||||
| Notional Amount (millions) | 348 | — | — | — | — | — | 348 | 27 | ||||||||
| Average contractual exchange rate | 8.61 | — | — | — | — | — | 8.61 | — | ||||||||
| Pound Sterling | ||||||||||||||||
| Notional Amount (millions) | 83 | — | — | — | — | — | 83 | 4 | ||||||||
| Average contractual exchange rate | 12.46 | — | — | — | — | — | 12.46 | — | ||||||||
| Swedish Krona | ||||||||||||||||
| Notional Amount (millions) | 16 | — | — | — | — | — | 16 | 1 | ||||||||
| Average contractual exchange rate | 0.93 | — | — | — | — | — | 0.93 | — | ||||||||
| Japanese Yen | ||||||||||||||||
| Notional Amount (millions) | 2 | — | — | — | — | — | 2 | 0.1 | ||||||||
| Average contractual exchange rate | 0.07 | — | — | — | — | — | 0.07 | — | ||||||||
| Vodacom | ||||||||||||||||
| US Dollar | ||||||||||||||||
| Notional Amount (millions) | 7.2 | — | — | — | — | — | 7.2 | 0.4 | ||||||||
| Average contractual exchange rate | 6.68 | — | — | — | — | — | 6.68 | — | ||||||||
| EURO | ||||||||||||||||
| Notional Amount (millions) | 35.3 | — | — | — | — | — | 35.3 | 0.6 | ||||||||
| Average contractual exchange rate | 7.87 | — | — | — | — | — | 7.87 | — | ||||||||
| Pound Sterling | ||||||||||||||||
| Notional Amount (millions) | 1.0 | — | — | — | — | — | 1.0 | 0.01 | ||||||||
| Average contractual exchange rate | 11.69 | — | — | — | — | — | 11.69 | |||||||||
242
EURO currency swap
| | 2005 | 2006 | 2007 | 2008 | 2009 | Thereafter | Total | Fair value | ||||||||
|---|---|---|---|---|---|---|---|---|---|---|---|---|---|---|---|---|
| | (ZAR) | |||||||||||||||
| Telkom | ||||||||||||||||
| Receive fixed EURO, pay fixed ZAR | — | 2,177 | — | — | — | — | 2,177 | 560 | ||||||||
| Average contractual exchange rate (EURO/ZAR) | — | 6.22 | — | — | — | — | 6.22 | — | ||||||||
| Average pay rate (%)(1) | — | 15.89 | % | — | — | — | — | 15.89 | % | — | ||||||
| Average receive rate (%)(1) | — | 7.13 | % | — | — | — | — | 7.13 | % | — | ||||||
| Receive fixed EURO, pay floating ZAR | — | 630 | — | — | — | — | 630 | 215 | ||||||||
| Average contractual exchange rate (EURO/ZAR) | — | 6.30 | — | — | — | — | 6.30 | — | ||||||||
| Average pay rate (%)(1) | — | 11.55 | % | — | — | — | — | 11.55 | % | — | ||||||
| Average receive rate (%)(1) | — | 7.13 | % | — | — | — | — | 7.13 | % | — | ||||||
- (1)
- Weighted average interest rate.
Other market risks
Credit risk management
We are not exposed to major concentrations of credit risk. To reduce the risk of counter party failure, limits are set based on the individual ratings of counterparties by well-known ratings agencies. Credit limits are reviewed on a yearly basis or when information becomes available in the market. We limit our exposure to any counterparty and these exposures are monitored daily. We expect that all counterparties will meet their obligations.
Trade debtors comprise a large and widespread customer base, covering residential, business and corporate customer profiles.
Credit checks are performed on all customers on application for new services and on an ongoing basis where appropriate.
Liquidity risk management
We are exposed to liquidity risk as a result of uncertain debtor related cash flows as well as capital commitments.
Liquidity risk is managed by our corporate finance division in accordance with policies and guidelines formulated by Telkom's operating committee. Pursuant to our borrowing requirements, we ensure that sufficient facilities exist to meet our immediate obligations. Telkom's operating committee maintains a reasonable balance between the period over which assets generate funds and the period over which the respective assets are funded in order to manage long-term liquidity risk.
We had available credit facilities not utilized of R3 billion as of March 31, 2004.
Fair value of financial instruments
The fair values of financial instruments are calculated using the market rates on valuation date. The values disclosed above are indicative values and may not be the realizable value.
Item 12. Description of Securities Other than Equity Securities
Not applicable.
243
Item 13. Defaults, Dividend Arrearages and Delinquencies
None.
Item 14. Material Modifications to the Rights of Security Holders and Use of Proceeds
None.
Item 15. Controls and Procedures
As of March 31, 2004, the end of the period covered by this annual report, Telkom, under the supervision and with the participation of Telkom's management, including the chief executive officer and the chief financial officer, performed an evaluation of the effectiveness of Telkom's disclosure controls and procedures. Based on this evaluation, Telkom's chief executive officer and chief financial officer concluded that, as of such date, Telkom's disclosure controls and procedures were effective for gathering, analyzing and disclosing the material information Telkom is required to disclose in the reports it files under the Exchange Act, within the time periods specified in the SEC's rules and forms. Telkom's management, including its chief executive officer and chief financial officer, recognize that any set of controls and procedures, no matter how well designed and operated, can provide only reasonable assurance of achieving management's control objectives. Telkom's management, including its chief executive officer and chief financial officer, believe that, as of March 31, 2004, Telkom's disclosure controls and procedures were effective to provide reasonable assurance of achieving management's control objectives.
There have been no significant changes in Telkom's control over financial reporting that occurred during the period covered by this annual report that has materially affected, or is reasonably likely to materially affect, Telkom's internal control over financial reporting.
Item 16A. Audit Committee Financial Expert
Our board of directors has determined that the chairman of our audit committee, Mr. Peter Moyo, is an audit committee financial expert within the meaning of Item 16A. (b) and (c) of the requirements of Form 20-F of the SEC. The SEC has determined that the audit committee financial expert designation does not impose on the person with that designation, any duties, obligations or liability that are greater than the duties, obligations or liabilities imposed on such person as a member of the audit committee of the board of directors in the absence of such designation.
Telkom has adopted a business code of ethics and a disclosure of information policy that apply to all of our employees, including our principal executive officer, principal financial officer and principal accounting officer or controller. Telkom's business code of ethics, taken together with its disclosure of information policy, are designed to comply with the requirements of Item 16B. of Form 20-F. Telkom's business code of ethics seeks to instill in its employees the spirit of fairness, respect and ethical standards in dealing with Telkom's stakeholders. In business dealings on behalf of Telkom, employees are expected to avoid activities that might give rise to conflicts of interest. Employees are expected to act in the exclusive interest of Telkom. Procedures have been put in place to deal with conflicts of interest where these arise in the course of employees' day-to-day activities.
Telkom is committed to promoting the highest standards of behavior and compliance with laws and regulations. Therefore its business code of ethics is reviewed regularly to ensure that it keeps up with developments both inside and outside Telkom.
244
We have filed our business code of ethics and disclosure policy as exhibits to this annual report.
Item 16C. Principal Accountant Fees and Services
The following table sets forth the aggregate audit fees, audit-related fees, tax fees of our principal accountants and all other fees billed for products and services provided by our principal accountants other than audit fees, audit-related fees and tax fees for each of the 2004 and 2003 financial years:
| | Audit-Related | |||||||||
|---|---|---|---|---|---|---|---|---|---|---|
| | Audit Fees | Audit-Related Fees | Tax Fees | All Other Fees | Total | |||||
| | (ZAR millions) | |||||||||
| 2003 | 41 | 3 | — | — | 44 | |||||
| 2004 | 18 | 2 | — | — | 20 | |||||
Audit Committee Pre-Approval Policy
In accordance with our audit committee pre-approval policy, all audit and non-audit services performed for us by our independent accountants were pre-approved by the audit committee of our board of directors, which concluded that the provision of such serviced by the independent accountants was compatible with the maintenance of that firm's independence in the conduct of its auditing functions.
The pre-approval policy provides for categorical pre-approval of permissible non-audit services and requires the specific pre-approval by the audit committee, prior to engagement, of such services, other than audit services covered by the annual engagement letter, that are individually estimated to result in an amount of fees less than 10% of the independent accountant's total audit engagement fee for individual services; provided that all such fees must be less than 50% of the total audit fees for Telkom's annual audit engagement. In addition, services to be provided by the independent accountants that are not within the category of pre-approved services must be approved by the audit committee prior to engagement, regardless of the service being requested and the amount, but subject to the restrictions above.
Requests or applications for services that require specific separate approval by the audit committee are required to be submitted to the audit committee by both management and the independent accountants, and must include a detailed description of the services to be provided and a joint statement confirming that the provision of the proposed services does not impair the independence of the independent accountants.
The audit committee may delegate pre-approval authority to one or more of its members. The member or members to whom such authority is delegated shall report any pre-approval decisions to the audit committee at its next scheduled meeting. The audit committee does not delegate to management its responsibilities to pre-approve services to be performed by the independent accountants.
Item 16D. Exemptions From the Listing Standards for Audit Committees
Not applicable.
Item 16E. Purchases of Equity Securities by the Issuer and Affiliated Purchasers.
Not applicable.
245
The registrant has responded to Item 18 in lieu of responding to this Item.
246
See Index to Financial Statements for a list of all financial statements filed as part of this annual report.
Documents filed as exhibits to this annual report:
| Exhibits | Description | |
|---|---|---|
1.1 | Memorandum and Articles of Association of Telkom S.A. Limited ("Telkom") (Incorporated by reference to Exhibit 3.1 to Telkom's Registration Statement on Form F-1 (File No. 333-102834) (the "F-1")).(1) | |
2.1 | Form of Ordinary Share Certificate (Incorporated by reference to Exhibit 4.1 to the Form F-1)(1) | |
2.2 | Deposit Agreement, dated as of March 3, 2003, among Telkom, the Bank of New York, as Depositary, and Owners and Beneficial Owners of American Depositary Receipts issued thereunder, including the form of American Depositary Receipt (Incorporated by reference to Exhibit 4.2 to the F-1)(1) | |
4.1 | Strategic Services Agreement, dated January 16, 2003, among Telkom, Thintana Communications LLC, SBC International Management Services, Inc. and Telkom Management Services SDN Berhard (Incorporated by reference to Exhibit 10.1 to the F-1)(1) | |
4.2 | Agreement, dated July 31, 2000, between Telkom and Total Facilities Management Company (Proprietary) Limited (Incorporated by reference to Exhibit 10.3 to the F-1)(1) | |
4.3 | Exclusive Facilities Management Services Agreement, dated March 31, 2001, between Telkom and systems Applications Project (Africa) (Proprietary) Limited (Incorporated by reference to Exhibit 10.4 to the F-1)(1) | |
4.4 | Multiparty Implementation Agreement, dated September 30, 1993, among Telkom, Vodacom Group (Proprietary) Limited, Mobile Telephone Network (Proprietary) Limited, the Postmaster General and the Government of the Republic of South Africa (Incorporated by reference to Exhibit 10.5 to the F-1)(1) | |
4.5 | Interconnection Agreement, dated February 16, 1994, among Telkom and Vodacom Group (Proprietary) Limited, as amended by agreements among Telkom, Vodacom Group (Proprietary) Limited and MTN on August 22, 1996, January 12, 1998, July 21, 1998 and September 4, 2001 (Incorporated by reference to Exhibit 10.6 to the F-1)(1) | |
4.6 | Interconnection Agreement, dated February 16, 1994, among Telkom and MTN, as amended by agreements among Telkom, Vodacom Group (Proprietary) Limited and MTN on August 22, 1996, January 12, 1998, July 21, 1998, and September 14, 2001 (Incorporated by reference to Exhibit 10.7 to the F-1)(1) | |
4.7 | Interconnection Agreement, dated August 31, 2001, between Telkom SA Limited and Cell C, as amended by agreement among Telkom, Vodacom Group (Proprietary) Limited and Cell C, dated September 18, 2001 (Incorporated by reference to Exhibit 10.8 to the F-1)(1) | |
4.8 | Joint Venture Agreement, dated March 31, 1995, between Telkom, Vodafone Group plc, Rembrant Group Limited, Vodacom Group, Vodacom, Vodac and Vodafone Holdings (SA) (Proprietary) Limited (Incorporated by reference to Exhibit 10.9 to the F-1)(1) | |
247
4.9 | Shareholders' Agreement, dated January 16, 2003, between the Minister for Communications of the Government of the Republic of South Africa and Thintana Communications LLC (Incorporated by reference to Exhibit 10.10 to the F-1)(1) | |
4.10 | Registration Rights Agreement, dated January 16, 2003, among the Minister of Communications of the Government of the Republic of South Africa, Thintana Communications LLC and Telkom SA Limited (Incorporated by reference to Exhibit 10.11 to the F-1)(1) | |
4.11 | Telkom Conditional Share Plan | |
4.12 | Service Agreement between Telkom SA Limited and Sizwe Nxasana | |
8.1 | Subsidiaries of Telkom (Incorporated by reference to Exhibit 21.1 to the F-1)(1) | |
11.1 | Telkom SA Limited Business Code of Ethics | |
11.2 | Telkom SA Limited Disclosure of Information Policy | |
12.1 | Certification of chief executive officer pursuant to 17 CFR 240.13a-14(a), promulgated under Section 302 of the Sarbanes-Oxley Act of 2002 | |
12.2 | Certification of chief financial officer pursuant to 17 CFR 240.13a-14(a), promulgated under Section 302 of the Sarbanes-Oxley Act of 2002 | |
13.1 | Certification of chief executive officer and chief financial officer furnished pursuant to Rule 13a-14(b) (17 CFR 240.13a-14(b)) or Rule 15d-14(b) (17 CFR 240.15d-14(b)) and Section 1350 of Chapter 63 of Title 18 of the United States Code (18 U.S.C. 1350), promulgated under Section 906 of the Sarbanes-Oxley Act of 2002 |
- (1)
- Incorporated by reference
248
The registrant hereby certifies that it meets all of the requirements for filing on Form 20-F and that it has duly caused and authorized the undersigned to sign this annual report on its behalf.
| TELKOM SA LIMITED | |||
By: | /s/ SIZWE NXASANA Name: Sizwe Nxasana Title: Chief Executive Officer | ||
Dated: June 25, 2004
Telkom SA Limited
Content to annual financial statements
For the year ended March 31, 2004
| | Page | |
|---|---|---|
| Consolidated | ||
| Reports of the independent auditors | F-2 | |
| Consolidated income statement | F-3 | |
| Consolidated balance sheet | F-4 | |
| Consolidated statement of changes in equity | F-5 | |
| Consolidated cash flow statement | F-6 | |
| Notes to the consolidated annual financial statements | F-7 |
F-1

Report of the independent auditors
To the Board of Directors and Shareholders of Telkom SA Limited
We have audited the accompanying consolidated balance sheets of Telkom SA Limited and its subsidiaries as of March 31, 2004, 2003 and 2002, and the related consolidated statements of income, shareholders' equity, and cash flows for the years then ended set out on pages F-3 to F-103. These financial statements are the responsibility of the Company's directors. Our responsibility is to express an opinion on these financial statements based on our audits. We did not audit the financial statements of Vodacom Group (Proprietary) Limited, a 50% joint venture included on a proportional consolidated basis, which statements reflect total assets constituting 19% in March 2004, 16% in 2003 and 14% in 2002, and total revenues constituting 29% in March 2004, 26% in 2003 and 24% in 2002 of the related consolidated totals. Those statements were audited by other auditors whose report has been furnished to us and our opinion, insofar as it relates to the amounts included for Vodacom Group (Proprietary) Limited, is based solely on the report of the other auditors.
We conducted our audits in accordance with the standards of the Public Company Accounting Oversight Board (United States). Those standards require that we plan and perform the audit to obtain reasonable assurance about whether the consolidated financial statements are free of material misstatement. An audit includes examining, on a test basis, evidence supporting the amounts and disclosures in the consolidated financial statements. An audit also includes assessing the accounting principles used and significant estimates made by management, as well as evaluating the overall consolidated financial statement presentation. We believe that our audits and the report of other auditors provide a reasonable basis for our opinion.
In our opinion, based on our audits and the report of other auditors, the consolidated financial statements referred to above present fairly, in all material respects, the consolidated financial position of Telkom SA Limited and its subsidiaries at March 31, 2004, 2003 and 2002, and the consolidated results of their operations and their cash flows for the years then ended, in conformity with International Financial Reporting Standards, which differ in certain respects from U.S. generally accepted accounting principles (see note 47 to the consolidated financial statements).
ERNST & YOUNG
Registered Accountants and Auditors
Chartered Accountants (SA)
Pretoria
June 4, 2004
F-2
Consolidated Income Statement
For the three years ended March 31, 2004
| | Notes | 2002 Rm | 2003 Rm | 2004 Rm | |||||
|---|---|---|---|---|---|---|---|---|---|
| Operating revenue | 3 | 34,087 | 37,507 | 40,795 | |||||
| Other income | 4 | 143 | 233 | 98 | |||||
| Operating expenses | 30,039 | 31,226 | 31,805 | ||||||
| Employee expenses | 5.1 | 7,166 | 7,208 | 7,408 | |||||
| Payments to other operators | 5.2 | 5,652 | 6,092 | 5,985 | |||||
| Selling, general and administrative expenses | 5.3 | 7,956 | 7,682 | 7,971 | |||||
| Services rendered | 5.4 | 2,273 | 2,622 | 2,269 | |||||
| Operating leases | 5.5 | 1,139 | 1,124 | 923 | |||||
| Depreciation, amortisation, impairment and write-offs | 5.6 | 5,853 | 6,498 | 7,249 | |||||
| Operating profit | 4,191 | 6,514 | 9,088 | ||||||
| Investment income | 6 | 512 | 424 | 479 | |||||
| Profit before finance charges | 4,703 | 6,938 | 9,567 | ||||||
Finance charges | 7 | 2,550 | 4,154 | 3,264 | |||||
| Interest | 3,185 | 2,869 | 2,488 | ||||||
| Foreign exchange and fair value effect | (635 | ) | 1,285 | 776 | |||||
| Profit before taxation | 2,153 | 2,784 | 6,303 | ||||||
| Taxation | 8 | 873 | 1,049 | 1,711 | |||||
| Profit after taxation | 1,280 | 1,735 | 4,592 | ||||||
| Minority interests | 22 | 59 | 105 | 69 | |||||
| Net profit for the year | 1,221 | 1,630 | 4,523 | ||||||
| Basic and diluted earnings per share (cents) | 9 | 219.2 | 292.6 | 812.0 | |||||
| Headline earnings per share (cents) | 9 | 299.3 | 314.0 | 863.6 | |||||
| Dividend per share (cents) | 9 | — | — | 90.0 | |||||
F-3
Consolidated Balance Sheet
at March 31, 2004
| | Notes | 2002 Rm | 2003 Rm | 2004 Rm | ||||||
|---|---|---|---|---|---|---|---|---|---|---|
| Assets | ||||||||||
| Non-current assets | 44,319 | 43,308 | 41,923 | |||||||
| Property, plant and equipment | 10 | 41,918 | 41,046 | 39,024 | ||||||
| Investment properties | 11 | — | — | 32 | ||||||
| Intangible assets | 12 | 530 | 364 | 580 | ||||||
| Investments | 13 | 859 | 1,161 | 1,567 | ||||||
| Deferred taxation | 14 | 1,012 | 737 | 720 | ||||||
Current assets | 10,997 | 9,921 | 11,061 | |||||||
| Other financial assets | 15 | 2,819 | 1,771 | 1,089 | ||||||
| Income tax receivable | 16 | 1,081 | 276 | — | ||||||
| Short-term investments | 13 | 29 | 26 | 168 | ||||||
| Inventories | 17 | 624 | 621 | 520 | ||||||
| Trade and other receivables | 18 | 5,720 | 6,110 | 6,066 | ||||||
| Cash and cash equivalents | 19 | 724 | 1,117 | 3,218 | ||||||
| Total assets | 55,316 | 53,229 | 52,984 | |||||||
Equity and liabilities | ||||||||||
| Capital and reserves | 16,832 | 18,348 | 22,058 | |||||||
| Share capital and premium | 20 | 8,293 | 8,293 | 8,293 | ||||||
| Treasury shares | 20 | — | — | (238 | ) | |||||
| Preliminary listing costs | 20 | (44 | ) | — | — | |||||
| Non-distributable reserves | 21 | 134 | (11 | ) | 104 | |||||
| Retained earnings | 23 | 8,449 | 10,066 | 13,899 | ||||||
Minority interests | 22 | 133 | 194 | 200 | ||||||
Non-current liabilities | 25,586 | 20,490 | 16,283 | |||||||
| Interest bearing debt | 24 | 22,533 | 17,453 | 12,703 | ||||||
| Deferred taxation | 14 | 463 | 497 | 1,142 | ||||||
| Provisions | 26 | 2,590 | 2,540 | 2,438 | ||||||
Current liabilities | 12,765 | 14,197 | 14,443 | |||||||
| Credit facilities utilised | 19 | 822 | 280 | 422 | ||||||
| Trade and other payables | 27 | 6,663 | 5,229 | 6,007 | ||||||
| Shareholders for dividend | — | — | 7 | |||||||
| Deferred income | 28 | 958 | 1,030 | 1,345 | ||||||
| Current portion of interest bearing debt | 24 | 2,154 | 4,759 | 4,051 | ||||||
| Current portion of provisions | 26 | 1,975 | 2,155 | 1,658 | ||||||
| Income tax payable | 193 | 177 | 460 | |||||||
| Other financial liabilities | 15 | — | 567 | 493 | ||||||
| Total equity and liabilities | 55,316 | 53,229 | 52,984 | |||||||
F-4
Consolidated statement of changes in equity
For the three years ended March 31, 2004
| | Share capital Rm | Share premium Rm | Treasury shares Rm | Preliminary listing costs Rm | Non- distributable reserves Rm | Retained earnings Rm | Total Rm | ||||||||
|---|---|---|---|---|---|---|---|---|---|---|---|---|---|---|---|
| Balance at April 1, 2001 | 5,570 | 2,723 | 6,679 | 14,972 | |||||||||||
| Adoption of IAS 39 (Note 23) | 45 | 584 | 629 | ||||||||||||
| Restated balance | 5,570 | 2,723 | 45 | 7,263 | 15,601 | ||||||||||
| Net profit for the year | 1,221 | 1,221 | |||||||||||||
| Transfer to non-distributable reserves (Note 21) | 35 | (35 | ) | ||||||||||||
| Fair value adjustment on investments (Note 21) | 5 | 5 | |||||||||||||
| Foreign currency translation reserve (net of tax of (R10m)) (Note 21) | 49 | 49 | |||||||||||||
| Preliminary listing costs (Note 20) | (44 | ) | (44 | ) | |||||||||||
| Balance at April 1, 2002 | 5,570 | 2,723 | (44 | ) | 134 | 8,449 | 16,832 | ||||||||
| Net profit for the year | 1,630 | 1,630 | |||||||||||||
| Transfer to non-distributable reserves (Note 21) | 13 | (13 | ) | ||||||||||||
| Fair value adjustment on investments (Note 21) | (37 | ) | (37 | ) | |||||||||||
| Foreign currency translation reserve (net of tax of R11m) (Note 21) | (121 | ) | (121 | ) | |||||||||||
| Preliminary listing costs expensed (Note 20) | 44 | 44 | |||||||||||||
| Balance at April 1, 2003 | 5,570 | 2,723 | — | (11 | ) | 10,066 | 18,348 | ||||||||
| Net profit for the year | 4,523 | 4,523 | |||||||||||||
| Dividend declared | (501 | ) | (501 | ) | |||||||||||
| Transfer to non-distributable reserves (Note 21) | 189 | (189 | ) | ||||||||||||
| Fair value adjustment on investments (Note 21) | 9 | 9 | |||||||||||||
| Foreign currency translation reserve (net of tax of R5m) (Note 21) | (83 | ) | (83 | ) | |||||||||||
| Treasury shares (Note 20) | (238 | ) | (238 | ) | |||||||||||
| Balance at March 31, 2004 | 5,570 | 2,723 | (238 | ) | — | 104 | 13,899 | 22,058 | |||||||
F-5
Consolidated cash flow statement
For the three years ended March 31, 2004
| | Notes | 2002 Rm | 2003 Rm | 2004 Rm | ||||||
|---|---|---|---|---|---|---|---|---|---|---|
| Operating activities | 8,171 | 9,748 | 13,884 | |||||||
| Cash receipts from customers | 34,053 | 37,494 | 40,520 | |||||||
| Cash paid to suppliers and employees | (22,470 | ) | (25,431 | ) | (24,750 | ) | ||||
| Cash generated from operations | 30 | 11,583 | 12,063 | 15,770 | ||||||
| Interest received | 528 | 384 | 479 | |||||||
| Finance charges paid | 31 | (3,026 | ) | (2,776 | ) | (1,255 | ) | |||
| Dividend paid | 33 | — | (25 | ) | (548 | ) | ||||
| Taxation (paid)/refunded | 32 | (914 | ) | 102 | (562 | ) | ||||
Investing activities | (9,250 | ) | (5,731 | ) | (5,423 | ) | ||||
| Proceeds on disposal of property, plant and equipment | 139 | 21 | 52 | |||||||
| Proceeds on disposal of investment | — | 172 | 29 | |||||||
| Proceeds on disposal of subsidiaries and joint ventures | 34 | 13 | 16 | — | ||||||
| Additions to property, plant and equipment | (9,004 | ) | (5,671 | ) | (5,187 | ) | ||||
| Intangible assets acquired | (97 | ) | — | (61 | ) | |||||
| Additions to other investments | (119 | ) | (269 | ) | (331 | ) | ||||
| Acquisition of subsidiaries | 35 | (182 | ) | — | 75 | |||||
Financing activities | 66 | (3,026 | ) | (6,481 | ) | |||||
| Listing costs | (44 | ) | (154 | ) | — | |||||
| Purchase of treasury shares | — | — | (102 | ) | ||||||
| Loans raised | 14,286 | 9,117 | 1,732 | |||||||
| Loans repaid | (15,041 | ) | (11,526 | ) | (7,428 | ) | ||||
| Finance lease capital repaid | — | — | (5 | ) | ||||||
| Finance lease capital raised | — | 5 | — | |||||||
| Decrease/(increase) in net financial assets | 865 | (468 | ) | (678 | ) | |||||
| Net (decrease)/increase in cash and cash equivalents | (1,013 | ) | 991 | 1,980 | ||||||
| Net cash and cash equivalents at beginning of the year | 867 | (98 | ) | 837 | ||||||
| Effect of foreign exchange rate differences | 48 | (56 | ) | (21 | ) | |||||
| Net cash and cash equivalents at end of the year | 19 | (98 | ) | 837 | 2,796 | |||||
F-6
Notes to the consolidated annual financial statements
for the three years ended March 31, 2004
1. Overview of business activities
Telkom SA Limited ("Telkom") is a limited liability company incorporated in the Republic of South Africa ("South Africa"). The Company, its subsidiaries and joint ventures ("the Group") is the leading provider of fixed-line voice and data communications services in South Africa and mobile communications services through Vodacom Group (Proprietary) Limited ("Vodacom") in South Africa and certain other African countries. The Group's services and products include:
- •
- fixed-line telephony, including domestic, pre-paid, international, public payphone and carrier services, as well as enhanced services and customer premises equipment sales and directory services;
- •
- mobile telephony through Vodacom;
- •
- data communications using fiber connections, including data transmission, data networking and leased lines and related services; and
- •
- e-commerce, including internet access service provider, application service provider, hosting, data storage, e-mail and security services.
2. Significant accounting policies
Basis of preparation
The financial statements comply with International Financial Reporting Standards ("IFRS") of the International Accounting Standards Board, South African Statements of Generally Accepted Accounting Practice ("SA GAAP"), and the Companies Act in South Africa.
The financial statements are prepared on the historical cost basis, with the exception of certain financial instruments which are measured at fair value, in conformity with IFRS and SA GAAP. IFRS were applied in full for the first time, in the March 31, 2002 financial statements, as the primary accounting basis. Where adjustments arising from this change could be reasonably determined, opening retained earnings for the earliest period presented were accordingly adjusted, with the exception of the adjustment arising on the adoption of IAS 39, which was accounted for on April 1, 2001.
Details of the Group's significant accounting policies are set out below, and are consistent with those applied in the previous year.
The preparation of financial statements requires the use of estimates and assumptions that affect the reported amounts of assets and liabilities and disclosure of contingent assets and liabilities at the date of the financial statements and the reported amounts of revenue and expenses during the reporting periods. Although these estimates are based on management's best knowledge of current events and actions that the Group may undertake in the future, actual results may differ from those estimates.
Basis of consolidation
The consolidated financial statements include those of Telkom SA Limited, its subsidiaries and joint ventures. Subsidiaries are those entities over whose financial and operating policies the Group has the ability to exercise control, so as to obtain benefits from their activities. Joint ventures are those enterprises over which the Group exercises joint control in terms of a contractual agreement. Joint ventures are accounted for using the proportionate consolidation method on a line-by-line basis. Intra-group balances and transactions, and any unrealised gains and losses arising from intra-group
F-7
transactions, are eliminated in preparing the consolidated financial statements. Unrealised gains and losses arising from transactions with jointly controlled entities are eliminated to the extent of the Group's interest in the enterprises. Business combinations are accounted for using the purchase method of accounting. On acquisition of a subsidiary or joint venture, any excess of the purchase price over the fair value of the Group's net assets is recognised as goodwill on acquisition. Minority interests are calculated on the fair value of assets and liabilities.
Subsidiaries and joint ventures where control is intended to be temporary, as they are acquired and held exclusively with a view to disposal in the near future, or the subsidiary or joint venture is operating under severe long-term restrictions, which significantly impairs its ability to transfer funds, are not consolidated, or proportionately consolidated. Such subsidiaries and joint ventures are accounted for as available for sale investments in terms of the accounting policy for financial instruments.
Property, plant and equipment
Freehold land is stated at cost and is not depreciated.
Property, plant and equipment is stated at historical cost less accumulated depreciation and accumulated impairment losses. Depreciation is charged from the date of commissioning on a straight-line basis over the estimated useful life. Assets under construction represents freehold land and buildings, software, network and support equipment and includes all direct expenditure but excludes the costs of abnormal amounts of waste material, labour, or other resources incurred in the production of self-constructed assets.
The expected useful lives assigned to groups of property, plant and equipment are:
| | Years | ||
|---|---|---|---|
| Freehold buildings | 15 to 50 | ||
| Leasehold buildings | 10 to 25 | ||
| Network equipment | |||
| Cables | 10 to 28 | ||
| Switching equipment | 5 to 15 | ||
| Transmission equipment | 15 | ||
| Other | 2 to 20 | ||
| Support equipment | 5 to 10 | ||
| Furniture and office equipment | 2 to 10 | ||
| Data processing equipment and software | 3 to 5 | ||
| Investment properties | 15 to 50 | ||
| Other | 3 to 10 | ||
Impairment of assets
The Group regularly reviews its assets, other than financial instruments, for any indication of impairment. When indicators including changes in technology, market, economic, legal and operating environments occur and result in changes of the assets' estimated remaining useful life, an impairment test is performed.
The recoverable amount of assets is measured using the higher of the present value of projected cash flows covering the remaining useful lives of the assets, and the net realisable value. Impairment losses are recognised when the assets' carrying value exceeds its estimated recoverable amount. The recoverable amount is determined for the cash-generating unit to which the asset belongs.
F-8
A previously recognised impairment loss is reversed through the income statement if the recoverable amount increases as a result of a change in the estimates used to determine the recoverable amount, but not to an amount higher than the carrying amount that would have been determined (net of depreciation) had no impairment loss been recognised in prior years.
Investment properties
Investment properties, which are properties held to earn rentals and/or for capital appreciation, are stated at cost less accumulated depreciation and accumulated impairment losses.
Depreciation is calculated so as to write off the cost of the investment property on a straight-line basis, over its estimated useful life to its estimated residual value. Depreciation commences when the property is ready for its intended use. The estimated useful lives of depreciable properties are disclosed in the policy on property, plant and equipment.
Intangible assets
Intangible assets, including goodwill, are stated at cost less accumulated amortisation and any accumulated impairment losses. The carrying amount of goodwill is reviewed annually and written down for impairment where considered necessary. Amortisation commences when the intangible assets are available for their intended use and is recognised on a straight-line basis over the assets' expected useful life.
The expected useful lives assigned to intangible assets are:
| | Years | |
|---|---|---|
| Licences | 5 to 20 | |
| Goodwill | 3 to 20 | |
| Trademarks, copyrights and other | 3 to 10 |
For goodwill, a recognised impairment loss is not reversed, unless the impairment loss was caused by a specific external event of an exceptional nature that is not expected to recur and the increase relates clearly to the reversal of the effect of that event.
Asset retirement obligations
Asset retirement obligations are provided for, if estimatable, at the present value of expected future cash flows when the obligation to dismantle or restore the site arises. The increase in the related asset's carrying value is depreciated over its estimated useful life. The unwinding of the discount is included in finance charges.
Repairs and maintenance
The Group expenses all costs associated with the repair and maintenance of its telecommunications network, unless these add to the value of the assets or prolong the useful lives.
Borrowing costs
Financing costs directly associated with the acquisition or construction of assets that require more than three months to complete and place in service are capitalised at interest rates relating to loans specifically raised for that purpose, or at the weighted average borrowing rate where the general pool of Group borrowings was utilised. Other borrowing costs are expensed as incurred.
F-9
Inventories
Inventories are stated at the lower of cost, determined on a weighted average basis, or estimated net realisable value.
Financial instruments
Recognition
All financial instruments are initially recognised at cost, including transaction costs, when the Group becomes a party to their contractual arrangements. Regular way transactions are accounted for on settlement date.
Subsequent to initial recognition, financial assets classified as "held-for-trading" and "available-for-sale" are measured at fair value and those classified as "loans and receivables originated by the enterprise" and "held-to-maturity" at amortised cost. Interest bearing borrowings and other financial liabilities are measured at amortised cost where a maturity date exists, or at cost if no maturity date exists. Liabilities held for trading and derivatives are measured at fair value with gains and losses included in net profit or loss for the period. Amortised cost is calculated on the effective interest rate method. Gains and losses arising on changes in fair value of these instruments are recognised in net profit or loss for the period, except for those classified as "available-for-sale" which are taken directly to equity. Fair value adjustments on unlisted investments are made if the value can be measured reliably.
The estimated fair values of derivatives are determined based on the relevant market information. These estimates are calculated with reference to the market rates using industry standard valuation techniques.
Listed investments are subsequently measured at fair value, which is calculated by reference to the quoted selling price at the close of business on the balance sheet date.
Derecognition
A financial instrument or a portion of a financial instrument will be derecognised and a gain or loss recognised when the company loses the contractual rights or extinguishes the obligation.
On derecognition of a financial asset or liability, the difference between the consideration and the carrying amount on the settlement date is included in net profit or loss for the period. For "available-for-sale" assets, the fair value adjustment relating to prior revaluations of assets is transferred from equity and recognised in net profit or loss for the period.
Trade and other receivables
Short-term trade receivables are recognised and carried at original invoice amount, which is the undiscounted fair value of the consideration receivable. Long-term trade receivables are initially recognised at fair value and subsequently measured at amortised cost.
Bills of exchange and promissory notes
Bills of exchange and promissory notes held to maturity are measured at amortised cost using the effective interest rate method. Those that do not have a fixed maturity are carried at the cost of the consideration given. Bills of exchange held as trading instruments are carried at mark-to-market rates.
F-10
Cash and cash equivalents
Cash and cash equivalents comprise cash on hand, deposits held on call and term deposits with maturity of less than three months.
Derivative financial instruments
All derivative financial instruments are measured at fair value subsequent to initial recognition with gains and losses taken to finance charges.
The fair value of forward exchange contracts is calculated by reference to current forward exchange rates for contracts with similar maturity profiles. The fair values of interest rate swap contracts are determined as the difference in the present value of the future net interest cash flows. The fair value of currency swaps is determined with reference to the present value of expected future cash flows. The Group's derivative transactions, while providing effective economic hedges under the risk management policies, do not qualify for hedge accounting under the specific rules of IAS 39. Upon initial application of IAS 39, on April 1, 2001, the Group recorded the fair value of the existing forward contracts on the balance sheet and the corresponding gain was recognised as an adjustment to the opening balance of retained earnings.
Prior to April 1, 2001, the Group entered into foreign exchange forward contracts to hedge the Group's exposure to fluctuations in foreign currency exchange rates on specific transactions. Up to March 31, 2001, gains and losses due to changes in spot rates on forward contracts designated as hedges of identifiable foreign currency firm commitments were deferred and included in the measurement of the related foreign currency transactions. Gains and losses due to changes in spot rates on forward contracts designated as hedges of existing assets and liabilities were recorded to the income statement to offset the currency gain or loss from the instrument being hedged. The portion of the premium paid over or received relating to the firm commitment period was included in the measurement of the basis of the related foreign currency transaction when recorded. Any remaining premium was amortised over the life of the foreign exchange contract to the income statement. Foreign exchange contract costs incurred in covering currency loans are expensed over the period of the contract and are included in finance costs.
Prior to April 1, 2001, the Group entered into interest rate swap agreements in order to manage interest rate exposure. The net interest paid or received on the swaps was recognised as interest expense.
Prior to April 1, 2001, the Group entered into cross-currency interest rate swap agreements in order to manage exposures to interest rates and fluctuations in foreign currency exchange rates. The net interest paid or received on the swaps was recognised as an interest expense. Gains and losses due to changes in spot rates on the contracts used for hedging were recorded to the income statement to offset the currency gain or loss from the instrument being hedged.
Repurchase agreements
Securities sold under repurchase agreements are not derecognised. These transactions are treated as collateralised arrangements and classified as non-trading liabilities and carried at amortised cost.
Securities purchased under repurchase agreements are not recognised. These transactions are treated as collateralised lending arrangements and classified as loans originated by the enterprise. Originated loans are recorded at amortised cost.
All associated finance charges are taken to income.
F-11
Bridge liquidity transactions
New bonds issued are measured at amortised cost based on the yield to maturity of the new issue.
Bonds are derecognised when the obligation specified in the contract is discharged. The difference between the carrying value of the bond and the amount paid to extinguish the obligation is included in finance charges.
Bonds issued where Telkom is a buyer and seller of last resort are carried at amortised cost. The Group does not actively trade in bonds.
Foreign currencies
The measurement currency of the Group is the South African Rand ("ZAR").
Transactions denominated in foreign currencies are translated at the rate of exchange at the transaction date. Monetary items denominated in foreign currencies are translated at the rate of exchange at the balance sheet date. Realised and unrealised gains and losses on foreign exchange are included in finance charges.
Assets and liabilities of foreign entities are translated at the foreign exchange rates ruling at the balance sheet date. Income, expenditure and cash flow items are remeasured at the actual foreign exchange rate or average foreign exchange rates for the period. Exchange differences on consolidation are classified as part of the foreign currency translation reserve, until disposal of the investment. Any fair value adjustments and goodwill arising on the acquisition of a foreign entity are treated as assets and liabilities of the Group and translated at the foreign exchange rates on transaction date.
Impairment of financial assets
At each balance sheet date an assessment is made of whether there are any indicators of impairment of financial assets based on an analysis of historical bad debt and customer credit-worthiness. If such evidence exists, the estimated recoverable amount of that asset is determined and any impairment loss recognised in net profit or loss for the period for the difference between the recoverable amount and the carrying amount.
The recoverable amount of assets carried at amortised cost is calculated as the present value of expected future cash flows discounted at the original effective interest rate of the asset.
Taxation
Current taxation
The charge for current taxation is based on the results for the period and is adjusted for non-taxable income and non-deductible expenditure. Current taxation is measured at the amount expected to be paid, using taxation rates and laws that have been enacted or substantively enacted by the balance sheet date.
Deferred taxation
Deferred taxation is accounted for using the balance sheet liability method at current rates in respect of temporary differences. A deferred tax asset is recognised to the extent that it is probable that future taxable profits will be available against which the associated unused tax losses, unused tax credits and deductible temporary differences can be utilised. Deferred tax assets are reduced to the extent that it is no longer probable that the related tax benefit will be realised.
F-12
Secondary Taxation on Companies
Secondary Taxation on Companies ("STC") is provided for at a rate of 12.5% on the amount by which dividends declared by the Group exceed dividends received. Deferred tax on unutilised STC credits is recognised to the extent that STC payable on future dividend payments is likely to be available for set-off.
Employee benefits
Post-employment benefits
The Group provides defined benefit and defined contribution plans for the benefit of employees. These plans are funded by the employees and the Group, taking into account recommendations of the independent actuaries. The post retirement medical and telephone rebate liabilities are unfunded.
Defined contribution plans
The Group's funding of the defined contribution plans is charged to the income statement in the same period as the related service is provided.
Defined benefit plans
The Group provides defined benefit plans for pension, retirement, medical aid costs, and telephone rebates to qualifying employees. The Group's net obligation in respect of defined benefits is calculated separately for each plan by estimating the amount of future benefits earned in return for services rendered.
The amount recognised in the balance sheet represents the present value of the defined benefit obligations, calculated by using the projected unit credit method, as adjusted for unrecognised actuarial gains and losses, unrecognised past service costs and reduced by the fair value of plan assets. The amount of any surplus recognised is limited to unrecognised actuarial losses and past service costs plus the present value of available refunds and reductions in future contributions to the plan. To the extent that there is uncertainty as to the entitlement to the surplus, no asset is recognised.
Actuarial gains and losses are recognised as income or expense when the cumulative unrecognised gains and losses for each individual plan exceed 10% of the greater of the present value of the Group's obligation or the fair value of plan assets. These gains or losses are amortised on a straight-line basis over ten years for the medical liability and over the expected average remaining working lives of the employees participating in the other plans.
Past service costs are recognised immediately to the extent that the benefits are vested, otherwise, they are recognised on a straight-line basis over the average period the benefits become vested.
Leave benefits
Holiday leave is provided for over the period that the leave accrues and is subject to a cap. Sick leave is provided for on days accrued and is also subject to a cap.
Termination benefits
Termination benefits are payable when employment is terminated before the normal retirement age or when an employee accepts voluntary redundancy in exchange for benefits. Termination benefits are recognised when it is probable that the expenses will be incurred.
F-13
Compensation benefits
Employees of the wholly owned subsidiaries of Vodacom, including executive directors, are eligible for compensation benefits in the form of a Deferred Bonus Incentive Scheme. Periodically, a number of entitlements are issued to employees, the value of which depends on the seniority of the employee. Benefits of eligible employees arising from the entitlements are determined with reference to the present value per entitlement, which is determined annually based on profits as per the audited consolidated annual financial statements of Vodacom Group (Proprietary) Limited.
The fair value of the entitlements is calculated as the difference in the entitlement value at balance sheet date and the value at which the entitlements were issued, multiplied by the number of entitlements allocated to a participant. Any change in entitlement value is recorded in the income statement based on the present value of the expected future cash outflows and recorded as a liability in the balance sheet. Participating employees are entitled to cash in their entitlements once the right to do so has vested.
Short term employee benefits
The cost of all short-term employee benefits is recognised during the period the employees render services, unless the entity uses the services of employees in the construction of an asset and the benefits received meets the recognition criteria of an asset, at which stage it is included as part of the related property, plant and equipment item.
Provisions
Provisions are recognised when the Group has a present obligation (legal or constructive) as a result of a past event and it is probable (i.e. more likely than not) that an outflow of resources will be required to settle the obligation, and a reliable estimate can be made of the amount of the obligation. Provisions are reviewed at each balance sheet date and adjusted to reflect the current best estimate. Where the effect of the time value of money is material, the amount of a provision is the present value of the expenditures expected to be required to settle the obligation.
Revenue
The Group provides fixed-line communication services and mobile communication services, directory services and communication related products. The Group provides such services to business, residential, payphone and mobile customers. Revenue represents the value of fixed consideration that has been received or is receivable.
Revenue for services is stated at amounts invoiced to customers and excludes Value Added Tax.
Revenue is recognised when there is evidence of an arrangement, collectability is reasonably assured, and the delivery of the product or service has occurred. In certain circumstances revenue is split into separately identifiable components and recognised when the related components are delivered in order to reflect the substance of the transaction. The value of components is determined using verifiable objective evidence. The Group does not provide customers with the right to a refund.
Subscriptions
The Group provides telephone and data communication services under postpaid and prepaid payment arrangements. Revenue includes fees for installation and activation which are recognised as revenue upon activation. Costs incurred on first time installations that form an integral part of the network are capitalised and depreciated over the life of the customer relationship. All other installation and activation costs are expensed as incurred.
F-14
Postpaid and prepaid service arrangements include subscription fees, typically monthly fees, which are recognised over the subscription period.
Traffic and value-added services
Prepaid traffic service revenue collected in advance is deferred and recognised based on actual usage or upon expiration of the usage period or whichever comes first. The terms and conditions of certain prepaid products allow the carry over of unused minutes. Revenue related to the carry over of unused minutes is deferred until usage or expiration. Payphone service revenue is recognised when the service is provided. Community phone revenue collected in advance is deferred and recognised based on actual usage or upon expiration of the usage period, whichever comes first. Interconnection revenue for call termination, call transit and network usage are recognised in the period the traffic occurs. Revenue related to local, long distance, network-to-network, roaming and international call connection services is recognised when the call is placed or the connection provided. Revenue related to products and value-added services is recognised upon delivery and acceptance of the product or service.
Contract revenue
These contracts may include a subsidised handset, 24-month service, activation, SIM-card and a user manual. Revenue is recognised as follows:
- •
- The loss on the subsidised handset, which includes the costs of the handset, the SIM-card and manual, is recognised upon activation by the customer;
- •
- Activation fee revenue received from the customer is recognised upon activation by the customer;
- •
- Monthly access revenue received from the customer is recognised in the period in which the service is delivered;
- •
- Airtime revenue is recognised on the usage basis. The terms and conditions of the bundled airtime products, where applicable, allow the carry over of unused minutes and the accumulation to a maximum of five times the monthly allocation. The unused airtime is deferred in full;
- •
- Deferred revenue related to unused airtime is recognised when utilised by the customer. Upon termination of the customer contract, all deferred revenue for unused airtime is recognised in income; and
- •
- Any other costs incurred as a result of a new customer, are expensed upon activation as this is treated as a customer acquisition cost.
Prepaid products
Airtime
Upon purchase of an airtime voucher the customer receives the right to make outgoing calls and receive incoming calls. Revenue is recognised as the customer utilises the voucher.
Remaining elements of prepaid packages
When a prepaid package is sold, all the costs, which include the costs of the SIM-card and manual, together with the commission, are treated as a customer acquisition cost. Activation cost up to the amount of revenue, including the revenue from the sale of the starter pack, is deferred and recognised upon activation by the customer. Any activation cost exceeding the revenue received is recognised as a loss upon sale of the starter pack by the Group. If a handset is bundled with a prepaid package, the cost is also treated as a customer acquisition cost.
F-15
The residual revenue related to the remaining elements of the prepaid packages is not separable since no objective evidence of fair value exists. The Group currently recognises this residual amount upon activation.
Equipment sales
Revenue from the sales of communication equipment is recognised upon delivery and acceptance by the customer.
Directory services
Revenue is recognised when paper directories are released for distribution, as the significant risks and rewards have been passed.
Other
Dividends from investments are recognised on the date that the Group is entitled to the dividend. Interest is recognised on a time proportion basis taking into account the principal amount outstanding and the effective interest rate.
Incentives
Vodacom pays incentives to service providers and dealers for new activations, retention of existing customers and reaching specified sales targets. These incentives are expensed as incurred.
Telkom provides incentives to its retail payphone card distributors as trade discounts. Incentives are based on sale volume and value. Revenue for retail payphone cards is recorded as traffic revenue, net of these discounts as the cards are used.
Distribution incentives paid to service providers and dealers for exclusivity, distribution assets and distribution subsidies are deferred and expensed over the contractual relationship period.
Leases
Operating lease payments are recognised as an expense in the income statement on a straight-line basis over the lease term.
Assets acquired in terms of finance leases are capitalised at the lower of fair value or the present value of the minimum lease payments at inception of the lease and depreciated over the lesser of the useful life of the asset or the lease term. The capital element of future obligations under the leases is included as a liability in the balance sheet. Lease finance costs are charged against income over the term of the lease using the effective interest rate method. Where a sale and leaseback transaction results in a finance lease, any excess of sale proceeds over the carrying amount is deferred and recognised in income over the term of the lease.
Segmental reporting
The Group is managed in two business segments, which forms the primary segment reporting basis: fixed-line and mobile. The Group's two segments operate mainly in South Africa, but the mobile segment has businesses in certain other African countries. The geographical location of the Group's customers has been identified as the secondary basis of segment reporting. The basis of segment reporting is representative of the Group's internal reporting structure, which is in accordance with IFRS.
The fixed-line business segment provides local telephony, domestic and international long distance services as well as leased lines, data transmission, directory services and internet access.
F-16
The mobile business segment provides mobile telephony services as well as the sale of mobile equipment.
Inter-segment sales are accounted for in the same way as sales to third parties at current market prices.
Marketing
Marketing costs are recognised as an expense as incurred.
Share buy backs
Shares repurchased by Telkom are cancelled. Shares held by subsidiaries are treated as treasury shares and are presented as a reduction of equity. Gains or losses on disposals of treasury shares are accounted for directly in equity.
Comparatives
Certain comparative figures have been reclassified in accordance with current period classifications and presentation. These reclassifications have no effect on prior year net profit. The current period classifications more closely resemble the nature of transactions within the Group's operating structure.
The reclassifications were made in notes 3 and 5. The principal reclassifications were to reflect certain other benefits as part of salaries and wages (Note 5.1), to show certain payments to other operators net of revenue and to reflect impairments and write-offs as part of the depreciation charge.
| Change from | Change to | 2002 | 2003 | Reference | ||||
|---|---|---|---|---|---|---|---|---|
| Payments to other operators | Operating revenue | 110 | 93 | Note 5.2 and 3 | ||||
| Selling, general and administrative expenses | Depreciation, amortisation, impairment and write-offs | 445 | 205 | Note 5.3 and 5.6 | ||||
| Operating leases—vehicles | Security and other | 78 | 81 | Note 5.5 and 5.4 |
Restatement
Vodacom restated its balance sheet disclosure for the 2003 and 2002 financial years to reflect its net zero investment in the Vodacom Congo (RDC) s.p.r.l's preference shares at its gross value in investments and interest bearing debt as the Group does not have a legal right of set-off for these amounts. This restatement does not impact the Group's results or cash flow information for the 2003 and 2002 years.
The following table reflects the value of the different line items prior and subsequent to the restatements:
| | 2002 | 2003 | ||||||
|---|---|---|---|---|---|---|---|---|
| | Previously Rm | Restated Rm | Previously Rm | Restated Rm | ||||
| Investment (Note 13) | 751 | 859 | 1,086 | 1.161 | ||||
| Current portion of interest bearing debt—foreign debt (Note 24) | 2,041 | 2,154 | 4,677 | 4,759 | ||||
F-17
| | 2002 Rm | 2003 Rm | 2004 Rm | ||||
|---|---|---|---|---|---|---|---|
| 3. Operating revenue | 34,087 | 37,507 | 40,795 | ||||
Fixed-line | 27,496 | 29,106 | 30,443 | ||||
| Mobile | 6,591 | 8,401 | 10,352 | ||||
Fixed-line | 27,496 | 29,106 | 30,443 | ||||
| Subscriptions, connections and other usage | 4,410 | 4,595 | 5,024 | ||||
| Traffic | 17,168 | 18,001 | 18,313 | ||||
| Domestic (local and long distance) | 8,670 | 9,178 | 9,680 | ||||
| Fixed-to-mobile | 7,323 | 7,539 | 7,321 | ||||
| International (outgoing) | 1,175 | 1,284 | 1,312 | ||||
| Interconnection | 1,612 | 1,587 | 1,441 | ||||
| Data | 3,652 | 4,183 | 4,787 | ||||
| Directories and other | 654 | 740 | 878 | ||||
| 4. Other income | 143 | 233 | 98 | ||||
Profit on disposal of investment | — | 89 | 25 | ||||
| Profit on disposal of property, plant and equipment | 30 | 15 | 19 | ||||
| Sundry | 113 | 129 | 54 | ||||
5. Operating expenses
Operating expenses comprise:
| | 2002 Rm | 2003 Rm | 2004 Rm | |||||
|---|---|---|---|---|---|---|---|---|
| 5.1 Employee expenses | 7,166 | 7,208 | 7,408 | |||||
Salaries and wages | 5,598 | 5,306 | 5,424 | |||||
| Medical aid contributions | 379 | 389 | 408 | |||||
| Retirement and pension contributions | 499 | 470 | 488 | |||||
| Post-retirement medical aid | 234 | 262 | 272 | |||||
| Current service cost | 20 | 20 | 24 | |||||
| Interest cost | 224 | 225 | 249 | |||||
| Actuarial gain | (5 | ) | (5 | ) | — | |||
| Settlement loss/(gain) | 11 | — | (3 | ) | ||||
| Curtailment (gain)/loss | (16 | ) | 22 | 2 | ||||
| Retirement and pension fund deficit | 81 | 40 | 44 | |||||
| Interest cost | 119 | 86 | 44 | |||||
| Curtailment gain | (38 | ) | (9 | ) | — | |||
| Realisation of fund reserve | — | (37 | ) | — | ||||
| Sick leave | (15 | ) | 34 | (11 | ) | |||
| Telephone rebates | 10 | 16 | 2 | |||||
| Current service cost | — | 3 | 4 | |||||
| Interest cost | 10 | 24 | 19 | |||||
| Actuarial gain | — | (11 | ) | (21 | ) | |||
| Other benefits | 599 | 945 | 993 | |||||
| Restructuring expense | 373 | 244 | 302 | |||||
| Employee expenses capitalised | (592 | ) | (498 | ) | (514 | ) | ||
F-18
Curtailment (gain)/loss
The curtailment (gain)/loss resulted from a reduction in the number of participants covered by the retirement and pension funds and the post-retirement medical aid. This, in turn, resulted in a required adjustment to the present value of the obligation.
Settlement loss/(gain)
The settlement loss/(gain) resulted from a transaction between the Group and participants of the post retirement medical aid. The participants were offered a lump sum in exchange for their right to receive specified post-employment benefits.
Other benefits
Other benefits include transfer costs, annual leave, performance, incentive and service bonuses.
Restructuring expense
The Group recognises the cost of restructuring charges associated with management's plan to reduce the size of its work force to a comparable level for world-class telecommunication companies.
The total number of employees who left the company is 1,633 (2003: 2,124, 2002: 2,960). These employees include management, corporate and operating staff. For 312 of these employees, March 31, 2004 was their last working day.
Retirement and pension contributions
For further details refer to Note 47.
F-19
Change in comparatives
R751m (2002: R721m) has been reclassified from other benefits to salaries and wages, which included motor and housing allowances.
| | 2002 Rm | 2003 Rm | 2004 Rm | |||||
|---|---|---|---|---|---|---|---|---|
| 5.2 Payments to other operators | 5,652 | 6,092 | 5,985 | |||||
5.3 Selling, general and administrative expenses | 7,956 | 7,682 | 7,971 | |||||
Selling and administrative expenses | 5,137 | 4,891 | 5,446 | |||||
| Maintenance | 2,202 | 2,169 | 1,868 | |||||
| Marketing | 617 | 622 | 657 | |||||
5.4 Services rendered | 2,273 | 2,622 | 2,269 | |||||
Facilities and property management | 1,241 | 1,234 | 1.164 | |||||
| Consultancy services—managerial fees | 237 | 427 | 239 | |||||
| Security and other | 768 | 839 | 806 | |||||
| Auditor's remuneration | 27 | 122 | 60 | |||||
| Audit services | 15 | 42 | 41 | |||||
| Company auditors | 12 | 35 | 32 | |||||
| Current year | 11 | 25 | 31 | |||||
| Prior year underprovision | 1 | 10 | 1 | |||||
| Other auditors—current year | 3 | 7 | 9 | |||||
| Audit related services | — | 1 | 6 | |||||
| Company auditors | — | — | 4 | |||||
| Other auditors | — | 1 | 2 | |||||
Tax services—other auditors | 1 | 1 | 1 | |||||
Other services | 11 | 10 | 7 | |||||
| Company auditors | 9 | 5 | 7 | |||||
| Other auditors | 2 | 5 | — | |||||
Telkom SA Limited IPO related fees | — | 68 | 5 | |||||
| Company auditors | — | 42 | — | |||||
| Current year | — | 32 | — | |||||
| Prior year underprovision | — | 10 | — | |||||
| Other auditors | — | 26 | 5 | |||||
Audit related services include the review of system implementations and accounting opinions. Other services consist mainly of assistance received with the requirements of the Sarbanes Oxley Act.
Change in comparatives R147m (2002: R145m) has been reclassified from consultancy services to facilities and property management.
F-20
| | 2002 Rm | 2003 Rm | 2004 Rm | ||||
|---|---|---|---|---|---|---|---|
| 5.5 Operating leases | 1,139 | 1,124 | 923 | ||||
Buildings | 316 | 284 | 195 | ||||
| Transmission and data lines | — | 7 | 16 | ||||
| Equipment | 59 | 64 | 85 | ||||
| Vehicles | 764 | 769 | 627 | ||||
5.6 Depreciation, amortisation, impairment and write-offs | 5,853 | 6,498 | 7,249 | ||||
Depreciation of property, plant and equipment | 5,283 | 6,146 | 6,763 | ||||
| Freehold buildings | 190 | 271 | 275 | ||||
| Leasehold buildings | 22 | 23 | 49 | ||||
| Network equipment | 3,324 | 3,865 | 4,279 | ||||
| Support equipment | 365 | 499 | 550 | ||||
| Furniture and office equipment | 44 | 49 | 47 | ||||
| Data processing equipment and software | 1,262 | 1,372 | 1,490 | ||||
| Other | 76 | 67 | 73 | ||||
| Depreciation of investment properties | — | — | 2 | ||||
| Amortisation of intangible assets | 125 | 147 | 134 | ||||
| Goodwill | 66 | 73 | 73 | ||||
| Licenses | 6 | 7 | 8 | ||||
| Trademarks, copyrights and other | 53 | 67 | 53 | ||||
| Goodwill impairment | — | 16 | — | ||||
| Property, plant and equipment impairment and write-offs (Note 10) | 445 | 189 | 350 | ||||
| Impairment | 398 | — | 149 | ||||
| Write-offs | 47 | 189 | 201 | ||||
6. Investment income | 512 | 424 | 479 | ||||
Interest received | 512 | 416 | 469 | ||||
| Dividends received | — | 8 | 10 | ||||
F-21
| | 2002 Rm | 2003 Rm | 2004 Rm | |||||
|---|---|---|---|---|---|---|---|---|
| 7. Finance charges | 2,550 | 4,154 | 3,264 | |||||
Interest | 3,185 | 2,869 | 2,488 | |||||
| Local debt | 2,690 | 2,642 | 2,253 | |||||
| Foreign debt | 599 | 375 | 303 | |||||
| Less: Finance costs capitalised | (104 | ) | (148 | ) | (68 | ) | ||
| Foreign exchange gains and losses and fair value adjustments | (635 | ) | 1,285 | 776 | ||||
| Foreign exchange losses/(gains) | 2,401 | (761 | ) | (368 | ) | |||
| Fair value adjustments on derivative instruments | (3,036 | ) | 2,046 | 1,144 | ||||
Capitalisation rate | 13.48 | % | 13.56 | % | 15.14 | % | ||
8. Taxation | 873 | 1,049 | 1,711 | |||||
South African normal company taxation | 787 | 678 | 953 | |||||
| Current taxation | 581 | 682 | 960 | |||||
| Underprovision/(overprovision) for prior year | 206 | (4 | ) | (7 | ) | |||
Deferred taxation | 48 | 322 | 604 | |||||
| Temporary differences—normal company taxation | 326 | 300 | 866 | |||||
| Temporary differences—Secondary Taxation on Companies tax credits | — | — | (199 | ) | ||||
| (Overprovision)/underprovision for prior year | (278 | ) | 22 | (63 | ) | |||
| Secondary Taxation on Companies | 37 | 47 | 151 | |||||
| Foreign taxation | 1 | 2 | 3 | |||||
Reconciliation of taxation rate | % | % | % | |||||
| Effective rate | 40.5 | 37.7 | 27.2 | |||||
| South African normal rate of taxation | 30.0 | 30.0 | 30.0 | |||||
| Adjusted for: | 10.5 | 7.7 | (2.8 | ) | ||||
| Exempt income | (4.6 | ) | (1.2 | ) | (3.1 | ) | ||
| Disallowable expenditure | 17.0 | 5.4 | 2.7 | |||||
| Temporary differences in joint venture | (0.4 | ) | — | — | ||||
| Tax losses not utilised | — | — | 0.2 | |||||
| Utilisation of assessed loss | — | — | (0.6 | ) | ||||
| Secondary Taxation on Companies | 1.7 | 1.7 | 2.4 | |||||
| Secondary Taxation on Companies tax credits | — | — | (3.2 | ) | ||||
| (Overprovision)/underprovision for prior year | (3.2 | ) | 0.6 | (1.2 | ) | |||
| Foreign taxation | — | 1.2 | — | |||||
The high effective rate for 2002 and 2003 was primarily due to non-deductible losses relating to a supplier dispute and resolution of the section 32 dispute with the South African Revenue Services.
F-22
9. Earnings per share
| | 2002 Rm | 2003 Rm | 2004 Rm | ||||
|---|---|---|---|---|---|---|---|
| Basic and diluted earnings per share | |||||||
| The calculation of earnings per share is based on net profit for the year (earnings) of R4,523m (2003: R1,630m, 2002: R1,221m) and weighted average number of ordinary shares in issue of 556,994,962 (2003: 557,031,819, 2002: 557,031,819). | |||||||
Headline earnings per share | |||||||
| The calculation of headline earnings per share is based on headline earnings of R4,810m (2003: R1,749m, 2002: R1,667m) and 556,994,962 (2003: 557,031,819, 2002: 557,031,819) weighted average number of ordinary shares issued. | |||||||
Reconciliation between earnings and headline earnings: | |||||||
Earnings as reported | 1,221 | 1,630 | 4,523 | ||||
Adjustments: | |||||||
| Profit on disposal of investment | — | (89 | ) | (25 | ) | ||
| Profit on sale of property, plant and equipment | (30 | ) | (15 | ) | (19 | ) | |
| Property, plant and equipment impairment and write-offs | 445 | 189 | 350 | ||||
| Goodwill amortisation | 66 | 73 | 73 | ||||
| Goodwill impairment | — | 16 | — | ||||
| Tax and outside shareholder effects | (35 | ) | (55 | ) | (92 | ) | |
| Headline earnings | 1,667 | 1,749 | 4,810 | ||||
Basic and diluted earnings per share (cents) | 219.2 | 292.6 | 812.0 | ||||
| Headline earnings per share (cents) | 299.3 | 314.0 | 863.6 | ||||
The disclosure of headline earnings is a requirement of the JSE Securities Exchange of South Africa and is not a recognised measure under US GAAP. | |||||||
Dividend per share (cents) | — | — | 90.0 |
10. Property, plant and equipment
| | 2002 Cost Rm | 2002 Accumulated depreciation Rm | 2002 Carrying value Rm | 2003 Cost Rm | 2003 Accumulated depreciation Rm | 2003 Carrying value Rm | 2004 Cost Rm | 2004 Accumulated depreciation Rm | 2004 Carrying value Rm | |||||||||
|---|---|---|---|---|---|---|---|---|---|---|---|---|---|---|---|---|---|---|
| Freehold land and buildings | 3,548 | (829 | ) | 2,719 | 3,821 | (1,099 | ) | 2,722 | 4,154 | (1,364 | ) | 2,790 | ||||||
| Leasehold buildings (Note 24) | 758 | (141 | ) | 617 | 799 | (164 | ) | 635 | 819 | (203 | ) | 616 | ||||||
| Network equipment | 50,448 | (20,032 | ) | 30,416 | 54,369 | (23,360 | ) | 31,009 | 56,108 | (26,974 | ) | 29,134 | ||||||
| Support equipment | 3,090 | (1,634 | ) | 1,456 | 3,785 | (2,198 | ) | 1,587 | 4,032 | (2,611 | ) | 1,421 | ||||||
| Furniture and office equipment | 392 | (167 | ) | 225 | 419 | (213 | ) | 206 | 451 | (260 | ) | 191 | ||||||
| Data processing equipment and software | 7,217 | (3,677 | ) | 3,540 | 7,770 | (4,550 | ) | 3,220 | 9,007 | (5,637 | ) | 3,370 | ||||||
| Under construction | 2,700 | — | 2,700 | 1,464 | — | 1,464 | 1,333 | — | 1,333 | |||||||||
| Other | 496 | (251 | ) | 245 | 480 | (277 | ) | 203 | 510 | (341 | ) | 169 | ||||||
| 68,649 | (26,731 | ) | 41,918 | 72,907 | (31,861 | ) | 41,046 | 76,414 | (37,390 | ) | 39,024 | |||||||
F-23
The carrying amounts of property, plant and equipment can be reconciled as follows:
| | Carrying value at beginning of year Rm | Additions Rm | Business combinations Rm | Transfers Rm | Transfers to investment properties Rm | Foreign currency translation reserve Rm | Impairment and write-offs Rm | Disposals Rm | Depreciation Rm | Carrying value at end of year Rm | ||||||||||
|---|---|---|---|---|---|---|---|---|---|---|---|---|---|---|---|---|---|---|---|---|
| 2004 | ||||||||||||||||||||
Freehold land and buildings | 2,722 | 64 | 3 | 287 | — | (1 | ) | (5 | ) | (5 | ) | (275 | ) | 2,790 | ||||||
| Leasehold buildings | 635 | 59 | — | — | (29 | ) | — | — | — | (49 | ) | 616 | ||||||||
| Network equipment | 31,009 | 1,524 | — | 1,374 | — | (143 | ) | (333 | ) | (18 | ) | (4,279 | ) | 29,134 | ||||||
| Support equipment | 1,587 | 140 | — | 252 | — | (4 | ) | (4 | ) | — | (550 | ) | 1,421 | |||||||
| Furniture and office equipment | 206 | 10 | — | 23 | — | — | (1 | ) | — | (47 | ) | 191 | ||||||||
| Data processing equipment and software | 3,220 | 491 | — | 1,170 | — | (14 | ) | (5 | ) | (2 | ) | (1,490 | ) | 3,370 | ||||||
| Under construction | 1,464 | 2,968 | — | (3,099 | ) | — | — | — | — | — | 1,333 | |||||||||
| Other | 203 | 51 | — | (7 | ) | — | (2 | ) | (2 | ) | (1 | ) | (73 | ) | 169 | |||||
| 41,046 | 5,307 | 3 | — | (29 | ) | (164 | ) | (350 | ) | (26 | ) | (6,763 | ) | 39,024 | ||||||
2003 | ||||||||||||||||||||
Freehold land and buildings | 2,719 | 19 | — | 258 | — | (1 | ) | (1 | ) | (1 | ) | (271 | ) | 2,722 | ||||||
| Leasehold buildings | 617 | 41 | — | — | — | — | — | — | (23 | ) | 635 | |||||||||
| Network equipment | 30,416 | 2,479 | — | 2,297 | — | (207 | ) | (103 | ) | (8 | ) | (3,865 | ) | 31,009 | ||||||
| Support equipment | 1,456 | 341 | — | 295 | — | (4 | ) | (2 | ) | — | (499 | ) | 1,587 | |||||||
| Furniture and office equipment | 225 | 22 | — | 9 | — | (1 | ) | — | — | (49 | ) | 206 | ||||||||
| Data processing equipment and software | 3,540 | 354 | — | 739 | — | (11 | ) | (27 | ) | (3 | ) | (1,372 | ) | 3,220 | ||||||
| Under construction | 2,700 | 2,416 | — | (3,591 | ) | — | — | (54 | ) | (7 | ) | — | 1,464 | |||||||
| Other | 245 | 40 | — | (7 | ) | — | (2 | ) | (2 | ) | (4 | ) | (67 | ) | 203 | |||||
| 41,918 | 5,712 | — | — | — | (226 | ) | (189 | ) | (23 | ) | (6,146 | ) | 41,046 | |||||||
2002 | ||||||||||||||||||||
Freehold land and buildings | 2,585 | 1 | — | 324 | — | — | — | (1 | ) | (190 | ) | 2,719 | ||||||||
| Leasehold buildings | 488 | 47 | — | 104 | — | — | — | — | (22 | ) | 617 | |||||||||
| Network equipment | 27,556 | 1,719 | — | 4,479 | — | 65 | (12 | ) | (67 | ) | (3,324 | ) | 30,416 | |||||||
| Support equipment | 1,442 | — | — | 379 | — | — | — | — | (365 | ) | 1,456 | |||||||||
| Furniture and office equipment | 208 | 67 | — | — | — | — | — | (6 | ) | (44 | ) | 225 | ||||||||
| Data processing equipment and software | 3,765 | 337 | — | 935 | — | — | (219 | ) | (16 | ) | (1,262 | ) | 3,540 | |||||||
| Under construction | 2,408 | 6,727 | — | (6,221 | ) | — | — | (214 | ) | — | — | 2,700 | ||||||||
| Other | 252 | 106 | — | — | — | 1 | — | (38 | ) | (76 | ) | 245 | ||||||||
| 38,704 | 9,004 | — | — | — | 66 | (445 | ) | (128 | ) | (5,283 | ) | 41,918 | ||||||||
The average time taken to construct assets varies from three to four months.
F-24
Full details of land and buildings are available for inspection at the registered office of the Company.
| | 2002 Rm | 2003 Rm | 2004 Rm | |||||
|---|---|---|---|---|---|---|---|---|
| Impairment and write-offs of assets | 445 | 189 | 350 | |||||
Assets under construction | 214 | 54 | — | |||||
| Assets relating to information technology development that, due to a supplier dispute, are not re-usable, have been impaired in full. | 179 | — | — | |||||
| Certain information technology support system development found not to be economically viable, resulted in a full write-off. | 35 | — | — | |||||
| Assets under construction written off. | — | 54 | — | |||||
Data processing equipment and software | 219 | 27 | 5 | |||||
| Assets relating to information technology development that, due to a supplier dispute, are not re-usable, have been impaired in full. | 167 | — | — | |||||
| Telkom assessed its software in 2003 which resulted in the write-off of computer software. | — | 27 | — | |||||
| The Group implemented a new billing system during 2002. The carrying value of the previous billing system was impaired in full. | 52 | — | — | |||||
| Data processing equipment and software written off. | — | — | 5 | |||||
Network equipment | 12 | 103 | 333 | |||||
| The Group raised an impairment for an earth station. This asset was developed to route traffic between the Public Switch Telephone Network ("PSTN") of Telkom and the Satellite Access Node ("SAN") of a satellite company. The satellite company has not met its current outstanding financial obligations to Telkom and management is of the opinion that no future payments will be received. Management has assessed the asset and it appears unlikely that there will be future economic benefits flowing to the Group to recover the carrying value. | — | — | 149 | |||||
| Decommissioned and obsolete equipment written off. | 12 | 103 | 184 | |||||
Other | ||||||||
| Support equipment, buildings and other assets written off. | — | 5 | 12 | |||||
11. Investment properties | ||||||||
| Opening balance | — | |||||||
| Transfer from property, plant and equipment | 29 | |||||||
| Business combinations | 5 | |||||||
| Depreciation | (2 | ) | ||||||
| Closing balance | 32 | |||||||
F-25
11.1 Holding 350 Erand Agricultural Holdings Ext. 1, RSA
The fair value of the investment property at March 31, 2004 has been arrived at on the basis of a valuation carried out on that day by RMB Properties Limited, on an open market value basis at R60m (Group share: R30m). The valuation was arrived at by reference to market evidence of transaction prices for similar properties.
Debt is collateralised over this leasehold land and building and the fair value of the lease liability included in Note 37 is R110m (Group share: R55m).
The property has been reclassified to investment properties, due to the majority of the premises being leased to third parties.
The property rental income earned by Vodacom from its investment property, all of which is leased out under operating leases, amounted to R7m (Group share: R4m). Direct operating expenses incurred on the investment property in the period amounted to R2m (Group share: R1m).
11.2 Stand 13 and 14 Dunkeld West, RSA
The Group acquired these properties on March 1, 2004 through its equity investment in Smartphone SP (Proprietary) Limited (Note 35).
The fair value of these investment properties at March 31, 2004 have been arrived at on the basis of a valuation carried out at that day by professional valuators on an open market value basis at R10m (Group share: R5m). The valuation was arrived at by reference to market evidence of transaction prices for similar properties.
The property rental income earned by Vodacom from these investment properties, all of which is leased out under operating leases, amounted to R0.1m (Group share: R0.05m).
12. Intangible assets
| | 2002 Cost Rm | 2002 Accumulated amortisation Rm | 2002 Carrying value Rm | 2003 Cost Rm | 2003 Accumulated amortisation Rm | 2003 Carrying value Rm | 2004 Cost Rm | 2004 Accumulated amortisation Rm | 2004 Carrying value Rm | |||||||||
|---|---|---|---|---|---|---|---|---|---|---|---|---|---|---|---|---|---|---|
| Goodwill | 493 | (185 | ) | 308 | 460 | (241 | ) | 219 | 572 | (322 | ) | 250 | ||||||
| Trademarks, copyrights and other | 274 | (127 | ) | 147 | 322 | (228 | ) | 94 | 519 | (280 | ) | 239 | ||||||
| Licenses | 104 | (29 | ) | 75 | 95 | (44 | ) | 51 | 133 | (42 | ) | 91 | ||||||
| 871 | (341 | ) | 530 | 877 | (513 | ) | 364 | 1,224 | (644 | ) | 580 | |||||||
F-26
The carrying amounts of intangible assets can be reconciled as follows:
| | Carrying value at beginning of year Rm | Additions Rm | Disposals Rm | Business combinations Rm | Impairment Rm | Foreign currency translation reserve Rm | Amortisation Rm | Transfers Rm | Carrying value at end of year Rm | |||||||||
|---|---|---|---|---|---|---|---|---|---|---|---|---|---|---|---|---|---|---|
| 2004 | ||||||||||||||||||
Goodwill | 219 | — | — | 112 | — | — | (73 | ) | (8 | ) | 250 | |||||||
| Trademarks, copyrights and other | 94 | 4 | — | 194 | — | — | (53 | ) | — | 239 | ||||||||
| Licenses | 51 | 57 | — | — | — | (17 | ) | (8 | ) | 8 | 91 | |||||||
| 364 | 61 | — | 306 | — | (17 | ) | (134 | ) | — | 580 | ||||||||
2003 | ||||||||||||||||||
Goodwill | 308 | — | — | — | (16 | ) | — | (73 | ) | — | 219 | |||||||
| Trademarks, copyrights and other | 147 | 14 | — | — | — | — | (67 | ) | — | 94 | ||||||||
| Licenses | 75 | — | — | — | — | (17 | ) | (7 | ) | — | 51 | |||||||
| 530 | 14 | — | — | (16 | ) | (17 | ) | (147 | ) | — | 364 | |||||||
2002 | ||||||||||||||||||
Goodwill | 180 | 194 | — | — | — | — | (66 | ) | — | 308 | ||||||||
| Trademarks, copyrights and other | 203 | — | (3 | ) | — | — | — | (53 | ) | — | 147 | |||||||
| Licenses | 32 | 48 | (8 | ) | — | — | 9 | (6 | ) | — | 75 | |||||||
| 415 | 242 | (11 | ) | — | — | 9 | (125 | ) | — | 530 | ||||||||
In 2003 management reassessed the expected future economic benefit of the customer base and intellectual property included in trademarks and copyrights. Based on this assessment management expected these intangible assets to have no useful life beyond year end, which resulted in an increased amortisation.
Impairment of goodwill
The Group impaired the goodwill arising on the acquisition of 40% of Swiftnet (Proprietary) Limited as a result of the performance of that company.
| | 2002 Rm | 2003 Rm | 2004 Rm | ||||||
|---|---|---|---|---|---|---|---|---|---|
| 13. Investments | 859 | 1,161 | 1,567 | ||||||
Available for sale | |||||||||
| Unlisted investments | 210 | 84 | 60 | ||||||
Intelsat | 92 | — | — | ||||||
| Nil% (2003: Nil%, 2002: 1.16%) interest in International Telecommunications Satellite Organisation, headquartered in Washington DC, USA, at cost. | |||||||||
Telkom disposed of its investment in Intelsat effective December 30, 2002. | |||||||||
Inmarsat | 9 | 9 | — | ||||||
F-27
| Nil% (2003: 0.30%, 2002: 0.30%) interest in International Mobile Satellite Services Organisation, headquartered in London, United Kingdom, at cost. | |||||||||
Telkom disposed of its investment in Inmarsat effective December 16, 2003. | |||||||||
Rascom | 1 | — | — | ||||||
| 1.07% (2003: 1.07%, 2002: 1.18%) interest in Regional African Satellite Communications Organisation, headquartered in Abidjan, Ivory Coast, at cost. | |||||||||
| Cost | 1 | 1 | 1 | ||||||
| Impairment | — | (1 | ) | (1 | ) | ||||
The fair value of the unlisted investments cannot be practicably determined. The directors' valuations are based on the Group's interest in the entities' net asset values converted at year-end exchange rates. | |||||||||
The aggregate directors' valuation of the above unlisted investments is Rnil (2003: R20,2m, 2002: R292,6m) based on the net asset values. | |||||||||
Preference shares in Vodacom Congo (RDC) s.p.r.l. | 108 | 75 | 60 | ||||||
| The preference shares of US$19m (Group share: US$9m) bear interest at a rate of 4% per annum. The preference shares are redeemable, but only after the first three years from date of inception and only on the basis that the shareholders are repaid simultaneously and in proportion to their shareholding. | |||||||||
Listed investments | 77 | 40 | 57 | ||||||
New Skies N.V. | 77 | 40 | 49 | ||||||
| 0.89% (2003: 0.89%, 2002: 0,89%) interest in New Skies Satellite N.V., headquartered in The Hague, Netherlands at fair value. Market value: R49m (2003: R40m, 2002: R77m). | |||||||||
SAGE shares | — | — | 8 | ||||||
F-28
Loans and receivables | — | 94 | 208 | ||||||
ABSA Bank Limited | — | 34 | 39 | ||||||
| Vodacom Congo (RDC) s.p.r.l.'s deposit account amounts to €10m (Group share: €5m) (2003: €8m (Group share: €4m), which is charged as security for the extended credit facility of Vodacom Congo (RDC) s.p.r.l, and bears interest at EURIBOR less 0.2%. The deposit is refundable once the extended credit facility is repaid. | |||||||||
Planetel Communication Limited | — | 27 | 22 | ||||||
| The loan of US$7m (Group share: US$3m) issued during the 2003 year, bears interest at LIBOR plus 5%. Planetel Communication Limited utilised this loan to ensure sufficient shareholder loan funding by itself as a shareholder of Vodacom Tanzania Limited. The loans and capitalised interest are collateralised by cession over all shareholder distributions and a pledge over their shares of Vodacom Tanzania Limited. All the shareholders subordinated their loans to Vodacom Tanzania Limited for the duration of the project finance funding period. | |||||||||
Caspian Construction Company Limited | — | 33 | 25 | ||||||
| The loan of US$8m (Group share: US$4m) issued during the 2003 year, bears interest at LIBOR plus 5%. Caspian Construction Company Limited utilised this loan to ensure sufficient shareholder loan funding by itself as a shareholder of Vodacom Tanzania Limited. The loans and capitalised interest are collateralised by cession over all shareholder distributions and a pledge over their shares of Vodacom Tanzania Limited. All the shareholders subordinated their loans to Vodacom Tanzania Limited for the duration of the project finance funding period. | |||||||||
Vodacom Congo (RDC) s.p.r.l | — | — | 76 | ||||||
| The joint venture partner's share of the loan issued by Vodacom International Limited to Vodacom Congo (RDC) s.p.r.l amounts to US$24m (Group share: US$12m). The loan bears interest at LIBOR plus 6.5%. The loan will be repaid on December 12, 2004. | |||||||||
Tel.One (Pvt) Ltd | — | — | 46 | ||||||
| The loan to Tel.One (Pvt) Ltd is unsecured, interest free and will be repaid through traffic revenue from June 2004 over 5 years. | |||||||||
Held for trading | 601 | 969 | 1,410 | ||||||
| Linked insurance policies—Coronation | 211 | 330 | 553 | ||||||
| Linked insurance policies—Investec | 33 | 20 | 39 | ||||||
| Ordinary shares—Listed—Investec | 75 | 116 | 234 | ||||||
| Cash—Investec | — | 26 | 88 | ||||||
| Other money market investments | 240 | 477 | 489 | ||||||
| Other unlisted investments | 42 | — | 7 | ||||||
F-29
| Less: Short term investments | (29 | ) | (26 | ) | (168 | ) | |||
| Tel.One (Pvt) Ltd | — | — | (10 | ) | |||||
| Other investments | (29 | ) | (26 | ) | — | ||||
| Absa Bank Limited | — | — | (39 | ) | |||||
| Vodacom Congo (RDC) s.p.r.l | — | — | (76 | ) | |||||
| Other money market investments | — | — | (35 | ) | |||||
| SAGE shares | — | — | (8 | ) | |||||
Included in held for trading investments is R1,370m (2003: R938m, 2002: R560m) that will be used to fund the post-retirement medical aid liability. These investments have been made through a cell captive that has been consolidated in full.
| | 2002 Rm | 2003 Rm | 2004 Rm | ||||
|---|---|---|---|---|---|---|---|
| 14. Deferred taxation | 549 | 240 | (422) | ||||
Balance at beginning of year | 853 | 549 | 240 | ||||
| Adoption of IAS 39 | (250) | — | — | ||||
| Income statement movements | (48) | (322) | (604) | ||||
| Temporary differences | (326) | (300) | (667) | ||||
| Underprovision/(overprovision) prior year | 278 | (22) | 63 | ||||
| Business combinations | — | — | (63) | ||||
| Foreign equity revaluation | (6) | 13 | 5 | ||||
The balance comprises: | 549 | 240 | (422) | ||||
| Capital allowances | (2,152) | (2,700) | (2,655) | ||||
| Provisions and other allowance | 1,379 | 1,595 | 1,628 | ||||
| Tax losses | 1,322 | 1,345 | 406 | ||||
| Secondary Taxation on Companies tax credits | — | — | 199 | ||||
Deferred tax balance is made up as follows: | 549 | 240 | (422) | ||||
| Deferred tax assets | 1,012 | 737 | 720 | ||||
| Deferred tax liabilities | (463) | (497) | (1,142) | ||||
Tax losses available for set-off against future taxable profits | 4,412 | 4,581 | 1,517 | ||||
| Unutilised assessed losses for which no deferred tax assets were raised | 225 | 124 | 193 | ||||
| Unutilised STC credits | — | 945 | 1,594 | ||||
Under South African tax legislation, tax losses for companies continuing to do business do not expire.
Secondary Taxation on Companies ("STC") is provided for at a rate of 12.5% on the amount by which dividends declared by the Group exceeds dividends received. It is recorded as a tax expense when dividends are declared. A deferred tax asset has been recognised in Telkom in respect of the STC credits on past dividends received not utilised against dividends declared for the year ended 31 March 2004, as it is now considered probable that it will be utilised in the future.
F-30
| | 2002 Rm | 2003 Rm | 2004 Rm | |||||
|---|---|---|---|---|---|---|---|---|
| 15. Other financial instruments | 2,819 | 1,204 | 596 | |||||
Held-to-maturity | ||||||||
| Repurchase agreements | 100 | 222 | 12 | |||||
| Held-for-trading | 2,719 | 982 | 584 | |||||
| Bills of exchange | 10 | (68 | ) | 19 | ||||
| Derivative instruments (Note 39) | 2,709 | 1,050 | 565 | |||||
Other financial instruments are made up as follows: | 2,819 | 1,204 | 596 | |||||
| Other financial assets | 3,712 | 1,771 | 1,089 | |||||
| Other financial liabilities | (893 | ) | (567 | ) | (493 | ) | ||
Repurchase agreements
The Group actively manages a portfolio of repurchase agreements in the South African capital and money markets, with a view to generating additional investment income on the favorable interest rates provided on these transactions. Interest received from the borrower is based on the current market-related yield.
| | | 2002 Rm | 2003 Rm | 2004 Rm | ||||
|---|---|---|---|---|---|---|---|---|
| 2004 | ||||||||
| Maturity period | Yield | |||||||
| 7 days | 9.21% | 12 | ||||||
2003 | ||||||||
| Maturity period | Yield | |||||||
| 1 day | 11.12% - 11.54% | 151 | ||||||
| 7 days | 10.38% | 71 | ||||||
| 222 | ||||||||
2002 | ||||||||
| Maturity period | Yield | |||||||
| 7 days | 13.30% | 46 | ||||||
| 5 days | 13.02% - 13.30% | 54 | ||||||
| 100 | ||||||||
Due the short-term nature of these transactions and the fact that the transactions are initiated based on market-related interest rates, the carrying value approximates the fair value. Collateral in the form of publicly traded bonds has been received in respect of the above transaction.
The terms and conditions of these transactions are governed by signed International Securities Market Association ("ISMA") agreements with all counter parties and the regulations of the Bond Exchange of South Africa ("BESA").
F-31
Bills of exchange
The fair value of bills of exchange has been derived at with reference to BESA quoted prices.
| | 2002 Rm | 2003 Rm | 2004 Rm | |||||
|---|---|---|---|---|---|---|---|---|
| 16. Income tax receivable | 1,081 | 276 | — | |||||
Tax receivable | 899 | 236 | — | |||||
| Interest accrued | 182 | 40 | — | |||||
Income tax receivable related to an overpayment of estimated tax in respect of the 1999 tax year. The amount was repaid by the South African Revenue Services during the year. | ||||||||
17. Inventories | 624 | 621 | 520 | |||||
Gross inventories | 670 | 696 | 597 | |||||
| Provision for obsolete inventories | (46 | ) | (75 | ) | (77 | ) | ||
Inventories consist of the following categories: | 624 | 621 | 520 | |||||
| Installation, maintenance material and network equipment | 385 | 374 | 265 | |||||
| Merchandise | 239 | 247 | 255 | |||||
Provision for obsolete inventories | 46 | 75 | 77 | |||||
| Opening balance | 53 | 46 | 75 | |||||
| Charged to selling, general and administrative expenses | 89 | 110 | 28 | |||||
| Write-off against provision | (96 | ) | (81 | ) | (26 | ) | ||
18. Trade and other receivables | 5,720 | 6,110 | 6,066 | |||||
Trade receivables | 4,858 | 5,423 | 5,222 | |||||
| Gross trade receivables | 5,501 | 5,760 | 5,547 | |||||
| Provision for doubtful debts | (643 | ) | (337 | ) | (325 | ) | ||
| Prepayments and other receivables | 862 | 687 | 844 | |||||
Provision for doubtful debts | 643 | 337 | 325 | |||||
| Opening balance | 493 | 643 | 337 | |||||
| Charged to selling, general and administrative expenses | 984 | 249 | 251 | |||||
| Write-off against provision | (834 | ) | (555 | ) | (263 | ) | ||
F-32
| | 2002 Rm | 2003 Rm | 2004 Rm | |||||
|---|---|---|---|---|---|---|---|---|
| 19. Net cash and cash equivalents | (98 | ) | 837 | 2,796 | ||||
| Cash shown as current assets | 724 | 1,117 | 3,218 | |||||
| Cash and bank balances | 723 | 916 | 1,219 | |||||
| Short-term deposits | 1 | 201 | 1,999 | |||||
| Credit facilities utilised | (822 | ) | (280 | ) | (422 | ) | ||
Undrawn borrowing facilities | 2,154 | 3,018 | 2,995 | |||||
| The undrawn borrowing facilities are unsecured, bear interest at a rate linked to prime, have no specific maturity date and are subject to annual review. The facilities are in place to ensure liquidity (Note 36). | ||||||||
Borrowing powers | ||||||||
| To borrow money the directors may mortgage or encumber Telkom's property or any part thereof and issue debentures, whether secured or unsecured, whether outright or as security for debt, liability or obligation of Telkom or any third party. For this purpose the borrowing powers of the directors are unlimited. | ||||||||
F-33
20. Share capital and premium
Authorised and issued share capital and share premium are made up as follows:
| | 2002 Rm | 2003 Rm | 2004 Rm | ||||
|---|---|---|---|---|---|---|---|
| Authorised | 10,000 | 10,000 | 10,000 | ||||
| 999,999,998 (2003: 999,999,998, 2002: 1,000,000,000) ordinary shares of R10 each | 10,000 | 10,000 | 10,000 | ||||
| 1 (2003: 1, 2002: Nil) class A ordinary share of R10 | — | — | — | ||||
| 1 (2003: 1, 2002: Nil) class B ordinary share of R10 | — | — | — | ||||
Issued and fully paid | 8,293 | 8,293 | 8,293 | ||||
| 557,031,817 (2003: 557,031,817, 2002: 557,031,819) ordinary shares of R10 each | 5,570 | 5,570 | 5,570 | ||||
| 1 (2003: 1, 2002: Nil) class A ordinary share of R10 | — | — | — | ||||
| 1 (2003: 1, 2002: Nil) class B ordinary share of R10 | — | — | — | ||||
| Share premium | 2,723 | 2,723 | 2,723 | ||||
Pursuant to a special resolution passed at the annual general meeting of Telkom held on January 27, 2003, Telkom's authorised and issued share capital was altered by the conversion of one ordinary share held by Government into one class A ordinary share with a par value of R10 and one ordinary share held by Thintana Communications into one class B ordinary share with a par value of R10. | |||||||
The class A and B ordinary shares rank equally with the ordinary shares in respect of rights to dividends but differ in respect of the right to appoint directors. Full details of the voting rights of ordinary, class A and class B shares can be obtained from the Articles of Association of Telkom. | |||||||
The unissued shares are under the control of the Directors until the next Annual General Meeting. | |||||||
The directors have been given the authority to buy back the Company's own shares up to a limit of 20% of the total share capital. | |||||||
Preliminary listing costs | (44 | ) | — | — | |||
| Preliminary listing expenses represent costs incurred in 2002 by the Group in preparation for the initial public offering. These costs were deferred to be written off against share premium when new shares were issued. However this was expensed on September 30, 2002 as the Board decided not to issue additional shares on date of listing. | |||||||
Treasury shares | — | — | (238 | ) | |||
| 3,185,736 ordinary shares in Telkom, with a fair value of R251m, are currently held by its subsidiary Rossal No 65 (Proprietary) Limited. |
F-34
| | 2002 Rm | 2003 Rm | 2004 Rm | ||||
|---|---|---|---|---|---|---|---|
| 21. Non-distributable reserves | 134 | (11 | ) | 104 | |||
Balance at beginning of year | — | 134 | (11 | ) | |||
| Adoption of IAS 39 | 45 | — | — | ||||
| Movement during year | 89 | (145 | ) | 115 | |||
| Foreign currency translation reserve (net of tax of R5m, 2003: R11m, 2002: (R10m)) | 49 | (121 | ) | (83 | ) | ||
| Fair value adjustment on investments | 5 | (37 | ) | 9 | |||
| Life fund reserve (Cell Captive) | 35 | 13 | 189 | ||||
The balance comprises: | 134 | (11 | ) | 104 | |||
| Foreign currency translation reserve | 49 | (72 | ) | (155 | ) | ||
| Fair value adjustment on investments | 50 | 13 | 22 | ||||
| Cell Captive reserve | 35 | 48 | 237 |
The Group has two consolidated cell captives, one used as an investment to fund Telkom's post retirement medical aid liability and the other for short-term insurance.
In terms of the Short-term Insurance Act, 1998, the Vodacom Group cell captive partner, Nova Risk Partners Limited is required to raise a contingency reserve equal to 10% of premiums written less approved reinsurance (as defined in the Act). This reserve can be utilised only with the prior permission of the Registrar of Short-term Insurance.
The earnings from the cell captives are transferred to non-distributable reserves.
| | 2002 Rm | 2003 Rm | 2004 Rm | ||||
|---|---|---|---|---|---|---|---|
| 22. Minority interest | 133 | 194 | 200 | ||||
Opening balance | 116 | 133 | 194 | ||||
| Movement—current year | 17 | 61 | 6 | ||||
Reconciliation | 133 | 194 | 200 | ||||
| Balance at beginning of year | 116 | 133 | 194 | ||||
| Disposal | (41 | ) | — | — | |||
| Share of earnings | 59 | 105 | 69 | ||||
| Foreign currency translation reserves | — | (19 | ) | (9 | ) | ||
| Dividends paid | (1 | ) | (25 | ) | (54 | ) |
F-35
| | 2002 Rm | 2003 Rm | 2004 Rm | |||||
|---|---|---|---|---|---|---|---|---|
| 23. Retained earnings | 8,449 | 10,066 | 13,899 | |||||
Balance at beginning of year | 6,679 | 8,449 | 10,066 | |||||
| Adoption of IAS 39 | 584 | — | — | |||||
| Movement during year | 1,186 | 1,617 | 3,833 | |||||
| Net profit for the year | 1,221 | 1,630 | 4,523 | |||||
| Transfer to non-distributable reserves | (35 | ) | (13 | ) | (189 | ) | ||
| Dividend declared for the year | — | — | (501 | ) | ||||
The balance comprises: | 8,449 | 10,066 | 13,899 | |||||
| Company | 5,660 | 6,367 | 9,749 | |||||
| Joint venture | 2,678 | 3,485 | 3,951 | |||||
| Subsidiaries | 111 | 214 | 199 | |||||
Adoption of IAS 39 | ||||||||
On April 1, 2001 the Group prospectively adopted IAS 39 Financial Instruments: Recognition and Measurement. In accordance with IAS 39, adjustments have been made to reserves on the date of adoption, while comparative amounts have not been restated. | ||||||||
Increase in net profit | ||||||||
| Gross | 468 | |||||||
| Taxation | (140 | ) | ||||||
| Net | 328 | |||||||
| Increase in opening retained earnings | ||||||||
| Gross | 834 | |||||||
| Taxation | (250 | ) | ||||||
| Net | 584 | |||||||
F-36
| | | 2002 Rm | 2003 Rm | 2004 Rm | |||||||
|---|---|---|---|---|---|---|---|---|---|---|---|
| 24. Interest bearing debt | 22,533 | 17,453 | 12,703 | ||||||||
(a) Local debt | 17,991 | 16,000 | 10,983 | ||||||||
| Locally registered Telkom debt instruments | 15,101 | 14,436 | 9,412 | ||||||||
| Name, maturity, rate p.a., nominal value | |||||||||||
| TK01, 2008, 10%, R4,609m (2003: R4,491m, 2002: R4,594m) | 3,552 | 3,566 | 3,812 | ||||||||
| TL08, 2004, 13%, R2,299m (2003: R3,500m, 2002: R3,500m) | 3,272 | 3,368 | 2,286 | ||||||||
| TL03, 2003, 10.75%, RNil (2003: R4,311m, 2002: R5,000m) | 4,985 | 4,306 | — | ||||||||
| TL06, 2006, 10.5%, R1,455m (2003: R1,455m, 2002: R1,455m) | 1,435 | 1,438 | 1,440 | ||||||||
| TL20, 2020, 6%, R2,500m (2003: R2,500m, 2002: R2,500m) | 1,119 | 1,136 | 1,155 | ||||||||
| PP01, 2002, 12.5%, RNil (2003: RNil, 2002: R200m) | 200 | — | — | ||||||||
| PP02, 2010, 0%, R430m (2003: R430m, 2002: R430m) | 132 | 152 | 174 | ||||||||
| PP03, 2010, 0%, R1,350m (2003: R1,350m, 2002: R1,350m) | 406 | 470 | 545 | ||||||||
Local bonds | |||||||||||
| The local Telkom bonds are unsecured, but contain a number of restrictive covenants, which limit Telkom's ability to create encumbrances on revenues or assets, and to secure any indebtedness without securing the outstanding bonds equally and rateably with such indebtedness. TL20 loan contain restrictive financial covenants. | |||||||||||
Telkom is a buyer or seller of last resort in the Telkom bond TK01. To eliminate the resultant exposure Telkom sells or buys government bonds. The objective of the hedging relationship is to eliminate price risk whereby value changes on the TK01 transactions are in total offset by value changes in the government stock. | |||||||||||
Repurchase agreements | 21 | 167 | 27 | ||||||||
Commercial paper bills | 2,387 | 1,397 | 1,542 | ||||||||
| 2003 - 2005, 13.5% to 15.13%, R1,708m (2003: R1,766m, 2002: R2,962m). | |||||||||||
Interest bearing loans | 482 | — | — | ||||||||
| Commerzbank AG | 100 | — | — | ||||||||
| The loan was uncollateralised, bore interest at a fixed quarterly rate of 13.7% and was repaid on March 17, 2003. | |||||||||||
Credit Agricole Indosuez | 100 | — | — | ||||||||
| The loan was uncollateralised, bore interest at a fixed quarterly rate of 14.0% NACQ and was repaid on March 17, 2003. | |||||||||||
Vodacom (Proprietary) Limited | 13 | — | — | ||||||||
Vodacom Tanzania Limited | 269 | — | — | ||||||||
| The loan of US$47m (Group share: US$24m) from Standard Bank of London was collateralised, bore interest at an effective interest rate of LIBOR plus 1.5% and was repaid during August 2002. | |||||||||||
Interest free long-term loans | |||||||||||
| Sekha-Metsi Consortium Limited (unsecured) | — | — | 2 | ||||||||
(b) Foreign debt | 5,663 | 5,098 | 4,574 | ||||||||
| United States Dollar: 2002 - 2003, 3.14%, $Nil (2003: $1,2m, 2002: $4m) | 42 | 10 | — | ||||||||
| Euro: 2002 - 2005, 0.10% - 7.13%, €512m (2003: €512m, 2002: €514m) | 5,133 | 4,445 | 3,988 | ||||||||
| South African Rand: 2009, 10.56%, RNil (2003: RNil, 2002: R359m) | 359 | — | — | ||||||||
Planetel Communications Limited | 10 | 24 | 18 | ||||||||
F-37
| The shareholder loan of US$10m (2003: US$10m, 2002: US$2m) (Group share: US$5m, 2003: US$5m, 2002: US$1m), is subordinated for the duration of the project finance funding period of Vodacom Tanzania Limited, bears no interest from April 1, 2002 (2002: 1%), and is thereafter available for repayment, by approval of at least 60% of the shareholders of Vodacom Tanzania Limited. The loan was re-measured at amortised cost at an effective interest rate of LIBOR plus 5%. The gain on re-measurement was included in the income statement. | |||||||||||
Caspian Construction Company Limited | 11 | 21 | 21 | ||||||||
| The shareholder loan of US$8m (2003: US$8m, 2002: US$2m) (Group share: US$4m, 2003: US$4m, 2002: US$1m) is subordinated for the duration of the project finance funding period of Vodacom Tanzania Limited, bears no interest from April 1, 2002 (2002: 1%), and is thereafter available for repayment, by approval of at least 60% of the shareholders of Vodacom Tanzania Limited. The loan was re-measured at amortised cost at an effective interest rate of LIBOR plus 5%. The gain on re-measurement was included in the income statement. | |||||||||||
Extended credit facility to Vodacom Congo (RDC) s.p.r.l. | — | 169 | 155 | ||||||||
| Vodacom Congo (RDC) s.p.r.l's extended credit facility amounts to €39m (Group share: €20m), which is partially collateralised by guarantees of cash deposit, and bears interest at a rate between EURIBOR plus 1.50% and EURIBOR plus 1.75%. The facility will be fully repaid by July 31, 2005. | |||||||||||
Revolving credit facility to Vodacom Congo (RDC) s.p.r.l. | — | 65 | 156 | ||||||||
| Vodacom's share of the short-term revolving credit facility provided by ABSA amounts to US$16m (2003: US$16m) (Group share: US$8m, 2003: US$8m). The credit facility is collateralised by guarantees provided by the Group, which bears interest at an effective interest rate of LIBOR plus 1.5% and is available until December 31, 2004. | |||||||||||
Vodacom's share of the short-term Euro revolving credit facility provided by Standard finance (Isle of Man) Limited amounts to €12m (2003: €Nil) (Group share: €6m, 2003: €Nil). The credit facility is collateralised by guarantees provided by Vodacom and bears interest at an effective interest rate of EURIBOR plus 1.5%. | |||||||||||
Vodacom's share of the short-term Dollar revolving credit facility provided by Standard Finance (Isle of Man) Limited amounts to US$19m (2003: US$Nil) (Group share: US$10m, 2003: US$Nil). The credit facility is collateralised by guarantees provided by Vodacom and bears interest at an effective interest rate of LIBOR plus 1.5%. | |||||||||||
| Project finance funding for Vodacom Tanzania Limited | — | 251 | 174 | ||||||||
| The drawn down portions of the project finance funding from external parties includes the following: | |||||||||||
| (a) | Netherlands Development Finance Company US$11m (Group share: US$6m) | ||||||||||
| (b) | DEG €12m (Group share: €6m) | ||||||||||
| (c) | Standard Corporate and Merchant Bank US$16m (Group share: US$8m) (2003: US$20m (Group share: US$10m)) | ||||||||||
F-38
| (d) | Barclays Bank (Local Syndicate Tanzania) TSH15,356m (2003: TSH 19,744m) (Group share: TSH7,678m, 2003: TSH9,872m) is collateralised by a charge over 51% of the shares, the license and Vodacom Tanzania Limited's tangible and intangible assets. The loans bear interest based upon the foreign currency denomination of the project financing between 4.9% and 11.6% per annum and will be fully repaid by March 2009. | ||||||||||
Loan to Vodacom Congo (RDC) s.p.r.l. | — | 35 | — | ||||||||
| Vodacom's share of the loan provided by Standard Finance (Isle of Man) Limited amounted to US$9m (Group share: US$5m) at March 31, 2003. The loan bore interest at an effective rate of LIBOR plus 1.5% and was repaid on July 1, 2003. | |||||||||||
Vodacom Congo (RDC) s.p.r.l. | — | 3 | 2 | ||||||||
| Vodacom's share of the short-term facility amounts to US$1m (Group share: US$0,5m). The facility bears interest at 18% per annum. The facility is subject to termination of the collection agreement. | |||||||||||
Preference shares issued by Vodacom Congo (RDC) s.p.r.l | 108 | 75 | 60 | ||||||||
| The preference shares of US$19m (Group share: US$9m) bear interest at a rate of 4% per annum. The preference shares are redeemable, but only after the first three years from date of inception and only on the basis that the shareholders are repaid simultaneously and in proportion to their shareholding. | |||||||||||
(c) Finance leases | 1,033 | 1,114 | 1,197 | ||||||||
The finance leases are secured by land and buildings with a book value of R616m (2003: R635m, 2002: R617m) (Note 10). These amounts are repayable within periods ranging from 4 to 15 years. Interest rates vary between 12.10% and 16.90% (2003: 13.44% and 18.3%) (Note 37). | |||||||||||
Less: Current portion of interest bearing debt | (2,154 | ) | (4,759 | ) | (4,051 | ) | |||||
Local debt | (1,982 | ) | (4,527 | ) | (3,628 | ) | |||||
| Locally registered Telkom debt instruments | (200 | ) | (4,306 | ) | (2,286 | ) | |||||
| Repurchase agreements | (21 | ) | (167 | ) | (27 | ) | |||||
| Commercial paper bills | (1,278 | ) | (54 | ) | (1,313 | ) | |||||
| Long-term loans | (201 | ) | — | — | |||||||
| Short-term loans | (282 | ) | — | — | |||||||
| Short-term interest free loans | — | — | (2 | ) | |||||||
Foreign debt | (167 | ) | (225 | ) | (408 | ) | |||||
| Finance lease | (5 | ) | (7 | ) | (15 | ) | |||||
Included in long-term and short-term debt is: | |||||||||||
| Guaranteed debt | 4,088 | 3,683 | 3,906 | ||||||||
| By the South African Government | 3,729 | 3,683 | 3,906 | ||||||||
| By South African Banks | 359 | — | — | ||||||||
A major portion of the guarantee debt relates to the TK01 debt instrument.
Telkom may issue or re-issue locally registered debt instruments in terms of the Post Office Amendment Act 85 of 1991. These borrowing powers are set out in the Company's Articles of Association.
F-39
Repurchase agreements
The Group actively manages a portfolio of repurchase agreements in the South African capital and money markets with a view to financing short-term liquidity gaps. Interest paid by the Group is based on the current market-related yield.
| | | 2002 Rm | 2003 Rm | 2004 Rm | ||||
|---|---|---|---|---|---|---|---|---|
| 2004 | ||||||||
| Maturity period | Yield | |||||||
| 7 days | 9.3% | 27 | ||||||
2003 | ||||||||
| Maturity period | Yield | |||||||
| 1 day | 10.8% - 11.54% | 167 | ||||||
2002 | ||||||||
| Maturity period | Yield | |||||||
| 13 days | 13.10% | 1 | ||||||
| 5 days | 13.02% - 13.30% | 20 | ||||||
| 21 | ||||||||
Due to the short-term nature of these transactions and the fact that the transactions are initiated based on market-related interest rates, the carrying value approximates the fair value.
Collateral in the form of publicly tradable bonds has been delivered in respect of the above transactions.
The terms and conditions of these transactions are governed by signed ISMA agreements with all counter parties and the regulations of the BESA. The fair value has been derived with reference to BESA quoted prices.
25. Repayment of total interest-bearing debt
| | 2002 Rm | 2003 Rm | 2004 Rm | ||||
|---|---|---|---|---|---|---|---|
| Total interest bearing debt | 24,687 | 22,212 | 16,754 | ||||
| Gross interest bearing debt | 29,190 | 26,181 | 20,151 | ||||
| Discount on debt instruments issued | (4,503 | ) | (3,969 | ) | (3,397 | ) |
F-40
| Year repayable | 2002 Total Rm | 2003 Total Rm | 2004 Foreign Rm | 2004 Local Rm | 2004 Total Rm | |||||
|---|---|---|---|---|---|---|---|---|---|---|
| 2002/2003 | 2,073 | — | — | — | — | |||||
| 2003/2004 | 5,072 | 4,768 | — | — | — | |||||
| 2004/2005 | 4,955 | 5,173 | 408 | 3,789 | 4,197 | |||||
| 2005/2006 | 5,278 | 4,682 | 3,940 | 287 | 4,227 | |||||
| 2006/2007 | 1,834 | 1,553 | 58 | 1,495 | 1,553 | |||||
| 2007/2008 | 4,594 | 4,576 | 44 | 4,666 | 4,710 | |||||
| 2008/2009 | 359 | 127 | 39 | 96 | 135 | |||||
| Thereafter | 5,025 | 5,302 | 85 | 5,244 | 5,329 | |||||
| 29,190 | 26,181 | 4,574 | 15,577 | 20,151 | ||||||
2002 Rm | 2003 Rm | 2004 Rm | |||||
|---|---|---|---|---|---|---|---|
| 26. Provisions | 2,590 | 2,540 | 2,438 | ||||
Employee related | 4,173 | 4,299 | 4,008 | ||||
| Annual leave | 463 | 417 | 401 | ||||
| Balance at beginning of year | 450 | 463 | 417 | ||||
| Charged to employee expenses | 136 | 114 | 162 | ||||
| Leave utilised or paid | (123) | (160) | (178) | ||||
Medical aid (Note 29) | 2,154 | 2,289 | 2,420 | ||||
| Balance at beginning of year | 2,183 | 2,154 | 2,289 | ||||
| Interest cost | 224 | 225 | 249 | ||||
| Current service cost | 14 | 20 | 24 | ||||
| Actuarial gain | (5) | (5) | — | ||||
| Settlement and curtailment (gain)/loss | (5) | 22 | (1) | ||||
| Termination settlement | (144) | (13) | (9) | ||||
| Contributions | (113) | (114) | (132) | ||||
Retirement and pension fund deficits | 759 | 474 | — | ||||
| Balance at beginning of year | 985 | 759 | 474 | ||||
| Repayment of the deficit | (307) | (325) | (518) | ||||
| Interest cost | 119 | 86 | 44 | ||||
| Curtailment gain | (38) | (9) | — | ||||
| Realisation of fund reserve | — | (37) | — | ||||
Sick leave | 315 | 349 | 338 | ||||
| Balance at beginning of year | 332 | 315 | 349 | ||||
| Net current service cost | (17) | 34 | (11) | ||||
Telephone rebates (Note 29) | 146 | 162 | 164 | ||||
| Balance at beginning of year | 134 | 146 | 162 | ||||
| Interest cost | 10 | 24 | 19 | ||||
| Current service cost | 2 | 3 | 4 | ||||
| Actuarial gain | — | (11) | (21) | ||||
Bonus | 336 | 608 | 685 | ||||
| Balance at beginning of year | 284 | 336 | 608 | ||||
| Charged to employee expenses | 224 | 460 | 546 | ||||
| Payment | (172) | (188) | (469) | ||||
F-41
Non-employee related | 392 | 396 | 88 | ||||
| Supplier dispute (Note 38) | 375 | 356 | — | ||||
| Balance at beginning of year | — | 375 | 356 | ||||
| Charged/(released) to selling, general and administrative expenses | 375 | (19) | (356) | ||||
Warranty provision | 1 | 5 | 17 | ||||
| Balance at beginning of year | — | 1 | 5 | ||||
| Charged to selling, general and administrative expenses | 20 | 5 | 14 | ||||
| Provisions utilised | (19) | (1) | (2) | ||||
Other | 16 | 35 | 71 | ||||
| Balance at beginning of year | 19 | 16 | 35 | ||||
| Charged to selling, general and administrative expenses | 38 | 28 | 71 | ||||
| Provision utilised | (41) | (9) | (35) | ||||
Less: Current portion of provisions | (1,975) | (2,155) | (1,658) | ||||
| Annual leave | (463) | (417) | (401) | ||||
| Medical aid | (200) | (150) | (158) | ||||
| Retirement and pension fund deficits | (258) | (221) | — | ||||
| Sick leave | (315) | (349) | (338) | ||||
| Telephone rebate | (11) | (14) | (12) | ||||
| Bonus | (336) | (608) | (685) | ||||
| Supplier dispute | (375) | (356) | — | ||||
| Warranty provision | (1) | (5) | (17) | ||||
| Other | (16) | (35) | (47) | ||||
Annual leave
In terms of the Group's policy, employees are entitled to accumulate vested leave benefits not taken within a leave cycle, to a cap of 28 days for Telkom and 45 days for Vodacom. This is reviewed annually and is in accordance with legislation.
Sick leave
Sick leave provision is determined in accordance with the Group's policy. This represents amounts accrued to the benefit of the employees and may be paid, due to the inability of an employee to render services for an extended period due to illness.
Bonus
The Telkom bonus scheme consists of performance bonuses which are dependent on achievement of certain financial and non-financial targets. The bonus is payable once every year after the Company results have been made public. To qualify staff members must be in service on the financial results date.
The Vodacom's bonus provision consists of a performance bonus based on profit achievement. The performance bonus is payable in May each year to members of management and is payable bi-annually in December and May to staff members. The maximum bonus payable is determined by applying a specific formula based upon Vodacom achieving a pre-determined profit and the employee's achievement of specified performance targets. Management and staff must be in service on May 31 to qualify for the bonus.
F-42
Deferred bonus incentive
The Vodacom's deferred bonus incentive provision represents the present value of the expected future cash out flows of the entitlement value at the balance sheet date less the value at which the entitlements were issued, multiplied by the number of entitlements allocated to a participant.
The value of the bonus entitlements are determined based upon the audited consolidated financial statements of the Vodacom Group. Periodically, a number of entitlements are issued to employees, the value of which depends on the seniority of the employee. The participating rights of employees vest at different stages and employees are entitled to cash in their entitlements within one year after the participating rights have vested. The provision is utilised when eligible employees receive the value of vested entitlements.
Supplier dispute
Telkom provided RNil (2003: R356m, 2002: R375m) for its estimate of a probable liability which includes interest and legal fees (Note 38).
Warranty provision
During the 2002 financial year, the warranty provision was created in Vodacom to cover manufacturing defects in the second year of warranty on handsets sold to customers.
Other
Other provisions include provisions for losses as a result of onerous contracts, advertising co-operation provision funds received from suppliers of handsets and various other smaller provisions.
The provisions for onerous contracts represents the Group's liability in respect of onerous lease contracts related to certain buildings. The provision is discounted for the respective periods of the lease contracts.
The advertising co-operation provision is based on a percentage of the purchase price of handsets purchased by Vodacom Service Provider Company (Proprietary) Limited from the various handset manufacturers. This provision is realised when the company provides evidence to the handset manufacturer that the company has incurred advertising expenditure in accordance with the manufacturers' co-operation rules. The external service providers can claim future advertising expenditure incurred by them per manufacturer from this provision, based on their purchases from the company. The provision represents the advertising expenditure not yet spent by the company or external service providers.
| | 2002 Rm | 2003 Rm | 2004 Rm | |||
|---|---|---|---|---|---|---|
| 27. Trade and other payables | 6,663 | 5,229 | 6,007 | |||
Trade payables | 4,877 | 2,801 | 3,435 | |||
| Finance cost accrued | 1,126 | 532 | 463 | |||
| Accruals | 660 | 1,896 | 2,109 |
F-43
2002 Rm | 2003 Rm | 2004 Rm | ||||
|---|---|---|---|---|---|---|
| 28. Deferred income | 958 | 1,030 | 1,345 |
Included in deferred income is profit on the sale and leaseback of certain Telkom buildings of R162m (2003: R173m, 2002: R184m). A profit of R11m is recognised in income on a straight line basis, over the period of the lease ending 2019.
29. Employee benefits
The Group provides benefits for all its permanent employees through the Telkom Pension Fund, the Telkom Retirement Fund and the Vodacom Group Pension Fund. Membership is compulsory. In addition, certain retired employees of Telkom SA Limited receive medical aid and a telephone rebate. All of the liabilities are actuarially determined and valuations performed at intervals not exceeding three years. Actuarial calculations are performed in the periods between valuations.
At March 31, 2004, the Group employed 37,543 employees (2003: 40,129; 2002: 43,960), of which 312 represents employees affected by the restructuring.
The Telkom Pension Fund
The Telkom Pension Fund is a defined benefit fund that was created in terms of the Post Office Amendment Act 85 of 1991. All employees who were members of the Government Service Pension Fund and Temporary Employees Pension Fund were transferred to a newly established Telkom Pension Fund. The deficits that existed in the aforementioned State Funds were transferred to the Telkom Pension Fund. Legislation also made provision that Telkom would guarantee the financial obligations of the Telkom Pension Fund. The SA Government guaranteed the actuarially valued deficit of the Telkom Pension Fund as at September 20, 1991, plus interest as determined by the State Actuary. Telkom can only benefit from the surplus through contribution holidays, if the funding level exceeds 100%. The most recent statutory valuation of the Telkom Pension Fund was performed as at March 31, 2002. The latest actuarial calculation performed at March 31, 2004 indicates that the pension fund is in a surplus funding position of R29m.
F-44
With effect from July 1, 1995, the Telkom Pension Fund was closed to new members. The funded status of the Telkom Pension Fund is disclosed below:
| | 2002 Rm | 2003 Rm | 2004 Rm | ||||
|---|---|---|---|---|---|---|---|
| Telkom Pension Fund | |||||||
Present value of funded obligation | 167 | 162 | 190 | ||||
| Fair value of plan assets | (150 | ) | (211 | ) | (219 | ) | |
| Funded status | 17 | (49 | ) | (29 | ) | ||
| Unrecognised net actuarial loss | (86 | ) | (50 | ) | (100 | ) | |
| Unrecognised net assets | (69 | ) | (99 | ) | (129 | ) | |
| The surplus is not recognised due to the legal status of surpluses in South Africa. | |||||||
| Expected return on plan assets | 24 | 28 | 31 | ||||
| Actuarial gain/(loss) on plan assets | 7 | (28 | ) | (41 | ) | ||
| Actual return /(loss) on plan assets | 31 | — | (10 | ) | |||
Principal actuarial assumptions were as follows: | |||||||
| Discount rate (%) | 15.0 | 11.5 | 10.0 | ||||
| Expected return on plan assets (%) | 10.0 | 14.0 | 10.0 | ||||
| Salary inflation rate (%) | 7.5 | 8.0 | 7.0 | ||||
| Pension increase allowance (%) | 5.2 | 4.7 | 3.8 | ||||
Funding level per actuarial valuation (%) | 91.0 | 94.0 | 94.0 | ||||
| The number of employees registered under the Telkom Pension Fund Plan | 448 | 382 | 339 |
The Telkom Retirement Fund
The Telkom Retirement Fund was established on July 1, 1995 as a defined contribution plan. Existing employees were given the option to either remain in the Telkom Pension Fund or to be transferred to the Telkom Retirement Fund. All pensioners of the Telkom Pension Fund and employees who retired after July 1, 1995 were transferred to the Telkom Retirement Fund. At the same time the proportionate share of the deficit relating to the transferring employees and pensioners was transferred to the Telkom Retirement Fund. Upon transfer the Government ceased to guarantee the deficit in the Telkom Retirement Fund. Subsequent to July 1, 1995 further transfers of existing employees occurred. The most recent statutory valuation of the Telkom Retirement fund was performed as at March 31, 2002.
The Telkom Retirement Fund is governed by the Pension Funds Act, Act No. 24 of 1956. In terms of section 37A of this Act, the pension benefits payable to the pensioners cannot be reduced.
The Telkom Retirement Fund is a defined contribution fund with regards to in-service members. On retirement, an employee is transferred from the defined contribution plan to a defined benefit plan. Telkom guarantees a minimum benefit to retirees that is based on their contributions and the performance of the defined contribution plan at retirement date. Increases in the benefit subsequent to an employee's retirement are also guaranteed.
Telkom guarantees any actuarial shortfall of the pensioner pool in the retirement fund. This liability is initially funded through assets of the retirement fund. The latest actuarial calculation performed at March 31, 2004 indicates that the retirement fund is in a surplus funding position of R378m.
F-45
In December 2001 the Pension Funds Second Amendment Act was promulgated. The Act generally provides for:
- •
- the payments of enhanced benefits to former members and minimum pension increases for pensioners; and
- •
- the appointment of any actuarial surplus existing in the fund, at the apportionment date, in an equitable manner between existing members, including pensioners, former members and the employer in such proportions as the Trustees of the fund shall determine.
Unless this process has been finalised, Telkom cannot recognise the surplus in the fund.
The funded status of the Telkom Retirement Fund is disclosed below.
| | 2002 Rm | 2003 Rm | 2004 Rm | ||||
|---|---|---|---|---|---|---|---|
| Telkom Retirement Fund | |||||||
Deficit (Originated on transfer from Telkom Pension Fund on July 1, 1995 and transfers thereafter). | |||||||
| Actuarial calculation/valuation | 742 | 474 | — | ||||
| Present value of funded obligation | 3,055 | 2,679 | 3,162 | ||||
| Fair value of plan assets | (3,805 | ) | (3,106 | ) | (3,540 | ) | |
| Funded status | (750 | ) | (427 | ) | (378 | ) | |
| Unrecognised net actuarial gain/(loss) | 460 | (190 | ) | (382 | ) | ||
| Unrecognised net assets | (290 | ) | (617 | ) | (760 | ) | |
| Expected return on plan assets | 444 | 479 | 421 | ||||
| Actuarial (loss)/gain on plan assets | (60 | ) | (699 | ) | 318 | ||
| Actual return on plan assets | 384 | (220 | ) | 739 | |||
Included in fair value of plan assets is: | |||||||
| Office buildings occupied by Telkom | 111 | 127 | 127 | ||||
| Telkom bonds | 63 | 27 | 46 | ||||
| Telkom shares | — | 28 | 121 | ||||
Principal actuarial assumptions were as follows: | |||||||
| Discount rate (%) | 12.2 | 11.5 | 10.0 | ||||
| Expected return on plan assets (%) | 14.0 | 14.0 | 10.0 | ||||
| Salary inflation rate (%) | 7.5 | 8.0 | 7.0 | ||||
| Pension increase allowance (%) | 5.2 | 4.7 | 3.8 | ||||
Funding level per actuarial valuation (%) | 84 | 84 | 84 | ||||
| The number of pensioners registered under the Telkom Retirement Fund Plan | 13,963 | 13,756 | 14,268 | ||||
| The number of in-service employees registered under the Telkom Retirement Fund | 38,927 | 34,974 | 32,017 |
Vodacom Group Pension Fund
All eligible employees of Vodacom and its wholly owned subsidiaries are members of the Vodacom Group Pension Fund, a defined contribution pension scheme. Executive employees of Vodacom and its wholly owned subsidiaries also have the option to be members of Vodacom Group executive Provident Fund, a defined contribution provident scheme. Both schemes are administered by ABSA Consultants
F-46
and Actuaries (Proprietary) Limited. The Group's share of the contribution to the pension fund amounted to R33m (2003: R26m, 2002: R21m). The Group's share of the contribution to the Provident Fund amounted to R3m (2003: R3m, 2002: R1m). The Vodacom employees at March 31, 2004 were 4,609 (2003: 4,406, 2002: 4,353). The fund is governed by the Pension Funds Act No 24 of 1956.
Medical benefits
Telkom SA Limited makes certain contributions to medical funds in respect of current and retired employees. The scheme is a defined benefit plan. The expense in respect of current employees' medical aid is disclosed in Note 5.1. The amounts due in respect of post-retirement medical benefits to current and retired employees have been actuarially determined and provided for as set out in Note 26. The Group has terminated future post-retirement medical benefits in respect of employees joining after July 1, 2000.
There are three major categories of members entitled to the post retirement medical aid: pensioners who retired before 1994 ("Pre-94"); those who retired after 1994 ("Post-94"); and the in-service members. The Post-94 and the in-service members' liability is subject to a rand cap, which increases annually with the average salary increase.
Eligible employees must be employed by Telkom until retirement age to qualify for the post retirement medical aid. The most recent valuation of the benefit was performed as at March 31, 2002. The next valuation for the fund will be in 2005. The Company has allocated certain investments to fund this liability as set out in Note 13. These investments do not qualify as plan assets.
The status of the medical aid liability is disclosed below:
| | 2002 Rm | 2003 Rm | 2004 Rm | |||
|---|---|---|---|---|---|---|
| Medical aid | ||||||
Present value of unfunded obligation | 1,886 | 2,161 | 2,378 | |||
| Unrecognised net actuarial gain | 268 | 128 | 42 | |||
| Liability as disclosed in the balance sheet (Note 26) | 2,154 | 2,289 | 2,420 | |||
Principal actuarial assumptions were as follows: | ||||||
| Discount rate (%) | 15.0 | 11.5 | 10.0 | |||
| Salary inflation (%) | 7.5 | 8.0 | 7.0 | |||
| Medical inflation rate (%) | 10.5 | 10.5 | 8.0 | |||
| Withdrawal rate (%) | 30.0 | 30.0 | 15.0 | |||
| Actual retirement age | 65 | 65 | 65 | |||
| Average retirement age | 63 | 63 | 63 | |||
| Number of members | 32,013 | 27,305 | 23,522 | |||
| The number of pensioners | 8,180 | 8,180 | 8,233 |
Telephone rebates
Telkom SA Limited provides telephone rebates to its pensioners. The most recent valuation was performed in March 2004. Eligible employees must be employed by Telkom until retirement age to qualify for the telephone rebates. The scheme is a defined benefit plan.
F-47
The status of the telephone rebate liability is disclosed below:
| | 2002 Rm | 2003 Rm | 2004 Rm | |||
|---|---|---|---|---|---|---|
| Present value of unfunded obligation (Note 26) | 146 | 162 | 164 | |||
Principal actuarial assumptions were as follows: | ||||||
| Discount rate (%) | 15.0 | 11.5 | 10.0 | |||
| Rebate inflation rate (%) | 7.5 | 8.0 | 5.0 | |||
| Actual retirement age | 65 | 65 | 65 | |||
| Average retirement age | 63 | 63 | 63 | |||
| Number of members | 28,740 | 23,427 | 21,867 | |||
| The number of pensioners | 12,305 | 14,023 | 11,686 |
Employee share awards
Telkom's shareholders approved the Telkom Employee Conditional Share Plan at the January 2004 Annual General Meeting. The scheme covers both operational and management employees and is aimed at giving shares to Telkom employees, at a RNil exercise price, at the end of the vesting period. The vesting period for the operational employee share award is 0% in year one, and 33% in each of the years thereafter, while management share award vests fully after 3 years. Although the number of shares allocated to employees will be communicated at the grant date, the ultimate number of shares that vest may differ based on certain performance conditions being met.
The Telkom Board approved the first grant of 3.2 million shares before year end. The allocaton to the employees did however not take place in the current year. No consideration is payable on the shares issued to employees, but performance criteria will need to be met in order for the shares to vest.
F-48
| | 2002 Rm | 2003 Rm | 2004 Rm | |||||
|---|---|---|---|---|---|---|---|---|
| 30. Reconciliation of profit after taxation to cash generated from operations | 11,583 | 12,063 | 15,770 | |||||
Profit after taxation | 1,280 | 1,735 | 4,592 | |||||
| Finance charges | 2,550 | 4,154 | 3,264 | |||||
| Taxation | 873 | 1,049 | 1,711 | |||||
| Investment income | (512 | ) | (424 | ) | (479 | ) | ||
| Listing Costs | — | 154 | — | |||||
| Non-cash items | 5,713 | 6,299 | 6,518 | |||||
| Depreciation, amortisation, impairment and write-offs | 5,853 | 6,498 | 7,249 | |||||
| Decrease in provisions | (110 | ) | (139 | ) | (687 | ) | ||
| Profit on disposal of property, plant and equipment | (30 | ) | (15 | ) | (19 | ) | ||
| Profit on disposal of investment | — | (89 | ) | (25 | ) | |||
| Share issue expenses reversed | — | 44 | — | |||||
| Decrease/(increase) in working capital | 1,679 | (904 | ) | 164 | ||||
| Inventories | 246 | (26 | ) | 115 | ||||
| Accounts receivable | (144 | ) | (107 | ) | (275 | ) | ||
| Accounts payable | 1,577 | (771 | ) | 324 | ||||
31. Finance charges paid | (3,026 | ) | (2,776 | ) | (1,255 | ) | ||
Finance charges per income statement | (2,550 | ) | (4,154 | ) | (3,264 | ) | ||
| Non-cash items | (476 | ) | 1,378 | 2,009 | ||||
| Movements in interest accruals | 548 | (552 | ) | 643 | ||||
| Net discount amortised | 663 | 592 | 581 | |||||
| Fair value adjustment | (3,036 | ) | 2,074 | 1,130 | ||||
| Unrealised loss/(gain) | 1,704 | (736 | ) | (345 | ) | |||
| IAS 39 application adjustment | (355 | ) | — | — | ||||
32. Taxation (paid)/refunded | (914 | ) | 102 | (562 | ) | |||
Net asset at beginning of year | 795 | 888 | 99 | |||||
| Interest accrual on tax receivable | 4 | 40 | — | |||||
| Taxation | (825 | ) | (727 | ) | (1,107 | ) | ||
| Business combination | — | — | (14 | ) | ||||
| Net (asset)/liability at end of year | (888 | ) | (99 | ) | 460 | |||
33. Dividend paid | — | (25 | ) | (548 | ) | |||
Dividends payable beginning of year | — | — | — | |||||
| Dividends declared | — | — | (501 | ) | ||||
| Dividends paid to minority shareholders | — | (25 | ) | (54 | ) | |||
| Dividends payable end of year | — | — | 7 | |||||
F-49
34. Disposal of subsidiaries and joint ventures
The Group's 50% joint venture company, Vodacom, disposed of the following:
On February 27, 2002, its 51% interest in Vodacom Sport and Entertainment (Proprietary) Limited;
On November 30, 2001, its 40% interest in Vodacom World Online (Proprietary) Limited; and on March 31, 2002, its 100% interest in Film Fun Holdings (Proprietary) Limited; Teljoy Botswana (Proprietary) Limited; and Africell Cellular Services (Proprietary) Limited.
These disposals were effected in order to dispose of non-core operations.
| | 2002 Rm | 2003 Rm | 2004 Rm | |||
|---|---|---|---|---|---|---|
| Aggregate carrying value of net assets disposed of | 38 | |||||
Property, plant and equipment | 36 | |||||
| Inventory | 3 | |||||
| Accounts receivable | 121 | |||||
| Accounts payable | (167 | ) | ||||
| Intangibles | 11 | |||||
| Investments | 5 | |||||
| Loan | 14 | |||||
| Cash and cash equivalents | 15 | |||||
Minority interest | (2 | ) | ||||
| Profit on disposal | 8 | |||||
| Disposal proceeds | 44 | |||||
| Cash and cash equivalents | (15 | ) | ||||
| Net cash consideration | 29 | |||||
| Settlement method | ||||||
| Net cash inflow from disposals | 13 | 16 | ||||
| Cash | 29 | 16 | ||||
| Current receivables | (16 | ) | — |
The total amount of R16m, which includes accrued interest, was received during the 2003 financial year
F-50
35. Acquisition of subsidiaries, joint ventures and minority shareholders' interests
| | 2002 Rm | 2003 Rm | 2004 Rm | ||||
|---|---|---|---|---|---|---|---|
| The following acquisitions were made: | |||||||
By the Company | (182 | ) | |||||
| On October 11, 2001, an additional 10% of Telkom Directory Services (Proprietary) Limited, bringing the Group's share to 64.9% | (160 | ) | |||||
| On May 16, 2001, an additional 40% of Swiftnet (Proprietary) Limited, bringing the Group's shareholding to 100% | (22 | ) | |||||
| During the 2004 financial year, a 100% shareholding in Rossal No 65 (Proprietary) Ltd for R1,000. | — | ||||||
By the Group's 50% joint venture, Vodacom | |||||||
During the 2003 financial year the Group exercised its option included in the finance lease agreement and acquired 100% of Skyprops 157 (Proprietary) Limited. | — | ||||||
On March 1, 2004, a 51% interest in the equity of Smartphone SP (Proprietary) Limited, which has a 100% shareholding in Stand 13 Eastwood Road Dunkeld (Proprietary) Limited and 52% in Ithuba Smartcall (Proprietary) Limited. | — | ||||||
The aggregate fair value of assets acquired and liabilities assumed on the purchase of subsidiaries and joint ventures were as follows: | |||||||
Aggregate fair value of net assets acquired | (5 | ) | |||||
| Property, plant and equipment | (3 | ) | |||||
| Investment properties | (5 | ) | |||||
| Trademarks, copyrights and other | (194 | ) | |||||
| Investments | (8 | ) | |||||
| Inventory | (16 | ) | |||||
| Accounts receivable | (58 | ) | |||||
| Cash and cash equivalents | (75 | ) | |||||
| Deferred taxation liability (including tax effect on intangibles) | 60 | ||||||
| Accounts payable | 279 | ||||||
| Taxation payable | 15 | ||||||
| Goodwill | (112 | ) | |||||
| Purchase price (including capitalised costs) | (117 | ) | |||||
| Cash and cash equivalents | 75 | ||||||
| Cash consideration | (42 | ) | |||||
| Less: amount payable | 117 | ||||||
| 75 | |||||||
The purchase price of R231m (Group share: R116m) was paid on April 7, 2004. The outstanding amount accrued interest at prime less 2% per annum from March 1, 2004 up to the date of payment.
The company has a contingent asset of R70,1 million. Should this contingent asset realise in the following year, an adjustment will be made to the purchase price and goodwill.
No minority interest exists on acquisition as a result of the negative net equity position of the company.
F-51
VM S.A.R.L trading as Vodacom Mozambique
During the 2004 financial year VM S.A.R.L trading as Vodacom Mozambique commenced operations. This transaction had no initial cash effect on the Group's cash flows.
36. Undrawn borrowing facilities and guarantees
36.1 Rand denominated facilities and guarantees
Telkom has general banking facilities of R1,118m with R1,083m unutilised at March 31, 2004. The facilities are unsecured, bear interest at a rate linked to prime, have no specific maturity date and are subject to annual review.
The Group exposure is 50% of the following items:
Vodacom has a rand denominated credit facility totalling R3,949m with R3,538m unutilised at March 31, 2004. The facilities are uncommitted and can also be utilised for foreign loans and are subject to review at various dates (usually on an annual basis).
| Guarantor | Details | Beneficiary | 2002 Rm | 2003 Rm | 2004 Rm | |||||
|---|---|---|---|---|---|---|---|---|---|---|
| Vodacom (Proprietary) Limited | All guarantees less than R2m in terms of various lease agreements | Various | 3 | 3 | 3 | |||||
Vodacom Service Provider Company (Proprietary) Limited | All guarantees less than R2m in terms of various lease agreements | Various | 1 | 2 | 3 | |||||
Vodacom Group (Proprietary) Limited | Guarantee in respect of receipt of independent intermediaries of premiums on behalf of short-term insurers and Lloyd's underwriters, and relating to short-term insurance business carried on in RSA. Terminates on May 31, 2004. | SA Insurance Association for benefit of insurers | — | 10 | 14 | |||||
| 4 | 15 | 20 | ||||||||
36.2 Foreign denominated facilities and guarantees
The Group exposure is 50% of the following items:
Vodacom Tanzania Limited has project funding facilities of US$55m, which were fully utilised at March 31, 2004. Vodacom Congo (RDC) s.p.r.l. has bridging facilities of €79m which were fully utilised at March 31, 2004. Vodacom Congo (RDC) s.p.r.l. also has a revolving credit facility of US$50m of which US$5m was utilised at March 31, 2004. Foreign currency term facilities are predominantly US Dollar based, at various maturities and are utilised for bridging and short-term working capital needs.
F-52
| Guarantor | Details | Beneficiary | Currency | 2002 Rm | 2003 Rm | 2004 Rm | ||||||
|---|---|---|---|---|---|---|---|---|---|---|---|---|
| Vodacom (Proprietary) Limited | Standby letters of credit* | Alcatel CIT | €25m (2003: €27m; 2002: €30m) | 300 | 233 | 195 | ||||||
Vodacom Group (Proprietary) Limited | Guarantees issued for the obligations of Vodacom Congo (RDC) s.p.r.l.** | ABSA | €54m (2003: €50m; 2002: €Nil) | — | 430 | 416 | ||||||
Vodacom Group (Proprietary) Limited | Guarantees issued for the obligations of Vodacom Congo (RDC) s.p.r.l's revolving credit facility** | ABSA | US$32m (2003 US$32m; 2002: US$Nil) | — | 255 | 202 | ||||||
Vodacom Group (Proprietary) Limited | Guarantees issued for the obligations of Vodacom Congo (RDC) s.p.r.l ** | Standard Finance (Isle of Man) Limited | €23m (2003: €Nil; 2002: €Nil) | — | — | 174 | ||||||
Vodacom Group (Proprietary) Limited | Guarantees issued for the obligations of Vodacom Congo (RDC) s.p.r.l ** | Standard Finance (Isle of Man) Limited | US$38m (2003: US$Nil; 2002: US$Nil) | — | — | 237 | ||||||
Vodacom International Limited | Guarantees issued for the obligation of Vodacom Congo (RDC) s.p.r.l's revolving credit facility ** | Alcatel CIT | €25m (2003: €Nil; 2002 €Nil) | — | — | 193 | ||||||
| 300 | 918 | 1,417 | ||||||||||
- *
- Amounts drawn down on the standby letters of credit amounted to R49m (2003: R67m; 2002: R98m) and are included as liabilities in the balance sheet.
- **
- Foreign denominated guarantees amounting to R623m (2003: R349m; 2002: RNil) issued in support of Vodacom Congo (RDC) s.p.r.l. are included as liabilities in the balance sheet.
Companies within the Group have provided the following guarantees:
Vodacom (Proprietary) Limited provides an unlimited guarantee for borrowings entered into by Vodacom Group (Proprietary) Limited.
F-53
| | 2002 Rm | 2003 Rm | 2004 Rm | |||
|---|---|---|---|---|---|---|
| Capital commitments authorised | 7,077 | 6,974 | 7,151 | |||
| Fixed-line | 4,932 | 4,977 | 4,566 | |||
| Mobile | 2,145 | 1,997 | 2,585 | |||
Commitments against authorised capital expenditure | 810 | 435 | 439 | |||
| Fixed-line | 85 | 104 | 88 | |||
| Mobile | 725 | 331 | 351 | |||
| Authorised capital expenditure not yet contracted | 6,267 | 6,539 | 6,712 | |||
| Fixed-line | 4,847 | 4,873 | 4,478 | |||
| Mobile | 1,420 | 1,666 | 2,234 |
Management expects these commitments to be financed from internally generated cash and other borrowings.
Capital commitments of the mobile segment was restated for the years ending March 31, 2002 and 2003 to include capital expenditure approved by the Board of Directors for the next financial year.
| | Total Rm | <1 year Rm | 1 - 5 years Rm | >5 years Rm | |||||
|---|---|---|---|---|---|---|---|---|---|
| Operating lease commitments | |||||||||
2004 | |||||||||
| Buildings | 809 | 141 | 365 | 303 | |||||
| Rental receivable on buildings | (227 | ) | (57 | ) | (125 | ) | (45 | ) | |
| Transmission and data lines | 64 | 17 | 46 | 1 | |||||
| Vehicles | 540 | 540 | — | — | |||||
| Equipment | 37 | 23 | 14 | — | |||||
| Sport and marketing contracts | 364 | 149 | 215 | — | |||||
| Total | 1,587 | 813 | 515 | 259 | |||||
2003 | |||||||||
| Buildings | 1,011 | 171 | 452 | 388 | |||||
| Rental receivable on buildings | (274 | ) | (47 | ) | (162 | ) | (65 | ) | |
| Transmission and data lines | 15 | 4 | 11 | — | |||||
| Vehicles | 719 | 719 | — | — | |||||
| Equipment | 11 | 4 | 7 | — | |||||
| Sport and marketing contracts | 228 | 123 | 105 | — | |||||
| Total | 1,710 | 974 | 413 | 323 | |||||
2002 | |||||||||
| Buildings | 675 | 195 | 271 | 209 | |||||
| Rental receivable on buildings | (188 | ) | (35 | ) | (102 | ) | (51 | ) | |
| Vehicles | 809 | 809 | — | — | |||||
| Equipment | 35 | 17 | 18 | — | |||||
| Total | 1,331 | 986 | 187 | 158 | |||||
F-54
Operating leases
The Group leases certain buildings, vehicles and equipment. The bulk of the lease terms negotiated for equipment-related premises are ten years with other leases signed for five years and three years. The bulk of non-equipment-related premises are for leases of three years to ten years. The majority of the leases normally contain an option clause entitling Telkom to renew the lease agreements for a period usually equal to the main lease term.
The minimum lease payments under these agreements are subject to annual escalations, which range from 8% to 12%.
Penalties in terms of the lease agreements are only payable should Telkom vacate the premises and negotiate to terminate the lease agreement prior to the expiry date, in which case the settlement payment will be negotiated in accordance with the market conditions of the premises. Future minimum lease payments under operating leases are included in the above note.
The master lease agreement for vehicles is for a period of five years, and expires on March 31, 2005. In accordance with the agreement Telkom is not allowed to lease any similar vehicle as specified in the contract from any other service provider during the five year period. The current contract does not have a forced renewal option. Any continued involvement after March 31, 2005 will be renegotiated at the time of the expiry of the current contract. The contract is structured to have no lease increases on vehicles that are continually leased from the lessor. If a vehicle is however replaced by a new similar vehicle the lease payment is increased with a percentage increase based on the South African consumer index at the time. As there is no minimum usage clause in the master lease agreement, only the lease payments for the next year have been disclosed. The leases of individual vehicles are renewed annually.
F-55
| | Total Rm | <1 year Rm | 1 - 5 years Rm | >5 years Rm | |||||
|---|---|---|---|---|---|---|---|---|---|
| Finance lease commitments | |||||||||
2004 | |||||||||
| Lease payments | 2,884 | 155 | 818 | 1,911 | |||||
| Finance charges | (1,687 | ) | (167 | ) | (642 | ) | (878 | ) | |
| Minimum lease payments | 1,197 | (12 | ) | 176 | 1,033 | ||||
| Present value of the liability | 1,086 | ||||||||
| Finance charges capitalised | 111 | ||||||||
| Liability as disclosed in Note 24 | 1,197 | ||||||||
2003 | |||||||||
| Lease payments | 2,889 | 109 | 748 | 2,032 | |||||
| Finance charges | (1,775 | ) | (134 | ) | (732 | ) | (909 | ) | |
| Minimum lease payments | 1,114 | (25 | ) | 16 | 1,123 | ||||
| Present value of the liability | 1,081 | ||||||||
| Finance charges capitalised | 33 | ||||||||
| Liability as disclosed in Note 24 | 1,114 | ||||||||
2002 | |||||||||
| Lease payments | 2,550 | 54 | 292 | 2,204 | |||||
| Finance charges | (1,517 | ) | (88 | ) | (393 | ) | (1,036 | ) | |
| Minimum lease payments | 1,033 | (34 | ) | (101 | ) | 1,168 | |||
| Present value of the liability | 1,026 | ||||||||
| Finance charges capitalised | 7 | ||||||||
| Liability as disclosed in Note 24 | 1,033 | ||||||||
Finance leases
A major portion of the finance lease relates to the sale and leaseback of the Group's buildings. The lease term negotiated for the building is for a period of 25 years ending in 2019. The minimum lease payments are subject to an annual escalation of 10%. Telkom has the right to sub-let part of the buildings. In case of a breach of contract, the lessor is entitled to cancel the lease agreement and claim damages.
Finance charges accruing on the Group's building leases exceed the lease payments for the next five years. Minimum lease payments for the next five years do not result in any income accruing to the Group.
38. Contingencies
| | 2002 Rm | 2003 Rm | 2004 Rm | |||
|---|---|---|---|---|---|---|
| Third parties | 65 | 161 | 70 | |||
| Guarantee of employee housing loans | 208 | 192 | 144 |
F-56
Third parties
These amounts represent sundry disputes with third parties that are not individually significant. Telkom does not deem it probable that the outcomes of these disputes will lead to financial loss to the Group.
Guarantee of employee housing loans
Telkom guarantees a certain portion of employees' housing loans. The amount guaranteed differs depending on facts such as employment period and salary rates. When an employee leaves the employment of Telkom, any housing debt guaranteed by Telkom is settled before any pension payout can be made over to the employee. The maximum amount of the guarantee in the event of the default is as disclosed above.
Supplier dispute
Expenditure of R594m was incurred up to March 31, 2002 for the development and installation of an integrated end-to-end customer assurance and activation system to be supplied by Telcordia. In the 2001 financial year, the agreement with Telcordia was terminated and in that year, the Company wrote off R119m of this investment. Following an assessment of the viability of the project, the balance of the Telcordia investment was written-off in the 2002 financial year. During March 2001, the dispute was taken to arbitration, where Telcordia was seeking approximately US$130m plus interest at a rate of 15.50% per year for money outstanding and damages. In September 2002, a partial ruling was issued by the arbitrator in favor of Telcordia. On November 5, 2002, Telkom brought an application in the High Court in South Africa to review and set aside the partial award. The hearing of the review application commenced on August 11, 2003. Judgement in Telkom's favor was handed down on November 27, 2003. Telcordia, however, brought an application for leave to appeal on 28, 29 and 30 April 2004. On May 3, 2004, the High court dismissed the application by Telcordia and ordered Telcordia to pay the legal costs of Telkom, including the cost of two counsel. Telcordia also petitioned the United States District Court for the District of Columbia to confirm the partial ruling, which petitioned Telkom has successfully resisted. Telcordia, however, have since filed a notice to appeal against the decision of the District Court of Columbia, which appeal was heard on April 1, 2004. The court dismissed the appeal by Telcordia on April 9, 2004. The dispute between Telkom and Telcordia and the amount of Telkom's liability are not expected to be finalised until late 2004 or early 2005. As Telkom no longer believes it has a probable obligation, it has provided US$Nil (March 31, 2003: US$44m) for its estimate of liabilities, which include interest and legal fees.
Competition Commission
The South African Value Added Network Services Association ("SAVA"), an association of value added network service ("VANS") providers, filed complaints against Telkom at the Competition Commission regarding alleged anti-competitive practices on the part of Telkom. Certain of the complaints have been referred to the Competition Tribunal by the Competition Commission for adjudication. The complaints deal with Telkom's alleged refusal to provide telecommunications facilities to certain VANS providers to construct their networks, alleged refusal to lease access facilities to VANS providers, alleged discriminatory pricing with regard to leased line services and alleged refusal to peer with certain VANS providers.
A maximum administrative penalty of up to 10%, calculated with reference to Telkom's annual turnover, excluding subsidiaries and joint ventures, for the financial year prior to the complaint date, may be imposed if it is found that Telkom has committed a prohibited practice as set out in the Competition Act, 1998 (as amended). The Competition Commission has to date not imposed the maximum penalty.
F-57
Telkom has brought an application in the High Court in respect of the Competition Tribunal's jurisdiction to adjudicate this matter, on the basis that:
- •
- the Competition Tribunal should not decide on the nature of Telkom's rights as contained in the Telecommunication Act, 1996 (as amended) as well as Telkom's various licenses and
- •
- several of the complaints are already the subject of matters still pending at the Independent Communication Authority of South Africa ("ICASA"). Telkom argues that it is for the sectoral regulator, ICASA, to decide on the rights and obligations given to Telkom in terms of the Telecommunication Act and its PSTS license.
Telkom is confident that it has not committed a prohibited practice as set out in the provisions of the Competitions Act as authorised by its PSTS License. We do not expect the Competition Tribunal to adjudicate on this matter within the next 2 years.
The Group exposure is 50% of the following items:
Vodacom Congo (R.D.C.) s.p.r.l.
The Group has a 51% equity interest through Vodacom in Vodacom Congo (R.D.C.) s.p.r.l., ("Vodacom Congo"), which commenced business on December 11, 2001.
Vodacom, in terms of the shareholders' agreement, is ultimately responsible for the funding of the operations of Vodacom Congo. Currently Vodacom Congo is incurring losses which are expected to continue in the short term. The 49% portion attributable to the other joint venture partner in respect of the liabilities and losses as at March 31, 2004, 2003 and 2002 were as follows:
F-58
| | 2002 Rm | 2003 Rm | 2004 Rm | ||||
|---|---|---|---|---|---|---|---|
| Losses | (25 | ) | (200 | ) | (15 | ) | |
| Total liabilities | (59 | ) | (816 | ) | (1,133 | ) | |
| Total assets | 427 | 658 | 1,012 | ||||
Preference shares were reclassified from equity to liabilities in accordance with IAS 39—Financial Instruments: Recognition and Measurement (Revised 2000) ("IAS39") during the 2004 financial year. Accordingly the net liabilities, loss before taxation and net loss of the joint venture company as previously disclosed for the 2003 and 2002 financial years were restated. | |||||||
HGL Advertising Company Limited | — | 70 | 56 | ||||
| Vodacom Tanzania Limited is a defendant in a court case in the high court of Tanzania in which the plaintiff, HGL Advertising Company Limited, is demanding compensation of US$9m (Group share: US$5m) for losses and damages allegedly incurred by them as a result of an illegal breach of contract. The facts of the case show there was no contract but rather a request to tender. The company's legal counsel is of the opinion that the case has a very limited chance of success. Should the plaintiff be successful, no reliable estimate of the damages awarded can be estimated | |||||||
Vodacom Satellite Services (Proprietary) Limited | 15 | 8 | 6 | ||||
| The functionality of the Gateway assets is under dispute and Vodacom Satellite Services (Proprietary) Limited and Vodafone Satellite Services Limited do not recognise the liability of US$1m (Group share: US$0.5m) to Globalstar LP. This amount has been written back to income in the 2002 year as the success of this claim is deemed to be remote. | |||||||
Other matters | 5 | 6 | 9 | ||||
| 20 | 84 | 71 | |||||
F-59
39. Financial instruments and risk management
Concentration of risks
Telkom is a party to collective bargaining agreements with unions covering the employment terms and conditions of a significant number of its employees. Telkom employees primarily belong to the Communication Workers Union and the Alliance of Telkom Union. These employees are bound to follow the decisions of the unions. Telkom has a good working relationship with the unions and to date, there have been no significant disruptions to operations due to union activities.
Telkom has various commercial contracts with suppliers of goods and services which at a high level can be classified into IT, network, commercial (inclusive of outsourced entities), training and other. Risk reviews are conducted on a quarterly basis, while formal assessments are conducted on an annual basis. If specific risks are highlighted during a review, a formal assessment is conducted immediately. Risk exposure is evaluated against the following criteria:
- •
- the value of the contract/Company spend to date;
- •
- impact of supplier/service provider on key strategic initiatives of the Company;
- •
- level/intensity of associated maintenance/support received from technology suppliers;
- •
- the period that a specific technology has already been introduced into the network;
- •
- the extent of customisation by the Company on standard technical functionality provided by supplier/service provider;
- •
- level of foreign exposure in currency associated with the product/service offering; and
- •
- inherent business and financial risk associated with a supplier.
Telkom is currently one of two holders of a license to provide public switched telephony services within South Africa. The customer base is diverse and spread across the country. A license has been awarded to the second network operator which is as yet not in operation. Telkom has embarked on a process of signing long-term contracts with significant customers.
Exposure to continuously changing market conditions has highlighted the importance of financial risk management as an element of control for the Group. Treasury policies, risk limits and control procedures are continuously monitored by the Board of Directors.
The Group holds or issues financial instruments to finance its operations, for the temporary investment of short-term funds and to manage currency and interest rate risks. In addition, financial instruments like trade receivables and payables, arise directly from the Group's operations.
The Group finances its operations primarily by a mixture of issued share capital, retained profit, long-term and short-term loans. The Group uses derivative financial instruments to manage its exposure to market risks from changes in interest and foreign exchange rates. The derivatives used for this purpose are principally interest rate swaps, currency swaps and forward exchange contracts. The Group does not speculate in derivative instruments.
Interest rate risk management
Interest rate risk arises from the repricing of the Group's forward cover and floating rate debt as well as new borrowings and refinancing.
The Group's policy is to manage interest cost through the utilisation of a mix of fixed and variable rate debt. In order to manage this mix in a cost efficient manner, the Group makes use of interest rate derivatives as approved in terms of Group policy. Fixed rate debt represents approximately 86.89% (2003: 90.06%, 2002: 85.82%) of the total consolidated debt, after taking the instruments listed below into consideration. The debt profile of mainly fixed rate debt has been maintained to limit the Group's exposure to interest rate increases given the size of the Group's debt portfolio.
F-60
| | Floating Rate Rm | <1 year Rm | Fixed rate 1 - 5 years Rm | >5 years Rm | Total Rm | ||||||
|---|---|---|---|---|---|---|---|---|---|---|---|
| Interest rate repricing profile for interest bearing debt: | |||||||||||
2004 | |||||||||||
| Borrowings | 2,196 | 2,316 | 9,403 | 2,839 | 16,754 | ||||||
| Percentage of borrowings | 13.11 | % | 13.82 | % | 56.13 | % | 16.94 | % | 100.00 | % | |
2003 | |||||||||||
| Borrowings | 2,208 | 4,366 | 12,906 | 2,732 | 22,212 | ||||||
| Percentage of borrowings | 9.94 | % | 19.66 | % | 58.10 | % | 12.30 | % | 100.00 | % | |
2002 | |||||||||||
| Borrowings | 3,500 | 407 | 14,714 | 6,066 | 24,687 | ||||||
| Percentage of borrowings | 14.18 | % | 1.65 | % | 59.60 | % | 24.57 | % | 100.00 | % |
Borrowings do not include credit facilities utilised of R422m (2003: R280m, 2002: R822m), which are floating rate debt.
The effective interest rate for the year was 15.14% (2003: 13.56%, 2002: 13.48%). At March 31, 2004 the Group did not have a significant interest rate risk exposure on financial assets.
In order to hedge specific exposures in the interest rate repricing profile of existing borrowings and peak additional borrowings, the Group makes use of interest rate derivatives as approved in terms of Group policy.
The table below summarises the interest rate swaps outstanding as at:
| | Average maturity | Currency | Notional amount m | Weighted average coupon rate | |||||
|---|---|---|---|---|---|---|---|---|---|
| 2004 | |||||||||
| Interest rate swaps | |||||||||
| Pay fixed | < 1 year | ZAR | 150 | 12.92 | % | ||||
| 1 - 5 years | ZAR | 1,000 | 14.67 | % | |||||
| Receive fixed | 1 - 5 years | ZAR | 56 | 9.99 | % | ||||
| > 5 years | ZAR | 62 | 9.82 | % | |||||
2003 | |||||||||
| Interest rate swaps | |||||||||
| Pay fixed | 1 - 5 years | ZAR | 1,150 | 14.44 | % | ||||
| Receive fixed | > 5 years | ZAR | 119 | 15.73 | % | ||||
2002 | |||||||||
| Interest rate swaps | |||||||||
| Pay fixed | < 1 year | ZAR | 1,300 | 12.19 | % | ||||
| 1 - 5 years | ZAR | 150 | 12.92 | % | |||||
| > 5 years | ZAR | 1,000 | 14.67 | % | |||||
| Receive fixed | > 5 years | ZAR | 74 | 16.00 | % |
Pay fixed
The floating rate is based on the 3 months JIBAR, and is settled quarterly in arrears. The interest rate swaps cover refinancing price risk on the commercial paper bill programme.
Receive fixed
The Group swapped its fixed rate for a floating rate linked to the BA (Banker's Acceptance) rate plus a margin of between 2% and 2.25%.
F-61
Credit risk management
Other financial assets and liabilities
The risk arises from derivative contracts entered into with international financial institutions. The maximum exposure to the Group if no amounts were recovered at March 31, 2004 is a net favorable position of R853m (2003: R1,390m). No collateral is required when entering into derivative contracts. Credit limits are reviewed on an annual basis or when information becomes available in the market. The Group limits its exposure to any counterparty and exposures are monitored daily. The Group expects that all counterparties will meet their obligations.
Trade receivables
Credit limits are set on an individual and entity basis. Management reduces the risk of unrecoverable debt by improving credit management through credit vetting and stricter debt collection policies. Trade receivables comprise a large and widespread customer base, covering residential, business and corporate customer profiles. Credit checks are performed on all customers on application for new services, and on an ongoing basis where appropriate.
Liquidity risk management
The Group is exposed to liquidity risk as a result of uncertain trade receivable related cash flows as well as capital commitments of the Group. Liquidity risk is primarily managed by the Corporate Finance division in accordance with policies and guidelines formulated by the Operating Committee. In terms of its borrowing requirements, the Group ensures that sufficient facilities exist to meet its immediate obligations. In terms of its long-term liquidity risk, the Group maintains a reasonable balance between the period assets generate funds and the period the respective assets are funded. Short-term liquidity gaps may be funded through repurchase agreements.
Available credit facilities not utilised at March 31, 2004 amounted to R2,995m (Note 36).
Negative working capital ratio
For each of the financial years ended 2002, 2003 and 2004 the Group had a negative working capital ratio. A negative working capital ratio arises when current liabilities are greater than the current assets. Current liabilities are intended to be financed from operating cash flows, new borrowings and borrowings available under existing credit facilities.
VM S.A.R.L call option
In terms of the shareholders' agreement, the Group's minority shareholder in VM S.A.R.L, Empresa Mocabicana De Telecommunicacòes S.A.R.L ("Emotel") has a call option for a period of 4 years following the commencement date, August 23, 2003. In terms of the option, Emotel shall be entitled to call on Vodacom International Limited such number of shares in and claims on loan account against VM S.A.R.L as constitute 25% of the entire issued share capital of that company. Emotel can exercise this option in full increments of 1%. The option can only be exercised on the 1st of April or the 1st of October of each calendar year for the duration of the option. The option price is specified in the shareholders' agreement. The call option has no value at March 31, 2004.
Smartphone SP (Proprietary) Limited put option
In terms of the shareholders' agreement, the minority shareholders of Smartphone SP (Proprietary) Limited have a put option against Vodacom Group (Proprietary) Limited, should the Group or the company terminate or fail to renew the Service Provider Agreement for any reason other than the expiry or cancellation of the Group's South African license. The put option has no value at March 31, 2004.
F-62
Foreign currency exchange rate risk management
In respect of South African operations, the Group manages its foreign currency exchange rate risk by hedging, on a portfolio basis, all identifiable exposures via various financial instruments suitable to the Group's risk exposure.
Cross currency swaps and forward exchange contracts have been entered into to reduce the foreign currency exposure on the Group's operations and liabilities. The Group also enters into forward exchange contracts to hedge interest expense and purchase and sale commitments denominated in foreign currencies (primarily US Dollars and Euro). The purpose of the Group's foreign currency hedging activities is to protect the Group from the risk that the eventual net flows will be adversely affected by changes in exchange rates.
F-63
The table below reflects the currency and interest rate exposure of liabilities. Foreign currency debt is translated at the year end exchange rates:
| | Fixed rate Rm | Floating Rm | Interest- free Rm | Total Rm | ||||
|---|---|---|---|---|---|---|---|---|
| Liabilities | ||||||||
2004 | ||||||||
| Currency | ||||||||
| ZAR | 10,611 | 1,991 | 13,042 | 25,644 | ||||
| Dollar | 52 | 246 | 341 | 639 | ||||
| Euro | 3,895 | 337 | 148 | 4,380 | ||||
| Other | — | 44 | 19 | 63 | ||||
| 14,558 | 2,618 | 13,550 | 30,726 | |||||
2003 | ||||||||
| Currency | ||||||||
| ZAR | 15,619 | 1,844 | 11,372 | 28,835 | ||||
| Dollar | 115 | 243 | 659 | 1,017 | ||||
| Euro | 4,338 | 325 | 68 | 4,731 | ||||
| Other | — | 76 | 28 | 104 | ||||
| 20,072 | 2,488 | 12,127 | 34,687 | |||||
2002 | ||||||||
| Currency | ||||||||
| ZAR | 16,189 | 4,016 | 12,656 | 32,861 | ||||
| Dollar | — | 171 | 351 | 522 | ||||
| Euro | 4,998 | 135 | 675 | 5,808 | ||||
| Other | — | — | 53 | 53 | ||||
| 21,187 | 4,322 | 13,735 | 39,244 | |||||
| Assets There is no material foreign currency exposure for assets. |
F-64
Forward exchange contracts
The following contracts relate to specific items on the balance sheet or foreign commitments not yet due. Foreign commitments not yet due consist of capital expenditure ordered but not yet received and future interest payments and loans denominated in foreign currency.
| | < 1 year | 1 - 5 years | > 5 years | |||||||||
|---|---|---|---|---|---|---|---|---|---|---|---|---|
| | Foreign currency notional amount m | Local currency amount Rm | Foreign currency notional amount m | Local currency amount Rm | Foreign currency notional amount m | Local currency amount Rm | ||||||
| Average maturity years currency | ||||||||||||
2004 | ||||||||||||
| Buy foreign currency and sell ZAR | ||||||||||||
| United States Dollar | 231 | 1,706 | 22 | 226 | — | — | ||||||
| Pound Sterling | 17 | 215 | — | — | — | — | ||||||
| Euro | 119 | 1,024 | 54 | 369 | — | — | ||||||
| Swedish Krona | 20 | 19 | — | — | — | — | ||||||
| Japanese Yen | 30 | 2 | — | — | — | — | ||||||
| 2,966 | 595 | — | ||||||||||
Buy ZAR and sell foreign currency | ||||||||||||
| United States Dollar | 81 | 613 | 43 | 446 | — | — | ||||||
| Pound Sterling | 7 | 84 | — | — | — | — | ||||||
| Euro | 45 | 383 | — | — | — | — | ||||||
| Swedish Krona | 17 | 16 | — | — | — | — | ||||||
| Japanese Yen | 25 | 2 | — | — | — | — | ||||||
| 1,098 | 446 | — | ||||||||||
Buy Euro and sell USD currency | ||||||||||||
| United States Dollar | 11 | 95 | — | — | — | — | ||||||
| 95 | — | — | ||||||||||
2003 | ||||||||||||
| Buy foreign currency and sell ZAR | ||||||||||||
| United States Dollar | 271 | 2,421 | 40 | 408 | — | — | ||||||
| Pound Sterling | 7 | 96 | — | — | — | — | ||||||
| Euro | 87 | 843 | 57 | 424 | — | — | ||||||
| Swedish Krona | 39 | 38 | — | — | — | — | ||||||
| Swiss Franc | — | 2 | — | — | — | — | ||||||
| Japanese Yen | 66 | 5 | — | — | — | — | ||||||
| 3,405 | 832 | — | ||||||||||
Buy ZAR and sell foreign currency | ||||||||||||
| United States Dollar | 56 | 551 | 51 | 522 | — | — | ||||||
| Pound Sterling | 4 | 58 | — | — | — | — | ||||||
| Euro | 31 | 314 | — | — | — | — | ||||||
| Swedish Krona | 12 | 14 | — | — | — | — | ||||||
| Japanese Yen | 34 | 3 | — | — | — | — | ||||||
| 940 | 522 | — | ||||||||||
Buy Euro and sell USD currency | ||||||||||||
| United States Dollar | 14 | 123 | — | — | — | — | ||||||
2002 | ||||||||||||
| Buy foreign currency and sell ZAR | ||||||||||||
| United States Dollar | 447 | 4,836 | 61 | 596 | — | — | ||||||
| Pound Sterling | 6 | 108 | 2 | 26 | — | — | ||||||
| Euro | 134 | 1,341 | 62 | 489 | — | — | ||||||
| Swedish Krona | 18 | 21 | — | — | — | — | ||||||
| Australian Dollar | 1 | 2 | — | — | — | — | ||||||
| Japanese Yen | 34 | 3 | — | — | — | — | ||||||
| 6,311 | 1,111 | — | ||||||||||
Buy ZAR and sell foreign currency | ||||||||||||
| United States Dollar | 145 | 1,435 | 35 | 318 | 25 | 275 | ||||||
| Pound Sterling | 3 | 45 | — | — | — | — | ||||||
| Euro | 41 | 410 | — | — | — | — | ||||||
| 1,890 | 318 | 275 | ||||||||||
Buy Euro and sell USD currency | ||||||||||||
| United States Dollar | 35 | 342 | — | — | — | — | ||||||
F-65
| | Average maturity | Receive | Average coupon | Pay | Average coupon | ||||||
|---|---|---|---|---|---|---|---|---|---|---|---|
| Currency swaps | |||||||||||
2004 | |||||||||||
| Receive fixed/pay fixed | 1 - 5 years | 350m EUR | 7.13 | % | 2,177m ZAR | 15.89 | % | ||||
| Receive fixed/pay floating | 1 - 5 years | 100m EUR | 7.13 | % | 630m ZAR | JIBAR+2.30 | % | ||||
2003 | |||||||||||
| Receive fixed/pay fixed | 1 - 5 years | 350m EUR | 7.13 | % | 2,177m ZAR | 15.89 | % | ||||
| Receive fixed/pay floating | 1 - 5 years | 100m EUR | 7.13 | % | 630m ZAR | JIBAR+2.30 | % | ||||
2002 | |||||||||||
| Receive floating/pay floating | < 1 year | 220m USD | LIBOR | 1,400m ZAR | JIBAR | ||||||
| Receive floating/pay floating | < 1 year | 1,990m ZAR | JIBAR | 220m USD | LIBOR | ||||||
| Receive fixed/pay fixed | 1 - 5 years | 350m EUR | 7.13 | % | 2,177m ZAR | 15.89 | % | ||||
| Receive fixed/pay floating | 1 - 5 years | 100m EUR | 7.13 | % | 630mZAR | JIBAR |
Fair values of financial instruments
Fair value of all financial instruments noted in the balance sheet approximates carrying value except as disclosed below:
The estimated net fair values have been determined using available market information and appropriate valuation methodologies as outlined below:
| | 2002 | 2003 | 2004 | ||||||||||
|---|---|---|---|---|---|---|---|---|---|---|---|---|---|
| | Carrying amount Rm | Fair value Rm | Carrying amount Rm | Fair value Rm | Carrying amount Rm | Fair value Rm | |||||||
| Liabilities | |||||||||||||
| Total interest bearing debt | 24,687 | 25,375 | 22,212 | 24,113 | 16,754 | 18,896 | |||||||
Derivatives (Note 15) | |||||||||||||
| Currency swap assets | 2,411 | 2,411 | 1,269 | 1,269 | 775 | 775 | |||||||
| Interest rate derivative assets | — | — | 14 | 14 | 18 | 18 | |||||||
| Interest rate derivative liabilities | (72 | ) | (72 | ) | (145 | ) | (145 | ) | (159 | ) | (159 | ) | |
| Foreign exchange derivatives—asset | 1,191 | 1,191 | 266 | 266 | 265 | 265 | |||||||
| Foreign exchange derivates—liabilities | (821 | ) | (821 | ) | (354 | ) | (354 | ) | (334 | ) | (334 | ) | |
| 2,709 | 2,709 | 1,050 | 1,050 | 565 | 565 | ||||||||
The fair values of borrowings are based on quoted prices or, where such prices are not available, the expected future payments discounted at market interest rates.
The fair values of derivatives are determined using quoted prices or where such prices are not available, discounted cash flow analysis is used. These amounts reflect the approximate values of the net derivatives position at the balance sheet date.
| | 2002 R | 2003 R | 2004 R | |||
|---|---|---|---|---|---|---|
| Exchange rate table (closing rates) | ||||||
United States Dollar | 11,440 | 8,010 | 6,357 | |||
| Euro | 9,996 | 8,676 | 7,790 |
F-66
Ms. Mtshotshisa, the Chairperson of the Board of Directors, serves on the Board of Directors of Admiral Industries (Proprietary) Limited, which has a contract to supply Telkom with workwear. Telkom paid R5,446,845 for the year ended March 31, 2004 for these services. The outstanding creditors balance at year end was R128,730.
Mr Sekano, the employee representative on Telkom's board, is chairman of Letlapa Security and a director of Telesafe Security. Letlapa Security owns an interest in Telesafe Security, a security company that provides physical security services to Telkom. Telkom paid R39,328,027 to Telesafe Security for the year ended March 31, 2004 for these services. The outstanding creditors balance at year end was R3,367,354.
Mr. Valkin, one of Telkom's board members, is a senior partner with the South African law firm of Bowman Gilfillan Inc., which provides legal services to Telkom from time to time. Telkom paid R90,000 to Bowman Gilfillan Inc., in the year ended March 31, 2004 for these services.
Messrs. McKenzie, Klug Sr., Valkin, Khai Tan and Tan Sri Dato'Ir. Md. Radzi, five of Telkom's Board members, are Thintana Communications' representatives on Telkom's Board of Directors.
Messrs. Mtshotshisa, Menell, Moyo, Sekano and Vilakazi, five of Telkom's Board members, are the Government's representatives on Telkom's Board of Directors.
| | Beneficial | Non-beneficial | ||||||
|---|---|---|---|---|---|---|---|---|
| | Direct | Indirect | Direct | Indirect | ||||
| Directors' shareholding | ||||||||
2004 | ||||||||
| Executive—S E Nxasana | 373 | 223 | 446 | 223 | ||||
| Non-executive | — | — | — | 16,700,276 | ||||
| NE Mtshotshisa | — | — | — | 88 | ||||
| MP Moyo* | — | — | — | 16,700,000 | ||||
| TG Vilakazi | — | — | — | 188 | ||||
| Total | 373 | 223 | 446 | 16,700,499 | ||||
2003 | ||||||||
| Executive—S E Nxasana | 223 | 223 | 446 | 223 | ||||
| Non-executive | — | — | — | 33,411,231 | ||||
| NE Mtshotshisa | — | — | — | 88 | ||||
| MP Moyo* | — | — | — | 16,700,000 | ||||
| TA Sekano* | — | — | — | 16,710,955 | ||||
| TG Vilakazi | — | — | — | 188 | ||||
| Total | 223 | 223 | 446 | 33,411,454 | ||||
- *
- The shares are beneficially owned by Old Mutual and Ucingo of which MP Moyo and TA Sekano are directors respectively.
F-67
The directors' shareholding did not change between the balance sheet date and the date of issue of the financial statements.
| | 2002 Rm | 2003 Rm | 2004 Rm | ||||
|---|---|---|---|---|---|---|---|
| Directors' emoluments | 59 | 60 | 48 | ||||
| Executive | |||||||
| For other services | 58 | 59 | 47 | ||||
| Non-executive | |||||||
| For services as directors | 1 | 1 | 1 | ||||
Directors' emoluments
| | Fees R | Remuneration R | Performance bonus R | Fringe and other benefits R | Management Company R | Total R | ||||||
|---|---|---|---|---|---|---|---|---|---|---|---|---|
| 2004 | ||||||||||||
| Emoluments per director: | ||||||||||||
| Non-executive | 1,292,166 | — | — | — | — | 1,292,166 | ||||||
| NE Mtshotshisa | 666,666 | — | — | — | — | 666,666 | ||||||
| RP Menell | 108,000 | — | — | — | — | 108,000 | ||||||
| TA Sekano | 96,000 | — | — | — | — | 96,000 | ||||||
| TG Vilakazi | 108,000 | — | — | — | — | 108,000 | ||||||
| CL Valkin | 108,000 | — | — | — | — | 108,000 | ||||||
| MP Moyo+ | 115,500 | — | — | — | — | 115,500 | ||||||
| Tan Sri Dato'Ir Md. Radzi Mansor | 90,000 | — | — | — | — | 90,000 | ||||||
| Executive | — | 1,864,845 | 8,200,991 | 1,074,730 | 35,600,612 | 46,741,178 | ||||||
| SE Nxasana* | — | 1,864,845 | 8,200,991 | 1,074,730 | — | 11,140,566 | ||||||
| SM McKenzie++ | — | — | — | — | 11,224,756 | 11,224,756 | ||||||
| AJ Lewis++ | — | — | — | — | 5,517,295 | 5,517,295 | ||||||
| JB Gibson++ (alternate) | — | — | — | — | 6,867,629 | 6,867,629 | ||||||
| B Manning++ (alternate) | — | — | — | — | 6,241,497 | 6,241,497 | ||||||
| C Khai Tan+++ | — | — | — | — | 5,749,435 | 5,749,435 | ||||||
| Total emoluments—Paid by Telkom | 1,292,166 | 1,864,845 | 8,200,991 | 1,074,730 | 35,600,612 | 48,033,344 | ||||||
F-68
| | Fees R | Remuneration R | Performance bonus R | Fringe and other benefits R | Management Company R | Total R | ||||||
|---|---|---|---|---|---|---|---|---|---|---|---|---|
| 2003 | ||||||||||||
| Emoluments per director: | ||||||||||||
| Non-executive | 1,106,689 | — | — | — | — | 1,106,689 | ||||||
| E Molobi | 66,667 | — | — | — | — | 66,667 | ||||||
| NE Mtshotshisa | 400,000 | — | — | — | — | 400,000 | ||||||
| WYN Luhabe | 42,040 | — | — | — | — | 42,040 | ||||||
| WE Lucas-Bull** | 27,446 | — | — | — | — | 27,446 | ||||||
| RP Meneli | 75,040 | — | — | — | — | 75,040 | ||||||
| CBC Smith | 51,540 | — | — | — | — | 51,540 | ||||||
| TA Sekano | 84,540 | — | — | — | — | 84,540 | ||||||
| TG Vilakazi | 60,020 | — | — | — | — | 60,020 | ||||||
| CL Valkin | 84,540 | — | — | — | — | 84,540 | ||||||
| MP Moyo+ | 93,040 | — | — | — | — | 93,040 | ||||||
| D Mji | 59,670 | — | — | — | — | 59,670 | ||||||
| Tan Sri Dato'Ir Md. Radzi Mansor | 62,146 | — | — | — | — | 62,146 | ||||||
| Executive | — | 1,558,539 | 1,723,801 | 747,792 | 55,024,671 | 59,054,803 | ||||||
| SE Nxasana* | — | 1,558,539 | 1,723,801 | 747,792 | — | 4,030,132 | ||||||
| SM McKenzie++ | — | — | — | — | 10,757,714 | 10,757,714 | ||||||
| TM Barry++ | — | — | — | — | 4,591,545 | 4,591,545 | ||||||
| AJ Lewis++ | — | — | — | — | 15,349,259 | 15,349,259 | ||||||
| JB Gibson++ | — | — | — | — | 8,488,307 | 8,488,307 | ||||||
| MD Kerckhoff++ | — | — | — | — | 6,300,576 | 6,300,576 | ||||||
| C Khai Tan+++ | — | — | — | — | 6,751,196 | 6,751,196 | ||||||
| JM Rajaratnam+++ | — | — | — | — | 1,393,037 | 1,393,037 | ||||||
| S Manickam+++ | — | — | — | — | 1,393,037 | 1,393,037 | ||||||
| Total emoluments—Paid by Telkom | 1,106,689 | 1,558,539 | 1,723,801 | 747,792 | 55,024,671 | 60,161,492 | ||||||
F-69
| | Fees R | Remuneration R | Performance bonus R | Fringe and other benefits R | Management Company R | Total R | ||||||
|---|---|---|---|---|---|---|---|---|---|---|---|---|
| 2002 | ||||||||||||
| Emoluments per director: | ||||||||||||
| Non-executive | 668,048 | — | — | — | — | 668,048 | ||||||
| E Molobi | 147,856 | — | — | — | — | 147,856 | ||||||
| ED Moseneke | 70,000 | — | — | — | — | 70,000 | ||||||
| WYN Luhabe | 52,690 | — | — | — | — | 52,690 | ||||||
| WE Lucas-Bull** | 56,320 | — | — | — | — | 56,320 | ||||||
| RP Menell | 47,560 | — | — | — | — | 47,560 | ||||||
| CBC Smith | 50,560 | — | — | — | — | 50,560 | ||||||
| TA Sekano | 24,232 | — | — | — | — | 24,232 | ||||||
| CL Valkin | 51,730 | — | — | — | — | 51,730 | ||||||
| MP Moyo+ | 35,312 | — | — | — | — | 35,312 | ||||||
| D Mji | 52,190 | — | — | — | — | 52,190 | ||||||
| SV Zilwa | 13,258 | — | — | — | — | 13,258 | ||||||
| Tan Sri Dato'Ir Md. Radzi Mansor | 66,340 | — | — | — | — | 66,340 | ||||||
| Executive | — | 1,375,441 | 447,000 | 536,000 | 55,630,905 | 57,989,346 | ||||||
| SE Nxasana* | — | 1,375,441 | 447,000 | 536,000 | — | 2,358,441 | ||||||
| TM Barry++ | — | — | — | — | 15,528,453 | 15,528,453 | ||||||
| AJ Lewis++ | — | — | — | — | 15,528,453 | 15,528,453 | ||||||
| MD Kerckhoff++ | — | — | — | — | 8,635,189 | 8,635,189 | ||||||
| JM Rajaratnam+++ | — | — | — | — | 7,969,405 | 7,969,405 | ||||||
| S Manickam+++ | — | — | — | — | 7,969,405 | 7,969,405 | ||||||
| Total emoluments—Paid by Telkom | 668,048 | 1,375,441 | 447,000 | 536,000 | 55,630,905 | 58,657,394 | ||||||
- *
- Included in remuneration is a pension contribution for SE Nxasana of R242,430 (2003: R179,301) paid to the Telkom Retirement Fund.
- **
- Paid to FirstRand Retail.
- +
- Paid to Old Mutual Life Assurance Company.
- ++
- Paid to SBC Communications for services rendered by directors included in consultancy services—managerial fees.
- +++
- Paid to Telekom Malaysia for services rendered by directors included in consultancy services—managerial fees.
F-70
The inter-company transactions are reflected as net and are thus eliminated against segment results.
| | 2002 Rm | 2003 Rm | 2004 Rm | |||||
|---|---|---|---|---|---|---|---|---|
| Business segment | ||||||||
Consolidated revenue | 34,087 | 37,507 | 40,795 | |||||
| Fixed line | 27,866 | 29,542 | 30,906 | |||||
| To external customers | 27,496 | 29,106 | 30,443 | |||||
| Inter-company | 370 | 436 | 463 | |||||
| Mobile | 8,075 | 9,890 | 11,739 | |||||
| To external customers | 6,591 | 8,401 | 10,352 | |||||
| Inter-company | 1,484 | 1,489 | 1,387 | |||||
| Elimination | (1,854 | ) | (1,925 | ) | (1,850 | ) | ||
Other income | 143 | 233 | 98 | |||||
| Fixed line | 127 | 198 | 73 | |||||
| Mobile | 16 | 35 | 25 | |||||
Operating expenses | 30,039 | 31,226 | 31,805 | |||||
| Fixed line | 25,568 | 25,392 | 24,508 | |||||
| Mobile | 6,275 | 7,759 | 9,147 | |||||
| Elimination | (1,804 | ) | (1,925 | ) | (1,850 | ) | ||
Consolidated operating profit | 4,191 | 6,514 | 9,088 | |||||
| Fixed line | 2,425 | 4,348 | 6,471 | |||||
| Mobile | 1,816 | 2,166 | 2,617 | |||||
| Elimination | (50 | ) | — | — | ||||
Consolidated investment income | 512 | 424 | 479 | |||||
| Fixed line | 839 | 730 | 1,481 | |||||
| Mobile | 16 | 36 | 59 | |||||
| Elimination | (343 | ) | (342 | ) | (1,061 | ) | ||
Consolidated finance charges | 2,550 | 4,154 | 3,264 | |||||
| Fixed line | 2,557 | 3,758 | 2,991 | |||||
| Mobile | 36 | 438 | 284 | |||||
| Elimination | (43 | ) | (42 | ) | (11 | ) | ||
Consolidated taxation | 873 | 1,049 | 1,711 | |||||
| Fixed line | 278 | 449 | 849 | |||||
| Mobile | 595 | 600 | 862 | |||||
Minority interest | 59 | 105 | 69 | |||||
| Fixed line | 44 | 48 | 56 | |||||
| Mobile | 15 | 57 | 13 | |||||
Net profit for the year | 1,221 | 1,630 | 4,523 | |||||
| Fixed line | 335 | 823 | 4,056 | |||||
| Mobile | 1,186 | 1,107 | 1,517 | |||||
| Elimination | (300 | ) | (300 | ) | (1,050 | ) | ||
F-71
Consolidated assets | 50,528 | 49,995 | 50,160 | |||||
| Fixed line | 43,588 | 42,332 | 41,441 | |||||
| Mobile | 7,531 | 8,254 | 9,761 | |||||
| Elimination | (591 | ) | (591 | ) | (1,042 | ) | ||
Investments | 888 | 1,187 | 1,735 | |||||
| Fixed line | 1,199 | 1,448 | 1,466 | |||||
| Mobile | 149 | 199 | 269 | |||||
| Elimination | (460 | ) | (460 | ) | — | |||
Other financial assets | 2,819 | 1,771 | 1,089 | |||||
| Fixed line | 2,706 | 1,740 | 1,070 | |||||
| Mobile | 113 | 31 | 19 | |||||
Tax assets—Fixed line | 1,081 | 276 | — | |||||
| Total assets | 55,316 | 53,229 | 52,984 | |||||
Consolidated liabilities | 13,471 | 11,731 | 13,019 | |||||
| Fixed line | 10,804 | 9,104 | 9,349 | |||||
| Mobile | 3,408 | 3,218 | 4,712 | |||||
| Elimination | (741 | ) | (591 | ) | (1,042 | ) | ||
Interest bearing debt | 24,687 | 22,212 | 16,754 | |||||
| Fixed line | 23,681 | 21,128 | 15,724 | |||||
| Mobile | 1,466 | 1,544 | 1,030 | |||||
| Elimination | (460 | ) | (460 | ) | — | |||
Other financial liabilities | — | 567 | 493 | |||||
| Fixed line | — | 467 | 461 | |||||
| Mobile | — | 100 | 32 | |||||
Tax liabilities | 193 | 177 | 460 | |||||
| Fixed line | 17 | 20 | 34 | |||||
| Mobile | 176 | 157 | 426 | |||||
| Total liabilities | 38,351 | 34,687 | 30,726 | |||||
Other segment information | ||||||||
| Capital expenditure for property, plant and equipment | 9,004 | 5,712 | 5,307 | |||||
| Fixed line | 6,962 | 4,013 | 3,862 | |||||
| Mobile | 2,042 | 1,699 | 1,445 | |||||
Capital expenditure for intangible assets | 97 | 14 | 61 | |||||
| Fixed line | — | 14 | — | |||||
| Mobile | 97 | — | 61 | |||||
Depreciation and amortisation | 5,408 | 6,293 | 6,899 | |||||
| Fixed line | 4,373 | 5,105 | 5,633 | |||||
| Mobile | 1,035 | 1,188 | 1,266 | |||||
Impairment and asset write-offs—Fixed line | 445 | 189 | 350 | |||||
Goodwill impaired—Fixed line | — | 16 | — | |||||
| Restructuring costs—Fixed line | 373 | 244 | 302 | |||||
F-72
| Geographical segment | ||||||||
Consolidated revenue | 34,087 | 37,507 | 40,795 | |||||
| South Africa | 33,720 | 36,936 | 40,053 | |||||
| Other African countries | 370 | 618 | 748 | |||||
| Elimination | (3 | ) | (47 | ) | (6 | ) | ||
Consolidated operating profit | 4,191 | 6,514 | 9,088 | |||||
| South Africa | 4,153 | 6,519 | 9,124 | |||||
| Other African countries | 41 | (2 | ) | (33 | ) | |||
| Elimination | (3 | ) | (3 | ) | (3 | ) | ||
Consolidated assets | 55,316 | 53,229 | 52,984 | |||||
| South Africa | 54,367 | 52,584 | 52,499 | |||||
| Other African countries | 1,002 | 1,216 | 1,691 | |||||
| Elimination | (53 | ) | (571 | ) | (1,206 | ) | ||
Other segment information | ||||||||
| Capital expenditure for property, plant and equipment | 9,004 | 5,712 | 5,307 | |||||
| South Africa | 8,510 | 5,256 | 4,691 | |||||
| Other African countries | 494 | 456 | 616 | |||||
"South Africa", which is also the country of domicile for Telkom SA Limited, comprises the segment information relating to Telkom SA Limited and its subsidiaries as well as Vodacom's South African-based mobile communications network, the segment information of its service providers and its other business segments.
"Other African countries" comprises only Vodacom's mobile communications networks in Tanzania, Lesotho and the Democratic Republic of Congo.
F-73
42. Related parties
Related party relationships exist within the Group. During the year all transactions were concluded at arm's length. Details of material transactions and balances with related parties not disclosed elsewhere in the financial statements were as follows:
| | 2002 Rm | 2003 Rm | 2004 Rm | ||||
|---|---|---|---|---|---|---|---|
| With joint venture | |||||||
| Vodacom Group (Proprietary) Limited | |||||||
Related party balances | |||||||
| Trade receivable | 41 | 35 | 42 | ||||
| Trade payable | (272 | ) | (253 | ) | (250 | ) | |
Related party transactions | |||||||
| Income | (370 | ) | (435 | ) | (463 | ) | |
| Expenses | 1,484 | 1,489 | 1,387 | ||||
| Audit fees—IPO related fees | — | 14 | 3 | ||||
| IPO costs | — | 25 | — | ||||
| Interest received | (36 | ) | (42 | ) | (11 | ) | |
With shareholders | |||||||
| Thintana Communications LLC | |||||||
| Management fees | 396 | 273 | 154 | ||||
Government | |||||||
| Revenue | 1,384 | 1,606 | 1,866 | ||||
| Trade receivable | 134 | 193 | 189 | ||||
Employees | |||||||
| Other receivables | 170 | 126 | 114 |
F-74
43. Interest in significant subsidiaries
Country of incorporation: RSA—Republic of South Africa; TZN—Tanzania; LES—Lesotho; MAU—Mauritius; MZ—Mozambique.
Nature of business: C—Cellular; S—Satellite; INV—Investment holding company; PROP—Property company; OTH—Other.
| | | | | | Interest in issued ordinary share capital | |||||||||
|---|---|---|---|---|---|---|---|---|---|---|---|---|---|---|
| | Country of incorporation | Issued share capital | 2002 % | 2003 % | 2004 % | |||||||||
| | 2002 | 2003 | 2004 | |||||||||||
| Directory advertising | ||||||||||||||
| Telkom Directory Services (Proprietary) Limited | RSA | R100,000 | R100,000 | R100,000 | 54.9 | 64.9 | 64.9 | |||||||
Data application services | ||||||||||||||
| Swiftnet (Proprietary) Limited | RSA | R50,000,000 | R50,000,000 | R50,000,000 | 100 | 100 | 100 | |||||||
Rossal No 65 (Proprietary) Limited | RSA | — | — | R1,000 | — | — | 100 | |||||||
The aggregate net profit of the three subsidiaries is R180m (2003: R144m, 2002: R117m). | ||||||||||||||
Vodacom has interest in the following companies (Group share: 50% of the interest in ordinary share capital as indicated): | ||||||||||||||
Cellular network operators | ||||||||||||||
| Vodacom (Proprietary) Limited (C) | RSA | R100 | R100 | R100 | 100 | 100 | 100 | |||||||
| Vodacom Lesotho (Proprietary) Limited (C) | LES | M4,180 | M4,180 | M4,180 | 88.3 | 88.3 | 88.3 | |||||||
| Vodacom Tanzania Limited (C) | TZN | US$100 | US$100 | US$100 | 65 | 65 | 65 | |||||||
| Vodacom Mozambique S.A.R.L. (C) | MZ | — | — | MZM5,005,500 | — | — | 98 | |||||||
Service providers | ||||||||||||||
| Vodacom Service Provider Holdings (Proprietary) Limited (INV) | RSA | R1,020 | R1,020 | R1,020 | 100 | 100 | 100 | |||||||
| Vodacom Service Provider Company (Proprietary) Limited (C) | RSA | R20 | R20 | R20 | 100 | 100 | 100 | |||||||
| Vodacom Satellite Services (Proprietary) Limited previously known as Globalstar Southern Africa (Proprietary) Limited * (S) | RSA | R100 | R100 | R100 | 100 | 100 | 100 | |||||||
| Vodac (Proprietary) Limited * | RSA | R1 | R1 | — | 100 | 100 | — | |||||||
| GSM Cellular (Proprietary) Limited* (C) | RSA | R1,200 | R1,200 | R1,200 | 100 | 100 | 100 | |||||||
| Smartphone SP (Proprietary) Limited (C) | RSA | — | — | R20,000 | — | — | 51 | |||||||
F-75
Other significant subsidiaries | ||||||||||||||
| Vodacom Venture No. 1 (Proprietary) Limited (INV)** | RSA | R158,999 | R158,999 | R158,999 | 100 | 100 | 100 | |||||||
| Vodacom Equipment Company (Proprietary) Limited * | RSA | R100 | R100 | R100 | 100 | 100 | 100 | |||||||
| Vodacare (Proprietary) Limited * (C) | RSA | R100 | R100 | R100 | 100 | 100 | 100 | |||||||
| Vodacom International Holdings (Proprietary) Limited (INV) | RSA | R100 | R100 | — | 100 | 100 | — | |||||||
| Vodacom International Limited (INV) | MAU | US$100 | US$100 | — | 100 | 100 | — | |||||||
| Vodacom Properties No. 1 (Proprietary) Limited * previously known as Skyprop 157 (Proprietary) Limited (PROP) | RSA | — | R100 | R100 | — | 100 | 100 | |||||||
| Stand 13 Eastwood Road Dunkeld West (Proprietary) Limited (PROP) | RSA | — | — | R100 | — | — | 100 | |||||||
| Ithuba Smartcall (Proprietary) Limited* (OTH) | RSA | — | — | R100 | — | — | 52 | |||||||
Rm | Rm | Rm | ||||||||||||
| Indebtedness of Telkom Joint Venture and subsidiary companies | ||||||||||||||
| Vodacom Group (Proprietary) Limited | RSA | 460 | 460 | — | ||||||||||
| Telkom Directory Services (Proprietary) Limited | RSA | 5 | — | — | ||||||||||
| Swiftnet (Proprietary) Limited | RSA | 56 | 47 | 18 | ||||||||||
| Intekom (Proprietary) Limited | RSA | 29 | 24 | 17 | ||||||||||
| Q-Trunk (Proprietary) Limited | RSA | 49 | 50 | 40 | ||||||||||
| Rossal No 65 (Proprietary) Limited | RSA | — | — | 249 |
- *
- Dormant at March 31, 2004.
- **
- Previously known as Teljoy Holdings Limited (INV).
F-76
44. Investments in joint ventures
| | 2002 Rm | 2003 Rm | 2004 Rm | ||||
|---|---|---|---|---|---|---|---|
| Vodacom Group (Proprietary) Limited | |||||||
| Telkom owns 5,000 shares of 1c each at cost. This amounts to a 50% shareholding in Vodacom Group (Proprietary) Limited. | |||||||
The Group's proportionate share of Vodacom's assets and liabilities is as follows: | |||||||
| Total assets | 7,679 | 8,408 | 10,049 | ||||
| Non-current assets | 5,607 | 6,063 | 6,597 | ||||
| Current assets | 2,072 | 2,345 | 3,452 | ||||
Total liabilities and reserves | (7,219 | ) | (7,948 | ) | (10,049 | ) | |
| Reserves | (2,732 | ) | (3,419 | ) | (3,802 | ) | |
| Minority interests | (5 | ) | (44 | ) | (46 | ) | |
| Non-current liabilities | (949 | ) | (1,362 | ) | (1,195 | ) | |
| Current liabilities | (3,533 | ) | (3,123 | ) | (5,006 | ) | |
| Loan from joint venture partners | 460 | 460 | — | ||||
The Group's proportionate share of revenue and expense is as follows: | |||||||
| Revenue | 8,075 | 9,890 | 11,739 | ||||
| Net operation expenses | (6,243 | ) | (7,688 | ) | (9,122 | ) | |
| Profit before net financing charges | 1,832 | 2,202 | 2,617 | ||||
| Net financing charges | (36 | ) | (438 | ) | (225 | ) | |
| Net income before taxation | 1,796 | 1,764 | 2,392 | ||||
| Taxation | (595 | ) | (600 | ) | (863 | ) | |
| Profit after taxation | 1,201 | 1,164 | 1,529 | ||||
| Minority interest | (15 | ) | (56 | ) | (13 | ) | |
| Net profit for the year | 1,186 | 1,108 | 1,516 | ||||
The Group's proportionate share of cash flow is as follows: | |||||||
| Cash flow from operating activities | 1,908 | 2,171 | 2,395 | ||||
| Cash flow from investing activities | (2,272 | ) | (1,622 | ) | (1,500 | ) | |
| Cash flow from financing activities | 285 | 259 | (398 | ) | |||
Net (decrease)/increase in cash and cash equivalents | (79 | ) | 808 | 497 | |||
| Effect of exchange rate on cash and cash equivalents | 48 | (56 | ) | (21 | ) | ||
| Cash and cash equivalents at beginning of year | (398 | ) | (429 | ) | 323 | ||
| Cash and cash equivalents at end of year | (429 | ) | 323 | 799 | |||
Vodacom's joint ventures during 2002 included Vodacom World Online (Proprietary) Limited and Vodacom Congo. Effective November 30, 2001, Vodacom disposed of the interest in Vodacom World Online (Proprietary) Limited. Details of the disposal are presented in Note 34. The Group acquired its interest in Vodacom Congo on December 11, 2001.
F-77
45. Subsequent events
Smartphone SP (Proprietary) Limited
Smartphone SP (Proprietary) Limited offered to purchase an 85.75% equity stake in Smartcom (Proprietary) Limited for R77.2 million. All suspensive conditions contained in the sale of shares agreement were met on April 16, 2004.
Dividends
The Telkom Board has declared a dividend of R613m on June 3, 2004, which will decrease deferred taxation on STC credits by R77 million.
The Board aims to pay a progressively increasing dividend annually. The level of dividend will be based upon a number of factors, including the assessment of financial results, the Company's debt level, interest coverage and future expectations, including internal cash flows.
Other matters
Effective April 1, 2004 Vodacom International Limited, or VIL, entered into a five year management agreement with VEE Networks Limited, or VEE, (formerly Econet Wireless Nigeria Limited), subject to rights of termination in favor of each of the parties. In terms of the agreement, VIL would have managed VEE's cellular network operations in Nigeria for a fee which is based on VEE's turnover. VEE would have been allowed to use the Vodacom logo and brand name. VIL also had the intention to acquire an equity stake in the business of VEE.
However on May 31, 2004, VIL and VEE mutually agreed to terminate the management agreement entered into on April 1, 2004. VIL will continue to provide technical support to VEE for a period of up to six months. VIL has also decided not to pursue an equity stake in the business of VEE.
The Group is further also a defendant in certain legal proceedings related to its activities in Nigeria. The outcome or extent of any claims against the Group, should the Group not be successful in defending these claims, is unknown.
The directors are not aware of any other matter or circumstance since the financial year end and the date of this report, not otherwise dealt with in the financial statements, which significantly affects the financial position of the Group and the results of its operations.
F-78
46. New International Financial Reporting Standards ("IFRS") accounting pronouncements
During December 2003, the International Accounting Standards Board ("IASB") issued the Improvements Project to current International Financial Reporting Standards ("The Improvements Project"). These changes are effective for annual periods commencing after January 1, 2005. Entities are required to adopt all changes to a current Standard at the same time, but can elect to adopt selective Standards in different periods, provided that all Standards are adopted by the annual period commencing on or after January 1, 2005. None of these have been early adopted.
The Improvements Project prescribes the following main changes to existing statements:
IAS1 Presentation of Financial Statements
The amendment to IAS1 requires the separate presentation of current and non-current assets and liabilities on the face of the balance sheet, and indicates that presentation on a liquidity basis is only to be used when such a presentation provides information that is reliable and more relevant. The classification of debt at the balance sheet date should also not consider post-balance sheet refinancing, amendments or waivers. The amendment further prohibits any expense and income items to be disclosed as "extraordinary". Additional disclosure required by IAS1 includes the key assumptions about the future, and other sources of estimation uncertainty, that have a significant risk of causing a material adjustment to the carrying amounts of assets and liabilities within the next financial year.
IAS2 Inventory
The last-in, first-out (LIFO) method of measuring the cost of inventories will no longer be allowed under the amended IAS2. Separate accounting is required for finance cost of inventories acquired with deferred settlement terms. The difference between the purchase price for normal credit terms and the amount paid will need to be recognised as interest expense over the period of the financing. Exchange differences on acquisition of inventories invoiced in a foreign currency will also no longer be included in the cost of inventories.
IAS8 Accounting Policies, Changes in Accounting Estimates and Errors
The current allowed alternative of recognising the cumulative effect of voluntary changes in accounting policies and corrections of errors in the current period, is no longer available under the amended IAS8. More detailed disclosure is also required including disclosure of impending changes in accounting policies when an entity has yet to implement a new standard or interpretations that has been issued, but has not yet come into effect. The distinction between fundamental and other material errors has been eliminated.
IAS10 Events After Balance Sheet Date
The new standard clarifies that if an entity declares a dividend after the balance sheet date, the entity should not recognise those dividends as a liability at the balance sheet date. Such dividends should only be disclosed in the notes to the financial statements in accordance with IAS1.
IAS15 Information Reflecting the Effect of Changing Prices has been withdrawn.
IAS16 Property, Plant and Equipment
The new standard clarifies that an entity should consider an item of property, plant and equipment as a combination of various units of measure with separate useful lives or consumption patterns. These separate lives are used to calculate depreciation, test for derecognition and for the treatment of expenditure to replace or renew a component of that item of property, plant and equipment. It further confirms that the cost of an item of property, plant and equipment should include not only the initial estimate of the costs relating to dismantlement, removal or restoration of the property at the time of installing the item, but also during the period of use for purposes other than producing inventory. The residual value and useful life of an asset must be reviewed annually. Residual value should not include expected future inflation. There is no cessation of depreciation when assets are idle.
F-79
IAS17 Leases
Based on the amendment a lease of land and buildings is required to be split into two elements—a lease of the land and a separate lease of the buildings. All initial direct costs incurred by a lessor in negotiating a finance lease need to be included in the initial measurement of the finance lease receivables. Initial direct cost incurred by lessors in negotiating an operating lease are added to the carrying amount of the leased asset and recognised over the lease term on the same basis as the lease income. This standard provides special transitional provisions, with retrospective application under certain circumstances not required.
IAS21 The Effects of Changes in Foreign Exchange Rates
The revised IAS21 incorporates the guidance previously included in SIC19—Reporting Currency—Measurement and Presentation of Financial Statements Under IAS21 and IAS29 and SIC30—Reporting Currency—Translation from Measurement Currency to Presentation Currency. It has also eliminated the distinction between a foreign operation that is integral to the operations of the reporting entity and foreign entities and now requires the goodwill and fair value adjustments to assets and liabilities that arise on the acquisition of a foreign entity to be translated at the closing rate.
IAS24 Related Party Disclosure
The revised standard now explicitly requires the disclosure of compensation of key management personnel (which now includes non-executive directors). Disclosure of related party transactions including the terms and conditions, securing of outstanding balances, the nature of the consideration payable on settlement, details of any guarantees and provision for doubtful debt are also required. Parent companies, investors, venturers and state-controlled entities are no longer exempt from providing related party disclosures in their separate financial statements. The scope of the revised standard is extended to include, amongst others, close family members of key management personnel of the entity or its parent.
IAS27 Consolidated and Separate Financial Statements
The use of the equity method of accounting by a parent in its separate financial statements is prohibited in the amended statement. A newly acquired subsidiary can be excluded from consolidation only if the control is intended to be temporary and management is actively seeking a buyer. All group companies will now be forced to use uniform accounting policies as the current impracticability exception has been removed from the revised statement. Minority interest will also in future need to be disclosed as part of equity, separately from the parent shareholders' equity.
IAS28 Accounting for Investments in Associates
The revised standard modifies the guidance previously in SIC20—Equity Accounting Method—Recognition of Losses by including other long-term interests that form part of the investor's net investment in the associate when recognising an investor's share of losses. Interests to be considered do not include trade receivables, trade payables or any long term receivables for which adequate collateral exists.
IAS31 Interest in Joint Ventures
The Standard provides exemptions from application of proportionate consolidation or the equity method similar to those provided for certain parents not to prepare consolidated financial statements. The Standard does not require the proportionate consolidation or the equity method to be applied when an interest in a joint venture is acquired and held with a view to its disposal within twelve months of acquisition. When such an investment is not disposed of with in twelve months, it must be accounted
F-80
for using the proportionate consolidation or the equity method as from date of acquisition. The exclusion from applying proportionate consolidation or the equity method when the joint venture is operating under severe long-term restrictions is no longer permitted.
IAS33 Earnings per Share
The revised standard incorporates the guidance of SIC24—Earnings per Share—Financial Instruments and Other Contracts that May be Settled in Shares and provides additional guidance on the treatment of selected issues. Additional disclosure is also required, including separate presentation of basic and diluted amounts per share from discontinuing and continuing operations.
IAS40 Investment Property
A property interest that is held by a lessee under an operating lease that meets the definition of investment property may be treated as investment property if the operating lease is accounted for as if it were a finance lease in accordance with IAS17, and the lessee uses the fair value model in terms of IAS40.
The Group is currently assessing the impact of the adoption of the Improvements Project, but has not quantified the impact of adopting the revisions to the current Standards.
During February 2004, the IASB issued IFRS2 Share-based Payment ("IFRS2"). IFRS2 is effective for annual periods beginning on or after January 1, 2005. In terms of the standard, all share based payment transactions must be recognised in the financial statements using a fair value measurement basis. An expense is recognised when the goods or services received are consumed. It requires the fair value of all equity instruments granted in an equity-settled share based transaction with employees to be based on market prices, if available, and to take into account the terms and conditions upon which those instruments were granted. In the absence of market prices, fair value is estimated using valuations techniques to estimate what the price of those equity instruments would have been on measurement date in an arm's length transactions between knowledgeable, willing parties. The Group has not completed its assessment of the possible impact that IFRS2 will have on its results.
On March 31, 2004, The IASB issued IFRS3—Business Combinations ("IFRS3"), IAS36—Impairment of Assets (revised) ("IAS36") and IAS38—Intangible assets (revised) ("IAS38"). IFRS3 is effective for business combinations agreed to on or after March 31, 2004, and for previously recognised goodwill or negative goodwill. IFRS3 requires all business combinations to be accounted for using the purchase method, and in applying this method, an acquirer provisions for future losses or restructuring costs are not recognised, but rather recorded as post-acquisitions expenses. Probability of future economic benefits is assumed for intangibles acquired in a business combination. Intangibles acquired in a business combination must be recognised as a separate asset from goodwill if it meets the definition of an asset and can be measured reliably. All contingent liabilities acquired should be recorded at its fair value.
Goodwill acquired in a business combination must not be amortised, but tested for impairment on an annual basis in terms of the revised IAS36. All negative goodwill recognised must be recorded immediately as a gain in the income statement. Reversals of impairment losses related to goodwill are prohibited and additional guidance on measuring impairment is provided.
In terms of IAS36 an annual impairment test is required for intangible assets with an indefinite useful life, intangible assets not yet available for use and goodwill acquired in a business combination. Under certain circumstances the estimate of the recoverable amount used in the preceding financial period may be used. All goodwill should be allocated to the acquirers' cash-generating units that are expected to benefit from the synergies of the business combination.
F-81
IAS38 states that the probability recognition criterion will always be satisfied for intangibles acquired separately or in a business combination. Intangible assets with indefinite useful lives are not amortised, but tested for impairment annually.
The Group is in the process of assessing the impact of IFRS3, IAS36 and IAS38 on its results.
IFRS5—Non-current Assets Held for Sale and Discontinued Operations ("IFRS5") was issued on March 31, 2004 and replaces IAS35—Discontinuing Operations. IFRS5 establishes a classification for non-current assets "held for sale" using the same criteria as those contained in FASB Statement 144—Accounting for the Impairment or Disposal of Long-Lived Assets. In general, to be classified as held for sale, an asset must be available for immediate sale in its present condition subject only to terms that are usual or customary for sales, the sale of the assets must be highly probable and the transfer must be expected to qualify for recognition as a completed sale within one year, with limited exceptions. Assets or disposal groups that are classified as held for sale are carried at the lower of carrying amount and fair value, less costs to sell. An entity is not allowed to depreciate an asset classified as held for sale or an asset that is included in a disposal group held for sale.
IFRS5 changes the timing of the classification as a discontinued operation. Under IFRS5, an operation is classified as discontinued at the date the entity has actually disposed of the operation, or when the operation meets the criteria to be classified as held for sale. IFRS5 is effective for periods commencing on or after January 1, 2005. The Group has not completed its assessment of the possible impact that IFRS5 will have on its results.
On March 31, 2004, the IASB issued the "macro hedging" and "prospective effectiveness test" amendment to IAS39—Financial Instruments:Recognition and Measurement ("IAS39"). The amendment to "macro hedging" enables fair value hedge accounting to be used more readily for a portfolio hedge of interest risk—a macro hedge—than under the current version of IAS39 that the IASB published in December 2003. The amendment is effective for annual periods commencing on or after January 1, 2005. The relaxation of the "prospective effectiveness test" from "almost fully offset" to "highly effective" should better enable entities to meet the hedge criteria. The Group is in the process of assessing the impact on its results.
Revised IAS32 and IAS39—Financial instruments: Presentation and Disclosure and Financial Instruments: Recognition and Measurement
There have been numerous changes to accounting for financial instruments and hedge accounting. Amongst other the statement permits entities to designate financial liabilities or assets on initial recognition or transition of the statement as to be measured at fair value, the originated loans and receivables category is renamed as loans and receivables to include purchased loans and receivables that are not quoted in an active market and additional guidance is provided about how to evaluate impairment that is inherent to a group of financial assets. The revised standards will be effective to Telkom for the 31 March 2006 financial period. Earlier application is permitted.
IFRIC Interpretation 1—Changes in Existing Decommissioning, Restoration and Similar Liabilities
On May 27, 2004 the first IFRIC Interpretation was issued. The Interpretation is effective for annual periods beginning on or after September 1, 2004, but earlier application is encouraged. Under IFRIC 1 the effect of any changes to an existing obligation must be added to or deducted from the cost of the related asset and depreciated prospectively over the asset's useful life.
F-82
47. US GAAP Information
Differences between International Financial Reporting Standards and US Generally Accepted Accounting Principles
The consolidated financial statements of Telkom SA Ltd have been prepared in accordance with International Financial Reporting Standards ("IFRS"), which differ in certain respects from accounting principles generally accepted in the United States ("US GAAP"). Application of US GAAP would have affected the balance sheet as of March 31, 2004, 2003 and 2002 and net income for each of the three years in the periods ended March 31, 2004 to the extent described below. A description of the material differences between IFRS and US GAAP as they relate to the Group, as well as its equity accounted investment in Vodacom, are discussed in further detail below.
*The United States Dollar ("US$") amounts shown in the footnotes have been translated at March 31, 2004 and for the year ended March 31, 2004 from South African Rand ("ZAR") only as a matter of arithmetic computation at the South African exchange rate of ZAR6.32 = US$1, the buying rate on March 31, 2004, the last business day prior to the date of our most recent balance sheet included in this submission. These amounts are unaudited and are included for the convenience of the reader only. Such translation should not be construed as a representation that the South African Rand amounts have been or could be converted into US Dollars at this or any other rate.
F-83
Net income and equity in accordance with US GAAP
The following schedule illustrates the significant adjustments to reconcile net income in accordance with IFRS to the amounts determined in accordance with US GAAP for each of the three years ended March 31, 2004, 2003 and 2002.
| | March 31, 2002 Rm | March 31, 2003 Rm | March 31, 2004 Rm | *March 31, 2004 US$m | |||||
|---|---|---|---|---|---|---|---|---|---|
| Net income according to IFRS | 1,221 | 1,630 | 4,523 | 715 | |||||
| US GAAP adjustments—Telkom: | |||||||||
| a) Revenue recognition | 29 | 77 | 98 | 15 | |||||
| b) Sale and leaseback transaction | 95 | 89 | 94 | 15 | |||||
| c) Preliminary listing costs | (44 | ) | 44 | — | — | ||||
| d) Derivative financial instruments | 90 | 83 | 82 | 13 | |||||
| e) Goodwill | 15 | 42 | 25 | 4 | |||||
| i) Tax effect of reconciling differences | (81 | ) | (94 | ) | (103 | ) | (16 | ) | |
| i) Additional distribution tax—retained earnings | (3 | ) | (52 | ) | (492 | ) | (78 | ) | |
| i) Capital gains tax—Vodacom income | (43 | ) | (140 | ) | (51 | ) | (8 | ) | |
US GAAP adjustments—Vodacom: | |||||||||
| d) Derivative financial instruments | 26 | 4 | 4 | 1 | |||||
| e) Goodwill | (1 | ) | 48 | 47 | 7 | ||||
| f) Joint venture accounting | (40 | ) | — | — | — | ||||
| g) Deferred bonus incentive scheme | 10 | (15 | ) | 4 | 1 | ||||
| h) Business combinations | — | — | 2 | — | |||||
| i) Tax effect of reconciling differences | (11 | ) | 4 | (3 | ) | — | |||
| Net income as per US GAAP before cumulative effect of change in accounting principle | 1,263 | 1,720 | 4,230 | 669 | |||||
| d) Cumulative effect of a change in accounting principle reflecting the application of SFAS 133—Telkom (net of tax of R30m) | 48 | — | — | — | |||||
| d) Cumulative effect of a change in accounting principle reflecting the application of SFAS 133—Vodacom (net of tax of R3m) | 6 | — | — | — | |||||
| e) Cumulative effect of a change in accounting principle reflecting the application of SFAS 142—Telkom (net of tax of Rnil) | — | (16 | ) | — | — | ||||
| Net income according to US GAAP | 1,317 | 1,704 | 4,230 | 669 | |||||
Basic and diluted EPS
The basic and diluted EPS do not differ, as there are no potentially dilutive securities.
F-84
Weighted average number of shares is 556,994,962 (2003, 2002: 557,031,819) issued shares.
| (Per share amounts in cents) | March 31, 2002 | March 31, 2003 | March 31, 2004 | *March 31, 2004 US | ||||
|---|---|---|---|---|---|---|---|---|
| Basic and diluted earnings per share before cumulative effect of change in accounting principle | 226.7 | 308.8 | 759.4 | 120.1 | ||||
| Basic and diluted earnings per share for cumulative effect of change in accounting principle | 9.8 | (2.9 | ) | — | — | |||
| Basic and diluted earnings per share | 236.5 | 305.9 | 759.4 | 120.1 | ||||
The following is a reconciliation of the material adjustments necessary to reconcile shareholders' equity in accordance with IFRS to the amounts in accordance with US GAAP as at March 31, 2004, 2003 and 2002.
| | March 31, 2002 Rm | March 31, 2003 Rm | March 31, 2004 Rm | *March 31, 2004 US$m | |||||
|---|---|---|---|---|---|---|---|---|---|
| Shareholders' equity according to IFRS | 16,832 | 18,348 | 22,058 | 3,490 | |||||
| US GAAP adjustments—Telkom: | |||||||||
| a) Revenue recognition | (1,105 | ) | (1,028 | ) | (930 | ) | (147 | ) | |
| b) Sale and leaseback transaction | (277 | ) | (188 | ) | (94 | ) | (15 | ) | |
| d) Derivative financial instruments | (34 | ) | (23 | ) | (12 | ) | (2 | ) | |
| e) Goodwill | 15 | 41 | 66 | 11 | |||||
| i) Tax effect of reconciling differences | 535 | 468 | 392 | 62 | |||||
| i) Additional distribution tax—retained earnings | (423 | ) | (475 | ) | (967 | ) | (153 | ) | |
| i) Capital gains tax—Vodacom income | (43 | ) | (183 | ) | (234 | ) | (37 | ) | |
US GAAP adjustments—Vodacom: | |||||||||
| e) Goodwill | 15 | 43 | 78 | 12 | |||||
| g) Deferred bonus incentive scheme | 29 | 14 | 18 | 3 | |||||
| h) Business combinations | — | — | 2 | — | |||||
| i) Tax effect of reconciling differences | (9 | ) | (4 | ) | (6 | ) | (1 | ) | |
| Shareholders' equity according to US GAAP | 15,535 | 17,013 | 20,371 | 3,223 | |||||
F-85
Under US GAAP, SFAS 130 "Reporting Comprehensive Income" requires that certain items be recognised as a separate component of equity under the caption "Accumulated Other Comprehensive income" ("OCI"). Additionally the standard requires that companies present comprehensive income, which is a combination of net income and changes in a company's accumulated other comprehensive income accounts. Changes in the Group's accumulated other comprehensive income is reflected under non-distributable reserves.
| | Retained earnings Rm | Other Comprehensive Income Rm | Balance Rm | ||||
|---|---|---|---|---|---|---|---|
| Total April 1, 2001 | 5,438 | 45 | 5,483 | ||||
| Net income per US GAAP | 1,317 | — | 6,755 | ||||
| Foreign currency translation adjustment | — | 64 | 64 | ||||
| Increase in fair value of listed investment | — | 5 | 50 | ||||
| Transitional adjustment on application of SFAS 133 (net of tax of R262m) | — | 440 | — | ||||
| Release of transitional adjustment on application of SFAS 133 to net income for 12 month period (net of tax of R38m) | — | (67 | ) | 373 | |||
| Total April 1, 2002 | 6,755 | 487 | 7,242 | ||||
| Net income per US GAAP | 1,704 | — | 8,459 | ||||
| Foreign currency translation adjustment | — | (141 | ) | (77 | ) | ||
| Decrease in fair value of listed investment | — | (37 | ) | 13 | |||
| Release of transitional adjustment on application of SFAS 133 to net income for 12 month period (net of tax of R28m) | — | (48 | ) | 325 | |||
| Total March 31, 2003 | 8,459 | 261 | 8,720 | ||||
| Net income per US GAAP | 4,230 | — | 12,689 | ||||
| Foreign currency translation adjustment | — | (95 | ) | (172 | ) | ||
| Increase in fair value of listed investment | — | 9 | 22 | ||||
| Release of transitional adjustment on application of SFAS 133 to net income for 12 month period (net of tax of R29m) | — | (47 | ) | 278 | |||
| Total March 31, 2004 | 12,689 | 128 | 12,817 | ||||
Movement in shareholders' equity in accordance with US GAAP
| Shareholders' equity according to US GAAP | March 31, 2002 Rm | March 31, 2003 Rm | March 31, 2004 Rm | *March 31, 2004 US$m | |||||
|---|---|---|---|---|---|---|---|---|---|
| Balance April 1 | 13,776 | 15,535 | 17,013 | 2,692 | |||||
| Net income for the year | 1,317 | 1,704 | 4,230 | 669 | |||||
| Foreign currency reserves | 64 | (141 | ) | (95 | ) | (15 | ) | ||
| Fair value adjustments—derivatives | 373 | (48 | ) | (47 | ) | (7 | ) | ||
| Fair value adjustments—investments | 5 | (37 | ) | 9 | 1 | ||||
| Dividend declared | — | — | (501 | ) | (79 | ) | |||
| Treasury shares | — | — | (238 | ) | (38 | ) | |||
| Balance March 31 | 15,535 | 17,013 | 20,371 | 3,223 | |||||
F-86
US GAAP income statement, balance sheet and cash flow statement without proportional consolidation of Vodacom.
| | March 31, 2002 Rm | March 31, 2003 Rm | March 31, 2004 Rm | *March 31, 2004 US$m | ||||
|---|---|---|---|---|---|---|---|---|
| Income statements as per US GAAP | �� | |||||||
| Operating revenue | 27,837 | 29,605 | 30,541 | 4,832 | ||||
| Other income | 118 | 199 | 69 | 11 | ||||
| Operating expenses and depreciation | 25,479 | 25,209 | 23,914 | 3,784 | ||||
| Operating income | 2,476 | 4,595 | 6,696 | 1,059 | ||||
| Investment income | 532 | 430 | 434 | 69 | ||||
| Net finance costs | 2,390 | 3,684 | 2,920 | 462 | ||||
| Income after financial items | 618 | 1,341 | 4,210 | 666 | ||||
| Equity accounted earnings | 1,177 | 1,148 | 1,571 | 249 | ||||
| Taxation | 434 | 736 | 1,495 | 237 | ||||
| Minority interests | 44 | 49 | 56 | 9 | ||||
| Net income | 1,317 | 1,704 | 4,230 | 669 | ||||
Balance sheets as per US GAAP | ||||||||
| Non current assets | 41,656 | 40,824 | 38,532 | 6,097 | ||||
| Current assets | 9,288 | 8,167 | 8,401 | 1,329 | ||||
| Total assets | 50,944 | 48,991 | 46,933 | 7,426 | ||||
Equity | 15,535 | 17,013 | 20,371 | 3,223 | ||||
| Minority interests | 128 | 150 | 154 | 25 | ||||
| Long-term liabilities | 24,650 | 18,777 | 15,037 | 2,379 | ||||
| Current liabilities | 10,631 | 13,051 | 11,371 | 1,799 | ||||
| Total equity and liabilities | 50,944 | 48,991 | 46,933 | 7,426 | ||||
| | March 31, 2002 Rm | March 31, 2003 Rm | March 31, 2004 Rm | *March 31, 2004 US$m | |||||
|---|---|---|---|---|---|---|---|---|---|
| Cash flow as per US GAAP | |||||||||
| Cash flow from operating activities | 7,099 | 7,302 | 11,796 | 1,867 | |||||
| Cash generated from operations | 7,959 | 8,821 | 12,733 | 2,015 | |||||
| Income from investments | 459 | 390 | 434 | 69 | |||||
| Dividends received / paid | 240 | (26 | ) | (548 | ) | (87 | ) | ||
| Net financing charges paid | (1,416 | ) | (2,657 | ) | (992 | ) | (157 | ) | |
| Taxation paid | (143 | ) | (71 | ) | (108 | ) | (17 | ) | |
| Taxation received | — | 845 | 277 | 44 | |||||
| Cash flow from investing activities | (7,128 | ) | (4,172 | ) | (4,226 | ) | (669 | ) | |
| Cash flow from financing activities | (905 | ) | (2,947 | ) | (6,086 | ) | (963 | ) | |
| Net decrease in cash and cash equivalents | (934 | ) | 183 | 1,484 | 235 | ||||
| Net cash and cash equivalents at beginning of year | 1,265 | 331 | 514 | 81 | |||||
| Net cash and cash equivalents at end of year | 331 | 514 | 1,998 | 316 | |||||
F-87
a) Revenue recognition
The Staff of the US Securities and Exchange Commission issued Staff Accounting Bulletin 104 (SAB 104) that addresses revenue recognition under US GAAP. Under this guidance, revenue earned from access, installation-activation and similar fees should be recognised over the estimated life of the customer relationship. Also, SAB 104 permits, but does not require, companies to defer costs directly associated with such revenue and to also recognise these costs over the life of the customer relationship. Under IFRS the Group recognises this revenue and related costs when the services are provided and the related costs are incurred.
In accordance with US GAAP, revenue earned from installation and activation is deferred and recognised over the expected period of the customer relationship. The expected period of the customer relationship is 7.5 years (2003: 7.5 years; 2002: 8 years) for telephony voice customers and 3.5 years (2003: 4 years; 2002: 4 years) for data-customers.
The Group recognises installation and activation costs, excluding those costs that are capitalised as an integral part of the network, in the period incurred. Revenue adjustments resulted in an increase in pre-tax earnings of R98m, R77m and R29m in 2004 and 2003 and 2002 respectively.
b) Sale and lease-back transaction
During the year ended March 31, 2000, Telkom outsourced its entire fleet of vehicles as well as the maintenance, fueling, insurance, tracking and other services to debis through a sale and lease-back agreement. The lease-back was in the form of a master service level agreement covering a period of five years providing, subject to the company's requirements, for the annual lease contracts for each vehicle under the agreement.
Under the provisions of IAS17, the Group recorded a gain from the transaction since it has transferred substantially all of the risks and rewards incidental to ownership of the vehicles to debis and the criteria for profit recognition had been satisfied. The Group recognised a gain amounting to R463m in 2000 and accounted for the lease-backs as operating leases.
Under US GAAP, SFAS 13, as amended by SFAS 28, the group determined that while the terms of the agreement provide that the assets underlying the lease-backs would be subject to annual lease contracts, renewable based upon the company's vehicle requirements and cancelable under certain terms, debis' right of first refusal to provide all of the Group's requirements during the five year term represents an economic compulsion to renew the leases. Accordingly, the Group concluded that since the lease-back covered substantially all the assets that were sold under the contract for substantially all their remaining useful lives, deferral of the related gain and recognition over the term of the related agreements was appropriate.
Based on the requirements of SFAS 13, a selected portion of the vehicle leases would be treated as finance leases due to the fact that when analysed on a vehicle by vehicle basis, the present value of the minimum lease payments of certain individual vehicles exceed 90% of the fair value of these vehicles or the lease term represents more than 75% of the remaining economic life of the vehicles. Accordingly, the full gain realised through the sale of the vehicles has been reversed and the proceeds from the sale are released over the period of the lease agreement. Rental payments would be applied to interest expense on the obligation as well as to reduce the principal amount of the obligation. The resulting capital lease assets are being depreciated over their remaining useful lives.
Telkom and debis negotiated the vehicle service level agreement with effective date of September 1, 2002. The change in the contract resulted in an increase in the number of vehicles being classified as capital leases. The increase in the number of capital leases was due to the lease term of the vehicles being extended, when compared to the previous contract, with a resulting impact on the economic life and present value calculations.
F-88
| | March 31, 2002 Rm | March 31, 2003 Rm | March 31, 2004 Rm | *March 31, 2004 US$m | |||||
|---|---|---|---|---|---|---|---|---|---|
| Retained earnings opening balance—profit reversal | (372 | ) | (277 | ) | (188 | ) | (30 | ) | |
| Recognition of profit—Income | 93 | 93 | 93 | 15 | |||||
| Depreciation adjustment | (9 | ) | (30 | ) | (45 | ) | (7 | ) | |
| Finance costs | (1 | ) | (10 | ) | (9 | ) | (2 | ) | |
| Add back: lease expense | 12 | 36 | 55 | 9 | |||||
| Net impact on income statement per period | 95 | 89 | 94 | 15 | |||||
| Retained earnings closing balance | (277 | ) | (188 | ) | (94 | ) | (15 | ) | |
| Balance sheet | |||||||||
| Capital lease asset | — | 102 | 57 | 9 | |||||
| Opening balance | 9 | — | 102 | 16 | |||||
| Additions | — | 132 | — | — | |||||
| Depreciation | (9 | ) | (30 | ) | (45 | ) | (7 | ) | |
Capital lease liability | — | 105 | 59 | 9 | |||||
| Opening balance | — | — | 105 | 17 | |||||
| Additions | — | 132 | — | — | |||||
| Lease payments | — | (37 | ) | (55 | ) | (9 | ) | ||
| Finance charges | 10 | 9 | 1 |
c) Preliminary listing costs
Under IFRS, external costs directly attributable to the issue of new shares are shown as a deduction, net of tax in equity. This is only allowed under US GAAP however, when the proposed listing has not been delayed more than 90 days after incurring these costs. In 2002, Telkom's IPO was postponed more than 90 days. Therefore, the costs incurred through March 31, 2002 related to the IPO of R44m have been expensed.
d) Derivative financial instruments
SFAS 133—Fair value adjustments
The Group adopted IAS39 and SFAS 133 on April 1, 2001. Upon adoption of IAS39, the difference between previous carrying amounts and the fair value of derivatives, that prior to the adoption of IAS39 had been designated as cash flow hedges or fair value hedges but do not qualify for hedge accounting under IAS39, was recognised as an adjustment to the opening balance of retained earnings in the financial year IAS39 was initially applied. Changes in the fair value of derivatives subsequent to April 1, 2001 are recorded in the income statement as they do not qualify for hedge accounting.
Under US GAAP, in accordance with SFAS 133, the company is required to recognise all derivatives on the balance sheet at fair value. The SFAS 133 transitional adjustments (at April 1, 2001) are recorded differently than those recorded under IAS39. For pre-existing hedge relationships that would be considered cash flow type hedges, the transitional adjustment should be reported in OCI as a cumulative effect of the accounting change. Any transition adjustment reported as a cumulative effect adjustment in OCI will subsequently be reclassified into earnings in a manner consistent with the earnings effect of the hedged transaction. For pre-existing hedge relationships that would be considered fair value type hedges, the company adjusted the carrying values of the hedged item to its fair value, but only to the extent of an offsetting transition adjustment from the previously designated hedging instrument.
F-89
The hedged asset or liability is subsequently accounted for in a manner consistent with the appropriate accounting for such assets and liabilities. For both cash flow and fair value hedges any portion of the derivative that is considered ineffective at transition is reported in income as a cumulative effect of an accounting change.
Upon adoption on April 1, 2001, the Group recorded an adjustment to other comprehensive income of R440m (net of tax of R262m) representing the fair value adjustment of derivatives for which the pre-existing hedge relationships would be considered cash flow type hedges. In the 2004 fiscal year, the Group reclassified from other comprehensive income into earnings R47m (net of tax of R29m) (2003: R48m (net of tax of R28m)) (2002:R67m (net of tax of R38m)) as the hedged transaction impacted earnings. Upon adoption, the Group also recorded an adjustment of R45m to increase the carrying value of a hedged debt instrument that was the hedged item in what would be considered a fair value type hedge. The fair value adjustment to the hedged item is limited to the extent of an off-setting fair value adjustment to the hedging instrument. In the 2004 fiscal year, the Group amortised R11m (2003: R11m) and (2002: R11m) of the adjustment to the hedged debt instrument into earnings. Upon adoption, the Group recorded, a cumulative effect of change in accounting principle, R54m (net of tax of R33m) representing the ineffective portion of adjustments to record derivatives at fair value.
e) Goodwill
Under IFRS, goodwill arising on the acquisition of a foreign entity is treated as an asset of the Group and translated at the foreign exchange rate in effect at transaction date. In accordance with IFRS the Group amortises goodwill and other intangibles on a straight-line basis over the anticipated benefit period.
Under US GAAP, goodwill arising on the acquisition of a foreign entity is translated at the actual exchange rate at the end of the period. Furthermore, under US GAAP with effect from July 1, 2001 goodwill and intangibles with infinite lives are not amortised for business combinations completed after June 30, 2001. For previously recorded goodwill and intangibles with infinite lives, amortisation ceased on March 31, 2002. These adjustments resulted in an increase in income in 2004 of R72m and R74m and R16m to income in 2003 and 2002, respectively.
The Group adopted SFAS 142 "Accounting for Goodwill and Other Intangibles" effective April 1, 2002 and completed the initial step of a transitional impairment test on all goodwill and indefinite lived intangible assets as of April 1, 2002. Management determined an impairment of R16m under US GAAP and IFRS existed with respect to the acquisition of the minority interest in Swiftnet in May 2001, which has been recognised as a cumulative effect of accounting change under US GAAP in the 2003 fiscal year. Subsequent impairment losses will be reflected in operating income or loss in the income statement. There was no subsequent impairment loss recognised in fiscal years 2003 and 2004.
Had Telkom applied SFAS 142 for the year ended March 31, 2004, 2003 and 2002, the pro forma effects on earnings would have been as follows (In millions of ZAR, except per share amounts)
| | 2002 Rm | 2003 Rm | 2004 Rm | |||
|---|---|---|---|---|---|---|
| Income before cumulative effect of accounting change | 1,267 | 1,704 | 4,230 | |||
| Net income according to US GAAP | 1,317 | 1,704 | 4,230 | |||
| Basic and diluted per share income before cumulative effect of accounting change (cents) | 227.5 | 305.9 | 759.4 | |||
| Basic and diluted net income per share (cents) | 237.1 | 305.9 | 759.4 |
F-90
f) Joint venture accounting
Under IFRS, investments qualifying as joint ventures are accounted for under the proportionate consolidation method of accounting. Under the proportionate consolidation method, the venturer records its share of each of the assets, liabilities, income and expenses of the jointly controlled entity on a line-by-line basis with similar items in the venturer's financial statements. The venturer continues to record its total share of the losses in excess of the net investment in the joint venture.
However for US GAAP purposes where the joint ventures are equity accounted, losses are only recognised up to the net investment in the joint venture, unless the investor has committed to continue providing financial support to the investee.
In 2002 in accordance with IFRS, the Group proportionately consolidated losses of R18m that were in excess of the Group's net investment in the joint venture. Under US GAAP these losses are not recorded. The investment was disposed in 2002 and the gain on the sale for IFRS purposes was calculated based on a lower investment balance, resulting in excess gain of R40m compared with US GAAP.
Vodacom equity accounted earnings
Under IFRS, the Group's interests in joint ventures are proportionally consolidated. Under US GAAP, interest in joint ventures not meeting the criteria for accommodation under item 17 of Form 20-F should be reflected in the consolidated financial statements using the equity method. The following table sets out the restated abbreviated income statement and balance sheet of the Group joint venture company, Vodacom, after US GAAP adjustments.
F-91
| | March 31, 2002 Rm | March 31, 2003 Rm | March 31, 2004 Rm | *March 31, 2004 US$m | |||||
|---|---|---|---|---|---|---|---|---|---|
| Income statements as per US GAAP | |||||||||
| Operating income | 3,615 | 4,552 | 5,466 | 865 | |||||
| Income after financial items | 3,588 | 3,748 | 5,004 | 792 | |||||
| Equity accounted earnings | (18 | ) | (188 | ) | 1 | — | |||
| Taxes | (1,463 | ) | (1,354 | ) | (1,987 | ) | (315 | ) | |
| Minority interests | (30 | ) | (113 | ) | (26 | ) | (4 | ) | |
| Change in accounting policy | 43 | 5 | 5 | 1 | |||||
| Net income for the year | 2,120 | 2,098 | 2,997 | 474 | |||||
Balance sheets as per US GAAP | |||||||||
| Non current assets | 11,448 | 11,853 | 12,394 | 1,961 | |||||
| Current assets | 3,990 | 4,599 | 6,708 | 1,061 | |||||
| Total assets | 15,438 | 16,452 | 19,102 | 3,022 | |||||
| Equity | 4,874 | 6,086 | 6,788 | 1,074 | |||||
| Minority interests | 11 | 88 | 93 | 14 | |||||
| Liabilities | 10,553 | 10,278 | 12,221 | 1,934 | |||||
| Total equity and liabilities | 15,438 | 16,452 | 19,102 | 3,022 | |||||
g) Deferred bonus incentive scheme
Under IFRS, the total value of deferred bonus entitlements as calculated at the end of each financial period are provided for in full on the balance sheet date, based on the net present value of expected future cash flows. Under US GAAP, compensation cost should be recognised over the service period or the vesting period if the service period is not defined, based upon the undiscounted value of the entitlements.
h) Business combinations
Under IFRS, the Group elected to fair value 100% of the assets acquired and liabilities assumed, including minority interests. The excess of the cost of an acquired entity over the net of the amounts assigned to assets acquired and liabilities assumed should be recognised as an asset referred to as goodwill.
Under US GAAP, the Group should only fair value the percentage of the assets acquired and liabilities assumed, excluding minority interests. Similar to IFRS, the excess of the cost of an acquired entity over the net of the amounts assigned to assets acquired and liabilities assumed should be recognised as an asset referred to as goodwill. As a result, the carrying amount of the goodwill for US GAAP purposes is adjusted to reflect the different values assigned to the minority portion of assets and liabilities.
i) Income taxes
Deferred tax benefits and liabilities are calculated, when applicable, for the differences between IFRS and US GAAP.
Telkom is taxed at a corporate tax rate of 30% on taxable income. Telkom incurs an additional Secondary Tax on Companies ("STC") at a rate of 12.50% on any dividends distributed to shareholders. The dividend tax is payable if and only when dividends are distributed. Neither the Company nor the shareholders receive any future tax benefits as a result of additional tax on dividends
F-92
paid. As required under IFRS, Telkom will recognise the tax effects of dividends when distributed in future. Under US GAAP, consistent with the requirements of EITF 95-9, the company measures its income tax expense, including the tax effect of temporary differences, using the tax rate that includes the dividend tax. STC is calculated on retained income after the 1992 fiscal year after deducting the net gains from certain capital transactions as defined and after giving credit for dividends received from Vodacom and other subsidiaries for which the Group had paid the related STC tax.
The following is the reconciliation of the tax expense computed using the statutory tax rate of 30% to the effective rate of 36% (2003: 55%; 2002: 70%)
| | March 31, 2002 Rm | March 31, 2003 Rm | March 31, 2004 Rm | *March 31, 2004 US$m | |||||
|---|---|---|---|---|---|---|---|---|---|
| Income before tax per US GAAP | 618 | 1,341 | 4,210 | 666 | |||||
| Expected income tax expense at statutory rate of 30% | 186 | 402 | 1,263 | 200 | |||||
| Adjustments due to STC on retained income | 26 | 80 | 533 | 84 | |||||
| Exempt income | (1 | ) | (55 | ) | (180 | ) | (28 | ) | |
| Unutilised tax losses | (11 | ) | — | — | — | ||||
| Disallowable expenses | 264 | 129 | (149 | ) | (24 | ) | |||
| Temporary differences in Joint venture | (11 | ) | 4 | — | — | ||||
| Adjustment on possible CGT—Vodacom earnings | 43 | 140 | 51 | 8 | |||||
| (Under) / Over provision for prior year | (62 | ) | 36 | (23 | ) | (4 | ) | ||
| Effective tax | 434 | 736 | 1,495 | 236 | |||||
F-93
With respect to the Group's investment in Vodacom, SFAS 109 requires that deferred taxes be recognised for the effect of the excess of the amount of financial reporting over the tax basis of such investment. According to South African tax law, the Group would be required to pay tax at a rate of 30% on any increase in the taxable appreciation in the value of its investment since October 1, 2001. As such, deferred taxes have been recognised on the Group's share of the undistributed earnings of Vodacom since October 1, 2001.
Deferred tax
The tax effects of the US GAAP adjustments relating to Telkom's operations have been calculated based on a tax rate of 37.78%.
A reconciliation of the deferred tax balances under IFRS to the amounts determined under US GAAP, where materially different, is as follows:
| | March 31, 2002 Rm | March 31, 2003 Rm | March 31, 2004 Rm | *March 31, 2004 US$m | |||||
|---|---|---|---|---|---|---|---|---|---|
| Net deferred tax asset/(liability) per IFRS | 549 | 240 | (422 | ) | (67 | ) | |||
| Vodacom deferred tax balance (equity accounted) | 214 | 144 | 79 | 13 | |||||
| Additional distribution tax | (423 | ) | (475 | ) | (967 | ) | (153 | ) | |
| CGT on equity investee | (43 | ) | (183 | ) | (234 | ) | (37 | ) | |
| Tax effect of US GAAP adjustments | 535 | 468 | 392 | 62 | |||||
| Net deferred tax asset/(liability) per US GAAP | 832 | 194 | (1,152 | ) | (182 | ) | |||
j) Guarantees
Under IFRS, fees received by the Group from issuing guarantees are recognised in income as earned. A liability in respect of the guarantee is not recognised until such time as the contingent liability is thought likely to realise.
Under US GAAP, the Group adopted the initial recognition and initial measurement provisions of FASB Interpretation No. 45, "Guarantor's Accounting and Disclosure Requirements for Guarantees, Including Indirect Guarantees and Indebtedness of Others (an interpretation of FASB Statements No. 5, 57 and 107 and Rescission of Interpretation No. 34) ("FIN 45") in fiscal year 2004. This interpretation clarifies that for certain guarantees a guarantor is required to recognise, at the inception of a guarantee entered into after December 15, 2002, a liability for the fair value of the obligation undertaken in issuing the guarantee. This interpretation does not prescribe a specific approach for subsequently measuring the guarantor's recognised liability over the term of the related guarantee.
The Group has issued guarantees on a certain portion of employee's housing loans. The amount guaranteed differs depending on the facts such as employment period and salary rates. When an employee leaves the employment of the Company, any housing debt guaranteed by Telkom is settled before any pension payout can be made to the employee. The fair value of guarantees subsequent to December 31, 2002 is not material to the Group.
The Group has issued certain guarantees in connection with borrowings of Vodacom Congo (RDC) s.p.r.l., an equity method investee for US GAAP purposes. On the adoption of FIN 45, all guarantees issued during fiscal year 2004 related to Vodacom Congo (RDC) s.p.r.l. were initially recorded at fair value at the balance sheet and subsequently amortised into income statements as the premiums are earned.
F-94
Additional US GAAP disclosures
Share based compensation
The Company accounts for stock option grants in accordance with APB Opinion No. 25, Accounting for Stock Issued to Employees ("APB 25") and related interpretations, because the Company believes the alternative fair value accounting model provided for under FASB Statement No.123, Accounting for Stock-Based Compensation, ("SFAS 123") requires the use of option valuation models that were not developed for use in valuing employee stock options.
Under APB 25, Telkom must account for options granted by a principle shareholder to its employees as a result of their employment with Telkom. Accordingly, the excess of the market price of the underlying stock at the date of grant over the exercise price of the employee options, is recognised as a shareholder capital contribution and compensation expense over the vesting period in the financial statements of the Company. The Company recognises this compensation expense for its graded vesting stock options on a straight-line basis over the vesting period of the shares.
Options granted under the Diabo stock option plan established by the principle shareholder, the Government of South Africa, are exercisable at the price of R33.81, expire three years from the date of grant, are not transferable other than on death, and are exercisable in four equal annual installments commencing on the date of grant, the first payments having been made six months from IPO date and on the first anniversary date of the scheme.
The compensation expense, applicable to current and ex-employees, is calculated as the difference between the option price and the share price on IPO date since it all relates to compensation for past service. Since the option price exceeded the share price on that date, no compensation expense is recorded.
Pro forma information regarding net income and earnings per share is required by SFAS 123, as amended by SFAS 148, and has been determined as if the Company had accounted for its employee stock options under the fair value method of that Statement. The fair value for these options was estimated at the date of grant using a binomial option pricing model with the following weighted-average assumptions:
- •
- risk-free interest rates based on government zero coupon curve of 13.2% (first option), 12.7% (second option), 11.6% (third option) and 11.3% (last option date);
- •
- dividend yields of 3,33%pa (no dividend yield for the first year);
- •
- volatility factors of the expected market price of the Company's common stock of 34%pa
An actuarially adjusted binomial valuation method has been used that builds up a full binomial tree of possible share prices whenever the option is exercised, and discounts these to establish the fair value of the option granted.
For purposes of pro forma disclosures, the estimated fair value of the options is recognised as a onetime charge to operating expenses as allowed by the SEC for options granted in connection with privatising governmental entities. The Company's pro forma information based on fair value calculations under SFAS 123 follows:
F-95
| | March 31, 2002 Rm | March 31, 2003 Rm | March 31, 2004 Rm | *March 31, 2004 US$m | ||||
|---|---|---|---|---|---|---|---|---|
| US GAAP net income | 1,317 | 1,704 | 4,230 | 669 | ||||
| Compensation expense | — | (46 | ) | — | — | |||
| Pro forma net income | 1,317 | 1,658 | 4,230 | 669 | ||||
| Pro forma basic and diluted earnings per common share (cents): | 236.4 | 297.6 | 759.4 | 120.1 |
A summary of the Company's stock option activity and related information for the year ended March 31, 2004 follows:
| | March 31, 2002 | March 31, 2003 | March 31, 2004 | |||
|---|---|---|---|---|---|---|
| Outstanding number at the beginning of the year | — | — | 11,140,636 | |||
| Granted during the year | — | 11,140,636 | — | |||
| Exercised during the year | — | — | 5,570,318 | |||
| Outstanding at the end of the year | — | 11,140,636 | 5,570,318 | |||
| Exercisable at the end the of year | — | — | — | |||
| Fair value of options granted during the year | — | R46m | — | |||
Exercise prices for options outstanding, as at March 31, 2004 is R33.81. The weighted-average remaining contractual life of those options is 519.5 days.
Employee benefits
There is a difference in treatment of the transitional asset / liability at inception of the statements under IFRS and US GAAP. In terms of FAS 87, this is amortised on a straight-line basis over the remaining working lives of the employees participating in the plan from April 1, 1989. In terms of IAS 19, if this is a "liability" or deficit, this is either recognised immediately or alternatively amortised over a period of 5 years. In the event of an asset arising, the full amount is recognised immediately. The effect of these differences has been immaterial to the US GAAP reconciliation.
Pension and retirement funds
For purposes of US GAAP, pension costs for defined benefit plans are accounted for in accordance with SFAS 87 "Employers' Accounting for Pensions" and the disclosure is presented in accordance with SFAS 132 "Employers' Disclosures about Pensions and Other Postretirement Benefits". Presented below are the disclosures required by US GAAP that are in addition to those provided under IFRS. Except as described below, the plan liabilities and assets are the same under US GAAP as IFRS. The difference in the balance sheet and income statements amounts are attributable to how and when the respective standards were implemented.
The Telkom Retirement fund invests their funds in South Africa and internationally. Seven fund managers invest in South Africa and two specialised fund managers trade with bonds on behalf of the Retirement fund. The market value of the local investments is approximately R11.4b. (Included in this investment is R46m worth of Telkom Bonds). Internationally a global equity mandate is utilised, the value at the end of March being approximately R1.1b.
The total expected contributions payable to the pension and retirement fund for the next financial year is R445m.
F-96
Actuarial calculations were performed by qualified actuaries to determine the benefit obligation, plan asset and service costs for the pension and retirement funds for each of the financial periods presented. The following assumptions were used in their calculations:
The fund portfolio consists of the following
| —Equities | 60 | % | |
| —Bonds | 30 | % | |
| —Cash | 10 | % | |
| Yield on government bonds | 9 | % | |
| Long term rate of return on equities | 12 | % | |
| Long term rate of return on cash | 7 | % | |
| Administration fee allowance | 1 | % | |
| Expected return on assets | 10 | % |
Expected future benefit payments are as follows:
| | Pension fund Rm | Retirement fund Rm | Total Rm | |||
|---|---|---|---|---|---|---|
| 2005 | 10 | 330 | 340 | |||
| 2006 | 14 | 352 | 366 | |||
| 2007 | 18 | 374 | 392 | |||
| 2008 | 19 | 397 | 416 | |||
| 2009 | 20 | 420 | 440 | |||
| >5 years | 171 | 2,460 | 2,631 | |||
| Total | 252 | 4,333 | 4,585 | |||
No surplus has been recognised for both the pension and retirement fund as there is significant uncertainty as to the existence and valuation of the pension and retirement fund asset. The uncertainty is due to the Pension Funds Second Amendment Act which requires the apportionment of any actuarial surplus existing in the fund at the apportionment date, between the existing members, including pensioners, former members and the employer in such proportions as the Trustees of the fund shall determine. Pending the outcome of the apportionment exercise, a portion of the surplus may be recognised as an asset in future periods.
The income statement expense is therefore the amount of pension contributions. The last statutory valuation of the funds performed in March 2002, indicated a statutory deficit and the current contributions are based on that valuation. Management expects to complete the next statutory valuation in March 2005.
Pension fund
The pension fund values for March 2002 are not material.
F-97
The net periodic pension costs includes the following components:
| | March 31, 2003 Rm | March 31, 2004 Rm | *March 31, 2004 US$m | ||||
|---|---|---|---|---|---|---|---|
| Service cost on benefits earned: | |||||||
| Interest and service cost on projected benefit obligations | 17 | 22 | 3 | ||||
| Expected return on plan assets | (28 | ) | (31 | ) | (5 | ) | |
| Amortisation of transitional obligation | (3 | ) | (3 | ) | |||
| Amortisation of unrecognised net gain | — | 2 | — | ||||
| Net periodic pension benefit not recognised | (14 | ) | (10 | ) | (2 | ) | |
| Pension contributions | 18 | 22 | 3 |
The status of the pension plan is as follows:
| | March 31, 2003 Rm | March 31, 2004 Rm | *March 31, 2004 US$m | |||||
|---|---|---|---|---|---|---|---|---|
| Benefit obligation: | ||||||||
| At beginning of year | 113 | 162 | 26 | |||||
| Interest and service cost | 20 | 23 | 3 | |||||
| Employee contributions | — | 3 | — | |||||
| Benefits paid and net cash flow | — | (7 | ) | (1 | ) | |||
| Actuarial loss | 29 | 9 | 2 | |||||
| Benefit obligation at end of year | 162 | 190 | 30 | |||||
| Plan assets at fair value: | ||||||||
| At beginning of year | 190 | 211 | 33 | |||||
| Expected return on plan assets | 28 | 32 | 5 | |||||
| Net cash flows | 21 | 17 | 3 | |||||
| Actuarial loss | (28 | ) | (41 | ) | (6 | ) | ||
| Plan assets at end of year | 211 | 219 | 35 | |||||
| Net funding position | 49 | 29 | 5 | |||||
| Unrecognised net transitional obligation | (43 | ) | (41 | ) | (7 | ) | ||
| Unrecognised actuarial gain | 50 | 100 | 16 | |||||
| Pension surplus | 56 | 88 | 14 | |||||
F-98
Retirement fund
The net periodic retirement costs includes the following components:
| | March 31, 2002 Rm | March 31, 2003 Rm | March 31, 2004 Rm | *March 31, 2004 US$m | |||||
|---|---|---|---|---|---|---|---|---|---|
| Service cost on benefits earned: | |||||||||
| Interest and service cost on projected benefit obligations | 324 | 307 | 279 | 44 | |||||
| Expected return on plan assets | (444 | ) | (479 | ) | (421 | ) | (66 | ) | |
| Amortisation of transitional obligation | — | 1 | 1 | — | |||||
| Amortisation of unrecognised net gain | — | (48 | ) | — | — | ||||
| Net periodic pension benefit not recognised | (120 | ) | (219 | ) | (141 | ) | (22 | ) | |
| Retirement fund contributions | 494 | 452 | 466 | 74 |
March 31, 2002 Rm | March 31, 2003 Rm | March 31, 2004 Rm | *March 31, 2004 US$m | |||||||
|---|---|---|---|---|---|---|---|---|---|---|
| Benefit obligation: | ||||||||||
| At beginning of year | 2,340 | 2,809 | 2,679 | 424 | ||||||
| Interest and service cost | 324 | 307 | 279 | 44 | ||||||
| Benefits paid and net cash flow | 145 | (279 | ) | (307 | ) | (49 | ) | |||
| Actuarial (gain)/loss | — | (158 | ) | 511 | 81 | |||||
| Benefit obligation at end of year | 2,809 | 2,679 | 3,162 | 500 | ||||||
March 31, 2002 Rm | March 31, 2003 Rm | March 31, 2004 Rm | *March 31, 2004 US$m | |||||||
|---|---|---|---|---|---|---|---|---|---|---|
| Plan assets at fair value: | ||||||||||
| At beginning of year | 2,687 | 3,512 | 3,106 | 491 | ||||||
| Expected return on plan assets | 444 | 478 | 421 | 67 | ||||||
| Net cash flows | 381 | (185 | ) | (305 | ) | (48 | ) | |||
| Actuarial gain/(loss) | — | (699 | ) | 318 | 50 | |||||
| Plan assets at end of year | 3,512 | 3,106 | 3,540 | 560 | ||||||
| Net funding position | 703 | 427 | 378 | 60 | ||||||
| Unrecognised net transitional obligation | 8 | 8 | 7 | 1 | ||||||
| Unrecognised actuarial (loss)/gain | (351 | ) | 190 | 383 | 60 | |||||
| Pension surplus | 360 | 625 | 768 | 121 | ||||||
Health care costs
In addition to the Group's defined benefit pension plan, the Group sponsors a defined benefit health care plan that provides post-retirement medical benefits to full-time employees who have worked for the Company and joined before June 30, 2000. Employees joining after June 30, 2000 do not qualify for any post-retirement health care subsidies. The plan is contributory, with retiree contributions adjusted annually. The Group's policy is to fund the cost of medical benefits in amounts determined at the discretion of management.
The contribution liability is calculated as the present value of the future contributions after retirement. The Rand cap on the subsidy applicable to active members and post 1994 continuation members has been assumed to escalate at salary inflation.
F-99
The assumed future investment returns has a significant effect on the amounts reported. A one-percentage-point change in the assumed health care cost trend rate would have the following effects:
| | 1-Percentage- Point Movement | |
|---|---|---|
| Impact on total of service and interest cost components in 2004 | R13m | |
| Impact on post-retirement benefit obligation as of 2004 | R374m |
Restrictions on dividend payouts
The following is a reconciliation of retained earnings per US GAAP to the amount of unrestricted retained earnings:
| | March 31, 2002 Rm | March 31, 2003 Rm | March 31, 2004 Rm | *March 31, 2004 US$m | |||||
|---|---|---|---|---|---|---|---|---|---|
| Retained earnings per US GAAP | 6,755 | 8,459 | 12,689 | 2,008 | |||||
| Share of non-distributable retained earnings in significant investee | (2,678 | ) | (3,485 | ) | (3,951 | ) | (625 | ) | |
| Cell Captive investment | (35 | ) | (48 | ) | (237 | ) | (38 | ) | |
| Unrestricted earnings under US GAAP | 4,042 | 4,926 | 8,501 | 1,345 | |||||
All distributable earnings are available for distribution based on the Group's dividend policy. The Board of Directors of Telkom decides on an annual basis the amount of earnings to be reinvested in the operations and the amount of any remaining funds that are available for distribution to shareholders.
Retained earnings of our investee, Vodacom, are restricted, since we require the consent of other shareholders in order to require Vodacom to declare dividends. Restricted retained earnings included in the March 31, 2004 balance amount to R3,951m (2003: R3,485m; 2002: R2,678m).
The Group has invested funds in two Cell Captives, which will be used to fund future post-retirement medical aid costs and for short-term insurance. These funds will be used for those purposes only and are therefore not distributable.
F-100
In the year ended March 31, 2000 the Group entered into a sale and leaseback of its vehicle fleet with Debis, part of which is being accounted for under US GAAP as capital leases. While no minimum usage clause exists in this contract as presented in note 24, the Group is deemed to be economically compelled under US GAAP to renew such leases based upon their historical requirements and contractual obligations to source any such requirements during the contract period from Debis. In accordance with the agreement Telkom is not allowed to lease any similar vehicles as those specified in the contract from any other service provider during the five-year period.
The current contract does not have a forced renewal option. Any continued involvement after March 31, 2005 will be renegotiated at the time of expiry of the current contract. The contract is structured to have no lease increases on vehicles that are continually leased from debis. If a vehicle is replaced by a new similar vehicle the lease payment is increased with a percentage increase based on the South African Consumer Price Index at the time.
The operating lease commitments as at March 31, 2004 are as follows:
| | Buildings Rm | Equipment Rm | Vehicles Rm | Total Rm | ||||
|---|---|---|---|---|---|---|---|---|
| 2005 | 115 | 13 | 485 | 613 | ||||
| 2006 | 89 | 9 | — | 98 | ||||
| 2007 | 75 | 13 | — | 88 | ||||
| 2008 | 68 | 1 | — | 69 | ||||
| 2009 | 49 | — | — | 49 | ||||
| >5 years | 48 | — | — | 48 | ||||
| Total | 444 | 36 | 485 | 965 | ||||
The finance lease commitments as at March 31, 2004 are as follows:
| | Buildings Rm | Equipment Rm | Vehicles Rm | Total Rm | ||||
|---|---|---|---|---|---|---|---|---|
| 2005 | 78 | — | 55 | 133 | ||||
| 2006 | 85 | — | — | 85 | ||||
| 2007 | 94 | — | — | 94 | ||||
| 2008 | 103 | — | — | 103 | ||||
| 2009 | 113 | — | — | 113 | ||||
| >5 years | 1,643 | — | — | 1,643 | ||||
| Total | 2,116 | — | 55 | 2,171 | ||||
Asset retirement obligations
The Group provides for its asset retirement obligations, if estimable, at the present value of expected future cash flows when the obligation to dismantle or restore the site arises. The increase in the related asset's carrying value is depreciated over its estimated useful life. The unwinding of the discount is included in the income statement. The provision raised in respect of the Group's asset retirement obligation is not significant. The Group does however have assets with indeterminate useful lives for which not enough information is currently available to estimate a range of settlement dates, and thus the fair value of the obligation. For these assets the liability will be recognised in the period in which sufficient information related to the potential settlement dates is available to determine a fair value.
F-101
Statement of income classification items
US GAAP requires the disclosure of certain income statement items
| | March 31, 2002 Rm | March 31, 2003 Rm | March 31, 2004 Rm | *March 31, 2004 US$m | |||||
|---|---|---|---|---|---|---|---|---|---|
| Revenues from other services | (21,129 | ) | (22,319 | ) | (22,746 | ) | (3,599 | ) | |
| Income from rentals | (599 | ) | (591 | ) | (629 | ) | (99 | ) | |
| Net sales of tangible products | (120 | ) | (130 | ) | (208 | ) | (33 | ) | |
| Income from Government | (1,288 | ) | (1,606 | ) | (1,866 | ) | (295 | ) | |
| Income from other related parties | (4,701 | ) | (4,959 | ) | (5,092 | ) | (806 | ) | |
| Total operating revenue | (27,837 | ) | (29,605 | ) | (30,541 | ) | (4,832 | ) | |
March 31, 2002 Rm | March 31, 2003 Rm | March 31, 2004 Rm | *March 31, 2004 US$m | ||||||
|---|---|---|---|---|---|---|---|---|---|
| Total revenue from services | (27,717 | ) | (29,475 | ) | (30,333 | ) | (4,799 | ) | |
| —Subscription and connection | (4,283 | ) | (4,582 | ) | (4,915 | ) | (778 | ) | |
| —Domestic (local and long distance) | (8,670 | ) | (9,176 | ) | (9,680 | ) | (1,532 | ) | |
| —Fixed to mobile | (7,323 | ) | (7,540 | ) | (7,321 | ) | (1,158 | ) | |
| —International outgoing | (1,175 | ) | (1,284 | ) | (1,312 | ) | (207 | ) | |
| —Interconnection | (1,765 | ) | (1,762 | ) | (1,643 | ) | (260 | ) | |
| —Data | (3,814 | ) | (4,464 | ) | (5,032 | ) | (796 | ) | |
| —Directories and other | (687 | ) | (667 | ) | (430 | ) | (68 | ) | |
| Revenue from product sales | (120 | ) | (130 | ) | (208 | ) | (33 | ) | |
| Total operating revenue | (27,837 | ) | (29,605 | ) | (30,541 | ) | (4,832 | ) | |
Costs of services | 13,670 | 13,840 | 14,749 | 2,334 | |||||
| Cost of sales related to services | 122 | 126 | 93 | 15 | |||||
| Cost of tangible products sold | 110 | 120 | 201 | 32 | |||||
| Operating expenses of other income and SG&A | 11,577 | 11,123 | 8,871 | 1,403 | |||||
| Total operating expense | 25,479 | 25,209 | 23,914 | 3,784 | |||||
| Net interest and amortisation of debt expense | 1,830 | 4,113 | (2,918 | ) | (462 | ) |
Balance Sheet Classification Items
US GAAP requires the disclosure of certain balance sheet items
| | March 31, 2002 Rm | March 31, 2003 Rm | March 31, 2004 Rm | *March 31, 2004 US$m | |||||
|---|---|---|---|---|---|---|---|---|---|
| Amounts payable for advisory, management and service fee | (23 | ) | (26 | ) | (7 | ) | (1 | ) | |
| Amounts payable to controlled companies | (40 | ) | (89 | ) | (115 | ) | (18 | ) | |
| Amounts payable to affiliates | (676 | ) | (393 | ) | (496 | ) | (79 | ) | |
| Trade creditors | (1,666 | ) | (1,620 | ) | (1,127 | ) | (178 | ) | |
| Restructuring liability | (35 | ) | — | (97 | ) | (15 | ) | ||
| Other amounts payable | (3,438 | ) | (1,950 | ) | (2,288 | ) | (362 | ) | |
| Total payable | (5,878 | ) | (4,078 | ) | (4,130 | ) | (653 | ) | |
F-102
Other payables include the following broad categories of payables: Financial instrument payables, sundry provisions, accruals and VAT payable.
Allowances
The following allowances have been included in other liabilities in the balance sheet items as disclosed in the IFRS financial statements for the Company.
| | March 31, 2002 Rm | March 31, 2003 Rm | March 31, 2004 Rm | *March 31, 2004 US$m | |||||
|---|---|---|---|---|---|---|---|---|---|
| Restructuring provision | |||||||||
| Opening balance | — | 35 | — | — | |||||
| Movement in provision | 373 | 244 | 302 | 50 | |||||
| Workforce reduction payments | (338 | ) | (279 | ) | (205 | ) | (34 | ) | |
| Closing balance restructuring liability | 35 | — | 97 | 16 | |||||
Recently issued accounting standards
In November 2002, The Emerging Issues Task Force reached a final consensus related to Revenue Arrangements with Multiple Deliverables (EITF 00-21). The consensus requires that revenue arrangements with multiple deliverables should be divided into separate units of accounting if (a) a delivered item has a value to the customer on a stand alone basis, (b) there is objective and reliable evidence of the fair value of the undelivered item and (c) the arrangement includes a general right of return, delivery or performance of the undelivered items is considered probable and substantially in the control of the vendor. Arrangement consideration should be allocated among the separate units of accounting based on their relative fair value and appropriate revenue recognition criteria would be applied to each separate unit of accounting. The group has not yet determined what effect, if any, EITF 00-21 would have on revenue and net income determined in accordance with US GAAP. The task force agreed the effective date for the consensus will be for all revenue arrangements entered into in fiscal periods beginning after June 15, 2003, with early adoption permitted. The Group is still evaluating the impact of this EITF on its financial statements. This EITF will be effective for the Group for revenue arrangements entered into after April 1, 2004.
On May 28, 2003, the Financial Accounting Standards Board ratified the consensus reached in the Emerging Issues Task Force Issue no 01-8, "Determining Whether an Arrangement Contains a Lease." EITF 01-8 addresses the issue on how to determine whether an arrangement contains a lease that is within the scope of SFAS 13, "Accounting for Leases." EITF 01-8 requires lease accounting for contractual arrangements that explicitly or implicitly convey the right to use specific property plant or equipment. These "embedded lease" attributes exist in certain data processing outsourcing arrangements that require a substantial investment in computer hardware and terminals devoted solely to the use of a single customer, or where providers of network capacity grant rights to capacity on the basis of an indefeasible right of use. The adoption of EITF 01-8 will result in indefeasible rights of use being accounted for as service contracts. The Group plans to adopt the provisions of EITF 01-8 for all agreements entered into after March 31, 2004, and it is not expected to have a material impact on the Group's results of operations, financial position and cash flows.
F-103
VODACOM GROUP (PROPRIETARY) LIMITED
REGISTRATION NO. 1993/005461/07
CONSOLIDATED ANNUAL FINANCIAL STATEMENTS
FOR THE THREE YEARS ENDED MARCH 31, 2004
F-104
| | Page | |
|---|---|---|
| Report of the Independent Auditors | F-106 | |
| Consolidated Income Statements | F-107 | |
| Consolidated Balance Sheets | F-108 | |
| Consolidated Statements of Changes in Equity | F-109 | |
| Consolidated Cash Flow Statements | F-110 | |
| Notes to the Consolidated Financial Statements | F-111 |
F-105
| Deloitte® | PO Box 11007 Hatfield 0028 South Africa | Deloitte & Touche Chartered Accountants (SA) Audit-Pretoria Deloitte Waterkloof House 221 Waterkloof Road Waterkloof 0181 Docex 6 Pretoria Tel: +27 (0)12 482 0000 Fax: +27 (0)12 460 3633/4231 www.deloitte.com |
REPORT OF THE INDEPENDENT AUDITORS AND INDEPENDENT
REGISTERED PUBLIC ACCOUNTING FIRM*
To the Members of Vodacom Group (Proprietary) Limited
We have audited the Group annual financial statements for each of the three years in the period ended March 31, 2004 set out on pages F-111 to F-192. These financial statements are the responsibility of the Group's directors. Our responsibility is to express an opinion on these financial statements based on our audits.
We conducted our audit in accordance with statements of South African Auditing Standards and the standards of the Public Company Accounting Oversight Board (PCAOB) (United States). Those standards require that we plan and perform the audit to obtain reasonable assurance about whether the financial statements are free of material misstatement. An audit includes examining, on a test basis, evidence supporting the amounts and disclosures in the financial statements. An audit also includes assessing the accounting principles used and significant estimates made by management, as well as evaluating the overall financial statement presentation. We believe that our audit provide a reasonable basis for our opinion.
In our opinion, the consolidated financial statements, referred to above, present fairly, in all material respects, the financial position of the Group as at March 31, 2004, 2003 and 2002, and the results of its operations and its cash flows for each of the three years in the period ended March 31, 2004, in conformity with international Financial Reporting Standards, South African Statements of Generally Accepted Accounting Practice and in the manner required by the Companies Act in South Africa, 1973.
As discussed in Note 41, the accompanying 2003 and 2002 balance sheets have been restated to reflect to the reclassification of Vodacom Congo (RDC) s.p.r.l. preference shares from its shareholders' equity to liabilities. The restatement of both investments and interest bearing liabilities amounted to R150.3 million for 2003 and R215.8 million for 2002 and does not impact the Group's results or cash flow information for these years.
International Financial Reporting Standards vary in certain significant respects from accounting principles generally accepted in the United States of America ("US GAAP"). Information relating to the nature and effect of such differences is presented in Note 48 to the consolidated financial statements.
/s/ Deloitte & Touche
Registered Accountants and Auditors
Chartered Accountants (SA)
Pretoria,
South Africa
June 4, 2004
- *
- As defined in Rule 1001 of the PCAOB rules included in PCAOB Release No. 2003-007
A complete list of partners available from any of our officers.
A member firm of
Deloitte Touche Tohmatsu
AUDIT . TAX . CONSULTING . FINANCIAL ADVISORY.
National Executive Partners: V Naidoo Chief Executive RMW Dunne Chief Operating Officer
TI Brown Audit DL Kennedy Tax GG Gelink Consulting MG Crisp Financial Advisory
OS Arbee IRM Law
RK Stone Chairman of the Board NT Mtoba Deputy Chairman of the Board
Regional Partner: AE Swiegers
A full list of partners is available on request
F-106
VODACOM GROUP (PROPRIETARY) LIMITED
CONSOLIDATED INCOME STATEMENTS
FOR THE THREE YEARS ENDED MARCH 31, 2004
| | Notes | 2002 Rm | 2003 Rm | 2004 Rm | |||||
|---|---|---|---|---|---|---|---|---|---|
| REVENUE | 1 | 16,150.7 | 19,778.7 | 23,478.0 | |||||
| OTHER OPERATING INCOME | 29.2 | 68.0 | 57.6 | ||||||
| DIRECT NETWORK OPERATING COST | (8,369.8 | ) | (10,860.4 | ) | (13,052.9 | ) | |||
| DEPRECIATION | 5 | (1,857.3 | ) | (2,163.0 | ) | (2,316.9 | ) | ||
| STAFF EXPENSES | (1,135.2 | ) | (1,018.6 | ) | (1,331.6 | ) | |||
| MARKETING AND ADVERTISING EXPENSES | (542.0 | ) | (652.5 | ) | (702.0 | ) | |||
| GENERAL ADMINISTRATION EXPENSES | (498.2 | ) | (611.6 | ) | (682.3 | ) | |||
| AMORTIZATION OF INTANGIBLE ASSETS | 2 | (212.7 | ) | (210.7 | ) | (216.0 | ) | ||
| INTEGRATION COSTS, DISPOSAL OF OPERATIONS AND IMPAIRMENTS | 3 | 56.4 | — | — | |||||
| PROFIT FROM OPERATIONS | 5 | 3,621.1 | 4,329.9 | 5,233.9 | |||||
INTEREST, DIVIDENDS AND OTHER FINANCIAL INCOME | 6 | 840.4 | 742.4 | 656.6 | |||||
| FINANCE COSTS | 7 | (868.2 | ) | (1,546.3 | ) | (1,107.5 | ) | ||
| PROFIT BEFORE TAXATION | 3,593.3 | 3,526.0 | 4,783.0 | ||||||
| TAXATION | 8 | (1,190.7 | ) | (1,198.9 | ) | (1,725.0 | ) | ||
| PROFIT AFTER TAXATION | 2,402.6 | 2,327.1 | 3,058.0 | ||||||
| MINORITY INTEREST | 18 | (29.6 | ) | (112.5 | ) | (26.2 | ) | ||
| NET PROFIT | 2,373.0 | 2,214.6 | 3,031.8 | ||||||
2002 R | 2003 R | 2004 R | |||||||
| BASIC AND DILUTED EARNINGS PER SHARE | 34 | 237,300 | 221,460 | 303,180 | |||||
| DIVIDEND PER SHARE | 34 | 60,000 | 60,000 | 210,000 | |||||
F-107
VODACOM GROUP (PROPRIETARY) LIMITED
CONSOLIDATED BALANCE SHEETS
AS AT MARCH 31, 2004
| | Notes | 2002 Rm | 2003 Rm | 2004 Rm | ||||||
|---|---|---|---|---|---|---|---|---|---|---|
| ASSETS | ||||||||||
| NON CURRENT ASSETS | 11,429.1 | 12,276.2 | 13,194.2 | |||||||
| Property, plant and equipment | 9 | 9,896.6 | 10,675.0 | 10,858.6 | ||||||
| Investment properties | 10 | — | — | 63.8 | ||||||
| Intangible assets | 11 | 796.3 | 551.1 | 1,034.1 | ||||||
| Investments* | 12 | 238.5 | 345.4 | 222.4 | ||||||
| Deferred taxation | 13 | 497.7 | 704.7 | 1,015.3 | ||||||
CURRENT ASSETS | 4,145.3 | 4,689.7 | 6,903.5 | |||||||
| Inventory | 14 | 306.0 | 238.8 | 288.5 | ||||||
| Accounts receivable | 15 | 2,845.9 | 3,158.9 | 3,926.5 | ||||||
| Short-term investments | 12 | 58.6 | 50.9 | 316.5 | ||||||
| Foreign currency derivatives | 43 | 215.6 | 34.6 | 1.9 | ||||||
| Bank and cash balances | 33 | 719.2 | 1,206.5 | 2,370.1 | ||||||
| TOTAL ASSETS | 15,574.4 | 16,965.9 | 20,097.7 | |||||||
| EQUITY AND LIABILITIES | ||||||||||
| CAPITAL AND RESERVES | 5,463.8 | 6,837.4 | 7,603.1 | |||||||
| Ordinary share capital | 16 | — | — | — | ||||||
| Non-distributable reserves | 17 | 106.1 | (132.3 | ) | (299.2 | ) | ||||
| Retained earnings | 5,357.7 | 6,969.7 | 7,902.3 | |||||||
MINORITY INTEREST | 18 | 10.6 | 88.0 | 93.0 | ||||||
NON CURRENT LIABILITIES | 1,894.4 | 2,881.6 | 2,568.5 | |||||||
| Interest bearing debt | 19 | 780.2 | 1,732.2 | 1,216.6 | ||||||
| Deferred taxation | 13 | 926.2 | 993.1 | 1,173.5 | ||||||
| Provisions | 23 | 188.0 | 156.3 | 178.4 | ||||||
CURRENT LIABILITIES | 8,205.6 | 7,158.9 | 9,833.1 | |||||||
| Accounts payable | 20 | 3,223.6 | 3,799.0 | 5,326.3 | ||||||
| Taxation payable | 351.6 | 315.2 | 852.0 | |||||||
| Shareholder loans | 21 | 920.0 | 920.0 | — | ||||||
| Non-interest bearing debt | 22 | 4.3 | 4.3 | 4.3 | ||||||
| Short-term interest bearing debt* | 19 | 1,231.7 | 436.4 | 839.9 | ||||||
| Provisions | 23 | 297.6 | 324.4 | 473.7 | ||||||
| Dividends payable | 600.0 | 600.0 | 1,500.0 | |||||||
| Foreign currency derivatives | 43 | — | 200.6 | 64.5 | ||||||
| Bank overdraft | 33 | 1,576.8 | 559.0 | 772.4 | ||||||
| TOTAL EQUITY AND LIABILITIES | 15,574.4 | 16,965.9 | 20,097.7 | |||||||
| COMMITMENTS AND CONTINGENT LIABILITIES | 35-37 | |||||||||
- *
- The Group restated its investments and short-term interest bearing debt for the 2003 and 2002 financial years. Refer to Note 41 for full details of restatement disclosure.
F-108
VODACOM GROUP (PROPRIETARY) LIMITED
CONSOLIDATED STATEMENTS OF CHANGES IN EQUITY
FOR THE THREE YEARS ENDED MARCH 31, 2004
| | Notes | Share Capital Rm | Retained Earnings Rm | Non- Distributable Reserves Rm | Total Rm | ||||||||
|---|---|---|---|---|---|---|---|---|---|---|---|---|---|
| BALANCE AT MARCH 31, 2001 | — | 3,508.3 | (2.3 | ) | 3,506.0 | ||||||||
| Change in accounting policy | 24 | — | 84.9 | — | 84.9 | ||||||||
| BALANCE AT MARCH 31, 2001 | — | 3,593.2 | (2.3 | ) | 3,590.9 | ||||||||
| Net profit for the year | — | 2,373.0 | — | 2,373.0 | |||||||||
| Dividends declared | — | (600.0 | ) | — | (600.0 | ) | |||||||
| Contingency reserve | — | (8.5 | ) | 8.5 | — | ||||||||
| Net gains and losses not recognized in the income statement | 17 | ||||||||||||
| Foreign currency translation reserve | — | — | 119.8 | 119.8 | |||||||||
| Foreign currency translation reserve—deferred taxation | — | — | (19.9 | ) | (19.9 | ) | |||||||
| BALANCE AT MARCH 31, 2002 | — | 5,357.7 | 106.1 | 5,463.8 | |||||||||
| Net profit for the year | — | 2,214.6 | — | 2,214.6 | |||||||||
| Dividends declared | — | (600.0 | ) | — | (600.0 | ) | |||||||
| Contingency reserve | — | (2.6 | ) | 2.6 | — | ||||||||
| Net gains and losses not recognized in the income statement | 17 | ||||||||||||
| Foreign currency translation reserve | — | — | (262.0 | ) | (262.0 | ) | |||||||
| Foreign currency translation reserve—deferred taxation | — | — | 21.0 | 21.0 | |||||||||
| BALANCE AT MARCH 31, 2003 | — | 6,969.7 | (132.3 | ) | 6,837.4 | ||||||||
| Net profit for the year | — | 3,031.8 | — | 3,031.8 | |||||||||
| Dividends declared | — | (2,100.0 | ) | — | (2,100.0 | ) | |||||||
| Contingency reserve | — | 0.8 | (0.8 | ) | — | ||||||||
| Net gains and losses not recognized in the income statement | 17 | ||||||||||||
| Foreign currency translation reserve | — | — | (177.0 | ) | (177.0 | ) | |||||||
| Foreign currency translation reserve—deferred taxation | — | — | 10.9 | 10.9 | |||||||||
| BALANCE AT MARCH 31, 2004 | — | 7,902.3 | (299.2 | ) | 7,603.1 | ||||||||
F-109
VODACOM GROUP (PROPRIETARY) LIMITED
CONSOLIDATED CASH FLOW STATEMENTS
FOR THE THREE YEARS ENDED MARCH 31, 2004
| | Notes | 2002 Rm | 2003 Rm | 2004 Rm | ||||||
|---|---|---|---|---|---|---|---|---|---|---|
| CASH FLOW FROM OPERATING ACTIVITIES | ||||||||||
| Cash receipts from customers | 15,583.1 | 19,349.0 | 22,798.3 | |||||||
| Cash paid to suppliers and employees | (9,395.0 | ) | (12,627.9 | ) | (15,201.6 | ) | ||||
| CASH GENERATED FROM OPERATIONS | 25 | 6,188.1 | 6,721.1 | 7,596.7 | ||||||
| Finance costs paid | 26 | (889.2 | ) | (721.7 | ) | (512.3 | ) | |||
| Interest, dividends and other financial income received | 27 | 541.6 | 280.0 | 368.7 | ||||||
| Taxation paid | 28 | (1,539.1 | ) | (1,337.4 | ) | (1,463.3 | ) | |||
| Dividends paid—shareholders | (480.0 | ) | (600.0 | ) | (1,200.0 | ) | ||||
| Dividends paid—minority shareholders in subsidiaries | (6.3 | ) | — | — | ||||||
| NET CASH FLOWS FROM OPERATING ACTIVITIES | 3,815.1 | 4,342.0 | 4,789.8 | |||||||
| CASH FLOW FROM INVESTING ACTIVITIES | ||||||||||
| Additions to property, plant and equipment | 29 | (4,409.1 | ) | (3,066.5 | ) | (2,813.8 | ) | |||
| Proceeds on disposal of property, plant and equipment | 92.4 | 7.7 | 5.0 | |||||||
| Additions to investment properties | 30 | — | — | — | ||||||
| Acquisition of intangible assets | 11 | (193.7 | ) | — | (121.1 | ) | ||||
| Disposal of subsidiaries | 31 | 1.7 | 31.5 | — | ||||||
| Acquisition of subsidiaries | 31 | (0.1 | ) | — | 149.6 | |||||
| Disposal of joint ventures | 32 | 23.3 | — | — | ||||||
| Acquisition of joint ventures | 32 | — | — | — | ||||||
| Advance to minority shareholders | — | (157.9 | ) | — | ||||||
| Disposal of other investments | — | 9.0 | — | |||||||
| Other investing activities | (57.8 | ) | (67.0 | ) | (219.5 | ) | ||||
| NET CASH FLOWS UTILIZED IN INVESTING ACTIVITIES | (4,543.3 | ) | (3,243.2 | ) | (2,999.8 | ) | ||||
| CASH FLOW FROM FINANCING ACTIVITIES | ||||||||||
| Shareholder loans repaid | — | — | (920.0 | ) | ||||||
| Interest bearing debt raised | 570.6 | 774.1 | 186.9 | |||||||
| Interest bearing debt repaid | — | (426.1 | ) | (55.6 | ) | |||||
| Finance lease capital repaid | — | (1.6 | ) | (9.6 | ) | |||||
| Finance lease capital raised | — | 13.2 | — | |||||||
| Funding received from minority shareholders | — | 157.9 | — | |||||||
| NET CASH FLOWS (UTILIZED IN)/FROM FINANCING ACTIVITIES | 570.6 | 517.5 | (798.3 | ) | ||||||
| NET INCREASE/(DECREASE) IN CASH AND CASH EQUIVALENTS | (157.6 | ) | 1,616.3 | 991.7 | ||||||
| Cash and cash equivalents at the beginning of the year | (796.1 | ) | (857.6 | ) | 647.5 | |||||
| Effect of foreign exchange rate changes | 96.1 | (111.2 | ) | (41.5 | ) | |||||
| CASH AND CASH EQUIVALENTS AT THE END OF THE YEAR | 33 | (857.6 | ) | 647.5 | 1,597.7 | |||||
F-110
VODACOM GROUP (PROPRIETARY) LIMITED
NOTES TO THE CONSOLIDATED FINANCIAL STATEMENTS
MARCH 31, 2004
BASIS OF PREPARATION
These consolidated annual financial statements have been prepared in accordance with International Financial Reporting Standards and South African Statements of Generally Accepted Accounting Practice and have been prepared on the historical cost basis, unless otherwise indicated. The consolidated annual financial statements have been presented in South African Rands, as this is the currency in which the majority of the Group's transactions are denominated.
The principal accounting policies are consistent in all material respects with those applied in the previous period, except where disclosed elsewhere.
The following are the principal accounting policies adopted by the Group in the preparation of these consolidated annual financial statements:
ACCOUNTING POLICIES
A. CONSOLIDATION
A.1 Basis of Consolidation
The consolidated annual financial statements include the consolidated financial position, results of operations and cash flows of Vodacom Group (Proprietary) Limited and its subsidiaries, both foreign and domestic, up to March 31, 2004.
Joint ventures are included using the proportionate consolidation method, whereby the Group's share of the assets, liabilities, income, expenses and cash flows of joint ventures are combined on a line-by-line basis with similar items in the consolidated annual financial statements.
Subsidiaries and joint ventures where control is intended to be temporary, as they are acquired and held exclusively with a view to their subsequent disposal in the near future or the subsidiary or joint venture is operating under severe long-term restrictions, which significantly impairs its ability to transfer funds, are not consolidated, or proportionately consolidated. Such subsidiaries and joint ventures are accounted for as investments available for sale in terms of the accounting policy for Financial Instruments.
Minority interests in the consolidated balance sheet and income statement are separately presented.
Goodwill on the acquisition of subsidiaries and joint ventures is accounted for in accordance with the Group's accounting policy for Intangible Assets set out below.
- •
- ACQUISITIONS OF A BUSINESS
A.2 Business Combinations
Business combination acquisitions are accounted for using the purchase method of accounting, whereby the acquisition is accounted for at its cost plus any costs directly attributable to the acquisition. Cost represents the cash or cash equivalents paid or the fair value or other consideration given, at the date of the acquisition. Business combinations include the acquisition of subsidiaries and joint ventures.
On acquisition, the identifiable assets and liabilities of the relevant subsidiaries or joint ventures are measured based upon their fair value at the date of acquisition.
F-111
- •
- DISPOSALS
On subsequent disposal, the profit or loss on disposal is the difference between the selling price and the fair value of net assets and liabilities disposed of, adjusted for any related goodwill to the extent that it has not been amortized in the consolidated income statement in accordance with the Group's accounting policies.
A.3 Subsidiaries
Subsidiaries are those entities controlled by the Group. Control is presumed to exist where the Group has an interest of more than one half of the voting rights and the power to control the financial and operating activities of the entities so as to obtain benefits from its activities. All subsidiaries are consolidated.
Inter-company balances and transactions, and resulting unrealized profits between Group companies, are eliminated in full on consolidation.
Where necessary, accounting policies of subsidiaries are adjusted to ensure that the consolidated annual financial statements are prepared using uniform accounting policies.
Investments in subsidiaries are consolidated from the date on which the Group has power to exercise control, up to the date on which power to exercise control ceases.
A.4 Joint Ventures
Joint ventures, for the purpose of these consolidated annual financial statements, are those entities in which the Group has joint control through a contractual arrangement with one or more other venturers.
Investments in joint ventures are proportionately consolidated from the date on which the Group has power to exercise joint control, up to the date on which power to exercise joint control ceases.
The Group's proportionate share of inter-company balances and transactions, and resulting unrealized profit or losses, between Group companies and jointly controlled entities are eliminated on consolidation.
B. PROPERTY, PLANT AND EQUIPMENT
Property, plant and equipment are stated at cost less accumulated depreciation and any accumulated impairment losses, if any. Land is not depreciated and is recorded at cost less accumulated impairment losses, if any.
Cost of property, plant and equipment includes all directly attributable expenditure incurred in the acquisition, establishment and installation of such assets so as to bring them to a working condition for their intended use. Interest costs are not capitalized.
Depreciation is calculated so as to write off the cost of property, plant and equipment on a straight-line basis, over their estimated useful lives to its estimated residual value. Depreciation commences when the asset is ready for its intended use (in the case of infrastructure assets this is deemed to be the date of acceptance). The estimated useful lives of depreciable property, plant and equipment are as follows:
F-112
| General-purpose buildings | 50 years | |
| Special-purpose buildings | 15 years | |
| Infrastructure: | ||
| —GSM | 8 years | |
| —Value added services equipment | 8 years | |
| —Value added services software | 3 years | |
| Community services: | ||
| —Containers | 5 years | |
| —Cellular equipment | 2 years | |
| Information services: | ||
| —Equipment | 4 years | |
| —Software | 3 years | |
| SIM center | 4 years | |
| Office automation | 2 - 3 years | |
| Other assets: | ||
| —Motor vehicles | 4 years | |
| —Furniture and fittings | 5 years | |
| —Office equipment | 4 years |
General-purpose and special-purpose buildings are generally classified as owner-occupied. They are therefore held at cost and depreciated as property, plant and equipment, and not regarded as investment properties.
Assets held under finance leases are depreciated over their expected useful lives on the same basis as owned assets or, where shorter, the term of the relevant lease if there is no reasonable certainty that the Group will obtain ownership by the end of the lease term.
Maintenance and repairs, which neither materially add to the value of the assets nor appreciably prolong their useful lives, are recognized as an expense in the period incurred. Minor plant and equipment items are also recognized as an expense in the period incurred.
Profits or losses on the retirement or disposal of property, plant and equipment, determined as the difference between the actual proceeds and the carrying amount of the assets, are recognized in the consolidated income statement in the period in which they occur.
C. INVESTMENT PROPERTIES
Investment properties, which are properties held to earn rentals and / or for capital appreciation, are stated at cost less accumulated depreciation and accumulated impairment losses, if any.
Depreciation is calculated so as to write off the cost of the investment property on a straight-line basis, over its estimated useful live to its estimated residual value. Depreciation commences when the property is ready for its intended use. The estimated useful lives of depreciable properties are disclosed under property, plant and equipment and can be general purpose buildings or special purpose buildings.
D. INTANGIBLE ASSETS
Intangible assets are stated at cost less accumulated amortization and accumulated impairment losses, if any. The residual value of intangible assets is assumed to be zero. Intangible assets are amortized to the consolidated income statement on a straight-line basis over their estimated useful
F-113
lives, which are reviewed on an annual basis. Amortization commences when the intangible asset is available for use. The estimated useful lives of intangible assets are currently as follows:
| Licenses | ||
| —Mobile | 5 - 20 years | |
| Other intangible assets | ||
| —Contract mobile customers | 5 years | |
| —Prepaid mobile customers | 3 years | |
| —Trademarks | 5 - 10 years | |
| —Goodwill | (Note D.4) |
The following are the main categories of intangible assets:
D.1 Licenses
Licenses, which are acquired to yield an enduring benefit, are capitalized at cost and amortized from the date of commencement of usage rights over the shorter of the economic life or the duration of the license agreement.
D.2 Customer Bases
Cost of contract customer bases or prepaid customer bases represents the purchase price on the acquisition of mobile customer bases. Customer bases are amortized on a straight-line basis over their estimated useful lives.
D.3 Trademarks and Brands
Purchased trademarks and brands are capitalized at cost and amortized over their estimated useful lives. Expenditure incurred to develop, maintain and renew trademarks and brands internally is recognized as an expense in the period incurred.
D.4 Goodwill
Goodwill represents the excess of the cost of the acquisition of a subsidiary or joint venture, over the Group's interest in the fair value of identifiable assets and liabilities at the date of acquisition, and is carried at cost less accumulated amortization and accumulated impairment losses, if any. Goodwill is amortized on a straight-line basis over its estimated useful life, not exceeding 20 years.
E. INVENTORY
Inventory is stated at the lower of cost and net realizable value. Cost is determined by the first-in-first-out method and comprises all costs of purchase, costs of conversion and other costs incurred in bringing it to its present location and condition. Net realizable value represents the estimated selling price in the ordinary course of business less all estimated costs to completion and the estimated costs necessary to make the sale.
The amount of any write-down of inventory to net realizable value and all losses of inventory is recognized as an expense in the period the write-down or loss occurs.
F. FOREIGN CURRENCIES
F.1 Transactions and Balances
Foreign currency transactions are translated, on initial recognition, at the foreign exchange rate ruling at the date of the transaction.
F-114
Monetary assets and liabilities denominated in foreign currencies are translated at the foreign exchange rate ruling at settlement date or balance sheet date whichever occurs first. Exchange differences on the settlement or translation of monetary assets or liabilities are included in finance costs and finance income in the period in which they arise.
F.2 Foreign Entities
The annual financial statements of foreign entities are translated into South African Rands for incorporation into the consolidated annual financial statements. Assets and liabilities are translated at the foreign exchange rates ruling at balance sheet date. Income, expenditure and cash flow items are translated at the actual foreign exchange rate or average foreign exchange rates for the period.
Gains and losses on the translation of equity loans to foreign entities that are intended to be permanent are recognized in equity.
All resulting unrealized exchange differences are classified as equity. On disposal, the cumulative amounts of unrealized exchange differences that have been deferred are recognized in the consolidated income statement as part of the gain or loss on disposal.
Goodwill and intangibles arising on the acquisition of a foreign entity are treated as assets and liabilities of the Group and translated at the foreign exchange rates ruling at transaction date.
F.3 Foreign Currency Hedges
Foreign currency hedges are dealt with in the Financial Instruments accounting policy.
G. TAXATION
G.1 Current Taxation
The charge for current taxation is based on the results for the period and is adjusted for items that are non-assessable or disallowed. Current taxation is measured at the amount expected to be paid, using taxation rates and laws that have been enacted or substantively enacted by the balance sheet date.
G.2 Deferred Taxation
Deferred taxation is provided using the balance sheet liability method for all temporary differences arising between the carrying amounts of assets and liabilities, on the consolidated balance sheet, and their respective taxation bases. Deferred taxation is not provided on differences relating to goodwill for which amortization is not deductible for taxation purposes nor on the initial recognition of assets or liabilities, which is not a business combination and, at the time of the transaction, affects neither accounting nor taxable profit or loss.
Deferred taxation liabilities are recognized for taxable temporary differences associated with investments in subsidiaries and joint ventures, except where the Group is able to control the timing of the reversal of the temporary differences and it is probable that it will not reverse in the foreseeable future.
Deferred taxation assets are recognized to the extent that it is probable that future taxable profit will be available against which the associated unused taxation losses or credits and deductible temporary differences can be utilized.
Provision for taxation, which could arise if undistributed retained profit of certain subsidiaries is remitted, is only made where a decision has been taken to remit such retained profits.
F-115
G.3 Secondary Taxation on Companies
Secondary Taxation on Companies (STC) is provided for at a rate of 12.5% on the amount of the net dividend declared by Vodacom Group (Proprietary) Limited. It is recorded as a tax expense when dividends are declared.
H. EMPLOYEE BENEFITS
H.1 Post-employment Benefits
The Group provides defined contribution funds for the benefit of employees, the assets of which are held in separate funds. The funds are funded by payments from employees and the Group. Contributions to the fund are recognized as an expense in the period in which the employee renders the related service.
The Group has no liability for contributions to the medical aid of retired employees.
H.2 Short-term and Long-term Benefits
The cost of all short-term employee benefits, such as salaries, employee entitlements to leave pay, bonuses, medical aid and other contributions, are recognized during the period in which the employee renders the related service. The Group recognizes the expected cost of bonuses only when the Group has a present legal or constructive obligation to make such payment and a reliable estimate can be made.
H.3 Accumulative Termination Benefits
Accumulative termination benefits are payable whenever:
- •
- an employee's employment is terminated before the normal retirement date, or
- •
- an employee accepts voluntary redundancy.
The Group recognizes termination benefits when it is constructively obliged to either terminate the employment of current employees according to a detailed formal plan without possibility of withdrawal or to provide termination benefits as a result of an offer made to encourage voluntary redundancy. If the benefits fall due more than 12 months after balance sheet date, they are discounted to present value. In the case of an offer to encourage voluntary redundancy and if the amount can be reasonably estimated, the measurement of termination benefits is based on the number of employees expected to accept the offer.
H.4 Compensation Benefits
Employees of the wholly owned subsidiaries, including executive directors, are eligible for compensation benefits in the form of a Deferred Bonus Incentive Scheme. Periodically, a number of entitlements are issued to employees, the value of which depends on the seniority of the employee. Benefits of eligible employees arising from the entitlements are determined with reference to the present value per entitlement, which is determined annually based on profits as per the audited consolidated annual financial statements of Vodacom Group (Proprietary) Limited.
The fair value of the entitlements is calculated as the difference in the entitlement value at balance sheet date and the value at which the entitlements were issued, multiplied by the number of entitlements allocated to a participant. Any change in entitlement value is recorded in the income statement based on the present value of the expected future cash out flows and recorded as a liability in the balance sheet. Participating employees are entitled to cash in their entitlements once the right to do so has vested.
F-116
I. REVENUE RECOGNITION
Revenue, which excludes Value Added Taxation and sales between Group companies, represents the invoiced value of goods and services supplied by the Group. The Group measures revenue at the fair value of the consideration received or receivable. Revenue is recognized only when it is probable that the economic benefits associated with a transaction will flow to the Group and the amount of revenue, and associated costs incurred or to be incurred, can be measured reliably. The Group invoices its independent service providers and dealers (agents) for the revenue billed by them on behalf of the Group. The Group, within its contractual arrangements with its agents, pays them administrative fees. The Group receives in cash, the net amount equal to the gross revenue earned less the administrative fees payable to the agents.
If necessary, revenue is split into separately identifiable components.
The main categories of revenue and basis of recognition for the Group are:
I.1 Contract Products
These contracts may include a subsidized handset, 24-month service, activation, SIM-card and a user manual. Revenue is recognized as follows:
- •
- The loss on the subsidized handset, which includes the costs of the handset, the SIM-card and manual, is recognized upon activation by the customer.
- •
- Activation fee revenue received from the customer is recognized upon activation by the customer.
- •
- Monthly access revenue received from the customer is recognized in the period in which the service is delivered.
- •
- Airtime revenue is recognized on the usage basis. The terms and conditions of the bundled airtime products, where applicable, allow the carry over of unused minutes. The unused airtime is deferred in full.
- •
- Deferred revenue related to unused airtime is recognized when utilized by the customer. Upon termination of the customer contract, all deferred revenue for unused airtime is recognized in income.
- •
- Any other costs incurred as a result of a new customer, are expensed upon activation as this is treated as a customer acquisition cost.
- •
- AIRTIME
I.2 Prepaid Products
- •
- REMAINING ELEMENTS OF PREPAID PACKAGES
Upon purchase of an airtime voucher the customer receives the right to make outgoing calls and receive incoming calls. Revenue is recognized as the customer utilizes the voucher.
When a prepaid package is sold, all the costs, which include the costs of the SIM-card and manual, together with the commission, is treated as a customer acquisition cost. Activation cost up to the amount of revenue, including the revenue from the sale of the starter pack, is deferred and recognized upon activation by the customer. Any activation cost exceeding the revenue received is recognized as a loss upon sale of the starter pack by the Group. If a handset is bundled with a prepaid package, the cost is also treated as a customer acquisition cost.
F-117
The residual revenue related to the remaining elements of the prepaid packages is not separable since no objective evidence of fair value exists. The Group currently recognizes this residual amount upon activation.
I.3 Equipment Sales
All equipment sales are recognized only when delivery and acceptance has taken place. Equipment sales to third party service providers are recognized when delivery is accepted. No rights of return exist on sales to third party service providers.
- •
- INTERCONNECT AND DATA REVENUE
I.4 Other Revenue and Income
- •
- DIVIDENDS
- •
- INTEREST
Interconnect and data revenue is recognized on the usage basis.
Dividends from investments are recognized when the right to receive payment has been established.
Interest is recognized on a time proportion basis with reference to the principal amount receivable and the effective interest rate applicable.
J. LEASES
J.1 Lease Classification
Leases involving property, plant and equipment whereby the lessor provides finance to the lessee with the asset as security, and where the lessee assumes the significant risks and rewards of ownership of those leased assets, are classified as finance leases.
Leases of property, plant and equipment to the lessee, under which the lessor effectively retains the significant risks and rewards of ownership of those leased assets, are classified as operating leases.
- •
- FINANCE LEASES
J.2 Group as Lessee
- •
- OPERATING LEASES
Lessee finance leases are capitalized, as property, plant and equipment, at their cash equivalent cost and a corresponding finance lease liability is raised. The cash equivalent cost is the lower of fair value or the present value of the minimum lease payments, at inception of the lease. Such assets are depreciated in terms of the accounting policy on property, plant and equipment stated above. Lease payments are allocated between lease finance costs and a capital reduction of the finance lease liability. Lease finance costs are allocated to the consolidated income statement over the term of the lease using the effective interest rate method, so as to produce a constant periodic rate of return on the remaining balance of the liability for each period.
Lessee operating lease rental payments are expensed in the consolidated income statement on a straight-line basis over the lease term. When an operating lease is terminated before the lease term has expired any payment to the lessor that is required, by way of penalty, is recognized as an expense in the period in which termination takes place.
K. DERIVATIVE INSTRUMENTS
Prior to April 1, 2001, the Group entered into foreign exchange forward contracts to hedge the Group's exposure to fluctuations in foreign currency exchange rates on specific transactions.
F-118
Up to March 31, 2001, gains and losses on forward contracts designated as hedges of identifiable foreign currency firm commitments were deferred and included in the measurement of the related foreign currency transactions.
The portion of the premium paid or received relating to the commitment period was included in the measurement of the basis of the related foreign currency transaction when recorded. Any remaining premium was amortized over the remaining life of the forward contract.
Foreign exchange contract costs incurred in covering foreign currency loans are expensed over the period of the contract and are included in finance costs.
Prior to April 1, 2001, the Group entered into interest rate swap agreements in order to manage interest rate exposure. The net interest paid or received on the swaps was recognized as interest expense or income. Gains resulting from the early termination of interest rate swap agreements were deferred and amortized as adjustments to interest expense over the remaining period originally covered by the terminated swap.
Effective April 1, 2001, the Group adopted IAS 39: Financial Instruments: Recognition and Measurement (Revised 2000) ("IAS 39"), which requires that all derivative instruments be recorded on the balance sheet at fair value, including certain derivative instruments embedded in other contracts. Changes in the fair value of forward contracts and interest rate swaps are recorded each period in current earnings, as these contracts do not qualify as hedges under IAS 39. Upon initial application of IAS 39, the Group recorded the fair value of the existing forward contracts on the balance sheet and the corresponding gain was recognized as an adjustment of the opening balance of retained earnings.
The Group records options at fair value. Where the fair value of options cannot be reliably estimated, the options are recorded at cost.
The Group does not use derivatives for trading or speculative purposes.
L. FINANCIAL INSTRUMENTS—OTHER THAN DERIVATIVES
L.1 Initial Recognition and Measurement
All financial instruments, other than derivatives, which are dealt with above, are recognized on the consolidated balance sheet. Financial instruments are initially recognized when the Group becomes party to the contractual terms of the instruments and are measured at cost, which is the fair value of the consideration given (financial asset) or received (financial liability or equity instrument) for it.
Financial liabilities and equity instruments issued by the Group are classified at initial recognition as debt or equity or compounded instruments in terms of IAS 32: Financial Instruments: Disclosure and Presentation ("IAS 32") on the basis of their contractual terms.
Transaction costs are included in the initial measurement of the financial instrument. Subsequent to initial recognition, these instruments are measured as set out below.
L.2 Financial Assets
The Group's principal financial assets are investments, foreign currency derivatives, receivables and bank and cash balances:
- •
- INVESTMENTS
Investments in equity instruments, excluding those in subsidiaries and joint ventures, are classified as available for sale and are stated at fair value. Gains and losses from changes in fair value of available for sale financial assets are recognized directly in equity until the financial asset is disposed of or it is determined to be impaired, at which time the cumulative gain or loss previously recognized in equity is included in the consolidated income statement.
F-119
- •
- RECEIVABLES
Investments acquired principally for the purpose of generating a profit from the short-term fluctuations in price, are classified as held for trading and are recorded and measured at fair value. Gains and losses on these investments are recorded in the consolidated income statement.
Interest bearing investments, including investments in finance leases, are stated at original investment less principal payments, and amortizations, and less accumulated impairment.
- •
- BANK AND CASH BALANCES
Receivables originated by the Group by providing goods or services directly to the customer are carried at original invoice amount less provision for doubtful receivables. A provision for impairment of receivables is established when there is objective evidence that the Group will not be able to collect all amounts due according to the original terms of the receivables. The amount of the provision is the difference between the carrying amount and the recoverable amount.
The provision for doubtful receivables covers losses where there is objective evidence that probable losses are present in components of the receivable portfolio at the balance sheet date. These have been estimated based upon historical patterns of losses in each component, the credit ratings allocated to the customers and reflecting the current economic climate in which the borrowers operate. When a receivable is uncollectible, it is written off to the income statement; subsequent recoveries are credited to the income statement.
The accounting policy for bank and cash balances is dealt with under cash and cash equivalents set out below.
L.3 Financial Liabilities
The Group's principal financial liabilities are shareholder loans, interest bearing debt, non-interest bearing debt, accounts payable, foreign currency derivatives; dividends payable, provisions and bank borrowings and other short term debt:
- •
- SHAREHOLDER LOANS
- •
- DEBT
Shareholder loans are recognized at the original proceeds received less principal payments.
- •
- ACCOUNTS PAYABLE
Interest bearing debt, including finance lease obligations, is recognized at amortized cost, namely original debt less principal payments and amortizations. The accounting policy for finance lease obligations is dealt with under leases set out above.
- •
- DIVIDENDS PAYABLE
Accounts payable are stated at their cost.
- •
- PROVISIONS
Dividends payable are stated at amounts declared.
Provisions are recognized when the Group has a present legal or constructive obligation resulting from past events, for which it is probable that an outflow of resources embodying economic benefits will be required to settle the obligation and a reliable estimate of the amount of the obligation can be made. A past event is deemed to give rise to a present obligation if, taking into account the available evidence, it is more likely than not that a present obligation exists at balance sheet date.
F-120
- •
- BANK BORROWINGS AND OTHER SHORT TERM DEBT
The amount recognized as a provision, is the best estimate of the expenditure required to settle the present obligation at balance sheet date, taking into account risks and uncertainties surrounding the provision. Long-term provisions are discounted to net present value.
The accounting policy for bank borrowings and other short-term debt is dealt with under cash and cash equivalents set out below.
L.4 Equity Instruments
The Group's principal equity instrument is ordinary share capital, which is recorded at original cost.
L.5 De-recognition
Financial assets (or a portion thereof) are de-recognized when the Group realizes the rights to the benefits specified in the contract, the rights expire or the Group surrenders or otherwise loses control of the contractual rights that comprise the financial asset. On de-recognition, the difference between the carrying amount of the financial asset and proceeds receivable and any prior adjustment to reflect fair value that had been reported in equity are included in the consolidated income statement.
Financial liabilities (or a portion thereof) are de-recognized when the obligation specified in the contract is discharged, cancelled or expire. On de-recognition, the difference between the carrying amount of the financial liability, including related unamortized costs and amounts paid for it are included in the consolidated income statement.
L.6 Fair Value Methods and Assumptions
The fair value of financial instruments traded in an organized financial market are measured at the applicable quoted prices.
The fair value of financial instruments not traded in an organized financial market, is determined using a variety of methods and assumptions that are based on market conditions and risk existing at balance sheet date, including independent appraisals and discounted cash flow methods.
The carrying amounts of financial assets and liabilities with a maturity of less than one year are assumed to approximate their fair value.
L.7 Offset
Where a legally enforceable right of offset exists for recognized financial assets and financial liabilities, and there is an intention to settle the liability and realize the asset simultaneously, or to settle on a net basis, all related financial effects are offset.
M. IMPAIRMENT OF ASSETS
The carrying amounts of assets, mentioned in the accounting policy notes, are assessed at each balance sheet date or earlier if there is a triggering event, to determine whether there is any indication of impairment. If any such indication exists, the Group estimates the recoverable amount of the asset, being the higher of the asset's net selling price and its value in use. An impairment loss is recognized if the recoverable amount of an asset is less than its carrying amount. The impairment loss is recognized as an expense in the consolidated income statement immediately.
The net selling price represents the amount obtainable from the sale of an asset in an arm's length transaction between knowledgeable, willing parties, less costs of disposal.
F-121
The value in use of an asset represents the expected future cash flows, from continuing use and disposal that are discounted to their present value using an appropriate pre-tax discount rate that reflects current market assessments of the time value of money and the risks specific to the asset.
For an asset that does not generate cash inflows largely independent of those from other assets, the recoverable amount is determined for the cash-generating unit to which the asset belongs. An impairment loss is recognized whenever the recoverable amount of a cash-generating unit is less than its carrying amount.
The impairment loss is allocated to reduce the carrying amount of the assets of the cash-generating unit, first to goodwill in respect of the cash generating unit, if any, and then to the other assets on a pro-rata basis based on their carrying amounts.
A previously recognized impairment loss is reversed if there has been a change in the estimates used to determine the recoverable amount, however not to an amount higher than the carrying amount that would have been determined had no impairment loss been recognized in prior periods.
After the recognition of an impairment loss, any depreciation or amortization charge for the asset is adjusted for future periods to allocate the asset's revised carrying amount, less its estimated residual value, on a systematic basis over its remaining useful life.
For goodwill, a recognized impairment loss is not reversed, unless the impairment loss was caused by a specific external event of an exceptional nature that is not expected to recur and the increase relates clearly to the reversal of the effect of that event.
N. CASH AND CASH EQUIVALENTS
For the purpose of the consolidated cash flow statement, cash and cash equivalents comprise cash on hand, deposits held on call, net of bank borrowings, all of which are available for use by the Group unless otherwise stated. Cash on hand is measured at its face value. Deposits held on call are classified as loans originated by the company and carried at amortized cost. Due to the short-term nature of these, the amortized cost approximates its fair value.
Bank borrowings, consisting of interest bearing short-term bank loans repayable on demand and overdrafts are recorded at the proceeds received, net of direct issue costs. Finance costs, including premiums payable on settlement or redemption, are accounted for on an accrual basis and are added to the carrying amount of the instrument to the extent that they are not settled in the period in which they arise.
O. BORROWING COSTS
Borrowing costs are expensed as they are incurred.
P. EXPENSES
Marketing and advertising costs are expensed as they are incurred. Prepaid costs related to annual events sponsorships are written off over the duration of the event.
Q. INCENTIVES
Incentives paid to service providers and dealers for new activations, retention of existing customers and reaching specified sales targets are expensed as incurred.
Distribution incentives paid to service providers and dealers for exclusivity, distribution assets and distribution subsidies are deferred and expensed over the contractual relationship period.
F-122
Discontinuing operations are significant, distinguishable components of an enterprise that have been sold, abandoned or are the subject of formal plans for disposal or discontinuance.
The profit or loss on the sale or abandonment of a discontinuing operation is determined from the earlier of the enterprise entering into a binding sale agreement for substantially all of the assets attributable to the discontinuing operation, or, the approval and announcement of a detailed, formal plan of discontinuance by the Board of directors.
S. USE OF ESTIMATES
The preparation of financial statements in accordance with generally accepted accounting principles require the use of estimates and assumptions that affect the reported amounts of assets and liabilities and disclosure of contingent assets and liabilities on the date of the financial statements and the reported amounts of revenues and expenses during the reporting period. Although these estimates are based on management's best knowledge of current events and actions they may undertake in the future, actual results ultimately may differ from those estimates.
T. COMPARATIVES
Certain comparative figures have been reclassified, where required or necessary, in accordance with current period classifications and presentation.
1. REVENUE
| | 2002 Rm | 2003 Rm | 2004 Rm | |||
|---|---|---|---|---|---|---|
| Airtime and access | 9,029.4 | 10,646.7 | 12,738.0 | |||
| Data revenue | 457.1 | 654.4 | 1,039.2 | |||
| Interconnect revenue | 4,300.9 | 5,309.2 | 5,784.8 | |||
| Equipment sales | 1,627.4 | 2,263.7 | 2,897.4 | |||
| International airtime | 301.1 | 539.1 | 659.2 | |||
| Other | 434.8 | 365.6 | 359.4 | |||
| 16,150.7 | 19,778.7 | 23,478.0 | ||||
Data revenue, which previously formed part of airtime and access revenue for the 2003 and 2002 financial years, has now been separately disclosed due to the strategic importance of the disclosure to the Group. The 2003 and 2002 related disclosure have thus been restated in accordance with current year disclosure.
2. AMORTIZATION OF INTANGIBLE ASSETS
| | 2002 Rm | 2003 Rm | 2004 Rm | ||||
|---|---|---|---|---|---|---|---|
| Goodwill | (98.9 | ) | (96.4 | ) | (94.8 | ) | |
| Licenses | (9.4 | ) | (12.9 | ) | (14.8 | ) | |
| Trademarks | (7.1 | ) | (4.1 | ) | (7.3 | ) | |
| Customer bases | (97.3 | ) | (97.3 | ) | (99.1 | ) | |
| (212.7 | ) | (210.7 | ) | (216.0 | ) | ||
F-123
3. INTEGRATION COSTS, DISPOSAL OF OPERATIONS AND IMPAIRMENTS
| | 2002 Rm | 2003 Rm | 2004 Rm | ||||
|---|---|---|---|---|---|---|---|
| Vodacom Satellite Services (Proprietary) Limited (Note 3.1) | 37.7 | — | — | ||||
| Satellite phones—onerous contract | 45.5 | — | — | ||||
| Recoupment of Gateway assets accrual | 15.0 | — | — | ||||
| Management fees paid to Telkom SA Limited in respect of the Delareyville earth station | (22.8 | ) | — | — | |||
| Net capital gain on disposal of discontinued operations | 19.0 | — | — | ||||
| Joycell Shops (Proprietary) Limited and Yellow Lizard Web Design (Proprietary) Limited | 2.7 | — | — | ||||
| Vodacom Sport & Entertainment (Proprietary) Limited (Note 4.1) | 40.0 | — | — | ||||
| Film Fun (Holdings) (Proprietary) Limited (Note 4.2) | (53.8 | ) | — | — | |||
| Vodacom World Online (Proprietary) Limited (Note 4.3) | 30.1 | — | — | ||||
| Write-off of investment in GSM Companies | (0.3 | ) | — | — | |||
| 56.4 | — | — | |||||
3.1 Vodacom Satellite Services (Proprietary) Limited
Vodacom Group (Proprietary) Limited acquired 100% of the share capital of Vodacom Satellite Services (Proprietary) Limited with effect from August 1, 2000. The principal nature of the business of the company is that of a provider of wholesale satellite airtime to cellular networks in South Africa. During the year ended March 31, 2001, a provision was made to reflect a contractual obligation of R45.5 million to purchase satellite phones. Since a satellite license was not issued to Vodacom Satellite Services (Proprietary) Limited, these phones could not be utilized. The provision was reversed during the year ended March 31, 2002 as the Group was subsequently released from this contractual obligation, and a recoupment of R15.0 million was made on certain of the Gateway assets that were impaired in 2001.
An invoice amounting to R34.0 million was raised and issued to Vodacom Satellite Services (Proprietary) Limited on May 22, 2001, for services rendered at the earth station in Delareyville, over a period of 26 months. The invoice was under dispute as no formal agreement was in place with the supplier, Telkom SA limited, for those services rendered. Vodacom Satellite Services (Proprietary) Limited and Telkom SA Limited reached an agreement during the course of the 2002 financial year whereby an invoice of R22.8 million, inclusive of VAT, was issued and paid in December 2001.
4. DISCONTINUED OPERATIONS
4.1 Vodacom Sport & Entertainment (Proprietary) Limited
On September 1, 2001, the Group entered into a sale agreement to dispose of its 51% interest in Vodacom Sport & Entertainment (Proprietary) Limited to South African Investments Limited (SAIL). The company carried out the Group's sport and entertainment marketing operations. The disposal was completed on February 27, 2002, on which date control of Vodacom Sport & Entertainment (Proprietary) Limited passed to SAIL. The results were de-consolidated from February 28, 2002. A profit of R40.0 million arose on the disposal of Vodacom Sport & Entertainment (Proprietary) Limited, being the proceeds of disposal less the carrying amount of the subsidiary's net assets (Note 31.1 a). No tax charge or credit arose from the transaction.
F-124
4.2 Film Fun (Holdings) (Proprietary) Limited, Teljoy Botswana (Proprietary) Limited and Africell Cellular Services (Proprietary) Limited
The 100% shareholding in Film Fun (Holdings) (Proprietary) Limited, Teljoy Botswana (Proprietary) Limited and Africell Cellular Services (Proprietary) Limited was sold to a management consortium for R9.0 million. These disposals were effected in order to dispose of non-core operations. A loss of R53.8 million was realized, being the proceeds of disposal less the carrying amount of the subsidiary's net assets (Note 31.1 b). The sale agreements were signed on March 27, 2002. The results were de-consolidated from March 31, 2002. The goodwill associated with the entities was allocated on the initial acquisition of the Teljoy Group on January 31, 2000.
4.3 Vodacom World Online (Proprietary) Limited
On November 9, 2001, the Group entered into a sale agreement to dispose of its 40% interest in the joint venture company of Vodacom World Online (Proprietary) Limited to Tiscali International BV, the other party to the joint venture. The company carried out the Group's internet service provider operations. The disposal was completed on November 30, 2001, on which date control of Vodacom World Online (Proprietary) Limited passed to Tiscali International BV. A profit of R30.1 million arose on the disposal of Vodacom World Online (Proprietary) Limited, being the proceeds of disposal of R31.8 million less the realization of the shareholder's loan of R134.9 million, net liabilities of R34.9 million and deferred profit of R98.3 million on the sale of the internet division by Vodacom (Proprietary) Limited in the 2000 financial year now realized. No tax charge or credit arose from the transaction. The results were de-consolidated from November 30, 2001.
4.4 Results and cash flows
The results and cash flows of Vodacom Sport & Entertainment (Proprietary) Limited (VSE), Vodacom World Online (Proprietary) Limited (VWOL), Film Fun (Holdings) (Proprietary) Limited (FFH), which have been included in the consolidated financial statements, were as follows:
| | VSE Rm | VWOL Rm | FFH Rm | ||||
|---|---|---|---|---|---|---|---|
| 2002 | |||||||
| Income statement | |||||||
| Revenue | 52.8 | 36.1 | 160.7 | ||||
| Expenditure | (38.0 | ) | (56.0 | ) | (148.0 | ) | |
| Profit/(Loss) before taxation | 14.8 | (19.9 | ) | 12.7 | |||
| Taxation | (4.3 | ) | — | (0.1 | ) | ||
| Profit/(Loss) after taxation | 10.5 | (19.9 | ) | 12.6 | |||
| Cash flow statement | |||||||
Net cash flows from/(utilized in) operating activities | (2.8 | ) | 1.4 | 54.2 | |||
| Net cash flows from/(utilized in) investing activities | (2.6 | ) | — | (0.3 | ) | ||
| Net cash flows from/(utilized in) financing activities | — | 4.8 | (129.4 | ) | |||
| Net increase/(decrease) in cash and cash equivalents | (5.4 | ) | 6.2 | (75.5 | ) | ||
F-125
5. PROFIT FROM OPERATIONS
The profit from operations (including integration costs, disposal of operations and impairments (Note 3)) is arrived at after taking the following income/(expenditure) into account:
| | 2002 Rm | 2003 Rm | 2004 Rm | |||||
|---|---|---|---|---|---|---|---|---|
| Net (loss)/profit on disposal of property, plant and equipment | 3.4 | 2.6 | (6.8 | ) | ||||
| Loss on disposal of property, plant and equipment | (2.6 | ) | (0.9 | ) | (7.9 | ) | ||
| Profit on disposal of property, plant and equipment | 6.0 | 3.5 | 1.1 | |||||
| Depreciation of property, plant and equipment (Note 9) | (1,857.3 | ) | (2,163.0 | ) | (2,312.7 | ) | ||
| Buildings | (12.7 | ) | (16.6 | ) | (13.4 | ) | ||
| Infrastructure | (1,388.5 | ) | (1,657.6 | ) | (1,840.1 | ) | ||
| Information services | (332.1 | ) | (379.5 | ) | (350.5 | ) | ||
| Community services | (11.1 | ) | (12.4 | ) | (12.8 | ) | ||
| Motor vehicles | (19.6 | ) | (20.1 | ) | (20.2 | ) | ||
| Furniture | (16.3 | ) | (18.0 | ) | (17.7 | ) | ||
| Office equipment | (14.3 | ) | (16.8 | ) | (11.3 | ) | ||
| Leasehold improvements | (31.0 | ) | (39.1 | ) | (36.4 | ) | ||
| Other assets | (31.7 | ) | (2.9 | ) | (10.3 | ) | ||
| Depreciation of investment properties (Note 10) | — | — | (4.2 | ) | ||||
| Auditors' remuneration—audit fees | (6.2 | ) | (5.4 | ) | (5.6 | ) | ||
| Current year audit fees | (5.7 | ) | (6.0 | ) | (5.7 | ) | ||
| Prior year over/(under) provision of audit fees | (0.1 | ) | 0.4 | 0.3 | ||||
| Telkom SA Limited foreign issuer costs | (0.3 | ) | (28.2 | ) | (6.8 | ) | ||
| Recovered from Telkom SA Limited | — | 28.5 | 6.8 | |||||
| Expenses | (0.1 | ) | (0.1 | ) | (0.2 | ) | ||
| Auditors' remuneration—other services | (6.4 | ) | (7.4 | ) | (6.8 | ) | ||
| For other services | (9.6 | ) | (11.2 | ) | (7.4 | ) | ||
| Capitalized | 3.2 | 3.8 | 0.6 | |||||
| Consultancy services—professional fees | (102.1 | ) | (117.8 | ) | (117.3 | ) | ||
Operating lease rentals | (474.2 | ) | (546.3 | ) | (532.8 | ) | ||
| GSM transmission and data lines | (336.0 | ) | (460.8 | ) | (465.6 | ) | ||
| Office accommodation | (79.7 | ) | (27.8 | ) | (35.6 | ) | ||
| Other accommodation | (49.4 | ) | (54.4 | ) | (29.6 | ) | ||
| Office equipment | (7.6 | ) | (3.3 | ) | (2.0 | ) | ||
| Motor vehicles | (1.5 | ) | — | — | ||||
| Payment to other operators | (1,378.1 | ) | (2,217.2 | ) | (2,990.3 | ) | ||
License fees—GSM | (384.4 | ) | (503.7 | ) | (550.1 | ) | ||
Staff expenses—pension and provident fund contributions | (45.1 | ) | (57.9 | ) | (71.8 | ) | ||
| Pension fund contributions | (42.8 | ) | (52.5 | ) | (65.9 | ) | ||
| Provident fund contributions | (2.3 | ) | (5.4 | ) | (5.9 | ) | ||
| Increase in provision for obsolete inventory | (10.5 | ) | (36.5 | ) | (30.9 | ) | ||
Bad debts written off | (111.2 | ) | (31.1 | ) | (48.8 | ) | ||
Decrease/(Increase) in provision for doubtful receivables | 64.9 | (15.5 | ) | 0.8 | ||||
F-126
| | 2002 | 2003 | 2004 | ||||
|---|---|---|---|---|---|---|---|
| Consolidated headcount for the Group | |||||||
| Full time employees | 4,353 | 4,406 | 4,609 | ||||
6. INTEREST, DIVIDENDS AND OTHER FINANCIAL INCOME
| | 2002 Rm | 2003 Rm | 2004 Rm | |||
|---|---|---|---|---|---|---|
| Banks and loans | 23.8 | 51.4 | 68.4 | |||
| Dividends received—unlisted investments | 4.3 | — | 5.4 | |||
| Gain on remeasurement of minority shareholder loan* | — | 92.8 | — | |||
| Guarantee fees | — | 14.7 | 26.4 | |||
| Investment income—held for trading investments | 3.9 | 5.1 | 11.2 | |||
| Other interest income | 4.9 | 1.4 | 6.2 | |||
| Foreign exchange gains | 2.5 | 6.7 | 0.5 | |||
| Gain on foreign exchange contract revaluation | 778.4 | 244.7 | 269.6 | |||
| Gain on foreign liability and asset revaluation | 18.3 | 301.4 | 237.5 | |||
| Interest rate swap interest | — | 6.0 | 5.1 | |||
| Interest rate swap revaluation | 4.3 | 18.2 | 26.3 | |||
| 840.4 | 742.4 | 656.6 | ||||
- *
- This amount of Rnil (2003: R92.8 million; 2002: Rnil) relates to a loan from Caspian Construction Company Limited and Planetel Communications Limited, that was remeasured at amortized cost, at an effective interest rate of LIBOR plus 5%, for which no consideration has been recorded.
7. FINANCE COSTS
| | 2002 Rm | 2003 Rm | 2004 Rm | ||||
|---|---|---|---|---|---|---|---|
| Bank overdraft | (86.1 | ) | (50.0 | ) | (27.3 | ) | |
| Finance leases | (98.9 | ) | (123.8 | ) | (130.1 | ) | |
| Funding loans | (87.2 | ) | (127.3 | ) | (64.4 | ) | |
| Interest on minority shareholder loan** | — | (9.7 | ) | (7.6 | ) | ||
| Leasehold property | — | — | (5.2 | ) | |||
| Other finance costs | — | (6.8 | ) | (13.3 | ) | ||
| Shareholder loans | (144.2 | ) | (167.9 | ) | (47.2 | ) | |
| Foreign exchange losses | (5.0 | ) | (62.2 | ) | (29.7 | ) | |
| Interest rate swap interest | — | (4.0 | ) | (1.1 | ) | ||
| Interest rate swap revaluation | — | — | (18.9 | ) | |||
| Loss on foreign exchange contract revaluation | (199.0 | ) | (831.2 | ) | (479.1 | ) | |
| Loss on foreign liability and asset revaluation | (247.8 | ) | (163.4 | ) | (283.6 | ) | |
| (868.2 | ) | (1,546.3 | ) | (1,107.5 | ) | ||
- **
- This amount of R7.6 million (2003: R9.7 million; 2002: Rnil) relates to notional interest on the loan from Caspian Construction Company Limited and Planetel Communications Limited, that was remeasured at amortized cost, at an effective interest rate of LIBOR plus 5%, for which no consideration has been recorded.
F-127
8. TAXATION
| | 2002 Rm | 2003 Rm | 2004 Rm | |||||
|---|---|---|---|---|---|---|---|---|
| South African normal taxation | (1,001.7 | ) | (1,223.3 | ) | (1,702.6 | ) | ||
| Current year | (1,022.9 | ) | (1,231.5 | ) | (1,716.4 | ) | ||
| Prior year over provision | 21.2 | 8.2 | 13.8 | |||||
| Deferred taxation | (82.7 | ) | 135.8 | 143.9 | ||||
| Current year | (79.7 | ) | 154.0 | 156.4 | ||||
| Prior year under provision | (3.0 | ) | (18.2 | ) | (12.5 | ) | ||
| Secondary taxation on companies | (74.5 | ) | (75.0 | ) | (262.5 | ) | ||
| Current year | (75.5 | ) | (75.0 | ) | (262.5 | ) | ||
| Prior year over provision | 1.0 | — | — | |||||
| Foreign taxation | (2.5 | ) | (2.7 | ) | (5.4 | ) | ||
| Current year | (3.7 | ) | (2.7 | ) | (4.3 | ) | ||
| Prior year (under)/over provision | 1.2 | — | (1.1 | ) | ||||
| Foreign deferred taxation—current year | (29.3 | ) | (33.7 | ) | 101.6 | |||
| Current year | (29.3 | ) | (79.9 | ) | 109.8 | |||
| Prior year (under)/over provision | — | 46.2 | (8.2 | ) | ||||
| (1,190.7 | ) | (1,198.9 | ) | (1,725.0 | ) | |||
2002 Rm | 2002 Rm | 2003 Rm | 2003 Rm | 2004 Rm | 2004 Rm | |||||||||
|---|---|---|---|---|---|---|---|---|---|---|---|---|---|---|
| Reconciliation of rate of taxation | ||||||||||||||
| Normal taxation on profit before taxation | 1,078.0 | 30.0 | 1,057.8 | 30.0 | 1,434.9 | 30.0 | ||||||||
| Adjusted for: | ||||||||||||||
| Exempt income | (1.3 | ) | — | (0.9 | ) | — | (0.8 | ) | — | |||||
| Disallowed expenditure | 6.7 | 0.1 | 28.5 | 0.7 | 26.4 | 0.6 | ||||||||
| Goodwill | 27.8 | 0.7 | 27.0 | 0.7 | 27.6 | 0.6 | ||||||||
| Prior year over provision | (19.4 | ) | (0.5 | ) | (36.2 | ) | (0.9 | ) | (0.5 | ) | — | |||
| Unutilized taxation loss | 21.9 | 0.6 | — | — | 24.8 | 0.5 | ||||||||
| Utilization of taxation loss | (0.6 | ) | — | — | — | (75.3 | ) | (1.6 | ) | |||||
| Foreign taxation rate differences | 14.1 | 0.4 | 66.3 | 1.9 | 78.2 | 1.6 | ||||||||
| Secondary taxation on companies | 74.5 | 2.1 | 75.0 | 2.1 | 262.5 | 5.5 | ||||||||
| Utilization of investment deductions | — | — | (18.6 | ) | (0.5 | ) | (24.1 | ) | (0.5 | ) | ||||
| Utilization of cumulative timing and permanent differences of Vodacom Congo (RDC) s.p.r.l. | — | — | — | — | (28.7 | ) | (0.6 | ) | ||||||
| Temporary differences in subsidiaries not provided for | (11.0 | ) | (0.3 | ) | — | — | — | — | ||||||
| Vodacom Satellite Services (Proprietary) Limited | (4.1 | ) | (0.1 | ) | — | — | — | — | ||||||
| Other | (6.9 | ) | (0.2 | ) | — | — | — | — | ||||||
| 1,190.7 | 33.1 | 1,198.9 | 34.0 | 1,725.0 | 36.1 | |||||||||
F-128
9. PROPERTY, PLANT AND EQUIPMENT
| | Cost Rm | Accumulated Depreciation Rm | Net Book Value Rm | |||
|---|---|---|---|---|---|---|
| 2002 | ||||||
| Land and buildings | 795.7 | (34.0 | ) | 761.7 | ||
| Infrastructure | 12,559.1 | (4,393.9 | ) | 8,165.2 | ||
| Information services | 1,606.3 | (936.6 | ) | 669.7 | ||
| Community services | 85.2 | (55.6 | ) | 29.6 | ||
| Motor vehicles | 67.0 | (25.8 | ) | 41.2 | ||
| Furniture | 96.7 | (48.6 | ) | 48.1 | ||
| Office equipment | 69.0 | (42.6 | ) | 26.4 | ||
| Leasehold improvements | 196.6 | (76.1 | ) | 120.5 | ||
| Other assets | 56.2 | (22.0 | ) | 34.2 | ||
| 15,531.8 | (5,635.2 | ) | 9,896.6 | |||
| | Cost Rm | Accumulated Depreciation Rm | Net Book Value Rm | |||
|---|---|---|---|---|---|---|
| 2003 | ||||||
| Land and buildings | 879.3 | (50.7 | ) | 828.6 | ||
| Infrastructure | 14,818.4 | (5,922.5 | ) | 8,895.9 | ||
| Information services | 1,979.6 | (1,298.9 | ) | 680.7 | ||
| Community services | 78.3 | (49.8 | ) | 28.5 | ||
| Motor vehicles | 109.7 | (68.2 | ) | 41.5 | ||
| Furniture | 109.5 | (62.3 | ) | 47.2 | ||
| Office equipment | �� | 80.6 | (60.1 | ) | 20.5 | |
| Leasehold improvements | 211.4 | (114.4 | ) | 97.0 | ||
| Other assets | 56.4 | (21.3 | ) | 35.1 | ||
| 18,323.2 | (7,648.2 | ) | 10,675.0 | |||
| | Cost Rm | Accumulated Depreciation Rm | Net Book Value Rm | |||
|---|---|---|---|---|---|---|
| 2004 | ||||||
| Land and buildings | 820.9 | (43.4 | ) | 777.5 | ||
| Infrastructure | 16,738.5 | (7,678.4 | ) | 9,060.1 | ||
| Information services | 2,359.6 | (1,599.2 | ) | 760.4 | ||
| Community services | 90.7 | (62.3 | ) | 28.4 | ||
| Motor vehicles | 128.9 | (77.7 | ) | 51.2 | ||
| Furniture | 122.6 | (84.4 | ) | 38.2 | ||
| Office equipment | 89.0 | (66.6 | ) | 22.4 | ||
| Leasehold improvements | 247.3 | (150.1 | ) | 97.2 | ||
| Other assets | 55.0 | (31.8 | ) | 23.2 | ||
| 20,652.5 | (9,793.9 | ) | 10,858.6 | |||
F-129
| | Land and Buildings Rm | Infrastructure Rm | Information Services Rm | Community Services Rm | Motor Vehicles Rm | Furniture Rm | Office Equipment Rm | Leasehold Improvements Rm | Other Assets Rm | Total Rm | |||||||||||
|---|---|---|---|---|---|---|---|---|---|---|---|---|---|---|---|---|---|---|---|---|---|
| 2002 | |||||||||||||||||||||
| Opening balance | 435.2 | 6,423.2 | 556.3 | 31.5 | 8.8 | 14.9 | 7.8 | 4.8 | 213.7 | 7,696.2 | |||||||||||
| Additions | 339.6 | 3,050.3 | 476.4 | 9.5 | 20.5 | 39.2 | 15.9 | 94.2 | 39.7 | 4,085.3 | |||||||||||
| Disposals | (0.5 | ) | (48.4 | ) | (17.5 | ) | (0.3 | ) | (0.1 | ) | (4.1 | ) | (0.1 | ) | (0.1 | ) | (17.8 | ) | (88.9 | ) | |
| Foreign currency translation | 0.1 | 128.9 | 0.7 | — | 1.5 | 0.5 | 0.1 | 1.0 | — | 132.8 | |||||||||||
| Depreciation | (12.7 | ) | (1,388.5 | ) | (332.1 | ) | (11.1 | ) | (19.6 | ) | (16.3 | ) | (14.3 | ) | (31.0 | ) | (31.7 | ) | (1,857.3 | ) | |
| Other | — | — | (0.1 | ) | — | — | (0.1 | ) | — | — | 1.3 | 1.1 | |||||||||
| Business combinations | — | — | (12.2 | ) | — | (0.2 | ) | (4.4 | ) | (1.0 | ) | — | (54.8 | ) | (72.6 | ) | |||||
| Asset category transfers | — | (0.3 | ) | (1.8 | ) | — | 30.3 | 18.4 | 18.0 | 51.6 | (116.2 | ) | — | ||||||||
| Closing balance | 761.7 | 8,165.2 | 669.7 | 29.6 | 41.2 | 48.1 | 26.4 | 120.5 | 34.2 | 9,896.6 | |||||||||||
| | Land and Buildings Rm | Infrastructure Rm | Information Services Rm | Community Services Rm | Motor Vehicles Rm | Furniture Rm | Office Equipment Rm | Leasehold Improvements Rm | Other Assets Rm | Total Rm | |||||||||||
|---|---|---|---|---|---|---|---|---|---|---|---|---|---|---|---|---|---|---|---|---|---|
| 2003 | |||||||||||||||||||||
| Opening balance | 761.7 | 8,165.2 | 669.7 | 29.6 | 41.2 | 48.1 | 26.4 | 120.5 | 34.2 | 9,896.6 | |||||||||||
| Additions | 85.0 | 2,795.4 | 412.9 | 11.3 | 24.2 | 17.8 | 12.0 | 36.3 | 4.4 | 3,399.3 | |||||||||||
| Disposals | — | (3.1 | ) | (0.2 | ) | — | (1.3 | ) | (0.2 | ) | (0.1 | ) | — | (0.2 | ) | (5.1 | ) | ||||
| Foreign currency translation | (2.4 | ) | (421.8 | ) | (22.4 | ) | — | (2.4 | ) | (1.5 | ) | (0.4 | ) | (1.7 | ) | (0.2 | ) | (452.8 | ) | ||
| Depreciation | (16.6 | ) | (1,657.6 | ) | (379.5 | ) | (12.4 | ) | (20.1 | ) | (18.0 | ) | (16.8 | ) | (39.1 | ) | (2.9 | ) | (2,163.0 | ) | |
| Asset category transfer | 0.9 | 17.8 | 0.2 | — | (0.1 | ) | 1.0 | (0.6 | ) | (19.0 | ) | (0.2 | ) | — | |||||||
| Closing balance | 828.6 | 8,895.9 | 680.7 | 28.5 | 41.5 | 47.2 | 20.5 | 97.0 | 35.1 | 10,675.0 | |||||||||||
| | Land and Buildings Rm | Infrastructure Rm | Information Services Rm | Community Services Rm | Motor Vehicles Rm | Furniture Rm | Office Equipment Rm | Leasehold Improvements Rm | Other Assets Rm | Total Rm | |||||||||||
|---|---|---|---|---|---|---|---|---|---|---|---|---|---|---|---|---|---|---|---|---|---|
| 2004 | |||||||||||||||||||||
| Opening balance | 828.6 | 8,895.9 | 680.7 | 28.5 | 41.5 | 47.2 | 20.5 | 97.0 | 35.1 | 10,675.0 | |||||||||||
| Transfer to investment properties | (58.1 | ) | — | — | — | — | — | — | — | — | (58.1 | ) | |||||||||
| Additions | 16.8 | 2,345.0 | 421.1 | 12.7 | 31.3 | 9.3 | 10.4 | 34.2 | 9.9 | 2,890.7 | |||||||||||
| Disposals | 0.1 | (7.4 | ) | (2.5 | ) | — | (1.2 | ) | (0.2 | ) | (0.1 | ) | (0.2 | ) | (0.3 | ) | (11.8 | ) | |||
| Foreign currency translation | (1.6 | ) | (295.6 | ) | (27.5 | ) | — | (2.0 | ) | (1.3 | ) | (0.5 | ) | (1.9 | ) | (0.3 | ) | (330.7 | ) | ||
| Depreciation | (13.4 | ) | (1,840.1 | ) | (350.5 | ) | (12.8 | ) | (20.2 | ) | (17.7 | ) | (11.3 | ) | (36.4 | ) | (10.3 | ) | (2,312.7 | ) | |
| Business combinations | 5.1 | — | 0.7 | — | — | 0.3 | 0.1 | — | — | 6.2 | |||||||||||
| Asset category transfer | — | (37.7 | ) | 38.4 | — | 1.8 | 0.6 | 3.3 | 4.5 | (10.9 | ) | — | |||||||||
| Closing balance | 777.5 | 9,060.1 | 760.4 | 28.4 | 51.2 | 38.2 | 22.4 | 97.2 | 23.2 | 10,858.6 | |||||||||||
F-130
| | 2002 Net Book Value Rm | 2003 Net Book Value Rm | 2004 Net Book Value Rm | |||
|---|---|---|---|---|---|---|
| Freehold land and buildings | ||||||
Portions 859, 847, 827, the remaining extent of Portion 45 (a portion of Portion 9), and Portion 828 (a portion of Portion 9) of farm Randjesfontein no. 405, Registration division J.R., Province of Gauteng, RSA | 32.4 | 32.4 | 35.0 | |||
| 43 Kwale Road, Dar es Salaam, Tanzania | 6.8 | 4.7 | 3.7 | |||
| Holding 359 Erand Agricultural Holdings Ext 1, RSA | — | 1.6 | 1.6 | |||
| Stand 200 Chelmsfordville, RSA | 0.1 | 0.5 | 0.6 | |||
| 1046 Mama Yemo Avenue, Lubumbashi, Province De Katanga, Democratic Republic of Congo | — | 1.5 | 0.5 | |||
| Kinshasa Building (Justice), 292 Justice Avenue, Gombe, Kinshasa, Democratic Republic of Congo | — | — | 4.2 | |||
| MSC Building, Maseru West, Lesotho | — | 0.7 | 0.7 | |||
| Stand 15, Eastwood Road, Dunkeld West, RSA | — | — | 5.0 | |||
| 39.3 | 41.4 | 51.3 | ||||
Leasehold land and buildings | ||||||
Portion 827 and 828 of farm Randjesfontein No. 405, RSA | 279.4 | 273.7 | 268.0 | |||
| Portion 769 of farm Randjesfontein No 405, RSA | 164.8 | 162.1 | 159.5 | |||
| Stand 34083 Bellville, City of Tygerberg, RSA | 109.5 | 107.9 | 106.3 | |||
| Erf 5259 and 5260 Montague Gardens, RSA | 98.1 | 96.5 | 94.9 | |||
| Holding 350 Erand Agricultural Holdings Ext. 1, RSA | 62.2 | 58.1 | — | |||
| Stand 207 Erand Agricultural Holdings Ext. 28, RSA | 6.8 | 88.9 | 87.2 | |||
| Holding 359 Erand Agricultural Holdings Ext. 1, RSA | 1.6 | — | — | |||
| Erf 33153 Belville, Cape Town, RSA | — | — | 10.3 | |||
| 722.4 | 787.2 | 726.2 | ||||
| Total freehold and leasehold land and buildings | 761.7 | 828.6 | 777.5 | |||
Debt is collateralized over leasehold land and buildings and the fair value of the lease liability is R845.4 million (2003: R884.9 million; 2002: R790.6 million).
A register with details of the cost price and date of acquisition of all land and buildings is available for inspection at the Registered office.
10. INVESTMENT PROPERTIES
| | Total Rm | ||
|---|---|---|---|
| 2004 | |||
| Opening balance | — | ||
| Transfer from property, plant and equipment (Note 10.1) | 58.1 | ||
| Business combination (Note 10.2) | 9.9 | ||
| Depreciation | (4.2 | ) | |
| Closing balance | 63.8 | ||
F-131
10.1 Holding 350 Erand Agricultural Holdings Ext. 1, RSA
The fair value of the investment property at March 31, 2004 has been arrived at on the basis of a valuation carried out at that day by RMB Properties Limited, on an open market value basis. The valuation was arrived at by reference to market evidence of transaction prices for similar properties. The property has been valued at R60.1 million.
Debt is collateralized over this leasehold land and building and the fair value of the lease liability included in Note 19.1 is R110.0 million at March 31, 2004.
The property has been reclassified to investment properties, due to the majority of the premises being leased to third parties.
The property rental income earned by the Group from its investment property, all of which is leased out under operating leases, amounted to R6.6 million. Direct operating expenses incurred on the investment property in the period amounted to R2.1 million.
10.2 Stand 13 and 14 Dunkeld West, RSA
The Group acquired these properties on March 1, 2004 through its equity investment in Smartphone SP (Proprietary) Limited.
The fair value of these investment properties at March 31, 2004 have been arrived at on the basis of a valuation carried out at that day by professional valuators, on an open market value basis. The valuation was arrived at by reference to market evidence of transaction prices for similar properties. The properties have been valued at R9.9 million.
The property rental income earned by the Group from these investment properties, all of which is leased out under operating leases, amounted to R0.1 million.
11. INTANGIBLE ASSETS
| | Cost Rm | Accumulated Amortization Rm | Net Book Value Rm | |||
|---|---|---|---|---|---|---|
| 2002 | ||||||
| Goodwill | 669.4 | (326.5 | ) | 342.9 | ||
| Licenses | 221.3 | (56.9 | ) | 164.4 | ||
| Trademarks | 51.5 | (24.8 | ) | 26.7 | ||
| Customer bases | 486.9 | (224.6 | ) | 262.3 | ||
| 1,429.1 | (632.8 | ) | 796.3 | |||
| | Cost Rm | Accumulated Amortization Rm | Net Book Value Rm | |||
|---|---|---|---|---|---|---|
| 2003 | ||||||
| Goodwill | 669.4 | (422.9 | ) | 246.5 | ||
| Licenses | 184.7 | (67.7 | ) | 117.0 | ||
| Trademarks | 51.5 | (28.9 | ) | 22.6 | ||
| Customer bases | 486.9 | (321.9 | ) | 165.0 | ||
| 1,392.5 | (841.4 | ) | 551.1 | |||
| | Cost Rm | Accumulated Amortization Rm | Net Book Value Rm | |||
|---|---|---|---|---|---|---|
| 2004 | ||||||
| Goodwill | 893.4 | (517.7 | ) | 375.7 | ||
| Licenses | 262.0 | (80.4 | ) | 181.6 | ||
| Trademarks | 209.7 | (36.2 | ) | 173.5 | ||
| Customer bases | 724.3 | (421.0 | ) | 303.3 | ||
| 2,089.4 | (1,055.3 | ) | 1,034.1 | |||
F-132
| Reconciliation | Opening Net Book Value Rm | Additions Rm | Foreign Currency Translation Rm | Business Combination Rm | Amortization Rm | Closing Net Book Value Rm | ||||||
|---|---|---|---|---|---|---|---|---|---|---|---|---|
| 2002 | ||||||||||||
| Goodwill | 359.1 | 98.5 | — | (15.8 | ) | (98.9 | ) | 342.9 | ||||
| Licenses | 61.2 | 95.2 | 17.5 | (0.1 | ) | (9.4 | ) | 164.4 | ||||
| Trademarks | 43.0 | — | — | (9.2 | ) | (7.1 | ) | 26.7 | ||||
| Customer bases | 359.6 | — | — | — | (97.3 | ) | 262.3 | |||||
| 822.9 | 193.7 | 17.5 | (25.1 | ) | (212.7 | ) | 796.3 | |||||
Reconciliation | Opening Net Book Value Rm | Additions Rm | Foreign Currency Translation Rm | Business Combination Rm | Amortization Rm | Closing Net Book Value Rm | ||||||
|---|---|---|---|---|---|---|---|---|---|---|---|---|
| 2003 | ||||||||||||
| Goodwill | 342.9 | — | — | — | (96.4 | ) | 246.5 | |||||
| Licenses | 164.4 | — | (34.5 | ) | — | (12.9 | ) | 117.0 | ||||
| Trademarks | 26.7 | — | — | — | (4.1 | ) | 22.6 | |||||
| Customer bases | 262.3 | — | — | — | (97.3 | ) | 165.0 | |||||
| 796.3 | — | (34.5 | ) | — | (210.7 | ) | 551.1 | |||||
Reconciliation | Opening Net Book Value Rm | Additions Rm | Foreign Currency Translation Rm | Business Combination Rm | Amortization Rm | Closing Net Book Value Rm | ||||||
|---|---|---|---|---|---|---|---|---|---|---|---|---|
| 2004 | ||||||||||||
| Goodwill | 246.5 | — | — | 224.0 | (94.8 | ) | 375.7 | |||||
| Licenses | 117.0 | 114.1 | (34.7 | ) | — | (14.8 | ) | 181.6 | ||||
| Trademarks | 22.6 | — | — | 158.2 | (7.3 | ) | 173.5 | |||||
| Customer bases | 165.0 | 7.0 | — | 230.4 | (99.1 | ) | 303.3 | |||||
| 551.1 | 121.1 | (34.7 | ) | 612.6 | (216.0 | ) | 1,034.1 | |||||
12. INVESTMENTS
| | 2002 Rm | 2003 Rm | 2004 Rm | |||||
|---|---|---|---|---|---|---|---|---|
| Held for trading | ||||||||
| Money market investments (Note 12.1) | 65.0 | 60.4 | 80.1 | |||||
| Less: Short-term portion of held for trading (Note 12.2) | (54.6 | ) | (50.9 | ) | (70.8 | ) | ||
| Available for sale | ||||||||
| Listed investment—SAGE shares | — | — | 16.5 | |||||
| Unlisted preference shares in Vodacom Congo (RDC) s.p.r.l.* | 215.8 | 150.3 | 119.1 | |||||
| The preference shares of US$18.9 million bear interest at a rate of 4% per annum. The preference shares are redeemable, but only after the first three years from date of inception and only on the basis that the shareholders are repaid simultaneously and in proportion to their shareholding. | ||||||||
| Less: Short-term portion of available for sale (Note 12.2) | — | — | (16.5 | ) | ||||
| Balance carried forward | 226.2 | 159.8 | 128.4 | |||||
F-133
Balance brought forward | 226.2 | 159.8 | 128.4 | |||||
Originating loans | ||||||||
| South African Investments Limited | 11.8 | — | — | |||||
| Long-term portion of the note receivable issued as part of the consideration for the disposal of Vodacom Sport & Entertainment (Proprietary) Limited. Interest is charged on this amount receivable at the prime-lending rate minus one percent per annum from the transaction date. | ||||||||
| Loan to Planetel Communications Limited and Caspian Construction Company Limited | 4.0 | — | — | |||||
| Planetel Communications Limited | — | 54.2 | 43.0 | |||||
| The loan of US$6.8 million issued during the 2003 year, bears interest at LIBOR plus 5%. Planetel Communications Limited utilized this loan to ensure sufficient shareholder loan funding by itself as a shareholder of Vodacom Tanzania Limited. The loans and capitalized interest are collateralized by cession over all shareholder distributions and a pledge over their shares of Vodacom Tanzania Limited. All the shareholders subordinated their loans to Vodacom Tanzania Limited for the duration of the project finance funding. (Note 19) | ||||||||
| Caspian Construction Company Limited | — | 64.4 | 51.0 | |||||
| The loan of US$8.1 million issued during the 2003 year, bears interest at LIBOR plus 5%. Caspian Construction Company Limited utilized this loan to ensure sufficient shareholder loan funding by itself as a shareholder of Vodacom Tanzania Limited. The loans and capitalized interest are collateralized by cession over all shareholder distributions and a pledge over their shares of Vodacom Tanzania Limited. All the shareholders subordinated their loans to Vodacom Tanzania Limited for the duration of the project finance funding. (Note 19) | ||||||||
| ABSA Bank Limited | — | 67.0 | 78.3 | |||||
| The Group's share of Vodacom Congo (RDC) s.p.r.l.'s deposit account amounts to €10.1 million (2003: €7.8 million; 2002: €nil), which is charged as security for the extended credit facility of Vodacom Congo (RDC) s.p.r.l., and bears interest at EURIBOR less 0.2%. The deposit is refundable once the extended credit facility is repaid. (Note 19) | ||||||||
| Vodacom Congo (RDC) s.p.r.l. | — | — | 150.9 | |||||
| The joint venture partner's share of the loan issued by Vodacom International Limited to Vodacom Congo (RDC) s.p.r.l. amounts to US$23.9 million. The loan bears interest at LIBOR plus 6.5%. The loan will be repaid on December 12, 2004. | ||||||||
| Other | 0.5 | — | — | |||||
| Less: Short-term portion of originating loans (Note 12.2) | (4.0 | ) | — | (229.2 | ) | |||
| 238.5 | 345.4 | 222.4 | ||||||
The fair value of the Group's investments is R538.9 million (2003: R396.3 million; 2002: R297.1 million).
F-134
12.1 Money market investments
| | Maturity Period | Interest Rate | Market Value Rm | |||
|---|---|---|---|---|---|---|
| 2002 | ||||||
| Details of the maturity periods and interest rates of the money market investments at year-end are as follows: | 0 - 6 months 6 - 12 months Over 12 months | 9.1% - 9.6 10.0% - 11.1 9.7% - 12.0 | % % % | 36.2 18.4 10.4 | ||
| 65.0 | ||||||
Maturity Period | Interest Rate | Market Value Rm | ||||
|---|---|---|---|---|---|---|
| 2003 | ||||||
| Details of the maturity periods and interest rates of the money market investments at year-end are as follows: | 0 - 6 months 6 - 12 months Over 12 months | 9.1% - 11.1 11.3 9.7 | % % % | 18.7 32.2 9.5 | ||
| 60.4 | ||||||
Maturity Period | Interest Rate | Market Value Rm | ||||
|---|---|---|---|---|---|---|
| 2004 | ||||||
| Details of the maturity periods and interest rates of the money market investments at year-end are as follows: | 0 - 6 months Over 12 months | 7.2% - 12.1 8.1% - 8.8 | % % | 70.8 9.3 | ||
| 80.1 | ||||||
12.2 Short-term portion
| | 2002 Rm | 2003 Rm | 2004 Rm | |||
|---|---|---|---|---|---|---|
| Held for trading | 54.6 | 50.9 | 70.8 | |||
| Available for sale | — | — | 16.5 | |||
| Originating loans | 4.0 | — | 229.2 | |||
| 58.6 | 50.9 | 316.5 | ||||
- *
- The Group restated its investments for the 2003 and 2002 financial years. Refer to Note 41 for full details of restatement disclosure.
F-135
| | 2002 Rm | 2003 Rm | 2004 Rm | ||||
|---|---|---|---|---|---|---|---|
| Deferred taxation assets | 497.7 | 704.7 | 1,015.3 | ||||
| Deferred taxation liabilities | (926.2 | ) | (993.1 | ) | (1,173.5 | ) | |
| (428.5 | ) | (288.4 | ) | (158.2 | ) | ||
13.1 Components
| | 2002 Rm | 2003 Rm | 2004 Rm | ||||
|---|---|---|---|---|---|---|---|
| Capital allowances | (822.9 | ) | (877.5 | ) | (959.6 | ) | |
| Foreign equity revaluation reserve | (17.9 | ) | 1.1 | 12.0 | |||
| Remeasurement of shareholder loans liability | — | (48.9 | ) | (33.0 | ) | ||
| Remeasurement of shareholder loans asset | — | 46.3 | 42.1 | ||||
| Taxation losses | 295.9 | 276.0 | 323.5 | ||||
| Provisions and deferred income | 160.8 | 378.1 | 615.5 | ||||
| Prepayments and other allowances | 41.0 | (18.0 | ) | (35.7 | ) | ||
| Customer base | (77.5 | ) | (48.7 | ) | (88.9 | ) | |
| Trademark | — | — | (46.5 | ) | |||
| Revaluation of property | — | — | (2.2 | ) | |||
| Foreign exchange losses—Vodacom Congo (RDC) s.p.r.l. | — | — | 22.2 | ||||
| Other | (7.9 | ) | 3.2 | (7.6 | ) | ||
| (428.5 | ) | (288.4 | ) | (158.2 | ) | ||
13.2 Reconciliation
| | 2002 Rm | 2003 Rm | 2004 Rm | |||||
|---|---|---|---|---|---|---|---|---|
| Balance at the beginning of the year | (268.4 | ) | (428.5 | ) | (288.4 | ) | ||
| Income statement income / (expense) | (112.0 | ) | 102.1 | 245.5 | ||||
| Foreign equity revaluation reserve | (19.9 | ) | 21.0 | 10.9 | ||||
| Movement due to IAS 39 adjustment | (36.5 | ) | — | — | ||||
| Business combinations | ||||||||
| Acquisition of customer base | 2.7 | — | (69.1 | ) | ||||
| Acquisition of trademark | — | — | (47.5 | ) | ||||
| Revaluation of property | — | — | (2.2 | ) | ||||
| Foreign exchange differences on consolidation of foreign subsidiaries | 7.2 | 17.0 | (7.4 | ) | ||||
| Disposal of subsidiaries | (1.6 | ) | — | — | ||||
| Balance at the end of the year | (428.5 | ) | (288.4 | ) | (158.2 | ) | ||
F-136
13.3 Utilization of taxation losses
| | 2002 Rm | 2003 Rm | 2004 Rm | |||||
|---|---|---|---|---|---|---|---|---|
| Opening taxation loss | 439.3 | 1,068.4 | 1,119.3 | |||||
| Foreign exchange movement on opening taxation loss | — | (304.7 | ) | (231.6 | ) | |||
| Prior year adjustment | — | 113.9 | (134.5 | ) | ||||
| Current year taxation loss created | 682.4 | 305.6 | 433.9 | |||||
| Subsidiaries liquidated | — | (63.9 | ) | — | ||||
| Disposal of subsidiaries and joint ventures | (53.3 | ) | — | — | ||||
| Closing taxation loss | 1,068.4 | 1,119.3 | 1,187.1 | |||||
| Utilized to reduce net deferred taxation liability | (986.3 | ) | (949.5 | ) | (1,022.1 | ) | ||
| Deferred taxation at 40% | — | — | (165.6 | ) | ||||
| Deferred taxation at 35% | — | (4.3 | ) | (6.6 | ) | |||
| Deferred taxation at 30% | (986.3 | ) | (884.6 | ) | (849.9 | ) | ||
| Deferred taxation at 15% | — | (60.6 | ) | — | ||||
| Tax holiday | — | (169.8 | ) | — | ||||
| Taxation losses available to reduce deferred taxation | 82.1 | — | 165.0 | |||||
F-137
There are unused taxation losses to the value of R165.0 million (2003: Rnil; 2002: R82.1 million) available to reduce the net deferred taxation liability. The effect of this would be a R24.8 million (2003: Rnil; 2002: R24.6 million) reduction in the net deferred taxation liability for the year to R133.4 million (2003: R288.4 million; 2002: R403.9 million). A deferred taxation asset was not recognized during the 2002 financial year for the above-mentioned unused taxation losses, as uncertainty existed as to whether future taxable profits would be available to utilize the asset against. During 2003 uncertainty existed as to whether the accumulated losses incurred by Vodacom Congo (RDC) s.p.r.l. during their tax holiday period will be available to reduce future taxable profits after expiry of the tax holiday period, and therefore no deferred taxation asset was raised. During the 2004 financial year it was confirmed by the local tax authority that the accumulated taxation losses will still be available after expiry of the tax holiday, resulting in the accumulated taxation asset being recognized.
14. INVENTORY
| | 2002 Rm | 2003 Rm | 2004 Rm | |||
|---|---|---|---|---|---|---|
| Merchandise | 305.3 | 229.1 | 260.4 | |||
| Other inventory | 0.7 | 9.7 | 28.1 | |||
| 306.0 | 238.8 | 288.5 | ||||
14.1 Inventory valuation allowance included above
| | 2002 Rm | 2003 Rm | 2004 Rm | |||||
|---|---|---|---|---|---|---|---|---|
| Balance at the beginning of the year | (1.3 | ) | (11.8 | ) | (48.3 | ) | ||
| Foreign exchange movement on opening balance | — | — | 0.3 | |||||
| Charged to costs and expenses | (10.5 | ) | (36.5 | ) | (30.9 | ) | ||
| Balance at the end of the year | (11.8 | ) | (48.3 | ) | (78.9 | ) | ||
15. ACCOUNTS RECEIVABLE
| | 2002 Rm | 2003 Rm | 2004 Rm | ||||
|---|---|---|---|---|---|---|---|
| Trade debtors | 2,395.2 | 2,645.5 | 3,072.4 | ||||
| Deferred incentives | 56.8 | 235.3 | 440.6 | ||||
| Prepayments | 262.5 | 185.4 | 240.6 | ||||
| Interest rate swap asset | 9.4 | 27.6 | 35.9 | ||||
| Value added taxation | 31.3 | 11.0 | 58.5 | ||||
| Interest income receivable | — | 10.3 | 18.9 | ||||
| Guarantee fees receivable | — | 14.7 | 13.1 | ||||
| Deferred proceeds from disposal of investments | |||||||
| South African Investments Limited | 11.8 | — | — | ||||
| Short-term portion of the note receivable issued as consideration for the disposal of Vodacom Sport & Entertainment (Proprietary) Limited. Interest is charged on this amount receivable at the prime-lending rate minus one percent per annum from the transaction date. | |||||||
| Film Fun (Holdings) (Proprietary) Limited | 9.0 | — | — | ||||
| Other | 69.9 | 29.1 | 46.5 | ||||
| 2,845.9 | 3,158.9 | 3,926.5 | |||||
F-138
15.1 Doubtful receivable allowance included above
| | 2002 Rm | 2003 Rm | 2004 Rm | |||||
|---|---|---|---|---|---|---|---|---|
| Balance at the beginning of the year | (141.9 | ) | (77.0 | ) | (82.6 | ) | ||
| Foreign exchange movement on opening balance | — | 9.9 | 6.2 | |||||
| Charged to / (Reversed from) costs and expenses | 64.9 | (15.5 | ) | 0.8 | ||||
| Balance at the end of the year | (77.0 | ) | (82.6 | ) | (75.6 | ) | ||
16. ORDINARY SHARE CAPITAL
| | 2002 R | 2003 R | 2004 R | ||||
|---|---|---|---|---|---|---|---|
| Authorized | |||||||
| 100,000 ordinary shares of 1 cent each | 1,000 | 1,000 | 1,000 | ||||
| Issued | |||||||
| 10,000 ordinary shares of 1 cent each | 100 | 100 | 100 | ||||
Unissued share capital is not under the control of the Board of directors.
17. NON-DISTRIBUTABLE RESERVES
| | 2002 Rm | 2003 Rm | 2004 Rm | |||||
|---|---|---|---|---|---|---|---|---|
| Foreign currency translation reserve | 117.5 | (144.5 | ) | (321.5 | ) | |||
| Deferred taxation on foreign currency translation reserve | (19.9 | ) | 1.1 | 12.0 | ||||
| Contingency reserve | 8.5 | 11.1 | 10.3 | |||||
| 106.1 | (132.3 | ) | (299.2 | ) | ||||
| Reconciliation | ||||||||
| Balance at the beginning of the year | (2.3 | ) | 106.1 | (132.3 | ) | |||
| Foreign currency translation reserve | 99.9 | (241.0 | ) | (166.1 | ) | |||
| Foreign currency translation | 119.8 | (262.0 | ) | (177.0 | ) | |||
| Deferred taxation | (19.9 | ) | 21.0 | 10.9 | ||||
| Other non-distributable reserves | ||||||||
| Transferred from distributable reserves—Contingency reserve | 8.5 | 2.6 | (0.8 | ) | ||||
| Balance at the end of the year | 106.1 | (132.3 | ) | (299.2 | ) | |||
Deferred taxation on the foreign currency translation reserve relates only to the translation of equity loans advanced to foreign subsidiaries.
In terms of the Short-term Insurance Act, 1998 the Group's cell captive partner, Nova Risk Partners Limited is required to raise a contingency reserve equal to 10% of premiums written less approved reinsurance (as defined in the Act). This reserve can be utilized only with the prior permission of the Registrar of Short-term Insurance.
F-139
| | 2002 Rm | 2003 Rm | 2004 Rm | |||||
|---|---|---|---|---|---|---|---|---|
| Distributable reserves | 12.0 | 124.5 | 150.7 | |||||
| Non-distributable reserves | (1.4 | ) | (36.5 | ) | (57.7 | ) | ||
| 10.6 | 88.0 | 93.0 | ||||||
Reconciliation | ||||||||
| Balance at the beginning of the year | (11.4 | ) | 10.6 | 88.0 | ||||
| Profit transferred from distributable reserves | 29.6 | 112.5 | 26.2 | |||||
| Foreign currency translation reserve | (0.1 | ) | (35.1 | ) | (21.2 | ) | ||
| Disposal of subsidiary | (4.7 | ) | — | — | ||||
| Dividend | (2.8 | ) | — | — | ||||
| Balance at the end of the year | 10.6 | 88.0 | 93.0 | |||||
19. INTEREST BEARING DEBT
| | 2002 Short-term Portion Rm | 2002 Long-term Portion Rm | 2002 Total Rm | 2003 Short-term Portion Rm | 2003 Long-term Portion Rm | 2003 Total Rm | ||||||
|---|---|---|---|---|---|---|---|---|---|---|---|---|
| Finance leases (Note 19.1) | 10.4 | 780.2 | 790.6 | 13.5 | 871.4 | 884.9 | ||||||
| Funding loans (Note 19.2) | 655.8 | — | 655.8 | 416.7 | 860.8 | 1,277.5 | ||||||
| Other short-term loans (Note 19.3) | 565.5 | — | 565.5 | 6.2 | — | 6.2 | ||||||
| 1,231.7 | 780.2 | 2,011.9 | 436.4 | 1,732.2 | 2,168.6 | |||||||
| | 2004 Short-term Portion Rm | 2004 Long-term Portion Rm | 2004 Total Rm | |||
|---|---|---|---|---|---|---|
| Finance leases (Note 19.1) | 29.0 | 856.7 | 885.7 | |||
| Funding loans (Note 19.2) | 807.7 | 359.9 | 1,167.6 | |||
| Other short-term loans (Note 19.3) | 3.2 | — | 3.2 | |||
| 839.9 | 1,216.6 | 2,056.5 | ||||
F-140
19.1 Finance Leases
| | 2002 Rm | 2003 Rm | 2004 Rm | |||||
|---|---|---|---|---|---|---|---|---|
| Vodacom (Proprietary) Limited | 502.4 | 594.3 | 596.4 | |||||
| The finance leases are collateralized by various land and buildings with a book value of R512.1 million (2003: R513.5 million; 2002: R443.0 million), bearing interest at fixed effective interest rates of between 12.1% and 16.9% per annum and are repayable between 4 and 8 years. | ||||||||
| Vodacom Service Provider Company (Proprietary) Limited | 288.2 | 290.6 | 289.3 | |||||
| The finance lease is collateralized by land and buildings with a book value of R268.0 million (2003: R273.7 million; 2002: R279.4 million), and bearing interest at a fixed effective interest rate of 14.8% per annum. Payments are made every six months in arrear and commenced on March 1, 2002. The finance lease expires on September 1, 2011. | ||||||||
| Less: Short-term portion of finance leases | ||||||||
| Vodacom (Proprietary) Limited | (7.1 | ) | (12.2 | ) | (22.5 | ) | ||
| Vodacom Service Provider Company (Proprietary) Limited | (3.3 | ) | (1.3 | ) | (6.5 | ) | ||
| �� | ||||||||
| Short-term portion of finance leases | (10.4 | ) | (13.5 | ) | (29.0 | ) | ||
| Long-term portion of finance leases | 780.2 | 871.4 | 856.7 | |||||
The fair value of the Group's finance lease liability is R955.4 million (2003: R884.9 million; 2002: R790.6 million).
| | 2005 Rm | 2006 Rm | 2007 Rm | 2008 Rm | 2009 Rm | 2010 onwards Rm | Total Rm | ||||||||
|---|---|---|---|---|---|---|---|---|---|---|---|---|---|---|---|
| Future minimum lease payments | 154.8 | 171.9 | 190.7 | 211.9 | 269.4 | 535.5 | 1,534.2 | ||||||||
| Finance costs | (125.8 | ) | (121.3 | ) | (111.7 | ) | (98.3 | ) | (77.2 | ) | (114.2 | ) | (648.5 | ) | |
| Net present value | 29.0 | 50.6 | 79.0 | 113.6 | 192.2 | 421.3 | 885.7 | ||||||||
19.2 Funding Loans
| | | 2002 Rm | 2003 Rm | 2004 Rm | |||||||
|---|---|---|---|---|---|---|---|---|---|---|---|
| Commerzbank AG | 200.0 | — | — | ||||||||
| The loan was uncollateralized, bore interest at a fixed quarterly rate of 13.7% and was repaid on March 17, 2003. | |||||||||||
| Crédit Agricole Indosuez | 200.0 | — | — | ||||||||
| The loan was uncollateralized, bore interest at a fixed quarterly rate of 14.0% NACQ and was repaid on March 17, 2003. | |||||||||||
| Balance carried forward | 400.0 | — | — | ||||||||
| Balance brought forward | 400.0 | — | — | ||||||||
| Planetel Communications Limited | 18.3 | 48.5 | 35.4 | ||||||||
F-141
| The shareholder loan of US$10.0 million (2003: US$10.0 million; 2002: US$1.6 million) is subordinated for the duration of the project finance funding period of Vodacom Tanzania Limited, bears no interest from April 1, 2002 (2002: 1%), and is thereafter available for repayment, by approval of at least 60% of the shareholders of Vodacom Tanzania Limited. The loan became non-interest bearing and was re-measured at amortized cost at an effective interest rate of LIBOR plus 5% (Note 12) during the 2003 financial year. The gain on re-measurement was included in the income statement (Note 6). | |||||||||||
| Caspian Construction Company Limited | 21.7 | 40.9 | 42.1 | ||||||||
| The shareholder loan of US$8.4 million (2003: US$8.4 million; 2002: US$1.9 million) is subordinated for the duration of the project finance funding period of Vodacom Tanzania Limited, bears no interest from April 1, 2002 (2002: 1%), and is thereafter available for repayment, by approval of at least 60% of the shareholders of Vodacom Tanzania Limited. This loan became non-interest bearing and was re-measured at amortized cost at an effective interest rate of LIBOR plus 5% (Note 12) during the 2003 financial year. The gain on re-measurement was included in the income statement (Note 6). | |||||||||||
| Project finance funding to Vodacom Tanzania Limited | — | 501.6 | 348.7 | ||||||||
| The drawn down portions of the project finance funding from external parties include the following: | |||||||||||
| (a) | Netherlands Development Finance Company of US$11.3 million (2003: US$11.3 million; 2002: US$nil); | ||||||||||
| (b) | DEG of €11.5 million (2003: €11.5 million; 2002: €nil); | ||||||||||
| (c) | Standard Corporate and Merchant Bank of US$16.0 million (2003: US$20.0 million; 2002: US$nil); | ||||||||||
| (d) | Barclays Bank (Local Syndicate Tanzania) of TSH15,356.3 million (2003: TSH19,744.0 million; 2002:TSHnil) | ||||||||||
| and is collateralized by a charge over 51% of the shares, the license and Vodacom Tanzania Limited's tangible and intangible assets. The loans bear interest based upon the foreign currency denomination of the project financing between 4.9% and 11.6% per annum and will be fully repaid by March 2009. | |||||||||||
| Extended credit facility to Vodacom Congo (RDC) s.p.r.l. | — | 335.7 | 310.1 | ||||||||
| The Group's share of Vodacom Congo (RDC) s.p.r.l.'s extended credit facility amounts to €38.8 million (2003: €38.8 million; 2002: €nil), which is partially collateralized by guarantees (Note 44) and a cash deposit (Note 12), and bears interest at a rate of between EURIBOR plus 1.5% and EURIBOR plus 1.75%. The facility will be fully repaid by July 31, 2005. | |||||||||||
| Balance carried forward | 440.0 | 926.7 | 736.3 | ||||||||
| Balance brought forward | 440.0 | 926.7 | 736.3 | ||||||||
| Revolving credit facilities to Vodacom Congo (RDC) s.p.r.l. | — | 130.0 | 312.2 | ||||||||
| The Group's share of the short-term revolving credit facility provided by ABSA amounts to US$16.3 million (2003: US$16.3 million; 2002: US$nil). The credit facility is collateralized by guarantees (Note 44) provided by the Group, which bears interest at an effective interest rate of LIBOR plus 1.5% and is available until December 31, 2004. | |||||||||||
F-142
| The Group's share of the short-term Euro revolving credit facility provided by Standard Finance (Isle of Man) Limited amounts to €11.5 million (2003: €nil; 2002: €nil). The credit facility is collateralized by guarantees (Note 44) provided by the Group and bears interest at an effective interest rate of EURIBOR plus 1.5%. | |||||||||||
| The Group's share of the short-term Dollar revolving credit facility provided by Standard Finance (Isle of Man) Limited amounts to US$19.1 million (2003: US$nil; 2002: US$nil). The credit facility is collateralized by guarantees (Note 44) provided by the Group and bears interest at an effective interest rate of LIBOR plus 1.5%. | |||||||||||
| Loan to Vodacom Congo (RDC) s.p.r.l. | — | 70.5 | — | ||||||||
| The Group's share of the loan provided by Standard Finance (Isle of Man) Limited amounted to US$8.8 million at March 31, 2003. The loan bore interest at an effective rate of LIBOR plus 1.5% and was repaid on July 1, 2003. | |||||||||||
| Preference shares issued by Vodacom Congo (RDC) s.p.r.l.* | 215.8 | 150.3 | 119.1 | ||||||||
| The preference shares of USD$18.9 million bear interest at a rate of 4% per annum. The preference shares are redeemable, but only after the first three years from date of inception and only on the basis that the shareholders are repaid simultaneously and in proportion to their shareholding. | |||||||||||
| Less: Short-term portion of funding loans | |||||||||||
| Commerzbank AG | (200.0 | ) | — | — | |||||||
| Crédit Agricole Indosuez | (200.0 | ) | — | — | |||||||
| Caspian Construction Company Limited | (18.3 | ) | — | — | |||||||
| Planetel Communications Limited | (21.7 | ) | — | — | |||||||
| Project finance to Vodacom Tanzania Limited | — | (65.9 | ) | (66.3 | ) | ||||||
| Extended credit facility to Vodacom Congo (RDC) s.p.r.l. | — | — | (310.1 | ) | |||||||
| Revolving credit facilities to Vodacom Congo (RDC) s.p.r.l. | — | (130.0 | ) | (312.2 | ) | ||||||
| Loan to Vodacom Congo (RDC) s.p.r.l. | — | (70.5 | ) | — | |||||||
| Preference shares issued by Vodacom Congo (RDC) s.p.r.l. | (215.8 | ) | (150.3 | ) | (119.1 | ) | |||||
| Short-term portion of funding loans | (655.8 | ) | (416.7 | ) | (807.7 | ) | |||||
| Long-term portion of funding loans | — | 860.8 | 359.9 | ||||||||
The fair value of the Group's funding loan liability is R1,167.6 million (2003: R1,277.5 million; 2002: R660.4 million).
F-143
19.3 Other short-term loans
| | 2002 Rm | 2003 Rm | 2004 Rm | ||||
|---|---|---|---|---|---|---|---|
| Vodacom Tanzania Limited | 539.4 | — | — | ||||
| The loan of US$47.2 million from Standard Bank of London was uncollateralized, bore interest at an effective interest rate of LIBOR plus 1.5% and was repaid during August 2002. | |||||||
| Vodacom (Proprietary) Limited | 26.1 | — | — | ||||
| Vodacom Congo (RDC) s.p.r.l. | — | 6.2 | 3.2 | ||||
| The Group's share of the short-term facility amounts to US$0.5 million (2003: US$0.8 million; 2002: US$nil). The facility bears interest at 18% per annum. The facility is subject to termination of the collection agreement. | |||||||
| 565.5 | 6.2 | 3.2 | |||||
The fair value of the Group's short-term loans is R3.2 million (2003: R6.2 million; 2002: R565.5 million)
19.4 Repayment of interest bearing debt
| | 2005 Rm | 2006 Rm | 2007 Rm | 2008 Rm | 2009 Rm | 2010 onwards Rm | Total Rm | |||||||
|---|---|---|---|---|---|---|---|---|---|---|---|---|---|---|
| Finance leases | ||||||||||||||
Vodacom (Proprietary) Limited | 22.5 | 37.7 | 58.1 | 83.0 | 149.6 | 245.5 | 596.4 | |||||||
| Vodacom Service Provider Company (Proprietary) Limited | 6.5 | 12.9 | 20.9 | 30.6 | 42.6 | 175.8 | 289.3 | |||||||
Funding loans | ||||||||||||||
Planetel Communications Limited | — | — | — | — | — | 35.4 | 35.4 | |||||||
| Caspian Construction Company Limited | — | — | — | — | — | 42.1 | 42.1 | |||||||
| Project finance funding to Vodacom Tanzania Limited | 66.3 | 85.2 | 110.4 | 86.8 | — | — | 348.7 | |||||||
| Extended credit facility to Vodacom Congo (RDC) s.p.r.l. | 310.1 | — | — | — | — | — | 310.1 | |||||||
| Revolving credit facilities to Vodacom Congo (RDC) s.p.r.l. | 312.2 | — | — | — | — | — | 312.2 | |||||||
| Preference shares issued by Vodacom Congo (RDC) s.p.r.l. | 119.1 | — | — | — | — | — | 119.1 | |||||||
| Other short-term loans | 3.2 | — | — | — | — | — | 3.2 | |||||||
| 839.9 | 135.8 | 189.4 | 200.4 | 192.2 | 498.8 | 2,056.5 | ||||||||
- *
- The Group restated its interest bearing debt for the 2003 and 2002 financial years. Refer to Note 41 for full details of restatement disclosure.
F-144
20. ACCOUNTS PAYABLE
| | 2002 Rm | 2003 Rm | 2004 Rm | |||
|---|---|---|---|---|---|---|
| Trade creditors | 2,030.0 | 2,129.5 | 2,900.9 | |||
| Revenue charged in advance | 610.4 | 920.5 | 1,492.2 | |||
| Capital expenditure creditors | 457.8 | 707.9 | 774.4 | |||
| Value added taxation | 16.3 | — | 101.6 | |||
| Interest accrual | 5.7 | — | 14.2 | |||
| Sundry accounts payable and accruals | 103.4 | 41.1 | 43.0 | |||
| 3,223.6 | 3,799.0 | 5,326.3 | ||||
21. SHAREHOLDER LOANS
| | 2002 Rm | 2003 Rm | 2004 Rm | |||
|---|---|---|---|---|---|---|
| Telkom SA Limited | 460.0 | 460.0 | — | |||
| Vodafone Group Plc | 124.3 | 124.3 | — | |||
| Vodafone Holdings (SA) (Proprietary) Limited | 165.5 | 197.7 | — | |||
| VenFin Finance Corporation (Proprietary) Limited | 124.2 | 138.0 | — | |||
| Descarte Investments No. 8 (Proprietary) Limited | 46.0 | — | — | |||
| 920.0 | 920.0 | — | ||||
The shareholder loans were uncollateralized and bore interest at a rate of prime plus 2%. The average annualized effective interest rate during the financial year was 19.0% (2003: 18.35%; 2002: 15.69%). The loans were repayable on demand of all the shareholders by no later than March 31, 2019. The shareholders have deferred their right to claim or accept payment of the amounts owing to them in favor of all other creditors in the event of the liquidation of the Group or should similar events occur. The shareholders elected for the loans to be repaid on June 30, 2003.
22. NON-INTEREST BEARING DEBT
| | 2002 Rm | 2003 Rm | 2004 Rm | ||||
|---|---|---|---|---|---|---|---|
| Vodacom Lesotho (Proprietary) Limited | 4.3 | 4.3 | 4.3 | ||||
| The minority shareholder's loan is uncollateralized and no repayment terms have been determined. | |||||||
| 4.3 | 4.3 | 4.3 | |||||
The fair value of the Group's non-interest bearing debt liabilities could not be readily determined.
F-145
23. PROVISIONS
| | 2002 Rm | 2003 Rm | 2004 Rm | |||
|---|---|---|---|---|---|---|
| Deferred bonus incentive provision (Note 23.1) | 311.4 | 231.7 | 359.5 | |||
| Bonus provision (Note 23.2) | 95.8 | 128.8 | 149.1 | |||
| Leave pay provision (Note 23.3) | 44.6 | 52.4 | 53.9 | |||
| Warranty provision (Note 23.4) | 1.8 | 9.5 | 34.3 | |||
| Other (Note 23.5) | 32.0 | 58.3 | 55.3 | |||
| 485.6 | 480.7 | 652.1 | ||||
| Reconciliation | Deferred bonus incentive provision Rm | Bonus provision Rm | Leave pay provision Rm | Warranty provision Rm | Other Rm | |||||||
|---|---|---|---|---|---|---|---|---|---|---|---|---|
| 2002 | ||||||||||||
| Balance at the beginning of the year | 214.4 | 66.0 | 33.6 | — | 36.4 | |||||||
| Provision created | 161.8 | 112.0 | 19.5 | 39.8 | 76.1 | |||||||
| Provision utilized | (64.8 | ) | (82.2 | ) | (8.5 | ) | (38.0 | ) | (80.5 | ) | ||
| Balance at the end of the year | 311.4 | 95.8 | 44.6 | 1.8 | 32.0 | |||||||
| Reconciliation | Deferred bonus incentive provision Rm | Bonus provision Rm | Leave pay provision Rm | Warranty provision Rm | Other Rm | |||||||
|---|---|---|---|---|---|---|---|---|---|---|---|---|
| 2003 | ||||||||||||
| Balance at the beginning of the year | 311.4 | 95.8 | 44.6 | 1.8 | 32.0 | |||||||
| Provision created | 16.7 | 141.1 | 13.4 | 9.2 | 43.3 | |||||||
| Provision utilized | (96.4 | ) | (108.1 | ) | (5.6 | ) | (1.5 | ) | (17.0 | ) | ||
| Balance at the end of the year | 231.7 | 128.8 | 52.4 | 9.5 | 58.3 | |||||||
| Reconciliation | Deferred bonus incentive provision Rm | Bonus provision Rm | Leave pay provision Rm | Warranty provision Rm | Other Rm | |||||||
|---|---|---|---|---|---|---|---|---|---|---|---|---|
| 2004 | ||||||||||||
| Balance at the beginning of the year | 231.7 | 128.8 | 52.4 | 9.5 | 58.3 | |||||||
| Provision created | 169.5 | 165.7 | 10.1 | 28.9 | 67.5 | |||||||
| Provision utilized | (41.7 | ) | (145.4 | ) | (8.6 | ) | (4.1 | ) | (70.5 | ) | ||
| Balance at the end of the year | 359.5 | 149.1 | 53.9 | 34.3 | 55.3 | |||||||
| | 2002 Rm | 2003 Rm | 2004 Rm | |||
|---|---|---|---|---|---|---|
| Timing of Provisions | ||||||
| Within one year | 297.6 | 324.4 | 473.7 | |||
| After one year | 188.0 | 156.3 | 178.4 | |||
| 485.6 | 480.7 | 652.1 | ||||
F-146
23.1 Deferred Bonus Incentive Provision
The deferred bonus incentive provision represents the present value of the expected future cash out flows of the entitlement value at the balance sheet date less the value at which the entitlements were issued, multiplied by the number of entitlements allocated to a participant.
The value of the bonus entitlements are determined based upon the audited consolidated financial statements of the Group. Periodically, a number of entitlements are issued to employees, the value of which depends on the seniority of the employee. The participating rights of employees vest at different stages and employees are entitled to cash in their entitlements within one year after the participating rights have vested. The provision is utilized when eligible employees receive the value of vested entitlements.
23.2 Bonus Provision
The bonus provision consists of a performance bonus based on profit achievement. The performance bonus is payable in May each year to members of management and is payable bi-annually in December and May to staff members. The maximum bonus payable is determined by applying a specific formula based upon the Group achieving a pre-determined profit and the employee's achievement of specified performance targets. Management and staff must be in service on May 31, to qualify for the bonus.
23.3 Leave Pay Provision
The leave pay provision relates to vested leave pay to which employees may become entitled upon leaving the employment of the Group. The provision arises as employees render a service that increases their entitlement to future compensated leave. The provision is utilized when employees who are entitled to leave pay, leave the employment of the Group or when the accrued leave due to an employee, is utilized.
23.4 Warranty Provision
The warranty provision covers manufacturing defects in the second year of warranty on handsets sold to customers.
23.5 Other
Other provisions for the Group include provisions for losses as a result of onerous contracts, advertising co-operation provision funds received from suppliers of handsets and various other smaller provisions.
The provision for onerous contracts represents the Group's liability in respect of onerous lease contracts related to certain buildings. The provision is discounted for the respective periods of the lease contracts.
The advertising co-operation provision is based on a percentage of the purchase price of handsets purchased by Vodacom Service Provider Company (Proprietary) Limited from the various handset manufacturers. This provision is realised when the company provides evidence to the handset manufacturer that the company has incurred advertising expenditure in accordance with the manufacturers' co-operation rules. The external service providers can claim future advertising expenditure incurred by them per manufacturer from this provision, based on their purchases from the company. The provision represents the advertising expenditure not yet spent by the company or external service providers.
F-147
24. CHANGE IN ACCOUNTING POLICY
The Group changed its accounting policy for foreign exchange contracts and other financial instruments due to the adoption of International Accounting Standard 39—Financial Instruments: Recognition and Measurement during the year ended March 31, 2002. Under IAS 39, the Group does not qualify to apply hedge accounting to foreign exchange contracts and therefore all fair value adjustments are recognized in the income statement in the period in which they occur.
Interest rate swaps are also recorded and measured at fair value. All changes in fair value are recognized in the income statement in the period in which they occur.
These changes have had the effect of increasing net profit for the 2002 year and retained profit at the beginning of the 2002 year, and have been applied prospectively from April 1, 2001:
| | 2002 Net Profit Rm | 2002 Opening Retained Earnings Rm | |||
|---|---|---|---|---|---|
| Gross effect | 352.3 | 121.4 | |||
Foreign exchange contracts | 347.4 | 104.2 | |||
| Interest rate swaps | 4.9 | 17.2 | |||
Taxation effect | (105.7 | ) | (36.5 | ) | |
Foreign exchange contracts | (104.2 | ) | (31.3 | ) | |
| Interest rate swaps | (1.5 | ) | (5.2 | ) | |
| 246.6 | 84.9 | ||||
F-148
25. CASH GENERATED FROM OPERATIONS
| | 2002 Rm | 2003 Rm | 2004 Rm | ||||
|---|---|---|---|---|---|---|---|
| Reconciliation of profit from operations to cash generated from operations: | |||||||
Profit from operations | 3,621.1 | 4,329.9 | 5,233.9 | ||||
| Adjusted for: | |||||||
Depreciation of property, plant and equipment | 1,857.3 | 2,163.0 | 2,312.7 | ||||
| Depreciation of investment properties | — | — | 4.2 | ||||
| Net loss / (profit) on disposal of property, plant and equipment | (3.4 | ) | (2.6 | ) | 6.8 | ||
| Revaluation of equity investment | 8.9 | — | — | ||||
| Recoupment of Gateway asset accrual | (15.0 | ) | — | — | |||
| Bad debts written off | 111.2 | 31.1 | 48.8 | ||||
| Capital profit on disposal of subsidiaries | (16.3 | ) | — | — | |||
| Write-off of investment in GSM companies | 0.3 | — | — | ||||
| Impairment of assets | (1.0 | ) | — | — | |||
| Amortization of intangible assets | 212.7 | 210.7 | 216.0 | ||||
| Cash flow from operations before working capital changes | 5,775.8 | 6,732.1 | 7,822.4 | ||||
Increase in accounts receivable | (264.5 | ) | (241.9 | ) | (704.6 | ) | |
| (Increase) / Decrease in inventory | 93.3 | 52.0 | (32.2 | ) | |||
| Increase in accounts payable and provisions | 583.5 | 178.9 | 511.1 | ||||
| Cash generated from operations | 6,188.1 | 6,721.1 | 7,596.7 | ||||
F-149
26. FINANCE COSTS PAID
| | 2002 Rm | 2003 Rm | 2004 Rm | ||||
|---|---|---|---|---|---|---|---|
| Bank overdraft | (86.1 | ) | (50.0 | ) | (27.3 | ) | |
| Finance leases | (98.9 | ) | (123.8 | ) | (130.1 | ) | |
| Funding loans | (87.2 | ) | (127.3 | ) | (64.4 | ) | |
| Interest on minority shareholder loan | — | (9.7 | ) | (7.6 | ) | ||
| Leasehold property | — | — | (5.2 | ) | |||
| Other finance costs | — | (6.8 | ) | (13.3 | ) | ||
| Shareholder loans | (144.2 | ) | (167.9 | ) | (47.2 | ) | |
| Interest accrual at the beginning of the year | (28.9 | ) | (5.7 | ) | — | ||
| Interest accrual at the end of the year | 5.7 | — | 14.2 | ||||
| (439.6 | ) | (491.2 | ) | (280.9 | ) | ||
| Foreign exchange losses | (5.0 | ) | (62.2 | ) | (29.7 | ) | |
| Interest rate swap interest | — | (4.0 | ) | (1.1 | ) | ||
| Interest rate swap revaluation | — | — | (18.9 | ) | |||
| Loss on foreign exchange contract revaluation | (199.0 | ) | (831.2 | ) | (479.1 | ) | |
| Loss on foreign liability and asset revaluation | (247.8 | ) | (163.4 | ) | (283.6 | ) | |
| Unrealized losses on foreign exchange contract revaluation | — | 808.8 | 393.2 | ||||
| Unrealized losses on foreign liability and asset revaluation | — | 11.8 | 155.9 | ||||
| Unrealized losses on interest rate swap | 2.2 | — | 18.9 | ||||
| Other non-cash flow items | — | 9.7 | 13.0 | ||||
| (889.2 | ) | (721.7 | ) | (512.3 | ) | ||
27. INTEREST, DIVIDENDS AND OTHER FINANCIAL INCOME RECEIVED
| Banks and loans | 23.8 | 51.4 | 68.4 | ||||
| Dividends received—unlisted investments | 4.3 | — | 5.4 | ||||
| Gain on remeasurement of minority shareholder loan | — | 92.8 | — | ||||
| Guarantee fees | — | 14.7 | 26.4 | ||||
| Investment income—held for trading investments | 3.9 | 5.1 | 11.2 | ||||
| Other interest income | 4.9 | 1.4 | 6.2 | ||||
| Interest accrual at the beginning of the year | — | — | 10.3 | ||||
| Interest accrual at the end of the year | — | (10.3 | ) | (18.9 | ) | ||
| Guarantee fees accrual at the beginning of the year | — | — | 14.7 | ||||
| Guarantee fees accrual at the end of the year | — | (14.7 | ) | (13.1 | ) | ||
| 36.9 | 140.4 | 110.6 | |||||
| Foreign exchange gains | 2.5 | 6.7 | 0.5 | ||||
| Gain on foreign exchange contract revaluation | 778.4 | 244.7 | 269.6 | ||||
| Gain on foreign liability and asset revaluation | 18.3 | 301.4 | 237.5 | ||||
| Interest rate swap interest | — | 6.0 | 5.1 | ||||
| Interest rate swap revaluation | 4.3 | 18.2 | 26.3 | ||||
| Unrealized gain on foreign exchange contract revaluation | (220.4 | ) | (213.4 | ) | (210.3 | ) | |
| Unrealized gain on foreign liability and asset revaluation | (41.0 | ) | (113.0 | ) | (38.9 | ) | |
| Unrealized gain on interest rate swap revaluation | — | (18.2 | ) | (26.3 | ) | ||
| Other non-cash flow items | (37.4 | ) | (92.8 | ) | (5.4 | ) | |
| 541.6 | 280.0 | 368.7 | |||||
F-150
28. TAXATION PAID
| | 2002 Rm | 2003 Rm | 2004 Rm | ||||
|---|---|---|---|---|---|---|---|
| Taxation per the income statement | (1,190.7 | ) | (1,198.9 | ) | (1,725.0 | ) | |
| Taxation payable at the beginning of the year | (810.0 | ) | (351.6 | ) | (315.2 | ) | |
| Taxation payable at the end of the year | 351.6 | 315.2 | 852.0 | ||||
| Deferred taxation at the beginning of the year | (268.4 | ) | (428.5 | ) | (288.4 | ) | |
| Deferred taxation at the end of the year | 428.5 | 288.4 | 158.2 | ||||
| Business combination—deferred taxation | (0.9 | ) | — | (118.8 | ) | ||
| Business combination—taxation payable | — | — | (29.6 | ) | |||
| Movement due to IAS 39 adjustment | (36.5 | ) | — | — | |||
| Movement due to foreign equity revaluation reserve | (19.9 | ) | 21.0 | 10.9 | |||
| Exchange difference on consolidation of foreign subsidiary | 7.2 | 17.0 | (7.4 | ) | |||
| (1,539.1 | ) | (1,337.4 | ) | (1,463.3 | ) | ||
29. ADDITIONS TO PROPERTY, PLANT AND EQUIPMENT
| | | 2002 Rm | 2003 Rm | 2004 Rm | |||||
|---|---|---|---|---|---|---|---|---|---|
| Additions to property, plant and equipment (Note 9) | (4,085.3 | ) | (3,399.3 | ) | (2,890.7 | ) | |||
| Less: | Vodacom (Proprietary) Limited finance leases | — | 81.1 | 10.4 | |||||
| Vodacom Service Provider Company (Proprietary) Limited finance leases | 282.2 | — | — | ||||||
| Vodacom Properties No.1 (Proprietary) Limited finance leases | — | 1.6 | — | ||||||
| Increase / (decrease) in capital expenditure related creditors | (606.0 | ) | 250.1 | 66.5 | |||||
| (4,409.1 | ) | (3,066.5 | ) | (2,813.8 | ) | ||||
30. ADDITIONS TO INVESTMENT PROPERTIES
| | 2002 Rm | 2003 Rm | 2004 Rm | ||||
|---|---|---|---|---|---|---|---|
| Additions to investment properties (Note 10) | — | — | 68.0 | ||||
| Less: Transfer from property, plant and equipment | — | — | (58.1 | ) | |||
| Less: Business combination (Note 31.2 c) | — | — | (9.9 | ) | |||
| — | — | — | |||||
F-151
31. DISPOSAL / (ACQUISITION) OF SUBSIDIARIES
| | 2002 Rm | 2003 Rm | 2004 Rm | |||
|---|---|---|---|---|---|---|
| Disposals of Subsidiaries | �� | |||||
Vodacom Sport & Entertainment (Proprietary) Limited (Note 31.1 a) | 17.9 | 22.5 | — | |||
| Film Fun (Holdings) (Proprietary) Limited (Note 31.1 b) | (16.2 | ) | 9.0 | — | ||
| 1.7 | 31.5 | — | ||||
Acquisition of Subsidiaries | ||||||
Vodacom Properties No.1 (Proprietary) Limited (Note 31.2 a) | — | — | — | |||
| Vodacom International Holdings (Proprietary) Limited and Vodacom International Limited (Note 31.2 b) | (0.1 | ) | — | — | ||
| Smartphone SP (Proprietary) Limited (Note 31.2 c) | — | — | 149.6 | |||
| VM, S.A.R.L. trading as Vodacom Mozambique (Note 31.2.d) | — | — | — | |||
| (0.1 | ) | — | 149.6 | |||
F-152
31.1 Subsidiaries Disposed
a) Vodacom Sport & Entertainment (Proprietary) Limited
On February 27, 2002, the Group disposed of its 51% interest in Vodacom Sport & Entertainment (Proprietary) Limited. The fair value of the assets and liabilities disposed were as follows:
| | 2002 Rm | 2003 Rm | 2004 Rm | ||||
|---|---|---|---|---|---|---|---|
| Carrying amount of net assets disposed of | 9.8 | — | — | ||||
Property, plant and equipment | 1.3 | — | — | ||||
| Investments | 2.7 | — | — | ||||
| Inventory | 0.5 | — | — | ||||
| Accounts receivable | 228.6 | — | — | ||||
| Deferred taxation | 1.6 | — | — | ||||
| Cash and cash equivalents | 4.6 | — | — | ||||
| Accounts payable | (227.9 | ) | — | — | |||
| Taxation payable | (0.4 | ) | — | — | |||
| VAT payable | (1.2 | ) | — | — | |||
Minority interest | (4.8 | ) | — | — | |||
| Capital gain on disposal | 40.0 | — | — | ||||
| Selling price | 45.0 | — | — | ||||
| Cash and cash equivalents | (4.6 | ) | — | — | |||
| Cash consideration | 40.4 | — | — | ||||
| Less: Amount receivable | (22.5 | ) | — | — | |||
| 17.9 | — | — | |||||
Selling price satisfied by: | 45.0 | 22.5 | — | ||||
Cash | 22.5 | 22.5 | — | ||||
| The consideration was deferred during 2002 for settlement in two equal installments on August 31, 2002 and August 31, 2003. (Notes 12 and 15). | 22.5 | — | — | ||||
The total amount of R25.7 million, which includes accrued interest, was received during the 2003 financial year.
F-153
b) Film Fun (Holdings) (Proprietary) Limited
On March 31, 2002, the Group disposed of its interest in Film Fun (Holdings) (Proprietary) Limited, Africell Cellular Services (Proprietary) Limited and Teljoy (Botswana) (Proprietary) Limited. The fair value of the assets and liabilities disposed were as follows:
| | 2002 Rm | 2003 Rm | 2004 Rm | ||||
|---|---|---|---|---|---|---|---|
| Carrying amount of net assets disposed of | 62.8 | — | — | ||||
Property, plant and equipment | 64.7 | — | — | ||||
| Loan—Teljoy Holdings Limited | 28.0 | — | — | ||||
| Goodwill | 15.9 | — | — | ||||
| Cash and cash equivalents | 16.2 | — | — | ||||
| Accounts receivable | 7.2 | — | — | ||||
| Inventory | 5.3 | — | — | ||||
| Shareholding in subsidiaries | 4.2 | — | — | ||||
| Investments | 3.3 | — | — | ||||
| Taxation receivable | 1.1 | — | — | ||||
| Accounts payable | (64.2 | ) | — | — | |||
| Provision for licenses | (25.0 | ) | — | — | |||
| Deferred taxation | (2.7 | ) | — | — | |||
| Non-distributable reserve | (0.2 | ) | — | — | |||
| Trademark | 9.0 | — | — | ||||
Capital loss on disposal | (53.8 | ) | — | — | |||
| Selling price | 9.0 | — | — | ||||
| Cash and cash equivalents | (16.2 | ) | — | — | |||
| Cash consideration | (7.2 | ) | — | — | |||
| Less: Amount receivable | (9.0 | ) | — | — | |||
| (16.2 | ) | — | — | ||||
Selling price satisfied by: | 9.0 | 9.0 | — | ||||
Cash | — | 9.0 | — | ||||
| Deferred consideration | 9.0 | — | — | ||||
The deferred consideration was received in cash from the new owners on May 15, 2002.
31.2 Subsidiaries Acquired
a) Vodacom Properties No.1 (Proprietary) Limited
During the 2003 financial year the Group exercised its option included in the finance lease agreement and acquired 100% of Skyprops 157 (Proprietary) Limited. The name of the company was subsequently changed to Vodacom Properties No. 1 (Proprietary) Limited.
F-154
The fair value of the net assets acquired are as follows:
| | 2002 Rm | 2003 Rm | 2004 Rm | |||
|---|---|---|---|---|---|---|
| — | — | — | ||||
| Property, plant and equipment | — | 1.6 | — | |||
| Long—term loan | — | (1.6 | ) | — | ||
| Purchase price | — | — | — | |||
b) Vodacom International Holdings (Proprietary)
Limited and Vodacom International Limited
Both companies became operational from April 1, 2001. Vodacom Group (Proprietary) Limited holds 100% of the issued share capital of Vodacom International Holdings (Proprietary) Limited, who in turn holds 100% of the issued share capital of Vodacom International Limited, a company based in Mauritius. The fair value of the share capital acquired is as follows:
| | 2002 Rm | 2003 Rm | 2004 Rm | |||
|---|---|---|---|---|---|---|
| Share capital | (0.1 | ) | — | — | ||
c) Smartphone SP (Proprietary) Limited
On March 1, 2004, the Group acquired a 51% interest in the equity of Smartphone SP (Proprietary) Limited, which has a 100% shareholding in Stand 13 Eastwood Road Dunkeld (Proprietary) Limited and 52% in Ithuba Smartcall (Proprietary) Limited. The fair value of the assets and liabilities acquired were preliminary determined by the Group and are as follows:
F-155
| | 2002 Rm | 2003 Rm | 2004 Rm | |||||
|---|---|---|---|---|---|---|---|---|
| Fair value of net assets acquired | — | — | (9.8 | ) | ||||
Property, plant and equipment | — | — | 6.2 | |||||
| Investment properties | — | — | 9.9 | |||||
| Pre-paid customer base | — | — | 230.4 | |||||
| Trademark | — | — | 158.2 | |||||
| Investments | — | — | 16.4 | |||||
| Deferred taxation asset | — | — | 0.2 | |||||
| Inventory | — | — | 31.0 | |||||
| Accounts receivable | — | — | 115.8 | |||||
| Cash and cash equivalents | — | — | 149.6 | |||||
| Non-current loan | — | — | (0.3 | ) | ||||
| Deferred taxation liability (including tax effect on intangibles) | — | — | (119.0 | ) | ||||
| Accounts payable | — | — | (558.8 | ) | ||||
| Taxation payable | — | — | (29.6 | ) | ||||
| Provision | — | — | (0.2 | ) | ||||
Goodwill | — | — | (224.0 | ) | ||||
| Purchase price (including capitalized costs) | — | — | (233.8 | ) | ||||
| Cash and cash equivalents | — | — | 149.6 | |||||
| Cash consideration | — | — | (84.2 | ) | ||||
| Less: Amount payable | — | — | 233.8 | |||||
| — | — | 149.6 | ||||||
The purchase price of R231.2 million was paid on April 7, 2004. The outstanding amount accrued interest at prime less 2% per annum from March 1, 2004 up to the date of payment.
The company has a contingent asset of R70.1 million. Should this contingent asset realize in the following year, an adjustment will be made to the purchase price.
No minority interest exists on acquisition as a result of the negative net equity position of the company.
d) VM, S.A.R.L. trading as Vodacom Mozambique
During the 2004 financial year VM, S.A.R.L. trading as Vodacom Mozambique, commenced operations. This had no initial effect on the Group's cash flows.
32. DISPOSAL / (ACQUISITION) OF JOINT VENTURES
| | 2002 Rm | 2003 Rm | 2004 Rm | |||
|---|---|---|---|---|---|---|
| Disposal of Joint Ventures | ||||||
Vodacom World Online (Proprietary) Limited (Note 32.1 a) | 23.3 | — | — | |||
Acquisition of Joint Ventures | ||||||
Vodacom Congo (RDC) s.p.r.l | — | — | — | |||
F-156
During the 2002 financial year Vodacom Congo (RDC) s.p.r.l was formed and financed by the Group and accordingly it had no effect on the Group's cash flow.
32.1 Joint Ventures Disposed
a) Vodacom World Online (Proprietary) Limited
On November 30, 2001, the Group disposed of its 40% joint venture shareholding in Vodacom World Online (Proprietary) Limited. The fair value of the assets and liabilities disposed were as follows:
| | 2002 Rm | 2003 Rm | 2004 Rm | ||||
|---|---|---|---|---|---|---|---|
| Carrying amount of net assets disposed | 1.7 | — | — | ||||
Property, plant and equipment | 6.7 | — | — | ||||
| Inventory | 0.6 | — | — | ||||
| Accounts receivable | 6.6 | — | — | ||||
| Taxation payable | (0.1 | ) | — | — | |||
| Cash and cash equivalents | 8.5 | — | — | ||||
| Accounts payable | (20.6 | ) | — | — | |||
Capital gain on disposal | 30.1 | — | — | ||||
| Selling price | 31.8 | — | — | ||||
| Cash and cash equivalents | (8.5 | ) | — | — | |||
| Cash consideration | 23.3 | — | — | ||||
33. CASH AND CASH EQUIVALENTS AT END OF YEAR
| | 2002 Rm | 2003 Rm | 2004 Rm | ||||
|---|---|---|---|---|---|---|---|
| Bank and cash balances | 719.2 | 1,206.5 | 2,370.1 | ||||
| Bank overdraft | (1,576.8 | ) | (559.0 | ) | (772.4 | ) | |
| (857.6 | ) | 647.5 | 1,597.7 | ||||
F-157
34. EARNINGS AND DIVIDEND PER SHARE
34.1 Basic and diluted earnings per share
| | 2002 R | 2003 R | 2004 R | |||
|---|---|---|---|---|---|---|
| The calculation of basic earnings per ordinary share is based on earnings of R3,031.8 million (2003: R2,214.6 million; 2002: R2,373.0 million) and 10,000 issued ordinary shares (2003: 10,000; 2002: 10,000). | 237,300 | 221,460 | 303,180 |
Due to no dilution factors being present, basic earnings per share equals diluted earnings per share.
34.2 Dividend per share
The calculation of the dividend per ordinary share is based on a declared ordinary dividend of R2,100.0 million (2003: R600.0 million; 2002: R600 million) and 10,000 issued ordinary shares (2003: 10,000; 2002: 10,000). The dividends were declared as follows:
| | 2002 R | 2003 R | 2004 R | |||
|---|---|---|---|---|---|---|
| Declared March 11, 2004 to shareholders registered on May 28, 2004 and payable on May 31, 2004 (Final) | — | — | 150,000 | |||
| Declared and paid on September 30, 2003 (Interim) | — | — | 60,000 | |||
| Declared March 20, 2003 to shareholders registered on June 28, 2003 and paid on June 30, 2003 (Final) | — | 60,000 | — | |||
| Declared March 21, 2002 and paid on June 28, 2002 (Final) | 60,000 | — | — | |||
| 60,000 | 60,000 | 210,000 | ||||
F-158
35. CAPITAL COMMITMENTS
| | 2002 Rm | 2003 Rm | 2004 Rm | ||||
|---|---|---|---|---|---|---|---|
| Commitments for orders in respect of existing contracts: | |||||||
| Vodacom (Proprietary) Limited | 1,005.2 | 517.8 | 448.4 | ||||
| Vodacom Congo (RDC) s.p.r.l. | 303.7 | 62.0 | 42.5 | ||||
| Vodacom Tanzania Limited | 78.9 | 70.4 | 169.8 | ||||
| Vodacom Service Provider Company (Proprietary) Limited | 59.9 | 10.6 | 39.7 | ||||
| Vodacom International Holdings (Proprietary) Limited | 2.2 | — | — | ||||
| Vodacom Group (Proprietary) Limited | 0.3 | 0.3 | 0.2 | ||||
| Vodacom Lesotho (Proprietary) Limited | — | 0.6 | — | ||||
| 1,450.2 | 661.7 | 700.6 | |||||
| Commitments not yet contracted for: | |||||||
| Vodacom (Proprietary) Limited | 1,754.9 | 2,572.5 | 3,875.7 | ||||
| Vodacom Tanzania Limited | 518.6 | 418.3 | 118.8 | ||||
| Vodacom Congo (RDC) s.p.r.l. | 461.7 | 189.8 | 102.7 | ||||
| Vodacom Service Provider Company (Proprietary) Limited | 4.1 | 125.4 | 71.1 | ||||
| Vodacom International Holdings (Proprietary) Limited | 0.1 | 5.3 | — | ||||
| Vodacom Lesotho (Proprietary) Limited | 95.0 | 14.2 | 12.2 | ||||
| Vodacom Group (Proprietary) Limited | 4.6 | 5.0 | 9.2 | ||||
| Vodacom International Limited (Mauritius) | 1.1 | 0.8 | — | ||||
| VM, S.A.R.L. | — | — | 277.8 | ||||
| Smartphone SP (Proprietary) Limited | — | — | 0.1 | ||||
| 2,840.1 | 3,331.3 | 4,467.6 | |||||
The capital expenditure of the Group will be financed through internal cash generation, extended supplier credit and bank credit.
Capital commitments were restated for the year ending March 31, 2003 and 2002 to include capital expenditure approved by the Board of Directors of Vodacom Group (Proprietary) Limited for the next financial year.
36. OTHER COMMITMENTS
| | 2002 Rm | 2003 Rm | 2004 Rm | |||
|---|---|---|---|---|---|---|
| Operating leases (Note 36.1) | 2,313.7 | 3,046.5 | 3,180.0 | |||
| Sport and marketing contracts (Note 36.2) | 321.1 | 457.0 | 727.4 | |||
| 2,634.8 | 3,503.5 | 3,907.4 | ||||
F-159
| | Within one year Rm | Between two and five years Rm | After five years Rm | Total Rm | |||||
|---|---|---|---|---|---|---|---|---|---|
| 36.1 Operating leases | |||||||||
| Transmission and data lines GSM | 483.9 | 1,440.0 | 451.2 | 2,375.1 | |||||
| Accommodation | 73.7 | 214.3 | 515.2 | 803.2 | |||||
| Other operating leases | 0.3 | 1.0 | 0.4 | 1.7 | |||||
| 557.9 | 1,655.3 | 966.8 | 3,180.0 | ||||||
| 36.2 Sport and marketing contracts | 297.2 | 430.2 | — | 727.4 | |||||
36.3 License fees
Network operators in the Group pay monthly license fees based on their net operational income as defined in the license agreement. Net operational income is defined as the total invoiced revenue of the licensee excluding discounts, Value Added Taxation and other direct taxes derived from customers of the licensee for the provision to them of the service, less net interconnect fees and bad debts actually incurred.
36.4 Interception of Communications and Provision of Communication-related Information Act ("the Act")
The Act was assented and published on January 22, 2003, but will only become effective at some point in future of which the date is currently uncertain. Due to the fact that certain provisions of the Act are still being finalized, a reliable estimate of capital and operating costs that will potentially be incurred in order to comply with the provisions of the Act cannot be estimated at this stage.
36.5 Service Providers
The Group has committed as part of its strategy to acquire its customer bases from certain independent service providers. Should all conditions be met, the Groups commitments in this regard are estimated at R1.6 billion.
F-160
37. CONTINGENT LIABILITIES
| | 2002 Rm | 2003 Rm | 2004 Rm | ||||
|---|---|---|---|---|---|---|---|
| Vodacom Satellite Services (Proprietary) Limited | 15.0 | 7.8 | — | ||||
The functionality of the Gateway assets is under dispute and Vodacom Satellite Services (Proprietary) Limited and Vodafone Satellite Services Limited do not recognize the liability of US$0.9 million to Globalstar LP. This amount has been written back to income in the 2002 year as the success of this claim is deemed to be remote (Note 3). Due to the duration of the claim process, the Board of directors are of the opinion that the claim will not be successful. | |||||||
Vodacom Tanzania Limited | — | 70.1 | — | ||||
Vodacom Tanzania Limited is a defendant in a court case in the high court of Tanzania in which the plaintiff, HGL Advertising Company Limited, is demanding compensation of US$8.8 million for losses and damages allegedly incurred by them as a result of an illegal breach of contract. The facts of the case show there was no contract but rather a request to tender. At the end of the 2004 financial year the Group's legal counsel is of the opinion that the Group's prospects of defending the matter has a very good chance of success. | |||||||
Various other legal matters | 5.0 | 5.5 | 9.2 | ||||
20.0 | 83.4 | 9.2 | |||||
37.1 Vodacom Congo (RDC) s.p.r.l..
The Group has a 51% equity interest in Vodacom Congo (RDC) s.p.r.l.., or Vodacom Congo, which commenced business on December 11, 2001. This investment is governed by a shareholders' agreement, which provides the other shareholder with certain protective and participating rights and therefore, in terms of IAS 31: "Accounting for interest in Joint Ventures", Vodacom Congo may not be consolidated as a subsidiary as it is considered to be a joint venture resulting in it being proportionally consolidated in the financial statements at March 31, 2004, 2003 and 2002 and for the years then ended.
The Group, in terms of the shareholders' agreement, is however ultimately responsible for the funding of the operations of Vodacom Congo. The shareholders' agreement also gives the Group the right to appoint management and the majority of the Board of the company. The Group also has a management agreement to manage the company on a day-to-day basis. Currently Vodacom Congo is incurring losses, which are expected to continue in the short-term. The 49% portion attributable to the joint venture partner of the liabilities and losses as at March 31, 2004, 2003 and 2002 were as follows:
| | 2002 Rm | 2003 Rm | 2004 Rm | ||||
|---|---|---|---|---|---|---|---|
| Net loss for the year after taxation | (24.5 | ) | (200.1 | ) | (15.1 | ) | |
| Total liabilities (including preference shares) | (459.2 | ) | (816.2 | ) | (1,133.2 | ) | |
| Total assets | 426.8 | 657.6 | 1,011.4 |
All guarantees issued are disclosed in Note 44.
Preference shares were reclassified from equity to liabilities in accordance with IAS 32: Financial Instruments: Disclosure and Presentation ("IAS 32") during the 2004 financial year. Accordingly the
F-161
net liabilities, loss before taxation and net loss of the joint venture company as previously disclosed for the 2003 and 2002 financial years were restated. Refer Notes 41 and 47.
37.2 Negative working capital ratio
For financial years ended 2004, 2003 and 2002 the Group had a negative working capital ratio. A negative working capital ratio arises when the group's current liabilities are greater than the current assets. The Group's management believes that based on its operating cash flow, it will be able to meet liabilities as they arise and that it is in compliance with all covenants contained in the borrowing agreements.
38. RETIREMENT BENEFITS
All eligible employees of the Group are members of the Vodacom Group Pension Fund, a defined contribution pension scheme. Certain executive employees of the Group are also members of the Vodacom Executive Provident Fund, a defined contribution provident scheme. Both schemes are administered by ABSA Consultants and Actuaries (Proprietary) Limited. Current contributions to the pension fund amounted to R65.9 million (2003: R52.5 million; 2002: R42.8 million). Current contributions to the provident fund amounted to R5.9 million (2003: R5.4 million; 2002: R2.3 million). South African funds are governed by the Pension Funds Act of 1956.
39. OTHER MATTERS
Effective April 1, 2004 Vodacom International Limited ("VIL") entered into a five year management agreement with VEE Networks Limited ("VEE"), (formerly Econet Wireless Nigeria Limited), subject to the right of termination in favor of each of the parties. In terms of the agreement, VIL would have managed VEE's cellular network operations in Nigeria for a fee which is based on VEE's turnover. VEE would have been allowed to use the Vodacom logo and brand name. VIL also had the intention to acquire an equity stake in the business of VEE.
However, on May 31, 2004, VIL and VEE mutually agreed to terminate the management agreement entered into on April 1, 2004. VIL will continue to provide technical support to VEE for a period of up to six months. VIL has also decided not to pursue an equity stake in the business of VEE.
The Group is further also a defendant in certain legal proceedings with Econet Wireless Limited related to its activities in Nigeria. The outcome or extent of any claims against the Group, should the Group not be successful in defending these claims, is unknown.
40. EVENTS SUBSEQUENT TO YEAR END
Smartphone SP (Proprietary) Limited offered to purchase an 85.75% equity stake in Smartcom (Proprietary) Limited for R77.2 million. All suspensive conditions contained in the sale of shares agreement were met on April 16, 2004.
The directors are not aware of any other matter or circumstance arising since the end of the financial year, not otherwise dealt with in the Vodacom Group consolidated financials, which significantly affected the financial position of the Group and results of its operations.
41. RESTATEMENT
The Group restated its balance sheet disclosure for the 2003 and 2002 financial years to reflect the reclassification of Vodacom Congo (RDC) s.p.r.l.'s preference shares from its shareholders equity to liabilities. This restatement does not impact the Group's results or cash flow information for the 2003 and 2002 years. The following table reflects the value of the different line items prior and subsequent to the restatement:
F-162
| | 2002 Previously Rm | 2002 Restated Rm | 2003 Previously Rm | 2003 Restated Rm | ||||
|---|---|---|---|---|---|---|---|---|
| Investments (Note 12) | 22.7 | 238.5 | 195.1 | 345.4 | ||||
| Short-term interest bearing debt (Note 19) | 1,015.9 | 1,231.7 | 286.1 | 436.4 |
F-163
42. RELATED PARTY TRANSACTIONS
42.1 Balances with Related Parties
| | 2002 Rm | 2003 Rm | 2004 Rm | |||||
|---|---|---|---|---|---|---|---|---|
| Included in accounts receivable: | ||||||||
Telkom SA Limited—Interconnect | 529.4 | 497.3 | 491.1 | |||||
| Telkom SA Limited—Other | 14.1 | 9.3 | 8.4 | |||||
| Vodafone Group Plc | 1.6 | 3.8 | 8.0 | |||||
Included in accounts payable: | ||||||||
Telkom SA Limited—Interconnect | (78.2 | ) | (67.8 | ) | (78.9 | ) | ||
| Telkom SA Limited—Other | (3.0 | ) | (2.0 | ) | (4.1 | ) | ||
| Vodafone Group Plc | — | (2.7 | ) | (2.6 | ) | |||
Shareholder loans (Note 21) | ||||||||
Telkom SA Limited | (460.0 | ) | (460.0 | ) | — | |||
| Vodafone Group Plc | (124.3 | ) | (124.3 | ) | — | |||
| Vodafone Holdings (SA) (Proprietary) Limited | (165.5 | ) | (197.7 | ) | — | |||
| VenFin Finance Corporation (Proprietary) Limited | (124.2 | ) | (138.0 | ) | — | |||
| Descarte Investments No. 8 (Proprietary) Limited | (46.0 | ) | — | — | ||||
Dividends payable | ||||||||
Telkom SA Limited | (300.0 | ) | (300.0 | ) | (750.0 | ) | ||
| Vodafone Holdings (SA) (Proprietary) Limited | (189.0 | ) | (210.0 | ) | (525.0 | ) | ||
| VenFin Telecommunication Investments Limited | (81.0 | ) | (90.0 | ) | (225.0 | ) | ||
| Descarte Investments No. 8 (Proprietary) Limited | (30.0 | ) | — | — | ||||
42.2 Transactions with Related Parties
| | | | | |||||
|---|---|---|---|---|---|---|---|---|
| Telkom SA Limited | 1,854.6 | 1,802.2 | 304.0 | |||||
Audit fees recovered | — | 28.5 | 6.8 | |||||
| Cellular usage | 24.1 | 32.8 | 31.1 | |||||
| Installation of transmission lines | (32.7 | ) | (36.9 | ) | (28.1 | ) | ||
| Interconnect expense | (305.7 | ) | (348.5 | ) | (417.2 | ) | ||
| Interconnect income | 2,942.5 | 2,945.2 | 2,732.8 | |||||
| Interest (paid) / received—commercial | 0.4 | (0.5 | ) | (0.1 | ) | |||
| IPO Co-operation fee | — | 50.0 | — | |||||
| Lease of transmission lines | (336.0 | ) | (445.4 | ) | (438.0 | ) | ||
| Management fees | (20.0 | ) | — | — | ||||
| Site costs | (11.3 | ) | (17.7 | ) | (18.3 | ) | ||
| Telephone landline usage | (34.6 | ) | (21.4 | ) | (30.2 | ) | ||
| Telephone software maintenance | — | — | (2.3 | ) | ||||
| VSAT rental | — | — | (0.9 | ) | ||||
| Interest payments on shareholder loan | (72.1 | ) | (83.9 | ) | (21.6 | ) | ||
| Shareholder loan repayment | — | — | (460.0 | ) | ||||
| Dividend payable | (300.0 | ) | (300.0 | ) | (750.0 | ) | ||
| Dividend paid | — | — | (300.0 | ) | ||||
F-164
Vodafone Group Plc | (25.5 | ) | (30.5 | ) | (127.7 | ) | ||
Roaming income (transacted within the Vodafone Group) | 27.4 | 38.2 | 54.9 | |||||
| Roaming expense (transacted within the Vodafone Group) | (33.4 | ) | (46.0 | ) | (50.9 | ) | ||
| Interest payments on shareholder loan | (19.5 | ) | (22.7 | ) | (7.4 | ) | ||
| Shareholder loan repayment | — | — | (124.3 | ) | ||||
Vodafone Holdings (SA) (Proprietary) Limited | (215.0 | ) | (243.3 | ) | (944.5 | ) | ||
Interest payments on shareholder loan | (26.0 | ) | (33.3 | ) | (11.8 | ) | ||
| Shareholder loan repayment | — | — | (197.7 | ) | ||||
| Dividend payable | (189.0 | ) | (210.0 | ) | (525.0 | ) | ||
| Dividend paid | — | — | (210.0 | ) | ||||
VenFin Finance Corporation (Proprietary) Limited | (56.8 | ) | (53.8 | ) | (156.2 | ) | ||
Interest payments on overdraft account | (37.3 | ) | (29.3 | ) | (11.0 | ) | ||
| Facility fees | — | (0.5 | ) | (0.7 | ) | |||
| Interest payments on shareholder loan | (19.5 | ) | (24.0 | ) | (6.5 | ) | ||
| Shareholder loan repayment | — | — | (138.0 | ) | ||||
Descarte Investments No. 8 (Proprietary) Limited | (37.2 | ) | (4.0 | ) | — | |||
Interest payments on shareholder loan | (7.2 | ) | (4.0 | ) | — | |||
| Dividend payable | (30.0 | ) | — | — | ||||
VenFin Telecommunication Investments Limited | (81.0 | ) | (90.0 | ) | (315.0 | ) | ||
Dividend payable | (81.0 | ) | (90.0 | ) | (225.0 | ) | ||
| Dividend paid | — | — | (90.0 | ) | ||||
42.3 Directors' emoluments
| | | | | |||||
|---|---|---|---|---|---|---|---|---|
| Directors' remuneration | (25.2 | ) | (21.2 | ) | (27.3 | ) | ||
Executive directors—fees as directors: salaries | (5.1 | ) | (13.4 | ) | (8.7 | ) | ||
| Executive directors—fees as directors: fringe benefits | (0.4 | ) | (0.4 | ) | (0.7 | ) | ||
| Executive directors—fees as directors: bonuses | (19.1 | ) | (6.8 | ) | (17.2 | ) | ||
| Non-executive directors—fees as directors | (0.6 | ) | (0.6 | ) | (0.7 | ) | ||
Included in directors' remuneration | (0.9 | ) | (1.5 | ) | (2.1 | ) | ||
Pension fund employer contributions | (0.4 | ) | (0.5 | ) | (0.7 | ) | ||
| Provident fund employer contributions | (0.4 | ) | (0.8 | ) | (1.2 | ) | ||
| Medical aid employer contributions | (0.1 | ) | (0.2 | ) | (0.2 | ) | ||
Directors' remuneration and emoluments paid by: | (25.2 | ) | (21.2 | ) | (27.3 | ) | ||
Vodacom Group (Proprietary) Limited | (17.4 | ) | (16.9 | ) | (21.4 | ) | ||
| Subsidiaries | (7.8 | ) | (4.3 | ) | (5.9 | ) | ||
43. FINANCIAL INSTRUMENTS AND RISK MANAGEMENT
The Group purchases or issues financial instruments in order to finance its operations and to manage the interest rate and currency risks that arise from its operations and sources of finance. Various financial assets and liabilities for example trade debtors, trade creditors, accruals, and provisions, arise directly from the Group's operations. Changing market conditions expose the Group to
F-165
various financial risks and have highlighted the importance of financial risk management as an element of control for the Group. Principal financial risks faced in the normal course of the Group's business are foreign currency risk, interest rate risk, credit risk and liquidity risk. These risks are managed within an approved Treasury Policy, subject to the limitations of the local markets in which the various group companies operate and the South African Reserve Bank.
The Group finances its operations through a mixture of retained profits, bank borrowings and long-term loans. Long-term financing is arranged locally by the South African entities. A treasury division within Vodacom Group (Proprietary) Limited has been established to provide treasury related services to the Group, including coordinating access to domestic and international financial markets, and the managing of various financial risks relating to the Group's operations. The treasury division is subject to arms length fees in terms of transfer pricing for services to offshore subsidiaries.
The Group utilizes derivative instruments, the objective of which is to reduce exposure to fluctuations in foreign currency rates and interest rates, and to manage the liquidity of cash resources within the Group. Trading in derivative instruments for speculative purposes is strictly prohibited.
Group treasury policies, risk limits, and control procedures are continuously monitored by management and the Board of directors, through the Audit Committee, the objective being to minimize exposure to foreign currency risk, interest rate risk, credit risk and liquidity risk. These risks are managed within an approved Treasury Policy.
43.1 Foreign Currency Management
The Group enters into foreign exchange contracts to buy specified amounts of various foreign currencies in the future at a predetermined exchange rate. The contracts are entered into in order to manage the Group's exposure to fluctuations in foreign currency exchange rates on specific transactions. The contracts are matched with anticipated future cash flows in foreign currencies primarily from purchases of capital equipment. The Group's policy is to enter into foreign exchange contracts for 100% of the committed net foreign currency payments from South Africa.
F-166
The Group has entered into numerous foreign exchange contracts to cover foreign capital commitments in respect of future imports of GSM infrastructure. The total value of foreign exchange contracts at year-end was:
| Forward contracts to buy foreign currency | Foreign Contract Value Mil | Forward Value Rm | Fair Value Adjustment Rm | ||||
|---|---|---|---|---|---|---|---|
| 2002 | |||||||
| United States Dollar | 102.6 | 1,099.4 | 119.0 | ||||
| Euro | 134.8 | 1,285.6 | 95.7 | ||||
| Pound Sterling | 0.2 | 2.6 | (0.1 | ) | |||
| 2,387.6 | 214.6 | ||||||
2003 | |||||||
| United States Dollar | 61.0 | 604.2 | (103.4 | ) | |||
| Euro | 111.5 | 1,078.9 | (97.2 | ) | |||
| Pound Sterling | 0.1 | 1.0 | — | ||||
| Swiss Franc | 0.6 | 3.5 | — | ||||
| 1,687.6 | (200.6 | ) | |||||
2004 | |||||||
| United States Dollar | 10.6 | 74.7 | (7.0 | ) | |||
| Euro | 91.7 | 756.2 | (41.4 | ) | |||
| Pound Sterling | 18.4 | 230.7 | (16.1 | ) | |||
| Swiss Franc | 0.1 | 0.5 | — | ||||
| 1,062.1 | (64.5 | ) | |||||
Forward value represents the foreign contract value multiplied by the contracted forward exchange rate.
| Forward contracts to sell foreign currency | Foreign Contract Value Mil | Forward Value Rm | Fair Value Adjustment Rm | ||||
|---|---|---|---|---|---|---|---|
| 2002 | |||||||
| United States Dollar | 3.6 | 42.7 | (0.7 | ) | |||
| Euro | 6.1 | 63.3 | (0.3 | ) | |||
| Pound Sterling | 0.1 | 1.0 | — | ||||
| 107.0 | (1.0 | ) | |||||
| 2003 | |||||||
| United States Dollar | 7.0 | 69.4 | 11.8 | ||||
| Euro | 20.9 | 205.5 | 22.8 | ||||
| 274.9 | 34.6 | ||||||
| 2004 | |||||||
| United States Dollar | 2.2 | 14.5 | 0.7 | ||||
| Euro | 9.0 | 70.5 | 1.2 | ||||
| Pound Sterling | 0.2 | 2.0 | — | ||||
| 87.0 | 1.9 | ||||||
F-167
Forward value represents the foreign contract value multiplied by the contracted forward exchange rate.
43.2 Interest Rate Risk Management
The Group has entered into interest rate swap contracts that entitle, or oblige it to receive interest at a fixed rate on notional principal amounts and entitle, or oblige it to pay interest at floating rates on the same notional principal amounts. The interest rate swaps allow the Group to swap long-term debt from fixed rates into floating rates that are lower, or higher, than those available if it had borrowed at floating rates directly. Under the interest rate swaps, the Group agrees with other parties to exchange, at specified quarterly intervals, the difference between fixed rate and floating rate interest amounts calculated by reference to the agreed notional principal amounts.
At March 31, 2004 the Group had three interest rate swaps:
- •
- Vodacom Group (Proprietary) Limited—the Company swapped its fixed interest rate of 14.9% NACQ (Nominal Annual Compounded Quarterly) for a floating rate, linked to the BA (Banker's Acceptance) rate plus margin of 2.00%.
- •
- Vodacom (Proprietary) Limited—the Company swapped its fixed interest rate of 20.1% NACQ (Nominal Annual Compounded Quarterly) for a floating rate linked to the BA (Banker's Acceptance) rate plus margin of 2.25%.
- •
- Vodacom (Proprietary) Limited—the Company swapped its fixed interest rate of 12.9% NACM (Nominal Annual Compounded Monthly) for a floating rate linked to the BA (Banker's Acceptance) rate plus margin of 2.00%.
| | 2002 Rm | 2003 Rm | 2004 Rm | |||
|---|---|---|---|---|---|---|
| Fair value of interest rate swap asset | 9.4 | 27.6 | 35.9 |
The fair value of the interest rate swap asset is represented by a notional principal amount of R235.0 million (2003: R238.0 million; 2002: R148.8 million) at a weighted average floating interest rate of 12.9% NACM (Nominal Annual Compounded Monthly) (2003: 15.4% NACM; 2002: between 12.1% and 12.6%).
43.3 Credit Risk Management
Financial assets, which potentially subject the Group to concentrations of credit risk, consist principally of cash, short-term deposits and trade receivables. The Group's cash and cash equivalents and short-term deposits are placed with high credit quality financial institutions. Trade receivables are presented net of an allowance for doubtful receivables. Credit risk with respect to trade receivables is limited due to the large number of customers comprising the Group's customer base and stringent credit approval processes for contracted subscribers. The Group, for its South African operations, spread their credit risk exposure amongst the high credit quality financial institutions.
F-168
The Group does not have any significant exposure to any individual customer or counter-party, except commercially to Telkom SA Limited (the Group's largest shareholder), Mobile Telecommunications Network (Proprietary) Limited, the Group's largest competitor, and Cell-C (Proprietary) Limited, the country's third network operator.
With respect to the forward exchange contracts, the Group's exposure is on the full amount of the foreign currency payable on settlement. The Group minimizes such risk by limiting the counter-parties to a group of major international banks, and does not expect to incur any losses as a result of non-performance by these counter-parties. The positions in respect of these counter-parties are closely monitored.
The carrying amounts of financial assets, excluding foreign currency derivatives and interest rate swaps, included in the consolidated balance sheet represent the Group's exposure to credit risk in relation to these assets. The credit exposure of forward exchange contracts is represented by the fair value of the contracts.
43.4 Liquidity Risk Management
The Group is exposed to liquidity risk as a result of uncertain debtor related cash flows and the capital commitments of the Group. In terms of its borrowing requirements, the Group ensures that adequate funds are available to meet its expected and unexpected financial commitments through utilization of undrawn borrowing facilities (Note 44). In terms of its long-term liquidity risk, a reasonable balance is maintained between the period over which assets generate funds and the period over which the respective assets are funded. (Note 37.2)
43.5 Fair Value of Financial Instruments
At the balance sheet date, the carrying amounts of cash and short-term deposits, accounts receivables, accounts payable and accrued expenses and short-term debt approximated their fair values due to the short-term maturities of these assets and liabilities.
The fair value of forward exchange contracts and interest rate swaps are determined using quoted prices or, where such prices are not available, a discounted cash flow analysis is used. These amounts reflect the approximate values of the derivative positions at balance sheet date.
43.6 VM, S.A.R.L. call option
In terms of the shareholders agreement, the Group's minority shareholder in VM, S.A.R.L., Empresa Moçambicana De Telecommunicaçòes S.A.R.L. ("Emotel") has a call option for a period of 4 years following the commencement date, August 23, 2003. In terms of the option, Emotel shall be entitled to call on Vodacom International Limited such numbers of shares in and claims on loan account against VM, S.A.R.L. as constitute 25% of the entire issued share capital of that company. Emotel can exercise this option in full increments of 1%. The option can only be exercised on the 1st of April or the 1st of October of each calendar year for the duration of the option. The option price is specified in the shareholders agreement. The call option has no value at March 31, 2004.
43.7 Smartphone SP (Proprietary) Limited put option
In terms of the shareholders agreement, the minority shareholders of Smartphone SP (Proprietary) Limited has a put option against Vodacom Group (Proprietary) Limited, should the Group or the company terminate or fail to renew the Service Provider Agreement for any reason other than the expiry or cancellation of the Group's South African license. The put option has no value at March 31, 2004.
F-169
44. UNDRAWN BORROWING FACILITIES AND GUARANTEES
44.1 Rand denominated facilities and guarantees
The Group has a Rand denominated credit facility totaling R3,949.0 million with R411.0 million utilized at March 31, 2004. The facilities are uncommitted and can also be utilized for foreign loans and are subject to review at various dates (usually on an annual basis).
| Guarantor | Details | Beneficiary | 2002 Rm | 2003 Rm | 2004 Rm | |||||
|---|---|---|---|---|---|---|---|---|---|---|
| Vodacom (Proprietary) Limited | All guarantees less than R2.0 million. | Various | 2.9 | 3.1 | 3.0 | |||||
Vodacom Service Provider Company (Proprietary) Limited | All guarantees less than R2.0 million. | Various | 1.4 | 1.6 | 3.1 | |||||
Vodacom Service Provider Company (Proprietary) Limited | Guarantee in respect of receipt by independent intermediaries of premiums on behalf of short-term insurers and Lloyd's underwriters, and relating to short-term insurance business carried on in South Africa. Terminates on May 31, 2004. | SA Insurance Association for benefit of insurers | — | 9.5 | 14.2 | |||||
| 4.3 | 14.2 | 20.3 | ||||||||
Vodacom (Proprietary) Limited provides an unlimited guarantee for borrowings entered into by Vodacom Group (Proprietary) Limited.
44.2 Foreign denominated facilities and guarantees
The following foreign denominated facilities are in place:
| Company | Details | As at March 31, 2004 Million Total facility | As at March 31, 2004 Million Utilized | |||||
|---|---|---|---|---|---|---|---|---|
| Vodacom Tanzania Limited | Project finance | US$ | 55.2 | US$ | 55.2 | |||
Vodacom Congo (RDC) s.p.r.l. | Bridging facilities | € | 78.7 | € | 78.7 | |||
Vodacom Congo (RDC) s.p.r.l. | Revolving credit facility—ABSA | US$ | 32.0 | US$ | 32.0 | |||
Vodacom Congo (RDC) s.p.r.l. | Revolving credit facility—Standard Finance (Isle of Man) | € | 22.5 | € | 22.5 | |||
Vodacom Congo (RDC) s.p.r.l. | Short-term loan—Standard Finance (Isle of Man) | US$ | 37.5 | US$ | 37.5 | |||
F-170
The following foreign denominated guarantees have been issued:
| Guarantor | Details | Beneficiary | Currency | 2002 Rm | 2003 Rm | 2004 Rm | ||||||
|---|---|---|---|---|---|---|---|---|---|---|---|---|
| Vodacom (Proprietary) Limited | Standby letters of credit * | Alcatel CIT | €25.2 million (2003: €27.0 million; 2002: €30.0 million) | 299.9 | 233.0 | 194.6 | ||||||
Vodacom Group (Proprietary) Limited | Guarantees issued for the obligations of Vodacom Congo (RDC) s.p.r.l. ** | ABSA | €53.8 million (2003: €49.8 million; 2002: €nil) | — | 429.7 | 415.6 | ||||||
Vodacom Group (Proprietary) Limited | Guarantees issued for the obligations of Vodacom Congo (RDC) s.p.r.l.'s revolving credit facility ** | ABSA | US$32.0 million (2003: US$32.0 million; 2002: US$nil) | — | 255.0 | 202.1 | ||||||
Vodacom Group (Proprietary) Limited | Guarantees issued for the obligations of Vodacom Congo (RDC) s.p.r.l. ** | Standard Finance (Isle of Man) Limited | €22.5 million (2003: €nil; 2002: €nil) | — | — | 173.8 | ||||||
Vodacom Group (Proprietary) Limited | Guarantees issued for the obligations of Vodacom Congo (RDC) s.p.r.l. ** | Standard Finance (Isle of Man) Limited | US$37.5 million (2003: US$nil million; 2002: US$nil) | — | — | 236.8 | ||||||
Vodacom International Limited | Guarantees issued for the obligations of Vodacom Congo (RDC) s.p.r.l.'s revolving credit facility. ** | Alcatel CIT | €25.0 million (2003: €nil; 2002: €nil) | — | — | 193.1 | ||||||
| 299.9 | 917.7 | 1,416.0 | ||||||||||
- *
- Amounts drawn down on the standby letters of credit amounted to R48.7 million (2003: R66.8 million; 2002: R98.4 million) and are included as liabilities in the balance sheet.
- **
- Foreign denominated guarantees amounting to R622.3 million (2003: R349.2 million; 2002: Rnil) issued in support of Vodacom Congo (RDC) s.p.r.l. are included as liabilities in the balance sheet.
F-171
The Group is primarily an integrated mobile telecommunication and data communication business located in South Africa and other African countries. The primary reporting format therefore comprises the geographic segments of the Group. This has been changed from the prior financial year where the Group considered business segments to be its primary reporting format.
| | South Africa Rm | Other African Countries Rm | Eliminations Rm | Total Rm | |||||
|---|---|---|---|---|---|---|---|---|---|
| 2002 | |||||||||
| GEOGRAPHICAL SEGMENTS | |||||||||
| Segment revenue | 15,415.4 | 740.4 | (5.1 | ) | 16,150.7 | ||||
| External | 15,410.3 | 740.4 | — | 16,150.7 | |||||
| Inter-segment | 5.1 | — | (5.1 | ) | — | ||||
| Segment profit/(loss) from operations | 3,545.7 | 81.5 | (6.1 | ) | 3,621.1 | ||||
| Interest, dividends and other financial income | 840.4 | ||||||||
| Finance costs | (868.2 | ) | |||||||
| Profit before taxation | 3,593.3 | ||||||||
| Included in Segment profit/(loss) from operations | |||||||||
| Depreciation and amortization | (1,939.2 | ) | (124.7 | ) | (6.1 | ) | (2,070.0 | ) | |
| Property, plant and equipment | (1,737.2 | ) | (120.1 | ) | — | (1,857.3 | ) | ||
| Intangible assets | (202.0 | ) | (4.6 | ) | (6.1 | ) | (212.7 | ) | |
| Bad debts written off | (111.2 | ) | — | — | (111.2 | ) | |||
| Integration costs, disposals of operations and impairments | 56.4 | — | — | 56.4 | |||||
| Capital expenditure | (3,292.0 | ) | (988.4 | ) | 1.4 | (4,279.0 | ) | ||
| Property, plant and equipment | (3,292.0 | ) | (794.7 | ) | 1.4 | (4,085.3 | ) | ||
| Intangible assets | — | (193.7 | ) | — | (193.7 | ) | |||
| Assets | |||||||||
| Segment assets | 13,179.1 | 2,003.3 | (105.7 | ) | 15,076.7 | ||||
| Deferred tax assets | 497.7 | ||||||||
| 15,574.4 | |||||||||
| Liabilities | |||||||||
| Segment liabilities | (7,152.6 | ) | (1,160.9 | ) | 91.3 | (8,222.2 | ) | ||
| Deferred taxation liabilities | (926.2 | ) | |||||||
| Taxation liabilities | (351.6 | ) | |||||||
| Dividends payable | (600.0 | ) | |||||||
| (10,100.0 | ) | ||||||||
F-172
| | South Africa Rm | Other African Countries Rm | Eliminations Rm | Total Rm | |||||
|---|---|---|---|---|---|---|---|---|---|
| 2003 | |||||||||
| GEOGRAPHICAL SEGMENTS | |||||||||
| Segment revenue | 18,636.3 | 1,236.2 | (93.8 | ) | 19,778.7 | ||||
| External | 18,543.7 | 1,235.0 | — | 19,778.7 | |||||
| Inter-segment | 92.6 | 1.2 | (93.8 | ) | — | ||||
| Segment profit/(loss) from operations | 4,340.3 | (4.3 | ) | (6.1 | ) | 4,329.9 | |||
| Interest, dividends and other financial income | 742.4 | ||||||||
| Finance costs | (1,546.3 | ) | |||||||
| Profit before taxation | 3,526.0 | ||||||||
| Included in Segment profit/(loss) from operations | |||||||||
| Depreciation and amortization | (2,131.2 | ) | (236.4 | ) | (6.1 | ) | (2,373.7 | ) | |
| Property, plant and equipment | (1,938.2 | ) | (224.8 | ) | — | (2,163.0 | ) | ||
| Intangible assets | (193.0 | ) | (11.6 | ) | (6.1 | ) | (210.7 | ) | |
| Bad debts written off | (30.1 | ) | (1.0 | ) | — | (31.1 | ) | ||
| Capital expenditure | (2,487.9 | ) | (911.4 | ) | — | (3,399.3 | ) | ||
| Property, plant and equipment | (2,487.9 | ) | (911.4 | ) | — | (3,399.3 | ) | ||
| Intangible assets | — | — | — | — | |||||
| Assets | |||||||||
| Segment assets | 14,971.0 | 2,431.7 | (1,141.5 | ) | 16,261.2 | ||||
| Deferred tax assets | 704.7 | ||||||||
| 16,965.9 | |||||||||
| Liabilities | |||||||||
| Segment liabilities | (6,676.5 | ) | (1,804.9 | ) | 349.2 | (8,132.2 | ) | ||
| Deferred taxation liabilities | (993.1 | ) | |||||||
| Taxation liabilities | (315.2 | ) | |||||||
| Dividends payable | (600.0 | ) | |||||||
| (10,040.5 | ) | ||||||||
F-173
| | South Africa Rm | Other African Countries Rm | Eliminations Rm | Total Rm | |||||
|---|---|---|---|---|---|---|---|---|---|
| 2004 | |||||||||
| GEOGRAPHICAL SEGMENTS | |||||||||
| Segment revenue | 21,992.6 | 1,496.8 | (11.4 | ) | 23,478.0 | ||||
| External | 21,981.2 | 1,496.8 | — | 23,478.0 | |||||
| Inter-segment | 11.4 | — | (11.4 | ) | — | ||||
| Segment profit/(loss) from operations | 5,306.7 | (66.7 | ) | (6.1 | ) | 5,233.9 | |||
| Interest, dividends and other financial income | 656.6 | ||||||||
| Finance costs | (1,107.5 | ) | |||||||
| Profit before taxation | 4,783.0 | ||||||||
| Included in Segment profit/(loss) from operations | |||||||||
| Depreciation and amortization | (2,259.2 | ) | (267.6 | ) | (6.1 | ) | (2,532.9 | ) | |
| Property, plant and equipment | (2,058.4 | ) | (254.3 | ) | — | (2,312.7 | ) | ||
| Investment property | (4.2 | ) | — | — | (4.2 | ) | |||
| Intangible assets | (196.6 | ) | (13.3 | ) | (6.1 | ) | (216.0 | ) | |
| Bad debts written off | (23.5 | ) | (25.3 | ) | — | (48.8 | ) | ||
| Integration costs, disposals of operations and impairments | |||||||||
| Capital expenditure | (1,666.3 | ) | (1,345.5 | ) | — | (3,011.8 | ) | ||
| Property, plant and equipment | (1,659.3 | ) | (1,231.4 | ) | — | (2,890.7 | ) | ||
| Intangible assets | (7.0 | ) | (114.1 | ) | — | (121.1 | ) | ||
| Assets | |||||||||
| Segment assets | 18,113.3 | 3,381.6 | (2,412.5 | ) | 19,082.4 | ||||
| Deferred tax assets | 1,015.3 | ||||||||
| 20,097.7 | |||||||||
| Liabilities | |||||||||
| Segment liabilities | (7,123.3 | ) | (2,427.4 | ) | 674.6 | (8,876.1 | ) | ||
| Deferred taxation liabilities | (1,173.5 | ) | |||||||
| Taxation liabilities | (852.0 | ) | |||||||
| Dividends payable | (1,500.0 | ) | |||||||
| (12,401.6 | ) | ||||||||
F-174
| | Unallocated Rm | Networks Rm | Service Provider Rm | Other Rm | Eliminations Rm | Total Rm | |||||||
|---|---|---|---|---|---|---|---|---|---|---|---|---|---|
| 2002 | |||||||||||||
| BUSINESS SEGMENTS | |||||||||||||
| Segment revenue | — | 13,898.2 | 4,270.4 | 311.6 | (2,329.5 | ) | 16,150.7 | ||||||
External | — | 13,892.7 | 2,008.8 | 249.2 | — | 16,150.7 | |||||||
| Inter-segment | — | 5.5 | 2,261.6 | 62.4 | (2,329.5 | ) | — | ||||||
Segment (loss) / profit from operations | (85.0 | ) | 3,446.2 | 343.6 | (32.6 | ) | (51.1 | ) | 3,621.1 | ||||
Interest, dividends and other financial income | 840.4 | ||||||||||||
| Finance costs | (868.2 | ) | |||||||||||
| Profit before taxation | 3,593.3 | ||||||||||||
Included in Segment (loss) / profit from operations | |||||||||||||
Depreciation and amortization | (2.3 | ) | (1,774.0 | ) | (66.3 | ) | (31.9 | ) | (195.5 | ) | (2,070.0 | ) | |
Property, plant and equipment | (2.3 | ) | (1,762.6 | ) | (60.7 | ) | (31.7 | ) | — | (1,857.3 | ) | ||
| Intangible assets | — | (11.4 | ) | (5.6 | ) | (0.2 | ) | (195.5 | ) | (212.7 | ) | ||
Bad debts written off | — | — | (111.2 | ) | — | — | (111.2 | ) | |||||
Integration costs, disposals of operations and impairments | (109.9 | ) | 45.5 | (3.5 | ) | (20.0 | ) | 144.3 | 56.4 | ||||
Capital expenditure | (36.1 | ) | (3,660.2 | ) | (562.4 | ) | (21.7 | ) | 1.4 | (4,279.0 | ) | ||
Property, plant and equipment | (36.1 | ) | (3,466.5 | ) | (562.4 | ) | (21.7 | ) | 1.4 | (4,085.3 | ) | ||
| Intangible assets | — | (193.7 | ) | — | — | — | (193.7 | ) | |||||
Assets | |||||||||||||
Segment assets | 4,737.3 | 12,976.0 | 2,466.5 | 679.7 | (5,782.8 | ) | 15,076.7 | ||||||
| Deferred taxation assets | 497.7 | ||||||||||||
| 15,574.4 | |||||||||||||
Liabilities | |||||||||||||
Segment liabilities | (2,427.0 | ) | (6,389.1 | ) | (2,103.7 | ) | (139.8 | ) | 2,837.4 | (8,222.2 | ) | ||
| Deferred tax liabilities | (926.2 | ) | |||||||||||
| Taxation liabilities | (351.6 | ) | |||||||||||
| Dividends payable | (600.0 | ) | |||||||||||
| (10,100.0 | ) | ||||||||||||
F-175
| | Unallocated Rm | Networks Rm | Service Provider Rm | Other Rm | Eliminations Rm | Total Rm | |||||||
|---|---|---|---|---|---|---|---|---|---|---|---|---|---|
| 2003 | |||||||||||||
| BUSINESS SEGMENTS | |||||||||||||
| Segment revenue | — | 17,486.2 | 5,399.8 | 81.0 | (3,188.3 | ) | 19,778.7 | ||||||
External | — | 17,181.6 | 2,556.6 | 40.5 | — | 19,778.7 | |||||||
| Inter-segment | — | 304.6 | 2,843.2 | 40.5 | (3,188.3 | ) | — | ||||||
Segment profit / (loss) from operations | 42.9 | 4,087.3 | 448.9 | (62.5 | ) | (186.7 | ) | 4,329.9 | |||||
Interest, dividends and other financial income | 742.4 | ||||||||||||
| Finance costs | (1,546.3 | ) | |||||||||||
| Profit before taxation | 3,526.0 | ||||||||||||
Included in Segment profit / (loss) from operations | |||||||||||||
Depreciation and amortization | (2.8 | ) | (2,075.1 | ) | (107.9 | ) | (1.2 | ) | (186.7 | ) | (2,373.7 | ) | |
Property, plant and equipment | (2.8 | ) | (2,056.8 | ) | (102.4 | ) | (1.0 | ) | — | (2,163.0 | ) | ||
| Intangible assets | — | (18.3 | ) | (5.5 | ) | (0.2 | ) | (186.7 | ) | (210.7 | ) | ||
Bad debts written off | — | (10.0 | ) | (21.1 | ) | — | — | (31.1 | ) | ||||
Capital expenditure | (4.5 | ) | (3,325.7 | ) | (66.0 | ) | (3.1 | ) | — | (3,399.3 | ) | ||
Property, plant and equipment | (4.5 | ) | (3,325.7 | ) | (66.0 | ) | (3.1 | ) | — | (3,399.3 | ) | ||
| Intangible assets | — | — | — | — | — | — | |||||||
Assets | |||||||||||||
Segment assets | 3,953.7 | 13,766.3 | 2,137.8 | 924.4 | (4,521.0 | ) | 16,261.2 | ||||||
| Deferred taxation assets | 704.7 | ||||||||||||
| 16,965.9 | |||||||||||||
Liabilities | |||||||||||||
Segment liabilities | (1,718.5 | ) | (6,730.6 | ) | (2,412.5 | ) | (148.7 | ) | 2,878.1 | (8,132.2 | ) | ||
| Deferred tax liabilities | (993.1 | ) | |||||||||||
| Taxation liabilities | (315.2 | ) | |||||||||||
| Dividends payable | (600.0 | ) | |||||||||||
| (10,040.5 | ) | ||||||||||||
F-176
| | Unallocated Rm | Networks Rm | Service Provider Rm | Other Rm | Eliminations Rm | Total Rm | |||||||
|---|---|---|---|---|---|---|---|---|---|---|---|---|---|
| 2004 | |||||||||||||
| BUSINESS SEGMENTS | |||||||||||||
| Segment revenue | — | 20,787.9 | 6,148.9 | 174.2 | (3,633.0 | ) | 23,478.0 | ||||||
External | — | 20,787.9 | 2,562.6 | 127.5 | — | 23,478.0 | |||||||
| Inter-segment | — | — | 3,586.3 | 46.7 | (3,633.0 | )) | — | ||||||
Segment profit / (loss) from operations | 26.7 | 4,884.5 | 614.1 | (114.8 | ) | (176.6 | ) | 5,233.9 | |||||
Interest, dividends and other financial income | 656.5 | ||||||||||||
| Finance costs | (1,107.5 | ) | |||||||||||
| Profit before taxation | 4,783.0 | ||||||||||||
Included in Segment profit / (loss) from operations | |||||||||||||
Depreciation and amortization | (3.3 | ) | (2,224.4 | ) | (114.0 | ) | (1.4 | ) | (189.8 | ) | (2,532.9 | ) | |
Property, plant and equipment | (3.3 | ) | (2,200.2 | ) | (108.0 | ) | (1.2 | ) | — | (2,312.7 | ) | ||
| Investment properties | — | (4.2 | ) | — | — | — | (4.2 | ) | |||||
| Intangible assets | — | (20.0 | ) | (6.0 | ) | (0.2 | ) | (189.8 | ) | (216.0 | ) | ||
Bad debts written off | — | (30.9 | ) | (17.9 | ) | — | — | (48.8 | ) | ||||
Capital expenditure | (4.1 | ) | (2,934.1 | ) | (72.3 | ) | (1.3 | ) | — | (3,011.8 | ) | ||
Property, plant and equipment | (4.1 | ) | (2,820.0 | ) | (65.3 | ) | (1.3 | ) | — | (2,890.7 | ) | ||
| Intangible assets | — | (114.1 | ) | (7.0 | ) | — | — | (121.1 | ) | ||||
Assets | |||||||||||||
Segment assets | 9,991.1 | 15,961.0 | 3,606.5 | 1,651.1 | (12,127.3 | ) | 19,082.4 | ||||||
| Deferred taxation assets | 1,015.3 | ||||||||||||
| 20,097.7 | |||||||||||||
Liabilities | |||||||||||||
Segment liabilities | (2,531.2 | ) | (12,401.3 | ) | (3,734.6 | ) | (327.4 | ) | 10,118.4 | (8,876.1 | ) | ||
| Deferred tax liabilities | (1,173.5 | ) | |||||||||||
| Taxation liabilities | (852.0 | ) | |||||||||||
| Dividends payable | (1,500.0 | ) | |||||||||||
| (12,401.6 | ) | ||||||||||||
"Unallocated" comprises the reporting relevant to Vodacom Group (Proprietary) Limited, the parent company in the Group, Vodacom International Limited (Mauritius) and Vodacom International Holdings (Proprietary) Limited. These companies are primarily management services companies, that offers combined administrative, advisory and management services to companies within the rest of the Group.
"Networks" comprise services provided by cellular networks within South Africa and other African countries. Services offered by the companies include the standard voice telecommunication services of
F-177
cellular networks as well as data communication services through the cellular network, including short message servicing (SMS), wireless application protocol (WAP), general packet radio system (GPRS) and multimedia messaging services (MMS)
"Service providers" comprise services provided by cellular telecommunication, satellite telecommunication and Internet service providers within South Africa. Cellular and satellite telecommunication service providers act as agents for the respective networks and on sells airtime to customers. Internet service providers provide their customer base access to the World Wide Web. The internet service provider was disposed of on November 30, 2001.
The disclosure of revenue from service providers has been restated for the 2003 and 2002 financial years to disclose gross revenue earned for services as apposed to the net revenue retained after transactions with dealers.
"Other" comprises of other business lines of the Group, including the providing of promotion and event services as well as providing television rental and related rental services, neither of which fall within the Group's strategic focus nor do they constitute a separately reportable segment. The promotion and event service business, and the rental service business were disposed of on February 27, 2002 and March 31, 2002 respectively.
"South Africa", which is also the home country of the parent, comprises the segment information relating to the South African based cellular network as well as all the segment information of the service providers and other business segments. "Other African countries" comprise only of cellular networks and are located in Tanzania, Lesotho, Democratic Republic of Congo and Mozambique, and it also includes the international holding company situated in Mauritius.
ACCOUNTING POLICIES AND BASIS OF PREPARATION
Segment information is prepared in conformity with accounting policies adopted for preparing and presenting the consolidated financial statements.
Segment revenue excludes value-added taxation and includes inter-Group revenue. Net revenue represents segment revenue from which inter-Group revenue has been eliminated. Sales between segments are made on a commercial basis. Segment profit / (loss) from operations represents segment revenue less segment operating expenses. Segment expenses include direct and operating expenses. Integration costs, disposals of operations and impairments, depreciation and amortization have been allocated to the segments to which they relate.
The segment assets and liabilities comprise all assets and liabilities of the different segments including those relating to operating, investing and financing activities. Unallocated assets and liabilities comprise of deferred taxation and other unallocatable balances.
Capital expenditure in property, plant and equipment, investment properties and intangible assets has been allocated to the segments to which they relate.
46. INTEREST IN SUBSIDIARIES
The information discloses interests in subsidiaries material to the financial position of the Group. The interest in the ordinary share capital is representative of the voting power.
RSA—Republic of South Africa; TZN—Tanzania; LES—Lesotho; MZ—Mozambique; MAU—Mauritius; C—Cellular; S—Satellite; MSC—Management services company; PROP—Property company; OTH—Other
- *
- —Dormant as at March 31, 2004.
F-178
| | | | | | Interest in Issued Ordinary Share Capital | ||||||||||
|---|---|---|---|---|---|---|---|---|---|---|---|---|---|---|---|
| | | Issued Share Capital | |||||||||||||
| | Country of Incorporation | 2002 % | 2003 % | 2004 % | |||||||||||
| | 2002 | 2003 | 2004 | ||||||||||||
| Cellular network operators | |||||||||||||||
Vodacom (Proprietary) Limited (C) | RSA | R100 | R100 | R100 | 100 | 100 | 100 | ||||||||
| Vodacom Lesotho (Proprietary) Limited (C) | LES | M4,180 | M4,180 | M4,180 | 88.3 | 88.3 | 88.3 | ||||||||
| Vodacom Tanzania Limited (C) | TZN | US$100 | US$100 | US$ | 100 | 65 | 65 | 65 | |||||||
| VM, S.A.R.L. (C) | MZ | — | — | MZM5,005,500 | — | — | 98 | ||||||||
Service providers | |||||||||||||||
VSP Holdings (Proprietary) Limited (MSC) | RSA | R1,020 | R1,020 | R1,020 | 100 | 100 | 100 | ||||||||
| Vodacom Service Provider Company (Proprietary) Limited (C) | RSA | R20 | R20 | R20 | 100 | 100 | 100 | ||||||||
| Vodacom Satellite Services (Proprietary) Limited previously known as Globalstar SA (Proprietary) Limited (S)* | RSA | R100 | R100 | R100 | 100 | 100 | 100 | ||||||||
| GSM Cellular (Proprietary) Limited (C)* | RSA | R1,200 | R1,200 | R1,200 | 100 | 100 | 100 | ||||||||
| Smartphone SP (Proprietary) Limited (C) | RSA | — | — | R20,000 | — | — | 51 | ||||||||
Other | |||||||||||||||
Vodacom Venture No. 1 (Proprietary) Limited (MSC) | RSA | R158,999 | R158,999 | R158,999 | 100 | 100 | 100 | ||||||||
| Vodacom Equipment Company (Proprietary) Limited* | RSA | R100 | R100 | R100 | 100 | 100 | 100 | ||||||||
| Vodacare (Proprietary) Limited (C)* | RSA | R100 | R100 | R100 | 100 | 100 | 100 | ||||||||
| Vodacom International Holdings (Proprietary) Limited (MSC) | RSA | R100 | R100 | R100 | 100 | 100 | 100 | ||||||||
| Vodacom International Limited (MSC) | MAU | US$100 | US$100 | US$ | 100 | 100 | 100 | 100 | |||||||
| Vodacom Properties No.1 (Proprietary) Limited (PROP)* | RSA | — | R100 | R100 | — | 100 | 100 | ||||||||
| Stand 13 Eastwood Road Dunkeld West (Proprietary) Limited (PROP) | RSA | — | — | R100 | — | — | 100 | ||||||||
| Ithuba Smartcall (Proprietary) Limited (OTH)* | RSA | — | — | R100 | — | — | 52 | ||||||||
47. INTEREST IN JOINT VENTURES
The Group's joint ventures during the 2002 financial year included Vodacom World Online (Proprietary) Limited and Vodacom Congo (RDC) s.p.r.l. Effective November 30, 2001, the Group disposed of the interest in Vodacom World Online (Proprietary) Limited. Details of the disposal are presented in Note 32 to the consolidated financial statements. The Group acquired its interest in
F-179
Vodacom Congo (RDC) s.p.r.l. on December 11, 2001, which is the only remaining joint venture at March 31, 2004.
| | 2002 Vodacom World Online (Proprietary) Limited | |||
|---|---|---|---|---|
| Interest held | 40 | % | ||
Rm | ||||
The Group's proportionate share of assets and liabilities: | ||||
| Property, plant and equipment | — | |||
| Intangible assets | — | |||
| Current assets | — | |||
| — | ||||
| Long term liabilities | — | |||
| Current liabilities | — | |||
| Net assets | — | |||
| The Group's proportionate share of revenue and expenditure: | ||||
| Revenue | 36.1 | |||
| Loss before taxation | (19.9 | ) | ||
| Taxation | — | |||
| Net loss | (19.9 | ) | ||
| The Group's proportionate share of cash flows: | ||||
| Net cash flows from / (utilized in) operating activities | 1.4 | |||
| Net cash flows from / (utilized in) investing activities | — | |||
| Net cash flows from / (utilized in) financing activities | 4.8 | |||
| Net cash flow | 6.2 | |||
| The Group's proportionate share of contingent liabilities and capital commitments: | ||||
| Contingent liabilities (Note 37) | — | |||
| Capital commitments | — | |||
F-180
| | 2002 Vodacom Congo (RDC) s.p.r.l. | 2003 Vodacom Congo (RDC) s.p.r.l. | 2004 Vodacom Congo (RDC) s.p.r.l. | |||||
|---|---|---|---|---|---|---|---|---|
| Interest held | 51 | % | 51 | % | 51 | % | ||
Rm | Rm | Rm | ||||||
The Group's proportionate share of assets and liabilities: | ||||||||
| Property, plant and equipment | 87.0 | 433.6 | 620.6 | |||||
| Intangible assets | 202.3 | 160.1 | 136.7 | |||||
| Deferred taxation asset | — | — | 100.2 | |||||
| Current assets | 154.9 | 90.7 | 195.2 | |||||
| 444.2 | 684.4 | 1,052.7 | ||||||
| Long term liabilities | — | (284.1 | ) | — | ||||
| Preference shares* | (440.3 | ) | (306.8 | ) | (243.1 | ) | ||
| Current liabilities | (37.6 | ) | (258.6 | ) | (936.3 | ) | ||
| Net liabilities | (33.7 | ) | (165.1 | ) | (126.7 | ) | ||
| The Group's proportionate share of revenue and expenditure: | ||||||||
| Revenue | 5.7 | 258.8 | 475.9 | |||||
| Loss before taxation after reclassification of preference share dividends* | (25.5 | ) | (208.3 | ) | (129.5 | ) | ||
| Taxation | — | — | 113.8 | |||||
| Net loss* | (25.5 | ) | (208.3 | ) | (15.7 | ) | ||
| The Group's proportionate share of cash flows: | ||||||||
| Net cash flows from / (utilized in) operating activities | (72.3 | ) | (172.9 | ) | 13.0 | |||
| Net cash flows from / (utilized in) investing activities | (275.8 | ) | (445.9 | ) | (359.4 | ) | ||
| Net cash flows from / (utilized in) financing activities | 388.0 | 552.4 | 365.4 | |||||
| Net cash flow | 39.9 | (66.4 | ) | 19.0 | ||||
| The Group's proportionate share of contingent liabilities and capital commitments: | ||||||||
| Contingent liabilities (Note 37) | — | — | — | |||||
| Capital commitments | 765.4 | 260.1 | 145.2 | |||||
- *
- Preference shares were reclassified from equity to liabilities in accordance with IAS 32: Financial Instruments: Disclosure and Presentation ("IAS 32") during the 2004 financial year. Accordingly the net liabilities, loss before taxation and net loss of the joint venture company as previously disclosed for the 2003 and 2002 financial years have been restated. (Note 41)
In terms of a shareholders agreement, the Group's joint venture partner in Vodacom Congo (RDC) s.p.r.l., Congolese Wireless Network s.p.r.l. ("CWN") has a put option which comes into effect 3 years after the commencement date, December 1, 2001, and for a maximum of 5 years thereafter. In terms of the option, CWN shall be entitled to put to Vodacom International Limited such number of shares in and claims on loan account against Vodacom Congo (RDC) s.p.r.l. as constitute 19% of the entire issued share capital of that company. CWN can exercise this option in a maximum of three tranches and each tranche must consist of at least 5% of the entire issued share capital of Vodacom Congo (RDC) s.p.r.l. The option price will be the fair market value of the related shares at the date the put option is exercised. The option has no value at March 31, 2004, 2003 and 2002.
F-181
The financial statements have been prepared in accordance with International Financial Reporting Standards ("IFRS"), which differs in certain respects from Generally Accepted Accounting Principles in the United States ("US GAAP"). The effect of applying US GAAP principles to net profit and shareholders' equity is set out below along with an explanation of applicable differences between IFRS and US GAAP:
| | Notes | 2002 Rm | 2003 Rm | 2004 Rm | ||||||
|---|---|---|---|---|---|---|---|---|---|---|
| Net profit as reported in accordance with IFRS | 2,373.0 | 2,214.6 | 3,031.8 | |||||||
Items increasing / (decreasing) net profit: | ||||||||||
Deferred bonus incentive scheme | (a | ) | 20.9 | (30.7 | ) | 8.6 | ||||
| Goodwill—amortization of taxation rate difference | (f | ) | (7.7 | ) | — | — | ||||
| Goodwill—non-amortization | (b | ) | 1.8 | 96.5 | 94.7 | |||||
| Goodwill—translation differences on amortization | (c | ) | (3.9 | ) | — | — | ||||
| Business combination | (m | ) | — | — | 4.8 | |||||
| Derivative financial instruments—reclassification of transition adjustments | (e | ) | 52.0 | 7.8 | 7.8 | |||||
| Income tax—rate differences | (f | ) | (225.3 | ) | (196.6 | ) | (144.4 | ) | ||
| Normal income tax effect of US GAAP adjustments | (g | ) | (21.9 | ) | 6.9 | (6.3 | ) | |||
| Joint venture | (i | ) | (80.0 | ) | — | — | ||||
| Net profit in accordance with US GAAP before cumulative effect of change in accounting policy | 2,108.9 | 2,098.5 | 2,997.0 | |||||||
| Change in accounting policy upon adoption of SFAS 133 | ||||||||||
| Derivative financial instruments—transition adjustments | (e | ) | 17.2 | — | — | |||||
| Income tax effect on above | (g | ) | (6.5 | ) | — | — | ||||
| Net profit in accordance with US GAAP after cumulative effect of change in accounting policy | 2,119.6 | 2,098.5 | 2,997.0 | |||||||
| Shareholders' equity as reported in accordance with IFRS | 5,463.8 | 6,837.4 | 7,603.1 | |||||||
Items increasing / (decreasing) shareholders' equity: | ||||||||||
Deferred bonus incentive scheme | (a | ) | 57.9 | 27.2 | 35.8 | |||||
| Goodwill—amortization of taxation rate difference | (f | ) | (17.7 | ) | (17.7 | ) | (17.7 | ) | ||
| Goodwill—non-amortization | (b | ) | 1.8 | 98.3 | 193.0 | |||||
| Goodwill—translation differences on accumulated amortization | (c | ) | (4.2 | ) | (4.2 | ) | (4.2 | ) | ||
| Goodwill—accumulated translation differences | (c | ) | 31.7 | (8.8 | ) | (32.7 | ) | |||
| Business combination | (m | ) | — | — | 4.8 | |||||
| Income tax—rate differences | (f | ) | (641.9 | ) | (837.8 | ) | (981.5 | ) | ||
| Normal income tax effect of US GAAP adjustments | (g | ) | (17.4 | ) | (8.2 | ) | (12.2 | ) | ||
| Shareholders' equity in accordance with US GAAP | 4,874.0 | 6,086.2 | 6,788.4 | |||||||
F-182
| Movements in Shareholders' equity in accordance with US GAAP | ||||||||||
Balance at beginning of period | 3,195.0 | 4,874.0 | 6,086.2 | |||||||
Net profit for the year | 2,119.6 | 2,098.5 | 2,997.0 | |||||||
| Dividends declared | (600.0 | ) | (600.0 | ) | (2,100.0 | ) | ||||
| Foreign currency translation reserve adjustment | 127.0 | (281.5 | ) | (190.0 | ) | |||||
| Cumulative effect adjustment of adoption of SFAS 133, net of taxation | 64.8 | — | — | |||||||
| Gain on derivatives—reclassified to earnings, net of taxation | (32.4 | ) | (4.8 | ) | (4.8 | ) | ||||
| Balance at end of period | 4,874.0 | 6,086.2 | 6,788.4 | |||||||
Summary of differences between IFRS and accounting principles generally accepted in the US.
A summary of the principal differences and additional disclosures applicable to the Group are set forth below:
(a) Deferred bonus incentive scheme
Under IFRS, the total value of deferred bonus entitlements as calculated at the end of each financial period is based on the net present value of expected future cash payments as determined under the bonus formula over the vesting period.
Under US GAAP, in accordance with FIN 28: "Accounting for Stock Appreciation Rights and Other Variable Stock Option Awards Plans an Interpretation of APB Opinions no. 15 and 25", compensation cost is recognized over the service period or the vesting period if the service period is not defined, based upon the undiscounted value of the entitlements.
(b) Goodwill—non-amortization
Under IFRS, goodwill and intangible assets arising in business combinations are amortized over their estimated useful lives.
Under US GAAP, accounting for goodwill and intangible assets was substantially the same as IFRS until the adoption of SFAS No. 141: Business Combinations ("SFAS 141") and SFAS No. 142: Goodwill and Other Intangible Assets ("SFAS 142"). SFAS 141 is effective for all business acquisitions consummated after June 30, 2001. SFAS 141 requires all business combinations consummated after June 30, 2001 to be accounted for under the purchase method. SFAS 141 also sets forth guidelines for applying the purchase method of accounting in the determination of intangible assets, including goodwill, acquired in a business combination.
SFAS 142 addresses the initial and ongoing financial accounting and reporting for acquired goodwill and other intangible assets. SFAS 142 requires that goodwill be separately disclosed from other intangible assets in the balance sheet, and no longer be amortized but tested for impairment at least annually (or more frequently if impairment indicators arise). SFAS 142 is effective for financial statements for periods beginning on or after December 15, 2001. Additionally, the amortization provisions of SFAS 142 are applicable to goodwill arising in all business acquisitions consummated after June 30, 2001 regardless of the adoption date of SFAS 142. Accordingly, goodwill arising from the investment in Vodacom Congo (RDC) s.p.r.l. and Smartphone SP (Proprietary) Limited is not subject to amortization.
The Group adopted SFAS 142 generally with effect from April 1, 2002. From that date all goodwill is no longer amortized.
F-183
The Group has carried out the initial impairment testing of goodwill required by SFAS 142 as at April 1, 2002 and determined that no impairment needs to be recognized upon the adoption of SFAS 142.
(c) Goodwill—translation of goodwill arising on the acquisition of a foreign entity
Under IFRS, goodwill arising on the acquisition of a foreign entity is treated as an asset of the Group and translated at the foreign exchange rate ruling at the transaction date—based on the historical rate.
Under US GAAP, goodwill arising on the acquisition of Vodacom Congo (RDC) s.p.r.l. and Vodacom Tanzania Limited is translated at the actual exchange rate at the end of the period. The resulting foreign exchange transaction gain or loss increases or decreases the net investment in Vodacom Congo (RDC) s.p.r.l. and Vodacom Tanzania Limited. The adjustments shown in the income statements are due to the amortization of such gain or loss recorded in goodwill under US GAAP.
| | 2002 Rm | 2003 Rm | 2004 Rm | |||||
|---|---|---|---|---|---|---|---|---|
| A reconciliation of goodwill reported under IFRS at the balance sheet date to the amounts determined under US GAAP is as follows: | ||||||||
Included in total goodwill reported under IFRS | 342.9 | 246.5 | 375.7 | |||||
| Goodwill not amortized under US GAAP | 1.8 | 98.3 | 193.0 | |||||
| Business combination (Note 48 m) | — | — | 136.0 | |||||
| Additional goodwill—income tax rate change (Note 48 f) | 20.1 | 20.1 | 35.8 | |||||
| Translation difference on amortization | (4.2 | ) | (4.2 | ) | (4.2 | ) | ||
| Translation difference on goodwill balance | 31.7 | (8.8 | ) | (32.7 | ) | |||
| Goodwill in joint venture (Note 48 i) | (110.8 | ) | (78.9 | ) | (61.2 | ) | ||
| As adjusted under US GAAP | 281.5 | 273.0 | 642.4 | |||||
(d) Income taxes—additional temporary differences
Under IFRS, no deferred tax liability was recognized in respect of intangible assets acquired other than in a business combination where there was a difference at the date of acquisition between the assigned values and the tax bases of the assets.
Under US GAAP, a deferred tax liability (and corresponding increase in assets acquired) is recognized for all temporary differences between the assigned values and the tax bases of intangible assets acquired. The recording of such deferred tax liability has no net impact on net income or shareholder's equity as determined under US GAAP as the decrease in income tax expense is offset by a corresponding increase in amortization (Note 48 g).
(e) Derivative financial instruments
The Group adopted IAS 39 and SFAS 133: Accounting for Derivative Instruments and Hedging Activities ("SFAS 133") on April 1, 2001.
Under IFRS, upon adoption of IAS 39: Financial Instruments—Recognition and Measurement ("IAS 39"), the difference between previous carrying amounts and the fair value of derivatives, which prior to the adoption of IAS 39 had been designated as either fair value or cash flow hedges but do not qualify as hedges under IAS 39, is recognized as an adjustment of the opening balance of retained earnings at the beginning of the financial year IAS 39 is initially applied. Changes in fair value of derivatives acquired after April 1, 2001 are recorded in the income statement.
F-184
Under US GAAP, upon adoption of SFAS 133, the difference between previous carrying amounts and fair value of derivatives, which prior to the adoption of SFAS 133 had been cash flow type hedges but do not qualify as hedges under SFAS 133, is recognized as a cumulative effect adjustment of other comprehensive income in the year SFAS 133 is initially applied. This amount is subsequently released into earnings in the same period or periods during which the hedged transaction affects earnings. During the year ended March 31, 2004 R7.8 million (2003: R7.8 million; 2002: R52.0 million) was released into earnings. The difference between previous carrying amounts and fair value of derivatives, which prior to the adoption of SFAS 133 had been fair value type hedges, is recognized as a cumulative effect adjustment in earnings. Changes in fair value of derivatives acquired after April 1, 2001 are recorded in the income statement.
(f) Income tax—rate differences
The tax rate in South Africa varies depending on whether income is distributed. The income tax rate is 30% but upon distribution an additional tax (Secondary Tax on Companies or "STC") of 12.5% is due based on the amount of the dividends net of the STC credit for dividends received during a dividend cycle.
In conformity with IFRS, the Group reflects the STC as a component of the income tax charge for the period in which dividends are declared. IFRS also requires that deferred tax be provided for at the undistributed rate of 30%.
For the purpose of US GAAP, the Group believes that under SFAS No. 109: "Accounting for Income Taxes" ("SFAS 109") temporary differences should be tax effected using the tax rate that will apply when income is distributed, i.e. an effective rate of 37.78% including STC.
The Group has therefore computed the estimated STC that would become payable upon distribution of relevant undistributed earnings and accrued that amount as an additional liability for US GAAP purposes.
The use of the higher rate not only affects the measurement of deferred tax assets and liabilities, and hence the tax charge for any period, but because temporary differences in a business combination need to be tax effected at the higher rate there is a consequent effect on the amount of goodwill recognized in a business combination under US GAAP.
(g) Deferred taxation
The tax effects of the US GAAP adjustments have been calculated based on the enacted tax rate of 37.78% (2003: 37.78%; 2002: 37.78%).
A reconciliation of the deferred tax balances under IFRS to the approximate amounts determined under US GAAP, where materially different, is as follows:
| | 2002 Rm | 2003 Rm | 2004 Rm | |||||
|---|---|---|---|---|---|---|---|---|
| Net deferred tax liabilities: | ||||||||
| As reported under IFRS | 428.5 | 288.4 | 158.2 | |||||
| Additional temporary differences (Note 48 d) | 62.2 | 53.7 | 46.0 | |||||
| Business combination (Note 48 m) | — | — | (58.3 | ) | ||||
| Income tax—rate difference (Note 48 f) | 679.7 | 875.6 | 1,035.0 | |||||
| Tax effect of US GAAP adjustments | 17.4 | 8.2 | 12.2 | |||||
| Deferred tax in joint venture (Note 48 i) | — | — | 100.2 | |||||
| As adjusted under US GAAP | 1,187.8 | 1,225.9 | 1,293.3 | |||||
F-185
Under IFRS, deferred tax assets on deductible temporary differences are only recognized to the extent that it is probable that the future taxable profit will allow the deferred tax asset to be recovered.
Under US GAAP, deferred tax assets are recognized on all temporary differences. A valuation allowance is recognized if it is more likely than not that the asset will not be recovered. For US GAAP purposes, an additional deferred tax asset and a corresponding valuation adjustment allowance of R24.8 million (2003: Rnil; 2002: R31.0 million) have no effect on the net shareholder's equity for the current year.
(h) Capitalized interest
Under IFRS, interest cost incurred during the construction period is expensed as incurred.
Under US GAAP, interest cost incurred during the construction period (i.e. period of time necessary to bring a constructed fixed asset to the condition and location necessary for its intended use) is capitalized. The capitalized interest is recorded as part of the asset to which it relates and is amortized over the asset's estimated useful life. Capitalized interest was nil for the years ended March 31, 2004, 2003 and 2002 as the effect of capitalizing interest, as compared with the effect of expensing interest, was not material.
(i) Joint ventures
Under IFRS, investments qualifying as joint ventures are accounted for under the proportionate consolidation method of accounting. Under the proportionate consolidation method, the venturer records its share of each of the assets, liabilities, income and expenses of the jointly controlled entity on a line-by-line basis with similar items in the venturer's financial statements. The venturer continues to record its share of losses in excess of its net investment of the joint venture.
Under US GAAP, joint ventures are accounted for under the equity method of accounting. Under the equity method, an investment in a joint venture is shown in the balance sheet of an investor as a single amount. Likewise, an investor's share of earnings or losses from its investment is ordinarily shown in its income statement as a single amount. Typically an investor discontinues applying the equity method when its net investment (including net advances) is reduced to zero, unless the investor has guaranteed obligations of the investee or is otherwise committed to provide further financial support from the investee.
Under IFRS, Vodacom World Online (Proprietary) Limited was proportionately consolidated in 2002. In 2001 the Group proportionately consolidated losses to the value of R45.0 million that was in excess of the Group's net investment in Vodacom World Online (Proprietary) Limited. Under US GAAP, these losses are not considered in calculating net income as the value of the investment was reduced to zero and the Group does not have further financial obligations to this joint venture. Upon disposal of the investment in Vodacom World Online (Proprietary) Limited in 2002, the gain on the sale was less based on a different basis in the net investment.
In 2004, 2003 and 2002, the Group also proportionately consolidated Vodacom Congo (RDC) s.p.r.l.. The summarized financial statement information for Vodacom World Online (Proprietary) Limited and Vodacom Congo (RDC) s.p.r.l. relating to the Group's pro rata interest is set out in Note 47. Currently under US GAAP, the Group's share of losses of Vodacom Congo (RDC) s.p.r.l. does not exceed the carrying amount of the investment in the joint venture.
F-186
Investment in Vodacom Congo (RDC) s.p.r.l. under US GAAP is as follows:
| | 2002 Rm | 2003 Rm | 2004 Rm | ||||||
|---|---|---|---|---|---|---|---|---|---|
| Initial investment in ordinary shares reported under IFRS | 5.1 | 5.1 | 5.1 | ||||||
| Initial investment in preference shares reported under IFRS | 440.3 | 306.8 | 243.1 | ||||||
| Group's share in accumulated losses of the joint venture net of dividends received | (20.1 | ) | (213.3 | ) | (218.0 | ) | |||
| Foreign currency translation reserve under IFRS | (13.5 | ) | 63.4 | 117.6 | |||||
| US GAAP adjustments: | |||||||||
| Goodwill not amortized | 1.8 | 7.2 | 12.5 | ||||||
| Translation difference on goodwill | 14.4 | (17.7 | ) | (35.2 | ) | ||||
| Investment in associate under US GAAP | 428.0 | 151.5 | 125.1 | ||||||
The Group retrospectively reclassified Vodacom Congo (RDC) s.p.r.l. preference shares from equity to liabilities. Refer Note 41.
(j) Comprehensive income
Comprehensive income under US GAAP and accumulated other comprehensive income balances under US GAAP are summarized as follows:
| | 2002 Rm | 2003 Rm | 2004 Rm | |||||
|---|---|---|---|---|---|---|---|---|
| Net income under US GAAP | 2,119.6 | 2,098.5 | 2,997.0 | |||||
| Other comprehensive (loss)/income: | ||||||||
| Foreign currency translation adjustment | 127.0 | (281.5 | ) | (190.0 | ) | |||
| Cumulative effect adjustment of adoption of SFAS 133 | 64.8 | — | — | |||||
| Gain on derivatives—reclassified to earnings | (32.4 | ) | (4.8 | ) | (4.8 | ) | ||
| Other comprehensive (loss)/income | 159.4 | (286.3 | ) | (194.8 | ) | |||
| Comprehensive income | 2,279.0 | 1,812.2 | 2,802.2 | |||||
| Accumulated other comprehensive income balances: | ||||||||
| Cumulative foreign currency translation adjustments | 129.3 | (152.2 | ) | (342.2 | ) | |||
| Cumulative effect adjustment of adoption of SFAS 133 | 32.4 | 27.6 | 22.8 | |||||
(k) Impairment of assets
Under IFRS, the Group is required to annually assess at the balance sheet date or earlier should a triggering event occur, whether there are any indications that an asset may be impaired. Should there be such an indicator, the asset must be tested for impairment. An impairment loss must be recognized in the income statement, should an assets carrying amount exceed its recoverable amount. The impairment loss is the difference between the assets carrying amount and its recoverable value. The recoverable amount is the higher of the assets net selling price or its value in use. Value in use is the future cash flows to be derived from the particular asset, discounted to present value using a pre-tax market determined rate that reflects the current assessment of the time value of money and the risks specific to the asset. The reversal of an impairment loss in subsequent periods is permitted when there has been a change in economic conditions or the expected use of the asset.
Under US GAAP, the Group is required to test for impairment whenever there is an indication of impairment. For assets to be held and used, impairment is first measured by reference to undiscounted cash flows. If there is no impairment by reference to undiscounted cash flows, no further action is
F-187
required but the useful life of the asset must be reconsidered. If impairment exists the Group must measure impairment by comparing the assets fair value to its carrying value. Fair value is either market value (if an active market for the asset exists) or the sum of discounted future cash flows. The discount rate reflects the risk that is specific to that asset. For assets to be disposed of, the loss recognized is the excess of the assets carrying amount over its fair value less costs to sell. The reversal of previously recognized impairment losses is prohibited.
During 2001 the Group recognized a loss of R45.5 million in respect of an onerous contract (Note 3) in accordance with paragraph 8 of SFAS 5: Accounting for Contingencies ("SFAS 5"). Subsequent to the issuance of the 2001 financial statements, it became clear that the other party to the contract was prepared to waive its right to supply satellite phones and instead was prepared to enter into a revised contract to supply mobile phones. Accordingly, management determined that, based on the change in circumstances arising from the willingness of the other party to revise the contract, the Group would no longer incur a loss under the contract and therefore reversed the loss previously provided for. The reversal of the provision, based on a change in circumstances, is not the recovery of impaired assets but rather it represents the reversal in a subsequent period of a provision for an estimated loss.
The Group currently has no material GAAP difference for impairment of assets.
(l) Revenue recognition
Under IFRS the Group recognizes activation fee revenue and costs up to the amount of the related activation revenue immediately upon activation of a new customer. Any excess costs incurred are recognized up front upon activation of a new customer.
Under US GAAP, activation fee revenues and costs up to the amount of activation revenue would be deferred and recognized over the customer relationship.
The Group has not presented the deferral of activation fees in the above US GAAP reconciliation, as the amounts are immaterial.
(m) Business combination
Under IFRS, the Group elected to fair value 100% of the assets acquired and liabilities assumed, including minority interests. The excess of the cost of an acquired entity over the net of the amounts assigned to assets acquired and liabilities assumed should be recognized as an asset referred to as goodwill.
Under US GAAP, the Group should only fair value the percentage of the assets acquired and liabilities assumed, excluding minority interests. Similar to IFRS, the excess of the cost of an acquired entity over the net of the amounts assigned to assets acquired and liabilities assumed should be recognized as an asset referred to as goodwill. As a result, the carrying amount of the goodwill for US GAAP purposes is adjusted to reflect the different values assigned to the intangibles.
(n) Guarantees
Under IFRS, fees received by the Group from issuing guarantees are recognized in income as earned. A liability in respect of the guarantee is not recognized until such time as the contingent liability is thought likely to realize.
Under US GAAP, the Group adopted the initial recognition and initial measurement provisions of FASB Interpretation No. 45, "Guarantor's Accounting and Disclosure Requirements for Guarantees, Including Indirect Guarantees and Indebtedness of Others (an interpretation of FASB Statements No. 5, 57 and 107 and Rescission of Interpretation No. 34)" ("FIN 45") in fiscal year 2004. This
F-188
interpretation clarifies that a guarantor is required to recognize, at the inception of a guarantee entered into after December 15, 2002, a liability for the fair value of the obligation undertaken in issuing the guarantee. This interpretation does not prescribe a specific approach for subsequently measuring the guarantor's recognized liability over the term of the related guarantee.
The Group has issued certain guarantees in connection with borrowings of Vodacom Congo (RDC) s.p.r.l., an equity method investee for US GAAP purposes. On the adoption of FIN 45, all guarantees issued during fiscal year 2004 related to Vodacom Congo (RDC) s.p.r.l. were initially recorded at fair value at the balance sheet and subsequently amortized into income statements as the premiums are earned.
(o) Recent accounting pronouncements not adopted at March 31, 2004
In November 2002, the Emerging Issues Task Force reached a final consensus related to Revenue Arrangement with Multiple Deliverables ("EITF 00-21"). The consensus requires that revenue arrangements with multiple deliverables should be divided into separate units of accounting if (a) a delivered item has value to the customer on stand alone basis, (b) there is objective and reliable evidence of the fair value of the undelivered item and (c) if the arrangement includes a general right of return, delivery or performance of the undelivered items is considered probable and substantially in the control of the vendor. Arrangement consideration should be allocated among the separate units of accounting based on their relative fair value and appropriate revenue recognition criteria would be applied to each separate unit of accounting. The Group has not yet determined what effect, if any, EITF 00-21 would have on revenue and net income determined in accordance with US GAAP. The Task Force agreed the effective date for the consensus will be for all revenue arrangements entered into in fiscal periods beginning after June 15, 2003, with early adoption permitted. The Group is still evaluating the impact of this EITF on its financial statements. This EITF will be effective for the Group for revenue arrangements entered into after April 1, 2004.
In December 2003, the FASB issued FIN 46R, Consolidation of Variable Interest Entities, an Interpretation of ARB 51, Revised December 2003 ("FIN 46R"), which clarifies the application of ARB No. 51, "Consolidated Financial Statements," to certain entities in which equity investors do not have the characteristics of a controlling financial interest or do not have sufficient equity at risk for the entity to finance its activities without additional subordinated financial support. FIN 46R requires the consolidation of these entities, known as Variable Interest Entities ("VIEs"), by the primary beneficiary of the entity. The primary beneficiary is the entity, if any, that will absorb a majority of the entity's expected losses, receive a majority of the entity's expected residual returns, or both.
Among other changes, the revisions of FIN 46R (a) clarified some requirements of the original FIN 46, which had been issued in January 2003, (b) eased some implementation problems, and (c) added new scope exceptions. Non-public entities must adopt FIN 46R no later than the beginning of the first interim or annual reporting period beginning after December 15, 2004. Accordingly, the Group will adopt FIN 46R April 1, 2005.
The Group is currently assessing the impact of the adoption of FIN 46R on its financial position, cash flows and results of operations. Based on its preliminary analysis, the accounting for the equity method investee Vodacom Congo (RDC) s.p.r.l. is possibly the only transaction that would be affected by adoption of FIN 46R. Disclosures in relation to the nature, size and potential loss is set out in Notes 37, 44 and 48 (i).
In November 2001, the Group, together with Congolese Wireless Network s.p.r.l. ("CWN"), an entity incorporated in the Democratic Republic of the Congo, formed Vodacom Congo (RDC) s.p.r.l. ("Vodacom Congo"), an entity incorporated in the Democratic Republic of the Congo. The Group owns a 51% interest in Vodacom Congo, while CWN owns the remaining 49% interest in Vodacom Congo. CWN had a limited existing network in the Democratic Republic of the Congo. Although
F-189
Vodacom has a majority voting interest in Vodacom Congo, the other shareholders have certain approval and veto rights granting them joint control over the joint venture. The Group is ultimately responsible for the funding of the operations of Vodacom Congo for the first three years pursuant to its shareholders agreement. Vodacom Congo's network was officially launched under the Vodacom brand in May 2002. Vodacom Congo is financing its roll-out in the Democratic Republic of the Congo with vendor and bridge financing and equity contributions and will ultimately seek to obtain non-recourse project finance.
Vodacom Congo is currently an equity method investee since EITF 96-16, Investors Accounting for an Investee when the Investor's have a Majority of the Voting Interest but the Minority Shareholder or Shareholders have certain Approval or Veto Rights ("EITF 96-16"), does not permit to consolidate an investment in which, among other things, the other shareholders have substantial participation rights, such as veto rights, etc. Also refer to Note 44 and Note 47.
In May 2003 the FASB issued Statement of Financial Accounting Standards No. 150, "Accounting for Certain Financial Instruments with Characteristics of both Liabilities and Equity" ("SFAS 150"). SFAS 150 modifies the accounting for certain financial instruments that, under previous guidance, issuers could account for as equity. The Statement requires that those instruments be classified as liabilities in statements of financial position.
SFAS 150 affects an issuer's accounting for three types of freestanding financial instruments, namely:
- •
- Mandatorily redeemable shares, which the issuing company is obligated to buy back in exchange for cash or other assets.
- •
- Financial instruments, other than outstanding shares, that do or may require the issuer to buy back some of its equity shares in exchange for cash or other assets.
- •
- An unconditional obligation that can be settled with equity shares, the monetary value of which is fixed, tied solely or predominantly to a variable such as a market index, or varies inversely with the value of the issuer's equity shares.
SFAS 150 does not apply to features embedded in financial instruments that are not derivatives in their entirety.
In addition to its requirements for the classification and measurement of financial instruments within its scope, SFAS 150 also requires disclosures about alternative ways of settling such instruments and the capital structure of entities, all of whose shares are mandatorily redeemable.
SFAS 150 is effective for financial instruments entered into or modified after May 31, 2003, and otherwise is effective at the beginning of the first interim period beginning after June 15, 2003. The Group fully adopted SFAS 150 on April 1, 2004 and is currently evaluating the impact on its results of operations and financial position.
F-190
49. New International Financial Reporting Standards Accounting Pronouncements
During December 2003, the International Accounting Standards Board ("IASB") issued the Improvements Project to current International Accounting Standards ("The Improvements Project"). The Improvements Project prescribes changes to the following Standards:
| IAS 1 | Presentation of Financial Statements | |
| IAS 2 | Inventory | |
| IAS 8 | Accounting Policies, Changes in Accounting Estimates and Errors | |
| IAS 10 | Events After Balance Sheet Date | |
| IAS 16 | Property, Plant and Equipment | |
| IAS 17 | Leases | |
| IAS 21 | The Effects of Changes in Foreign Exchange Rates | |
| IAS 24 | Related Party Disclosures | |
| IAS 27 | Consolidated and Separate Financial Statements | |
| IAS 28 | Accounting for Investments in Associates | |
| IAS 31 | Financial Reporting in Joint Ventures | |
| IAS 33 | Earnings per Share | |
| IAS 40 | Investment Property |
IAS 15—Information Reflecting the Effect of Changing Prices has been withdrawn. These changes are effective for annual periods commencing on or after January 1, 2005. Entities are required to adopt all changes to a current Standard at the same time, but can elect to adopt selective standards in different financial periods, provided that all Standards are adopted by the annual period commencing on or after January 1, 2005.
The Group is currently assessing the impact of the adoption of the Improvements Project, but has not quantified the impact of adopting the revisions to the current Standards.
During February 2004, the IASB issued IFRS 2—Share-based Payment ("IFRS 2"). IFRS 2 is effective for annual periods beginning on or after January 1, 2005. In terms of the standard, all share-based payment transactions must be recognized in the financial statements using a fair value measurement basis. An expense is recognized when the goods or services received are consumed. It requires the fair value of all equity instruments granted to be based on market prices, if available, and to take into account the terms and conditions upon which those instruments were granted. In the absence of market prices, fair value is estimated using valuation techniques to estimate what the price of those equity instruments would have been on measurement date in an arm's length transaction between knowledgeable, willing parties.
The Group has not completed its assessment of the possible impact that IFRS 2 will have on its results.
On March 31, 2004, the IASB issued IFRS 3—Business Combinations ("IFRS 3"), IAS 36—Impairment of Assets (revised) ("IAS 36") and IAS 38—Intangible Assets (revised) ("IAS 38"). IFRS 3 is effective for business combinations agreed to on or after March 31, 2004, and for previously recognized goodwill or negative goodwill. IFRS 3 requires all business combinations to be accounted for using the purchase method, and in applying this method, an acquirer must not recognize provisions for future losses or restructuring costs expected to be incurred, but rather record these as post-acquisition expenses. Intangibles acquired in a business combination must be recognized as a separate asset from goodwill if it meets the definition of an asset and can be measured reliably. All contingent liabilities acquired should be recorded at its fair value.
Goodwill acquired in a business combination must not be amortized, but tested for impairment on an annual basis. All negative goodwill recognized must be recorded immediately as a gain in the
F-191
income statement. Reversals of impairment losses are prohibited and additional guidance on measuring impairment is provided.
The Group is in the process of assessing the impact of IFRS 3, IAS 36 and IAS 38 on its results.
The IASB issued IFRS 4—Insurance Contracts ("IFRS 4"), on March 31, 2004. The Standard applies to all insurance contracts that an entity issues or to all reinsurance contracts that it holds. IFRS 4 is the first guidance by the IASB on the recognition, measurement and disclosure of insurance contracts. The Standard is effective for annual periods commencing on or after January 1, 2005. An insurer need not apply some aspects of the IFRS to comparative information that relates to annual periods beginning before January 1, 2005.
The Group has not completed its assessment of the possible impact that IFRS 4 will have on its results.
IFRS 5—Non-current Assets Held for Sale and Discontinued Operations ("IFRS 5") was issued on March 31, 2004 and replaces IAS 35—Discontinued Operations. IFRS 5 establishes a classification for non-current assets "held for sale" using the same criteria as those contained in FASB Statement 144—Accounting for the Impairment or Disposal of Long-Lived Assets. In general, to be classified as held for sale, an asset must be available for immediate sale in its present condition subject only to terms that are usual or customary for sales, the sale of the assets must be highly probable and the transfer must be expected to qualify for recognition as a completed sale within one year, with limited exceptions. Assets or disposal groups that are classified as held for sale are carried at the lower of carrying amount and fair value, less costs to sell. An entity is not allowed to depreciate an asset classified as held for sale or included in a disposal group held for sale.
IFRS 5 changes the timing of the classification as a discontinued operation. Under IFRS 5, an operation is classified as discontinued at the date the entity has actually disposed of the operation, or when the operation meets the criteria to be classified as held for sale. IFRS 5 is effective for annual periods commencing on or after January 1, 2005.
The Group has not completed its assessment of the possible impact that IFRS 5 will have on its results.
On March 31, 2004, the IASB issued the "macro hedging" amendment to IAS 39—Financial Instruments: Recognition and Measurement ("IAS 39"). The amendment enables fair value hedge accounting to be used more readily for a portfolio hedge of interest risk—a macro hedge—than under the version of IAS 39 that the IASB published in December 2003. The amendment is effective for annual periods commencing on or after January 1, 2005.
The Group is in the process of assessing the impact of the "macro hedging" amendment on its results.
F-192
REFERENCES
SPECIAL NOTE REGARDING FORWARD-LOOKING STATEMENTS
TABLE OF CONTENTS
PART I
- Item 1. Identity of Directors, Senior Management and Advisors
Item 2. Offer Statistics and Expected Timetable
Item 3. Key Information
SELECTED HISTORICAL CONSOLIDATED FINANCIAL AND OTHER DATA OF VODACOM GROUP
VODACOM GROUP
DIVIDENDS AND DIVIDEND POLICY
EXCHANGE RATES
RISK FACTORS
HISTORY AND DEVELOPMENT OF THE COMPANY
BUSINESS OVERVIEW
CAPITAL EXPENDITURES
REGULATION AND LICENSE REQUIREMENTS
ORGANIZATIONAL STRUCTURE
PROPERTY, PLANT AND EQUIPMENT
OPERATING RESULTS
LIQUIDITY AND CAPITAL RESOURCES
DIRECTORS AND SENIOR MANAGEMENT
COMPENSATION
BOARD PRACTICES
EMPLOYEES
SHARE OWNERSHIP
MAJOR SHAREHOLDERS
RELATED PARTY TRANSACTIONS
CONSOLIDATED FINANCIAL STATEMENTS AND OTHER FINANCIAL INFORMATION
SIGNIFICANT CHANGES
MEMORANDUM AND ARTICLES OF ASSOCIATION
EXCHANGE CONTROLS
TAXATION
DOCUMENTS ON DISPLAY
PART II
- Item 13. Defaults, Dividend Arrearages and Delinquencies
Item 14. Material Modifications to the Rights of Security Holders and Use of Proceeds
Item 15. Controls and Procedures
Item 16A. Audit Committee Financial Expert
Item 16B. Code of Ethics
Item 16C. Principal Accountant Fees and Services
Item 16D. Exemptions From the Listing Standards for Audit Committees
Item 16E. Purchases of Equity Securities by the Issuer and Affiliated Purchasers.
SIGNATURES
Telkom SA Limited Content to annual financial statements For the year ended March 31, 2004
Report of the independent auditors
Consolidated Income Statement For the three years ended March 31, 2004
Consolidated Balance Sheet at March 31, 2004
Consolidated statement of changes in equity For the three years ended March 31, 2004
Consolidated cash flow statement For the three years ended March 31, 2004
Notes to the consolidated annual financial statements for the three years ended March 31, 2004
VODACOM GROUP (PROPRIETARY) LIMITED REGISTRATION NO. 1993/005461/07 CONSOLIDATED ANNUAL FINANCIAL STATEMENTS FOR THE THREE YEARS ENDED MARCH 31, 2004
CONTENT
REPORT OF THE INDEPENDENT AUDITORS AND INDEPENDENT REGISTERED PUBLIC ACCOUNTING FIRM
VODACOM GROUP (PROPRIETARY) LIMITED CONSOLIDATED INCOME STATEMENTS FOR THE THREE YEARS ENDED MARCH 31, 2004
VODACOM GROUP (PROPRIETARY) LIMITED CONSOLIDATED BALANCE SHEETS AS AT MARCH 31, 2004
VODACOM GROUP (PROPRIETARY) LIMITED CONSOLIDATED STATEMENTS OF CHANGES IN EQUITY FOR THE THREE YEARS ENDED MARCH 31, 2004
VODACOM GROUP (PROPRIETARY) LIMITED CONSOLIDATED CASH FLOW STATEMENTS FOR THE THREE YEARS ENDED MARCH 31, 2004
VODACOM GROUP (PROPRIETARY) LIMITED NOTES TO THE CONSOLIDATED FINANCIAL STATEMENTS MARCH 31, 2004