SUBJECT TO COMPLETION, DATED JANUARY 30, 2003
Telkom SA Limited
incorporated in the Republic of South Africa
Registration number 1991/005476/06
139,257,954 Ordinary Shares
offered in the form of Ordinary Shares or American Depositary Shares, or ADSs, each representing 4 Ordinary Shares
This is an initial public offering of ordinary shares, having a par value of R10 each in the capital of Telkom SA Limited, by the
Government of the Republic of South Africa. This global offering is expected to be 139,257,954 ordinary shares, but may be
increased to up to 167,109,546 ordinary shares. The global offering is being made in the United States and the Republic of South
Africa and to institutional investors outside of those jurisdictions. 48,740,284 of the ordinary shares offered in the global offering
are being registered under the US Securities Act of 1933 for initial offer and sale in the United States and for any resales into the
United States. Initial offers and sales outside the United States are not being registered
under the US Securities Act of 1933
.
We currently estimate that the initial public offering price will be:
between R33.50 and R40.90 per ordinary share; and
between $15.30 and $18.70 per ADS, based on an exchange rate of R8.77 per $1.00, rounded up to the nearest 10 US Cents.
All of the ordinary shares to be sold in the global offering are being offered by the Government of the Republic of South Africa. We
will not receive any of the proceeds from the sale of the ordinary shares in the global offering.
Prior to this global offering, there has been no public market for the ordinary shares or ADSs. The JSE Securities Exchange, South
Africa has agreed to list all the ordinary shares in the "Telecommunications Services" sector of the list of the JSE Securities
Exchange, South Africa under the symbol "TKG" and ISIN Code "ZAE000044897," subject to the attainment of a spread of
shareholders acceptable to the JSE Securities Exchange, South Africa and the submission of all supporting documents required by
the JSE Securities Exchange, South Africa. Telkom has applied to list the ADSs on the New York Stock Exchange under the symbol
"TKG." Please see page 161 of this prospectus for a description of the views of the JSE Securities Exchange, South Africa on
the creation of the class A ordinary share and class B ordinary share in the share capital of Telkom on the JSE Securities
Exchange, South Africa listing date and the rights afforded to the holders thereof.
Investing in Telkom's ordinary shares and ADSs involves risks. See "Risk Factors" beginning on page 14 of this prospectus.
Underwriting
Proceeds to the
Discounts and
Government of the
Price to Public
Commissions
(1)
Republic of South Africa
Per ordinary share . . . . . . . . . . . . . . .
R
R
R
Per ADS . . . . . . . . . . . . . . . . . . . . .
$
$
$
Total
(2)
. . . . . . . . . . . . . . . . . . . . .
$
$
$
(1)
Underwriting discounts and commissions do not include fees of up to 0.45% of the total proceeds of the global offering that
may be payable at the discretion of the Government of the Republic of South Africa.
(2)
Assumes that all ordinary shares are sold in the form of ADSs.
The Government of the Republic of South Africa intends to grant the joint global coordinators, on behalf of the underwriters,
a 30-day option to purchase up to a maximum of 20,888,693 additional ordinary shares on the same terms and conditions set forth
above solely to cover over-allotments, if any.
Neither the US Securities and Exchange Commission, the South African Registrar of Companies, the JSE nor any other
regulatory body has approved or disapproved of these securities or passed on the adequacy or accuracy of this prospectus as
truthful or complete. Any representation to the contrary is a criminal offense.
This prospectus does not constitute an offer for sale of ordinary shares or ADSs in the Republic of South Africa and may
not be distributed in South Africa.
The underwriters expect to deliver the ordinary shares and ADSs on or about March 7, 2003.
Deutsche Bank Securities
JPMorgan
Prospectus dated
, 2003
The information in this prospectus is not complete and may be changed. We and the Government of the Republic of South Africa may not sell these securities until the registration statement filed with
Securities and Exchange Commission is effective.
This prospectus is not an offer to sell these securities and it is not soliciting an offer to buy these securities in any jurisdiction where the offer or
sale is not permitted.
Filed pursuant to Rule 424(a)
under the Securities Act of 1933
Registration No. 333-102834
You should rely only on the information contained in this prospectus. We and the Government of the Republic of South Africa
have not authorized anyone to provide you with different information. We and the Government of the Republic of South Africa are
not offering to sell or soliciting offers to buy the ordinary shares or ADSs in places where such offers and sales are not permitted by
applicable law. You should not assume that the information in this prospectus is accurate as of any date other than the date on the
front of this prospectus.
TABLE OF CONTENTS
Page
Prospectus Summary . . . . . . . . . . . . . . . . . . . . . . . . . . . . . . . . . . . . . . . . . . . . . . . . . . . . . . . .
1
Risk Factors . . . . . . . . . . . . . . . . . . . . . . . . . . . . . . . . . . . . . . . . . . . . . . . . . . . . . . . . . . . .
14
Special Note Regarding Forward-Looking Statements . . . . . . . . . . . . . . . . . . . . . . . . . . . . . . . . . . . . . .
22
Use of Proceeds . . . . . . . . . . . . . . . . . . . . . . . . . . . . . . . . . . . . . . . . . . . . . . . . . . . . . . . . . .
23
Dividends and Dividend Policy . . . . . . . . . . . . . . . . . . . . . . . . . . . . . . . . . . . . . . . . . . . . . . . . . .
24
Exchange Rates . . . . . . . . . . . . . . . . . . . . . . . . . . . . . . . . . . . . . . . . . . . . . . . . . . . . . . . . . .
26
Capitalization . . . . . . . . . . . . . . . . . . . . . . . . . . . . . . . . . . . . . . . . . . . . . . . . . . . . . . . . . . . .
27
Selected Historical Consolidated Financial and Other Data of the Telkom Group . . . . . . . . . . . . . . . . . . . . . . . .
28
Management's Discussion and Analysis of Financial Condition and Results of Operations . . . . . . . . . . . . . . . . . . .
34
The South African Telecommunications Industry . . . . . . . . . . . . . . . . . . . . . . . . . . . . . . . . . . . . . . . . .
89
Business . . . . . . . . . . . . . . . . . . . . . . . . . . . . . . . . . . . . . . . . . . . . . . . . . . . . . . . . . . . . . .
92
Legal Proceedings . . . . . . . . . . . . . . . . . . . . . . . . . . . . . . . . . . . . . . . . . . . . . . . . . . . . . . . . .
122
Regulation and License Requirements . . . . . . . . . . . . . . . . . . . . . . . . . . . . . . . . . . . . . . . . . . . . . . .
123
Management . . . . . . . . . . . . . . . . . . . . . . . . . . . . . . . . . . . . . . . . . . . . . . . . . . . . . . . . . . . .
132
Relationship with Major Shareholders and Related Transactions . . . . . . . . . . . . . . . . . . . . . . . . . . . . . . . . .
145
Relationship with Vodacom and Related Transactions . . . . . . . . . . . . . . . . . . . . . . . . . . . . . . . . . . . . . .
152
Description of Shares . . . . . . . . . . . . . . . . . . . . . . . . . . . . . . . . . . . . . . . . . . . . . . . . . . . . . . .
154
Description of American Depositary Receipts . . . . . . . . . . . . . . . . . . . . . . . . . . . . . . . . . . . . . . . . . . .
167
Nature of the South African Trading Market . . . . . . . . . . . . . . . . . . . . . . . . . . . . . . . . . . . . . . . . . . .
172
Taxation . . . . . . . . . . . . . . . . . . . . . . . . . . . . . . . . . . . . . . . . . . . . . . . . . . . . . . . . . . . . . .
173
Exchange Controls . . . . . . . . . . . . . . . . . . . . . . . . . . . . . . . . . . . . . . . . . . . . . . . . . . . . . . . . .
179
The Global Offering . . . . . . . . . . . . . . . . . . . . . . . . . . . . . . . . . . . . . . . . . . . . . . . . . . . . . . . .
182
Underwriting . . . . . . . . . . . . . . . . . . . . . . . . . . . . . . . . . . . . . . . . . . . . . . . . . . . . . . . . . . . .
187
Legal Matters . . . . . . . . . . . . . . . . . . . . . . . . . . . . . . . . . . . . . . . . . . . . . . . . . . . . . . . . . . . .
190
Experts . . . . . . . . . . . . . . . . . . . . . . . . . . . . . . . . . . . . . . . . . . . . . . . . . . . . . . . . . . . . . . .
191
Expenses Relating to the Global Offering . . . . . . . . . . . . . . . . . . . . . . . . . . . . . . . . . . . . . . . . . . . . .
192
Enforcement of Civil Liabilities . . . . . . . . . . . . . . . . . . . . . . . . . . . . . . . . . . . . . . . . . . . . . . . . . .
193
Where You Can Find More Information . . . . . . . . . . . . . . . . . . . . . . . . . . . . . . . . . . . . . . . . . . . . . .
194
Documents Available for Inspection . . . . . . . . . . . . . . . . . . . . . . . . . . . . . . . . . . . . . . . . . . . . . . . .
195
Additional Information . . . . . . . . . . . . . . . . . . . . . . . . . . . . . . . . . . . . . . . . . . . . . . . . . . . . . . .
196
Index to Financial Statements . . . . . . . . . . . . . . . . . . . . . . . . . . . . . . . . . . . . . . . . . . . . . . . . . . .
F-1
Republic of South Africa . . . . . . . . . . . . . . . . . . . . . . . . . . . . . . . . . . . . . . . . . . . . . . . . . . . . . . A-1
Extracts from Telkom's new memorandum and articles of association . . . . . . . . . . . . . . . . . . . . . . . . . . . . . . B1
ii
1
PROSPECTUS SUMMARY
Overview
Telkom is one of the largest companies registered in the Republic of South Africa and we are the largest communications
services provider on the African continent based on operating revenue and assets. We had consolidated operating revenue of
R34.2 billion ($3.2 billion), net profit of R1.2 billion ($116 million) and cash flow from operating activities of R8.2 billion
($775 million) in the year ended March 31, 2002 and we had total assets of R55.2 billion ($5.2 billion) and shareholders' equity of
R16.8 billion ($1.6 billion) as of March 31, 2002. We had consolidated operating revenue of R18.3 billion ($1.7 billion), net profit
of R0.6 billion ($61 million) and cash flow from operating activities of R3.5 billion ($328 million) in the six months ended
September 30, 2002 and we had total assets of R54.6 billion ($5.2 billion) and shareholders' equity of R17.5 billion ($1.7 billion)
as of September 30, 2002.
We offer business, residential and payphone customers a wide range of services and products, including:
fixed-line voice services, including subscriptions and connections services, local, long distance, fixed-to-mobile and
international voice services, interconnection and transit communications services, value-added voice services, customer
premises equipment sales and directory services;
fixed-line data services, including domestic and international data transmission services, such as leased lines and packet-
based services, managed data networking services and internet access and related information technology services; and
mobile communications services, including voice and data services, value-added services and handset sales through our joint
venture, Vodacom, a company incorporated in the Republic of South Africa.
We had the exclusive right to provide public switched telecommunications services, including international voice services, in
South Africa until May 7, 2002. We are currently the only national provider of these services in South Africa, although a process
has been commenced to liberalize the South African communications market, which will introduce competition in a number of our
business areas. In 1997, we embarked on an extensive five year capital investment program in our fixed-line business. Our fixed-line
capital investment for the five years ended March 31, 2002 was R41.7 billion ($4.0 billion), of which R27.9 billion ($2.6 billion)
was for network modernization and line roll-out in order to comply with our license obligations and prepare for competition.
As of September 30, 2002, we had 4.9 million telephone access lines in service and 99.8% of our telephone access lines were
connected to digital exchanges.
Vodacom is our mobile communications joint venture with Vodafone Group Plc, a company incorporated in England and Wales,
and VenFin Limited, a company incorporated in the Republic of South Africa. Vodacom is the largest mobile communications
network operator in South Africa with a market share of approximately 59% as of September 30, 2002 based on total reported
customers. Vodacom had 7.7 million customers as of September 30, 2002, of which 7.1 million were in South Africa. Vodacom has
investments in mobile communications network operators in Lesotho, Tanzania and the Democratic Republic of the Congo and in
an entity that, in August 2002, was granted a license to operate a mobile communications network in Mozambique. Vodacom had
consolidated revenue of R16.2 billion ($1.5 billion), net profit of R2.4 billion ($225 million) and cash flow from operating activities
of R3.8 billion ($362 million) in the year ended March 31, 2002 and total assets of R15.4 billion ($1.5 billion) and shareholders'
equity of R5.5 billion ($518 million) as of March 31, 2002. Vodacom had consolidated revenue of R9.4 billion ($895 million), net
profit of R0.9 billion ($87 million) and cash flow from operating activities of R1.6 billion ($155 million) in the six months ended
September 30, 2002 and total assets of R17.3 billion ($1.6 billion) and shareholders' equity of R6.3 billion ($601 million) as of
September 30, 2002.
We believe that we have a number of competitive strengths that will enable us to increase our profitability and cash flow and
successfully meet competition. Our competitive strengths include our leading market position in the South African fixed-line
communications market, our state-of-the-art, fully digital fixed-line network and the financial, operational and managerial expertise
of our strategic equity investor, Thintana Communications LLC, a Delaware limited liability company, which is 60% beneficially
owned by SBC Communications, Inc., a Delaware corporation, and 40% beneficially owned by Telekom Malaysia S.D.N. Berhard,
a company incorporated in Malaysia. In addition, Vodacom is the leading South African mobile communications network operator
with strong brand recognition, extensive network coverage and distribution channels, experienced local and international
shareholders and management and Vodacom is expanding its operations in other select sub-Saharan Africa countries.
Our group strategy
Our group strategic goals are to increase shareholder value by increasing profitability and cash flows, while maintaining our
market leadership in the South African fixed-line and mobile communications markets. We also intend to support Vodacom's
strategy of establishing and maintaining leading positions in other sub-Saharan African mobile markets. In addition, we will seek to
increase the synergies between our fixed-line business and Vodacom.
In order to achieve our goals, we intend to pursue the following strategies:
compete effectively in our core fixed-line markets and grow selected markets;
continue to reduce operating expenses and enhance capital investment efficiencies in our fixed-line business;
2
expand our integrated service offerings through the increased sale of existing data products and the development of new data
and fixed-mobile products;
continue to invest in our fixed-line employees to foster a highly competitive corporate culture and to enhance skills retention;
and
capitalize on the growing mobile communications market through Vodacom.
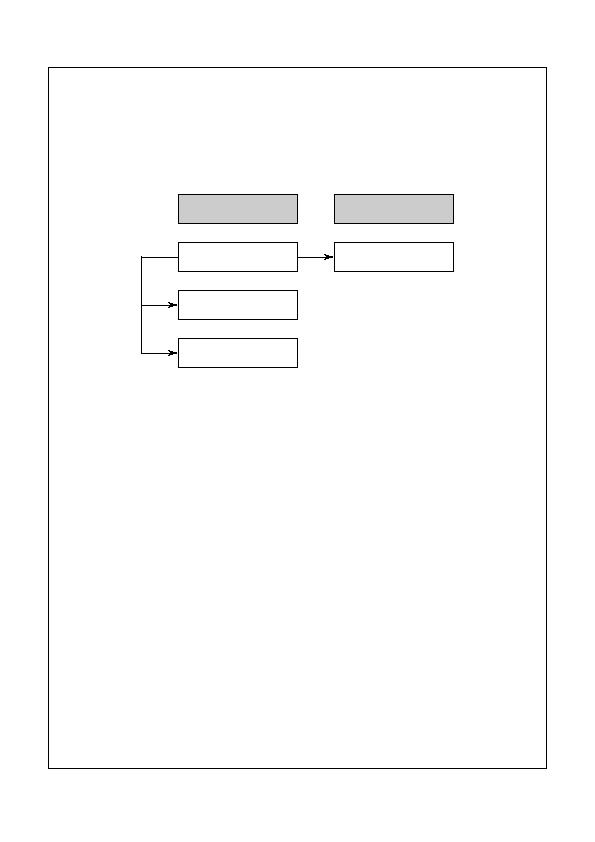
Group operational structure
Our business segments and group operational structure are as follows:
History
Telkom was incorporated on September 30, 1991 as a public limited liability company registered under the South African
Companies Act, 61 of 1973, as amended. On that same date, the Government of the Republic of South Africa transferred the
entire telecommunications enterprise of the then Department of Posts and Telecommunications of the Republic of South Africa
to Telkom. Telkom remained a wholly state-owned enterprise until May 14, 1997, when the Government sold a 30% equity interest
in Telkom to Thintana Communications as part of its policy to liberalize the telecommunications market in South Africa. On March
30, 2001, the Government sold another 3% equity interest in Telkom from its holdings to Ucingo Investments (Proprietary) Limited,
a company incorporated in the Republic of South Africa comprising a consortium of black empowerment investors, leaving the
Government with 67% of Telkom's issued and outstanding ordinary share capital.
As part of the sale to Thintana Communications, the then Minister of Posts, Telecommunications and Broadcasting of the
Republic of South Africa entered into an agreement with Thintana Communications under which Thintana Communications
undertook significant operational and managerial responsibilities and acquired the ability to exercise effective operational and
managerial control over us until May 2002. Since May 2002, our strategic equity investors no longer exercise effective operational
and managerial control over us, but they continue to provide us with strategic direction as their nominees continue to occupy key
managerial positions and participate in Telkom's operating committee.
Upon completion of the global offering, the Government of the Republic of South Africa will own approximately 42% of
Telkom's issued and outstanding ordinary share capital, or approximately 38% if the underwriters exercise their over-allotment
option in full, and Thintana Communications will own approximately 30% of Telkom's issued and outstanding ordinary share
capital.
Telkom's registration number is 1991/005476/06. Telkom's principal executive offices are located at Telkom Towers North,
152 Proes Street, Pretoria 0002, Gauteng Province, South Africa. Telkom's telephone number is (27) (12) 321 5808 and
its internet address is www.telkom.co.za. Information contained on Telkom's website is not a part of this prospectus.
Unless the context requires otherwise, references to "we," "us," "our" and the "Telkom Group" in this prospectus refer to
Telkom SA Limited and its subsidiaries and its 50% interest in Vodacom, and references to "Telkom" in this prospectus refer only
to Telkom SA Limited. References to "Vodacom" in this prospectus refer to Telkom's 50% owned joint venture, Vodacom Group
(Proprietary) Limited, and its subsidiaries. We do not control Vodacom, the management of which requires consensus agreement
among its shareholders who are party to Vodacom's joint venture agreement.
Fixed-line
Mobile
Telkom SA Limited
Telkom Directory Services
(Proprietary) Limited
Swiftnet (Proprietary)
Limited
Vodacom Group
(Proprietary) Limited
64.9%
100.0%
50.0%
3
The Global Offering
The Global Offering
A global offering of 139,257,954 ordinary shares by the Government of the Republic of
South Africa in the US and International offerings and the South African retail offering. The
global offering may be increased to up to 167,109,546 ordinary shares in certain
circumstances. 48,740,284 of the ordinary shares offered in the global offering are being
registered under the US Securities Act of 1933 for initial offer and sale in the United States
and for any resales into the United States. Offers and sales of ordinary shares and ADSs
outside the United States, including all ordinary shares and ADSs offered to South African
retail and institutional investors, are being offered pursuant to Regulation S under the US
Securities Act of 1933 and are not covered by the registration statement filed with the US
Securities and Exchange Commission.
US and International Offerings
Made to retail and institutional investors in the United States and to institutional investors
outside of the United States, including institutional investors in the Republic of South
Africa, in the form of ordinary shares or ADSs.
South African Retail Offering
Made to individuals in possession of a valid South African identity number and who
provide a South African postal address and groups of such individuals, known as stokvels,
at a 20% discount to the initial public offering price, rounded down to the nearest SA
Cent, for up to R5,000 of ordinary shares per individual and up to R5,000 of ordinary
shares per member of a stokvel, subject to a maximum of R50,000 of ordinary shares per
stokvel, in the form of ordinary shares. This offering is referred to as the Khulisa offer.
Ordinary shares purchased in this offering may not be sold for three months following the
date of the listing of the shares on the JSE. The Government of the Republic of South
Africa will also award investors under this offer one ordinary share for every five ordinary
shares purchased and held in trust until the second anniversary of the JSE listing date.
Made to individuals in possession of a valid South African identity number and who provide
a South African postal address at a 5% discount to the initial public offering price, rounded
down to the nearest SA Cent, in the form of ordinary shares.
See "The Global Offering" beginning on page 182 of this prospectus.
Offering Price
Between R33.50
and R40.90
per ordinary share. This is equivalent to between $15.30 and
$18.70
per ADS at a ratio of 4 ordinary shares per ADS and an exchange rate of R8.77 per
$1.00, rounded up to the nearest 10 U.S. Cents. The initial public offering price may be outside
one or both of the price range indications referred to above. Ordinary shares sold in the South
be at the discounts set out above. The initial public offering price will be inclusive of
African retail offering will be at the discounts set out above. The public offering price will be .
inclusive of uncertified securities tax.
Over-Allotment Option
The Government of the Republic of South Africa intends to grant the joint global
co-ordinators, on behalf of the underwriters, a 30-day option to purchase up to a maximum
of 20,888,693 additional ordinary shares on the same terms and conditions set forth above
solely to cover over-allotments, if any.
Ownership of Controlling
Following the completion of this global offering, Telkom's controlling shareholders will
Shareholders following the
own the following shares:
Global Offering
The Government will own the one issued and outstanding class A ordinary share and
approximately 42% of Telkom's issued and outstanding ordinary share capital, or
approximately 38% if the underwriters exercise their over-allotment option in full.
Thintana Communications will own the one issued and outstanding class B ordinary share
and approximately 30% of Telkom's issued and outstanding ordinary share capital.
See "Description of Shares" beginning on page 154 of this prospectus for a description of
the rights attaching to the class A ordinary share and the class B ordinary share.
In connection with the global offering, the Government of the Republic of South Africa
intends to grant to eligible current and former employees of Telkom, options to purchase up
to 11,140,636 of its ordinary shares, representing 2% of Telkom's issued and outstanding
ordinary share capital, through the Diabo Share Trust established for that purpose at R33.81
per share, which is the price at which Thintana Communications invested in Telkom in
1997. See "Management Other employee share ownership arrangements" beginning on
page 141 of this prospectus.
In addition, the Government and Ucingo Investments are currently in discussions which may
or may not lead to a lock-up agreement with Ucingo Investments or possible repurchase by
the Government of Ucingo Investments' 3% stake in Telkom at the time of the global offering.
If this repurchase takes place, the Government may, in its sole discretion increase the expected
size of the offering by up to 3% and use the net proceeds from the sale of these shares to fund
the repurchase of the Ucingo Investments' stake. The Government will own approximately
45% of Telkom's issued and outstanding ordinary share capital, or approximately 41% if the
underwriters exercise their over-allotment option in full, following the completion of the
global offering if the Ucingo Investments repurchase occurs and the Government does not
increase the size of the global offering.
4
Information in this prospectus related to the size of the global offering and the ownership of
ordinary shares by the Government of the Republic of South Africa does not include any
sale of ordinary shares through the Diabo Share Trust for the benefit of former and current
employees described above.
Information in this prospectus, unless otherwise stated, does not reflect any repurchase or
sale by the Government of Ucingo Investments' stake in Telkom and assumes a global
offering size of 139,257,954 ordinary shares and the exercise of an over-allotment option of
20,888,693 ordinary shares.
Voting Rights
The ordinary shares will generally vote together as a single class with the class A ordinary
share held by the Government of the Republic of South Africa and the class B ordinary
share held by Thintana Communications, except as required by law and as provided for by
Telkom's new memorandum and articles of association. However, certain actions cannot be
taken by Telkom or by its subsidiaries without the authorization of representatives appointed
by the Government of the Republic of South Africa and Thintana Communications, as
significant shareholders, respectively. See "Management Reserved matters" beginning on
page 137 of this prospectus and "Relationship with Major Shareholders and Related
Transactions Shareholder arrangements New shareholders' agreement" beginning on
page 145 of this prospectus.
American Depositary Shares
Investors outside of South Africa may purchase ordinary shares in the form of ADSs.
Each ADS represents 4 ordinary shares and is evidenced by an American Depositary
Receipt, or ADR.
The ADS depositary is The Bank of New York.
Use of Proceeds
We will not receive any proceeds from the sale of ordinary shares or ADSs in the global offering.
Listings
The JSE has agreed to list the ordinary shares in the "Telecommunications Services" sector
of the JSE list under the symbol "TKG," subject to the attainment of a spread of
shareholders acceptable to the JSE and the submission of all supporting documents required
by the JSE. Telkom has applied to list the ADSs on the New York Stock Exchange under the
symbol "TKG."
Lock-Up Agreements
Telkom, Thintana Communications and the Government of the Republic of South Africa
intend to agree with the underwriters that none of them will sell additional Telkom ordinary
shares for 180 days following the date of the underwriting agreement, subject to certain
exceptions. In addition, the Government has agreed with Thintana Communications that the
Government will not sell its Telkom ordinary shares for a further 545-day period after the
expiration of the lock-up period described above. For a further description of the lock-up and
its exceptions, see "Underwriting" beginning on page 187 of this prospectus. As of the date
of this prospectus, Ucingo Investments has not agreed to a lock-up of its ordinary shares.
Expected Timetable
We expect the timetable for the global offering to be as follows:
January 30, 2003: South African retail offering opens and US and international offerings
commence.
March 4, 2003: Announcement of the initial public offering price and commencement
of conditional trading of the ordinary shares on the JSE and trading of the ADSs on the New
York Stock Exchange.
March 4, 2003: Payment and delivery of ordinary shares and ADSs in the US and
International Offerings.
March 11, 2003: Dispatch of shareholder statements in the South African retail offering.
Payment and Settlement
Delivery of the ordinary shares and ADSs in the US and International Offerings is expected
to take place against payment therefor in immediately available funds on or about March
28, 2003. As described in "The Global Offering" beginning on page 182 of this prospectus,
investors in the South African retail offering will have to make payment prior to this date.
The ordinary shares will be delivered in dematerialized or electronic entry form through the
facilities of Share Transactions Totally Electronic Limited, or STRATE. The ADSs will be
delivered in book entry form through the facilities of The Depository Trust Company.
The identification numbers for the ordinary shares and the ADSs are:
Ordinary shares
ISIN: ZAE000044897
ADSs
CUSIP: 879603108
ISIN and CUSIP are codes which uniquely identify a particular securities issue.
Risk Factors
For a discussion of certain factors that should be considered in evaluating an investment in
Telkom's ordinary shares or ADSs, see "Risk Factors" beginning on page 14 of this
prospectus.
5
SUMMARY HISTORICAL CONSOLIDATED FINANCIAL
AND OTHER DATA OF THE TELKOM GROUP
The following table sets forth summary consolidated financial and other data of the Telkom Group as of and for each of the
three years in the period ended March 31, 2002 and as of and for each of the six month periods ended September 30, 2002 and
2001. Information in the following table includes our 50% interest in the results, assets, liabilities and shareholders' equity of
Vodacom, which we proportionately consolidate.
The following summary historical consolidated financial data of the Telkom Group as of and for each of the three years ended
March 31, 2002 was derived from the Telkom Group's historical consolidated financial statements beginning on page F48 of this
prospectus, which have been audited by Ernst & Young, Registered Accountants and Auditors, Chartered Accountants (SA).
The following summary historical consolidated financial data of the Telkom Group as of September 30, 2002 and for each of the six
month periods ended September 30, 2002 and 2001 was derived from the Telkom Group's unaudited condensed consolidated financial
statements beginning on page F2 of this prospectus, which, in the opinion of our management, have been prepared on the same basis
as the Telkom Group's audited consolidated financial statements and reflect all adjustments, consisting of normal recurring
adjustments, necessary for a fair presentation of the Telkom Group's results of operations and financial position for such periods.
Results for the six month periods ended September 30, 2002 and 2001 are not necessarily indicative of results that may be expected for
the entire year.
The consolidated financial statements of the Telkom Group have been prepared in accordance with International Accounting
Standards, or IAS, which differs in certain respects from US Generally Accepted Accounting Principles, or US GAAP. For a
description of the principal differences between IAS and US GAAP relevant to the consolidated financial statements of the Telkom
Group and a reconciliation to US GAAP of net income and profit and shareholders' equity, see note 41 of the notes to the audited
consolidated financial statements of the Telkom Group as of and for the three years ended March 31, 2002 beginning on page F97 of
this prospectus and note 21 of the notes to the unaudited condensed consolidated financial statements of the Telkom Group as of
September 30, 2002 and for each of the six month periods ended September 30, 2002 and 2001 beginning on page F15 of this
prospectus.
Headline earnings per share is a disclosure requirement of the JSE and is not a recognized measure under US GAAP. Headline
earnings represents net profit, excluding profit on the disposal of property, plant and equipment; profit on the disposal of
subsidiaries and joint ventures; property, plant and equipment impairment losses; goodwill amortization; and tax and minority
interest impacts. EBITDA represents operating profit before income tax, finance charges, investment income and depreciation and
amortization. We believe that EBITDA provides meaningful additional information to investors since it is widely accepted by
analysts and investors as a basis for comparing a company's underlying operating profitability with that of other companies as it is
not influenced by past capital expenditures or business acquisitions, a company's capital structure or the relevant tax regime. This is
particularly the case in a capital-intensive industry such as communications. It is also a widely accepted indicator of a company's
ability to service its long-term debt and other fixed obligations and to fund its continued growth. EBITDA is not a US GAAP or
IAS measure. You should not construe EBITDA as an alternative to operating profit or cash flows from operating activities
determined in accordance with US GAAP or IAS or as a measure of liquidity. EBITDA is not defined in the same manner by all
companies and may not be comparable to other similarly titled measures of other companies unless the definition is the same. In
addition, because the calculation of EBITDA in the maintenance covenants contained in our credit facilities is based on accounting
policies in use at the time the indebtedness was incurred, EBITDA for purposes of those covenants is not calculated in the same
manner as it is calculated in the following table.
Fixed access lines are comprised of public switched telecommunications network lines, or PSTN lines, including integrated
services digital network, or ISDN, channels, public and private payphones and internal lines in service. We calculate fixed-line
penetration, or teledensity, based on the total number of telephone lines in service at the end of the period per 100 persons in the
population of South Africa. Population is the estimated South African population at the mid year in the periods indicated as
published by Statistics South Africa, a South African governmental department. We calculate fixed-line traffic, other than
international outgoing mobile traffic and international interconnection traffic, by dividing traffic revenues for the particular category
by the weighted average tariff for such category during the relevant period. Fixed-line international outgoing mobile traffic and
international interconnection traffic are based on the actual traffic registered through the respective exchanges and reflected in
international interconnection invoices. We calculate revenue per fixed access line by dividing total fixed-line revenue during the
period, excluding data and directories and other revenue, by the average number of fixed lines during the period. We calculate our
number of fixed lines per fixed-line employee on the basis of fixed lines in service at period end divided by the number of
employees in our fixed-line segment at period end, excluding employees from our two subsidiaries, Telkom Directory Services and
Swiftnet, which do not provide public switched telecommunications services.
6
Rand amounts as of and for the year ended March 31, 2002 and as of and for the six months ended September 30, 2002 have
been translated into Dollars solely for your convenience at R10.54 per $1.00, the Rand noon buying rate discussed in "Exchange
Rates" on page 26 of this prospectus on September 30, 2002, the date of the Telkom Group's most recent consolidated balance
sheet included in this prospectus. These translations should not be construed as representations that the Rand amounts could
actually be converted into US dollars at these rates or at all.
You should read the following information together with "Risk Factors" beginning on page 14, "Capitalization" on page 27,
"Selected Historical Consolidated Financial and Other Data of the Telkom Group" beginning on page 28, "Management's
Discussion and Analysis of Financial Condition and Results of Operations" beginning on page 34 and the consolidated financial
statements and the notes thereto of the Telkom Group and Vodacom beginning on page F2 of this prospectus.

7
THE TELKOM GROUP
Summary Income Statement Data
Six months ended
Year ended March 31,
September 30,
2000
2001
2002
2002
2001
2002
2002
ZAR
ZAR
ZAR
USD
ZAR
ZAR
USD
Amounts in accordance with IAS
(unaudited)
(in millions, except per share amounts)
Operating revenue . . . . . . . . . . . . . . . .
27,113
31,352
34,197
3,244
16,523
18,316
1,738
Employee expenses
1
. . . . . . . . . . . . . . .
7,713
6,590
7,166
680
3,590
3,707
352
Payments to other operators . . . . . . . . . . .
4,241
4,983
5,762
547
2,654
3,105
294
Selling, general and administrative
2
. . . . . . .
5,324
6,971
8,237
781
3,794
3,795
360
Services rendered . . . . . . . . . . . . . . . .
1,439
1,539
2,194
208
1,091
1,108
105
Operating leases . . . . . . . . . . . . . . . . .
340
1,292
1,217
115
583
684
65
Depreciation and amortization . . . . . . . . .
4,174
5,052
5,408
513
2,643
3,106
295
Operating expenses . . . . . . . . . . . . . . . .
23,231
26,427
29,984
2,844
14,355
15,505
1,471
Operating profit . . . . . . . . . . . . . . . . . .
3,882
4,925
4,213
400
2,168
2,811
267
Investment income . . . . . . . . . . . . . . . .
641
617
490
46
306
152
14
Finance charges . . . . . . . . . . . . . . . . .
(2,482)
(3,137)
(2,550)
(242)
(1,845)
(1,779)
(169)
Profit before tax . . . . . . . . . . . . . . . . . .
2,041
2,405
2,153
204
629
1,184
112
Taxation . . . . . . . . . . . . . . . . . . . . .
(501)
(715)
(873)
(83)
(206)
(456)
(43)
Profit after tax . . . . . . . . . . . . . . . . . . .
1,540
1,690
1,280
121
423
728
69
Minority interests . . . . . . . . . . . . . . . .
(13)
(68)
(59)
(5)
(52)
(84)
(8)
Net profit . . . . . . . . . . . . . . . . . . . . .
1,527
1,622
1,221
116
371
644
61
Number of ordinary shares outstanding (millions)
Basic . . . . . . . . . . . . . . . . . . . . . . .
557
557
557
557
557
557
557
Diluted . . . . . . . . . . . . . . . . . . . . . .
557
557
557
557
557
557
557
Earnings per share (cents)
Basic . . . . . . . . . . . . . . . . . . . . . . .
274.1
291.2
219.2
20.8
66.6
115.6
11.0
Diluted . . . . . . . . . . . . . . . . . . . . . .
274.1
291.2
219.2
20.8
66.6
115.6
11.0
Dividends per share (cents) . . . . . . . . . . .
59.6 - - - - - -
Amounts in accordance with US GAAP
Net revenue . . . . . . . . . . . . . . . . . . . . .
n/a
26,413
27,947
2,653
13,657
14,605
1,386
Operating income . . . . . . . . . . . . . . . . .
n/a
3,716
2,498
237
1,711
2,219
211
Net income . . . . . . . . . . . . . . . . . . . . .
n/a
1,598
1,317
125
481
757
73
Earnings per share (cents)
Basic . . . . . . . . . . . . . . . . . . . . . . .
n/a
286.9
236.5
22.4
86.4
135.9
12.9
Diluted . . . . . . . . . . . . . . . . . . . . . .
n/a
286.9
236.5
22.4
86.4
135.9
12.9

8
Summary Balance Sheet Data
As of
As of March 31,
September 30,
2000
2001
2002
2002
2002
2002
ZAR
ZAR
ZAR
USD
ZAR
USD
Amounts in accordance with IAS
(unaudited)
(in millions, except per share amounts)
Total assets . . . . . . . . . . . . . . . . . . . . .
47,276
53,537
55,208
5,238
54,581
5,178
Current assets . . . . . . . . . . . . . . . . . . . .
11,010
12,674
10,968
1,041
11,195
1,062
Cash and cash equivalents . . . . . . . . . . . .
1,953
1,801
724
69
1,085
103
Other current assets . . . . . . . . . . . . . . .
9,057
10,873
10,244
972
10,110
959
Non-current assets . . . . . . . . . . . . . . . . .
36,266
40,863
44,240
4,197
43,386
4,116
Total liabilities
3
. . . . . . . . . . . . . . . . . .
33,879
38,449
38,243
3,628
36,892
3,500
Current liabilities . . . . . . . . . . . . . . . . . .
14,371
15,447
12,646
1,200
15,552
1,475
Short-term debt
4
. . . . . . . . . . . . . . . . .
6,046
6,425
2,868
272
7,322
694
Other current liabilities . . . . . . . . . . . . .
8,325
9,022
9,778
928
8,230
781
Non-current liabilities . . . . . . . . . . . . . . .
19,508
23,002
25,597
2,428
21,340
2,025
Long-term debt
5
. . . . . . . . . . . . . . . . .
15,928
19,843
22,533
2,138
18,144
1,722
Other non-current liabilities . . . . . . . . . . .
3,580
3,159
3,064
290
3,196
303
Minority interests . . . . . . . . . . . . . . . . .
47
116
133
13
214
20
Shareholders' equity . . . . . . . . . . . . . . .
13,350
14,972
16,832
1,597
17,475
1,658
Amounts in accordance with US GAAP
Total assets . . . . . . . . . . . . . . . . . . . . .
n/a
49,524
50,943
4,836
49,458
4,693
Total liabilities . . . . . . . . . . . . . . . . . . .
n/a
35,626
35,280
3,349
33,076
3,138
Shareholders' equity . . . . . . . . . . . . . . . .
n/a
13,776
15,535
1,475
16,220
1,539
Six months ended
Year ended March 31,
September 30,
2000
2001
2002
2002
2001
2002
2002
ZAR
ZAR
ZAR
USD
ZAR
ZAR
USD
Summary Cash Flow Data
Amounts in accordance with IAS
(unaudited)
(in millions)
Cash flow from operating activities . . . . . . . .
4,917
6,165
8,171
775
3,301
3,462
328
Cash flow from/(used in) investing activities . . .
(9,107)
(9,964)
(9,294)
(882)
(3,653)
(2,453)
(233)
Cash flow from/(used in) financing activities . . .
5,051
3,439
110
10
(973)
(1,178)
(112)
Summary Other Data
Headline earnings per share (cents)
6
. . . . . . . .
199.9
341.8
299.3
28.4
70.2
123.9
11.8
Net asset value per share (cents) (at period end) . .
2,396.6
2,687.8
3,021.7
286.7
n/a
3,137.2
297.6
Net asset value per share excluding
intangibles (cents) (at period end) . . . . . . . . .
2,312.3
2,613.3
2,926.6
277.7
n/a
3,057.8
290.1
EBITDA
8
. . . . . . . . . . . . . . . . . . . . . .
8,056
9,977
9,621
913
4,811
5,917
562
Total debt (at period end)
9
. . . . . . . . . . . . .
21,974
26,268
25,401
2,410
25,359
25,466
2,416
Capital expenditures excluding intangibles . . . .
9,461
9,889
9,004
854
3,641
2,346
223

9
Summary Fixed-Line Statistical Data
Six months ended
Year ended March 31,
September 30,
2000
2001
2002
2001
2002
Fixed access lines (thousands) (at period end)10
. . . . . . .
5,493
4,962
4,924
4,986
4,895
Postpaid
PSTN
11
. . . . . . . . . . . . . . . . . . . . . . . . . . . . .
4,668
3,930
3,554
3,761
3,407
ISDN channels . . . . . . . . . . . . . . . . . . . . . . . . .
271
374
467
421
522
Prepaid . . . . . . . . . . . . . . . . . . . . . . . . . . . . . .
381
480
708
615
780
Payphones
12
. . . . . . . . . . . . . . . . . . . . . . . . . . . .
173
178
195
189
186
Fixed-line penetration rate (%) (at period end) . . . . . . . . .
12.8
11.4
11.1
11.1
10.8
Revenue per fixed access line (ZAR) . . . . . . . . . . . . . .
3,869
4,297
4,729
2,294
2,456
Total fixed-line traffic (millions of minutes) . . . . . . . . . .
31,127
32,915
32,973
16,620
16,145
Local
13
. . . . . . . . . . . . . . . . . . . . . . . . . . . . .
19,471
20,388
20,252
10,246
9,870
Long distance . . . . . . . . . . . . . . . . . . . . . . . . .
5,222
4,938
4,895
2,492
2,445
Fixed-to-mobile . . . . . . . . . . . . . . . . . . . . . . . .
3,659
4,319
4,390
2,221
2,079
International outgoing . . . . . . . . . . . . . . . . . . . . .
344
357
375
184
219
Interconnection . . . . . . . . . . . . . . . . . . . . . . . .
2,431
2,913
3,061
1,477
1,532
Number of full-time, fixed-line employees (at period end)14
.
49,128
43,758
39,444
42,110
38,009
Fixed lines per fixed-line employee (at period end)14
. . . . . .
112
113
125
118
129
1
Employee expenses include retrenchment expenses of R373 million, R132 million and R303 million in the years ended March 31, 2002, 2001
and 2000, respectively, and R169 million and R195 million in the six months ended September 30, 2002 and 2001, respectively.
2
Selling, general and administrative expenses include asset write-offs of R445 million and R230 million in the years ended March 31, 2002 and
2001, respectively, and provisions for potential damages related to Telkom's arbitration with Telcordia of R375 million in the year ended
March 31, 2002.
3
As of September 30, 2002, R3,621 million of our long-term debt was guaranteed by the Government of the Republic of South Africa.
4
Includes short-term portion of finance leases and utilized credit facilities.
5
Includes long-term portion of finance leases.
6
Headline earnings per share is a disclosure requirement of the JSE and is not a recognized measure under US GAAP. The following is a
reconciliation between net profit and headline earnings in accordance with IAS for the periods indicated:
Six months ended
Year ended March 31,
September 30,
2000
2001
2002
2001
2002
ZAR
ZAR
ZAR
ZAR
ZAR
(unaudited)
(in millions, except per share amounts)
Net profit
1,527
1,622
1,221
371
644
Adjustments:
Profit on disposal of property, plant and equipment . . . . . . . . . .
(493)
(29)
(22)
(6)
(7)
Profit on disposal of subsidiaries and joint ventures . . . . . . . . .
(83)
(8)
Property, plant and equipment impairment losses . . . . . . . . . . .
279
445
16
Goodwill amortization . . . . . . . . . . . . . . . . . . . . . . . . .
18
75
66
26
36
Tax and outside shareholders effects . . . . . . . . . . . . . . . . . .
145
(43)
(35) -
1
Headline earnings . . . . . . . . . . . . . . . . . . . . . . . . . . .
1,114
1,904
1,667
391
690
Headline earnings per share (cents) . . . . . . . . . . . . . . . . .
199.9
341.8
299.3
70.2
123.9
7
Net asset value per share including and excluding intangibles are requirements of the JSE. Net asset value per share excluding intangibles is not a
recognized measure under US GAAP. Net asset value per share including intangibles is based on net assets of R16,832 million, R14,972 million
and R13,350 million as of March 31, 2002, 2001 and 2000, respectively, and R17,475 million as of September 30, 2002. Net asset value per
share excluding intangibles is based on net assets of R16,302 million, R14,557 million and R12,880 million as of March 31, 2002, 2001 and
2000, respectively, and R17,033 million as of September 30, 2002.

8
EBITDA can be reconciled to operating profit by subtracting depreciation and amortization from EBITDA as follows:
Six months ended
Year ended March 31,
September 30,
2000
2001
2002
2002
2001
2002
2002
ZAR
ZAR
ZAR
USD
ZAR
ZAR
USD
(unaudited)
(in millions)
EBITDA . . . . . . . . . . . . . . . . . . . . . . . .
8,056
9,977
9,621
913
4,811
5,917
562
Depreciation and Amortization . . . . . . . . . . . .
4,174
5,052
5,408
513
2,643
3,106
295
Operating Profit . . . . . . . . . . . . . . . . . . .
3,882
4,925
4,213
400
2,168
2,811
267
9
Includes short-term and long-term debt, finance lease obligations and utilized credit facilities.
10
Including Telkom internal lines of 162,460, 151,986 and 145,302 as of March 31, 2002, 2001 and 2000, respectively, and 136,459 and 157,942 as
of September 30, 2002 and 2001, respectively. Each PSTN line includes one access channel, each basic ISDN line includes two access channels
and each primary ISDN line includes 30 access channels.
11
Excluding ISDN channels.
12
Includes public and private payphones.
13
Local traffic includes internet traffic.
14
Excluding employees of Telkom Directory Services and Swiftnet.
10

11
SUMMARY HISTORICAL CONSOLIDATED FINANCIAL
AND OTHER DATA OF VODACOM
The following table sets forth summary consolidated financial and other data of Vodacom as of and for each of the three years in
the period ended March 31, 2002 and as of and for each of the six month periods ended September 30, 2002 and 2001. Information
in the Vodacom table reflects 100% of Vodacom's results of operations. Information with respect to Vodacom's other African
operations in the Vodacom table reflects 100% of the operations of Vodacom's subsidiaries in Lesotho and Tanzania and 51% of
Vodacom's joint venture in the Democratic Republic of the Congo, unless otherwise indicated. We proportionately consolidate our
50% interest in Vodacom in the Telkom Group's consolidated financial statements. Vodacom's direct network operating costs,
depreciation, other operating income, employee expenses, marketing expenses, administrative expenses, amortization of intangible
assets and integration costs, disposals of operations and impairment costs are presented as separate line items in Vodacom's
consolidated financial statements, but have been combined under the heading "operating expenses" in the table set forth below.
The following summary historical consolidated financial data of Vodacom as of and for each of the three years ended
March 31, 2002 have been derived from Vodacom's historical consolidated financial statements beginning on page F115 of this
prospectus, which were audited by PricewaterhouseCoopers, Inc. and Deloitte & Touche, Registered Accountants and Auditors,
Chartered Accountants (SA). The following summary historical consolidated financial data of Vodacom as of September 30, 2002
and for each of the six month periods ended September 30, 2002 and 2001 was derived from Vodacom's unaudited condensed
consolidated financial statements beginning on page F25 of this prospectus, which, in the opinion of Vodacom's management, have
been prepared on the same basis as Vodacom's audited consolidated financial statements and reflect all adjustments, consisting of
normal recurring adjustments, necessary for a fair presentation of Vodacom's results of operations and financial position for such
periods. Results for the six month periods ended September 30, 2002 and 2001 are not necessarily indicative of results that may be
expected for the entire year.
The consolidated financial statements of Vodacom have been prepared in accordance with IAS, which differs in certain respects
from US GAAP. For a description of the principal differences between IAS and US GAAP relevant to the financial statements of
Vodacom and a reconciliation to US GAAP of net income and shareholders' equity, see note 45 of the notes to the audited consolidated
financial statements of Vodacom as of and for the three years ended March 31, 2002 beginning on page F176 of this prospectus and
note 20 of the notes to the unaudited condensed consolidated financial statements of Vodacom as of September 30, 2002 and for each
of the six month periods ended September 30, 2002 and 2001 beginning on page F40 of this prospectus.
EBITDA represents operating profit before income tax, finance charges, investment income and depreciation and amortization.
We believe that EBITDA provides meaningful additional information to investors since it is widely accepted by analysts and
investors as a basis for comparing a company's underlying operating profitability with that of other companies as it is not influenced
by past capital expenditures or business acquisitions, a company's capital structure or the relevant tax regime. This is particularly
the case in a capital-intensive industry such as communications. It is also a widely accepted indicator of a company's ability to
service its long-term debt and other fixed obligations and to fund its continued growth. EBITDA is not a US GAAP or IAS
measure. You should not construe EBITDA as an alternative to operating profit or cash flows from operating activities determined in
accordance with US GAAP or IAS or as a measure of liquidity. EBITDA is not defined in the same manner by all companies and
may not be comparable to other similarly titled measures of other companies unless the definition is the same.
Vodacom's customer totals are based on the total number of customers registered on Vodacom's network, which have not been
disconnected, including inactive customers, as of the end of the period indicated. See "Business Mobile communications
South Africa Customers" on page 115 of this prospectus for a discussion of Vodacom's procedures with respect to disconnections
and inactive customers. Vodacom's churn is calculated by dividing the average monthly number of disconnections during the period
by the average monthly total reported customer base during the period. Vodacom calculates penetration, or teledensity, based on the
total number of customers at the end of the period per 100 persons in the population of South Africa. Population is the estimated
South African population at the mid-year in the periods indicated as published by Statistics South Africa, a South African
governmental department. Vodacom's traffic comprises total traffic registered on Vodacom's network, including bundled minutes,
outgoing international roaming calls and calls to free services, but excluding national and incoming international roaming calls.
Vodacom's average monthly revenue per customer, or ARPU, is calculated by dividing the average monthly revenue during the
period by the average monthly total reported customer base during the period. ARPU excludes revenue from equipment sales, other
sales and services and revenue from national and international users roaming on Vodacom's networks. Vodacom's average monthly
minutes of use per customer, or MOU, is calculated by dividing the average monthly minutes during the period by the average
monthly total reported customer base during the period. MOU excludes calls to free services, bundled minutes and data minutes.
Cumulative network capital expenditure per customer is the cumulative network capital expenditure since the launch of Vodacom's
South African network divided by Vodacom's average customers in South Africa for the period.
Rand amounts as of and for the year ended March 31, 2002 and as of and for the six months ended September 30, 2002 have
been translated into Dollars solely for your convenience at R10.54 per $1.00, the Rand noon buying rate discussed in "Exchange
Rates" on page 26 of this prospectus on September 30, 2002, the date of Vodacom's most recent balance sheet included in this
prospectus. These translations should not be construed as representations that the Rand amounts could actually be converted into
US dollars at these rates or at all.
You should read the following information together with "Risk Factors" beginning on page 14, "Selected Historical
Consolidated Financial and Other Data of the Telkom Group" beginning on page 28, "Management's Discussion and Analysis of
Financial Condition and Results of Operations" beginning on page 34 and the consolidated financial statements and the notes
thereto of the Telkom Group and Vodacom beginning on page F2 of this prospectus.
12
VODACOM
Summary Income Statement Data
Six months ended
Year ended March 31,
September 30,
2000
2001
2002
2002
2001
2002
2002
ZAR
ZAR
ZAR
USD
ZAR
ZAR
USD
Amounts in accordance with IAS
(unaudited)
(in millions, except per share amounts)
Revenue . . . . . . . . . . . . . . . . . . . . .
9,572
13,276
16,151
1,532
7,522
9,441
895
Operating expenses . . . . . . . . . . . . . . .
7,208
10,723
12,530
1,189
5,947
7,603
721
Operating profit . . . . . . . . . . . . . . . . .
2,364
2,553
3,621
343
1,575
1,838
174
Investment income . . . . . . . . . . . . . . .
32
25
32
3
17
16
2
Finance charges . . . . . . . . . . . . . . . .
(567)
(504)
(60)
(5)
(123)
(315)
(30)
Profit before tax . . . . . . . . . . . . . . . . .
1,829
2,074
3,593
341
1,469
1,539
146
Taxation . . . . . . . . . . . . . . . . . . . .
(514)
(765)
(1,190)
(113)
(445)
(525)
(50)
Profit after tax . . . . . . . . . . . . . . . . . .
1,315
1,309
2,403
228
1,024
1,014
96
Minority interests . . . . . . . . . . . . . . . -
9
(30)
(3)
(16)
(96)
(9)
Net profit . . . . . . . . . . . . . . . . . . . .
1,315
1,318
2,373
225
1,008
918
87
Amounts in accordance with US GAAP
Net profit for the year . . . . . . . . . . . . . .
n/a
1,249
2,120
201
932
839
80
Summary Balance Sheet Data
As of
As of March 31,
September 30,
2000
2001
2002
2002
2002
2002
ZAR
ZAR
ZAR
USD
ZAR
USD
Amounts in accordance with IAS
(unaudited)
(in millions)
Total assets . . . . . . . . . . . . . . . . . . . . . . . . .
9,864
12,342
15,359
1,457
17,319
1,643
Current assets . . . . . . . . . . . . . . . . . . . . . . . .
2,788
3,470
4,145
393
5,451
517
Cash and cash equivalents . . . . . . . . . . . . . . . .
936
798
719
68
1,564
148
Other current assets . . . . . . . . . . . . . . . . . . . .
1,852
2,672
3,426
325
3,887
369
Non-current assets . . . . . . . . . . . . . . . . . . . . . .
7,076
8,872
11,214
1,064
11,868
1,126
Total liabilities . . . . . . . . . . . . . . . . . . . . . . .
7,195
8,847
9,884
938
10,880
1,032
Current liabilities . . . . . . . . . . . . . . . . . . . . . .
5,883
7,267
7,990
758
8,080
766
Short-term debt
1
. . . . . . . . . . . . . . . . . . . . .
3,370
2,547
3,517
334
4,207
399
Other current liabilities . . . . . . . . . . . . . . . . . .
2,513
4,720
4,473
424
3,873
367
Non-current liabilities . . . . . . . . . . . . . . . . . . . .
1,312
1,580
1,894
180
2,800
266
Long-term debt
2
. . . . . . . . . . . . . . . . . . . . .
817
896
780
74
1,592
151
Other non-current liabilities . . . . . . . . . . . . . . .
495
684
1,114
106
1,208
115
Minority interests . . . . . . . . . . . . . . . . . . . . .
(2)
(11)
11
1
102
10
Shareholders' equity . . . . . . . . . . . . . . . . . . . .
2,671
3,506
5,464
518
6,337
601
Amounts in accordance with US GAAP
Shareholders' equity . . . . . . . . . . . . . . . . . . . .
n/a
3,195
4,874
462
5,654
536
Six months ended
Year ended March 31,
September 30,
2000
2001
2002
2002
2001
2002
2002
ZAR
ZAR
ZAR
USD
ZAR
ZAR
USD
Summary Cash Flow Data
Amounts in accordance with IAS
(unaudited)
(in millions)
Cash flow from operating activities . . . . . .
2,341
3,610
3,815
362
n/a
1,637
155
Cash flow from/(used in) investing activities . .
(3,338)
(2,853)
(4,543)
(431)
n/a
(2,415)
(229)
Cash flow from/(used in) financing activities .
646
(1,038)
571
54
n/a
494
47
Summary Other Data
EBITDA
3
. . . . . . . . . . . . . . . . . . . .
3,462
4,189
5,691
540
n/a
3,027
287
Total debt (at period end)
4
. . . . . . . . . . .
4,187
3,443
4,297
408
n/a
5,799
550
Capital expenditures including intangibles . . .
2,032
3,184
4,279
406
n/a
1,718
163
South Africa . . . . . . . . . . . . . . . . .
2,011
2,830
3,291
312
n/a
1,121
106
Other African countries . . . . . . . . . . .
21
354
988
94
n/a
597
57
13
Summary Statistical Data
Six months ended
Year ended March 31,
September 30,
2000
2001
2002
2001
2002
South Africa
Total mobile customers (thousands) (at period end)
5
. . . . .
3,069
5,108
6,557
5,657
7,130
Contract . . . . . . . . . . . . . . . . . . . . . . . . . . . .
963
1,037
1,090
1,062
1,139
Prepaid . . . . . . . . . . . . . . . . . . . . . . . . . . . . .
2,082
4,046
5,439
4,569
5,961
Community services telephones . . . . . . . . . . . . . . . .
24
25
28
26
30
Churn (%) . . . . . . . . . . . . . . . . . . . . . . . . . . . .
31.8
23.3
27.2
31.3
30.7
Contract . . . . . . . . . . . . . . . . . . . . . . . . . . . .
17.4
18.7
14.5
16.6
13.2
Prepaid . . . . . . . . . . . . . . . . . . . . . . . . . . . . .
40.5
24.8
30.1
34.8
34.3
Mobile market share (%) (at period end) . . . . . . . . . . . .
59
61
61
61
59
Mobile penetration (%) (at period end) . . . . . . . . . . . . .
12.1
19.1
24.2
20.6
26.6
Total mobile traffic (millions of minutes) . . . . . . . . . . .
5,669
7,472
8,881
4,229
5,007
Outgoing . . . . . . . . . . . . . . . . . . . . . . . . . . . .
2,885
4,052
4,967
2,307
2,994
Incoming . . . . . . . . . . . . . . . . . . . . . . . . . . . .
2,784
3,420
3,914
1,922
2,013
Average monthly revenue per customer (ZAR)
6
. . . . . . .
266
208
182
190
181
Contract
6
. . . . . . . . . . . . . . . . . . . . . . . . . . . .
481
493
560
551
612
Prepaid . . . . . . . . . . . . . . . . . . . . . . . . . . . . .
132
98
93
94
88
Community services . . . . . . . . . . . . . . . . . . . . . .
n/a
1,453
1,719
1,710
1,766
Average monthly minutes of use per customer . . . . . . . .
158
137
111
114
102
Contract . . . . . . . . . . . . . . . . . . . . . . . . . . . .
274
270
264
265
269
Prepaid . . . . . . . . . . . . . . . . . . . . . . . . . . . . .
90
70
58
59
53
Community services . . . . . . . . . . . . . . . . . . . . . .
1,593
2,859
3,354
3,246
3,215
Cumulative network capital expenditure per customer (ZAR)
(at period end) . . . . . . . . . . . . . . . . . . . . . . . . . .
2,543
2,053
1,991
2,048
1,980
Number of mobile employees (at period end)
7
. . . . . . . .
4,048
4,102
3,984
4,384
3,845
Number of mobile customers per mobile employee (at period end)
7
758
1,245
1,646
1,290
1,854
Other African countries
Number of mobile customers (thousands) (at period end) . .
12
104
306
164
540
Average monthly revenue per customer
Lesotho (ZAR) . . . . . . . . . . . . . . . . . . . . . . . . .
n/a
n/a
144
n/a
87
Tanzania (USD) . . . . . . . . . . . . . . . . . . . . . . . .
n/a
31
27
n/a
23
Democratic Republic of the Congo (USD) . . . . . . . . . .
n/a
n/a
n/a
n/a
22
Number of mobile employees (at period end)
7
. . . . . . . .
43
170
369
201
397
Number of customers per mobile employee (at period end)
7
. .
279
612
830
816
1,360
1
Includes short-term portion of finance leases and utilized credit facilities.
2
Includes long-term portion of finance leases.
3
EBITDA includes a net gain of R56 million, a net loss of R213 million and a net gain of R129 million in the 2002, 2001 and 2000 financial
years, respectively, and a net gain of R25.5 million and nil in the six months ended September 30, 2001 and 2002, respectively, for integration
costs, disposals of operations and impairments.
4
Includes interest-bearing debt, shareholder loans and bank overdrafts.
5
13.9% of Vodacom's total reported customers, 15.9% of its prepaid customers and 3.8% of its contract customers in South Africa were inactive as
of March 31, 2002. 15.1% of Vodacom's total reported customers, 17.0% of its prepaid customers and 4.9% of its contract customers in South
Africa were inactive as of September 30, 2002.
6
Value added service revenue from previously partially owned service providers is included in contract and total average monthly revenue per
customer from October 1, 2001, at which time Vodacom consolidated these previously partially owned service providers.
7
Includes 423, 553 and 96 total temporary employees as of March 31, 2002, 2001 and 2000, respectively, and 140 and 335 total temporary
employees as of September 30, 2002 and 2001, respectively.
END OF PROSPECTUS SUMMARY
14
RISK FACTORS
You should carefully consider the risks described below and the other information in this prospectus before making a decision to
purchase the ordinary shares or ADSs, including the consolidated financial statements of the Telkom Group and Vodacom and the
related notes thereto beginning on page F2 of this prospectus.
Risks Related to our Business
Increased competition in the South African telecommunications market may result in a reduction in overall average tariffs and
market share in our fixed-line business, which could cause our growth rates, operating revenue and net profit to decline.
We had the exclusive right to provide public switched telecommunications services, including international telephone services,
in the Republic of South Africa until May 7, 2002, but for a number of years have competed with mobile operators and value-added
network operators in connection with the provision of other services. The Independent Communications Authority of South Africa,
or ICASA, issued an international carrier of carriers license and a multimedia license to Sentech Limited, a company incorporated
in the Republic of South Africa, in May 2002. In addition, a process has commenced to issue an additional license to provide public
switched telecommunications services to a second national operator and to issue additional licenses to small business operators to
provide telecommunications services in areas with a teledensity of less than 5%. ICASA has indicated that it expects to issue these
licenses in 2003 or early 2004. Further competition may arise as a result of an assessment by the Minister of Communications of
the feasibility of issuing additional licenses from May 2005. As competition intensifies, the main challenges our fixed-line business
faces are continuing to improve customer loyalty and maintaining its leadership in the South African communications market. As a
result of increasing competition, we anticipate a reduction in overall average tariffs and market share in our fixed-line business,
which could cause our growth rates, operating revenue and net profit to decline.
Competition from the three existing mobile communications network operators in South Africa has resulted in significant
customer migration and substitution from fixed-line to mobile services. If this migration and substitution continue, our growth
rates, operating revenue and net profit could decline.
Telkom competes with the three existing mobile communications network operators, Vodacom, Mobile Telephone Network
Holdings (Proprietary) Limited, a company incorporated in the Republic of South Africa, or MTN, and Cell C (Proprietary)
Limited, a company incorporated in the Republic of South Africa, or Cell C, for customers. Telkom also competes with mobile
operators who use least cost routing technology that enables fixed-to-mobile calls from corporate private branch exchanges to
bypass our fixed-line network by being transferred directly to mobile networks. Telkom has experienced significant customer
migration from fixed-line services to mobile services, as well as substitution of calls placed using mobile services rather than our
fixed-line service, in recent years with the increase in mobile penetration in South Africa. If this migration continues, our growth
rates, operating revenue and net profit could decline.
Increased competition in the mobile communications market in South Africa may result in a reduction of Vodacom's average
tariffs and Vodacom's market share and increased customer acquisition and retention costs, which could cause Vodacom's
growth rates, revenue and net profit to decline.
There are currently three operators in the South African mobile communications market, Vodacom, MTN and Cell C.
At September 30, 2002, Vodacom held approximately 59%, MTN held approximately 36% and Cell C held approximately 5% of
the South African mobile communications market, based on total reported customers. Cell C only commenced operations in
November 2001. In addition, ICASA has indicated that it intends to license global mobile personal communications services in
2003 or later and to conduct a feasibility study on the licensing of a fourth mobile operator in 2004 or later. This increased
competition, together with the further liberalization of the South African telecommunications industry, may result in a reduction in
Vodacom's overall average tariffs and market share and increase its customer acquisition and retention costs, which could cause
Vodacom's growth rates, revenue and net profit to decline.
If we are not able to implement a reduction in our existing fixed-line employees and employee expenses or if significant labor
unrest results from the implementation of our fixed-line employee reduction program, our ability to compete may be harmed and
our net profit could decline.
The number of our fixed-line employees, excluding Telkom Directory Services (Proprietary) Limited and Swiftnet (Proprietary)
Limited, both of which are companies incorporated in the Republic of South Africa, declined by approximately 18,800 positions from
March 31, 1997 through September 30, 2002. We intend to continue to reduce our fixed-line headcount over the next five years. Our
ability to implement employee reductions is limited by South African labor laws. In addition, legal requirements make such reductions
costly. We also face pressure from labor unions in South Africa who oppose employee reductions and may encounter resistance from
the Government of the Republic of South Africa if the reductions conflict with the Government's social objectives at the time. If we are
unable to reduce the number of our fixed-line employees and employee expenses or if significant labor unrest results from
implementation of our fixed-line employee reduction program, our ability to compete may be harmed and our net profit could decline.
15
If customer non-payments in our fixed-line business continue to be high or increase, our net profit could decline.
We have experienced a significant number of customer non-payments in our fixed-line business, particularly in impoverished
areas where we were required to expand our network pursuant to our license obligations. In response to these non-payments, we
disconnected a substantial number of telephone lines beginning in our 2001 financial year and incurred bad debt expense of
R965 million, R671 million and R560 million in our fixed-line segment during the years ended March 31, 2002, 2001 and 2000,
respectively, and R75 million and R510 million in the six months ended September 30, 2002 and 2001, respectively. To control our
bad debts, we have implemented a more rapid disconnection policy for non-payments, continued and improved credit vetting and
controls, instituted a better collection program and continued to promote our prepaid fixed-line services. If these measures prove
ineffective and customer non-payments continue to be high or increase in the future and if we are unable to increase our tariffs to
cover the cost of bad debts, our net profit could decline.
The value of Vodacom's investments outside of South Africa and Vodacom's revenue and net profit may decline as a result of
political, economic, regulatory and legal developments in the countries where Vodacom has invested.
Vodacom currently has investments in mobile communications network operators in Lesotho, Tanzania and the Democratic
Republic of the Congo and in an entity that, in August 2002, was granted a license to operate a mobile communications network in
Mozambique. These countries have political, economic, regulatory and legal systems that are still in the process of transformation
and are less developed than those in the Republic of South Africa. Political or economic upheaval or changes in laws and
regulations or in their application may harm the operations of the companies in which Vodacom invests and impair the value of
these investments. The regulatory environments in these countries often lack clarity in a number of areas and are subject to varying
interpretations. These economies have a history of extreme poverty and are susceptible to civil strife, political conflict and political
mismanagement, all of which could cause the value of Vodacom's investments in these countries and Vodacom's revenue and net
profit to decline.
Most of the fixed-line operators in these countries are still state controlled. As a result, the mobile communications network
operators in which Vodacom has invested may encounter difficulties in negotiating commercially acceptable interconnection
agreements and collecting amounts due under interconnection agreements. There are foreign exchange control restrictions in South
Africa, which may restrict Vodacom's ability to fund its investments in these countries, and there are foreign exchange controls in a
majority of these countries, which may restrict Vodacom's ability to extract value from these investments. In addition, a number of
jurisdictions in which Vodacom invests have imposed price controls, particularly for interconnection, which could reduce
Vodacom's net profit and cause the value of Vodacom's investments in these other African countries to decline.
If our strategic equity investors do not continue to provide us strategic services or if we lose a number of our key employees
provided by our strategic equity investors, our business operations could be disrupted and our ability to compete could be
harmed.
We have benefited from the experience and knowledge of our strategic equity investors through their participation on our
operating committee and their employees who serve in key management positions. Pursuant to a strategic services agreement with
our strategic equity investors, our strategic equity investors provided us with 30 of our employees as of September 30, 2002,
including our chief operating officer, chief financial officer and chief strategic officer, two of whom participate on Telkom's
operating committee. If our strategic equity investors do not continue to provide these services to us or if our key personnel who are
employees of our strategic equity investors terminate their employment with us, our business operations could be disrupted and our
ability to compete could be harmed.
If we lose our key personnel or if we are unable to hire and retain highly qualified employees, our business operations
could be disrupted and our ability to compete could be harmed.
Our success depends in large part on our ability to hire and retain highly qualified employees who possess the requisite
qualifications and technical skills. Telkom does not have formal employment agreements with a majority of its executive officers,
any of whom may terminate their employment with us at any time. The loss of key personnel could disrupt our business operations
if we are unable to replace them with similarly qualified individuals. We expect that competition for employees in the South African
communications industry will increase as new competitors enter the market. If we lose a number of our key employees to our
competitors, our business operations could be disrupted and our ability to compete could be harmed.
We do not have the right to appoint a majority of Vodacom's directors or members of its directing committee and the Vodacom
joint venture agreement contains approval rights that may limit our flexibility and ability to implement our preferred strategies.
Although we are a 50% shareholder in Vodacom, our flexibility and ability to implement our preferred strategies may be limited
by the fact that we do not have the right to appoint a majority of Vodacom's directors or members of its directing committee. In
addition, under our memorandum and articles of association, Thintana Communications and the Government are entitled to
nominate the directors we appoint to the Vodacom board. The Vodacom joint venture agreement, which governs the relationship
between Telkom and the other shareholders of Vodacom, requires each of Vodacom's shareholders who owns 10% or more of
Vodacom's shares to approve certain material transactions. As a result of these factors, we may not be able to impose strategies on
Vodacom which we believe to be beneficial to us without the approval of Vodacom's other shareholders.
16
If Vodacom does not continue to make distributions to Telkom, Telkom may not be able to fund its operating expenditures
and service its debt and other financial obligations. In addition, Telkom may not have sufficient funds to pay dividends and
could be required to lower or defer capital expenditures, which could cause the trading prices of Telkom's ordinary shares and
ADSs to decline.
Telkom receives dividends and other distributions from Vodacom which Telkom uses to fund its capital and operating expenditures
and service its debt and other financial obligations. Vodacom is legally distinct from Telkom and has no obligation to make funds
available to Telkom. Vodacom's ability to pay dividends and repay intercompany loans to Telkom may be restricted by, among other
things, its operations and the availability of funds and the terms of credit and debt arrangements entered into by it, as well as statutory
and other legal restrictions. In addition, Vodacom's ability to make distributions to Telkom and its other shareholders requires the
approval of Vodacom's other shareholders who own 10% or more of Vodacom's shares. To the extent that Vodacom is unable to, or
otherwise does not, make distributions to Telkom in the future, Telkom may not be able to fund its operating expenditures and service
its debt and other financial obligations. In addition, Telkom may not have sufficient funds to pay dividends and could be required to
lower or defer capital expenditures, which could cause the trading prices of Telkom's ordinary shares and ADSs to decline.
We have a significant amount of indebtedness, which may impair our operating and financial flexibility and could make it
difficult for us to borrow additional funds for working capital, capital expenditures or other general corporate purposes.
We have a significant amount of indebtedness, the majority of which is related to our fixed-line business. As of September 30,
2002, we had R25.5 billion of total consolidated indebtedness, before cash and cash equivalents. We need to dedicate a substantial
portion of our operating cash flows to service debt, which reduces the funds available for working capital, capital expenditures and
other general corporate purposes. In addition, some of the instruments governing our indebtedness require us to maintain specified
financial ratios and impose operating restrictions on us. Our failure to comply with these restrictions could lead to a default under
the terms of the relevant indebtedness even though we are able to meet our debt service obligations. Moreover, our high level of
debt and the restrictive covenants contained in our debt agreements could limit our ability to borrow additional funds for working
capital, capital expenditures or other general corporate purposes.
If we continue to experience high rates of theft, vandalism, network fraud and lost revenue due to non-licensed operators in
our fixed-line business, our fixed-line fault rates could increase and our operating revenue and net profit could decline.
We have experienced significant cable theft, theft of solar panels and wireless communications equipment, vandalism of
payphones and network fraud, such as non-licensed calls, in our fixed-line business. Theft and vandalism have caused our fixed-line
fault rates to increase, and the repair time on our network and the network downtime associated with such faults have resulted in
lost operating revenue and increased costs. We have also lost operating revenue to non-licensed operators providing
telecommunications services in South Africa. We estimate that we lost revenue of R174 million in the year ended March 31, 2002
from network fraud. If we are unable to minimize theft, vandalism and network fraud, or if we continue to lose operating revenue to
non-licensed operators in our fixed-line business, our fixed-line fault rates could increase and our operating revenue and net profit
could decline.
If we are not able to improve our management information and other systems, our ability to compete may be harmed.
Our information systems do not provide management on a real time basis certain operating data and financial information and
have made our budgeting and planning processes difficult. We have recently implemented improved systems and processes, but they
became operational only after April 1, 2002. It may take up to twelve months for these new systems to be fully tested in an operating
environment. In addition, our billing and information systems are not integrated and therefore we cannot provide a single bill for
customers with multiple locations and the bill post-processing systems currently in place are not capable of providing us with
comprehensive and detailed information on the traffic carried by our fixed-line network. To address these problems, we intend to
reduce the number of current billing systems in place and to introduce appropriate monitoring systems capable of deriving better
operational, financial and accounting information. To the extent we are not able to improve and fully implement these systems, our
ability to effectively compete in the increasingly liberalized South African communications market may be harmed. In addition, the
information systems in Vodacom's other African operations in the Democratic Republic of the Congo are new and not fully tested
and are not capable of providing management on a real time basis reliable operating data and financial information.
Delays in the development and supply of communications equipment may hinder the deployment of new technologies and
services and cause our growth rates and net profit to decline.
Our operations, including the operations of Vodacom, depend in part upon the successful and timely supply of evolving fixed
and mobile communications technologies, such as general packet radio services, or GPRS. We use technologies from a number of
vendors and make significant capital expenditures in connection with communications technologies. If technologies are not
developed by our suppliers on time or do not perform according to expectations or achieve commercial acceptance, we may be
required to delay service introductions and make additional capital expenditures and we could be required to write-off investments
in failed technology, which could cause our growth rates and net profit to decline.
Continuing rapid changes in technologies could increase competition or require us to make substantial additional investments,
which could disrupt our business operations and reduce our net profit.
The services we offer are technology-intensive. The development of new technologies, such as fixed-wireless services and
packet radio services, could increase competition and make our technology obsolete. We may have to make substantial additional
17
investments in new technologies to remain competitive. New technologies we choose may not prove to be commercially successful.
As a result, we could lose customers, fail to attract new customers or incur substantial costs in order to maintain our customer
bases, which could disrupt our business operations and reduce our net profit.
Actual or perceived health risks relating to mobile handsets or transmission masts and any related publicity or litigation could
make it difficult to find attractive sites for base stations and reduce Vodacom's growth rates, customer base, average usage per
customer and net profit.
Concern has been expressed that the electromagnetic signals from mobile handsets and base stations, which serve as antennae
for transmitting radio signals, may pose health risks. Actual or perceived risks of mobile handsets or base stations and related
publicity or litigation, could make it difficult to find attractive sites for base stations and reduce Vodacom's growth rates, customer
base, average usage per customer and net profit.
Risks Related to Telkom's Ownership by the Government of South Africa and Thintana Communications
Telkom's major shareholders will continue to exercise control over our strategic direction and major corporate actions.
The Government of the Republic of South Africa and Thintana Communications, the investment vehicle of our strategic equity
investors, will together continue to hold a majority of Telkom's ordinary shares after the global offering. Through the ownership and
voting arrangements provided for in a new shareholders' agreement and Telkom's new memorandum and articles of association, the
Government and Thintana Communications will be able to exert considerable influence over Telkom's corporate governance,
strategic direction and major corporate actions and to appoint directors of Telkom's subsidiaries and joint venture, Vodacom.
In the new shareholders' agreement, the Government and Thintana Communications have, among other things, agreed to vote
together on specific matters. See "Relationship with Major Shareholders and Related Transactions" beginning on page 145 of this
prospectus for a description of the Government's and Thintana Communications' rights under the new shareholders' agreement. In
addition, Telkom's new memorandum and articles of association require Telkom to obtain written consent from the Government
before taking actions that would limit Telkom's ability to provide public switched telecommunication services. Telkom's new
memorandum and articles of association also require the approval of directors appointed by the Government and Thintana
Communications in order for Telkom or any of its subsidiaries, including Vodacom, to enter into major corporate actions and
transactions, including amendments to Telkom's management structure and the powers of Telkom's operating committee, the
approval of Telkom's dividend policy and payment of dividends, increases in Telkom's indebtedness beyond certain limits and
changes of control. As a result, without the approval and participation of the Government and Thintana Communications, Telkom
will not be able to consummate transactions involving an actual or potential change of control, including transactions in which you
might otherwise receive a premium for your ordinary shares or ADSs over market prices. Because the Government and Thintana
Communications will continue to exercise control over Telkom after the global offering, investors purchasing ordinary shares and
ADSs in the global offering will lack meaningful power to approve decisions of Telkom's board of directors or to influence our
strategic direction and major corporate actions.
The Government of the Republic of South Africa may use its position as shareholder, policymaker for, and customer of, the
telecommunications industry in a manner that may be favorable to our competitors and unfavorable to us.
Following the global offering, the Government of the Republic of South Africa will own approximately 42% of Telkom's issued
and outstanding ordinary shares, or approximately 38% if the underwriters exercise their over-allotment option in full. The
Government also holds significant equity stakes in other industry participants, including Sentech Limited, and is expected to have
an indirect 30% equity interest in the second national operator. To further its policy of liberalization of the telecommunications
industry, the Government may adopt and implement policies and exercise its right to approve regulations that benefit our
competitors but are not beneficial to us. In addition, to further other political or social objectives, the Government may act in a
manner that may be detrimental to our business but advantageous to our competitors.
The Government of the Republic of South Africa is also one of our customers. The Government accounted for approximately
9% of our fixed-line operating revenue, excluding directories and other operating revenue, in the six months ended September 30,
2002. The Government could transfer some or all of its business to the second national operator or other operators when they
commence operations. Legislation has been enacted to centralize all procurement by the Government through one agency. If the
Government transfers some or all of its business to other operators, our operating revenue and net profit would decline.
Risks Related to Regulatory and Legal Matters
The regulatory environment for the telecommunications industry in South Africa is evolving and final regulations addressing
a number of significant matters have not yet been issued. The interpretation of existing regulations, or the adoption of new
policies or regulations that are unfavorable to us, could disrupt our business operations and could cause our net profit and the
trading prices of Telkom's ordinary shares and ADSs to decline.
The provision of telecommunications services in the Republic of South Africa is subject to extensive regulation. The regulatory
environment is developing, lacks clarity in a number of areas and is subject to interpretation, review and amendment as the
telecommunications industry is further developed and liberalized. In addition, the regulatory process entails a public comment
18
process, which, in light of the politicized issue of privatization of industries such as telecommunications in South Africa, makes the
outcome of the regulations uncertain and may cause delays in the regulatory process. A number of significant matters have not been
addressed or clarified, including:
the terms and conditions of the second national operator's license;
whether and the extent to which our licenses may be amended as a result of the licensing of the second national operator;
whether any additional obligations may be imposed on us at that time or thereafter;
the extent to which our fixed-line business will be required to make its facilities or access lines available to the second
national operator to provide services, other than public switched telecommunications services, during the first two years of its
license and beyond;
the extent to which our fixed-line business may be required to unbundle its local loop after two years; and
the extent to which we will be required to contribute to the universal service fund.
In addition, ICASA was only established in 2000. Upon its establishment, ICASA inherited a legacy of regulatory problems
from its predecessors. It has been reported that ICASA may currently lack adequate resources to effectively fulfill its regulatory and
licensing functions and to deal with regulatory challenges that continue to change given the rapidly evolving telecommunications
environment. This combination of factors creates further uncertainties in the regulatory arena and the ability of ICASA to
effectively fulfill its functions. We cannot predict the outcome or timing of any amendments or modifications to applicable
regulations or the interpretation thereof, the release of new regulations or their impact on us. Although we have no reason to believe
that ICASA will act in a manner that is prejudicial to our interests, we have in the past had conflicts with ICASA and its
predecessor, including litigation against them with regard to price cap regulations and interconnection and facilities guidelines.
Changes in the regulation of telecommunications services in South Africa, the imposition of unfavorable terms in our licenses or the
loss or unfavorable amendment of any license could disrupt our business operations and could cause our net profit and the trading
prices of Telkom's ordinary shares and ADSs to decline.
In addition, we may be affected by new laws and regulations which may require our business customers to make use of suppliers
complying with black economic empowerment requirements. If such new laws and regulations are promulgated, and if our
shareholder base does not qualify under the ownership requirements of these black economic empowerment initiatives or
restrictions, some of our business customers may be required or elect to obtain all or some of their telecommunications services
from our competitors who may fulfill such ownership requirements.
If Telcordia Technologies Incorporated, a New Jersey corporation, were able to recover substantial damages in its arbitration
proceedings against Telkom, Telkom would be required to fund such payments from cash flows or drawings on its existing
credit facilities, which could cause Telkom's indebtedness to increase and its net profit to decline.
Telcordia instituted arbitration proceedings against Telkom in March 2001 seeking to recover approximately $130 million for
monies outstanding and damages, plus interest at a rate of 15.5% per year. The proceedings relate to the cancellation of an
agreement entered into between Telkom and Telcordia during June 1999 for the development and supply of an integrated end-to-end
customer assurance and activation system by Telcordia. In September 2002, a partial ruling was issued by the arbitrator in favor of
Telcordia. The arbitration proceedings and the amount of Telkom's liability are not expected to be finalized until late 2003 or early
2004. Telkom has provided R373 million for its estimate of probable liabilities, including interest, in respect of the Telcordia claim
in the Telkom Group's consolidated financial statements as of September 30, 2002. Telkom is currently unable to predict the
amount that it may eventually be required to pay Telcordia. If Telcordia recovers substantial damages from Telkom, Telkom would
be required to fund such payments from cash flows or drawings on its existing credit facilities, which could cause its indebtedness
to increase and its net profit to decline.
If we are unable to negotiate favorable terms, rates and conditions for the provision of interconnection services and facilities
and leasing services, our business operations could be disrupted and our net profit could decline.
Telkom is required to provide interconnection services to the mobile operators, the second national operator and all other entities
that lawfully provide telecommunications services in South Africa and to lease or otherwise make our telecommunications facilities
available to any entity lawfully providing or utilizing telecommunications services in South Africa. We will also be required to
allow the second national operator to use all of our telecommunications facilities for the provision of public switched
telecommunications services on a resale basis for the first two years of its license. We may also be required to lease or otherwise
make our telecommunications facilities available to the second national operator for the provision of services, other than public
switched telecommunications services, during the first two years of its license and beyond. The terms and conditions for the
provision of these services and facilities are, or will be, set out in interconnection agreements and facilities lease agreements
negotiated and agreed to by us with these other entities. ICASA is entitled to issue, and has issued, regulations relating to
interconnection and facilities leasing. Certain of these regulations, while currently only in draft format, contemplate an
asymmetrical interconnection regime between Telkom and the underserviced area licensees, with a terminating tariff differential of
at least 30% in favor of these licensees. To the extent that we are unable to reach agreement with these entities for the provision of
these services, including the applicable tariffs, or to the extent that the terms and conditions of our agreements are inconsistent with
relevant legislation or regulations, such terms and conditions may be determined and imposed on us by ICASA. Sentech has applied
to the South African High Court for an order seeking to set aside supplementary facilities leasing guidelines on the basis of procedural
errors. ICASA has filed a notice of no opposition to this application. As a result, there is a risk that the guidelines will be remanded
back to ICASA for further deliberations. If the guidelines are unfavorable to us when revised, or if we are unable to negotiate favorable
terms and conditions for the provision of the services and facilities covered by the guidelines or ICASA otherwise imposes terms and
conditions that are unfavorable to us, our business operations could be disrupted and our net profit could decline.
19
If we are unable to recover the substantial capital and operational costs associated with the implementation of carrier pre-
selection and number portability or are unable to implement these requirements in a timely manner, our business operations
could be disrupted and our net profit could decline.
We are required to implement carrier pre-selection in our fixed-line business, which will enable customers to choose and vary
their fixed-line telecommunications carrier for long distance and international calls, by December 31, 2003. We are also required to
implement number portability, which will enable customers to retain their fixed-line and mobile telephone numbers if they switch
fixed-line operators or mobile operators, by 2005. We will incur substantial set-up and maintenance time and costs in connection
with the implementation of carrier pre-selection and number portability, which could disrupt our business operations. The extent of
recoverability of these costs have not yet been determined and finalized by ICASA. Although we are required to implement carrier
pre-selection by December 31, 2003 pursuant to regulations imposed by ICASA, we will not be able to fully implement carrier
pre-selection until the second national operator is licensed and the second national operator's interconnection systems and the
inter-operator processes and systems to support carrier pre-selection become available, which may not occur until after
December 31, 2003. To the extent that we are unable to comply with these requirements in the required timeframes or are unable to
substantially recover these costs of compliance, our business operations could be disrupted and our net profit could decline.
Our tariffs are subject to approval by the regulatory authorities, which may limit our flexibility in pricing and could reduce our
net profit. Vodacom's revenue and net profit could decline if wholesale price controls are imposed on it.
Our public switched telecommunications services license imposes a price cap formula on our overall tariffs for a basket of
specified services and any individual product or service within the basket of specified services that we previously had the exclusive
right to provide. The overall tariffs for all services in the basket may not be increased by more than 1.5% below inflation in South
Africa, based on the consumer price index and measured using revenue for the services in the basket at constant volumes for the
prior year. In addition, effective January 1, 2003, the price of any individual product or service within the basket may not be
increased by more than 5% above inflation in South Africa in any year. Our tariffs for these services are filed with ICASA for
approval. Revenue from these services may not be used to subsidize competitive products and services. These limitations on our
customer tariffs limit our pricing flexibility and could reduce our net profit. In addition, Vodacom's revenue and net profit could
decline if additional price controls are imposed on it.
If Vodacom does not obtain a license to use adequate amounts of 1800MHz radio frequency spectrum or a license for radio
frequency spectrum for the provision of third generation services on commercially reasonable terms, Vodacom's future growth
rates, revenue and net profit could decline.
Vodacom has a statutory right to obtain a license to use 1800MHz radio frequency spectrum and radio frequency spectrum for the
provision of third generation services pursuant to amendments to the Telecommunications Act, 103 of 1996. The amount of spectrum
that will be licensed and the fees that will be required to obtain the 1800MHz radio frequency spectrum and radio frequency
spectrum for the provision of third generation services have not yet been determined. In the event Vodacom is not able to obtain
sufficient additional capacity on the 1800MHz radio frequency spectrum or radio frequency spectrum for the adequate provision of
third generation services, or if the fees or terms of such licenses are unfavorable, Vodacom's growth rates, revenue and net profit
could decline.
If Telkom is required to comply with the provisions of the South African Public Finance Management Act, 1 of 1999, or PFMA,
Telkom could incur increased expenses and its net profit could decline and compliance with the PFMA could result in the
delisting of Telkom's ordinary shares and ADSs from the JSE and New York Stock Exchange.
Telkom is required to comply with the provisions of the South African Public Finance Management Act, 1 of 1999, or PFMA.
Telkom applied for and obtained a temporary exemption from many of the provisions of the PFMA until November 2004. If
Telkom does not obtain a further exemption from the PFMA or if its existing exemption is revoked for any reason or it is otherwise
required to comply with the PFMA, Telkom may be compelled to prepare a second set of financial statements in compliance with
accounting principles and practices prescribed by the Government of the Republic of South Africa which do not correlate with IAS
or US GAAP and would require Telkom to incur additional costs. Telkom would also be required to comply with, what it believes
to be, extremely prescriptive treasury regulations issued pursuant to the PFMA, to provide the Government with advance access to
proprietary and potentially price sensitive information and to seek the prior approval of South African governmental authorities to
enter into certain material agreements, to maintain certain bank accounts, to formulate and implement certain investment strategies
or to discharge its auditors, which would preclude Telkom from acting in the same manner as its competitors and other listed
companies. If Telkom is required to comply with the PFMA, Telkom may not be able to comply with the Listings Requirements of
the JSE or the listing rules of the NYSE and Telkom's ordinary shares and ADSs could be delisted.
Risks Related to the Republic of South Africa
Fluctuations in the value of the Rand could have a significant impact on the amount of Telkom's dividends, the trading prices
of Telkom's ordinary shares and ADSs, our net profit and on the comparability of our results between financial periods.
In recent years, the value of the Rand as measured against the Dollar has declined considerably. The Rand declined from R5.90
per $1.00 at December 31, 1998 to R12.00 per $1.00 at December 31, 2001. The exchange rate between the Rand and the Dollar
was R10.54 per $1.00 as of September 30, 2002 and R8.77 per $1.00 as of January 28, 2003.
20
Fluctuations in the exchange rate between the Rand and the Dollar could have an adverse impact on:
the Dollar equivalent of any dividends and distributions on Telkom's ordinary shares and ADSs payable in Rands;
the Dollar equivalent of the Rand denominated prices of Telkom's ordinary shares; and
the market value of Telkom's ADSs in the United States.
These fluctuations could also increase the amount in Rand terms of our non-Rand denominated debt, increase our non-Rand
denominated financing costs and operating and capital expenditures and cause our net profit to decline. Since September 30, 2002,
the value of the Rand has increased as measured against the Dollar and the Euro. Due to this increase. the Telkom Group's net
income is likely to be negatively affected by foreign exchange losses in the year ended March 31, 2003. See "Management's
Discussion and Analysis of Financial Condition and Results of Operations Principal factors that affect our results of operations
Volatility of the Rand and adoption of IAS 39" on page 37 of this prospectus. In addition, fluctuations in currency exchange rates
between the South African Rand and the currencies in African countries where Vodacom invests could decrease the value of these
businesses and Vodacom's and our net profit.
The high levels of unemployment, poverty and crime in South Africa could cause the size of the South African communications
market and our growth rates, operating revenue and net profit, as well as the trading prices of Telkom's ordinary shares and
ADSs, to decline.
While South Africa features a highly developed financial and legal infrastructure at the core of its economy, it has high levels of
unemployment, poverty and crime. These problems have hindered investment into South Africa, have prompted emigration of
skilled workers and have impacted economic growth negatively. Recently, the South African economy has been growing at a
relatively slow rate, inflation and unemployment have been high by comparison with developed countries and foreign reserves have
been relatively low. Although it is difficult to predict the effect of these problems on South African businesses or the Government of
the Republic of South Africa's efforts to solve them, these problems could cause the size of the communications market and our
growth rates, operating revenue and net profit, as well as the trading prices of Telkom's ordinary shares and ADSs, to decline. For
additional information on the Republic of South Africa, see "Republic of South Africa" beginning on page A1.
The high rates of HIV infection in South Africa could cause the size of the South African communications market and our
growth rates, operating revenue and net profit to decline.
South Africa has one of the highest HIV infection rates in the world. The exact impact of increased mortality rates due to AIDS
deaths on the cost of doing business in South Africa and the potential growth in the economy is unclear at this time although
employee related costs in South Africa are expected to increase as a result of the AIDS epidemic and the size of the South African
population and communications market could decline. Our growth rates, operating revenue and net profit could decline if employee
related expenses increase or the size of the African population and communications market decline.
Significant labor disputes, work stoppages, increased employee expenses as a result of collective bargaining and the cost of
compliance with South African labor laws could disrupt our fixed-line business operations and reduce our net profit.
Trade unions represented 75% of our fixed-line employees, excluding our Telkom Directory Services and Swiftnet subsidiaries,
as of September 30, 2002. Trade unions have publicly opposed our privatization and have instituted and in the future could institute
work stoppages to oppose changes in our shareholding structure or gain leverage in negotiating collective bargaining agreements.
Telkom's bargaining agreement covering its unionized employees is scheduled to expire on March 31, 2003. In addition, a number
of South African trade unions, including the trade unions of our employees, have close links to various political parties and have
had a significant influence in South Africa as vehicles for social and political reform and in the collective bargaining process. Since
1995 South Africa has enacted various labor laws that enhance the rights of employees, which have imposed costs on us. Significant
labor disputes, work stoppages, increased employee expenses as a result of collective bargaining and the cost of compliance with
labor laws could disrupt our fixed-line business operations and reduce our net profit.
South African exchange control restrictions could hinder our ability to make foreign investments and procure foreign
denominated financings.
South Africa's exchange control regulations restrict transactions between residents of the Common Monetary Area, which
consists of South Africa, the Republic of Namibia, and the Kingdoms of Lesotho and Swaziland, and non-residents of the Common
Monetary Area. In particular, South African companies:
are generally not permitted to export capital from South Africa or to hold foreign currency in excess of certain limits without
the approval of the South African exchange control authorities;
are generally required to repatriate to South Africa profits of foreign operations; and
are limited in their ability to utilize profits of one foreign business to finance operations of a different foreign business.
These restrictions could hinder our ability to make foreign investments and procure foreign denominated financings. While the
South African Government has relaxed exchange controls in recent years, it is difficult to predict whether or how it will further
relax or abolish exchange control measures in the future. See "Exchange Controls" beginning on page 179 of this prospectus.
21
Risks Related to the Global Offering
You may be prevented from owning more than 15% of any class of Telkom's issued shares for a period of three months
following the listing on the JSE and more than a direct or indirect 5% ownership interest in Telkom or Vodacom and in any
other licensed operator providing the same category of services.
You may not be permitted to acquire more than 15% of Telkom's ordinary shares. Pursuant to Telkom's new memorandum and
articles of association, for a period of three months following the listing on the JSE, if a single shareholder acquires direct or indirect
ownership of more than 15% of any class of shares, Telkom's board may require that shareholder to dispose of such shares in excess
of 15% or in some instances Telkom can dispose of the shares. Telkom's board may also refuse to register the transfer of any shares
that will result in you holding in excess of 15% of its ordinary shares. This three-month period may be extended by legislation. If you
are not a passive institutional investor who does not participate in our management, you may be prevented from holding a direct or
indirect 5% ownership interest in Telkom or Vodacom and a 5% or greater ownership interest in any other licensed operator providing
the same category of telecommunications services as Telkom or Vodacom in a concentrated market where there are less than five
licensees.
The future sale of a substantial number of Telkom's ordinary shares or ADSs could cause the trading prices of Telkom's
ordinary shares and ADSs to decline.
Following this global offering, the Government of the Republic of South Africa will own approximately 42% of Telkom's issued
and outstanding ordinary share capital, or approximately 38% if the underwriters exercise their over-allotment option in full,
Thintana Communications will own approximately 30% of Telkom's issued and outstanding ordinary share capital and Ucingo
Investments will own approximately 3% of Telkom's issued and outstanding ordinary share capital assuming the Ucingo Investments
repurchase does not occur. In addition, the Government intends to grant to eligible past and present employees of Telkom, options
to purchase 11,140,636 of its ordinary shares, representing 2% of Telkom's issued and outstanding ordinary share capital, which
will become exercisable over a period of three years in four equal tranches commencing six months after the public offering.
Telkom may also adopt one or more management and employee incentive plans that provide for the issue of ordinary shares.
Ordinary shares in the Khulisa offer are being offered at a 20% discount to the initial public offering price and may not be sold for
three months following the date of the listing of the shares on the JSE. Sales of substantial amounts of shares by Telkom's
shareholders or by Telkom, or the appearance that a large number of shares is available for sale, following this global offering could
cause the trading prices of Telkom's ordinary shares and ADSs to decline. Telkom, the Government and Thintana Communications
intend to agree with the underwriters to certain restrictions on the sale of ordinary shares and ADSs for 180 days from the date of
the underwriting agreement as described in "Underwriting" beginning on page 187 and "Relationship with Major Shareholders and
Related Transactions" beginning on page 145 of this prospectus, but these lock-up agreements can be waived by the joint global co-
ordinators in their sole discretion. In addition, the Government has agreed with Thintana Communications that the Government will
not sell any of its ordinary shares for a further 545 day period after the expiration of its lock-up period with the underwriters. As of
the date of this prospectus, Ucingo Investments has not agreed to a lock-up of its ordinary shares.
Your rights as a shareholder will be governed by South African law, which differs in material respects from the rights of
shareholders under the laws of other jurisdictions.
Telkom is a public limited liability company incorporated under the laws of the Republic of South Africa. The rights of holders
of Telkom's ordinary shares and therefore many of the rights of Telkom's ADS holders are governed by Telkom's memorandum and
articles of association and by South African law. These rights differ in material respects from the rights of shareholders in
companies incorporated elsewhere, such as in the United States. In particular, South African law significantly limits the
circumstances under which shareholders of South African companies may institute litigation on behalf of a company. For a
description of the differences between shareholders' rights under South African law and Delaware law, See "Description of Shares
Comparison of shareholders' rights under South African and Delaware law" beginning on page 162 of this prospectus.
It may not be possible for you to effect service of legal process, enforce judgments of courts outside of South Africa or bring
actions based on securities laws of jurisdictions other than South Africa against Telkom or against members of its board.
Telkom and a majority of the members of its board of directors and executive officers are residents of South Africa. In addition,
Telkom's assets and a major portion of the assets of members of its board of directors and executive officers are located in whole or
in substantial part in South Africa. As a result, it may not be possible for you to effect service of legal process within the United
States or elsewhere outside of the Republic of South Africa upon most of our directors or officers, including with respect to matters
arising under US federal securities laws or applicable state securities laws. Moreover, it may not be possible for you to enforce
against Telkom or the members of its board of directors and executive officers judgments obtained in courts outside South Africa,
including the United States, based on the civil liability provisions of the securities laws of those countries, including those of the
United States. A foreign judgment is not directly enforceable in South Africa, but constitutes a cause of action which may be
enforced by South African courts with the approval of the South African Minister of Trade and Industry. In addition, awards of
punitive damages will not be enforceable in South Africa. Although it is possible for an investor to bring an action against Telkom
in a South African civil court to enforce rights in terms of US federal securities laws, these laws will not be enforced if they are
penal or revenue or taxation laws or laws which are contrary to South African public policy. It is not possible therefore for an
investor to seek to impose criminal liability on us in a South African court arising from a violation of US federal securities laws.
Your ability to sell a substantial number of ordinary shares and ADSs may be restricted by the limited liquidity of ordinary
shares traded on the JSE.
The principal trading market for Telkom's ordinary shares is expected to be the JSE. Historically, trading volumes and liquidity
of shares listed on the JSE have been low in comparison with other major markets. The ability of a holder to sell a substantial
number of ordinary shares on the JSE in a timely manner, especially by means of a large block trade, may be restricted by the
limited liquidity of ordinary shares listed on the JSE. The limited liquidity of the ordinary shares could depress the overall liquidity
and trading prices of the ADSs.
22
SPECIAL NOTE REGARDING FORWARD-LOOKING STATEMENTS
Many of the statements included in this prospectus are forward-looking statements that involve risks and uncertainties. You can
generally identify forward-looking statements by the use of terminology such as "may," "will," "expect," "intend," "plan,"
"estimate," "anticipate," "believe," or similar phrases. All statements, other than statements of historical facts, including, among
others, statements regarding our future financial position, business strategy, projected levels of growth in the communications
market, projected costs, estimates of capital expenditures and plans and objectives of management for future operation, are forward-
looking statements. Our actual future performance could differ materially from these forward-looking statements. Important factors
that could cause actual results to differ materially from our expectations include those risks identified in the foregoing "Risk
Factors" beginning on page 14 of this prospectus, as well as other matters not yet known to us or not currently considered material
by us.
We caution you not to place undue reliance on these forward-looking statements. All written and oral forward-looking
statements attributable to us or persons acting on our behalf are qualified in their entirety by these cautionary statements. Moreover,
unless we are required by law to update these statements, we will not necessarily update any of these statements after the date of
this prospectus, either to conform them to actual results or to changes in our expectations.
23
USE OF PROCEEDS
We will not receive any proceeds from the sale of ordinary shares or ADSs in the global offering. The purpose of the global
offering is to enable the Government of the Republic of South Africa to continue its restructuring of state-owned enterprises and to
broaden Telkom's shareholder base.

24
DIVIDENDS AND DIVIDEND POLICY
All of Telkom's issued and outstanding ordinary shares rank equal for dividends. The following table sets forth the annual
dividends declared per ordinary share based on 557,031,819 ordinary shares issued and outstanding in the years ended March 31,
2000 and 1999 and 3,899,222,728 ordinary shares in the year ended March 31, 1998, which for the year ended March 31, 1998
represents the ordinary shares issued and outstanding at the date the dividend was declared in the 1997 financial year. Annual
dividends are expressed in Rands and translated into Dollars at the Rand noon buying rate described in "Exchange Rates" on
page 26 of this prospectus on the relevant dividend payment date.
Dividends paid per
ordinary share
Total dividends
Dividend
(cents)
(millions)
cover
1
Year ended March 31,
ZAR
USD
ZAR
USD
2002 . . . . . . . . . . . . . . - - - -
n/a
2001 . . . . . . . . . . . . . . - - - -
n/a
2000 . . . . . . . . . . . . . .
59.6
9.7
331.7
53.9
4.6x
1999 . . . . . . . . . . . . . .
98.1
16.7
546.6
93.0
3.4x
1998 . . . . . . . . . . . . . .
10.3
2.0
400.0
78.7
5.9x
1
Dividend cover is calculated by dividing net profit for the year after minority interest by the dividend for the year.
Dividends paid by Telkom in the past reflected its status as being majority-owned by the Government of the Republic of South
Africa and should not be considered indicative of Telkom's ability to pay future dividends. Telkom did not declare any dividends in
the two years ended March 31, 2002 in order to reinvest profits in its fixed-line network modernization, rehabilitation and line-
rollout program.
Telkom does not expect to pay dividends for the year ended March 31, 2003. Telkom's board of directors has currently recommended
that a dividend be paid for the year ended March 31, 2004 of up to 33% of the Telkom Group's reported after tax net profit for that
period, subject to South African law, the provisions of Telkom's memorandum and articles of association and the factors described
below. We cannot assure you that any dividend will actually be paid or what the timing or amount of any future dividends will be.
Telkom's current dividend policy aims to provide shareholders with a competitive return on their investment, while assuring sufficient
reinvestment of profits to enable us to achieve our strategy. Telkom may revise its dividend policy from time to time. The determination
to pay dividends, and the amount of the dividends, will depend upon, among other things, the following:
our earnings;
our financial condition;
our capital requirements;
the impact of currency exchange rate fluctuations;
general business conditions and strategies;
contractual restrictions on the payment of dividends;
the possible effects on our credit worthiness;
the pay-out and dividend ratios of other major South African companies and other telecommunications operators; and
other factors our board of directors may deem relevant, including future growth prospects.
Under South African law, a company may make payments to its shareholders if authorized thereto by its organizational
documents. A company may not make any payment, in whatever form, to its shareholders if there are reasonable grounds for
believing that:
the company is or would, after the payment, be unable to pay its debts as they become due in the ordinary course of business; or
the consolidated assets of the company fairly valued, after the payment, would be less than the consolidated liabilities of the
company.
Under South African law, a shareholder is liable to a company for any payments received by the shareholder from the company
in violation of these restrictions.
Pursuant to Telkom's new memorandum and articles of association, for so long as either the Government or Thintana
Communications is a significant shareholder, Telkom's dividend policy and all declarations of dividends and payments to
shareholders will have to be approved by the directors appointed by the Government and Thintana Communications. Pursuant to
Telkom's new memorandum and articles of association, a significant shareholder is a shareholder who holds the class A ordinary
share or class B ordinary share in the capital of Telkom and at least 15% of Telkom's issued ordinary shares. This percentage will
25
be reduced from time to time to reflect the dilutive effect of issuances of new ordinary shares, but may not be less than 10%.
Furthermore, in the new shareholders' agreement, the Government and Thintana Communications have agreed to vote their shares
together in relation to the declaration and payment of dividends.
Telkom's ability to make future dividend payments will be determined based upon its financial position under IAS. The
following table sets forth a reconciliation of retained earnings in accordance with IAS to distributable reserves in accordance with
IAS for the periods indicated.
As of March 31,
As of September 30,
2001
2002
2002
2002
2002
ZAR
ZAR
USD
ZAR
USD
(unaudited)
(in millions)
Retained earnings in accordance with IAS . . . . . . . . . . . .
6,679
8,449
802
9,070
861
Share of non-distributable retained earnings in Vodacom . . . . .
(1,754)
(2,678)
(254)
(3,139)
(298)
Distributable reserves in accordance with IAS . . . . . . . . .
4,925
5,771
548
5,931
563
Retained earnings of Vodacom are restricted since Telkom requires the consent of the other shareholders of Vodacom to declare
dividends. As described in "Taxation" beginning on page 173 of this prospectus, Telkom is required to pay secondary tax on
companies at a flat rate of 12.5% in respect of the amount of certain dividends declared by it. As a result of the payment of
secondary tax on companies, the amount of dividends that may actually be paid is less than the amount of distributable reserves.
Distributable reserves are available for distribution based on Telkom's dividend policy. Telkom's board of directors decides on an
annual basis the amount of distributable reserves to be reinvested in operations and the amount of any remaining funds that are
available for distribution to shareholders.
Telkom expects to pay any cash dividends solely in Rands. Cash dividends payable to holders of ADSs listed on the New York
Stock Exchange will be paid to the depositary's custodian, which will convert the dividends into Dollars, at the rate of exchange
applicable on the date such dividends are paid, for disbursement to holders. Fluctuations in the exchange rate between Rands and
Dollars and expenses of the depositary will affect the Dollar amounts actually received by holders of ADSs upon conversion by the
depositary of such cash dividends. See "Description of American Depositary Receipts Dividends and other distributions"
beginning on page 167 of this prospectus.
Provided that the relevant share certificate is endorsed "non-resident" or an entry is made to such effect in the relevant electronic
register, there is currently a blanket approval under the South African exchange control regulations for the free transferability of
cash dividends to holders of ordinary shares or ADSs. See "Exchange Controls" beginning on page 179 of this prospectus.
In addition to the corporate tax on taxable income of South African companies at the current rate of 30%, South African
companies pay secondary tax on companies as described above. Capitalization shares or stock dividends distributed to holders of
ordinary shares do not incur secondary tax on companies. Because of this tax treatment, it has become common practice in South
Africa for companies to offer capitalization shares in lieu of cash dividends. Capitalization shares are shares issued by a company,
the payment for which is allocated out of the company's reserves, including share premium, or unappropriated profits.
For a discussion of the material South African and US federal income tax provisions regarding the taxation of dividends on
ordinary shares and ADSs, see "Taxation" beginning on page 173 of this prospectus.

26
EXCHANGE RATES
Unless otherwise specified, as used in this prospectus:
references to "Rand," "R," "ZAR" and "SA Cents" are to South African Rand and Cents, the currency of the
Republic of South Africa;
references to "Dollars," "$," "USD" and "US Cents" are to the United States Dollar and Cents, the currency
of the United States; and
references to the "Rand noon buying rate" are to the noon buying rates in New York City for cable transfers
in Rands as certified for customs purposes by the US Federal Reserve Bank of New York expressed in Rands per $1.00.
For your convenience, this prospectus contains translations of certain Rand amounts into Dollars. You should not assume,
however, that Rands could have been exchanged into Dollars at any particular rate or at all. Unless otherwise stated, translations of
Rand amounts into Dollars have been made at R10.54 per $1.00, the Rand noon buying rate on September 30, 2002, the date of the
Telkom Group's most recent balance sheet included in this prospectus. These translations should not be construed as representations
that the Rand amounts could actually be converted into US dollars at these rates or at all.
The table below shows the high, low, average and end of period Rand noon buying rates. The end of period Rand noon buying
rate is computed on the last business day of the relevant period and the average Rand noon buying rate is computed using the Rand
noon buying rate on the last business day of each month during the period indicated.
Year ended March 31,
High
Low
Average
End of period
1998 . . . . . . . . . . . . . . . . .
5.04
4.41
4.74
5.04
1999 . . . . . . . . . . . . . . . . .
6.64
5.03
5.85
6.17
2000 . . . . . . . . . . . . . . . . .
6.58
5.98
6.19
6.54
2001 . . . . . . . . . . . . . . . . .
8.04
6.56
7.34
8.04
2002 . . . . . . . . . . . . . . . . .
13.60
7.91
9.64
11.38
The table below shows the high and low Rand noon buying rates for each month during the six months prior to the date of this
prospectus:
Year 2002
High
Low
July . . . . . . . . . . . . . . . . . . . . . . . . . . . . . . . . . . . . . . . . . . .
10.35
9.95
August . . . . . . . . . . . . . . . . . . . . . . . . . . . . . . . . . . . . . . . . .
10.90
10.24
September . . . . . . . . . . . . . . . . . . . . . . . . . . . . . . . . . . . . . . .
10.74
10.48
October . . . . . . . . . . . . . . . . . . . . . . . . . . . . . . . . . . . . . . . . .
10.53
10.00
November . . . . . . . . . . . . . . . . . . . . . . . . . . . . . . . . . . . . . . .
9.98
9.25
December . . . . . . . . . . . . . . . . . . . . . . . . . . . . . . . . . . . . . . .
9.27
8.59
On January 28 , 2003, the Rand noon buying rate was R8.77 per $1.00.
Fluctuations in the exchange rate between the Rand and the Dollar will affect the Dollar amounts received by holders of ADSs
on conversion of dividends, if any, paid in Rands on the ordinary shares and may affect the Dollar trading price of the ADSs
on the New York Stock Exchange.

27
CAPITALIZATION
The following table sets forth the capitalization of the Telkom Group as of September 30, 2002 in accordance with IAS. The
Telkom Group's capitalization includes our 50% interest in Vodacom, which we proportionately consolidate in the Telkom Group's
consolidated financial statements.
Rand amounts have been translated into Dollars solely for your convenience at R10.54 per $1.00, the Rand noon buying rate on
September 30, 2002, the date of the Telkom Group's most recent consolidated balance sheet included in this prospectus. These
translations should not be construed as representations that the Rand amounts could actually be converted in US dollars at these
rates or at all.
You should read the following information together with "Risk Factors" beginning on page 14, "Selected Historical
Consolidated Financial and Other Data of the Telkom Group" beginning on page 28, "Management's Discussion and Analysis of
Financial Condition and Results of Operations" beginning on page 34 and the consolidated financial statements and notes thereto of
the Telkom Group and Vodacom beginning on page F2 of this prospectus.
As of September 30, 20021
ZAR
USD
(unaudited)
(millions)
Short-term
Local unsecured debt
2
. . . . . . . . . . . . . . . . . . . . . . . . . . . . . . . . . . . . .
1,364
129
Current portion of long-term debt
3
. . . . . . . . . . . . . . . . . . . . . . . . . . . . . .
5,958
565
Local debt . . . . . . . . . . . . . . . . . . . . . . . . . . . . . . . . . . . . . . . . . . .
5,897
559
Unsecured . . . . . . . . . . . . . . . . . . . . . . . . . . . . . . . . . . . . . . . . . .
5,607
532
Secured . . . . . . . . . . . . . . . . . . . . . . . . . . . . . . . . . . . . . . . . . . .
290
27
Government guaranteed . . . . . . . . . . . . . . . . . . . . . . . . . . . . . . . . . . .
Foreign debt . . . . . . . . . . . . . . . . . . . . . . . . . . . . . . . . . . . . . . . . . .
61
6
Secured . . . . . . . . . . . . . . . . . . . . . . . . . . . . . . . . . . . . . . . . . . .
29
3
Government guaranteed . . . . . . . . . . . . . . . . . . . . . . . . . . . . . . . . . . .
32
3
Total short-term debt . . . . . . . . . . . . . . . . . . . . . . . . . . . . . . . . . . . . .
7,322
694
Long-term
3
Local debt . . . . . . . . . . . . . . . . . . . . . . . . . . . . . . . . . . . . . . . . . . .
12,058
1,144
Unsecured . . . . . . . . . . . . . . . . . . . . . . . . . . . . . . . . . . . . . . . . . .
7,550
716
Secured . . . . . . . . . . . . . . . . . . . . . . . . . . . . . . . . . . . . . . . . . . .
1,047
99
Government guaranteed . . . . . . . . . . . . . . . . . . . . . . . . . . . . . . . . . . .
3,461
329
Foreign debt . . . . . . . . . . . . . . . . . . . . . . . . . . . . . . . . . . . . . . . . . .
6,086
578
Unsecured . . . . . . . . . . . . . . . . . . . . . . . . . . . . . . . . . . . . . . . . . .
5,306
504
Secured . . . . . . . . . . . . . . . . . . . . . . . . . . . . . . . . . . . . . . . . . . .
293
28
Bank guaranteed . . . . . . . . . . . . . . . . . . . . . . . . . . . . . . . . . . . . . .
359
34
Government guaranteed . . . . . . . . . . . . . . . . . . . . . . . . . . . . . . . . . . .
128
12
Total long-term debt . . . . . . . . . . . . . . . . . . . . . . . . . . . . . . . . . . . .
18,144
1,722
Shareholder equity
Share capital . . . . . . . . . . . . . . . . . . . . . . . . . . . . . . . . . . . . . . . . . . .
5,570
529
(1,000,000,000 ordinary shares of R10 each
authorized, 557,031,819 ordinary shares issued and
outstanding as of September 30, 2002) . . . . . . . . . . . . . . . . . . . . . . . . . . . . .
Share premium . . . . . . . . . . . . . . . . . . . . . . . . . . . . . . . . . . . . . . . . . .
2,723
258
Non-distributable reserves . . . . . . . . . . . . . . . . . . . . . . . . . . . . . . . . . . . .
112
11
Retained earnings . . . . . . . . . . . . . . . . . . . . . . . . . . . . . . . . . . . . . . . . .
9,070
860
Total shareholders' equity . . . . . . . . . . . . . . . . . . . . . . . . . . . . . . . . . . .
17,475
1,658
Total capitalization . . . . . . . . . . . . . . . . . . . . . . . . . . . . . . . . . . . . . . .
42,941
4,074
1
There have been no material changes to the Telkom Group's capitalization and indebtedness from September 30, 2002 through January 16, 2003,
the last practical day on which this information could be compiled, except for the following:
the repayment of the R359 million European Investment Bank loan;
the repayment of R397 million of short-term instruments;
exchange rate movements of R566 million; and
our 50% share of Vodacom's total interest bearing debt has decreased by R1.2 billion as a function of the normal monthly working capital cycle.
2
Credit facilities utilized.
3
Long-term debt and related current portion of long-term debt include finance lease obligations.
28
SELECTED HISTORICAL CONSOLIDATED FINANCIAL
AND OTHER DATA OF THE TELKOM GROUP
The following table sets forth selected historical consolidated financial and other data of the Telkom Group as of and for each of
the five years in the period ended March 31, 2002 and as of and for each of the six month periods ended September 30, 2002 and
2001. Information in the following table includes our 50% interest in the results, assets, liabilities and shareholders' equity of
Vodacom, which we proportionately consolidate.
The following selected historical consolidated financial data of the Telkom Group as of and for each of the three years ended
March 31, 2002 was derived from the Telkom Group's historical consolidated financial statements beginning on page F48 of this
prospectus, which have been audited by Ernst & Young, Registered Accountants and Auditors, Chartered Accountants (SA).
The following selected consolidated financial data as of March 31, 1999 and March 31, 1998 and for each of the two years ended
March 31, 1999 was derived from the Telkom Group's unaudited consolidated financial statements not included in this prospectus,
which are presented in accordance with IAS. The following selected historical consolidated financial data of the Telkom Group as
of September 30, 2002 and for each of the six month periods ended September 30, 2002 and 2001 was derived from the Telkom
Group's unaudited condensed consolidated financial statements beginning on page F2 of this prospectus, which, in the opinion of
our management, have been prepared on the same basis as the Telkom Group's audited consolidated financial statements and reflect
all adjustments, consisting of normal recurring adjustments, necessary for a fair presentation of the Telkom Group's results of
operations and financial position for such periods. Results for the six month periods ended September 30, 2002 and 2001 are not
necessarily indicative of results that may be expected for the entire year.
The consolidated financial statements of the Telkom Group have been prepared in accordance with IAS, which differs in certain
respects from US GAAP. For a description of the principal differences between IAS and US GAAP relevant to the consolidated
financial statements of the Telkom Group and a reconciliation to US GAAP of net income and profit and shareholders' equity, see
note 41 of the notes to the audited consolidated financial statements of the Telkom Group beginning on page F97 of this prospectus
and note 21 of the notes to the unaudited condensed consolidated financial statements of the Telkom Group as of September 30, 2002
and for each of the six month periods ended September 30, 2002 and 2001 beginning on page F15 of this prospectus.
Headline earnings per share is a disclosure requirement of the JSE and is not a recognized measure under US GAAP. Headline
earnings represents net profit, excluding profit on the disposal of property, plant and equipment; profit on the disposal of
subsidiaries and joint ventures; property, plant and equipment impairment losses; goodwill amortization; and tax and minority
interest impacts. EBITDA represents operating profit before income tax, finance charges, investment income and depreciation and
amortization. We believe that EBITDA provides meaningful additional information to investors since it is widely accepted by
analysts and investors as a basis for comparing a company's underlying operating profitability with that of other companies as it is
not influenced by past capital expenditures or business acquisitions, a company's capital structure or the relevant tax regime. This is
particularly the case in a capital-intensive industry such as communications. It is also a widely accepted indicator of a company's
ability to service its long-term debt and other fixed obligations and to fund its continued growth. EBITDA is not a US GAAP or
IAS measure. You should not construe EBITDA as an alternative to operating profit or cash flows from operating activities
determined in accordance with US GAAP or IAS or as a measure of liquidity. EBITDA is not defined in the same manner by all
companies and may not be comparable to other similarly titled measures of other companies unless the definition is the same. In
addition, because the calculation of EBITDA in the maintenance covenants contained in our credit facilities is based on accounting
policies in use at the time the indebtedness was incurred, EBITDA for purposes of those covenants is not calculated in the same
manner as it is calculated in the following table.
Fixed access lines are comprised of PSTN lines, including ISDN channels, public and private payphones and internal lines in
service. We calculate fixed-line penetration, or teledensity, based on the total number of telephone lines in service at the end of the
period per 100 persons in the population of South Africa. Population is the estimated South African population at the mid year in
the periods indicated as published by Statistics South Africa, a South African governmental department. We calculate fixed-line
traffic, other than international outgoing mobile traffic and international interconnection traffic, by dividing traffic operating
revenues for the particular category by the weighted average tariff for such category during the relevant period. Fixed-line
international outgoing mobile traffic and international interconnection traffic is based on the actual traffic registered through the
respective exchanges and reflected in international interconnection invoices. We calculate revenue per fixed access line by dividing
total fixed-line revenue during the period, excluding data and directories and other revenue, by the average number of fixed lines
during the period. We calculate our number of fixed lines per fixed-line employee on the basis of fixed lines in service at period end
divided by the number of employees in our fixed-line segment at period end, excluding employees from our two subsidiaries,
Telkom Directory Services and Swiftnet, which do not provide public switched telecommunications services.
Information with respect to Vodacom's statistical data reflects 100% of Vodacom's results of operations and information with
respect to Vodacom's other African operations reflects 100% of the operations of Vodacom's subsidiaries in Lesotho and Tanzania
and 51% of Vodacom's joint venture in the Democratic Republic of the Congo, unless otherwise indicated. Vodacom's customer
29
totals are based on the total number of customers registered on Vodacom's network, which have not been disconnected, including
inactive customers, as of the end of the period indicated. See "Business Mobile communications South Africa Customers" on
page 115 of this prospectus for a discussion of Vodacom's procedures with respect to disconnections and inactive customers.
Vodacom's churn is calculated by dividing the average monthly number of disconnections during the period by the average monthly
total reported customer base during the period. Vodacom calculates penetration, or teledensity, based on the total number of
customers at the end of the period per 100 persons in the population of South Africa. Population is the estimated South African
population at the mid year in the periods indicated as published by Statistics South Africa. Vodacom's traffic comprises total traffic
registered on Vodacom's network, including bundled minutes, outgoing international roaming calls and calls to free services, but
excluding national and incoming international roaming calls. Vodacom's ARPU is calculated by dividing the average monthly
revenue during the period by the average monthly total reported customer base during the period. ARPU excludes revenue from
equipment sales, other sales and services and revenue from national and international users roaming on Vodacom's networks. MOU
is calculated by dividing the average monthly minutes during the period by the average monthly total reported customer base during
the period. MOU excludes calls to free services, bundled minutes and data minutes. Cumulative network capital expenditure per
customer is the cumulative network capital expenditure since the launch of Vodacom's South African network divided by
Vodacom's average customers in South Africa for the period.
Rand amounts as of and for the year ended March 31, 2002 and as of and for the six months ended September 30, 2002 have
been translated into Dollars solely for your convenience at R10.54 per $1.00, the Rand noon buying rate discussed in "Exchange
Rates" on page 26 of this prospectus on September 30, 2002, the date of the Telkom Group's most recent consolidated balance
sheet included in this prospectus. These translations should not be construed as representations that the Rand amounts could
actually be converted into US dollars at these rates or at all.
You should read the following information together with "Risk Factors" beginning on page 14, "Capitalization" on page 27,
"Management's Discussion and Analysis of Financial Condition and Results of Operations" beginning on page 34 and the
consolidated financial statements and the notes thereto of the Telkom Group and Vodacom beginning on page F2 of this
prospectus.

30
THE TELKOM GROUP
Income Statement Data
Six months ended
Year ended March 31,
September 30,
1998
1999
2000
2001
2002
2002
2001
2002
2002
ZAR
ZAR
ZAR
ZAR
ZAR
USD
ZAR
ZAR
USD
Amounts in accordance with IAS
(unaudited)
(unaudited)
(in millions, except per share amounts)
Operating revenue . . . . . . . . .
19,495
23,029
27,113
31,352
34,197
3,244
16,523
18,316
1,738
Employee expenses
1
. . . . . . . .
n/a
2
n/a
2
7,713
6,590
7,166
680
3,590
3,707
352
Payments to other operators . . . .
n/a
2
n/a
2
4,241
4,983
5,762
547
2,654
3,105
294
Selling, general and administrative
3
n/a
2
n/a
2
5,324
6,971
8,237
781
3,794
3,795
360
Services rendered . . . . . . . . .
n/a
2
n/a
2
1,439
1,539
2,194
208
1,091
1,108
105
Operating leases . . . . . . . . . .
n/a
2
n/a
2
340
1,292
1,217
115
583
684
65
Depreciation and amortization . .
n/a
2
n/a
2
4,174
5,052
5,408
513
2,643
3,106
295
Operating expenses . . . . . . . . .
15,498
19,617
23,231
26,427
29,984
2,844
14,355
15,505
1,471
Operating profit . . . . . . . . . . .
3,997
3,412
3,882
4,925
4,213
400
2,168
2,811
267
Investment income . . . . . . . .
997
436
641
617
490
46
306
152
14
Finance charges . . . . . . . . . .
(1,585)
(1,283)
(2,482)
(3,137)
(2,550)
(242)
(1,845)
(1,779)
(169)
Profit before tax . . . . . . . . . . .
3,409
2,565
2,041
2,405
2,153
204
629
1,184
112
Taxation . . . . . . . . . . . . . .
(1,032)
(657)
(501)
(715)
(873)
(83)
(206)
(456)
(43)
Profit after tax . . . . . . . . . . .
2,377
1,908
1,540
1,690
1,280
121
423
728
69
Minority interests . . . . . . . . . .
(13)
(55)
(13)
(68)
(59)
(5)
(52)
(84)
(8)
Net profit . . . . . . . . . . . . . .
2,364
1,853
1,527
1,622
1,221
116
371
644
61
Number of ordinary shares
outstanding (millions)
Basic . . . . . . . . . . . . . . . .
557
557
557
557
557
557
557
557
557
Diluted . . . . . . . . . . . . . . .
557
557
557
557
557
557
557
557
557
Earnings per share (cents)
Basic . . . . . . . . . . . . . . . .
424.4
332.7
274.1
291.2
219.2
20.8
66.6
115.6
11.0
Diluted . . . . . . . . . . . . . . .
424.4
332.7
274.1
291.2
219.2
20.8
66.6
115.6
11.0
Dividends per share (cents) . . . .
10.3
98.1
59.6
- - - - - -
Amounts in accordance with US GAAP
Net revenue . . . . . . . . . . . . .
n/a
n/a
n/a
26,413
27,947
2,653
13,657
14,605
1,386
Operating income . . . . . . . . . .
n/a
n/a
n/a
3,716
2,498
237
1,711
2,219
211
Net income . . . . . . . . . . . . . .
n/a
n/a
n/a
1,598
1,317
125
481
757
73
Earnings per share (cents)
Basic . . . . . . . . . . . . . . . .
n/a
n/a
n/a
286.9
236.5
22.4
86.4
135.9
12.9
Diluted . . . . . . . . . . . . . . .
n/a
n/a
n/a
286.9
236.5
22.4
86.4
135.9
12.9
31
Balance Sheet Data
As of
As of March 31,
September 30,
1998
1999
2000
2001
2002
2002
2002
2002
ZAR
ZAR
ZAR
ZAR
ZAR
USD
ZAR
USD
Amounts in accordance with IAS
(unaudited)
(unaudited)
(in millions, except per share amounts)
Total assets . . . . . . . . . . . . . . . . . . .
26,012
37,420
47,276
53,537
55,208
5,238
54,581
5,178
Current assets . . . . . . . . . . . . . . . . . .
5,692
7,580
11,010
12,674
10,968
1,041
11,195
1,062
Cash and cash equivalents . . . . . . . . . .
n/a
n/a
1,953
1,801
724
69
1,085
103
Other current assets . . . . . . . . . . . . .
n/a
n/a
9,057
10,873
10,244
972
10,110
959
Non-current assets . . . . . . . . . . . . . . .
20,320
29,840
36,266
40,863
44,240
4,197
43,386
4,116
Total liabilities
4
. . . . . . . . . . . . . . . .
13,011
24,496
33,879
38,449
38,243
3,628
36,892
3,500
Current liabilities . . . . . . . . . . . . . . . .
6,643
12,985
14,371
15,447
12,646
1,200
15,552
1,475
Short-term debt
5
. . . . . . . . . . . . . . .
n/a
n/a
6,046
6,425
2,868
272
7,322
694
Other current liabilities . . . . . . . . . . .
n/a
n/a
8,325
9,022
9,778
928
8,230
781
Non-current liabilities . . . . . . . . . . . . .
6,368
11,511
19,508
23,002
25,597
2,428
21,340
2,025
Long-term debt
6
. . . . . . . . . . . . . . .
n/a
n/a
15,928
19,843
22,533
2,138
18,144
1,722
Other non-current liabilities . . . . . . . . .
n/a
n/a
3,580
3,159
3,064
290
3,196
303
Minority interests . . . . . . . . . . . . . . .
19
84
47
116
133
13
214
20
Shareholders' equity . . . . . . . . . . . . .
12,982
12,840
13,350
14,972
16,832
1,597
17,475
1,658
Amounts in accordance with US GAAP . . . .
Total assets . . . . . . . . . . . . . . . . . . .
n/a
n/a
n/a
49,524
50,943
4,836
49,458
4,693
Total liabilities . . . . . . . . . . . . . . . . .
n/a
n/a
n/a
35,626
35,280
3,349
33,076
3,138
Shareholders' equity . . . . . . . . . . . . . .
n/a
n/a
n/a
13,776
15,535
1,475
16,220
1,539
Six months ended
Year ended March 31,
September 30,
1998
1999
2000
2001
2002
2002
2001
2002
2002
ZAR
ZAR
ZAR
ZAR
ZAR
USD
ZAR
ZAR
USD
Cash Flow Data
(unaudited)
(unaudited)
Amounts in accordance with IAS
(in millions)
Cash flow from operating activities . . .
3,976
6,123
4,917
6,165
8,171
775
3,301
3,462
328
Cash flow from/(used in) investing
activities . . . . . . . . . . . . . . . . .
(6,942) (12,658)
(9,107)
(9,964)
(9,294)
(882)
(3,653)
(2,453)
(233)
Cash flow from/(used in) financing
activities . . . . . . . . . . . . . . . . .
1,218
6,383
5,051
3,439
110
10
(973)
(1,178)
(112)
Other Data
Headline earnings per share (cents)
7 . .
n/a
n/a
199.
9
341.
8
299.
3
28.
4
70.
2
123.
9
11.8
Net asset value per share (cents)
8
(at period end) . . . . . . . . . . . .
2,330.6
2,305.1
2,396.6
2,687.8
3,021.7
286.
7
n/a
3,137.2
297.6
Net asset value per share excluding
intangibles (cents) (at period end)
8
. .
2,323.9
2,289.1
2,312.3
2,613.3
2,926.6
277.
7
n/a
3,057.8
290.1
EBITDA . . . . . . . . . . . . . . .
6,433
6,363
8,056
9,977
9,621
913
4,811
5,917
562
Total debt (at period end)
9
. . . . . .
n/a
n/a
21,974
26,268
25,401
2,410
25,359
25,466
2,416
Capital expenditure excluding intangibles
7,030
12,690
9,461
9,889
9,004
854
3,641
2,346
223

32
Fixed-Line Statistical Data (Telkom)
Six months ended
Year ended March 31,
September 30,
1998
1999
2000
2001
2002
2001
2002
Fixed access lines (thousands)
(at period end)
10
. . . . . . . . . . . . . . . . .
4,645
5,075
5,493
4,962
4,924
4,986
4,895
Postpaid
PSTN
11
. . . . . . . . . . . . . . . . . . . . .
4,518
4,768
4,668
3,930
3,554
3,761
3,407
ISDN . . . . . . . . . . . . . . . . . . . . . .
154
271
374
467
421
522
Prepaid . . . . . . . . . . . . . . . . . . . . . .
n/a
n/a
381
480
708
615
780
Payphones
12
. . . . . . . . . . . . . . . . . . . .
127
153
173
178
195
189
186
Fixed-line penetration rate
(%) (at period end) . . . . . . . . . . . . . . . .
11.3
12.1
12.8
11.4
11.1
11.1
10.8
Revenue per fixed access line (ZAR) . . . . . .
n/a
n/a
3,869
4,297
4,729
2,294
2,456
Total fixed-line traffic
(millions of minutes) . . . . . . . . . . . . . .
n/a
n/a
31,127
32,915
32,973
16,620
16,145
Local
13
. . . . . . . . . . . . . . . . . . . . .
n/a
n/a
19,471
20,388
20,252
10,246
9,870
Long distance . . . . . . . . . . . . . . . . .
n/a
n/a
5,222
4,938
4,895
2,492
2,445
Fixed-to-mobile . . . . . . . . . . . . . . . .
n/a
n/a
3,659
4,319
4,390
2,221
2,079
International outgoing . . . . . . . . . . . . .
n/a
n/a
344
357
375
184
219
Interconnection . . . . . . . . . . . . . . . .
n/a
n/a
2,431
2,913
3,061
1,477
1,532
Number of full-time, fixed-line
employees (at period end)
14
. . . . . . . . . .
56,480
61,237
49,128
43,758
39,444
42,110
38,009
Fixed lines per fixed-line employee
(at period end)
14
. . . . . . . . . . . . . . . . .
82
83
112
113
125
118
129
Vodacom Statistical Data (100% of Vodacom)
South Africa
Total mobile customers (thousands)
(at period end)
15
. . . . . . . . . . . . . . .
1,137
1,991
3,069
5,108
6,557
5,657
7,130
Contract . . . . . . . . . . . . . . . . . .
695
866
963
1,037
1,090
1,062
1,139
Prepaid . . . . . . . . . . . . . . . . . . .
426
1,101
2,082
4,046
5,439
4,569
5,961
Community services telephones . . . . . .
16
23
24
25
28
26
30
Churn (%) . . . . . . . . . . . . . . . . . .
28.2
26.5
31.8
23.3
27.2
31.3
30.7
Contract . . . . . . . . . . . . . . . . . .
17.1
16.1
17.4
18.7
14.5
16.6
13.2
Prepaid . . . . . . . . . . . . . . . . . . .
30.0
39.3
40.5
24.8
30.1
34.8
34.3
Mobile market share (%) (at period end) . . .
62
60
59
61
61
61
59
Mobile penetration (%) (at period end) . . . .
4.5
8.0
12.1
19.1
24.2
20.6
26.6
Total mobile traffic (millions of minutes) .
5,669
7,472
8,881
4,229
5,007
Outgoing . . . . . . . . . . . . . . . . . .
n/a
n/a
2,885
4,052
4,967
2,307
2,994
Incoming . . . . . . . . . . . . . . . . . .
n/a
n/a
2,784
3,420
3,914
1,922
2,013
Average monthly revenue per customer
(ZAR)
16
. . . . . . . . . . . . . . . . . . . .
394
358
266
208
182
190
181
Contract
16
. . . . . . . . . . . . . . . . . .
n/a
n/a
481
493
560
551
612
Prepaid . . . . . . . . . . . . . . . . . . .
n/a
n/a
132
98
93
94
88
Community services . . . . . . . . . . . .
n/a
n/a
n/a
1,453
1,719
1,710
1,766
Average monthly minutes of use per
customer . . . . . . . . . . . . . . . . . . .
n/a
n/a
158
137
111
114
102
Contract . . . . . . . . . . . . . . . . . .
n/a
n/a
274
270
264
265
269
Prepaid . . . . . . . . . . . . . . . . . . .
n/a
n/a
90
70
58
59
53
Community services . . . . . . . . . . . .
n/a
n/a
1,593
2,859
3,354
3,246
3,215
Cumulative network capital expenditure per
customer (ZAR) (at period end) . . . . . . .
n/a
n/a
2,543
2,053
1,991
2,048
1,980
Number of mobile employees
(at period end)
17
. . . . . . . . . . . . . . .
2,050
3,446
4,048
4,102
3,984
4,384
3,845
Number of mobile customers per mobile
employee (at period end)
17
. . . . . . . . . .
555
578
758
1,245
1,646
1,290
1,854

33
Six months ended
Year ended March 31,
September 30,
1998
1999
2000
2001
2002
2001
2002
Other African countries
Number of mobile customers
(thousands) (at period end) . . . . . . . . .
3
5
12
104
306
164
540
Average monthly revenue per customer
Lesotho (ZAR) . . . . . . . . . . . . . . .
n/a
n/a
n/a
n/a
144
n/a
87
Tanzania (USD) . . . . . . . . . . . . . .
n/a
n/a
n/a
31
27
n/a
23
Democratic Republic of the
Congo (USD) . . . . . . . . . . . . . . . .
n/a
n/a
n/a
n/a
n/a
n/a
22
Number of mobile employees
(at period end)
17
. . . . . . . . . . . . . . .
n/a
n/a
43
170
369
201
397
Number of mobile customers per mobile
employee (at period end)
17
. . . . . . . . . .
n/a
n/a
279
612
830
816
1,360
1
Employee expenses include retrenchment costs of R373 million, R132 million and R303 million in the years ended March 31, 2002, 2001
and 2000, respectively, and R169 million and R195 million in the six months ended September 30, 2002 and 2001, respectively.
2
Not available because we changed the categories contained in our consolidated financial statements in the year ended March 31, 2000.
3
Selling, general and administrative expenses include asset write-offs of R445 million and R230 million in the years ended March 31, 2002 and 2001,
respectively, and provisions for potential damages related to Telkom's arbitration with Telcordia of R375 million in the year ended March 31, 2002.
4
As of September 30, 2002, R3,621 million of our long-term debt was guaranteed by the Government of the Republic of South Africa.
5
Includes short-term portion of finance leases and utilized credit facilities.
6
Includes long-term portion of finance leases.
7
Headline earnings per share is a disclosure requirement of the JSE and is not a recognized measure under US GAAP. The following is a
reconciliation between net profit and headline earnings in accordance with IAS for the periods indicated:
Six months ended
Year ended March 31,
September 30,
2000
2001
2002
2001
2002
ZAR
ZAR
ZAR
ZAR
ZAR
(unaudited)
(in millions, except per share amounts)
Net profit
1,527
1,622
1,221
371
644
Adjustments:
Profit on disposal of property, plant and equipment . . . . . . . . .
(493)
(29)
(22)
(6)
(7)
Profit on disposal of subsidiaries and joint ventures . . . . . . . . . (83)
(8)
Property, plant and equipment impairment losses . . . . . . . . . .
279
445
16
Goodwill amortization . . . . . . . . . . . . . . . . . . . . . . . .
18
75
66
26
36
Tax and outside shareholders effects . . . . . . . . . . . . . . . . .
145
(43)
(35)
1
Headline earnings . . . . . . . . . . . . . . . . . . . . . . . . . .
1,114
1,904
1,667
391 690
Headline earnings per share (cents) . . . . . . . . . . . . . . . .
199.9
341.8
299.3
70.2
123.9
8
Net asset value per share including and excluding intangibles are disclosure requirements of the JSE. Net asset value per share excluding
intangibles is not a recognized measure under US GAAP. Net asset value per share including intangibles is based on net assets of
R16,832 million, R14,972 million, R13,350 million, R12,840 million and R12,982 million as of March 31, 2002, 2001, 2000, 1999 and 1998,
respectively, and R17,475 million as of September 30, 2002. Net asset value per share excluding intangibles is based on net assets of
R16,302 million, R14,557 million, R12,880 million, R12,751 million and R12,945 million as of March 31, 2002, 2001, 2000, 1999 and 1998,
respectively, and R17,033 million as of September 30, 2002.
9
Includes short-term and long-term debt, finance lease obligations and utilized credit facilities.
10
Including Telkom internal lines of 162,460, 151,986 and 145,302 as of March 31, 2002, 2001 and 2000, respectively, and 136,459 and 157,942
as of September 30, 2002 and 2001, respectively. Each PSTN line includes one access channel, each basic ISDN line includes two access
channels and each pricing ISDN line includes 30 access channels.
11
Excluding ISDN channels.
12
Includes public and private pay phones.
13
Local traffic includes internet traffic.
14
Excluding employees of Telkom Directory Services and Swiftnet.
15
13.9% of Vodacom's total reported customers, 15.9% of its prepaid customers and 3.8% of its contract customers in South Africa were
inactive as of March 31, 2002. 15.1% of Vodacom's total reported customers, 17.0% of its prepaid customers and 4.9% of its contract customers
in South Africa were inactive as of September 30, 2002.
16
Value added service revenue from previously partially owned service providers is included in contract and total average monthly revenue per
customer from October 1, 2001, at which time Vodacom consolidated these previously partially owned service providers.
17
Includes 423, 553 and 96 total temporary employees as of March 31, 2002, 2001 and 2000, respectively, and 140 and 335 total temporary
employees as of September 30, 2002 and 2001, respectively.
34
MANAGEMENT'S DISCUSSION AND ANALYSIS OF FINANCIAL CONDITION
AND RESULTS OF OPERATIONS
You should read the following discussion together with the consolidated financial statements of the Telkom Group and Vodacom
and the notes thereto beginning on page F2 included elsewhere in this prospectus. The Telkom Group and Vodacom have prepared
their financial statements in accordance with IAS, which differs in certain respects from US GAAP. For a description of the
principal differences between IAS and US GAAP relevant to the financial statements of the Telkom Group and Vodacom and a
reconciliation to US GAAP of net income and profit and shareholders' equity, see note 41 of the notes to the audited consolidated
financial statements of the Telkom Group as of and for the three years ended March 31, 2002 beginning on page F97 of this
prospectus, note 21 of the notes to the unaudited condensed consolidated financial statements of the Telkom Group as of
September 30, 2002 and for each of the six month periods ended September 30, 2002 and 2001 beginning on page F15 of this
prospectus, note 45 of the notes to the audited consolidated financial statements of Vodacom as of and for the three years ended
March 31, 2002 beginning on page F176 of this prospectus and note 20 of the notes to the unaudited condensed consolidated
financial statements of Vodacom as of September 30, 2002 and for each of the six month periods ended September 30, 2002 and 2001
beginning on page F40 of this prospectus.
Overview of our business
We are currently the sole provider of public switched telecommunications services in South Africa, providing fixed-line voice
and data services. In addition, we participate in the South African mobile communications market through our 50% interest in
Vodacom, the largest mobile communications network operator in South Africa based on total reported customers. We also provide
directory services and other services through our subsidiaries, Telkom Directory Services (Proprietary) Limited and Swiftnet
(Proprietary) Limited, both of which are companies incorporated in the Republic of South Africa.
We offer business, residential and payphone customers a wide range of services and products, including:
fixed-line voice services, including subscription and connections services, local, long distance, fixed-to-mobile and
international voice services, interconnection and transit communications services, value-added voice services, customer
premises equipment sales and directory services;
fixed-line data services, including domestic and international data transmission services, such as leased lines and packet-
based services, managed data networking services and internet access and related information technology services; and
mobile communications services, including voice and data services, value-added services and handset sales through Vodacom.
Principal factors that affect our results of operations
Liberalization of the South African telecommunications market and increasing competition
We had the exclusive right to provide public switched telecommunications services, including international telephone services,
in the Republic of South Africa until May 7, 2002. In May 2002, Sentech Limited was issued licenses to provide international
carrier of carriers services and multimedia services. Due to the continuing liberalization of the communications market, we expect
to face competition from a second national operator. We also expect to face additional competition by small business operators in
areas with a teledensity of less than 5%. ICASA has indicated that it expects to issue these licences in 2003 or early 2004. At the
close of the bid process, two bids for the second national operator had been received. Further competition may arise as a result of
an assessment by the Minister of Communications of the feasibility of issuing additional licenses from May 2005. In addition, our
fixed-line business has faced competition from mobile communications network operators, including Vodacom, and value-added
network operators for a number of years. In recent periods, our fixed-line business has experienced significant migration from our
fixed-line services to mobile services, as well as substitution of calls placed using mobile services rather than our fixed-line service.
We also compete with mobile operators who use least cost routing technology that enables fixed-to-mobile calls from corporate
private branch exchanges to bypass our network by being transferred directly to mobile networks.
The current South African mobile communications market is dominated by two mobile communications network operators,
Vodacom and MTN, and a third mobile communications network operator, Cell C, has competed in this market since November
2001. In addition, ICASA has indicated that it intends to license global mobile personal communications services in 2003 or later
and to conduct a feasibility study on the licensing of a fourth mobile operator in 2004 or later.
We expect competition in the fixed-line and mobile communications sectors to continue to increase. As competition intensifies,
the main challenges our fixed-line business faces are continuing to improve customer loyalty and maintaining its leadership in the
South African communications market. As a result of increasing competition, we anticipate a reduction in overall average tariffs and
market share in our fixed-line business. Vodacom has maintained its market share to date, despite the introduction of Cell C, but
customer acquisition and retention costs have increased. The introduction of future competition may result in a reduction in
Vodacom's overall average tariffs and market share and an increase in its customer acquisition and retention costs. However, we
expect competition to stimulate overall market demand for communications services.

35
South African fixed-line communications market
While South Africa features a highly developed financial and legal infrastructure at the core of its economy, it also suffers from
high levels of unemployment and income disparity. With respect to the economically disadvantaged portion of the population,
communications providers must compete with other basic service providers for customers' limited resources. In a number of areas
of the country and for particular portions of the population, mobile services are the preferred alternative to fixed-line services.
To substantially meet our license targets, we installed a significant number of access lines that proved to be uneconomic and
have since been disconnected. Taking into account recent disconnections, the number of our fixed lines in service grew by a
compound annual rate of only 3.0% over the five years ending March 31, 2002. Although the fixed-line penetration rate in South
Africa was only 10.8% as of September 30, 2002, due to the diverse rural geography and demographic factors in South Africa, we
do not expect fixed-line penetration rates to increase significantly in the near-term. In light of these market conditions, we will seek
to maximize the utilization of existing capacity, largely through increased sales of our prepaid and other products.
Significant growth in mobile communications market
South Africa has experienced significant growth in the number of mobile users since Global System for Mobile Technology,
or GSM, mobile services were launched in the country in 1994. The penetration rate for mobile users increased from 2.4%
at March 31, 1997 to 24.2% at March 31, 2002 and 26.6% at September 30, 2002. As a result, Vodacom's revenues increased 21.6%
and 38.7% in the 2002 and 2001 financial years, respectively, and 25.5% in the six months ended September 30, 2002 as compared
to the six months ended September 30, 2001. While we believe the mobile penetration rate will continue to increase, we do not
expect that it will continue to grow at the same high rates that it has experienced in the recent past. Consequently, Vodacom is
placing increased focus on customer retention and providing value-added services in addition to its previous focus on customer
acquisition, as well as selective growth in other African countries.
A large part of the growth in mobile services was due to the success of prepaid services. Approximately 83.6% of Vodacom's
South African mobile customers were prepaid customers at September 30, 2002. Vodacom expects the number of prepaid mobile
users to continue to grow as a percentage of total mobile users. The increasing percentage of prepaid users, who tend to have lower
average usage, has resulted in decreasing overall average revenue per customer, despite increasing average revenue per contract
customer. In the future, as the mobile market matures and growth in the prepaid market slows, average revenue per customer is
expected to stabilize.
Tariff rebalancing
We have substantially completed a five-year tariff rebalancing program in our fixed-line business. This has reduced the need for
future tariff adjustments in the face of competition. We have decreased the ratio of tariffs for long distance calls to all destinations
over 200km compared to tariffs for local calls from 13.2:1 as of March 31, 1997 to 2.7:1 as of March 31, 2002. In addition, the
weighted average effective price per minute to all international destinations decreased approximately 44% from January 1, 1998 to
March 31, 2002. The following table shows our long distance to local call ratio for the periods indicated.
As of March 31,
1997
1998
1999
2000
2001
2002
Long distance to local call ratio
13.2
9.2
7.7
6.9
5.8
2.7
The rebalancing of tariffs was performed within a price cap mechanism imposed by regulations that limited increases in the
overall tariffs in a basket of specified services that we previously had the exclusive right to provide. More than 80% of Telkom's
operating revenue is included in this basket. The overall tariffs for all services in the basket may not be increased by more than
1.5% below inflation in South Africa, based on the consumer price index and measured using revenue for the services in the basket
at constant volumes for the prior year. In addition, prior to January 1, 2003, the price of any individual product or service included
in the basket of specified services could not be increased by more than 20% above inflation in South Africa in any year. Effective
January 1, 2003, the price of any individual product or service included in the basket may not be increased by more than 5% above
inflation in South Africa in any year. In December 2002, ICASA approved our tariff filing providing for a 9.5% increase in the
overall tariffs for all services in the basket effective January 1, 2003, based on the increase in the consumer price index for
September 2002 of 12.5%. Average inflation in South Africa was 5.7% in the year ended December 31, 2001 and 5.4% in the year
ended December 31, 2000. See "Business Fixed-line communications Fees and tariffs Tariff rebalancing" on page 102 of this
prospectus.
Interconnection agreements
Telkom amended its interconnection agreements with Vodacom and MTN and entered into a new interconnection agreement
with Cell C effective in November 2001. Telkom's amended interconnection agreements increased the portion of fixed-to-mobile
tariffs retained by Telkom effective from November 1, 2001. The adjustments also eliminated volume discounts previously offered
to mobile operators for termination of mobile-to-fixed calls on our fixed-line network and equalized termination rates payable by
Telkom to mobile operators for incoming international calls with national fixed-to-mobile termination rates. Telkom's amended

36
interconnection agreements also increased the discount offered on outgoing international calls originating on the mobile networks in
order to better prepare us for increased competition from Sentech Limited and the second national operator and from small business
operators in areas with a teledensity of less than 5%. Telkom's interconnection agreements provide for annual increases in the
portion of fixed-to-mobile tariffs retained by Telkom and the termination rates payable by Telkom to the mobile operators as well as
the termination rates payable to Telkom from the mobile operators for mobile-to-fixed calls commencing in January 2003.
Effective in November 2001, Vodacom and MTN entered into an amended interconnection agreement with each other and new
interconnection agreements with Cell C. These agreements increased the amounts mobile operators are required to pay one another
for the termination of mobile-to-mobile calls from November 2001. These amendments also introduced an interconnection rate of
4 SA Cents for the termination of calls by mobile operators for calls originating from other mobile operator's community service
phones, whereas previously these calls were terminated at no charge. These amendments have increased Vodacom's payments to
other operators, while increasing the interconnection revenues received by Vodacom.
See "Business Fixed-line communications Fees and tariffs Interconnection tariffs" on page 104 of this prospectus.
Fixed-line license obligations
Our public switched telecommunications services license included service and fixed line roll-out targets that were required to be
met through May 7, 2002. We substantially met all of our fixed-line service and line roll-out targets with the exception of our
residential fault rate target, our aggregate fixed-line roll-out target and targets which required us to provide service to underserviced
villages and to replace analog lines with digital lines.
We elected not to roll-out lines in our last year of exclusivity in areas where it was not economical. As a result, we missed our
aggregate fixed-line roll-out target by 16,448 lines. Our license required us to pay penalties for missing these license targets.
We have provided for our estimate of the total penalties for failing to meet these targets of approximately R15 million
in the Telkom Group's financial statements for the year ended March 31, 2002 based on the previous requirements contained in our
existing license. This amount is subject to review by ICASA. We do not currently anticipate that we will have any additional fixed
line roll-out targets.
Fixed-line network modernization and line roll-out program
In 1997, we embarked on an extensive five year capital investment program in our fixed-line business. Our fixed-line capital
investment for the five years ended March 31, 2002 was R41.7 billion, of which R27.9 billion was for network modernization and
line roll-out. Our fixed-line capital investment program was mainly initiated to satisfy our license obligations and prepare for
competition by making substantial improvements to our fixed-line network services.
The following table shows the amounts included in our total fixed-line capital expenditure for the periods indicated.
Fixed-line capital expenditure
Six months ended
Year ended March 31,
September 30,
1998
1999
2000
2001
2002
2001
2002
ZAR
ZAR
ZAR
ZAR
ZAR
ZAR
ZAR
(unaudited)
(unaudited)
(in millions)
Network modernization . . . . . . . . .
962
1,674
1,244
1,209
2,192
733
371
Line roll-out . . . . . . . . . . . . . . .
3,658
6,971
4,230
3,994
1,769
849
318
Total network modernization and
line-roll-out . . . . . . . . . . . . . .
4,620
8,645
5,474
5,203
3,961
1,582
689
Operational support systems . . . . . .
778
1,533
2,194
2,453
2,369
791
743
Company support and other . . . . . . .
1,115
1,279
800
641
632
257
55
Total fixed-line capital expenditure . .
6,513
11,457
8,468
8,297
6,962
2,630
1,487
Capital expenditure as a percentage of
fixed-line operating revenue (%) . . .
n/a
n/a
36
31
25
19
10
In the future, we intend to selectively invest in our fixed-line segment on a smaller scale based on customer demand and
economic viability. Having substantially completed our fixed-line roll-out, we expect future fixed-line capital expenditures to be
primarily for improving the quality of our network and our operational support systems. We have budgeted to spend approximately
R4.9 billion in the year ended March 31, 2003 on fixed-line capital expenditures.
37
Customer non-payments
We have experienced significant bad debts in our fixed-line business, particularly in impoverished areas where we were required
to expand our network pursuant to our license obligations. In response to these non-payments, we disconnected a substantial
number of telephone lines beginning in our 2001 financial year and incurred bad debt expenses of R965 million, R671 million and
R560 million in our fixed-line segment during the years ended March 31, 2002, 2001, and 2000, respectively, and R75 million and
R510 million in the six months ended September 30, 2002 and 2001, respectively. To control our bad debts, we have implemented a
more rapid disconnection policy for non-payments, continued and improved credit vetting and controls, instituted a better collection
program and continued to promote our prepaid fixed-line services.
Transformation of our fixed-line business from a majority government owned entity to a market and profit-oriented enterprise
We are in the final stages of changing the orientation of our fixed-line business from a majority governmental owned entity to a
market and profit-oriented business. To achieve this, we began a transformation program in 1997 with the help of our strategic
equity investors to reorganize our fixed-line business along functional lines. Our focus was to change our corporate culture, improve
the skills of our South African employees, increase the focus of our marketing efforts, outsource non-core operations and manage
revenue generation and operating expenses more effectively.
Employee-related expenses are a significant component of our total fixed-line operating expenses. The number of our fixed-line
employees, excluding Telkom Directory Services and Swiftnet, declined by approximately 18,800 positions from March 31, 1997
through September 30, 2002. We spent R373 million, R132 million and R303 million in the years ended March 31, 2002, 2001 and
2000, respectively, and R169 million and R195 million in the six months ended September 30, 2002 and 2001, respectively, on our
employee restructuring program. We intend to continue to reduce our fixed-line headcount over the next five years.
In addition, we have identified and outsourced six non-core activities since March 31, 2000. Through March 31, 2002, we
received R804 million from our outsourcing program. We recently announced our intention to dispose of our property portfolio
through a sale and leaseback transaction. See " Recent developments Property portfolio" on page 38 of this prospectus.
Volatility of the Rand and adoption of IAS 39
In recent years, the value of the Rand as measured against the Dollar has declined considerably. The Rand declined from R5.90
per $1.00 at December 31, 1998 to R12.00 per $1.00 at December 31, 2001. The exchange rate between the Rand and the Dollar
was R10.54 per $1.00 as of September 30, 2002 and R8.77 per $1.00 as of January 28, 2002. Telkom's policy is to fully hedge its
foreign denominated debt and operating and capital expenditures. Vodacom's policy is to hedge its foreign denominated operating
and capital expenditures for its South African operations. Further decreases in the value of the Rand as measured against other
currencies could increase the future cost in Rand terms of our foreign denominated debt, our foreign denominated financing costs
and our foreign denominated operating and capital expenditures.
During the year ended March 31, 2002, Telkom and Vodacom prospectively adopted IAS 39 Recognition and Measurement of
Financial Instruments. Under this standard, fair value adjustments on financial instruments are recorded in the Telkom Group's
consolidated financial statements in the period they occur. The effect of the application of this new standard increased our
consolidated opening retained earnings balance by R584 million and increased our consolidated profit before tax by R635 million
on a non-cash basis in the 2002 financial year. In the six months ended September 30, 2002, the effect of the application of this
standard decreased our consolidated profit before tax by R367 million on a non-cash basis. Future exchange rate volatility is
expected to continue to materially impact our future results due to the large volume of foreign exchange contracts entered into by us
to cover our foreign currency denominated debt, financing and operating costs and capital expenditures. Since September 30, 2002,
the value of the Rand has increased as measured against the Dollar and the Euro. Due to this increase, the Telkom Group's net
income is likely to be negatively affected by foreign exchange losses in the year ended March 31, 2003.
Strategic equity investor participation
We have significantly benefited over the past five years from the knowledge and experience of our strategic equity investors,
SBC Communications and Telekom Malaysia. We are a party to a strategic services agreement with our strategic equity investors
pursuant to which they had the ability to exercise effective operational and managerial control over us until May 2002. Our strategic
equity investors provided us with a number of management and operational services, including participation in Telkom's operating
committee and provided us with a number of key employees who served in various management and executive officer positions.
Since May 2002, our strategic equity investors no longer exercise effective operational and managerial control over us, but their
nominees continue to occupy key managerial positions, including chief operating officer, chief financial officer and chief strategic
officer, and they participate in Telkom's operating committee and continue to provide us with strategic direction. We paid
R219 million, R260 million and R260 million in the years ended March 31, 2002, 2001 and 2000, respectively, and R115 million
and R141 million in the six months ended September 30, 2002 and 2001, respectively, to our strategic equity investors for the
strategic services they provided to us pursuant to the strategic services agreement. We expect to continue to make payments to our
strategic equity investors for these services. See "Relationship with Major Shareholders and Related Transactions Shareholder
arrangements Strategic services agreement" beginning on page 148 of this prospectus.
38
Telcordia dispute
Telkom spent R594 million in the 2000 and 2001 financial years for the development and supply of an integrated end-to-end
customer assurance and activation system by Telcordia. In the 2001 financial year, the agreement with Telcordia was terminated.
Telkom wrote off R119 million of this investment in the 2001 financial year. Following an assessment of the viability of the assets
related to the Telcordia initiative, Telkom wrote-off the balance of these assets of R346 million in the 2002 financial year. In March
2001, Telcordia instituted arbitration proceedings against Telkom, seeking approximately $130 million for monies outstanding and
damages, plus interest at a rate of 15.5% per year. In September 2002, a partial ruling was issued by the arbitrator in favor of
Telcordia. Telkom has launched review proceedings in the South African High Court in respect of this partial ruling. The arbitration
proceedings and the amount of Telkom's liability are not expected to be finalized until late 2003 or early 2004. Telkom has
provided R373 million for its estimate of probable liabilities, including interest, in respect of the Telcordia claim in the Telkom
Group's consolidated financial statements as of September 30, 2002. See "Risk Factors Risks Related to Regulatory and Legal
Matters If Telcordia Technologies Incorporated, a New Jersey corporation, were able to recover substantial damages in its
arbitration proceedings against Telkom, Telkom would be required to fund such payments from cash flows or drawings on its
existing credit facilities, which could cause Telkom's indebtedness to increase and its net profit to decline" on page 18 and "Legal
Proceedings" on page 122 of this prospectus.
Vodacom's sale of non-core assets
Vodacom has sold off all its non-core assets in line with its strategy to focus on its core mobile business. These companies
included Teljoy Holdings (Proprietary) Limited, a television rental company incorporated in the Republic of South Africa; Vodacom
World Online (Proprietary) Limited, an internet company incorporated in the Republic of South Africa; and Vodacom Sport &
Entertainment (Proprietary) Limited, Vodacom's former sponsorship and event management company incorporated in the Republic
of South Africa. The sale of Vodacom's non-core assets in 2002, the write-off of Vodacom's investment in Globalstar, a satellite
network, in 2001, and the costs incurred in restructuring Vodacom's service providers in 2001, resulted in a profit of R56 million in
the year ended March 31, 2002, a loss of R213 million in the year ended March 31, 2001 and a profit of R129 million in the year
ended March 31, 2000. These amounts are attributable to our interest in Vodacom, 50% of which are included in the Telkom
Group's consolidated operating expenses. Vodacom intends to avoid future investment in non-core interests.
Theft, vandalism, network fraud and non-licensed operators
We have experienced significant cable theft, theft of solar panels and wireless communications equipment, vandalism of
payphones and network fraud, such as non-licensed calls, in our fixed-line business. Theft and vandalism have caused our fixed-line
fault rates to increase, and the repair time on our network and network downtime associated with such faults have resulted in lost
operating revenue and increased costs. We have also lost operating revenue to non-licensed operators providing telecommunications
services in South Africa. We estimate that we lost revenue of R174 million in the year ended March 31, 2002 from network fraud.
If we are unable to minimize theft, vandalism and network fraud, or if we continue to lose operating revenue to non-licensed
operators in our fixed-line business, our fixed-line fault rates could increase and our operating revenue and net profit could decline.
Recent developments
Property portfolio
On September 1, 2002, we issued an information memorandum inviting potential investors to provide to us by November 2002,
preliminary submissions to purchase a substantial portion of our fixed-line property portfolio and lease that property back to us.
This transaction is expected to involve over 1,400 properties ranging from warehouses and exchange buildings to our national
network operations center and is intended to further our strategy of focusing on our core businesses. We are currently reviewing the
bids we have received to date after having completed a due diligence process.
Summary of operations
Our operating results reflect the factors and changing patterns described in " Principal factors that affect our results of
operations" beginning on page 34 of this prospectus. The key business changes during the three years ended March 31, 2002, 2001
and 2000 and each of the six month periods ended September 30, 2002 and 2001 were:
increased revenues and profitability from our mobile segment due to an increased number of mobile customers;
increased revenues and profitability from our mobile and fixed-line data services;
increased fixed-line local traffic revenues and decreased fixed-line long distance and international traffic revenues due to tariff
rebalancing;
increased fixed-to-mobile traffic revenues;
reduced numbers of employees as we focused on improving the profitability of our fixed-line segment; and
significant capital expenditures to meet fixed-line license obligations in South Africa and support mobile expansion
in South Africa and other sub-Saharan African countries.
Our operating structure comprises two segments, fixed-line and mobile. Our fixed-line segment provides fixed-line voice and
data communications services through Telkom; directory services through our 64.9% owned subsidiary, Telkom Directory Services;
and wireless data services through our wholly-owned subsidiary, Swiftnet. Our mobile segment consists of our 50% interest in
Vodacom.

39
We proportionately consolidate Vodacom's results into the Telkom Group's consolidated financial statements. This means that
we include 50% of Vodacom's results in each of the line items in the Telkom Group's consolidated financial statements and in the
period-to-period discussion below. We fully consolidate our Telkom Directory Services and Swiftnet subsidiaries in the Telkom
Group's consolidated financial statements.
Results of operations
Six months ended September 30, 2002 compared to six months ended September 30, 2001
Consolidated results
The following table shows information related to our operating revenue, operating expenses, operating profit, net profit, profit
margin, EBITDA and EBITDA margin for the periods indicated.
Telkom Group's segmental results
Six months ended September 30,
Six months
2001
2002
2002/2001
ZAR
%
ZAR
%
% change
(unaudited)
(in millions, except percentages)
Operating revenue . . . . . . . . . . . . . .
16,523
100.0
18,316
100.0
10.9
Fixed-line . . . . . . . . . . . . . . . . . . .
13,658
82.6
14,563
79.5
6.6
Mobile . . . . . . . . . . . . . . . . . . . . .
3,762
22.8
4,720
25.8
25.5
Intercompany eliminations . . . . . . . . . .
(897)
(5.4)
(967)
(5.3)
7.8
Operating expenses . . . . . . . . . . . . .
14,355
100.0
15,505
100.0
8.0
Fixed-line . . . . . . . . . . . . . . . . . . .
12,243
85.3
12,669
81.7
3.5
Mobile . . . . . . . . . . . . . . . . . . . . .
2,975
20.7
3,800
24.5
27.7
Intercompany eliminations . . . . . . . . . .
(863)
(6.0)
(964)
(6.2)
11.7
Operating profit . . . . . . . . . . . . . . .
2,168
100.0
2,811
100.0
29.7
Fixed-line . . . . . . . . . . . . . . . . . . .
1,415
65.3
1,894
67.4
33.9
Mobile . . . . . . . . . . . . . . . . . . . .
787
36.3
920
32.7
16.9
Intercompany eliminations . . . . . . . . . .
(34)
(1.6)
(3)
(0.1)
91.2
Net profit . . . . . . . . . . . . . . . . . . .
371
100.0
644
100.0
73.6
Profit margin (%) . . . . . . . . . . . . . .
2.2
3.5
EBITDA
1
. . . . . . . . . . . . . . . . . . .
4,811
100
5,917
100.0
23.0
Fixed-line . . . . . . . . . . . . . . . . . . .
3,572
74.2
4,396
74.3
23.1
Mobile . . . . . . . . . . . . . . . . . . . . .
1,271
26.5
1,515
25.6
19.2
Intercompany eliminations . . . . . . . . . .
(32)
(0.7)
6
0.
1
(118.8)
EBITDA margin (%) . . . . . . . . . . . .
29.1
32.3
1
EBITDA represents operating profit before income tax, finance charges, investment income and depreciation and amortization. We believe that
EBITDA provides meaningful additional information to investors since it is widely accepted by analysts and investors as a basis for comparing a
company's underlying operating profitability with that of other companies as it is not influenced by past capital expenditures or business
acquisitions, a company's capital structure or the relevant tax regime. This is particularly the case in a capital-intensive industry such as
communications. It is also a widely accepted indicator of a company's ability to service its long-term debt and other fixed obligations and to fund
its continued growth. EBITDA is not a US GAAP or IAS measure. You should not construe EBITDA as an alternative to operating profit or cash
flows from operating activities determined in accordance with US GAAP or IAS or as a measure of liquidity. EBITDA is not defined in the same
manner by all companies and may not be comparable to other similarly titled measures of other companies unless the definition is the same. In
addition, because the calculation of EBITDA in the maintenance covenants contained in our credit facilities is based on accounting policies in use
at the time the indebtedness was incurred, EBITDA for purposes of those covenants is not calculated in the same manner as it is calculated in the
above table. Mobile EBITDA includes a net gain of R12.8 million and nil in the six months ended September 30, 2001 and 2002, respectively, for
our 50% share of Vodacom's integration costs, disposals of operations and impairments.
Operating revenue
Operating revenue increased 10.9% in the six months ended September 30, 2002 compared to the six months ended
September 30, 2001 primarily due to increased average tariffs in our fixed-line segment and customer growth in our mobile
segment. Fixed-line operating revenue accounted for 79.5% of our consolidated operating revenue before intercompany eliminations
during the six months ended September 30, 2002.

40
Operating expenses
Operating expenses increased 8.0% in the six months ended September 30, 2002 compared to the six months ended
September 30, 2001 due to increased operating expenses in our fixed-line and mobile segments. The increase in fixed-line operating
expenses was primarily due to increased depreciation, payments to other network operators and employee expenses. These increases
were partially offset by lower bad debt expense during the period and a reduction of the bad debt provision on our balance sheet
resulting from an improvement in the aging of receivables made possible by improvements in debtor management. The increase in
mobile operating expenses was primarily due to increased payments to other network operators, depreciation associated with
increased capital expenditures and selling and distribution expenses as a result of the growth in our mobile segment.
Operating profit
Operating profit increased 29.7% in the six months ended September 30, 2002 compared to the six months ended
September 30, 2001 due to increased operating profit in our fixed-line and mobile segments. Operating profit in our fixed-line
segment increased 33.9% in the six months ended September 30, 2002 compared to the six months ended September 30, 2001 as
higher revenue driven by tariff increases outpaced slower growth in operating expenses. Operating profit in our mobile segment
increased 16.9% in the six months ended September 30, 2002 compared to the six months ended September 30, 2001 primarily due
to substantial increases in the number of Vodacom's mobile customers and revenue and slower growth in operating expenses.
Investment income
Investment income consists of interest received on trade receivables, short-term investments and bank accounts and income
received from our investments, including satellite companies. Investment income decreased 50.3% to R152 million in the six
months ended September 30, 2002 from R306 million in the six months ended September 30, 2001. The decrease was
primarily due to lower interest received as a result of lower average balances in investments and bank accounts, the collection of an
R844 million receivable from the South African Revenue Services in the six months ended September 30, 2002 and a more rapid
collection of trade debtors.
Finance charges
Finance charges include interest paid on local and foreign borrowings, amortized discounts on bonds and commercial paper
bills, fair value gains and losses on financial instruments and foreign exchange gains and losses. We prospectively adopted IAS 39
in the 2002 financial year. Accordingly, the impact of IAS 39 was included in both six month periods ended September 30, 2002
and 2001. The following table sets forth information related to our finance charges for the periods indicated.
Finance Charges
Six months ended
Six months
September 30,
2002/2001
2001
2002
% change
ZAR
ZAR
ZAR
(unaudited)
(in millions, except percentages)
Interest expense . . . . . . . . . . . . . . . . . . . . . . . . . . . . . . .
1,420
1,412
(0.6)
Local loans . . . . . . . . . . . . . . . . . . . . . . . . . . . . . . . .
1,226
1,281
4.5
Foreign loans . . . . . . . . . . . . . . . . . . . . . . . . . . . . . . .
261
228
(12.6)
Finance charges capitalized . . . . . . . . . . . . . . . . . . . . . . .
(67)
(97)
44.8
Net fair value losses/(gains) on financial instruments . . . . . . . . . .
425
367
(13.6)
Total finance charges . . . . . . . . . . . . . . . . . . . . . . . . . . .
1,845
1,779
(3.6)
Finance charges decreased 3.6% in the six months ended September 30, 2002 compared to the six months ended
September 30, 2001 due to a 13.6% decrease in net fair value losses on financial instruments and a 0.6% decrease in interest
expense. The decrease in net fair value losses was primarily due to lower foreign denominated bank loans and foreign currency
denominated purchases. The decrease in interest expense was primarily due to lower balances on foreign loans and increased
finance charges capitalized due to an increased number of qualifying assets completed during the period, partially offset by
increased balances on local loans.

41
Taxation
Our consolidated tax expense increased significantly to R456 million in the six months ended September 30, 2002 from
R206 million in the six months ended September 30, 2001. Our consolidated effective tax rate was 38.5% and 32.8% in the six
months ended September 30, 2002 and 2001, respectively. Telkom's effective tax rate was 48.4% and 21.6% in the six months
ended September 30, 2002 and 2001, respectively. The increase in Telkom's consolidated effective tax rate was due to an increase
in non-deductible expenses primarily relating to expenses associated with the initial public offering. Vodacom's effective tax rate
was 34.1% and 30.3%, respectively, in the six months ended September 30, 2002 and 2001. The increase in consolidated tax
expense in the six months ended September 30, 2002 was primarily due to increased operating profit. South African companies
became subject to capital gains tax on October 1, 2001. As a result, we were previously not required to pay capital gains tax. See
"Taxation" beginning on page 173 of this prospectus.
Minority interests
Minority interests in the income of subsidiaries increased 61.5% to R84 million in the six months ended September 30, 2002
from R52 million in the six months ended September 30, 2001 due to increased profits in our Telkom Directory Services and
Swiftnet subsidiaries despite the decrease in minority ownership in these subsidiaries during the 2002 financial year. We acquired a
further 10% interest in Telkom Directory Services in October 2001 and the remaining 40% interest in Swiftnet in May 2001.
Net profit
Net profit increased 73.6% to R644 million in the six months ended September 30, 2002 from R371 million in the six months
ended September 30, 2001 primarily due to increased operating profit in both our fixed-line and mobile segments and decreased
finance charges, partially offset by lower investment income.
Fixed-line segment
The following is a discussion of the results of operations from our fixed-line segment before eliminations of intercompany
transactions with Vodacom. Our fixed-line segment is our largest segment based on revenue and profit contribution and includes all
the operating activities derived from Telkom's fixed-line voice and data communications services business, as well as directory
services through our 64.9% owned Telkom Directory Services subsidiary, and wireless data services through our wholly-owned
Swiftnet subsidiary.
Fixed-line operating revenue
Our fixed-line operating revenue is derived principally from fixed-line subscriptions and connections; traffic, which comprises
local and long-distance traffic, fixed-to-mobile traffic and international outgoing traffic; and interconnection, which comprises
terminating and transiting traffic. We also derive fixed-line operating revenue from our data business, which includes data
transmission services, managed data networking services and internet access and related information technology services; and our
directory businesses. The following table shows operating revenue for our fixed-line segment broken down by major business areas
and as a percentage of total revenue for our fixed-line segment and the percentage change by business area for the periods indicated.
Fixed-line operating revenue
Six months ended September 30,
2001
2002
Six months
% of
% of
2002/2001
ZAR
revenue
ZAR
revenue
% change
(unaudited)
(in millions, except percentages)
Subscriptions and connections . . . . . . .
2,208
16.2
2,239
15.4
1.4
Traffic . . . . . . . . . . . . . . . . . . . . .
8,495
62.2
8,911
61.2
4.9
Local . . . . . . . . . . . . . . . . . . . .
2,377
17.4
2,723
18.7
14.6
Long-distance . . . . . . . . . . . . . . .
1,994
14.6
1,787
12.3
(10.4)
Fixed-to-mobile . . . . . . . . . . . . . .
3,508
25.7
3,770
25.9
7.5
International outgoing . . . . . . . . . . .
616
4.5
631
4.3
2.4
Interconnection . . . . . . . . . . . . . . .
705
5.1
907
6.2
28.7
Data . . . . . . . . . . . . . . . . . . . . . .
1,881
13.8
2,112
14.5
12.3
Directories and other services . . . . . . .
369
2.7
394
2.7
6.8
Fixed-line operating revenue . . . . . . . .
13,658
100.0
14,563
100.0
6.6

42
Operating revenue from our fixed-line segment increased 6.6% in the six months ended September 30, 2002 compared to the six
months ended September 30, 2001 primarily due to increased average tariffs, partially offset by a decline in the number of fixed
access lines in service as a result of disconnections due to customer non-payments and customer migration to mobile services. Traffic
decreased 3.5% in the six months ended September 30, 2002 compared to the six months ended September 30, 2001. Revenue per
fixed access line continued to improve, increasing 7.1% to R2,456 in the six months ended September 30, 2002 compared to R2,294
in the six months ended September 30, 2001 as we increased our penetration of value-added voice services and higher revenue
generating access services and decreased the number of our fixed access lines. We also increased our data revenues in the six months
ended September 30, 2002 as demand for data services increased.
Subscriptions and connections. Revenue from subscriptions and connections consists of revenue from connection fees, monthly
rental charges, value-added voice services and the sale and rental of customer premises equipment for postpaid and prepaid PSTN
lines, which includes ISDN channels, and private payphones. We launched asynchronous digital subscriber line, or ADSL, service
in August 2002. Subscription and connection revenue is principally a function of the number and mix of residential and business
lines in service, the number of private payphones in service and the corresponding charges.
The following table sets forth information related to our fixed-line subscription and connection revenue during the periods indicated.
Fixed-line subscription and connection revenue
Six months ended September 30,
Six months
2002/2001
2001
2002
% change
(unaudited)
Total subscriptions and connections revenue
(ZAR millions, except percentages) . . . . . . . . . . . . . . . . . . .
2,208
2,239
1.4
Total subscription access lines (thousands, except percentages)
1
. . .
4,821
4,727
(1.9)
Postpaid . . . . . . . . . . . . . . . . . . . . . . . . . . . . . . . . .
4,182
3,929
(6.0)
PSTN
2
. . . . . . . . . . . . . . . . . . . . . . . . . . . . . . . .
3,761
3,407
(9.4)
ISDN channels . . . . . . . . . . . . . . . . . . . . . . . . . . . .
421
522
24.0
Prepaid . . . . . . . . . . . . . . . . . . . . . . . . . . . . . . . . .
615
780
26.8
Private payphones . . . . . . . . . . . . . . . . . . . . . . . . . . .
24
18
(25.0)
1
Total subscription access lines are comprised of PSTN lines, including ISDN lines, private payphones and internal lines in service, but excludes
public payphones. Telkom had 136,459 and 157,942 internal lines as of September 30, 2002 and 2001, respectively. Each PSTN line includes one
access channel, each basic ISDN line includes two access channels and each primary ISDN line includes 30 access channels.
2
PSTN lines include copper cable, ADSL, digital enhanced cordless technology, or DECT, and fiber.
Revenue from subscriptions and connections increased 1.4% in the six months ended September 30, 2002 compared to the six
months ended September 30, 2001 primarily due to an increase in average monthly subscriptions and connections tariffs, partially
offset by the lower number of fixed access lines in service as a result of disconnections due to customer non-payments and customer
migration to mobile services. The decrease in postpaid PSTN lines in the six months ended September 30, 2002 was partially offset by
increases in the number of postpaid ISDN channels, which have higher subscription rates than PSTN lines, and in the number of
prepaid PSTN lines. The increases in the number of postpaid ISDN channels was driven by increased demand for higher bandwidth
and functionality. The increase in prepaid lines was mainly due to our continued marketing efforts for our prepaid telephone services in
the six months ended September 30, 2002, particularly to first-time residential customers with poor or no credit histories.
For a discussion of our connection and rental fees, see "Business Fixed-line communications Fees and tariffs Subscription
and connection tariffs" beginning on page 102 of this prospectus and for a discussion of the number of customers during the
periods, see "Business Fixed-line communications Products and services" beginning on page 97 of this prospectus.
Traffic. Traffic revenue consists of revenue from local, long distance, fixed-to-mobile and international outgoing calls. Traffic
revenue is principally a function of tariffs and the number, duration and mix between relatively more expensive domestic
long distance, international and fixed-to-mobile calls and less expensive local calls.
The following table sets forth information related to our total fixed-line traffic revenue for the periods indicated.
Total fixed-line traffic revenue
Six months ended September 30,
Six months
2002/2001
2001
2002
% change
(unaudited)
Total traffic revenue (ZAR millions, except percentages) . . . . . . . .
8,495
8,911
4.9
Traffic (millions of minutes, except percentages)
1
. . . . . . . . . . . .
15,143
14,613
(3.5)
Average monthly traffic minutes per average monthly access line
(minutes)
2
. . . . . . . . . . . . . . . . . . . . . . . . . . . . . . . . .
523
512
(2.1)
1
Traffic is calculated by dividing total traffic revenues by the weighted average tariff during the relevant period. Traffic includes internet traffic.
2
Average traffic minutes per average monthly access line are calculated by averaging the total traffic during each month in the period divided by
the average number of access lines in each month during the period.

43
Traffic revenue increased 4.9% in the six months ended September 30, 2002 compared to the six months ended September 30,
2001 primarily due to increased local and fixed-to-mobile traffic tariffs, partially offset by lower long-distance and international
traffic tariffs. Traffic decreased 3.5% in the six months ended September 30, 2002 compared to the six months ended September 30,
2001 primarily due to lower local, fixed-to-mobile and long distance traffic, partially offset by increased international traffic. Traffic
was adversely affected in the six months ended September 30, 2002 by a decrease in the number of fixed access lines in service as a
result of disconnections due to customer non-payments and customer migration to mobile services. In addition, traffic was adversely
affected by the increasing substitution of calls placed using mobile services rather than our fixed-line service.
For a discussion of our traffic tariffs, see "Business Fixed-line communications Fees and tariffs Traffic tariffs" beginning
on page 103 of this prospectus and for a discussion of our traffic during the periods discussed, see "Business Fixed-line
communications Traffic" beginning on page 98 of this prospectus.
The following table sets forth information related to our fixed-line local traffic revenues for the periods indicated.
Local traffic revenue
Six months ended September 30,
Six months
2002/2001
2001
2002
% change
(unaudited)
Local traffic revenue (ZAR millions, except percentages) . . . . . . . .
2,377
2,723
14.6
Local traffic (millions of minutes, except percentages)
1
. . . . . . . . .
10,246
9,870
(3.7)
1
Local traffic is calculated by dividing total local traffic revenue by the weighted average local traffic tariff during the relevant period.
Local traffic includes internet traffic
Local traffic revenue increased 14.6% in the six months ended September 30, 2002 compared to the six months ended
September 30, 2001 primarily due to increased local traffic tariffs and a change in the mix of call packages, partially offset by a
decline in local traffic. Local traffic decreased 3.7% in the six months ended September 30, 2002 compared to the six months ended
September 30, 2001. Local traffic was adversely affected by a decrease in the number of fixed access lines in service in the six
months ended September 30, 2002 as a result of disconnections due to customer non-payments and customer migration to mobile
services. In addition, local traffic was adversely affected by the increasing substitution of local calls placed using mobile services
rather than our fixed-line service.
The following table sets forth information related to our fixed-line long distance traffic revenue for the periods indicated.
Long distance traffic revenue
Six months ended September 30,
Six months
2002/2001
2001
2002
% change
(unaudited)
Long distance traffic revenue (ZAR millions, except percentages) . . . .
1,994
1,787
(10.4)
Long distance traffic (millions of minutes, except percentages)
1
. . . . .
2,492
2,445
(1.9)
1
Long distance traffic is calculated by dividing total long distance traffic revenue by the weighted average long distance traffic tariff during the
relevant period.
Long distance traffic revenue decreased 10.4% in the six months ended September 30, 2002 compared to the six months ended
September 30, 2001 primarily due to decreased long distance traffic tariffs and decreased long distance traffic. Long distance traffic
decreased 1.9% in the six months ended September 30, 2002 compared to the six months ended September 30, 2001. Long distance
traffic was adversely impacted by a decrease in the number of fixed access lines in service during the six months ended September 30,
2002 as a result of disconnections due to customer non-payments and customer migration to mobile services. In addition, long
distance traffic was adversely affected by the increasing substitution of national long distance calls using mobile services rather than
our fixed-line long distance service. Historically, fixed-line long distance traffic tariffs were higher than the price of mobile calls,
which are not distance dependent. We have reduced our long-distance traffic tariffs to below mobile tariffs over the past five years
as a result of our tariff rebalancing program.
Revenue from fixed-to-mobile traffic consists of revenue from calls made by our fixed-line customers to the three mobile
networks in South Africa and is primarily a function of fixed-to-mobile traffic tariffs and the number, duration and mix of calls
between fixed-line and mobile customers.

44
The following table sets forth information related to our fixed-to-mobile traffic revenue for the periods indicated.
Fixed-to-mobile traffic revenue
Six months ended September 30,
Six months
2002/2001
2001
2002
% change
(unaudited)
Fixed-to-mobile traffic revenue (ZAR millions, except percentages) . .
3,508
3,770
7.5
Fixed-to-mobile traffic (millions of minutes, except percentages)
1
. . .
2,221
2,079
(6.4)
1
Fixed-to-mobile traffic is calculated by dividing total fixed-to-mobile traffic revenue by the weighted average fixed-to-mobile traffic tariff during
the relevant period.
Fixed-to-mobile traffic revenue increased 7.5% in the six months ended September 30, 2002 compared to the six months ended
September 30, 2001 primarily due to fixed-to-mobile traffic tariff increases as a result of the amendment of our interconnection
agreement with MTN and Vodacom and our new interconnection agreement with Cell C effective in November 2001, partially
offset by a decrease in fixed-to-mobile traffic and a change in the mix of call packages and associated discounts. Fixed-to-mobile
traffic decreased 6.4% in the six months ended September 30, 2002 compared to the six months ended September 30, 2001 as a
result of an effective 15.5% increase in tariffs in November 2001 and a decrease in the number of fixed-line subscribers due to
disconnections for customer non-payments and customer migration to mobile services and due to the growth in mobile users
resulting in the increasing substitution of mobile-to-mobile calls that are not routed over our fixed-line network.
Revenue from international outgoing traffic consists of revenue from calls made by our fixed-line customers to international
destinations and is a function of tariffs and the number, duration and mix of calls to destinations outside South Africa.
The following table sets forth information related to our international outgoing traffic revenue for the periods indicated.
International outgoing traffic revenue
Six months ended September 30,
Six months
2002/2001
2001
2002
% change
(unaudited)
International outgoing traffic revenue (ZAR millions, except percentages) . .
616
631
2.4
International outgoing traffic (millions of minutes, except percentages)
1
. . . .
184
219
19.0
1
International outgoing traffic is calculated by dividing total international outgoing traffic revenue by the weighted average international outgoing
traffic tariff during the relevant period.
International outgoing traffic revenue increased 2.4% in the six months ended September 30, 2002 compared to the six months
ended September 30, 2001 primarily due to increased international outgoing traffic and a change in the mix of calling destinations,
partially offset by decreases in average international outgoing traffic tariffs as a result of our tariff rebalancing program.
International outgoing traffic increased 19.0% in the six months ended September 30, 2002 compared to the six months ended
September 30, 2001 primarily due to lower tariffs associated with our tariff rebalancing program and increased marketing efforts.
Interconnection. We generate revenue from interconnection services for traffic from calls made by other operators' subscribers
that terminate on or transit through our network. Revenue from interconnection services includes payments from domestic mobile
and international operators regardless of where the traffic originates or terminates.

45
The following table sets forth information related to interconnection service revenue for the periods indicated.
Interconnection revenue
Six months ended September 30,
Six months
2002/2001
2001
2002
% change
(unaudited)
Interconnection revenue (ZAR millions, except percentages) . . . .
705
907
28.7
Domestic mobile interconnection
Interconnection revenue from domestic mobile operators
(ZAR millions, except percentages) . . . . . . . . . . . . . . . . . . .
261
284
8.8
Domestic mobile interconnection traffic (millions of minutes,
except percentages)
1
. . . . . . . . . . . . . . . . . . . . . . . . . . .
975
1,034
6.1
International interconnection
Interconnection revenue from international operators
(ZAR millions, except percentages) . . . . . . . . . . . . . . . . . . .
444
623
40.3
International interconnection traffic (millions of minutes,
except percentages)
2
. . . . . . . . . . . . . . . . . . . . . . . . . . .
502
498
(0.8)
1
Domestic mobile-to-fixed interconnection traffic is calculated by dividing total domestic mobile-to-fixed interconnection traffic revenue by the
weighted average domestic mobile-to-fixed interconnection traffic tariff during the relevant period. International outgoing mobile traffic is based
on the actual traffic registered through the respective exchanges and reflected in invoices.
2
International interconnection traffic is based on the actual traffic registered through the respective exchanges and reflected in invoices.
Interconnection revenue from domestic mobile operators includes revenue for call termination and international outgoing calls
from domestic mobile networks, as well as access to other services, such as emergency services and directory enquiry services.
Interconnection revenue from domestic mobile operators increased 8.8% in the six months ended September 30, 2002 compared to
the six months ended September 30, 2001 due to a reduction in the number of time bands for peak and off peak tariffs from three to
two, effectively increasing mobile termination rates, and increased mobile-to-fixed terminating traffic. The increase in mobile-to-
fixed terminating traffic was due to an overall increase in mobile calls as a result of the introduction of per second billing by mobile
operators and the entrance of Cell C into the mobile market.
Interconnection revenue from domestic operators includes fees paid to our fixed-line business by Vodacom of R164 million in
the six months ended September 30, 2002 and R159 million in the six months ended September 30, 2001. Fifty percent of these
amounts were attributable to our interest in Vodacom and were eliminated from the Telkom Group's revenue in consolidation.
We expect interconnection revenue from domestic operators to increase as a result of the entrance of the second national operator in
2003 or the first quarter of 2004 and the further liberalization of the South African telecommunications industry.
Interconnection revenue from international operators includes amounts paid by foreign operators for the use of our network to
terminate calls made by customers of such operators and payments from foreign operators for interconnection transiting traffic
through our network to other foreign networks. International interconnection traffic consists of international termination traffic and
international transiting traffic. Interconnection revenue from international operators increased 40.3% in the six months ended
September 30, 2002 compared to the six months ended September 30, 2001 due to an increase in international interconnection
tariffs, increases in the Rand value of international settlement rates due to a decline in the value of the Rand against the SDR, the
notional currency in which international traffic settlement rates are determined, and increases in international termination traffic.
These increases were partially offset by decreases in international transiting traffic due to aggressive competition from other
international carriers.
Data. Data services comprise data transmission services, including leased lines and packet-based services, managed data
networking services and internet access and related information technology services. In addition, data services include revenue from
ADSL, which we launched in August 2002. Revenue from data services is principally a function of tariffs, the terms of a customer's
service level agreement and monthly rentals.

46
The following table sets forth information related to revenue from data services for the periods indicated.
Data services revenue
Six months ended September 30,
Six months
2002/2001
2001
2002
% change
(unaudited)
Data services revenue (ZAR millions, except percentages) . . . . . .
1,881
2,112
12.3
Leased lines and other data revenue
1
. . . . . . . . . . . . . . . . . .
1,476
1,621
9.8
Leased line facilities revenue from mobile operators . . . . . . . . .
405
491
21.2
Number of leased lines
2
. . . . . . . . . . . . . . . . . . . . . . . . .
n/a
355,533
n/a
Number of managed network sites . . . . . . . . . . . . . . . . . . .
5,113
6,636
29.8
1
Leased lines and other data revenue includes all data services revenue other than leased line facilities revenue from mobile operators.
2
Converted into voice grade equivalents using 64 kilobits per second, excludes leased lines to mobile operators. We replaced our data billing and
customer care systems in July 2002. Our new systems exclude non-revenue generating lines from the definition of leased lines. As a result, we are
not able to provide comparable leased lines for the six months ended September 30, 2001.
Our data services revenue increased 12.3% in the six months ended September 30, 2002 compared to the six months ended
September 30, 2001. The increase was primarily due to increased penetration of leased lines to mobile operators and increased
penetration of leased lines in corporate and business markets, increased demand for bandwidth with higher capacity and increased
numbers of customers using data managed networking services. Revenue from leased line facilities to mobile operators increased
21.2% in the six months ended September 30, 2002 compared to the six months ended September 30, 2001 primarily due to growth
in the mobile market and the introduction of Cell C in November 2001. Operating revenue from our data services included
R231 million and R191 million in revenue received by our fixed-line business from Vodacom in the six months ended September 30,
2002 and 2001, respectively. Fifty percent of these amounts were attributable to our interest in Vodacom and were eliminated from
the Telkom Group's revenue in consolidation.
For a discussion of our data services, see "Business Fixed-line communications Products and services Data
communications services" beginning on page 99 of this prospectus.
Directories and other services. Revenue from directories and other services consists primarily of advertising revenue from our
subsidiary, Telkom Directory Services, and, to a substantially lesser degree, wireless data services revenue from our subsidiary,
Swiftnet, and other miscellaneous revenue, including revenue from the sale of materials. Revenue from directories and other
services increased 6.8% in the six months ended September 30, 2002 compared to the six months ended September 30, 2001 due to
increases in directory services revenue from Telkom Directory Services as a result of increased marketing efforts resulting in
increased spending on advertising by existing customers and additional advertising revenue from new customers.
Fixed-line operating expenses
The following table shows the operating expenses of our fixed-line segment broken down by expense category as a percentage of
total revenue and the percentage change by operating expense category for the periods indicated.
Fixed-line operating expenses
Six months ended September 30,
2001
2002
Six months
% of
% of
2002/2001
ZAR
revenue
ZAR
revenue
% change
(unaudited)
(in millions, except percentages)
Employee expenses . . . . . . . . . . . . . .
3,341
24.5
3,460
23.7
3.6
Payments to other network operators . . . .
3,161
23.1
3,443
23.6
8.9
Selling, general and administrative
expenses . . . . . . . . . . . . . . . . . .
1,943
14.2
1,595
11.0
(17.9)
Services rendered . . . . . . . . . . . . . . .
1,073
7.9
1,086
7.5
1.2
Operating leases . . . . . . . . . . . . . . . .
567
4.1
583
4.0
2.8
Depreciation and amortization . . . . . . . .
2,158
15.8
2,502
17.2
15.9
Fixed-line operating expenses . . . . . . . .
12,243
89.6
12,669
87.0
3.5
Employee expenses. Employee expenses consist mainly of salaries and wages for employees, including bonuses and other
incentives, benefits and employee retrenchment expenses.

47
The following table sets forth information related to our employee expenses for the periods indicated.
Fixed-line employee expenses
Six months ended September 30,
Six months
2002/2001
2001
2002
% change
(unaudited)
(ZAR millions, except percentages and
average number of employees)
Salaries and wages . . . . . . . . . . . . . . . . . . . . . . . . . . . .
2,231
1,990
(10.8)
Benefits . . . . . . . . . . . . . . . . . . . . . . . . . . . . . . . . . .
1,235
1,470
19.0
Employee retrenchment expenses . . . . . . . . . . . . . . . . . . . .
195
169
(13.3)
Employee related expenses capitalized . . . . . . . . . . . . . . . . . .
(320)
(169)
(47.2)
Employee expenses . . . . . . . . . . . . . . . . . . . . . . . . . . . .
3,341
3,460
3.6
Number of fixed-line employees (at period end)
1
. . . . . . . . . . .
42,573
38,589
(9.4)
1
Includes employees of Swiftnet and Telkom Directory Services.
Employee expenses increased 3.6% in the six months ended September 30, 2002 compared to the six months ended
September 30, 2001 primarily due to higher benefits and lower employee related expenses capitalized, partially offset by lower
salaries and wages and employee retrenchment expenses.
Salaries and wages decreased 10.8% in the six months ended September 30, 2002 compared to the six months ended
September 30, 2001 primarily due to a decrease in the number of employees in the six months ended September 30, 2002 as a
result of our staff reduction program, reduced overtime and reduced part-time and temporary workers, partially offset by a 7.5%
increase in base salaries and wages pursuant to collective bargaining agreements.
Benefits include bonuses, company contributions to medical aid, pension and retirement funds, leave provisions, workmen's
compensation and levies payable for skills development. Benefits increased 19.0% in the six months ended September 30, 2002
compared to the six months ended September 30, 2001 primarily due to the accrual of bonuses in that period. Bonuses were not
accrued in the six months ended September 30, 2001 because our financial and performance targets were not met during the first half
of the 2002 financial year.
Employee retrenchment expenses include the cost of voluntary early retirement and termination severance packages offered to
employees. Employee retrenchment expenses also include the cost of social plan expenses to equip redundant employees for new
careers outside Telkom. Employee retrenchment expenses decreased 13.3% in the six months ended September 30, 2002 compared
to the six months ended September 30, 2001 as lower numbers of employees were retrenched during this period. Employee
retrenchment expenses in the six months ended September 30, 2002 includes a R110 million provision for employees identified as
of September 30, 2002 for retrenchment in future periods pursuant to our current retrenchment program. We retrenched 498
employees in the six months ended September 30, 2002 compared to 1,102 employees in the six months ended September 30, 2001.
For additional information related to our fixed-line employee numbers, see "Business Fixed-line communications Employees"
beginning on page 111 of this prospectus.
Employee related expenses capitalized include employee related expenses associated with construction and infrastructure
development projects that are recorded as work-in-progress until construction is completed. Employee related expenses capitalized
decreased 47.2% in the six months ended September 30, 2002 compared to the six months ended September 30, 2001 primarily due to
reduced capital expenditures during the period. Capital expenditures were 43.5% lower in the six months ended September 30, 2002
compared to the six months ended September 30, 2001.
Payments to other network operators. Payments to other network operators include settlement payments paid to the three South
African mobile communications network operators for terminating calls on their networks and to international network operators
for terminating outgoing international calls and traffic transiting through their networks.
The following table sets forth information related to our payments to other network operators for the periods indicated.
Fixed-line payments to other network operators
Six months ended September 30,
2001
2002
Six months
2002/2001
ZAR
ZAR
% change
(unaudited)
(in millions, except percentages)
Payments to mobile communications network operators . . . . . . . . .
2,570
2,683
4.4
Payments to international network operators . . . . . . . . . . . . . . .
591
760
28.6
Payments to other network operators . . . . . . . . . . . . . . . . .
3,161
3,443
8.9

48
Payments to other network operators increased 8.9% in the six months ended September 30, 2002 compared to the six months
ended September 30, 2001. The increase was primarily due to increased termination rates from November 2001 pursuant to our
amended interconnection agreements with the mobile operators, increases in the Rand value of international settlement rates due to
the decline in the value of the Rand against the SDR and increased international outgoing traffic.
Payments to other network operators include payments made by our fixed-line business to Vodacom, which were R1,518 million
in the six months ended September 30, 2002 and R1,426 million in the six months ended September 30, 2001. Fifty percent of
these amounts were attributable to our interest in Vodacom and were eliminated from the Telkom Group's expenses in
consolidation.
Selling, general and administrative expenses. Selling, general and administrative expenses include materials and maintenance
costs, marketing expenditures, bad debts, asset write-offs, theft and other expenses, including obsolete stock, costs of sales and the
profit or loss on the sale of assets.
The following table sets forth information related to our fixed-line selling, general and administrative expenses for the periods
indicated.
Fixed-line selling, general and administrative expenses
Six months ended September 30,
2001
2002
Six months
2002/2001
ZAR
ZAR
% change
(unaudited)
(in millions, except percentages)
Materials and maintenance . . . . . . . . . . . . . . . . . . . . . . . .
1,082
1,068
(1.3)
Marketing . . . . . . . . . . . . . . . . . . . . . . . . . . . . . . . . .
136
116
(14.7)
Bad debts . . . . . . . . . . . . . . . . . . . . . . . . . . . . . . . . .
510
75
(85.3)
Asset write-offs . . . . . . . . . . . . . . . . . . . . . . . . . . . . . .
14
6
(57.1)
Other . . . . . . . . . . . . . . . . . . . . . . . . . . . . . . . . . . . .
201
330
64.2
Selling, general and administrative expenses . . . . . . . . . . . . .
1,943
1,595
(17.9)
Selling, general and administrative expenses decreased 17.9% in the six months ended September 30, 2002 compared to the six
months ended September 30, 2001 primarily due to reduced bad debts, materials and maintenance, marketing expenses and asset
write-offs, partially offset by expenses associated with the initial public offering in the six months ended September 30, 2002 and
higher capitalized expenses in the six months ended September 30, 2001.
Materials and maintenance expenses include stock write-offs, subcontractors' payments and consumables required to maintain
our network. Materials and maintenance expenses decreased 1.3% in the six months ended September 30, 2002 compared to the six
months ended September 30, 2001 due to improved efficiencies.
Marketing expenses decreased 14.7% in the six months ended September 30, 2002 compared to the six months ended
September 30, 2001 primarily due to the delayed implementation of advertising and customer retention programs. We expect
marketing expenses to increase in the second half of the 2003 financial year in preparation for increased competition from the
second national operator.
Bad debts decreased 85.3% in the six months ended September 30, 2002 compared to the six months ended September 30, 2001.
We implemented a new receivables aging system during the six months ended September 30, 2001 that enabled us to better manage
receivables. As a result, bad debt expense declined due to the application of our improved credit management and vetting policies
during the period and a reduction of the bad debt provision on our balance sheet by R178 million as of September 30, 2002.
Asset write-offs decreased 57.1% in the six months ended September 30, 2002 compared to the six months ended
September 30, 2001 primarily due to the write off of fewer network assets in the six months ended September 30, 2002
following an intensive asset verification process through March 31, 2002.
Other expenses include obsolete stock, cost of sales, subsistence and travel, the profit or loss on the sale of assets, an offset from
bad debts recovered and costs and expenses related to our initial public offering. Other expenses increased 64.2% in the six months
ended September 30, 2002 compared to the six months ended September 30, 2001 primarily due to expenses related to our initial
public offering, higher costs of goods sold for customer premises equipment in the six months ended September 30, 2002 and
higher capitalized expenses in the six months ended September 30, 2001. On December 30, 2002, we disposed of our participating
interests in Intelsat.

49
Services rendered. Services rendered include payments in respect of the management of our properties, consultants and security.
Consultants comprise fees paid to debtors and collection agents and to providers of other professional services, such as Thintana
Communications. Security refers to contracts to ensure a safe work environment, such as guard services. The following table sets
forth information relating to services rendered expenses for the periods indicated.
Fixed-line services rendered
Six months ended September 30,
2001
2002
Six months
2002/2001
ZAR
ZAR
% change
(unaudited)
(in millions, except percentages)
Property management . . . . . . . . . . . . . . . . . . . . . . . . . .
515
534
3.7
Consultants and security . . . . . . . . . . . . . . . . . . . . . . . . .
558
552
(1.1)
Services rendered . . . . . . . . . . . . . . . . . . . . . . . . . . . .
1,073
1,086
1.2
Property management increased 3.7% in the six months ended September 30, 2002 compared to the six months ended September
30, 2001 as a result of increases in utilities and maintenance expenses. Consultants and security payments remained relatively flat,
decreasing 1.1% in the six months ended September 30, 2002 compared to the six months ended September 30, 2001. Consultants and
security payments included R115 million and R141 million of fees paid to our strategic equity investor, Thintana Communications, in
the six months ended September 30, 2002 and 2001, respectively, pursuant to our strategic services agreement. A portion of payments
made to Thintana Communications relate to projects and have been capitalized.
Operating leases. Operating leases include payments in respect of equipment, buildings and vehicles. Operating leases increased
2.8% in the six months ended September 30, 2002 compared to the six months ended September 30, 2001 primarily due to
increased expenses in connection with surveillance and monitoring equipment leases to protect against theft and partially due to
increased vehicle lease expenses. The decrease in expenses due to the decrease in our vehicle fleet from 18,630 vehicles at
September 30, 2001 to 15,133 vehicles at September 30, 2002 was offset by significant expenses associated with upgrades to our
vehicle fleet.
Depreciation and amortization. Depreciation and amortization increased 15.9% in the six months ended September 30, 2002
compared to the six months ended September 30, 2001 primarily due to investment in support equipment and buildings in prior
periods. Investment in network support equipment increased due to increased investment in payphones, cables, switching and
transmission equipment and process control and surveillance equipment for our national network operations center. Capital
investment in the six months ended September 30, 2002 shifted to assets with shorter useful lives as our capital expenditure
program shifted from network rollout to network support and infrastructure.
Fixed-line operating profit
The following table shows information related to the operating profit and EBITDA for our fixed-line segment for the periods
indicated.
Fixed-line operating profit
Six months ended September 30,
Six months
2002/2001
2001
2002
% change
(unaudited)
(in millions, except percentages)
Operating profit (ZAR) . . . . . . . . . . . . . . . . . . . . . . . . . .
1,415
1,894
33.9
Operating margin (%) . . . . . . . . . . . . . . . . . . . . . . . . . . .
10.4
13.0
EBITDA (ZAR)
1
. . . . . . . . . . . . . . . . . . . . . . . . . .
3,572
4,396
23.1
EBITDA margin (%) . . . . . . . . . . . . . . . . . . . . . . . . . . .
26.2
30.2
1
Our fixed-line EBITDA represents fixed-line operating profit before income tax, finance charges, investment income and depreciation and
amortization. We believe that EBITDA provides meaningful additional information to investors since it is widely accepted by analysts and
investors as a basis for comparing a company's underlying operating profitability with that of other companies as it is not influenced by past
capital expenditures or business acquisitions, a company's capital structure or the relevant tax regime. This is particularly the case in a capital-
intensive industry such as communications. It is also a widely accepted indicator of a company's ability to service its long-term debt and other
fixed obligations and to fund its continued growth. EBITDA is not a US GAAP or IAS measure. You should not construe EBITDA as an
alternative to operating profit or cash flows from operating activities determined in accordance with US GAAP or IAS or as a measure of
liquidity. EBITDA is not defined in the same manner by all companies and may not be comparable to other similarly titled measures of other
companies unless the definition is the same.
Fixed-line operating profit increased 33.9% in the six months ended September 30, 2002 compared to the six months ended
September 30, 2001 primarily due to higher revenue driven by tariff increases outpacing slower growth in operating expense,
primarily due to improved controls of expenses, including debtors, and a one-time adjustment in the reserve for bad debt of
R178 million.

50
Mobile segment
Mobile is our fastest growing segment and encompasses all the operating activities of our 50% joint venture investment in
Vodacom, the largest mobile operator in South Africa with an approximate 59% market share as of September 30, 2002 based on
total reported customers. In addition to its South African operations,Vodacom has investments in mobile communications network
operators in Lesotho, Tanzania and the Democratic Republic of the Congo. Vodacom commenced its network rollout in the
Democratic Republic of the Congo in December 2001 and relaunched under the Vodacom brand in May 2002. Vodacom also has an
investment in an entity that, in August 2002, was granted a license to operate a mobile communications network in Mozambique.
Vodacom is currently seeking to enter into interconnection agreements with local operators in Mozambique and does not intend to
commence service in Mozambique unless commercially acceptable terms are agreed. Vodacom is the largest mobile operator in
Africa based on total reported customers. Vodacom's operations outside of South Africa are at an earlier stage in their expansion
and market penetration than its operations in South Africa. As a result, Vodacom's customer acquisition costs and capital
expenditures per customer for its other African operations are higher and its operating margins are generally lower than for its
South African operations. Customers in other African countries increased 229% to 540,328 in the six months ended September 30,
2002 compared to the six months ended September 30, 2001. A substantial portion of the growth was from prepaid services.
Services outside of South Africa are mainly prepaid due to the lack of banking systems and credit histories.
The following table shows information related to our 50% share of Vodacom's operating revenue and operating profit broken
down by Vodacom's South African operations and operations in other African countries for the periods indicated. All amounts in
this table and the discussion of our mobile segment that follows represent 50% of Vodacom's results of operations unless otherwise
stated and are before the elimination of intercompany transactions with us.
Mobile operating revenues and profits
Six months ended September 30,
Six months
2001
2002
2002/2001
ZAR
%
ZAR
%
% change
(unaudited)
(in millions, except percentages)
Operating revenue . . . . . . . . . . . . . .
3,762
100.0
4,720
100.0
25.5
South Africa . . . . . . . . . . . . . . . . . .
3,648
97.0
4,446
94.2
21.9
Other African countries . . . . . . . . . . . .
114
3.0
274
5.8
140.4
Operating profit . . . . . . . . . . . . . . .
787
100.0
920
100.0
16.9
South Africa . . . . . . . . . . . . . . . . . .
787
100.0
943
102.6
19.8
Other African countries . . . . . . . . . . . .
(23)
(2.6)
n/a
EBITDA
1
. . . . . . . . . . . . . . . . . . .
1,271
100.0
1,515
100.0
19.2
South Africa . . . . . . . . . . . . . . . . . .
1,253
98.6
1,483
97.9
18.4
Other African countries . . . . . . . . . . . .
18
1.4
32
2.1
77.8
1
Our mobile EBITDA comprises our 50% share of Vodacom's EBITDA, which represents mobile operating profit before income tax, finance
charges, investment income and depreciation and amortization. We believe that EBITDA provides meaningful additional information to investors
since it is widely accepted by analysts and investors as a basis for comparing a company's underlying operating profitability with that of other
companies as it is not influenced by past capital expenditures or business acquisitions, a company's capital structure or the relevant tax regime.
This is particularly the case in a capital-intensive industry such as communications. It is also a widely accepted indicator of a company's ability to
service its long-term debt and other fixed obligations and to fund its continued growth. EBITDA is not a US GAAP or IAS measure. You should
not construe EBITDA as an alternative to operating profit or cash flows from operating activities determined in accordance with US GAAP or IAS
or as a measure of liquidity. EBITDA is not defined in the same manner by all companies and may not be comparable to other similarly titled
measures of other companies unless the definition is the same. Mobile EBITDA includes a net gain of R12.8 million and nil in the six months
ended September 30, 2001 and 2002, respectively, for our 50% share of Vodacom's integration costs, disposals of operations and impairments.
Mobile operating revenue
Vodacom derives revenue from mobile services as well as other related or value added goods and services. Vodacom's revenue is
mainly in the form of airtime charges, primarily airtime payments from customers registered on Vodacom's network;
interconnection revenue from other operators for the termination of calls on Vodacom's network and national roaming revenue from
Cell C; revenue from equipment sales, including sales of handsets and accessories; and revenue from international services,
including airtime charges for the use of Vodacom's network through roaming of customers from other international networks.

51
The following table shows our 50% share of Vodacom's revenue broken down by major business area and as a percentage of
total operating revenue for our mobile segment and the percentage change by business area for the periods indicated.
Mobile operating revenue
Six months ended September 30,
Six months
2001
2002
2002/2001
ZAR
%
ZAR
%
% change
(in millions, except percentages)
(unaudited)
Airtime . . . . . . . . . . . . . . . . . . . .
2,219
59.0
2,531
53.6
14.1
Interconnection . . . . . . . . . . . . . . . .
959
25.5
1,277
27.1
33.2
Equipment sales . . . . . . . . . . . . . . . .
376
10.0
653
13.8
73.7
International services . . . . . . . . . . . . .
113
3.0
171
3.6
51.3
Other sales and services . . . . . . . . . . .
95
2.5
88
1.9
(7.4)
Mobile operating revenue . . . . . . . . . .
3,762
100.0
4,720
100.0
25.5
The following table sets forth non-financial operational data of Vodacom for the periods indicated. The amounts stated for
customers and traffic minutes reflect 100% of Vodacom's customers and traffic minutes.
Six months ended September 30,
Six months
2001
2002
2002/2001
ZAR
ZAR
% change
(unaudited)
South Africa
Customers (thousands) (at period end)
1
. . . . . . . . . . . . . . . .
5,657
7,130
26.0
Contract . . . . . . . . . . . . . . . . . . . . . . . . . . . . . . . . .
1,062
1,139
7.3
Prepaid . . . . . . . . . . . . . . . . . . . . . . . . . . . . . . . . .
4,569
5,961
30.5
Community services . . . . . . . . . . . . . . . . . . . . . . . . . .
26
30
15.4
Traffic minutes (millions of minutes)
2
. . . . . . . . . . . . . . . . .
4,229
5,007
18.4
Outgoing . . . . . . . . . . . . . . . . . . . . . . . . . . . . . . . .
2,307
2,994
29.8
Incoming (Interconnection) . . . . . . . . . . . . . . . . . . . . . . .
1,922
2,013
4.7
MOU (minutes)
3
. . . . . . . . . . . . . . . . . . . . . . . . . . . . .
114
102
(10.5)
Contract . . . . . . . . . . . . . . . . . . . . . . . . . . . . . . . . .
265
269
1.5
Prepaid . . . . . . . . . . . . . . . . . . . . . . . . . . . . . . . . .
59
53
(10.2)
Community services . . . . . . . . . . . . . . . . . . . . . . . . . .
3,246
3,215
(1.0)
ARPU (ZAR)
4, 5
. . . . . . . . . . . . . . . . . . . . . . . . . . . . . .
190
181
(4.7)
Contract
5
. . . . . . . . . . . . . . . . . . . . . . . . . . . . . . . .
551
612
11.1
Prepaid . . . . . . . . . . . . . . . . . . . . . . . . . . . . . . . . .
94
88
(6.4)
Community services . . . . . . . . . . . . . . . . . . . . . . . . . .
1,710
1,766
3.3
Churn (%)
6
. . . . . . . . . . . . . . . . . . . . . . . . . . . . . . . .
31.3
30.7
(1.9)
Contract . . . . . . . . . . . . . . . . . . . . . . . . . . . . . . . . .
16.6
13.2
(20.5)
Prepaid . . . . . . . . . . . . . . . . . . . . . . . . . . . . . . . . .
34.8
34.3
(1.4)
Other African countries
Customers (thousands) (at period end)
1
. . . . . . . . . . . . . . . .
164
540
229.3
Lesotho . . . . . . . . . . . . . . . . . . . . . . . . . . . . . . . . .
30
92
206.7
Tanzania . . . . . . . . . . . . . . . . . . . . . . . . . . . . . . . .
134
306
128.4
Democratic Republic of the Congo . . . . . . . . . . . . . . . . . .
n/a
142
n/a
ARPU
4
Lesotho (ZAR) . . . . . . . . . . . . . . . . . . . . . . . . . . . . .
n/a
87
n/a
Tanzania (USD) . . . . . . . . . . . . . . . . . . . . . . . . . . . . .
n/a
23
n/a
Democratic Republic of the Congo (USD) . . . . . . . . . . . . . . .
n/a
22
n/a
52
1
Customer totals are based on the total number of customers registered on Vodacom's network, which have not been disconnected, including
inactive customers, as of the end of the period indicated. 15.1% of Vodacom's total reported customers, 17.0% of its prepaid customers and 4.9%
of its contract customers in South Africa were inactive as of September 30, 2002. See "Business Mobile communications South Africa
Customers" on page 115 of this prospectus for a discussion of Vodacom's procedures with respect to disconnections and inactive customers.
2
Vodacom's traffic comprises total traffic registered on Vodacom's network, including bundled minutes, outgoing international roaming calls and
calls to free services, but excluding national and incoming international roaming calls.
3
Vodacom's MOU is calculated by dividing the average monthly minutes during the period by the average monthly total reported customer base
during the period. MOU excludes calls to free services, bundled minutes and data minutes.
4
ARPU is calculated by dividing the average monthly revenue during the period by the average monthly total reported customer base during the
period. ARPU excludes revenue from equipment sales, other sales and services and revenue from national and international users roaming on
Vodacom's networks.
5
Value added service revenue from previously partially owned service providers is included in contract and total average monthly revenue per
customer from October 1, 2001, at which time Vodacom consolidated these previously partially owned service providers.
6
Churn is calculated by dividing the average monthly total number of disconnections during the period by the average monthly total reported
customer base during the period.
Vodacom's operating revenue increased 25.5% in the six months ended September 30, 2002 compared to the six months ended
September 30, 2001 primarily due to customer growth. Vodacom's revenue from operations outside of South Africa increased from
R114 million in the six months ended September 30, 2001 to R274 million in the six months ended September 30, 2002 primarily
due to a substantial increase in the number of customers in Vodacom's Tanzania, Democratic Republic of the Congo and Lesotho
operations. Revenue from Vodacom's operations outside of South Africa as a percentage of Vodacom's total mobile operating
revenue increased to 5.8% in the six months ended September 30, 2002 from 3.0% in the six months ended September 30, 2001.
In South Africa, Vodacom's total ARPU decreased 4.7% in the six months ended September 30, 2002 compared to the six
months ended September 30, 2001 primarily due to the increase in the percentage of prepaid customers in Vodacom's total customer
base from 80.8% as of September 30, 2001 to 83.6% as of September 30, 2002 and a decrease in average prepaid ARPUs. Prepaid
customers on average tend to use fewer minutes and generate lower revenue than contract customers. As a result, average monthly
minutes per customer and ARPU are lower for prepaid customers. Vodacom's contract ARPU increased 11.1% in the six months
ended September 30, 2002 compared to the six months ended September 30, 2001. Prepaid ARPU decreased 6.4% in the six
months ended September 30, 2002 compared to the six months ended September 30, 2001 primarily due to a decrease in average
monthly minutes per prepaid customer as newer prepaid customers tend to be in lower income tiers. Vodacom expects that the
decline in its total ARPU in recent years will stabilize in the future based on the impact of new, higher ARPU prepaid products,
such as 4U, the continued growth in contract ARPU and slower growth rates in overall customers.
Service providers in South Africa generally subsidize handset sales for contract customers. Handsets for prepaid customers are not
subsidized. Subsidized handset sales give customers an incentive to switch operators to obtain new handsets and have contributed to
churn. Vodacom's churn rate for contract customers decreased to 13.2% in the six months ended September 30, 2002 from 16.6% in
the six months ended September 30, 2001 primarily due to a revised equipment upgrade policy and a greater focus on retention.
Vodacom's churn rate for prepaid customers remained relatively constant and was 34.3% in the six months ended September 30,
2002 and 34.8% in the six months ended September 30, 2001. Vodacom was able to maintain relatively constant churn rates despite
the entrance of Cell C into the market in November 2001 by offering prepaid products at increased discounts. For a discussion of
Vodacom's churn rate, see "Business Mobile communications South Africa Customers" on page 115 of this prospectus.
Airtime. Vodacom derives airtime revenue from connection and monthly rental fees and airtime usage fees paid by Vodacom's
contract customers for use of its mobile networks. Airtime revenue also includes fees paid by Vodacom's prepaid phone customers
for prepaid starter phone packages, airtime recharge vouchers and incomer vouchers, which entitle customers to receive unlimited
incoming calls for 365 days, and revenue from mobile data, including short messaging services, or SMSs. Airtime revenue depends
on the total number of customers, traffic volume, mix of prepaid and contract customers and tariffs.
Vodacom's airtime revenue increased 14.1% in the six months ended September 30, 2002 compared to the six months ended
September 30, 2001 primarily due to the increase in the number of Vodacom's customers. Customers increased 31.8% in the six
months ended September 30, 2002 compared to the six months ended September 30, 2001 primarily due to strong prepaid customer
growth in South Africa and significant customer growth in Vodacom's operations outside of South Africa. New products and
services also contributed substantially to Vodacom's customer growth for the six months ended September 30, 2002. Vodacom
launched 4U, its prepaid SMS and per second billing product, in October 2001 in anticipation of increased competition from Cell C,
which commenced operations in November 2001. Vodacom connected over 1.3 million 4U customers in the first six months of
launching the product, a portion of which were migrated from existing prepaid customers.
For a discussion of Vodacom's customers and traffic see "Business Mobile communications South Africa Customers" on
page 115 of this prospectus and "Business Mobile communications South Africa Traffic" on page 116 of this prospectus.
Mobile data revenue increased 23.7% to R120 million in the six months ended September 30, 2002 from R97 million in the six
months ended September 30, 2001. Vodacom's SMS traffic increased over the period primarily due to new packages and services,
such as 4U which are priced to encourage SMS usage. Vodacom transmitted 653 million SMSs over its network in the six months
ended September 30, 2002 compared to 363 million SMSs in the six months ended September 30, 2001.

53
Interconnection. Vodacom generates interconnection revenue when a call originating from our fixed-line network or one of the
other mobile operators' networks terminates on Vodacom's network. Interconnection revenue includes revenue from Cell C for
national roaming services. Vodacom generates national roaming revenue when its mobile network carries a call made from a
Cell C customer. Interconnection revenue depends on the volume of traffic terminating on Vodacom's network, the interconnection
termination rates payable by ourselves and the other mobile operators to Vodacom and national roaming rates and volumes.
Vodacom's interconnection revenue increased 33.2% in the six months ended September 30, 2002 compared to the six months
ended September 30, 2001 primarily due to an increase in interconnection rates and the number of mobile calls terminating on
Vodacom's network as a result of the increased number of Vodacom's customers and South African mobile users generally during
the period. Increased interconnection revenue by Vodacom Tanzania and Vodacom Congo further contributed to the increase. The
increases were partially offset by a decrease in the number of fixed calls from Telkom's network terminating on Vodacom's
network. Interconnection revenue in our mobile segment included R759 million and R712 million in the six months ended
September 30, 2002 and 2001, respectively, for services received from our fixed-line business, which were eliminated from the
Telkom Group's revenues in consolidation.
Equipment sales. Vodacom generates revenue from equipment sales primarily from the sale of mobile phones and accessories to
its customers. Vodacom purchases handsets for itself and for external service providers in bulk at purchase discounts in order to
lower the cost of handset subsidization. Equipment sales revenue fluctuates based on whether external providers and Vodacom's
other African operators source equipment from Vodacom in South Africa or purchase equipment from third party service providers.
Vodacom's revenue from equipment sales increased 73.7% in the six months ended September 30, 2002 compared to the six months
ended September 30, 2001 primarily due to large volumes of equipment sales by Vodacom Congo.
International services. Vodacom generates fees from international services when its mobile network carries a call made by a
customer of another international mobile communications network operator. Vodacom's revenue from international services
increased 51.3% in the six months ended September 30, 2002 compared to the six months ended September 30, 2001 primarily due
to increased call activity in South Africa and other African operations and exchange rate fluctuations.
Other. Other revenue includes revenue from other operations, including Vodacom's Teljoy television rental business, which was
sold in March 2002, and value-added services. Vodacom's other revenue decreased 7.4% in the six months ended September 30,
2002 compared to the six months ended September 30, 2001 primarily due to the sale of non-core assets.
Mobile operating expenses
The following is a discussion of our mobile segment's operating expenses which are comprised of our 50% interest in
Vodacom's operating expenses. Vodacom's operating expense line items are presented in accordance with the line items reflected in
the Telkom Group's consolidated operating expenses, which are different from the operating expense line items contained in
Vodacom's consolidated financial statements. The following table shows our 50% share of Vodacom's operating expenses and the
percentage change for the periods indicated.
Mobile operating expenses
Six months ended September 30,
2001
2002
Six months
2002/2001
ZAR
ZAR
% change
(unaudited)
(in millions, except percentages)
Employee expenses . . . . . . . . . . . . . . . . . . . . . . . . . . . .
254
251
(1.2)
Payments to other network operators . . . . . . . . . . . . . . . . . . .
284
491
72.9
Selling, general and administrative expenses . . . . . . . . . . . . . . .
1,817
2,220
22.2
Services rendered . . . . . . . . . . . . . . . . . . . . . . . . . . . . .
34
35
2.9
Operating leases . . . . . . . . . . . . . . . . . . . . . . . . . . . . . .
103
209
102.9
Depreciation and amortization . . . . . . . . . . . . . . . . . . . . . .
483
594
23.0
Mobile operating expenses . . . . . . . . . . . . . . . . . . . . . . .
2,975
3,800
27.7
Employee expenses. Employee expenses consist mainly of salaries and wages of employees as well as contributions to employee
pension and medical aid funds and benefits.
Vodacom's employee expenses decreased 1.2% in the six months ended September 30, 2002 compared to the six months ended
September 30, 2001 primarily due to a 7.5% decrease in the number of employees. The decrease in the number of employees was
partially offset by an overall increase in average salaries for employees of approximately 9.0% in the six months ended September 30,
2002. Employee productivity, as measured by customers per employee, increased 42.4% to 1,808 customers per employee as of
September 30, 2002 from 1,270 customers per employee as of September 30, 2001.

54
Payments to other network operators. Payments to other network operators consist mainly of interconnection payments made by
Vodacom's South African and other African operations for terminating calls on other operators' networks.
Vodacom's payments to other network operators increased 72.9% in the six months ended September 30, 2002 compared to the
six months ended September 30, 2001 as a result of increased outgoing traffic from South Africa and other African countries in line
with increased customer growth and, to a lesser degree, the increase in interconnection tariffs in South Africa under Vodacom's
interconnection agreements from November 2001 for traffic terminating on other mobile networks and our fixed-line network.
Payments to other network operators also increased due to the increasing amount of outgoing traffic terminating on the other mobile
networks, rather than our fixed-line network, as the cost of terminating calls on other mobile networks is higher than calls
terminating on our fixed-line network.
Payments to other network operators in our mobile segment included R80 million and R82 million in the six months ended
September 30, 2002 and 2001, respectively, for interconnection fees paid to our fixed-line segment, which were eliminated from the
Telkom Group's operating expenses in consolidation.
Selling, general and administrative expenses. Selling, general and administrative expenses include subscriber acquisition and
retention costs, packaging, distribution, marketing, regulatory license fees, bad debts and various other general administrative
expenses, including insurance, accommodations and social investments.
The following table sets forth information related to our 50% share of Vodacom's selling, general and administrative expenses
for the periods indicated.
Mobile selling, general and administrative costs
Six months ended September 30,
Six months
2001
2002
2002/2001
ZAR
ZAR
% change
(unaudited)
(in millions, except percentages)
Selling, distribution and other . . . . . . . . . . . . . . . . . . . . . . .
1,549
1,913
23.5
Marketing . . . . . . . . . . . . . . . . . . . . . . . . . . . . . . . . .
154
182
18.2
Regulatory and license fees . . . . . . . . . . . . . . . . . . . . . . . .
94
114
21.3
Bad debts . . . . . . . . . . . . . . . . . . . . . . . . . . . . . . . . .
33
11
(66.7)
Asset write-offs
1
. . . . . . . . . . . . . . . . . . . . . . . . . . . . . .
(13)
Selling, general and administrative expenses . . . . . . . . . . . . .
1,817
2,220
22.2
1
Integration costs, disposals of operations and impairments.
Vodacom's selling, general and administrative expenses increased 22.2% in the six months ended September 30, 2002 compared
to the six months ended September 30, 2001 primarily due to an increase in selling, distribution and other expenses, marketing
expenses and regulatory and licence fees to support the growth in operations. Selling, distribution and other expenses include cost
of goods sold, commissions, subscriber acquisition and retention expenses and distribution expenses. Although overall selling and
distribution costs increased in line with increases in operating revenue, selling and distribution incentive costs increased faster than
revenue growth as competition in the South African market increased. The increase in marketing expense was mainly due to
significant marketing expense incurred by Vodacom Congo to establish itself in the market. The increase in regulatory and license
fees was directly related to the increase in operating revenues.
Services rendered. Services rendered include consultancy services for technical, administrative and managerial services, audit
fees, insurance, legal fees and communication and information technology costs. Services rendered increased 2.9% in the six
months ended September 30, 2002 compared to the six months ended September 30, 2001 primarily due to an increase in support
services for Vodacom's other African operations.
Operating leases. Operating leases include payments in respect of rentals of GSM transmission lines as well as office
accommodation, office equipment and motor vehicles. Vodacom's operating leases increased 102.9% in the six months ended
September 30, 2002 compared to the six months ended September 30, 2001 primarily due to the cost of leasing base station sites
required for its network in the Democratic Republic of the Congo.
Operating leases in our mobile segment included R115 million and R95 million in the six months ended September 30, 2002
and 2001, respectively, for operating lease payments to our fixed-line segment, which were eliminated from the Telkom Group's
operating expenses in consolidation.

55
Depreciation and amortization. Vodacom's depreciation and amortization increased 23.0% in the six months ended September 30,
2002 compared to the six months ended September 30, 2001 primarily due to depreciation and amortization of capital expenditures
Vodacom incurred in building out its network in South Africa and other sub-Saharan African countries, partially offset by a decrease
in the amortization of intangible assets as a result of the sale of Teljoy Holdings (Proprietary) Limited and Vodacom World Online
Holdings (Proprietary) Limited and the elimination of related goodwill from its balance sheet.
Mobile operating profit
The following table shows information related to the operating profit and EBITDA for our mobile segment, which comprises
50% of Vodacom's results for the periods indicated.
Mobile operating profit
Six months ended September 30,
Six months
2002/2001
2001
2002
% change
(unaudited)
(in millions, except percentages)
Operating profit (ZAR) . . . . . . . . . . . . . . . . . . . . . . . . . .
787
920
16.9
Operating margin (%) . . . . . . . . . . . . . . . . . . . . . . . . . . .
20.
9
19.5
EBITDA (ZAR)
1
. . . . . . . . . . . . . . . . . . . . . . . . . . . . .
1,271
1,515
19.2
EBITDA margin (%) . . . . . . . . . . . . . . . . . . . . . . . . . . .
33.
8
32.1
1
Our mobile EBITDA comprises our 50% share of Vodacom's EBITDA, which represents mobile operating profit before income tax, finance
charges, investment income and depreciation and amortization. We believe that EBITDA provides meaningful additional information to investors
since it is widely accepted by analysts and investors as a basis for comparing a company's underlying operating profitability with that of other
companies as it is not influenced by past capital expenditures or business acquisitions, a company's capital structure or the relevant tax regime.
This is particularly the case in a capital-intensive industry such as communications. It is also a widely accepted indicator of a company's ability
to service its long-term debt and other fixed obligations and to fund its continued growth. EBITDA is not a US GAAP or IAS measure.
You should not construe EBITDA as an alternative to operating profit or cash flows from operating activities determined in accordance with
US GAAP or IAS or as a measure of liquidity. EBITDA is not defined in the same manner by all companies and may not be comparable to other
similarly titled measures of other companies unless the definition is the same. Mobile EBITDA includes a net gain of R12.8 million and
nil in the six months ended September 30, 2001 and 2002, respectively, for our 50% share of Vodacom's integration costs, disposals of operations
and impairments.
Mobile operating profit increased 16.9% in the six months ended September 30, 2002 compared to the six months ended
September 30, 2001 primarily due to the significant growth in mobile customers and traffic over the period. Operating profit as a
percentage of revenue decreased marginally from 20.9% in the six months ended September 30, 2001 to 19.5% in the six months
ended September 30, 2002.
Year ended March 31, 2002 compared to year ended March 31, 2001 and year ended March 31, 2001 compared to year ended
March 31, 2000
Consolidated results
The following table shows information related to our operating revenue, operating expenses, operating profit, net profit, profit
margin, EBITDA and EBITDA margin for the periods indicated.

56
Telkom Group's segmental results
Year ended March 31,
2000
2001
2002
2001/2000
2002/2001
ZAR
%
ZAR
%
ZAR
%
% change
% change
(in millions, except percentages)
Operating revenue . . . .
27,113
100.0
31,352
100.0
34,197
100.0
15.6
9.1
Fixed-line . . . . . . . . .
23,838
87.9
26,439
84.3
27,976
81.8
10.9
5.8
Mobile . . . . . . . . . . .
4,786
17.7
6,638
21.2
8,075
23.6
38.7
21.6
Intercompany eliminations
(1,511)
(5.6)
(1,725)
(5.5)
(1,854)
(5.4)
14.2
7.5
Operating expenses . . .
23,231
100.0
26,427
100.0
29,984
100.0
13.8
13.5
Fixed-line . . . . . . . . .
21,283
91.6
22,680
85.8
25,529
85.1
6.6
12.6
Mobile . . . . . . . . . . .
3,604
15.5
5,361
20.3
6,259
20.9
48.8
16.8
Intercompany eliminations
(1,656)
(7.1)
(1,614)
(6.1)
(1,804)
(6.0)
(2.5)
11.8
Operating profit . . . . .
3,882
100.0
4,925
100.0
4,213
100.0
26.9
(14.5)
Fixed-line . . . . . . . . .
2,555
65.8
3,759
76.3
2,447
58.1
47.1
(34.9)
Mobile . . . . . . . . . .
1,182
30.5
1,277
25.9
1,816
43.1
8.0
42.2
Intercompany eliminations
145
3.7
(111)
(2.2)
(50)
(1.2)
(176.6)
55.0
Net profit . . . . . . . . .
1,527
100.0
1,622
100.0
1,221
100.0
6.2
(24.7)
Profit margin (%) . . . .
5.6
5.2
3.6
EBITDA
1
. . . . . . . . .
8,056
100.0
9,977
100.0
9,621
100.0
23.8
(3.6)
Fixed-line . . . . . . . . .
6,180
76.7
7,993
80.1
6,810
70.8
29.3
(14.8)
Mobile . . . . . . . . . . .
1,731
21.5
2,095
21.0
2,851
29.6
21.0
36.1
Intercompany eliminations
145
1.8
(111)
(1.1)
(40)
(0.4)
(176.6)
64.0
EBITDA margin (%) . .
29.7
31.8
28.1
1
EBITDA represents operating profit before income tax, finance charges, investment income and depreciation and amortization. We believe that
EBITDA provides meaningful additional information to investors since it is widely accepted by analysts and investors as a basis for comparing
a company's underlying operating profitability with that of other companies as it is not influenced by past capital expenditures or business
acquisitions, a company's capital structure or the relevant tax regime. This is particularly the case in a capital-intensive industry such as
communications. It is also a widely accepted indicator of a company's ability to service its long-term debt and other fixed obligations and to fund
its continued growth. EBITDA is not a US GAAP or IAS measure. You should not construe EBITDA as an alternative to operating profit or cash
flows from operating activities determined in accordance with US GAAP or IAS or as a measure of liquidity. EBITDA is not defined in the same
manner by all companies and may not be comparable to other similarly titled measures of other companies unless the definition is the same. In
addition, because the calculation of EBITDA in the maintenance covenants contained in our credit facilities is based on accounting policies in use
at the time, the indebtedness was incurred, EBITDA for purposes of those covenants is not calculated in the same manner as it is calculated in the
above table. Mobile EBITDA includes a net gain of R28 million, a net loss of R107 million and a net gain of R65 million in the 2002, 2001 and
2000 financial years, respectively, for our 50% share of Vodacom's integration costs, disposals of operations and impairments.
Operating revenue
Operating revenue increased 9.1% and 15.6% in the years ended March 31, 2002 and 2001, respectively, primarily due to
increased average tariffs in our fixed-line segment and customer growth in our mobile segment. Fixed-line operating revenue
accounted for 81.8% of our consolidated operating revenue before intercompany eliminations during this period. The aggregate
increases in operating revenue exceeded average inflation in South Africa, which was 5.7% in the year ended December 31, 2001
and 5.4% in the year ended December 31, 2000.
Operating expenses
Operating expenses increased 13.5% and 13.8% in the years ended March 31, 2002 and 2001, respectively, due to increased
operating expenses in our fixed-line and mobile segments. The increase in fixed-line operating expenses in the 2002 financial year
was primarily due to increased services rendered expenses as a result of the outsourcing of our property management operations,
payments to other operators, provisions for potential damages related to our dispute with Telcordia, bad debts, employee
retrenchment expenses related to headcount reductions and write-offs of Telcordia related assets. The increase in fixed-line
operating expenses in the 2001 financial year was primarily due to increased operating lease expense as a result of the sale and
leaseback of our motor vehicle fleet in March 2000, payments to other operators, depreciation and write-offs of assets, including
provisions against assets relating to the Telcordia dispute and the write-off of other software. These increases were partially offset
by lower salaries and wages in our fixed-line segment in both the 2002 and 2001 financial years. The increase in mobile operating
expenses in both the 2002 and 2001 financial years was primarily due to increased payments to other network operators,
depreciation associated with increased capital expenditures and selling and distribution expenses as a result of the growth in our
mobile segment.

57
Operating profit
Operating profit decreased 14.5% in the year ended March 31, 2002 primarily due to the significant increase in operating
expenses in our fixed-line business. The decrease was partially offset by an increase in operating profit from our mobile segment as
a result of substantial increases in the number of Vodacom's mobile customers and revenue while Vodacom maintained its operating
margins. Operating profit increased 26.9% in the year ended March 31, 2001 primarily due to an increase in operating profit from
our fixed-line segment and, to a lesser extent, our mobile segment.
Investment income
Investment income consists of interest received on trade receivables, short-term investments and bank accounts and income
received from our investments, including satellite companies. Investment income decreased 20.6% to R490 million in the year
ended March 31, 2002 and 3.7% to R617 million in the year ended March 31, 2001 from R641 million in the year ended March 31,
2000.
The decreases were primarily due to lower interest received on lower average balances in investments and bank accounts.
Finance charges
Finance charges include interest paid on local and foreign borrowings, amortized discounts on bonds and commercial paper
bills, fair value gains and losses on financial instruments and foreign exchange gains and losses. Fair value losses and gains on
financial instruments are not comparable over the three years ended March 31, 2002, due to the prospective application of IAS 39
in 2002.
The following table sets forth information related to our finance charges for the periods indicated.
Finance Charges
Year ended March 31,
2000
2001
2002
2001/2000
2002/2001
ZAR
ZAR
ZAR
% change
% change
(in millions, except percentages)
Interest expense . . . . . . . . . . . . . . . . . . . .
2,147
2,572
3,185
19.8
23.8
Local loans . . . . . . . . . . . . . . . . . . . . .
2,342
2,173
2,690
(7.2)
23.8
Foreign loans . . . . . . . . . . . . . . . . . . . .
137
559
599
308.0
7.2
Finance charges capitalized . . . . . . . . . . . . .
(332)
(160)
(104)
(51.8)
(35.0)
Net fair value losses/(gains) on
financial instruments . . . . . . . . . . . . . . . . .
(40)
(12)
(635)
(70.0)
Fair value adjustments on derivative instruments . .
(3,036)
Foreign exchange (gains)/losses . . . . . . . . . .
(40)
(12)
2,401
(70.0)
Foreign exchange contract premiums . . . . . . . .
375
577
53.
9
Total finance charges . . . . . . . . . . . . . . . . .
2,482
3,137
2,550
26.4
(18.7)
Excluding the net fair value of gains on financial instruments of R635 million in the 2002 financial year, finance charges
increased in the 2002 financial year due to increased interest expense. Finance charges increased in the 2001 financial year due to
the costs of hedging our new foreign denominated debt issued in that year as well as increased interest expense. Interest expense
increased 23.8% and 19.8% in the years ended March 31, 2002 and 2001, respectively, due to higher weighted average interest rates
in each year, and higher long-term debt balances.
Taxation
Our consolidated tax expense increased 22.1% to R873 million in the year ended March 31, 2002 and 42.7% to R715 million in
the year ended March 31, 2001 from R501 million in the year ended March 31, 2000. Our consolidated effective tax rate was
40.5% in the 2002 financial year, 29.8% in the 2001 financial year and 24.5% in the 2000 financial year. Telkom's effective tax rate
was 53.8%, 18.1% and 19.6%, respectively, and Vodacom's effective tax rate was 33.3%, 36.9% and 28.1%, respectively, during the
2002, 2001 and 2000 financial years. The increase in consolidated tax expense in the year ended March 31, 2002 was primarily due
to the high amount of non-deductible expenses at Telkom related to Telcordia write-offs and reserves established for potential losses
as a result of the arbitration ruling and depreciation on buildings, Telkom's election to suspend the application of Section 32 of the
South African Tax Code related to the exemption from tax of international interconnection revenue generated from transmitting
messages internationally in the Telkom Group's consolidated financial statements and additional tax paid by Vodacom on dividends
distributed to Telkom. The increase in consolidated tax expense in the year ended March 31, 2001 was primarily due to the increase
in our pretax income and additional tax paid by Vodacom on dividends distributed to Telkom. South African companies became
subject to capital gains tax on October 1, 2001. As a result, we were previously not required to pay capital gains tax. See "Taxation"
beginning on page 173 of this prospectus.

58
Minority interests
Minority interests in the income of subsidiaries decreased 13.2% to R59 million in the year ended March 31, 2002 primarily due
to our increased ownership in our Swiftnet and Telkom Directory Services subsidiaries during the 2002 financial year, partially
offset by increased profits from these subsidiaries. We acquired the remaining 40% interest in Swiftnet in May 2001 and a further
10% interest in Telkom Directory Services in October 2001. Minority interests in the income of subsidiaries increased by
R55 million to R68 million in the year ended March 31, 2001 from R13 million in the year ended March 31, 2000. The increase
was attributable to increased profits from our Telkom Directory Services and Swiftnet subsidiaries.
Net profit
Net profit decreased 24.7% to R1,221 million in the year ended March 31, 2002 primarily due to lower operating profit in our
fixed-line segment. The decrease was partially offset by the fair value foreign exchange gain recognized in the 2002 financial year
as a result of the prospective application of IAS 39 and an increase in operating profit in our mobile segment. Net profit increased
6.2% to R1,622 million in the year ended March 31, 2001 from R1,527 million in the year ended March 31, 2000 primarily due to
increased operating profit in our fixed-line and mobile segments. The increase was partially offset by significantly higher finance
charges associated with higher average interest bearing debt and foreign exchange hedging costs related to the issuance of foreign
denominated debt in that year.
Fixed-line segment
The following is a discussion of the results of operations from our fixed-line segment before eliminations of intercompany
transactions with Vodacom. Our fixed-line segment is our largest segment based on revenue and profit contribution and includes all
the operating activities derived from Telkom's fixed-line voice and data communications services business, as well as directory
services through our 64.9% owned Telkom Directory Services subsidiary, and wireless data services through our wholly-owned
Swiftnet subsidiary.
Fixed-line operating revenue
The following table shows operating revenue for our fixed-line segment broken down by major business areas and as a
percentage of total revenue for our fixed-line segment and the percentage change by business area for the periods indicated.
Fixed-line operating revenue
Year ended March 31,
2000
2001
2002
% of
% of
% of
2001/2000
2002/2001
ZAR
revenue
ZAR
revenue
ZAR
revenue
% change
% change
(in millions, except percentages)
Subscriptions and
connections . . . . . . . .
4,085
17.1
4,197
15.9
4,410
15.8
2.7
5.1
Traffic . . . . . . . . . .
14,991
62.9
16,409
62.1
17,168
61.3
9.5
4.6
Local . . . . . . . . . .
3,836
16.1
4,237
16.0
4,876
17.4
10.5
15.1
Long-distance . . . . .
4,317
18.1
4,043
15.3
3,794
13.6
(6.3)
(6.2)
Fixed-to-mobile . . . .
5,325
22.3
6,845
25.9
7,323
26.1
28.5
7.0
International outgoing .
1,513
6.4
1,284
4.9
1,175
4.2
(15.1)
(8.5)
Interconnection . . . . .
1,366
5.7
1,854
7.0
1,798
6.4
35.7
(3.0)
Data . . . . . . . . . . .
2,764
11.6
3,328
12.6
3,913
14.0
20.4
17.6
Directories and other
services . . . . . . . . . .
632
2.7
651
2.4
687
2.5
3.0
5.5
Fixed-line operating revenue
23,838
100.0
26,439
100.0
27,976
100.0
10.9
5.8
Operating revenue from our fixed-line segment increased 5.8% and 10.9% in the years ended March 31, 2002 and 2001,
respectively, primarily due to increased average tariffs, partially offset by a decline in the number of fixed access lines in service as
a result of disconnections due to customer non-payments and customer migration to mobile services. Traffic remained relatively flat
during the 2002 financial year after an increase of 4.6% in the 2001 financial year. We also increased our data revenues in both
years as demand for data services increased. Traffic revenue per fixed access line continued to improve, increasing 11.1% and
10.1% from R3,869 in the 2000 financial year to R4,297 in the 2001 financial year and R4,729 in the 2002 financial year as we
increased our penetration of value-added voice services and higher revenue generating access services and decreased the number of
our fixed access lines.

59
Subscriptions and connections. The following table sets forth information related to our fixed-line subscription and connection
revenue during the periods indicated.
Fixed-line subscription and connection revenue
Year ended March 31,
2001/2000
2002/2001
2000
2001
2002
% change
% change
Total subscriptions and connections revenue
(ZAR millions, except percentages) . . . . . . . . .
4,085
4,197
4,410
2.7
5.1
Total subscription access lines (thousands,
except percentages)
1
. . . . . . . . . . . . . . . . .
5,356
4,809
4,750
(10.2)
(1.2)
Postpaid
PSTN
2
. . . . . . . . . . . . . . . . . . . . . .
4,668
3,930
3,554
(15.8)
(9.6)
ISDN channels . . . . . . . . . . . . . . . . . .
271
374
467
38.0
24.9
Prepaid . . . . . . . . . . . . . . . . . . . . . . .
381
480
708
26.0
47.5
Private payphones . . . . . . . . . . . . . . . . . .
36
25
21
(30.6)
(16.0)
1
T
otal subscription access lines are comprised of PSTN lines, including ISDN lines, private payphones and internal lines in service, but exclude
public payphones. Telkom had 162,460, 151,986 and 145,302 internal lines as of March 31, 2002, 2001 and 2000, respectively. Each PSTN line
includes one access channel, each basic ISDN line includes two access channels and each primary ISDN line includes 30 access channels.
2
PSTN lines include copper cable, ADSL, digital enhanced cordless technology, or DECT, and fiber.
Revenue from subscriptions and connections increased 5.1% and 2.7% in the years ended March 31, 2002 and 2001,
respectively, primarily due to an increase in average monthly subscriptions and connections tariffs, partially offset by the lower
number of fixed access lines in service as a result of disconnections due to customer non-payments and customer migration to
mobile services. The decreases in postpaid PSTN lines in the years ended March 31, 2002 and 2001 were partially offset by
increases in the number of postpaid ISDN channels, which have higher subscription rates than PSTN lines, and in the number of
prepaid PSTN lines. The increase in the number of postpaid ISDN channels was driven by increased demand for higher bandwidth
and functionality. The increase in prepaid lines was mainly due to our increased marketing efforts for our prepaid telephone services
in the 2002 and 2001 financial years, particularly to first-time residential customers with poor or no credit histories.
For a discussion of our connection and rental fees, see "Business Fixed-line communications Fees and tariffs Subscription
and connection tariffs" beginning on page 102 of this prospectus and for a discussion of the number of customers during the
periods, see "Business Fixed-line communications Products and services" beginning on page 97 of this prospectus.
Traffic. The following table sets forth information related to our total fixed-line traffic revenue for the periods indicated.
Total fixed-line traffic revenue
Year ended March 31,
2001/2000
2002/2001
2000
2001
2002
% change
% change
Total traffic revenue (ZAR millions, except
percentages) . . . . . . . . . . . . . . . . . . . . . .
14,991
16,409
17,168
9.5
4.6
Traffic (millions of minutes, except percentages)
1
. .
28,696
30,002
29,912
4.6
(0.3)
Average monthly traffic minutes per average
monthly access line (minutes)
2
. . . . . . . . . . . .
472
494
518
4.7
4.9
1
Traffic is calculated by dividing total traffic revenue by the weighted average tariff during the relevant period. Traffic includes internet traffic.
2
Average traffic minutes per average monthly access line are calculated by averaging the total traffic during each month in the year divided by the
average number of access lines in each month during the year.
Traffic revenue increased 4.6% in the year ended March 31, 2002 primarily due to increased local and fixed-to-mobile traffic
tariffs, partially offset by lower long distance and international traffic tariffs. Traffic decreased 0.3% in the 2002 financial year.
Traffic revenue increased 9.5% in the year ended March 31, 2001 primarily due to increased traffic, local traffic tariffs and a change
in the pricing of fixed-to-mobile traffic. Telkom changed the pricing of fixed-to-mobile traffic from per second billing to billing for
the first sixty second increment and in increments of thirty seconds thereafter, effective in September 1999. Traffic increased 4.6%
in the 2001 financial year, primarily due to increased fixed-to-mobile, local and international traffic, partially offset by lower long
distance traffic. Traffic was adversely affected in both the 2002 and 2001 financial years by a decrease in the number of fixed access
lines in service as a result of disconnections due to customer non-payments and customer migration to mobile services. In addition,
traffic was adversely affected by the increasing substitution of calls placed using mobile services rather than our fixed-line service.

60
For a discussion of our traffic tariffs, see "Business Fixed-line communications Fees and tariffs Traffic tariffs" beginning
on page 103 of this prospectus and for a discussion of our traffic during the periods discussed, see "Business Fixed-line
communications Traffic" beginning on page 98 of this prospectus.
The following table sets forth information related to our fixed-line local traffic revenue for the periods indicated.
Local traffic revenue
Year ended March 31,
2001/2000
2002/2001
2000
2001
2002
% change
% change
Local traffic revenue (ZAR millions,
except percentages) . . . . . . . . . . . . . . . . . .
3,836
4,237
4,876
10.5
15.1
Local traffic (millions of minutes,
except percentages)
1
. . . . . . . . . . . . . . . . . .
19,471
20,388
20,252
4.7
(0.7)
1
Local traffic is calculated by dividing total local traffic revenue by the weighted average local traffic tariff during the relevant period. Local traffic
includes internet traffic
Local traffic revenue increased 15.1% in the year ended March 31, 2002 primarily due to increased local traffic tariffs. Local
traffic decreased 0.7% in the 2002 financial year. Local traffic revenue increased 10.5% in the year ended March 31, 2001 primarily
due to increased local traffic tariffs and local traffic. Local traffic revenue was adversely affected by a change in the mix of call
packages and associated discounts and by a decrease in the number of fixed access lines in service during the 2002 and 2001
financial years as a result of disconnections due to customer non-payments and customer migration to mobile services. In addition,
local traffic was adversely affected by the increasing substitution of local calls placed using mobile services rather than our fixed-
line service.
The following table sets forth information related to our fixed-line long distance traffic revenue for the periods indicated.
Long distance traffic revenue
Year ended March 31,
2001/2000
2002/2001
2000
2001
2002
% change
% change
Long distance traffic revenue (ZAR millions,
except percentages) . . . . . . . . . . . . . . . . . .
4,317
4,043
3,794
(6.3)
(6.2)
Long distance traffic (millions of minutes,
except percentages)
1
. . . . . . . . . . . . . . . . . .
5,222
4,938
4,895
(5.4)
(0.9)
1
Long distance traffic is calculated by dividing total long distance traffic revenue by the weighted average long distance traffic tariff during the
relevant period.
Long distance traffic revenue decreased 6.2% and 6.3% in the years ended March 31, 2002 and 2001, respectively, primarily due
to decreased long distance traffic tariffs and decreased long distance traffic. Long distance traffic decreased 0.9% in the 2002
financial year and 5.4% in the 2001 financial year. Long distance traffic was adversely impacted by a decrease in the number of
fixed access lines in service during the 2002 and 2001 financial years as a result of disconnections due to customer non-payments
and customer migration to mobile services. In addition, long distance traffic was adversely affected by the increasing substitution of
national long distance calls using mobile services rather than our fixed-line long distance service. Historically, fixed-line long
distance traffic tariffs were higher than the price of mobile calls, which are not distance dependent. We have reduced our long-
distance traffic tariffs to below mobile tariffs over the past five years as a result of our tariff rebalancing program.

61
The following table sets forth information related to our fixed-to-mobile traffic revenue for the periods indicated.
Fixed-to-mobile traffic revenue
Year ended March 31,
2001/2000
2002/2001
2000
2001
2002
% change
% change
Fixed-to-mobile traffic revenue (ZAR millions,
except percentages) . . . . . . . . . . . . . . . . . .
5,325
6,845
7,323
28.5
7.0
Fixed-to-mobile traffic (millions of minutes,
except percentages)
1
. . . . . . . . . . . . . . . . . .
3,659
4,319
4,390
18.0
1.6
1
Fixed-to-mobile traffic is calculated by dividing total fixed-to-mobile traffic revenue by the weighted average fixed-to-mobile traffic tariff during
the relevant period.
Fixed-to-mobile traffic revenue increased 7.0% in the year ended March 31, 2002 primarily due to fixed to mobile traffic tariff
increases as a result of the amendment of our interconnection agreement with MTN and Vodacom and our new interconnection
agreement with Cell C effective in November 2001 and a 1.6% increase in fixed-to-mobile traffic. The increase in fixed-to-mobile
traffic was primarily due to an increased number of mobile users and an increase in the number of calls. Fixed-to-mobile traffic was
was adversely impacted by a decrease in the number of fixed-line subscribers due to disconnections for non-payments and customer
migration to mobile services and due to the growth in mobile users resulting in the increasing substitution of mobile-to-mobile calls
that are not routed over our fixed-line network as well as a 15.5% effective tariff increase in November 2001. Fixed-to-mobile
traffic revenue increased 28.5% in the year ended March 31, 2001 primarily due to growth in fixed-to-mobile traffic and a change
in the pricing of fixed-to-mobile traffic from per second billing to billing for the first sixty second increment and in increments of
thirty seconds thereafter. Fixed-to-mobile traffic increased 18% as a result of an increased number of mobile users and an increase
in the number of calls.
The following table sets forth information related to our international outgoing traffic revenue for the periods indicated.
International outgoing traffic revenue
Year ended March 31,
2001/2000
2002/2001
2000
2001
2002
% change
% change
International outgoing traffic revenue (ZAR millions,
except percentages) . . . . . . . . . . . . . . . . . .
1,513
1,284
1,175
(15.1)
(8.5)
International outgoing traffic (millions of minutes,
except percentages)
1
. . . . . . . . . . . . . . . . . .
344
357
375
3.
8
5.0
1
International outgoing traffic is calculated by dividing total international outgoing traffic revenue by the weighted average international outgoing
traffic tariff during the relevant period.
International outgoing traffic revenue decreased 8.5% and 15.1% in the years ended March 31, 2002 and 2001, respectively,
primarily due to decreases in average international outgoing traffic tariffs as a result of our tariff rebalancing program. International
outgoing traffic increased 5.0% and 3.8% in the 2002 and 2001 financial years, respectively.

62
Interconnection. The following table sets forth information related to interconnection revenue for the periods indicated.
Interconnection revenue
Year ended March 31,
2001/2000
2002/2001
2000
2001
2002
% change
% change
Interconnection revenue (ZAR millions,
except percentages) . . . . . . . . . . . . . . . . . .
1,366
1,854
1,798
35.7
(3.0)
Domestic mobile interconnection
Interconnection revenue from domestic mobile
operators (ZAR millions, except percentages) . . .
500
527
557
5.4
5.7
Domestic mobile interconnection traffic
(millions of minutes, except percentages)
1
. . . . .
1,931
2,051
2,008
6.2
(2.1)
International interconnection
Interconnection revenue from international
operators (ZAR millions, except percentages) . . .
866
1,327
1,241
53.2
(6.5)
International interconnection traffic (millions of
minutes, except percentages)
2
. . . . . . . . . . . .
500
862
1,053
72.4
22.2
1
Domestic mobile-to-fixed interconnection traffic is calculated by dividing total domestic mobile-to-fixed interconnection traffic revenue by the
weighted average domestic mobile-to-fixed interconnection traffic tariff during the relevant period. International outgoing mobile traffic is based
on the actual traffic registered through the respective exchanges and reflected in invoices.
2
International interconnection traffic is based on the actual traffic registered through the respective exchanges and reflected in invoices.
Interconnection revenue from domestic mobile operators increased 5.7% in the year ended March 31, 2002 due to a reduction in
the number of time bands for peak and off peak tariffs from three to two, effectively increasing mobile termination rates. These
increases were offset by decreased mobile-to-fixed terminating traffic as a result of increased mobile-to-mobile calls bypassing our
network. Interconnection revenue from domestic operators increased 5.4% in the year ended March 31, 2001 primarily due to
increased mobile-to-fixed traffic and increased outgoing mobile traffic as a result of growth in the number of mobile users, partially
offset by lower mobile international outgoing traffic tariffs. Mobile termination rates for domestic mobile-to-fixed traffic remained
constant in the year ended March 31, 2001.
Interconnection revenue from domestic operators includes fees paid to our fixed-line business by Vodacom of R306 million in
the year ended March 31, 2002, R297 million in the year ended March 31, 2001 and R277 million in the year ended March 31,
2000. Fifty percent of these amounts were attributable to our interest in Vodacom and were eliminated from the Telkom Group's
revenue in consolidation.
Interconnection revenue from international operators decreased 6.5% in the year ended March 31, 2002 due to a decrease in
international interconnection tariffs in line with international trends. The decrease in international interconnection tariffs was offset
in part by increased international termination traffic and international transiting traffic. Interconnection revenue from international
operators increased significantly in the year ended March 31, 2001 due to increases in international transiting traffic and
international terminating traffic. The increases were partially offset by lower international interconnection tariffs in line with
international trends.

63
Data. The following table sets forth information related to revenue from data services for the periods indicated.
Data services revenue
Year ended March 31,
2001/2000
2002/2001
2000
2001
2002
% change
% change
Data services revenue (ZAR millions,
except percentages) . . . . . . . . . . . . . . . . .
2,764
3,328
3,913
20.4
17.6
Leased lines and other data revenue
1
. . . . . .
2,176
2,624
3,079
20.6
17.3
Leased line facilities revenues - from mobile
operators . . . . . . . . . . . . . . . . . . . . . . .
588
704
834
19.7
18.5
Number of leased lines
2
. . . . . . . . . . . . .
248,919
315,597
398,311
26.8
26.2
Number of managed network sites . . . . . . . .
3,138
4,634
5,684
47.7
22.7
1
Leased lines and other data revenue includes all data services revenue other than leased line facilities revenue from mobile operators.
2
Converted into voice grade equivalents using 64 kilobits per second, excludes leased lines to mobile operators. Includes non-revenue generating
lines.
Our data services revenue increased 17.6% and 20.4% in the years ended March 31, 2002 and 2001, respectively. The increases
were primarily due to increased penetration of leased lines in corporate and business markets, increased demand for bandwidth with
higher capacity, increased numbers of customers using data managed networking services and increased revenue from leased line
facilities to mobile operators. Revenue from leased line facilities to mobile operators increased 18.5% and 19.7% in the years ended
March 31, 2002 and 2001, respectively, primarily due to growth in the mobile market and the introduction of Cell C in the 2002
financial year. Operating revenue from our data services included R368 million, R355 million and R324 million in revenue received
by our fixed-line business from Vodacom in the years ended March 31, 2002, 2001 and 2000, respectively. Fifty percent of these
amounts were attributable to our interest in Vodacom and were eliminated from the Telkom Group's revenue in consolidation.
For a discussion of our data services, see "Business - Fixed-line communications - Products and services - Data
communications services" beginning on page 99 of this prospectus.
Directories and other services. Revenue from directories and other services increased 5.5% and 3.0% in the years ended
March 31, 2002 and 2001, respectively. These increases were due to increases in directory services revenue from Telkom Directory
Services as a result of increased marketing efforts resulting in increased spending on advertising by existing customers and
additional advertising revenue from new customers.
Fixed-line operating expenses
The following table shows the operating expenses of our fixed-line segment broken down by expense category as a percentage of
total revenue and the percentage change by operating expense category for the periods indicated.
Fixed-line operating expenses
Year ended March 31,
2000
2001
2002
% of
% of
% of
2001/2000
2002/2001
ZAR
revenue
ZAR
revenue
ZAR
revenue
% change
%change
(in millions, except percentages)
Employee expenses . .
7,396
31.0
6,123
23.2
6,611
23.6
(17.2)
8.0
Payments to other network
operators . . . . . . . .
5,412
22.7
6,136
23.2
6,759
24.2
13.4
10.2
Selling, general and
administrative expenses
3,141
13.2
3,462
13.1
4,510
16.1
10.2
30.3
Services rendered . . .
1,414
5.9
1,507
5.7
2,138
7.6
6.6
41.9
Operating leases . . . .
295
1.3
1,218
4.6
1,148
4.1
312.9
(5.7)
Depreciation and
amortization . . . . . .
3,625
15.2
4,234
16.0
4,363
15.6
16.8
3.0
Fixed-line operating
expenses . . . . . . . . .
21,283
89.3
22,680
85.8
25,529
91.3
6.6
12.6

64
Employee expenses. The following table sets forth information related to our employee expenses for the periods indicated.
Fixed-line employee expenses
Year ended March 31,
2001/2000
2002/2001
2000
2001
2002
% change
% change
(ZAR millions, except percentages and average number of employees)
Salaries and wages . . . . . . . . . . . . . . . . .
4,562
4,336
4,323
(5.0)
(0.3)
Benefits . . . . . . . . . . . . . . . . . . . . . .
3,031
2,300
2,507
(24.1)
9.0
Employee retrenchment expenses . . . . . . . . .
303
132
373
(56.4)
182.6
Employee related expenses capitalized . . . . . .
(500)
(645)
(592)
29.
0
(8.2)
Employee expenses . . . . . . . . . . . . . . . . .
7,396
6,123
6,611
(17.2)
8.0
Number of fixed-line employees
(at period end)
1
. . . . . . . . . . . . . . . . . .
49,766
44,459
40,030
(10.7)
(10.0)
1
Includes employees of Swiftnet and Telkom Directory Services.
Employee expenses increased 8.0% in the year ended March 31, 2002 primarily due to a one-time actuarial, settlement and
curtailment gain recognized in benefits in the 2001 financial year that reduced benefit expenses in that year. Excluding the one-time
actuarial, settlement and curtailment gain described below, employee expenses increased 1.0% in the 2002 financial year due to an
increase in employee retrenchment costs which offset lower employee related expenses capitalized and lower salaries and wages. In
the 2001 financial year, employee expenses decreased 17.2% primarily due to a one-time actuarial, settlement and curtailment gain
recognized in benefits, lower salaries and wages, and lower employee retrenchment expenses. Excluding the one-time actuarial,
settlement and curtailment gain in the 2001 financial year, employee expenses decreased 11.5%.
Salaries and wages remained relatively constant in the year ended March 31, 2002. The decrease in the number of employees in
the 2002 financial year as a result of our staff reduction program, was offset by a 7.5% increase in base salaries and wages pursuant
to collective bargaining agreements during the year. Salaries and wages decreased 5.0% in the year ended March 31, 2001 primarily
due to reduced numbers of employees as a result of our staff reduction program, partially offset by a 7.5% increase in base salaries
and wages pursuant to collective bargaining agreements during the year.
Benefits increased 9.0% and decreased 24.1% in the years ended March 31, 2002 and 2001, respectively. In the year ended
March 31, 2001, we stopped offering post-retirement medical benefits to new employees and reached agreements with certain
existing employees to buy-out their future post-retirement medical entitlements. This resulted in a reduction in our liability for post-
retirement benefits and a one-time actuarial, settlement and curtailment gain of R425 million recognized in benefits in the 2001
financial year. Excluding the gain in the 2001 financial year, benefit expense decreased 8.0% and 10.1% in the years ended
March 31, 2002 and 2001, respectively, due to reductions in the number of employees.
Employee retrenchment expenses increased significantly in the year ended March 31, 2002 as significantly higher salaried
employees with longer service tenure were retrenched. Employee retrenchment expenses decreased significantly in the year ended
March 31, 2001 primarily due to a 60.6% decrease in the number of employees retrenched compared to the 2000 financial year. We
retrenched 11,070 employees in the 2000 financial year compared to 4,362 employees in the 2001 financial year and 2,960 in the
2002 financial year. For additional information related to our fixed-line employee numbers, see "Business Fixed-line
communications - Employees" beginning on page 111 of this prospectus.
Employee related expenses capitalized decreased 8.2% in the year ended March 31, 2002 primarily due to reduced capital
expenditures and the greater use of external contractors in the 2002 financial year. Employee related expenses capitalized increased
29.0% in the year ended March 31, 2001 primarily due to an increased number of capital projects completed by employees in lieu
of external contractors.

65
Payments to other network operators. The following table sets forth information related to our payments to other network
operators for the periods indicated.
Fixed-line payments to other network operators
Year ended March 31,
2000
2001
2002
2001/2000
2002/2001
ZAR
ZAR
ZAR
% change
% change
(in millions, except percentages)
Payments to mobile communications network operators
4,308
4,883
5,309
13.3
8.7
Payments to international network operators . . .
1,104
1,253
1,450
13.5
15.7
Payments to other network operators . . . . . .
5,412
6,136
6,759
13.4
10.2
Payments to other network operators increased 10.2% and 13.4% in the years ended March 31, 2002 and 2001, respectively. The
increase in the 2002 financial year was primarily due to increased termination rates from November 2001 pursuant to our amended
interconnection agreements with the mobile operators, increases in the Rand value of international settlement rates due to the
decline in the value of the Rand against the SDR and increased international interconnection traffic. The increase in the 2001
financial year was primarily due to the substantial increase in fixed-to-mobile traffic, increased Rand denominated termination and
transit settlement rates and increased international interconnection traffic.
Payments to other network operators include payments made by our fixed-line business to Vodacom, which were R2,968 million
in the year ended March 31, 2002, R2,772 million in the year ended March 31, 2001 and R2,406 million in the year ended
March 31, 2000. Fifty percent of these amounts were attributable to our interest in Vodacom and were eliminated from the Telkom
Group's expenses in consolidation.
Selling, general and administrative expenses. The following table sets forth information related to our fixed-line selling, general
and administrative expenses for the periods indicated.
Fixed-line selling, general and administrative expenses
Year ended March 31,
2000
2001
2002
2001/2000
2002/2001
ZAR
ZAR
ZAR
% change
% change
(in millions, except percentages)
Materials and maintenance . . . . . . . . . . . .
1,986
1,962
2,093
(1.2)
6.7
Marketing . . . . . . . . . . . . . . . . . . . . .
284
335
346
18.0
3.3
Bad debts . . . . . . . . . . . . . . . . . . . . . . . .
560
671
965
19.8
43.8
Asset write-offs . . . . . . . . . . . . . . . . . .
-
230
445
-
93.5
Other . . . . . . . . . . . . . . . . . . . . . . . .
311
264
661
(15.1)
150.4
Selling, general and administrative expenses . .
3,141
3,462
4,510
10.2
30.3
Selling, general and administrative expenses increased 30.3% in the year ended March 31, 2002 primarily due to Telcordia asset
write-offs, provisions for our arbitration proceedings with Telcordia and increased bad debts. Selling, general and administrative
expenses increased 10.2% in the year ended March 31, 2001 primarily due to asset write-offs related to our Telcordia dispute and
other software and increased bad debts. Selling, general and administrative expenses in the 2000 financial year included a profit
from the sale of our vehicle fleet in that year.
Materials and maintenance expenses increased 6.7% in the year ended March 31, 2002 in line with increased revenue. Materials
and maintenance expenses decreased 1.2% in the year ended March 31, 2001 as a result of improved materials management through
centralized stockrooms and improved network efficiencies. Our network efficiencies improved as a result of a significant increase in
digitization and the benefits derived from the establishment of our national network operations center, which is capable of
monitoring our core network and coordinating and dispatching all of our core network repair personnel from one control point. Our
national network operations center has improved the monitoring of our network resulting in an improvement in maintenance and
repair activities and lower costs.
Bad debts increased 43.8% and 19.8% in the years ended March 31, 2002 and 2001, respectively. We implemented a new
receivables aging system during the 2001 financial year. The increase in the 2001 financial year was due to the write-off of bad
debts as a result of better aging information obtained from the new system. The increase in the 2002 financial year was due to
stricter bad debt provisioning based on information obtained from a full year's implementation of our new receivables aging system.

66
Asset write-offs increased significantly in the years ended March 31, 2002 and March 31, 2001. The changes were due to write-
offs of Telcordia related assets in both years and the write-off of assets associated with customer billing systems in the 2001
financial year.
Other expenses in the 2002 financial year were impacted by the inclusion of a R375 million provision related to the Telcordia
dispute in that financial year and were impacted in the 2000 financial year by the inclusion of a profit of R468 million from
the sale of our vehicle fleet in that year.
Services rendered. The following table sets forth information relating to services rendered expenses for the periods indicated.
Fixed-line services rendered
Year ended March 31,
2000
2001
2002
2001/2000
2002/2001
ZAR
ZAR
ZAR
% change
% change
(in millions)
Property management . . . . . . . . . . . . . . .
-
370
1,096
-
196.2
Consultants and security . . . . . . . . . . . . . .
1,414
1,137
1,042
(19.6)
(8.4)
Services rendered . . . . . . . . . . . . . . . . . .
1,414
1,507
2,138
6.6
41.9
Property management expenses increased significantly in both the 2002 and 2001 financial years, as a result of our outsourcing
program. Outsourcing resulted in decreased operating expenses in other categories where these operations were previously included,
such as employee expenses. Consultants and security payments decreased 8.4% and 19.6% in the years ended March 31, 2002 and
2001, respectively, due to fewer consultants in both years as a result of our cost-saving efforts and lower payments to our strategic
equity investors in the 2002 financial year. Consultants and security payments include R219 million, R260 million and R260 million
of fees paid to our strategic equity investor, Thintana Communications, in the years ended March 31, 2002, 2001 and 2000,
respectively, pursuant to our strategic services agreement. A portion of payments made to Thintana Communications relate to
projects and have been capitalized.
Operating leases. Operating leases decreased 5.7% in the year ended March 31, 2002 due to a decrease in vehicle lease costs
because of a reduction in the fleet from 18,686 vehicles at March 31, 2001 to 16,627 vehicles at March 31, 2002. Operating lease
expenses increased significantly in the year ended March 31, 2001 primarily due to the sale and leaseback of our motor vehicle fleet
in March 2000.
Depreciation and amortization. Depreciation and amortization increased 3.0% and 16.8% in the years ended March 31, 2002
and 2001, respectively, primarily due to investment in our fixed-line network modernization and line roll-out and investment in
support equipment and software for our national network operations center. Capital investment in the 2002 financial year shifted to
assets with shorter useful lives as our capital expenditure program shifted from network rollout to network support and
infrastructure.
Fixed-line operating profit
The following table shows information related to the operating profit and EBITDA for our fixed-line segment for the periods
indicated.
Fixed-line operating profit
Year ended March 31,
2000
2001
2002
2001/2000
2002/2001
ZAR
ZAR
ZAR
% change
% change
(in millions, except percentages)
Operating profit (ZAR) . . . . . . . . . . . . . .
2,555
3,759
2,447
47.1
(34.9)
Operating margin (%) . . . . . . . . . . . . . . .
10.7
14.2
8.8
EBITDA (ZAR)
1
. . . . . . . . . . . . . . . . . .
6,180
7,993
6,810
29.3
(14.8)
EBITDA margin (%) . . . . . . . . . . . . . . . . . .
25.9
30.2
24.3
1
Our fixed-line EBITDA represents fixed-line operating profit before income tax, finance charges, investment income and depreciation and
amortization. We believe that EBITDA provides meaningful additional information to investors since it is widely accepted by analysts and
investors as a basis for comparing a company's underlying operating profitability with that of other companies as it is not influenced by past
capital expenditures or business acquisitions, a company's capital structure or the relevant tax regime. This is particularly the case in a capital-
intensive industry such as communications. It is also a widely accepted indicator of a company's ability to service its long-term debt and other
fixed obligations and to fund its continued growth. EBITDA is not a US GAAP or IAS measure. You should not construe EBITDA as an
alternative to operating profit or cash flows from operating activities determined in accordance with US GAAP or IAS or as a measure of
liquidity. EBITDA is not defined in the same manner by all companies and may not be comparable to other similarly titled measures of other
companies unless the definition is the same.

67
Fixed-line operating profit decreased 34.9% in the year ended March 31, 2002 primarily due to increased services rendered
expense as a result of the outsourcing of our property management operations, payments to other operators, provisions for potential
damages related to our dispute with Telcordia, bad debts, employee retrenchment expenses related to headcount reductions and
write-offs of Telcordia assets. Fixed-line operating profit increased 47.1% in the year ended March 31, 2001 primarily due to higher
operating revenue as a result of increased tariffs and fixed-to-mobile traffic and lower employee expenses, partially offset by
increased operating lease expense as a result of the sale and leaseback of our motor vehicle fleet in March 2000, payments to other
operators, depreciation and write-offs of Telcordia assets and other software.
Mobile segment
The following table shows information related to our 50% share of Vodacom's operating revenue and operating profit broken
down by Vodacom's South African operations and operations in other African countries for the periods indicated. All amounts in
this table and the discussion of our mobile segment that follows represent 50% of Vodacom's results of operations unless otherwise
stated and are before the elimination of intercompany transactions with us.
Mobile operating revenue and profits
Year ended March 31,
2000
2001
2002
% of
% of
% of
2001/2000
2002/2001
ZAR
total
ZAR
total
ZAR
total
% change
% change
(in millions, except percentages)
Operating revenue . . .
4,786
100.0
6,638
100.0
8,075
100.0
38.7
21.6
South Africa . . . . . .
4,767
99.6
6,546
98.6
7,705
95.4
37.3
17.7
Other African . . . . .
19
0.4
92
1.4
370
4.6
384.2
302.2
Operating profit
1
. . .
1,182
100.0
1,277
100.0
1,816
100.0
8.0
42.2
South Africa . . . . . .
1,179
99.8
1,293
101.3
1,775
97.7
9.7
37.3
Other African . . . . .
3
0.2
(16)
(1.3)
41
2.3
(633.3)
356.3
EBITDA
2
. . . . . . .
1,731
100.0
2,095
100.0
2,851
100.0
21.0
36.1
1
Certain of Vodacom's operating expense items have been reclassified in the consolidation of the Telkom Group. As a result, operating profit
in Vodacom's consolidated financial statements is not prepared on a consistent basis with operating profit in the Telkom Group's mobile segment.
2
Our mobile EBITDA comprises our 50% share of Vodacom's EBITDA, which represents mobile operating profit before income tax, finance
charges, investment income and depreciation and amortization. We believe that EBITDA provides meaningful additional information to investors
since it is widely accepted by analysts and investors as a basis for comparing a company's underlying operating profitability with that of other
companies as it is not influenced by past capital expenditures or business acquisitions, a company's capital structure or the relevant tax regime.
This is particularly the case in a capital-intensive industry such as communications. It is also a widely accepted indicator of a company's ability
to service its long-term debt and other fixed obligations and to fund its continued growth. EBITDA is not a US GAAP or IAS measure.
You should not construe EBITDA as an alternative to operating profit or cash flows from operating activities determined in accordance with
US GAAP or IAS or as a measure of liquidity. EBITDA is not defined in the same manner by all companies and may not be comparable to other
similarly titled measures of other companies unless the definition is the same. Mobile EBITDA includes a net gain of R28 million, a net loss of
R107 million and a net gain of R65 million in 2002, 2001 and 2000 financial years, respectively, for our 50% share of Vodacom's integration
costs, disposals of operations and impairments.

68
Mobile operating revenue
The following table shows our 50% share of Vodacom's revenue broken down by major business area and as a percentage of
total operating revenue for our mobile segment and the percentage change by business area for the periods indicated.
Mobile operating revenue
Year ended March 31,
2000
2001
2002
% of
% of
% of
2001/2000
2002/2001
ZAR
total
ZAR
total
ZAR
total
% change
%change
(in millions, except percentages)
Airtime . . . . . . . .
2,660
55.6
3,628
54.6
4,743
58.7
36.4
30.7
Interconnection . . . .
1,291
27.0
1,630
24.6
2,150
26.6
26.3
31.9
Equipment sales . . . .
638
13.3
1,021
15.4
814
10.1
60.0
(20.3)
International services .
146
3.1
130
2.0
151
1.9
(11.0)
16.2
Other sales and services - .
51
1.0
229
3.4
217
2.7
349.0
(5.2)
Mobile operating
revenue . . . . . . . . .
4,786
100.0
6,638
100.0
8,075
100.0
38.7
21.6
The following table sets forth non-financial operational data of Vodacom for the periods indicated. The amounts stated for
customers and traffic minutes reflect 100% of Vodacom's customers and traffic minutes.
Year ended March 31,
2001/2000
2002/2001
2000
2001
2002
% change
% change
South Africa
Customers (thousands) (at period end)
1
. . . .
3,069
5,108
6,557
66.4
28.4
Contract . . . . . . . . . . . . . . . . . . . . .
963
1,037
1,090
7.7
5.1
Prepaid . . . . . . . . . . . . . . . . . . . . .
2,082
4,046
5,439
94.3
34.4
Community services . . . . . . . . . . . . . .
24
25
28
4.2
12.0
Traffic minutes (millions of minutes)
2
. . . . . .
5,669
7,472
8,881
31.8
18.9
Outgoing . . . . . . . . . . . . . . . . . . . .
2,885
4,052
4,967
40.5
22.6
Incoming (Interconnection) . . . . . . . . . . .
2,784
3,420
3,914
22.8
14.4
MOU (minutes)
3
. . . . . . . . . . . . . .
158
137
111
(13.3)
(19.0)
Contract . . . . . . . . . . . . . . . . . . . . .
274
270
264
(1.5)
(2.2)
Prepaid . . . . . . . . . . . . . . . . . . . . .
90
70
58
(22.2)
(17.1)
Community services . . . . . . . . . . . . . .
1,593
2,859
3,354
79.5
17.3
ARPU (ZAR)
4, 5
. . . . . . . . . . . . . . . . . .
266
208
182
(21.8)
(12.5)
Contract
5
. . . . . . . . . . . . . . . . . . . . .
481
493
560
2.5
13.6
Prepaid . . . . . . . . . . . . . . . . . . . . .
132
98
93
(25.8)
(5.1)
Community services . . . . . . . . . . . . . .
n/a
1,453
1,719
-
18.3
Churn (%)
6
. . . . . . . . . . . . . . . . . . . .
31.8
23.3
27.2
(26.7)
16.7
Contract . . . . . . . . . . . . . . . . . . . . .
17.4
18.7
14.5
7.5
(22.5)
Prepaid . . . . . . . . . . . . . . . . . . . . .
40.5
24.8
30.1
(38.8)
21.4
Other African countries
Customers (thousands) (at period end)
1
. . . .
12
104
306
766.7
194.2
Lesotho . . . . . . . . . . . . . . . . . . . . .
12
22
57
83.3
159.1
Tanzania . . . . . . . . . . . . . . . . . . . . .
n/a
82
228
n/a
178.0
Democratic Republic of the Congo . . . . . . .
n/a
n/a
21
n/a
n/a
ARPU
4
Lesotho (ZAR) . . . . . . . . . . . . . . . . .
n/a
n/a
144
n/a
n/a
Tanzania (USD) . . . . . . . . . . . . . . . . .
n/a
31
27
n/a
(12.9)
Democratic Republic of the Congo (USD) - . - . - . - .
n/a
n/a
n/a
n/a
n/a
1
Customer totals are based on the total number of customers registered on Vodacom's network, which have not been disconnected, including
inactive customers, as of the end of the period indicated. 13.9% of Vodacom's total reported customers, 15.9% of its prepaid customers and 3.8%
of its contract customers in South Africa were inactive as of March 31, 2002. See "Business - Mobile communications - South Africa
Customers" on page 115 of this prospectus for a discussion of Vodacom's procedures with respect to disconnections and inactive customers.
2
Vodacom's traffic comprises total traffic registered on Vodacom's network, including bundled minutes, outgoing international roaming calls and
calls to free services, but excluding national and incoming international roaming calls.
69
3
Vodacom's MOU is calculated by dividing the average monthly minutes during the period by the average monthly total reported customer base
during the period. MOU excludes calls to free services, bundled minutes and data minutes.
4
ARPU is calculated by dividing the average monthly revenue during the period by the average monthly total reported customer base during the
period. ARPU excludes revenues from equipment sales, other sales and services and revenues from international users roaming on Vodacom's
networks.
5
Value added service revenue from previously partially owned service providers is included in contract and total average monthly revenue per
customer from October 1, 2001, at which time Vodacom consolidated these previously partially owned service providers.
6
Churn is calculated by dividing the average monthly total number of disconnections during the period by the average monthly total reported
customer base during the period.
Vodacom's operating revenue increased 21.6% and 38.7% in the years ended March 31, 2002 and 2001, respectively, primarily
due to customer growth. The increase in Vodacom's operating revenue in the 2002 financial year was partially offset by a decrease
in equipment sales. The 60.0% increase in equipment sales in 2001 contributed marginally to the significant growth in 2001.
Vodacom's revenues from operations outside of South Africa increased to R370 million in the year ended March 31, 2002 from
R92 million in the year ended March 31, 2001 and R19 million in the year ended March 31, 2000. The increases were due to a
substantial increase in the number of customers in Vodacom's Tanzania and Lesotho operations. Revenue from Vodacom's
operations outside of South Africa as a percentage of Vodacom's total mobile operating revenue increased to 4.6% in the year ended
March 31, 2002 from 1.4% in the year ended March 31, 2001 and 0.4% in the year ended March 31, 2000.
In South Africa, Vodacom's total ARPU decreased 12.5% and 21.8% in the years ended March 31, 2002 and 2001, respectively,
primarily due to the increase in the percentage of prepaid customers in Vodacom's total customer base from 68% as of March 31,
2000 to 79% as of March 31, 2001 and 83% as of March 31, 2002 and the decrease in average prepaid ARPUs. Prepaid customers
on average tend to use fewer minutes and generate lower revenue than contract customers. As a result, average monthly minutes per
customer and ARPU are lower for prepaid customers. Vodacom's contract ARPU increased 13.6% and 2.5% in the years ended
March 31, 2002 and 2001, respectively. Prepaid ARPU decreased 5.1% and 25.8% in the years ended March 31, 2002 and 2001,
respectively, primarily due to a decrease in average monthly minutes per prepaid customer as newer prepaid customers tend to be in
lower income tiers. Vodacom expects that the decline in its total ARPU in recent years will stabilize in the future based on the
impact of new, higher ARPU prepaid products, such as 4U, the continued growth in contract ARPU and slower growth rates in
overall customers.
Service providers in South Africa generally subsidize handset sales for contract customers. Handsets for prepaid customers are
not subsidized. Subsidized handset sales give customers an incentive to switch operators to obtain new handsets and have
contributed to high churn rates in South Africa. Vodacom's churn rate of contract customers decreased to 14.5% in the year ended
March 31, 2002 from 18.7% in the year ended March 31, 2001 primarily due to a revised equipment upgrade policy and a greater
focus on retention. Vodacom's churn rate for prepaid customers increased to 30.1% in the year ended March 31, 2002 from 24.8%
in the year ended March 31, 2001 primarily due to a more competitive market and lower barriers to entry for prepaid customers. For
a discussion of Vodacom's churn rate, see "Business - Mobile communications - South Africa - Customers" on page 115 of this
prospectus.
Airtime. Vodacom's airtime revenue increased 30.7% and 36.4% in the years ended March 31, 2002 and 2001, respectively,
primarily due to the increase in the number of Vodacom's customers, and, to a lesser extent, standard tariff increases that were on
average below inflation in South Africa. Customers increased 31.7% and 69.2% in the years ended March 31, 2002 and 2001,
respectively, primarily due to strong prepaid customer growth in South Africa and significant customer growth in Vodacom's
operations outside of South Africa. New product and services also had a substantial role in Vodacom's customer growth for the year
ended March 31, 2002. Vodacom connected over 1.3 million 4U customers in the first six months of launching 4U, its prepaid SMS
and per second billing product, a portion of which were migrated from existing prepaid customers.
For a discussion of Vodacom's customers and traffic see "Business - Mobile communications - South Africa - Customers" on
page 115 of this prospectus and "Business - Mobile communications - South Africa - Traffic" on page 116 of this prospectus.
Vodacom's mobile data revenue was R400 million in the year ended March 31, 2002, 50% of which is included in the Telkom
Group's revenue. Vodacom's SMS traffic increased over the period primarily due to new packages and services such as
4U which is priced to encourage SMS usage. In the year ended March 31, 2002, Vodacom transmitted 911 million SMSs over its
network and averaged 13.5 SMSs per customer per month.
Interconnection. Vodacom's interconnection revenue increased 31.9% and 26.3% in the years ended March 31, 2002 and 2001,
respectively, primarily due to an increase in the number of calls terminating on Vodacom's network as a result of the increased
number of Vodacom's customers and South African mobile users generally during the periods. Interconnection revenue in our
mobile segment included R1,484 million, R1,386 million and R1,203 million in the years ended March 31, 2002, 2001 and 2000,
respectively, for services received from our fixed-line business, which were eliminated from the Telkom Group's revenue in
consolidation.
Equipment sales. Vodacom's revenue from equipment sales decreased 20.3% in the year ended March 31, 2002 primarily due to
external service providers obtaining an increasing number of handsets from third parties and a marginal decrease in the cost of
handsets. Vodacom's revenue from equipment sales increased 60.0% in the year ended March 31, 2001 primarily due to the rapid
increase in the number of new Vodacom customers.

70
International services. Vodacom's revenue from international services increased 16.2% in the year ended March 31, 2002,
primarily due to increased call activity and exchange rate fluctuations in 2002. Vodacom's revenue from international services
decreased 11.0% in the year ended March 31, 2001, primarily due to changes in traffic patterns.
Other. Vodacom's other revenue decreased 5.2% in the year ended March 31, 2002 primarily due to the sale of non-core assets.
Vodacom's other revenue increased significantly in the year ended March 31, 2001 primarily due to the growth of these non-core
businesses and the inclusion of the Teljoy television rental business in Vodacom's revenues in the 2001 fiscal year.
Mobile operating expenses
The following is a discussion of our mobile segment's operating expenses which are comprised of our 50% interest in
Vodacom's operating expenses. Vodacom's operating expense line items are presented in accordance with the line items reflected in
the Telkom Group's consolidated operating expenses, which are different from the operating expense line items contained in
Vodacom's consolidated financial statements. The following table shows our 50% share of Vodacom's operating expenses and the
percentage change for the periods indicated.
Year ended March 31,
2000
2001
2002
2001/2000
2002/2001
ZAR
ZAR
ZAR
% change
% change
(in millions, except percentages)
Employee expenses . . . . . . . . . . . . . . . .
324
475
568
46.6
19.6
Payments to other network operators . . . . . . .
196
411
689
109.7
67.6
Selling, general and administrative expenses . . .
2,320
3,389
3,674
46.1
8.4
Services rendered . . . . . . . . . . . . . . . . .
25
32
56
28.0
75.0
Operating leases . . . . . . . . . . . . . . . . . .
189
236
237
24.9
0.4
Depreciation and amortization . . . . . . . . . . . . .
550
818
1,035
48.7
26.5
Mobile operating expenses . . . . . . . . . . . . .
3,604
5,361
6,259
48.8
16.8
Employee expenses. Vodacom's employee expenses increased 19.6% and 46.6% in the years ended March 31, 2002 and 2001,
respectively, primarily due to increased bonuses and incentives and, to a lesser degree, the growth of Vodacom's operations in South
Africa and expansion outside of South Africa. The increases were also due to an overall increase in average salaries for employees
of 10.0% in the 2002 financial year and 8.0% in the 2001 financial year. The number of employees increased 4.4% and 1.9% in the
years ended March 31, 2002 and 2001, respectively. Employee productivity, as measured by customers per employee, increased
29.3% to 1,577 customers per employee as of March 31, 2002 and 62.0% to 1,220 customers per employee as of March 31, 2001
from 753 customers per employee as of March 31, 2000.

71
Payments to other network operators. Vodacom's payments to other network operators increased significantly in both the years
ended March 31, 2002 and 2001, as a result of increased outgoing traffic in line with increased customer growth and, to a lesser
degree, the increase in interconnection tariffs under Vodacom's interconnection agreements from November 2001 for traffic
terminating on other mobile networks and our fixed-line network. Payments to other network operators also increased due to the
increasing amount of outgoing traffic terminating on the other mobile networks, rather than our fixed-line network, as the cost of
terminating calls on other mobile networks is higher than calls terminating on our fixed-line network.
Payments to other network operators in our mobile segment included R153 million, R149 million and R139 million in the years
ended March 31, 2002, 2001 and 2000, respectively, for interconnection fees paid to our fixed-line segment, which were eliminated
from the Telkom Group's operating expenses in consolidation.
Selling, general and administrative expenses. The following table sets forth information related to our 50% share of Vodacom's
selling, general and administrative expenses for the periods indicated.
Mobile selling, general and administrative expenses
Year ended March 31,
2000
2001
2002
2001/2000
2002/2001
ZAR
ZAR
ZAR
% change
% change
(in millions, except percentages)
Selling, distribution and other . . . . . . . . . . .
1,940
2,782
3,216
43.4
15.6
Marketing . . . . . . . . . . . . . . . . . . . . .
298
257
271
(13.8)
5.4
Regulatory and license fees . . . . . . . . . . . .
136
165
192
21.3
16.4
Bad debts . . . . . . . . . . . . . . . . . . . . . . . .
11
78
23
609.1
(70.5)
Asset write-offs . . . . . . . . . . . . . . . . . .
(65)
107
(28)
(264.6)
(126.2)
Selling, general and administrative expenses . .
2,320
3,389
3,674
46.1
8.4
Vodacom's selling, general and administrative expenses increased 8.4% and 46.1% in the years ended March 31, 2002 and 2001,
respectively, primarily due to an increase in selling, distribution and other expenses to support the growth in operations. Selling,
distribution and other expenses include cost of goods sold, commissions, subscriber acquisition and retention expenses and
distribution expenses. The increase in selling and distribution expenses over the three year period was directly related to the
increase in operating revenue. The increase in regulatory and license fees during the same period was also directly related to the
increase in operating revenues. The increase in bad debts in the 2001 financial year was primarily due to Vodacom's restructuring of
its service providers and the subsequent write-off of debtors.
Services rendered. Services rendered increased 75.0% in the year ended March 31, 2002 primarily due to an increase in support
services for Vodacom's other African operations and an increase in information technology costs due to expansion and upgrades.
Vodacom's services rendered increased 28.0% in the year ended March 31, 2001 primarily due to the start up nature of its
expansion into other African countries as well as the installation of a new accounting system.
Operating leases. Vodacom's operating leases remained relatively constant in the year ended March 31, 2002 and increased
24.9% in the year ended March 31, 2001. The increase in the 2001 financial year was primarily due to increases in GSM
transmission lines leased and increases in the number of base stations in both South Africa and other African operations.
Operating leases in our mobile segment included R184 million, R178 million and R162 million in the years ended March 31,
2002, 2001 and 2000, respectively, for operating lease payments to our fixed-line segment, which were eliminated from the Telkom
Group's operating expenses in consolidation.
Depreciation and amortization. Vodacom's depreciation and amortization increased 26.5% and 48.7% in the years ended March 31,
2002 and 2001, respectively. The increases were primarily the result of depreciation and amortization of capital expenditures Vodacom
incurred in building out its network in South Africa and other sub-Saharan African countries, offset by a decrease in the amortization of
intangible assets as a result of the sale of Teljoy Holdings (Proprietary) Limited and Vodacom World Online Holdings (Proprietary)
Limited and the elimination of related goodwill from its balance sheet.

72
Mobile operating profit
Year ended March 31,
Mobile operating profit
The following table shows information related to the operating profit and EBITDA for our mobile segment, which comprises
50% of Vodacom's results for the periods indicated.
2001/2000
2002/2001
2000
2001
2002
% change
% change
(in millions, except percentages)
Operating profit (ZAR) . . . . . . . . . . . . . .
1,182
1,277
1,816
8.0
42.2
Operating margin (%) . . . . . . . . . . . . . . .
24.7
19.2
22.5
EBITDA (ZAR)
1
. . . . . . . . . . . . . . . . . .
1,731
2,095
2,851
21.0
36.1
EBITDA margin (%) . . . . . . . . . . . . . . . . . .
36.2
31.6
35.3
1
Our mobile EBITDA comprises our 50% share of Vodacom's EBITDA, which represents mobile operating profit before income tax, finance
charges, investment income and depreciation and amortization. We believe that EBITDA provides meaningful additional information to investors
since it is widely accepted by analysts and investors as a basis for comparing a company's underlying operating profitability with that of other
companies as it is not influenced by past capital expenditures or business acquisitions, a company's capital structure or the relevant tax regime.
This is particularly the case in a capital-intensive industry such as communications. It is also a widely accepted indicator of a company's ability
to service its long-term debt and other fixed obligations and to fund its continued growth. EBITDA is not a US GAAP or IAS measure.
You should not construe EBITDA as an alternative to operating profit or cash flows from operating activities determined in accordance
with US GAAP or IAS or as a measure of liquidity. EBITDA is not defined in the same manner by all companies and may not be comparable
to other similarly titled measures of other companies unless the definition is the same. Mobile EBITDA includes a net gain of R28 million,
a net loss of R107 million and a net gain of R65 million in 2002, 2001 and 2000 financial years, respectively, for our 50% share of Vodacom's
integration costs, disposals of operations and impairments.
Mobile operating profit increased 42.2% and 8.0% in the years ended March 31, 2002 and 2001, respectively, primarily due to
the significant growth in mobile customers and traffic over the period. Operating profit as a percentage of revenue increased
from 19.2% in the year ended March 31, 2001 to 22.5% in the year ended March 31, 2002.
Group liquidity and capital resources
Cash flows
The following table shows information regarding our consolidated cash flows for the periods indicated.
Six months ended
September 30,
Year ended March 31,
Six months
2000
2001
2002
2001
2002
2001/2000
2002/2001
2002/2001
ZAR
ZAR
ZAR
% change
% change
ZAR
ZAR
% change
(unaudited)
(in millions, except percentages)
Cash flows from operating activities - .
4,917
6,165
8,171
25.4
32.5
3,301
3,462
4.9
Cash flows used in investing activities (9,107)
(9,964)
(9,294)
(9.4)
6.7
(3,653)
(2,453)
32.8
Cash flows from/(used in) financing
activities . . . . . . . . . . . . . . .
5,051
3,439
110
(31.9)
(96.8)
(973)
(1,178)
21.1
Net increase/(decrease) in cash and
cash equivalents . . . . . . . . . . .
861
(360)
(1,013)
(141.8)
181.4
(1,325)
(169)
(87.2)
Effect of foreign exchange rate
differences . . . . . . . . . . . . . .
-
-
48
-
-
2
(12)
-
Net cash and cash equivalents at the
beginning of the year . . . . . . . .
366
1,227
867
235.2
(29.3)
867
(98)
(111.3)
Net cash and cash equivalents at the end
of the year . . . . . . . . . . . . . . .
1,227
867
(98)
(29.3)
(111.3)
(456)
(279)
(38.8)
Cash flows from operating activities
Our primary sources of liquidity are cash flows from operating activities and borrowings. In the future, we intend to fund our
expenses, indebtedness and working capital requirements from our operations and from capital raised in the markets. Cash flows
from operating activities increased 4.9% in the six months ended September 30, 2002 compared to the six months ended
September 30, 2001 due to increased receipts from customers and improved credit management and cash management. Cash flows
from operating activities increased over the three year period by 32.5% in the 2002 financial year and 25.4% in the 2001 financial
year due to increased receipts from customers and improved credit management and cash management. Finance charges decreased
in the six months ended September 30, 2002 compared to the six months ended September 30, 2001 while taxation increased.
Cash flows used in investing activities
Cash flows used in investing activities relate primarily to investments in our fixed-line network and our 50% share of Vodacom's
investments in its mobile networks in South Africa and other African countries. Cash flows used in investing activities decreased
73
32.8% in the six months ended September 30, 2002 compared to the six months ended September 30, 2001 primarily due to the
decrease in capital expenditure for our fixed-line roll-out and, to a lesser extent, due to a decrease in Vodacom's capital expenditure.
Cash flows used in investing activities decreased 6.7% in the year ended March 31, 2002 largely for the same reasons.
Cash flows used in investing activities increased 9.4% in the year ended March 31, 2001 compared to the six months ended
September 30, 2001 primarily due to increases in fixed-line capital expenditures for operational support systems as we completed
the roll-out of our fixed-line network and our 50% share of Vodacom's capital expenditure. These increases were offset by proceeds
of R804 million from the sale and leaseback of non-core activities in the year ended March 31, 2000.
Cash flows from/(used in) financing activities
Cash flows from financing activities are primarily a function of borrowing activities. In the six months ended September 30, 2002,
loans repaid and the increase in interest-bearing investments exceeded loans raised and finance leases by R1,178 million. We repaid a
net of R804 million of commercial paper bills and a R200 million 12.5% coupon, unsecured loan stock due April 15, 2002 in the six
months ended September 30, 2002. A $58 million credit facility was extended to Vodacom Congo during that period by an external
consortium.
Telkom's 50% share of this credit facility is R150 million.
In the six months ended September 30, 2001, loans repaid exceeded loans raised and the decrease in interest-bearing investments
by R973 million. We repaid a $185 million syndicated loan, a $150 million syndicated loan and a $250 million syndicated loan
during the six months ended September 30, 2002. We issued a net of R1,456 million of commercial paper bills and issued
R2,300 million aggregate principal amount of 10.75% bonds due 2003.
In the 2002 financial year, loans raised and the decrease in interest-bearing investments exceeded loans repaid by R110 million.
We repaid a $185 million syndicated loan, a $150 million syndicated loan and a $250 million syndicated loan in the 2002 financial
year. We also repaid a net R392 million of commercial paper bills during the year. We decreased our interest bearing investments
including repurchase agreements and bills of exchange by R865 million. During the 2002 financial year we issued R2,300 million
aggregate principal amount of 10.75% bonds due 2003 and R1,500 million aggregate principal amount of 10.5% bonds due 2006.
In the 2001 financial year, loans raised exceeded loans repaid and the increase in interest-bearing investments by R3,439 million.
We issued Euro 500 million aggregate principal amount of 7.125% bonds due 2005, R1,350 million aggregate principal amount of
zero coupon private placement bonds due 2010, R2,700 million aggregate principal amount of 10.75% bonds due 2003 and we
entered into a R359 million loan from the European Investment Bank in the 2001 financial year. We repaid a net R3,815 million of
commercial paper bills in the 2001 financial year. We also increased our interest bearing investments including repurchase
agreements and bills of exchange by R613 million.
In the 2000 financial year, loans raised exceeded loans repaid and the increase in interest-bearing investments by R5,051 million.
We issued R1,500 million aggregate principal amount of 13% bonds due 2004, R200 million aggregate principal amount of 12.5%
loan stock due 2002, R2,500 million aggregate principal amount of 6% local bonds due 2020 and R430 million aggregate principal
amount of zero coupon loan stock due 2010 in the 2000 financial year. We issued a net R2,034 million of commercial paper bills in
the 2000 financial year. There were no significant redemptions during the year. We increased our interest bearing investments
including repurchase agreements and bills of exchange by R358 million.
Working capital
Telkom and its directors are of the opinion that the Telkom Group's cash flows from operations, together with proceeds from the
sale of non-core assets and liquidity available under credit facilities and in the capital markets, will be sufficient to meet the Telkom
Group's present working capital requirements for the twelve months following the date of this prospectus and that the Telkom
Group's issued capital after the global offering will be adequate for the purposes of the Telkom Group's business. Although the
Telkom Group had negative working capital in the six month periods ended September 30, 2002 and 2001 and the years ended
March 31, 2002, 2001 and 2000, our management believes that based on our historical results and operating cash flows, and our
ability to raise capital in the markets, we will be able to meet our liabilities as they arise for the twelve months following the date of
this prospectus.
Capital expenditures and investments
We have made significant capital expenditures in connection with our five year fixed-line network modernization and roll-out
program during the past three financial years. Similarly, Vodacom has made significant capital expenditures during the past three
financial years in building and upgrading its mobile network in South Africa and other African countries. The following table shows
the Telkom Group's investments in property, plant and equipment excluding intangibles, including our 50% share of Vodacom's
investments, for the periods indicated.
74
Six months ended
Year ended March 31,
September 30,
2000
2001
2002
2001
2002
ZAR
ZAR
ZAR
ZAR
ZAR
Amounts in accordance with IAS
(unaudited)
(in millions)
Group capital expenditure
Fixed-line . . . . . . . . . . . . . . . . . . . . . . . . .
8,468
8,297
6,962
2,630
1,487
Network modernization . . . . . . . . . . . . . . . . .
1,244
1,209
2,192
733
371
Line roll-out . . . . . . . . . . . . . . . . . . . . . . .
4,230
3,994
1,769
849
318
Operational support systems . . . . . . . . . . . . . .
2,194
2,453
2,369
791
743
Company support and other . . . . . . . . . . . . . . . . .
800
641
632
257
55
Mobile . . . . . . . . . . . . . . . . . . . . . . . . . .
993
1,592
2,042
1,011
859
Total investment in property, plant and equipment . .
9,461
9,889
9,004
3,641
2,346
In the future, we intend to selectively invest in our fixed-line segment on a smaller scale based on customer demand and economic
viability. Having substantially completed our fixed-line roll-out, we expect future fixed-line capital expenditures to be primarily for
improving the quality of our network and our operational support systems. Our consolidated capital expenditures in property, plant
and equipment for the 2003 financial year is budgeted to be R7.5 billion, of which R4.9 billion is budgeted to be spent in our fixed-
line segment and R2.6 billion is budgeted to be spent in our mobile segment, which is our 50% share of Vodacom's capital
expenditure of R5.1 billion. Our consolidated capital expenditures are continually examined and evaluated against the estimated
economic benefit and may be revised in light of changing business conditions, investment opportunities and other business factors.
Commitments
We estimate our commitments in respect of property, plant and equipment in the next five years to be R1.9 billion. We anticipate
that the projects in respect of which funds have currently been committed will be completed by March 31, 2003. Our annual
commitments under operating leases, as of March 31, 2002, are as follows.
Between
Within
one and
Over
Total
one year
five years
five years
(in millions)
Buildings . . . . . . . . . . . . . . . . . . . . . . . .
737
208
310
219
Transmission and data lines . . . . . . . . . . . . . . . . .
1,101
183
735
183
Equipment . . . . . . . . . . . . . . . . . . . . . . . .
35
17
18
-
Vehicles . . . . . . . . . . . . . . . . . . . . . . . . .
809
809
-
-
Total . . . . . . . . . . . . . . . . . . . . . . . . . . .
2,682
1,217
1,063
402
Telkom has entered into a full maintenance lease agreement for its vehicles with debis Fleet Management (Proprietary) Limited,
a company incorporated in the Republic of South Africa. The master lease agreement is for a period of five years and expires
March 31, 2005. As there is no minimum usage clause in the master lease agreement, only the lease payments for the one year
renewal period are included in the table above. The leases of individual vehicles are renewed annually.
Contingent liabilities
Telcordia instituted arbitration proceedings against Telkom in March 2001 seeking to recover approximately $130 million for
monies outstanding and damages, plus interest at a rate of 15.5% per year. The proceedings relate to the cancellation of an agreement
entered into between Telkom and Telcordia during June 1999 for the development and supply of an integrated end-to-end customer
assurance and activation system by Telcordia. In September 2002, a partial ruling was issued by the arbitrator in favor of Telcordia.
Telkom has launched review proceedings in the South African High Court in respect of this partial ruling. The arbitration proceedings
and the amount of Telkom's liability are not expected to be finalized until late 2003 or early 2004. Telkom has provided R373 million
for its estimate of probable liabilities, including interest, in respect of the Telcordia claim in the Telkom Group's consolidated
financial statements as of September 30, 2002. Telkom is currently unable to predict the amount that it may eventually be required to
pay Telcordia. If Telcordia recovers substantial damages from Telkom, Telkom would be required to fund such payments from cash
flows or drawings on its existing credit facilities, which could cause its indebtedness to increase and its net profit to decline.
See also note 26 to the notes to the audited consolidated financial statements of the Telkom Group as of and for the three years
ended March 31, 2002 and note 16 of the unaudited condensed consolidated financial statements of the Telkom Group as of
September 30, 2002 and for each of the six month periods ended September 30, 2002 and 2001 for additional information related to
contingent liabilities of the Telkom Group.

75
Employee benefit special purpose entity
We had liabilities of R2,215 million and R2,130 million as of September 30, 2002 and 2001, respectively, and R2,154 million,
R2,183 million and R2,464 million in the years ended March 31, 2002, 2001 and 2000, respectively, in respect of post retirement
medical aid obligations for current and retired employees. We have set up a special purpose entity in the 2002 financial year for the
purpose of funding these post retirement obligations. This special purpose entity is purely used as a financing tool as we still retain
our obligation to provide post retirement medical aid benefits to retired employees. As a result, it does not meet the definition of a plan
asset in terms of IAS 19 - Employee Benefits. Our interest in the special purpose entity is by way of equity, and this entity is fully
consolidated in the Telkom Group's financial statements. The cumulative value of the funds in this special purpose entity was
R503 million and R304 million as of September 30, 2002 and 2001, respectively, and R560 million as of March 31, 2002.
Funding sources
To date, we have financed our operations primarily from cash flows from operations and by borrowings in the South African and
international capital markets. Access to international capital markets and its associated cost of funding depends in part on our credit
ratings. We maintain an active dialog with the principal credit rating agencies who review our ratings periodically. Standard & Poor's
International Ratings, LLC, a Delaware limited liability company and a division of McGraw-Hill Companies Inc., and Moody's
Investors Services Inc, a Delaware corporation, have rated our foreign debt BBB and Baa3, respectively. We have not solicited a
rating on our local Rand denominated debt due to our long standing relationships with Rand denominated investors. As of
September 30, 2002, 75.9% of our debt was local debt, compared to 78.2% as of March 31, 2002, 63.6% as of March 31, 2001 and
77.8% as of March 31, 2000. Our Rand denominated debt bears interest at rates ranging from 10 basis points to 60 basis points
above treasuries.
The following table sets forth our consolidated indebtedness including finance leases as of September 30, 2002.
Nominal
Maturing
amount
Outstanding
outstanding
Twelve Months ended September 30,
Interest
as of
as of
payment
Interest September 30,
September 30,
After
dates
rate
2002
2002
2003
2004
2005
2006
2006
(%)
ZAR
ZAR
ZAR
ZAR
ZAR
ZAR
ZAR
(in millions)
TELKOM
Bonds
10% statutorily guaranteed
open-ended local bond due
March 31,
10
3,461
4,436
-
-
-
-
4,436
not later than
September 30
March 31, 2008 (TK01)
1, 2, 3
13% unsecured local bond May 31,
13
3,318
3,500
-
3,500
-
-
-
due May 31, 2004 (TL08)
1,4
November 30
10.75% unsecured local bond
March 31,
10.75
4,990
5,000
5,000
-
-
-
-
due September 30, 2003
September 30
(TL03)
1,5
10.5% unsecured local bond
April 30,
10.5
1,241
1,455
-
-
-
-
1,455
due October 31, 2006
October 31
(TL06)
1,6
6% unsecured local bond
February 22
6
1,127
2,500
-
-
-
-
2,500
due February 24, 2020
(TL20)
7
Zero coupon unsecured loan
-
-
142
430
-
-
-
-
430
stock due September 30, 2010
(PP02)
8
Zero coupon unsecured loan
-
-
437
1,350
-
-
-
-
1,350
stock due June 15, 2010 (PP03)
9
7.125% unsecured Euro bond
April 12
7.125
5,195
5,195
-
-
5,195
-
-
due April 12, 2005
10
Finance leases
n/a
13.44 to
654
654
-
-
-
-
654
14.69
Repurchase agreements
n/a
n/a
253
253
253
-
-
-
-

76
Nominal
Maturing
amount
Outstanding
outstanding
Twelve Months ended September 30,
Interest as of as of
payment
Interest September 30,
September 30,
After
dates
rate
2002
2002
2003
2004
2005
2006
2006
(%)
ZAR
ZAR
ZAR
ZAR
ZAR
ZAR
ZAR
(in millions)
Commercial paper
Zero coupon unsecured -
Various
Various
1,692
2,154
409
55
1,690
-
-
commercial paper bills with
a maturity not later than
April 4, 2005. The average
discount rate on these
commercial paper bills is
10.49% per annum.
Bank facilities
Bank loan from Dresdner Bank
-
3.
83
26
26
26
-
-
-
-
(Switzerland) Ltd repayable on
July 31, 2003
3
R146 million unsecured overdraft
-
Prime
Not
Not
-
-
-
-
-
facility with ABSA Bank Limited,
Rate
utilized
utilized
repayable on demand
R485 million unsecured overdraft
-
Prime
Not
Not
-
-
-
-
-
facility with The Standard Bank of
Rate
utilized
utilized
South Africa Limited, repayable
on demand
R100 million unsecured overdraft
-
Mutually
Not
Not
-
-
-
-
-
facility with ABN Ambro Bank,
agreed
utilized
utilized
repayable on demand
$35 million unsecured short
-
Mutually
Not
Not
-
-
-
-
-
term loan facility with Credit
agreed
utilized
utilized
Agricole Indosuez, various
repayment dates
Various bank loans
3
-
-
135
135
7
4
4
4
116
R359 million credit facility
-
Johannesburg
359
359
-
-
-
-
359
with European Investment
Interbank
Bank repayable on March 13,
Agreed Rate
2009
11
plus 0.75
Bank overdraft and other
-
-
-
-
-
-
-
-
-
short-term debt
Total Telkom
23,030
27,447
5,695
3,559
6,889
4
11,300
VODACOM
12
R200 million unsecured credit
-
13.
7
100
100
100
-
-
-
-
facility with Commerzbank AG
repayable on March 17, 2003
R200 million unsecured credit
-
14.
0
100
100
100
-
-
-
-
facility with Credit Agricole
Indosuez repayable on
March 17, 2003
$45 million project finance for
Vodacom Tanzania Limited
13
-
5.
513
237
237
29
38
47
59
64
Various finance leases
14
-
13.
85
397
397
5
10
18
30
334
14.69
Vodacom Congo (R.D.C.) S.P.R.L.
-
EURIBOR+
149
149
-
149
-
-
-
Extended credit facility
1.75%
Various other short-term loans
-
-
89
89
43
-
-
-
46
Bank overdrafts and other
-
-
1,364
1,364
1,364
-
-
-
-
short-term debt
Total Vodacom
12
-
-
2,436
2,436
1,641
197
65
89
444
TOTAL
-
-
25,466
29,883
7,336
3,756
6,954
93
11,744
77
1
Listed on the Bond Exchange of South Africa.
2
Open ended bond issue, and number of bonds issued varies from time to time. As of September 30, 2002, R4,436 million of these bonds were
in issue.
3
R3,621 million of Telkom's indebtedness outstanding as of September 30, 2002 was guaranteed by the Government of the Republic of South
Africa.
4
2,000 of these bonds were issued on November 30, 1998 at a yield to maturity of 17.3% and a further 1,500 of these bonds were issued on July 29,
1999 at an interest rate of 15.52%.
5
2,700 of these bonds were issued on March 15, 2001, a further 800 of these bonds were issued on June 26, 2001 and a further 1,500 of these
bonds were issued on July 24, 2001. The yield to maturity was 11.27%, 10.74% and 10.47%, respectively.
6
1,500 of these bonds were issued on October 31, 2001 at a yield to maturity of 10.87%.
7
2,500 of these bonds were issued on February 22, 2000 at a yield to maturity of 15.00%.
8
Issued on February 25, 2000. Original amount issued was R430 million. The yield to maturity of this instrument issued by Telkom is 14.37%.
9
Issued on June 15, 2000. Original amount issued was R1.4 billion. The yield to maturity of this instrument is 15.175%.
10
Listed on the London Stock Exchange. An aggregate principal amount of Euro 500 million was issued on April 12, 2000.
11
Guaranteed by Absa Bank Limited.
12
Represents Telkom's 50% share of Vodacom's indebtedness.
13
Payable on agreement of all shareholders.
14
Secured by land and buildings.
We expect to repay the indebtedness and other obligations in the above table with cash flows from operations and/or new capital
raised in the markets. None of the outstanding indebtedness in the above table is convertible into other securities and, being debt
instruments, were not offered or issued to our existing shareholders. The bonds in the above table were issued to, and are currently
held by, a number of third parties pursuant to public offers and private placements undertaken by us. The funds raised through the
issuances of the above indebtedness were used for the extension and modernization of our communications networks, the provision
of additional communications services and for general working capital purposes. The loan from the European Investment Bank was
raised for the purposes of the design, purchase, building, installation and implementation of a long distance national transmission
project.
The debt instruments in the above table do not contain any restrictive covenants except a number of the instruments contain
provisions limiting our ability to create liens. In addition, our R2.5 billion 6% local bonds due February 24, 2020 contain financial
maintenance covenants requiring the Telkom Group to maintain the following ratios:
-
EBITDA to net interest expense ratio of no less than 3.5:1 in the 2003 financial year, increasing to 4.0:1 in the 2004 financial
year and 5.0:1 thereafter; and
-
net interest bearing debt to EBITDA ratio of no greater than 2.0:1.
Our R359 million credit facility with the European Investment Bank contains financial maintenance covenants requiring the
Telkom Group to maintain an EBIT to net finance costs ratio of not less than 1.8:1 and a debt to equity ratio of not greater than
4.1:1. The guarantee agreement by Absa Bank Limited, a company incorporated in the Republic of South Africa, with respect to
this loan requires the Telkom Group to maintain the following ratios:
-
EBIT to net finance cost ratio of not less than 2.2:1 in the 2003 financial year, increasing to 2.5:1 in the 2004 financial year;
-
debt to equity ratio of no greater than 1.5:1 in the 2003 financial year, decreasing to 1.25:1 in the 2004 financial year; and
-
net worth of no less than R13 billion.
On December 17, 2002, we repaid our R359 million credit facility with the European Investment Bank and terminated this
facility.
The above ratios are calculated semi-annually based on accounting policies in use at the time the indebtedness was incurred.
Because the above ratios are calculated based on accounting policies in use at the time the indebtedness was incurred, EBITDA for
purposes of the ratios is not calculated in the same manner as it is calculated elsewhere in this prospectus.
All debt incurred by Telkom prior to 1991 is guaranteed by the Government of the Republic of South Africa pursuant to
Section 35 of the South African Exchequer Act, 66 of 1975. The Government of the Republic of South Africa does not guarantee
debt incurred thereafter or Vodacom's debt. As of September 30, 2002, R3,621 million of our total indebtedness of R25.5 billion
was guaranteed by the Government of the Republic of South Africa.
The only material loan made by Telkom or any of its subsidiaries is the loan of R460 million to Vodacom, which is not reflected
in the table above and is unsecured, and which is more fully described in "Relationship with Vodacom and Related Transactions
Loan agreement" on page 153 of this prospectus. This loan is our only material intercompany financing arrangement. No loans have
been furnished by Telkom or any of its subsidiaries for the benefit of any director. Telkom's policy is to hedge its exposure to
foreign exchange rate fluctuations.
Interest rate risk is converted to Rands and managed per our policy and control manual which stipulates guidelines on exposure
to fixed and floating rate debt. Telkom's philosophy is to target a fixed/floating debt ratio of at least 65% fixed, adjusted to market
conditions considering the interest rates at that time. If interest rates are low, Telkom will establish a higher than 65% fixed/floating
debt ratio and when interest rates are high, Telkom seeks to establish the ratio closer to a 65% fixed/floating debt ratio.
78
Report by directors as to material changes
Telkom reports that there have been no material changes in its financial or trading position or that of its subsidiaries since
March 31, 2002, other than in the ordinary course of business or as set out in this prospectus.
IAS compared with US GAAP
The consolidated financial statements of the Telkom Group and of Vodacom have been prepared in accordance with IAS, which
differs in certain respects from US GAAP. The significant differences between IAS and US GAAP and the effects on net income
and shareholders' equity, relating to the consolidated financial statements of the Telkom Group are described in note 41 to the
Telkom Group's consolidated financial statements beginning on page F97 of this prospectus. The description of the differences and
the effects on net income and shareholders' equity of Vodacom are included in note 45 of Vodacom's consolidated financial
statements beginning on page F176 of this prospectus. As further discussed in those financial statements, the most significant
differences between IAS and US GAAP relating to the Telkom Group's consolidated financial statements include revenue
recognition, sale and leaseback transactions, derivative financial instruments, goodwill, share issue expenses and deferred income
taxes and for Vodacom they include derivative financial instruments, goodwill, joint venture accounting, deferred bonus incentive
schemes and deferred income taxes.
Dealer Incentives
Telkom provides incentives to its retail payphone card distributors as trade discounts. Incentives are based on sales volume and
value.
Revenue for retail payphone cards is recorded as traffic revenue, net of these discounts as the cards are used.
The following is a summary of the incentives offered by Vodacom:
Contract connection incentive commissions
These incentives are offered to service providers or dealers to stimulate the acquisition of new customers for all contract
packages. A commission is paid to the service provider or dealer for each new activation. The cost of paying the commission is
recognized as an expense in the period of the connection as part of customer acquisition costs. Vodacom accounts for the incentive
paid as an expense, rather than netting the expense against revenue.
Contract retention incentive commissions
These incentives are offered to service providers or dealers to maintain and retain existing customer loyalty for all contract
packages, excluding Vodacom 4U. The purpose of these incentives is to minimize customer churn. Vodacom calculates the incentive
paid monthly and the expense is recognized in the period it is earned by the service provider or dealer.
Prepaid incentive commissions
These incentives are offered to service providers or dealers to stimulate the acquisition of new customers for all prepaid
packages. A commission is paid to service providers or dealers for each new activation. The cost of paying the commission is
recognized as an expense in the period of the connection as part of customer acquisition costs. Vodacom accounts for the incentive
paid as an expense, rather than netting the expense against revenue.
Distribution incentive commissions
These incentives are offered to service providers or dealers to maintain and increase their loyalty to, and exclusivity with,
Vodacom. These incentives include exclusivity payments and advances to service providers in respect of purchases of assets for
stores and providing distribution outlets with distribution subsidies to maintain the loyalty of distribution outlets through the
stimulation of sales. These incentives are accounted for as follows:
-
exclusivity payment costs incurred are paid annually and are deferred and recognized ratably over the contractual relationship
period;
-
advances for purchases of distribution assets are capitalized and expensed over 24 to 36 months, the period of the contractual
relationship period with the distributors; and
-
distribution subsidies are expensed based on the terms of the agreement. Typical terms are either at a fixed rate per customer
or a fixed monthly rate.
Critical accounting policies and estimates
The preparation of our financial statements requires management to make estimates and assumptions that affect the reported
results of our operations. Management believes the following critical accounting policies, among others, affect its more significant
judgments and estimates used in the preparation of our consolidated financial statements and are critical to the business operations
and the understanding of the results of our operations.
79
General
We evaluate our estimates, including those relating to bad debts, inventories, investments, intangible assets, income taxes,
pension and other post retirement benefits and contingencies and litigation on an ongoing basis. We base our estimates on historical
experience and on various other assumptions that we believe to be reasonable under the circumstances, the results of which form
the basis for making our judgments about carrying values of assets and liabilities that are not readily available from other sources.
Actual results may differ from those resulting from estimates made under different assumptions and conditions.
Revenue recognition
Revenue, excluding value added taxation and sales between group companies, represents the invoiced value of goods and
services supplied by us. We measure revenue at the fair value of the consideration received or receivable. Revenue is recognized
only when it is probable that the economic benefits associated with a transaction will flow to us and the amount of revenue, and
associated costs incurred or to be incurred can be reliably measured.
Revenue from usage and network access is recognized as services are provided. Revenue is recognized on a usage basis
commencing on the date of activation of services with any revenue on prepaid airtime or phone cards forfeited being recognized on
expiration date. Revenue from the sale of equipment is recognized when the customer accepts delivery. Other revenue is recognized
when the right to receive payment has been established.
Useful life of intangible assets
In assessing the recoverability of goodwill and other intangible assets, we must make assumptions regarding estimated future
cash flows and other factors to determine the fair value of the respective assets. If these estimates or their fair value assessments
change in the future, we may need to record impairment charges for these assets not previously recorded. Goodwill associated with
the excess purchase price over the fair value of assets acquired and other identifiable intangible assets, such as trademarks and
licenses, are currently amortized on the straight line basis, over their estimated useful lives.
Useful life of long-lived assets
In assessing the useful life of long-lived assets, we use estimates of future cash flows and expectation regarding the future
utilization pattern of the assets to determine the depreciation to be charged on a straight line basis over the estimated useful lives of
the assets. On a regular basis, we review the useful lives and economic capacity of the long-lived assets with reference to any events
or circumstances which may indicate that an adjustment to the depreciation period is necessary.
Given the significance of long-lived assets to our financial statements, any change in the depreciation period could have a
material impact on our results of operations and financial condition.
Impairment of long-lived assets
We periodically evaluate our long-lived assets for potential impairment indicators. Our judgments regarding the existence of
impairment indicators are based on legal factors, market conditions and operational performance. Further events could cause us to
conclude that impairment indicators exist and that the specified long-lived asset is impaired. The fair values determined are
dependent upon the forecasted performance of our business, changes in the telecommunications industry and the overall economic
environment. When we determine that the carrying value of any long-lived asset may not be recoverable, we measure any
impairment based upon a comparison of the carrying amounts of the asset to its fair value, which is determined by using a
forecasted discounted cash flow method.
In assessing the recoverability of our long-lived assets, we must make assumptions regarding estimated future cash flows and
other factors to determine the fair value of the respective assets. If these estimates, or their fair value assessments, change in the
future or if the forecasts are not met, we may have to record additional impairment charges not previously recognized. Any resulting
additional impairment loss could have a material impact on our results of operations and financial condition.
Trade receivables - estimation of provision for doubtful debts
We maintain allowances for doubtful accounts for estimated losses resulting from the inability of our customers to make
required payments. In order to estimate the appropriate level for this allowance, we analyze historical bad debts, customer
concentrations, current customer credit-worthiness, current economic trends and changes in our customer payment patterns. If the
financial condition of our customers were to deteriorate, resulting in an impairment of their ability to make payments, additional
allowances may be required. A considerable amount of judgment is required in assessing the ultimate realization of these
receivables including the current credit-worthiness of each customer.
Deferred taxation assets
Significant judgment is required in determining our provision for income taxes and our deferred tax assets and liabilities.
80
Deferred taxation assets
Significant judgment is required in determining our provision for income taxes and our deferred tax assets and liabilities.
We estimate our current tax exposure based on the positions utilized in filing our tax returns together with the temporary
differences resulting from different treatment of items, such as deferred revenue, depreciation for tax and accounting purposes.
These temporary differences result in deferred tax assets and liabilities being recognized. We must then assess the probability
of our deferred tax assets being recoverable from future taxable income. To the extent that we believe that recovery is not likely, we
will establish a valuation allowance. The carrying value of our net deferred tax assets assumes that we will be able to generate
sufficient future taxable income in certain tax jurisdictions, based on estimates and assumptions. While we have considered future
taxable income and ongoing prudent and feasible tax planning strategies in assessing the need for the valuation allowance, in the
event that we were to determine that we would not be able to realize our deferred tax assets in the future, a valuation allowance may
be required which would reduce income in the period such determination was made.
Post employment benefits
We have significant pension and postretirement benefit costs and credits that are developed from actuarial valuations and
calculations. We follow the guidance of IAS 19, "Employee Benefits" and SFAS 106, "Employers' Accounting for Postretirement
Benefits Other Than Pensions" for these benefits. Under these accounting standards, assumptions are made regarding the valuation
of benefit obligations and performance of plan assets. The guiding principle of these standards is delayed recognition of differences
between actual results and those assumed. This allows for a smoothed recognition of changes in benefit obligations and plan
performance over the estimated working lives of the employees who benefit under these plans.
Inherent to these valuations and calculations are key assumptions, including discount rates and expected return on assets. The
primary assumptions used are as follows:
-
Discount rate - The discount rate is used to record the value of benefits, which are based on future projections, in terms of
today's Rand-value.
-
Expected return on plan assets - Management projects the future return on plan assets based principally on prior
performance. An increase in the projected future value of assets reduces the benefit obligation a company will record.
-
Rate of compensation increase - Management estimates pay increases, which are used to project employees' pension benefits
after retirement.
-
Health care cost trend - Management projects the expected increases in the cost of health care.
-
Amortization of gains or losses - Management can select the method by which gains or losses are recognized in the financial
results. These gains or losses are created when actual results differ from estimated results based on the above assumptions.
We are required to consider current market conditions, including changes in interest rates and healthcare inflation, in selecting
these assumptions. Changes in the related pension and post employment benefit costs and credits may occur in the future in
addition to changes resulting from fluctuations in our related headcount.
Termination benefits
During the year ended March 31, 2002, we recorded significant termination benefits related to a planned reduction in staff
numbers. These costs included estimates pertaining to employee separation costs and settlement of contractual obligations resulting
from our decision to reduce staff numbers. Provision has only been made for the number of employees specifically identified and
notified at year end. Although we do not anticipate significant changes, the actual costs may differ from these estimates.
Inventory
We write down our inventory for estimated obsolescence or unmarketable inventory equal to the difference between the cost of
inventory and the estimated market value, based upon assumptions about future demand and market conditions. If actual market
conditions are less favorable than those projected by management, additional inventory write-downs may be required.
Commitments and contingencies
Management's current estimated range of liabilities relating to certain pending litigation and arbitration proceedings is based on
claims for which management can estimate the amount and range of loss. We have recorded the minimum estimated liability related
to those claims where there is a range of loss. Because of the uncertainties relating to both the amount and range of loss on the
remaining pending litigation and arbitration proceedings, management is unable to make a reasonable estimate of the liability that
could result from an unfavorable outcome. As additional information becomes available, we will assess the potential liability related
to our pending litigation and arbitration proceedings and revise our estimates. Such revisions in our estimates of the potential
liability could materially impact our results of operation and financial position. See "Legal Proceedings" on page 122 of this
prospectus.
Incentive compensation
Management incentive plans are tied to various financial performance metrics. Bonus accruals made throughout the year related
to the various incentive plans are based on management's best estimate of the achievements of the specific financial metrics.
Adjustments to accruals are made on a quarterly basis as forecasts of financial performance are updated. At year-end, the accruals
are adjusted to reflect the actual results achieved.
81
Fair value estimations of financial instruments
Fair values are based on listed market prices, where available. If listed market prices are not available, fair value is determined
based on other relevant factors, including dealers' price quotations and price quotations for similar instruments traded in different
markets. Fair value for certain derivatives are based on pricing models that consider current market and contractual prices for the
underlying financial instruments or commodities, as well as the time value and yield curve or volatility factors underlying the
positions. Pricing models and their underlying assumptions impact the amount and timing of unrealized gains and losses
recognized, and the use of different pricing models or assumptions could produce different financial results.
Leasing
We apply the provisions of IAS 17 to all leasing transactions. In general, there are two types of leases from a lessee's
perspective: operating leases which are leases accounted for off-balance sheet, and capital leases which are leases capitalized on the
balance sheet.
In accounting for leases, management makes significant assumptions, including the discount rate, fair market value of the leased
assets and their estimated useful life. Changes in these assumptions could result in a significant change to the amounts recognized
in the financial statements.
In addition to uncertainty inherent in management assumptions, leasing transactions become increasingly complex when they
involve sale/leaseback accounting, which are leasing transactions where the lessee previously owned the leased assets. In these
instances it is important to analyze the facts relating to the transactions to determine whether the transactions are finance leases or
operating leases, which will result in either on-balance sheet or off-balance sheet recognition, respectively.
Any changes in the assumptions used by management could significantly impact on the value of assets and liabilities in our
consolidated accounts.
Provisions
Telkom applies IAS 37 in making assessments about the appropriate amount of provisions to be recognized for commitments
and contingencies. Provisions are recognized when, and only when, the Telkom Group has a present obligation, legal or
constructive, as a result of a past event and it is probable that an outflow of resources will be required to settle the obligation.
Provisions are reviewed at each balance sheet date and adjusted to reflect management's best estimate. While management does not
anticipate any significant changes to the provisions reflected in the accompanying consolidated financial statements, changes in
assumptions or related facts and circumstances could result in significant changes in the future.
Any changes in the assumptions used by management could significantly impact on the value of assets and liabilities in the
group accounts.
Quantitative and qualitative disclosures about market risk
Financial instruments and financial risk management
Exposure to continuously changing market conditions has highlighted the importance of financial risk management as an
element of control. Treasury policies, risk limits and control procedures are continuously monitored by Telkom's board of directors
through its audit and risk management committee.
We hold or issue financial instruments to finance our operations, for the temporary investment of short-term funds and to
manage currency and interest rate risks. In addition, financial instruments, for example trade debtors and trade creditors, arise
directly from our operations.
We finance our operations primarily by a mixture of issued share capital, retained profit and long-term and short-term loans.
We use derivative financial instruments to manage our exposure to market risks from changes in interest and foreign exchange rates.
The derivatives used for this purpose are principally interest rate swaps, currency swaps and forward exchange contracts.
Market sensitive instruments - other than for trading purposes
Interest rate risk management
Interest rate risk arises from the repricing of our floating rate debt as well as incremental funding or new borrowings and the
refinancing of existing borrowings.
Our policy is to manage interest cost through the utilization of a mix of fixed and variable rate debt. In order to manage this
mix in a cost efficient manner, we make use of interest rate derivatives as approved pursuant to our group policy. Fixed rate
debt represented 86.2% of our total consolidated debt as of March 31, 2002. The debt profile of mainly fixed rate debt has been
maintained to limit our exposure to interest rate increases given the substantial size of the group's debt portfolio. All financial
instruments that re-price within one year are deemed to be floating rate debt.

82
The following table shows our fixed and variable rate debt for the periods indicated.
At March 31, 2002,
2003
2004
2005
2006
2007 Thereafter
Total
Fair value
(in millions, except percentages)
Long-term debt
Telkom
Fixed rate (ZAR
denominated)
Long-term debt,
including current
portion . . . . . . . . .
200
5,000
3,500
-
1,455
8,874
19,029
15,795
Average interest rate
(percentage)
1
. . . . . .
14.93
10.95
16.55
-
10.87
15.29
14.03
-
Commercial paper bills
1,196
58
1,446
262
-
-
2,962
2,409
Average interest rate
(percentage)
2
. . . . . .
11.17
14.51
14.27
14.06
-
-
13.01
-
Finance leases . . . . . .
-
-
-
-
-
637
637
637
Fixed rate (EURO
denominated)
Long-term debt . . . . .
-
-
-
4,998
-
-
4,998
5,018
Average interest rate
(percentage)
. . . . . . .
-
-
-
7.13
-
-
7.13
-
Variable rate (ZAR
denominated)
Variable rate . . . . . .
21
-
-
-
-
359
380
380
Average interest rate
(percentage)
2, 3
. . . . .
10.30
-
-
-
-
11.34
11.29
-
Variable rate (EURO
denominated)
Variable rate . . . . . .
12
4
4
4
4
107
135
135
Average interest rate
(percentage)
1, 3
. . . . .
1.35
1.05
1.05
1.05
1.05
0.77
0.85
-
Variable rate (USD
denominated)
Variable rate . . . . . .
28
14
-
-
-
-
42
42
Average interest rate
(percentage)
1, 3
. . . . .
3.83
3.83
-
-
-
-
3.83
-
Vodacom
4
Fixed rate (ZAR
denominated)
Finance leases . . . . . .
3.6
(2.8)
4.3
10.2
-
235.9
251.2
251.2
Variable rate (ZAR
denominated)
Finance leases . . . . . . .
1.7
(1.2)
0.8
3.3
-
139.6
144.2
144.2
1
Weighted average yield to maturity.
2
Weighted average interest rate.
3
Variable rate equals the current reset rate applicable on reporting date.
4
Represents Telkom's 50% share of Vodacom's indebtedness.

83
The following table shows our interest rate swaps for the periods indicated.
At March 31, 2002,
2003
2004
2005
2006
2007 Thereafter
Total
Fair value
(in millions, except percentages)
Telkom
Pay fixed, receive
floating . . . . . . . . . .
1,300
-
150
-
-
1,000
2,450
(77)
Average pay rate
(percentage)
1
. . . . . . .
12.19
-
12.92
-
-
14.67
13.25
-
Average receive rate
(percentage)
1
. . . . . . .
10.24
-
10.25
-
-
10.76
10.45
-
Vodacom
2
Receive fixed, pay
floating . . . . . . . . . .
-
-
-
-
-
74
74
5
Average pay rate
(percentage)
1, 3
. . . . . .
-
-
-
-
-
12.32
12.32
-
Average receive rate
(percentage)
1
. . . . . . .
-
-
-
-
-
15.97
15.97
-
1
Weighted average interest rate.
2
Represents Telkom's 50% share of Vodacom's indebtedness.
3
Variable rate calculated as of March 31, 2002.

84
The following table shows our currency swaps for the periods indicated.
Year ended March 31, 2002,
2003
2004
2005
2006
2007 Thereafter
Total
Fair value
(in millions, except percentages)
Telkom
USD
Receive USD, pay ZAR . 1,400
-
-
-
-
-
1,400
1,099
Average contractual
exchange rate (USD/ZAR)
6.36
-
-
-
-
-
6.36
-
Receive floating USD,
pay floating ZAR . . . . .
-
-
-
-
-
-
-
-
Average pay rate
(percentage)
1
. . . . . . . . 12.82
-
-
-
-
-
12.82
-
Average receive rate
(percentage)
1 . . . . . . . . . . . . .
3.02
-
-
-
-
-
3.02
-
Receive ZAR, pay USD . . 1,990
-
-
-
-
-
1,990
(494)
Average contractual
exchange rate (USD/ZAR)
9.05
-
-
-
-
-
9.05
-
Receive floating ZAR,
pay floating USD . . . . .
-
-
-
-
-
-
-
-
Average pay rate
(percentage)
1
. . . . . . . .
1.82
-
-
-
-
-
1.82
-
Average receive rate
(percentage)
1
. . . . . . . . 11.34
-
-
-
-
-
11.34
-
EURO
Receive EURO, pay ZAR .
-
-
-
2,177
-
-
2,177
1,350
Average contractual
exchange rate
(EURO/ZAR) . . . . . . .
-
-
-
6.22
-
-
6.22
-
Receive fixed EURO, pay
fixed ZAR . . . . . . . . .
-
-
-
-
-
-
-
-
Average pay rate
(percentage)
1
. . . . . . . .
-
-
-
15.89
-
-
15.89
-
Average receive rate
(percentage)
1
. . . . . . . .
-
-
-
7.13
-
-
7.13
-
Receive EURO, pay ZAR
-
-
-
630
-
-
630
456
Average contractual
exchange rate
(EURO/ZAR) . . . . . . .
-
-
-
6.30
-
-
6.30
-
Receive fixed Euro, pay
floating ZAR . . . . . . . .
-
-
-
-
-
-
-
-
Average pay rate
(percentage)
1
. . . . . . . .
-
-
-
12.03
-
-
12.03
-
Average receive rate
(percentage)
1
. . . . . . . .
-
-
-
7.13
-
-
7.13
-
1
Weighted average interest rate.

85
Foreign currency exchange rate risk
We manage our foreign exchange rate risk by hedging all identifiable exposures via various financial instruments suitable to our
risk exposure.
Cross currency swaps and forward foreign exchange contracts have been entered into to reduce the foreign currency exposure on
our operations and our liabilities. We also enter into forward foreign exchange contracts to hedge interest expense and purchase and
sale commitments denominated in foreign currencies, principally US Dollars and Euros. The purpose of our foreign currency
hedging activities is to protect us from the risk that the eventual net flows will be adversely affected by changes in exchange rates.
We make use of foreign debt funding when the opportunity exists to fund at a lower than local cost of funding.
We have reduced our foreign currency denominated debt over the year ended March 31, 2002, due to a premium paid on foreign
debt over local funding.
The following table sets forth our liabilities and related derivative instruments subject to foreign exchange risk for the periods
indicated.
Year ended March 31, 2002,
2003
2004
2005
2006
2007 Thereafter
Total
Fair value
(in millions, except percentages)
Telkom
Long term debt
Fixed rate (EURO
denominated)
2
. . . . . . . .
-
-
-
4,998
-
-
4,998
5,018
Average interest rate
(percentage)
1
. . . . . . . .
-
-
-
7.13
-
-
7.13
-
Variable rate
(EURO denominated)
2
. . .
12
4
4
4
4
107
135
135
Average interest rate
(percentage)
1
. . . . . . . .
1.35
1.05
1.05
1.05
1.05
0.77
0.85
-
Accounts payable
(EURO denominated)
2
. . .
675
-
-
-
-
-
675
675
Interest free
Variable rate
(USD denominated)
3
. . . .
28
14
-
-
-
-
42
42
Average interest rate
(percentage)
1
. . . . . . . .
3.83
3.83
-
-
-
-
3.83
-
Accounts payable
(USD denominated)
3
. . . .
351
-
-
-
-
-
351
351
Interest free
Accounts payable
(British Pound Sterling
denominated)
4
. . . . . . . .
37
-
-
-
-
-
37
37
Interest free
Accounts payable
(Swedish Kronor
denominated)
5
. . . . . . . .
16
-
-
-
-
-
16
16
Interest free
1
Weighted average interest rate.
2
EURO converted at the spot rate quoted on Reuters of R9.996/EURO on March 29, 2002.
3
USD converted at the spot rate quoted on Reuters of R11.44/USD on March 29, 2002.
4
GBP converted at the spot rate quoted on Reuters of R16.319/GBP on March 29, 2002.
5
SEK converted at the spot rate quoted on Reuters of R0.9027/SEK on March 29, 2002.

86
The following tables set forth our foreign currency forward exchange contracts for the periods indicated.
Forward contracts to buy foreign currencies and sell ZAR
At March 31, 2002,
2003
2004
2005
2006
2007 Thereafter
Total
Fair value
(ZAR)
Telkom
US Dollar
Notional Amount (millions) .
4,297
177
195
213
-
-
4,882
621
Average contractual
exchange rate . . . . . . . .
10.83
8.75
9.75
10.64
-
-
10.68
-
EURO
Notional Amount (millions) .
711
54
53
369
-
-
1,187
269
Average contractual
exchange rate . . . . . . . .
10.49
15.09
15.01
6.89
-
-
9.24
-
Pound Sterling
Notional Amount (millions) .
107
-
-
-
-
-
107
(2)
Average contractual
exchange rate . . . . . . . .
17.06
-
-
-
-
-
17.06
-
Swedish Krona
Notional Amount (millions) .
21
-
-
-
-
-
21
0
Average contractual
exchange rate . . . . . . . .
1.14
-
-
-
-
-
1.14
-
Japanese Yen
Notional Amount (millions) .
3
-
-
-
-
-
3
0
Average contractual
exchange rate . . . . . . . .
0.09
-
-
-
-
-
0.09
-
Australian Dollar
Notional Amount (millions) .
2
-
-
-
-
-
2
0
Average contractual
exchange rate . . . . . . . .
6.12
-
-
-
-
-
6.12
-
Vodacom
US Dollar
Notional Amount (millions) .
549.4
0.6
-
-
-
-
550
59.5
Average contractual
exchange rate . . . . . . . .
10.7
-
-
-
-
-
10.7
-
EURO
Notional Amount (millions) .
642.8
-
-
-
-
-
642.8
47.9
Average contractual
exchange rate . . . . . . . .
9.5
-
-
-
-
-
9.5
-
Pound Sterling
Notional Amount (millions) .
1.3
-
-
-
-
-
1.3
0
Average contractual
exchange rate . . . . . . . .
16.7
-
-
-
-
-
16.7
-
Swiss Franc
Notional Amount (millions) .
0.03
-
-
-
-
-
0.03
0
Average contractual
exchange rate . . . . . . . .
0.14
-
-
-
-
-
0.14
-

87
Forward contracts to buy foreign currencies and sell USD
2003
2004
2005
2006
2007 Thereafter
Total
Fair value
(ZAR)
Telkom
EURO
Notional Amount (millions) .
354
-
-
-
-
-
354
0
Average contractual
exchange rate . . . . . . . .
0.88
-
-
-
-
-
0.88
-
Forward contracts to sell foreign currencies and buy ZAR
2003
2004
2005
2006
2007 Thereafter
Total
Fair value
(ZAR)
Telkom
US Dollar
Notional Amount (millions) .
1,400
69
75
81
107
275
2,007
(608)
Average contractual
exchange rate . . . . . . . .
9.96
7.89
8.52
9.23
10.08
10.94
9.90
-
EURO
Notional Amount (millions) .
379
-
-
-
-
-
379
(14)
Average contractual
exchange rate . . . . . . . .
9.87
-
-
-
-
-
9.87
-
Pound Sterling
Notional Amount (millions) .
45
-
-
-
-
-
45
(3)
Average contractual
exchange rate . . . . . . . .
15.89
-
-
-
-
-
15.89
-
Vodacom
US Dollar
Notional Amount (millions) .
21.3
-
-
-
-
-
21.3
0.4
Average contractual
exchange rate . . . . . . . .
12.0
-
-
-
-
-
12.0
-
EURO
Notional Amount (millions) .
31.6
-
-
-
-
-
31.6
0.2
Average contractual
exchange rate . . . . . . . .
10.1
-
-
-
-
-
10.1
-
Pound Sterling
Notional Amount (millions) .
0.5
-
-
-
-
-
0.5
-
Average contractual
exchange rate . . . . . . . .
16.7
-
-
-
-
-
16.7
-
EURO currency swap
2003
2004
2005
2006
2007 Thereafter
Total
Fair value
(ZAR)
Telkom
Receive EURO, Pay ZAR . .
-
-
2,177
-
-
2,177
1,350
Average contractual exchange
rate (EURO/ZAR) . . . . . .
-
-
-
6.22
-
-
6.22
-
Receive fixed EURO, pay
fixed ZAR
Average pay rate (%)
1
. . . .
-
-
-
15.89
-
-
15.89
-
Average receive rate (%)
1
. .
-
-
-
7.13
-
-
7.13
-
Receive EURO, Pay ZAR . .
-
-
-
630
-
-
630
456
Average contractual
exchange rate (EURO/ZAR)
-
-
-
6.30
-
-
6.30
-
Receive fixed EURO, pay
floating ZAR
Average pay rate (%)
1
. . . .
-
-
-
12.03
-
-
12.03
-
Average receive rate (%)
1
. .
-
-
-
7.13
-
-
7.13
-
1
Weighted average interest rate.
88
Other market risks
Credit risk management
We are not exposed to major concentrations of credit risk. To reduce the risk of counter party failure, limits are set based on the
individual ratings of counterparties by well-known ratings agencies. Credit limits are reviewed on a yearly basis or when
information becomes available in the market. We limit our exposure to any counterparty and these exposures are monitored daily.
We expect that all counterparties will meet their obligations.
Trade debtors comprise a large and widespread customer base, covering residential, business and corporate customer profiles.
Credit checks are performed on all customers on application for new services, and on an ongoing basis where appropriate.
Liquidity risk management
We are exposed to liquidity risk as a result of uncertain debtor related cash flows as well as capital commitments.
Liquidity risk is managed by our corporate finance division in accordance with policies and guidelines formulated by Telkom's
operating committee. Pursuant to our borrowing requirements, we ensure that sufficient facilities exist to meet our immediate
obligations. Telkom's Operating Committee maintains a reasonable balance between the period over which assets generate funds
and the period over which the respective assets are funded in order to manage long-term liquidity risk.
We had available credit facilities not utilized of R2.2 billion as of March 31, 2002.
Fair value of financial instruments
The fair values of financial instruments are calculated using the market rates on valuation date. The values disclosed above are
indicative values and may not be the realizable value.
89
THE SOUTH AFRICAN TELECOMMUNICATIONS INDUSTRY
The information presented in this section has been derived from a number of independent publications.
Overview of South Africa
South Africa had an estimated population of 45.4 million persons as of mid year 2002 according to Statistics South Africa.
South Africa has a stable political system and a highly developed financial and legal infrastructure. The South African
Government's current macro-economic strategy for growth, employment and redistribution is based on promoting free market
principles and sound financial and fiscal discipline. As a result, South Africa has experienced significant GDP growth in recent
years, with GDP per capita increasing from R17,634 in 1998 to R21,889 in 2001 (Source: South Africa Reserve Bank, March 2002)
although the GDP per capita in South Africa decreased in US dollar terms from $3,160 to $2,623 due to the decline in the value of
the Rand (Source: EIU, September 2002). This ranks South Africa among countries such as Chile, Mexico, Hungary, Thailand and
Malaysia with USD GDP per capita of 4,460, 6,155, 5,137, 1,860 and 3,700, respectively (Source: EIU, September 2002). Inflation
in South Africa decreased from 8.6% in 1997 to 5.7% in 2001 and direct foreign investment in the country increased from $550
million, or 0.4% of GDP, in 1998 to $4.0 billion, or 3.2% of GDP, in 2000 (Source: World Markets Research Centre, October
2002). For more information on the South African economy, see "Republic of South Africa" beginning on page A1.
The South African telecommunications market
Overview
The South African telecommunications market is currently the largest in Africa based on customers and revenues. The market
has grown substantially in the past few years from R31.7 billion ($5.7 billion) in 1998 to R47.1 billion ($6.8 billion) in 2000
(Source: ITU, Yearbook of Statistics, Telecommunications 19912000, December 2001). As of September 30, 2002, fixed-line
penetration based on population was 10.8%, while mobile penetration had risen to 26.6%. While this may suggest that there is
significant growth opportunity in the South African telecommunications market, the country faces numerous challenges to
overcome the substantial inequality among its population in terms of geographic, economic and demographic distribution.
Approximately 55% of South Africa's population is concentrated in urban areas (Source: The World Bank 2002; data for year
2000). Similarly, wealth is highly concentrated with an estimated top 10% of the population earning in excess of 45% of the
national income while the poorest 20% earn under 3% (Source: The World Bank 2002; data from Survey in 19931994).
Fixed-line
The fixed-line telecommunications market in South Africa has grown approximately 28% from R20.4 billion ($3.7 billion) in 1998
to R26.1 billion ($3.8 billion) in 2000 (Source: ITU, Yearbook of Statistics, Telecommunications 1991-2000, December 2001).
The increase was primarily due to increased fixed-line usage by Telkom's global and corporate customer segment, increased internet
traffic and the introduction of new value-added voice and data products and prepaid fixed-line services. Telkom's introduction of
prepaid fixed-line services was the first prepaid fixed-line service to be made available to customers in the world. Long-term growth is
expected to continue to be driven by increased internet usage, increased usage of data services and the development and adoption of
new data products and services. Growth, however, may be limited by further tariff reductions, the continued migration of users from
fixed-line services to mobile services and a significant decrease in the rollout of new fixed access lines. As of September 30, 2002,
there were 4.9 million fixed access lines in South Africa.
Internet
South Africa is the largest internet market in Africa with an estimated 2.4 million internet users resulting in a penetration rate of
approximately 5.6% as of November 30, 2002 based on the estimated population as of mid year 2002 by Statistics South Africa.
The number of internet service providers increased rapidly from seven in 1997 to 170 at the end of 2001 as the market structure
evolved to accommodate tier two internet service providers. First tier internet service providers are wholesale resellers of bandwidth
while second tier internet service providers purchase international and sometimes local bandwidth from first tier internet service
providers. The internet service providers include Telkom, UUNet SA, Internet Solutions, AT&T Global Network, MTN Network
Solutions and DataPro.
Mobile
GSM mobile services were launched in South Africa in 1994 and have experienced rapid growth in the number of mobile users
increasing from 1.0 million users as of March 31, 1997 to 10.8 million users as of March 31, 2002, and 12.1 million users as of
September 30, 2002, resulting in mobile penetration increasing from 2.4% to 26.6% during the same period. However, the overall
penetration in South Africa remains low compared to Western European or Asian levels, which provides the potential for continued
growth in the number of customers. South African mobile revenues were R15,411 million in 2000, R21,052 million in 2001 and
R25,493 million in 2002. Revenues from mobile services grew approximately 88% from R11.2 billion ($1.06 billion) in 1998 to
R21.1 billion ($2.0 billion) in 2000 (Source: ITU, Yearbook of Statistics, Telecommunications 19912000, December 2001).

90
The increase in the number of mobile users was primarily due to the popularity of prepaid services, increased affordability of
handsets and a decline in overall tariffs for mobile services. The planned allocation of 1800MHz radio frequency spectrum is
expected to expand service coverage, increase network capacity and facilitate the introduction of high-end data services and mobile
internet.
There are currently three mobile communications network operators in South Africa, Vodacom, MTN and Cell C.
As of September 30, 2002, Vodacom had an approximately 59% market share of total reported customers in the South African
mobile market, while MTN had an approximately 36% share and Cell C accounted for the remaining 5% of customers. Cell C only
commenced operations in November 2001.
Year ended March 31,
Six months ended September 30,
1998
1999
2000
2001
2002
2001
2002
(in thousands, except percentages)
South Africa
Mobile users . .
1,836
100%
3,337
100%
5,188
100%
8,339
100%
10,789
100%
9,192
100%
12,081
100%
Vodacom . . . .
1,137
62%
1,991
60%
3,069
59%
5,108
61%
6,557
61%
5,657
61%
7,130
59%
MTN
1
. . . . . .
699
38%
1,346
40%
2,119
41%
3,231
39%
3,879
36%
3,535
39%
4,284
36%
Cell C
2
. . . . .
-
-
-
-
-
-
-
-
353
3%
-
-
667
5%
Total market
penetration (%) .
4.5
8.0
12.1
19.1
24.2
20.6
26.6
1
Source: MTN Financial Reports.
2
Source: Vodacom estimates.
The sub-Saharan Africa telecommunications market
Telecommunications markets in countries within sub-Saharan Africa vary considerably in terms of fixed-line and mobile
penetration.
The following table sets out key indicators for 2001 for selected countries in sub-Saharan Africa.
Mobile
customers as
Fixed-line
Mobile
percentage
telephones
customers
of total
GDP per
Population
1
per 100
per 100
telephone
GDP
5
capita PPP
6
Gini
Country
(millions)
inhabitants
2
inhabitants
3
customers
4
($ b
illions)
($)
coefficient
7
Angola . . . . . . . . . . .
13.53
0.59
0.64
52.0%
4.1
2,390
n/a
Botswana . . . . . . . . .
1.67
9.27
16.65
64.9%
5.8
10,220
n/a
D.R. Congo . . . . . . . .
52.52
0.04
0.29
88.2%
n/a
n/a
n/a
Kenya . . . . . . . . . . .
31.29
1.00
1.60
61.5%
9.8
1,230
44.9
Mozambique . . . . . . . .
20.19
0.44
0.84
65.5%
4.9
n/a
39.6
Nigeria . . . . . . . . . . .
116.93
0.43
0.28
39.8%
39.2
1,080
50.6
Tanzania . . . . . . . . . .
35.97
0.41
1.19
74.2%
9.2
900
38.2
Uganda . . . . . . . . . .
22.53
0.28
1.43
83.5%
5.9
1,320
37.4
Zambia . . . . . . . . . . .
10.65
0.80
0.92
53.5%
3.7
893
52.6
South Africa . . . . . . .
43.79
11.35
21.00
64.9%
113.3
7,880
59.3
1
Population based on data for 2001 as listed in ITU 2002 (June 20, 2002).
2
Fixed line penetration based on data for 2001 as listed in ITU 2002 (June 20, 2002). For Botswana data refers to year 2000.
3
Mobile penetration based on data for 2001 as listed in ITU 2002 (June 20, 2002).
4
Mobile customers as percentage of total telephone customers based on data for 2001 as listed in ITU 2002 (June 20, 2002).
5
GDP based on data for 2001 as listed in EIU September 2002. For Mozambique GDP refers to data for 1999 as listed in ITU 2002
(June 20, 2002).
6
GDP per capita based on data for 2001 as listed in EIU September 2002.
7
Gini Coefficient based on 2002 World Development Indicators, The World Bank. For Kenya data refers to year 1997. For Mozambique data refers
to years 19961997. For Nigeria data refers to years 19961997. For Tanzania data refers to year 1993. For Uganda data refers to year 1996. For
Zambia data refers to year 1998. For South Africa data refers to years 19931994. The closer the percentage is to 100%, the greater the income
disparity in the population.
91
The region of sub-Saharan Africa has historically suffered from low and stagnant market penetration rates, primarily due to a
lack of liberalization and competition, inadequate infrastructure, underdeveloped financial, legal and regulatory systems, civil strife
and low per capita income. According to the International Telecommunication Union, sub-Saharan Africa passed the penetration
threshold of one fixed-line telephone customer per 100 inhabitants in 2000. Telecommunications markets within the region have
undergone varying degrees of development, resulting in considerable discrepancy with regard to the development of fixed-line and
mobile infrastructure and penetration rates. Principal drivers for the development of these telecommunications markets have been,
and will continue to be, liberalization, increased competition and investment in infrastructure and technology, as well as political
stability and economic development.
The mobile sector has helped fuel growth in the telecommunications markets in sub-Saharan Africa over the last decade. On
average, mobile customers as a percentage of total telephone customers in the region is greater than 60%. Mobile services have
proved to be more successful than fixed-line services due to the underdeveloped fixed-line infrastructures and comparatively less
time required to install a mobile network. In addition, prepaid mobile services have been extremely successful in addressing the
need for affordable services in a region where income levels are low and the consumer credit system is underdeveloped. A growing
number of African mobile networks are prepaid only. On the African continent, approximately 80% of customers use prepaid
services, almost twice the global average (Source: ITU Telecommunication Indicators Update, October 2001).
92
BUSINESS
Overview
Telkom is one of the largest companies registered in the Republic of South Africa and we are the largest communications
services provider on the African continent based on operating revenue and assets. We had consolidated operating revenue of
R34.2 billion ($3.2 billion), net profit of R1.2 billion ($116 million) and cash flow from operating activities of R8.2 billion
($775 million) in the year ended March 31, 2002 and we had total assets of R55.2 billion ($5.2 billion) and shareholders' equity of
R16.8 billion ($1.6 billion) as of March 31, 2002. We had consolidated operating revenue of R18.3 billion ($1.7 billion), net profit
of R0.6 billion ($61 million) and cash flow from operating activities of R3.5 billion ($328 million) in the six months ended
September 30, 2002 and we had total assets of R54.6 billion ($5.2 billion) and shareholders' equity of R17.5 billion ($1.7 billion)
as of September 30, 2002.
We offer business, residential and payphone customers a wide range of services and products, including:
-
fixed-line voice services, including subscriptions and connections services, local, long distance, fixed-to-mobile and
international voice services, interconnection and transit communications services, value-added voice services, customer
premises equipment sales and directory services;
-
fixed-line data services, including domestic and international data transmission services, such as leased lines and
packet-based services, managed data networking services and internet access and related information technology services;
and
-
mobile communications services, including voice and data services, value-added services and handset sales through
Vodacom.
We had the exclusive right to provide public switched telecommunications services, including international voice services, in
South Africa until May 7, 2002. We are currently the only national provider of these services in South Africa, although a process
has been commenced to liberalize the South African communications market, which will introduce competition in a number of our
business areas. In 1997, we embarked on an extensive five year capital investment program in our fixed-line business. Our fixed-line
capital investment for the five years ended March 31, 2002 was R41.7 billion ($4.0 billion), of which R27.9 billion ($2.6 billion)
was for network modernization and line roll-out in order to comply with our license obligations and prepare for competition. As of
September 30, 2002, we had 4.9 million telephone access lines in service and 99.8% of our telephone access lines were connected
to digital exchanges.
Vodacom is our mobile communications joint venture with Vodafone and VenFin. Vodacom is the largest mobile
communications network operator in South Africa with a market share of approximately 59% as of September 30, 2002 based on
total reported customers. Vodacom had 7.7 million customers as of September 30, 2002, of which 7.1 million were in South Africa.
Vodacom has investments in mobile communications network operators in Lesotho, Tanzania and the Democratic Republic of the
Congo and in an entity that, in August 2002, was granted a license to operate a mobile communications network in Mozambique.
Vodacom had consolidated revenue of R16.2 billion ($1.5 billion), net profit of R2.4 billion ($225 million) and cash flow from
operating activities of R3.8 billion ($362 million) in the year ended March 31, 2002 and total assets of R15.4 billion ($1.5 billion)
and shareholders' equity of R5.5 billion ($518 million) as of March 31, 2002. Vodacom had consolidated revenue of R9.4 billion
($896 million), net profit of R0.9 billion ($87 million) and cash flow from operating of activities of R1.6 billion ($155 million) in
the six months ended September 30, 2002 and total assets of R17.3 billion ($1.6 billion) and shareholders' equity of R6.3 billion
($601 million) as of September 30, 2002.
Historical background
Privatization
Prior to 1991, the then Department of Posts and Telecommunications of the Republic of South Africa provided
telecommunications and post office services in South Africa on an exclusive basis. In 1991, Telkom was incorporated and registered
as a public limited liability company under the South African Companies Act, 61 of 1973, as amended, and the Government of the
Republic of South Africa transferred the entire telecommunications enterprise of the then Department of Posts and
Telecommunications of the Republic of South Africa to Telkom as part of a commercialization process intended to liberalize certain
sectors of South Africa's economy. On May 14, 1997, the Government of the Republic of South Africa sold a 30% equity interest in
Telkom to Thintana Communications as part of its policy to liberalize the telecommunications market in South Africa. As part of
this sale, the Government reserved the right to transfer up to 10% of its ordinary shares to previously disadvantaged groups. On
March 30, 2001, the Government sold another 3% equity interest in Telkom from its holdings to Ucingo Investments, a consortium
of black empowerment investors, leaving the Government with 67% of Telkom's issued and outstanding ordinary share capital.
As part of the sale to Thintana Communications, the then Minister of Posts, Telecommunications and Broadcasting of the
Republic of South Africa entered into an agreement with Thintana Communications under which Thintana Communications
undertook significant operational and managerial responsibilities and acquired the ability to exercise effective operational and
managerial control over us until May 2002. Pursuant to the agreement, Thintana Communications had the power to staff certain
93
management positions, including those of chief operating officer, chief financial officer and chief strategic officer. Consequently, the
individuals occupying these positions were seconded to Telkom from SBC Communications and Telekom Malaysia. In addition,
Thintana Communications and the Government were entitled to appoint a number of directors to Telkom's board of directors, based
on their ownership of Telkom, and a number of our corporate actions were subject to specific approval by Thintana
Communications and the Government or their board representatives. These matters generally included approval of business plans,
annual budgets, training programs and payment of dividends. Until May 2002, Thintana Communications was also entitled to
appoint a majority of the members of Telkom's operating committee, thus granting it control over many of our significant
operational matters. These matters generally included the preparation and implementation of business plans and annual budgets for
approval by Telkom's board of directors and the performance of obligations and the exercise of rights under Telkom's public
switched telecommunications services license.
Since May 2002, our strategic equity investors no longer exercise effective operational and managerial control over us, but they
continue to provide us with strategic direction as their nominees continue to occupy key managerial positions, including those of chief
operating officer, chief financial officer and chief strategic officer, and participate in Telkom's operating committee. Where previously
our strategic equity investors provided us with up to approximately 75 employees, they provided us with approximately 30 employees
as of September 30, 2002. See "Relationship with Major Shareholders and Related Transactions Shareholder arrangements
Strategic services agreement" beginning on page 148 of this prospectus.
Fixed-line transformation program
As a first step in preparing for the liberalization of the fixed-line telecommunications market in South Africa, we began a
transformation program in May 1997 to change the orientation of our fixed-line business from a majority governmental owned
entity to a market and profit-oriented business. Our transformation program aimed to reorganize our fixed-line business along
functional lines from the previous regional structure, change our corporate culture and improve the skills of our South African
employees, increase our marketing efforts, outsource non-core operations and manage revenue generation and operating expenses
more effectively.
Employee-related expenses are a significant component of our total fixed-line operating expenses. The number of our fixed-line
employees, excluding Telkom Directory Services and Swiftnet, declined by approximately 18,800 positions from March 31, 1997
through September 30, 2002. We spent R373 million, R132 million and R303 million in the years ended March 31, 2002, 2001 and
2000, respectively, and R169 million and R195 million in the six months ended September 30, 2002 and 2001, respectively, on
our employee restructuring program. We intend to continue to reduce our fixed-line headcount over the next five years. Our fixed-
line transformation program has benefited significantly from the management, marketing, technical and financial expertise of
our strategic equity investors. Our number of fixed lines per employee increased from 82 as of March 31, 1998 to 129 as of
September 30, 2002.
As part of our fixed-line transformation program we identified and outsourced a number of non-core activities. Since March 31,
2000, we have outsourced our motor vehicle fleet, security operations, electronic workshop, light engineering workshop, catering
services and buildings management operations. Through March 31, 2002, we received R804 million from our outsourcing program,
which we have utilized to further upgrade and expand our fixed-line network, invest in our core operations and reduce debt. We
recently announced our intention to dispose of our property portfolio through a sale and leaseback transaction. See "Management's
Discussion and Analysis of Financial Condition and Results of Operations Recent developments Property portfolio" on page 38
of this prospectus.
Current ownership
Immediately prior to this global offering, Telkom had three shareholders. The Government of the Republic of South Africa
owned 67% of Telkom's issued and outstanding ordinary shares, Thintana Communications owned 30% of Telkom's issued and
outstanding ordinary shares and Ucingo Investments owned 3% of Telkom's issued and outstanding ordinary shares.
Upon completion of this global offering, the Government will own approximately 42% of Telkom's issued and outstanding
ordinary share capital, or approximately 38% if the underwriters exercise their over-allotment option in full, Thintana
Communications will own approximately 30% of Telkom's issued and outstanding ordinary share capital and Ucingo Investments
will own approximately 3% of Telkom's issued and outstanding ordinary share capital.
Regulatory background
Between 1991, when Telkom was incorporated, and 1996, when the South African Telecommunications Act, 103 of 1996, was
enacted, we were the exclusive provider of public switched telecommunications services, including international voice services in
South Africa, acting pursuant to the now repealed South African Post Office Act, 44 of 1958. As a partially privatized network
operator, we continued to act as the exclusive public switched telecommunications service provider until May 7, 2002, when our
period of exclusivity expired. During that period and with the assistance of our two strategic equity investors, we prepared for
competition in the public switched telecommunications services sector. As part of the fixed-line telecommunications liberalization
program, ICASA issued an international carrier of carriers license and multimedia license to Sentech Limited in May 2002. In
addition, the South African Minister of Communications and ICASA have initiated a process to issue a license to a second national
operator, which will introduce competition for us in the public switched telecommunications services sector, and to issue additional
94
licenses to small business operators to provide telecommunications services in areas with a teledensity of less than 5%. This process
is not yet completed, but ICASA has indicated that it expects to issue these licenses in 2003 or early 2004. Further competition
may arise as a result of an assessment by the Minister of Communications of the feasibility of issuing additional licenses from
May 2005.
In the mobile communications market, Vodacom, our 50% owned joint venture, and MTN were issued licenses under the
Post Office Act, 44 of 1958, in 1993 to provide mobile cellular telecommunications services in South Africa. These licenses
continued in force under the Telecommunications Act, 103 of 1996, until they were confirmed and re-issued on August 19, 2002.
Until November 2001, Vodacom and MTN were the only two licensed mobile communications network operators in South Africa.
In November 2001, Cell C commenced operations as a third mobile communications network operator.
Our competitive strengths
We believe that we are well-positioned to strengthen our business, increase our profitability and cash flows and successfully
meet future competition based on the following:
We have the leading market position and are well placed to face competition in the South African fixed-line communications
market.
We believe our leading market position and our strong brand recognition will enable us to successfully meet competition in the
fixed-line communications market without significant future fixed-line roll-out and with reduced levels of investment in our fixed-
line segment. Key to achieving our objectives is our focus on rigorous cost management and efficiency improvements, reduced
levels of investment and the successful implementation of our business strategy.
Customer retention is one of our key focus areas and we have undertaken the following actions to ensure we retain
our customers:
-
refocused our sales and marketing force into more specialized divisions and entered into long term contracts with a number
of our larger corporate and business customers;
-
improved the efficiency and quality of our network and achieved high service quality targets; and
-
successfully rebalanced our fixed-line tariffs to be more closely aligned with the costs of providing services, thereby reducing
the need for future tariff adjustments and placing us in a strong competitive position.
We have a state-of-the-art, fully digital fixed-line network that provides service to every major urban area in South Africa.
We believe our extensive state-of-the-art fixed-line network places us in a strong position to compete with new providers of
communications services as it enables us to sell value-added voice and data services. Since 1997, we have:
-
largely completed our fixed-line network modernization and line roll-out program and, as of September 30, 2002, had 99.8%
of our telephone access lines connected to digital exchanges;
-
modernized and enhanced our fixed-line network's resiliency and performance through the deployment of synchronous
digital hierarchy managed self-healing optical fiber rings and by increasing our use of optical fiber;
-
deployed a national network operations center with the ability to proactively monitor our network and offer managed data
networking services to global and corporate customers; and
-
invested in the SAT-3/WASC/SAFE submarine cable system, which provides increased fiber optic transmission capability
between South Africa and international destinations.
We are an integrated communications service provider of bundled voice, data, video and internet services with the expertise to
expand our service offerings.
Our network and resources enable us to provide customers with a wide range of integrated communications services, including
voice services, data communications services, video services and internet services. We have undertaken the following actions to
strengthen our data communications service capabilities and improve our integrated communications service offerings:
-
successfully launched ISDN in 1995 and ADSL in August 2002 to business and residential customers;
-
developed extensive experience in designing and operating customized data communications and managed data networking
products and services, including managed local and wide area networks;
-
entered into business alliances with a number of leading communications equipment suppliers such as Siemens, Cisco
Systems, Hughes Network Systems and Sun Microsystems to provide fully integrated communications solutions over our
core fixed-line network; and
-
deployed an extensive voice-over-internet protocol, or VOIP, network and launched a voice over internet protocol regional
clearing house to serve as a hub for voice traffic on the African continent.
95
We have benefited, and expect to continue to benefit, from the financial, operational and managerial expertise of our two
strategic equity investors.
SBC Communications is a leading provider of communications services in the United States and has significant experience
operating in a highly deregulated and competitive communications markets. Telekom Malaysia is the leading communications
service provider in Malaysia with both fixed-line and mobile businesses. We benefit from the experience and knowledge of our
strategic equity investors through:
-
their participation on our operating committee and their employees who serve as our officers; and
-
the skills they transfer to our South African management team.
Vodacom is the leading South African mobile communications network operator with strong brand recognition, extensive
network coverage and distribution channels.
Vodacom is the largest mobile communications network operator in South Africa with a market share of approximately 59% as
of September 30, 2002 based on total reported customers. Vodacom has an extensive network that covers 95.1% of South Africa's
population based on the last official census conducted in 1996 and 64.6% of the total land surface area of South Africa as of
September 30, 2002. Vodacom has a broad distribution network consisting of Vodacom owned shops and sales forces and
independent dealers, franchises and national chains.
Vodacom is leveraging its successful experience in South Africa to selectively expand into other sub-Saharan African countries.
Vodacom is pursuing future growth through select expansion initiatives in other sub-Saharan African markets that are
complementary to its core business in South Africa. Investments outside of South Africa are evaluated and monitored against key
investment criteria, focusing primarily on countries with stable economic and political conditions and good prospects for growth,
market leadership and profitability. Other key factors include Vodacom's ability to gain majority ownership, develop strong local
partnership relationships and obtain non-recourse financing. Other African operations are branded under the "Vodacom" name.
Vodacom benefits from an experienced and long-serving management team complemented by its experienced local and
international shareholders, Vodafone, VenFin and us.
Vodacom has an experienced, long-serving management team with a record of innovation as the first mobile communications
network operator in the world to offer prepaid mobile communications services on an intelligent network platform and the first
South African mobile communications network operator to provide nationwide coverage in South Africa. Vodacom benefits from
the financial, operational and managerial expertise of its strategic shareholders, Vodafone, VenFin and us.
Our group strategy
Our group strategic goals are to increase shareholder value by increasing profitability and cash flows, while maintaining our
market leadership in the South African fixed-line and mobile communications markets. We also intend to support Vodacom's
strategy of establishing and maintaining leading positions in other sub-Saharan African mobile markets. In addition, we will seek to
increase the synergies between our fixed-line business and Vodacom. In order to achieve our goals, we intend to pursue the
following strategies:
Compete effectively in our core fixed-line markets and grow selected markets.
In order to successfully compete and grow revenue in our fixed-line services, we intend to encourage our customers to increase
their usage on our network through the following strategies:
-
Market new services to our existing customers. We intend to increase fixed-line revenue per customer by continuing to
develop and market innovative, value-added voice service packages to our residential fixed-line customers, aggressively
marketing our price advantages and entering into long-term contracts with corporate and business customers.
-
Promote increased network usage and revenue. We intend to stimulate network usage and revenue by increasing the
penetration of higher speed internet access through ISDN and ADSL.
-
Maximize traffic revenue. We intend to offer commercial interconnection and facilities leasing agreements to the second
national operator. In addition, we will seek to maximize the number of customers connected to our network through a
targeted deployment of our prepaid offerings where we have existing unutilized capacity.
-
Improve our customer service. We intend to continue to improve customer service and satisfaction through improved
distribution channels by relocating service branches and offering tailored packages and calling plan promotions.
96
Continue to reduce operating expenses and enhance capital investment efficiencies in our fixed-line business.
We will seek to increase operational and capital expenditure efficiencies to improve operating margins and increase cash flows in
our fixed-line business. We intend to continue to streamline and improve our business operations where advantageous through the
following strategies.
-
Continue to reduce headcount. We will continue to reduce headcount by encouraging voluntary retrenchments, natural
attrition and other employee optimization initiatives.
-
Continue to reduce operating expenses. We will seek to continue implementing a strict cost management policy and further
operating expense reduction initiatives.
-
Invest in operational support systems. We will continue to invest in operational support systems that permit integrated billing,
workforce management and fault handling to improve customer service and enhance operational efficiencies.
-
Implement a focused and disciplined capital investment program. We will continue to institute a disciplined business oriented
capital investment program to ensure capital investments are tied to demand and are only deployed where returns can be
achieved in excess of our cost of capital.
Expand our integrated service offerings through the increased sale of existing data products and the development of new data
and fixed-mobile products.
We have developed the following strategies to ensure that we are able to capitalize on the projected growth in the data and fixed-
mobile businesses and develop additional long-term corporate customer relationships:
-
Promote existing data products. We intend to increase corporate and business penetration of data transmission products by
increasing our focused selling and distribution efforts and leveraging our extensive corporate customer relationships and
strong sales force to increase sales of managed data networking services, internet access services, internet protocol based
communications services and related data center services, such as web hosting, server hosting, storage and security.
-
Develop new fixed-mobile products. We intend to develop new business and residential bundled fixed-mobile products,
together with our 50% owned Vodacom joint venture, in preparation for increased competition and the emergence of new
technologies.
Continue to invest in our fixed-line employees to foster a highly competitive corporate culture and to enhance skills retention.
We intend to continue to change our fixed-line corporate culture and increase productivity through the following strategies:
-
Implement training and skills retention programs. We intend to continue to leverage the experience of our strategic equity
investors to improve and transfer skills to our employees. In addition, we plan to improve retention of critical skills through
employee retention programs such as the implementation of appropriate employee share ownership and option plans.
-
Continue to develop long-term relationships with our trade unions. We intend to continue to develop long-term relationships
with our trade unions through the development of mutually beneficial guidelines for managing our employees.
-
Entrench a competitive culture. We will seek to foster a competitive culture through the continued roll-out of "The
Competitive Mindset" program, our company-wide program aimed at educating our employees to better respond to future
competition and creating an entrepreneurial culture.
Capitalize on the growing mobile communications market through Vodacom.
We intend to continue our participation in the South African mobile communications market through Vodacom and will support
its strategic objectives. Vodacom's strategic objectives are to achieve sustainable growth in profits and cash flow, while
maintaining its leading market position in South Africa and growing its operations in other select sub-Saharan African countries.
In order to achieve these objectives, Vodacom intends to pursue the following strategies:
-
Achieve sustainable growth in profits and cash flows. Vodacom will seek to sustain growth in profits and cash flows by
growing customer numbers, while carefully managing its existing customer base, capital expenditures and operating
expenses. Vodacom will focus on maintaining low churn rates and retaining high value customers through focused handset
upgrade policies, while continuously monitoring customer acquisition costs.
-
Expand data and fixed-mobile products. Vodacom intends to increase its revenue and profits by introducing a range of
offerings of value-added data and content services over its network, such as multimedia messaging services, information and
banking services, and location based services through alliances with content service providers, while remaining focused on
its core mobile business. Vodacom will seek to develop and market in cooperation with us, new business and residential
bundled fixed-mobile products. Vodacom launched its general packet radio services, or GPRS, network in October 2002.
-
Increase revenue from Vodacom's other African operations. Vodacom intends to increase revenue from its other African
operations, initially by growing its existing operations in sub-Saharan Africa, and by selectively acquiring additional mobile
licenses or operators in other sub-Saharan African markets in the future, focusing primarily on countries that have stable
economic and political conditions and good prospects for growth, market leadership and profitability. In its other African
operations, Vodacom seeks to gain majority ownership, develop strong local partnership relationships and obtain non-
recourse financing.
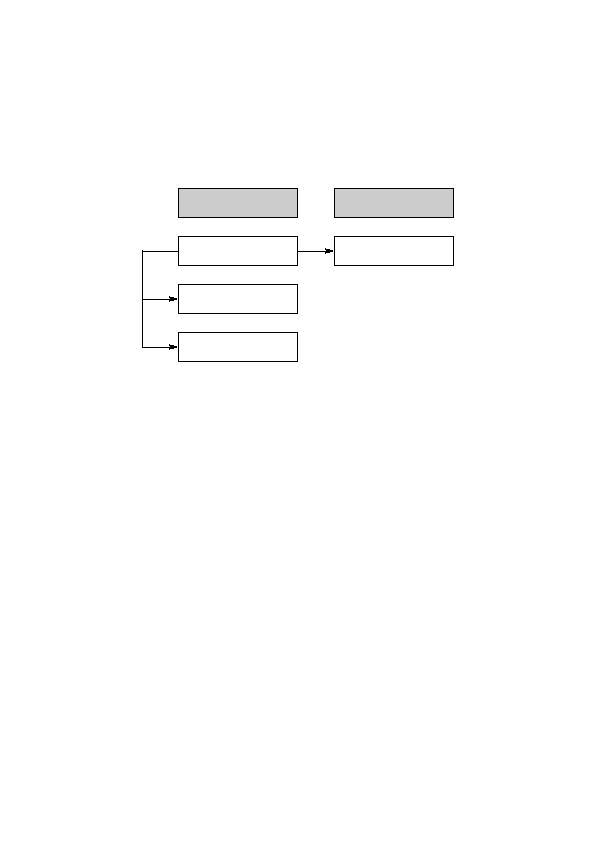
97
Group operational structure
Our business consists of two segments:
-
a fixed-line segment; and
-
a mobile segment.
Our fixed-line segment consists of our fixed-line business, which provides fixed-line access and data communications services
through Telkom; directory services through our 64.9% owned Telkom Directory Services subsidiary; and wireless data services
through our wholly-owned Swiftnet subsidiary. Our mobile segment consists of our 50% interest in Vodacom, our joint venture. Our
group operational structure is as follows:
Fixed-line communications
Overview
Our fixed-line segment is our largest business segment and includes our fixed-line telephone, data and directory services
business.
Our fixed-line services consist of:
-
fixed-line subscription and connection services to postpaid, prepaid and private payphone customers using PSTN, ISDN and
ADSL technologies, as well as the sale of value-added voice services and customer premises equipment;
-
fixed-line traffic services to postpaid, prepaid and payphone customers, including local, long distance, fixed-to-mobile and
international outgoing traffic services;
-
interconnection services, including terminating traffic from South African mobile operators and terminating and transiting
traffic from international operators;
-
fixed-line data services, including data transmission services, such as leased lines, packet-based services, managed data
networking services and internet access and related information technology services; and
-
directory services.
Products and services
Subscriptions and connections
We provide postpaid, prepaid and private payphone customers with digital and analog fixed-line access services, including
PSTN lines, ISDN lines, ADSL, which we launched in August 2002, and wireless access between a customer's premises and our
fixed-line network. Each PSTN line includes one access channel, each basic ISDN line includes two access channels and each
primary ISDN line includes 30 access channels. Each ISDN line transmits signals at speeds of 64 kilobits per second per channel.
ADSL allows the provision of high speed connections over existing copper wires using digital compression. ADSL transmits signals
at speeds of 512 kilobits per second downstream and 256 kilobits per second upstream. We expect growth in the provision of ISDN
lines will increase our revenue as subscription fees for ISDN lines are higher than those for PSTN lines.
We were the first fixed-line operator in the world to provide prepaid service on a fixed-line network. Our prepaid service offers
customers an alternative to the conventional postpaid fixed-line telephone service. All costs, including installation, telephone
equipment, line rental and call charges, are paid in advance so that there are no monthly phone bills. We target our prepaid service
mainly at first-time homephone customers who do not have a sufficient credit history and are located in areas where we can provide
access to our network without significant additional investment. Customers who have previously had their telephone service
disconnected due to non-payment are also encouraged to migrate to our prepaid service option in order to reduce future
nonpayments while satisfying demand for our services.
Fixed-line
Mobile
Telkom SA Limited
Telkom Directory Services
(Proprietary) Limited
Swiftnet (Proprietary)
Limited
Vodacom Group
(Proprietary) Limited
64.9%
100.0%
50.0%

98
We also offer subscriptions to value-added voice services. We offer a broad range of value-added voice services on a
subscription or usage basis, including call forwarding, call waiting, conference calling, voice-mail, freecall, sharecall, which permits
callers and recipients to share call costs, speed dialing, enhanced fax services and calling card services for payphones. These
services complement our basic voice services and provide us with additional revenue while satisfying customer demand, enhancing
our brand and increasing customer loyalty.
We provide payphone services throughout South Africa. As of September 30, 2002, we operated approximately 186,300 public
payphones and approximately 18,500 private payphones, of which approximately 43% were coin operated and the remainder were
card operated phones. We also have combination payphones. In July 2001, we launched a new community container payphone
program, that places payphones in secure central locations in underserviced and outlying areas. The payphone containers are
managed by the communities in which they are located in order to reduce theft and vandalism. As a result, we are able to provide
telephone service to underserviced areas.
The following table sets forth information regarding our postpaid and prepaid lines and payphones as of the dates indicated,
including our internal lines:
As of
As of
March 31,
September 30,
Six months
2001/2000
2002/2001
2002/2001
2000
2001
2002
% change
% change
2001
2002
% change
(thousands, except percentages)
Postpaid PSTN
1
. . . . . . . . . . .
4,668
3,930
3,554
(15.8)
(9.6)
3,761
3,407
(9.4)
Business . . . . . . . . . . . . . .
1,848
1,627
1,578
(12.0)
(3.0)
1,615
1,529
(5.3)
Residential . . . . . . . . . . . . .
2,820
2,303
1,976
(18.3)
(14.2)
2,146
1,878
(12.5)
Prepaid PSTN
1
. . . . . . . . . . .
381
480
708
26.0
47.5
615
780
26.8
ISDN channels . . . . . . . . . . .
271
374
467
38.0
24.9
421
522
24.0
Payphone
2
. . . . . . . . . . . . . .
173
178
195
2.9
9.6
189
186
(1.6)
Total access lines
3
. . . . . . . . . .
5,493
4,962
4,924
(9.7)
(0.8)
4,986
4,895
(1,8)
1
PSTN lines include copper cable, ADSL, digital enhanced cordless technology, or DECT and fiber.
2
Includes public and private payphones.
3
Total subscription access lines are comprised of PSTN lines, including ISDN channels, public and private payphones and internal lines in service.
Telkom had 162,460, 151,986 and 145,302 internal lines as of March 31, 2002, 2001 and 2000, respectively, and 136,459 and 157,942 internal
lines as of September 30, 2002 and 2001, respectively. Each PSTN line include one access channel, each basic ISDN line includes two access
channels and each primary ISDN line includes 30 access channels.
In accordance with the installation performance targets in our public switched telecommunications service license, we were
required to roll-out 2.7 million access lines and 120,000 payphones from May 1997 to May 2002. We substantially met all of our
line roll-out targets. We elected not to roll-out lines in our last year of exclusivity where it was not economical to do so. As a result,
we missed our fixed-line roll-out target by 16,448 lines. The number of our telephone access lines in service has grown at a
compounded annual rate of 3.0% over the five year period ended March 31, 2002.
During the years ended March 31, 2002 and 2001 and in the six month periods ended September 30, 2002 and 2001, respectively,
our total access lines were adversely impacted by a high level of disconnections resulting largely from the fixed lines we rolled out in
impoverished areas in accordance with the targets contained in our license and the consequent non-payment by a number of these
customers, as well as the continued migration of fixed-line customers to mobile services. We disconnected 1.1 million access lines in
2002 and 1.5 million access lines in 2001. The decrease in postpaid PSTN lines was partially offset by an increase in postpaid ISDN
lines, prepaid lines and payphone units.
We also offer telecommunications equipment sales, such as telephones and private branch exchange systems, or PABX systems,
related post-sales maintenance and service for residential and business customers in South Africa. The market in South Africa for
such equipment and systems, commonly known as customer premises equipment, is characterized by high competition and low
profit margins. We believe, however, that the supply and servicing of customer premises equipment is an essential element of
providing a full service to our customers.
Traffic
We offer local, long distance, fixed-to-mobile and international telephone services to business, residential and payphone customers
throughout South Africa at tariffs that vary depending on the destination, distance, the length and time of day of call. Local traffic
services are for calls made to destinations less than 50km from origination. Long distance traffic services are for calls made to
national destinations greater than 50km. We provide international outgoing telephone services, including both voice and data traffic.
All international traffic to and from South Africa was legally required to be routed through our network until May 7, 2002.

99
We provide direct international dialing access to over 230 destinations. The following table sets forth information regarding our
traffic for the periods indicated. We calculate fixed-line traffic by dividing traffic revenues for the particular category by the
weighted average tariff for such category during the relevant period.
Year ended
Six months ended
March 31,
September 30,
Six months
2001/2000
2002/2001
2002/2001
2000
2001
2002
% change
% change
2001
2002
% change
(millions of minutes, except percentages)
Local
1
. . . . . . . . . . . . . . . . .
19,471
20,388
20,252
4.7
(0.7)
10,246
9,870
(3.7)
Long distance . . . . . . . . . . . .
5,222
4,938
4,895
(5.4)
(0.9)
2,492
2,445
(1.9)
Fixed-to-mobile . . . . . . . . . . .
3,659
4,319
4,390
18.0
1.6
2,221
2,079
(6.4)
International outgoing . . . . . . . .
344
357
375
3.8
5.0
184
219
19.0
Total traffic . . . . . . . . . . . . .
28,696
30,002
29,912
4.6
(0.3)
15,143
14,613
(3.5)
1
Local traffic includes internet traffic.
Interconnection services
We provide interconnection services to the three mobile operators, Vodacom, MTN and Cell C, and other entities that lawfully
provide licensed telecommunications services in South Africa consisting of call termination and call transit, as well as access,
through our network, to other services, including FreeCall 080, ShareCall 0860 and HomeFree, emergency services and directory
enquiry services. We will also be required to provide interconnection services to the second national operator and to other licensees.
We also provide interconnection services to international operators in respect of incoming international calls and transiting
traffic through South Africa to other African countries. We are seeking to establish ourselves as the principal international
telecommunications hub for Africa through our investments in undersea cables and our network and our arrangements with other
fixed-line operators in Africa in order to continue to increase international transiting traffic revenue.
The following table sets forth information regarding interconnection traffic terminating on or transiting through our network for the
periods indicated. We calculate interconnection traffic, other than international outgoing mobile traffic and international interconnection
traffic, by dividing interconnection revenue for the particular category by the weighted average tariff for such category during the
relevant period. Fixed-line international outgoing mobile traffic and international interconnection traffic are based on the actual traffic
registered through the respective exchanges and reflected in international interconnection invoices.
Year ended
Six months ended
March 31,
September 30,
Six months
2001/2000
2002/2001
2002/2001
2000
2001
2002
% change
% change
2001
2002
% change
(millions of minutes, except percentages)
Domestic mobile interconnection traffic
1,931
2,051
2,008
6.2
(2.1)
975
1,034
6.1
International interconnection traffic .
500
862
1,053
72.4
22.2
502
498
(0.8)
Total . . . . . . . . . . . . . . . . .
2,431
2,913
3,061
19.8
5.1
1,477
1,532
3.7
Data communications services
We offer a wide range of national and international data communications services, including:
-
data transmission services, such as leased lines and packet-based services;
-
managed data networking services; and
-
internet access and related information technology services.
Data transmission services
Data transmission services provide the connection of information technology applications over wide area networks. These services
include leased lines and packet-based services. We have a growing portfolio of data transmission products tailored to different customer
needs from high bandwidth mission critical applications to low bandwidth applications. We also offer our customers tailor-made cost
effective customer specific solutions.

100
The following table sets forth information regarding our data transmission services, excluding mobile leased lines as of the dates
indicated converted into lines using a 64 kilobits per second equivalent:
As of
As of
March 31,
September 30,
Six months
2001/2000
2002/2001
2002/2001
2000
2001
2002
% change
% change
1
2001
2002
% change
(64 kilobits/s equivalent, except percentages)
Total data lines
248,919
315,597
398,311
26.8
26.2
n/a
355,533
n/a
1
We replaced our data billing and customer care systems in July 2002. Our new systems exclude non-revenue generating lines from the definition
of leased lines. As a result, leased lines as of September 30, 2002 are not comparable to prior periods.
Leased lines. We are presently the sole provider of national and international leased lines in South Africa. Leased lines are
fixed connections between locations, which are secure and exclusive to the user, and are mainly used for high volume data or
multimedia transmission. Leased lines are our principal data transmission service and include Diginet, Diginet Plus and Megaline
services. We also provide leased lines to broadcasters for audio and video services. Our leased line customers pay an initial
installation charge and a recurring fee based on the type, length and capacity of the leased line. In recent years, leased line charges
have increased slightly due to capital cost increases. However, we expect that competition will result in lower leased line prices in
the future.
The following table sets forth the bandwidth capacity of our Diginet, Diginet Plus, Megaline and broadcasting data transmission
services:
Leased line
Bandwidth
Diginet
9.6 Kbit/s to 64 Kbit/s
Diginet Plus
128 Kbit/s to 2 Mbit/s
Megaline
2 Mbit/s to 155 Mbit/s
Broadcasting
Audio
64 Kbit/s
Video
34 Mbit/s
Packet-based services. Packet-based services are based on a statistical multiplexing technique that allows customers to share
bandwidth more cost effectively based on a virtual private network concept. Our packet-based services include packet-switched
services, frame relay services, asynchronous transfer mode based services and internet protocol based services.
Our packet-switched service is Saponet-P, which allows data communications for a range of applications, such as database
searches, electronic funds transfers and e-mail. We use the X.25 protocol, which is a worldwide standard for transmitting data using
packet-switched networks. Packet-switched services are based on a mature technology and account for a significant but declining
amount of our data transmission service revenue. Although traffic has grown in recent years, we expect that customers currently
using packet-switched services will increasingly migrate to frame relay based services and, in the future, asynchronous transfer
mode based services and internet protocol services.
Our frame relay service is a high speed open protocol that is more efficient than X.25 packet-switching and is well suited for
data intensive applications, such as connecting local area networks. Instead of leasing high capacity lines in order to accommodate
occasional or intermittent high data volumes, customers using frame relay pay for capacity sufficient to satisfy their average
requirements. Frame relay based services account for a growing percentage of our data transmission service revenue. This is due
primarily to the significant increase in the amount of internet and corporate local access network traffic carried on our frame relay
networks and the growing number of applications that require the speed and flexibility of more advanced technologies.
Our asynchronous transfer mode based services include ATM Express, which we launched in 2002. ATM Express provides
digital transmission services for wide area networks at speeds from 2 megabits per second up to 155 megabits per second. ATM
Express provides a medium for companies to transmit high volumes of virtually error-free information at high speeds over their
wide area network with high quality and reliable connections. Voice, video and data applications can be supported simultaneously
over a connection. Megaline Plus is a broadband service providing for the carrying of voice and video at a constant bit rate across
our asynchronous transfer mode network. ATM Express and Megaline Plus serve as an integral component of our integrated virtual
private network service offering that allows for the convergence of voice, data, video, e-commerce and web services across a single
access medium over our network. We expect our asynchronous transfer mode based service revenue to grow as a result of
customers' growing demand for bandwidth, flexibility and reliability.
Our primary internet protocol data transmission products include VIPLink, an internet protocol wide-area-network, and VIPDial,
a telecommuting product. We have invested in an internet protocol and voice-over internet protocol network and launched a regional
clearinghouse to serve as a hub for voice traffic on the African continent. We intend to launch additional internet protocol data
transmission products in the future.
101
Managed data networking services
Our managed data networking services combine our data transmission services discussed above with active network
management provided by us. We offer a wide range of integrated and customized networking services, including planning,
installation, management and maintenance of corporate-wide data, voice and video communications networks, as well as
other value-added services, such as capacity, configuration and software version management on customers' networks. To market
our service commitment, we offer guaranteed service level agreements on a wide range of our products, which guarantee
availability, or uptime, of the network, through the use of our national network operations center.
Our managed data networking services include our customer network care service, which facilitates the network management of
all our data transmission services using the leased lines or packet-based services discussed above, and our Spacestream and IVSat
products, which are satellite based products. Spacestream is our high quality, flexible satellite networking service that supports data,
voice, fax, video and multimedia applications. IVSat connects computers, systems and users internationally and enables the transfer
of large volumes of data and information between locations anywhere in Africa.
Managed data networking services are billed on a monthly basis and vary by customer depending on the particular services
provided and the number of network sites under management. The following table sets forth information regarding the number of
managed network sites for each of our managed data networking services as of the dates indicated:
As of
As of
March 31,
September 30,
Six months
2001/2000
2002/2001
2002/2001
2000
2001
2002
% change
% change
2001
2002
% change
(number of sites, except percentages)
Terrestrial based . . . . . . . . . . .
789
1,329
2,139
68.4
60.9
1,442
2,676
85.6
Satellite-based . . . . . . . . . . . .
2,349
3,305
3,545
40.7
7.3
3,671
3,960
7.9
Total managed network sites . . . .
3,138
4,634
5,684
47.7
22.7
5,113
6,636
29.8
Internet access services and other related information technology services
Internet access services. We are one of the leading internet access providers in South Africa in the wholesale internet access
provision market and are focused on growing our position in the retail internet access market. We are also packaging our
TelkomInternet product with ADSL and ISDN services.
Our South African internet exchange, or SAIX, is South Africa's largest internet access provider offering dedicated and dial-up
internet connectivity and private label internet service provider services to corporate customers and internet service provider
companies. These services include e-mail, web page hosting, administration, technical support, virus protection and domain name
registration. SAIX has offered fixed-line network internet access through dial-up service since 1997. SAIX derives revenue for its
access services primarily from fees paid by customers for its dial-up services.
We launched TelkomInternet in January 2000. TelkomInternet provides dial-up internet access service for residential and small
businesses.
TelkomInternet derives revenue primarily from fees paid by customers for its dial-up services.
The following table sets forth information regarding our wholesale and retail internet services and customers as of the dates
indicated.
As of
As of
March 31,
September 30,
Six months
2001/2000
2002/2001
2002/2001
2000
2001
2002
% change
% change
2001
2002
% change
Wholesale
Internet leased lines . . . . . . . . .
n/a
643
778 -
21.0
671
930
38.6
Internet leased lines equivalent
64kb/s . . . . . . . . . . . . . . . .
n/a
2,105
2,876 -
36.6
2,482
3,656
47.3
Dial-up ports . . . . . . . . . . . .
3,124
6,476
8,557
107.3
32.1
7,852
10,043
27.9
Retail
Internet customers . . . . . . . . . .
23,205
37,122
48,995
60.0
32.0
42,866
75,317
75.7
Our wholesale internet services are billed on a bandwidth basis while our retail internet services are billed on a monthly
subscription basis. We also generate fixed-line traffic revenue from internet traffic routed over our fixed-line network.

102
Information technology and related services. We have recently expanded our data offering to selected information technology
services, including local area network services, data center hosting services, managed infrastructure hosting, web application
hosting, security services, disaster recovery and storage services and application service provider hosting. Our local area network
services include structured cabling, local area network management services, local area network equipment supply and shared local
area network applications. Our security services include firewalls, intrusion detection, certificate authority and virus protection.
We also offer e-commerce products and services, including electronic data interchange, hosted procurement market place,
payment gateways, electronic storefronts, electronic bill presentment and electronic protocol translation services. CyberTrade, our
web-based e-commerce service provider, provides users with a secure platform to perform online banking and stock market trading,
to buy and sell goods and products from electronic merchants and to access critical information.
Directory and other services
Directory services. We own 64.9% of Telkom Directory Services, the largest directory publisher in South Africa providing white
and yellow pages directory services and electronic white pages. Telkom Directory Services has begun providing electronic yellow
pages and value-added content through full color advertisements. Telkom Directory Services is working towards improving the
accessibility and distribution of the directories through door-to-door delivery and electronic media. We also provide national
telephone inquiries and directory services.
Wireless data application services. We own 100% of Swiftnet, which operates under the name Fastnet Wireless Service. Fastnet
is a wireless network providing asynchronous wireless access on our X.25 network, Saponet-P, to its customer base. Services
include retail credit card and check point-of-sale terminal verification, telemetry, security and vehicle tracking.
Fees and tariffs
Tariff rebalancing
We have made significant progress over the past five years in rebalancing tariffs in our fixed-line segment in order to reduce the
need for future tariff adjustments in the face of competition. Our tariff rebalancing program has resulted in a decrease in the ratio of
tariffs for long distance calls to all destinations over 200 km compared to tariffs for local calls from 13.2:1 as of March 31, 1997
to 2.7:1 as of March 31, 2002. The weighted average effective price per minute to all international destinations decreased
approximately 44% from January 1, 1998 to March 31, 2002. The following table shows our long distance to local call ratio for the
periods indicated.
As of March 31,
1997
1998
1999
2000
2001
2002
Long distance to local call ratio
13.2
9.2
7.7
6.9
5.8
2.7
The Telecommunications Act, 103 of 1996, and regulations made under the Act impose a price cap formula on a basket of
specified services that we previously had the exclusive right to provide, including installations; prepaid and postpaid line rental;
local, long distance and international calls; fixed-to-mobile calls; public payphone calls; ISDN services; our Diginet product; and
our Megaline product. More than 80% of Telkom's operating revenue is included in this basket. Prices on these services are filed
with ICASA for approval. Revenue from these services may not be used to subsidize other products and services. Currently, the
overall tariffs for all services in the basket may not be increased by more than 1.5% below inflation in South Africa, based on the
consumer price index and measured using revenue for the services in the basket at constant volumes for the prior year. In addition,
prior to January 1, 2003, the price of any individual product or service included in the basket could not be increased by more than
20% above inflation in South Africa in any year. Effective January 1, 2003, the price of any individual product or service included
in the basket may not be increased by more than 5% above inflation in South Africa in any year. In December 2002, ICASA
approved our tariff filing providing for a 9.5% increase in the overall tariffs for all services in the basket effective January 1, 2003,
based on the increase in the consumer price index for September 2002 of 12.5%. Inflation in South Africa was 5.7% in the year
ended December 31, 2001 and 5.4% in the year ended December 31, 2000. See "Risk Factors Risks Related to Regulatory and
Legal Matters Our tariffs are subject to approval by the regulatory authorities, which may limit our flexibility in pricing and could
reduce our net profit" on page 19 and "Regulation and License Requirements" beginning on page 123 of this prospectus.
Subscription and connection tariffs
We offer a number of products and programs that provide customers with volume and term benefits in order to attract customers,
such as our R7 call plan, which allows customers to make calls of unlimited duration anywhere in South Africa for R7.00 per call,
including VAT, during weeknights and weekends. We also provide reduced installation charges to most packaged services and
provide discounts to other customer specific solutions. In order to attract high-volume corporate and business customers we offer
PrimeNet, which provides volume discounts for intracompany traffic between different company premises, and rate stability
programs on certain data products that fix rates at the lower of the prevailing rates or the rate at the time of the contract.

103
The following tables show our subscriptions and connections tariffs as of March 31, 2002 and September 30, 2002 and our new
subscriptions and connections tariffs effective January 1, 2003.
As of March 31, 2002 and September 30, 2002
PSTN Postpaid
PSTN Prepaid
ISDN basic
ISDN primary
(ZAR, including value-added tax)
Business
Installation . . . . . . . . . . . . . . . . . . . . . .
239.00
n/a
377.19
20,314.80
Monthly rental . . . . . . . . . . . . . . . . . . . .
89.97
n/a
186.77
2,698.92
Residential
Installation . . . . . . . . . . . . . . . . . . . . . .
239.00
138.00
377.19
n/a
Monthly rental . . . . . . . . . . . . . . . . . . . .
67.72
41.98
158.75
n/a
As of January 1, 2003
PSTN Postpaid
PSTN Prepaid
ISDN basic
ISDN primary
(ZAR, including value-added tax)
Business
Installation . . . . . . . . . . . . . . . . . . . . . .
268.98
n/a
377.19
20,314.80
Monthly rental . . . . . . . . . . . . . . . . . . . .
101.23
n/a
201.78
3,036.96
Residential
Installation . . . . . . . . . . . . . . . . . . . . . .
268.98
155.27
377.19
n/a
Monthly rental . . . . . . . . . . . . . . . . . . . .
76.20
47.23
171.50
n/a
Traffic tariffs
Local, long distance and fixed-to-mobile
When setting local and long distance call pricing, a number of variables are considered in order to generate an optimal level of
revenue and to balance demand and affordability within our price cap limitations. These include the duration of the call, the
distance between the points of origin and destination, and the time of day as well as the day of the week the call is made.
For calls from our fixed-line customers to mobile users, we bill our customer the standard retail tariff, retain a fixed portion of
the retail tariff and pay the remainder of the tariff to the mobile operator.
The following table sets forth our postpaid and prepaid traffic tariffs as of March 31, 2002 and September 30, 2002 and our new
postpaid and prepaid traffic tariffs effective January 1, 2003:
As of March 31, 2002
and September 30, 2002
As of January 1, 2003
Off
Off
Peak rates
1
peak rates
2
Peak rates
1
peak rates
2
(ZAR, including value-added tax)
Postpaid services (residential and business)
Local minimum call charge (050km) for first unit
3
. . . . . . .
0.49
0.49
0.55
0.55
Local call rate per minute (050km) after first unit
3
. . . . . . .
0.33
0.12
0.37
0.14
Long distance minimum call charge (>50km) for first unit
4
. . .
0.88
0.88
0.99
0.99
Long distance call rate per minute (>50km) after first unit
4
. . .
0.88
0.44
0.99
0.50
Fixed-to-mobile call rate per minute (Vodacom and MTN) . . .
1.78
1.06
1.88
1.11
Fixed-to-mobile call rate per minute (Cell C) . . . . . . . . . .
1.62
1.06
1.88
1.11
Prepaid services (residential only)
Local minimum call charge (050km) for first unit
5
. . . . . . .
0.49
0.49
0.55
0.55
Local call rate per minute (050km) after first unit
5
. . . . . . .
0.38
0.14
0.42
0.16
Long distance minimum call charge (>50km) for first unit
6
. . .
0.88
0.88
0.99
0.99
Long distance call rate per minute (>50km) after first unit
6
. . .
1.04
0.52
1.17
0.59
Fixed-to-mobile call rate per minute (Vodacom and MTN) . . .
1.78
1.06
1.88
1.11
Fixed-to-mobile call rate per minute (Cell C) . . . . . . . . . .
1.62
1.06
1.88
1.11
1
Monday to Friday 7 a.m. to 7 p.m. for local and long distance calls, excluding public holidays in South Africa. Monday to Friday 7 a.m. to 8 p.m.
for fixed-to- mobile calls, excluding public holidays in South Africa.
2
Monday to Friday 7 p.m. to 7 a.m. and Friday 7 p.m. to Monday 7 a.m. and on public holidays in South Africa for local and long distance calls.
Monday to Friday 8 p.m. to 7 a.m. and Friday 8 p.m. to Monday 7 a.m. and on public holidays in South Africa for fixed-to-mobile calls.
3
The first unit for peak calls is 89 seconds and for off peak calls is 238 seconds.
4
The first unit for peak calls is 60 seconds and for off peak calls is 120 seconds.
5
The first unit for peak calls is 78 seconds and for off peak calls is 207 seconds.
6
The first unit for peak calls is 51 seconds and for off peak calls is 101 seconds.

104
International outgoing
Our outgoing international call tariffs and payments are based on settlement rates negotiated with other international carriers on
a bilateral basis. The following table sets forth our international outgoing traffic tariffs per minute as of March 31, 2002 and
September 30, 2002 and our new international outgoing traffic tariffs per minute effective January 1, 2003 for residential and
business customers to the ten most frequently called countries.
As of March 31, 2002
and September 30, 2002
As of January 1, 2003
Off
Off
Peak rates
1
peak rates
2
Peak rates
1
peak rates
2
(ZAR, including value-added tax)
United Kingdom . . . . . . . . . . . . . . . . . . . . . . . . .
3.41
3.07
3.35
3.01
Zimbabwe . . . . . . . . . . . . . . . . . . . . . . . . . . . .
1.58
1.24
1.58
1.24
United States . . . . . . . . . . . . . . . . . . . . . . . . . . .
3.64
3.29
3.57
3.24
Namibia . . . . . . . . . . . . . . . . . . . . . . . . . . . . . .
1.58
1.24
1.58
1.24
Botswana . . . . . . . . . . . . . . . . . . . . . . . . . . . . .
1.58
1.24
1.58
1.24
Mozambique . . . . . . . . . . . . . . . . . . . . . . . . . . .
2.72
2.38
2.72
2.38
Germany . . . . . . . . . . . . . . . . . . . . . . . . . . . . .
2.84
2.61
2.79
2.56
Swaziland . . . . . . . . . . . . . . . . . . . . . . . . . . . . .
1.58
1.24
1.58
1.24
Australia . . . . . . . . . . . . . . . . . . . . . . . . . . . . .
3.28
2.95
3.22
2.90
Lesotho . . . . . . . . . . . . . . . . . . . . . . . . . . . . . .
1.58
1.24
1.58
1.24
1
Monday to Friday 8 a.m. to 8 p.m., excluding public holidays in South Africa.
2
Monday to Friday 8 p.m. to 8 a.m. and Friday 8 p.m. to Monday 8 a.m. and on public holidays in South Africa.
Interconnection tariffs
Interconnection termination rates for mobile operators are distance-independent, and are based on aggregated measurements of
traffic crossing the points of interconnection measured on a per-second basis. For national calls from mobile users to fixed-line
customers, the mobile operator pays us a termination fee. The risk of uncollectibles is carried by the originating operator.
For incoming international calls destined for mobile users, we pay the mobile operator a termination rate which is the same as the
rate we pay for fixed-to-mobile calls, and for outgoing international calls originating from mobile users, the mobile operators pay to
us our standard retail rate for international calls, less a discount.
Our current interconnection tariffs are set out in interconnection agreements negotiated and agreed by us and the other operators.
ICASA is entitled to issue, and has issued, regulations relating to interconnection between South African licensed operators.
The following table sets forth our fixed-to-mobile interconnection tariffs, including our termination rates paid to mobile operators
and our retention rates, and our mobile-to-fixed interconnection tariffs as of March 31, 2002 and September 30, 2002 and our new
fixed-line interconnection tariffs effective January 1, 2003.
As of March 31, 2002
and September 30, 2002
As of January 1, 2003
Peak rates
1
Off peak rates
2
Peak rates
1
Off peak rates
2
(ZAR, including value-added tax)
Fixed-to-mobile (Vodacom and MTN) . . . . . .
1.78
1.06
1.88
1.11
Termination rate paid to mobile operators . . . .
1.40
0.83
1.46
0.86
Retention rate . . . . . . . . . . . . . . . . . . .
0.38
0.23
0.42
0.25
Fixed-to-mobile (Cell C) . . . . . . . . . . . . . .
1.62
1.06
1.88
1.11
Termination rate paid to mobile operator . . . . .
1.24
0.83
1.46
0.86
Retention rate . . . . . . . . . . . . . . . . . . .
0.38
0.23
0.42
0.25
Mobile-to-fixed (Vodacom, MTN and Cell C)
Termination rate paid to Telkom . . . . . . . . .
0.24
0.11
0.27
0.14
1
Monday to Friday 7 a.m. to 8 p.m., including public holidays in South Africa.
2
Monday to Friday 8 p.m. to 7 a.m. and Friday 8 p.m. to Monday 7 a.m., including public holidays in South Africa.
105
Data tariffs
We charge monthly fees for leased lines, which vary based on bandwidth and distance. The following table sets forth the tariffs
for our data leased lines using 20 km distances as of the dates indicated and our new tariffs for our data leased lines using
20 km distances effective as of January 1, 2003.
As of March 31,
As of September 30,
As of January 1,
2000
2001
2002
2002
2003
(ZAR, including value-added tax)
Diginet
1,652
1,830
1,919
1,919
2,066
Diginet Plus
6,158
6,384
5,943
5,943
6,286
Megalines
2 Mbit/s
15,831
16,781
15,333
15,333
16,188
34 Mbit/s
133,472
143,281
129,675
129,675
136,800
140 Mbit/s
449,776
482,710
437,304
437,304
461,244
Managed data networking services are billed on a monthly basis and vary by customer depending on the particular services
provided and the number of network sites under management.
Sales and marketing
We group our fixed-line customer base into the following three categories in order to more effectively target and service our
customer:
business customers;
residential customers; and
payphone customers.
Business customers
Business customers are comprised of global and corporate customers, business customers, Government customers and wholesale
customers. We have separate sales and marketing departments geared to each of the sub-categories within our business customer
category. Our business customer category accounted for approximately 71% of our total fixed-line revenue, excluding directories
and other revenue, in the six months ended September 30, 2002 and approximately 41% of our total fixed access lines as of
September 30, 2002.
Global and corporate
Global and corporate customers comprise 225 of South Africa's largest financial, retail, manufacturing and mining companies
with domestic and international operations. We have increased our sales and marketing efforts aimed at our large global and
corporate customers in order to continue to improve customer loyalty. We offer tailored packaged solutions and seek to enter into
long-term relationships with our global and corporate customers in order to maintain our leadership position in this customer
market. We market and sell our products and services to these customers primarily through corporate account managers and our
corporate customer call center in Cape Town.
Business and government
Business and Government customers comprise approximately 550,000 large, medium and small business and governmental
accounts. Government customers accounted for approximately 9% of our total fixed-line operating revenue, excluding directories
and other revenue, in the six months ended September 30, 2002. We separately target the top 500 customers within this category.
We also offer tailored packaged solutions and seek to enter into long-term relationships with our medium and small business
customers in this category. In addition, we established a customer relation unit to focus on retaining business customers. We market
and sell our products and services to these customers primarily through customer account managers and representatives, the Telkom
Business Call Center and customer service branches. As of September 30, 2002, we had over 150 customer service branches located
throughout South Africa to assist our business customers in finding the products and end-user equipment that best fits their needs.
Wholesale
Wholesale customers comprise mobile operators, domestic licensed network operators, international operators and value-added
network service providers. Products sold to wholesale customers primarily include mobile voice termination services, international
voice termination services, leased line data services and international transiting services. We also provide internet protocol services
to other internet service providers. We are currently focusing on developing wholesale products that cater to the needs of a more
106
liberalized fixed-line market in South Africa. Our marketing and sales strategy for the wholesale services market is to be the carrier
of choice for other operators. We have invested a substantial amount into our state-of-the-art network both in South Africa and in
our international undersea cables. We intend to compete in this market by offering destination specific wholesale based prices
targeted to this customer market. We intend to focus on expanding our relationships with international operators and further
increasing the penetration of our transiting services to international operators, including other African operators, for traffic into and
out of Africa.
Residential customers
Residential customers comprise both prepaid and postpaid residential customers using PSTN, ISDN and ADSL services.
Residential customers accounted for approximately 25% of our total fixed-line revenue, excluding directories and other revenue, in
the six months ended September 30, 2002 and approximately 55% of our total fixed access lines as of September 30, 2002. Prepaid
residential customers accounted for approximately 29% of our residential customers as of September 30, 2002.
We are seeking to compete in the residential market by offering communications packages focused on improving convenience
and security to enhance consumers' lifestyles, while at the same time increasing revenue per customer. We intend to continue to
introduce calling plans that target high use customers and are designed to increase consumers' value for money. We market and sell
our residential products through our customer call center, customer service branches, mobile vans, Vodacom's mobile customer
service branches, kiosks, the South African Post Office, independent distributors and vendors and through telemarketing. We are
focused on increasing the penetration of our ISDN and ADSL services to retail customers through targeted direct advertising to
high internet usage subscribers.
Payphone customers
Payphones comprise our public and private payphone units. Payphones accounted for approximately 4% of our total fixed-line
revenue, excluding directories and other revenue, as of September 30, 2002.
In order to increase sales in our payphone services business, we seek to provide easy access to our services through the effective
placement of our phones and phonecard outlets in high traffic areas. Our key focus area is the premier market, which includes
garages, prisons and malls. In furtherance of this goal, we target and enter into nationwide contracts with multi-location telephone
providers to ensure wider distribution of our payphones. We market and sell our payphone products through our sales managers and
representatives and sales call centers.
Customer care and service
Customer care is one of our top priorities. We offer a number of customer care initiatives tailored to our different customer
segments. We allocate service managers to each of our global and corporate customers, who are responsible for ensuring that all
new installations and repairs are performed in a satisfactory and timely manner. In addition, we have established a corporate
customer call center in Cape Town for our global and corporate customers, capable of making minor infrastructure changes from a
single location. We also offer service level agreements on a number of our existing data communications products where technology
allows us to do so and our goal is to introduce service level agreements on all new data communications products in the future. We
confer VIP status on each of our global and corporate customers and other selected customers that allows them direct access to key
people within our organization to ensure quick resolution of any problems they may have regarding our products and services.
We initiated an ambassador program in 2000 for our medium and small business customers. Under this program, participating
managers each adopt a few business customers and act as a single point of contact for those customers in the event of any problems
with our products and services. In addition, our Telkom Business Center provides customer support for our medium and small
business customers. We also offer service level agreements for our data communications products to our medium and small business
customers.
We offer a broad range of internet-based customer-care tools. We operate, for example, an email service center where our
customers can contact and receive responses from our customer service representatives by email. We also provide a website with
answers to frequently asked questions, service bulletin boards and tools to change passwords and other personal data on-line.
Network quality
The improvements in customer service that we have made have been facilitated by our investments in our network operations
center and our new data center. These investments have increased our ability to identify and anticipate future customer needs more
rapidly and to provide the appropriate solutions and services.
We have six installation and fault management centers to address faults, installation and service appointment scheduling.

107
The following table sets forth information regarding improvements in our installation and repair times and service quality during
the periods indicated.
As of
Year ended March 31,
September 30,
2000
2001
2002
2002
Installation
Mean time to install residential voice (days) . . . . . . .
21
18
8
7
Mean time to install business voice (days) . . . . . . . .
12
11
5
3
Mean time to install corporate voice (days) . . . . . . .
6
5
3
1
Mean time to install ISDN (days) . . . . . . . . . . . .
88
59
31
20
Mean time to install 2Mb data (days) . . . . . . . . . .
84
53
35
27
Mean time to install subrates data (days) . . . . . . . .
50
28
23
21
Repair
Mean time to repair business voice (hours) . . . . . . .
26
23
16
11
Mean time to repair corporate voice (hours) . . . . . . .
16
15
14
7
Mean time to repair 2Mb leased lines (hours) . . . . . .
4
3
3
3
Mean time to repair subrate leased lines (hours) . . . . .
8
6
6
4
Service measures
Number of residential faults per 1,000 lines . . . . . . .
522
518
528
420
Number of business faults per 1,000 lines . . . . . . . .
332
279
265
223
Number of faults per 1,000 subrates . . . . . . . . . . .
1,094
1,053
919
841
Number of faults per 1,000 2Mb . . . . . . . . . . . . .
1,036
718
925
750
Percentage of coin payphones available (percentage) . .
91
94
95
n/a
Percentage of card payphones available (percentage) . .
97
98
98
n/a
Overall, we have significantly improved installation and repair times and service quality, however, our fault rates have been
adversely affected by theft and vandalism. We have introduced a number of efforts to curb theft and vandalism, including the
introduction of alarms, security patrols and other technologies.
Severe weather conditions in the year ended March 31, 2000 also negatively impacted fault rates for business and residential
customers.
Infrastructure and technology
In 1997, we embarked on an extensive five year capital investment program in our fixed-line business. Our total fixed-line
investment for the five years ended March 31, 2002 was R41.7 billion, of which R27.9 billion was for network modernization and
line roll-out in order to comply with our license obligations and prepare for competition.
As of September 30, 2002, we had 4.9 million lines connected to our network. As a result of the line roll-out targets contained in
our license, disconnections due to customer non-payments and customer migration to mobile services, we have excess capacity on
our fixed-line network. We plan to use this capacity where possible to expand our prepaid services. Our strategy is to increase the
number of access lines on our network by selectively expanding our network in economically viable areas where projected revenue
exceeds the cost of construction.
The following table sets forth information related to the digitalization and upgrade of our network at the dates indicated.
As of
As of March 31,
September 30,
1998
1999
2000
2001
2002
2001
2002
Digitalization (percentage of lines) . .
82.0
92.5
99.0
99.6
99.8
99.8
99.8
ATM switches . . . . . . . . . . . . .
-
45
116
129
195
163
194
Digital exchange units . . . . . . . .
3,019
3,512
3,697
3,894
4,083
4,059
4,103
108
National network operations center
In 2000, we opened a state-of-the-art national network operations center, capable of monitoring our core network and
coordinating and dispatching core network repair personnel from one control point based at Techno Park in Centurion, Pretoria. Our
national network operations center enables us to be more proactive in anticipating, localizing and isolating problems, such as
congestion and cable breaks, so that they can be corrected promptly. It has a 120-meter wide video wall providing an
up-to-the-minute, real-time visual summary of the status of our entire network. Our national network operations center includes an
emergency restoration and control center that manages all network failure restorations. Network service management specialists are
able to obtain up to the minute information from this center in order to proactively update global and corporate customers who have
services affected by any major network failure, including voice and data network services.
Switching network
An important part of our fixed-line network modernization program has been switch digitalization. As of September 30, 2002,
99.8% of our telephone access lines were connected to digital exchanges. Switch digitalization has made our network more efficient
and has enabled us to offer value-added voice and data services including caller line identification, electronic call answering and
innovative billing systems. We have converted our switching network infrastructure from a four-tier architecture which historically
was based on analog switching technology to a two-tier structure based on large capacity digital switches. The upper, or primary,
tier is used for the transmission of long distance and international traffic and the lower, or secondary, tier is used for the
transmission of local traffic.
The primary tier consists of eight switching centers and two international switching centers. Each of the switching centers
includes two switches for redundancy purposes and in order to handle larger volumes during peak times. Each of the primary
switching centers are interconnected by at least two self-healing diverse routes. Interconnection between our network and the
networks of the three South African mobile operators takes place at primary-level switches in the main centers. Two international
telephone switching centers serve as the international gateways. Secondary switching centers are connected to the primary
switching centers by at least two self-healing diverse routes. Each secondary switching center includes one switch with internal
redundancy mechanisms.
Transmission network
A priority of our investment program has been to make our fixed-line network more resilient. We have enhanced our fixed-line
network's resiliency through the deployment of synchronous digital hierarchy managed self-healing optical fiber rings. As a result
of our efforts, the overall number of fault reports per 1,000 lines has decreased 16.0% in the past three years from 1,094 as of
March 31, 2000 to 919 as of March 31, 2002. The number of fault reports per 1,000 business lines has decreased 20.2% in the past
three years from 332 in the year ended March 31, 2000 to 265 in the year ended March 31, 2002.
Our national transmission network comprises a synchronous digital hierarchical network. Both the primary and the secondary
tier consist of interlocking self-healing rings, which provide a dual path to each connection point. The primary tier consists of eight
rings, while the secondary tier consists of 420 rings. The synchronous digital hierarchy network, with its network management
capability, provides for faster provision and modification of service, improved grade of service and lower maintenance costs.
Access network
The majority of private branch exchanges are connected via regular copper or special screened copper cable. Fiber in the loop
has been deployed in the form of optical fiber distributed concentrators and digital line concentrators.
Asynchronous transfer mode network
We have rolled out an asynchronous transfer mode network to deliver broadband services to global and corporate customers.
We plan on migrating all of our data networks onto our asynchronous transfer mode network. As of September 30, 2002,
179 corporate customers have been connected to our asynchronous transfer mode network. The present available bandwidth
between the core switches on our asynchronous transfer mode network is 49 STM-1s or 7.3 Gbit/s, while the available bandwidth
between the core switches and the services access switches is 207 STM-1s or 30.8 Gbit/s. Access to our asynchronous transfer
mode network is primarily provided via copper wire.
Public broadband internet protocol network
Our public broadband internet protocol network comprises a three tier hierarchical network consisting of eight core sites,
17 edge sites and 57 access locations, including over 18,500 modems with an estimated dial up base of greater than 320,000
customers. Our internet protocol network is powered by Cisco equipment.
We have recently introduced ADSL as a new access technology for our internet protocol network. ADSL rollout has been
planned to provide a footprint covering fifty percent of existing PSTN customers by April 2003. This network is managed from our
national network operating center.
109
Voice over internet protocol network
Our voice over internet protocol network terminates calls of international voice carriers into our fixed-line network. The network
can terminate more than sixty media gateways, or 21,000 voice circuits, and is presently transit switching voice over internet
protocol calls to four African countries. The media gateways compress the traditional voice channels of 64 kbit/s in to 8 kbit/s
channels thus enabling us to reduce the cost of international calls.
International connectivity
We offer international connectivity from two international switching centers to terrestrial, satellite and submarine cable routes.
The satellite earth station is situated at Hartebeeshoek, west of Pretoria. Further international connectivity has been provided with
the deployment of very small aperture terminals and other satellite transmitters located at global and corporate customers' premises
throughout the country.
A submarine cable system, SAT-2, exists between Cape Town and Europe. We are the largest capacity owner on the SAT-2
submarine cable system with the right to use approximately 65% of the combined capacity. Consistent with our strategy of
increasing international carrier traffic on our network, we have invested approximately $85 million in the SAFE submarine cable
system and the SAT-3/WASC submarine cable system. The cable systems provide fiber optic connectivity between South Africa and
international destinations. These cable systems utilize the latest technology available in order to provide improved high-speed voice,
data, video and other on-demand high-bandwidth services and have increased fiber optic bandwidth between Europe and Africa
significantly. We have the right to approximately 20% of the combined capacity on the SAT-3/WASC and SAFE submarine cable
systems, making us the largest capacity owner in these cable systems out of the 36 telecommunications operators who have invested
over $650 million in these cables. We believe we are uniquely positioned to exploit the synergies between our extensive fixed-line
network in South Africa and our investments in these cables in order to become the communications hub of Africa.
Information technology/operations support systems
The quality of our operations support systems, which store, manage and analyze essential business information, is critical to the
success of our business. Our operations support systems permit us to make timely and informed business decisions and respond to
our customers' needs with tailored solutions. We have dedicated significant resources to the design and implementation of our new
operations support systems based on a comprehensive and well defined information technology strategy.
In 2000, we opened a new data center at Techno Park in Centurion, Pretoria in order to improve internal information technology
service levels and offer external internet and related services such as managed data center hosting services. The center is
safeguarded by state-of-the-art environmental and security systems capable of performing maintenance without impacting service or
availability. The 10,731 square meter complex has 9,467 square meters of usable space and includes a 2,100 square meter data
center and a twenty-four hour operations center. The command center contains a large video wall which enables operational and
customer personnel to keep abreast of the current state of our intellectual technology infrastructure twenty-four hours a day.
Our retail billing systems have been upgraded. In 1999, the Amdocs guiding, rating and error management modules were
implemented and in June 2001, the Amdocs Accounts Receivable module was implemented for voice services. We have also
replaced our data billing system to facilitate the billing of more complex price plans. A new wholesale/interconnect billing process
was implemented in 1999. In addition, we implemented a fraud management system during 2000 to detect network and subscription
fraud.
Competition
We expect that increased competition from the liberalization of the South African communications market could result in
decreased tariffs and loss in market share which could negatively impact our results of operations and growth. However, we expect
competition also to stimulate overall market demand for communications services.
We had the exclusive right to provide public switched telecommunications services in the Republic of South Africa, including
international telephone services, until May 7, 2002, but for a number of years we have competed with mobile operators and value-
added network operators in connection with the provision of other services. ICASA issued an international carrier of carriers license
and multimedia license to Sentech Limited in May 2002. Sentech Limited is wholly owned by the Government of the Republic of
South Africa and is a provider of broadcasting signal distribution services on the African continent. In addition, the South African
Minister of Communications and ICASA have initiated a process to issue an additional license to provide public switched
telecommunications services to a second national operator and additional licenses to small business operators to provide
telecommunications services in areas with a teledensity of less than 5%. ICASA has indicated that it expects to issue these licenses
in 2003 or early 2004, however, the Government's solicitation of applications for these licenses has not been well received by
prospective domestic and international telephone service providers and it is difficult to determine the timing of such competition.
At the close of the application process, two applications for the second national operator had been received. It is currently
anticipated that the second national operator will be 30% owned by two entities beneficially owned by the South African
Government. The South African Telecommunications Act, 103 of 1996, requires the Minister of Communications to conduct an
assessment of the feasibility of issuing additional licenses from May 2005.
110
We also compete with Vodacom, our 50% owned joint venture, MTN and Cell C, the three existing mobile operators, for
telephone customers and for corporate mobile carrier services. In addition, we compete with mobile operators who use least cost
routing technology that enables fixed-to-mobile calls from corporate private branch exchanges to be transferred directly to mobile
networks. As a result of increasing competition, the main challenge we face is continuing to improve customer service and loyalty
and maintaining our leadership in the South African telecommunications market during liberalization.
We compete primarily on the basis of customer service, dependability and price in those areas where we currently face
competition and we expect to compete for public switched telecommunications services in the future. We intend to introduce new
products and services and tariff structures with the aim of gaining additional revenues and increasing current revenues generated
from existing products.
In addition, we compete with other telecommunication services providers in those areas that are fully liberalized, such as the
provision of value-added data network services. The entry of many multinational corporations to South Africa is expected to be a
further incentive for global communications operators, which already service these corporations abroad, to establish or enhance
their presence in South Africa.
Procurement
We utilize a transparent multi-disciplined approach to purchasing and supplier management in order to ensure that we receive
the best products and services from reliable suppliers at the best overall price. We have established cross functional sourcing teams
staffed with individuals from different areas of our organization to evaluate and make recommendations on large bids, which
depending on size, require the further approval of our operating committee and notification to our board of directors. Bid requests
are published in our weekly tender bulletin and on our web site. We are required to adopt affirmative procurement policies that
favor historically disadvantaged suppliers. We seek to utilize at least two suppliers for all critical equipment where possible in order
to minimize supply risk. In the year ended March 31, 2002, our top twenty suppliers accounted for approximately 51% of all
equipment purchased and our main supplier was Siemens, which accounted for approximately 10% of all equipment purchased.
Fixed-line properties
Our principal executive offices are located at Telkom Towers North, 152 Proes Street, Pretoria 0002, Republic of South Africa
and comprise approximately 27,000 square meters of office space. Our executive offices are leased from the Telkom Retirement
Fund under a lease agreement which will expire on January 31, 2019. The total area of all our properties as of March 31, 2002
comprised approximately 3.2 million square meters consisting of approximately 1.9 million square meters of owned properties and
approximately 1.3 million square meters of leased properties. As of March 31, 2002, we leased approximately 670,000 square
meters of office space pursuant to lease agreements. Except as stated to the contrary below, our leases expire at various times
ranging from one month to five years.
Our properties primarily consist of 2,459 electronic telephone exchanges, 49 microwave transmission towers, three satellite
stations, 171 customer service branches, 263 customer service centers, three information technology centers and one network
management center.
Details of the principal immovable property leased and owned by our fixed-line business as of March 31, 2002 are as follows:
Building area
Type of
Leased or
(square
Monthly
Expiration
property
owned
Lessor
Lessee
Location
meters)
rental
date
Head office
Leased
Telkom
Telkom
152 Proes Street,
26,981
R889,214
January 31,
Retirement
Pretoria,
2019
Fund
South Africa
Equipment related
Leased
Telkom
Telkom
178 Vermeulen Street,
4,993
R296,127
January 31,
Retirement
Pretoria,
2019
Fund
South Africa
Information
Leased
Telkom
Telkom
21 Teddington Street,
22,332
R735,996
January 31,
technology center
Retirement
Tygerberg,
2019
Fund
Bellville,
South Africa
Network operations
Owned
n/a
n/a
91 Oak Avenue,
24,449
n/a
n/a
center
Highveld,
Centurion,
South Africa
111
Building area
Type of
Leased or
(square
Monthly
Expiration
property
owned
Lessor
Lessee
Location
meters)
rental
date
Hillbrow Owned
n/a
n/a
Claim
Street
18,126
n/a
n/a
microwave tower
Hillbrow
Johannesburg
South Africa
Pretoria Owned
n/a
n/a
Devenish
Street
4,485
n/a
n/a
microwave tower
Groenkloof
Pretoria
South Africa
Hartebeesthoek Owned
n/a
n/a
Old
Krugersdrop
Road
6,405
n/a
n/a
satellite station
on the Farm
Hartebeesthoek
South Africa
Electronic Owned
n/a
n/a
Sivewright
Street
16,723
n/a
n/a
telephone exchange
New Doornfontein
Johannesburg
South Africa
Our property facilities, whether leased or owned, are managed pursuant to a management agreement with Telecommunications
Facilities Management Company (Proprietary) Limited, a company incorporated in the Republic of South Africa, of
Meersig Building, 48 West Avenue, Centurion. The consideration paid to Telecommunications Facilities Management Company
for management services in the year ended March 31, 2002 and the six months ended September 30, 2002 was R144 million and
R73 million, respectively. The management agreement terminates on March 31, 2011.
On September 1, 2002, we issued an information memorandum inviting potential investors to provide to us by November 2002,
preliminary submissions to purchase a substantial portion of our fixed-line property portfolio and lease that property back to us.
This transaction is expected to involve over 1,400 properties ranging from warehouses and exchange buildings to our national
network operations center and is intended to further our strategy of focusing on our core business. We are currently reviewing the
bids we have received to date after having completed a due diligence process.
Employees
The following table sets forth the number of our full-time employees in our fixed-line segment.
As of March 31,
As of September 30, Six months
2001/2000
2002/2001
2002/2001
2000
2001
2002
% change
% change
2001
2002
% change
Telkom . . . . . . . . . . . . . . . .
49,128
43,758
39,444
(10.9)
(9.9)
42,110
38,009
(9.7)
Network and technology . . . . .
36,551
31,330
28,343
(14.3)
(9.5)
30,303
27,313
(9.9)
Marketing and sales . . . . . . . .
9,021
8,919
8,230
(1.1)
(7.7)
8,423
8,001
(5.0)
Support and other . . . . . . . . .
3,556
3,509
2,871
(1.3)
(18.2)
3,384
2,695
(20.4)
Other subsidiaries, excluding
Vodacom . . . . . . . . . . . . . . .
638
701
586
9.9
(16.4)
463
580
25.3
Total . . . . . . . . . . . . . . . . .
49,766
44,459
40,030
(10.7)
(10.0)
42,573
38,589
(9.4)
In addition to our full time employees, we employed an average of 2,227 temporary employees in the year ended March 31, 2002 and
an average of 2,089 temporary employees in the six months ended September 30, 2002. Our employees are represented by the Alliance of
Telkom Unions, comprising the South African Communications Union, the Solidarity Union, the Post and Telecommunications
Association of South Africa and the Communication Workers Union. Some of our employees also belong to other unions that are not
recognized by Telkom for collective bargaining purposes, including the Postal Union, the Society of Telkom Engineers and the South
African State and Allied Workers Union. As of September 30, 2002, approximately 75% of our fixed-line employees, excluding our
Telkom Directory Services and Swiftnet subsidiaries, were union members. Telkom's bargaining agreement covering its unionized
employees is scheduled to expire on March 31, 2003.
The Government of the Republic of South Africa currently appoints two members to our board of directors who are currently union
representatives. A number of South African trade unions, including the trade unions of our employees, have close links to various political
parties. In the past, trade unions have had a significant influence in South Africa as vehicles for social and political reform and in the
collective bargaining process. Since 1995, South Africa has enacted various labor laws that enhance the rights of employees and resulted
in increased compliance costs.
These laws:
confirm the right of employees to belong to trade unions;
guarantee employees the right to strike, the right to picket and the right to participate in secondary strikes in prescribed
circumstances;
112
provide for mandatory compensation in the event of termination of employment due to redundancy;
limit the maximum ordinary hours of work;
increase the rate of pay for overtime;
require large employers, such as us, to implement affirmative action policies to benefit previously disadvantaged groups and
impose significant monetary penalties for non-compliance; and
provide for the financing of training programs by means of a levy grant system and a national skills fund.
We believe that the relationship between our management and our employees and labor unions is good. We believe that
investment in employee training and development is essential to implementing corporate cultural change and improving customer
satisfaction. In order to improve the skill levels of our employees, we invested R506 million in employee training and development
in the year ended March 31, 2002 and approximately R226 million in employee training and development in the six months ended
September 30, 2002.
We are leveraging the experience of our strategic equity investors to improve and transfer skills to our South African
management team. Leadership development continues to remain our primary priority, with specific focus on previously
disadvantaged groups. We have launched a number of initiatives designed to train our employees and encourage employee retention.
Employee-related expenses are a significant component of our total fixed-line operating expenses. The number of our fixed-line
employees, excluding Telkom Directory Services and Swiftnet, declined by approximately 18,800 positions from March 31, 1997
through September 30, 2002. We have entered into agreements relating to employee optimization and retrenchment with two unions
representing the majority of our employees. An agreement regarding employee optimization, which was concluded with the Alliance of
Telkom Unions on August 23, 2001, gives employees identified as being redundant the option to accept a voluntary severance or early
retirement package or the option to join a redeployment pool. Employees joining the redeployment pool will be retrained for vacant
positions after an assessment relating to skills and training of the employee has been conducted.
A job security and retrenchment framework agreement was reached with the Communications Workers' Union on January 24,
2002. This agreement is aimed at engendering a sense of job security and regulating the process to be followed prior to any
dismissals for operational reasons. The agreement makes provision for a consultative process to seek ways of avoiding job losses,
for reaching agreement on the dismissal of employees for operational reasons should job losses be unavoidable and for ways of
assisting employees after they have been dismissed due to operational reasons, including training.
In addition, in October 2002, Telkom and its unions agreed to embark on a process of implementing alternative strategies and
approaches to avoid and minimize job losses and to create new career opportunities for Telkom employees.
Mobile communications
Overview
We participate in the South African mobile communications market through our 50% interest in Vodacom. Vodacom is the
largest mobile communications network operator in the Republic of South Africa with a market share of approximately 59% as of
September 30, 2002 based on total reported customers. In addition, Vodacom has investments in mobile communications network
operators in Lesotho, Tanzania and the Democratic Republic of the Congo and in an entity that, in August 2002, was granted a
license to operate a mobile communications network in Mozambique.
Vodacom's other shareholders are:
Vodafone, the world's largest mobile telecommunications company, that beneficially owns 35% of Vodacom; and
VenFin that beneficially owns 15% of Vodacom.
South Africa
Vodacom had 7.1 million customers in South Africa as of September 30, 2002. Vodacom's 5,199 base stations as of September 30,
2002 are capable of reaching approximately 43 million people in South Africa, representing 95.1% of the country's population
based on Statistics South Africa. Vodacom's base stations cover approximately 64.6% of the total land surface of the country. The
penetration rate for mobile communications in the Republic of South Africa has increased to 26.6% as of September 30, 2002 from
2.
4% as of March 31, 1997.
Vodacom offers mobile communications services based on the Global System for Mobile communications technology, or GSM.
Vodacom was granted a mobile cellular telecommunications license in South Africa in September 1993 and commenced service in
June 1994. This mobile cellular telecommunications service license was confirmed and reissued in August 2002 pursuant to the
Telecommunications Act, 103 of 1996.
113
Products and services
Vodacom offers a wide range of mobile voice and data communications products and services, including value-added services
such as caller identification, call forwarding, call waiting, voicemail, entertainment, information and commerce services, short
messaging services, mobile internet access, fax services and twin call services, which enable customers to use two mobile phones
under the same number. Vodacom's services also include the sale of handsets. Vodacom has a record of innovation as the first
mobile communications network operator in the world to offer prepaid mobile communications services on an intelligent network
platform. Vodacom was also the first mobile communications network operator in South Africa with nationwide coverage. Vodacom
has access to Vodafone's extensive research related to its products, services and technology, including its international
benchmarking studies. In the future, Vodacom will focus on offering premier interactive voice response, premium short messaging
services, general packet radio services, multimedia services and fixed-to-mobile products.
Contract subscription services
As of September 30, 2002, 16.0% of Vodacom's customers were contract customers. Contract subscription is typically for an
initial 24-month contract. Vodacom offers contract customers a range of mobile service packages designed to appeal to specific
customer segments. Vodacom offers two broad categories of contract subscription packages, leisure packages for residential
customers and business packages for business customers.
In November 2001, Vodacom introduced per second billing products for both its leisure and business packages where customers
are billed in one second increments. The monthly subscription and call charges vary with each of the packages. All contract
packages make available voice, fax and data services, voicemail, caller identification, call forwarding, call waiting and short
message service capability. Depending on the contract package, customers either pay a fixed monthly charge and receive a set
number of free minutes or pay a monthly subscription for access plus a per minute or per second fee. In addition, Vodamail
Executive is available to all contract packages on request. This is an integrated voice and fax mailbox that offers features such as
Faxmail, group distribution list and voicemail messaging.
Prepaid services
As of September 30, 2002, 83.6% of Vodacom's customers were prepaid customers. Vodacom has two prepaid products, Vodago
and 4U. In November 1996, Vodacom launched Vodago, a prepaid, no contract, no credit mobile communications service based on
the Siemens Intelligent Network platform. Since its introduction, Vodago has experienced rapid growth and has been a significant
element in the growth of Vodacom's mobile customer base. In October 2001, Vodacom launched 4U, a new prepaid per second
billing product targeted at the youth market who have higher usage of SMS and a need for per second billing. Since its inception,
the number of 4U subscribers has increased significantly and as of September 30, 2002, approximately 46% of Vodacom's prepaid
customers were 4U customers.
Vodago and 4U provide instant access to the Vodacom network and enable low volume customers to control mobile telephone
costs based on usage because there are no long-term contracts. Fax and certain data services are not available to Vodago customers.
Vodacom offers five Vodago vouchers, ranging from R29 worth of airtime value and a 14 day usage time window to R1,100 worth
of airtime value and a 365 day usage time window. Remaining time value and time window are accumulated provided the customer
recharges a voucher before the time window expires. The accumulated time window cannot exceed 24 months. Vodacom also offers
a voucher that entitles customers to receive unlimited incoming calls for 365 days. This voucher does not entitle the customer to
make outgoing calls, but can be combined with other vouchers that entitle the customer to make outgoing calls as well as
accumulate airtime.
A wide variety of retail outlets, such as handset dealers, gas stations, tobacco shops and post offices, sell recharge vouchers for
Vodacom's prepaid customers. Recharging can also take place electronically and through the use of banking networks. Because
prepaid customers pay in advance for their mobile service, the risk of bad debts is eliminated and the risk of fraud is substantially
reduced. In addition, prepaid services provide cost savings to Vodacom as bills do not need to be sent to prepaid customers and
handsets for prepaid customers are not subsidized. There are less service offerings for the prepaid mobile communications market
than there are for the contract base market. Following the launch of 4U, Vodacom is continuing to implement initiatives to expand
on its prepaid mobile communications service offerings and to gain a greater understanding of its prepaid customer base and its
requirements.
Community services
In 1996, Vodacom jointly with Siemens and Psitek developed community telephone units, which are installed throughout
communities either on an individual basis or grouped in a container with the Vodacom brand.
Community service phones are purchased by local entrepreneurs who resell community phone services. Community service
phones are preloaded with airtime and can be recharged electronically by telephone shop operators when the airtime on the phone
expires. The demand for community service phones has been strong since its introduction. The development of community service
114
phones has made it possible to provide mobile access to the more than 20 million South Africans who live in communities where
there is less than one telephone line per hundred people and have improved the quality of life for many South Africans who
previously had no access to telecommunications. Vodacom rolled-out approximately 30,000 community service phones by
September 30, 2002, exceeding its aggregate license target of 22,000 community service phones. Community service phones have
been a cost effective method of significantly increasing traffic revenue on Vodacom's network due to their low roll-out costs for
Vodacom and low barriers to entry for customers. Community service phones generated ARPUs of nine times Vodacom's average
overall ARPUs in the year ended March 31, 2002. Vodacom intends to utilize or adopt its business model for community service
phones in its other African operations.
Value-added mobile voice and data services
Vodacom offers an extensive portfolio of value-added mobile voice and data services, including caller identification, call
forwarding, call waiting, voicemail, entertainment, mobile information and commerce services, short messaging services, mobile
multimedia services, data services, mobile internet access, fax services and twin call services, the latter of which enable customers
to use two mobile phones under the same number. Vodacom has experienced substantial growth in the use of its value-added voice
and data services, resulting in increased traffic revenue on its network. Short messaging services generated almost all of Vodacom's
R400 million of data revenue in the year ended March 31, 2002 and R239 million of data revenue in the six months ended
September 30, 2002. Vodacom transmitted 911 million short messaging services over its network in the year ended March 31, 2002
and 653 million in the six months ended September 30, 2002 compared to 363 million in the six months ended September 30, 2001.
Data revenue provided 2.5% of Vodacom's total mobile network service revenues in the year ended March 31, 2002, up from
2.0% in the year ended March 31, 2001. Data revenue provided 2.5% of Vodacom's total mobile network service revenue in the six
months ended September 30, 2002. However, Vodacom believes that more sophisticated mobile messaging data and internet
services are still in their infancy, with broad application hampered by low transmission speeds. Vodacom expects that the broad
introduction of "always-on" faster response and generally higher speed packet-switched data services, such as GPRS and, at a later
stage, universal mobile telecommunications system, or UMTS, will provide the platform for future value-added services. Vodacom
launched Mylife, its GPRS network service in October 2002. Although GPRS capable handsets became commercially available by
mid-2002, the availability of mobile multi-media services, or MMS, handsets at commercially attractive prices is not expected to
occur until 2003. Vodacom expects MMS services to provide a growing source of revenue in the future as they gain acceptance
among customers.
Handset sales
Service providers offer handsets for sale at subsidized prices to contract customers depending on the airtime and tariff plan and
type of handset purchased. Vodacom purchases handsets at current market prices. Mobile users may use any handset on the
Vodacom or any other network if the handset contains a sim-card for Vodacom or the other network. No modifications, other than
the replacement of the sim-card, are required to utilize handsets on either the Vodacom or other mobile communications network
operators' networks, unless the handset is network locked. During 2002, Vodacom began network locking subsidized handset sales
for its prepaid products, as it had done for a small number of handsets sold prior to April 1999.
Interconnection services
Vodacom provides interconnection services to the other two South African mobile operators, our fixed-line business and to the
local operators in each of the African countries in which Vodacom operates. Vodacom will also provide these services to the second
national operator and other South African communications licensees when they commence operations.
National roaming services
In July 2001, Vodacom concluded a roaming agreement with Cell C for a fifteen year period. This roaming agreement enables
Cell C to provide national coverage to its customers, by allowing the routing of calls over Vodacom's mobile communications
network. Roaming by Cell C in a number of densely populated cities or regions, including Gauteng, which includes Johannesburg
and Pretoria, Cape Town, Durban, Bloemfontein and Port Elizabeth, will not be permitted after a period of three years.
International roaming services
International roaming enables Vodacom's contract customers to make and receive calls with their mobile telephones in countries
using the networks of operators with whom Vodacom has entered into international roaming agreements. As of September 30, 2002,
Vodacom had international roaming agreements with over 230 mobile communications network operators in over 120 countries. In
the fourth quarter of 1998, Vodacom became the first South African mobile communications network operator to sign a digital GSM
roaming agreement with an American mobile communications operator. Vodacom also receives revenue from its roaming partners
for calls made in South Africa by their customers.

115
Customers
Vodacom has experienced substantial growth in its mobile customer base since its inception in 1994. As of September 30, 2002,
there were an estimated 12.1 million mobile communications customers in South Africa, which represents a penetration rate of
26.6% of the population. Despite the introduction of a third mobile communications network operator in 2001, Vodacom has
maintained its market share. As of September 30, 2002, Vodacom customers represented approximately 59% of South African
mobile communications customers making Vodacom the leading mobile communications network provider in South Africa and the
whole continent of Africa based on total reported customers.
The following table sets forth customer data for Vodacom's mobile communications services in the Republic of South Africa as
of the dates indicated.
As of March 31,
As of September 30, Six months
2001/2000
2002/2001
2002/2001
2000
2001
2002
% change
% change
1
2001
2002
% change
South Africa:
Customers (thousands)
1
. . . . . .
3,069
5,108
6,557
66.4
28.4
5,657
7,130
26.0
Contract . . . . . . . . . . . . . . .
963
1,037
1,090
7.7
5.1
1,062
1,139
7.3
Prepaid . . . . . . . . . . . . . . . .
2,082
4,046
5,439
94.3
34.4
4,569
5,961
30.5
Community services . . . . . . . . .
24
25
28
4.2
12.0
26
30
15.4
Gross connections (thousands) . . .
1,884
2,990
3,038
58.7
1.6
1,385
1,625
17.3
Contract . . . . . . . . . . . . . . .
261
263
199
0.8
(24.3)
110
110 -
Prepaid . . . . . . . . . . . . . . . .
1,617
2,725
2,836
68.5
4.1
1,273
1,513
18.9
Community services . . . . . . . . .
6
2
3
(66.7)
50.0
2
2 -
Churn (percentage)
2
. . . . . . . .
31.8
23.3
27.2
(26.7)
16.7
31.3
30.7
(1.9)
Contract . . . . . . . . . . . . . . .
17.4
18.7
14.5
7.5
(22.5)
16.6
13.2
(20.5)
Prepaid . . . . . . . . . . . . . . . .
40.5
24.8
30.1
(38.8)
21.4
34.8
34.3
(1.4)
1
Customer totals are based on the total number of customers registered on Vodacom's network, which have not been disconnected, including
inactive customers, as of the end of the period indicated. 13.9% of Vodacom's total reported customers, 15.9% of its prepaid customers and 3.8%
of its contract customers in South Africa were inactive as of March 31, 2002. 15.1% of Vodacom's total reported customers, 17.0% of its prepaid
customers and 4.9% of its contract customers in South Africa were inactive as of September 30, 2002.
2
Churn is calculated by dividing the average monthly number of disconnections during the period by the average monthly total reported customer
base during the period.
Vodacom's contract customers are disconnected when they terminate their contract or their service provider who carries the
credit risk terminates their contract due to non-payment. Prepaid customers are disconnected if they do not recharge their vouchers
after being in time window lock for four months. Time window lock occurs when a customer's paid active time window, or access
period, expires. Customers are deemed to be inactive if they have not made or received a revenue generating call in three months.
Vodacom believes the significant year on year growth in customer numbers is due primarily to historical pent up demand for
basic voice telephone services, particularly in underserviced and rural, outlying areas of South Africa. Vodacom also attributes its
growth to the launch of its prepaid services, which have enabled those that lack access to credit and steady income to obtain
telephone service. Finally, Vodacom believes that its aggressive marketing campaign, the creation of strong distribution
channels for Vodacom's products and services and the introduction of new value-added voice and data services have further
fuelled growth.
Vodacom expects that the number of contract customers in South Africa will eventually level off and that the number of prepaid
customers in South Africa will continue to grow in the medium term driven by the continued demand for basic voice telephone
services. Vodacom believes that mobile communications services provide a cost effective means to connect in underserviced and
rural, outlying areas. Vodacom's efforts will therefore continue to focus on growing customer numbers while carefully managing its
existing customer base, marginal revenue per customer and customer related acquisition and retention costs.
Vodacom, MTN and Cell C each provide connection commissions to service providers and dealers (agents). These are often
utilized by agents to subsidize handsets as an incentive for customers to switch operators to obtain a new handset and to reduce the
cost of access. As a result, Vodacom focuses on keeping its churn rate low and retaining high value customers through focused
handset upgrade policies and other retention measures, while continuously monitoring customer acquisition and retention costs.
Vodacom also actively manages churn through customer relationship management systems, developing its own distribution and
logistics capabilities and other retention initiatives. Prepaid customer churn is negatively affected by the high rate of unemployment
in South Africa and low cost of access.

116
Traffic
The following table sets forth information related to the traffic volume of Vodacom's customers in South Africa for the periods
indicated. Traffic comprises outgoing calls made in South Africa and abroad and incoming calls received by Vodacom's customers
in South Africa, excluding national and incoming international calls.
As of March 31,
As of September 30,
Six months
2001/2000
2002/2001
2002/2001
2000
2001
2002
% change
% change
2001
2002
% change
Traffic (millions of minutes) . . . .
5,669
7,472
8,881
31.8
18.9
4,229
5,007
18.4
Outgoing . . . . . . . . . . . . . . .
2,885
4,052
4,967
40.5
22.6
2,307
2,994
29.8
Incoming (interconnection) . . . . .
2,784
3,420
3,914
22.8
14.4
1,922
2,013
4.7
Tariffs
Vodacom's tariffs are subject to the regulatory scrutiny, and, in certain circumstances, approval of ICASA. The contract tariff
packages are designed to appeal to the various spectrum of leisure and business customers. Vodacom sets its contract subscription
package tariffs utilizing a balanced mix of access and usage. For those tariff packages where voice usage is high, the per minute
rate is lowered and the monthly subscription tariff is raised. For those packages where the voice usage is low, the per minute tariff
rate is increased and the monthly subscription tariff is lowered. For those users where the monthly subscription tariff is a barrier to
entry, Vodacom offers prepaid packages with no monthly subscription tariff, but sets the per minute voice tariff rate higher. Tariff
rates for SMS messaging are based on the fact that lower cost channels are used to carry the data.
The following table sets forth selected tariff information as of the dates indicated for a leisure contract package, a business
contract package and a prepaid package. Peak hours are weekdays between 7:00 a.m. and 8:00 p.m. Off peak hours are all other
times and all day during public holidays. Tariffs for international calls vary according to the destination country of the call. In
November 2001, Vodacom launched new products for its contract and prepaid packages where calls are charged in one second
increments. The following tariffs for Vodacom's packages are charged in time units of one minute for the first minute and thereafter
in units of 30 seconds.
As of September 30, 2002
Leisure
1
Contract
2
Prepaid
3
(ZAR, including value-added tax)
Connection fee . . . . . . . . . . . . . . . . . . . . . . . . . . . . . . . . . .
97.00
97.00
-
Monthly charge/subscription . . . . . . . . . . . . . . . . . . . . . . . . . . .
135.00
180.00 -
National calls (per minute)
Mobile-to-fixed peak calls . . . . . . . . . . . . . . . . . . . . . . . . . . .
2.70
1.66
2.85
Mobile-to-fixed off peak calls . . . . . . . . . . . . . . . . . . . . . . . . .
0.87
0.87
1.55
Mobile-to-mobile peak calls own network . . . . . . . . . . . . . . . . .
1.70
1.66
2.85
Mobile-to-mobile off peak calls own network . . . . . . . . . . . . . . .
0.87
0.87
1.55
Mobile-to-mobile peak calls other networks . . . . . . . . . . . . . . . .
2.70
2.08
2.85
Mobile-to-mobile off peak calls other networks . . . . . . . . . . . . . .
0.87
0.87
1.55
International calls (per minute)
Peak . . . . . . . . . . . . . . . . . . . . . . . . . . . . . . . . . . . . . .
1.66+
1.66+
R5, R10
Telkom
Telkom
or R15
peak
peak
depending
on zone
Off peak . . . . . . . . . . . . . . . . . . . . . . . . . . . . . . . . . . . .
0.87+
0.87+
R5, R10
Telkom
Telkom
or R15
off peak
off peak
depending
on zone
SMS per message
Peak . . . . . . . . . . . . . . . . . . . . . . . . . . . . . . . . . . . . . .
0.75
0.75
0.75
Off peak . . . . . . . . . . . . . . . . . . . . . . . . . . . . . . . . . . . .
0.30
0.30
0.30
1
Tariff for "Weekend Everyday," Vodacom's contract leisure package. Vodacom's "Weekend Everyday" contract includes 120 free off-peak minutes
per month. Calls are charged for first 60 second increment and 30 second increments thereafter. As of September 30, 2002, "Weekend Everyday"
customers accounted for 41.0% of Vodacom's total contract customers.
2
Tariff for "Business Call," Vodacom's contract business package. Vodacom's "Business Call" contract includes no free minutes per month. Calls
are charged for first 60 second increment and 30 second increments thereafter. As of September 30, 2002, "Business Call" customers accounted
for 20.0% of Vodacom's total contract customers.
3
Tariff for "Vodago," Vodacom's standard prepaid package. Calls are charged for first 60 second increment and 30 second increments thereafter.
117
Sales and marketing
Vodacom's sales and marketing strategy is split into two focus areas, marketing and brand building and sales and distribution.
Vodacom's promotional strategy seeks to build a brand that is widely recognized by customers. Vodacom's advertising and
promotion campaign is focused on television advertising and sponsorship of sporting and entertainment events.
The sale and distribution of Vodacom's products and services and the acquisition and retention of customers are performed by
Vodacom's wholly-owned subsidiary, Vodacom Service Provider Company (Proprietary) Limited, a company incorporated in the
Republic of South Africa, and the other independent and exclusive service providers. In recent years, Vodacom has purchased a
number of the previously independent service providers and consolidated its sales and distribution operations into Vodacom Service
Provider Company. In addition, Vodacom utilized three exclusive service providers and three independent non-exclusive service
providers as of March 31, 2002. As of March 31, 2002, approximately 72% of Vodacom's contract base was managed by exclusive
service providers, including Vodacom Service Provider Company which manages 69% of Vodacom's contract base, while
approximately 28% of its contract base was managed by independent non-exclusive service providers.
Vodacom Service Provider Company seeks to enter into exclusive relationships with leading national retailers, wholesalers,
dealers and franchisees in order to acquire and retain contract and prepaid customers. As a result of its efforts, approximately 70%
of Vodacom's sales are made through exclusive distribution channels.
As of September 30, 2002, Vodacom's distribution network consists of:
Vodaworld A unique one-stop mobile telecommunications mall, showcasing the latest technology in mobile hardware.
Dealers and franchises Approximately 2,106 company and independently owned mobile dealer and franchise outlets.
National chains Approximately 5,754 retail outlets.
Vodacom Direct Vodacom's call center based selling division.
Corporate solutions An extensive direct sales division within Vodacom which concentrates on the sale of contracts, data
products and value-added services to businesses.
Dealer incentives
Vodacom offers the following incentives in order to reduce churn on its network:
Contract connection incentive commissions. These incentives are offered to service providers or dealers to stimulate the
acquisition of new customers for all contract packages. A commission is paid to the service provider or dealer for each new
activation.
Contract retention incentive commissions. These incentives are offered to service providers or dealers to maintain and retain
existing customer loyalty for all contract packages, excluding Vodacom 4U. The purpose of these incentives is to minimize
customer churn.
Prepaid incentive commissions. These incentives are offered to service providers or dealers to stimulate the acquisition of new
customers for all prepaid packages. A commission is paid to service providers or dealers for each new activation.
Distribution incentive commissions. These incentives are offered to service providers or dealers to maintain and increase their
loyalty to, and exclusivity with, Vodacom. These incentives include exclusivity payments and advances to service providers in
respect of purchases of assets for stores and providing distribution outlets with distribution subsidies to maintain the loyalty of
distribution outlets through the stimulation of sales.
Customer care
Vodacom believes that customer service and relationship management are key distinguishing factors among mobile
communications network operators and will be increasingly important as competition intensifies. Consequently, Vodacom has
significantly improved its customer information systems and become increasingly proactive in developing relationships with its
customers, particularly in the high revenue segment of the market. Vodacom has developed a customer relationship management
package that enables it to create a historical profile of customers so that customer information can be shared among the group and
used in Vodacom's customer retention initiatives. In addition, Vodacom has undertaken a number of other initiatives, including the
development of distribution and logistics capabilities to better service customers.
Vodacom plans to continue to invest in sophisticated information systems to facilitate the interface between operational support
systems, administrative systems, billing systems, distribution systems and customer service systems. Vodacom believes that the new
information systems will allow for the development of enhanced service management processes.

118
Vodacom's contract customers receive itemized bills and are encouraged to pay by direct debit transfer. Vodacom has a flexible
billing system for corporate customers allowing it to offer multiple tariff rates and more customized billing information. Vodacom
monitors its exposure to credit loss and customer fraud through a credit scoring system that evaluates potential contract customers.
The evaluation process has led to decreases in contract customer churn rates and increases in the overall credit quality of its mobile
customers. For its prepaid customers, Vodacom offers the option to recharge over the telephone using credit cards in order to make
the recharge process quicker and easier.
Infrastructure and technology
Vodacom operates the largest mobile communications network on the African continent using digital GSM technology within
the GSM 900-frequency band based on total reported customers.
In South Africa, the network's core GSM infrastructure as of September 30, 2002 is characterized by:
23 mobile switching centers;
217 base station controllers;
5,199 base transceiver stations, 1,433 of which are micro base transceiver stations;
32,104 transceivers; and
GPRS functionality across the network.
As of
As of March 31,
September 30,
1998
1999
2000
2001
2002
2002
Macro base transceiver stations
2,153
2,575
2,977
3,401
3,670
3,766
Micro base transceiver stations
174
891
1,221
1,292
1,380
1,433
Total
2,327
3,466
4,198
4,693
5,050
5,199
Prepaid services are supported by the same GSM technology as contract services. In addition, prepaid services utilize a network
of 12 intelligent network nodes and associated front-ends and mediation systems for a variety of interactive voice response and
electronic recharging options, including commercial bank ATM and point of sale terminal recharging.
Vodacom's transmission network comprises more than 12,000 2Mbit/sec systems and two 155Mbit/sec systems leased from
Telkom, which are managed by a comprehensive digital cross-connect infrastructure. In addition, Vodacom operates an extensive
data network for its internal requirements, based on internet protocol, point-to-point and X.25 services, which is supported by the
cross-connect network and more than 50 packet/frame/circuit nodes.
This network enables Vodacom to provide value-added voice and data services supported by the following infrastructure in
South Africa:
38 voicemail platforms;
five short messaging service centers;
a wireless application protocol platform;
a mobile internet gateway platform supporting advanced SIM toolkit applications; and
an intelligent network platform.
Vodacom has designed its mobile communications network using scaleable technology in order to be able to increase capacity in
an economic manner as demand dictates. The network is capable of providing a high level of service quality despite an extremely
varied distribution of traffic, difficult terrain conditions and a complex regulatory environment. As of September 30, 2002, Vodacom
had achieved a busy hour dropped call rate of 0.75% and call success rate of 98.7% in South Africa.
Vodacom intends to install additional base station controllers, micro base stations and micro base transceiver stations in order to
increase capacity and improve network quality in areas where required. Vodacom has already installed dual band (GSM900/
GSM1800) base transceiver stations in 435 locations, including 275 locations in Johannesburg, 155 locations in Pretoria and five
locations in Stellenbosch. In addition, all base transceiver stations in metropolitan areas have been upgraded with dual band
antennas and feeder cables to accommodate GSM1800 equipment.
In the design of its network, Vodacom has paid careful attention to the needs of customers and to the environment by making an
extensive effort to implement sites in the most discrete manner possible. Furthermore, attention has been paid to the issue of the
management of electromagnetic emissions to ensure compliance with recognized international environmental standards such as
those developed by the International Commission on Non-Ionizing Radiation Protection.
Vodacom has implemented a new billing system to allow for the billing of GPRS services, such as multi-media messaging
services and other content-based services. Unlike traditional GSM services where calls are billed on a per second or per minute
basis, customers utilizing GPRS services are billed according to the number of bytes of data sent or received.

119
Competition
The current South African mobile telecommunications market consists of three mobile communications network operators,
Vodacom, MTN, a wholly-owned subsidiary of MTN Group Limited, a public company listed on the JSE, and Cell C. Cell C is
60% beneficially owned by a Saudi Arabian based group owned by the Hariri family and 40% beneficially owned by a consortium
of mainly black empowerment groups. Cell C commenced operations in November 2001. As of September 30, 2002, Vodacom was
the market leader with an approximately 59% market share based on the total reported customers in the South African mobile
communications market, while MTN had an approximately 36% market share and Cell C had an approximately 5% market share.
Vodacom competes primarily on the basis of product quality, availability and network coverage. Vodacom believes that increased
competition could have an adverse impact on its tariffs and churn rate.
Operations in other African countries
Vodacom intends to increase revenue from its other African operations, initially by growing its existing operations in sub-
Saharan Africa, and, in the future, by selectively acquiring additional mobile licenses or operators in other sub-Saharan African
markets. Investments outside of South Africa are evaluated and monitored against key investment criteria, focusing primarily on
countries with stable economic and political conditions and good prospects for growth, market leadership and profitability. Other
key factors include Vodacom's ability to gain majority ownership, develop strong local partnership relationships and obtain non-
recourse financing. Other African operators are branded under the "Vodacom" name.
Vodacom has investments in mobile communications network operators in Lesotho, Tanzania and the Democratic Republic of
the Congo and in an entity that, in August 2002, was granted a license to operate a mobile communications network in
Mozambique. Vodacom is currently seeking to enter into interconnection agreements with local operators in Mozambique and does
not intend to commence service in Mozambique unless commercially acceptable terms are agreed. The number of customers served
by Vodacom's operations outside South Africa has grown 194.2% from 104,383 as of March 31, 2001 to 306,156 as of March 31,
2002. The number of customers served by Vodacom's operations outside South Africa grew to 540,328 as of September 30, 2002.
Revenue from Vodacom's operations outside of South Africa has grown from R184 million in the year ended March 31, 2001 to
R740 million in the year ended March 31, 2002 and from R228 million in the six months ended September 30, 2001 to R549
million in the six months ended September 30, 2002. Our share of Vodacom's operating profit from other African operations was
R41 million in the year ended March 31, 2002 as compared to an operating loss of R16 million in the year ended March 31, 2001
and an operating profit of R3 million in the year ended March 31, 2000.
The following table sets forth customer data for Vodacom's mobile communications networks in its other African operations as
of the dates specified.
Six months
Year ended March 31,
ended September 30,
Six months
2001/2000
2002/2001
2002/2001
2000
2001
2002
% change
% change
2001
2002
% change
Other African countries
Customers (thousands) (at period end)
1
12
104
306
766.7
194.2
164
540
229.3
Lesotho . . . . . . . . . . . . . . .
12
22
57
83.3
159.1
30
92
206.7
Tanzania . . . . . . . . . . . . . .
-
82
228
-
178.0
134
306
128.4
Democratic Republic of the Congo
-
-
21
-
-
-
142
-
Penetration (%) (at period end)
2
Lesotho . . . . . . . . . . . . . . .
n/a
n/a
1.0
n/a
-
n/a
n/a
n/a
Tanzania . . . . . . . . . . . . . .
n/a
n/a
1.1
n/a
-
n/a
n/a
n/a
Democratic Republic of the Congo
n/a
n/a
0.3
n/a
-
n/a
n/a
n/a
ARPU
3
Lesotho (ZAR) . . . . . . . . . . .
n/a
n/a
144
n/a
n/a
n/a
87
n/a
Tanzania (USD) . . . . . . . . . .
n/a
31
27
n/a
(12.9)
n/a
23
n/a
Democratic Republic of the Congo
(USD)
. . . . . . . . . . . . . . . .
n/a
n/a
n/a
n/a
n/a
n/a
22
n/a
1
Customer totals are based on the total number of customers registered on Vodacom's network, which have not been disconnected, including
inactive customers, as of end of the period indicated.
2
Penetration is calculated based on ITU Telecommunications Indicators as of December 31, 2001.
3
ARPU is calculated by dividing the average monthly revenue during the period by the average monthly total reported customer base during the
period. ARPU excludes revenue from equipment sales, other sales and services and revenue from national and international users roaming on
Vodacom's networks.
120
Lesotho
Vodacom owns an 88.3% interest in Vodacom Lesotho (Pty) Limited, a company incorporated in the Kingdom of Lesotho.
Vodacom Lesotho's network was commercially launched in May 1996 and has 35 base stations as of September 30, 2002.
Vodacom Lesotho's license has a term of 15 years with 14 years remaining. Vodacom Lesotho's cumulative capital expenditures
through September 30, 2002 were R158 million.
As of March 31, 2002, Vodacom Lesotho was the sole mobile operator in Lesotho, however, the fixed-line operator in Lesotho,
Lesotho Telecommunications Corporation, was recently issued the second mobile communications license in Lesotho and
commenced operations in April 2002.
In November 2000, the Privatization Unit of Lesotho and the Sekha-Metsi Consortium Ltd, a company incorporated in the
United Republic of Tanzania, entered into an agreement pursuant to which the Sekha-Metsi Consortium Limited acquired Lesotho
Telecommunications Corporation's 11.7% interest in Vodacom Lesotho. Vodacom Lesotho had a R25 million money market loan
from Vodacom as of September 30, 2002.
Tanzania
Vodacom owns a 65% interest in Vodacom Tanzania Limited, a company incorporated in the United Republic of Tanzania, while
Planetel Communication Limited, a company incorporated in Tanzania, owns a 16% interest, and Caspian Construction Proprietary
Limited, a company incorporated in Tanzania, owns a 19% interest. Vodacom Tanzania has a 15 year license to operate a GSM
network in Tanzania, which became effective on December 21, 1999. The roll-out of the network commenced in March 2000 and
the commercial launch of the network occurred in August 2000 and there are 257 base stations as of September 30, 2002. Vodacom
Tanzania became the largest mobile communications network operator in Tanzania within one year of launching. Vodacom
Tanzania's cumulative capital expenditures through September 30, 2002 were $115 million.
Tanzania has four other mobile operators, Mobitel, Tritel, Celtel, the existing fixed-line operator's mobile subsidiary, and Zantel.
Zantel operates exclusively on the island of Zanzibar.Vodacom Tanzania had a $65 million non-recourse secured project loan, of
which $47 million was drawn as of September 30, 2002.
Democratic Republic of the Congo
In November 2001, Vodacom, together with Congolese Wireless Network s.p.r.l. a company incorporated in the Democratic
Republic of the Congo, formed Vodacom Congo (R.D.C.) S.P.R.L., a company incorporated in the Democratic Republic of the
Congo. Vodacom owns a 51% interest in Vodacom Congo, while Congolese Wireless Network owns the remaining 49% interest in
Vodacom Congo. Congolese Wireless Network s.p.r.l. had a limited existing network in the Democratic Republic of the Congo.
Although Vodacom has a majority voting interest in Vodacom Congo, the other shareholders have certain approval and veto rights
granting them joint control over the joint venture. Vodacom is ultimately responsible for the funding of the operations of Vodacom
Congo for the first three years pursuant to its shareholders agreement . Vodacom Congo's network was relaunched under the
Vodacom brand in May 2002. Vodacom Congo has 18 years remaining on its license. Vodacom Congo had 108 base stations as of
September 30, 2002. Vodacom Congo is financing its roll-out in the Democratic Republic of the Congo with vendor financing and
equity contributions and is seeking to obtain non-recourse project finance. Vodacom Congo's cumulative capital expenditures
through September 30, 2002 were $91 million.
Mozambique
Vodacom acquired a 98% interest in Vodacom Mozambique (VM S.A.R.L.), a company incorporated in Mozambique. In August
2002, Vodacom Mozambique was awarded a 15 year national public land mobile network service license. Vodacom Mozambique is
currently seeking to enter into interconnection agreements with local operators in Mozambique and does not intend to commence
service in Mozambique unless commercially acceptable terms are agreed. Mozambique has only one existing mobile
communications network operator, M-Cell, the existing fixed-line operator's mobile subsidiary. Vodacom currently owns a 98%
interest in Vodacom Mozambique, while Empresa Mocambicana de Telecommunications SARL, a company incorporated in
Mozambique, owns the remaining 2% interest.
Properties
Vodacom's principal executive offices are located at Vodacom Corporate Park, 082 Vodacom Boulevard, Vodavalley, Midrand,
1683, Republic of South Africa. Vodacom's properties primarily consist of three corporate offices, 5,199 base transceiver stations,
217 base station controllers, 23 mobile switching centers, a network management center and a customer service center. The total
area of all of Vodacom's properties, excluding its network and retail outlets, was 153,571 square meters as of March 31, 2002,
consisting of 94,448 square meters of owned properties and 59,123 square meters of leased properties. Vodacom's leases expire at
various times ranging from one month to 14 years.

121
Vodacom leases transmission lines from us under a lease agreement for the provision of its backbone infrastructure.
Employees
The following table sets forth the number of Vodacom's employees including contractors and temporary employees as of the
dates indicated.
As of March 31,
As of September 30,
Six months
2001/2000
2002/2001
2002/2001
2000
2001
2002
% change
% change
2001
2002
% change
South Africa . . . . . . . . . . . . . .
4,048
4,102
3,984
1.3
(2.9)
4,384
3,845
(12.3)
Other African . . . . . . . . . . . . .
43
170
369
295.3
117.1
201
397
97.5
Total
1
. . . . . . . . . . . . . . . . .
4,091
4,272
4,353
4.4
1.9
4,585
4,242
(7.5)
1
Includes 423, 553 and 96 total temporary employees as of March 31, 2002, 2001 and 2000, respectively, and 140 and 335 total temporary
employees as of September 30, 2002 and 2001, respectively.
Vodacom is committed to providing equal opportunities to all of its employees and has developed an employment equity policy
that is available to all employees. Vodacom's employees' participation in unions was 5.5% as of March 31, 2002. Vodacom believes
that the relationship between its management and its employees and labor unions is good.
Procurement
Vodacom solicits bids for all goods and services in excess of R1 million. Bids are by invitation only. A multi-disciplinary cross-
functional team evaluates and awards bids to the best supplier based on the best overall value, taking into account technical
solutions, delivery time, price and the participation of black economic empowerment partners.
Vodacom seeks to utilize at least two suppliers for all critical equipment where possible to minimize supply risk. Vodacom's
main technology suppliers are Siemens, Alcatel and Motorola.
122
LEGAL PROCEEDINGS
On May 7, 2002, the South African Value-added Network Services Providers' Association, or VANS Association, lodged a
formal complaint with the Competition Commission under the South African Competition Act, 89 of 1998, alleging that Telkom
was abusing its leading position in contravention of the Competition Act, 89 of 1998, and that it was engaged in price
discrimination. The Competition Commission has requested Telkom to respond to the various issues raised by the VANS
Association in order to assist the Commission in the investigation of these allegations. The complaints relate to Telkom's refusal to
provide new telecommunication facilities or threatening to cease providing existing facilities on its fixed-line network to certain
value-added network service providers and that such refusal or threat constitutes anti-competitive conduct in contravention of the
Competition Act, 89 of 1998. If these complaints are upheld, Telkom could be required to pay damages to the complainants.
Telkom cannot assess the amount of such claims or whether any of the complainants would be able to substantiate any losses.
Telcordia instituted arbitration proceedings against Telkom in March 2001 before a single arbitrator of the International Court of
Arbitration, operating under the auspices of the International Chamber of Commerce, which is seated in Paris, France. The seat of
the arbitration is in Johannesburg, South Africa. Telcordia is seeking to recover approximately $130 million for monies outstanding
and damages, plus interest at a rate of 15.5% per year. The arbitration proceedings relate to the cancellation of an agreement entered
into between Telkom and Telcordia during June 1999 for the development and supply of an integrated end-to-end customer
assurance and activation system by Telcordia. In September 2002, a partial ruling was issued by the arbitrator in favor of Telcordia.
Telkom has launched review proceedings in the South African High Court in respect of this partial ruling, which have been
scheduled for a hearing during August 2003. Telcordia petitioned the United States District Court for the District of Columbia to
confirm the partial ruling, which petition Telkom has resisted. A hearing date for this petition has not as of the date of this
prospectus been set. The arbitration proceedings and the amount of our liability are not expected to be finalized until late 2003 or
early 2004. Telkom has provided R373 million for its estimate of probable liabilities, including interest, in respect of the Telcordia
claim in the Telkom Group's consolidated financial statements as of September 30, 2002. Telkom is currently unable to predict the
amount that it may eventually be required to pay Telcordia. If Telcordia were able to recover substantial damages from Telkom,
Telkom would be required to fund such payments from cash flows or drawings on its existing credit facilities, which could cause its
indebtedness to increase and its net profit to decline.
We are parties to various additional proceedings and lawsuits in the ordinary course of our business, which our management do
not believe will have a material adverse impact on us.
123
REGULATION AND LICENSE REQUIREMENTS
Regulation
We are primarily subject to the South African Telecommunications Act, 103 of 1996, the regulations promulgated under that Act
and the various licenses issued to us. Many of these regulations are relatively new and are subject to amendment and finalization as
the telecommunications industry is further developed and liberalized. We cannot predict the outcome or timing of any amendments
or modifications to the applicable regulations or their interpretation or the impact on us. In some instances, final regulations have
not yet been promulgated.
Overview
Prior to 1991, the South African Department of Posts and Telecommunications functioned as the exclusive telecommunications
and postal enterprise in the Republic of South Africa rendering telecommunications services over a public switched
telecommunications network under the Post Office Act, 44 of 1958. The Postmaster-General acted as regulatory authority for all
issues relating to both the telecommunications services and postal services. In 1991, the Minister of Posts and Telecommunications
incorporated two companies to succeed the telecommunications and postal enterprises of the then Department of Posts and
Telecommunications and we were incorporated as the successor of the telecommunications enterprise. The Postmaster-General and
the Department of Posts and Telecommunications, however, retained general regulatory functions and continued to regulate the
telecommunications industry until the Telecommunications Act, 103 of 1996, came into effect in 1996. On September 30, 1993,
under the regulatory regime of the Postmaster-General, the Department of Posts and Telecommunications and the Post Office Act,
44 of 1958, Vodacom and MTN were issued two national mobile cellular telecommunications licenses. These licenses were the first
major commercial licenses granted to direct competitors of Telkom.
In 1996 and 1997, the Telecommunications Act, 103 of 1996, totally overhauled the legislative and regulatory framework of the
telecommunications industry in South Africa, replaced virtually all the telecommunications provisions of the Post Office Act, 44 of
1958, established the South African Telecommunications Regulatory Authority (which was replaced in 2000 by ICASA when the
South African Telecommunications Regulatory Authority and the Independent Broadcasting Authority were merged) and vested it
with almost all regulatory functions relating to the telecommunications and broadcasting industries, including a major role in the
issuance of telecommunications licenses. However, certain types of licenses, including licenses for public switched telecommunications
services, mobile cellular telecommunications services, national long distance and international telecommunications services, may
not be issued or even applied for without a prior public invitation by the Minister of Communications setting out the criteria for the
issuance. These licenses can only be granted by the Minister of Communications on recommendation from ICASA. In addition, the
Telecommunications Act, 103 of 1996, gives the Minister of Communications authority to grant licenses using alternative methods
such as by way of auction or tender.
The former Department of Posts and Telecommunications is now known as the Department of Communications. The office of
the Postmaster-General no longer exists and the head of the Department of Communications is now known as the Director-General.
The Director-General does not, however, have any regulatory powers under the Telecommunications Act, 103 of 1996. Under the
Telecommunications Act, 103 of 1996, the Minister of Communications has a policy-making role, entitling her to issue policy
directions consistent with the objectives of the Telecommunications Act and giving her the ability to issue invitations to apply for
the above-mentioned licenses and the granting thereof.
The Telecommunications Act, 103 of 1996, deemed us to be the holder of a public switched telecommunications license, a
value-added network services license and a radio spectrum license, issued under the Telecommunications Act, 103 of 1996, which
enable us to continue providing the telecommunications services we provided prior to commencement of the Telecommunications
Act, 103 of 1996. On May 7, 1997, we were issued with a formal written public switched telecommunications services license, a
value-added network services license and a radio frequency spectrum license under this new regulatory regime. We operate under
these licenses today.
In 2001, the Telecommunications Act, 103 of 1996, was substantially amended in order, among other things, to facilitate and
regulate the introduction of competition in the telecommunications sector of the Republic of South Africa. The Telecommunications
Act, 103 of 1996, now makes provision for the issue of an additional license to provide public switched telecommunications
services to a second national operator and for the issue of additional licenses to small business operators to provide
telecommunications services in areas with a teledensity of less than 5%. These processes have already commenced and ICASA has
indicated that it expects to issue these licenses in 2003 or early 2004. At the close of the application process, two applications for
the second national operator had been received. The amended Telecommunications Act, 103 of 1996, provided for the issue of an
international carrier of carriers license and a multimedia license to Sentech Limited that were issued in May 2002. The relevant
amendments introduce the possibility of further competition from May 2005 should the Minister of Communications, after
conducting a feasibility assessment, determine that one or more additional public switched telecommunications services licenses
should be awarded. As a further measure to liberalize the South African telecommunications sector and to increase competition, the
Telecommunications Act, 103 of 1996, after these amendments also now expressly provides that the second national operator,
Telkom, Vodacom and MTN will be entitled to obtain a license to use radio frequency spectrum in the 1800 MHz band and
spectrum for the provision of third generation services. Cell C's existing license already includes the right to use radio frequency
spectrum in the 1800 MHz band. Finally, the amended Telecommunications Act, 103 of 1996, requires the introduction of carrier
124
pre-selection by the end of 2003 and number portability by 2005. ICASA has also indicated that it intends to license global mobile
personal communications services in 2003 or later and to conduct a feasibility study on the licensing of a fourth mobile cellular
operator in 2004 or later.
Regulatory authority
In 2000, the Independent Communications Authority of South Africa Act, 13 of 2000, created ICASA, a new regulatory body
for the telecommunications and broadcasting industries. ICASA took over all functions of the dissolved South African
Telecommunications Regulatory Authority and the Independent Broadcasting Authority, which previously acted as regulator of the
telecommunications and the broadcasting industries, respectively. Deriving its powers from the Telecommunications Act, 103 of
1996, the Independent Communications Authority of South Africa Act, 13 of 2000, and the Independent Broadcasting Authority
Act, 153 of 1993, ICASA currently serves as the primary regulatory and licensing authority for the South African communications
industry, except with respect to those specific licenses that can only be granted by the Minister of Communications. In respect of
these specific licenses, ICASA is empowered to evaluate license applications made in response to invitations issued by the Minister
of Communications and to make recommendations to the Minister of Communications, who is vested with the final power to issue
the licenses. Upon its establishment, ICASA inherited a legacy of regulatory problems from its predecessors. It has been reported
that ICASA may currently lack adequate resources to effectively fulfill its regulatory and licensing functions and to deal with
regulatory challenges that continue to change given the rapidly evolving telecommunications environment.
Policy directions and regulations
The Telecommunications Act, 103 of 1996, entitles the Minister of Communications, after a public comment period, in
consultation with ICASA and after referral to Parliament for comment, to issue and publish policy directions consistent with the
objectives of the Telecommunications Act, 103 of 1996, from time to time. Once such policy directions have been issued, ICASA is
obliged to perform its regulatory and other functions in accordance with such directions. In addition, the Telecommunications Act,
103 of 1996, entitles ICASA to make regulations, drafts of which must, except where the public interest otherwise requires, first be
published in the Government Gazette for public comment before final regulations can be prescribed and published in the
Government Gazette by the Minister of Communications.
Under South African law, it is possible for licensees such as Vodacom and Telkom and for other interested parties to have the
regulations and rulings issued by ICASA reviewed and tested in a court of law for compliance with the objectives and other
provisions of the Telecommunications Act, 103 of 1996, and other relevant laws such as the South African Constitution. Such
review proceedings take place before an impartial court of law.
The Telecommunications Act, 103 of 1996, is not entirely clear on a number of issues which are expected to be dealt with by
regulation. In addition, because ICASA was only established in 2000 and the regulations governing the telecommunications
industry in the Republic of South Africa are evolving, lack clarity in a number of areas and are still subject to interpretation, review
and amendment there is some degree of regulatory uncertainty for Telkom and Vodacom.
The regulatory process entails a public comment process which, in light of the politicized issue of the privatization of industries
such as telecommunications in the Republic of South Africa, makes the outcome of the process uncertain and may cause delays.
Interconnection
The Telecommunications Act, 103 of 1996, establishes the general conditions for interconnection among licensed operators.
In particular, the Telecommunications Act, 103 of 1996, guarantees the right of any licensed operator to interconnect with operators
licensed to provide public switched telecommunication services, including the second national operator. The Telecommunications
Act, 103 of 1996, empowers ICASA to prescribe guidelines as to the terms and conditions of interconnection agreements which
must be negotiated between the parties and it confers on ICASA powers to intervene and propose, or even to set its own terms and
conditions where the parties are unable to reach an agreement or the agreed terms are not consistent with the relevant guidelines.
Any terms and conditions of an interconnection agreement set by ICASA are binding between the parties.
In 2000, ICASA issued, and the Minister of Communications approved and promulgated, interconnection guidelines, which
stipulate, among other things, that certain operators may be declared to be "Public Operators", that certain operators may be
declared to be "Major Operators", and that certain telecommunication services may be declared to be "Essential Services". A Major
Operator must provide Essential Interconnection Services to Public Operators at the Long Run Incremental Cost, or LRIC, of those
facilities.
Supplementary interconnection guidelines, approved by the Minister of Communications, were issued by ICASA in 2002. These
guidelines declare Telkom to be a Major Operator, its interconnection services to be Essential Services and the second national
operator, the mobile cellular operators and the underserviced area licensees to be Public Operators. The guidelines further prescribe
that the Essential Services must be made available at the Fully Allocated Cost of those services for the first two years, where after
LRIC based interconnection prices will become mandatory.
125
The public comment process for draft supplementary interconnection guidelines relating to interconnection with the
underserviced area licensees was recently completed. These draft guidelines are currently before ICASA for ICASA approval
before they are formally presented to the Minister of Communications for signature. In current form, the draft guidelines envisage
an asymmetrical interconnection regime between Telkom and the underserviced area licensees, with a terminating tariff differential
of at least 30% in favor of these licensees. These draft guidelines do not make any specific reference to cost based pricing, but
being supplementary in nature it may be that cost based pricing will be addressed as part of the overall interconnection regulatory
regime.
The interconnection agreements between Telkom and Vodacom and MTN that preceded the Telecommunications Act, 103 of
1996, were renegotiated and amended in 2001. An interconnection agreement, on substantially the same terms, was negotiated and
concluded with Cell C at the same time. These interconnection agreements with Vodacom and MTN are now completely separated
from the agreements for the supply of telecommunication facilities, which used to be dealt with as part of the interconnection
agreement and which have also been renegotiated.
Facilities leasing
As in the case of interconnection, the Telecommunications Act, 103 of 1996, establishes the general conditions for the leasing of
telecommunications facilities. The Telecommunications Act, 103 of 1996, guarantees the right of licensed operators to obtain
telecommunications facilities from operators licensed to provide public switched telecommunication services, including the second
national operator, and it empowers ICASA to prescribe guidelines for facilities leasing agreements. It confers on ICASA powers to
intervene and propose, or even to set its own terms and conditions where the parties are unable to reach an agreement or where the
agreed terms are not consistent with the relevant guidelines, regulations or the Telecommunications Act, 103 of 1996. Any terms
and conditions of a facilities leasing agreement set by ICASA are binding between the parties.
In addition, the Telecommunications Act, 103 of 1996, requires us to allow the second national operator to use all of our
telecommunications facilities for the first two years of its license, on a resale basis, for the purpose of providing public switched
telecommunication services. We may also be required under the Telecommunications Act, 103 of 1996, to lease or otherwise make
our telecommunications facilities available to the second national operator for the provision of services, other than public switched
telecommunications services, during the first two years of its license and beyond. It is unclear whether this shared access relates
only to the provision of public switched telecommunication services by the second national operator during such two years or to
other services as well, although the guidelines issued by ICASA may be interpreted to deal with such other services as well. It is
also unclear whether we will be required to allow shared access to the second national operator at LRIC-based prices beyond such
two year period in respect of other services, although the guidelines issued by ICASA may be interpreted to prescribe that beyond
the two year period, LRIC prices will become mandatory as described below.
In 2000, ICASA issued, and the Minister of Communications approved, facilities leasing guidelines, which stipulate, among
others, that certain operators may be declared to be "Public Operators," that certain operators may be declared to be "Major
Operators" and that certain telecommunication facilities may be declared to be "Essential Facilities." A Major Operator must
provide Essential Facilities to Public Operators at LRIC of those facilities.
Supplementary facilities leasing guidelines were issued by ICASA and approved and promulgated by the Minister of
Communications in 2002. These guidelines declare us to be a Major Operator and the mobile cellular operators and the
underserviced area licensees to be Public Operators. The guidelines list a set of Telkom's facilities that are declared to be Essential
Facilities. Among those essential facilities is shared access to the local loop by the second national operator for the first two years
of its license. The guidelines further prescribe that the Essential Facilities must be made available at the Fully Allocated Cost of
those facilities for the first two years and thereafter LRIC based prices will become mandatory. Sentech Limited has applied to the
South African High Court for an order seeking to set these supplementary facilities leasing guidelines aside on the basis of procedural errors.
ICASA has filed a notice of no opposition to this application. As a result, there is a risk that the guidelines will be remanded back to ICASA
for further deliberations and ICASA and the Minister will be required to recommence the process of declaring which operators are Major
Operators and which are Public Operators and which facilities are Essential Facilities. We cannot predict the outcome of this matter and
it is difficult to assess what impact, if any, it will have on us and our business.
Tariffs
The Telecommunications Act, 103 of 1996, and regulations made under the Act impose a price cap formula on a basket of specified
services that we previously had the exclusive right to provide, including installations; prepaid and postpaid line rental; local, long
distance and international calls; fixed-to-mobile calls; public payphone calls; ISDN services; our Diginet product; and our Megaline
product. Prices on these services are filed with ICASA for approval. Revenue from these services may not be used to subsidize other
products and services. Currently, the overall tariffs for all services in the basket may not be increased by more than 1.5% below
inflation in South Africa, based on the consumer price index and measured using revenue for the services in the basket at constant
volumes for the prior year. In addition, prior to January 1, 2003, the price of any individual product or service included in the basket
could not be increased by more than 20% above inflation in South Africa in any year. Effective January 1, 2003, the price of any
individual product or service included in the basket may not be increased by more than 5% above inflation in South Africa in any year.
126
In December 2002, as a result of an out of court settlement, ICASA approved our tariff filing providing for a 9.5% increase in the
overall tariffs for all services in the basket effective January 1, 2003, based on the increase in the consumer price index for September
2002 of 12.5%. Inflation in South Africa was 5.7% in the year ended December 31, 2001 and 5.4% in the year ended December 31,
2000.
Pursuant to its mobile cellular telecommunications license, Vodacom has to lodge all tariff plans or any amendments to existing
tariff plans with ICASA. No increase in the price of any service or in some cases, a basket of services, greater than the percentage
annual increase in the consumer price index is allowed without ICASA's approval.
Universal service obligations
As part of our five year exclusivity period ended May 7, 2002, we had the following universal service obligations for our
fixed-line business:
to build 2.69 million new access lines, including 1.67 million lines in underserviced areas;
to connect 3,204 villages; and
to install 120,000 payphones.
We substantially met all of our fixed-line service and line roll-out targets with the exception of our residential fault rate target,
our aggregate fixed-line roll-out target and targets which required us to provide service to underserviced villages and to replace
analog lines with digital lines. We elected not to roll-out lines in our last year of exclusivity where it was not economical to do so.
As a result we missed our line-roll-out target by 16,448 lines. Our license required us to pay penalties for missing these license
targets. Based on the previous requirements contained in our existing license, we estimate the total penalties for failing to meet
these targets to be approximately R15 million. This amount is subject to review by ICASA. We do not currently anticipate that we
will have any additional fixed line roll-out targets.
Our public switched telecommunications license requires us to provide basic voice telephone service to every person in South
Africa who requests such service, who can afford it and who enters into a contract with us for such service, and to install, connect,
maintain and repair a telephone to use such service, and provide access to emergency organisations and directory information
services. However, we are not required to provide the foregoing services where ICASA determines that the demand for such
services can be met by other means and, as a result, it would be unduly burdensome in the circumstances for us to provide the
telecommunications service requested.
The Minister of Communications issued a public statement in 2002 describing our future obligations to assist in the continued
development of communications services to the South African population. The obligation will be a contribution to the Universal
Service Fund, or USF, and ongoing universal service obligations imposed on us through the generic terms of our license. Draft
regulations governing contributions to the universal service fund have been forwarded to the Minister by ICASA for signature. If
the Minister signs the draft regulations in their current form, 0.2% of revenue from regulated public switched telecommunications
services licenses and 0.2% of revenue from mobile cellular licenses will be required to be paid to the universal service fund. New
social obligations may be imposed with new licenses, such as 1800MHz licenses and third generation technology licenses.
Vodacom's mobile cellular telecommunications license contains an obligation that required Vodacom to provide 22,000
community services, or public access, telephones in underserviced areas by June 1, 1999, which Vodacom satisfied. Approximately
30,000 community service telephones were in service as of September 30, 2002. One type of deployment, the transportable, is
being phased out; however, the number of telephones will not be allowed to fall below the required levels. Vodacom's future
universal service obligations will also consist of a contribution to the USF, and possible new universal access obligations.
Regulatory accounts
Under the Telecommunications Act, 103 of 1996, and our public switched telecommunications service license, we are required
to report and account to ICASA our retail and wholesale activities using a specific accounting methodology set out in a Chart of
Accounts and Cost Allocation Manual, or COA/CAM. The adoption of this methodology by us requires the aggregation and
disaggregation of general ledger accounts in a different manner than we normally do. It also requires a reconciliation of the
accounts. We were required to put the necessary accounting and management information systems, which would have enabled us to
prepare such reports and accounts, in place by May 7, 2002, subject to ICASA issuing the COA/CAM regulations. The regulations,
however, were only published on July 19, 2002. The regulations require the first submission of our regulatory financial statements
to take place by September 30, 2003. However, the regulations also recognize the burden placed by the reporting requirements on
operators and adopt a phased implementation approach. Accordingly, we may make written submissions to ICASA setting out the
steps to be taken, work involved and proposed timeframes to implement systems to comply with the reporting obligations of the
regulations, after which ICASA will inform us in writing of the timeframes for complying with the reporting obligations. These
regulations also require us to develop a procedures manual that sets out how we will implement the COA/CAM accounting
methodology in practice, which manual must be reviewed and approved by ICASA. To date, no COA/CAM procedures manual has
been so approved by ICASA. In accordance with the timing of the introduction of this reporting requirement, we are in the process
of preparing a COA/CAM manual. ICASA will have to approve the manual that we prepare, which may take up to two years and
may require us to incur costs and expenses.
127
Carrier pre-selection
Telkom is required to phase in carrier pre-selection, with call-by-call override capabilities, by not later than December 31, 2003.
It is unlikely that we will be able to comply with this requirement in the required timeframe. Carrier pre-selection will be made
available as and when the second national operator is capable of doing so. The timing of the implementation of carrier pre-selection
is dependent on when the second national operator is licensed and the second national operator's interconnection systems and the
inter-operator processes and systems to support carrier pre-selection become available, which may not occur until after December 31,
2003. Regulations indicate that the system set-up costs will be recovered as part of the prescribed annual review of fees and
charges, but no further detail is available. We are currently engaged with ICASA to define the manner in which such costs could be
recovered. Slamming, which is the transfer of a user from one operator to another without such user's knowledge or authorization,
is to be prohibited. There is a risk that the procedure to combat slamming may not be effective and would result in further market
share losses. Carrier pre-selection is not applicable to mobile cellular operators.
Number portability
The Telecommunications Act, 103 of 1996, mandates that number portability enabling customers to retain their fixed-line and
mobile telephone numbers if they switch between fixed-line operators and between mobile cellular operators will be introduced in
2005. The draft guidelines published by ICASA in relation to number portability in 2001 have been withdrawn. The set-up and
per-operator costs are typically the largest cost components of implementing number portability. Similar to carrier pre-selection,
there is a risk of not fully recovering system set-up costs.
Unbundling the local loop
Given that the only existing public fixed-line network is operated by us under our license, and that Vodacom, MTN and Cell C
each operate independent mobile communications networks, there are no rules dealing specifically with equal and unbundled access
to shared resources.
While the Telecommunications Act, 103 of 1996, currently provides that we will not be required to unbundle our local loop for a
period of two years after the issue of the second national operator's license, it is envisioned that as the industry is further
liberalized, operators such as us with existing facilities and access lines, will be obliged to make these available to new entrants.
The second national operator will be entitled to lease our telecommunications facilities for a period of two years after being
licensed. Furthermore, although it is not our interpretation, the relevant provisions may be interpreted that the second national
operator may have shared access to the local loop, which is understood to mean access to the higher bandwidth for xDSL
applications beyond such two years.
The above is an exception to the generic provision that the local loop will not be unbundled during the first two years of the
second national operator's license.
Licenses
Fixed-line telephone services
Public switched telecommunications services
On November 15, 1996, we were deemed to be the holder of a license to provide public switched telecommunication services
under the Telecommunications Act, 103 of 1996, and on May 7, 1997, we were issued a written license by the Minister for Posts,
Telecommunications and Broadcasting to provide public switched telecommunications services in South Africa for a minimum
validity period of 25 years, which included our exclusivity period of five years ended May 7, 2002. Under this license we are
authorized to provide, among other things, the following:
national long distance telecommunications services;
international telecommunications services;
local access telecommunication services;
public pay telephone services;
fixed-lines, infrastructure and facilities required to provide the above services;
telecommunications facilities to be used by any person for the provision of value-added network services;
telecommunications facilities comprising fixed-lines to be used by operators for the provision of mobile communications
services and any other telecommunications services;
telecommunications facilities to be used by any person for the provision of any private telecommunications network, with the
exception of certain private telecommunications networks situated on a single piece of land or two or more contiguous pieces
of land owned by the same person, or maintained by Transnet or Eskom as authorized under the Telecommunications Act,
103 of 1996;
connection to our network of any other licensed telecommunications system or service both in and outside of South Africa;
and
conveyance of signals to and from telecommunications systems and equipment connected to our network, together with any
switching or other services incidental to such conveyance.

128
Additionally, we are entitled under the Telecommunications Act, 103 of 1996, to manufacture, sell, supply, distribute and
maintain certain telecommunication facilities and equipment, including customer premises equipment and software, provided that
ICASA consents to the commercial marketing, distribution or sale of such facilities or equipment.
Furthermore, the 2001 amendment to the Telecommunications Act, 103 of 1996, provides for fixed-mobile services to be
deemed a new public switched telecommunications service that may be provided with a public switched telecommunications
service license or an underserviced area license. A fixed mobile service is a service that permits a customer of the licensee to access
the public switched telecommunications network of the licensee and obtain telecommunications services from such licensee from
either a fixed point or while in motion within the local exchange area, but does not permit or include call handover between cells.
Our public switched telecommunications service license has not yet been amended to include fixed-mobile services and it is not
expected that it will be so amended until a license is issued to a second national operator.
The license fee payable by us under this license amounts to 0.1% of our annual revenues generated from the provision of the
licensed public switched telecommunications services.
Our public switched telecommunications services license may be revoked by ICASA if we repeatedly fail to comply with an
order made by ICASA pursuant to the Telecommunications Act, 103 of 1996, and fail to correct the non compliance within 90 days
of being requested to comply, or if we are placed in final liquidation or under a provisional or final judicial management order. Our
license required us to pay penalties for missing the service quality and line-rollout targets contained in our license. Based on our
current license, we estimate the total penalties for failing to meet these targets to be approximately R15 million. This amount is
subject to review by ICASA.
The following table sets forth certain information relating to service quality and line roll-out targets under our public switched
telecommunications services license for the exclusivity period ending May 7, 2002.
Target
Actual
Service quality targets
Faults per 1,000 lines: Business . . . . . . . . . . . . . . . . . . . . . . . . .
370
288
Faults per 1,000 lines: Residential . . . . . . . . . . . . . . . . . . . . . . . .
390
528
Faults cleared within 48 hours: Business (%) . . . . . . . . . . . . . . . . . .
86
96
Faults cleared within 48 hours: Residential (%) . . . . . . . . . . . . . . . . .
78
94
Service of public payphones
Coin telephones . . . . . . . . . . . . . . . . . . . . . . . . . . . . . . . . . .
90
95
Card telephones . . . . . . . . . . . . . . . . . . . . . . . . . . . . . . . . . .
95
98
Business orders met within 28 days . . . . . . . . . . . . . . . . . . . . . . .
90
97
Business orders met within 90 days . . . . . . . . . . . . . . . . . . . . . . .
98
99.85
Residential orders met within 28 days
. . . . . . . . . . . . . . . . . . . . .
80
95
Residential orders met within 120 days . . . . . . . . . . . . . . . . . . . . .
98
99.79
Line roll out targets
Lines, excluding payphones . . . . . . . . . . . . . . . . . . . . . . . . . . .
2,690,000
2,673,522
Payphones . . . . . . . . . . . . . . . . . . . . . . . . . . . . . . . . . . . .
120,000
132,990
Areas with a teledensity of less than 5% . . . . . . . . . . . . . . . . . . . . .
1,676,000
1,787,968
Priority customers . . . . . . . . . . . . . . . . . . . . . . . . . . . . . . . .
20,246
25,577
Villages . . . . . . . . . . . . . . . . . . . . . . . . . . . . . . . . . . . . . .
3,204
2,699
Replacement lines . . . . . . . . . . . . . . . . . . . . . . . . . . . . . . . .
1,252,000
159,666
We are also obliged to publish our charges and the manner which we adopt for determining those charges in respect of the
various telecommunication services provided by us. Provision is also made for the protection of customer confidentiality and other
information that we receive from our customers in the course of providing telecommunication services to them. Bills to our
customers must reflect the type of service, the units for which charges are made, and at a minimum, the starting time of each
connection, the number called and the duration and number of units for each call. Our records must identify for customers the basis
for the amount charged for the use of our services and we are required to retain such information to allow ICASA the ability to
have an independent quality assurance check done that the billing process complies with the aforesaid requirements.
Our license also requires us to establish efficient procedures, taking into account predominant regional languages and to provide
assistance to customers with complaints during normal business hours. Our procedures for dealing with customer complaints must
include a procedure for referring any disputes relating to such complaints to an affordable independent arbitration procedure instead
of a court. Finally, we are required, in consultation with ICASA, to prepare and publish a code of practice that duly takes account
of predominant regional languages, giving guidance to our customers in respect of any disputes with and complaints from such
customers relating to the provision of telecommunication services.
129
ICASA has indicated that they may seek to review and possibly amend the terms of our public switched telecommunications
services license in 2003/2004. It is not clear whether this will in fact happen or, if ICASA does seek to do so, to what extent
ICASA will seek to impose new service and installation targets in our public switched telecommunications services license or
impose additional obligations on us. However, under our existing license, such a review and amendment can, in some instances,
only be effected through a public comment process with our participation and, in other instances, only with our consent. We cannot,
however, predict the outcome of such contemplated review.
Other licenses
On November 15, 1996, we were deemed to be the holder of a license to provide value-added network services under the
Telecommunications Act, 103 of 1996, and on May 7, 1997, we were issued a written license by the Minister for Posts,
Telecommunications and Broadcasting to provide value-added network services on a non-exclusive basis for a period of 25 years.
Our value-added network service license may be revoked by ICASA if we repeatedly fail to comply with an order made by
ICASA and fail to correct the non-compliance within 90 days, or if we are placed in final liquidation or under a provisional or final
judicial management order.
On February 21, 1997, we were deemed to be the holder of a radio frequency spectrum license to provide telecommunication
services and facilities, and on May 7, 1997, we were issued a written license by the Minister for Posts, Telecommunications and
Broadcasting to use the relevant bands of radio frequency spectrum. We use the radio spectrum for the provision of fixed links
within our network, both land based and satellite, and for wireless local loop applications. Where these bands were licensed to us
on a shared or non-exclusive basis, ICASA is to ensure that any other licenses issued to other entities do not create harmful
interference with our use of the radio frequency spectrum. Our use of the radio frequency spectrum is subject to our compliance
with the relevant provisions of international telecommunications conventions, the radio regulations and the International
Telecommunications Union radio regulations agreed to or adopted by the Republic of South Africa. We are only authorized to use
our assigned frequency bands for the provision of public switched telecommunication services.
Our radio frequency spectrum license may be revoked by ICASA if we repeatedly fail to comply with an order made by it and
fail to correct the noncompliance within 90 days of being requested to comply, or if we are placed in final liquidation or under a
provisional or final judicial management order. Additionally, our radio frequency license will terminate if our public switched
telecommunication services license is terminated.
Under the Telecommunications Act, 103 of 1996, each of Vodacom, MTN, Cell C, Telkom and the second national operator will
all be entitled to apply for, and acquire, licenses for the use of 1800MHz radio frequency spectrum and radio frequency spectrum
for the provision of third generation services in the near future. However, the amount of spectrum that will be licensed and the fees
that will be required to obtain the 1800 MHz radio frequency spectrum and radio frequency spectrum for the provision of third
generation services have not yet been determined.
Our subsidiary Swiftnet has been granted a telecommunications license and a radio frequency spectrum license providing for:
the authorization of Swiftnet to construct, maintain and operate a national wireless data network and to provide wireless data
telecommunication services; and
the interconnection with our network.
Under our interconnection agreement with Swiftnet, we must charge Swiftnet those tariffs recommended by ICASA and
approved by the Minister of Communications.
Mobile cellular telephone services
On September 30, 1993, a multiparty implementation agreement was concluded between us, Vodacom, MTN, the Postmaster-
General and the South African Government dealing with the licensing of Vodacom and MTN. On the same date, Vodacom was
issued with a mobile cellular telecommunications license for a validity period of 15 years.
On July 1, 1997, Vodacom was deemed to be the holder of a license to provide mobile cellular telecommunications services in
accordance with the Telecommunications Act, 103 of 1996, subject to the terms and conditions of the written mobile cellular
telecommunications license issued by the Postmaster-General and the multiparty implementation agreement, and on August 19,
2002, Vodacom was, in terms of the Telecommunications Act, 103 of 1996, issued a written mobile cellular telecommunications
service license by the Minister of Communications and ICASA, incorporating the terms and conditions of the original license and
agreement, subject to certain legislatively mandated changes. Under this license, Vodacom is authorized to construct, maintain and
use its public land mobile communications network for the provision of mobile cellular telecommunications services, and to
interconnect with our public switched telecommunications network and the public land mobile communications networks of other
licensed mobile cellular telecommunications service providers. ICASA will soon be amending Vodacom's license to authorize
interconnection with the second national operator, Sentech Limited and other public operators.
An initial license fee of R100,000,000 was payable by Vodacom and an ongoing license fee of 5% of Vodacom's audited net
operational income generated from the provision of the licensed services is payable by Vodacom quarterly in arrears.
130
The mobile cellular telecommunications license may be revoked by ICASA, with the approval of the Minister of
Communications, if Vodacom agrees thereto, or if Vodacom is placed in liquidation or under judicial management, or if there is a
change in the direct or indirect ownership of 25% of the issued voting share capital of Vodacom in any one transfer or a change in
the ownership of any of the issued voting share capital of Vodacom that results in a change to the composition of one-quarter of
Vodacom's board of directors, in either case without ICASA's prior written approval, or if Vodacom takes steps to deregister itself
or if it is deregistered, or if Vodacom fails to pay the required license fee after due demand by ICASA.
Vodacom's use of its public land mobile communications network is authorized for the provision of a GSM based national
mobile cellular telecommunications service and the connection of fixed and mobile terminal equipment using GSM cellular
telephony technology. For the duration of this license, Vodacom's network must conform to the GSM specification standards and
recommendations of the International Telecommunications Union as adopted by South Africa, as well as with the GSM
specifications set by the European Technical Standards Institute, or ETSI. ICASA is in the process of amending Vodacom's license
to authorize dual band GSM900/1800 operation, consistent with recent legislative provisions mandating that ICASA grant
1800MHz spectrum to Vodacom upon application, which has been made.
Vodacom was required to comply with service and installation targets that were set forth in the terms of its mobile cellular
telecommunications license and to maintain the lines so installed. Vodacom's license required it to install and thereafter to maintain
22,000 community service telephones in rural and previously disadvantaged communities or areas by June 1, 1999 and to provide
network coverage to 60% of the South African population within two years, and 70% within four years. In addition, one of the
conditions to Vodacom's license was a requirement that it generate R1 billion of economic activity over ten years. All license
requirements were achieved by Vodacom within or prior to the required time periods.
Vodacom's mobile cellular telecommunications license requires Vodacom to provide facilities to enable a caller, free of charge,
to communicate with an emergency organization as swiftly as practicable and sets out certain customer service standards with
which Vodacom is required to comply. This license also requires Vodacom to use reasonable endeavors to ensure that certain
information is kept confidential. Vodacom is obliged to provide directory services and to liaise with other licensees in that regard.
Vodacom and its service providers are not entitled to show any undue preference to any person or class of person and Vodacom
must develop, publish and enforce guidelines for use by its personnel when handling inquiries and complaints from customers to
whom it supplies telecommunications facilities. These guidelines must be included in its contracts with service providers and must
be published and available to customers. Vodacom's license prescribes that the guidelines must address the following areas of the
provision of customer services:
procedures for handling customer complaints;
the time frame for handling customer complaints through such procedures;
further recourse available to a customer who is dissatisfied with Vodacom's complaint handling procedures;
procedures adopted by Vodacom to check the accuracy of a customer's telephone account;
procedures to be adopted by Vodacom to assist customers in disaster situations; and
availability to customers of quality of service information relating to Vodacom's network services.
Vodacom was also issued a radio frequency spectrum license simultaneously with its mobile cellular telecommunications license
permitting it to use the 890.2/935.2MHz to 900.0/945.0MHz radio frequency spectrum for purposes of providing mobile cellular
telecommunications services, valid for the duration of Vodacom's mobile telecommunications license of fifteen years. Vodacom was
also granted a license effective July 1, 1995 for the use of an additional 2x1MHz of GSM900 radio frequency spectrum under its
mobile cellular telecommunications license. Pursuant to the Telecommunications Act, 103 of 1996, the three mobile cellular
licensees were given the right, upon application, to be granted licenses to use 1800MHz frequency spectrum on payment of fees as
determined by the Minister. In certain cases, these are existing users of this spectrum so that it may be necessary to clear the
1800MHz frequency spectrum before it can be licensed. The Act envisaged that unless the Minister extended the May 30, 2002
deadline for applications, the spectrum would be issued by the end of June 2002. The Minister did not extend the May 30, 2002
deadline. Vodacom applied on May 30, 2002, but has not yet been licensed. In addition, there has been some delay in determining
the fees to be paid for the 1800MHz spectrum. However, it is expected that this will be completed in the near future, and that the
frequency spectrum licenses will be issued.
Vodacom was also issued a license to provide value-added network services on October 20, 1998. This license is a temporary
license and is valid until three months after the promulgation of final regulations applicable to value-added network services by
ICASA. To date, final regulations relating to value-added network services have not been promulgated. As a result of the
uncertainty surrounding the regulatory regime applicable to value-added network services, ICASA adopted the practice of issuing
temporary value-added network services licenses, valid up until three months after promulgation of final value-added network
services regulations. This would allow final licenses to be issued incorporating the relevant regulations. Licensees will be required
to reapply for licenses to provide value-added network services once final regulations are issued.
In addition, Vodacom was granted a temporary test license on July 9, 2002 to use 2 x 125MHz of the 1800MHz radio frequency
spectrum and to construct, maintain and use radio stations for purposes of this test license. The license is valid until three months
after November 10, 2002. A second test/experimental license for a further three months until February 9, 2002 was granted to
Vodacom. Vodacom may erect, maintain and operate 447 sites anywhere in Gauteng and 5 sites in Stellenbosch using the 1800MHz
radio frequency spectrum for test purposes pursuant to this license. Vodacom may not carry commercial traffic on these sites while
testing.
131
Vodacom is obliged to keep and maintain statistics on complaints made to it by its customers. The statistics must be provided to
ICASA at least once every six months, and ICASA may, after consultation with Vodacom, publish these statistics.
Ownership restrictions
Pursuant to the ownership regulations issued under the Telecommunications Act, 103 of 1996, Telkom is a public switched
telecommunications services licensee operating in a "concentrated market," which is a market where there are fewer than five
licensees. Pursuant to these regulations, no person who holds a direct or indirect 5% ownership interest in Telkom, other than the
Government of the Republic of South Africa and passive institutional investors who do not participate in our management, is
entitled to hold a 5% or greater ownership interest in any other licensed operator providing the same category of
telecommunications services as Telkom in that concentrated market, such as the second national operator. The same position applies
in relation to a person holding such an ownership interest in both Vodacom and another mobile cellular telecommunications service
licensee. In addition, licensees such as Telkom and Vodacom are required to maintain accurate and detailed records indicating the
name, address, telephone number, e-mail address and other contact details of all persons holding a direct or indirect ownership
interest of 5% or more in the licensee, the number of shares or other ownership interests owned of record by each such person, the
identity of each such person entitled to vote and the like and must annually file such information with ICASA. ICASA is entitled, at
the request of the licensee, to waive the licensee's obligations with respect to maintaining certain of the information where the
licensee's issued share capital is listed on the JSE or any other internationally recognized securities exchange and the information is
not kept in the ordinary course with respect to such listed issued share capital and is not otherwise required by such exchanges.
Under the same regulations, licensees such as Telkom and Vodacom are required to obtain the prior written approval of ICASA,
in an application that is signed by the licensee, the transferor and the transferee, for any transfer of a control interest in the licensee.
A control interest in a licensee includes a direct or indirect:
beneficial ownership of more than 25% of the issued share capital of that licensee;
entitlement to vote a majority of the votes that may be cast at a general meeting of that licensee;
ability to appoint or veto the appointment of a majority of the directors of that licensee;
holding company of that licensee; or
ability to direct or cause the direction of the management and policies of that licensee in a way similar to the foregoing.
The criterion to be used by ICASA in considering the application is whether the licensee will be able to satisfy its obligations
under its licenses and comply with the Telecommunications Act, 103 of 1996, and the regulations thereunder after the transfer
concerned. Any transfer in violation of these regulations is void.
Other regulatory issues
We are subject to the provisions of the Competition Act, 89 of 1998, which, together with the Telecommunications Act, 103 of
1996, regulates uncompetitive behavior in the communications industry in South Africa. The Competition Commission and ICASA
have come to an arrangement regarding jurisdictional issues existing between the two regulations. Under the provision of these two
Acts, we may not act uncompetitively or unjustly discriminate against any customer.
The Republic of South Africa is a member of the World Trade Organization and is a signatory to the Basic Agreement on
Telecommunications.
The Interception and Monitoring Prohibition Act, 127 of 1992, requires Telkom, Vodacom and other licensees to install
equipment and put in place procedures that would allow certain agencies of the Government of the Republic of South Africa to
intercept and monitor communications over our respective networks and to retain records and copies of such communications for a
prescribed period of time. Telkom's and Vodacom's compliance with this requirement will require Telkom and Vodacom to increase
capital and operational expenditure.
In certain South African judgments, we have been regarded as an organ of state. In addition, some legislation, notably the South
African Promotion of Administrative Justice Act, 3 of 2000, have provisions that identify us as rendering a public service. As a
result, some decisions that would otherwise be normal business decisions in other listed companies need to go through a
consultative process with the Government before we can make them.
Finally, our subsidiary Swiftnet is required, in terms of its license, to have at least 30% of its shares held by historically
disadvantaged individuals or entities. In accordance with such requirement, a black economic empowerment investor acquired a
30% equity stake in Swiftnet subject to its ability to raise the necessary funding to pay for the interest. We reacquired this 30%
stake, thus placing Swiftnet in breach of its license requirement. ICASA has required Swiftnet to remedy the breach of its license. If
not remedied, there is a risk of Swiftnet's license being revoked.

132
MANAGEMENT
Directors and executive officers of Telkom
The management of Telkom is vested in its board of directors which currently consists of 14 directors. Telkom's new memorandum
and articles of association, which will become effective on the JSE listing date, specify that its board of directors shall be reduced to
11 members. The Government has requested that Wendy Luhabe, Dr. Dilija Mji and Colin Smith resign before the JSE listing date in
order to reconstitute the board upon the listing date.
In accordance with Telkom's new articles of association, the Government and Thintana Communications are entitled to appoint
directors based on the percentage of the issued ordinary shares owned by them. See "Description of Shares" beginning on
page 154 of this prospectus. Based on the expected ownership percentages of the Government and Thintana Communications following
the global offering, each of the Government and Thintana Communications will, pursuant to Telkom's new articles of association, be
entitled to appoint five directors, including two executive directors to Telkom's board of directors.
Telkom's new articles of association provide that the chief executive officer shall be an executive director nominated and appointed at
least every three years by the board of directors, after consultation with each of the Government and Thintana Communications, for so
long as they are significant shareholders, as more fully described under "Description of Shares - Significant shareholder" on page 154 of
this prospectus. The chief executive officer is the most senior executive of the company and the exercise of his authority is subject to the
authority and direction of the board of directors.
Telkom's shareholders in a general meeting are entitled to appoint that number of directors, if any, as are not appointed by the
Government or Thintana Communications or the board of directors. The shareholders in a general meeting are not entitled to fill a vacancy
of a director appointed by either the Government or Thintana Communications. If, as of the eighth anniversary of the JSE listing date, the
class A ordinary share and class B ordinary share have not otherwise been converted into ordinary shares under the terms of Telkom's new
articles of association, they will be so converted and the rights of the Government and Thintana Communications as holders of the class A
ordinary share and class B ordinary share, respectively, including their rights to appoint members of Telkom's board of directors will,
pursuant to Telkom's new articles of association, be terminated.
Under the new shareholders' agreement between the Government and Thintana Communications, the parties are obligated to use their
reasonable efforts to identify and appoint directors from members of historically disadvantaged groups in order to achieve a composition
of the board that is representative of the demographics of the Republic of South Africa, provided that Thintana Communications is entitled
to appoint two directors in its sole discretion. The parties further agreed that, to the extent the total number of directors appointed by them
by virtue of their respective ownership of the class A ordinary share and the class B ordinary share is less than eleven, the balance of the
directors, other than the chief executive officer, shall comprise independent directors. The Government and Thintana Communications will
form a committee to nominate the remaining independent directors to the board for so long as they are significant shareholders, as more
fully described under "Relationship with Major Shareholders - Shareholder arrangements - New shareholders' agreement" beginning on
page 145 of this prospectus. To the extent that the committee cannot agree on nominations for independent directors, then the Government
and Thintana Communications are entitled to nominate a number of independent directors in proportion to their relative shareholding. The
nominations will then be voted upon by all of Telkom's shareholders in a general meeting in the normal course. The Government and
Thintana Communications have agreed that they will exercise their voting rights in favor of any independent director nominated in
accordance with the new shareholders' agreement.
Pursuant to Telkom's new articles of association, the board of directors is required to meet at least once every two months. The
following are Telkom's directors as of the date of this prospectus. All of Telkom's directors are citizens of the Republic of South Africa
unless otherwise indicated.
Directors
Year of
Year of
Name
birth
Business address
Position
Term of office
appointment
Nomazizi Mtshotshisa
1
1944
9th Floor, Fedsure Building,
Chairperson of
3 years
2002
13 Fredman Drive, Sandton,
the Board
South Africa
Non-executive
director
Jonathan Paul Klug, Sr.
2, 3
1956
230 Blackjack Oak,
Non-executive
Indefinite
2003
San Antonio, Texas
director
America
Wendy Luhabe
1
1957
98 7th Avenue,
Non-executive
3 years, extended
1997
Melville, Johannesburg,
director
for a further three
South Africa
years in 2000
Tan Sri Dato' Ir.
1941
2nd Floor, Wisma Telekom,
Non-executive
Indefinite
1999
Muhammad Radzi
Jalan Pantai Baharu,
director
Mansor
2, 4
59672 Kuala,
Lumpur, Malaysia
Shawn McKenzie
2, 3
1958
Telkom Towers North,
Chief Operating
Indefinite
2002
152 Proes Street,
Officer, executive
Pretoria, South Africa
director
Richard Menell
1
1955
56 Main Street,
Non-executive
3 years
2000
Johannesburg,
director
South Africa

Year of
Year of
Name
birth
Business address
Position
Term of office
appointment
Dr. Diliza Mji
1
1953
16 Medical Towers,
Non-executive
3 years
2000
162 Old Main Road,
director
Isipingo, South Africa
Peter Moyo
1
1962
Old Mutual Park,
Non-executive
3 years
2001
Jan Smuts Drive,
director
Pinelands, Cape Town,
South Africa
Sizwe Nxasana
1957
Telkom Towers North,
Chief Executive
3 years, extended
1998
152 Proes Street,
Officer,
for a further three
Pretoria, South Africa
executive director
years in 2001
Tlhalefang Sekano
5
1959
26 Baker Street,
Non-executive
3 years
2001
Rosebank, Johannesburg,
director
South Africa
Colin Smith
5
1956
9th Floor,
Non-executive
3 years, extended
1997
Arcadia Centrum,
director
for a further three
Corner of Beatrix and
years in 2000
Vermeulen Streets,
Pretoria, South Africa
Chian Khai Tan
2, 4
1950
Telkom Towers North,
Chief Strategic
Indefinite
2002
152 Proes Street,
Officer,
Pretoria, South Africa
executive director
Charles Valkin
2
1934
9th Floor,
Non-executive
3 years, extended
1997
Twin Towers West,
director
for a further three
Sandton City, Sandton,
years in 2002
South Africa
Themba Vilakazi
1
1946
4th Floor, IS Building,
Non-executive
3 years
2002
158 Jan Smuts Avenue,
director
Rosebank, Johannesburg,
South Africa
1
Government representative
2
Thintana Communications representative
3
American
4
Malaysian
5
Employee representative
Nomazizi Mtshotshisa has served as the chairperson of the board since August 1, 2002. In addition, she has been an executive
director of Admiral Industries (Proprietary) Limited since 1999. Prior to 1999, she was an executive director at Vula
Communications Holdings (Proprietary) Limited, an investment company, from July 1997 to October 1999. In the past five years,
she has served as executive director of Vula Communications Holdings (Proprietary) Limited; partner and chairperson of Maluti
Resources (Proprietary) Limited (Mining); chairperson of Midi TV (Proprietary) Limited (eTV); a director of the Industrial
Development Corporation of South Africa Limited, Mossgas (Proprietary) Limited, Soekor (Proprietary) Limited; a chairperson of
Khumama Mining (Proprietary) Limited; and has held a trusteeship of the Chris Hani Baragwanath Reconstruction Trust. Ms.
Mtshotshisa holds a Bachelor of Arts degree from the University of South Africa.
Jonathan Paul Klug, Sr was appointed to the board on January 10, 2003. He has been the vice president - finance-
international of SBC Communications since May 2002. Prior to May 2002, Mr Klug served as chief financial officer - Bell Canada
for SBC Communications from May 2000 until May 2002, as vice president - partner channels and alliances of SBC
Communications from October 1999 until May 2000, as president - Arkansas of Southwestern Bell Telephone from December
1998 to October 1999 and as managing director - corporate development of SBC Communications from June 1993 until November
1998. He is currently a director of Belgacom S.A. and ADSB Telecommunications B.V. In the past five years he has served as a
director of Manitoba Telecom Services Inc. and Bimcor Inc. He holds a Bachelor of Business Administration degree from the
University of Notre Dame and a Masters in Business Administration degree from St Louis University.
Wendy Luhabe was appointed to the board on April 29, 1997. Ms. Luhabe has worked as an entrepreneur since 1992 in various
fields encompassing human resources management and development, women investment institutes and asset management.
Previously, she worked for ten years in marketing management in South Africa, Germany and the United States.
Ms. Luhabe is a director and the chairperson of Vodacom, the Industrial Development Corporation of South Africa Limited, the
International Marketing Council and Alliance Capital Management (Proprietary) Limited. In the past five years, she has served as a
director of Cycad Financial Holdings Limited, the Southern Africa Fund Incorporated (New York) and Tiger Brands Limited. She
holds a Bachelor of Commerce degree from the University of Lesotho and has attended various management and leadership
development programs.
133
Tan Sri Dato' Ir. Muhammad Radzi Mansor was appointed to the board on October 23, 1999. Mr. Mansor was a consultant
and advisor to Multimedia Development Corporation from April 1997 to June 2000. Mr. Mansor was appointed chairperson of
Telekom Malaysia in July 1999. He currently serves as a director of TM International Sdn Bhd, Menara Kuala Lumpur Sdn Bhd,
TM Cellular Sdn Bhd, Telekom Multi-Media Sdn Bhd and Universiti Telekom Sdn Bhd. In the past five years, he has served as
chairman of the tender and finance committee of the Telekom Multi-Media Sdn Bhd, chairman of Fiberail Sdn Bhd, chairman of
Telekom Smart School Sdn Bhd, chairman of TM International Leasing Incorporated, director of Radzi-San Enterprise Sdn Bhd,
chairman of MTN Network (Pte) Ltd, Sri Lanka, chairman of TMI Mauritius Limited, director of Sotelgui sa (Societe Des
Telecommunication De Guinee), director of Telekom Networks Malawi Limited and director of Thintana Communications.
He holds an Engineering diploma from Faraday Engineering College and a Master of Science degree in Technological Economics
from Stirling University.
Shawn McKenzie was appointed chief operating officer on July 12, 2002. Prior to joining Telkom he was the president - Texas,
Southwestern Bell Telephone Company, a subsidiary of SBC Communications, from June 2001 until July 2002. Mr. McKenzie also
served as president - Kansas, Southwestern Bell Telephone from October 1997 until June 2001. Prior to 1997, Mr. McKenzie served
in a variety of marketing, technical and external affairs positions for Southwestern Bell Telephone Company since joining SBC
Communications in 1979. He is currently a director of Vodacom Group (Proprietary) Limited. He has a Bachelor of Science degree in
Business Administration and Political Science from the College of the Ozarks and he serves on the College's Board of Trustees.
Richard Menell was appointed to the board on July 1, 2000. He has been chairman of Anglovaal Mining since June 2002.
Prior to June 2002, he was the chief executive officer and deputy chairman of Anglovaal Mining (Proprietary) Limited since
January 1997. Mr. Menell is the deputy chairperson of the South African Tourism Board and a trustee of the South African
National Business Trust. Mr Menell is a director of more than 30 companies in South Africa and elsewhere, both private and public.
These directorships include appointments to the boards of Avgold Limited, The Standard Bank of South Africa Limited and Mutual
and Federal Insurance Company Limited. Mr. Menell holds a Bachelor of Arts with honors from Stanford University, a Master of
Science degree in Natural Sciences from Stanford University and a Master of Arts degree in Geology, Mineral Explorations and
Management from Trinity College, Cambridge, England.
Dr. Diliza Mji was appointed to the board on July 1, 2000. Dr. Mji is a consultant general and pediatric surgeon in private
practice at the University of Natal, Nelson Mandela School of Medicine, where he has been practicing medicine since January
1980. Dr. Mji is a senior lecturer at the University of Durban Westville in Durban. Dr. Mji is also a director of Alvis South Africa
(Proprietary) Limited, McCarthy BUSA Toyota (Proprietary) Limited, Dynamic Global Defense Technologies (South Africa)
(Proprietary) Limited, Elgin Brown and Hamer (Proprietary) Limited and Group Five Trans Africa (Proprietary) Limited. In the past
five years, he has served as a director of British Aerospace (South Africa), the Industrial Development Corporation of South Africa
Limited, Thebe Health Care (Proprietary) Limited, Coastal Group Limited, Logtek Holdings (Proprietary) Limited, Armaments
Corporation of South Africa Limited, Phelindaba Skills Institute Airborne Trust, Durban Institute of Technology (Proprietary)
Limited and The New Housing Company (Association incorporated in terms of section 21). He holds a Bachelor of Medicine
degree and a Bachelor of Surgery degree from the University of Natal and is a Fellow of the College of Surgeons in South Africa.
Peter Moyo was appointed to the board on September 19, 2001. He has been the deputy managing director of Old Mutual Life
Assurance Company (South Africa) Limited since September 2000. Prior to September 2000, Mr. Moyo held the position of
executive general manager of Old Mutual Life Assurance Company Limited (South Africa) from September 1998 until August of
2000. From September 1997 until June 1998 he held the position of divisional manager of Old Mutual Life Assurance Company
(South Africa) Limited and from June 1998 until August 1998 he held the position of general manager. Mr. Moyo was a partner at
Ernst & Young, Registered Accountants and Auditors, Chartered Accountants (SA), until August of 1997. In the past five years, he
has served as a director of Yabeng Investment Holding Company Limited, Bulawayo Electrical Supplies (Proprietary) Limited,
Jobco - The Business Trust (Association incorporated in terms of section 21), Old Mutual Life Assurance Company (South Africa)
Limited, Old Mutual Asset Managers (Namibia) (Proprietary) Limited, Old Mutual Health Insurance Limited, Old Mutual
Healthcare (South Africa) (Proprietary) Limited, Old Mutual Holdings (Namibia) (Proprietary) Limited, Old Mutual Life Assurance
Co (Namibia) Limited, Old Mutual Life Assurance Company (Zimbabwe) Limited, Old Mutual Life Holdings (South Africa)
Limited, Old Mutual Unit Trust Management Company (Namibia) Limited, Old Mutual Portfolio Holdings (Namibia) (Proprietary)
Limited, Omiopl (No. 3) (Proprietary) Limited, the Life Office's Association of South Africa and the Old Mutual (South Africa)
Foundation. He holds a Bachelor of Commerce (Honors) degree from the University of South Africa (association incorporated in
terms of Section 21), and a Higher Diploma in Tax Law from the University of the Witwatersrand, and is a Chartered Accountant
(South Africa).
Sizwe Nxasana was appointed chief executive officer on April 1, 1998. Prior to joining Telkom in March 1998, he was the
national managing partner for Nkonki Sizwe Ntsaluba Inc. from June 1996 to March 1998. He is a member of the Income Tax
Special Court and a director of Vodacom Group (Proprietary) Limited, the South African Revenue Service Board, Business Against
Crime - South Africa (Association incorporated in terms of Section 21), Zenex 1995 Trust and Zenex Foundation and was, in the
past five years, a director of Co-ordinated Network Investments (Proprietary) Limited. He holds a Bachelor of Commerce degree
from the University of Fort Hare and a Bachelor of Accounting Science (honors) degree from the University of South Africa and is
a Chartered Accountant (South Africa).
Tlhalefang Sekano was appointed to the board on September 19, 2001. He has been the executive chairperson of the
Communication Workers Investment Company since 1996. He is also a director of Ucingo Investments (Proprietary) Limited. In the
past five years, he served as president of the Communications Workers' Union, director of Union Alliance Media Limited and
Nextcom Cellular (Proprietary) Limited and chairperson of Letlape Group (Proprietary) Limited.
134

Colin Smith was appointed to the board on April 29, 1997. He has been the executive president of the South African
Communications Union since 1996. He is a member of the board of trustees of the Telkom Retirement Fund and has served
as managing director of the Member Benefits Management Group since 2000.
Chian Khai Tan was appointed chief strategic officer on July 1, 2002. Prior to joining Telkom, he was senior vice president,
consumer and business sales at Telekom Malaysia from February 2001 to June 2002, general manager special project focus group at
Telekom Malaysia from June 1998 until October 2000 and general manager, major business sales at Telekom Malaysia from April
1997 until May 1998. In the past five years, Mr. Tan has served as a director of Citifon Sdn Bhd and Telkom Publication Sdn Bhd,
both subsidiaries of Telekom Malaysia. Mr. Tan is a director of Vodacom Group (Proprietary) Limited and TMI Mauritius Limited.
He holds a Bachelor of Engineering (honors) degree from the University of Liverpool.
Charles Valkin was appointed to the board on April 23, 1997. He has been an attorney and is a senior partner with the South
African law firm of Bowman Gilfillan Inc. where he has worked since 1964. He currently serves as a non-executive director of
Reunert Limited. Mr. Valkin holds a Bachelor of Commerce degree, a Bachelor of Laws degree and a Higher Diploma in Taxation
from the University of the Witwatersrand.
Themba Vilakazi was appointed to the board on July 1, 2002. He has been the executive chairman of Scientific Resource
Management since July 1995. He is the founder and chairman of the South African Development Fund, Inc., located in Boston,
Massachusetts, which he managed from 1985 until 1996. He currently serves as chairman of Transponder Technologies
(Proprietary) Limited and Intenda (Proprietary) Limited; and a director of Scanco (Proprietary) Limited, Trust Marque (Proprietary)
Limited and Zamile Consulting (Proprietary) Limited. He holds a Bachelor of Science degree in Biology from Boston University.
Alternate directors
The following are alternate directors who have been appointed in accordance with Telkom's memorandum and articles
of association. Each of these alternate directors is entitled to act in the place and stead of his appointing director in all board
proceedings in which such appointing director is not present.
Year of
Year of
appointment
Name
birth
Business address
Position
as alternate
Anthony Lewis
1
. . . . . .
1958
Telkom Towers North,
Chief Financial Officer
1998
152 Proes Street,
and alternate director
Pretoria,
to Charles Valkin
South Africa
John Gibson
1
. . . . . . . .
1953
Telkom Towers North,
Group Executive - Corporate
2002
152 Proes Street,
Development and IPO
Pretoria,
and alternate director to
South Africa
Jonathan Klug
Dato' Md Khir . . . . . . .
1947
2nd Floor
Alternate director to Tan Sri
2001
Abdul Rahman
2
Ibupejabat Telekom Malaysia
Dato' Ir. Muhammad
Jalan Pantai Baharu
Radzi Mansor
50672 Kuala Lumpur
Malaysia
1
American.
2
Malaysian.
Anthony Lewis was appointed as chief financial officer of Telkom in September 2000. He joined Telkom in 1997 as executive
controller. Mr. Lewis has also served as the director of finance of SBC International Management Services Inc., a management
services company, since April 1997 and is a director of the American International School of Johannesburg. Prior to joining Telkom,
he served in various finance positions with SBC Communications since joining SBC Communications in 1984, including finance
director for one of SBC's regional wireless operations. He is a member of the American Institute of Certified Public Accountants,
holds a Bachelor of Science in Business Administration degree from the University of Arkansas and a Master of Business
Administration degree from the University of Texas at Austin. He is also a certified public accountant in the United States.
John Gibson was appointed as Group Executive - Corporate Development and IPO of Telkom in September 2002. Prior to
joining Telkom, he was a general attorney - international at SBC Communications Inc from April 1997 until May 2000 and general
attorney and assistant general counsel-mergers and acquisitions from May 2000 until September 2002. In the past five years he has
been an alternate director of Telmex and of TDC (TeleDanmark). He holds a Bachelor of Arts degree from the University of
Wyoming and a Juris Doctorate from the Washburn School of Law in Kansas.
Dato' Md Khir Abdul Rahman is a director and the chief executive of Telekom Malaysia and has served as an alternate
director of Telkom since May 2000. Prior to May 2000, he served as deputy chief executive/general manager of Malaysia
Electronics Payment System Sdn Bhd from October 1999 until May 2000, a director of Oriental Bank Bhd from September 1999
until April 2000 and as a managing director of Mejati Technologies Ltd from April 1996 until September 1999. He previously
served as a non-executive director of Technology Resources Industries and has held various senior positions at the Central Bank of
Malaysia. He is currently a director of Multimedia Development Corporation and Malaysian Industry - Government Group for
High Technology. He holds a Bachelor of Science degree in mathematics from the University of Malaya, Malaysia, a Masters in
Agricultural Development degree and a Doctorate of Science in Computing Statistics from the State University of Ghent, Belgium.
135

Executive officers
The following executive officers are responsible for various business and administrative departments:
Year of
Year of
Name
birth
Position
employment
Sizwe Nxasana
1
. . . . . . . . . . . . . . . . . .
1957
Chief Executive Officer
1998
Shawn McKenzie
1, 2, 3
. . . . . . . . . . . . . . .
1958
Chief Operating Officer
2002
Anthony Lewis
2, 3, 4
. . . . . . . . . . . . . . . .
1958
Chief Financial Officer
1997
Chian Khai Tan
1, 2, 5
. . . . . . . . . . . . . . . .
1950
Chief Strategic Officer
2002
Nombulelo Moholi . . . . . . . . . . . . . . . .
1960
Chief Sales and Marketing Officer
1994
Reuben September . . . . . . . . . . . . . . . .
1957
Chief Technical Officer
1977
1
Biographies set forth under "- Directors and executive officers of Telkom - Directors" beginning on page 132 of this prospectus.
2
Thintana Communications representative.
3
American.
4
Biography set forth under "- Directors and executive officers of Telkom - Alternate directors" on page 135 of this prospectus.
5
Malaysian.
The business address of each of Telkom's executive officers is Telkom Towers North, 152 Proes Street, Pretoria, South Africa.
Nombulelo Moholi was appointed as chief sales and marketing officer in April 2002. Ms. Moholi joined Telkom in 1994 as
general manager of payphones and became a group executive of regulatory affairs in March 1998 and managing executive of
international and special markets in 1999. Prior to joining Telkom, she worked for GEC and Siemens (South Africa). She is
chairperson of the South African Bureau of Standards and holds a Bachelor of Science degree in Electrical and Electronic
Engineering from the University of Cape Town.
Reuben September was appointed chief technical officer in May 2002. Prior to this appointment, he served as managing
executive of Technology and Network Services since March 1, 2000. He has worked in various engineering and commercial
positions in Telkom since 1977. He is a member of the Professional Institute of Engineers of South Africa (ECSA) and holds
a Bachelor of Science degree in Electrical and Electronic Engineering from the University of Cape Town.
There are no family relationships between any of Telkom's directors or executive officers.
Vodacom senior management
The following executive officers are responsible for various business and administrative departments:
Year of
Year of
Name
birth
Position
employment
Alan Knott-Craig . . . . . . . . . . . . . . . . .
1952
Chief Executive Officer of Vodacom
1993
Andrew Mthembu . . . . . . . . . . . . . . . .
1956
Deputy Chief Executive Officer of
1998
Vodacom and Managing Director of
Vodacom International Holdings (Pty) Ltd
Leon Crouse . . . . . . . . . . . . . . . . . . .
1953
Group Finance Director of Vodacom
1993
Shameel Aziz-Joosub . . . . . . . . . . . . . . .
1971
Managing Director of Vodacom Service
1994
Provider Company (Pty) Ltd
Pieter Uys . . . . . . . . . . . . . . . . . . . . .
1962
Managing Director of Vodacom (Pty) Ltd
1993
The business address of each of Vodacom's executive officers is Vodacom Corporate Park, 082 Vodacom Boulevard, Vodavalley,
Midrand, South Africa.
Alan Knott-Craig has served as a director and chief executive officer of Vodacom since October 1996. Prior to 1996,
Mr. Knott-Craig was the senior general manager of Mobile Communications at Telkom until 1993, when he left to form Vodacom.
Mr Knott-Craig is also a director of the following other companies within the Vodacom Group: Vodacom (Proprietary) Limited,
Vodacom Service Provider Company (Proprietary) Limited and Vodacom International Holdings (Proprietary) Limited.
Mr. Knott-Craig holds a Bachelor of Science degree in Electrical Engineering from the University of Cape Town and a Master of
Business Leadership degree from the University of South Africa. He was inducted as one of the eight Gold Members of the
GSM Association's 2001 inaugural "Roll of Honour."
Andrew Mthembu has served as a director since he joined Vodacom in January 1998 and was appointed as the deputy chief
executive officer of Vodacom in November 2001. Mr. Mthembu is also the Managing Director of Vodacom International Holdings
(Proprietary) Limited. Prior to 1998, Mr. Mthembu was managing director at Tolcon, a toll road concession company, from 1995
until December 1997. Mr. Mthembu holds a Bachelor of Science degree in Chemistry and Biology from the University of Botswana
and Swaziland, a Bachelor of Science degree in Civil Engineering from the University of Calgary, Canada and a Masters of Science
degree in Construction Management from the University of Reading, England.
136
Leon Crouse has served as a director and group finance director of Vodacom since October 1996. Prior to 1996, Mr. Crouse
served as Vodacom's general manager of Finance since Vodacom's inception in 1993. Leon Crouse is also a director of Vodacom
(Proprietary) Limited, Vodacom Service Provider Company (Proprietary) Limited and Vodacom International Holdings (Proprietary)
Limited. Mr. Crouse holds a Bachelor of Commerce degree and a Certificate in the Theory of Accounting from the University of
Port Elizabeth and completed his Chartered Accountant (South Africa) qualification in 1977.
Shameel Aziz-Joosub has served as a director and as the managing director of Vodacom Service Provider Company
(Proprietary) Limited since September 2000. Prior to September 2000, Mr. Joosub worked in Vodacom's finance department since
1994 and was Managing Director of Vodacom Equipment (Proprietary) Limited before merging it with Vodacom Service Provider
Company (Proprietary) Limited. Shameel Aziz-Joosub also serves as director of Vodacom Group (Proprietary) Limited. Mr. Joosub
holds a Bachelor of Commerce (Honors) degree from the University of South Africa and holds a Masters of Business
Administration degree from the University of Southern Queensland and is an Associated General Accountant (South Africa).
Pieter Uys has served as managing director of Vodacom (Proprietary) Limited since December 1, 2001 and as chief operating
officer of Vodacom (Proprietary) Limited since February 2001. Mr. Uys joined Vodacom as a member of Vodacom's initial
engineering team in 1993. Mr. Uys holds a Bachelor of Science degree in Engineering and a Masters in Engineering degree from
the University of Stellenbosch and a Master of Business Administration degree from the Stellenbosch Business School.
Reserved matters
Pursuant to Telkom's new articles of association, for so long as the Government is a significant shareholder, neither Telkom nor
any of its subsidiaries may take a number of corporate actions, or "reserved matters," in respect of Telkom or its subsidiaries unless
authorized by the board, if, and to the extent that, the matter is not within the scope of the exclusive powers and authority delegated
to the operating committee referred to below. In addition, the authorizing resolution of the board must have received the affirmative
vote of at least two directors appointed by the Government. The following are Government reserved matters:
-
the approval or amendment of Telkom's strategic objectives or those of any subsidiary;
-
any determination of or amendment to Telkom's management structure or schedule of authorizations granted by the board to
management;
-
prior to May 8, 2004, any determination by the board of directors with respect to the scope or revocation of the exclusive
powers and authority of the operating committee or the human resources review committee referred to below, and at any
time, the countermanding, amending or supplementing of any decision or action made or taken by the operating committee
or the human resources review committee before May 8, 2004;
-
the formation of any committee of, or the delegation of any authority to, such committee, by the board of directors, other
than as expressly set out in the new articles of association;
-
an increase or reduction in the issued share capital of Telkom or its subsidiaries;
-
any issue, conversion or allotment of shares or securities by Telkom or any subsidiary;
-
the approval or making of the dividend policy from time to time and the declaration or distribution of any dividends by
Telkom or by its subsidiaries;
-
any material change in Telkom's business or that of its subsidiaries;
-
the incurrence or assumption by Telkom of any indebtedness which would cause the debt/equity ratio of Telkom, or Telkom
Group on a consolidated basis, to exceed 1.00;
-
any merger or consolidation involving Telkom or any transfer of any of Telkom's assets or liabilities or those of its subsidiaries
where the consideration or purchase price, as the case may be, exceeds minimum thresholds;
-
the execution, amendment or termination of any contract between Telkom or its subsidiaries and any shareholder who owns
in excess of 10% of the ordinary shares, unless the Government has an interest in the contract in question that conflicts with
the interest of Telkom or the applicable subsidiary;
-
the establishment by Telkom of any subsidiary;
-
any change to the name under which Telkom or any subsidiary does business;
-
any change in Telkom's financial or tax year;
-
any winding-up or liquidation of Telkom or any of its subsidiaries;
-
after May 7, 2004 and subject to the audit and risk management committee's exclusive authority referred to below, the
appointment of Telkom's auditors insofar as the South African Companies Act, 61 of 1973, requires such appointment to be
made by directors;
-
any material alteration of the terms of any employee share ownership scheme approved by a general meeting; and
-
any change in the number of directors making up the board.
Pursuant to the new shareholders' agreement, if the Government agrees to be bound by an undertaking not to directly or
indirectly compete with Telkom's licensed business activities or those of its subsidiaries or Vodacom and divests itself of all
ownership interests that would constitute a violation of such non-compete undertaking, Thintana Communications and the
Government must give Telkom written notice, in which event the approval and amendment of business plans and annual budgets of
Telkom and its subsidiaries will, pursuant to Telkom's new articles of association, be included as additional Government reserved
matters.
For so long as Thintana Communications is a significant shareholder, neither Telkom nor any of its subsidiaries may take a
number of corporate actions, or "reserved matters," unless authorized by the board, if, and to the extent that the matter is not within
the exclusive powers and authority delegated to the operating committee referred to below. In addition, the authorizing resolution of
the board must have received the affirmative vote of a majority of the directors appointed by Thintana Communications. These
reserved matters include the Government reserved matters referred to above as well as the following:
137
-
the approval or amendment of any business plan or any annual budget of Telkom or any subsidiary;
-
the appointment, dismissal and replacement of members of management provided to Telkom by, or with Telkom's consent,
on behalf of, Thintana Communications, which is in breach of or otherwise than in accordance with the requirements of the
strategic services agreement referred to under "Relationship with Major Shareholders and Related Transactions - Shareholder
arrangements Strategic services agreement" beginning on page 148 of this prospectus;
-
establishing any new or materially amending any existing employee compensation policies or plans;
-
the approval of Telkom's annual financial statements and those of its subsidiaries;
-
any material change in the accounting policies of Telkom or any subsidiary, other than a change that brings Telkom's
accounting policies into conformity with IAS or Telkom's licenses;
-
the granting by Telkom or any of its subsidiaries of any guarantee or encumbrance not authorized in an annual budget which
exceed minimum thresholds;
-
the entering into by Telkom or any subsidiary of any single transaction or series of transactions that requires a payment in
excess of minimum thresholds unless Thintana Communications has a material interest in the transaction which conflicts with
Telkom's or any subsidiary's interest;
-
any transfer of, amendment to, or termination of, any telecommunications or broadcasting license held by Telkom or by its
subsidiaries;
-
the commencement or settlement by Telkom or - its subsidiaries of material litigation, unless Thintana Communications is a
party to, and has a conflicting interest in, such litigation;
-
Telkom or any subsidiary entering into an agreement that restricts their business;
-
any change in the financial or tax year of any subsidiary;
-
the incurrence or assumption by any subsidiary of any indebtedness that would cause the debt/equity ratio of that subsidiary
to exceed 1.00;
-
the commencement of any new business by Telkom or any of its subsidiaries; and
-
the establishment by Telkom or any subsidiary of Telkom of any subsidiary or any joint venture, partnership or similar
arrangement.
If, and to the extent that, any of the actions which are reserved matters are within the exclusive powers and authority granted to
the operating committee, such action may only be taken if authorized by the operating committee and the authorizing resolution
receives the affirmative vote of at least one operating committee member appointed by each of the Government and Thintana
Communications, for so long as they are significant shareholders.
Telkom's new articles of association provide that the articles relating to these reserved matters will fall away at the end of eight
years from the JSE listing date.
Thintana Communications may transfer the class B ordinary share and its ordinary shares, subject to certain restrictions. See
"Relationship with Major Shareholders and Related Transactions - Shareholder arrangements - New Shareholders' agreement"
beginning on Page 145 of this prospectus. If it transfers the class B ordinary share and sufficient ordinary shares to constitute the
transferee a significant shareholder, the transferee will acquire the rights Thintana Communications enjoyed in respect of the
reserved matters referred to above. If there is a subsequent transfer of the class B ordinary share and sufficient ordinary shares to
constitute the second transferee a significant shareholder, certain of these reserved matters will fall away. In any event, all the
reserved matters will fall away on the eighth anniversary of the JSE listing date.
Board committees
The board has, pursuant to Telkom's existing articles of association, established a number of standing committees that operate
within written guidelines established by the board. The following is a discussion of Telkom's board committees that will come into
effect pursuant to Telkom's new articles of association, which will replace Telkom's existing articles of association as of the JSE
listing date.
Operating committee
Telkom's new articles of association provide that Telkom shall have an operating committee until May 7, 2004. After May 7,
2004 the operating committee shall cease to exist and all of its powers and authorities shall revert to the board.
The term of the operating committee may be extended or the operating committee may be re-established if authorized by the
board as a reserved matter. See "- Reserved matters" beginning on page 137 of this prospectus.
The operating committee shall consist of five voting members and four non-voting members. Each of the Government and
Thintana Communications has the right, for so long as it is a significant shareholder, to appoint two voting and two non-voting
members and the fifth voting member is the chief executive officer. If either the Government or Thintana Communications ceases to
be a significant shareholder, the board is entitled to make the appointments to the operating committee that were previously made
by that significant shareholder.
Certain exclusive powers and authorities are conferred upon the operating committee, provided that these powers are revocable
in whole or in part by the board, as a reserved matter, at any time until May 7, 2004, when the operating committee is scheduled to
terminate, and any decisions or action made or taken by the operating committee pursuant to its executive powers and authorities
described below may also be revoked, amended or supplemented by the board as a reserved matter. See "- Reserved matters"
beginning on page 137 of this prospectus. The operating committee's exclusive powers and authorities include, among other things,
the following:
-
the preparation, review and recommendation to the board of Telkom's business plans and annual budgets and those of
Telkom's subsidiaries;
-
the implementation of any business plan or annual budget;
138
-
the implementation of all issues and matters relating to the achievement of Telkom's obligations under its licenses, including
network expansion, equipment procurement, tariff setting, customer service and marketing; and
-
the implementation of Telkom's management structure.
No action may be taken at any meeting of the operating committee, other than a decision to dissolve or adjourn the meeting,
unless the chief executive officer and at least one voting member of the operating committee appointed by each of the Government
and Thintana Communications is present.
Actions of the operating committee must be approved by a majority vote of its members. In the event of a tie, a voting member
appointed by the Government shall have a casting vote.
The following are the voting members of the operating committee as of the date of this prospectus:
-
Mr. Sizwe Nxasana, chairman;
-
Mr. Shawn McKenzie;
-
Mr. Reuben September;
-
Mr. Anthony Lewis; and
-
Ms. Nombulelo Moholi.
As of the date of this prospectus, the following are the non-voting members of the operating committee:
-
Mr. Chian Khai Tan; and
-
Mr. Kaushik Patel.
If at any time the class B ordinary share ceases to exist, the provisions of Telkom's new articles of association relating to the
operating committee will cease to be of any further force or effect. The class B ordinary share will be converted into an ordinary
share at the end of eight years from the JSE listing date or, if at any time before that, the holder of the class B share ceases to hold
at least 5% of Telkom's issued shares. See "Description of Shares - Significant shareholder" on page 154 of this prospectus.
No current member of the operating committee receives, nor will any member of such committee receive, after the JSE listing
date, any remuneration for his or her services as an operating comittee member.
Audit and risk management committee
Telkom's new articles of association provide that Telkom shall have an audit and risk management committee comprising at
least three non-executive directors, which will replace Telkom's existing audit committee. No member of the audit and risk
management committee may, other than in his or her capacity as a member of that committee, the board or any other committee of
the board, accept any consulting, advisory or other compensatory fee from Telkom or any subsidiary of Telkom or be an affiliated
person of Telkom, any subsidiary or any vendor of Telkom. Affiliated persons include, among others, any person owning or
controlling 5% or more of the issued and outstanding voting securities of Telkom and any officer, partner, co-partner or employee of
Telkom. The responsibilities of the audit and risk management committee include, among other things, the following:
-
having the exclusive authority to appoint or, insofar as that is not permitted by the South African Companies Act, 61 of 1973,
recommend for appointment, Telkom's auditors, determine their compensation and oversee their work;
-
resolving disagreements between Telkom's management and its auditors in regard to financial reporting;
-
establishing procedures for the treatment of complaints regarding accounting or auditing matters and for the confidential
anonymous submission by employees of concerns regarding questionable accounting or auditing matters;
-
having the authority to engage independent counsel and other advisors, as determined necessary to carry out its duties;
-
having the authority to make determinations with respect to payment of remuneration and other compensation to Telkom's
auditors for the purpose of rendering or issuing an audit report and to any advisors employed by the committee;
-
conducting internal audits;
-
reviewing the draft interim and final accounts;
-
reviewing and recommending changes to Telkom's statutory audit;
-
monitoring Telkom's internal accounting and auditing systems;
-
conducting a corporate governance audit; and
-
reviewing and monitoring Telkom's risk management performance and providing a high level risk assessment for the board
on an on-going basis.
The following are the members of Telkom's existing audit committee as of the date of this prospectus:
-
Mr. Peter Moyo, chairman;
-
Mr. Anthony Lewis; and
-
Mr. Viren Magan.
Telkom may be required to alter the composition of its audit and risk management committee in order to comply with the
Sarbanes-Oxley Act of 2002 depending on the outcome of final rule making in this area. See "- US Sarbanes-Oxley Act of 2002"
on page 144 of this prospectus. In addition, pursuant to Telkom's new articles of association, Messrs Anthony Lewis and Viren
Magan will be required to be removed from the audit and risk management committee as of the JSE listing date.
Human resources review committee
Telkom's new articles of association state that the board shall establish and maintain until May 7, 2004, or a later date
determined by the board as a reserved matter, a human resources review committee comprising at least seven members, including at
least three non-executive directors. Two members of the committee will be appointed by Thintana Communications.
The human resources review committee's exclusive powers and authorities include, among other things, the following:
-
recommending to the board, policy guidelines on human resource development; and
139

-
recommending to the board of directors, guidelines for affirmative action and empowerment programs and monitoring
compliance with those guidelines.
No action may be taken at a meeting of the human resources review committee, other than a decision to dissolve or adjourn the
meeting, unless a member of that committee appointed by Thintana Communications is present. Actions of the human resources
review committee must be approved by a majority vote of its members. In the event of a tie, the chairperson of the human resources
review committee shall have a casting vote.
As of the date of this prospectus, the human resources review committee and the remuneration committee are one combined
committee. The following are the members of Telkom's existing human resources review and remuneration committee as of the date
of this prospectus:
-
Ms. Nomazizi Mtshotshisa;
-
Mr. Sizwe Nxasana;
-
Mr. Shawn McKenzie;
-
Ms. Wendy Luhabe;
-
Tan Sri Dato' Ir Md Radzi Mansor;
-
Dr. Diliza Mji; and
-
Mr. Tlhalefang Sekano.
A chairperson has not been appointed to the human resources review committee.
Remuneration committee
Under Telkom's new articles of association, the board will establish a separate remuneration committee after the JSE listing
date. Telkom's remuneration committee must be chaired by the chairperson of the board and must include at least one member
appointed by Thintana Communications. The committee will review the terms upon which Telkom's executive directors and senior
managers are employed and compensated and upon which Telkom's non-executive directors and directors appointed by a general
meeting are compensated and will make recommendations to the board with respect to such matters.
Other committees
Telkom's new articles of association provide that the board may in its discretion establish other committees at any time. For so
long as the Government and Thintana Communications are significant shareholders, they are entitled to appoint at least one
representative each to serve as a full voting member of such committee.
Compensation of directors and executive officers
The following table sets forth in Rands, the cash and non-cash compensation, paid by Telkom to its executive and non-executive
directors in the year ended March 31, 2002:
Bonuses/
Board
performance
Directors
Basic
committee
related
Pension fund
Other
Name and position
fees
salary
fees
payments
contributions
benefits
Total
Executive director
Sizwe Nxasana
(Chief Executive Officer)
1,219,441
-
447,000
156,000
536,000
2,358,441
Non-executive directors
Dikgang Moseneke
1
-
-
-
-
-
-
70,000
70,000
Eric Molobi (Chairman)
2
8,596
-
9,260
-
-
130,000
147,856
Wendy Luhabe
43,560
-
9,130
-
-
-
52,690
Wendy Lucas-Bull
3
43,560
-
12,760
-
-
-
56,320
Richard Menell
43,560
-
4,000
-
-
-
47,560
Colin Smith
43,560
-
7,000
-
-
-
50,560
Tlhalefang Sekano
23,232
-
1,000
-
-
-
24,232
Charles Valkin
43,560
-
8,170
-
-
-
51,730
Peter Moyo
32,312
-
3,000
-
-
-
35,312
Diliza Mji
43,560
-
8,630
-
-
-
52,190
Tan Sri Dato'Ir Muhammad
Radzi Mansor
43,560
22,780
66,340
Sindy Zilwa
4
7,718
-
5,540
-
-
-
13,258
1
Mr. Moseneke resigned from the board in July 2001.
2
Mr. Molobi resigned from the board in July 2002.
3
Ms. Lucas-Bull resigned from the board in September 2002.
4
Ms. Zilwa resigned from the board in August 2001.
In addition, in the year ended March 31, 2002, Telkom paid SBC Communications R7,022,600 in respect of services rendered
by Thomas Barry, Telkom's former chief operating officer and one of its former executive directors, R7,022,600 in respect
140
of services rendered by Anthony Lewis, Telkom's chief financial officer and one of its alternate directors and paid R3,905,270
in respect of services rendered by Martin Kerckoff, a former alternate director and group executive. Telkom paid Telekom Malaysia
R3,601,700 in respect of services rendered by Mr. Shanmugam Manickham, Telkom's former chief strategic officer, and
R3,601,680, in respect of the services rendered by Mr. Joe Rajaratnam, a former alternate director and group executive.
In the year ended March 31, 2002, the aggregate consolidated compensation of Telkom's directors and executive officers, paid or
accrued, was R28 million.
In the year ended March 31, 2002, we set aside or accrued R759 million to provide pension, retirement or similar benefits for all
employees.
There will be no variation of the compensation received at the date of this prospectus by any of Telkom's directors as a
consequence of the global offering and the listing.
Remuneration of non-executive directors
Fees for Telkom's non-executive directors are determined by the board of directors with regard to market practice, within the
restrictions contained in Telkom's articles of association. They receive no other pay or benefits, with the exception of
reimbursement of expenses incurred in connection with their directorship of Telkom and do not participate in the share schemes,
bonus schemes or incentive plans outlined in this prospectus and are not eligible for pension scheme membership.
Directors' interest in shares
As of the date of this prospectus, none of Telkom's directors had any beneficial or non-beneficial interest in any of Telkom's
shares except as stated under "Relationship with Major Shareholders and Related Transactions - Other related transactions" on
page 151 of this prospectus. Some of Telkom's directors may, however, acquire shares through the global offering.
Loans to directors and executive officers
Telkom has not made any loans to any of its directors or executive officers referred to in this prospectus.
Directors and executive officers' service agreements
Telkom has concluded service agreements with Sizwe Nxasana, Nombulelo Moholi and Reuben September. Shawn McKenzie,
Anthony Lewis and Chian Khai Tan are seconded to Telkom pursuant to the strategic services agreement referred to in
"Relationship with Major Shareholders and Related Transactions - Shareholder arrangements - Strategic services agreement"
beginning on page 148 of this prospectus.The service agreement for Mr. Nxasana has a three year term and is subject to termination
by either party giving six months notice. The service contracts for Ms. Moholi and Mr. September are of indefinite duration, but are
subject to termination by either party giving three months notice. Each of Ms. Moholi and Mr. September has entered into a
retention agreement and a restraint, or non-compete, agreement. Certain amounts are payable to them pursuant to their retention
agreements, which amounts are repayable or forfeited if he or she resigns from Telkom prior to March 31, 2005.
Employee compensation arrangements
As of March 31, 2002, Telkom had not granted any options to acquire ordinary shares to any of its directors or executive
officers. However, Telkom, the Government of the Republic of South Africa and Thintana Communications view employee
incentive plans as important to attract, motivate and retain talented employees. Accordingly, they intend to work together to adopt
employee incentive plans for Telkom's management and employees.
Telkom has a phantom scheme that is currently being phased out. The phantom scheme is an employee scheme pursuant to
which Telkom's employees were paid bonuses calculated by reference to Telkom's estimated ordinary share price. The phantom
scheme does not provide employees with a mechanism to acquire ordinary shares. Telkom has not awarded rights under the
phantom scheme since July 1, 2002, and does not intend to award any further rights under this scheme.
Other employee share ownership arrangements
In connection with the global offering, the Government intends to grant share options to purchase up to 11,140,636 of its
ordinary shares, representing 2% of Telkom's issued and outstanding ordinary share capital, through the Diabo Share Trust,
established for the benefit of:
-
current employees, who are persons employed by Telkom at 9:00 a.m. (S.A. time) on the JSE listing date; and
-
former employees, who are not current employees, but who were employed by Telkom on or after October 1, 1999 up to
8:59 a.m. (S.A. time) on the JSE listing date, including deceased estates of such employees. Employees who resigned voluntarily
or were dismissed on grounds of misconduct, fraud or any other grounds justifying summary dismissal at common law before
8:59 a.m. (S.A. time) on the JSE listing date are excluded from participation in this scheme.
141
These options will entitle current and former employees to acquire ordinary shares from the Government at R33.81 per share,
which is the price at which Thintana Communications invested in Telkom in 1997, plus any stamp duty, brokerage and related costs
payable on the transfer of these ordinary shares. Accordingly, these ordinary shares may be acquired at a discount to the initial
public offering price. These shares will be delivered over a period of three years in four equal tranches. Current employees and
former employees may also elect to have some or all of these shares disposed of for their benefit. An employee does not need to
remain employed with Telkom after 9:00 a.m. (S.A. time) on the JSE listing date in order to continue participating in the scheme
and persons who are employed by Telkom after 9:00 am (SA. time) on the JSE listing date will not otherwise have the right to
participate in the scheme.
Corporate governance statement
Telkom, its board of directors, board committees and senior management are committed to ensure that the affairs of Telkom are
conducted with integrity and in accordance with the South African King Code of Corporate Practices and Conduct, 2002, or
King Code II, which constitutes a code on ethics and business conduct. Telkom's audit and risk management committee monitors
Telkom's compliance with the King Code II.
Telkom has implemented a code of ethics that promotes high standards of integrity, behavior and ethics in dealing with all of its
stakeholders, including its directors, managers, employees, customers, suppliers, investors, shareholders and society at large.
Pursuant to this code of ethics, Telkom's directors and employees are expected to carry on their business through fair commercial
competitive practices. Telkom has also developed an employment equity policy that has been approved by its board of directors and
has been distributed to its employees. The aim of this policy is to implement an employment equity program that promotes moral
decency, sound business practices and principles of economic common sense. The main objectives of this policy are to:
-
create an environment in which the best-qualified person can be employed for the job regardless of gender, religion,
color or race;
-
create within Telkom a balanced profile of employees that reflects the composition of South African society at large;
-
correct racial and social imbalances of the past; and
-
provide for Telkom's current and future requirements for skilled staff.
Telkom's shareholding and governance structure reflect its position as a partly privatized national provider of public switched
telecommunications services, with the Government of the Republic of South Africa and Thintana Communications as shareholders,
in which substantial managerial, technical and business input are required from Telkom's two strategic equity investors. This
shareholding and governance structure has impacted Telkom's ability to comply in full with all the principles of the King Code II.
Telkom's level of compliance with the specific matters with which the JSE believes is good practice for listed companies to
comply is as follows:
-
Telkom's board of directors currently comprises three executive and eleven non-executive directors. As of the JSE listing
date, the board of directors will be reconstituted so as to comprise eleven directors. A majority of Telkom's non-executive
directors are independent of management and free from any business or other relationships that could materially interfere
with the exercise of an independent judgment. In addition, both the non-executive directors and executive directors have a
wide range of skills and commercial experience that enable them to bring independent judgment to bear on issues of strategy,
performance, resources and standards of conduct to deliberations and decisions of the board. As such, their views carry
significant weight in all such deliberations and decisions.
-
The procedures relating to the appointment of Telkom's directors are set out in its articles of association and in its new
shareholders' agreement. Pursuant to these procedures, some of the directors of Telkom are appointed by the Government
and others by Thintana Communications rather than by Telkom's board of directors or shareholders as a whole.
-
Pursuant to Telkom's new articles of association, Telkom's board of directors is required to meet regularly, at least once every
two months, or as often as circumstances necessitate. Even though the board does not have a formal schedule of matters
specifically reserved to it for decision, Telkom's memorandum and articles of association do set out the matters that require
the approval of the Government and Thintana Communications and thus, by extension, the matters that are the board's
responsibility. Telkom's board of directors does record its conclusions in discharging its duties and responsibilities by
minuting all procedures at every board meeting.
-
All of Telkom's directors have access to the services of the company secretary, who is responsible for ensuring that all board
and board committee procedures are followed. All directors are entitled to seek independent professional advice about
the affairs of the Telkom Group at Telkom's cost.
-
In order to prepare a new director for his or her role, and as and when required by any serving director at any time after his
appointment, Telkom has established an induction program to familiarize a participating director with information about the
business, competitive posture, strategic plans and objectives of Telkom and on new laws and regulations and changing
commercial risks. This induction program is performed by Telkom's chairperson and chief executive officer.
-
As set out in "- Board committees" beginning on page 138 of this prospectus, Telkom's board of directors has delegated
certain of its functions to a number of standing committees of the board. All of these board committees operate within
specifically prescribed terms of reference and levels and areas of authorization formally set out in Telkom's articles of
association.
142
-
Pursuant to Telkom's new articles of association, significant managerial and other control over Telkom will, until May 7,
2004, vest in the operating committee and not in Telkom's board of directors.
-
Telkom has separate offices for its chairman and chief executive officer. However, Telkom's new articles of association
provide that, if so determined by the unanimous approval of the Government and Thintana Communications, for so long as
they remain significant shareholders, the same person may serve as both the chairman and the chief executive officer for a
period not exceeding 12 months.
-
Telkom is and remains ready, when practicable and legal, to enter into dialogue with shareholders and make such information
publicly available to all shareholders. In addition, Telkom will encourage institutional and other shareholders to give due
weight and consideration to all relevant factors drawn to their attention and to eliminate unnecessary variations in criteria that
apply to the corporate governance arrangements and measurements of performance of the various companies in which they
invest.
-
Telkom's board of directors, through the audit and risk management committee, annually conducts a review of the
effectiveness of its system of internal controls and reports to shareholders the results of such review. The board also believes
that this system of internal controls provides reasonable assurance that Telkom's assets are safeguarded, Telkom's
transactions are authorized and recorded properly and that material errors and irregularities are either detected or prevented in
a timely manner.
-
Telkom's board of directors, through the audit and risk management committee, is responsible for the total risk management
process within the Telkom Group. Management is accountable to the board and has established a system of internal controls
to manage significant risks, encompassing all significant business risks, including operational risk.
-
Telkom's management is required to provide the board with appropriate and timely information about the business,
operations and general affairs of the Telkom Group. In addition, Telkom's directors are encouraged to make further enquiries
where necessary should the information volunteered by its management not be enough in all circumstances. The chairperson
ensures that Telkom's board members are all properly briefed on issues arising at board meetings, using external advisors
where necessary.
-
Telkom's directors have unrestricted and unhindered access to all information, records, documents and property and the
board receives information that goes beyond assessing Telkom's quantitative performance.
-
Telkom believes that the levels and make-up of the remuneration packages offered to the directors of Telkom, especially
the executive directors, are sufficient to attract and retain the directors needed to run Telkom's business successfully. In order
to avoid paying more than is necessary and in order to ensure that Telkom offers competitive packages, Telkom constantly
benchmarks to an international peer group. Based on information received from such benchmarking process, Telkom
approaches its shareholders to ask for increases where necessary.
-
In determining specific remuneration packages for each of our executive directors, the standing remuneration committee of
the Telkom board of directors consults with the chairperson and chief executive officer and is sensitive to the pay and
employment conditions elsewhere in the Telkom Group when determining annual salary increases for directors. In doing so,
performance related elements of the remuneration constitute a large proportion of the total remuneration package of
executive directors and are specifically designed to align their interests with those of shareholders and to give such executive
directors incentives to perform at the highest levels.
-
Should any of Telkom's executive director's service be terminated early, the remuneration committee will tailor its approach
in respect of compensation commitments to the circumstances of the case with the broad aim of avoiding rewarding poor
performance, while dealing fairly with cases where departure is not due to poor performance.
-
No director is involved in deciding his or her own remuneration. In addition, Telkom has adopted a formal and transparent
procedure for developing a policy on executive directors' remuneration.
-
Telkom's board of directors explains its responsibility for preparing Telkom's accounts and requires Telkom's external
auditors to state specifically their reporting responsibilities. In this regard it is the board's responsibility to present a balanced
and understandable assessment of both interim and year-end financial information as well as other price sensitive public
reports, including any reports to ICASA and other information that Telkom is statutorily obliged to disclose.
-
Telkom's directors report on the business as a going concern with supporting assumptions and qualifications as and when
necessary at the time of Telkom's interim and year-end financial statements and have established a formal and transparent
arrangement for considering how to apply the financial reporting and internal control principles.
-
Telkom intends to establish guidelines in relation to a restricted period in dealings in its securities by its directors, officers
and other employees preceding the announcement of financial results or any other price sensitive information. Telkom also
has regard to all appropriate insider trading and other legislation and regulations that may have a bearing on such dealings in
securities from time to time. Telkom's company secretary will keep a record of all dealings in securities by its directors,
officers and other employees.
143
Director and executive officer additional information
None of Telkom's directors or executive officers referred to above:
-
has been declared bankrupt or has entered into an individual voluntary arrangement to surrender his or her estate;
-
was a director with an executive function of any company at the time of, or within 12 months preceding, any receivership,
compulsory liquidation, creditors' voluntary liquidation, administration, company voluntary arrangement or any composition
or arrangement with that company's creditors generally or with any class of its creditors;
-
has been a partner in a partnership at a time of, or within 12 months preceding, any compulsory liquidation, administration
or partnership voluntary arrangement of such partnership;
-
has been a partner in a partnership at the time of, or within 12 months preceding, a receivership of any assets of such
partnership;
-
has had any of his or her assets subject to receivership;
-
has been publicly criticized by any statutory or regulatory authorities, including recognized professional bodies or been
disqualified by a court from acting as a director of a company or from acting in the management or conduct of the affairs
of any company; or
-
has been convicted of any offense involving dishonesty.
US Sarbanes-Oxley Act of 2002
The United States Public Company Accounting Reform and Investor Protection Act of 2002, also known as the Sarbanes-Oxley
Act of 2002, was enacted on July 30, 2002 and contains significant new rules on corporate governance for United States and foreign
companies reporting in the United States, especially in the area of audit committee composition and authority. Telkom will
be subject to the Sarbanes-Oxley Act following this global offering. Many of the provisions of the Sarbanes-Oxley Act
are subject to SEC rulemaking and will become effective in the course of this year.
In particular, the Sarbanes-Oxley Act calls for audit committees of US reporting companies, such as Telkom, to be composed
entirely of independent board members and to be exclusively responsible for the engagement and removal of and oversight
over a company's external auditors. The Sarbanes-Oxley Act will also require issuers such as Telkom to disclose whether
there is at least one member of the audit committee that would qualify as a "financial expert".
The SEC has not issued final rulemaking with respect to which directors would constitute "independent" directors and "financial
experts" within the meaning of the Sarbanes-Oxley Act. As a result, Telkom may be required to alter the composition of its board of
directors and audit and risk management committee in order to comply with the Sarbanes-Oxley Act depending on the outcome of
final SEC rulemaking in this area. On January 8, 2003, the SEC released proposed rules addressing standards relating to listed
companies' audit committees.
The Sarbanes-Oxley Act also provides that companies, such as Telkom, must disclose whether they have adopted a code of
ethics and business conduct and, if not, why. US reporting companies, such as Telkom, will also be required to publicly disclose
any waiver from the provisions of such code. This provision will take effect as from January 26, 2003. As set out in this section, we
already have a code of ethics and business in accordance with which Telkom, its board of directors, board committees and
employees conduct its affairs. We will publicly be disclosing waivers granted in relation to such code.
Telkom is closely monitoring SEC rulemaking proceedings pursuant to the Sarbanes-Oxley Act to ensure its compliance with
any rules as they become applicable to Telkom as a foreign private issuer.
144

145
RELATIONSHIP WITH MAJOR SHAREHOLDERS
AND RELATED TRANSACTIONS
Telkom and its predecessors have been responsible for the exclusive provision of public switched telecommunication services in the
Republic of South Africa from 1910 through May 2002. Prior to 1991, Telkom's business was conducted as a division of the
Department of Posts and Telecommunications of the Government of the Republic of South Africa. On September 30, 1991, the
Government embarked upon a commercialization process through which the Department of Posts and Telecommunications transferred
its telecommunications enterprise to Telkom. Telkom remained a wholly state-owned entity until May 14, 1997, when the Government
of the Republic of South Africa sold a 30% equity stake in Telkom to Thintana Communications, which is 60% beneficially owned by
SBC Communications and 40% by Telekom Malaysia, Telkom's two strategic equity investors. In March 2001, the Government sold a
3% equity stake in Telkom from its holdings to Ucingo Investments, a consortium of black empowerment investors. Immediately prior
to the global offering, Telkom will have only three shareholders. The Government owns 67% of Telkom's issued and outstanding
ordinary shares, Thintana Communications owns 30% of Telkom's issued and outstanding ordinary shares and Ucingo Investments
owns 3% of Telkom's issued and outstanding ordinary shares. In addition, in connection with the global offering, the Government
intends to grant to current and former employees of Telkom, options to purchase, through the Diabo Share Trust established for that
purpose, up to 11,140,636 of its ordinary shares, representing 2% of Telkom's issued and outstanding ordinary share capital.
The following table shows how many of Telkom's ordinary shares the Government, Thintana Communications and Ucingo
Investments currently own and how many ordinary shares they will own after the global offering is completed assuming a global
offering size of 139,257,954 ordinary shares and the exercise of an over-allotment option of 20,888,693 ordinary shares:
Shares beneficially owned prior
Shares to be sold
Shares beneficially owned
to the global offering
in the global offering
after the global offering
Number
%
Number
%
Number
%
Government of the Republic of
South Africa . . . . . . . . . .
373,211,318
67.0
160,146,647
28.7
213,064,670 1
38.3
Thintana Communications . .
167,109,546
30.0
-
-
167,109,545 2
30.0
Ucingo Investments . . . . . .
16,710,955
3.0
-
-
16,710,955
3.0
Total . . . . . . . . . . . . .
557,031,819
100.0
160,146,647
28.7
396,885,170
71.3
1
Excludes the one class A ordinary share to be created upon the conversion of one existing ordinary share on the JSE listing date.
2
Excludes the one class B ordinary share to be created upon the conversion of one existing ordinary share on the JSE listing date.
Except as stated under "- Other related transactions" on page 151 of this prospectus, none of Telkom's directors or officers is the
beneficial owner of any of Telkom's ordinary share capital. Except as disclosed above, Telkom is not directly or indirectly owned or
controlled by any other corporation, foreign government or any other natural or legal person severally or jointly and Telkom is not
aware of any arrangements, the operation of which may at a subsequent date result in a change of control of Telkom.
The Government and Ucingo Investments are currently in discussions which may or may not lead to a lock-up agreement with
Ucingo Investments or a possible repurchase by the Government of Ucingo Investments' 3% stake in Telkom at the time of the
global offering. If this repurchase takes place, the Government may, in its sole discretion, increase the expected size of the global
offering by up to 3% of Telkom's issued ordinary share capital and use the net proceeds from the sale of these shares to fund the
repurchase of the Ucingo Investments' stake. The Government will own approximately 45% of Telkom's issued and outstanding
ordinary share capital, or approximately 41% if the underwriters exercise their over-allotment option in full, following the
completion of the global offering if the Ucingo Investments repurchase occurs and the Government does not increase the size of the
global offering.
Shareholder arrangements
Current shareholders' agreement
Telkom is currently a party to a shareholders' agreement with the Government, represented by the then Minister of Posts,
Telecommunications and Broadcasting, and Thintana Communications, dated May 14, 1997. The current shareholders' agreement
governs many aspects of the operations, governance and management of Telkom. However, the Government, represented by the
Minister of Communications, and Thintana Communications have entered into a new shareholders' agreement relating to Telkom
that will become effective as of the date of listing of the ordinary shares on the JSE and New York Stock Exchange, at which time
the current shareholders' agreement will be terminated.
New shareholders' agreement
The Government, represented by the Minister of Communications, and Thintana Communications have entered into a new
shareholders' agreement to become effective, subject to certain conditions precedent, as of the date of the listing of the ordinary
shares on the JSE and New York Stock Exchange. The new shareholders' agreement will replace Telkom's current shareholders'
agreement. Telkom is not a party to the new shareholders' agreement.
146
Pursuant to the new shareholders' agreement and Telkom's new articles of association, the Government and Thintana
Communications have certain special rights as "significant shareholders." The rights of the Government and Thintana
Communications as significant shareholders pursuant to the new articles of association will terminate on the conversion of the class A
ordinary share and class B ordinary share into ordinary shares, which conversion will automatically occur, if it has not already
occurred in accordance with Telkom's new articles of association, on the eighth anniversary of the JSE listing date.
See "Description of Shares - Significant shareholder" on page 154 of this prospectus. However, if the Government and Thintana
Communications have not otherwise ceased to be significant shareholders prior to the eighth anniversary of the JSE listing date, the
Government and Thintana Communications will continue, after that date and as between themselves only, to have rights as
significant shareholders pursuant to the new shareholders' agreement for so long as they own at least 15% of Telkom's issued
ordinary shares, which percentage will be adjusted from time to time to reflect the dilutive effect of any issuance of new ordinary
shares by Telkom, provided that the percentage will not be lower than 10%,
Under the new shareholders' agreement, the Government and Thintana Communications have agreed to exercise their respective
voting and other rights, as shareholders in Telkom, to ensure, among other things, that, to the extent legally possible:
-
Telkom and its subsidiaries operate in accordance with the provisions of the new shareholders' agreement, memorandum and
articles of association, business plan, annual budget and the strategic services agreement;
-
Telkom complies with its obligations under its licenses;
-
Telkom complies with the provisions of its articles of association regarding the appointment or removal of persons duly
nominated to or removed from the human resources review committee, the establishment and operation of the audit and risk
management committee and the right of Thintana Communications to perform a financial and/or operations audit and risk
management of Telkom and its subsidiaries;
-
Telkom procures that the powers granted to the operating committee by the new articles of association are not withdrawn or
modified in any way except as provided in the articles;
-
Telkom complies with the provisions of the new strategic services agreement;
-
for so long as Thintana Communications is a significant shareholder, Telkom does not issue, and the Government does not,
without prior written consent of Thintana Communications, transfer any ordinary shares to, or encumber any ordinary shares
in favor of, any transferee whose business involves the provision of telecommunications services and whose annual revenues
exceeds $100 million, except in a distribution on any securities exchange where neither the seller nor any person acting on its
behalf is aware that the relevant transaction has been pre-arranged with a buyer that is a telecommunications provider;
-
Telkom pursues strategic objectives to operate in a commercial manner designed to maximize Telkom's value and to achieve
the highest levels of efficiency, productivity and profitability, to make Telkom a world class telecommunications operator
responsive to the needs of the customer, to satisfy economically viable demands for basic telephony needs in South Africa
and to increase coverage of priority customers, such as educational and medical facilities, community centers and
governmental agencies, through an accelerated network roll-out program, to enable genuine economic empowerment of
South African disadvantaged groups, to transform Telkom into a company representative of South African demographics, to
create training and skills-development opportunities in the telecommunications sector, to create economic growth and
employment opportunities through the creation of an "information society" and to ensure that these strategic objectives are
incorporated into Telkom's business plan;
-
Telkom first prepays its borrowings from or guaranteed by the Government before prepaying its other medium or long-term
indebtedness where, after consultation, the Government and Thintana Communications agree that it would be preferable for
Telkom to do so;
-
Telkom has, in addition to any other independent auditors otherwise required, at least two joint firms of independent auditors,
one nominated by the Government and the other by Thintana Communications with the prior approval of the other party; and
-
Telkom distributes by way of dividend the maximum amount of profits commercially and prudently available for such
distribution in each financial year in accordance with Telkom's new articles of association.
In addition, the Government and Thintana Communications have agreed that, for so long as both of them are significant
shareholders, they will meet prior to any general meetings of ordinary shareholders and attempt to reach consensus on how to
vote their shares in respect of every item that is on the agenda for the relevant meeting. If they do reach consensus, each of the
Government and Thintana Communications have undertaken to vote all of their respective ordinary shares in accordance with such
agreement. If, after implementation of an escalation procedure, they fail to reach consensus, each of the Government and Thintana
Communications is free to vote its ordinary shares as it deems fit, unless the relevant matter is a shareholder reserved matter.
Shareholder reserved matters include:
-
the approval of special resolutions;
-
the amendment of Telkom's memorandum or articles of association and any change to the name under which Telkom does business;
-
any change in Telkom's share capital or capital structure, other than any issue, allotment, consolidation, division or buy-back,
the authority for which has been delegated to the board of directors by a resolution of a general meeting;
-
the adoption of, or material amendment to, any employee share ownership plan;
-
any change of Telkom's joint auditors after May 7, 2004;
-
Telkom's winding-up or liquidation;
-
the approval of Telkom's annual financial statements; and
-
any significant acquisition, merger or material transaction.
147
If the relevant matter on which consensus is not reached is a shareholder reserved matter and Thintana Communications wishes
to vote against the matter at a general meeting, the new shareholders' agreement allows Thintana Communications, for so long as it
is a significant shareholder, to require the Government to vote against the relevant shareholder reserved matter as well. The new
shareholders' agreement also allows the Government, for so long as it is a significant shareholder, the right to require Thintana
Communications to vote against the relevant shareholder reserved matter if the Government wishes to vote against it, but only if the
Government agrees in writing to be bound to the non-competition provisions of the new shareholders' agreement and at the same
time divests itself of all ownership interests in Telkom`s competitors, competitors of any of Telkom's subsidiaries and Vodacom's
competitors that would violate such non-competition provisions.
If the Government does not agree or is otherwise unable to so bind itself to the non-competition provisions or does not so divest
competing ownership interests, the Government must abstain from voting its ordinary shares on the reserved matter at the relevant
general meeting, may not be present at the relevant general meeting for the consideration of that matter and Thintana
Communications may vote only that number of its ordinary shares that represents the percentage that the total number of ordinary
shares held by shareholders, other than the Government and Thintana Communications, bears to the total number of ordinary shares
held by shareholders, other than Thintana Communications. Currently, the Government is not bound by such non-competition
provisions, but Thintana Communications is.
The new shareholders' agreement provides that the Government and Thintana Communications shall exercise their respective
voting and other rights, as shareholders in Telkom, to ensure that, to the extent legally possible, Telkom's board of directors consists
of a maximum of 11 directors. To the extent that the Government holds more ordinary shares in Telkom than Thintana
Communications, the Government and Thintana Communications shall use their best endeavors to procure that the chairperson of
Telkom's board of directors shall be a candidate nominated by the Government from among the non-executive directors and, to the
extent that the Government holds fewer ordinary shares than Thintana Communications, the chairperson of Telkom's board of
directors will be appointed by Telkom's board of directors from among the non-executive directors. The Government and Thintana
Communications also undertake to use reasonable efforts to ensure the membership of Telkom's board is representative of South
African demographics, provided that Thintana Communications is entitled to appoint up to two directors in its sole discretion.
The new shareholders' agreement contains provisions relating to the appointment by Telkom of directors to the board of directors of
its subsidiaries and its Vodacom joint venture. For so long as either the Government or Thintana Communications is a significant
shareholder, a director of Telkom nominated by such significant shareholder is entitled to nominate for appointment by the Telkom
board of directors, a number of members on each of the boards of directors of each of Telkom's subsidiaries, which number shall be a
proportion of the total number of members on such board of directors that Telkom is entitled to appoint based on the ratio of the
number of shares owned by the significant shareholder who nominates such director to the sum of the shares owned by the
Government and Thintana Communications, but in any event at least one member on each such board of directors. With respect to
Vodacom, for so long as Telkom has the right to appoint four directors to Vodacom's board and Thintana Communications is a
significant shareholder and continues to hold indirectly 10% or more of Vodacom's share capital, a director of Telkom nominated by
Thintana Communications will be entitled to nominate two of these four directors which Telkom will appoint to Vodacom's board of
directors. If Thintana Communications is a significant shareholder, but neither of these other conditions is satisfied, then a director of
Telkom nominated by Thintana Communications will have the same right to nominate directors for appointment to Vodacom's board as
it does in relation to Telkom's subsidiaries. If at any time Telkom has the right to appoint only one director to Vodacom's board and
Thintana Communications is at such time a significant shareholder, a director of Telkom nominated by Thintana Communications will
be entitled to nominate that director for appointment, after consultation with Telkom. The director so appointed must, however, in
carrying out his or her responsibilities, act as Telkom's nominee.
The Government has agreed with Thintana Communications not to sell its shares in Telkom for a further 545 day period after the
expiration of or release from the 180 day lock-up period described in "Underwriting" beginning on page 187 of this prospectus. The
Government and Thintana Communications have reciprocal rights of first offer for the purchase of each other's shares. Neither the
Government nor Thintana Communications may transfer any ordinary shares it holds and in the case of the Thintana
Communications, the class B ordinary share, without first offering the shares in question for sale to the other party at a price and
upon terms and conditions determined by the offering party. These rights of first offer are subject to the following exemptions:
-
certain transfers by the Government to "eligible ministries," disadvantaged groups and past and present employees of
Telkom, as more fully described below;
-
listed public offerings;
-
transfers under exempted and brokers' transactions or block trades permitted under United States and South African securities
laws; and
-
any forced purchase of all of Thintana Communications' shares at their fair market value by the Government, or by a third party
designated by the Government, if, among other things, Thintana Communications ceases to be controlled by Telkom's strategic
equity investors, acting together or separately; or breaches the non-competition obligations set forth in the new shareholders'
agreement; or is unable to pay its debts in the ordinary course of business; or becomes subject to liquidation or bankruptcy
procedures that are not discharged within ninety days; or an order is made or a resolution is passed for its winding-up.
If the Government does not exercise its first right to purchase any shares so offered to it,Thintana Communications may transfer
the offered shares to any bona fide third party, provided that:
-
the consent of the Government is required for the transfer of the class B ordinary share, if the class B ordinary share is part
of the offered shares, subject to the qualifications mentioned below; and the Government's consent is also required for the
transfer of the other shares, being ordinary shares, to a South African person; and
148
-
the class B ordinary share may, in any event, be transferred only if, as part of the transfer, the transferee acquires a number of
Thintana Communications' ordinary shares as would be sufficient to constitute the transferee as a significant shareholder
without taking into account any other ordinary shares already held by or on behalf of the transferee.
The qualifications mentioned above are that the Government's consent to the transfer of the class B ordinary share may not be
unreasonably withheld for a transferee whose business involves the provision of telecommunications services and has annual
revenues from such services in excess of $1.5 billion and, in any event, is not required for a transfer to any one of the
telecommunications companies to which such a transfer is specifically permitted under the new shareholders' agreement. Thintana
Communications is entitled to freely transfer its shares in Telkom to its members, provided that the class B ordinary share is
transferred to the same transferee as to whom the ordinary shares are transferred and such transferee binds itself to the new
shareholders' agreement.
The Government may transfer its shares in Telkom, including its class A ordinary share, to one or several eligible ministries of
the Government and, where the Government transfers its class A ordinary share, only after consultation with Thintana
Communications and only if it transfers its class A ordinary share together with enough ordinary shares as would result in the
relevant ministry becoming a significant shareholder without taking into account any other ordinary shares already held by or on
behalf of such ministry. An "eligible ministry" of the Government is any ministry or department of the Government which has
signed a written acknowledgement, in a form reasonably acceptable to Thintana Communications, to be bound by the new
shareholders' agreement. In addition, the Government may transfer up to 7%, which includes the shares required for the
implementation of the offering by the Government of options to past and present employees of Telkom for 2% of Telkom's share
capital, of the total issued shares of Telkom, or such greater percentage as Thintana Communications may consent to, for the
purpose of empowering disadvantaged groups, provided that the Government imposes certain transfer restrictions on the transferee
and that such transferee agrees to be bound thereby.
The new shareholders' agreement prohibits Thintana Communications, subject to limited exceptions, from engaging in any
business activity which competes with any of Telkom's licensed business activities, or those of its subsidiaries or Vodacom, in the
Republic of South Africa. Thintana Communications must also use reasonable efforts to offer to Telkom an opportunity to
participate, on mutually agreed and commercially reasonable terms and conditions, in any telecommunications investments which it
or any of its affiliates proposes making in sub-Saharan Africa.
The Government has agreed to indemnify Thintana Communications against a violation by Telkom of environmental laws in certain
circumstances, against the exercises of certain authority under the Telecommunications Act, 103 of 1996 in relation to Telkom which
could reasonably be expected to have an adverse effect on Telkom, its business or prospects or Thintana Communications' investment
in Telkom and against certain amendments to Telkom's licenses made without Telkom's consent if such amendment has a material
adverse effect on Telkom, its business or prospects or Thintana Communications' investment in Telkom.
For additional information related to the holding of shares by the Government of the Republic of South Africa and by Thintana
Communications, see "Description of Shares" beginning on page 154 of this prospectus.
Strategic services agreement
Telkom is a party to an existing strategic services agreement with Thintana Communications, SBC International Management
Services Inc., or SBC Management, and Telekom Management Services Sdn. Bhd, or Telekom Management. Pursuant to that
agreement, Thintana Communications is entitled and obliged, with the right to request others, including SBC Management and
Telekom Management and their affiliates, to provide personnel to Telkom. Pursuant to this agreement, SBC Management and
Telekom Management provide personnel to Telkom, as requested by Thintana Communications. These personnel fill certain key
managerial positions, such as the chief operating officer and the chief strategic officer, in which they provide strategic services for
Telkom. The strategic services relate to the following: business management, oversight of personnel matters, development and
implementation of marketing plans and other corporate strategies, network planning and supervision, network operations, budget
planning, payroll processing, internal financial support services, technical advice and assistance, regulatory compliance, customer
billing and other related services.
When the existing strategic services agreement commenced, approximately 75 managerial positions were filled by personnel
provided by SBC Management and Telekom Management pursuant to the agreement. As of September 30, 2002, that number had
been reduced to approximately 30 such positions. Since May 7, 2002, Thintana Communications has been obliged to make
reasonable efforts to fill any of the managerial positions which it is entitled to fill, with members of South African groups
historically discriminated against on the grounds of race, color, origin or gender.
Telkom pays a fee for the services of each person provided to it pursuant to the strategic services agreement. If not sooner terminated
and superseded by the new strategic services agreement described below, the existing agreement will terminate in May 2004.
The following table sets forth information related to the fees, which are payable in dollars, paid to SBC Management and
Telekom Management over the last three years pursuant to the existing strategic services agreement:
Six months ended
Year ended March 31,
September 30,
2000
2001
2002
2001
2002
(unaudited)
(ZAR millions)
SBC Management Services Inc. . . . . . . .
215
215
185
n/a
n/a
Telekom Management Services Sdn. Bhd. -. .
45
45
34
n/a
n/a
Total . . . . . . . . . . . . . . . . . . . . .
260
260
219
141
115
149
Telkom, and the other parties to the existing strategic services agreement executed a new strategic services agreement on
January 16, 2003. This new strategic services agreement - will become effective only if Telkom obtains the relevant exchange
control approvals required for Telkom to effect the payments to be made under that agreement. Telkom has applied for these
approvals. Under this new strategic services agreement, Thintana Communications will continue to be entitled and obliged to
provide personnel to Telkom to fill approximately 20 key management positions and certain additional senior managers during the
financial years ending March 31, 2003 and 2004. Telkom itself is entitled to request, if and when it requires, certain additional
senior managers during those same two financial years. All the personnel will be appointed to provide the same strategic services as
those to be provided under the existing strategic services agreement. As and when vacancies occur in those positions, personnel will
be selected by Thintana Communications and provided to Telkom, for appointment by Telkom to fill the vacancies, in accordance
with the requirements of the new strategic services agreement. These requirements include a consultative process between Telkom
and Thintana Communications for the appointments. They also provide for a gradual decrease in the number of the more senior
personnel to be provided by Thintana Communications. In any event, wherever it is feasible, vacancies are required to be filled by
suitably qualified historically disadvantaged individuals. Telkom will continue to pay to Thintana Communications, or any other
personnel provider who provides personnel at the request of Thintana Communications, a fee for the services of each person
provided to Telkom under the new strategic services agreement.
The new strategic services agreement will automatically terminate on the liquidation or dissolution of either Telkom or
Thintana Communications. It will also automatically terminate upon the earlier of ten days after Thintana Communications ceases
to be a significant shareholder in Telkom, in which event Telkom may request a continuance of the agreement for a further period
not exceeding 120 days, and the later of the third anniversary of the JSE listing and May 8, 2007. The new strategic services
agreement may also be terminated by Thintana Communications:
-
in the event of certain breaches of the agreement by Telkom;
-
if the relevant exchange control approvals required by Telkom to effect the payments thereunder terminate without renewal;
-
if the new shareholders' agreement is terminated for any reason or a material term thereof is breached by the Government;
-
if any of the rights granted to Thintana Communications under the new shareholders' agreement or Telkom's new memorandum
and articles of association becomes unenforceable; or
-
if Telkom ceases to be a significant provider of telecommunications services for any reason whatsoever.
Either of SBC Management or Telkom Management may also terminate the new agreement, insofar as it relates to that party, if
that party declares bankruptcy or seeks legal protection from its creditors or if SBC International South Africa LLC or any of its
affiliates or Telkom Malaysia Africa Sdn. Bhd. or any of its affiliates, as the case may be, ceases to hold an equity interest in
Thintana Communications.
Registration rights agreement
Telkom has entered into a registration rights agreement with the Government and Thintana Communications in connection with
the global offering. Pursuant to the agreement, Thintana Communications has the right to cause Telkom to either effect a JSE public
offering in South Africa, or register with the Securities and Exchange Commission all or part of its ordinary shares, or both, at any
time after the expiration or waiver of the lock-up period set forth in the underwriting agreement. The Government has the same
right, but it can exercise this right only starting 545 days after the expiration or waiver of the underwriters' lock-up period. Each of
Thintana Communications and the Government can demand any number of successive registrations, but no more than one in any
calendar year, provided that Thintana Communications is entitled to two such registrations prior to the Government becoming
entitled to demand any registrations. In addition, both Thintana Communications and the Government have the right to have their
ordinary shares registered or sold in a listed public offering any time that Telkom or any other person seeks registration of, or a
listed public offering for, Telkom's issued and outstanding ordinary shares.
Telkom has undertaken to take steps necessary to effect a JSE public offering and/or registration with the Securities and
Exchange Commission. Pursuant to this registration rights agreement, in the event that the Government or Thintana
Communications exercise their right to include their shares in a JSE public offering or US registration of Telkom shares that is
sought by Telkom or by any other person, Telkom would be required to bear and pay all expenses incurred in connection with such
offering or registration, including all registration, listing, filing and qualification fees, as well as underwriting discount and
commissions. However, in the event that the Government or Thintana Communications exercise their right to demand Telkom to
effect a JSE public offering or US registration of their ordinary shares, Telkom would be required to bear and pay all expenses
incurred in connection with registration, listing, filing or qualifications, however, certain fees relating to such registration or listing
shall be borne by the relevant shareholders selling shares in proportion to the number of shares issued or sold. In that case,
underwriting discounts and commissions will be borne by each relevant party based on the number of shares issued or sold by that
party. Telkom is required to indemnify certain parties, including the selling shareholders and the underwriters and their respective
directors, officers, employees and agents against certain losses in connection with such public offering or registration.
Relationship with the Government of the Republic of South Africa
The Government of the Republic of South Africa is Telkom's largest shareholder and is responsible for the telecommunications
industry policy in the Republic of South Africa. The Ministry of Communications has the most direct role in our business.
However, we have interactions with several other Ministries, including the Ministry of Finance for matters relating to taxation,
the Ministry of Labour for matters relating to employment and the Ministry of Trade and Industry for matters relating to the
communications industry.
150
The Government of the Republic of South Africa as regulator
Ministry of Communications
The Ministry of Communications has a number of roles that, directly or indirectly, affect us:
-
The Ministry of Communications represents the Government of the Republic of South Africa as Telkom's shareholder.
The Minister has the powers and duties conferred on a shareholder of a public limited liability company by South African
law, Telkom's memorandum and articles of association and the shareholders' agreement between the Government and
Thintana Communications.
-
The Ministry is responsible for the development of telecommunications policy and for proposing legislation to implement
such policy, subject to supervision by the Cabinet of the Republic of South Africa. The Ministry is also responsible for
administering the Telecommunications Act, 103 of 1996 and the Independent Communications Authority of South Africa
Act, 13 of 2000.
The Ministry has the following primary powers under the Telecommunications Act, 103 of 1996:
-
it may issue policy directives to ICASA, binding it to perform its functions under the Telecommunications Act, 103 of 1996
in accordance with such policy directives;
-
any regulation made by ICASA needs to be approved and published by the Ministry, which may reject such approval, before
it becomes valid and enforceable; and
-
the Ministry has the sole power to approve the grant of any license for a public switched telecommunications service, a
national long distance telecommunications service, an international telecommunications service or a mobile
telecommunications service.
ICASA
ICASA is the regulatory body for the telecommunications and broadcasting industries. ICASA derives its powers from the
Independent Communications Authority of South Africa Act, and, with respect to telecommunications, from the
Telecommunications Act. ICASA serves as the primary regulatory and licensing authority for the South African telecommunications
and broadcasting industries, except for specific licenses that can only be granted by the Minister of Communications.
ICASA's primary powers under the Telecommunications Act are to:
-
conduct public inquiries in any matter relevant to the achievement of the objectives of the Telecommunications Act or to the
performance of its functions in terms of the Telecommunications Act;
-
plan, control and manage the radio frequency spectrum and license its usage;
-
make recommendations to the Minister of Communications on the granting of telecommunication licenses for which the
Minister of Communications has issued an invitation to apply and, in all other cases grant and issue telecommunication
licenses;
-
make regulations as provided for in the Telecommunications Act, subject to ratification by the Minister of Communications;
-
approve, amend or reject agreements entered into by telecommunications licensees relating to interconnection or the leasing
of telecommunication facilities, in accordance with the relevant regulations; and
-
investigate and adjudicate alleged contraventions of the Telecommunications Act, regulations or license conditions by
licensees and, where appropriate, impose sanctions provided in the Telecommunications Act.
Public Finance Management Act
Telkom is required to report certain aspects of its business and operations, such as its corporate and business plans, to the
Minister of Communications in her capacity as executive authority of Telkom pursuant to the Public Finance Management Act,
1 of 1999. Telkom has obtained a temporary exemption from certain provisions of the Public Finance Management Act, 1 of 1999.
See "Risk Factors - Risks Related to Regulatory and Legal Matters - If Telkom is required to comply with the provisions of the
South African Public Finance Management Act, 1 of 1999, or PFMA, Telkom could incur increased expenses and its net profit
could decline and compliance with the PFMA could result in the delisting of Telkom's ordinary shares and ADSs from the JSE
and the New York Stock Exchange" on page 19 of this prospectus.
The Government of the Republic of South Africa as a customer
The departments and agencies of the Government of the Republic of South Africa in the aggregate comprise one of our largest
customers. Generally, we deal with the various departments and agencies of the Government as separate customers, and the provision
of services to any one department or agency does not constitute a material part of our revenues. Legislation has been enacted to
centralize all procurement by the Government through one agency. We estimate that in the six months ended September 30, 2002,
our overall operating revenue from all departments and agencies of the Government amounted to 9% of our total fixed-line revenue,
excluding directory services and other revenue. If the Government transfers some or all of its business to other operators, our
operating revenue and net profit could decline.
151
The Government of the Republic of South Africa guarantees
Pursuant to Section 35 of the South African Exchequer Act, 66 of 1975, the Government of the Republic of South Africa
guaranteed Telkom's borrowings incurred prior to 1991. As of September 30, 2002, R3.6 billion of our total indebtedness
of R25.5 billion was guaranteed by the Government of the Republic of South Africa.
Other related transactions
Mr. Tlhalefang Sekano, one of Telkom's board directors, is a member of the board of directors of Ucingo Investments which
holds 3% of the ordinary shares of Telkom.
Some of our directors and executive officers beneficially own shares in our strategic equity investors, which in the aggregate
represent less than an indirect 1% beneficial interest in Telkom.
Mr. Tlhalefang Sekano, one of Telkom's board directors, is the chairman of Lethapa Security and a director of Telesafe Security.
Lethapa Security owns an interest in Telesafe Security, a security company which provides physical security to Telkom.
Telkom paid R32.1 million and R25.3 million to Telesafe Security in the years ended March 31, 2002 and 2001, respectively,
for these services. In addition, Lethapa Security had an option to purchase 10% of Rebserve Ltd., which together with
Atkins Facilities Management, formed the joint venture, Telecommunications Facilities Management Company (Proprietary)
Limited, which has been awarded a contract to deliver facilities management services to Telkom's South African properties
portfolio. Telkom paid R1.6 billion and R0.6 billion to TFMC in the years ended March 31, 2002 and 2001, respectively, and
R608 million and R587 million in the six months ended September 30, 2002 and 2001, respectively, for these services.
Ms. Nomazizi Mtshotshisa, one of Telkom's board directors, serves on the board of directors of Admiral Industries (Proprietary)
Limited, which has a contract to supply Telkom with workwear. Telkom paid R1.4 million and R1.7 million to Beslin Sithunzi
Workwear in the years ended March 31, 2002 and 2001, respectively, and R0.02 million and R0.4 million in the six months ended
September 30, 2002 and 2001, respectively, for these services.
Mr. Charles Valkin, one of Telkom's directors, is a senior partner with the South African law firm of Bowman Gilfillan Inc.,
which provides legal services to Telkom from time to time.
Messrs. Shawn McKenzie, Jonathan P. Klug Sr., Charles Valkin, Chian Khai Tan and Tan Sri Dato'Ir Muhammad Radzi Mansor,
five of Telkom's board directors, are Thintana Communications' representatives on Telkom's board of directors. See "-Shareholder
arrangements" beginning on page 145 of this prospectus for a discussion of the arrangements between Thintana Communications
and us and the fees we paid to Thintana Communications for strategic services in the three years ended March 31, 2002. SBC
Communications paid Bowman Gilfillan Inc. a total of R259,307 in fees during the period from April 1, 1999 until July 29, 2002
for Mr. Valkin's services as a director of Telkom.
152
RELATIONSHIP WITH VODACOM AND RELATED TRANSACTIONS
Vodacom joint venture agreement
We acquired a 50% equity interest in Vodacom in 1993. Our rights as a shareholder of Vodacom are governed by a joint venture
agreement, which was entered into on March 29, 1995, among Telkom, Vodafone, VenFin, Vodacom and other related parties.
Governance
The Vodacom joint venture agreement sets the number of directors of the board of directors of Vodacom at a minimum of
twelve. Telkom has the right to appoint four directors, Vodafone has the right to appoint three directors, VenFin has the right to
appoint one director and the remaining four directors are appointed by shareholders holding 10% or more of the issued shares of
Vodacom and who are a party to the joint venture agreement. Currently, the only shareholders holding beneficially 10% or more of
the issued shares in Vodacom are Telkom, Vodafone and VenFin and the four board members appointed by Telkom and these
shareholders are senior management of Vodacom.
Under the Vodacom joint venture agreement, the Vodacom board was required to establish a directing committee and delegate all
its power, functions and authority to act on behalf of Vodacom to this committee. This authority cannot be revoked without the prior
written consent of the shareholders holding 10% or more of the issued shares of Vodacom. The directing committee comprises all
directors appointed to Vodacom's board by shareholders holding 10% or more of the issued shares of Vodacom. Currently, the
directing committee consists of eight members comprising four directors appointed by Telkom, three directors appointed by
Vodafone and one director appointed by VenFin.
The unanimous written agreement of those shareholders holding 10% or more of the issued shares of Vodacom is required for,
among other things, the following consensus matters prior to Vodacom or any of its subsidiaries that are a party to the joint venture
agreement taking any of the following actions:
-
changing the nature of or discontinuing its business;
-
disposing of a material part of assets, shares or claims against its subsidiaries;
-
making material acquisitions, merging with another company or entering into a change of control transaction;
-
altering or affecting its capital structure, including the issuance of any shares, the granting of options or the issue of
convertible debentures;
-
proposing any special resolution;
-
altering its dividend policy;
-
incurring certain interest bearing debt which exceeds 50% of the consolidated shareholders' funds;
-
establishing any employee bonus or share incentive scheme;
-
appointing or removing any director to or from its board of directors, otherwise than in accordance with the joint venture
agreement;
-
entering into any agreement with any of its shareholders or affiliates;
-
agreeing to any material alteration of its rights flowing from any license held by it or its subsidiaries enabling such
companies to do their business;
-
approving or amending the business plan of Vodacom; and
-
appointing or removing the chairperson of the board or chief executive officer.
If the shareholders holding 10% or more of the issued shares of Vodacom fail to reach agreement on an above consensus matter,
they are required to exercise all the powers that they have to ensure the consensus matter is not consummated. Should any dispute
arise between the shareholders holding 10% or more of the issued shares of Vodacom regarding the failure of those shareholders
to reach consensus, the dispute is to be referred for determination to the chairperson of those shareholders at the request of any
shareholder holding 10% or more of the issued shares of Vodacom. If the chairperson fail to reach agreement on the consensus
matter in question, each shareholder is entitled to enforce any rights through any competent court.
Pursuant to the Vodacom joint venture agreement, all members of the directing committee are required to agree on certain
matters and, in the event of disagreement, the issue is treated as a consensus matter requiring the unanimous written consent of
those shareholders holding 10% or more of the issued shares of Vodacom. The following matters require unanimous approval:
-
the approval or amendment of any subsidiary company business plans;
-
expenditures that are in excess of 10% of total budgeted expenditures;
-
non-budgeted capital expenditures that are in excess of 5% of the consolidated shareholders' funds;
153
-
the encumbrance of any assets or the issuance of guarantees where the liability secured is in excess of the lower of 5% of the
consolidated shareholders' funds or R10 million;
-
any agreement with any shareholder of Vodacom; and
-
the appointment of the company secretary.
The approval of at least six directors appointed to the directing committee is required to take action with respect to:
-
the approval or adoption of the terms and conditions and any amendments to the interconnect and transmission agreements
concluded with Telkom;
-
the setting or adjustment of tariffs; and
-
the approval of terms and conditions of supply and associated agreements with the suppliers of infrastructure.
Non-competition
Each party to the Vodacom joint venture agreement has agreed that neither it nor its affiliates will form a similar joint-venture
relationship, or invest in any competitive business in the Republic of South Africa. This restraint lapses with respect to each party
two years after the date such party ceases to be a shareholder of Vodacom or upon termination of the joint venture agreement.
In addition, each party to the Vodacom joint venture agreement has agreed that it will not own, manage or otherwise become
engaged in any GSM mobile telecommunications entity or analogue system or otherwise participate in any mobile
telecommunication activities in any African country, a major portion of which is situated below the equator, unless the party
proposing to engage in such activity first offers Vodacom the opportunity to pursue such activity and Vodacom declines. Any
decision by Vodacom to become involved in a GSM or analogue system in this territory requires the written consent of those
shareholders holding 10% or more of the issued shares of Vodacom.
Right of first offer
If any Vodacom shareholder that is a party to the joint venture agreement wishes to sell any of the shares held by it, it must offer
to sell such shares and an equivalent portion of its claims on loan accounts in Vodacom to the other parties to the joint venture
agreement. If none of the non-transferring parties accepts such an offer to purchase all of the shares and claims offered on the terms
in the notice, then the selling shareholder has the right to sell the shares and an equivalent portion of its claims to a third party at a
price not lower than the price, and upon the terms, set forth in the seller's original offer.
Loan agreement
Telkom is a party to a loan agreement, dated as of March 29, 1995, with Vodafone Holdings SA (Proprietary) Limited, a
subsidiary of Vodafone, VenFin Finansile Beleggings Limited, a subsidiary of Venfin, and Vodacom. Under this agreement Telkom
and the subsidiaries of Vodafone and VenFin agreed to lend and advance to Vodacom, in proportion to each of their respective
shareholdings, R1.08 billion or such higher amount as may be agreed upon. The total capital amount outstanding to Telkom under
this loan was R460 million as of September 30, 2002. This loan bears interest at a rate equal to the prime lending rate of Vodacom's
bankers from time to time plus 2%. The average effective interest rate was 15.69% in the year ended March 31, 2002 and 17.57%
in the six months ended September 30, 2002. No interest is in arrears. The loan is repayable on demand with the agreement of all
the shareholders and in no event later than March 31, 2019. The shareholders have agreed that the loan will be repaid in June 2003.
Being a shareholders' loan, the loan is unsecured and is subordinated in favor of Vodacom's other creditors in the event of
liquidation. In addition, the loan may be converted into equity or preference share capital in certain circumstances.
154
DESCRIPTION OF SHARES
Set forth below is a summary of material information relating to Telkom's share capital, including summaries of certain
provisions of Telkom's new memorandum and articles of association, the South African Companies Act, 61 of 1973 and the Listings
Requirements of the JSE. This summary is qualified in its entirety by the provisions of Telkom's new memorandum and articles of
association and by the applicable provisions of South African law and the Listings Requirements of the JSE. You should refer to the
full text of Telkom's new memorandum and articles of association, which is filed as an exhibit to the registration statement of which
this prospectus forms a part. Please refer to "Documents Available For Inspection" on page 195 of this prospectus to inspect a copy
of Telkom's new memorandum and articles of association.
General
Telkom was incorporated on September 30, 1991, as a public limited liability company registered under the South African
Companies Act with registration number 1991/005476/06. Telkom is governed by its memorandum and articles of association and the
provisions of the South African Companies Act, 61 of 1973. Upon the listing of Telkom's ordinary shares on the JSE and ADSs on the
New York Stock Exchange, Telkom will also be subject to the Listings Requirements of the JSE and the New York Stock Exchange.
Telkom's main object and business is to supply telecommunications, broadcasting, multimedia technology and information
services to the general public in the Republic of South Africa.
The following discussion of the provisions of Telkom's memorandum and articles of association describes the new memorandum
and articles of association which will become effective as of the JSE listing date:
Share capital
As of September 30, 2002, the date of Telkom's most recent balance sheet included in this prospectus, and as of the date of this
prospectus, Telkom's authorized share capital was R10,000,000,000, divided into 1,000,000,000 ordinary shares with a par value of
R10 each, and its issued share capital was R5,570,318,190, divided into 557,031,819 ordinary shares with a par value of R10 each
and its share premium was R2,723,000,000. Pursuant to a special resolution passed at a general meeting of Telkom held on
January 16, 2003, Telkom's authorized and issued share capital will, with effect from the JSE listing date, be altered by the
conversion of one ordinary share held by the Government into one class A ordinary share with a par value of R10 and one ordinary
share held by Thintana Communications into one class B ordinary share with a par value of R10. As a result, Telkom's authorized
share capital will comprise R10,000,000,000, divided into 999,999,998 ordinary shares with a par value of R10 each, one class A
ordinary share with a par value of R10 and one class B ordinary share with a par value of R10, and its issued share capital will
comprise R5,570,318,190, divided into 557,031,817 ordinary shares with a par value of R10 each, one class A ordinary share with a
par value of R10 and one class B ordinary share with a par value of R10. Only ordinary shares are being offered in the global
offering and only ordinary shares will be listed on the JSE and ADSs listed on the New York Stock Exchange will only represent
ordinary shares. The class A and B ordinary shares will not be listed on any stock exchange.
No alterations to Telkom's share capital occurred during the five years preceding the date of this prospectus. There were no
changes in Telkom's authorized or issued share capital between March 31, 2001 and the date of this prospectus.
All of Telkom's issued and outstanding ordinary shares will rank equally with each other and will be fully paid and not subject to
calls for additional payments of any kind. Except as specified in Telkom's new articles of association, selected provisions of which
are described in this prospectus, the class A ordinary share and the class B ordinary share will rank equally with the ordinary shares.
As of the date of this prospectus, there is no contract or arrangement whereby any option or preferential right of any kind has
been or is proposed to be given to any person to subscribe for shares in Telkom or any of its subsidiaries.
Significant shareholder
Pursuant to Telkom's articles of association, a "significant shareholder" is the registered holder of the class A ordinary share
or the class B ordinary share and, in addition, of at least 15% of the issued ordinary shares as of the JSE listing date, which
percentage will be adjusted from time to time to reflect the dilutive effect of any issuance of new ordinary shares by Telkom after
that date, provided that that percentage will not be lower than 10%. A significant shareholder has certain specific rights in terms of
Telkom's memorandum and articles of association as more fully described below. Prior to and immediately following the global
offering, the Government and Thintana Communications will be the only significant shareholders.
If, on the eighth anniversary of the JSE listing date, the class A ordinary share and class B ordinary share have not otherwise
been converted into ordinary shares under the terms of Telkom's new articles of association, they will automatically be so converted
and the rights of the Government and Thintana Communications as holders of the class A ordinary share and class B ordinary share,
respectively, including their rights as significant shareholders, will be terminated under Telkom's new articles of association, but not
under the new shareholders' agreement.
155
Dividends
Telkom's shareholders, in a general meeting, or its board, from time to time, may declare a dividend to be paid to the registered
holders of one or more classes of shares; provided that Telkom's shareholders may not declare a greater dividend in a general
meeting than is recommended by the board and provided further that no dividend may be declared to a holder of the class A
ordinary share or class B ordinary share, unless the same dividend is declared to holders of all ordinary shares. In addition, for so
long as either the Government or Thintana Communications is a significant shareholder, the declaration or distribution of dividends
or other distributions must be approved by the board as a reserved matter. See "Management - Reserved matters" beginning on
page 137 of this prospectus.
Pursuant to Telkom's new articles of association, dividends on ordinary shares will not bear interest. Dividends are declared
payable to shareholders registered as such on a date subsequent to the date of publication of the announcement of the declaration of
the dividend. This date may not be sooner than 14 days after the date of such publication. All unclaimed dividends may be invested
or otherwise utilized by the board for Telkom's benefit until claimed, provided that dividends unclaimed after a period of three
years shall be forfeited. Forfeited dividends revert to Telkom or its assigns.
Any dividend or other sum payable in cash to a shareholder may be transmitted by ordinary post to the address of the
shareholder recorded in the register or any other address the shareholder may previously have given to Telkom in writing or by
electronic transfer to such bank account as the shareholder may previously have given to Telkom in writing. Telkom will not be
responsible for any loss in transmission. Subject to the approval of shareholders in a general meeting, any dividend may be paid and
satisfied, either wholly or in part, by the distribution of specific assets as the board may determine and direct at the time of
declaring the dividend.
Any cash dividends paid by Telkom will be declared in South African Rands. The shareholders in a general meeting, or the
board of directors, may at the time of declaring a dividend, stipulate that the dividend to be paid to shareholders having registered
addresses outside South Africa or who have given written instructions requesting payment at addresses outside South Africa, shall
be paid in a currency other than South African currency. Holders of ADSs on the relevant record date will be entitled to receive any
dividends payable in respect of the ordinary shares underlying the ADSs, subject to the terms of the deposit agreement. Cash
dividends paid in Rands will be converted by the depositary to Dollars and paid by the depositary to holders of ADSs, net of
conversion expenses of the depositary, in accordance with the deposit agreement. See "Description of American Depositary
Receipts - Dividends and other distributions" beginning on page 167 of this prospectus.
Voting rights
Subject to any rights or restrictions attached to any class of shares, every shareholder present at a general meeting in person, by
proxy or by representation will, on a show of hands, have one vote only and, in the case of a poll, that proportion of the total votes
which the aggregate amount of the nominal value of the shares held by that shareholder bears to the aggregate of the nominal value
of all the shares issued by Telkom. For a description of shareholders' rights to request a poll, see "- General meetings of
shareholders" beginning on page 157 of this prospectus. A shareholder is entitled to appoint a proxy to attend, speak and vote at any
meeting on the shareholder's behalf. The proxy need not be a shareholder. For a description of the method by which the ordinary
shares held by the depositary will be voted, see "Description of American Depositary Receipts - Voting rights" on page 168 of this
prospectus.
Issue of additional shares and pre-emption rights
Subject to the provisions of the South African Companies Act, 61 of 1973, the JSE Listings Requirements and any rights or
restrictions attached to any class of shares, shareholders in a general meeting may authorize the board to allot and issue shares or
grant options over unissued shares to such persons at such times, and generally on such terms and conditions, and for such
consideration, whether payable in cash or otherwise, as it may decide. As of the date of this prospectus, no such authorization has
been granted to the board by the shareholders of Telkom. For so long as either the Government or Thintana Communications is a
significant shareholder, there may not be any increase or reduction in Telkom's issued share capital or that of any of its subsidiaries
without the authorization of the board as a reserved matter. See "Management - Reserved matters" beginning on page 137 of this
prospectus. Any changes in Telkom's capital structure is also a shareholder reserved matter under the new shareholders' agreement
as described more fully in "Relationship with Major Shareholders and Related Transactions - Shareholder arrangements - New
shareholders' agreement" beginning on page 145 of this prospectus. No change in the number of issued class A ordinary shares or
class B ordinary shares may be made without the approval of the Government and Thintana Communications, respectively.
The Listings Requirements of the JSE require Telkom's unissued ordinary shares to be offered first to existing shareholders in
proportion to their holdings of ordinary shares unless these shares are issued for the acquisition of assets. The shareholders may,
however, grant either a general approval in a general meeting authorizing directors to issue ordinary shares for cash or a specific
approval for a particular issue of ordinary shares, without first offering them to existing shareholders. Issues of ordinary shares for
cash pursuant to a general approval in the aggregate in any one financial year may not exceed 15% of the issued share capital of
that class. The maximum discount at which securities may be issued under a general approval is 10% of the weighted average
trading price of those securities over 30 business days on the JSE prior to the date that the price of the issue is determined or agreed
by the directors. A specific approval to issue ordinary shares is subject to, among other things, the disclosure of the number or
156
maximum number of securities to be issued and disclosure of whether the discount at which the securities are to be issued is
unlimited and, if not, the limit. A general and specific approval are each subject to the requirement of approval of a 75% majority of
votes cast by shareholders present or represented by proxy at a general meeting, excluding controlling shareholders and various
other associated parties, in the case of a specific approval. The Government and Thintana Communications may be regarded as
controlling shareholders for these purposes. As of the date of this prospectus, no general or specific approval authorizing the
directors to issue shares for cash has been granted to the board by the shareholders of Telkom.
For a description of the method by which the depositary may make any dividend in or distributions of ordinary shares or offer of
rights to subscribe for additional ordinary shares available to holders of ADSs, see "Description of American Depositary Receipts
Dividends and other distributions" beginning on page 167 of this prospectus.
Subject to the South African Companies Act, 61 of 1973, the directors or Telkom's shareholders may resolve in a general
meeting to utilize all or any part of Telkom's reserves, or any amount available for distribution as a dividend and not required for
the payment or provision of dividends on preference shares, to pay for Telkom's authorized but unissued shares to be issued as fully
paid capitalization shares to shareholders entitled to receive such distributions as a dividend.
Transfer of shares
Telkom's new articles of association do not contain any restriction on the right to transfer ordinary shares, except as described
below in "- Limitation on share ownership." Ordinary shares may be transferred by an instrument in writing in any usual common
form or in such other form as the board of directors may approve if such transfer does not arise pursuant to a trade of such shares
on the JSE. The transferor will be deemed to remain the holder of the ordinary shares until the name of the transferee is entered in
Telkom's share register in respect of the transferred ordinary shares. Every instrument of transfer presented for registration must be
accompanied by the certificate representing the ordinary shares to be transferred and/or such other evidence Telkom may require to
prove the title of the transferor or the transferor's right to transfer the ordinary shares.
Although shareholders are entitled to hold their ordinary shares in certificated form, ordinary shares may only be traded on the
JSE if they have been dematerialized through Share Transactions Totally Electronic Limited, or STRATE. A dematerialized share is
not evidenced by a share certificate and may not be transferred by an instrument in writing, but is represented and transferred by
means of electronic book entries.
The Minister of Communications, which holds the class A ordinary share on behalf of the Government, may transfer the class A
ordinary share only to other ministries and governmental departments of the Republic of South Africa and only if the Minister
transfers the class A ordinary share together with as many ordinary shares as would be sufficient to constitute the transferee a
significant shareholder without taking into account any other ordinary shares already held by or on behalf of the transferee, and
only after consultation with Thintana Communications. If so transferred, the transferee will acquire the rights of the Government as
the holder of the class A ordinary share. If at any time the Government ceases to hold the class A ordinary share, the class A
ordinary share will be converted into an ordinary share by operation of Telkom's new articles of association.
The class B ordinary share may be transferred if it is transferred together with as many ordinary shares as would be sufficient to
constitute the transferee a significant shareholder without taking account any other ordinary shares already held by or on behalf of
such transferee, and only after consultation with the Government. The first transferee who becomes a significant shareholder
pursuant to such transfer will acquire the rights Thintana Communications enjoyed as a significant shareholder, but certain of the
reserved matters will fall away on the second transfer of such shares. See "Management - Reserved matters" beginning on page 137
of this prospectus. If Thintana Communications, as the holder of the class B ordinary share, ceases to hold at least 5% of the issued
and outstanding shares in the capital of Telkom, then the class B ordinary share will be converted into an ordinary share. If the
class B ordinary share is converted into an ordinary share, the class A ordinary share will automatically be converted into an
ordinary share.
The class A ordinary share and class B ordinary share will automatically be converted into ordinary shares on the eighth
anniversary of the JSE listing date if those shares have not otherwise been converted under Telkom's new articles of association
before that date. See "- Significant shareholder" on page 154 of this prospectus.
There are other restrictions on the Government and Thintana's ability to transfer their shares. These restrictions are set out in
Telkom's new shareholders' agreement and described in "Relationship with Major Shareholders and Related Transactions
Shareholder arrangements - New shareholders' agreement" beginning on page 145 of this prospectus.
Limitation on share ownership
Pursuant to Telkom's new articles of association, if a person or several persons acting in concert acquire legal
or beneficial ownership of any shares which will result in that person or persons owning in excess of 15% of all issued shares in
that class of Telkom's shares, that person or persons are required to notify Telkom. Telkom's board has the power to give that
person or persons notice to dispose of the excess shares and if the excess shares are not disposed of within 21 days,
or any longer period determined by the board, Telkom is entitled to sell the excess shares on behalf of that person or persons.
In addition, the board is entitled to refuse to register the transfer of any shares that would result in a person or several persons
acting in concert, acquiring ownership of more than 15% of all issued shares in a particular class of Telkom's shares. The holder of
an ADS is deemed to be the holder of the ordinary shares which are represented by the ADS. The Government and Thintana
Communications are exempt from this limitation on share ownership for so long as they are significant shareholders or fulfill the
remaining criteria of a significant shareholder after the class A ordinary share and class B ordinary share have converted into
ordinary shares on the eighth anniversary of the JSE listing date. In addition, any shareholder who acquires and holds shares
pursuant to and solely for the purposes of a distribution of such shares is exempt from this limitation of ownership.
157
The provisions of Telkom's new articles of association relating to the 15% limitation of share ownership referred to in this
paragraph will automatically cease to be of any force unless they are sanctioned by law within three months of the JSE listing date.
Thintana Communications, for so long as it is a significant shareholder, may not hold in excess of 49% of the issued shares of
any class of shares in Telkom, other than the class B ordinary share.
Disclosure of interest in shares
Pursuant to the South African Companies Act, 61 of 1973 registered shareholders are required at the end of every calendar
quarter to disclose to the issuer the identity of each other person who has a beneficial interest in the shares held by the registered
holder and the number and class of those shares. Moreover, an issuer of shares may, by notice in writing, require a person who is a
registered holder of, or whom the issuer knows or has reasonable cause to believe, has a beneficial interest in, a share issued by the
issuer to identify to the issuer the person on whose behalf a share is held. The addressee of the notice may also be required to give
particulars of the extent of the beneficial interest held during the three years preceding the date of the notice. All issuers of shares
are obliged to establish and maintain a register of the disclosures described above and to publish in their annual financial statements
a list of the persons who hold beneficial interests equal to or in excess of 5% of the total number of shares of that class issued by
the issuer together with the extent of those beneficial interests.
Pursuant to Telkom's new articles of association, its board is entitled at any time, by written notice, to require the registered
holder of any of its shares or a person who holds any of its shares as a nominee to disclose to it such information as Telkom's
directors consider necessary in order to determine whether or not that holder owns, whether alone or together with any other
persons acting in concert, in excess of 15% of the shares in any class of Telkom's issued shares. If that holder fails to comply with
Telkom's written notice to disclose, its board may suspend that holder's right to receive payment of dividends on all of the shares
held by that holder. This power will cease unless it is sanctioned by law within three months of the JSE listing date.
Register of members
Telkom keeps a register of its members, being shareholders whose names have been included in this register, in South Africa.
Telkom may keep a branch share register in any foreign country, subject to the approval of the South African Reserve Bank.
General meetings of shareholders
Telkom is required by the South African Companies Act, 61 of 1973 to hold an annual general meeting not more than nine
months after the end of every financial year and within 15 months after the date of its last preceding annual general meeting. The
board may convene a general meeting whenever it thinks fit and must do so on the request of 100 shareholders or of shareholders
holding, at the date of request, not less than one-twentieth of shares carrying voting rights.
Telkom is required by the South African Companies Act, 61 of 1973 to provide at least 21 "clear days" intervening notice for
annual general meetings and for general meetings at which special resolutions are proposed, and at least 14 "clear days" intervening
notice for all other general meetings. "Clear days" exclude the date on which notice is given and the date on which the meeting is
held.
A holder of shares may by notice require Telkom to record an address within South Africa which shall be deemed to be his or
her address for the purpose of the service of notices. Telkom's new articles of association require notices of general meetings to be
in writing and to be given or served on any shareholder either by sending the notice, or a message advising that the notice is
available on a website and containing the address of such website by electronic mail or telefacsimile to an electronic mail address
or telefacsimile number notified to Telkom for this purpose. Alternatively, the written notice may be given by delivery in person or
by sending it through the post, properly addressed, to a shareholder at his or her address shown in the register of shareholders or to
a beneficial holder of Telkom's shares at the address which has been disclosed to Telkom and recorded in its register of such
disclosures. Notice may be given to any beneficial holder of Telkom's shares who has not disclosed his or her address, electronic
mail address or telefacsimile number to Telkom, by publishing that notice or an advertisement that such notice is available on a
website, in the South African Government Gazette and any newspaper determined by Telkom's directors. Any notice to shareholders
must simultaneously be given to the secretary or other suitable official of any recognized stock exchange on which Telkom's shares
are listed in accordance with the requirements of the stock exchange. Every notice shall be deemed to have been received on the
date on which it is so delivered and, if it is sent by post, on the day on which it is posted. If it is published in the South African
Government Gazette or if it is advertised in the Government Gazette, it is deemed to have been received on the date it appears in
the Government Gazette. If it is sent by electronic mail or telefacsimile, it is deemed to have been sent on the day it is sent or
transmitted.
For a description of the method by which holders of ADSs will be provided notices of shareholder meetings by the depositary,
see "Description of American Depositary Receipts - Voting rights" on page 168 of this prospectus.
158
No business may be transacted at any general meeting unless the requisite quorum is present when the meeting proceeds
to business. A quorum is at least three shareholders present in person or, in the case of a shareholder which is a company,
by representation, and entitled to vote, provided that no quorum will be constituted if the Government or Thintana Communications
is not present. If within thirty minutes from the time appointed for the meeting a quorum is not present, the meeting will stand
adjourned to the same day in the next week, or if that day is a South African public holiday or a Saturday or Sunday, the next
succeeding day other than a South African public holiday, Saturday or Sunday, at the same time and place. The quorum at the
adjourned meeting shall be three shareholders present in person or by representation. If a quorum at the initial meeting was
not established because of the absence of the Government or Thintana Communications, the presence of the absent shareholder is
not required to establish a quorum at the adjourned meeting. In order to pass a special resolution, shareholders holding in the
aggregate not less than one fourth of the total votes of all shareholders entitled to vote must be present in person or by proxy at
the meeting.
At a general meeting, a resolution put to the vote will be decided by a show of hands unless a poll is demanded by:
-
the chairman;
-
not less than five shareholders having the right to vote at such meeting; or
-
a shareholder or shareholders representing not less than one tenth of the total voting rights of all shareholders having the
right to vote at the meeting or a shareholder or shareholders entitled to vote and holding in aggregate not less than one tenth
of Telkom's issued share capital.
Subject to the rights of the Government and Thintana Communications as significant shareholders described in
"Relationship with Major Shareholders and Related Transactions - Shareholder arrangements - New Shareholders' agreement"
beginning on page 145 of this prospectus, resolutions will be carried by a majority of the votes recorded at the meeting except in
the case of a special resolution which must be passed either on a show of hands, by not less than three fourths of the number of
Telkom's shareholders entitled to vote who are present in person, by proxy or by representation or, where a poll has been
demanded, by not less than three fourths of the total votes to which the shareholders present in person, by proxy or by
representation are entitled.
Annual report and accounts
Telkom's board is required to keep such accounting records and books of account as are prescribed by the South African
Companies Act, 61 of 1973. Generally, no shareholder, other than a director, has any right to inspect any of our accounting record
books, accounts or documents, except that for so long as Thintana Communications is a significant shareholder, it has the right, at
its sole expense, to perform or have performed a financial and/or operations audit of Telkom and its subsidiaries.
The board is required, in respect of each of Telkom's financial years, to prepare annual consolidated financial statements and
present them before the annual general meeting.
Pursuant to the Listings Requirements of the JSE, unaudited interim reports must be distributed to all shareholders within three
months after the end of the first six months of Telkom's financial year.
Telkom's consolidated financial statements must, in conformity with IAS, fairly present the state of affairs and business of
Telkom and all of its consolidated subsidiaries at the end of the financial year concerned and the profit or loss of Telkom and all of
its consolidated subsidiaries for that financial year.
Changes in capital
Telkom may from time to time by special resolution:
-
consolidate, divide or sub-divide all or any part of Telkom's issued or unissued capital;
-
increase or cancel all or any part of Telkom's unissued capital;
-
convert any of Telkom's shares, whether issued or not, into shares of another class;
-
convert all or any of Telkom's paid-up shares into stock and reconvert such stock into paid-up shares; or
-
convert any shares having a par value into shares having no par value and vice versa.
Telkom may from time to time reduce its issued share capital, share premium, stated capital, reserves or any capital redemption
reserve fund with the approval of an ordinary resolution of Telkom's shareholders in a general meeting and a resolution of Telkom's
directors. Any increase or reduction in Telkom's issued share capital or that of any of Telkom's subsidiaries must be approved by
directors as a reserved matter. See "Management - Reserved matters" beginning on page 137 of this prospectus. In addition, any
change in Telkom's capital structure is a shareholder reserved matter under the new shareholders' agreement, as described more
fully in "Relationship with Major Shareholders and Related Transactions - Shareholder arrangements - New shareholders'
agreement" beginning on page 145 of this prospectus, unless such power is capable of, and has been, delegated to Telkom's board
by a resolution of the shareholders of Telkom.
Variation of rights
Whenever Telkom's capital is divided into different classes of shares, the rights attached to any class of shares in issue may be
varied, modified or abrogated by special resolution, provided that no variation that adversely affects those rights may be made
without the written consent or ratification of the holders of three-fourths of the issued shares of that class or a resolution passed in
the same manner as a special resolution at a separate general meeting of the holders of such shares.
159
The affirmative vote or consent of the Government and Thintana Communications, as the case may be, is required for any
amendment, alteration or cancellation of any of the provisions of Telkom's memorandum and articles of association that would
alter or change the powers, preferences or special rights of the class A ordinary share or class B ordinary share or the holder of the
class A ordinary share or class B ordinary share, as the case may be, so as to affect either adversely. Telkom's memorandum and
articles of association further require Telkom to obtain written consent from the Government before issuing any securities or
amending any existing securities in a manner that would adversely affect the Government's right under a special condition set forth
in Telkom's memorandum of association, including the creation of a new class of shares or the amendment of the rights attached to
an existing class of shares to provide them with rights superior to or equal to or adversely affecting the rights of Government under
this condition. This special condition provides that Telkom must obtain written consent from the Government before:
-
taking any action that would result in Telkom's ceasing to provide telecommunications services under its public switched
telecommunications services license in the Republic of South Africa; or
-
disposing of assets, the effect of which would materially impair Telkom's ability to fulfill its obligation under its public
switched telecommunications services license.
The rights conferred upon the holders of the shares of any class will be deemed not to be directly or indirectly adversely affected
by the creation or issue of further shares ranking equally with them or the cancellation of any shares of any other class.
Distribution of assets on liquidation
If Telkom is liquidated, whether voluntarily or compulsorily, the assets remaining after the payment of all of Telkom's liabilities
and the costs of winding-up shall be distributed among the shareholders in proportion to the numbers of shares held by them,
subject to the rights of any shareholders to whom shares have been issued on special conditions and subject to Telkom's right to
set-off unpaid capital or premium against the liability, if any, of shareholders. Furthermore, with the authority of a special
resolution, the liquidator may divide among the shareholders, in specie or kind, the whole or any part of the assets, whether or not
those assets consist of property of one kind or different kinds.
For so long as the Government and Thintana Communications are significant shareholders, any winding up or liquidation of
Telkom must be authorized as a board reserved matter. See "Management - Reserved matters" beginning on page 137 of this
prospectus. Any winding up or liquidation of Telkom is also a shareholder reserved matter under the new shareholders' agreement
is more fully described under "Relationship with Major Shareholders and Related Transactions - Shareholder arrangements - New
shareholders' agreement" beginning on page 145 of this prospectus.
Purchase of shares
The South African Companies Act, 61 of 1973, permits loans by a company to its employees, other than directors, for the
purpose of purchasing or subscribing for shares of that company or of its holding company.
The procedure for acquisition by a company of its own shares is regulated both by the South African Companies Act, 61 of 1973
and the Listings Requirements of the JSE. The South African Companies Act, 61 of 1973 provides that a company may, by special
resolution, if authorized by its memorandum and articles of association, approve the acquisition of its shares; provided that a
company may not make any payment in whatever form to acquire any share issued by that company if there are reasonable grounds
for believing that the company is or would, after the payment, be unable to pay its debts or if the consolidated assets of the
company fairly valued would, after the payment, be less than the consolidated liabilities of the company. The South African
Companies Act, 61 of 1973 also provides that:
-
a subsidiary may acquire up to a maximum of 10% in the aggregate of the number of issued shares of its holding company,
or parent company; and
-
a company may make payments to its shareholders if authorized by its memorandum and articles of association subject to the
provisions referred to above relating to ability to pay debts and solvency.
Under South African law and the Listings Requirements of the JSE, the shareholders in a general meeting may approve a
specific acquisition by the company of its issued shares or grant the company a general authority to acquire its issued shares by way
of a renewable mandate which is valid until the company's next annual general meeting, provided that such authority may not
extend beyond 15 months from the date of the granting of the general authority. The general authority is subject to, among other
things, the following:
-
the acquisition of ordinary shares must be on the "open market" of the JSE;
-
the number of ordinary shares that may be acquired pursuant to the general authority may not, in the aggregate, exceed 20%
of Telkom's issued share capital in any one financial year; and
-
the ordinary shares may not be acquired at a price that is more than 10% above the weighted average of the market value of
the ordinary shares for the five business days immediately preceding the date on which the acquisition is agreed.
As of the date of this prospectus, the shareholders of Telkom have not granted Telkom or its subsidiaries a general authority to
acquire Telkom's issued and outstanding ordinary shares.
160
Directors
Pursuant to Telkom's new articles of association, the Government and Thintana Communications, for so long as they hold the
class A ordinary share and the class B ordinary share, respectively, are entitled to appoint directors based on the percentage of the
issued ordinary shares owned by them as follows:
-
if either shareholder owns at least 25%, it has the right to appoint five directors, including two executive directors;
-
if either shareholder owns at least 20%, but less than 25% of the issued ordinary shares, it has the right to appoint four
directors, including, in the case of Thintana Communications, two executive directors and, in the case of the Government,
one executive director;
-
if either shareholder owns at least 15%, but less than 20% of the issued ordinary shares, it has the right to appoint three
directors, including, in the case of Thintana Communications, two executive directors, and in the case of the Government,
three non-executive directors;
-
if either shareholder owns at least 10%, but less than 15% of the issued ordinary shares, it has the right to appoint two
directors, including, in the case of Thintana Communications, two executive directors and, in the case of the Government,
two non-executive directors; and
-
if either shareholder owns at least 5%, but less than 10% of the issued ordinary shares, it has the right to appoint one director,
including, in the case of Thintana Communications, one executive director and, in the case of Government, one non-
executive director.
Neither the Government nor Thintana Communications will have the right to appoint more than five directors, regardless of their
share ownership.
The remaining directors, if any, other than Telkom's chief executive officer who is appointed by Telkom's board of directors,
may be appointed by a general meeting. A general meeting is not entitled to fill a vacancy of a director appointed by the
Government or Thintana Communications, as holders of the class A ordinary share and the class B ordinary share, respectively.
At each of Telkom's annual general meetings, at least one third of Telkom's directors appointed by a general meeting, excluding
executive directors, directors appointed by the Government and Thintana and any directors appointed by the directors after the
conclusion of Telkom's preceding annual general meeting, are required to retire from office but are eligible for reelection.
The directors to retire are those who have been longest in office or, as between directors appointed by a general meeting who have
been in office for an equal length of time, in the absence of agreement, determined by lot. If, after such retirements, there would
remain in office any director appointed by a general meeting who would have held office for three years since his last election, he
shall also retire at such annual general meeting. In addition, those directors appointed by a general meeting since the last annual
general meeting are required to retire from office. A retiring director is eligible for reelection. Directors appointed by the
Government or Thintana Communications, as the case may be, can be removed and replaced at any time upon receipt by Telkom of
written notice from the Government or Thintana Communications, as the case may be.
The remuneration of Telkom's directors shall be determined from time to time by its directors, taking into account the
recommendations of the remuneration committee appointed by Telkom's directors. Telkom's directors shall be paid all their
traveling and other expenses properly incurred by them in the execution of their duties in or about Telkom's business, which
are approved or ratified by Telkom's directors.
Any director who serves on any committee, devotes special attention to Telkom's business, goes or resides outside of the
Republic of South Africa for any of Telkom's purposes, or performs any services that are outside the scope of ordinary duties of a
director, may be paid such extra remuneration or allowances as Telkom's directors, excluding the director in question, may
determine.
Telkom's new articles of association provide that a director shall not vote in respect of any contract or arrangement or any other
proposal whatsoever in which he or she has a material interest, other than by virtue of his or her interest in securities in Telkom
and in certain other limited circumstances. A director may not be counted in the quorum of a meeting in relation to any resolution
in which he or she is not permitted to vote.
The directors are not obliged to hold any qualification shares.
Telkom's new articles of association grant a director appointed by the Government and Thintana Communications the right, for
so long as they are significant shareholders, to nominate certain of the directors that Telkom is entitled to appoint to the boards of
directors of its subsidiaries and Vodacom. These rights are the same as those contained in the new shareholders' agreement referred
to under "Relationship with Major Shareholders and Related Transactions - Shareholder arrangements - New shareholders'
agreement" beginning on page 145 of this prospectus.
If the class A ordinary share and class B ordinary share are converted into ordinary shares, the rights of the Government and
Thintana Communications as holders of the class A ordinary share and class B ordinary share, respectively, including their rights of
appointment of directors to Telkom's board of directors and the boards of directors of Telkom's subsidiaries and Vodacom, will be
terminated.
161
Borrowing powers
The directors may exercise all of Telkom's powers to borrow money and to mortgage or encumber Telkom's property or any part
thereof and to issue debentures, whether secured or unsecured, whether outright or as security for any debt, liability or obligation of
Telkom or of any third party. For this purpose, the borrowing powers of the directors are unlimited. Telkom's borrowing powers have
not been exceeded during the past three years. Telkom's borrowing powers may be varied by amending its articles of association.
Non-South African shareholders
Other than as described under "- Limitation on share ownership" beginning on page 156 of this prospectus, there are no
limitations in Telkom's memorandum or articles of association on the right of non-South African shareholders to hold or exercise
voting rights attaching to any of its ordinary shares.
Rights of minority shareholders and fiduciary duties
Majority shareholders of South African companies have no fiduciary obligations under South African common law to minority
shareholders. However, under provisions in the South African Companies Act, 61 of 1973, a shareholder may, under certain
circumstances, seek relief from the court if the shareholder has been unfairly prejudiced. These provisions are designed to provide
relief for oppressed shareholders without necessarily overruling the majority's decision. There may also be common law and
statutory personal actions available to a shareholder of a company.
The fiduciary obligations of directors may differ from those in the United States and certain other countries. Under South
African law, the directors of a company are required to adhere to and act in accordance with two main fiduciary duties, the duty to
act in the best interests of the company and the duty to act with due care and skill. The fiduciary duty to act in the best interests of
the company includes a duty that the directors must avoid a conflict between their personal interests and the interests of the
company, prohibits the directors from using their fiduciary position for personal benefit, prohibits the directors from exceeding the
powers of the company and prohibits the directors from exercising any power for an improper or collateral purpose. The fiduciary
duty to act with due care and skill includes the requirement that the directors must not act negligently, fraudulently or recklessly
and must exercise judgement as to what is in the best interests of the company. South African law provides for personal liability of
directors if they conduct the business of the company fraudulently or recklessly. Under Delaware law, the fiduciary duties of
directors consist of the duty of care, the duty of loyalty and the duty of disclosure. The fiduciary duty of care requires directors to
inform themselves of all material information reasonably available to them prior to making a business decision. The duty of loyalty
prohibits directors from using their position of trust and confidence to further their private interests. The duty of disclosure requires
directors to disclose to stockholders all material facts germane to a transaction involving stockholder approval.
Statement by the JSE
When considering the application for listing by Telkom, and in particular the provisions of Telkom's new articles of association,
the JSE, as well as ensuring that Telkom's new articles of association complied with the specific requirements of the JSE Listings
Requirements, gave considerable attention to the rights being afforded to the holders of the class A ordinary share and class B
ordinary share in those new articles of association in preference to other shareholders.
The JSE believes in the fundamental principle of shareholders having rights in proportion to their actual shareholding in a company.
As a consequence, the JSE is averse to any provision in the articles of association which is contrary to this principle and which affords
rights (voting, economic or otherwise) to particular shareholders without those same rights being afforded to all shareholders. The JSE
also believes strongly in the independence of directors and that the articles should not entrench the rights of certain shareholders to
appoint or remove directors nominated by themselves. The JSE further supports the ideals and principles of good corporate governance
as detailed in the South African King Code of Corporate Practices and Conduct, 2002.
Shareholders' attention is drawn to the fact that the Government and Thintana Communications, in concluding an agreement
between themselves, have deemed it necessary to include in Telkom's new articles of association through the mechanism of the
class A ordinary share and class B ordinary share, certain provisions protecting their rights which are contrary to the
abovementioned principles. These provisions are more fully dealt with under under "Management - Reserved matters" beginning
on page 137 of this prospectus, which effectively limit a shareholder's ability to influence any decision on the reserved matters,
"Management - Board committees - Operating committee" beginning on page 138 of this prospectus, "- Directors" on page 160 of
this prospectus, and "- Limitation on share ownership" beginning on page 156 of this prospectus.
Extracts of Telkom's new memorandum and articles of association containing these provisions are contained in Appendix B
beginning on page B1 of this prospectus.
With regard to the 15% limitation on share ownership, the JSE has required and has been assured that this will be removed from
Telkom's new articles of association or entrenched by appropriate legislation if so desired, by no later than three months after the
listing date. In compliance with the JSE's requirements, the provisions of Telkom's new articles of association relating to the 15%
limitation of share ownership state that these provisions will automatically cease to be of any force unless they are sanctioned by
law within three months of the JSE listing date.
The JSE has agreed to accept Telkom's new articles of association and their approval for the listing in recognition of factors
which are unique to the listing of Telkom, such as:
162
-
it being a major privatization of state assets;
-
the national interest;
-
the existence since 1997 of a binding agreement between the Government and Thintana Communications; and
-
the consequences for the future prospects of South Africa's privatization process should the listing not take place.
This is subject to the overriding "sunset" provision in terms of which extraordinary rights will automatically lapse on the
expiration of eight years from the JSE listing date or the Government or Thintana Communications ceases to be a significant
shareholder, whichever event occurs first.
Comparison of shareholders' rights under South African and Delaware law
The following describes some of the material differences between the rights of shareholders under South African and
Delaware law.
Voting rights, generally
South Africa
Under South African law, every shareholder in a public company has a vote in respect of the shares held by such shareholder in
the issued share capital of the company. The number of votes exercisable by that shareholder is that proportion of the total votes
in the company which the aggregate amount of the nominal value of the shares held by that shareholder bears to the total amount of
the nominal value of all the shares in the company. Any shareholder of a company entitled to attend and vote at a meeting of the
company is entitled to appoint another person or persons, whether a member or not, to act for such shareholder by proxy.
Delaware
Under Delaware law, each stockholder is entitled to one vote for each share of capital stock held by the stockholder, unless
otherwise provided in the certificate of incorporation of the company. Each stockholder entitled to vote at a meeting of stockholders
may authorize another person or persons to act for the stockholder by proxy for up to three years from its date, or for a longer
period if the proxy specifically provides.
Preemptive rights
South Africa
Under South African law, no shareholder shall have preemptive rights to purchase additional securities of a company unless the
organizational documents of the company expressly grant preemptive rights. However, the Listings Requirements of the JSE require
that unissued ordinary shares of a company listed on the JSE be offered first to existing shareholders in proportion to their holdings
of shares of a listed company unless the shares are issued for the acquisition of assets. See "Description of Shares-Issue of
additional shares and pre-emption rights" beginning on page 155 of this prospectus.
Delaware
Delaware law provides that no stockholder shall have preemptive rights to purchase additional securities of the company unless
the certificate of incorporation of the company expressly grants these rights.
Cumulative voting
Cumulative voting is a system for electing directors whereby the number of votes a shareholder is entitled to vote in an election
of directors equals the number of shares held by the shareholder multiplied by the number of open directorships. Under cumulative
voting, a shareholder may cast all or any number of the shareholder's votes for a single candidate or for any number of candidates.
South Africa
Under South African law, shareholders do not have the right to elect directors by cumulative voting. The number of votes that a
shareholder may cast in respect of the appointment of each individual director equals the number of votes generally exercisable by
that shareholder. South African law provides that at a general meeting of a company, a motion for the appointment of two or more
persons as directors of the company by a single resolution shall not be moved, unless a resolution that it shall be so moved has first
been agreed to by the meeting without any vote being given against it.
Delaware
Under Delaware law, stockholders do not have the right to elect directors by cumulative vote unless the right is granted in the
company's certificate of incorporation.
Shareholder approval of corporate matters by written consent
South Africa
Under South African law, any action required to be taken at any annual or other general meeting of a company, other than
actions requiring a special resolution, may be taken without a meeting, without prior notice and without a formal vote, if the
required written consent setting forth that action to be taken and waiving the required prior notice is signed by all shareholders.
163
Delaware
Under Delaware law, any action required to be taken at any annual or special meeting of the stockholders may be taken without
a meeting, without prior written notice and without a vote, if a written consent setting forth the action to be taken is signed
by the number of holders of outstanding stock that would be necessary to authorize or take the action at a meeting at which all
shares entitled to vote thereon were present and voted, unless otherwise provided in the certificate of incorporation of the company.
Prompt notice of the taking of any action by less than unanimous consent must be given to shareholders who did not consent
to the action.
Anti-takeover provisions
South Africa
Under the South African Companies Act, 61 of 1973, the South African Securities Regulation Panel, or SRP regulates certain
transactions and schemes aimed at the take-over of companies such as Telkom in order to ensure the equal treatment of
shareholders. For this purpose, the SRP has promulgated a code, which is loosely based on the U.K. City Code on Take-Overs and
Mergers, setting out general principles and specific rules regulating take-overs and mergers. The SRP requires that a mandatory
offer be made to shareholders, at specified prices, in circumstances where:
-
the offeror acquires more than 35% of the votes exercisable at a general meeting of a company, if the offeror, prior to the
acquisition, held less than 35% of such votes; or
-
the offeror acquires more than 5% of such votes during any twelve month period, if the offeror, prior to the acquisition, held
more than 35%, but less than 50% of such votes.
The SRP code also sets out comprehensive rules regulating the procedures to be followed and the manner in which the offer
should be made. In addition, under the JSE Listings Requirements, a company listed on the JSE is required to obtain shareholder
approval for any transaction between that company and a "material" shareholder if the JSE considers that shareholder to have a
significant interest in or influence over the company. A "material" shareholder is any person who is or within twelve months
preceding the date of the transaction was entitled to exercise or controls the exercise of 10% or more of the votes permitted to be
cast at a general meeting of the company.
Delaware
Delaware law contains a business combination statute that protects Delaware companies from hostile takeovers and from actions
following the takeover by prohibiting some transactions once an acquirer has gained a significant holding in the company.
Section 203 of the Delaware General Corporation Law prohibits "business combinations," including mergers, sales and leases of
assets, issuances of securities and similar transactions by a company or a subsidiary with an interested stockholder that beneficially
owns 15% or more of a company's voting stock, within three years after the person becomes an interested stockholder, unless:
-
the transaction that will cause the person to become an interested stockholder is approved by the board of directors of the
target prior to the transaction;
-
after the completion of the transaction in which the person becomes an interested stockholder, the interested stockholder
holds at least 85% of the voting stock of the company not including shares owned by persons who are directors and also
officers of interested stockholders and shares owned by specified employee benefit plans; or
-
after the person becomes an interested stockholder, the business combination is approved by the board of directors of the
company and holders of at least 66.67% of the outstanding voting stock, excluding shares held by the interested stockholder.
A Delaware company may elect not to be governed by Section 203 by a provision contained in the original certificate of
incorporation of the company or an amendment to the original certificate of incorporation or to the bylaws of the company, which
amendment must be approved by a majority of the shares entitled to vote and may not be further amended by the board of directors
of the company. This amendment is not effective until twelve months following its adoption.
Shareholder access to and inspection of corporate records
South Africa
According to South African law, the register of members of a company is open to inspection by any shareholder or his or her
duly authorized agent. Any person may apply to a company for a copy of or extract from the register of shareholders, and the
company shall either furnish such copy or extract or afford such person adequate facilities for making such copy or extract. If
access to the register of shareholders for the purpose of making any inspection or any copy or extract or facilities for making any
copy or extract is refused or not granted or furnished within fourteen days after a written request to that effect has been delivered to
the company, the company, and any director or officer of the company who knowingly is a party to the refusal or default, shall be
guilty of an offense. The person denied access may apply to court for relief.
164
Delaware
Delaware law allows any stockholder to inspect and make copies of the stock ledger and the other books and records of a
Delaware company for a purpose reasonably related to that person's interest as a stockholder. If the company refuses to permit an
inspection or does not reply to the demand within five business days, the stockholder may apply to the Delaware Court of Chancery
for an order to compel the inspection.
Duties of directors and officers
South Africa
According to South African law, the business and affairs of every company are managed by the board of directors as provided
in the company's organizational documents. The board of directors shall consist of one or more members, each of whom shall
be a natural person. The actual number of directors shall be fixed by the company's organizational documents. Directors need not
be shareholders unless required by the organizational documents. The organizational documents may prescribe other qualifications
for directors as well.
According to South African law, a public company such as Telkom is required to appoint a company secretary and a public
officer. In addition, a public company may appoint further officers in accordance with its organizational documents with such titles
and duties as may be set out in the organizational documents or as may be determined by the company. Any share certificates
signed by two directors of the company, or one director and one other officer of the company authorized by the directors for such
purpose, evidences title to the shares concerned. The duties of the company secretary of a company include ensuring that minutes of
all shareholders' meetings, directors' meetings and meetings of any board committees are properly recorded.
Delaware
According to Delaware law, the business and affairs of every company are managed by the board of directors as provided
in the company's certificate of incorporation. The board of directors consists of one or more members, each of whom is a natural
person. The actual number of directors shall be fixed by the company's bylaws or in its certificate of incorporation. Directors need
not be stockholders unless required by the bylaws or certificate of incorporation. The bylaws or certificate of incorporation may
prescribe other qualifications for directors as well.
Delaware law also requires every company to have officers with titles and duties as are stated in the bylaws or in a resolution of
the board of directors, which is not inconsistent with the bylaws and as may be necessary to enable the company to sign instruments
and stock certificates. One of the officers shall have the duty to record the proceedings of the meetings of the stockholders and
directors. Officers are chosen in the manner and hold their offices for the terms prescribed by the bylaws or determined by the board
of directors or other governing body.
Meetings
South Africa
South African law requires every company to hold an annual general meeting not more than nine months after the end of every
financial year of the company and within not more than fifteen months after the date of the last annual general meeting of the
company. If for any reason an annual general meeting of the company is not or cannot be held in this manner, the South African
Registrar of Companies may, on application by the company or any shareholder or its or legal representative, call or direct the
calling of a general meeting of the company which shall be deemed to be an annual general meeting. South African law requires
that the annual financial statements of the company as well as group financial statements be considered at the annual general
meeting. Furthermore, the company's auditor must be appointed at the annual general meeting and the meeting must address the
business which is required to be dealt with pursuant to the organizational documents of the company. Directors are appointed by a
general meeting, unless otherwise provided in the organizational documents of the company. The JSE Listings Requirements
require that the appointment of a director to fill a casual vacancy or as an addition to the board must be confirmed at the next annual
general meeting of the company.
General meetings of the company may, except insofar as is otherwise provided in the organizational documents of the company,
be called by the board of directors in accordance with the organizational documents of the company or by two or more shareholders
holding not less than one tenth of its issued share capital.
Delaware
Under Delaware law, unless directors are elected by written consent in lieu of an annual meeting, an annual meeting of the
stockholders shall be held for the election of directors on a date and at a time designated by the company's bylaws. Stockholders
may, unless the certificate of incorporation provides otherwise, act by written consent to elect directors. In addition, any other
proper business may be transacted at the annual meeting. If an annual meeting is not held within 30 days of the date designated for
such a meeting, or is not held for a period of 13 months after the last annual meeting, the Delaware Court of Chancery may
summarily order a meeting to be held upon the application of any shareholder or director.
165
Delaware law also permits special meetings of shareholders to be called by the board of directors and by other persons
authorized to do so by the company's certificate of incorporation or bylaws.
Dividends
South Africa
Under South African law, a company may make payments to its shareholders if authorized thereto by its organizational
documents. A company may not make any payment, in whatever form, to its shareholders if there are reasonable grounds for
believing that:
-
the company is or would, after the payment, be unable to pay its debts as they become due in the ordinary course of business; or
-
the consolidated assets of the company fairly valued, after the payment, would be less than the consolidated liabilities of the
company.
Delaware
Under Delaware law, the directors of a company may declare and pay dividends out of surplus or, when no surplus exists,
out of net profits for the fiscal year in which the dividend is declared or the preceding fiscal year, subject to any restrictions
in the company's certificate of incorporation. Dividends may not be paid out of net profits if, after payment of the dividend,
the capital of the company would be less than the capital represented by the issued and outstanding stock of all classes having
a preference upon the distribution of assets.
Repurchase or redemption of shares
South Africa
South African law provides that a company may, by special resolution, if authorized by its memorandum and articles of
association, repurchase or redeem its shares; provided that a company shall not make any payment to repurchase any shares issued
by the company if there are reasonable grounds for believing that the company is or would, after the payment, be unable to pay its
debts or if the consolidated assets of the company would, after the payment, be less than the consolidated liabilities of the company.
Delaware
Delaware law permits a company to repurchase or redeem its shares, provided, however, that no company shall do so when the
capital of the company is impaired or when the purchase or redemption would cause any impairment of the capital of the company,
except that a company may purchase or redeem out of its capital any of its own shares which are entitled upon any distribution
of the company's assets, whether by dividend or liquidation, to a preference over another class or series of its stock, or, if no shares
entitled to such a preference are outstanding, any of its own shares, if the shares will be retired upon their acquisition and the
capital of the company reduced in accordance with Delaware law.
Limitations of liability of directors
South Africa
Under South African law, any provision, whether contained in the organizational documents of a company or in any contract
with a company, that purports to exempt any director or officer of the company from any liability which by law would otherwise
attach to such person in respect of any negligence, default, breach of duty or breach of trust of which the person may - be guilty in
relation to the company or to indemnify the person against any such liability is void. A company may, however, indemnify a
director or officer as described in "Indemnification of officers and directors - South Africa" below. If, in any proceedings for
negligence, default, breach of duty or breach of trust against any director or officer of a company, it appears to the court that the
person concerned is or may be liable, but that the person has acted honestly and reasonably, and that, considering all facts and
circumstances of the case, including those concerned with the person's appointment, the person ought fairly to be excused for the
wrongdoing, the court may relieve the person, either wholly or partly, from liability on terms determined by the court.
Delaware
Delaware law permits a company to include a provision in its certificate of incorporation eliminating or limiting the personal
liability of a director to the company or its shareholders for damages for breach of the director's fiduciary duty, provided that
a director's liability shall not be limited:
-
for any breach of the director's duty of loyalty to the company or its shareholders;
-
for acts or omissions not in good faith or which involve intentional misconduct or a knowing violation of law;
-
under Section 174 of the Delaware General Corporation Law, which concerns unlawful payments of dividends, stock
purchases or redemption; or
-
for any transaction from which the director derived an improper personal benefit.
166
Indemnification of officers and directors
South Africa
Under South African law, the organizational documents of a company may contain a provision indemnifying any director or
officer or auditor in respect of any liability incurred by such person in defending any proceedings, whether civil or criminal, in
which judgment is given in the person's favor, in which the person is acquitted or the proceedings are abandoned or in connection
with any application in which the court relieves the person from liability on the basis that the person acted honestly and reasonably
and that the person ought fairly to be excused for negligence, default, breach of duty or breach of trust.
Delaware
Delaware law provides that, subject to certain limitations in the case of derivative suits brought by a company's stockholders
in its name, a company may indemnify any individual who is made a party to any third-party suit or proceeding on account
of being a director, officer, employee or agent of the company against expenses, including attorneys' fees, judgments, fines and
amounts paid in settlement reasonably incurred by the officer or director in connection with the action, through, among other
things, a majority vote of a quorum consisting of directors who were not parties to the suit or proceeding, if the individual:
-
acted in good faith and in a manner the officer or director reasonably believed to be in or not opposed to the best interests of
the company or, in some circumstances, at least not opposed to its best interests; and
-
in a criminal proceeding, had no reasonable cause to believe the officer's or director's conduct was unlawful.
To the extent a director, officer, employee or agent is successful in the defense of the action, suit or proceeding, the company is
required by Delaware law to indemnify the individual for reasonable expenses incurred thereby.
167
DESCRIPTION OF AMERICAN DEPOSITARY RECEIPTS
American Depositary Receipts
The Bank of New York, as depositary, will execute and deliver the ADRs. ADRs are American Depositary Receipts.
Each ADR is a certificate evidencing a specific number of American Depositary Shares, also referred to as ADSs. Each ADS
will represent 4 shares, or a right to receive 4 shares, deposited with FirstRand Bank Limited, Socit Gnrale South Africa
Limited or The Standard Bank of South Africa Limited, each acting as custodian for the depositary in South Africa. Each ADS will
also represent any other securities, cash or other property which may be held by the depositary. The depositary's office at which the
ADRs will be administered is located at 101 Barclay Street, New York, New York 10286.
You may hold ADRs either directly by having an ADR registered in your name or indirectly through your broker or other
financial institution. If you hold ADRs directly, you are an ADR holder. This description assumes you hold your ADRs directly. If
you hold the ADRs indirectly, you must rely on the procedures of your broker or other financial institution to assert the rights of
ADR holders described in this section. You should consult with your broker or financial institution to find out what those
procedures are.
As an ADR holder, Telkom will not treat you as one of its shareholders and you will not have shareholder rights. South African
law governs shareholder rights. The depositary will be the holder of the shares underlying your ADSs. As a holder of ADRs, you
will have ADR holder rights. A deposit agreement among Telkom, the depositary and you, as an ADR holder, and the beneficial
owners of ADRs set out ADR holder rights as well as the rights and obligations of the depositary. New York law governs the deposit
agreement and the ADSs.
The following is a summary of the material provisions of the deposit agreement. For more complete information, you should
read the entire deposit agreement and the form of ADR. Directions on how to obtain copies of those documents are provided in
"Where You Can Find More Information" on page 194 of this prospectus.
Dividends and other distributions
How will you receive dividends and other distributions on the shares?
The depositary has agreed to pay to you the cash dividends or other distributions it or the custodian receives on shares or other
deposited securities, after deducting its fees and expenses. You will receive these distributions in proportion to the number of shares
your ADSs represent.
Cash
The depositary will convert any cash dividend or other cash distribution Telkom pays on the shares into US dollars, if the
depositary can do so on a reasonable basis and can transfer the US dollars to the United States. If that is not possible or if any
government approval is needed and can not be reasonably obtained, the deposit agreement allows the depositary to distribute the
foreign currency only to those ADR holders to whom it is possible to do so. It will hold the foreign currency it cannot convert for
the account of the ADR holders who have not been paid. It will not invest the foreign currency and it will not be liable for any
interest.
Before making a distribution, the depositary will deduct any withholding taxes that must be paid. If the exchange rates fluctuate
during a time when the depositary cannot convert the foreign currency, you may lose some or all of the value of the distribution.
Shares
The depositary may, and shall if Telkom requests, distribute additional ADSs representing any shares Telkom distributes as a
dividend or free distribution. The depositary will only distribute whole ADSs. It will sell shares which would require it to deliver a
fractional ADS and distribute the net proceeds in the same way as it does with cash. If the depositary does not distribute additional
ADRs, the outstanding ADSs will also represent the new shares.
Before making a distribution, the depositary will deduct any withholding taxes that must be paid.
Rights to purchase additional shares
If Telkom offers holders of its securities any rights to subscribe for additional shares or any other rights, the depositary, after
consulting with Telkom, may make these rights available to you. If the depositary decides it is not legal and practical to make the
rights available but that it is practical to sell the rights, the depositary will use reasonable efforts to sell the rights and distribute the
proceeds in the same way as it does with cash. The depositary will allow rights that are not distributed or sold to lapse. In that case,
you will receive no value for them.
If the depositary makes rights available to you, it will exercise the rights and purchase the shares on your behalf. The depositary
will then deposit the shares and deliver ADSs to you. It will only exercise rights if you pay it the exercise price and any other
charges the rights require you to pay.
168
US securities laws may restrict transfers and cancellation of the ADSs represented by shares purchased upon exercise of rights.
For example, you may not be able to trade these ADSs freely in the United States. In this case, the depositary may deliver restricted
depositary shares that have the same terms as the ADSs described in this section except for changes needed to put the necessary
restrictions in place.
Other distributions
The depositary will send to you anything else Telkom distributes on deposited securities by any means it thinks is equitable and
practical. If, in the depositary's reasonable opinion, it cannot make the distribution in that way, the depositary has a choice. It may,
after consulting with Telkom, decide to sell what Telkom distributed and distribute the net proceeds, in the same way as it does with
cash.
Or, it may decide to hold what Telkom distributed, in which case ADSs will also represent the newly distributed property.
Before making a distribution, the depositary will deduct any withholding taxes that must be paid.
The depositary is not responsible if it decides that it is unlawful or impractical to make a distribution available to any ADR
holders. Telkom has no obligation to register ADSs, shares, rights or other securities under the Securities Act. Telkom also has no
obligation to take any other action to permit the distribution of ADSs, shares, rights or anything else to ADR holders. This means
that you may not receive the distributions we make on our shares or any value for them if it is illegal or impractical for us to make
them available to you.
Deposit, withdrawal and cancellation
How are ADSs issued?
The depositary will deliver ADSs if you or your broker deposit shares or evidence of rights to receive shares with the custodian.
Upon payment of its fees and expenses and of any taxes or charges, such as stamp taxes or stock transfer taxes or fees, the
depositary will register the appropriate number of ADSs in the names you request and will deliver the ADRs at its office to the
persons you request.
How do ADS holders cancel an ADR and obtain shares?
You may turn in your ADRs at the depositary's office. Upon payment of the depositary's fees and expenses and of any taxes or
charges, such as stamp taxes or stock transfer taxes or fees, the depositary will deliver the shares and any other deposited securities
underlying the ADS to you or a person you designate at the office of the custodian. Or, at your request, risk and expense, the
depositary will deliver the deposited securities at its office, if feasible.
Voting rights
How do you vote?
You may instruct the depositary to vote the shares underlying your ADSs, but only if Telkom asks the depositary to ask for your
instructions. Otherwise, you won't be able to exercise your right to vote unless you withdraw the shares. However, you may not
know about the meeting enough in advance to withdraw the shares.
If Telkom asks for your instructions, the depositary will notify you of the upcoming vote and arrange to deliver Telkom's voting
materials to you. The materials will describe the matters to be voted on and explain how you may instruct the depositary to vote the
shares or other deposited securities underlying your ADSs as you direct. For instructions to be valid, the depositary must receive
them on or before the date specified. The depositary will try, as far as practical, subject to South African law and the provisions of
Telkom's memorandum and articles of association, to vote or to have its agents vote the shares or other deposited securities as you
instruct. If the depositary does not receive voting instructions from you by the specified date, it will consider you to have authorized
and directed it to give a discretionary proxy to a person designated by Telkom to vote the number of deposited securities
represented by your ADSs. The depositary will give a discretionary proxy in those circumstances to vote on all questions at to be
voted upon unless Telkom notifies the depositary that Telkom:
-
does not wish to receive a discretionary proxy;
-
thinks there is substantial shareholder opposition to the particular question; or
-
thinks the particular question would have a material and adverse impact on its shareholders.
The depositary will only vote or attempt to vote as you instruct or as described in the preceding sentence.
Telkom cannot assure you that you will receive the voting materials in time to ensure that you can instruct the depositary to vote
your shares. In addition, the depositary and its agents are not responsible for failing to carry out voting instructions or for the
manner of carrying out voting instructions. This means that you may not be able to exercise your right to vote and there may be
nothing you can do if your shares are not voted as you requested.
169
Fees and expenses
The depositary will charge the following fees and expenses:
Persons depositing shares or ADR holders must pay:
For:
$5.00 (or less) per 100 ADSs (or portion of 100 ADSs)
-
Issuance of ADSs, including issuances resulting from a
distribution of shares or rights or other property
-
Cancellation of ADSs for the purpose of withdrawal, including
if the deposit agreement terminates
$.02 (or less) per ADS
-
Any cash distribution to you to the extent not prohibited by
the rules of any securities exchange on which Telkom's ADSs
are listed for trading
A fee equivalent to the fee that would be payable if
-
Distribution of securities distributed to holders of deposited
securities distributed to you had been shares and the
securities which are distributed by the depositary to
shares had been deposited for issuance of ADSs
ADR holders
Registration or transfer fees
-
Transfer and registration of shares on Telkom's share register
to or from the name of the depositary or its agent when you
deposit or withdraw shares
Expenses of the depositary in converting foreign
currency to US dollars
Expenses of the depositary
-
Cable, telex and facsimile transmissions (when expressly
provided in the deposit agreement)
Taxes and other governmental charges the depositary or
the custodian have to pay on any ADR or share underlying
an ADR, for example, stock transfer taxes, stamp duty or
withholding taxes
Any charges incurred by the depositary or its agents for
-
No charges of this type are currently made in the
servicing the deposited securities
JSE market
Payment of taxes
The depositary may deduct the amount of any taxes owed from any payments to you. It may also sell deposited securities,
by public or private sale, to pay any taxes owed. You will remain liable if the proceeds of the sale are not enough to pay the taxes.
If the depositary sells deposited securities, it will, if appropriate, reduce the number of ADSs to reflect the sale and pay to you any
proceeds, or send to you any property, remaining after it has paid the taxes.
If Telkom:
Then:
Changes the nominal or par value of its shares
The cash, shares or other securities received by the depositary will
become new deposited securities. Each ADS will automatically
represent its equal share of the new deposited securities
Reclassifies, splits up, subdivides or consolidates any
The depositary may, in its reasonable discretion, after consulting
of the deposited securities
with Telkom, deliver new ADRs or ask you to surrender your
outstanding ADRs in exchange for new ADRs identifying the new
deposited securities
Distributes securities on the shares that are not distributed
to you
Recapitalizes, reorganizes, merges, liquidates, sells all
or substantially all of its assets, or takes any similar action
170
Amendment and termination
How may the deposit agreement be amended?
Telkom may agree with the depositary to amend the deposit agreement and the ADRs without your consent for any reason,
provided, however, that in no event shall any amendment impair your rights to surrender your ADR and receive the deposited
securities represented by it, except in order to comply with mandatory provisions of applicable laws. If an amendment adds
or increases fees or charges, except for taxes and other governmental charges or expenses of the depositary for registration fees,
facsimile costs, delivery charges or similar items, or prejudices a substantial right of ADR holders, it will not become effective for
outstanding ADRs until 30 days after the depositary notifies ADR holders of the amendment. At the time an amendment becomes
effective, you are considered, by continuing to hold your ADR, to agree to the amendment and to be bound by the ADRs and the
deposit agreement, as amended.
How may the deposit agreement be terminated?
The depositary will terminate the deposit agreement if Telkom asks it to do so. The depositary may also terminate the deposit
agreement if the depositary has told Telkom that it would like to resign and Telkom has not appointed a new depositary bank within
90 days. In either case, the depositary must notify you at least 30 days before termination.
After termination, the depositary and its agents will do the following under the deposit agreement but nothing else: (1) collect
dividends and other distributions on the deposited securities; (2) sell rights and other property and (3) deliver shares and other
deposited securities upon cancellation of ADRs. Six months after termination, the depositary may sell any remaining deposited
securities by public or private sale. After that, the depositary will hold the money it received on the sale, as well as any other cash
it is holding under the deposit agreement, for the pro rata benefit of the ADR holders who have not surrendered their ADRs.
It will not invest the money and has no liability for interest. The depositary's only obligations will be to account for the money and
other cash and indemnify Telkom. After termination Telkom's only obligations will be to indemnify the depositary and to pay fees
and expenses of the depositary that Telkom agreed to pay.
Limitations on obligations and liability
Limits on Telkom's obligations and the obligations of the depositary; limits on liability to holders of ADRs
The deposit agreement expressly limits Telkom's obligations and the obligations of the depositary. It also limits Telkom's
liability and the liability of the depositary. Telkom and the depositary:
-
are only obligated to take the actions specifically set forth in the deposit agreement without negligence or bad faith;
-
are not liable if either of us is prevented or delayed by law or circumstances beyond our control from performing our
obligations under the deposit agreement;
-
have no obligation to become involved in a lawsuit or other proceeding related to the ADRs or the deposit agreement on your
behalf or on behalf of any other party unless it receives an indemnity for all expenses and liability that is satisfactory to it;
and
-
are not liable for any action or non-action by either of us if such action or non-action occurred in reliance upon the advice
of or information from legal counsel, accountants, any person presenting shares for deposit, any owner or beneficial owner
or any other person believed by either of us in good faith to be competent to give advice or such information.
The depositary is not liable for acts and omissions made by a successor depositary whether in connection with a previous act of
the depositary, unless the depositary acted with negligence and/or bad faith.
In the deposit agreement, we agree to indemnify the depositary for acting as depositary, except for losses caused by the
depositary's own negligence or bad faith, and the depositary agrees to indemnify Telkom for losses resulting from its negligence or
bad faith.
Requirements for depositary actions
Before the depositary will deliver or register a transfer of an ADR, make a distribution on an ADR, or permit withdrawal of
shares, the depositary may require:
-
payment of stock transfer or other taxes or other governmental charges and transfer or registration fees charged by third
parties for the transfer of any shares or other deposited securities;
-
satisfactory proof of the identity and genuineness of any signature or other information it deems necessary; and
-
compliance with regulations it may establish, from time to time, consistent with the deposit agreement, including
presentation of transfer documents.
171
The depositary may refuse to deliver ADRs or register transfers of ADRs generally when the transfer books of the depositary or
Telkom's transfer books are closed or at any time if the depositary or Telkom thinks it advisable to do so.
Your right to receive the shares underlying your ADRs
You have the right to cancel your ADRs and withdraw the underlying shares at any time except:
-
When temporary delays arise because: (i) the depositary has closed its transfer books or Telkom has closed its transfer
books; (ii) the transfer of shares is blocked to permit voting at a shareholders' meeting; or (iii) Telkom is paying a dividend
on its shares.
-
When you or other ADR holders seeking to withdraw shares owe money to pay fees, taxes and similar charges.
-
When it is necessary to prohibit withdrawals in order to comply with any laws or governmental regulations that apply to
ADRs or to the withdrawal of shares or other deposited securities.
This right of withdrawal may not be limited by any other provision of the deposit agreement.
Pre-release of ADRs
The deposit agreement permits the depositary to deliver ADRs before deposit and receipt of the underlying shares, unless
Telkom has requested the depositary to cease doing so. This is called a pre-release of the ADR. The depositary may also deliver
shares upon cancellation of pre-released ADRs (even if the ADRs are canceled before the pre-release transaction has been closed
out). A pre-release is closed out as soon as the underlying shares are delivered to the depositary. The depositary may receive ADRs
instead of shares to close out a pre-release. The depositary may pre-release ADRs only under the following conditions:
(1) before or at the time of the pre-release, the person to whom the pre-release is being made represents to the depositary in writing
that it or its customer owns the shares or ADRs to be deposited; (2) the pre-release is fully collateralized with cash, US government
securities, or other collateral that the depositary considers equally liquid and safe; and (3) the depositary must be able to close out
the pre-release on not more than five business days' notice. In addition, the depositary will limit the number of ADRs that may
be outstanding at any time to 30% as a result of pre-release, although the depositary may disregard the limit from time to time if it
thinks it is reasonably appropriate to do so.
Compliance with our charter; disclosure of beneficial ownership; ownership restrictions
Your rights as a holder of ADRs will be subject to Telkom's memorandum and articles of association as if you were a holder
of shares and to all applicable provisions of South African law. Telkom has the right to restrict transfers of ADRs to prevent
violation of ownership limitations under Telkom's memorandum and articles of association charter or applicable law.
As a holder of ADRs, you agree to provide information that Telkom or the depositary requests about the capacity in which you
own ADSs and the identity of any other persons that have or share beneficial ownership of your ADSs and other matters.
172
NATURE OF THE SOUTH AFRICAN TRADING MARKET
The JSE was formed in 1887. The JSE provides facilities for the buying and selling of a wide range of securities, including
equity and corporate debt securities.
The JSE is a self-regulatory organization operating under the supervision of the Ministry of Finance, through the Financial
Services Board and its representative, the Registrar of Stock Exchanges. Following the introduction of the Stock Exchange Control
Amendment Act, 54 of 1995, or the Amendment Act, which provides the statutory framework for the deregulation of the JSE, the
JSE's Rules were amended with effect from November 8, 1995. These amendments removed the restrictions on corporate
membership and allowed stockbrokers to form limited liability corporate entities with foreign ownership. Members were, for the
first time, also required to keep client funds in trust accounts separate from the members' own funds. Further rules to complete the
deregulation of the JSE, as envisioned by the Amendment Act, were promulgated during 1996 to permit members of the JSE to
trade either as agents or as principals in any equity transactions and to allow members to negotiate freely the brokerage
commissions payable on agency transactions in equities.
Screen trading commenced on the JSE on the JSE Equities Trading, or JET trading system, in March 1996 in respect of certain
securities and by June 7, 1996 all securities listed on the JSE were screen traded and the open outcry floor was closed. In July 2001,
the JSE concluded a business agreement and a technology agreement with the London Stock Exchange. Pursuant to the technology
agreement, the JSE agreed to replace its existing JET trading system with the trading platform of the London Stock Exchange,
called the Stock Exchange Trading System, or SETS. Under the business agreement, the JSE and the London Stock Exchange
agreed to co-operate in the marketing of the other exchange's data and to introduce reciprocal remote membership and dual primary
listings of each other. The implementation of these agreements is subject to exchange control permission which the JSE is currently
seeking. In May 2002, the SETS system replaced the then current JET trading system. In April 2001, the JSE entered into a joint
venture agreement with the Financial Times Stock Exchange, or FTSE, in terms of which the JSE and FTSE agreed to review the
JSE's then existing indices and to replace them with indices which embraced FTSE's international index ground rules. On June 24,
2002, FTSE took over the calculation of the JSE's indices when the FTSE/JSE Africa Index Series was introduced. At the same
time, the JSE introduced a new stock classification system based on FTSE's Global Classification System. Accordingly, South
African stocks are now classified according to a global system familiar to users of the FTSE indices. In early July 2002, the
Commodities Futures Trading Commission granted the JSE no action relief in respect of futures contracts listed by the JSE on
the FTSE/JSE Top 40 Index.
The total market capitalization of all equity securities listed on the JSE was R1,295 billion as of August 31, 2002. The change
over to the JSE/FTSE indices also involved the implementation of free floats, thereby giving a more accurate reflection of the size,
or investibility, of the market. Prior to the introduction of JSE/FTSE indices, indices were calculated on a total market capitalization
basis and the indices did not take into account cross-holdings or pyramid group structures, thereby inflating the "true" size of the
market and, accordingly, its investibility. Liquidity on the JSE, which is measured by reference to the total market value of
securities traded as a percentage of the total market capitalization, was 34% for the 12 months ended December 31, 2001 and
46% for the 12 months ended August 31, 2002. Trading is concentrated in a growing, but small number of companies.
As of August 31, 2002, there were 500 listed companies on the JSE.
South Africa was included in both the Morgan Stanley Capital International Emerging Markets Free Index, or the MSCI Index,
and the International Finance Corporation Investable Index, or IFC Index, in March and April 1995, respectively. South Africa has a
significant representation in these emerging markets indices, with weightings of 11.5% in the MSCI's Index and 8.7% in the
IFC Index as of March 31, 2002.
Dividends of South African companies, if paid at all, are generally paid twice a year. As of August 31, 2002, the average
dividend yield for companies listed on the JSE was 3%. We cannot assure you that we will pay dividends or that, if we do pay
dividends that our dividend yield will equal or exceed the average dividend yield for companies listed on the JSE. See "Dividends
and Dividend Policy" beginning on page 24 of this prospectus.
Following the introduction of the FTSE free float indices, the All Share Index, a free float weighted composite index of all
companies listed on the JSE, included only those companies that constitute the top 99% of the market capitalization of the JSE.
The three main sectors in the market are Resources, Financials and Industrials. As of August 31, 2002, the All Share Index included
158 companies and the Financial and Industrial Index and the Resources Index included 138 and 20 companies, respectively, and
accounted for 53% and 47%, respectively, of the total market capitalization of the JSE.
The JSE settles securities trades electronically through Share Transactions Totally Electronic Limited, or STRATE, the central
securities depositary for the South African equities market. All trades are downloaded from the JSE SETS automated trading system
to the JSE's broker deal accounting system, which manages the settlement status of every trade. The broker deal accounting system
interfaces with STRATE's system, which in turn interfaces with those of the custodian banks. The JSE's Settlement Authority
monitors all trades from time of execution to settlement to ensure performance. Since the introduction of STRATE, there have not
been any failed trades of any nature on the JSE.
Shares may not be traded on the JSE unless they have been dematerialized through STRATE. Contractual, rolling settlement has
been introduced by the JSE in order to increase the speed, certainty and efficiency of the settlement mechanism and to fall into line
with international practices. While settlement on the JSE is currently made five days after each trade, five days or T+5, the JSE
in conjunction with STRATE, is exploring with the industry how best to reduce the settlement period further to three days or T+3
without introducing undue risk.
173
TAXATION
The following is a summary of the material South African and US tax consequences in connection with the acquisition, ownership
and disposition of the ordinary shares and ADSs. The following summary is not a comprehensive description of all of the tax
considerations that may be relevant to a decision to acquire purchase, own or dispose of our shares or ADSs and does not cover tax
consequences that depend upon your particular tax circumstances. This discussion is only a general discussion; it is not a substitute
for tax advice. We believe and the summary assumes that we are not and will not become a foreign personal holding company
("FPHC") for US federal income tax purposes, but there can be no assurance that we will not become a FPHC in the future.We recommend that you consult your own tax advisor about the consequences of holding our ordinary shares or ADSs, as
applicable, in your particular situation. The discussion in this section is based on current law. Changes in the law may alter the tax
treatment of our ordinary shares or ADSs, as applicable, possibly on a retroactive basis.
South African tax matters
Withholding tax on dividends
Effective October 1, 1995, the Republic of South Africa repealed all legislation imposing any withholding tax on dividends.
Accordingly, we will not be obliged to withhold any tax on dividends paid by us to our shareholders whether or not resident
in the Republic of South Africa. Any future decision to re-impose a withholding tax on dividends declared by South African
residents to non-resident shareholders is generally permissible under the terms of a reciprocal tax treaty entered into between
the Republic of South Africa and the United States in 1997. That treaty, however, provides that any withholding tax introduced
in the future shall be limited to:
-
5% of the gross amount of the dividends declared, provided that the beneficial owner of the shares on which the relevant
dividends are declared is a company holding at least 10% of the voting stock of the relevant company declaring such dividend;
and
-
15% of the gross amount of the dividends declared by the relevant company in all other cases.
Although no withholding tax is payable on dividends declared by a South African resident, South Africa has a secondary tax on
companies, or STC, which is 12.5% of the net amount of the dividend. Although the STC is the liability of the South African
resident company which declares the dividend, it would reduce the amount available for distribution. See "- Secondary tax on
companies" on page 175 of this prospectus.
Income taxes relating to shareholders
In principle, South African residents are taxed on their worldwide income regardless of the source thereof. Non-residents are,
subject to certain exemptions, taxed in relation to income derived from a source within or deemed to be within the Republic of
South Africa. These exceptions include normal dividends received from South African companies, such as Telkom; interest
received from certain sources, including stocks or securities issued by the government, provided the non-resident is not a resident
in a neighboring country, was physically absent from South Africa for at least 183 days during the particular year and does not
carry on a business in South Africa; and interest received where the non-resident meets certain requirements regarding physical
absence from South Africa, is not a resident of any of the countries in the common monetary area and does not carry on a trade in
South Africa.
Under South African tax law, a natural person is deemed to be a resident if the person is ordinarily resident in the Republic of
South Africa or, if not ordinarily resident during any particular year of assessment for tax purposes, the person was physically present in
the Republic of South Africa for certain prescribed periods in the three years prior to and during the tax year in question. Non-natural
persons, including companies and trusts, are deemed to be resident in the Republic of South Africa for tax purposes if they were
incorporated or formed in the Republic of South Africa or have their place of effective management in the Republic of South Africa.
Generally, income tax is payable on the profits derived from the disposal of shares in a South African company by residents
of the Republic of South Africa if the profits derived from such disposal are of a revenue nature as opposed to a capital nature.
Essentially, a profit is viewed as being of a revenue nature if it is made pursuant to the operation of a business or scheme of profit
making and not incidentally or as a result of a mere realization of a share held for long-term investment purposes. In determining
whether the income derived from the disposal of such shares is of a capital or revenue nature, the South African tax authorities and
courts look at, among other things, the intention of the holder of the shares to determine whether the disposal gave rise to a capital
or a revenue profit. Currently profits derived from the disposal of South African shares held as long-term investments are generally
regarded to be profits of a capital nature and are not subject to South African income tax; however, please see "- Capital gains tax"
beginning on page 174 of this prospectus for a discussion of the imposition of capital gains tax. The distribution of profits by way
of dividends paid by a South African resident company, such as Telkom, in the ordinary course, is not deductible by the company
and is exempt from South African taxation for the recipient.

174
If a non-resident shareholder trades in South African shares, such non-resident shareholder would be subject to South African
income tax if the proceeds from the disposal would be seen as being from a South African source, which would generally be the
case where the trading activities take place in South Africa.
To the extent that any share is acquired at a discount to market price, there is a risk that the relevant discount could be regarded
as an income tax taxable benefit in the hands of the relevant shareholder if that shareholder is an employee or director of Telkom
and that share was acquired from Telkom, its associated institutions or a third party by arrangement with it, or if that shareholder is
an employee of the Government of the Republic of South Africa and that share was acquired from the Government, its associated
institutions or a third party by arrangement with it.
Should a non-resident be subject to South African tax pursuant to the South African legislation, the tax treaty between South
Africa and the United States may provide such non-resident with tax relief. The tax treaty between South Africa and the United
States provides that profits of an enterprise of a US resident shall only be taxed in South Africa if such US resident carries on a
business in South Africa through a permanent establishment situated in South Africa. Thus if South Africa has taxing rights to any
profits generated by the disposal of shares by a US resident to the extent that such US resident carries on business through a
permanent establishment in South Africa and the share dealing activities form part of such permanent establishment's business, the
US resident will, in principle, be taxed on the profits of the disposal to the extent that such profits are from a source within or
deemed to be within South Africa.
Income taxes
As discussed above, income tax is levied in the Republic of South Africa only on income which is classified to be of a revenue
nature. South African companies are subject to corporate income tax of 30% of their taxable income. See also "- Secondary tax on
companies" on page 175 of this prospectus.
Capital gains tax
Capital gains tax was introduced into the South African taxation system with effect from October 1, 2001. Capital gains tax was
introduced by way of an amendment to the South African Income Tax Act, 58 of 1962 to incorporate therein a substantive new
schedule known as the Eighth Schedule. The relevant capital gains tax rates are summarized in the table below.
Capital gains tax is imposed on certain capital gains arising from the disposal or deemed disposal of an asset and a prescribed
portion of the capital gain, as set out in the table below, will be included in a taxpayer's taxable income. An asset is very broadly
defined in the legislation and includes shares in a South African company. If, however, the profits of the disposal were subject to
income tax, no capital gains tax liability would arise.
Capital gains or losses are calculated separately with respect to each asset disposed of and then aggregated to ultimately
calculate the taxpayer's total taxable capital gain or loss. Each capital gain is determined by deducting from the proceeds accruing
to the taxpayer from the relevant disposal, the base cost of the asset and each portion of the proceeds already subject to income tax.
The base cost includes all direct costs in respect of the acquisition, improvement and disposal of the asset. The net capital gain, in
the case of natural persons only, is reduced by an annual exclusion of R10,000.
The following table sets out the prescribed portion of a capital gain that would be included in a taxpayers' taxable income, the
normal tax rates applicable to taxpayers and, consequently, the effective rate at which capital gains are taxed:
Prescribed portion
of the capital gain
included in taxable
Statutory
income expressed
income tax
Type of taxpayer
as a percentage
rate
Effective rate
(%)
(%)
(%)
Individuals . . . . . . . . . . . . . . . . . . . . . . . . . . .
25
040
010
Retirement funds . . . . . . . . . . . . . . . . . . . . . . . .
n/a
n/a
n/a
Trusts
Special . . . . . . . . . . . . . . . . . . . . . . . . . . . .
25
040
010
Other . . . . . . . . . . . . . . . . . . . . . . . . . . . . .
50
40
20
Life assurers
Individual policyholder fund . . . . . . . . . . . . . . . . .
25
30
7.5
Company policyholder fund . . . . . . . . . . . . . . . . .
50
30
15
Corporate fund . . . . . . . . . . . . . . . . . . . . . . . .
50
30
15
Untaxed policyholder fund . . . . . . . . . . . . . . . . . .
0
0
0
Companies . . . . . . . . . . . . . . . . . . . . . . . . . . .
50
30
15
Permanent establishments (branches) . . . . . . . . . . . . .
50
35
17.5
Small business corporations . . . . . . . . . . . . . . . . . .
50
1530
7.515
Employment companies . . . . . . . . . . . . . . . . . . . .
50
35
17.5
Collective investment schemes . . . . . . . . . . . . . . . . .
050
030
015
175
The legislation makes provision, in certain circumstances, for a set-off of capital losses against capital gains and a carry forward
of capital losses.
To the extent a non-resident makes a capital gain on the disposal of shares, such gain will be taxed in South Africa if the shares
form part of the assets of a permanent establishment through which trade is carried on in South Africa. Capital gains tax applies
where a non-resident, alone or with any connected person, holds at least 20% of the equity of a company or other entity and 80% or
more of the non-trading assets of such company or other entity such as Telkom comprise immovable property located in South
Africa. However, pursuant to the tax treaty between South Africa and the United States, South Africa only has taxing rights to the
extent that the shares disposed of form part of the business property of a permanent establishment in South Africa.
Stamp duty
South African stamp duty, or uncertificated securities tax in an electronic environment, is payable by companies upon the issue
of shares, at a rate of 0.25% of the value or issue price of the shares.
On a subsequent registration of transfer of shares, South African stamp duty is generally payable for off-market transactions,
which are transactions other than through a stockbroker, and a marketable securities tax is generally payable for on-market
transactions, which are transactions through a stockbroker, each at 0.25% of the arm's length consideration payable for the share
concerned. In respect of transactions involving uncertificated or dematerialized shares, uncertificated securities tax is payable at the
same rates as set out above on every change in beneficial ownership thereof pursuant to the Uncertificated Securities Tax Act, 31 of
1998.
Uncertificated shares are shares that are not evidenced by a certificate and are transferable without a written instrument.
South African stamp duty and marketable securities taxes are generally payable on shares in a South African company regardless
of whether the transfer is executed within or outside South Africa. There are certain exceptions to the payment of stamp duty and
marketable securities tax where, for example, the instrument of transfer is executed outside South Africa and registration of transfer
is effected in any branch register kept by the relevant company, subject to certain provisions set forth in the South African Stamp
Duties Act, 77 of 1968. Transfers of ADSs between non-residents of South Africa are not subject to South African stamp duty or
marketable securities tax; however, if shares are withdrawn from the deposit facility, stamp duty or marketable securities tax is
payable on the subsequent transfer of the shares. An acquisition of shares from the depositary in exchange for ADSs representing
the shares, including an acquisition upon termination of a deposit arrangement, renders an investor liable to South African stamp
duty or marketable securities tax at the same rate as stamp duty or marketable securities tax on a subsequent transfer of shares,
upon the registration of the investor as the holder of shares on a company's register.
Secondary tax on companies
Secondary tax on companies or STC is payable in the Republic of South Africa by resident companies of the Republic of South
Africa at a rate of 12.5% based on the net amount of dividends declared by a company during any dividend cycle. The net amount
of dividends declared by a company is the excess of the dividends declared by the company over the amount of most dividends
accruing to the company during the relevant dividend cycle. A dividend cycle runs from the date of declaration of a dividend to the
date of declaration of the next dividend. Any excess of dividends accruing to a company in a relevant dividend cycle, excluding
those foreign dividends which are not exempt from South African income tax, over the dividends paid in such cycle are carried
forward by the company to the succeeding dividend cycle as an STC credit.
The imposition of STC, together with the corporate income tax discussed above, effectively imposes a dual corporate tax system
in the Republic of South Africa with the liability for each of STC and normal corporate income tax being separately determined.
Accordingly, a company without a normal tax liability may have a liability for STC, and vice versa, and may be liable for both
normal tax and STC on profits distributed. STC creates an effective tax rate on companies of 37.78%. Capitalization shares awarded
and distributed in lieu of cash dividends do not incur STC at that stage and it has become common practice for listed South African
companies to offer capitalization shares in lieu of cash dividends. No South African tax, including withholding tax, is payable in
respect of the receipt of these shares by the recipients thereof. However, STC will arise to the extent capitalized profits used to
award the capitalization shares are subsequently paid to shareholders whether in connection with a liquidation of the company or a
share buy-back.
United States tax matters
The following discussion sets forth the material US federal income tax consequences of the ownership and disposition of our
ordinary shares or ADSs relevant to US holders, and in certain circumstances, Non-US holders, as of the date of this prospectus.
This discussion is based on the US Internal Revenue Code of 1986, as amended, existing final, temporary and proposed Treasury
Regulations, rulings and judicial decisions, all as of the date hereof and all of which are subject to prospective or retroactive
changes, which could affect the tax consequences as described below. This discussion is based in part upon representations of the
depositary made to us and the assumption that each obligation in the deposit agreement and any related agreements will be
performed in accordance with its terms.
176
This discussion does not purport to address all US federal income tax consequences that may be relevant to a particular investor.
This discussion applies to you only if you hold our ordinary shares or ADSs, as applicable, as a capital asset for tax purposes,
generally, for investment purposes, within the meaning of Section 1221 of the US Internal Revenue Code of 1986. This discussion
does not address the tax consequences that may be relevant to you if you are a member of a class of holders subject to special rules,
including:
-
dealers in securities or currencies;
-
traders in securities that elect to use a mark-to-market method of accounting for securities holdings;
-
banks or other financial institutions;
-
insurance companies;
-
tax-exempt organizations;
-
persons that hold our ordinary shares or ADSs as part of a straddle or a hedging, integrated, constructive sale or conversion
transaction for tax purposes;
-
persons whose functional currency, as defined in Section 985 of the US Internal Revenue Code of 1986, for tax purposes is
not the Dollar;
-
persons resident or ordinarily resident in South Africa;
-
persons liable for alternative minimum tax;
-
persons that own, or are treated as owning, directly, indirectly or constructively, ten percent or more of the total combined
voting power of our ordinary shares or ADSs;
-
a US expatriate or former long-term resident of the US;
-
a person who acquired the shares as compensation;
-
a regulated investment company; or
-
a real estate investment trust.
Further, this discussion does not address the indirect consequences to holders of equity interests in entities, for instance,
partnerships, that own ordinary shares or ADSs. In addition, this discussion does not address any aspect of US federal gift
or estate tax, or the state, local or foreign tax consequences of an investment in the ordinary shares or ADSs.
For purposes of the discussion below, you are a US holder if you are a beneficial owner of our ordinary shares
or ADSs who or which is:
-
a citizen or resident of the United States;
-
a corporation, or entity taxable as a corporation, that was created or organized in or under the laws of the United States
or any State of the United States, including the District of Columbia;
-
an estate the income of which is subject to US federal income tax regardless of its source; or
-
a trust if: (a) a court within the United States is able to exercise primary supervision over its administration and one or more
US persons have the authority to control all substantial decisions of the trust or (b) the trust was in existence on
August 20, 1996, and on August 19, 1996 was treated as a domestic trust and has elected to be treated as a US person.
A non-US holder is a beneficial owner of our ordinary shares or ADSs who is not a US holder.
Tax consequences to US holders
For US federal income tax purposes, if you are the beneficial owner of ADSs you will be treated as the beneficial owner of the
underlying shares represented by the ADSs.
Distribution
Subject to the passive foreign investment company discussion below, distributions, other than ordinary shares, if any, distributed
pro rata to all our shareholders, including holders of ADSs, with respect to ordinary shares or ADSs will be a dividend to the extent
those distributions are made out of our current and accumulated earnings and profits, as determined for US federal income tax
purposes. Any such distribution generally will be included in your gross income as foreign source ordinary income on the date the
distribution is received, which in the case of a US holder of ADSs will be the date of receipt by the depositary. Distributions in
excess of our current and accumulated earnings and profits will be treated first as a nontaxable return of capital, reducing your tax
basis in the ordinary shares or ADSs. Any such distribution in excess of your tax basis in the ordinary shares or ADSs will be
treated as capital gain and will be either long-term or short-term depending upon whether you have held the ordinary shares or
ADSs for more than one year.
Dividends paid by us will not be eligible for the dividends received deduction available to certain US corporate shareholders.
Because we do not calculate our earnings and profits under US rules, you will not be able to demonstrate that a dividend is not out
of earnings and profits.
177
We expect to pay distributions on the ordinary shares and ADSs in South African Rands. Dividends paid in South African Rands
generally will be included in your gross income in a US Dollar amount calculated by reference to the exchange rate in effect on the
day you, in the case of ordinary shares, or the depositary, in the case of ADSs, receive the dividend whether or not the payment is
converted into Dollars at that time. Any gain or loss that you recognize on a subsequent conversion of Rands into Dollars will be
US source ordinary income or loss.
Dispositions
Subject to the passive foreign investment company discussion below, you generally will realize capital gain or loss upon the sale
or other disposition of the ordinary shares or ADSs measured by the difference between the amount realized on the sale or other
disposition and your tax basis in the ordinary shares or ADSs, which is generally the cost of the ordinary shares or ADSs reduced
by any previous distributions that are not characterized as dividends. Any recognized gain or loss will be long-term capital gain or
loss if the ordinary shares or ADSs have been held for more than one year on the date of the sale or other disposition. In general,
any capital gain or loss recognized will be treated as US source income or loss, as the case may be, for US foreign tax credit
purposes.
Your ability to deduct capital losses may be subject to limitations.
If you receive Rands upon the sale or other disposition of our shares, you will realize an amount equal to the US Dollar value of
the Rands on the date of the sale or other disposition (or in the case of cash basis and electing accrual basis taxpayers, the
settlement date). You will have a tax basis in the Rands received equal to the US Dollar amount of the Rands received. Any gain or
loss you realize on a subsequent conversion of Rands into US Dollars generally will be US source ordinary income or loss.
You may incur South African stamp duty or MST in connection with a subsequent registration or transfer of ordinary shares. See
"South African tax matters - Stamp duty" on page 175 of this prospectus. In such case stamp duty or MST, as applicable,
will not be a creditable tax for US foreign tax credit purposes.
Passive foreign investment company
We do not believe that we are, for US federal tax purposes, a passive foreign investment company (a "PFIC"), and expect to
continue our operations in such a manner that we will not become a PFIC. A determination of whether a non-US company is a
PFIC must be made on an annual basis, and our status could change depending among other things upon changes in our activities
and assets and upon the gross receipts of corporations of which we own a 25 percent or more interest, but which we do not control.
If we were to become a PFIC, US holders would be subject to additional federal income taxes on any excess distributions received
and any gain realized from the sale or other disposition of the ordinary shares or ADSs plus an interest charge on certain taxes
treated as having been deferred by US holders under the PFIC rules (whether or not we continue to be a PFIC).
US holders should consult their own tax advisors concerning the United States federal income tax consequences of holding
ordinary shares or ADSs if we are considered a PFIC in any taxable year, including the advisability and availability of making
certain elections that may alleviate the tax consequences referred to above.
Tax consequences for non-US holders
You generally will not be subject to US federal income tax or withholding tax on dividends received from us with respect
to ordinary shares or ADSs unless that income is considered effectively connected with the conduct of a US trade or business,
and if an applicable income tax treaty so requires as a condition for you to be subject to US federal income tax on a net income
basis in respect of income from our ordinary shares or ADSs, as applicable, such dividends are attributable to a permanent
establishment that you maintain in the United States.
You generally will not be subject to US federal income tax on any gain realized upon the sale or exchange of ordinary shares
or ADSs, unless:
-
that gain is effectively connected with the conduct of a US trade or business, and if an applicable income tax treaty so
requires as a condition for you to be subject to US federal income tax on a net income basis in respect of gain from the sale
or other disposition of our ordinary shares or ADSs, as applicable, such gain is attributable to a permanent establishment
maintained by you in the United States; or
-
you are an individual and are present in the United States for at least 183 days in the taxable year of the sale or other
disposition, and either your gain is attributable to an office or other fixed place of business that you maintain in the United
States or you have a tax home in the United States.
If you are engaged in a US trade or business, the income from ordinary shares or ADSs, including dividends and the gain from
the disposition of ordinary shares or ADSs, that is effectively connected with the conduct of that trade or business generally will be
subject to regular US federal income tax in the same manner as income of a US Holder, as discussed above. In addition, if you are
a corporation, your earnings and profits that are attributable to that effectively connected income, subject to certain adjustments,
may be subject to an additional branch profits tax at a rate of 30%, or any lower rate as may be specified by an applicable tax treaty.
178
Information reporting and backup withholding
Backup withholding and information reporting requirements may apply to payments within the United States on our ordinary
shares or ADS, including certain payments of the proceeds of a sale or redemption of our ordinary shares or ADSs, to US holders.
We, our agent, a broker, the Trustee or any paying agent, as the case may be, may be required to withhold tax from any payment
that is subject to backup withholding if the US holder fails to furnish the US holder's taxpayer identification number, to certify that
such US holder is not subject to backup withholding, or to otherwise comply with the applicable requirements of the backup
withholding rules. Pursuant to recently enacted tax legislation, the backup withholding rate is 30% for calendar years 2002 and
2003; 29% for calendar years 2004 and 2005; and 28% for calendar years 2006 through 2010. This legislation is scheduled to
expire and the backup withholding rate will be 31% for amounts paid after December 31, 2010 unless Congress enacts legislation
providing otherwise. US holders required to establish their exempt status must generally provide such certification on
IRS Form W-9, entitled Request for Taxpayer Identification Number. Certain US holders, including, among others, corporations,
are not subject to the backup withholding and information reporting requirements.
Non-US holders generally are not subject to information reporting or back-up withholding with respect to dividends paid on, or
upon the disposition of, our ordinary shares or ADSs, provided that such non-US Holder provides a taxpayer identification number,
certifies to its foreign status, or otherwise establishes an exemption. Non-US holders required to establish their exempt status must
generally provide such certification on IRS Form W8-BEN, entitled Certificate of Foreign Status.
The amount of any back-up withholding will be allowed as a credit against a holder's US federal income tax liability and may
entitle such holder to a refund, provided that certain information is furnished to the IRS.
PROSPECTIVE PURCHASERS OF ORDINARY SHARES OR ADSs SHOULD CONSULT WITH THEIR OWN TAX
ADVISORS REGARDING THE APPLICATION OF THE US FEDERAL INCOME TAX LAWS TO THEIR
PARTICULAR SITUATIONS AS WELL AS TO ANY ADDITIONAL TAX CONSEQUENCES RESULTING FROM
PURCHASING, HOLDING OR DISPOSING OF SHARES INCLUDING THE APPLICABILITY AND EFFECT OF THE
TAX LAWS OF ANY STATE, LOCAL OR FOREIGN JURISDICTION, AND ESTATE, GIFT, AND INHERITANCE
LAWS.
179
EXCHANGE CONTROLS
The following is a summary of the material South African exchange control measures, which has been derived from publicly
available documents. The following summary is not a comprehensive description of all of the exchange control regulations and does
not cover exchange control consequences that depend upon your particular circumstances. We recommend that you consult your
own advisor about the exchange control consequences in your particular situation. The discussion in this section is based on the
current South African law and regulations. Changes in the law may alter the exchange control provisions that apply to you, possibly
on a retroactive basis.
Introduction
Dealing in foreign currency, the export of capital and/or revenue, incurring of liabilities by residents to non-residents and various
other exchange control matters in South Africa are regulated by the South African exchange control regulations. The South African
exchange control regulations form part of the general monetary policy of South Africa. The regulations are issued pursuant to
section 9 of the Currency and Exchanges Act, 9 of 1933. Pursuant to the regulations, the control over South African capital and/or
revenue reserves, as well as their accruals and spending, is vested in the Minister of Finance.
The Minister of Finance has delegated the administration of exchange controls to the Exchange Control Department of the
South African Reserve Bank, or Excon, which is responsible for the day to day administration and functioning of exchange
controls. Excon has wide discretion but exercises its powers within certain policy guidelines. Within prescribed limits, authorized
dealers in foreign exchange are permitted to deal in foreign exchange. Such dealings in foreign exchange by authorized dealers are
undertaken in accordance with the provisions and requirements of the exchange control rulings, which rulings are issued by Excon,
as the delegatee of the Minister of Finance, and contain certain administrative measures, as well as conditions and limits applicable
to transactions in foreign exchange, which may be undertaken by authorized dealers. Non-residents have been granted general
approval, pursuant to the rulings, to deal in South African assets and to invest and disinvest in South Africa.
The Republic of South Africa's exchange control regulations provide for restrictions on exporting capital from the Common
Monetary Area, consisting of the Republic of South Africa, the Republic of Namibia, and the Kingdoms of Lesotho and Swaziland.
Transactions between residents of the Common Monetary Area, on the one hand, including companies, and non-residents of the
Common Monetary Area, on the other hand, are subject to these exchange control regulations.
There are many inherent disadvantages of exchange controls including the distortion of the price mechanism, the problems
encountered in the application of monetary policy, the detrimental effects on inward foreign investment and the administrative costs
associated therewith. The South African Minister of Finance has indicated that all remaining exchange controls are likely to be
dismantled as soon as circumstances permit. There has, since 1996, been a gradual relaxation of exchange controls. The gradual
approach to the abolition of exchange controls adopted by the Government of South Africa is designed to allow the economy to
adjust more smoothly to the removal of controls that have been in place for a considerable period of time. The stated objective of
the authorities is equality of treatment between residents and non-residents with respect to inflows and outflows of capital. The
focus of regulation, subsequent to the abolition of exchange controls, is expected to favor the positive aspects of prudential financial
supervision.
The present exchange control system in South Africa is used principally to control capital movements. South African companies
are not permitted to maintain foreign bank accounts and, without the approval of Excon, are generally not permitted to export
capital from South Africa or hold foreign currency. In addition, South African companies are required to obtain the approval of
Excon prior to raising foreign funding on the strength of their South African balance sheets, which would permit recourse to South
Africa in the event of defaults. Where 75% or more of a South African company's capital, voting power, power of control or
earnings is directly or indirectly controlled by non-residents, such a company is designated an affected person by the South African
Reserve Bank, and certain restrictions are placed on its ability to obtain local financial assistance. Telkom is not, and has never
been, designated an affected person by the South African Reserve Bank.
Foreign investment and outward loans by South African companies are also restricted. In addition, without the approval of
Excon, South African companies are generally required to repatriate to South Africa profits of foreign operations and are limited in
their ability to utilize profits of one foreign business to finance operations of a different foreign business. South African companies
establishing subsidiaries, branches, offices or joint ventures abroad are generally required to submit financial statements on these
operations to Excon on an annual basis. As a result, a South African company's ability to raise and deploy capital outside the
Common Monetary Area is restricted.
Although exchange controls have been gradually relaxed since 1996, unlimited outward transfers of capital are not permitted at
this stage. Some of the more salient changes to the South African exchange control provisions over the past few years have been as
follows:
180
-
companies wishing to invest in countries outside the Common Monetary Area may, in addition to what is set out below,
apply for permission to enter into corporate asset/share swap and share placement transactions to acquire foreign
investments. The latter mechanism entails the placement of the locally quoted company's shares with long-term overseas
holders who, in payment for the shares, provide the foreign currency abroad which the company then uses to acquire the
target investment. Since February 2001, institutional investors are no longer entitled to make use of the asset swap
mechanism but are, however, entitled to acquire foreign portfolio investments of up to 10% of their net inflow of funds
during the 2000 calendar year;
-
companies wishing to establish new overseas ventures are permitted to transfer offshore up to R500 million to finance
approved investments abroad and up to R2 billion per new investment to finance approved new investments in Africa.
However, the approval of Excon is required in advance. On application to Excon, companies are also allowed to use part of
their local cash holdings to finance up to 10% of approved new foreign investments where the cost of these investments
exceeds the current limits. In addition, South African companies may utilize part of their cash holdings in South Africa to
repay up to 10% of outstanding foreign debt raised to finance foreign investments, provided the facility is for a minimum
period of two years; and
-
remittance of directors' fees payable to persons permanently resident outside the Common Monetary Area may be approved
by authorized dealers, pursuant to the rulings.
Authorized dealers in foreign exchange may, against the production of suitable documentary evidence, provide forward cover
to South African residents in respect of fixed and ascertained foreign exchange commitments covering the movement of goods.
Persons who emigrate from South Africa are entitled to take limited amounts of money out of South Africa as a settling-in
allowance. The balance of the emigrant's funds will be blocked and held under the control of an authorized dealer. These blocked
funds may only be invested in:
-
blocked current, savings, interest bearing deposit accounts in the books of an authorized dealer in the banking sector;
-
securities listed on the JSE and financial instruments listed on the Bond Exchange of South Africa which are deposited with
an authorized dealer and not released except temporarily for switching purposes, without the approval of Excon. Authorized
dealers must at all times be able to demonstrate that listed securities or financial instruments which are dematerialized or
immobilized in a central securities depositary are being held subject to the control of the authorized dealer concerned;
-
mutual funds units; or
-
the South African Futures Exchange.
Aside from the investments referred to above, blocked Rands may only be utilized for very limited purposes. Capitalization
shares and dividends declared out of capital gains or out of income earned prior to emigration remain subject to the blocking
procedure. It is not possible to predict when existing exchange controls will be abolished or modified by the South African
Government in the future.
Sales of shares
Under present regulations, our ordinary shares and ADSs are freely transferable outside the Common Monetary Area between
non-residents of the Common Monetary Area. In addition, the proceeds from the sale of ordinary shares on the JSE on behalf of
shareholders who are not residents of the Common Monetary Area are freely remittable to such shareholders. Share certificates held
by non-residents will be endorsed with the words "non-resident."
Dividends
Dividends declared in respect of shares held by a non-resident in a company whose shares are listed on the JSE are freely
remittable. See "Dividends and Dividend Policy" beginning on page 24 of this prospectus.
Any cash dividends paid by us are expected to be paid in Rands. Holders of ADSs on the relevant record date will be entitled to
receive any dividends payable in respect of the shares underlying the ADSs, subject to the terms of the deposit agreement. Subject
to exceptions provided in the deposit agreement, cash dividends paid in Rand will be converted by the depositary to Dollars and
paid by the depositary to holders of ADSs, net of conversion expenses of the depositary, in accordance with the deposit agreement.
The depositary will charge holders of ADSs, to the extent applicable, taxes and other governmental charges and specified fees and
other expenses. See "Dividends and Dividend Policy" beginning on page 24 of this prospectus.
Shareholders who are not residents of the Common Monetary Area who are in receipt of scrip dividends and who elect to
dispose of the relevant shares, may remit the proceeds arising from the sale of the relevant shares.
181
Shares acquired pursuant to the global offering
A former resident of South Africa who has emigrated from the Common Monetary Area may use blocked Rands to purchase
ordinary shares pursuant to this prospectus. All payments in respect of applications for ordinary shares by non-residents using
blocked Rands must be made through an authorized dealer in foreign exchange controlling the blocked assets.
In accordance with exchange control regulations of South Africa, an appropriate electronic entry reflecting a "non-resident"
endorsement will be made in respect of uncertificated shares purchased with blocked Rands and share certificates issued in respect
of ordinary shares purchased with blocked Rands pursuant to this prospectus will be endorsed "non-resident." Share certificates will
be placed under the control of the authorized dealer through whom the payment was made.
If applicable, refund monies payable in respect of unsuccessful applications or partly successful applications for ordinary shares
emanating from blocked Rand accounts, will, subject to the terms of the global offering as described in "The Global Offering"
beginning on page 182 of this prospectus, be returned to the authorized dealer through whom payments were made for credit to
such applicant's blocked account.
182
THE GLOBAL OFFERING
The global offering comprises:
-
an offering of ordinary shares by the Government of the Republic of South Africa, referred to as the US and international
offerings, to retail and institutional investors in the United States and to institutional investors outside of the United States,
including institutional investors in the Republic of South Africa, at the initial public offering price, in the form of ordinary
shares or ADSs; and
-
an offering of ordinary shares by the Government of the Republic of South Africa, referred to as the South African retail
offering, in the form of ordinary shares, which comprises:
an offering of ordinary shares to individuals in possession of a valid South African identity number and who provide a
South African postal address and groups of such individuals, known as stokvels, at a 20% discount to the initial public
offering price, rounded down to the nearest SA Cent, for up to R5,000 of ordinary shares per individual and up to R5,000
of ordinary shares per member of a stokvel, subject to a maximum of R50,000 of ordinary shares per stokvel. This
offering is specifically targeted at historically disadvantaged individuals and stokvels consisting only of historically
disadvantaged individuals and is referred to as the Khulisa offer; and
an offering of ordinary shares to individuals in possession of a valid South African identity number and who provide a
South African postal address at a 5% discount to the initial public offering price, rounded down to the nearest SA Cent,
for applications for any amount of ordinary shares applied for, referred to as the general offer. This offering is made to
individuals only and therefore excludes stokvels.
In addition, in connection with the global offering, the Government of the Republic of South Africa intends to grant to eligible
current and former employees of Telkom, options to purchase up to 11,140,636 of its ordinary shares, representing 2% of Telkom's
issued and outstanding ordinary share capital, through the Diabo Share Trust established for that purpose. See "Management
Other employee share ownership arrangements" on page 141 of this prospectus.
The global offering is conditional on listing the ordinary shares on the JSE and the ADSs on the New York Stock Exchange.
In accordance with the rules of the JSE, there will be conditional dealings in the ordinary shares with effect from March 4, 2003
until March 7, 2003, after which date dealing in the ordinary shares will be unconditional. If the global offering is terminated
for any reason, all transactions which take place during this period will be void and neither the JSE, the Government, Telkom nor
the joint global co-ordinators shall have any responsibility or liability to any person for any loss or damages of whatever nature and
however arising as a result of such termination.
All ordinary shares that are in issue as of the date of this prospectus will rank equally in all respects and will have the right to
receive all dividends and all other distributions declared, made or paid on the ordinary shares.
Initial offers and sales in the United States are being registered under the US Securities Act of 1933. Offers and sales of ordinary
shares and ADSs outside the United States, including all ordinary shares and ADSs offered to South African retail and institutional
investors, are being offered pursuant to Regulation S under the US Securities Act of 1933 and are not covered by the registration
statement filed with the US Securities and Exchange Commission.
Pricing
The initial public offering price range is estimated to be between R 33.50 and R40.90 per ordinary share. This is equivalent to
between $15.30 and $18.70 per ADS at a ratio of 4 ordinary shares per ADS and an exchange rate of R8.77 per $1.00. The initial
public offering price may be outside one or both of these price range indications. The initial public offering price ,rounded up to the nearest 10 US cents will be inclusive of uncertificated securities tax.
The joint global co-ordinators are seeking indications of interest from prospective investors to acquire ordinary shares in the
offering to institutional investors. Following this book building process, the initial public offering price will be determined by the
joint global co-ordinators after consultation with the Government of the Republic of South Africa and is expected to be announced on
March 4, 2003.
The initial public offering price will initially be determined in Rands. The US Dollar offering price for ADSs, will be based
on exchange rates for Rands into US Dollars as of the date the initial public offering price is determined.
Among the factors which may be considered in determining the initial public offering price are prevailing market conditions, the
demand for ordinary shares and ADSs in the global offering, the prices at which institutions bid to acquire ordinary shares and
ADSs and the desire to establish an orderly after-market in the ordinary shares and ADSs.
Allocation
The basis of allocation of the ordinary shares and ADSs in the global offering will be determined by the joint global co-
ordinators after consultation with the Government. All allocations will be rounded down to the nearest ordinary share.
The applicants in the global offering will only be informed of their individual allocations upon receipt of their notification
regarding electronic crediting of their account or share certificates. It is the intention that shareholder statements will be posted to
successful applicants by no later than March 11, 2003. Applicants purchasing ordinary shares in the global offering who deal prior to
the receipt of their notification do so at risk of selling ordinary shares for which they have not received an allocation.
The joint global co-ordinators reserve the right to scale back applications or to allocate ordinary shares under the different
offerings depending on the overall demand for ordinary shares in the global offering. All individuals in possession of a valid South
183
African identity number and who provide a South African postal address, and stokvels comprising such individuals, will be afforded
the opportunity to participate in the South African retail offering, with the Khulisa offering specifically targeted at historically
disadvantaged individuals and stokvels consisting only of such historically disadvantaged individuals. Decisions with respect to the
allocation of ordinary shares within the South African retail offering will be made on an equitable basis as determined and applied
by the Government in its sole discretion at the time the initial public offering price is finally determined. Telkom will not participate in
and will have no responsibility with respect to the determination of the allocation of ordinary shares in the South African retail offering
or the application of allocations in the South African retail offering. Historically disadvantaged individuals are South African citizens
who were disadvantaged by unfair discrimination on the basis of race and who had no right to vote, on the basis of race, prior to the
South African general election in 1994, in a South African general election of representatives to the House of Assembly of the then
South African Parliament.
The Khulisa offer application forms contain two tick boxes in which applicants must indicate their income level and whether or
not they are, or are comprised solely of, historically disadvantaged individuals.
Details of the South African retail offering
Applications for ordinary shares must be based on the total monetary amount applicants wish to invest in ordinary shares and
not on a specific number of ordinary shares. The price is payable in full on application in Rands. If no part of an application is
accepted, all of the money paid on application will be returned without interest. If an application is accepted in part, having been
scaled back, the balance of the money paid on application, if in excess of R20, will be returned by ordinary post without interest,
with the applicant bearing the risk of loss. Money and any interest earned on the application money that is retained will be used to
cover administrative expenses.
By completing an application form, an applicant will be deemed to have offered to acquire the maximum number of ordinary
shares that may be applied for with the amount specified on the applicant's check or postal order, or tendered in cash or any smaller
amount in respect of which the application is accepted.
Dealings in ordinary shares will commence on the JSE prior to the dispatch of any notification regarding the electronic crediting
of accounts or share certificates, as the case may be.
Khulisa offer
An offering of ordinary shares is also being made to individuals in possession of a valid South African identity number and who
provide a South African postal address and groups of such individuals, known as stokvels, at a 20% discount to the initial public
offering price, rounded down to the nearest SA Cent, for up to R5,000 of ordinary shares per individual and up to R5,000 of
ordinary shares per member of a stokvel, subject to a maximum of R50,000 of ordinary shares per stokvel. Stokvels are associations
of two or more members, who contribute funds to the association on a regular basis, the funds of which are paid, in whole or in
part, to its members in accordance with its rules, whether on a rotational basis or upon the occurrence of an event or otherwise.
Examples of stokvels include savings clubs, burial societies and other quasi-insurance and quasi-loan associations.
The minimum application under the Khulisa offer is R500 for individuals and R5,000 for stokvels. The maximum application under
the Khulisa offer is R5,000 for individuals and R5,000 per member for stokvels, subject to a maximum of R50,000 per stokvel.
The amount specified on the application forms will be allocated to the available ordinary shares, rounded down to the nearest
ordinary share. Individuals may submit an application form for both the general offer and the Khulisa offer. Stokvels may only submit
an application form for the Khulisa offer. If there is heavy demand for ordinary shares, applicants may receive fewer shares than those
applied for.
In order to reduce the costs of share dealing, investors may elect to trade through a low-cost share dealing service that has been
set up for ordinary shares purchased pursuant to the Khulisa offer. Individuals and stokvels are entitled to a one-time free trade of
their shares, by post for the two year and three month period of the Khulisa Trust referred to below. Individuals may also trade by
telephone and stokvels may also trade by fax at their own expense.
Khulisa Share Administration Trust
Ordinary shares purchased pursuant to the Khulisa offer will be held in a trust known as the Khulisa Share Administration Trust
or the Khulisa Trust and may not be withdrawn from the Khulisa Trust or sold for three months following the date of listing the
ordinary shares on the JSE. The Khulisa Trust will be administered by an independent trustee and will endure for a period of at
least two years and three months after the JSE listing date. On, or as soon as reasonably practical after the second anniversary of the
JSE listing date, the ordinary shares held by the Khulisa Trust will be released to the beneficial owners. If at any time during the
two year period after the JSE listing date any dividends are paid by Telkom, they will be paid to and held by the Khulisa Trust, and
such dividends will only be released and paid, as soon as reasonably practical at the end of such two-year period, to those persons
who were beneficial owners on the record date for determining entitlement to dividends. Any interest earned on such dividends will
accrue to the Khulisa Trust and may be applied by the trustee, together with any other amounts which may accrue to the Khulisa
Trust, in paying any administrative charges or expenses of the Khulisa Trust.
Award of bonus shares
If individuals and stokvels allow the ordinary shares purchased under the Khulisa offer to be held in the Khulisa Trust until the
second anniversay of the JSE listing date, the Government will reward those individuals and stokvels by giving each of them one
bonus share for every five shares purchased by them in the Khulisa offer and not disposed of.
184
General offer
An offering of ordinary shares is being made to all individuals in possession of a valid South African identity number and who
provide a South African postal address at a 5% discount to the initial public offering price, rounded down to the nearest SA Cent,
for any amount of shares applied for. The minimum application under this offer is R500 and there is no maximum application. The
amount specified on the application form will be allocated to the available ordinary shares, rounded down to the nearest ordinary
share.
In order to facilitate share dealings by these investors, investors may elect to trade through a low-cost share dealing service that
has been set up for ordinary shares purchased pursuant to this offer.
Expected times and dates of the opening and closing of the global offering
The U.S. and international offerings are expected to open on January 30, 2003 and are expected to settle
on March 7, 2003.
Share Transactions Totally Electronic or STRATE
Ordinary shares may only be traded on the JSE in electronic form and will immediately be trading for electronic settlement in
terms of STRATE, following listing.
STRATE is a system of paperless transfer of ordinary shares. The principal features of STRATE are as follows:
-
trades executed on the JSE must be settled within five business days;
-
there are penalties for late settlement;
-
an electronic record of ownership replaces share certificates and physical delivery of certificates; and
-
all investors are required to appoint either a broker or a Central Securities Depositary Participant to act on their behalf and to
handle their settlement requirements.
All applicants who elect to receive certificated shares will first have to dematerialize their shares should they wish to trade. It
generally takes between 5 and 10 days to dematerialize certificated shares.
Disadvantages of holding shares in certificated form
Holding shares in certificated form carries associated risk, including the risk of loss or tainted scrip. Also, a shareholder will be
required to appoint a broker or a Central Securities Depositary Participant and to dematerialize the shares prior to the sale of the
shares on the JSE. The shareholder will have no recourse in the event of delays occasioned by the validation process or the
acceptance or otherwise of the shares by a broker or a duly appointed Central Securities Depositary Participant.
Statement as to listing on the JSE
The JSE has agreed to list all the ordinary shares in the "Telecommunications Services" sector of the lists of the JSE under the
symbol "TKG" and the abbreviated name "Telkom," subject to the attainment of a spread of shareholders acceptable to the JSE and
the submission of all supporting documents required by the JSE. The JSE requires that 20% of each class of listed equity shares
must be held by the public, excluding employees of Telkom and their associates, and the number of public shareholders must be at
least 500. At the date of this prospectus, all the relevant JSE Listings Requirements have been complied with.
Information for Canadian investors
Neither the ordinary shares nor the ADSs have been or will be qualified by prospectus for sale to the public in Canada
under applicable Canadian securities laws and, accordingly, any offer or sale of the ordinary shares or ADSs in Canada will
be made pursuant to an exemption from the applicable prospectus filing requirements, and otherwise in compliance with
applicable Canadian laws. Investors in Canada should refer to the information below and Ontario purchasers in particular
should refer to the section entitled "Statutory rights of action (Ontario purchasers)" on page 186 of this prospectus.
This document is not, and under no circumstances is to be construed as, a prospectus, an advertisement or a public offering of
the securities described herein in Canada. No securities commission or similar authority in Canada has reviewed or in any way
passed upon this document or the merits of the securities described herein, and any representation to the contrary is an offence.
The offering is being made in the provinces of Ontario, Qubec and British Columbia, or the Private Placement Provinces, by
way of a private placement of ordinary shares and ADSs. The offering in the Private Placement Provinces is being made pursuant to
this document through the underwriters named in this document or through their selling agents who are permitted under applicable
law to distribute such securities in Canada.
185
Representations and agreements by purchaser
Confirmation of the acceptance of offers to purchase any ordinary shares or ADSs will be sent to purchasers in the Private
Placement Provinces who have not withdrawn their offers to purchase prior to the issuance of such confirmations. Each purchaser
of ordinary shares or ADSs in the Private Placement Provinces who receives a purchase confirmation regarding the purchase of
ordinary shares or ADSs will, by the purchaser's receipt thereof, be deemed to have represented to us, the Government of the
Republic of South Africa and the underwriters or such dealer from which such purchase confirmation is received, that such
purchaser and any ultimate purchaser for which such initial purchaser is acting as agent (a) is entitled under applicable provincial
securities laws to purchase such ordinary shares or ADSs without the benefit of a prospectus qualified under such securities laws
and, in the case of purchasers in provinces other than Ontario, without the services of a dealer registered pursuant to such securities
laws, (b) is basing its investment decision on this document and not on any other information concerning us or the
offering, (c) has reviewed the terms referred to below under the heading "Canadian resale restrictions" and (d) is in compliance
with the following:
-
where the purchaser is purchasing in Ontario, such purchaser is either a "designated institution" within the meaning of
Section 204 of the Regulation to the Securities Act (Ontario) purchasing from a person or company registered as an
international dealer under the Securities Act (Ontario) or is a purchaser purchasing from a fully registered dealer and, in
either case, is purchasing the ordinary shares or ADSs with the benefit of the prospectus exemption provided by Section 2.3
of Ontario Securities Commission Rule 45-501, that is, such purchaser is purchasing the ordinary shares or ADSs as a
principal and is an "accredited investor" within the meaning of Section 1.1 of Rule 45-501;
-
where the purchaser is purchasing in Qubec, such purchaser is a sophisticated purchaser within the meaning of Section 44
of the Securities Act (Qubec) purchasing the ordinary shares or ADSs as principal, or is a "sophisticated purchaser" within
the meaning of Section 45 of the Securities Act (Qubec) purchasing for the portfolio of a person managed solely by it or is
purchasing as principal ordinary shares or ADSs with an aggregate acquisition cost to such purchaser of at least Cdn$150,000
from a registered dealer with an unrestricted practice;
-
where the purchaser is purchasing in British Columbia, such purchaser is (i) purchasing the ordinary shares or ADSs with the
benefit of the prospectus exemption and dealer registration exemption provided by Section 5.1 of Multilateral Instrument
45-103, that is, such purchaser is purchasing as principal and is an "accredited investor" within the meaning of Section 1.1 of
MI 45-103 or (ii) such purchaser is purchasing the ordinary shares or ADSs as principal and has been designated as an
exempt purchaser by an outstanding order of the Executive Director of the British Columbia Securities Commission in
accordance with the registration and prospectus exemptions provided by Sections 45(2)(4) and 74(2)(3) of the Securities Act
(British Columbia);
-
if the purchaser is a company, the purchaser was not established solely for the purpose of acquiring ordinary shares or ADSs
in reliance on an exemption from applicable prospectus requirements in the Private Placement Provinces;
-
such purchaser is either purchasing ordinary shares or ADSs as principal for its own account, or is deemed to be purchasing
ordinary shares or ADSs as principal for its own account in accordance with the applicable securities laws of the province in
which such purchaser is resident, by virtue of being either (i) a designated trust company; (ii) a designated insurance
company; (iii) a portfolio manager or (iv) another entity similarly deemed by those laws to be purchasing as principal for its
own account when purchasing on behalf of other beneficial purchasers;
-
such purchaser is purchasing in respect of a trade for which there is an exemption from the registration requirements of
applicable Canadian securities laws or which is otherwise in compliance with such laws;
-
such purchaser acknowledges and agrees that the offer and sale of ordinary shares or ADSs was made through this document
and was not made through an advertisement of the ordinary shares or ADSs in any printed media of general and regulation
paid circulation, radio or television or any other form of advertising; and
-
such purchaser acknowledges that the ordinary shares or ADSs are being distributed in Canada on a private placement basis
only and that any resale of ordinary shares or ADSs must be in accordance with the requirements of applicable securities
laws, which will vary depending on the relevant jurisdictions.
Language of document
Each purchaser of ordinary shares or ADSs in Canada that receives a purchase confirmation hereby agrees that it is such
purchaser's express wish that all documents evidencing or relating in any way to the sale of such ordinary shares or ADSs be
drafted in the English language only. Chaque acheteur au Canada d'actions ou ADSs recevant un avis de confirmation - l'gard de
son acquisition reconnit que c'est sa volont expresse que tous les documents faisant foi ou se rapportant de quelque manire - la
vente d'actions ou ADSs soient rdigs uniquement en anglais.
Canadian resale restrictions
The distribution of the ordinary shares of ADSs in the Private Placement Provinces is being made on a private placement basis.
Accordingly, any resale of the ordinary shares or ADSs must be made (i) through an appropriately registered dealer or in
accordance with an exemption from the dealer registration requirements of applicable provincial securities laws and (ii) in
accordance with, or pursuant to an exemption from, the prospectus requirements of such laws. Such resale restrictions may not
apply to resales made outside of Canada, depending on the circumstances. Purchasers of ordinary shares or ADSs are advised to
seek legal advice prior to any resale of ordinary shares or ADSs.
186
Statutory rights of action (Ontario purchasers)
Section 4.2 of Rule 45-501 provides that when an offering memorandum, such as this document, is delivered to an investor to
whom securities are distributed in reliance upon the accredited investor prospectus exemption in Section 2.3 of Rule 45-501, the
right of action referred to in Section 130.1 of the Securities Act (Ontario) is applicable. Section 130.1 provides purchasers who
purchase securities offered by an offering memorandum with a statutory right of action against the issuer of securities and any
selling securityholder for rescission or damages in the event that the offering memorandum and any amendment to it contains a
"misrepresentation." Misrepresentation means an untrue statement of a material fact or an omission to state a material fact that is
required to be stated or that is necessary to make any statement not misleading or false in the light of the circumstances in which it
was made.
Where this document, together with any amendment to it, is delivered to a prospective purchaser of ordinary shares or ADSs in
connection with a trade made in reliance on Section 2.3 of Rule 45-501, and this document contains a misrepresentation which was
a misrepresentation at the time of purchase of the ordinary shares or ADSs, the purchaser will have a statutory right of action
against us and any selling securityholder for damages or, while still the owner of shares, for rescission, in which case, if the
purchaser elects to exercise the right of rescission, the purchaser will have no right of action for damages, provided that the right of
action for rescission will be exercisable by the purchaser only if the purchaser gives notice to the defendant, not more than 180 days
after the date of the transaction that gave rise to the cause of action, that the purchaser is exercising this right; or, in the case of any
action, other than an action for rescission, the earlier of: (i) 180 days after the plaintiff first had knowledge of the facts giving rise to
the cause of action or (ii) three years after the date of the transaction that gave rise to the cause of action.
The defendant shall not be liable for a misrepresentation if it proves that the purchaser purchased the ordinary shares or ADSs
with knowledge of the misrepresentation.
In an action for damages, the defendant shall not be liable for all or any portion of the damages that the defendant proves do not
represent the depreciation in value of the ordinary shares or ADSs as a result of the misrepresentation relied upon.
Subject to the paragraph below, all or any one or more of us and any selling securityholders are jointly and severally liable, and
every person or company who becomes liable to make any payment for a misrepresentation may recover a contribution from any
person or company who, if sued separately, would have been liable to make the same payment, unless the court rules that, in all
circumstances of the case, to permit recovery of the contribution would not be just and equitable.
Despite the paragraph above, we shall not be liable where we are not receiving any proceeds from the distribution of the
ordinary shares or ADSs being distributed and the misrepresentation was not based on information provided by us, unless the
misrepresentation:
-
was based on information that was previously publicly disclosed by us;
-
was a misrepresentation at the time of its previous public disclosure; and
-
was not subsequently publicly corrected or superseded by us prior to the completion of the distribution of the ordinary
shares or ADSs.
In no case shall the amount recoverable for the misrepresentation exceed the price at which the ordinary shares or ADSs were
offered.
The foregoing statutory right of action for rescission or damages conferred is in addition to and without derogation from any
other right the purchaser may have at law.
This summary is subject to the express provisions of the Securities Act (Ontario) and the regulations and rules made under it,
and you should refer to the complete text of those provisions.
Enforcement of legal rights
All of our directors and officers (or their equivalents), as well as any experts or persons named herein may be located outside of
Canada and, as a result, it may not be possible for purchasers to effect service of process within Canada upon us or such persons.
All or a substantial portion of our assets and the assets of such persons may be located outside of Canada and, as a result, it
may not be possible to satisfy a judgment against us or such persons in Canada or to enforce a judgment obtained in Canadian
courts against us or such persons outside of Canada.
Canadian tax considerations and eligibility for investment
This document does not address the Canadian tax consequences of ownership of the ordinary shares or ADSs. Prospective
purchasers of ordinary shares or ADSs should consult their own tax advisers with respect to the Canadian and other tax
considerations applicable to their individual circumstances and with respect to the eligibility of the ordinary shares or ADSs for
investment by purchasers under relevant Canadian legislation.

187
UNDERWRITING
The global offering consists of the offer and sale of 139,257,954 ordinary shares or ADSs by the Government of the Republic of
South Africa, but may be increased to up to 167,109,546 ordinary shares in certain circumstances. See "The Global Offering"
beginning on page 182 of this prospectus.
Telkom, the Government and the underwriters intend to enter into an underwriting agreement in connection with the global
offering. It is expected that the U.S. and international offerings will be underwritten. Subject to the terms and conditions described
in the underwriting agreement, the Government will agree to sell the ordinary shares and each underwriter will agree, severally and
not jointly, to procure purchasers for, or failing that, to purchase themselves the ordinary shares, indicated in the following table.
The underwriting agreement will provide that if an underwriter defaults, the purchase commitements of non-defaulting underwriters
may be increased. The joint global coordinators are the representatives of the underwriters.
Underwriters
Number of ordinary shares
Joint Global Co-ordinators
Deutsche Bank AG London . . . . . . . . . . . . . . . . . . . . . . . . . . . . . . . . . . .
J.P. Morgan Securities Ltd. . . . . . . . . . . . . . . . . . . . . . . . . . . . . . . . . . . . .
Underwriters
Salomon Smith Barney . . . . . . . . . . . . . . . . . . . . . . . . . . . . . . . . . . . . . .
UBS AG, acting through its business group UBS Warburg . . . . . . . . . . . . . . . . . . .
Barnard Jacobs Mellet Holdings Limited . . . . . . . . . . . . . . . . . . . . . . . . . . . .
HSBC Bank plc . . . . . . . . . . . . . . . . . . . . . . . . . . . . . . . . . . . . . . . . . .
Investec Bank Limited . . . . . . . . . . . . . . . . . . . . . . . . . . . . . . . . . . . . . .
Standard Corporate and Merchant Bank, a division of The Standard Bank of
South Africa Limited . . . . . . . . . . . . . . . . . . . . . . . . . . . . . . . . . . . . . . .
African Harvest Capital (Proprietary) Limited, Mazwai Securities (Proprietary) Limited and Wipcapital (Proprietary)
Limited/Legae Securities (Proprietary) Limited will also participate in the global offering.
The underwriting agreement will provide that the purchasers procured by the underwriters, or the underwriters, may choose to
take some or all of their ordinary shares in the form of ADSs in order to accommodate requests of investors. The underwriters
expect to offer and sell the ordinary shares and/or ADSs in the United States through their registered broker-dealer affiliates
registered with the Securities and Exchange Commission under Section 15 of the Securities Exchange Act of 1934, as amended.
The Government intends to grant the joint global coordinators, on behalf of the underwriters, an option to purchase up to an
additional 20,888,693 ordinary shares. If granted, this option may be exercised, in whole or in part, on or before 30 days from the
date on which the underwriting agreement is signed, solely to cover over-allotments, if any. If any ordinary shares are purchased
pursuant to this option, the underwriters will severally, and not jointly, purchase ordinary shares in approximately the same
proportion as set forth in the table above, subject to the terms and conditions described in the underwriting agreement. The
underwriters may choose to take some or all of their additional ordinary shares in the form of ADSs.
Pursuant to the underwriting agreement, the joint global coordinators, upon consultation with the Government and notice to
Telkom, will have the right to terminate the underwriting agreement under specified circumstances at any time prior to the
settlement date of the U.S. and international offerings, which is expected to take place on March 7, 2003, or prior to the
expiration of the over-allotment closing, if any.
The total underwriting discounts and commissions to be paid to the underwriters by the Government will be 1.9% of the total
offering price for the ordinary shares in the global offering. In addition to the fees and commissions described above, the
Government of the Republic of South Africa may decide to pay additional fees of up to 0.45% of the total offering proceeds. The
following table shows the per ordinary share and per ADS price, the total underwriting discounts and commissions to be paid to the
underwriters by the Government and the proceeds, before expenses to the Government. The Government will pay only sales
commissions on any additional ordinary shares and ADSs purchased by the underwriters to cover over-allotments. Such amounts
are shown assuming both no exercise and full exercise of the underwriters' option to purchase additional ordinary shares and ADSs.
Per ordinary share
Per ADSs
No Exercise
Full Exercise
Public offering price . . . . . . . . . . . .
R
$
R
$
R
$
Underwriting discounts and commissions
paid by the Government . . . . . . . . . .
R
$
R
$
R
$
Proceeds, before expenses . . . . . . . . .
R
$
R
$
R
$
Telkom's offering expenses are estimated to be R - - - - - - - - - ($ ). The Government's offering expenses, exclusive of the
underwriters' discount, are estimated to be R - - - - - - ($ ).
188
Ordinary shares or ADSs sold by the underwriters to retail investors in the United States and to institutional investors both
within and outside of the United States and the Republic of South Africa will initially be offered at the initial public offering price
set forth on the cover of this prospectus. Ordinary shares sold by the underwriters to individuals in possession of a valid South
African identity number and who provide a South African postal address and groups of such individuals, known as stokvels, in the
Khulisa offer, which forms a part of the South African retail offering, will be at a 20% discount to the initial public offering price,
rounded down to the nearest SA Cent, for up to R5,000 of ordinary shares per individual and up to R5,000 of ordinary shares per
member of a stokvel, subject to a maximum of R50,000 of ordinary shares per stokvel. Ordinary shares sold by the underwriters to
individuals in possession of a valid South African identity number in the general offer, which forms a part of the South African
retail offering, will be at a 5% discount to the initial public offering price, rounded down to the nearest SA Cent. Any ordinary
shares sold by the underwriters to securities dealers may be sold at a discount of up to R per ordinary share or $ per ADS
from the initial public offering price.
Thintana Communications and the Government of the Republic of South Africa intend to agree with the underwriters that, subject
to certain exceptions, none of them will from the date of this prospectus through 180 days following the date on which the
underwriting agreement is signed:
-
issue, offer, lend, pledge, sell, hedge, contract to sell, sell any option or contract to purchase, purchase any option or contract
to sell, mortgage, charge, assign, grant any option, right or warrant to purchase or otherwise transfer or dispose of, other than
in the global offering, any of the ordinary shares in Telkom currently made by them or any securities that are convertible into
or exercisable or exchangeable for Telkom's ordinary shares or ADSs; or
-
enter into any swap or other agreement that transfers to any other entity, in whole or in part, any of the economic
consequences of ownership of Telkom's ordinary shares or enter into any other transaction with the same economic
consequences.
Telkom intends to enter into a similar agreement with respect to its ordinary shares.
In addition, the Government has, in the new shareholders' agreement referred to under "Relationship with Major Shareholders
and Related Transactions - Shareholder arrangements - New shareholders' agreement" beginning on page 145 of this prospectus,
agreed with Thintana Communications that the Government will not sell its ordinary shares in Telkom for a further 545-day period
after the expiration of the lock-up period described above.
Prior to the global offering, there has been no public market for the ordinary shares or the ADSs. The initial public offering price
will be negotiated between the Government of the Republic of South Africa and the joint global co-ordinators, on behalf of the
underwriters. Among the factors to be considered in determining the initial public offering price of the ordinary shares and ADSs will
be the prevailing market conditions, the demand for ordinary shares and ADSs in the global offering, the prices at which institutions
bid to acquire ordinary share and ADSs and the desire to establish an orderly after-market in the ordinary shares and ADSs.
There can be no assurance that an active trading market for Telkom's ordinary shares and ADSs will develop. It is also possible
that after the global offering, Telkom's ordinary shares will not trade in the public market at or above the initial public offering price.
The ordinary shares have been approved for listing on the JSE under the symbol "TKG" and the ADSs have been approved for
listing on the New York Stock Exchange under the symbol "TKG." In order to meet the requirements for listing the ADSs on the
New York Stock Exchange, the underwriters will undertake to sell a minimum number of ordinary shares, or equivalent number
of ADSs, to a minimum number of beneficial owners.
In connection with this offer, Deutsche Bank AG London or its affiliates, in consultation with J.P. Morgan Securities Ltd., may for
the account of the underwriters, over-allot or effect transactions with a view to supporting the market price of Telkom's ordinary shares
or ADSs at a level higher than that which might otherwise prevail for a limited period after the commencement of conditional trading.
However, there is no obligation to do so. Such action, if commenced, may be discontinued at any time, provided two business days
notice is given to the JSE, but may under no circumstances continue beyond the 30th calendar day after the listing date. Specifically,
Deutsche Bank AG London, or its affiliates, in consultation with J.P. Morgan Securities Ltd., may sell more ordinary shares or ADSs
than the underwriters are obligated to purchase under the underwriting agreement, creating a short position. The short sale is covered if
the short position is no greater than the number of ordinary shares or ADSs available for purchase under the over-allotment option.
Deutsche Bank AG London, or its affiliates, in consultation with J.P. Morgan Securities Ltd., can close out a covered short sale by
exercising the over-allotment option or purchasing ordinary shares or ADSs in the open market. The joint global co-ordinators may
also reclaim selling concessions allowed to an underwriter or a dealer for distributing the ordinary share or ADSs in the offering, if the
joint global coordinators repurchase previously distributed ordinary shares or ADSs in transactions to cover syndicate short positions or
to stabilize the price of the ordinary shares or the ADSs. These stabilizing transactions, syndicate-covering transactions and penalty
bids may be effected on the JSE, the NYSE or otherwise.
To enable the underwriters to satisfy their delivery obligations in connection with over-allotments and syndicate short positions, the
joint global co-ordinators may borrow ordinary shares from the Government under a stock lending arrangement. This arrangement will
be limited to the size of the over-allotment option. Shares borrowed under this arrangement will be repaid through the exercise of the
over-allotment option or shares available in the market or otherwise.
189
Telkom and the Government of the Republic of South Africa intend to agree to indemnify the several underwriters against
certain liabilities, including liabilities under the Securities Act of 1933 and the applicable securities laws, and to contribute to
payments the underwriters may be required to make in respect of these liabilities, losses and expenses. The underwriters expect to
receive from the Government of the Republic of South Africa expense reimbursements of approximately $1,500,000.
UBS Warburg Corporate Finance (South Africa) (Proprietary) Limited, a subsidiary of UBS AG, and AMB Holdings Limited
have acted as financial advisors to Telkom in connection with the global offering and will receive an estimated R27,000,000 from
Telkom in compensation for such services.
Certain of the other underwriters, including the joint global coordinators, are providing, have provided or may in the future
provide investment banking and other financial services to the selling shareholder and us in the ordinary course of business and will
receive customary compensation in connection therewith.
Selling restrictions
General
No action has been or will be taken in any jurisdiction except in the United States and the Republic of South Africa that would
permit a public offering of Telkom's ordinary shares, or the possession, circulation or distribution of a prospectus or any other
material relating to us, the Government of the Republic of South Africa or Telkom's ordinary shares or ADSs in any country or
jurisdiction where action for that purpose is required. Accordingly, Telkom's ordinary shares and ADSs may not be offered or sold,
directly or indirectly, and neither this document nor any other offering material or advertisements in connection with Telkom's
shares may be distributed or published, in or from any country or jurisdiction except in compliance with any applicable rules and
regulations of any such country or jurisdiction.
United Kingdom
Each of the underwriters have represented and agreed that: (i) it has not offered or sold and, prior to the expiry of a period of six
months from the completion of the global offering, will not offer or sell any ordinary shares or ADSs to persons in the United
Kingdom except to persons whose ordinary activities involve them in acquiring, holding, managing or disposing of investments
(as principal or agent) for the purposes of their business, or otherwise in circumstances which have not resulted and will not result
in an offer to the public in the United Kingdom within the meaning of the Public Offers of Securities Regulations 1995; (ii) it has
complied and will comply with all applicable provisions of the Financial Services and Markets Act 2000, or the FSMA, with
respect to anything done by it in relation to any ordinary shares or ADSs, in, from or otherwise capable of having an effect in the
United Kingdom and (iii) it has only communicated or caused to be communicated and will only communicate or cause to be
communicated any invitation or inducement to engage in investment activity (within the meaning of section 21 of the FSMA)
received by it in connection with the issue or sale of any ordinary shares or ADSs in circumstances in which section 21(1) of the
FSMA does not apply to the underwriters.
Japan
The ordinary shares have not been and will not be registered under the Securities and Exchange Law of Japan. Each underwriter
has represented and agreed that it has not offered or sold, and it will not offer or sell, directly or indirectly, any shares in Japan
or to, or for the account or benefit of, any resident of Japan or to, or for the account or benefit, of any resident for reoffering
or resale, directly or indirectly, in Japan, except pursuant to an exemption from the registration requirements of, or otherwise
in compliance with, the Securities and Exchange Law of Japan. As part of the offering, the underwriters may offer shares in Japan
to a list of 49 offerees in accordance with the above provisions.
Canada
Each of the underwriters have acknowledged and agreed that the ordinary shares and ADSs will only be offered or sold, directly
or indirectly, in Canada in the Canadian provinces of Ontario, Qubec and British Columbia and in compliance with the applicable
Canadian securities laws and accordingly, any sales of ordinary shares or ADSs will be made (i) through an appropriately registered
securities dealer or in accordance with an available exemption from the registered securities dealer requirements of applicable
Canadian securities laws and (ii) pursuant to an exemption from the prospectus requirements of such laws.
The Netherlands
The ordinary shares may not be offered, transferred, sold or delivered to any individual or legal entity other than to persons who
trade or invest in securities in the conduct of their profession or trade, which includes banks, securities intermediaries, including
dealers and brokers, insurance companies, pension funds, other institutional investors and commercial enterprises which as an
ancillary activity regularly invest in securities.
190
LEGAL MATTERS
The validity of the issuance of the ordinary shares and ADSs offered hereby will be passed upon for Telkom by Paul, Hastings,
Janofsky & Walker LLP, New York, New York, United States counsel to Telkom, with respect to matters of New York law
and United States federal law, and by Werksmans Inc., South African counsel to Telkom, with respect to matters of South African
law. Legal matters relating to the ordinary shares and ADSs offered hereby will be passed upon for the underwriters by Freshfields
Bruckhaus Deringer, United States counsel to the underwriters with respect to matters of New York law and United States
federal law, and Deneys Reitz Inc. and Chuene, Kwinana & Motsatse Inc., South African counsel to the underwriters with respect
to matters of South African law. In addition, certain legal matters relating to New York law and United States law will be passed
upon for the Government of the Republic of South Africa by Skadden, Arps, Slate, Meagher & Flom LLP, United States counsel to
the Government, and certain legal matters relating to South African law will be passed upon for the Government of the Republic of
South Africa by Edward Nathan & Friedland (Proprietary) Limited, South African counsel to the Government.
191
EXPERTS
The consolidated financial statements of the Telkom Group as of March 31, 2002, 2001 and 2000 and for each of the three years
in the period ended March 31, 2002, appearing in this prospectus and the US registration statement have been audited by Ernst &
Young, Registered Accountants and Auditors, Chartered Accountants (SA), as set forth in their report on page F48 of this
prospectus, and are included in reliance upon the authority of such firm as experts in accounting and auditing in giving the report.
The audited financial statements of Vodacom as of March 31, 2002, 2001 and 2000 and for each of the three years in the period
ended March 31, 2002 included in this prospectus have been so included in reliance on the report on page F115 of this prospectus,
which contains an explanatory paragraph concerning certain restatements and adjustments as described in note 44 of the
consolidated financial statements, of PricewaterhouseCoopers Inc. and Deloitte & Touche, Registered Accountants and
Auditors, Chartered Accountants (SA), given on the authority of such firms as experts in auditing and accounting.
Ernst & Young have reported that they have applied limited procedures in accordance with professional standards for a review of
the unaudited condensed consolidated financial statements of the Telkom Group as of September 30, 2002 and for each of the six
month periods ended September 30, 2002 and 2001 appearing in this prospectus and the US registration statement. However, their
separate reports included on page F2 of this prospectus state that they did not audit and they do not express an opinion on those
financial statements. Accordingly, the degree of reliance on their reports on such information should be restricted considering the
limited nature of the review procedures applied. The independent auditors are not subject to the liability provisions of Section 11 of
the US Securities Act of 1933 for their reports on the unaudited condensed consolidated financial statements because that report is
not a "report" or a "part" of the US registration statement prepared or certified by the auditors within the meaning of Sections 7
and 11 of the US Securities Act of 1933.
In addition, with respect to the unaudited condensed consolidated financial statements of Vodacom as of September 30, 2002 and
for each of the six-month periods ended September 30, 2002 and 2001 included in this prospectus and the US registration
statement, PricewaterhouseCoopers Inc. and Deloitte & Touche reported that they have applied limited procedures in accordance
with professional standards for a review of such information. However, their separate report thereon, dated December 12, 2002,
appearing herein state that they did not audit and they do not express an opinion on the unaudited condensed consolidated financial
statements. Accordingly, the degree of reliance on their report on such unaudited condensed consolidated financial statements
should be restricted in light of the limited nature of the review procedures applied. Furthermore, PricewaterhouseCoopers Inc. and
Deloitte & Touche are not subject to the liability provisions of Section 11 of the US Securities Act of 1933 for their report on the
unaudited condensed consolidated financial statements because that report is not "a report" or "a part" of the US registration
statement prepared or certified by PricewaterhouseCoopers Inc. and Deloitte & Touche within the meaning of Sections 7 and 11 of
the US Securities Act of 1933.

192
EXPENSES RELATING TO THE GLOBAL OFFERING
Set forth below is an itemization of the total expenses, excluding underwriting discounts and commissions, that are expected to
be incurred in connection with the offer and sale of securities. With the exception of the JSE listing and inspection fee, the US
Securities and Exchange Commission registration fee and the New York Stock Exchange listing fee, all amounts are estimates.
Telkom currently estimates that it will pay R137,000,000 of legal fees and expenses, accounting fees and expenses, financial
advisory fees and other fees and expenses in connection with the offering and the Government of the Republic of South Africa will
pay the remainder of the fees and expenses.
JSE listing and inspection fee . . . . . . . . . . . . . . . . . . . . . . . . . . .
R620,000
US Securities and Exchange Commission registration fee . . . . . . . . . . . .
183,960
NASD filing fee . . . . . . . . . . . . . . . . . . . . . . . . . . . . . . . . . .
275,000
New York Stock Exchange listing fee . . . . . . . . . . . . . . . . . . . . . . .
1,969,872
Printing and engraving expenses . . . . . . . . . . . . . . . . . . . . . . . . . .
27,000,000
Legal fees and expenses . . . . . . . . . . . . . . . . . . . . . . . . . . . . . .
93,000,000
Accounting fees and expenses . . . . . . . . . . . . . . . . . . . . . . . . . . .
60,000,000
Financial advisory fees . . . . . . . . . . . . . . . . . . . . . . . . . . . . . . .
27,000,000
Other fees and expenses . . . . . . . . . . . . . . . . . . . . . . . . . . . . . .
10,000,000
Total . . . . . . . . . . . . . . . . . . . . . . . . . . . . . . . . . . . . . . . .
R220,048,832
193
ENFORCEMENT OF CIVIL LIABILITIES
Telkom is incorporated in the Republic of South Africa. Substantially all of the members of Telkom's board of directors and
officers, and certain experts named herein, reside outside of the United States. Substantially all of the assets of these persons and all
of our assets are located outside the United States. As a result, it may not be possible for you to effect service of legal process
within the United States or elsewhere outside of the Republic of South Africa upon most of Telkom's directors or officers, including
with respect to matters arising under US federal securities laws or applicable state securities laws.
Moreover, it may not be possible for investors to enforce against these persons or us a judgment obtained in a United States
court predicated upon the civil liability provisions of the federal securities or other laws of the United States or any state thereof.
A foreign judgment is not directly enforceable in South Africa, but constitutes a cause of action which will be enforced
by South African courts provided that:
-
the court which pronounced the judgment had jurisdiction to entertain the case;
-
the judgment is final and conclusive;
-
the recognition and enforcement of the judgment by South African courts would not be contrary to public policy, including
observance of the rules of natural justice which require that the documents initiating the foreign proceedings were properly
served on the defendant and that the defendant was given the right to be heard and represented by counsel in a free and fair
trial before an impartial tribunal;
-
the judgment was not obtained by fraudulent means;
-
the judgment does not involve the enforcement of penal or revenue laws, which relate to income of the State derived from
taxation and other sources;
-
the judgment is not for the payment of multiple or punitive damages; and
-
the enforcement of the judgment is not precluded by the provisions of the South African Protection of Businesses Act,
99 of 1978.
The South African Protection of Businesses Act, 99 of 1978, prohibits the enforcement in the Republic of South Africa of a
foreign judgment, except with the permission of the South African Minister of Trade and Industry, and limits the recovery of
multiple or punitive damages that have been awarded by a non-South African court, irrespective of whether or not the South African
Minister of Trade and Industry has consented. In addition, the South African Protection of Businesses Act, 99 of 1978, provides that
in determining whether or not a foreign judgment is recognizable or enforceable in the Republic of South Africa, the person against
whom the judgment was given will not be regarded as having submitted to the jurisdiction of the foreign court by reason only of the
fact that such person appeared in the proceedings in question for the purposes of contesting the jurisdiction of the court, protecting
or obtaining property, applying for dismissal or stay of proceedings pending arbitration, or for the institution of new proceedings.
Such person will also not be regarded as having submitted to the jurisdiction of the foreign court if that person did business within
the area of the court, unless at the same time as when the events giving rise to the liability or relevant proceedings occurred, that
person conducted a permanent business establishment within that area.
South African courts cannot inquire into the merits of a foreign judgment and cannot act as a court of appeal or review over the
foreign court. South African courts will usually implement their own procedural laws and the capacity of the parties to contract will
be determined in accordance with South African law. It is doubtful whether an original action based on United States federal
securities laws can be brought before South African courts. A plaintiff who is not resident in South Africa may be required to
provide security for costs in the event of proceedings being initiated in South Africa. Furthermore the Rules of the High Court of
South Africa require that documents executed outside South Africa must be authenticated for the purpose of use in South Africa.
It is possible for an investor to bring an action against Telkom in a South African civil court to enforce rights under United
States federal securities laws. These laws will not be enforced if they are penal or revenue or taxation laws or laws which are
contrary to South African public policy. It is not possible therefore for an investor to seek to impose criminal liability on us in a
South African court arising from a violation of United States federal securities laws.
194
WHERE YOU CAN FIND MORE INFORMATION
We have filed with the SEC a registration statement on Form F1 under the Securities Act (SEC File No. 333- - - - - - - ).
This prospectus does not contain all of the information set forth in the registration statement, parts of which have been
omitted in accordance with the rules and regulations of the SEC. For further information about us and the ordinary shares
and the ADSs, please refer to the registration statement and exhibits, which you may obtain as described below.
Upon completion of the global offering, we will be subject to the informational requirements of the Securities Exchange Act of
1934 as they apply to a foreign private issuer, and will file reports and other information with the SEC. As a foreign private issuer,
we will be exempt from Exchange Act rules regarding the content and furnishing of proxy statements to shareholders and rules
relating to short swing profits reporting and liability.
Our SEC filings are available to the public over the internet at the SEC's website at http://www.sec.gov You may also read and
copy any document we file at the public reference facilities of the SEC located at 450 Fifth Street, N.W., Washington, DC 20549.
You may obtain more information concerning the operation of the Public Reference Section of the SEC by calling the SEC at
1-800-SEC-0330. In addition, upon the listing of our ADSs on the New York Stock Exchange, the reports and other information we
file with the SEC will also be available for reading and copying at the offices of the New York Stock Exchange, 11 Wall Street,
New York, New York 10005, United States. We also maintain an internet site at http://www.telkom.co.za. Our website and the
information contained therein or connected thereto shall not be deemed to be incorporated into this prospectus or the registration
statement of which it forms a part.
195
DOCUMENTS AVAILABLE FOR INSPECTION
Copies of the following documents are available for inspection at our registered office during normal business hours from the
date of this prospectus until the closing of the global offering:
-
Telkom's audited consolidated financial statements as of and for the past three financial years ended March 31, 2002;
-
Telkom's new memorandum and articles of association;
-
the memorandum and articles of association of Telkom Directory Services and Swiftnet;
-
the new shareholders' agreements, referred to in "Relationship with Major Shareholders and Related Transactions
Shareholder arrangements" beginning on page 145 of this prospectus;
-
the material contracts referred to in "Additional Information - Material contracts" beginning on page 198 of this prospectus;
-
summaries of the service agreements of executive directors and executive officers;
-
the trust deed constituting the Khulisa Share Administration Trust;
-
the trust deed constituting the Diabo Share Trust;
-
the review report and report of Ernst & Young, Chartered Accountants (SA) referred to on pages F2 and F48, respectively,
and the joint review report and report of PricewaterhouseCoopers Inc. and Deloitte & Touche, Chartered Accountants (SA),
referred to on pages F25 and F115, respectively, of this prospectus;
-
the written consent of the reporting accountants to the issue of the prospectus including their reports in the form and context
in which they are included herein; and
-
the written consents of the advisors referred to under "Corporate Information and Advisors" to their names being included in
this prospectus in the capacities stated.
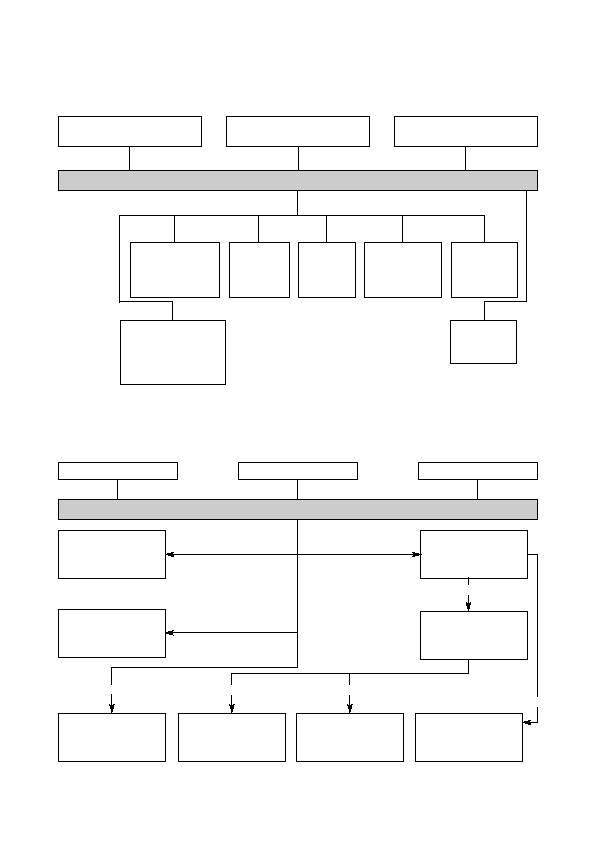
196
ADDITIONAL INFORMATION
Telkom's ownership and legal corporate structure as of the date of this prospectus
Subsidiaries:
100%
100%
100%
100%
Joint venture:
Investments:
Note: 1
Immediately following the global offering:
the Government will own the one class A ordinary share and approximately 42% of Telkom's issued and outstanding ordinary share capital, or 38%
if the underwriters exercise their over-allotment option in full; and
Thintana Communications will own the one class B ordinary share and approximately 30% of Telkom's issued and outstanding ordinary share capital.
Note: 2
Dormant entities.
Vodacom's ownership and legal corporate structure as of the date of this prospectus
Telkom Directory
Services (Proprietary)
Limited
Swiftnet
(Proprietary)
Limited
Intekom
(Proprietary)
Limited
Telkom
Communications
International 2
(Proprietary)
Limited
Q-Trunk
(Proprietary)
Limited 2
Telkom SA Limited
Rascom
:
1.18%
New Skies
:
0.89%
Inmarsat
:
0.30%
Vodacom Group (Proprietary) Limited
Vodacom
(Proprietary)
Limited
Vodacom
International Holdings
(Proprietary)
Limited
Vodacom Service
Provider Company
(Proprietary)
Limited
Vodacom
International
Limited (Mauritius)
)
Vodacom Tanzania
Limited
Vodacom Congo
(R.D.C.) S.P.R.L.
Vodacom
Mozambique
(VM S.A.R.L)
Vodacom Lesotho
(Proprietary)
Limited
100%
100%
100%
100%
65%
51%
98%
88.3%
100%
64.9%
100%
100%
100%
Vodacom Group
(Proprietary)
Limited
50%
Government of the Republic of
South Africa
Thintana Communications
LLC
Ucingo Investments
(Proprietary) Limited
67% 1
30% 1
3%
Telkom SA Limited
Vodafone Group plc
VenFin Limited
50%
35%
15%

197
Additional information with respect to our subsidiaries
Details of our subsidiaries, but not our Vodacom joint venture, are as follows:
Date and
place of
incorporation
Percentage
Length of
and date of
Issued
held, directly
time business
Name and
becoming a
share
or indirectly,
Principal
has been
registration number
subsidiary
capital
by Telkom
business
conducted
Telkom Directory Services
April 29, 1992
R100,000 divided into
64.9%
Provide services required
10 years
(Pty) Ltd (registration no:
Republic of
100,000 ordinary shares
for the production of
1992/002329/07)
South Africa
of R1.00 each
telephone directories
Swiftnet (Pty) Ltd
November 23, 1994
R50,000,000 was divided
100%
Render telecommunications
8 years
(registration no:
Republic of
into 5,000,000 ordinary
services enabling customers
1994/009541/07)
South Africa
shares of R1.00 each and
access to our switched
45,000,000 preference
data network by means
shares of R1.00 each
of fixed portable radio lines
Telkom Communications
May 21, 1999
US$ 2 divided into
100%
Dormant
3 years
International (Pty) Ltd
Mauritius
2 ordinary shares of
(registration no:
US$1 each
22372/5013)
Intekom (Pty) Ltd
October 11, 1996
R100,000 divided into
100%
Hold and license to
4.5 years
(registration no:
Republic of
10,000,000 ordinary shares
Telkom certain intellectual
1996/013862/07)
South Africa
of R0.01 each
property rights
Q-Trunk (Pty) Ltd
April 18, 1994
R10,001,000 divided into
100%
Dormant
8 years
(registration no:
Republic of
10,001,000 ordinary shares
1994/02728/07)
South Africa
of R1.00 each
Prior to becoming dormant in 2001, the main business and object of:
-
Telkom Communications International was to carry on the business of investments and to acquire and hold securities of all
kinds;
-
Q-Trunk was to provide a radio trunking service to the public as a network operator.
The following is a summary of certain provisions of the articles of association of Swiftnet and Telkom Directory Services,
Telkom's operating subsidiaries.
Directors
The directors of Swiftnet and Telkom Directory Services are not obliged to hold any qualification shares.
The directors of Telkom Directory Services are entitled to such remuneration as the shareholders in a general meeting may from
time to time determine, which remuneration shall be divided among the directors in such proportions as they may agree, or in
default of such agreement, equally, except that in the event any director has held office for less than a year, such director shall only
rank in such determination in the proportion to the period during which he or she has actually held office.
The directors of each of the companies may, with the approval of a disinterested quorum of directors, hold any other office or
place of profit in the company, except that of auditor, or any subsidiary of the company in conjunction with his office of director, for
such period and on such terms as to remuneration, in addition to the remuneration to which he may be entitled as a director, and
otherwise as a disinterested quorum of directors may determine.
Any director who serves on any executive or other committee or devotes special attention to the business of the company or goes
or resides outside the Republic of South Africa for the purposes of the company or otherwise performs or binds himself or herself
to perform services which, in the opinion of the directors, are outside the scope of the ordinary duties of a director, may be paid
such extra remuneration or allowances as a disinterested quorum of directors may determine.
The remuneration of a director appointed to any position or executive office shall be determined by a disinterested quorum of
directors, shall be in addition to or in substitution for any ordinary remuneration as a director of the company and may consist of a
salary or a commission on profits or dividends or both.
198
Borrowing powers
The directors may from time to time borrow for the purposes of the company such amounts as they think fit or secure the
payment or repayment of such amounts as they think fit, whether by the creation and issue of debentures, secured or unsecured,
whether outright or as security for any debt, liability or obligation of the company or of any third party, mortgage or charge upon
all or any of the property or assets of the company, including its uncalled or unpaid capital, make such regulations regarding the
transfer of debentures and all matters incidental to debentures, provided that the total amount owing by the company in respect of
money so raised, borrowed or secured shall not exceed the amount authorized by Telkom, once Telkom's shares are listed on any
stock exchange.
Property acquisitions
Neither Telkom, nor any of its subsidiaries have, in the three years preceding the date of this prospectus acquired, nor do they
propose to acquire or have any option to acquire any securities in, or the business undertakings of, any other company or business
enterprise or any immovable property or other property in the nature of a fixed asset, the purchase price of which is material,
as contemplated by the South African Companies Act, 61 of 1973.
Property disposals
Details of all disposals by Telkom and by its subsidiaries, but not our Vodacom joint venture, of any securities in any other
company or any business undertaking or any enterprise or any immovable property or other property in the nature of a fixed asset,
the purchase price of which is material, as contemplated in the South African Companies Act, 61 of 1973, which have occurred in
the three years preceding the date of this prospectus or which are to occur are as follows:
-
pursuant to a purchase agreement, dated March 18, 2000, between Telkom and debis Fleet Management (Proprietary)
Limited, Telkom sold its fleet management division, as a going concern, to debis Fleet Management effective March 31,
2000. The purchase price was R753,286,368, which was paid to Telkom in cash on March 31, 2000. The address of debis
Fleet Management is 123 Wierda Road, Zwartkop, Centurion, South Africa. The beneficial shareholder of debis Fleet
Management is Daimler Chrysler Services (debis) AG of debis House, am Potsdamer Platz, Eichornstrabe 3, 10785 Berlin,
Germany; and
-
on September 1, 2002, we issued an information memorandum inviting potential investors to provide to us by November
2002, preliminary submissions to purchase a substantial portion of our fixed line property portfolio and lease that property
back to us. This transaction is expected to involve over 1,400 properties ranging from warehouses and exchange buildings to
our national network operations center and is intended to further our strategy of focusing on our core business. We are
currently reviewing the bids we have received to date after having completed a due diligence process.
Material contracts
Particulars of all material contracts within the meaning of the South African Companies Act, 61 of 1973, and the JSE Listings
Requirements entered into by Telkom or any of its subsidiaries, but not our Vodacom joint venture, within the two years preceding
the date of this prospectus, other than in the ordinary course of the business carried on by Telkom or any of its subsidiaries, or any
other contract entered into at any time that contains an obligation or settlement that is significant to Telkom or any of its
subsidiaries, as of the date of this prospectus, are as follows:
-
the registration rights agreement referred to under "Relationship with Major Shareholders and Other Related Transactions
Shareholder arrangements - Registration rights agreement" on page 149 of this prospectus;
-
the existing and new strategic services agreements between Telkom, Thintana Communications, SBC International
Management Services Inc. and Telkom Management Services SDN Berhad referred to under "Relationship with Major
Shareholders and Related Transactions - Shareholder arrangements - Strategic services agreement" beginning on page 148
of this prospectus;
-
agreement, dated July 31, 2000, between Telkom and Telecommunications Facilities Management Company (Proprietary)
Limited or TFMC, pursuant to which Telkom appoints TFMC to manage, administer and maintain all of its properties;
-
exclusive facilities management services agreement, dated March 31, 2001, between Telkom and Systems Applications
Projects (Africa) (Proprietary) Limited or SAP Africa, pursuant to which SAP Africa grants Telkom a license to use specified
software to establish, operate and administer a central web-based market for use by Telkom, its employees and business
parties, for purposes of buying or selling products and/or services;
-
the Vodacom joint venture agreement referred to under "Relationship with Major Shareholders and Related Transactions"
beginning on page 145 of this prospectus;

199
-
multiparty implementation agreement, dated September 30,1993, between Telkom, Vodacom (Proprietary) Limited, Mobile
Telephone Networks (Proprietary) Limited or MTN, the Postmaster General and the Government of the Republic of South
Africa, which relates to the implementation of the national cellular telecommunications licenses issued to Vodacom and
MTN;
-
interconnection agreement, dated February 16, 1994 between Telkom and Vodacom (Proprietary) Limited, as amended on
August 22, 1996, January 12, 1998, July 21, 1998 and September 4, 2001, relating to the interconnection of their respective
telecommunications networks and the conveyance of messages to and from their respective networks to the intended
destination of such messages;
-
interconnection agreement, dated February 16, 1994 between Telkom and MTN, as amended on August 22, 1996, January 12,
1998, July 21, 1998 and September 14, 2001, relating to the interconnection of their respective telecommunications networks
and the conveyance of messages to and from their respective networks to the intended destination of such messages;
-
interconnection agreement, dated August 31, 2001, between Telkom and Cell C, as amended on September 18, 2001, relating
to the interconnection of their respective telecommunications networks and the conveyance of messages to and from their
respective networks to the intended destination;
-
terms and conditions of the bonds listed on the Bond Exchange of South Africa under ticker code "TK01", as set out in an
offering circular issued by Telkom;
-
terms and conditions of the bonds listed on the Bond Exchange of South Africa under ticker code "TL08", as set out in an
offering circular issued by Telkom;
-
terms and conditions of the bonds listed on the Bond Exchange of South Africa under ticker code "TL03", as set out in an
offering circular issued by Telkom;
-
terms and conditions of the bonds listed on the Bond Exchange of South Africa under ticker code "TL06", as set out in an
offering circular issued by Telkom, dated October 29, 2001;
-
terms and conditions of the bonds listed on the Bond Exchange of South Africa under ticker code "TL20" as set out in the
placing document issued by Telkom;
-
terms and conditions of the zero coupon loan stock PP02 as set out in a private placing circular issued by Telkom;
-
terms and conditions of the zero coupon loan stock PP03 as set out in a zero coupon note issued by Telkom; and
-
terms and conditions of the Telkom EuroBond 2000 listed on the London Stock Exchange, as set out in the offering circular
issued by Telkom.
Royalty agreements
Details of existing or proposed contracts relating to material royalties and technical fees payable by Telkom or any of its
subsidiaries, but not our Vodacom joint venture, are as follows:
Date of agreement
Parties
Product or services
Royalty/Technical fee
February 28, 2000
Telkom and Safika Technology
Right to use FLOWTHRU
Service fee of 20% of purchase price
Holdings (Proprietary) Limited
AND I-CARE software
in year 1, 50% in year 2 and 100%
t/a Safika BEA
in year 3, based on minimum purchase
price prior to April 30, 2000 of
US$2 million
December 18, 1998
Telkom and Systems Applications
Use of software, third party
Initial cost of R45,194,765 with
Products (Southern Africa)
database and network access
service fee of 15% of original fee
(Proprietary) Limited and
per annum
Vodacom
April 28, 1999
Telkom and AMDOCS, Inc. and
License to use billing system
Assessed annual commitment of
Persetel Q-Data Africa
and related software products
R23 million
(Proprietary) Limited
and related customization
services and maintenance
Extension of agreement
Telkom and IBM South Africa
License agreement for use of
R10,896,556, subject to foreign
from March 31, 2001
(Proprietary) Limited
proprietary software of IBM or
exchange increases and consumer
Group 80 Main Frame Equipment
price increases
and Enterprise Administered
System/390 software

200
Date of agreement
Parties
Product or services
Royalty/Technical fee
March 1, 2000
Telkom and EMC Computer Systems
Right to use software, including
License and maintenance fee for year
(Proprietary) Limited
Microcode and Film-ware for
ended March 31, 2002 was R13,554,329
internal enterprise network to
and payment is in terms of a quote
support host computers, network
basis
devices and application systems
September 1, 1999
Telkom and Oracle Corporation
License and maintenance
License and service fee of R24,105,998
(South Africa) (Proprietary) Limited
agreement for the use of Oracle
for year ended March 31, 2002
network software for data
management, development,
administration and sales analysis
August 1, 1999
Telkom and Novell Ireland
License and service fee for use
Currently annual commitment
Software Limited
of Novell software
of R15,103,869
Commissions paid in respect of underwriting
Details of the consideration paid within the preceding three years as commission to any person for subscribing or agreeing to
subscribe or procuring or agreeing to procure subscriptions for securities in Telkom are as follows:
Commission
paid in year
ended
Description
Name of
Address of
Amount
Commission
March 31,
of security
underwriter
underwriter
underwritten
paid
(ZAR)
(ZAR)
2002
Telkom bond - TL03
Joint Lead Manager
87 Maud Street
2,300,000,000
1,581,250
Deutsche Bank AG
Sandown, Sandton
South Africa
Joint Lead Manager
2 Fredman Drive
Rand Merchant Bank,
Sandown
a division of FirstRand
South Africa
Bank Limited
Senior Co-Lead Manager
138 West Street
Merrill Lynch South Africa
Sandown, Sandton
(Proprietary) Limited
South Africa
2002
Telkom bond - TL06
Lead Manager -
3 Simmonds Street
1,500,000,000
750,000
Standard Corporate
Johannesburg
and Merchant Bank,
South Africa
a division of The Standard
Bank of South Africa
Limited
Co-Lead Manager
100 Grayston Drive
Investec Bank Limited
Sandown, Sandton
South Africa
Co-Lead Manager -
1 Fricker Road
JP Morgan Securities
Illovo
South Africa
Johannesburg
(Proprietary) Limited
South Africa
Joint Manager
135 Rivonia Road
Nedcor Bank Limited
Sandown, Sandton
South Africa
Joint Manager
1 Newton Avenue
Nedcor Investment
Killarney
Bank Limited
Johannesburg
(Proprietary)
South Africa
Joint Manager
61 Central Street
Wipcapital
Houghton
(Proprietary) Limited
Johannesburg
South Africa

201
Commission
paid in year
ended
Description
Name of
Address of
Amount
Commission
March 31,
of security
underwriter
underwriter
underwritten
paid
(ZAR)
(ZAR)
2001
Telkom bond - TL03
Joint Lead Manager
87 Maud Street
2,700,000,000
1,856,250
Deutsche Bank AG
Sandown, Sandton
South Africa
Joint Lead Managers
2 Fredman Drive
Rand Merchant Bank,
Sandown, Sandton
a division of FirstRand
South Africa
Bank Limited
Senior Co-Lead Manager
138 West Street
Merrill Lynch South Africa
Sandown, Sandton
(Proprietary) Limited
South Africa
Telkom Euro bond
Salomon Brothers
111 Buckingham
3,150,000,000
3,150,000
International Limited
Palace Road
London, SW1B OSB
United Kingdom
Dresdner Bank AG
London Branch
ABN Amro Bank NV
Commerzbank AG
Credit Agricole Indosuez
Credit Suisse First Boston
(Europe) Limited
Deutsche Bank AG
Commission
paid in year
ended
Description
Name of
Address of
Amount
Commission
March 31,
of security
underwriter
underwriter
underwritten
paid
(ZAR)
(ZAR)
2000
Telkom bond - TL08
Joint Lead Managers
3 Simmonds Street
1,500,000,000
1,687,500
Standard Corporate
Johannesburg
and Merchant Bank,
South Africa
a division of The Standard
Bank of South Africa
Limited
Joint Lead Managers
1 Fricker Road
JP Morgan Securities
Illovo
South Africa
Johannesburg
(Proprietary) Limited
South Africa
Senior Co-Lead Manager
87 Maud Street
Deutsche Bank AG
Sandown, Sandton
South Africa
Joint Manager
2 Fredman Drive
Rand Merchant Bank,
Sandown, Sandton
a division of FirstRand
South Africa
Bank Limited
Joint Manager
2 Maud Street
African Merchant Bank
Sandown, Sandton
Limited
South Africa
The directors of the underwriters in the above table that are companies incorporated in the Republic of South Africa are as
follows:
FirstRand Bank Limited:
-
M Brogan, R Williams, M King, A Vahed, V Bartlett, G Ferreira, L Dippenaar, J Burger, J Gafney, P Goss, P Harris,
S Maharaj, D Falck, R Spilg.

202
Merrill Lynch South Africa (Proprietary) Limited:
-
M Borkum, H Borkum, A Hare, M Marks, B Henderson, C Phillips, Y Ramaih, S Ermotti, A Horowitz.
The Standard Bank of South Africa Limited:
-
D Hawton, C Strauss, E Theron, E Mackay, D Band, J Maree, E Bradley, D Cooper, R Plumbridge, R Andersen, S Macozoma,
R Menell, C Stals, M Ruck, P Prinsloo.
Investec Bank Limited:
-
D Jowell, B Kantor, S Abrahams, R Berkowitz, A Leith, P Thomas, G Burger, R Forlee, S Hackner, D Kuper, B Tapnack,
R Upton, M Nkosi, M Mason, I Kantor, D Lawrence, H Herman, R Mokate, D Nurek, M Malungani, D Motsepe, F Titi.
J P Morgan Securities South Africa (Proprietary) Limited:
-
J Coulter, M Horton, W Evans.
Nedbank Limited:
-
C Liebenberg, M Katz, S Morris, A Routledge, R Laubscher, M Levett, D Muller, J de Blanche, B Hore, P Joubert,
W Clewlow, J Magwaza, M Mkhwanazi, M Ndlovu, J Roberts, J Sutcliffe, T Nyasulu, I Botha, T Boardman, C Savage,
B Davison, B Figaji, P Nhleko, R Cottrell, D Nicholas.
Nedcor Investment Bank Limited:
-
G Richardson, S Morris, R Laubscher, J Bestbier, B Davison, P Lane, W Ross, M Davis, P Joubert, R Cottrell, C Liebenberg,
A Routledge, M Katz, R van Wyk, L Porter, I Botha, E Molobi, P Nhleko, N Dennis, S Pityana.
Wipcapital (Proprietary) Limited:
-
G Serobe, D Tennick.
AMB Holdings Limited:
-
B Vundla, J Chalsty, R Rumboll, W Winckler, J Meyers, Z Lusengo, D Baloyi, A Moosa, A Jammine, A Sprague,
O Maubane, C Vosloo, R Dow.
Directors of Vodacom
The only material loan made by Telkom or any of its subsidiaries is to Vodacom. See "Management's Discussion and Analysis
of Financial Condition and Results of Operations - Funding sources" beginning on page 75 of this prospectus. Vodacom's directors
are Wendy Luhabe, Alan Knott-Craig, Andrew Mthembu, Leon Crouse, Shameel Aziz-Joosub, Sizwe Nxasana, Philip Williams,
Josua Malherbe, Hans Kuropatwa, Andy Halford, Shawn McKenzie and Chian Khai Tan.
Telkom company selected five-year historical financial information
The following five year selected historical financial information is required by the South African Companies Act, 61 of 1973 and
sets forth the unaudited profit of Telkom, excluding its subsidiaries and Vodacom joint venture, before and after tax for each of the
five years ended March 31, 2002 and the unaudited total assets and liabilities as of March 31, 2002. This unaudited historical
financial information has been derived from Telkom's annual financial statements prepared in accordance with South African
generally accepted accounting principles and required by the South African Companies Act, 61 of 1973, as of and for each of the
five years ended March 31, 2002 with certain adjustments made for purposes of converting those amounts to the corresponding
amounts under IAS. For purposes of this presentation, Telkom's investments in subsidiaries and the Vodacom joint venture are
reflected using the cost method of accounting in accordance with IAS 27, paragraph 29, and IAS 31, paragraph 42, respectively.
This unaudited selected historical financial information is not required by the US securities and exchange commission's rules and
regulations and is not in accordance with US GAAP.
Year ended March 31,
1998
1999
2000
2001
2002
(unaudited)
(ZAR millions)
Income statement data
Profit before tax . . . . . . . . . . .
3,012
1,822
889
1,677
489
Profit after tax . . . . . . . . . . . .
2,123
1,391
711
1,373
262
Balance sheet data as of
March 31, 2002
Total assets . . . . . . . . . . . . . .
48,514
Total liabilities . . . . . . . . . . . .
34,555
F-1
INDEX TO FINANCIAL STATEMENTS
Page
Condensed Consolidated Interim Financial Statements of Telkom SA Limited
Review Report of the Independent Accountants . . . . . . . . . . . . . . . . . . . . . . . . . . . . . . . . . . . . . . . . .
F-2
Condensed Consolidated Income Statements for the six months ended September 30, 2002 and 2001 . . . . . . . . . . . .
F-3
Condensed Consolidated Balance Sheets at March 31, 2002 and September 30, 2002 . . . . . . . . . . . . . . . . . . . . .
F-4
Condensed Consolidated Statements of Changes in Equity for the six months ended September 30, 2002 and 2001 . . . . .
F-5
Condensed Consolidated Cash Flow Statements for the six months ended September 30, 2002 and 2001 . . . . . . . . . .
F-6
Notes to the Condensed Consolidated Interim Financial Statements . . . . . . . . . . . . . . . . . . . . . . . . . . . . . .
F-7
Condensed Consolidated Interim Financial Statements of Vodacom Group (Proprietary) Limited
Review Report of the Independent Accountants . . . . . . . . . . . . . . . . . . . . . . . . . . . . . . . . . . . . . . . . .
F-25
Condensed Consolidated Income Statements for the six months ended September 30, 2002 and 2001 . . . . . . . . . . . .
F-26
Condensed Consolidated Balance Sheets at March 31, 2002 and September 30, 2002 . . . . . . . . . . . . . . . . . . . . .
F-27
Condensed Consolidated Statements of Changes in Equity for the six months ended September 30, 2002 and 2001 . . . . .
F-28
Condensed Consolidated Cash Flow Statements for the six months ended September 30, 2002 and 2001 . . . . . . . . . .
F-29
Notes to the Condensed Consolidated Interim Financial Statements . . . . . . . . . . . . . . . . . . . . . . . . . . . . . .
F-30
Consolidated Financial Statements of Telkom SA Limited
Report of the Independent Auditors . . . . . . . . . . . . . . . . . . . . . . . . . . . . . . . . . . . . . . . . . . . . . . .
F-48
Consolidated Income Statements for the three years ended March 31, 2002 . . . . . . . . . . . . . . . . . . . . . . . . . .
F-49
Consolidated Balance Sheets at March 31, 2002, 2001 and 2000 . . . . . . . . . . . . . . . . . . . . . . . . . . . . . . . .
F-50
Consolidated Statements of Changes in Equity for the three years ended March 31, 2002 . . . . . . . . . . . . . . . . . . .
F-51
Consolidated Cash Flow Statements for the three years ended March 31, 2002 . . . . . . . . . . . . . . . . . . . . . . . .
F-52
Notes to the Consolidated Financial Statements . . . . . . . . . . . . . . . . . . . . . . . . . . . . . . . . . . . . . . . . .
F-53
Consolidated Financial Statements of Vodacom Group (Proprietary) Limited
Report of the Independent Auditors . . . . . . . . . . . . . . . . . . . . . . . . . . . . . . . . . . . . . . . . . . . . . . . F-115
Consolidated Income Statements for the three years ended March 31, 2002 . . . . . . . . . . . . . . . . . . . . . . . . . . F-116
Consolidated Balance Sheets at March 31, 2002, 2001 and 2000 . . . . . . . . . . . . . . . . . . . . . . . . . . . . . . . . F-117
Consolidated Statements of Changes in Equity for the three years ended March 31, 2002 . . . . . . . . . . . . . . . . . . . F-118
Consolidated Cash Flow Statements for the three years ended March 31, 2002 . . . . . . . . . . . . . . . . . . . . . . . . F-119
Notes to the Consolidated Financial Statements . . . . . . . . . . . . . . . . . . . . . . . . . . . . . . . . . . . . . . . . . F-120

F-2
REVIEW REPORT OF THE INDEPENDENT ACCOUNTANTS
to the Shareholders of Telkom SA Limited
We have reviewed the accompanying condensed consolidated balance sheet of Telkom SA Limited and its subsidiaries as of
September 30, 2002, and the related condensed consolidated statements of income, shareholders' equity and cash flows for the
six-month periods ended September 30, 2002 and 2001 set out on pages F3 to F24. These condensed consolidated interim
financial statements are the responsibility of the Company's directors. We were furnished with the report of other accountants on
their reviews of the interim information of Vodacom Group (Proprietary) Limited, a 50% joint venture, which statements reflect
total assets constituting 15.9% in September 2002 and total revenues constituting 21.6% in September 2002 and 18.4% in
September 2001 of the related consolidated totals.
We conducted our reviews in accordance with standards established by the American Institute of Certified Public Accountants.
A review of interim financial information consists principally of applying analytical procedures to financial data, and making
inquiries of persons responsible for financial and accounting matters. It is substantially less in scope than an audit conducted in
accordance with auditing standards generally accepted in the United States of America, which will be performed for the full year
with the objective of expressing an opinion regarding the financial statements taken as a whole. Accordingly we do not express
such an opinion.
Based on our reviews and the report of other accountants, we are not aware of any material modifications that should be made to
the accompanying condensed consolidated interim financial statements for them to be in conformity with International Accounting
Standard 34 Interim Financial Reporting.
We have previously audited, in accordance with auditing standards generally accepted in the United States, the consolidated balance
sheet of Telkom SA Limited as of March 31, 2002, and the related consolidated statements of income, shareholders' equity, and
cash flows for the year then ended and in our report dated December 10, 2002, we expressed, based on our audit and the report of
other auditors, an unqualified opinion on those consolidated financial statements as well as drew attention to Telkom SA Limited's
change in accounting policy for financial instruments to conform with International Accounting Standards 39 Financial
Instruments: Recognition and measurement. In our opinion, the information set forth in the accompanying condensed consolidated
balance sheet as of March 31, 2002, is fairly stated, in all material respects, in relation to the consolidated balance sheet from which
it has been derived.
International Accounting Standards vary in certain significant respects from accounting principles generally accepted in the United
States of America. Application of accounting principles generally accepted in the United States of America would have affected the
consolidated shareholders' equity as of September 30, 2002, and the consolidated results of operations for each of the six-month
periods ended September 30, 2002 and September 30, 2001 to the extent summarized in Note 21 to the unaudited condensed
consolidated interim financial statements.
ERNST & YOUNG
Registered Accountants and Auditors
Chartered Accountants (SA)
Pretoria
December 12, 2002
Chartered Accountants (SA)
Telephone (011) 772-3000
Wanderers Office Park
Telefax (011) 772-4000
52 Corlett Drive, Illovo
Docex 123 Randburg
PO Box 2322
www.ey.com/southafrica
Johannesburg 2000

F-3
TELKOM SA LIMITED
CONDENSED CONSOLIDATED INCOME STATEMENTS
for the six months ended September 30, 2002 and 2001
September
September
2001
2002
Note
(Unaudited)
(Unaudited)
Rm
Rm
Operating revenue . . . . . . . . . . . . . . . . . . . . . . . . . . . . . . .
3
16,523
18,316
Operating expenses . . . . . . . . . . . . . . . . . . . . . . . . . . . . . . .
14,355
15,505
Employee expenses . . . . . . . . . . . . . . . . . . . . . . . . . . . . . .
3,590
3,707
Payments to other operators . . . . . . . . . . . . . . . . . . . . . . . . . .
2,654
3,105
Selling, general and administrative expenses . . . . . . . . . . . . . . . . .
3,794
3,795
Services rendered . . . . . . . . . . . . . . . . . . . . . . . . . . . . . . .
1,091
1,108
Operating leases . . . . . . . . . . . . . . . . . . . . . . . . . . . . . . . .
583
684
Depreciation and amortization . . . . . . . . . . . . . . . . . . . . . . . . .
2,643
3,106
Operating profit . . . . . . . . . . . . . . . . . . . . . . . . . . . . . . . . .
2,168
2,811
Investment income . . . . . . . . . . . . . . . . . . . . . . . . . . . . . . . .
306
152
Profit before finance charges . . . . . . . . . . . . . . . . . . . . . . . . . .
2,474
2,963
Finance charges . . . . . . . . . . . . . . . . . . . . . . . . . . . . . . . . . .
(1,845)
(1,779)
Profit before tax . . . . . . . . . . . . . . . . . . . . . . . . . . . . . . . . .
629
1,184
Taxation . . . . . . . . . . . . . . . . . . . . . . . . . . . . . . . . . . . . . .
(206)
(456)
Profit after tax . . . . . . . . . . . . . . . . . . . . . . . . . . . . . . . . . .
423
728
Minority interests . . . . . . . . . . . . . . . . . . . . . . . . . . . . . . . . .
(52)
(84)
Net profit for the period . . . . . . . . . . . . . . . . . . . . . . . . . . . .
371
644
Basic and diluted earnings per share (cents) . . . . . . . . . . . . . . . . .
8
66.6
115.6
F-4
TELKOM SA LIMITED
CONDENSED CONSOLIDATED BALANCE SHEETS
at March 31, 2002 and September 30, 2002
March
September
2002
2002
(Audited)
(Unaudited)
Rm
Rm
ASSETS
Non-current assets . . . . . . . . . . . . . . . . . . . . . . . . . . . . . . .
44,240
43,386
Property, plant and equipment . . . . . . . . . . . . . . . . . . . . . . . . . .
41,918
41,172
Intangible assets . . . . . . . . . . . . . . . . . . . . . . . . . . . . . . . . .
530
442
Investments . . . . . . . . . . . . . . . . . . . . . . . . . . . . . . . . . . . .
780
867
Deferred taxation . . . . . . . . . . . . . . . . . . . . . . . . . . . . . . . . .
1,012
905
Current assets . . . . . . . . . . . . . . . . . . . . . . . . . . . . . . . . . .
10,968
11,195
Inventories . . . . . . . . . . . . . . . . . . . . . . . . . . . . . . . . . . . .
624
887
Trade receivables . . . . . . . . . . . . . . . . . . . . . . . . . . . . . . . . .
5,720
6,163
Income tax receivable . . . . . . . . . . . . . . . . . . . . . . . . . . . . . .
1,081
237
Other financial assets . . . . . . . . . . . . . . . . . . . . . . . . . . . . . . .
2,819
2,823
Cash and cash equivalents . . . . . . . . . . . . . . . . . . . . . . . . . . . .
724
1,085
Total assets . . . . . . . . . . . . . . . . . . . . . . . . . . . . . . . . . . . .
55,208
54,581
EQUITY AND LIABILITIES
Capital and reserves . . . . . . . . . . . . . . . . . . . . . . . . . . . . . .
16,832
17,475
Share capital and premium . . . . . . . . . . . . . . . . . . . . . . . . . . . .
8,293
8,293
Share issue expenses . . . . . . . . . . . . . . . . . . . . . . . . . . . . . . .
(44)
Non-distributable reserves . . . . . . . . . . . . . . . . . . . . . . . . . . . .
134
112
Retained earnings . . . . . . . . . . . . . . . . . . . . . . . . . . . . . . . . .
8,449
9,070
Minority interests . . . . . . . . . . . . . . . . . . . . . . . . . . . . . . . .
133
214
Non-current liabilities . . . . . . . . . . . . . . . . . . . . . . . . . . . . . .
25,597
21,340
Interest-bearing debt . . . . . . . . . . . . . . . . . . . . . . . . . . . . . . .
21,505
17,097
Finance leases . . . . . . . . . . . . . . . . . . . . . . . . . . . . . . . . . .
1,028
1,047
Deferred taxation . . . . . . . . . . . . . . . . . . . . . . . . . . . . . . . . .
463
523
Provisions . . . . . . . . . . . . . . . . . . . . . . . . . . . . . . . . . . . . .
2,601
2,673
Current liabilities . . . . . . . . . . . . . . . . . . . . . . . . . . . . . . . .
12,646
15,552
Trade and other payables . . . . . . . . . . . . . . . . . . . . . . . . . . . . .
7,391
6,025
Current portion of interest-bearing debt . . . . . . . . . . . . . . . . . . . . .
2,041
5,953
Current portion of finance leases . . . . . . . . . . . . . . . . . . . . . . . . .
5
5
Deferred income . . . . . . . . . . . . . . . . . . . . . . . . . . . . . . . . .
958
838
Income tax payable . . . . . . . . . . . . . . . . . . . . . . . . . . . . . . . .
193
76
Current portion of provisions . . . . . . . . . . . . . . . . . . . . . . . . . .
1,236
1,291
Credit facilities utilized . . . . . . . . . . . . . . . . . . . . . . . . . . . . . .
822
1,364
Total equity and liabilities . . . . . . . . . . . . . . . . . . . . . . . . . . .
55,208
54,581

F-5
TELKOM SA LIMITED
CONDENSED CONSOLIDATED STATEMENTS OF CHANGES IN EQUITY
for the six months ended September 30, 2002 and 2001
Share Share
Preliminary
Non-
Retained
Total
capital
premium
listing costs
distributable
earnings
reserves
Rm
Rm
Rm
Rm
Rm
Rm
Balance at March 31, 2001 (Audited)
5,570
2,723
6,679
14,972
Adoption of IAS39 . . . . . . . . . .
45
584
629
Restated Balance at March 31, 2001
(Audited) . . . . . . . . . . . . . . .
5,570
2,723
45
7,263
15,601
Net profit for the period . . . . . . . .
371
371
Transfer to non-distributable reserve .
11
(11)
Share issue expenses . . . . . . . . . .
(32)
(32)
Foreign currency reserves (net of tax) .
8
8
Balance at September 30, 2001
(Unaudited) . . . . . . . . . . . . . .
5,570
2,723
(32)
64
7,623
15,948
Balance at March 31, 2002 (Audited)
5,570
2,723
(44)
134
8,449
16,832
Net profit for the period . . . . . . . .
644
644
Transfer to non-distributable reserve .
23
(23)
Fair value adjustment . . . . . . . . .
(22)
(22)
Foreign currency reserves (net of tax) .
(23)
(23)
Share issue expenses reversal . . . .
44
44
Balance at September 30, 2002
(Unaudited) . . . . . . . . . . . . . .
5,570
2,723
112
9,070
17,475
F-6
TELKOM SA LIMITED
CONDENSED CONSOLIDATED CASH FLOW STATEMENTS
for the six months ended September 30, 2002 and 2001
September
September
2001
2002
Note
(Unaudited)
(Unaudited)
Rm
Rm
Operating activities . . . . . . . . . . . . . . . . . . . . . . . . . . . . . . .
3,301
3,462
Cash receipts from customers . . . . . . . . . . . . . . . . . . . . . . . . . .
16,548
18,021
Cash paid to suppliers and employees . . . . . . . . . . . . . . . . . . . . . .
(11,963)
(13,980)
Cash generated from operations . . . . . . . . . . . . . . . . . . . . . . . . .
4,585
4,041
Income from investments . . . . . . . . . . . . . . . . . . . . . . . . . . . . .
246
152
Finance charges paid . . . . . . . . . . . . . . . . . . . . . . . . . . . . . . .
(957)
(1,168)
Taxation (paid)/refunded . . . . . . . . . . . . . . . . . . . . . . . . . . . . .
(573)
437
Investing activities . . . . . . . . . . . . . . . . . . . . . . . . . . . . . . . .
(3,653)
(2,453)
Proceeds on disposal of property, plant and equipment . . . . . . . . . . . . .
13
2
Additions to property, plant and equipment . . . . . . . . . . . . . . . . . . .
(3,641)
(2,346)
Additions to other investments . . . . . . . . . . . . . . . . . . . . . . . . . .
(3)
(109)
Purchase of minority interests . . . . . . . . . . . . . . . . . . . . . . . . . .
14
(22)
Financing activities . . . . . . . . . . . . . . . . . . . . . . . . . . . . . . .
(973)
(1,178)
Loans raised . . . . . . . . . . . . . . . . . . . . . . . . . . . . . . . . . . .
7,444
7,599
Loans repaid . . . . . . . . . . . . . . . . . . . . . . . . . . . . . . . . . . .
(9,182)
(8,614)
Finance lease . . . . . . . . . . . . . . . . . . . . . . . . . . . . . . . . . . .
2
(Increase)/decrease in interest-bearing investments . . . . . . . . . . . . . . .
765
(165)
Net decrease in net cash and cash equivalents . . . . . . . . . . . . . . . . . .
(1,325)
(169)
Net cash and cash equivalents at beginning of the period . . . . . . . . . . . .
867
(98)
Effect of foreign exchange rate differences . . . . . . . . . . . . . . . . . . .
2
(12)
Net cash and cash equivalents at end of the period . . . . . . . . . . . . .
9
(456)
(279)

F- 7
TELKOM SA LIMITED
NOTES TO THE CONDENSED CONSOLIDATED INTERIM FINANCIAL STATEMENTS
1.
BASIS OF PREPARATION
The condensed consolidated balance sheet of the Telkom SA Limited Group ("Group") as at September 30, 2002 andthe condensed consolidated income statements, statements of changes in equity and cash flows for the six months ended
September 30, 2001 and 2002 are unaudited. For purposes of the interim financial statements, certain information and
disclosures normally included in financial statements prepared in accordance with generally accepted accounting principles
have been condensed or omitted. The March 31, 2002 balance sheet was derived from the audited group consolidated financial
statements prepared in accordance with International Accounting Standards (IAS). These unaudited financial statements should
be read in conjunction with the audited IAS consolidated financial statements for the three years ended March 31, 2002.
All adjustments of a normal recurring nature, necessary for the fair presentation of the condensed consolidated interim
financial statements have been included herein. The results of the interim periods are not necessarily indicative of the results
for the entire year.
2.
ACCOUNTING POLICIES
The condensed consolidated interim financial statements have been prepared in accordance with and comply with IAS 34
Interim Financial Reporting.
The preparation of the condensed consolidated interim financial statements requires the Group's management to make
estimates and assumptions that may affect the reported amounts of assets and liabilities and disclosure of contingent assets
and liabilities at the date of the condensed consolidated interim financial statements, and the reported amounts of revenues
and expenses during the reporting period. Actual results could differ from those estimates.
The accounting policies of the Group applied in the presentation of the accompanying unaudited condensed consolidated interim
financial statements for the six months ended September 30, 2001 and 2002 are consistent with those applied in the financial
statements for the year ended March 31, 2002.
September
September
2001
2002
(Unaudited)
(Unaudited)
Rm
Rm
3.
OPERATING REVENUE
Operating Revenue . . . . . . . . . . . . . . . . . . . . . . . . . . . .
16,523
18,316
Fixed Line . . . . . . . . . . . . . . . . . . . . . . . . . . . . . . . .
13,473
14,355
Mobile . . . . . . . . . . . . . . . . . . . . . . . . . . . . . . . . . .
3,050
3,961
Fixed Line . . . . . . . . . . . . . . . . . . . . . . . . . . . . . . . . .
13,473
14,355
Subscriptions, connections and other usage . . . . . . . . . . . . . . .
2,208
2,239
Traffic . . . . . . . . . . . . . . . . . . . . . . . . . . . . . . . . . . .
8,495
8,911
National (local and long distance) . . . . . . . . . . . . . . . . . . .
4,371
4,510
Fixed-to-mobile . . . . . . . . . . . . . . . . . . . . . . . . . . . .
3,508
3,770
International (outgoing) . . . . . . . . . . . . . . . . . . . . . . . .
616
631
Interconnection . . . . . . . . . . . . . . . . . . . . . . . . . . . . . .
626
825
Data . . . . . . . . . . . . . . . . . . . . . . . . . . . . . . . . . . . .
1,786
1,996
Directories and other . . . . . . . . . . . . . . . . . . . . . . . . . . .
358
384
4.
IMPAIRMENT LOSSES . . . . . . . . . . . . . . . . . . . . . . . . . -
16
The Group impaired the goodwill arising on the acquisition of 40% of Swiftnet (Proprietary) Limited as a result of the current
performance of that company.

F-8
TELKOM SA LIMITED
NOTES TO THE CONDENSED CONSOLIDATED INTERIM FINANCIAL STATEMENTS
September
September
2001
2002
(Unaudited)
(Unaudited)
Rm
Rm
5.
RESTRUCTURING COSTS . . . . . . . . . . . . . . . . . . . . . . .
195
169
Telkom has continued to incur restructuring costs, as a result of
a plan to reduce the workforce. 498 employees were affected (September 30, 2001: 1,102).
March
September
2002
2002
(Audited)
(Unaudited)
6.
NUMBER OF SHARES IN ISSUE
557,031,819 ordinary shares of R10 each.
7.
NET ASSET VALUE PER SHARE (cents) . . . . . . . . . . . . . . .
3,021.7
3,137.2
The calculation of net asset value per share is based on
net assets of R17,475 million as at September 30, 2002
(March 31, 2002: R16,832 million) and
557,031,819 (March 31, 2002: 557,031,819) issued shares.
September
September
2001
2002
(Unaudited)
(Unaudited)
8.
BASIC AND DILUTED EARNINGS PER SHARE (cents) . . . . . .
66.6
115.6
The calculation of basic and diluted earnings per share is based
on net profit of R644 million ( September 30, 2001: R371 million) and
557,031,819 (September 30, 2001: 557,031,819) issued shares.
There are no dilution factors at present, as a result basic and
diluted earnings per share are equal.
September
September
2001
2002
(Unaudited)
(Unaudited)
Rm
Rm
9.
NET CASH AND CASH EQUIVALENTS . . . . . . . . . . . . . . . .
(456)
(279)
Cash . . . . . . . . . . . . . . . . . . . . . . . . . . . . . . . . . . . . .
270
1,085
Credit facilities utilized . . . . . . . . . . . . . . . . . . . . . . . . . . .
(726)
(1,364)
Unutilized banking facilities . . . . . . . . . . . . . . . . . . . . . . .
R2,2 billion
R2,2 billion
The general banking facilities have no specific maturity date, but are
subject to annual review. The facilities are in place to ensure continuing
liquidity.

F-9
TELKOM SA LIMITED
NOTES TO THE CONDENSED CONSOLIDATED INTERIM FINANCIAL STATEMENTS
September
September
2001
2002
(Unaudited)
(Unaudited)
Rm
Rm
10.
ADDITIONS TO PROPERTY, PLANT AND EQUIPMENT
Additions:
Land and buildings . . . . . . . . . . . . . . . . . . . . . . . . . . . .
145
100
Network equipment . . . . . . . . . . . . . . . . . . . . . . . . . . . .
2,377
1,463
Furniture and office equipment . . . . . . . . . . . . . . . . . . . . . .
10
7
Data Processing equipment . . . . . . . . . . . . . . . . . . . . . . . .
472
148
Under construction . . . . . . . . . . . . . . . . . . . . . . . . . . . .
615
616
Other . . . . . . . . . . . . . . . . . . . . . . . . . . . . . . . . . . .
22
12
3,641
2,346
11.
MOVEMENT IN INVENTORIES
The majority of the group's inventories are purchased from foreign countries,
that require a lead time of approximately three months before receipt in
South Africa. Telkom Group practice is to place most of its orders during
the first six months of the year. Our inventory level therefore decreases
towards the end of the year.
March
September
2002
2002
(Audited)
(Unaudited)
Rm
Rm
12.
INTEREST BEARING DEBT
Current portion of interest bearing debt
Local debt . . . . . . . . . . . . . . . . . . . . . . . . . . . . . . . . . .
2,002
5,892
Foreign debt . . . . . . . . . . . . . . . . . . . . . . . . . . . . . . . . .
39
61
Total current portion of interest bearing debt . . . . . . . . . . . . . .
2,041
5,953
Long term portion of interest bearing debt
Local debt . . . . . . . . . . . . . . . . . . . . . . . . . . . . . . . . . .
16,010
11,011
Foreign debt . . . . . . . . . . . . . . . . . . . . . . . . . . . . . . . . .
5,495
6,086
Total long term portion of interest bearing debt . . . . . . . . . . . .
21,505
17,097
Movements in borrowings for the six month period ended September 30, 2002
Interest bearing debt in the form of commercial paper bills decreased from R2.5 billion to R1.7 billion as set out in Note 13
below. An additional credit facility of R148 million was extended and taken up by the Group with an additional loan
of R79 million raised from the minority shareholders and a revolving credit of R32 million granted.

F-10
TELKOM SA LI`ITED
NOTES TO THE CONDENSED CONSOLIDATED INTERIM FINANCIAL STATEMENTS
13.
ISSUES AND REPAYMENT OF INTEREST BEARING DEBT
For the six month period ended September 30, 2002
New issue:
The issuing of an extended credit facility to Vodacom Congo
(R.D.C.) S.P.R.L. for R150 million.
Repayment of debt
The following local debt was repaid in the period under review:
R803,6 million repayment of Commercial Paper Bills.
R200 million repayment of locally registered debt instruments (PP01).
Refinancing of current portion of interest bearing debt
The refinancing of R5.9 billion of current portion of interest bearing debt
will depend on the market circumstances at the time of repayment.
Management believes that sufficient funding facilities will be available at
the date of refinancing.
14.
PURCHASE OF MINORITY INTEREST
On May 16, 2001, an additional 40% of Swiftnet (Proprietary) Limited was acquired for R22 million, bringing the Group's
shareholding to 100% (See Note 4).
March
September
2002
2002
(Audited)
(Unaudited)
Rm
Rm
15.
CONTINGENCIES . . . . . . . . . . . . . . . . . . . . . . . . . . . .
Third parties . . . . . . . . . . . . . . . . . . . . . . . . . . . . . . . . .
65
29
Guarantee of employee housing loans . . . . . . . . . . . . . . . . . . .
208
175
Third parties
These amounts represent sundry disputes against third parties that are not individually significant and that the company
does not envisage settling.
Guarantee of employee housing loans
Telkom guarantees to settle a certain portion of employees' housing loans. The amount guaranteed differs depending on
factors such as employment period and salary rates. When an employee leaves the employment of Telkom, any housing
debt guaranteed by Telkom is settled before any payment can be made over to the employee.
The maximum amount of the guarantee in the event of default is disclosed above.
Supplier dispute
Expenditure of R594 million was incurred in the 2000 and 2001 financial year for the development and the installation of an
integrated end-to-end customer assurance and activation system by Telcordia. In the 2001 financial year, the agreement with
Telcordia was terminated and Telkom wrote off R119 million of this investment in the fixed-line business. Following an
assessment of the viability of the assets related to the Telcordia initiative, Telkom wrote off the balance of these assets of
R346m in the 2002 financial year. During March 2001, the dispute was taken to arbitration, where Telcordia was seeking
approximately $130 million plus interest at a rate of 15.5% per year for money outstanding and damages. In September 2002,
a partial ruling was issued by the arbitrator in favour of Telcordia. The arbitration proceedings and any liability are not,
however, expected to be finalized until late 2003 or early 2004. Telkom's provision of R373 million, for its estimate of
probable liabilities, including interest, was recognized at September 30, 2002 (March 31, 2002: R375 million).

F-11
TELKOM SA LIMITED
NOTES TO THE CONDENSED CONSOLIDATED INTERIM FINANCIAL STATEMENTS
15.
CONTINGENCIES (continued)
Vodacom Congo (R.D.C.) S.P.R.L.
The Group has a 51% equity interest through Vodacom in Vodacom Congo (R.D.C.) S.P.R.L. ("Vodacom Congo"), whichcommenced business on December 11, 2001. This investment is governed by a shareholders' agreement which provides the
minority shareholder certain protective and participating rights. In terms of IAS 31 "Accounting for interest in Joint Ventures",
Vodacom Congo may not be consolidated as a subsidiary as it is considered to be a joint venture and has been proportionally
consolidated in the financial statements at March 31, 2002 and September 30, 2002. Vodacom in terms of the shareholders'
agreement is ultimately responsible for the funding of the operations of Vodacom Congo for the first three years. The
shareholders' agreement also gives Vodacom the right to appoint management and the majority of the Board of the company.
Vodacom also has a separate management agreement to manage the company on a day-to-day basis. Currently Vodacom
Congo is incurring losses which are expected to increase in the foreseeable future. The 49% portion attributable to the joint
venture partner of the liabilities and losses were as follows:
March
September
2002
2002
(Audited)
(Unaudited)
Rm
Rm
Net loss . . . . . . . . . . . . . . . . . . . . . . . . . . . . . . . . . . .
(19)
(87)
Total liabilities . . . . . . . . . . . . . . . . . . . . . . . . . . . . . . .
(30)
(384)
Total assets . . . . . . . . . . . . . . . . . . . . . . . . . . . . . . . . .
440
714
Preference shares . . . . . . . . . . . . . . . . . . . . . . . . . . . . . .
(368)
(368)
Accordingly, the Group exposure is 50% of the above amounts.
Furthermore, the following guarantees were approved/issued
by Vodacom in respect of Vodacom Congo:
Euro
US$
September 30, 2002:
Details
Beneficiary
m
m
Approved not issued
Guarantees not yet
ABSA Bank
4
issued
Limited
March 31, 2002:
Approved and issued
Guarantee Alcatel
ABSA Bank
32.6
29.8
C.I.T., Alcatel Space
Limited
Industries and Alcatel
Altech Telecoms (Pty)
Ltd ("Alcatel")Approved not issued
Guarantees not yet
ABSA Bank
51.2
issued
Limited
Accordingly, the Group exposure is 50% of the above amounts.
16.
COMMITMENTS
Capital commitments authorized not committed . . . . . . . . . . . .
6,680
3,877
Fixed-line . . . . . . . . . . . . . . . . . . . . . . . . . . . . . . . . . .
4,847
3,049
Mobile . . . . . . . . . . . . . . . . . . . . . . . . . . . . . . . . . . . .
1,833
828
Capital commitments authorized and committed . . . . . . . . . . . .
810
2,793
Fixed-line . . . . . . . . . . . . . . . . . . . . . . . . . . . . . . . . . .
85
1,852
Mobile . . . . . . . . . . . . . . . . . . . . . . . . . . . . . . . . . . . .
725
941
Management expects these commitments will be financed mainly from internally generated cash.
F-12
TELKOM SA LIMITED
NOTES TO THE CONDENSED CONSOLIDATED INTERIM FINANCIAL STATEMENTS
September
September
2001
2002
(Unaudited)
(Unaudited)
Rm
Rm
17.
SEGMENT INFORMATION
for the six months ended September 30, 2002 and 2001
The intercompany transactions are reflected as net and
are thus eliminated against segment results.
Business segments
Consolidated revenue . . . . . . . . . . . . . . . . . . . . . . . . . . .
16,523
18,316
Fixed line . . . . . . . . . . . . . . . . . . . . . . . . . . . . . . . . . .
13,658
14,563
To external customers . . . . . . . . . . . . . . . . . . . . . . . . . .
13,473
14,355
Intercompany . . . . . . . . . . . . . . . . . . . . . . . . . . . . . . .
185
208
Mobile . . . . . . . . . . . . . . . . . . . . . . . . . . . . . . . . . . . .
3,762
4,720
To external customers . . . . . . . . . . . . . . . . . . . . . . . . . .
3,050
3,961
Intercompany . . . . . . . . . . . . . . . . . . . . . . . . . . . . . . .
712
759
Elimination . . . . . . . . . . . . . . . . . . . . . . . . . . . . . . . . .
(897)
(967)
Segment operating profit . . . . . . . . . . . . . . . . . . . . . . . . .
2,168
2,811
Fixed line . . . . . . . . . . . . . . . . . . . . . . . . . . . . . . . . . .
1,415
1,894
Mobile . . . . . . . . . . . . . . . . . . . . . . . . . . . . . . . . . . . .
787
920
Elimination . . . . . . . . . . . . . . . . . . . . . . . . . . . . . . . . .
(34)
(3)
Investment income . . . . . . . . . . . . . . . . . . . . . . . . . . . . .
306
152
Fixed line . . . . . . . . . . . . . . . . . . . . . . . . . . . . . . . . . .
327
183
Mobile . . . . . . . . . . . . . . . . . . . . . . . . . . . . . . . . . . . .
8
8
Elimination . . . . . . . . . . . . . . . . . . . . . . . . . . . . . . . . .
(29)
(39)
Finance charges . . . . . . . . . . . . . . . . . . . . . . . . . . . . . .
1,845
1,779
Fixed line . . . . . . . . . . . . . . . . . . . . . . . . . . . . . . . . . .
1,812
1,660
Mobile . . . . . . . . . . . . . . . . . . . . . . . . . . . . . . . . . . . .
62
158
Elimination . . . . . . . . . . . . . . . . . . . . . . . . . . . . . . . . .
(29)
(39)
Taxation . . . . . . . . . . . . . . . . . . . . . . . . . . . . . . . . . . .
206
456
Fixed line . . . . . . . . . . . . . . . . . . . . . . . . . . . . . . . . . .
(17)
194
Mobile . . . . . . . . . . . . . . . . . . . . . . . . . . . . . . . . . . . .
223
262
Depreciation and amortisation . . . . . . . . . . . . . . . . . . . . . .
2,643
3,106
Fixed line . . . . . . . . . . . . . . . . . . . . . . . . . . . . . . . . . .
2,159
2,511
Mobile . . . . . . . . . . . . . . . . . . . . . . . . . . . . . . . . . . . .
484
595
Impairment loss/asset write-offs . . . . . . . . . . . . . . . . . . . . . -
16
Fixed line . . . . . . . . . . . . . . . . . . . . . . . . . . . . . . . . . . -
16
Mobile . . . . . . . . . . . . . . . . . . . . . . . . . . . . . . . . . . . . - -
F-13
TELKOM SA LIMITED
NOTES TO THE CONDENSED CONSOLIDATED INTERIM FINANCIAL STATEMENTS
March
September
2002
2002
(Audited)
(Unaudited)
Rm
Rm
17.
SEGMENT INFORMATION (continued)
at March 31, 2002 and September 30, 2002
Consolidated assets . . . . . . . . . . . . . . . . . . . . . . . . . . . .
50,528
50,654
Fixed line . . . . . . . . . . . . . . . . . . . . . . . . . . . . . . . . . .
43,588
42,629
Mobile . . . . . . . . . . . . . . . . . . . . . . . . . . . . . . . . . . . .
7,531
8,442
Elimination . . . . . . . . . . . . . . . . . . . . . . . . . . . . . . . . .
(591)
(417)
Investments . . . . . . . . . . . . . . . . . . . . . . . . . . . . . . . . .
780
867
Financial assets . . . . . . . . . . . . . . . . . . . . . . . . . . . . . . .
2,819
2,823
Tax assets . . . . . . . . . . . . . . . . . . . . . . . . . . . . . . . . . .
1,081
237
Total assets . . . . . . . . . . . . . . . . . . . . . . . . . . . . . . . . .
55,208
54,581
Consolidated liabilities . . . . . . . . . . . . . . . . . . . . . . . . . .
13,471
12,714
Fixed line . . . . . . . . . . . . . . . . . . . . . . . . . . . . . . . . . .
10,804
8,991
Mobile . . . . . . . . . . . . . . . . . . . . . . . . . . . . . . . . . . . .
3,408
4,247
Elimination . . . . . . . . . . . . . . . . . . . . . . . . . . . . . . . . .
(741)
(524)
Interest-bearing debt . . . . . . . . . . . . . . . . . . . . . . . . . . . .
24,579
24,102
Tax liabilities . . . . . . . . . . . . . . . . . . . . . . . . . . . . . . . .
193
76
Total liabilities . . . . . . . . . . . . . . . . . . . . . . . . . . . . . . .
38,243
36,892
September
September
2001
2002
(Unaudited)
(Unaudited)
Rm
Rm
Other segment information
Capital expenditure for property, plant and equipment . . . . . . . .
3,641
2,346
Fixed line . . . . . . . . . . . . . . . . . . . . . . . . . . . . . . . . . .
2,630
1,487
Mobile . . . . . . . . . . . . . . . . . . . . . . . . . . . . . . . . . . . .
1,011
859

F-14
TELKOM SA LIMITED
NOTES TO THE CONDENSED CONSOLIDATED INTERIM FINANCIAL STATEMENTS
September
September
2001
2002
(Unaudited)
(Unaudited)
Rm
Rm
18.
RELATED PARTY TRANSACTIONS
With Joint Venture (Vodacom 50% share)
Income . . . . . . . . . . . . . . . . . . . . . . . . . . . . . . . . . . . . . . . . .
186
208
Expenses . . . . . . . . . . . . . . . . . . . . . . . . . . . . . . . . . . . . . . . .
712
759
Interest received . . . . . . . . . . . . . . . . . . . . . . . . . . . . . . . . . . . .
19
20
With shareholders
Thintana Communications LLC Management fees . . . . . . . . . . . . . . . . .
141
115
Government Revenue . . . . . . . . . . . . . . . . . . . . . . . . . . . . . . . . .
774
888
March
September
2002
2002
(Audited)
(Unaudited)
Rm
Rm
Related Party Balances
With Joint Venture (Vodacom)
Trade receivables . . . . . . . . . . . . . . . . . . . . . . . . . . . . . . . . . . . .
16
41
Trade payables . . . . . . . . . . . . . . . . . . . . . . . . . . . . . . . . . . . . .
166
272
With shareholders
Government Trade receivables . . . . . . . . . . . . . . . . . . . . . . . . . . . .
170
134
Employees Other receivables . . . . . . . . . . . . . . . . . . . . . . . . . . . . .
119
170
With affiliate directors
March 31, 2002
Mr. E Molobi, the Chairman of the Board of Directors on September 30, 2001 had the following interests as Chief Executive
Officer of Kagiso Trust investments (Proprietary) Limited:
- A 25% holding by Kagiso Trust Investments (Proprietary) Limited in BUA Telecoms, a company that is a vendor to the
Group.
- A 25% holding by Kagiso Trust Investments (Proprietary) Limited in debis Fleet Management (Proprietary) Limited, a fleet
management company to which the Group has outsourced its vehicle fleet.
- A 50.1% holding by Kagiso Trust Investments (Proprietary) Limited in Kagiso Treasury Services (Proprietary) Limited
who manages Telkom's treasury function.
September 30, 2002
Mr. E Molobi resigned as a director of Telkom on July 11, 2002, and is no longer the Chairman of the Board of Directors at
September 30, 2002.
19.
NEGATIVE WORKING CAPITAL RATIO
For the interim period ended September 30, 2002 and the financial year ended March 31, 2002, the Telkom SA Limited Group
had a negative working capital ratio. A negative working capital ratio arises when the Group's current liabilities are greater
than the current assets. Current liabilities will be financed from operating cash flows, new borrowings and credit facilities.

F-15
TELKOM SA LIMITED
NOTES TO THE CONDENSED CONSOLIDATED INTERIM FINANCIAL STATEMENTS
20.
SUBSEQUENT EVENTS
Taxation
The South African Revenue Services ("SARS") indicated, in an assesment dated August 28, 2002, that they are disallowing thetreatment of certain income in Telkom's 1998 income tax return. The dispute related to the first time application in fiscal year
ended 1998 of Section 32 ("S32") of the Income Tax Act, 1962, which allows revenue generated by transmitting messagesinternationally to be only partly included in determining taxable income, and the deferral of unbilled revenues for tax
purposes.
On December 10, 2002, SARS agreed with Telkom's practice of claiming S32 of the Income Tax Act, 1962, for all years up to
and including March 2001. Telkom has not claimed S32 in respect of the 2002 financial year. SARS, however, disallowed
Telkom's practice of deferring certain unbilled revenue from taxable income.
The impact of the disallowance of unbilled revenue, which has been recognized as an additional income tax provision in the
Income Statement for the year ended March 31, 2002, is as follows:
Rm
Reversal of tax receivable . . . . . . . . . . . . . . . . .
(218)
Reversal of deferred taxation . . . . . . . . . . . . . . .
186
Reversal of interest accrued . . . . . . . . . . . . . . . .
(100)
Tax effect of interest reversal . . . . . . . . . . . . . . .
30
(102)
In connection with the filing of its tax return for the 2001 fiscal year, Telkom revised the basis of its calculation and increased
its estimate of the S32 benefit used for the preparation of the March 31, 2001 financial statements by an amount of R92
million. The revision has been recognized as a change in estimate and reflected as a reduction of the income tax provision for
the year ended March 31, 2002.
The tax impact of the above is reflected in the determination of the tax provision for the fiscal year ended March 31, 2002.
Other
The directors are not aware of any other matter or circumstance arising since the end of the financial period, not otherwise
dealt with in the condensed consolidated interim financial statements, which significantly affects the financial position of the
Group and the results of its operations.
21.
US GAAP INFORMATION
Differences between International Accounting Standards and US Generally Accepted Accounting Principles
The condensed consolidated interim financial statements of Telkom SA Ltd have been prepared in accordance with
International Accounting Standards ("IAS"), which differ in certain respects from generally accepted accounting principles inthe United States ("US GAAP"). Application of US GAAP would have affected the unaudited consolidated balance sheet as ofSeptember 30, 2002 and unaudited consolidated net income for the six month periods ended September 30, 2001 and 2002 to
the extent described below. A description of the material differences between IAS and US GAAP as they relate to Telkom SA
Limited and subsidiaries ("the Group"), as well as its equity accounted investment in Vodacom, are discussed in further detailbelow.
*The United States Dollar (USD) amounts shown in the footnotes have been translated at September 30, 2002 and for the six
month period ended September 30, 2002 from South African Rand ("ZAR") only as a matter of arithmetic computation at theSouth African exchange rate of ZAR10.535 = USD 1, the buying rate on September 30, 2002, the date of our most recent
balance sheet included in this reconciliation. These amounts are unaudited and are included for the convenience of the reader
only. Such translation should not be construed as a representation that the South African Rand amounts have been or could be
converted into US Dollars at this or any other rate.
The accompanying unaudited condensed consolidated interim financial statements should be read in conjunction with the
audited consolidated financial statements of Telkom SA Limited and subsidiaries for the year ended March 31, 2002.
The accounting policies of the company applied in the presentation of the reconciliations of shareholders equity as of
September 30, 2002 and net income for the six month periods ended September 30, 2001 and 2002 are consistent with those
applied in the audited financial statements referred to above, except for the application of SFAS 142, "Goodwill and Other
Intangible Assets", effective as of April 1, 2002.

F-16
TELKOM SA LIMITED
NOTES TO THE CONDENSED CONSOLIDATED INTERIM FINANCIAL STATEMENTS
US GAAP INFORMATION (continued)
Net income and equity in accordance with US GAAP differences
The following schedule illustrates the significant adjustments to reconcile net income in accordance with IAS to the amounts
determined in accordance with US GAAP for the six month periods ended September 30, 2001 and 2002.
September 30,
September 30,
*September 30,
2001
2002
2002
(Unaudited)
(Unaudited)
(Unaudited)
Rm
Rm
US$m
Net income according to IAS . . . . . . . . . . . . . . . . . . .
371
644
61
US GAAP adjustments Telkom:
(a) Revenue recognition . . . . . . . . . . . . . . . . . . . . . .
(3)
42
4
(b) Sale and leaseback transaction . . . . . . . . . . . . . . . . .
48
50
5
(c) Share issue expenses . . . . . . . . . . . . . . . . . . . . . .
(32)
44
4
(d) Derivative financial instruments . . . . . . . . . . . . . . . .
46
38
4
(e) Goodwill and amortisation . . . . . . . . . . . . . . . . . . . -
16
2
(e) Goodwill impairment . . . . . . . . . . . . . . . . . . . . . . -
(16)
(2)
(h) Tax effect of reconciling differences . . . . . . . . . . . . . .
(34)
(49)
(4)
(h) Additional distribution tax retained earnings . . . . . . . .
11
(19)
(2)
(h) Capital gains tax Vodacom income . . . . . . . . . . . . . -
(25)
(2)
US GAAP adjustments Vodacom:
(d) Derivative financial instruments . . . . . . . . . . . . . . . .
13
2 -
(e) Goodwill . . . . . . . . . . . . . . . . . . . . . . . . . . . .
(1)
24
2
(f) Joint venture accounting . . . . . . . . . . . . . . . . . . . .
8 - -
(g) Deferred bonus incentive scheme . . . . . . . . . . . . . . .
5
(14)
(1)
(h) Tax effect of reconciling differences
(5)
4
Net income as per US GAAP before cumulative effect of change
in accounting principles . . . . . . . . . . . . . . . . . . . . .
427
741
71
(d)
Cumulative effect of a change in accounting principle reflecting
the application of SFAS 133 Telkom (net of tax of R29m) .
48 - -
(d)
Cumulative effect of a change in accounting principle reflecting
the application of SFAS 133 Vodacom (net of tax of R3m) .
6 - -
(e)
Cumulative effect of change in accounting principle reflecting
the application of SFAS 142 (net of tax of Nil) -
16
2
Net income according to US GAAP
481
757
73
Basic and diluted earnings per share
The basic and diluted earnings per share do not differ, as there are
no potentially dilutive securities.
557,031,819 issued shares
Basic and diluted earnings per share before cumulative effect of
change in accounting principle (cents) . . . . . . . . . . . . . . .
76.4
132.9
12.9
Basic and diluted earnings per share for cumulative effect of . . .
change in accounting principle (cents) . . . . . . . . . . . . . . .
10
3 -
Basic and diluted earnings per share (cents)
86.4
135.9
12.9

F-17
TELKOM SA LIMITED
NOTES TO THE CONDENSED CONSOLIDATED INTERIM FINANCIAL STATEMENTS
US GAAP INFORMATION (continued)
The following is a reconciliation of the material adjustments necessary to reconcile shareholders' equity in accordance with IAS to
the amounts in accordance with US GAAP as at March 31, 2002 and September 30, 2002.
March 31,
September 30,
*September 30,
2002
2002
2002
(Audited)
(Unaudited)
(Unaudited)
Rm
Rm
US$m
Shareholders' equity according to IAS . . . . . . . . . . . . .
16,832
17,475
1,659
US GAAP adjustments Telkom:
(a) Revenue recognition . . . . . . . . . . . . . . . . . . . . . .
(1,105)
(1,063)
(101)
(b) Sale and leaseback transaction . . . . . . . . . . . . . . . . .
(277)
(227)
(22)
(d)
Derivative financial instruments fair value hedges at
adoption of FAS133 . . . . . . . . . . . . . . . . . . . . . .
(34)
(28)
(3)
(e) Goodwill . . . . . . . . . . . . . . . . . . . . . . . . . . . .
15
31
3
(h) Tax effect of reconciling differences . . . . . . . . . . . . . .
535
498
47
(h) Additional distribution tax retained earnings . . . . . . . .
(423)
(442)
(42)
(h) Capital gains tax Vodacom income . . . . . . . . . . . . .
(43)
(68)
(6)
US GAAP adjustments Vodacom:
(e) Goodwill . . . . . . . . . . . . . . . . . . . . . . . . . . . .
15
34
3
(f) Joint venture accounting . . . . . . . . . . . . . . . . . . . . - - -
(g) Deferred bonus incentive scheme . . . . . . . . . . . . . . .
29
15
1
(h) Tax effect of reconciling differences . . . . . . . . . . . . . .
(9)
(5)
Shareholders' equity according to US GAAP . . . . . . . . . .
15,535
16,220
1,539
Comprehensive income
Under US GAAP, SFAS 130 "Reporting Comprehensive Income" requires that certain items be recognized as a separate component
of equity under the caption "Accumulated Other Comprehensive income". Additionally the standard requires that companies present
comprehensive income, which is a combination of net income and changes in a company's accumulated other comprehensive
income accounts. Changes in the Group's accumulated other comprehensive accounts are reflected under non-distributable reserves.
Non-
Retained earnings
distributable
Balance
reserves
Rm
Rm
Rm
Total March 31, 2001 (audited) . . . . . . . . . . . . . . . . .
5,438
45
5,483
Net income per US GAAP for the period ended
September 30, 2001 (unaudited) . . . . . . . . . . . . . . . . . .
481 -
5,919
Foreign currency translation adjustment (unaudited) . . . . . . .
12
12
Transitional adjustment on application of SFAS 133 to net income
for the period ended September 30, 2001 (net of tax of R262 m)
(unaudited). . . . . . . . . . . . . . . . . . . . . . . . . . . . . -
440 -
Release of transitional adjustment in application of SFAS 133 to
net income for the six month period September 30, 2001 (net of
tax of R19 m) (unaudited) . . . . . . . . . . . . . . . . . . . . . -
(34)
406
Increase in fair value of investment (unaudited) . . . . . . . . . . - -
45
Total September 30, 2001 (unaudited) . . . . . . . . . . . . . .
5,919
463
6,382

F-18
TELKOM SA LIMITED
NOTES TO THE CONDENSED CONSOLIDATED INTERIM FINANCIAL STATEMENTS
US GAAP INFORMATION (continued)
Non-
Retained
distributable,
Balance
earnings
reserves
Rm
Rm
Rm
Total March 31, 2002 (audited) . . . . . . . . . . . . . . . . .
6,755
487
7,242
Net income per US GAAP for the six month period ended
September 30, 2002 (unaudited) . . . . . . . . . . . . . . . . . .
757 -
7,512
Foreign currency translation adjustment (unaudited) . . . . . . . -
(28)
36
Release of transitional adjustment on application of SFAS 133 to
net income for the six month period ended September 30, 2002 .
net of tax R13m (unaudited) . . . . . . . . . . . . . . . . . . . . -
(22)
351
Decrease in fair value of investment (unaudited) . . . . . . . . . -
(22)
28
Total September 30, 2002 (unaudited) . . . . . . . . . . . . . .
7,512
415
7,927
Movement in shareholders' equity in accordance with
US GAAP
March 31,
September 30
September 30,
2002
2002
2002
(Audited)
(Unaudited)
(Unaudited)
Rm
Rm
US$m
Balance April 1 . . . . . . . . . . . . . . . . . . . . . . . . . . .
13,776
15,535
1,474
Net income for the period . . . . . . . . . . . . . . . . . . . . .
1,317
757
72
Foreign currency reserves . . . . . . . . . . . . . . . . . . . . .
64
(28)
(3)
Fair value adjustments derivatives . . . . . . . . . . . . . . . .
373
(22)
(2)
Decrease in fair value of investment . . . . . . . . . . . . . . . .
5
(22)
(2)
Balance March 31, 2002 and September 30, 2002 . . . . . . . .
15,535
16,220
1,539
(a)
Revenue recognition
The Staff of the US Securities and Exchange Commission issued Staff Accounting Bulletin 101 (SAB 101) that addresses revenue
recognition under US GAAP. Under this guidance, revenue earned from access, installation-activation and similar fees should be
recognized over the estimated life of the customer relationship. Also, SAB 101 permits, but does not require, companies to defer
costs directly associated with such revenue and to also recognize these costs over the life of the customer relationship. Under IAS
the Group recognizes this revenue and related costs when the services are provided and the related costs are incurred.
In accordance with US GAAP, revenue earned from installation and activation is deferred and recognized over the expected
period of the customer relationship. The expected period of the customer relationship is 8 years (2001 8.5 years) for telephony
voice customers and 4 years (2001 4 years) for data customers. The Group recognizes installation and activation costs,
excluding those costs that are capitalized as an integral part of the network, in the period incurred. These adjustments resulted in a
decrease of R3m and an increase of R42m to income for the six month periods ended September 30, 2001 and 2002, respectively.
(b)
Sale and lease-back
Telkom outsourced its entire fleet of vehicles as well as the maintenance, fueling, insurance, tracking and other services to debis
through a sale and lease-back agreement. The lease-back was in the form of a master service level agreement covering a period of
five years providing, subject to Telkom's requirements, for the annual lease contracts for each vehicle under the agreement.
Under the provisions of IAS 17, the Group recorded a gain from a transaction that had transferred substantially all of the risks
and rewards incidental to ownership of the vehicles to debis as the criteria for profit recognition had been satisfied. The Group
recognized a gain in the amount of R463m in 2000 and accounted for the lease-backs as operating leases.
Under US GAAP, SFAS 13, as amended by SFAS 28, the Group determined that while the terms of the agreement provide that
the assets underlying the lease-back would be subject to annual lease contract, renewable based upon Telkom's vehicle
requirements and cancelable under certain terms, debis' right of first refusal to provide all of the Group's requirements during
the five year term represents an economic compulsion to renew the leases. Accordingly, the Group concluded, that since the
lease-back covers substantially all the assets that were sold under the contract for substantially all their remaining useful lives,
deferral of the related gain and recognition over the term of the related agreements was appropriate.
F-19
TELKOM SA LIMITED
NOTES TO THE CONDENSED CONSOLIDATED INTERIM FINANCIAL STATEMENTS
US GAAP INFORMATION (continued)
Based on the requirements of SFAS 13, a selected portion of the vehicle leases would be treated as finance leases due to the
fact that when analyzed on a vehicle by vehicle basis, the present value of the minimum lease payments of certain individual
vehicles exceed 90% of the fair value of these vehicles or the lease term represents more than 75% of the remaining economic
life of the vehicles. Accordingly, the full gain realized through the sale of the vehicles has been reversed and the proceeds from
the sale has been treated as an obligation. Rental payments have been applied to interest expense on the obligation as well as
to reduce the principal amount of the obligation. The resulting capital lease assets are being depreciated over their remaining
useful lives.
(c)
Share issue expenses
Under IAS, external costs directly attributable to the issue of new shares are shown as a deduction, in equity.
This is only allowed under US GAAP however, when the proposed listing has not been delayed more than 90 days after
incurring these costs. In 2002, Telkom's IPO was postponed more than 90 days. Therefore the costs incurred through
September 30, 2001 related to the IPO of R32m have been expensed for US GAAP purposes. For IAS purposes, during the
September 2002 period a decision was made to expense the IPO costs previously capitalized to the value of R44m.
The Board resolved to write off previously capitalized share issue expenses as Telkom does not intend to issue new shares as
part of its initial public offering.
(d)
Derivative financial instruments
SFAS 133 Fair value adjustments
The Group adopted IAS 39 and SFAS 133 on April 1, 2001. Upon adoption of IAS 39, the difference between previous
carrying amounts and the fair value of derivatives, which prior to the adoption of IAS 39 had been designated as cash flow
hedges or fair value hedges but which do not qualify for hedge accounting under IAS 39, is recognized as an adjustment to the
opening balance of retained earnings in the financial year IAS 39 is initially applied. Changes in the fair value of derivatives
subsequent to April 1, 2001 are recorded in the income statement as they do not qualify for hedge accounting.
Under US GAAP, in accordance with SFAS 133, the company is required to recognize all derivatives on the balance sheet at
fair value. The SFAS 133 transitional adjustments (at April 1, 2001) are recorded differently than those recorded under IAS 39.
For pre-existing hedge relationships that would be considered cash flow type hedges, the transitional adjustment should be
reported in Other Comprehensive Income as a cumulative effect of the accounting change. Any transition adjustment reported
as a cumulative effect adjustment in Other Comprehensive Income will subsequently be reclassified into earnings in a manner
consistent with the earnings effect of the hedged transaction. For pre-existing hedge relationships that would be considered fair
value type hedges, the company adjusted the carrying values of the hedged item to its fair value, but only to the extent of an
offsetting transition adjustment from the previously designated hedging instrument. For the six month periods ended
September 30, 2001 and 2002, the Group amortised R6m and R6m respectively of the adjustments to the hedged debt
instruments into earnings. The hedged asset or liability is subsequently accounted for in a manner consistent with the
appropriate accounting for such assets and liabilities. For both cash flow and fair value hedges any portion of the derivative
that is considered ineffective at transition is reported in income as a cumulative effect of an accounting change.
Upon adoption on April 1, 2001, the Group recorded an adjustment to other comprehensive income of R440m (net of tax of
R262m) representing the fair value adjustment of derivatives for which the pre-existing hedge relationships would be
considered cash flow type hedges. For the six month periods ended September 30, 2001 and 2002, subsequent to the adoption
date, the Group reclassified from other comprehensive income into earnings R34m (net of tax of R19m) and R22m (net of tax
of R13m) respectively as the hedged transaction impacted earnings. Upon adoption, the Group also recorded an adjustment of
R45m to increase the carrying value of a hedged debt instrument that was the hedged item in what would be considered a fair
value type hedge. The fair value adjustment to the hedged item is limited to the extent of an off-setting fair value adjustment to
the hedging instrument. Upon adoption, the Group recorded, a cumulative effect of change in accounting principal, R54m (net
of tax of R33m) representing the ineffective portion of adjustments to record derivatives at fair value.
(e)
Goodwill
Under IAS, goodwill arising on the acquisition of a foreign entity is treated as an asset of the Group and translated at the
foreign exchange rate in effect at transaction date. In accordance with IAS the Group amortizes goodwill and other intangibles
on a straight line basis over the anticipated period of benefits.
Under US GAAP, goodwill arising on the acquisition of a foreign entity is translated at the actual exchange rate at the end
of the period. Furthermore, under US GAAP with effect from July 1, 2001 goodwill and intangibles with infinite lives are not
amortized for business combinations completed after June 30, 2001. For previously recorded goodwill and intangibles with
infinite lives, amortization ceases on March 31, 2002.
The Group has adopted SFAS 142 "Accounting for Goodwill and Other Intangibles" effective April 1, 2002. The Group
completed the initial step of a transitional impairment test on all goodwill and indefinite lived intangible assets as of April 1,
2002 within six months of adoption of SFAS 142.

F-20
TELKOM SA LIMITED
NOTES TO THE CONDENSED CONSOLIDATED INTERIM FINANCIAL STATEMENTS
US GAAP INFORMATION (continued)
Management determined that an impairment of R16m existed with respect to the step acquisition of the minority interest of
Swiftnet which has been recognised as a cumulative effect of accounting change in the 2003 fiscal year. The impairment loss
has been reflected in operating loss in the IAS income statement.
Had Telkom applied SFAS 142 for the six months ended September 30, 2001, the pro forma effects on earnings would have
been as follows (in millions of ZAR, except per share amounts):
Income before cumulative effect of accounting change . . . . . . . . . . . . . . . . . . . . . . . .
425
Net income according to US GAAP . . . . . . . . . . . . . . . . . . . . . . . . . . . . . . . . . .
479
Basic and diluted per share income before cumulative effect of accounting change (cents) . . . . .
76.3
Basic and diluted net income per share (cents) . . . . . . . . . . . . . . . . . . . . . . . . . . . .
85.9
(f)
Joint venture accounting
Under IAS, investments qualifying as joint ventures are accounted for under the proportionate consolidation method of
accounting. Under the proportionate consolidation method, the venturer records its share of each of the assets, liabilities, income
and expenses of the jointly controlled entity on a line-by-line basis with similar items in the venturer's financial statements.
The venturer continues to record its total share of the losses in excess of the net investment in the joint venture.
However for US GAAP purposes where the joint ventures are equity accounted, losses are only recognized up to the net
investment in the joint venture, unless the investor has committed to continue providing financial support to the investee. For the
6 month period ended September 30, 2001, in accordance with IAS, the Group proportionately consolidated losses of R8m, that
was in excess of the Group's net investment in the joint venture. Under US GAAP these losses are not recorded for reasons
previously stated.
Vodacom equity accounted earnings
Under IAS, the Group's interests in joint ventures are proportionally consolidated. Under US GAAP, interest in joint ventures
not meeting the criteria for accommodation under item 17 of Form 20-F should be reflected in the consolidated financial
statements using the equity method. The following table sets out the restated abbreviated income statement and balance sheet
of the Group joint venture company, Vodacom after US GAAP adjustments:
September 30,
September 30,
*September 30,
2001
2002
2002
(Unaudited)
(Unaudited)
(Unaudited)
Rm
Rm
US$m
Income statements as per US GAAP
Operating income . . . . . . . . . . . . . . . . . . . . . . .
1,585
1,849
176
Income after financial items . . . . . . . . . . . . . . . . .
1,504
1,562
149
Taxes . . . . . . . . . . . . . . . . . . . . . . . . . . . . .
(583)
(628)
(60)
Minority interests . . . . . . . . . . . . . . . . . . . . . . . -
(96)
(9)
Net income before accounting changes . . . . . . . . . . . .
921
838
80
Change in accounting policy . . . . . . . . . . . . . . . . .
11 - -
Net income for the period . . . . . . . . . . . . . . . . . .
932
838
80
March 31,
September 30,
*September 30,
2002
2002
2002
(Audited)
(Unaudited)
(Unaudited)
Rm
Rm
US$m
Balance sheets as per US GAAP
Non-current assets . . . . . . . . . . . . . . . . . . . . . .
11,429
11,830
1,123
Current assets . . . . . . . . . . . . . . . . . . . . . . . . .
3,990
5,404
513
Total assets . . . . . . . . . . . . . . . . . . . . . . . . . .
15,419
17,234
1,636
Equity . . . . . . . . . . . . . . . . . . . . . . . . . . . . .
4,874
5,654
537
Minority interests . . . . . . . . . . . . . . . . . . . . . . .
11
102
9
Liabilities . . . . . . . . . . . . . . . . . . . . . . . . . . .
10,534
11,478
1,090
Total equity and liabilities . . . . . . . . . . . . . . . . . .
15,419
17,234
1,636

F-21
TELKOM SA LIMITED
NOTES TO THE CONDENSED CONSOLIDATED INTERIM FINANCIAL STATEMENTS
US GAAP INFORMATION (continued)
(g)
Deferred bonus incentive scheme
Under IAS, the total value of deferred bonus entitlements as calculated at the end of each financial period are provided for in
full on the balance sheet date, based on the net present value of expected future cash flows. Under US GAAP, compensation
cost should be recognized over the service period or the vesting period if the service period is not defined, based upon the
undiscounted value of the entitlements.
(h)
Income taxes
Deferred tax benefits and liabilities are calculated, when applicable, for the differences between IAS and US GAAP.
Telkom is taxed at a corporate tax rate of 30% on taxable income. Telkom incurs an additional Secondary Tax on Companies
(STC) at a rate of 12.50% on any dividends distributed to shareholders. The dividend tax is payable if and only when
dividends are distributed. Neither the Company nor the shareholders receive any future tax benefits as a result of additional tax
on dividends paid. As required under IAS, Telkom will recognize the tax effects of dividends when distributed in the future.
Under US GAAP, consistent with the requirements of EITF 95-9, the company measures its income tax expense, including the
tax effect of temporary differences, using the tax rate that includes the dividend tax. STC is calculated on retained income after
the 1992 fiscal year after deducting the effects of certain capital transactions as defined.
With respect to the Group's investment in Vodacom SFAS 109 requires that deferred taxes be recognized for the effect of the
excess of the amount of financial reporting over the tax basis of such investment. According to South African tax law, the
Group would be required to pay tax at a rate of 37.78% on any increase in the appreciation in the value of its investment since
October 1, 2001. As such, deferred taxes have been recognized on the Group's share of the undistributed earnings of Vodacom
since October 1, 2001.
Deferred tax
The tax effects of the US GAAP adjustments relating to Telkom's operations have been calculated based on a tax rate
of 37.78%.
(i)
Employee benefits
There is a difference in treatment of the transitional asset/liability on adoption of the statements under IAS and US GAAP.
In terms of FAS 87, this is amortised on a straight line basis over the remaining lifetime of the fund at that time. In terms of
IAS 19, if this is a "liability" or deficit, this is either recognised immediately or alternatively amortised over a period
of 5 years. In the event of a net asset arising, the full amount is recognised immediately. The effects of these differences have
been immaterial to the reconciliation.
Furthermore, IAS 19 determines that the employer limits the extent of any asset recognized on the balance sheet by the
employer to the true economic benefit available, whereas FAS 87 does not. To the extent that the "expense" calculated under
FAS 87 is less than the actual contribution made, an asset will build up in the company accounts.
IAS 19 recognizes the SA legislative position on surplus in allowing the limitation of the extent of any asset recognized to
such as is available for the economic benefit of the employer. As no surplus has been apportioned to the employer, in terms of
IAS 19, the asset is limited to zero. This has the impact of adjusting the expense recognised in the income statement to the
employer's actual contribution for the period concerned.
The disclosure of the retirement fund and pension fund unrecognized asset would be as follows under US GAAP:
March 31,
September 30,
*September 30,
2002
2002
2002
(Audited)
(Unaudited)
(Unaudited)
Rm
Rm
US$m
Telkom retirement fund
Present value of the funded obligation . . . . . . . . . . . .
3,055
2,823
268
Fair value of plan asset . . . . . . . . . . . . . . . . . . . .
(3,805)
(3,609)
(343)
Funded status . . . . . . . . . . . . . . . . . . . . . . . . .
(750)
(786)
(75)
Unrecognized net actuarial gain . . . . . . . . . . . . . . .
437
366
35
Unrecognized surplus . . . . . . . . . . . . . . . . . . . . .
(313)
(420)
(40)

F-22
TELKOM SA LIMITED
NOTES TO THE CONDENSED CONSOLIDATED INTERIM FINANCIAL STATEMENTS
US GAAP INFORMATION (continued)
March 31,
September 30,
*September 30,
2002
2002
2002
(Audited)
(Unaudited)
(Unaudited)
Rm
Rm
US$m
Telkom pension fund
Present value of the funded obligation . . . . . . . . . . . .
113
124
12
Fair value of plan asset . . . . . . . . . . . . . . . . . . . .
(190)
(213)
(20)
Funded status . . . . . . . . . . . . . . . . . . . . . . . . .
(77)
(89)
(8)
Unrecognized net actuarial gain . . . . . . . . . . . . . . .
53
52
4
Unrecognized surplus . . . . . . . . . . . . . . . . . . . . .
(24)
(37)
(4)
Additional US GAAP disclosures
Restructuring
During the six-month periods ended September 31, 2001 and 2002, the Group had recognized the cost of restructuring
charges associated with management's plan to reduce the size of its work force to a comparable level for world-class
telecommunication companies. The plan involved the termination of employees, which the Group expects to be substantially
completed within a period of 12 months.
The 2002 plan affects 498 employees who ceased their service for the six month period to September 30, 2002 and 1,248
employees who will cease their services during 2002/2003 and were still employed by the Group at September 30, 2002.
These employees include operating personnel and product development and corporate staff.
The following table provides a roll forward of restructuring provisions recognized by the Group for the year ended
March 31, 2002 and for the six-month period ended September 30, 2002.
March 31,
September 30,
*September 30,
2002
2002
2002
(Audited)
(Unaudited)
(Unaudited)
Rm
Rm
US$m
Restructuring provision beginning of period . . . . . . . . -
35
3
Workforce reduction payments . . . . . . . . . . . . . . . .
(338)
(169)
(16)
Increase in provision . . . . . . . . . . . . . . . . . . . . .
373
244
23
Restructuring provision end of period . . . . . . . . . . .
35
110
10
Recently issued accounting standards
SFAS 142 addresses the initial and ongoing financial accounting and reporting for acquired goodwill and other intangible
assets. SFAS 142 requires that goodwill be separately disclosed from other intangible assets in the balance sheet, and no longer
be amortized but tested for impairment at least annually (or more frequently if impairment indicators arise). SFAS 142 is
effective for financial statements for periods beginning on or after December 15, 2001. Additionally, the amortization
provisions of SFAS 142 are applicable to goodwill arising in all business acquisitions consummated after June 30, 2001
regardless of the adoption date of SFAS 142. Accordingly, goodwill arising from the increased investment in Telkom Directory
Services is not subject to amortization.
The Group has adopted SFAS 142 on April 1, 2002. The Group has completed the initial step of a transitional impairment test
on adoption of SFAS 142. An impairment charge of R16m related to the investment in one of the subsidiaries Swiftnet was
recognised as a result of the adoption of SFAS 142. This impairment loss has been reflected in operating loss in the IAS
income statement.
In August 2001, the FASB issued SFAS 143, "Accounting for Obligations Associated with the Retirement of Long-Lived
Assets." SFAS 143 addresses financial accounting and reporting for the retirement obligation of an asset. This statement states
that companies should recognize the asset retirement cost, at their fair value, as part of the cost of the asset and classify the
accrued amount as a liability in the consolidated balance sheet. The asset retirement liability is then accredited to the ultimate
F-23
Recently issued accounting standards (continued)
payout as interest expense. The initial measurement of the liability would be subsequently updated for revised estimates of the
discounted cash outflows. The Statement will be effective for fiscal years beginning after June 15, 2002. The Group does not
expect the application of SFAS 143 to have a material effect on its US GAAP earnings and position.
In October 2001, the FASB issued SFAS 144, "Accounting for the Impairment or Disposal of Long-Lived Assets." SFAS 144
addresses financial accounting and reporting for the impairment of long-lived assets and for long-lived assets to be disposed.
The Statement will be effective for fiscal years beginning after December 15, 2001. The Group does not expect the application
of SFAS 144 to have a material effect on its US GAAP earnings and position.
In April 2002, the FASB issued SFAS 145 "Rescission of SFAS 4, 44, and 64, Amendment of SFAS 13, and Technical
Corrections". This Statement rescinds SFAS 4 "Reporting Gains and Losses from Extinguishment of Debt", and an
amendment of that Statement, SFAS 64, "Extinguishments of Debt Made to Satisfy Sinking-Fund Requirements". SFAS 144
also rescinds SFAS 44, "Accounting for Intangible Assets of Motor Carriers". SFAS 144 amends SFAS 13, Accounting for
Leases, to eliminate an inconsistency between the required accounting for sale-leaseback transactions and the required
accounting for certain lease modifications that have economic effects that are similar to sale-leaseback transactions. This
Statement also amends other existing authoritative pronouncements to make various technical corrections, clarify meanings, or
describe their applicability under changed conditions. The Group does not expect the application of SFAS 145 to have a
material effect on its US GAAP earnings and financial position.
In 2002, the FASB issued SFAS 146 "Accounting for Costs Associated with Exit or Disposal Activities". This Statement
addresses the financial accounting and reporting for costs associated with exit or disposal activities and nullifies EITF Issue
No 94.3 "Liability Recognition for Certain Employees termination Benefits and Other Costs to Exit an Activity (including
Certain Costs Incurred in a Restructuring)". SFAS 146 requires that a liability for a cost associated with an exit or disposal
activity be recognized when the liability is incurred. This liability does not arise when the Company has only committed to a
plan, the fundamental criteria of EITF 94-3. In addition, fair value is the objective for initial measurement of the liability. This
standard is effective for exit or disposal activities that are initiated after December 31, 2002, with early application encouraged.
The Group does not expect the application of SFAS 146 to have a material effect on its US GAAP earnings and financial
position.
In November 2002, the Emerging Issues Task Force reached a final consensus related to Revenue Arrangements with Multiple
Deliverables (EITF 00-21). The consensus requires that revenue arrangements with multiple deliverables should be divided
into separate units of accounting if (a) a delivered item has value to the customer on a stand alone basis, (b) there is objective
and reliable evidence of the fair value of the undelivered item and (c) if the arrangement includes a general right of return,
delivery or performance of the undelivered items is considered probable and substantially in the control of the vendor.
Arrangement consideration should be allocated among the separate units of accounting based on their relative fair value and
appropriate revenue recognition criteria would be applied to each separate unit of accounting. The Group has not yet
determined what effect, if any, EITF 00-21 would have on revenue and net income determined in accordance with US GAAP.
The Task Force agreed the effective date for the consensus will be for all revenue arrangements entered into in fiscal periods
beginning after June 15, 2003, with early adoption permitted. The Group will adopt EITF 00-21 for their fiscal year beginning
April 1, 2004.
In December 2002, the FASB issued Statements of Financial Accounting Standards No 148, "Accounting for Stock-Based
Compensation Transition and Disclosure an amendment of FAS 123". Under FAS 148, the statement provides alternative
methods of transition for a voluntary change to the fair value based method of accounting for stock-based employee
compensation. In addition, this statement amends the disclosure requirements of Statement 123 to require prominent disclosure
on both annual and interim financial statements about the method of accounting for stock-based employee compensation and
the effect of the method used on reported results. The amendments to Statement 123 in paragraphs 2(a)-2(e) of this statement
shall be effective for financial statements for fiscal years ending after December 15, 2002. Earlier application of the transition
provisions in paragraphs 2(a)-2(d) is permitted for entities with a fiscal year ending prior to December 15, 2002, provided that
financial statements for the 2002 fiscal year have not been issued as of the date this Statement is issued. Early application of
the disclosure provisions in paragraph 2(e) is encouraged. The Group has determined that this statement will have no impact
on its financial statements for the periods presented as it does not have any stock based compensation plans.
In November 2002, the FASB issued FASB Interpretation No. 45, "Guarantor's Accounting and Disclosure Requirements for
Guarantees, Including Indirect Guarantees of Indebtedness of Others an interpretation of FASB Statements No. 5, 57, and 107
and rescission of FASB Interpretation No. 34" ("FIN 45"). This interpretation elaborates on the disclosures to be made by aguarantor in its interim and annual financial statements about its obligations under certain guarantees that it has issued. It also
clarifies that a guarantor is required to recognize, at the inception of a guarantee, a liability for the fair value of the obligation
undertaken in issuing the guarantee. This interpretation does not prescribe a specific approach for subsequently measuring the
guarantor's recognized liability over the term of the related guarantee. This interpretation also incorporates, without change,
the guidance in FASB Interpretation No. 34, Disclosure of Indirect Guarantees of Indebtedness of Others, which is being
F-24
superseded. The initial recognition and initial measurement provisions of this interpretation are applicable on a prospective
basis to guarantees issued or modified after December 31, 2002, irrespective of the guarantor's fiscal year-end. The disclosure
requirements in this Interpretation are effective for financial statements of interim or annual periods ending after December 15,
2002. The interpretive guidance incorporated without change from Interpretation 34 continues to be required for financial
statements for fiscal years ending after June 15, 1981 the effective date of Interpretation 34. The Group is currently
evaluating the impact of recognizing the fair value of certain guarantees that it has issued.
In January 2003, the FASB issued FASB Interpretation No. 46 "Consolidation of Variable Interest Entities an interpretation
of ARB No. 51 " ("FIN 46"). This interpretation of Accounting Research Bulletin No. 51. Consolidated Financial Statements,addresses consolidation by business enterprises of variable interest entities which have one or both of the following
characteristics:
1.
The equity investment at risk is not sufficient to permit the entity to finance its activities without additional subordinated
financial support from other parties, which is provided through other interests that will absorb some or all of the expected
losses of the entity.
2.
The equity investors lack one or more of the following essential characteristics of a controlling financial interest:
a.
The direct or indirect ability to make decisions about the entity's activities through voting rights or similar rights
b.
The obligation to absorb the expected losses of the entity if they occur, which makes it possible for the entity to
finance its activities
c.
The right to receive the expected residual returns of the entity if they occur, which is the compensation for the risk of
absorbing the expected losses.
This Interpretation applies immediately to variable interest entities created after January 31, 2003, and to variable interest
entities in which an enterprise obtains an interest after that date. It applies in the first fiscal year or interim period beginning
after June 15, 2003, to variable interest entities in which an enterprise holds a variable interest that it acquired before February
1, 2003. The Interpretation applies to public enterprises as of the beginning of the applicable interim or annual period, and it
applies to nonpublic enterprises as of the end of the applicable annual period.
This Interpretation may be applied prospectively with a cumulative-effect adjustment as of the date on which it is first applied
or by restating previously issued financial statements for one or more years with a cumulative-effect adjustment as of the
beginning of the first year restated. The Group is still evaluating the impact of this interpretation on its financial statements.

F-25
35296
11007
MENLO PARK 0102
HATFIELD 0028
(012)
429 0000
(012) 482 0000
Fax
(012)
429 0100
Fax
(012) 460 3633
REVIEW REPORT OF THE INDEPENDENT ACCOUNTANTS
to the Members of Vodacom Group (Proprietary) Limited
We have reviewed the accompanying condensed consolidated balance sheet of Vodacom Group (Proprietary) Limited and its
subsidiaries ("the Group") as at September 30, 2002, and the related condensed consolidated statements of income, shareholders'equity and cash flows for the six month periods ended September 30, 2002 and 2001 set out on pages F26 to F47. These
condensed consolidated interim financial statements are the responsibility of the Company's directors. Our responsibility is to issue
a report on the interim financial information based on our review.
We conducted our review in accordance with standards established by the American Institute of Certified Public
Accountants. Those standards require that we plan and perform the review to obtain moderate assurance that the interim financial
information is free of material misstatement. A review of the interim financial information consists principally of applying
analytical procedures to financial data, and making inquiries of persons responsible for financial and accounting matters. It is
substantially less in scope than an audit conducted in accordance with auditing standards generally accepted in the United States of
America, the objective of which is the expression of an opinion regarding the financial statements taken as a whole. We have not
performed an audit and, accordingly we do not express such an opinion.
Based on our reviews, we are not aware of any material modifications that should be made to the accompanying condensed
consolidated interim financial statements for them to be in conformity with International Accounting Standards 34 Interim
Financial Reporting.
We previously audited, in accordance with auditing standards generally accepted in the United States , the consolidated
balance sheet of the Group as of March 31, 2002, and the related consolidated statements of income, shareholders' equity, and
cash flows for the year then ended, and in our report dated June 11, 2002, except for note 44, as to which date is October 15, 2002
we expressed, based on our audit, an unqualified opinion on those consolidated financial statements as well as drew attention to the
Group's change in accounting policy for financial instruments to conform with International Accounting Standards 39 Financial
Instruments: Recognition and measurement and to certain restatements regarding the consolidated financial
statements of the Group as issued previously.
In our opinion, the information set forth in the accompanying condensed consolidated balance sheet as of March 31, 2002, is fairly
stated, in all material respects, in relation to the consolidated balance sheet from which it has been derived.
International Accounting Standards vary in certain significant respects from accounting principles generally accepted in the United
States of America. Application of accounting principles generally accepted in the United States of America would have affected the
consolidated shareholders' equity as of September 30, 2002 and 2001 and the consolidated net profit for each of the six month
periods ended September 30, 2002 and September 30, 2001 to the extent summarized in Note 20 to the unaudited condensed
consolidated interim financial statements.
Registered Accountants and Auditors
Registered Accountants and Auditors
Chartered Accountants (SA)
Chartered Accountants (SA)
Pretoria
Pretoria
December 12, 2002
December 12, 2002
A complete list of partners is available from any of our offices
Joint auditors
PricewaterhouseCoopers Inc
Chartered Accountants (SA)
Registered Accountants and Auditors
(Registration no 1998/012055/21)
Deloitte & Touche Chartered Accountants (SA)
Registered accountants and auditors

F-26
VODACOM GROUP (PROPRIETARY) LIMITED
CONDENSED CONSOLIDATED INCOME STATEMENTS
for the six months ended September 30, 2002 and 2001
For the six months ended
September 30,
2001
2002
Rm
Rm
Notes
(unaudited)
(unaudited)
Revenue . . . . . . . . . . . . . . . . . . . . . . . . . . . . . . . . . . . . .
4
7,522.2
9,440.8
Direct network operating cost . . . . . . . . . . . . . . . . . . . . . . . . . .
(3,931.4)
(5,320.6)
Depreciation . . . . . . . . . . . . . . . . . . . . . . . . . . . . . . . . . . .
(863.4)
(1,084.8)
Other operating income . . . . . . . . . . . . . . . . . . . . . . . . . . . . .
1.7
8.3
Staff expenses . . . . . . . . . . . . . . . . . . . . . . . . . . . . . . . . . .
(506.9)
(501.7)
Marketing and advertising expenses . . . . . . . . . . . . . . . . . . . . . . .
(307.9)
(364.8)
General administration expenses . . . . . . . . . . . . . . . . . . . . . . . . .
(260.9)
(234.4)
Amortisation of intangible assets . . . . . . . . . . . . . . . . . . . . . . . .
(103.8)
(104.6)
Integration costs, disposals of operations and impairment costs . . . . . . . .
Profit from operations . . . . . . . . . . . . . . . . . . . . . . . . . . . . .
Interest and dividends received . . . . . . . . . . . . . . . . . . . . . . . . . .
Finance costs . . . . . . . . . . . . . . . . . . . . . . . . . . . . . . . . . . .
Profit before taxation . . . . . . . . . . . . . . . . . . . . . . . . . . . . . .
Taxation . . . . . . . . . . . . . . . . . . . . . . . . . . . . . . . . . . . . . .
Profit after taxation . . . . . . . . . . . . . . . . . . . . . . . . . . . . . . .
Minority interest . . . . . . . . . . . . . . . . . . . . . . . . . . . . . . . . .
Net profit from ordinary activities . . . . . . . . . . . . . . . . . . . . . . .
2002
Basic and diluted earnings per share . . . . . . . . . . . . . . . . . . . . .
F-27
VODACOM GROUP (PROPRIETARY) LIMITED
CONDENSED CONSOLIDATED BALANCE SHEETS
at March 31, 2002 and at September 30, 2002
Rm
Notes
(audited)
(unaudited)
ASSETS
Non-current assets . . . . . . . . . . . . . . . . . . . . . . . . . . . . . . .
11,213.3
11,868.5
Property, plant and equipment . . . . . . . . . . . . . . . . . . . . . . . . .
9
9,896.6
10,447.1
Intangible assets . . . . . . . . . . . . . . . . . . . . . . . . . . . . . . . .
796.3
682.6
Investments . . . . . . . . . . . . . . . . . . . . . . . . . . . . . . . . . .
22.7
165.4
Deferred taxation . . . . . . . . . . . . . . . . . . . . . . . . . . . . . . .
497.7
573.4
Current assets . . . . . . . . . . . . . . . . . . . . . . . . . . . . . . . . . .
4,145.3
5,450.7
Foreign currency derivatives . . . . . . . . . . . . . . . . . . . . . . . . . .
215.6
22.6
Inventory . . . . . . . . . . . . . . . . . . . . . . . . . . . . . . . . . . . .
306.0
382.1
Accounts receivable . . . . . . . . . . . . . . . . . . . . . . . . . . . . . .
2,845.9
3,234.5
Short-term investments . . . . . . . . . . . . . . . . . . . . . . . . . . . .
58.6
247.5
Bank and cash balances . . . . . . . . . . . . . . . . . . . . . . . . . . . .
719.2
1,564.0
Total assets
15,358.6
17,319.2
EQUITY AND LIABILITIES
Capital and reserves . . . . . . . . . . . . . . . . . . . . . . . . . . . . . .
5,463.8
6,337.0
Ordinary share capital . . . . . . . . . . . . . . . . . . . . . . . . . . . . .
6 - -
Non-distributable reserves . . . . . . . . . . . . . . . . . . . . . . . . . . .
106.1
59.9
Retained earnings . . . . . . . . . . . . . . . . . . . . . . . . . . . . . . .
6,277.1
Minority interest . . . . . . . . . . . . . . . . . . . . . . . . . . . . . . . .
10.6
102.3
Non-current liabilities . . . . . . . . . . . . . . . . . . . . . . . . . . . . . .
1,894.4
2,800.2
Interest bearing debt . . . . . . . . . . . . . . . . . . . . . . . . . . . . . .
10
780.2
1,591.9
Deferred taxation . . . . . . . . . . . . . . . . . . . . . . . . . . . . . . .
926.2
1,045.5
Provisions . . . . . . . . . . . . . . . . . . . . . . . . . . . . . . . . . . .
188.0
162.8
Current liabilities . . . . . . . . . . . . . . . . . . . . . . . . . . . . . . . .
7,989.8
8,079.7
Shareholder loans . . . . . . . . . . . . . . . . . . . . . . . . . . . . . . .
920.0
920.0
Accounts payable . . . . . . . . . . . . . . . . . . . . . . . . . . . . . . .
3,201.7
3,473.7
Taxation payable . . . . . . . . . . . . . . . . . . . . . . . . . . . . . . . .
351.6
113.4
Non-interest bearing debt . . . . . . . . . . . . . . . . . . . . . . . . . . .
4.3
4.3
Provisions . . . . . . . . . . . . . . . . . . . . . . . . . . . . . . . . . . .
319.5
285.8
Dividends payable . . . . . . . . . . . . . . . . . . . . . . . . . . . . . . .
600.0 -
Short-term interest bearing debt . . . . . . . . . . . . . . . . . . . . . . . .
10
1,015.9
554.0
Bank overdrafts . . . . . . . . . . . . . . . . . . . . . . . . . . . . . . . .
1,576.8
2,728.5
Total equity and liabilities
15,358.6
17,319.2

F-28
VODACOM GROUP (PROPRIETARY) LIMITED
CONDENSED CONSOLIDATED STATEMENTS OF CHANGES IN EQUITY
for the six months ended September 30, 2002 and 2001
Share capital
Retained
Non-
Total
and premium
earnings
distributable
reserves
Rm
Rm
Rm
Rm
BALANCE AT MARCH 31, 2001 AUDITED (RESTATED) -
3,593.2
(2.3)
3,590.9
Net profit for the period . . . . . . . . . . . . . . . . -
1,007.9 -
1,007.9
Net gains and losses not recognised in the
income statement
Foreign currency translation reserve . . . . . . . . - -
17.5
17.5
BALANCE AT SEPTEMBER 31, 2001 UNAUDITED .
4,601.1
15.2
4,616.3
BALANCE AT MARCH 31, 2002 AUDITED (RESTATED) -
5,357.7
106.1
5,463.8
Net profit for the period . . . . . . . . . . . . . . . . -
918.1
918.1
Contingency reserve . . . . . . . . . . . . . . . . . . -
1.3
(1.3)
Net gains and losses not recognised in the income
statement
Foreign currency translation reserve . . . . . . . . - -
(54.1)
(54.1)
Foreign currency translation reserve
- deferred taxation . . . . . . . . . . . . . . . . . - -
9.2
9.2
BALANCE AT SEPTEMBER 30, 2002 UNAUDITED . -
6,277.1
59.9
6,337.0

F-29
VODACOM GROUP (PROPRIETARY) LIMITED
CONDENSED CONSOLIDATED CASH FLOW STATEMENTS
for the six months ended September 30, 2002 and 2001
For the six months ended
September 30,
2001
2002
Rm
Rm
Notes
(unaudited)
(unaudited)
CASH FLOW FROM OPERATING ACTIVITIES
Cash receipts from customers . . . . . . . . . . . . . . . . . . . . . . . . .
7,090.8
9,009.8
Cash paid to suppliers and employees . . . . . . . . . . . . . . . . . . . . .
(4,150.8)
(5,838.0)
CASH GENERATED FROM OPERATIONS . . . . . . . . . . . . . . . .
2,940.0
3,171.8
Finance costs paid . . . . . . . . . . . . . . . . . . . . . . . . . . . . . . .
(148.4)
(242.1)
Interest income received . . . . . . . . . . . . . . . . . . . . . . . . . . . .
16.7
15.6
Taxation paid . . . . . . . . . . . . . . . . . . . . . . . . . . . . . . . . . .
(931.1)
(707.9)
Dividends paid shareholders . . . . . . . . . . . . . . . . . . . . . . . . .
11
(480.0)
(600.0)
NET CASH FLOWS FROM OPERATING ACTIVITIES . . . . . . . . . . .
1,397.2
1,637.4
CASH FLOW FROM INVESTING ACTIVITIES
Additions to property, plant and equipment . . . . . . . . . . . . . . . . . .
(2,022.1)
(2,081.3)
Proceeds on disposal of property, plant and equipment . . . . . . . . . . . .
24.2
4.6
Loans to minority shareholders . . . . . . . . . . . . . . . . . . . . . . . .
(153.9)
Short-term investment . . . . . . . . . . . . . . . . . . . . . . . . . . . . .
(172.9)
Other investing activities . . . . . . . . . . . . . . . . . . . . . . . . . . .
(14.9)
(11.9)
NET CASH FLOWS UTILISED IN INVESTING ACTIVITIES . . . . . . . .
(2,012.8)
(2,415.4)
CASH FLOW FROM FINANCING ACTIVITIES
Interest bearing debt incurred . . . . . . . . . . . . . . . . . . . . . . . . .
11.1
336.4
Funding received from minority shareholders . . . . . . . . . . . . . . . . .
157.8
NET CASH FLOWS FROM FINANCING ACTIVITIES . . . . . . . . . . . .
11.1
494.2
NET DECREASE IN CASH AND CASH EQUIVALENTS . . . . . . . . .
(604.5)
(283.8)
Cash and cash equivalents at the beginning of the period . . . . . . . . . . .
(796.1)
(857.6)
Effect of foreign exchange rate changes . . . . . . . . . . . . . . . . . . . .
4.5
(23.1)
CASH AND CASH EQUIVALENTS AT THE END OF THE PERIOD . .
12
(1,396.1)
(1,164.5)

F-30
VODACOM GROUP (PROPRIETARY) LIMITED
NOTES TO THE CONDENSED CONSOLIDATED INTERIM FINANCIAL STATEMENTS
for the six months ended September 30, 2002 and 2001
1.
NATURE OF OPERATIONS
The Group is primarily an integrated mobile telecommunication and data communication business located in South Africa but
does also have businesses in other African countries.
2.
BASIS OF PRESENTATION
The condensed consolidated balance sheet of the Group as at September 30, 2002 and the condensed consolidated income
statements, statements of changes in equity and cash flows for the six months ended September 30, 2002 and 2001 are
unaudited. These condensed consolidated financial statements are prepared in accordance with IAS 34: "Interim Financial
Reporting". These unaudited financial statements should be read in conjunction with the audited consolidated financial
statements for the three years ended March 31, 2002.
The results of interim periods are not necessarily indicative of the results for the entire year.
3.
ACCOUNTING POLICIES
The condensed consolidated financial statements have been prepared on the historic cost basis. The accounting policies applied
are consistent with those of the previous year.
The preparation of the condensed consolidated financial statements requires the Group's management to make estimates and
assumptions that affect the reported amounts of assets and liabilities and disclosure of contingent assets and liabilities at the
date of the condensed consolidated financial statements, and the reported amounts of revenues and expenses during the
reporting period. Actual results could differ from these estimates. The accounting policies are consistent with those used in the
financial statements for the year ended March 31, 2002.
For the six months ended
September 30,
2001
2002
Rm
Rm
(unaudited)
(unaudited)
4.
REVENUE
Airtime and access . . . . . . . . . . . . . . . . . . . . . . . . . . . . .
4,438.4
5,061.3
Interconnect revenue . . . . . . . . . . . . . . . . . . . . . . . . . . . .
1,917.8
2,554.9
Equipment sales . . . . . . . . . . . . . . . . . . . . . . . . . . . . . . .
751.2
1,305.3
International airtime . . . . . . . . . . . . . . . . . . . . . . . . . . . . .
225.3
342.6
Other . . . . . . . . . . . . . . . . . . . . . . . . . . . . . . . . . . . .
189.5
176.7
7,522.2
9,440.8
5.
INTEGRATION COSTS, DISPOSALS OF OPERATIONS AND
IMPAIRMENT COSTS
Satellite phones reversal of onerous contract (Note 5.1) . . . . . . . . .
45.5 -
Management fees paid to Telkom SA Limited in respect of the
Delareyville earth station . . . . . . . . . . . . . . . . . . . . . . . . . .
(20.0) -
25.5 -
5.1
Globalstar Southern Africa (Proprietary) Limited
Vodacom Group (Proprietary) Limited acquired 100% of the share capital of Globalstar Southern Africa (Proprietary)
Limited with effect from August 1, 2000. The principal nature of the business of the company is that of a provider of
wholesale satellite airtime to cellular networks in Southern Africa. During the 2001 financial year the total goodwill on
acquisition of R24.7 million and the total net asset value of the company was impaired by R102.5 million, as no satellite
license was issued by the Independent Communications Authority of South Africa and the international satellite company
Globalstar Limited Partnership, a United States listed company, was expected to go into Chapter 11 bankruptcy.
During the year ended March 31, 2001, a provision was made to reflect a contractual obligation of R45.5 million to
purchase satellite phones. Since a satellite licence was not issued to Globalstar Southern Africa (Proprietary) Limited,
these phones could not be utilised. The provision was reversed during the period ended September 30, 2001 as the
Group was subsequently released from this contractual obligation.

F-31
VODACOM GROUP (PROPRIETARY) LIMITED
NOTES TO THE CONDENSED CONSOLIDATED INTERIM FINANCIAL STATEMENTS (continued)
for the six months ended September 30, 2002 and 2001
As at
As at
March 31,
September 30,
2002
2002
R
R
(audited)
(unaudited)
6.
ORDINARY SHARE CAPITAL
10,000 ordinary shares of 1 cent each . . . . . . . . . . . . . . . . . . .
100
100
7.
NET ASSET VALUE PER SHARE
The calculation of net asset value per ordinary share is based on net assets
of R6,337.0 million (March 31, 2002: R5,463.8 million) and 10,000
issued ordinary shares (March 31, 2002: 10,000) . . . . . . . . . . . . .
546,380
633,700
For the six months ended
September 30,
2001
2002
R
R
(unaudited)
(unaudited)
8.
BASIC AND DILUTED EARNINGS PER SHARE
The calculation of basic earnings per ordinary share is based on earnings
of R918.1 million (September 30, 2001: R1,007.9 million) and
10,000 issued ordinary shares (September 30, 2001: 10,000) . . . . . . .
100,790
91,810
Due to no dilution factors being present, basic earnings per share equals
diluted earnings per share.
As at
As at
March 31,
September 30,
2002
2002
Rm
Rm
(audited)
(unaudited)
9.
ADDITIONS TO PROPERTY, PLANT AND EQUIPMENT
Land and buildings . . . . . . . . . . . . . . . . . . . . . . . . . . . . .
339.6
0.8
Infrastructure . . . . . . . . . . . . . . . . . . . . . . . . . . . . . . . .
3,050.3
1,492.4
Information services . . . . . . . . . . . . . . . . . . . . . . . . . . . .
476.4
175.9
Community services . . . . . . . . . . . . . . . . . . . . . . . . . . . .
9.5
4.1
Motor vehicles . . . . . . . . . . . . . . . . . . . . . . . . . . . . . . .
20.5
10.3
Furniture . . . . . . . . . . . . . . . . . . . . . . . . . . . . . . . . . . .
39.2
7.0
Office equipment . . . . . . . . . . . . . . . . . . . . . . . . . . . . . .
15.9
6.1
Leasehold improvements . . . . . . . . . . . . . . . . . . . . . . . . . .
94.2
13.5
Other assets . . . . . . . . . . . . . . . . . . . . . . . . . . . . . . . . .
39.7
8.0
4,085.3
1,718.1

F-32
VODACOM GROUP (PROPRIETARY) LIMITED
NOTES TO THE CONDENSED CONSOLIDATED INTERIM FINANCIAL STATEMENTS (continued)
for the six months ended September 30, 2002 and 2001
10. INTEREST BEARING DEBT
As at March 31, 2002
As at September 30, 2002
Current
Long-term
Total
Current
Long-term
Total
portion
portion
portion
portion
Rm
Rm
Rm
Rm
Rm
Rm
(audited)
(audited)
(audited)
(unaudited)
(unaudited)
(unaudited)
Finance leases . . . . . . . . . .
10.4
780.2
790.6
10.3
783.8
794.1
Funding loans . . . . . . . . . . .
440.0
-
440.0
457.9
808.1
1,266.0
Other short-term loans . . . . . .
565.5
-
565.5
85.8
-
85.8
1,015.9
780.2
1,796.1
554.0
1,591.9
2,145.9
As at
As at
March 31,
September 30,
2002
2002
Rm
Rm
(audited)
(unaudited)
10.1
Finance leases
Vodacom (Proprietary) Limited . . . . . . . . . . . . . . . . . . .
502.4
503.8
The finance leases are collateralised by various land and buildings
with a book value of R438.1 million (March 31, 2002:
R443.0 million), bear interest at effective interest rates of between
13.51% and 16.93% and are repayable between 2 and 10 years.
Vodacom Service Provider Company (Proprietary) Limited . . . .
288.2
290.3
The finance leases are collateralised by various land and buildings
with a book value of R276.5 million (March 31, 2002:
R279.4 million), and bear interest at a variable nominal interest rate
of 13.76% compounded monthly. Payments are made every six
months in arrear and commenced on March 1, 2002. The finance
leases expire on September 1, 2011.
Less: Current portion of finance leases:
Vodacom (Proprietary) Limited . . . . . . . . . . . . . . . .
(7.1)
(10.3)
Vodacom Service Provider Company (Proprietary) Limited .
(3.3) -
(10.4)
(10.3)
Long-term portion of finance leases . . . . . . . . . . . . . . . . .
780.2
783.8
The fair value of the Group's finance lease liability is R794.1 million (March 31, 2002: R790.6 million).

F-33
VODACOM GROUP (PROPRIETARY) LIMITED
NOTES TO THE CONDENSED CONSOLIDATED INTERIM FINANCIAL STATEMENTS (continued)
for the six months ended September 30, 2002 and 2001
10. INTEREST BEARING DEBT (continued)
As at
As at
March 31,
September 30,
2002
2002
Rm
Rm
(audited)
(unaudited)
10.2
Funding loans
Commerzbank AG . . . . . . . . . . . . . . . . . . . . . . . . . .
200.0
200.0
The R200 million loan is uncollateralised, bears interest at a fixed
rate of 13.7% NACQ (Nominal Amount Compounded Quarterly)
and is repayable on March 17, 2003.
Crdit Agricole Indosuez . . . . . . . . . . . . . . . . . . . . . .
200.0
200.0
The loan is uncollateralised, bears interest at a fixed rate of 14.0%
NACQ and is repayable on March 17, 2003.
Caspian Construction Company Limited and Planatel
Communications Limited . . . . . . . . . . . . . . . . . . . . . .
40.0
92.6
The shareholder loans of $18.4 million (March 31, 2002: $3.4 million)
are subordinated and bear no interest from 1 April 2002
(March 31, 2002: LIBOR plus 1%), and are available for repayment,
subject to 60% shareholders' approval.
The drawn portion of the project finance totalling $45.0 million to
Vodacom Tanzania Limited are collateralised by a charge over 51%
of the shares, the licence and the company's tangible and intangible
assets. The loans bear interest based on the denomination of the debt
between 5.5% and 13.0% per annum and will be fully repaid by
March 2009 . . . . . . . . . . . . . . . . . . . . . . . . . . . . . -
474.8
The extended credit facility of $28.3 million to Vodacom Congo
(R.D.C.) S.P.R.L is partly secured by guarantees and cash deposits,
bears interest at EURIBOR plus 1.75% and is repayable on
April 1, 2004 . . . . . . . . . . . . . . . . . . . . . . . . . . . . . -
298.6
Less: Current portion of funding loans:
Commerzbank AG . . . . . . . . . . . . . . . . . . . . . . .
(200.0)
(200.0)
Crdit Agricole Indosuez . . . . . . . . . . . . . . . . . . .
(200.0)
(200.0)
Project finance to Vodacom Tanzania Limited . . . . . . . . -
(57.9)
Caspian Construction Company Limited and Planatel
Communications Limited . . . . . . . . . . . . . . . . . . .
(40.0) -
(440.0)
(457.9)
Long-term portion of funding loans . . . . . . . . . . . . . . . . .
808.1
The fair value of the Group's funding loan liability is R1,264.3 million (March 31, 2002: R444.6 million).

F-34
VODACOM GROUP (PROPRIETARY) LIMITED
NOTES TO THE CONDENSED CONSOLIDATED INTERIM FINANCIAL STATEMENTS (continued)
for the six months ended September 30, 2002 and 2001
10. INTEREST BEARING DEBT (continued)
As at
As at
March 31,
September 30,
2002
2002
Rm
Rm
(audited)
(unaudited)
10.3
Other short-term loans
Standard Bank of London Limited . . . . . . . . . . . . . . . . .
539.4 -
The loan of $47.2 million is uncollateralised, bears interest at
LIBOR plus 1.5% and is repayable by June 30, 2002. This loan
is supported by a letter of comfort.
Various loans to Vodacom (Proprietary) Limited . . . . . . . . . .
26.1
21.3
ABSA Bank Limited . . . . . . . . . . . . . . . . . . . . . . . . . -
64.5
This loan is collateralised through guarantees issued and bears
interest at an all in rate of 3%. This loan was replaced by a
revolving credit facility on November 12, 2002, which bears interest
at LIBOR plus 1.5% and is available until December 31, 2004.
565.5
85.8
10.4
Repayment of interest bearing debt
2003
2004
2005
2006
2007
Total
onwards
Rm
Rm
Rm
Rm
Rm
Rm
Finance leases
Vodacom (Proprietary) Limited
10.3
16.2
27.3
43.6
406.4
503.8
Vodacom Service Provider
Company (Proprietary) Limited -
3.7
9.5
16.6
260.5
290.3
Funding loans
Commerzbank AG . . . . . .
200.0 - - - -
200.0
Crdit Agricole Indosuez . . .
200.0 - - - -
200.0
Other short-term loans . . . .
85.8 - - - -
85.8
Vodacom Tanzania Limited . .
57.9
75.1
94.7
117.6
222.1
567.4
Vodacom Congo (R.D.C.)
S.P.R.L.. . . . . . . . . . . . -
298.6 - - -
298.6
554.0
393.6
131.5
177.8
889.0
2,145.9
11.
DIVIDENDS PAID
During the period under review, the dividend to the amount of R600.0 million (September 30, 2001: R480.0 million) was paid
to ordinary shareholders.
For the six months ended
September 30,
2001
2002
Rm
Rm
(unaudited)
(unaudited)
12.
CASH AND CASH EQUIVALENTS AT END OF PERIOD
Bank and cash balances . . . . . . . . . . . . . . . . . . . . . . . . . . .
56.8
1,564.0
Bank overdrafts . . . . . . . . . . . . . . . . . . . . . . . . . . . . . . .
(1,452.9)
(2,728.5)
(1,396.1)
(1,164.5)

F-35
VODACOM GROUP (PROPRIETARY) LIMITED
NOTES TO THE CONDENSED CONSOLIDATED INTERIM FINANCIAL STATEMENTS (continued)
for the six months ended September 30, 2002 and 2001
13.
DISPOSAL/(ACQUISITION) OF SUBSIDIARIES
There were no acquisitions or disposals during the periods covered by the condensed consolidated financial statements.
14. CONTINGENT LIABILITIES
As at
As at
March 31,
September 30,
2002
2002
Rm
Rm
(audited)
(unaudited)
14.1
Globalstar Southern Africa (Proprietary) Limited
The functionality of the Gateway assets is under dispute and
Globalstar Southern Africa (Proprietary) Limited and Vodafone
Satellite Services Limited do not recognise the liability to
Globalstar LP. . . . . . . . . . . . . . . . . . . . . . . . . . . . .
15.0
15.0
14.2
Legal matters . . . . . . . . . . . . . . . . . . . . . . . . . . . .
5.0 -
14.3
Vodacom Congo (R.D.C.) S.P.R.L.
The Group has a 51% equity interest in Vodacom Congo (R.D.C.) S.P.R.L. ("Vodacom Congo"), which commencedbusiness on December 11, 2001. This investment is governed by a shareholders' agreement which provides the minority
shareholder certain protective and participating rights. In terms of IAS 31: "Accounting for interest in Joint Ventures",
Vodacom Congo may not be consolidated as a subsidiary as it is considered to be a joint venture and has been
proportionally consolidated in the financial statements at March 31, 2002 and September 30, 2002.
The Group, in terms of the shareholders' agreement, is however ultimately responsible for the funding of the operations
of Vodacom Congo for the first three years. The shareholders' agreement also gives the Group the right to appoint
management and the majority of the Board of the company. The Group also has a separate management agreement to
manage the company on a day-to-day basis. Currently Vodacom Congo is incurring losses which are expected to
increase in the foreseeable future. The 49% portion attributable to the joint venture partner of the liabilities and losses
were as follows:
As at
As at
March 31,
September 30,
2002
2002
Rm
Rm
(audited)
(unaudited)
Net loss . . . . . . . . . . . . . . . . . . . . . . . . . . . . . . . .
(19.3)
(87.3)
Total liabilities . . . . . . . . . . . . . . . . . . . . . . . . . . . .
(29.7)
(383.8)
Total assets . . . . . . . . . . . . . . . . . . . . . . . . . . . . . .
440.3
714.4
Preference shares . . . . . . . . . . . . . . . . . . . . . . . . . . .
(368.1)
(368.1)
Furthermore, the following guarantees were approved by the Group in respect of Vodacom Congo but are as yet not
issued:
Company
Details
Beneficiary
Euro
US$
Mil
Mil
Approved not issued
Guarantees not yet issued
ABSA Bank Limited
4.0 -
March 31, 2002
Approved and issued
Guarantee Alcatel
ABSA Bank Limited
32.6
29.8
C.I.T. Alcatel
Space Industries
and Alcatel Altech
Telecoms (Pty) Ltd
("Alcatel")Approved not issued
Guarantees not yet issued
ABSA Bank Limited -
51.2

F-36
VODACOM GROUP (PROPRIETARY) LIMITED
NOTES TO THE CONDENSED CONSOLIDATED INTERIM FINANCIAL STATEMENTS (continued)
for the six months ended September 30, 2002 and 2001
14.
CONTINGENT LIABILITIES (continued)
14.4
Negative working capital ratio
For the interim period ended September 30, 2002, and the financial year ended March 31, 2002, the Group had a
negative working capital ratio. A negative working capital ratio arises when the Group's current liabilities are greater
than the current assets. The Group's management believes that based on its operating cash flow, it will be able to meet
liabilities as they arise and it is in compliance with any covenants in borrowing agreements.
15.
UNDRAWN BORROWING FACILITIES AND GUARANTEES
The Group has Rand denominated credit facilities totalling R3,095.0 million with R1,973.7 million unutilised at
September 30, 2002. The facilities are uncommitted and can also be utilised for foreign loans and are subject to review at various
dates (usually on an annual basis). Vodacom Tanzania Limited has project funding facilities of $65.0 million of which
$20.0 million are unutilised at September 30, 2002. Vodacom Congo (R.D.C.) S.P.R.L. has bridging facilities of Euro 35.8 million
of which Euro 6.7 million are unutilised at September 30, 2002. Foreign currency term facilities are predominantly US dollar
based, at various maturities and are utilised for bridging and short-term working capital needs.
Companies within the Group have provided the following guarantees:
Company
Details
Beneficiary
As at
As at
March 31,
September 30,
2002
2002
Rm
Rm
(audited)
(unaudited)
Vodacom (Proprietary) Limited
All guarantees less than R0.2 million
Various
1.9
2.1
in terms of various lease agreements
Vodacom (Proprietary) Limited
Electricity supply
Eskom
1.0
1.0
Vodacom (Proprietary) Limited *
Standby letters of credit
Alcatel CIT
299.9
345.6
Vodacom Service Provider
All guarantees less than R0.1 million
Various
0.4
0.4
Company (Proprietary) Limited
in terms of various lease agreements
Vodacom Service Provider
Electricity supply
Midrand Town
1.0
1.0
Company (Proprietary) Limited
Council
Vodacom Group (Proprietary)
Guarantee for the obligations of
ABSA Bank -
338.3
Limited **
Vodacom Congo (R.D.C.) S.P.R.L.
Vodacom Group (Proprietary)
Letter of credit issued for obligations
Alcatel CIT -
112.8
Limited
of Vodacom Congo (R.D.C.) S.P.R.L.
Vodacom Group (Proprietary)
Letter of credit issued for obligations
Alcatel Space -
23.7
Limited
of Vodacom Congo (R.D.C.) S.P.R.L.
Industries
Vodacom Group (Proprietary)
Guarantee in respect of receipt by
SA Insurance -
9.5
Limited
independent intermediaries of
Association for
premiums on behalf of short-term
benefit of
insurers and Lloyd's underwriters,
insurers
and relating to short-term insurance
business carried on in the Republic of
South Africa
304.2
834.4
*
Amounts drawn on the standby letters of credit amounting to R nil (March 31, 2002: R98.4 million) are included as
liabilities in the balance sheet.
**
Amounts drawn on the guarantee issued amounting to R298.6 million are included as liabilities in the balance sheet.
Vodacom (Proprietary) Limited provides an unlimited guarantee for borrowings entered into by Vodacom Group (Proprietary)
Limited.

F-37
VODACOM GROUP (PROPRIETARY) LIMITED
NOTES TO THE CONDENSED CONSOLIDATED INTERIM FINANCIAL STATEMENTS (continued)
for the six months ended September 30, 2002 and 2001
16. COMMITMENTS
As at
As at
March 31,
September 30,
2002
2002
Rm
Rm
16.1
Capital Commitments
(audited)
(unaudited)
Commitments for orders in respect of existing contracts:
Vodacom (Proprietary) Limited . . . . . . . . . . . . . . . . . .
1,005.2
1,222.2
Vodacom Congo (R.D.C.) S.P.R.L. . . . . . . . . . . . . . . . .
303.7
444.2
Vodacom Tanzania Limited . . . . . . . . . . . . . . . . . . . .
78.9
166.8
Vodacom Service Provider Company (Proprietary) Limited . . .
59.9
18.9
Vodacom International Holdings (Proprietary) Limited . . . . .
2.2
-
Vodacom Group (Proprietary) Limited . . . . . . . . . . . . . .
0.3 -
Vodacom Lesotho (Proprietary) Limited . . . . . . . . . . . . . -
30.2
1,450.2
1,882.3
Commitments not yet contracted for:
Vodacom (Proprietary) Limited . . . . . . . . . . . . . . . . . .
805.5
1,483.7
Vodacom Congo (R.D.C.) S.P.R.L. . . . . . . . . . . . . . . . .
16.0
79.6
Vodacom Service Provider Company (Proprietary) Limited . . .
15.9
51.4
Vodacom Tanzania Limited . . . . . . . . . . . . . . . . . . . .
10.3 -
Vodacom Lesotho (Proprietary) Limited . . . . . . . . . . . . .
1.9
36.6
Vodacom Group (Proprietary) Limited . . . . . . . . . . . . . . -
3.7
849.6
1,655.0
The capital expenditure of the Group will be financed from internal cash generation, extended supplier credit and bank
credit.
16.2
License fees
Network operators in the Group pay monthly license fees based on their net operational income as defined in the license
agreement. Net operational income is defined as the total invoiced revenue of the license excluding discounts, Value
Added Taxation and other direct taxes derived from customers of the licensee for the provision to them of the service,
less net interconnect fees and bad debts actually incurred.
17.
EVENTS SUBSEQUENT TO THE PERIOD
The directors are not aware of any matter or circumstance arising since the end of the financial period, not otherwise dealt with
in the condensed consolidated financial statements, which significantly affects the position of the Group and the results of its
operations.
F-38
VODACOM GROUP (PROPRIETARY) LIMITED
NOTES TO THE CONDENSED CONSOLIDATED INTERIM FINANCIAL STATEMENTS (continued)
for the six months ended September 30, 2002 and 2001
18. RELATED PARTY TRANSACTIONS
As at
As at
March 31,
September 30,
2002
2002
Rm
Rm
(audited)
(unaudited)
18.1
Balances with Related Parties
Included in accounts receivable:
Telkom SA Limited Interconnect . . . . . . . . . . . . . . . .
529.4
332.1
Telkom SA Limited Other . . . . . . . . . . . . . . . . . . .
14.1 -
Vodafone Group plc . . . . . . . . . . . . . . . . . . . . . . . .
1.6
0.3
Included in accounts payable:
Telkom SA Limited . . . . . . . . . . . . . . . . . . . . . . . .
78.2
31.6
Telkom SA Limited Other . . . . . . . . . . . . . . . . . . .
3.0
0.5
Vodafone Group plc . . . . . . . . . . . . . . . . . . . . . . . . -
1.9
For the six months ended
September 30,
2001
2002
Rm
Rm
(unaudited)
(unaudited)
18.2
Transactions with Related Parties
Telkom SA Limited . . . . . . . . . . . . . . . . . . . . . . . . .
1,018.5
1,062.1
Interconnect income . . . . . . . . . . . . . . . . . . . . . . . .
1,421.9
1,497.8
Customer billing . . . . . . . . . . . . . . . . . . . . . . . . . .
4.1
19.9
Interest paid commercial . . . . . . . . . . . . . . . . . . . . -
0.3
Lease of transmission lines . . . . . . . . . . . . . . . . . . . .
(174.7)
(214.6)
Interconnect fees . . . . . . . . . . . . . . . . . . . . . . . . .
(158.6)
(163.9)
Interest payments on shareholder loan . . . . . . . . . . . . . .
(37.0)
(40.4)
Vodago prepaid costs . . . . . . . . . . . . . . . . . . . . . . . -
(4.9)
Telephone landline usage . . . . . . . . . . . . . . . . . . . . .
(16.9)
(9.6)
Installation of transmission lines . . . . . . . . . . . . . . . . .
(16.0)
(15.9)
Site costs . . . . . . . . . . . . . . . . . . . . . . . . . . . . . .
(4.3)
(6.6)
Vodafone Group plc . . . . . . . . . . . . . . . . . . . . . . . . .
(14.5)
(23.7)
Roaming income (transacted within the Vodafone Group) . . . .
11.0
11.9
Roaming expense (transacted within the Vodafone Group) . . .
(15.5)
(24.7)
Interest payments on shareholder loan . . . . . . . . . . . . . .
(10.0)
(10.9)
Vodafone Holdings (SA) (Proprietary) Limited
Interest payments on shareholder loan . . . . . . . . . . . . . .
(13.3)
(14.5)
VenFin Finansieringskorporasie (Proprietary) Limited . . . . . . .
(30.8)
(28.5)
Interest payments on shareholder loan . . . . . . . . . . . . . .
(10.0)
(10.9)
Interest payments on money market . . . . . . . . . . . . . . .
(20.8)
(17.6)
Descarte Investments No. 8 (Proprietary) Limited . . . . . . . . .
(3.7)
(4.0)
Interest payments on shareholder loan . . . . . . . . . . . . . .
(3.7)
(4.0)
Transactions with related parties are priced at prevailing market rates.
F-39
VODACOM GROUP (PROPRIETARY) LIMITED
NOTES TO THE CONDENSED CONSOLIDATED INTERIM FINANCIAL STATEMENTS (continued)
for the six months ended September 30, 2002 and 2001
19.
SEGMENTAL INFORMATION
The Group is primarily an integrated mobile telecommunication and data communication business located in South Africa but
does have businesses in other African countries. The primary reporting format therefore comprises the business segments of
the Group. During the period under review, the Group did not experience any pressures relating to the potential seasonality and
cyclicality of its operations.
For the six months ended
Unallocated
Networks
Service
Other
Elimi-
Total
September 30, 2001 providers
nations
(unaudited)
BUSINESS SEGMENTS
Rm
Rm
Rm
Rm
Rm
Rm
Segment revenue -
6,356.4
3,350.6
120.0
(2,304.8)
7,522.2
External -
4,158.3
3,257.5
106.4 -
7,522.2
Inter-segment -
2,198.1
93.1
13.6
(2,304.8) -
Segment profit/(loss) from
operations
(2.3)
1,539.7
135.6
(0.4)
(97.5)
1,575.1
Interest and dividends received
16.7
Finance costs
(123.1)
Profit before taxation
1,468.7
Included in segment profit/(loss)
from operations:
Depreciation and amortisation
(1.1)
(823.3)
(44.9)
(0.4)
(97.6)
(967.3)
Property, plant and equipment
(1.1)
(819.9)
(42.1)
(0.4) -
(863.5)
Intangible assets -
(3.4)
(2.8) -
(97.6)
(103.8)
Bad debts written off -
(11.2)
(54.8) - -
(66.0)
Integration costs, disposals of
operations and impairment costs
(20.0)
45.5 - - -
25.5
For the six months ended
Unallocated
Networks
Service
Other
Elimi-
Total
September 30, 2002 providers
nations
(unaudited)
BUSINESS SEGMENTS
Rm
Rm
Rm
Rm
Rm
Rm
Segment revenue -
8,198.3
4,209.4
52.0
(3,018.9)
9,440.8
External -
5,331.8
4,071.9
37.1 -
9,440.8
Inter-segment -
2,866.5
137.5
14.9
(3,018.9) -
Segment profit/(loss) from
operations:
17.6
1,750.2
192.1
(29.0)
(92.7)
1,838.2
Interest and dividends received
15.6
Finance costs
(315.3)
Profit before taxation
1,538.5
Included in segment profit/(loss)
from operations
Depreciation and amortisation
(1.4)
(1,039.3)
(55.7)
(0.5)
(92.5)
(1,189.4)
Property, plant and equipment
(1.4)
(1,030.1)
(52.9)
(0.4) -
(1,084.8)
Intangible assets -
(9.2)
(2.8)
(0.1)
(92.5)
(104.6)
Bad debts written off -
(3.6)
(17.4) - -
(21.0)

F-40
VODACOM GROUP (PROPRIETARY) LIMITED
NOTES TO THE CONDENSED CONSOLIDATED INTERIM FINANCIAL STATEMENTS (continued)
for the six months ended September 30, 2002 and 2001
20.
US GAAP INFORMATION
The financial statements have been prepared in accordance with International Accounting Standards ("IAS") which differs incertain respects from Generally Accepted Accounting Principles in the United States ("US GAAP"). The effect of applying US GAAP principles to net profit and shareholders' equity is set out below along with an explanation of applicable differences
between IAS and US GAAP:
For the six months ended
September 30,
2001
2002
Rm
Rm
Notes
(unaudited)
(unaudited)
Net profit as reported in accordance with IAS . . . . . . . . . . . . .
1,007.9
918.1
Items increasing/(decreasing) net profit:
Deferred bonus incentive scheme . . . . . . . . . . . . . . . . . . . .
(a)
10.4
(27.8)
Goodwill non-amortisation . . . . . . . . . . . . . . . . . . . . . . .
(b) -
49.2
Goodwill translation differences on amortisation . . . . . . . . . . .
(c)
(0.6)
(1.7)
Derivative financial instruments reclassification of transition
adjustments . . . . . . . . . . . . . . . . . . . . . . . . . . . . . . . .
(e)
25.3
3.9
Income tax rate difference . . . . . . . . . . . . . . . . . . . . . . .
(f)
(124.2)
(112.2)
Income tax effect of US GAAP adjustments . . . . . . . . . . . . . . .
(g)
(13.4)
9.0
Joint Venture . . . . . . . . . . . . . . . . . . . . . . . . . . . . . . .
(i)
16.0 -
Net profit in accordance with US GAAP before cumulative effect of change
in accounting policy . . . . . . . . . . . . . . . . . . . . . . . . . . . . .
921.4
838.5
Change in accounting policy upon adoption of SFAS 133:
Derivative financial instruments transition adjustments . . . . . . .
(e)
17.2 -
Income tax effect on above . . . . . . . . . . . . . . . . . . . . . .
(g)
(6.5) -
Net profit in accordance with US GAAP after cumulative effect of change in
accounting policy . . . . . . . . . . . . . . . . . . . . . . . . . . . . . .
932.1
838.5
As at
As at
September 30,
September 30,
2001
2002
Rm
Rm
Notes
(unaudited)
(unaudited)
Shareholders' equity as reported in accordance with IAS . . . . . . .
4,616.3
6,337.0
Items increasing/(decreasing) shareholders' equity:
Deferred bonus incentive scheme . . . . . . . . . . . . . . . . . . . .
(a)
47.4
30.1
Goodwill non-amortisation . . . . . . . . . . . . . . . . . . . . . . .
(b) -
51.1
Goodwill translation differences on accumulated amortisation . . . .
(c)
(0.9)
(6.0)
Goodwill accumulated translation differences . . . . . . . . . . . . .
(c)
8.0
20.5
Income tax rate difference . . . . . . . . . . . . . . . . . . . . . . .
(f)
(552.0)
(767.4)
Income tax effect of US GAAP adjustments . . . . . . . . . . . . . . .
(g)
(17.8)
(11.3)
Joint Venture . . . . . . . . . . . . . . . . . . . . . . . . . . . . . . .
(i)
96.0 -
Shareholders' equity in accordance with US GAAP . . . . . . . . . . . .
4,197.0
5,654.0

F-41
VODACOM GROUP (PROPRIETARY) LIMITED
NOTES TO THE CONDENSED CONSOLIDATED INTERIM FINANCIAL STATEMENTS (continued)
for the six months ended September 30, 2002 and 2001
20.
US GAAP INFORMATION (continued)
Movements in shareholders' equity in accordance with US GAAP
Rm
Balance at March 31, 2001 (audited) . . . . . . . . . . . . . . . . . . . . . . . . . . . . . . . . . . . .
3,195.0
Net profit for the period . . . . . . . . . . . . . . . . . . . . . . . . . . . . . . . . . . . . . . . . . . .
932.1
Dividends declared . . . . . . . . . . . . . . . . . . . . . . . . . . . . . . . . . . . . . . . . . . . . . . -
Foreign currency translation reserve adjustment . . . . . . . . . . . . . . . . . . . . . . . . . . . . . .
20.9
Cumulative effect adjustment of adoption of SFAS 133 . . . . . . . . . . . . . . . . . . . . . . . . . .
64.8
Gain on derivatives reclassified to earnings . . . . . . . . . . . . . . . . . . . . . . . . . . . . . . . .
(15.8)
Balance at September 30, 2001 (unaudited) . . . . . . . . . . . . . . . . . . . . . . . . . . . . . . . . .
4,197.0
Net profit for the period . . . . . . . . . . . . . . . . . . . . . . . . . . . . . . . . . . . . . . . . . . .
1,187.5
Dividends declared . . . . . . . . . . . . . . . . . . . . . . . . . . . . . . . . . . . . . . . . . . . . . .
(600.0)
Foreign currency translation reserve adjustment . . . . . . . . . . . . . . . . . . . . . . . . . . . . . .
106.1
Gain on derivatives reclassified to earnings . . . . . . . . . . . . . . . . . . . . . . . . . . . . . . . .
(16.6)
Balance at March 31, 2002 (audited) . . . . . . . . . . . . . . . . . . . . . . . . . . . . . . . . . . . .
Net profit for the period . . . . . . . . . . . . . . . . . . . . . . . . . . . . . . . . . . . . . . . . . . .
838.5
Dividends declared . . . . . . . . . . . . . . . . . . . . . . . . . . . . . . . . . . . . . . . . . . . . . . -
Foreign currency translation reserve adjustment . . . . . . . . . . . . . . . . . . . . . . . . . . . . . .
(56.1)
Gain on derivatives reclassified to earnings . . . . . . . . . . . . . . . . . . . . . . . . . . . . . . . .
(2.4)
Balance at September 30, 2002 (unaudited) . . . . . . . . . . . . . . . . . . . . . . . . . . . . . . . . .
5,654.0
Summary of differences between International Accounting Standards and accounting principles generally accepted in
the US.
A summary of the principal differences and additional disclosures applicable to the Group are set forth below:
(a)
Deferred bonus incentive scheme
Under IAS, the total value of deferred bonus entitlements as calculated at the end of each financial period is based on
the net present value of expected future cash payments as determined under the bonus formula over the vesting period.
Under US GAAP, in accordance with FIN 28 : "Accounting for Stock Appreciation Rights and Other Variable Stock
Option Awards Plans and Interpretation of APB Opinions No. 15 and 25", compensation cost is recognised over the
service period or the vesting period if the service period is not defined, based upon the undiscounted value of the
entitlements.
(b)
Goodwill non-amortisation
Under IAS, goodwill and intangible assets arising in business combinations are amortised over their estimated useful
lives.
Under US GAAP, accounting for goodwill was substantially the same as IAS until the adoption of SFAS 142 "Goodwill
and Other Intangible Assets" ("SFAS 142"). SFAS 142 addresses the initial and ongoing financial accounting andreporting for acquired goodwill and other intangible assets. It requires that goodwill no longer be amortised but tested
for impairment annually or more frequently if impairment indicators arise.
The amortisation provisions of SFAS 142 are applicable to goodwill arising in business combinations consummated
after June 30, 2001 and consequently in the year ended March 31, 2002 goodwill arising from the investment in
Vodacom Congo (R.D.C.) S.P.R.L. is not amortised.
The Group adopted SFAS 142 with effect from April 1, 2002. From that date all goodwill is no longer amortised.
The Group has carried out the initial impairment testing of goodwill required by SFAS 142 before the first interim
reporting period as at September 30, 2002 based on the April 1, 2002 goodwill balance and determined that no
impairment needed to be recognised upon the adoption of SFAS 142.

F-42
VODACOM GROUP (PROPRIETARY) LIMITED
NOTES TO THE CONDENSED CONSOLIDATED INTERIM FINANCIAL STATEMENTS (continued)
for the six months ended September 30, 2002 and 2001
20.
US GAAP INFORMATION (continued)
(c)
Goodwill translation of goodwill arising on the acquisition of a foreign entity
Under IAS, goodwill arising on the acquisition of a foreign entity is treated as an asset of the Group and translated at
the foreign exchange rate ruling at the transaction date based on the historical rate.
Under US GAAP, goodwill arising on the acquisition of Vodacom Congo (R.D.C.) S.P.R.L. and Vodacom Tanzania
Limited is translated at the actual exchange rate at the end of the period. The resulting foreign exchange transaction gain
or loss increases or decreases the net investment in Vodacom Congo (R.D.C.) S.P.R.L. and Vodacom Tanzania Limited.
As at
As at
March 31,
September 30,
2002
2002
Rm
Rm
(audited)
(unaudited)
A reconciliation of goodwill for South African and foreign entities
reported under IAS on the balance sheet to the approximate amounts
determined under US GAAP is as follows:
Included in total goodwill reported under IAS . . . . . . . . . . .
342.9
295.6
Goodwill not amortised under US GAAP . . . . . . . . . . . .
1.9
51.1
Goodwill income tax rate change . . . . . . . . . . . . . . . .
20.1
20.1
Translation difference on amortisation . . . . . . . . . . . . . .
(4.3)
(6.0)
Translation difference on goodwill balance . . . . . . . . . . . .
31.7
20.5
As adjusted under US GAAP . . . . . . . . . . . . . . . . . . . .
392.
3
381.3
(d)
Income taxes additional temporary differences
Under IAS, no deferred tax liability was recognised in respect of intangible assets acquired other than in a business
combination where there was a difference at the date of acquisition between the assigned values and the tax bases of the
assets.
Under US GAAP, a deferred tax liability (and corresponding increase in assets acquired) is recognised for all temporary
differences between the assigned values and the tax bases of intangible assets acquired. The recording of such deferred
tax liability has no net impact on net income or shareholder's equity as determined under US GAAP as the decrease in
income tax expense is off-set by a corresponding increase in amortisation (Note 20f).
(e)
Derivative financial instruments
The Group adopted IAS 39 and SFAS 133: Accounting for Derivative Instruments and Hedging Activities ("SFAS 133")on April 1, 2001.
Under IAS, upon adoption of IAS 39, the difference between previous carrying amounts and the fair value of
derivatives, which prior to the adoption of IAS 39 had been designated as either fair value or cash flow hedges but do
not qualify as hedges under IAS 39, is recognised as an adjustment of the opening balance of retained earnings at
the beginning of the financial year IAS 39 is initially applied. Changes in fair value of derivatives acquired after
April 1, 2001 are recorded in the income statement.
Under US GAAP, upon adoption of SFAS 133, the difference between previous carrying amounts and fair value of
derivatives, which prior to the adoption of SFAS 133 had been cash flow type hedges but do not qualify as hedges under
SFAS 133, is recognised as a cumulative effect adjustment of other comprehensive income in the year SFAS 133 is
initially applied. This amount is subsequently released into earnings in the same period or periods during which the
hedged transaction affects earnings. During the six month period ended September 30, 2002 R3.9 million (2001:
R26.0 million) was released into earnings. The difference between previous carrying amounts and fair value of
derivatives, which prior to the adoption of SFAS 133 had been fair value type hedges, is recognised as a cumulative
effect adjustment in earnings. Changes in fair value of derivatives acquired after April 1, 2001 are recorded in the
income statement.

F-43
VODACOM GROUP (PROPRIETARY) LIMITED
NOTES TO THE CONDENSED CONSOLIDATED INTERIM FINANCIAL STATEMENTS (continued)
for the six months ended September 30, 2002 and 2001
20.
US GAAP INFORMATION (continued)
(f)
Income tax rate differences
The tax rate in South Africa varies depending on whether income is distributed. The income tax rate is 30% but upon
distribution an additional tax (Secondary Tax on Companies or "STC") of 12.5% is due based on the amount of the
dividends net of the STC liability.
In conformity with IAS, Vodacom reflects the STC as a component of the income tax charge for the period in which
dividends are declared. IAS also requires that deferred tax be provided for at the undistributed rate of 30%.
For the purpose of US GAAP, Vodacom believes that under SFAS No. 109: "Accounting for Income Taxes"
("SFAS 109") temporary differences should be tax effected using the tax rate that will apply when income is distributed,i.e. an effective rate of 37.78% including STC. The use of the higher rate not only affects the measurement of deferred
tax assets and liabilities, and hence the tax charge for any period, but because temporary differences in a business
combination need to be tax effected at the higher rate there is a consequent effect on the amount of goodwill recognised
in a business combination under US GAAP.
Vodacom has therefore computed the STC that would become payable upon distribution of relevant undistributed
earnings and accrued that amount as an additional liability.
(g)
Deferred taxation
The tax effects of the US GAAP adjustments have been calculated based on the enacted tax rate of 37.78%
(2001: 37.78%, March 31, 2002: 37.78%).
A reconciliation of the deferred tax balances under IAS to the approximate amounts determined under US GAAP, where
materially different, are as follows:
As at
As at
March 31,
September 30,
2002
2002
Rm
Rm
(audited)
(unaudited)
Net deferred tax liabilities:
As reported under IAS . . . . . . . . . . . . . . . . . . . . . . . .
428.5
472.0
Additional temporary differences . . . . . . . . . . . . . . . . .
62.2
54.8
Income tax rate difference . . . . . . . . . . . . . . . . . . .
675.3
787.5
Tax effect of US GAAP adjustments . . . . . . . . . . . . . . .
21.8
11.3
As adjusted under US GAAP . . . . . . . . . . . . . . . . . . . .
1,187.8
1,325.6
Under IAS, deferred tax assets on deductible temporary differences are only recognised to the extent that it is probable
that the future taxable profit will allow the deferred tax asset to be recovered.
Under US GAAP, deferred tax assets are recognised on all temporary differences. A valuation allowance is recognised if
it is more likely than not that the asset will not be recovered. For US GAAP, an additional deferred tax asset and a
corresponding valuation adjustment allowance of R67.3 million (March 31, 2002: R31.0 million) have no effect on the
net shareholder's equity for the year.
(h)
Capitalised interest
Under IAS, interest cost incurred during the construction period is expensed as incurred.
Under US GAAP, interest cost incurred during the construction period (i.e. period of time necessary to bring a
constructed fixed asset to the condition and location necessary for its intended use) is capitalised. The capitalised
interest is recorded as part of the asset to which it relates and is amortised over the asset's estimated useful life.
Capitalised interest was nil for the six months ended September 30, 2002 and 2001 as the effect of capitalising interest,
as compared with the effect of expensing interest, was not material.

F-44
VODACOM GROUP (PROPRIETARY) LIMITED
NOTES TO THE CONDENSED CONSOLIDATED INTERIM FINANCIAL STATEMENTS (continued)
for the six months ended September 30, 2002 and 2001
20.
US GAAP INFORMATION (continued)
(i)
Joint ventures
Under IAS, investments qualifying as joint ventures are accounted for under the proportionate consolidation method of
accounting. Under the proportionate consolidation method, the venturer records its share of each of the assets, liabilities,
income and expenses of the jointly controlled entity on a line-by-line basis with similar items in the venturer's financial
statements. The venturer continues to record its share of losses in excess of its net investment of the joint venture.
Under US GAAP, joint ventures are accounted for under the equity method of accounting. Under the equity method, an
investment in a joint venture is shown in the balance sheet of an investor as a single amount. Likewise, an investor's
share of earnings or losses from its investment is ordinarily shown in its income statement as a single amount. An
investor discontinues applying the equity method when its net investment (including net advances) is reduced to zero.
For the six months ended September 30, 2001, in accordance with IAS, the Group proportionately consolidated losses to
the value of R16.0 million, that was in excess of the Group's net investment in the joint venture. Under US GAAP these
losses are not considered in calculating net income as the value of the investment was reduced to zero. Upon disposal of
the investment in Vodacom World Online (Proprietary) Limited in 2002, the gain on the sale was less based on a
different basis in the net investment.
(j)
Comprehensive income
Comprehensive income under US GAAP and accumulated other comprehensive income balances under US GAAP are
summarised as follows:
For the six months ended
September, 30
2001
2002
Rm
Rm
(unaudited)
(unaudited)
Net income under US GAAP . . . . . . . . . . . . . . . . . . . .
932.1
838.5
Other comprehensive income/(loss):
Foreign currency translation adjustment . . . . . . . . . . . . .
20.9
(56.1)
Cumulative effect adjustment of adoption of SFAS 133 . . . . .
64.8 -
Gain on derivatives reclassified to earnings . . . . . . . . . . .
(15.8)
(2.4)
Other comprehensive income/(loss) . . . . . . . . . . . . . . . . .
69.9
(58.5)
Comprehensive income . . . . . . . . . . . . . . . . . . . . . . .
1,002.0
780.0
Accumulated other comprehensive income balances:
Cumulative foreign currency translation adjustments . . . . . .
23.2
73.2
Cumulative effect adjustment of adoption of SFAS 133 . . . . .
49.0
30.0
(k)
Impairment of assets
Under IAS, the Group is required to annually assess whether there are any indications that an asset may be impaired.
Should there be such an indicator, the asset must be tested for impairment. An impairment loss must be recognised in
the statement of operations, should an assets carrying amount exceed its recoverable amount. The impairment loss is the
difference between the assets carrying amount and its recoverable value. The recoverable amount is the higher of the
assets net selling price or its value in use. Value in use is the future cash flows to be derived from the particular asset,
discounted to present value using a pre-tax market determined rate that reflects the current assessment of the time value
of money and the risks specific to the asset. The reversal of an impairment loss in subsequent periods is permitted when
there has been a change in economic conditions or the expected use of the asset.
Under US GAAP, for assets other than goodwill, the Group is required to test for impairment whenever there is an
indication of impairment in accordance with the FASB Statement of Financial Accounting Standards No. 144
"Accounting for the Impairment or Disposal of Long-lived Assets ("SFAS 144"). For assets to be held and used,impairment is first measured by reference to undiscounted cash flows. If there is no impairment by reference to
undiscounted cash flows, no further action is required but the useful life of the asset must be reconsidered. If impairment
exists the Group must measure impairment by comparing the assets fair value to its carrying value. Fair value is either
market value (if an active market for the asset exists) or the sum of discounted future cash flows. The discount rate
reflects the risk that is specific to that asset. For assets to be disposed of, the loss recognised is the excess of the assets
carrying amount over its fair value less costs to sell. The reversal of previously recognised impairment losses is
prohibited.
F-45
VODACOM GROUP (PROPRIETARY) LIMITED
NOTES TO THE CONDENSED CONSOLIDATED INTERIM FINANCIAL STATEMENTS (continued)
for the six months ended September 30, 2002 and 2001
20.
US GAAP INFORMATION (continued)
(k)
Impairment of assets (continued)
During the same period in 2001 the Group recognised a loss of R45.5 million in respect of a onerous contract (Note 5)
in accordance with paragraph 8 of SFAS 5: "Accounting for Contingencies" ("SFAS 5"). Subsequent to the issuance ofthe 2001 financial statements, it became clear that the other party to the contract was prepared to waive its right to
supply satellite phones and instead was prepared to enter into a revised contract to supply mobile phones. Accordingly,
management determined that, based on the change in circumstances arising from the willingness of the other party to
revise the contract, the Group would no longer incur a loss under the contract and therefore reversed the loss previously
provided for. The reversal of the provision, based on a change in circumstances, is not the recovery of impaired assets
but rather it represents the reversal in a subsequent period of provision for an estimated loss.
The Group currently has no material GAAP difference for impairment of assets.
(l)
Revenue recognition
Under IAS, the Group recognises activation fee revenue and costs up to the amount of the related activation revenue
immediately upon activation of a new customer. Any excess costs incurred are recognised up front upon activation of a
new customer.
Under US GAAP, activation fee revenues and costs up to the amount of activation revenue would be deferred and
recognised over the customer relationship period.
The Group has not presented the deferral of activation fees in the above US GAAP reconciliation, as there is no net
income impact.
(m)
Recent accounting pronouncements
In July 2001, the Financial Accounting Standards Board ("FASB") issued Statements of Financial Accounting StandardsNo. 142, "Goodwill and Other Intangible Assets" ("SFAS 142"). Under SFAS 142, goodwill and intangible assets withindefinite lives are no longer amortised but are reviewed annually (or more frequently if impairment indicators arise) for
impairment. Separable intangible assets that are not deemed to have indefinite lives will continue to be amortised over
their useful lives.
The amortisation provisions of SFAS 142 apply to goodwill and intangible assets acquired after June 30, 2001.
With respect to goodwill and intangible assets acquired prior to July 1, 2001, the Group adopted SFAS 142 effective
April 1, 2002. The Group has evaluated the effect that the adoption of the provisions of SFAS 142 will have on its
results of operations and financial position (Note 20b).
In August 2001, the FASB issued Statement of Financial Accounting Standards No. 143, "Accounting for Obligations,
Associated with the Retirement of Long-Lived Assets" ("SFAS 143"). SFAS 143 establishes accounting standards forrecognition and measurement of a liability at fair value for an asset retirement obligation and an addition to the
associated asset retirement cost. The accretion of interest expense each period is subsequently recorded as an expense
and added to the liability. FAS 143 is effective for fiscal years beginning after June 15, 2002. The Group expects that the
adoption of SFAS 143 will not have a material impact on its results of operations and financial position.
In October 2001, the FASB issued Statement of Financial Accounting Standards No. 144, "Accounting for the
Impairment or Disposal of Long-Lived Assets" ("SFAS 144"). SFAS 144 addresses financial accounting and reportingfor the impairment of long-lived assets and for long-lived assets to be disposed of. This Statement supersedes FASB
("SFAS 121"). However, this Statement retains the fundamental provisions of SFAS 121 for recognition andmeasurement of the (a) impairment of long-lived assets to be held and used and (b) long-lived assets to be disposed of
by sale. The Group adopted SFAS 144 effective April 1, 2002 (Note 20k). The adoption of SFAS 144 has no material
impact on its results of operations and financial position.
F-46
VODACOM GROUP (PROPRIETARY) LIMITED
NOTES TO THE CONDENSED CONSOLIDATED INTERIM FINANCIAL STATEMENTS (continued)
for the six months ended September 30, 2002 and 2001
20.
US GAAP INFORMATION (continued)
(m)
Recent accounting pronouncements (continued)
In April 2002, the FASB issued Statements of Accounting Standards No. 145, "Rescission of SFAS Nos. 4, 44 and 64,
Amendment of SFAS 13, and Technical Corrections as of April 2002" ("SFAS 145"). SFAS 145 rescinds SFAS No. 4,"Reporting Gains and Losses from Extinguishment of Debt," SFAS No. 44, "Accounting for Intangible Assets of Motor
Carriers", and SFAS 64, "Extinguishments of Debt made to satisfy Sinking-Fund requirements". As a result, gains and
losses from extinguishment of debt will no longer be classified as extraordinary items unless they meet the criteria of
unusual or infrequent as described in Accounting Principles Boards Opinion 30, "Reporting the Results of Operations
Reporting the Effects of Disposal of a Segment of a Business, and Extraordinary, Unusual and Infrequently Occurring
Events and Transactions". In addition, SFAS 145 amends SFAS 13, "Accounting for Leases", to eliminate an
inconsistency between the required accounting for sale-leaseback transactions and the required accounting for certain
lease modifications that have economic effects that are similar to sale-leaseback transactions. SFAS 145 also amends
other existing authoritative pronouncements to make various technical corrections, clarify meanings, or describe their
applicability under changed conditions. SFAS 145 is effective for fiscal years beginning after May 15, 2002. The Group
is currently evaluating the impact that the adoption of SFAS 145 will have on its results of operations and financial
position. However, the Group does not believe that the adoption of SFAS 145 will have a material impact on its results
of operations and financial position.
In June 2002, the FASB issued Statement of Accounting Standards No. 146, "Accounting for Costs Associated with Exit
or Disposal Activities" ("SFAS 146"). This Statement addresses financial accounting and reporting for costs associatedwith exit or disposal activities and nullifies Emerging Issues Task Force Issue No. 94-3, "Liability Recognition for
Certain Employee Termination Benefits and Other Costs to Exit an Activity (including Certain Costs Incurred in a
Restructuring)" ("EITF 94-3"). SFAS 146 eliminates the definition and requirements for recognition of exit costs inEITF 94-3. SFAS 146 requires that a liability for a cost associated with an exit or disposal activity be recognised when
the liability is incurred. Under EITF 94-3, a liability for an exit cost as defined in EITF 94-3 was recognised at the date
of an entity's commitment to an exit plan. SFAS 146 also concluded that an entity's commitment to a plan, by itself,
does not create a present obligation to others that meets the definition of a liability. SFAS 146 also establishes that fair
value is the objective for initial measurement of the liability. SFAS 146 is effective for exit or disposal activities initiated
after December 31, 2002. The Group is currently evaluating the impact that the adoption of SFAS 146 will have on its
results of operations and financial position. However, the Group does not believe that the adoption of SFAS 146 will
have a material impact on its results of operations and financial position.
In October 2002, the FASB issued SFAS No. 147, "Acquisitions of Certain Financial Institutions" ("SFAS 147"). This Statement removes acquisitions of financial institutions from the scope of Statement 72 and Interpretation 9 and
requires that those transactions be accounted for in accordance with SFAS No. 141, Business Combinations ("SFAS141" and SFAS 142. In addition, this Statement amends SFAS 144, to include in its scope long-term customer-
relationship intangible assets of financial institutions such as depositor and borrower relationship intangible assets
and credit card holders intangible assets. SFAS 147 is effective for acquisitions where the date of acquisition is on or
after October 1, 2002.. The Group expects that the adoption of this Statement will not have a material impact on its
results of operations and financial position.
In November 2002, the Emerging Issues Task Force reached a final consensus related to Revenue Arrangements with
Multiple Deliverables (EITF 00-21). The consensus requires that revenue arrangements with multiple deliverables
should be divided into separate units of accounting if (a) a delivered item has value to the customer on stand alone
basis, (b) there is objective and reliable evidence of the fair value of the undelivered item and (c) if the arrangement
includes a general right of return, delivery or performance of the undelivered items is considered probable and
substantially in the control of the vendor. Arrangement consideration should be allocated among the separate units of
accounting based on their relative fair value and appropriate revenue recognition criteria would be applied to each
separate unit of accounting. The Group has not yet determined what effect, if any, EITF 00-21 would have on revenue
and net income determined in accordance with US GAAP. The Task Force agreed the effective date for the consensus
will be for all revenue arrangements entered into in fiscal periods beginning after June 15, 2003, with early adoption
permitted. The Group will adopt EITF 00-21 for their fiscal year beginning April 1, 2004.
In December 2002, the FASB issued Statements of Financial Accounting Standards No 148, "Accounting for Stock-
Based Compensation Transition and Disclosure an amendment of FAS 123". Under FAS 148, the statement provides
alternative methods of transition for a voluntary change to the fair value based method of accounting for stock-based
F-47
employee compensation. In addition, this statement amends the disclosure requirements of Statement 123 to require
prominent disclosure on both annual and interim financial statements about the method of accounting for stock-based
employee compensation and the effect of the method used on reported results. The amendments to Statement 123 in
paragraphs 2(a)-2(e) of this statement shall be effective for financial statements for fiscal years ending after December
15, 2002. Earlier application of the transition provisions in paragraphs 2(a)-2(d) is permitted for entities with a fiscal
year ending prior to December 15, 2002, provided that financial statements for the 2002 fiscal year have not been issued
as of the date this Statement is issued. Early application of the disclosure provisions in paragraph 2(e) is encouraged.
The Group has determined that this statement will have no impact on its financial statements for the periods presented
as it does not have any stock based compensation plans.
In November 2002, the FASB issued FASB Interpretation No. 45, "Guarantor's Accounting and Disclosure
Requirements for Guarantees, Including Indirect Guarantees of Indebtedness of Others an interpretation of FASB
Statements No. 5, 57, and 107 and rescission of FASB Interpretation No. 34" ("FIN 45"). This interpretation elaborateson the disclosures to be made by a guarantor in its interim and annual financial statements about its obligations under
certain guarantees that it has issued. It also clarifies that a guarantor is required to recognize, at the inception of a
guarantee, a liability for the fair value of the obligation undertaken in issuing the guarantee. This interpretation does not
prescribe a specific approach for subsequently measuring the guarantor's recognized liability over the term of the related
guarantee. This interpretation also incorporates, without change, the guidance in FASB Interpretation No. 34, Disclosure
of Indirect Guarantees of Indebtedness of Others, which is being superseded. The initial recognition and initial
measurement provisions of this interpretation are applicable on a prospective basis to guarantees issued or modified after
December 31, 2002, irrespective of the guarantor's fiscal year-end. The disclosure requirements in this Interpretation are
effective for financial statements of interim or annual periods ending after December 15, 2002. The interpretive
guidance incorporated without change from Interpretation 34 continues to be required for financial statements for fiscal
years ending after June 15, 1981 the effective date of Interpretation 34. The Group is currently evaluating the impact
of recognizing the fair value of certain guarantees that it has issued.
In January 2003, the FASB issued FASB Interpretation No. 46 "Consolidation of Variable Interest Entities an
interpretation of ARB No. 51 " ("FIN 46"). This interpretation of Accounting Research Bulletin No. 51. ConsolidatedFinancial Statements, addresses consolidation by business enterprises of variable interest entities which have one or
both of the following characteristics:
1.
The equity investment at risk is not sufficient to permit the entity to finance its activities without additional
subordinated financial support from other parties, which is provided through other interests that will absorb some
or all of the expected losses of the entity.
2.
The equity investors lack one or more of the following essential characteristics of a controlling financial interest:
a.
The direct or indirect ability to make decisions about the entity's activities through voting rights or similar
rights
b.
The obligation to absorb the expected losses of the entity if they occur, which makes it possible for the entity
to finance its activities
c.
The right to receive the expected residual returns of the entity if they occur, which is the compensation for the
risk of absorbing the expected losses.
This Interpretation applies immediately to variable interest entities created after January 31, 2003, and to variable
interest entities in which an enterprise obtains an interest after that date. It applies in the first fiscal year or interim
period beginning after June 15, 2003, to variable interest entities in which an enterprise holds a variable interest that it
acquired before February 1, 2003. The Interpretation applies to public enterprises as of the beginning of the applicable
interim or annual period, and it applies to nonpublic enterprises as of the end of the applicable annual period.
This Interpretation may be applied prospectively with a cumulative-effect adjustment as of the date on which it is first
applied or by restating previously issued financial statements for one or more years with a cumulative-effect adjustment
as of the beginning of the first year restated. The Group is still evaluating the impact of this interpretation on its
financial statements.

F48
REPORT OF THE INDEPENDENT AUDITORS
to the Shareholders of TELKOM SA LIMITED
We have audited the accompanying consolidated balance sheets of TELKOM SA LIMITED and subsidiaries as of March 31, 2002, 2001
and 2000, and the related consolidated statements of income, shareholders' equity, and cash flows for each of the three years in the
period ended March 31, 2002 set out on pages F49 to F114. These financial statements are the responsibility of the Company's
directors. Our responsibility is to express an opinion on these financial statements based on our audits. We did not audit the
financial statements of Vodacom Group (Proprietary) Limited, a 50% joint venture, which statements reflect total assets constituting
14% in March 2002, 12% in 2001 and 10% in 2000, and total revenues constituting 24% in March 2002, 21% in 2001 and 18% in
2000 of the related consolidated totals. Those statements were audited by other auditors, whose report, which has been furnished to
us, without qualifying, draws attention to the fact that there were certain restatements and adjustments regarding the consolidated
financial statements of the Vodacom Group (Proprietary) Limited as issued previously. Our opinion, insofar as it relates to the
amounts included for Vodacom Group (Proprietary) Limited, is based solely on the report of the other auditors.
We conducted our audits in accordance with auditing standards generally accepted in the United States of America. Those standards
require that we plan and perform the audit to obtain reasonable assurance about whether the consolidated financial statements are
free of material misstatement. An audit includes examining, on a test basis, evidence supporting the amounts and disclosures in the
consolidated financial statements. An audit also includes assessing the accounting principles used and significant estimates made by
management, as well as evaluating the overall consolidated financial statement presentation. We believe that our audits provide a
reasonable basis for our opinion.
In our opinion, based on our audits and the report of other auditors, the consolidated financial statements referred to above present
fairly, in all material respects, the consolidated financial position of TELKOM SA LIMITED at March 31, 2002, 2001 and 2000, and the
consolidated results of their operations and their cash flows for each of the three years in the period ended March 31, 2002, in
conformity with International Accounting Standards and in the manner required by the Companies Act in South Africa.
International Accounting Standards vary in certain significant respects from accounting principles generally accepted in the
United States of America. Application of accounting principles generally accepted in the United States of America would have
affected the consolidated shareholders' equity as of March 31, 2002, 2001 and the consolidated results of operations for each of the
two years in the period ended March 31, 2002 to the extent summarized in Note 41 to the consolidated financial statements.
Without qualifying our opinion above we draw attention to Note 20 to the consolidated financial statements. In 2002 Telkom SA
Limited changed its accounting policy for financial instruments to conform with International Accounting Standard 39 Financial
Instruments: Recognition and measurement.
ERNST & YOUNG
Registered Accountants and Auditors
Chartered Accountants (SA)
Pretoria
December 10, 2002
Chartered Accountants (SA)
Telephone (011) 772-3000
Wanderers Office Park
Telefax
(011) 772-4000
52 Corlett Drive, Illovo
Docex
123 Randburg
PO Box 2322
www.ey.com/southafrica
Johannesburg 2000

F49
TELKOM SA LIMITED
CONSOLIDATED INCOME STATEMENTS
for the three years ended March 31, 2002
2000
2001
2002
Note
Rm
Rm
Rm
Operating revenue . . . . . . . . . . . . . . . . . . . . . . . . . . . .
3
27,113
31,352
34,197
Operating expenses . . . . . . . . . . . . . . . . . . . . . . . . . . .
4
23,231
26,427
29,984
Employee expenses . . . . . . . . . . . . . . . . . . . . . . . . . . . .
7,713
6,590
7,166
Payments to other operators . . . . . . . . . . . . . . . . . . . . . . . .
4,241
4,983
5,762
Selling, general and administrative expenses . . . . . . . . . . . . . . .
5,324
6,971
8,237
Services rendered . . . . . . . . . . . . . . . . . . . . . . . . . . . . .
1,439
1,539
2,194
Operating leases . . . . . . . . . . . . . . . . . . . . . . . . . . . . . .
340
1,292
1,217
Depreciation and amortization . . . . . . . . . . . . . . . . . . . . . .
4,174
5,052
5,408
Operating profit . . . . . . . . . . . . . . . . . . . . . . . . . . . . .
3,882
4,925
4,213
Investment income . . . . . . . . . . . . . . . . . . . . . . . . . . . .
5
641
617
490
Profit before finance charges . . . . . . . . . . . . . . . . . . . . . .
4,523
5,542
4,703
Finance charges . . . . . . . . . . . . . . . . . . . . . . . . . . . . . .
6
2,482
3,137
2,550
Profit before tax . . . . . . . . . . . . . . . . . . . . . . . . . . . . .
2,041
2,405
2,153
Taxation . . . . . . . . . . . . . . . . . . . . . . . . . . . . . . . . . .
7
501
715
873
Profit after tax . . . . . . . . . . . . . . . . . . . . . . . . . . . . . .
1,540
1,690
1,280
Minority interests . . . . . . . . . . . . . . . . . . . . . . . . . . . . .
13
68
59
Net profit for the year . . . . . . . . . . . . . . . . . . . . . . . . . .
1,527
1,622
1,221
Basic and diluted earnings per share (cents) . . . . . . . . . . . . . . .
8
274.1
291.2
219.2
F50
TELKOM SA LIMITED
CONSOLIDATED BALANCE SHEETS
at March 31, 2002
2000
2001
2002
Note
Rm
Rm
Rm
ASSETS
Non-current assets . . . . . . . . . . . . . . . . . . . . . . . . . . . .
36,266
40,863
44,240
Property, plant and equipment . . . . . . . . . . . . . . . . . . . . . .
9
34,110
38,704
41,918
Intangible assets . . . . . . . . . . . . . . . . . . . . . . . . . . . . . .
10
470
415
530
Investments . . . . . . . . . . . . . . . . . . . . . . . . . . . . . . . .
11
389
576
780
Deferred taxation . . . . . . . . . . . . . . . . . . . . . . . . . . . . .
12
1,297
1,168
1,012
Current assets . . . . . . . . . . . . . . . . . . . . . . . . . . . . . .
11,010
12,674
10,968
Inventories . . . . . . . . . . . . . . . . . . . . . . . . . . . . . . . . .
13
1,187
861
624
Trade receivables . . . . . . . . . . . . . . . . . . . . . . . . . . . . .
14
5,427
5,852
5,720
Income tax receivable . . . . . . . . . . . . . . . . . . . . . . . . . . .
15
1,259
1,294
1,081
Other financial assets . . . . . . . . . . . . . . . . . . . . . . . . . . .
16
1,184
2,866
2,819
Cash and cash equivalents . . . . . . . . . . . . . . . . . . . . . . . . .
17
1,953
1,801
724
Total assets . . . . . . . . . . . . . . . . . . . . . . . . . . . . . . . .
47,276
53,537
55,208
EQUITY AND LIABILITIES
Capital and reserves . . . . . . . . . . . . . . . . . . . . . . . . . . .
13,350
14,972
16,832
Share capital and premium . . . . . . . . . . . . . . . . . . . . . . . .
18
8,293
8,293
8,293
Share issue expenses . . . . . . . . . . . . . . . . . . . . . . . . . . .
18
(44)
Non-distributable reserves . . . . . . . . . . . . . . . . . . . . . . . . .
19
134
Retained earnings . . . . . . . . . . . . . . . . . . . . . . . . . . . . .
20
5,057
6,679
8,449
Minority interests . . . . . . . . . . . . . . . . . . . . . . . . . . . .
47
116
133
Non-current liabilities . . . . . . . . . . . . . . . . . . . . . . . . . .
19,508
23,002
25,597
Interest bearing debt . . . . . . . . . . . . . . . . . . . . . . . . . . . .
21
15,149
18,991
21,505
Finance leases . . . . . . . . . . . . . . . . . . . . . . . . . . . . . . .
22
779
852
1,028
Deferred taxation . . . . . . . . . . . . . . . . . . . . . . . . . . . . .
12
228
315
463
Provisions . . . . . . . . . . . . . . . . . . . . . . . . . . . . . . . . .
23
3,352
2,844
2,601
Current liabilities . . . . . . . . . . . . . . . . . . . . . . . . . . . .
14,371
15,447
12,646
Trade and other payables . . . . . . . . . . . . . . . . . . . . . . . . .
24
5,882
6,141
7,391
Current portion of interest bearing debt . . . . . . . . . . . . . . . . . .
21
5,320
5,491
2,041
Current portion of finance leases . . . . . . . . . . . . . . . . . . . . .
22
5
Deferred income . . . . . . . . . . . . . . . . . . . . . . . . . . . . . .
970
1,142
958
Income tax payable . . . . . . . . . . . . . . . . . . . . . . . . . . . .
317
499
193
Current portion of provisions . . . . . . . . . . . . . . . . . . . . . . .
23
1,156
1,240
1,236
Credit facilities utilized . . . . . . . . . . . . . . . . . . . . . . . . . .
17
726
934
822
Total equity and liabilities . . . . . . . . . . . . . . . . . . . . . . . .
47,276
53,537
55,208

F51
TELKOM SA LIMITED
CONSOLIDATED STATEMENTS OF CHANGES IN EQUITY
for the three years ended March 31, 2002
Preliminary
Non-
Share
Share
listing
distributable
Retained
capital
premium
costs
reserves
earnings
Total
Rm
Rm
Rm
Rm
Rm
Rm
Balance at April 1, 1999 . . . . . . . .
5,570
2,723
3,862
12,155
Net profit for the year . . . . . . . . .
1,527
1,527
Dividends declared . . . . . . . . . . .
(332)
(332)
Balance at March 31, 2000 . . . . . .
5,570
2,723
5,057
13,350
Net profit for the year . . . . . . . . .
1,622
1,622
Balance at March 31, 2001 . . . . . .
5,570
2,723
6,679
14,972
Adoption of IAS 39 . . . . . . . . . .
45
584
629
Restated balance . . . . . . . . . . . .
5,570
2,723
45
7,263
15,601
Net profit for the year . . . . . . . . .
1,221
1,221
Transfer to non-distributable reserves .
35
(35)
Fair value adjustment . . . . . . . . .
5
5
Foreign currency reserves (net of
tax of R10m) (Note 19) . . . . . . . .
49
49
Share issue expenses (Note 18) . . . .
(44)
(44)
Balance at March 31, 2002 . . . . . .
5,570
2,723
(44)
134
8,449
16,832
F52
TELKOM SA LIMITED
CONSOLIDATED CASH FLOW STATEMENTS
for the three years ended March 31, 2002
2000
2001
2002
Note
Rm
Rm
Rm
Operating activities . . . . . . . . . . . . . . . . . . . . . . . . . .
4,917
6,165
8,171
Cash receipts from customers . . . . . . . . . . . . . . . . . . . . .
26,010
31,072
34,053
Cash paid to suppliers and employees . . . . . . . . . . . . . . . . .
(19,683)
(21,240)
(22,448)
Cash generated from operations . . . . . . . . . . . . . . . . . . . .
29
6,327
9,832
11,605
Income from investments . . . . . . . . . . . . . . . . . . . . . . .
498
582
506
Finance charges paid . . . . . . . . . . . . . . . . . . . . . . . . . .
30
(1,271)
(3,927)
(3,026)
Taxation paid . . . . . . . . . . . . . . . . . . . . . . . . . . . . . .
31
(257)
(322)
(914)
Operating cash flow . . . . . . . . . . . . . . . . . . . . . . . . . .
5,297
6,165
8,171
Dividends paid . . . . . . . . . . . . . . . . . . . . . . . . . . . . .
(380)
Investing activities . . . . . . . . . . . . . . . . . . . . . . . . . .
(9,107)
(9,964)
(9,294)
Expenditure to maintain operations
Proceeds on disposal of property, plant and equipment . . . . . . . .
898
230
139
Proceeds on disposal of subsidiaries and joint ventures . . . . . . .
32
26
13
Additions to property, plant and equipment . . . . . . . . . . . . . .
(9,461)
(9,889)
(9,004)
Intangible assets acquired . . . . . . . . . . . . . . . . . . . . . . .
(5)
(97)
Proceeds on disposal of other investments . . . . . . . . . . . . . .
12
Additions to other investments . . . . . . . . . . . . . . . . . . . .
(255)
(260)
(119)
Expenditure to expand operations
Purchase of subsidiaries and minority interests . . . . . . . . . . . .
33
(410)
(57)
(182)
Disposal of division . . . . . . . . . . . . . . . . . . . . . . . . . .
34
100
Preliminary listing costs . . . . . . . . . . . . . . . . . . . . . . . .
(44)
Financing activities . . . . . . . . . . . . . . . . . . . . . . . . . .
5,051
3,439
110
Loans raised . . . . . . . . . . . . . . . . . . . . . . . . . . . . . .
6,141
9,713
14,286
Loans repaid . . . . . . . . . . . . . . . . . . . . . . . . . . . . . .
(732)
(5,661)
(15,041)
(Increase)/Decrease in interest-bearing investments . . . . . . . . .
(358)
(613)
865
Net increase/(decrease) in net cash and cash equivalents . . . . .
861
(360)
(1,013)
Net cash and cash equivalents at beginning of the year . . . . . .
366
1,227
867
Effect of foreign exchange rate differences . . . . . . . . . . . . .
48
Net cash and cash equivalents at end of the year . . . . . . . . .
17
1,227
867
(98)
F53
TELKOM SA LIMITED
NOTES TO THE CONSOLIDATED FINANCIAL STATEMENTS
for the three years ended March 31, 2002
1.
OVERVIEW OF BUSINESS ACTIVITIES
TELKOM SA LIMITED ("Telkom") is a limited liability company incorporated in the Republic of South Africa ("South Africa").The company, its subsidiaries and joint ventures ("the Group") is the leading provider of fixed-line voice and datacommunications services in South Africa and mobile communications services through Vodacom Group (Proprietary) Limited
("Vodacom") in South Africa and certain other African countries. The Group's services and products include: fixed linetelephony, including domestic, prepaid, international, public payphone and carrier services, as well as enhanced services,
customer premises equipment sales and directory services; mobile telephony through Vodacom; data communications using
fibre connections, including data transmission, data networking and leased lines and related services; and e-commerce,
including internet access service provider, application service provider, hosting, data storage, e-mail and security services.
2.
SIGNIFICANT ACCOUNTING POLICIES
Basis of preparation
Over the recent years a process has been underway to harmonize South African Statements of Generally Accepted Accounting
Practice ("SA GAAP") with International Accounting Standards ("IAS"). At September 30, 2002 that process was essentiallycomplete with there being no material differences in matters of principle between IAS and SA GAAP, there are however
differences in the effective dates of IAS and SA GAAP.
For the accounting periods up to, and including March 2002, the Group has prepared annual financial statements, as required
by the South African Companies Act, in accordance with SA GAAP.
The financial statements are prepared on the historical cost basis, with the exception of financial instruments, which are
measured at fair value, in conformity with IAS. IAS were applied in full for the first time, in these financial statements, as the
primary accounting basis. Where adjustments arising from this change could be reasonably determined, opening retained
earnings for the earliest period presented were accordingly adjusted, with the exception of the adjustment arising on the
adoption of IAS 39, which was accounted for on April 1, 2001.
The preparation of financial statements requires the use of estimates and assumptions that affect the reported amounts of assets
and liabilities and disclosure of contingent assets and liabilities at the date of the financial statements and the reported amounts
of revenue and expenses during the reporting period. Although these estimates are based on management's best knowledge of
current events and actions that the Group may undertake in the future, actual results ultimately may differ from those
estimates.
Basis of consolidation
The consolidated financial statements include those of TELKOM SA LIMITED, its subsidiaries and joint ventures. Joint ventures
are accounted for using the proportionate consolidation method. Non-consolidated subsidiaries and joint ventures are carried at
cost. Intra-Group transactions are eliminated on consolidation. Business combinations are accounted for using the purchase
method of accounting. On acquisition of a subsidiary or joint venture, any excess of the purchase price over the fair value of
the net assets is recognized as goodwill on acquisition. Minority interests are calculated on the fair value of assets and
liabilities.
Intangible assets
Intangible assets, including goodwill, are stated at cost and amortized on a straight-line basis over the anticipated period of
benefit. Amortization commences when the asset is available for its intended use.
The expected useful lives assigned to intangible assets are:
Years
Licences
5 to 20
Goodwill
3 to 20
Trademarks, copyrights and other
3 to 5
Property, plant and equipment
Freehold land is stated at cost and is not depreciated.
F54
TELKOM SA LIMITED
NOTES TO THE CONSOLIDATED FINANCIAL STATEMENTS
for the three years ended March 31, 2002
2.
SIGNIFICANT ACCOUNTING POLICIES (continued)
Property, plant and equipment ("PPE") is stated at historical cost less accumulated depreciation. Depreciation is charged fromthe date of commissioning on a straight-line basis over the estimated useful life. Assets under construction represents software,
network and support equipment and includes all direct expenditure but excludes abnormal wastage.
The expected useful lives assigned to groups of property, plant and equipment are:
Years
Buildings
40 to 50
Buildings held under finance lease
25
Network equipment
Cables
10 to 28
Switching equipment
5 to 15
Transmission equipment
15
Other
2 to 15
Support equipment
5 to 10
Furniture and office equipment
3 to 10
Data processing equipment and software
3 to 5
Other
5 to 10
Repairs and maintenance
The Group expenses all costs associated with the repair and maintenance of its telecommunications network.
Borrowing costs
Financing costs directly associated with the acquisition or construction of assets that require more than three months to
complete and place in service are capitalized at interest rates relating to loans specifically raised for that purpose, or at the
weighted average borrowing rate where the general pool of Group borrowings was utilized. Other borrowing costs are
expensed as incurred.
Inventories
Inventories are stated at the lower of cost, determined on a weighted average basis, or estimated net realisable value.
Impairment of assets
The Group regularly reviews its assets and financial instruments for any indication of impairment. With respect to long lived
assets, the Group recognizes impairment when indicators including changes in technological, market, economic, legal and
operating environments occur and result in changes in the extent to which such assets will be used in the future.
The impairment of network assets is measured using the present value of projected cash flows covering the remaining useful
lives of the network. Impairments of other assets are determined using the net realizable value.
Impairment losses are recognized when the carrying value exceeds the estimated recoverable amount.
Financial instruments
Recognition
All financial instruments are initially recognized at cost, including transaction costs, when the Group becomes a party to their
contractual arrangements. Gains and losses arising on changes in fair value of these instruments are recognized in income in
the period they occur, except for those classified as "available-for-sale" which are taken directly to equity.
Subsequent to initial recognition, financial assets classified as "available-for-sale" are measured at fair value and those
classified as "held to maturity" at amortized cost. Receivables, loans advanced, interest-bearing borrowings and other financial
liabilities are measured at amortized cost where a maturity date exists, or at cost if no maturity date exists. Amortized cost is
calculated on the effective interest rate method.
Fair value adjustments on unlisted investments are made if the value can be determined in terms of IAS 39.
F55
TELKOM SA LIMITED
NOTES TO THE CONSOLIDATED FINANCIAL STATEMENTS
for the three years ended March 31, 2002
2.
SIGNIFICANT ACCOUNTING POLICIES (continued)
Derecognition
On derecognition of a financial asset or liability, the difference between the consideration and the carrying amount on the trade
date is included in income.
Trade and other receivables
Trade receivables are recognized and carried at original invoice amount less an allowance for uncollectables. Based on
historical performance with the fixed-line business, an allowance of 2% is raised for debt outstanding for less than 30 days. For
debts older than 30 days an allowance of 10% is used, increasing to 100% for debts in excess of 120 days. Bad debts are
written-off when the collection process has been exhausted.
The mobile businesses's policy for determining the allowance for doubtful accounts in full (unless arrangements have been
made with the debtors for payment) is as follows:
All amounts outstanding for 120 days and more as well as any specific retailers, dealers or subscribers outstanding for less
than 120 days, where there is deemed to be a significant risk of non-payment. In addition, if accounts receivable balances are
handed over for collection to the legal department, they are written off in full regardless of days outstanding. Hand over to the
legal department is determined on a case by case basis, but usually occurs after amounts have been outstanding for 90 days for
individual subscribers and after 150 days for all other accounts receivables.
Bills of exchange and promissory notes held to maturity are measured at amortized cost using the effective interest rate
method. Those that do not have a fixed maturity are carried at the fair value of the consideration given.
Cash and cash equivalents
Cash and cash equivalents comprise cash on hand, deposits held on call and term deposits with maturity of less than three
months.
Derivative financial instruments
Effective April 1, 2001, all derivative financial instruments are measured at fair value subsequent to initial recognition with
gains and losses taken to income. The fair value of forward exchange contracts is calculated by reference to current forward
exchange rates for contracts with similar maturity profiles. The fair values of interest rate swap contracts are determined as the
difference in the present value of the future net interest cash flows. The fair value of currency swaps is determined with
reference to the present value of expected future cash flows. The Group's derivative transactions, while providing effective
economic hedges under the risk management policies, do not qualify for hedge accounting under the specific rules of IAS 39.
Upon initial application of IAS 39, the Group recorded the fair value of the existing forward contracts on the balance sheet and
the corresponding gain was recognized as an adjustment to the opening balance of retained earnings.
Prior to April 1, 2001, the Group entered into foreign exchange forward contracts to hedge the Group's exposure to
fluctuations in foreign currency exchange rates on specific transactions. Up to March 31, 2001, gains and losses due to changes
in spot rates on forward contracts designated as hedges of identifiable foreign currency firm commitments were deferred and
included in the measurement of the related foreign currency transactions. Gains and losses due to changes in spot rates on
forward contracts designated as hedges of existing assets and liabilities were recorded to the income statement to offset the
currency gain or loss from the instrument being hedged. The portion of the premium paid or received relating to the firm
commitment period was included in the measurement of the basis of the related foreign currency transaction when recorded.
Any remaining premium was amortized over the life of the foreign exchange contract to the income statement. Foreign
exchange contract costs incurred in covering currency loans are expensed over the period of the contract and are included in
finance costs.
Prior to April 1, 2001, the Group entered into interest rate swap agreements in order to manage interest rate exposure. The net
interest paid or received on the swaps was recognized as interest expense.
Prior to April 1, 2001, the Group entered into cross-currency interest rate swap agreements in order to manage exposures to
interest rates and fluctuations in foreign currency exchange rates. The net interest paid or received on the swaps was
recognized as interest expense. Gains and losses due to changes in spot rates on the contracts used for hedging were recorded
to the income statement to offset the currency gain or loss from the instrument being hedged.
F56
TELKOM SA LIMITED
NOTES TO THE CONSOLIDATED FINANCIAL STATEMENTS
for the three years ended March 31, 2002
2.
SIGNIFICANT ACCOUNTING POLICIES (continued)
Sale and buy back transactions
Securities sold under sale and buy back agreements are carried at amortized cost. Associated finance charges are taken to
income.
Securities purchased under sale and buy back agreements are not recognized in the financial statements but a receivable is
raised for the consideration provided. The receivable is classified as a held for trading investment, and is carried at fair value
with adjustments taken to income.
Bridge liquidity transactions
New bonds issued are measured at amortized cost based on the yield to maturity of the new issue.
Bonds are derecognized when the obligation specified in the contract is discharged. The difference between the carrying value
of the bond and the amount paid to extinguish the obligation is included in income.
Bonds issued where Telkom is a buyer and seller of last resort are carried at amortized cost. The Group does not actively trade
in bonds.
Foreign currencies
The functional currency of the Group is the South African Rand.
Transactions denominated in foreign currencies are translated at the rate of exchange at the transaction date. Monetary items
denominated in foreign currencies are translated at the rate of exchange at the balance sheet date. Realized and unrealized
profits and losses on foreign exchange are included in finance charges.
Assets and liabilities of foreign entities are translated at the foreign exchange rates ruling at the balance sheet date. Income,
expenditure and cash flow items are translated at the actual foreign exchange rate or average foreign exchange rates for the
period. Exchange differences on consolidation are classified as part of the foreign currency translation reserve, until disposal of
the investment. Any fair value adjustments arising on the acquisition of a foreign entity are recorded in the Group and
translated at the foreign exchange rates on transaction date.
Deferred taxation
Deferred taxation is accounted for using the balance sheet liability method at current rates in respect of temporary differences.
Deferred tax assets are recognized to the extent that future taxable profits are expected to be available for set-off.
Employee benefits
Short-term employee benefits
The cost of all short-term employee benefits is recognized during the period employees render services.
Leave benefits
Holiday leave is accumulated over the period that the leave accrues and is subject to a cap. Sick leave is accumulated on days
accrued and is also subject to a cap.
Post-employment benefits
The Group provides defined benefit and defined contribution plans for the benefit of employees. These plans are funded by the
employees and the Group, taking into account recommendations of the independent actuaries. The post-retirement medical
liability is unfunded.
Defined contribution plans
The Group's funding of the defined contribution plans is charged to the income statement in the same period as the related
service is provided.
Defined benefit plans
The Group provides defined benefit plans for pension, medical aid costs, and telephone rebates to qualifying employees. The
Group's net obligation in respect of defined benefits is calculated separately for each plan by estimating the amount of future
benefits earned in return for services rendered.
F57
TELKOM SA LIMITED
NOTES TO THE CONSOLIDATED FINANCIAL STATEMENTS
for the three years ended March 31, 2002
2.
SIGNIFICANT ACCOUNTING POLICIES (continued)
The amount recognized in the balance sheet represents the present value of the defined benefit obligations, calculated using the
projected unit credit method, as adjusted for unrecognized actuarial gains and losses, unrecognized past service costs and
reduced by the fair value of plan assets. The amount of any surplus recognized is limited to unrecognized actuarial losses and
past service costs plus the present value of available refunds and reductions in future contributions to the plan. To the extent
that there is uncertainty as to the entitlement to the surplus, no asset is recognized.
Actuarial gains and losses are recognized as income or expense when the cumulative unrecognized gains and losses for each
individual plan exceed 10% of the greater of the present value of the Group's obligation or the fair value of plan assets. These
gains or losses are amortized on a straight line basis over ten years.
Past service costs are recognized immediately to the extent that the benefits are vested, otherwise they are recognized on a
straight line basis over the average period the benefits become vested.
Termination benefits
Termination benefits are payable when employment is terminated before the normal retirement age or when an employee
accepts voluntary redundancy in exchange for benefits. Termination benefits are accounted for in terms of the policy for
provisions.
Provisions
Provisions are recognized when, and only when, the Group has a present obligation (legal or constructive) as a result of a past
event and it is probable (i.e. more likely than not) that an outflow of resources will be required to settle the obligation, and a
reliable estimate can be made of the amount of the obligation. Provisions are reviewed at each balance sheet date and adjusted
to reflect the current best estimate. Where the effect of time value of money is material, the amount of a provision is the
present value of the expenditures expected to be required to settle the obligation.
Revenue
Revenue for services is stated at amounts invoiced to customers and excludes Value-Added Tax.
The Group provides fixed-line communication services, mobile communication services, directory services and
communication-related products. The Group provides such services to business, residential, payphone and mobile customers.
Revenue, which excludes Value-Added Tax, represents the value of fixed consideration that has been received or is receivable.
Revenue is recognized when there is evidence of an arrangement, collectability is reasonably assured, and the delivery of the
product or service has occurred. In certain circumstances revenue is split into separately identifiable components and recognized
when the related components are delivered in order to reflect the substance of the transaction. The value of components is
determined using verifiable objective evidence. The Group does not provide customers with the right to a refund.
Products and services
Subscriptions
The Group provides telephone and data communication services under postpaid and prepaid payment arrangements. Revenue
includes fees for installation and activation. Installation and activation-related fees are recognized as revenue upon activation.
Costs incurred on first time installations that form an integral part of the network are capitalized and depreciated over the life
of the network. All other installation and activation costs are expensed as incurred.
Postpaid and prepaid service arrangements include subscription fees, typically monthly fees, which are recognized over the
subscription period on a pro rata basis. The terms and conditions of certain products allow the carry over of unused minutes;
revenue related to the carry over of unused minutes is deferred until usage or expiration.
Airtime, traffic and value-added services
Prepaid service revenue collected in advance is deferred and recognized based on actual usage or upon expiration of the usage
period or whatever comes first. Payphone service revenue is recognized when the service is provided. Community phone
revenue collected in advance is deferred and recognized based on actual usage or upon expiration of the usage period.
Interconnection revenue for call termination, call transit, and network usage are recognized in the period the traffic occurs.
Revenue related to local, long distance, network-to-network, roaming and international call connection services is recognized
when the call is placed or the connection provided. Revenue related to products and value-added services is recognized upon
delivery of the product or service.
F58
TELKOM SA LIMITED
NOTES TO THE CONSOLIDATED FINANCIAL STATEMENTS
for the three years ended March 31, 2002
2.
SIGNIFICANT ACCOUNTING POLICIES (continued)
Telkom provides incentives to its retail payphone card distributors as trade discounts. Incentives are based on sales volume and
value. Revenue for retail payphone cards is recorded as traffic revenues, net of these discounts as the cards are used.
Equipment sales
Sales of communication equipment are recognized upon delivery to the customer.
Directory services
Revenue related to published directory services is recognized on a pro rata basis over the period in which the publication
expires, which is generally 12 months. Telephone-based directory service revenue is recognized when the service is provided.
Other
Dividends from investments are recognized on the date that the dividend is declared. Interest is recognized on a time
proportion basis taking into account the principal amount outstanding and the effective interest rate.
Incentives
Vodacom pays incentives to service providers and dealers for new activations, retention of existing customers and reaching
specified sales targets. These incentives are expensed as incurred.
Vodacom also pays distribution incentives to service providers and dealers for exclusivity, distribution assets and distribution
subsidies, which are deferred and expensed over the contractual relationship period.
Leases
Operating lease payments are recognised as an expense in the income statement on a straight-line basis over the lease term.
Assets acquired in terms of finance leases are capitalized at the lower of fair value or the present value of the minimum lease
payments at inception of the lease and depreciated over the lesser of the useful life of the asset or the lease term. Lease finance
costs are charged against income over the term of the lease using the effective interest rate method.
Segmental reporting
The Group is managed in two business segments: Fixed-line and Mobile. The basis of segment reporting is representative of
the Group's internal reporting structure, which is in accordance with International Accounting Standards. The Group's two
segments operate mainly in South Africa but the mobile segment has businesses in certain other African countries.
The Fixed-line business segment provides local telephony, domestic and international long distance services as well as leased
lines, data transmission, directory services and internet access.
The Mobile business segment provides mobile telephony services as well as the sale of mobile equipment.
Inter-segment sales are accounted for in the same way as sales to third parties at current market prices.
Marketing
Marketing costs are recognized as an expense as incurred.
F59
TELKOM SA LIMITED
NOTES TO THE CONSOLIDATED FINANCIAL STATEMENTS
for the three years ended March 31, 2002
2000
2001
2002
Rm
Rm
Rm
3.
OPERATING REVENUE
27,113
31,352
34,197
Operating revenue
Fixed line . . . . . . . . . . . . . . . . . . . . . . . . . . . . . . . . . . . .
23,530
26,100
27,606
Mobile . . . . . . . . . . . . . . . . . . . . . . . . . . . . . . . . . . . . .
3,583
5,252
6,591
Fixed line . . . . . . . . . . . . . . . . . . . . . . . . . . . . . . . . . . . .
23,530
26,100
27,606
Subscriptions, connections and other usage . . . . . . . . . . . . . . . . . .
4,085
4,197
4,410
Traffic . . . . . . . . . . . . . . . . . . . . . . . . . . . . . . . . . . . . . .
14,991
16,409
17,168
Domestic (local and long distance) . . . . . . . . . . . . . . . . . . . . .
8,153
8,280
8,670
Fixed-to-mobile . . . . . . . . . . . . . . . . . . . . . . . . . . . . . . .
5,325
6,845
7,323
International (outgoing) . . . . . . . . . . . . . . . . . . . . . . . . . . .
1,513
1,284
1,175
Interconnection . . . . . . . . . . . . . . . . . . . . . . . . . . . . . . . . .
1,228
1,706
1,645
Data . . . . . . . . . . . . . . . . . . . . . . . . . . . . . . . . . . . . . . .
2,602
3,150
3,729
Directories and other . . . . . . . . . . . . . . . . . . . . . . . . . . . . . .
624
638
654
4.
OPERATING EXPENSES
23,231
26,427
29,984
Operating expenses comprise:
Employee expenses . . . . . . . . . . . . . . . . . . . . . . . . . . . . . .
7,713
6,590
7,166
Salaries and wages . . . . . . . . . . . . . . . . . . . . . . . . . . . . . . .
4,062
3,691
3,731
Pension and retirement funds . . . . . . . . . . . . . . . . . . . . . . . . . .
129
128
81
Interest cost . . . . . . . . . . . . . . . . . . . . . . . . . . . . . . . . .
129
128
119
Curtailment gain . . . . . . . . . . . . . . . . . . . . . . . . . . . . . . .
(38)
Defined contribution expense . . . . . . . . . . . . . . . . . . . . . . . . . .
486
468
505
Post-retirement medical aid . . . . . . . . . . . . . . . . . . . . . . . . . .
354
(27)
228
Current service cost . . . . . . . . . . . . . . . . . . . . . . . . . . . . .
42
50
14
Interest cost . . . . . . . . . . . . . . . . . . . . . . . . . . . . . . . . .
266
348
224
Actuarial loss/(gain) . . . . . . . . . . . . . . . . . . . . . . . . . . . . .
15
(16)
(5)
Settlement (gain)/loss . . . . . . . . . . . . . . . . . . . . . . . . . . . .
(86)
11
Curtailment loss/(gain) . . . . . . . . . . . . . . . . . . . . . . . . . . . .
31
(323)
(16)
Medical aid contributions . . . . . . . . . . . . . . . . . . . . . . . . . . . .
248
383
379
Sick leave and telephone rebates . . . . . . . . . . . . . . . . . . . . . . . .
135
12
(5)
Current service cost/(gain) . . . . . . . . . . . . . . . . . . . . . . . . . .
126
3
(15)
Interest cost . . . . . . . . . . . . . . . . . . . . . . . . . . . . . . . . .
9
9
10
Other benefits . . . . . . . . . . . . . . . . . . . . . . . . . . . . . . . . . .
1,996
1,803
1,874
Restructuring expense . . . . . . . . . . . . . . . . . . . . . . . . . . . . .
303
132
373
Curtailment loss/(gain)
The curtailment loss/(gain) resulted from a material reduction in the number of
employees covered by the defined benefit plan, as well as a change in benefit
under the plan. This, in turn, resulted in a required adjustment to the present
value of the obligation.
Settlement (gain)/loss
The settlement (gain)/loss resulted from a transaction between the group and
members of the defined benefit plan. The members were offered a lump sum in
exchange for their right to receive specified post-employment benefits.
Payments to other operators . . . . . . . . . . . . . . . . . . . . . . . . . .
4,241
4,983
5,762

F60
TELKOM SA LIMITED
NOTES TO THE CONSOLIDATED FINANCIAL STATEMENTS
for the three years ended March 31, 2002
2000
2001
2002
Rm
Rm
Rm
4.
OPERATING EXPENSES (continued)
Selling, general and administrative expenses . . . . . . . . . . . . . . . .
5,324
6,971
8,237
Selling and administrative expenses . . . . . . . . . . . . . . . . . . . . . .
3,170
4,053
4,995
Maintenance . . . . . . . . . . . . . . . . . . . . . . . . . . . . . . . . . .
2,065
2,076
2,202
Marketing . . . . . . . . . . . . . . . . . . . . . . . . . . . . . . . . . . . .
582
592
617
Property, plant and equipment impairment losses (Note 9) . . . . . . . . . .
279
445
Impairment provisions raised . . . . . . . . . . . . . . . . . . . . . . . .
119
398
Write-offs . . . . . . . . . . . . . . . . . . . . . . . . . . . . . . . . . .
160
47
Profit on disposal of property, plant and equipment . . . . . . . . . . . . . .
(493)
(29)
(22)
Services rendered . . . . . . . . . . . . . . . . . . . . . . . . . . . . . . .
1,439
1,539
2,194
Facilities management, security and other . . . . . . . . . . . . . . . . . . .
984
1,222
1,786
Consultancy services . . . . . . . . . . . . . . . . . . . . . . . . . . . . . .
445
290
382
Auditors' remuneration . . . . . . . . . . . . . . . . . . . . . . . . . . . . .
10
27
26
Audit fees . . . . . . . . . . . . . . . . . . . . . . . . . . . . . . . . . .
8
13
15
Other . . . . . . . . . . . . . . . . . . . . . . . . . . . . . . . . . . . . .
2
14
11
Operating leases . . . . . . . . . . . . . . . . . . . . . . . . . . . . . . . .
340
1,292
1,217
Buildings . . . . . . . . . . . . . . . . . . . . . . . . . . . . . . . . . . . .
239
297
316
Transmission and data lines . . . . . . . . . . . . . . . . . . . . . . . . . .
7
5
Equipment . . . . . . . . . . . . . . . . . . . . . . . . . . . . . . . . . . .
54
56
59
Vehicles . . . . . . . . . . . . . . . . . . . . . . . . . . . . . . . . . . . . .
40
934
842
Depreciation of property, plant and equipment . . . . . . . . . . . . . . .
4,138
4,920
5,283
Freehold buildings . . . . . . . . . . . . . . . . . . . . . . . . . . . . . . .
155
197
190
Leasehold buildings . . . . . . . . . . . . . . . . . . . . . . . . . . . . . .
20
20
22
Network equipment . . . . . . . . . . . . . . . . . . . . . . . . . . . . . . .
2,766
3,367
3,324
Support equipment . . . . . . . . . . . . . . . . . . . . . . . . . . . . . . .
309
406
365
Furniture and office equipment . . . . . . . . . . . . . . . . . . . . . . . . .
27
34
44
Data processing equipment and software . . . . . . . . . . . . . . . . . . .
678
817
1,262
Other . . . . . . . . . . . . . . . . . . . . . . . . . . . . . . . . . . . . . .
183
79
76
Amortization of intangible assets . . . . . . . . . . . . . . . . . . . . . .
36
132
125
Goodwill . . . . . . . . . . . . . . . . . . . . . . . . . . . . . . . . . . . .
18
75
66
Trademarks, copyrights and other . . . . . . . . . . . . . . . . . . . . . . .
16
55
53
Licenses . . . . . . . . . . . . . . . . . . . . . . . . . . . . . . . . . . . . .
2
2
6
5.
INVESTMENT INCOME
641
617
490
6.
FINANCE CHARGES
2,482
3,137
2,550
Interest payable and loan discount amortized . . . . . . . . . . . . . . .
2,107
2,560
2,550
Local loans . . . . . . . . . . . . . . . . . . . . . . . . . . . . . . . . . . .
2,342
2,173
2,690
Foreign loans . . . . . . . . . . . . . . . . . . . . . . . . . . . . . . . . . .
137
559
599
Less: Finance costs capitalized . . . . . . . . . . . . . . . . . . . . . . . . .
(332)
(160)
(104)
Foreign exchange (gains)/losses . . . . . . . . . . . . . . . . . . . . . . . .
(40)
(12)
2,401
Fair value adjustments on derivative instruments . . . . . . . . . . . . . . .
(3,036)
Hedging costs . . . . . . . . . . . . . . . . . . . . . . . . . . . . . . . . .
375
577
Capitalization rate . . . . . . . . . . . . . . . . . . . . . . . . . . . . . . .
14.48%
13.01%
13.48%
F61
TELKOM SA LIMITED
NOTES TO THE CONSOLIDATED FINANCIAL STATEMENTS
for the three years ended March 31, 2002
2000
2001
2002
Rm
Rm
Rm
7.
TAXATION . . . . . . . . . . . . . . . . . . . . . . . . . . . . . . . . .
501
715
873
South African normal company taxation . . . . . . . . . . . . . . . .
318
470
787
Current tax . . . . . . . . . . . . . . . . . . . . . . . . . . . . . . . .
317
471
581
Underprovision/(overprovision) based on assessment . . . . . . . . . .
1
(1)
206
Deferred taxation . . . . . . . . . . . . . . . . . . . . . . . . . . . . .
132
214
48
Current . . . . . . . . . . . . . . . . . . . . . . . . . . . . . . . . . .
138
224
326
Overprovision for prior year based on assessment . . . . . . . . . . . .
(6)
(10)
(278)
Secondary Tax on Companies . . . . . . . . . . . . . . . . . . . . . . .
50
29
37
Foreign tax . . . . . . . . . . . . . . . . . . . . . . . . . . . . . . . . .
1
2
1
Reconciliation of taxation rate . . . . . . . . . . . . . . . . . . . . . .
%
%
%
Effective rate . . . . . . . . . . . . . . . . . . . . . . . . . . . . . . . .
24.5
29.8
40.5
South African normal rate of taxation . . . . . . . . . . . . . . . . . . .
30.0
30.0
30.0
Adjusted for: . . . . . . . . . . . . . . . . . . . . . . . . . . . . . . . .
(5.5)
(0.2)
10.5
Exempt income . . . . . . . . . . . . . . . . . . . . . . . . . . . . . . .
(24.1)
(15.5)
0.1
Disallowable expenditure . . . . . . . . . . . . . . . . . . . . . . . . . .
16.5
13.2
12.3
Temporary differences in joint venture . . . . . . . . . . . . . . . . . . .
(0.6)
(0.2)
(0.4)
Tax losses not utilized . . . . . . . . . . . . . . . . . . . . . . . . . . . .
1.0
1.1
Secondary Tax on Companies . . . . . . . . . . . . . . . . . . . . . . .
2.5
1.3
1.7
Underprovision for prior years . . . . . . . . . . . . . . . . . . . . . . .
(0.8)
(0.1)
(3.2)
The change in the effective rate for 2002 was primarily due to non-deductible losses relative to a supplier dispute, and the
change in tax regime whereby certain income was no longer exempt from tax.
8.
EARNINGS AND DIVIDEND PER SHARE
Basic and diluted earnings per share
The calculation of earnings per share is based on net profit for the year (earnings) of Rm 1,221 (2001: Rm 1,622, 2000:
Rm 1,527) and ordinary shares in issue of 557,031,819 (2001: 557,031,819, 2000: 557,031,819).
Dividend per share
The calculation of the dividend per ordinary share is based on a declared ordinary dividend of R Nil (2001: R Nil, 2000:
Rm 332) and 557,031,819 (2001: 557,031,819, 2000: 557,031,819) ordinary shares issued.
2000
2001
2002
Rm
Rm
Rm
Basic and diluted earnings per share (cents) . . . . . . . . . . . . . . . . .
274.1
291.2
219.2
Dividend per share (cents) . . . . . . . . . . . . . . . . . . . . . . . . . . .
59.6

F62
TELKOM SA LIMITED
NOTES TO THE CONSOLIDATED FINANCIAL STATEMENTS
for the three years ended March 31, 2002
9.
PROPERTY, PLANT AND EQUIPMENT
2002
2001
Accumulated
Carrying
Accumulated
Carrying
Cost
depreciation
value
Cost
depreciation
value
Rm
Rm
Rm
Rm
Rm
Rm
Freehold land and buildings . . . . .
3,548
(829)
2,719
3,226
(641)
2,585
Leasehold buildings . . . . . . . . .
758
(141)
617
608
(120)
488
Network equipment . . . . . . . . .
50,448
(20,032)
30,416
46,904
(19,348)
27,556
Support equipment . . . . . . . . . .
3,090
(1,634)
1,456
2,874
(1,432)
1,442
Furniture and office equipment . . .
392
(167)
225
333
(125)
208
Data processing equipment and
software . . . . . . . . . . . . . . .
7,217
(3,677)
3,540
6,513
(2,748)
3,765
Under construction . . . . . . . . . .
2,700
2,700
2,408
2,408
Other . . . . . . . . . . . . . . . . .
496
(251)
245
556
(304)
252
68,649
(26,731)
41,918
63,422
(24,718)
38,704
2000
Accumulated
Carrying
Cost
depreciation
value
Rm
Rm
Rm
Freehold land and buildings . . . . . . . . . . . . . . . . . . . . . . . . . . . .
2,714
(448)
2,266
Leasehold buildings . . . . . . . . . . . . . . . . . . . . . . . . . . . . . . . .
570
(102)
468
Network equipment . . . . . . . . . . . . . . . . . . . . . . . . . . . . . . . .
39,709
(16,232)
23,477
Support equipment . . . . . . . . . . . . . . . . . . . . . . . . . . . . . . . . .
2,342
(1,035)
1,307
Furniture and office equipment . . . . . . . . . . . . . . . . . . . . . . . . . .
286
(84)
202
Data processing equipment and software . . . . . . . . . . . . . . . . . . . . .
5,098
(2,186)
2,912
Under construction . . . . . . . . . . . . . . . . . . . . . . . . . . . . . . . . .
3,229
3,229
Other . . . . . . . . . . . . . . . . . . . . . . . . . . . . . . . . . . . . . . . .
450
(201)
249
54,398
(20,288)
34,110
Carrying
Foreign
Carrying
value at
currency Impairment
value at
beginning
translation
and
Deprecia-
end of
of year
Additions
Transfers
reserve
write-offs
Disposals
tion
year
Rm
Rm
Rm
Rm
Rm
Rm
Rm
Rm
2002
Freehold land and
buildings . . . . . . .
2,585
1
324
(1)
(190)
2,719
Leasehold buildings .
488
47
104
(22)
617
Network equipment .
27,556
1,719
4,479
65
(12)
(67)
(3,324)
30,416
Support equipment .
1,442
379
(365)
1,456
Furniture and office
equipment . . . . . .
208
67
(6)
(44)
225
Data processing
equipment and
software . . . . . . .
3,765
337
935
(219)
(16)
(1,262)
3,540
Under construction .
2,408
6,727
(6,221)
(214)
2,700
Other . . . . . . . .
252
106
1
(38)
(76)
245
38,704
9,004
66
(445)
(128)
(5,283)
41,918

F63
TELKOM SA LIMITED
NOTES TO THE CONSOLIDATED FINANCIAL STATEMENTS
for the three years ended March 31, 2002
9.
PROPERTY, PLANT AND EQUIPMENT (continued)
Carrying
Carrying
value at
Business
Impairment
value at
beginning
combina-
and
Deprecia-
end of
of year
Additions
tions
Transfers
write-offs
Disposals
tion
year
Rm
Rm
Rm
Rm
Rm
Rm
Rm
Rm
2001
Freehold land and
buildings . . . . . . .
2,266
536
(20)
(197)
2,585
Leasehold buildings .
468
55
(15)
(20)
488
Network equipment .
23,477
1,235
116
6,269
(160)
(14)
(3,367)
27,556
Support equipment .
1,307
85
463
(7)
(406)
1,442
Furniture and office
equipment . . . . . .
202
18
29
(7)
(34)
208
Data processing
equipment and
software . . . . . . .
2,912
224
1,482
(36)
(817)
3,765
Under construction .
3,229
8,181
(8,811)
(119)
(72)
2,408
Other . . . . . . . .
249
91
32
(41)
(79)
252
34,110
9,889
116
(279)
(212)
(4,920)
38,704
Carrying
Carrying
value at
value at
beginning
Business
Deprecia-
end of
of year
Additions combinations
Transfers
Disposals
tion
year
Rm
Rm
Rm
Rm
Rm
Rm
Rm
2000
Freehold land and buildings . .
1,557
8
856
(155)
2,266
Leasehold buildings . . . . . .
493
3
(8)
(20)
468
Network equipment . . . . . . .
20,219
409
5,708
(93)
(2,766)
23,477
Support equipment . . . . . . .
980
61
575
(309)
1,307
Furniture and office equipment .
181
7
49
(8)
(27)
202
Data processing equipment and
software . . . . . . . . . . . . .
1,928
158
1,520
(16)
(678)
2,912
Under construction . . . . . . .
3,229
8,760
(8,760)
3,229
Other . . . . . . . . . . . . . .
598
55
18
52
(291)
(183)
249
29,185
9,461
18
(416)
(4,138)
34,110
F64
TELKOM SA LIMITED
NOTES TO THE CONSOLIDATED FINANCIAL STATEMENTS
for the three years ended March 31, 2002
9.
PROPERTY, PLANT AND EQUIPMENT (continued)
2000
2001
2002
Rm
Rm
Rm
The average time taken to construct assets varies between three and four months.
Impairment and write-off of assets . . . . . . . . . . . . . . . . . . . . .
279
445
Assets under construction . . . . . . . . . . . . . . . . . . . . . . . . . . .
119
214
Assets relating to information technology development that, due to a
supplier dispute, are not re-usable, have been impaired in full . . . . . . .
119
179
Certain information technology support system development found not to
be economically viable, resulted in a full write-off . . . . . . . . . . . . .
35
Data processing equipment and software . . . . . . . . . . . . . . . . . . .
219
Assets relating to information technology development that, due to a
supplier dispute, are not re-usable, have been impaired in full . . . . . . .
167
The Group implemented a new billing system during 2002. The carrying
value of the previous billing system was impaired in full . . . . . . . . . .
52
Network equipment
Network equipment written-off in full . . . . . . . . . . . . . . . . . . . .
160
12
10. INTANGIBLE ASSETS
2002
2001
Accumulated
Carrying
Accumulated
Carrying
Cost
amortization
value
Cost
amortization
value
Rm
Rm
Rm
Rm
Rm
Rm
Goodwill . . . . . . . . . . . . .
493
(185)
308
299
(119)
180
Trademarks, copyrights and other
274
(127)
147
277
(74)
203
Licences . . . . . . . . . . . . .
104
(29)
75
54
(22)
32
871
(341)
530
630
(215)
415
2000
Accumulated
Carrying
Cost
amortization
value
Rm
Rm
Rm
Goodwill . . . . . . . . . . . . . . . . . . . . . . . . . . . . . . . . . . . . . .
231
(44)
187
Trademarks, copyrights and other . . . . . . . . . . . . . . . . . . . . . . . . .
270
(19)
251
Licences . . . . . . . . . . . . . . . . . . . . . . . . . . . . . . . . . . . . . .
52
(20)
32
553
(83)
470

F65
TELKOM SA LIMITED
NOTES TO THE CONSOLIDATED FINANCIAL STATEMENTS
for the three years ended March 31, 2002
10. INTANGIBLE ASSETS (continued)
The carrying amounts of intangible assets can be reconciled as follows:
Carrying
Foreign
value at
currency
Carrying
beginning
translation
value at
of year
Additions
Disposals
reserve
Amortization
end of year
Rm
Rm
Rm
Rm
Rm
Rm
2002
Goodwill . . . . . . . . . .
180
194
(66)
308
Trademarks, copyrights and
other . . . . . . . . . . . . .
203
(3)
(53)
147
Licences . . . . . . . . . . .
32
48
(8)
9
(6)
75
415
242
(11)
9
(125)
530
Carrying
value at
Carrying
beginning
Business
value at
of year
combinations
Amortization
end of year
Rm
Rm
Rm
Rm
2001
Goodwill . . . . . . . . . . . . . . . . . . . . . . . . . . . .
187
68
(75)
180
Trademarks, copyrights and other . . . . . . . . . . . . . . .
251
7
(55)
203
Licences . . . . . . . . . . . . . . . . . . . . . . . . . . . . .
32
2
(2)
32
470
77
(132)
415
Carrying
value at
Carrying
beginning
Business
value at
of year
Additions
combinations
Amortization
end of year
Rm
Rm
Rm
Rm
Rm
2000
Goodwill . . . . . . . . . . . . . . . . . . .
31
174
(18)
187
Trademarks, copyrights and other . . . . . .
29
4
234
(16)
251
Licences . . . . . . . . . . . . . . . . . . . .
33
1
(2)
32
93
5
408
(36)
470
F66
TELKOM SA LIMITED
NOTES TO THE CONSOLIDATED FINANCIAL STATEMENTS
for the three years ended March 31, 2002
2000
2001
2002
Rm
Rm
Rm
11. INVESTMENTS . . . . . . . . . . . . . . . . . . . . . . . . . . . . . . . . . .
389
576
780
Participating interests
Unlisted . . . . . . . . . . . . . . . . . . . . . . . . . . . . . . . . . . . . . . .
114
102
102
Intelsat
1.158069% (2001: 1.160425%, 2000: 1.161013%) share in International
Telecommunications Satellite Organisation, headquartered in
Washington DC, USA at cost . . . . . . . . . . . . . . . . . . . . . . . . . . . .
104
92
92
Directors' valuation: R264.4 million (2001: R152.3 million, 2000: R118.6 million)
Inmarsat
0.30186% (2001: 0.30186%, 2000: 0.30186%) share in International Mobile
Satellite Services Organisation, headquartered in London, United Kingdom,
at cost. . . . . . . . . . . . . . . . . . . . . . . . . . . . . . . . . . . . . . . . .
9
9
9
Directors' valuation: R26.4 million (2001: R17.8 million, 2000: R13.1million)
Rascom
1.180595% (2001: 1.530%, 2000: 3.280705%) share in Regional African Satellite
Communications Organisation, headquartered in Abidjan, Ivory Coast, at cost . .
1
1
1
Directors' valuation: R1.8 million (2001: R1.8 million, 2000: R1.5 million).
A reliable fair value could not be determined for unlisted investments. The
directors' valuations are based on the Group's interest in the entities' net asset
values translated at year-end exchange rates.
Investment initially held for disposal . . . . . . . . . . . . . . . . . . . . . . . .
61
Film Fun Holdings (Proprietary) Limited
100% shareholding, at cost . . . . . . . . . . . . . . . . . . . . . . . . . . . . .
26
Loans granted . . . . . . . . . . . . . . . . . . . . . . . . . . . . . . . . . . . .
35
Film Fun Holdings (Proprietary) Limited was not consolidated in Group results as
they were acquired with a view to disposal in 2000.
Joint ventures . . . . . . . . . . . . . . . . . . . . . . . . . . . . . . . . . . . .
2
Vodacom World Online
Joint venture loan . . . . . . . . . . . . . . . . . . . . . . . . . . . . . . . . . .
2
Listed . . . . . . . . . . . . . . . . . . . . . . . . . . . . . . . . . . . . . . . .
27
27
77
New Skies N.V.
0.889184% (2001: 1.157712%, 2000: 1.157712%) share in New Skies
Satellite N.V., headquartered in The Hague, Netherlands at fair value
(2001 and 2000, at cost) . . . . . . . . . . . . . . . . . . . . . . . . . . . . . . .
27
27
77
Market value: R77.0 million (2001: R72.0 million, 2000: Directors' valuation
R54.8 million).
Other investments
Cost and valuation . . . . . . . . . . . . . . . . . . . . . . . . . . . . . . . . . .
185
447
601
Linked insurance policies Coronation fund manager . . . . . . . . . . . . . . .
211
Linked insurance policies Investec fund manager . . . . . . . . . . . . . . . . .
33
Ordinary shares Listed Investec fund manager . . . . . . . . . . . . . . . . .
75
Other money markets . . . . . . . . . . . . . . . . . . . . . . . . . . . . . . . .
240
Government stock . . . . . . . . . . . . . . . . . . . . . . . . . . . . . . . . . .
1
Unlisted . . . . . . . . . . . . . . . . . . . . . . . . . . . . . . . . . . . . . . .
185
447
41
Included in other investments is R560m (2001: R440m, 2000: R180m) that will be used to fund the post-retirement medical
aid liability. These investments have been made through a cell captive that has been consolidated in full.
F67
TELKOM SA LIMITED
NOTES TO THE CONSOLIDATED FINANCIAL STATEMENTS
for the three years ended March 31, 2002
2000
2001
2002
Rm
Rm
Rm
12. DEFERRED TAXATION
1,069
853
549
Balance at beginning of year . . . . . . . . . . . . . . . . . . . . . . . . . . .
1,201
1,069
853
Adoption of IAS 39 . . . . . . . . . . . . . . . . . . . . . . . . . . . . . . . .
(250)
Income statement movements . . . . . . . . . . . . . . . . . . . . . . . . . .
(132)
(216)
(48)
Temporary differences . . . . . . . . . . . . . . . . . . . . . . . . . . . . . .
(138)
(224)
(326)
Underprovision prior year based on assessment . . . . . . . . . . . . . . . .
6
8
278
Foreign equity revaluation . . . . . . . . . . . . . . . . . . . . . . . . . . . .
(6)
The balance comprises: . . . . . . . . . . . . . . . . . . . . . . . . . . . . . .
1,069
853
549
Capital allowances . . . . . . . . . . . . . . . . . . . . . . . . . . . . . . . . .
(371)
(786)
(1,579)
Provisions and allowances . . . . . . . . . . . . . . . . . . . . . . . . . . . . .
774
601
806
Tax losses . . . . . . . . . . . . . . . . . . . . . . . . . . . . . . . . . . . . . .
666
1,038
1,322
Deferred tax balance is made up as follows: . . . . . . . . . . . . . . . . . .
1,069
853
549
Deferred tax assets . . . . . . . . . . . . . . . . . . . . . . . . . . . . . . . . .
1,297
1,168
1,012
Deferred tax liabilities . . . . . . . . . . . . . . . . . . . . . . . . . . . . . . .
(228)
(315)
(463)
Tax losses available for set-off against future taxable profits . . . . . . . . .
2,394
3,719
4,637
Under South African tax legislation, tax losses for companies continuing to
do business, do not expire.
13. INVENTORIES . . . . . . . . . . . . . . . . . . . . . . . . . . . . . . . . . .
1,187
861
624
Installation and maintenance material . . . . . . . . . . . . . . . . . . . . . . .
895
532
336
Network equipment . . . . . . . . . . . . . . . . . . . . . . . . . . . . . . . .
135
62
49
Merchandise . . . . . . . . . . . . . . . . . . . . . . . . . . . . . . . . . . . .
157
267
239
14. TRADE RECEIVABLES . . . . . . . . . . . . . . . . . . . . . . . . . . . . .
5,427
5,852
5,720
Trade debtors . . . . . . . . . . . . . . . . . . . . . . . . . . . . . . . . . . . .
5,078
4,857
4,858
Gross trade debtors . . . . . . . . . . . . . . . . . . . . . . . . . . . . . . . . .
5,624
5,343
5,501
Provision for doubtful debts . . . . . . . . . . . . . . . . . . . . . . . . . . . .
(546)
(486)
(643)
Prepayments . . . . . . . . . . . . . . . . . . . . . . . . . . . . . . . . . . . .
347
607
695
Other receivables . . . . . . . . . . . . . . . . . . . . . . . . . . . . . . . . . .
2
388
167
F68
TELKOM SA LIMITED
NOTES TO THE CONSOLIDATED FINANCIAL STATEMENTS
for the three years ended March 31, 2002
2000
2001
2002
Rm
Rm
Rm
15. INCOME TAX RECEIVABLE . . . . . . . . . . . . . . . . . . . . . . . . .
1,259
1,294
1,081
Tax receivable . . . . . . . . . . . . . . . . . . . . . . . . . . . . . . . . . . .
1,116
1,116
899
Interest accrued . . . . . . . . . . . . . . . . . . . . . . . . . . . . . . . . . . .
143
178
182
Income tax receivable relates to an over-payment of estimated tax in respect of
the 1998 and 1999 tax years. A refund of R844 million was received subsequent
to year-end.
16. OTHER FINANCIAL ASSETS . . . . . . . . . . . . . . . . . . . . . . . . .
1,184
2,866
2,819
Repurchase agreements . . . . . . . . . . . . . . . . . . . . . . . . . . . . . .
276
782
100
Bills of exchange . . . . . . . . . . . . . . . . . . . . . . . . . . . . . . . . . .
86
193
10
Derivative instruments (Note 27) . . . . . . . . . . . . . . . . . . . . . . . . .
822
1,891
2,709
Repurchase agreements
The Group actively manages a portfolio of sale and buy back repurchase
agreements in the South African capital and money markets, with a view to
generating additional investment income on the favourable interest rates provided
on these transactions. Interest received from the borrower is based on the
current market-related yield required for South African Government and
Telkom bonds.
2002
Maturity period
Yield
7 days
13.30% . . . . . . . . . . . . . . . . . . . .
46
5 days
13.02% - 13.30% . . . . . . . . . . . . . . .
54
. . . . . . . . . . . . . . . . . . . . . . . .
100
2001
Maturity period
Yield
7 days
11.30% - 12.40% . . . . . . . . . . . . . . .
348
3 days
11.92% - 13.30% . . . . . . . . . . . . . . .
434
. . . . . . . . . . . . . . . . . . . . . . . .
782
2000
Maturity period
Yield
3 days
13.43% - 14.26% . . . . . . . . . . . . . . .
276
Due to the short-term nature of these transactions and the fact that the transactions are initiated based on market-related
interest rates, the carrying value approximates the fair value. Collateral in the form of publicly tradable bonds has been
delivered in respect of the above transactions.
The terms and conditions of these transactions are governed by signed International Securities Market Association ("ISMA")agreements with all counter parties and the regulations of the Bond Exchange of South Africa ("BESA").The fair value of such bonds has been derived with reference to BESA quoted prices.
F69
TELKOM SA LIMITED
NOTES TO THE CONSOLIDATED FINANCIAL STATEMENTS
for the three years ended March 31, 2002
2000
2001
2002
Rm
Rm
Rm
17. NET CASH AND CASH EQUIVALENTS . . . . . . . . . . . . . . . . . . .
1,227
867
(98)
Cash and bank balances . . . . . . . . . . . . . . . . . . . . . . . . . . . . . .
874
306
723
Short-term investments . . . . . . . . . . . . . . . . . . . . . . . . . . . . . . .
1,079
1,495
1
Cash shown as current assets . . . . . . . . . . . . . . . . . . . . . . . . . . .
1,953
1,801
724
Credit facilities utilized . . . . . . . . . . . . . . . . . . . . . . . . . . . . . .
(726)
(934)
(822)
Undrawn borrowing facilities
General banking facilities . . . . . . . . . . . . . . . . . . . . . . . . . . . . .
2,154
The general banking facilities have no specific maturity date but are subject to
annual review. The facilities are in place to ensure liquidity .
18. SHARE CAPITAL
Authorised and issued share capital and share premium are made up as follows:
Authorised
1,000,000,000 (2001: 1,000,000,000, 2000: 1,000,000,000) ordinary shares of
R10 each . . . . . . . . . . . . . . . . . . . . . . . . . . . . . . . . . . . . . .
10,000
10,000
10,000
Issued and fully paid . . . . . . . . . . . . . . . . . . . . . . . . . . . . . . .
8,293
8,293
8,293
557,031,819 (2001: 557,031,819, 2000: 557,031,819) ordinary shares of R10 each
5,570
5,570
5,570
Share premium . . . . . . . . . . . . . . . . . . . . . . . . . . . . . . . . . . .
2,723
2,723
2,723
Share issue expenses . . . . . . . . . . . . . . . . . . . . . . . . . . . . . . .
(44)
Share issue expenses represent costs incurred by the Group in preparation for the
initial public offering. These costs are to be written-off against proceeds of a
separate share issue by the Group on date of listing.
19. NON-DISTRIBUTABLE RESERVES . . . . . . . . . . . . . . . . . . . . .
134
Balance at beginning of year . . . . . . . . . . . . . . . . . . . . . . . . . . .
Adoption of IAS 39 . . . . . . . . . . . . . . . . . . . . . . . . . . . . . . . .
45
Movement during year . . . . . . . . . . . . . . . . . . . . . . . . . . . . . .
89
Foreign currency translation reserve (net of tax of R10m) . . . . . . . . . . .
49
Fair value adjustment . . . . . . . . . . . . . . . . . . . . . . . . . . . . . .
5
Life Fund reserve (Cell Captive) . . . . . . . . . . . . . . . . . . . . . . . .
35
The balance comprises: . . . . . . . . . . . . . . . . . . . . . . . . . . . . . .
134
Foreign currency translation reserve . . . . . . . . . . . . . . . . . . . . . . . .
49
Fair value adjustment to investments . . . . . . . . . . . . . . . . . . . . . . .
50
Cell Captive reserve . . . . . . . . . . . . . . . . . . . . . . . . . . . . . . . .
35
The Group has two cell captives, one used as an investment vehicle and the other for short-term insurance. The earnings from
the cell captives are transferred to non-distributable reserves.
F70
TELKOM SA LIMITED
NOTES TO THE CONSOLIDATED FINANCIAL STATEMENTS
for the three years ended March 31, 2002
2000
2001
2002
Rm
Rm
Rm
20. RETAINED EARNINGS
Retained earnings . . . . . . . . . . . . . . . . . . . . . . . . . . . . . . . .
5,057
6,679
8,449
Balance at beginning of year . . . . . . . . . . . . . . . . . . . . . . . . . .
3,862
5,057
6,679
Adoption of IAS 39 . . . . . . . . . . . . . . . . . . . . . . . . . . . . . . .
584
Retained earnings for the year . . . . . . . . . . . . . . . . . . . . . . . . .
1,195
1,622
1,186
Profit per income statement . . . . . . . . . . . . . . . . . . . . . . . . . .
1,527
1,622
1,221
Dividends declared . . . . . . . . . . . . . . . . . . . . . . . . . . . . . . .
(332)
Transfer to non-distributable reserves . . . . . . . . . . . . . . . . . . . . .
(35)
The balance comprises: . . . . . . . . . . . . . . . . . . . . . . . . . . . . .
5,057
6,679
8,449
Company . . . . . . . . . . . . . . . . . . . . . . . . . . . . . . . . . . . . .
3,483
4,856
5,660
Joint venture . . . . . . . . . . . . . . . . . . . . . . . . . . . . . . . . . . .
1,335
1,754
2,678
Subsidiaries . . . . . . . . . . . . . . . . . . . . . . . . . . . . . . . . . . . .
239
69
111
Adoption of IAS 39
On 1 April 2001 the Group prospectively adopted IAS 39 Financial Instruments:
Recognition and Measurement. In accordance with IAS 39, adjustments have
been made to reserves on the date of adoption, while comparative amounts have
not been restated.
Increase in opening retained earnings
Gross . . . . . . . . . . . . . . . . . . . . . . . . . . . . . . . . . . . . . . .
834
Taxation . . . . . . . . . . . . . . . . . . . . . . . . . . . . . . . . . . . . . .
(250)
Net . . . . . . . . . . . . . . . . . . . . . . . . . . . . . . . . . . . . . . . .
584
21. INTEREST BEARING DEBT . . . . . . . . . . . . . . . . . . . . . . . . .
15,149
18,991
21,505
(Excluding finance lease and credit facilities utilized)
(a) Local debt . . . . . . . . . . . . . . . . . . . . . . . . . . . . . . . . . .
15,584
14,923
18,012
Locally registered Telkom debt instruments . . . . . . . . . . . . . . . . .
7,958
11,292
15,101
Name, maturity, rate p.a., nominal value:
TK01, 2008, 10%, R4 594m (2001: R4 829m, 2000: R4 699m) . . . . . . . .
3,453
3,666
3,552
TL08, 2004, 13%, R3 500m (2001: R3 500m, 2000: R3 500m) . . . . . . . .
3,122
3,191
3,272
TL03, 2003, 10.75%, R5 000m (2001: R2 700m, 2000: Nil) . . . . . . . . . .
2,669
4,985
TL06, 2006, 10.5%, R1 455m (2001: Nil, 2000: Nil) . . . . . . . . . . . . . .
1,435
TL20, 2020, 6%, R2 500m (2001: R2 500m, 2000: R2 500m) . . . . . . . . .
1,091
1,104
1,119
PP01, 2002, 12.5%, R200m (2001: R200m, 2000: R200m) . . . . . . . . . . .
192
196
200
PP02, 2010, 0%, R430m (2001: R430m, 2000: R430m) . . . . . . . . . . . .
100
115
132
PP03, 2010, 0%, R1 350m (2001: R1 350m, 2000: Nil) . . . . . . . . . . . .
351
406
Local bonds
The local Telkom bonds are unsecured, but contain a number of restrictive
covenants, which limit Telkom's ability to create encumbrances on revenues or
assets, and to secure any indebtedness without securing the outstanding bonds
equally and rateably with such indebtedness.
Telkom is a buyer or seller of last resort in the Telkom bond TK01. To eliminate
the resultant exposure Telkom sells or buys Government bonds. The objective of
the hedging relationship is to eliminate price risk whereby value changes on the
TK01 transactions are in total offset by value changes in the government stock.
Telkom switching certificates
2008, 10.20% to 15.94% . . . . . . . . . . . . . . . . . . . . . . . . . . . . .
120
120
Revolving repurchase agreements . . . . . . . . . . . . . . . . . . . . . . .
192
421
21
F71
TELKOM SA LIMITED
NOTES TO THE CONSOLIDATED FINANCIAL STATEMENTS
for the three years ended March 31, 2002
2000
2001
2002
Rm
Rm
Rm
21. INTEREST BEARING DEBT (continued)
Commercial paper bills . . . . . . . . . . . . . . . . . . . . . . . . . . . . .
6,702
2,888
2,387
2002 2005, 10.09% to 15.13%, R2 962m (2001: R3 699m, 2000: R7 868m).
Interest bearing long-term loans . . . . . . . . . . . . . . . . . . . . . . . .
610
200
221
Commerzbank AG (unsecured) . . . . . . . . . . . . . . . . . . . . . . . . .
175
100
100
13.7% NACQ, repayable March 17, 2003.
Credit Agricole Indosuez (unsecured) . . . . . . . . . . . . . . . . . . . . . .
100
100
100
14.0% NACQ, repayable on March 17, 2003.
RMB Corporate Finance . . . . . . . . . . . . . . . . . . . . . . . . . . . . .
335
An option agreement between Vodacom Group (Proprietary) Limited and
RMB Corporate Finance (Proprietary) Limited for the purchase of shares in
Teljoy Holdings Limited lapsed on April 3, 2000 and the amount due was repaid
on April 17, 2000.
Vodacom Tanzania Limited
The shareholder's loan is uncollaterised, bears interest at LIBOR plus 1% and no
repayment terms have been determined. . . . . . . . . . . . . . . . . . . . . .
21
Short-term loans . . . . . . . . . . . . . . . . . . . . . . . . . . . . . . . .
282
Interest free long-term loans . . . . . . . . . . . . . . . . . . . . . . . . . .
2
2
Sekha-Metsi Consortium Limited (unsecured)
(b) Foreign debt . . . . . . . . . . . . . . . . . . . . . . . . . . . . . . . . .
4,885
9,559
5,534
United States Dollar
2002 2003, 3.83%, $4m (2001: $596m, 2000: $598m) . . . . . . . . . . . .
4,655
5,368
42
Euro
2002 2005, 0.10% 7.125%, 514m (2001: 519m, 2000: 24m) . . . . . . . .
126
3,786
5,133
South African Rand
2009, 10.56%, R359m (2001: R373m, 2000: Nil) . . . . . . . . . . . . . . . .
359
359
This is shown as foreign debt since the loans are held with foreign lenders.
This credit facility is guaranteed, with both agreements containing restrictive
financial covenants, setting required levels for net debt to net worth and net
income to net financing charges.
Loans denominated in other currencies . . . . . . . . . . . . . . . . . . . . .
104
46
Less: Current portion of interest bearing debt . . . . . . . . . . . . . . . .
(5,320)
(5,491)
(2,041)
Local debt . . . . . . . . . . . . . . . . . . . . . . . . . . . . . . . . . . . .
(5,003)
(2,191)
(2,002)
Locally registered Telkom debt instruments . . . . . . . . . . . . . . . . . .
(200)
Commercial paper bills . . . . . . . . . . . . . . . . . . . . . . . . . . . .
(4,401)
(1,770)
(1,278)
Revolving repurchase agreements . . . . . . . . . . . . . . . . . . . . . . .
(192)
(421)
(21)
Long-term loans . . . . . . . . . . . . . . . . . . . . . . . . . . . . . . . .
(410)
(221)
Short-term loans . . . . . . . . . . . . . . . . . . . . . . . . . . . . . . . .
(282)
Foreign debt . . . . . . . . . . . . . . . . . . . . . . . . . . . . . . . . . . .
(317)
(3,300)
(39)
Total debt (including finance leases Note 22) . . . . . . . . . . . . . . . . .
21,248
25,334
24,579
Gross interest bearing debt . . . . . . . . . . . . . . . . . . . . . . . . . . . .
25,041
30,362
29,082
Discount on debt instruments issued . . . . . . . . . . . . . . . . . . . . . . .
(3,793)
(5,028)
(4,503)

F72
TELKOM SA LIMITED
NOTES TO THE CONSOLIDATED FINANCIAL STATEMENTS
for the three years ended March 31, 2002
2000
2001
2002
2002
2002
Year repayable
Total
Total
Foreign
Local
Total
Rm
Rm
Rm
Rm
Rm
21. INTEREST BEARING DEBT (continued)
Repayment of interest bearing debt
2000/2001 . . . . . . . . . . . . . . . . . . .
5,320
2001/2002 . . . . . . . . . . . . . . . . . . .
5,212
5,491
2002/2003 . . . . . . . . . . . . . . . . . . .
1,975
2,445
40
1,925
1,965
2003/2004 . . . . . . . . . . . . . . . . . . .
112
3,802
18
5,054
5,072
2004/2005 . . . . . . . . . . . . . . . . . . .
4,270
4,956
4
4,951
4,955
2005/2006 . . . . . . . . . . . . . . . . . . .
2
3,848
5,002
276
5,278
Thereafter . . . . . . . . . . . . . . . . . . .
8,150
9,820
470
11,342
11,812
25,041
30,362
5,534
23,548
29,082
2000
2001
2002
Rm
Rm
Rm
Included in long and short-term debt is:
Guaranteed debt . . . . . . . . . . . . . . . . . . . . . . . . . . . . . . . . .
3,937
3,954
4,088
By South African Government . . . . . . . . . . . . . . . . . . . . . . . . . . .
3,868
3,907
3,729
By South African Banks . . . . . . . . . . . . . . . . . . . . . . . . . . . . . .
69
47
359
The Company may issue or re-issue locally registered debt instruments in terms
of the Post Office Amendment Act 85 of 1991. These borrowing powers are set
out in the Company's articles of association.
Revolving repurchase agreements
The Group actively manages a portfolio of sale and buy back repurchase
agreements in the South African capital and money markets with a view to
financing short-term liquidity gaps. Interest paid by the Group is based on the
current market-related yield required for South African Government and
Telkom bonds.
2002
Maturity period
Yield
13 days
13.10% . . . . . . . . . . . . . . . . . . . .
1
5 days
13.02% - 13.30% . . . . . . . . . . . . . . .
20
21
2001
Maturity period
Yield
7 days
12.40% . . . . . . . . . . . . . . . . . . . .
3
3 days
12.12% - 12.48% . . . . . . . . . . . . . . .
418
421
2000
Maturity period
Yield
7 days
14.15% . . . . . . . . . . . . . . . . . . . .
11
3 days
13.84% - 14.27% . . . . . . . . . . . . . . .
181
192
F73
TELKOM SA LIMITED
NOTES TO THE CONSOLIDATED FINANCIAL STATEMENTS
for the three years ended March 31, 2002
21. INTEREST BEARING DEBT (continued)
Due to the short-term nature of these transactions and the fact that the transactions are initiated based on market-related
interest rates, the carrying value approximates the fair value.
Collateral in the form of publicly tradable bonds has been received in respect of the above transactions.
The terms and conditions of these transactions are governed by signed ISMA agreements with all counter parties and the
regulations of the Bond Exchange of South Africa (BESA). The fair value of such bonds has been derived with reference to
BESA quoted prices.
2000
2001
2002
Rm
Rm
Rm
22. FINANCE LEASES . . . . . . . . . . . . . . . . . . . . . . . . . . . . . .
779
852
1,028
Total finance leases . . . . . . . . . . . . . . . . . . . . . . . . . . . . . . .
779
852
1,033
The finance leases are secured by land and buildings with a book value of
R617m (2001: R488m, 2000: R468m). These amounts are repayable between
periods of 5 and 17 years. Interest rates vary between 13.44% and 14.69%.
Less: Current portion of finance leases . . . . . . . . . . . . . . . . . . .
(5)
23. PROVISIONS . . . . . . . . . . . . . . . . . . . . . . . . . . . . . . . . .
3,352
2,844
Leave pay . . . . . . . . . . . . . . . . . . . . . . . . . . . . . . . . . . .
493
450
463
Balance at beginning of year . . . . . . . . . . . . . . . . . . . . . . . . .
537
493
450
Charged to income . . . . . . . . . . . . . . . . . . . . . . . . . . . . . .
158
108
136
Leave utilized or paid . . . . . . . . . . . . . . . . . . . . . . . . . . . .
(202)
(151)
(123)
Medical aid liability (Note 28) . . . . . . . . . . . . . . . . . . . . . . . .
2,464
2,183
2,154
Balance at beginning of year . . . . . . . . . . . . . . . . . . . . . . . . .
2,217
2,464
2,183
Interest cost . . . . . . . . . . . . . . . . . . . . . . . . . . . . . . . . .
266
348
224
Current service cost . . . . . . . . . . . . . . . . . . . . . . . . . . . . .
42
50
14
Actuarial loss/(gain) . . . . . . . . . . . . . . . . . . . . . . . . . . . . .
15
(16)
(5)
Settlement and curtailment loss/(gain) . . . . . . . . . . . . . . . . . . . .
31
(409)
(5)
Termination settlement . . . . . . . . . . . . . . . . . . . . . . . . . . . .
(118)
(144)
Contributions . . . . . . . . . . . . . . . . . . . . . . . . . . . . . . . . .
(107)
(136)
(113)
Retirement and Pension Fund deficits (Note 28) . . . . . . . . . . . . . .
1,097
985
759
Balance at beginning of year . . . . . . . . . . . . . . . . . . . . . . . . .
1,208
1,097
985
Repayment of the deficit . . . . . . . . . . . . . . . . . . . . . . . . . . .
(240)
(240)
(307)
Interest cost . . . . . . . . . . . . . . . . . . . . . . . . . . . . . . . . .
129
128
119
Curtailment gain . . . . . . . . . . . . . . . . . . . . . . . . . . . . . . .
(38)
Sick leave . . . . . . . . . . . . . . . . . . . . . . . . . . . . . . . . . . . .
330
332
315
Balance at beginning of year . . . . . . . . . . . . . . . . . . . . . . . . .
205
330
332
Net charge to income . . . . . . . . . . . . . . . . . . . . . . . . . . . .
125
2
(17)
Telephone rebates . . . . . . . . . . . . . . . . . . . . . . . . . . . . . . .
124
134
146
Balance at beginning of the year . . . . . . . . . . . . . . . . . . . . . . .
114
124
134
Interest cost . . . . . . . . . . . . . . . . . . . . . . . . . . . . . . . . .
9
9
10
Current service cost . . . . . . . . . . . . . . . . . . . . . . . . . . . . .
1
1
2
Short-term portion . . . . . . . . . . . . . . . . . . . . . . . . . . . . . .
(1,156)
(1,240)
(1,236)
Leave pay . . . . . . . . . . . . . . . . . . . . . . . . . . . . . . . . . .
(480)
(450)
(463)
Medical benefits . . . . . . . . . . . . . . . . . . . . . . . . . . . . . . .
(218)
(200)
(200)
Retirement and Pension Fund deficit . . . . . . . . . . . . . . . . . . . .
(128)
(258)
(258)
Sick leave . . . . . . . . . . . . . . . . . . . . . . . . . . . . . . . . . .
(330)
(332)
(315)
F74
TELKOM SA LIMITED
NOTES TO THE CONSOLIDATED FINANCIAL STATEMENTS
for the three years ended March 31, 2002
23. PROVISIONS (continued)
Leave pay benefits
In terms of the Group's policy, employees are entitled to accumulate vested leave benefits not taken within a leave cycle. This
is reviewed annually and is in accordance with legislation.
Sick leave
Sick leave provision is determined in accordance with the Group's policy. This takes into account the possibility of production
loss for the Group, due to the inability of an employee to render services for an extended period due to illness.
2000
2001
2002
Rm
Rm
Rm
24. TRADE AND OTHER PAYABLES . . . . . . . . . . . . . . . . . . . . .
5,882
6,141
7,391
Trade payables . . . . . . . . . . . . . . . . . . . . . . . . . . . . . . . . .
3,981
3,851
4,877
Finance cost accrued . . . . . . . . . . . . . . . . . . . . . . . . . . . . . .
274
578
1,126
Deferred exchange gains . . . . . . . . . . . . . . . . . . . . . . . . . . . .
936
894
Other . . . . . . . . . . . . . . . . . . . . . . . . . . . . . . . . . . . . . .
691
818
1,388
25. COMMITMENTS
Capital commitments authorized . . . . . . . . . . . . . . . . . . . . . .
10,351
11,028
7,490
Fixed-line . . . . . . . . . . . . . . . . . . . . . . . . . . . . . . . . . .
8,733
9,201
4,932
Mobile . . . . . . . . . . . . . . . . . . . . . . . . . . . . . . . . . . . .
1,618
1,827
2,558
Commitments against authorized capital expenditure . . . . . . . . . . .
2,271
1,311
810
Fixed-line . . . . . . . . . . . . . . . . . . . . . . . . . . . . . . . . . .
1,939
503
85
Mobile . . . . . . . . . . . . . . . . . . . . . . . . . . . . . . . . . . . .
332
808
725
Authorised capital expenditure not yet committed . . . . . . . . . . . . .
8,080
9,717
6,680
Fixed-line . . . . . . . . . . . . . . . . . . . . . . . . . . . . . . . . . .
6,794
8,698
4,847
Mobile . . . . . . . . . . . . . . . . . . . . . . . . . . . . . . . . . . . .
1,286
1,019
1,833
Management expects these commitments will be financed mainly from internally generated cash.
Operating lease commitments
Between
Within one
and
Over
Total
one year
five years
five years
Rm
Rm
Rm
Rm
2002
Buildings . . . . . . . . . . . . . . . . . . . . . . . . . . . . .
737
208
310
219
Transmission and data lines . . . . . . . . . . . . . . . . . . .
1,101
183
735
183
Vehicles . . . . . . . . . . . . . . . . . . . . . . . . . . . . . .
809
809
Equipment . . . . . . . . . . . . . . . . . . . . . . . . . . . .
35
17
18
2,682
1,217
1,063
402
Vehicle leases
Telkom has entered into a lease agreement for its vehicles. The master lease agreement is for a period of five years and expires
on March 31, 2005. As there is no minimum usage clause in the master lease agreement, only the lease payments for the next
year have been disclosed. The leases of individual vehicles are renewed annually.

F75
TELKOM SA LIMITED
NOTES TO THE CONSOLIDATED FINANCIAL STATEMENTS
for the three years ended March 31, 2002
25. COMMITMENTS (continued)
Finance lease commitments
Between
Within one
and
Over
Total
one year
five years
five years
Rm
Rm
Rm
Rm
Buildings
2002
Lease payments . . . . . . . . . . . . . . . . . . . . . . . . . .
2,550
54
292
2,204
Finance charges . . . . . . . . . . . . . . . . . . . . . . . . . .
(1,517)
(88)
(393)
(1,036)
Minimum lease payments . . . . . . . . . . . . . . . . . . . .
1,033
(34)
(101)
1,168
Present value of the liability . . . . . . . . . . . . . . . . . . .
1,026
Finance charges capitalized . . . . . . . . . . . . . . . . . . .
7
Liability as disclosed in Note 22 . . . . . . . . . . . . . . . . .
1,033
2001
Lease payments . . . . . . . . . . . . . . . . . . . . . . . . . .
2,452
49
264
2,139
Finance charges . . . . . . . . . . . . . . . . . . . . . . . . . .
(1,600)
(83)
(377)
(1,140)
Minimum lease payments . . . . . . . . . . . . . . . . . . . .
852
(34)
(113)
999
Present value of the liability . . . . . . . . . . . . . . . . . . .
845
Finance charges capitalized . . . . . . . . . . . . . . . . . . .
7
Liability as disclosed in Note 22 . . . . . . . . . . . . . . . . .
852
2000
Lease payments . . . . . . . . . . . . . . . . . . . . . . . . . .
2,458
45
202
2,211
Finance charges . . . . . . . . . . . . . . . . . . . . . . . . . .
(1,679)
(79)
(359)
(1,241)
Minimum lease payments . . . . . . . . . . . . . . . . . . . .
779
(34)
(157)
970
Present value of the liability . . . . . . . . . . . . . . . . . . .
772
Finance charges capitalized . . . . . . . . . . . . . . . . . . .
7
Liability as disclosed in Note 22 . . . . . . . . . . . . . . . . .
779
Finance charges accruing on the Group's building leases exceed the lease payments for the next five years. Minimum lease
payments have been limited to R Nil in 2001 and 2002. For purposes of 2002, R5 million is the only minimum lease payment
as reflected in Note 22.

F76
TELKOM SA LIMITED
NOTES TO THE CONSOLIDATED FINANCIAL STATEMENTS
for the three years ended March 31, 2002
2000
2001
2002
Rm
Rm
Rm
26. CONTINGENCIES . . . . . . . . . . . . . . . . . . . . . . . . . . . . . . . .
Third parties . . . . . . . . . . . . . . . . . . . . . . . . . . . . . . . . . . . .
35
184
65
Guarantee of employee housing loans . . . . . . . . . . . . . . . . . . . . . . .
262
178
208
Third parties
These amounts represent sundry disputes against third parties that are not individually significant and that the company does
not intend to settle.
Guarantee of employee housing loans
Telkom guarantees to settle a certain portion of employees' housing loans. The amount guaranteed differs depending on factors
such as employment period and salary rates. When an employee leaves the employment of the Group, any housing debt
guaranteed by Telkom is settled before any payment can be made over to the employee.
The maximum amount of the guarantee in the event of the default is as disclosed above.
Supplier dispute
Expenditure of R594 million was incurred in the 2000 and 2001 financial year for the development and installation of an
integrated end-to-end customer assurance and activation system by Telcordia. In the 2001 financial year, the agreement with
Telcordia was terminated and in that year, Telkom wrote off R119 million of this investment in the fixed-line business.
Following an assessment of the viability of the assets related to the Telcordia initiative, Telkom wrote off the balance of these
assets of R346m in financial year 2002. During March 2001, the dispute was taken to arbitration, where Telcordia was seeking
approximately $130 million plus interest at a rate of 15.5% per year for money outstanding and damages. In September 2002,
a partial ruling was issued by the arbitrator in favour of Telcordia. The arbitration proceedings and any liability are not,
however, expected to be finalized until late 2003 or early 2004. Telkom's provision of R375 million for its estimate of probable
liabilities, including interest, was recognized at March 31, 2002.
Site restoration costs
The Group has no legal or constructive obligation to incur site restoration costs. Restoration of sites after decommissioning of
assets are done on a case by case merit. No sites have been identified that would require material restoration to be performed.
Vodacom Congo (R.D.C) S.P.R.L.
The Group has a 51% equity interest through Vodacom in Vodacom Congo (R.D.C) S.P.R.L., ("Vodacom Congo"), whichcommenced business on December 11, 2001.
Vodacom, in terms of the shareholders' agreement, is ultimately responsible for the funding of the operations of Vodacom
Congo. Currently Vodacom Congo is incurring losses which are expected to increase into the foreseeable future. The 49%
portion attributable to the other joint venture partner in respect of the liabilities and losses as at March 31, 2002 were as
follows:
Rm
Losses
(19.3)
Liabilities
(29.7)
Accordingly, the Group exposure is 50% of the above amounts.

F77
TELKOM SA LIMITED
NOTES TO THE CONSOLIDATED FINANCIAL STATEMENTS
for the three years ended March 31, 2002
26. CONTINGENCIES (continued)
Furthermore, the following guarantees were approved/issued by Vodacom in respect of Vodacom Congo subsequent to the
balance sheet date:
Euro
US$
Details
Beneficiary
Date issued
m
m
Approved and issued
Guarantee Alcatel C.I.T.,
ABSA Bank Limited
May 8, 2002
32.6
29.8
Alcatel Space Industries and
Alcatel Altech Telecoms
(Pty) Ltd ("Alcatel")Approved not issued
Guarantees not yet issued
ABSA Bank Limited
51.2
Negative working capital ratio
For each of the financial years ended 2002, 2001 and 2000 the Group had a negative working capital ratio. A negative working
capital ratio arises when current liabilities are greater than the current assets. Current liabilities will be financed from operating
cash flows, new borrowings and credit facilities.
27. FINANCIAL INSTRUMENTS AND RISK MANAGEMENT
Exposure to continuously changing market conditions has highlighted the importance of financial risk management as an
element of control for the Group. Treasury policies, risk limits and control procedures are continuously monitored by the
Board of Directors.
The Group holds or issues financial instruments to finance its operations, for the temporary investment of short-term funds and
to manage currency and interest rate risks. In addition, financial instruments like trade receivables and payables, arise directly
from the Group's operations.
The Group finances its operations primarily by a mixture of issued share capital, retained profit, long-term and short-term
loans. The Group uses derivative financial instruments to manage its exposure to market risks from changes in interest and
foreign exchange rates. The Group does not speculate in derivative instruments.
Interest rate risk management
Interest rate risk arises from the repricing of the Group's forward cover and floating rate debt as well as new borrowings and
refinancing.
The Group's policy is to manage interest cost through the utilization of a mix of fixed and variable rate debt. In order to
manage this mix in a cost efficient manner, the Group makes use of interest rate derivatives as approved in terms of Group
policy. Fixed rate debt represents approximately 86.20% (2001: 62.66%, 2000: 63.13%) of the total consolidated debt, after
taking the instruments listed below into consideration. The debt profile of mainly fixed rate debt has been maintained to limit
the Group's exposure to interest rate increases given the size of the Group's debt portfolio. All financial instruments that
reprice within one year are deemed to be floating rate debt.

F78
TELKOM SA LIMITED
NOTES TO THE CONSOLIDATED FINANCIAL STATEMENTS
for the three years ended March 31, 2002
27. FINANCIAL INSTRUMENTS AND RISK MANAGEMENT (continued)
Interest rate repricing profile for interest bearing debt:
Floating rate
Fixed rate
0 - 1 years
2 - 5 years
> 5 years
Total
Rm
Rm
Rm
Rm
Rm
2002
Borrowings . . . . . . . . . .
3,392
407
14,714
6,066
24,579
Percentage of borrowings . . .
13.80%
1.66%
59.86%
24.68%
100.00%
2001
Borrowings . . . . . . . . . .
9,460
1
9,809
6,064
25,334
Percentage of borrowings . . .
37.34%
0.00%
38.72%
23.94%
100.00%
2000
Borrowings . . . . . . . . . .
7,835
4,477
3,538
5,398
21,248
Percentage of borrowings . . .
36.88%
21.07%
16.65%
25.40%
100.00%
Borrowings do not include credit facilities utilized of R822m (2001: R934m, 2000: R726m), they are floating rate debt.
The effective interest rate for the year was 13.48% (2001: 13.01%, 2000: 14.48%). At March 31, 2002 the Group did not have
a significant interest rate risk exposure on financial assets.
In order to hedge specific exposures in the interest rate repricing profile of existing borrowings and anticipated peak additional
borrowings, the Group makes use of interest rate derivatives as approved in terms of Group policy.

F79
TELKOM SA LIMITED
NOTES TO THE CONSOLIDATED FINANCIAL STATEMENTS
for the three years ended March 31, 2002
27. FINANCIAL INSTRUMENTS AND RISK MANAGEMENT (continued)
The tables below summarise the interest rate hedges outstanding as at:
Notional
Weighted
Average
Average
amount
average
Capped
maturity
Currency
m
coupon rate
interest rate
March 31, 2002
Interest rate swaps
Pay fixed
0 1 year
ZAR
1,300
12.19%
1- 5 years
ZAR
150
12.92%
> 5 years
ZAR
1,000
14.67%
Receive fixed
1 - 5 years
ZAR
74
16.00%
March 31, 2001
Interest rate swaps
Pay fixed
0 1 year
USD
70
6.30%
1 - 5 years
ZAR
1,450
12.27%
> 5 years
ZAR
1,000
14.67%
Receive fixed
1 - 5 years
ZAR
74
16.00%
Caps
0 - 1 years
USD
30
7.00%
March 31, 2000
Interest rate swaps
Pay fixed
0 - 1 year
CHF
17
2.23%
1 - 5 years
USD
70
6.30%
1 - 5 years
ZAR
1,350
12.32%
> 5 years
ZAR
1,000
14.67%
Receive fixed
0 -1 year
FFR
50
4.15%
0- 1 year
GBP
1
7.25%
> 5 years
ZAR
25
14.60%
> 5 years
ZAR
71
16.00%
Caps
0 - 1 year
USD
70
5.83%
1 - 5 years
USD
30
7.00%
The interest rate swaps cover refinancing price risk on the commercial paper bill programme.
Credit risk management
The risk arises from derivative contracts entered into with international financial institutions with a rating of A1 or better.
The accounting loss the company would incur if no amounts were recovered at March 31, 2002 is R2,683 million. No
collateral is required when entering into derivative contracts. Credit limits are reviewed on a yearly basis or when information
becomes available in the market. The Group limits its exposure to any counterparty and exposures are monitored daily. The
Group expects that all counterparties will meet their obligations. Credit limits are set on an individual entity basis.
Trade debtors comprise a large and widespread customer base, covering residential, business and corporate customer
profiles. Credit checks are performed on all customers on application for new services, and on an ongoing basis where
appropriate.

F80
TELKOM SA LIMITED
NOTES TO THE CONSOLIDATED FINANCIAL STATEMENTS
for the three years ended March 31, 2002
27. FINANCIAL INSTRUMENTS AND RISK MANAGEMENT (continued)
Liquidity risk management
The Group is exposed to liquidity risk as a result of uncertain debtor related cash flows as well as capital commitments of the
Group. Liquidity risk is primarily managed by the Corporate Finance division in accordance with policies and guidelines
formulated by the Operating Committee. In terms of its borrowing requirements, the Group ensures that sufficient facilities
exist to meet its immediate obligations. In terms of its long-term liquidity risk, the Operating Committee maintains a
reasonable balance between the period assets generate funds and the period the respective assets are funded. Short-term
liquidity gaps may be funded through sale and buy back transactions.
Foreign currency exchange rate risk management
The Group manages its foreign currency exchange rate risk by hedging, on a portfolio basis, all identifiable exposures via
various financial instruments suitable to the Group's risk exposure.
Cross currency swaps and forward exchange contracts have been entered into to reduce the foreign currency exposure on the
Group's operations and liabilities. The Group also enters into forward foreign exchange contracts to hedge interest expense and
purchase and sale commitments denominated in foreign currencies (principally US Dollars and Euro). The purpose of the
Group's foreign currency hedging activities is to protect the Group from the risk that the eventual net flows will be adversely
affected by changes in exchange rates.
The tables below reflect the currency and interest rate exposure of liabilities. Foreign currency debt is translated at the year-end
exchange rates:
Liabilities
2002
Fixed rate
Floating
Interest free
Total
Currency
Rm
Rm
Rm
Rm
ZAR . . . . . . . . . . . . . . . . . . . . . . . . . . . . .
16,190
4,016
11,762
31,968
USD . . . . . . . . . . . . . . . . . . . . . . . . . . . . .
63
351
414
EUR . . . . . . . . . . . . . . . . . . . . . . . . . . . . .
4,998
135
675
5,808
Other . . . . . . . . . . . . . . . . . . . . . . . . . . . .
53
53
21,188
4,214
12,841
38,243
2001
Fixed rate
Floating
Interest free
Total
Currency
Rm
Rm
Rm
Rm
ZAR . . . . . . . . . . . . . . . . . . . . . . . . . . . . .
12,344
4,722
11,359
28,425
USD . . . . . . . . . . . . . . . . . . . . . . . . . . . . .
5,370
379
5,749
EUR . . . . . . . . . . . . . . . . . . . . . . . . . . . . .
3,530
256
411
4,197
Other . . . . . . . . . . . . . . . . . . . . . . . . . . . .
46
21
67
15,874
10,394
12,170
38,438
2000
Fixed rate
Floating
Interest free
Total
Currency
Rm
Rm
Rm
Rm
ZAR . . . . . . . . . . . . . . . . . . . . . . . . . . . . .
13,338
3,674
11,574
28,586
USD . . . . . . . . . . . . . . . . . . . . . . . . . . . . .
75
4,657
218
4,950
EUR . . . . . . . . . . . . . . . . . . . . . . . . . . . . .
126
1
127
Other . . . . . . . . . . . . . . . . . . . . . . . . . . . .
104
112
216
13,413
8,561
11,905
33,879
Assets
There is no material foreign currency exposure for assets.

F81
TELKOM SA LIMITED
NOTES TO THE CONSOLIDATED FINANCIAL STATEMENTS
for the three years ended March 31, 2002
27. FINANCIAL INSTRUMENTS AND RISK MANAGEMENT (continued)
Forward exchange contracts
The following contracts relate to specific items on the balance sheet or foreign commitments not yet due. Foreign
commitments not yet due consist of capital expenditure ordered but not yet received and future interest payments and loans
denominated in foreign currency.
2002
Average maturity
0 -1 year
1 - 5 years
> 5 years
currency
Foreign
Local
Foreign
Local
Foreign
Local
currency
currency
currency
currency
currency
currency
notional
amount
notional
amount
notional
amount
amount
amount
amount
m
Rm
m
Rm
m
Rm
Purchases
United States Dollar .
447
4,836
61
596
Pound Sterling . . . .
6
108
2
26
Euro . . . . . . . . .
169
1,692
62
489
Swedish Krona . . . .
18
21
Australian Dollar . . .
1
2
Japanese Yen . . . . .
34
3
. . . . . . . . . . . .
6,662
1,111
Sales
United States Dollar .
175
1,790
35
318
25
275
Pound Sterling . . . .
3
45
Euro . . . . . . . . .
41
410
. . . . . . . . . . . .
2,245
318
275
2001
Average maturity
0 - 1 year
1 - 5 years
> 5 years
currency
Foreign
Local
Foreign
Local
Foreign
Local
currency
currency
currency
currency
currency
currency
notional
amount
notional
amount
notional
amount
amount
amount
amount
m
Rm
m
Rm
m
Rm
Purchases
United States Dollar .
1,173
8,802
87
802
Pound Sterling . . . .
11
122
Euro . . . . . . . . .
158
1,028
65
536
Deutsche Mark . . . .
129
216
Swiss Franc . . . . .
5
23
French Franc . . . . .
51
51
Australian Dollar . . .
9
39
Japanese Yen . . . . .
80
6
. . . . . . . . . . . .
10,287
1,338
Sales
United States Dollar .
295
2,300
35
307
34
364
Pound Sterling . . . .
2
28
Euro . . . . . . . . .
62
390
Deutsche Mark . . . .
13
41
French Franc . . . . .
43
47
Australian Dollar . . .
8
32
2,838
307
364

F82
TELKOM SA LIMITED
NOTES TO THE CONSOLIDATED FINANCIAL STATEMENTS
for the three years ended March 31, 2002
27. FINANCIAL INSTRUMENTS AND RISK MANAGEMENT (continued)
2000
Average maturity
0 - 1 year
1 - 5 years
> 5 years
currency
Foreign
Local
Foreign
Local
Foreign
Local
currency
currency
currency
currency
currency
currency
notional
amount
notional
amount
notional
amount
amount
amount
amount
m
Rm
m
Rm
m
Rm
Purchases
United States Dollar .
1,404
9,155
380
2,692
20
213
Pound Sterling . . . .
21
323
Euro . . . . . . . . .
55
360
1
7
Deutsche Mark . . . .
167
318
4
14
Swiss Franc . . . . .
11
32
5
14
French Franc . . . . .
665
240
3
Australian Dollar . . .
7
22
Japanese Yen . . . . .
141
9
Italian Lira . . . . . .
16,418
56
Swedish Krone . . . .
59
44
Spanish Peseta . . . .
895
36
Canadian Dollar . . .
1
10,596
2,727
213
Sales
United States Dollar .
276
1,803
35
271
43
446
Pound Sterling . . . .
1
12
Euro . . . . . . . . .
20
123
Deutsche Mark . . . .
18
58
Swiss Franc . . . . .
1
French Franc . . . . .
67
37
Australian Dollar . . .
4
9
Swedish Krone . . . .
1
1
Japanese Yen . . . . .
14
1
Italian Lira . . . . . .
2,432
8
Spanish Peseta . . . .
443
17
2,070
271
446
Currency swaps
Average
Receive
Average
Pay
Average
maturity
coupon
coupon
2002
Receive floating/pay floating . . . . . .
0 1 year
220m USD
LIBOR
1,400m ZAR
JIBAR
Receive floating/pay floating . . . . . .
0 1 year
1,990m ZAR
JIBAR
220m USD
LIBOR
Receive fixed/pay fixed . . . . . . . . .
2 5 years
350m EUR
7.125%
2,177m ZAR
15.895%
Receive fixed/pay floating . . . . . . . .
2 5 years
100m EUR
7.125%
630m ZAR
JIBAR
2001
Receive floating/pay floating . . . . . .
1 5 years
220m USD
LIBOR
1,400m ZAR
JIBAR
Receive fixed/pay fixed . . . . . . . . .
2 5 years
350m EUR
7.125%
2,177m ZAR
15.895%
Receive fixed/pay floating . . . . . . . .
2 5 years
100m EUR
7.125%
630m ZAR
JIBAR
2000
Receive floating/pay floating . . . . . .
2 5 years
220m USD
LIBOR
1,400m ZAR
JIBAR

F83
TELKOM SA LIMITED
NOTES TO THE CONSOLIDATED FINANCIAL STATEMENTS
for the three years ended March 31, 2002
27. FINANCIAL INSTRUMENTS AND RISK MANAGEMENT (continued)
Fair values of financial instruments
The estimated fair values have been determined using available market information and appropriate valuation methods as
outlined below:
2000
2001
2002
Carrying
Fair value
Carrying
Fair value
Carrying
Fair value
amount
amount
amount
Rm
Rm
Rm
Rm
Rm
Rm
Assets
Cash . . . . . . . . . . . . . . . .
1,953
1,953
1,801
1,801
724
724
Trade and other receivables . . . .
5,427
5,427
5,852
5,852
5,720
5,720
Repurchase agreements . . . . . .
276
276
782
782
100
100
Bills of exchange . . . . . . . . . .
86
86
193
193
10
10
Investments . . . . . . . . . . . . .
2
2
27
72
637
637
7,744
7,744
8,655
8,700
7,191
7,191
Liabilities
Interest bearing debt . . . . . . . .
21,248
21,920
25,334
26,552
24,579
25,267
Trade and other payables . . . . . .
5,882
5,882
6,141
6,141
7,391
7,391
Credit facilities utilized . . . . . .
726
726
934
934
822
822
27,856
28,528
32,409
33,627
32,792
33,480
Derivatives (Note 16)
Currency swaps . . . . . . . . . . .
699
699
2,411
2,411
Interest rate derivatives . . . . . . .
10
(177)
(72)
(72)
Foreign exchange derivatives . . .
822
73
1,192
748
370
370
822
83
1,891
1,270
2,709
2,709
The fair values of debtors, bank balances, repurchase agreements and other liquid funds, creditors and accruals, approximate
their carrying amount due to the short-term maturities of these instruments.
The fair values of borrowings are based on quoted prices or, where such prices are not available, the expected future payments
discounted at market interest rates.
The fair values of derivatives are determined using quoted prices or discounted cash flow analysis. These amounts reflect the
approximate values of the net derivatives position at the balance sheet date. The fair value of investments are based on quoted
prices.
There were unlisted investments as of March 31, 2002, 2001 and 2000 with carrying values of R143m, R549m, and R387m,
respectively, for which the fair value is not practicably determinable (Note11).
There is no single appropriate or workable method to select a single estimate of fair value because the range of reasonable fair
value estimates is significant and the probabilities of the various estimates cannot be reasonably assessed. As a result, the
usefulness of a single estimate of fair value is negated. Consequently, fair value cannot be reliably measured.
Exchange rate table (closing rates):
2000
2001
2002
R
R
R
United States Dollar . . . . . . . . . . . . . . . . . . . . . . . . . . . . .
6.586
8.003
11.440
Euro . . . . . . . . . . . . . . . . . . . . . . . . . . . . . . . . . . . . . .
6.307
7.061
9.996

F84
TELKOM SA LIMITED
NOTES TO THE CONSOLIDATED FINANCIAL STATEMENTS
for the three years ended March 31, 2002
28. EMPLOYEE BENEFITS
The Group provides benefits for all its permanent employees through the Telkom Pension Fund, the Telkom Retirement Fund
and the Vodacom Group Pension Fund. Membership is compulsory. In addition certain retired employees of Telkom SA
Limited receive a telephone rebate and medical aid. All of the liabilities are actuarially determined and valuations performed at
intervals not exceeding three years. Actuarial calculations are performed in the periods between valuations.
At March 31, 2002, the Group employed 42 208 employees (2001: 46,735, 2000: 51,971).
The Telkom Pension Fund
The Telkom Pension Fund is a defined benefit fund that was created in terms of the Post Office Amendment Act 85 of 1991.
All employees who were members of the Government Service Pension Fund and Temporary Employees Pension Fund were
transferred to a newly established Telkom Pension Fund. The deficits that existed in the aforementioned State Funds were
transferred to the Telkom Pension Fund. Legislation also made provision that Telkom would guarantee the financial obligations
of the Telkom Pension Fund. The South African Government guaranteed the actuarially valued deficit of the Telkom Pension
Fund at September 20, 1991, plus interest as determined by the State Actuary. The most recent statutory valuation of the
Telkom Pension Fund was performed at March 31, 2000.
With effect from July 1, 1995, the Telkom Pension Fund was closed to new members. The funded status of the Telkom Pension
Fund is disclosed below:
2000
2001
2002
Rm
Rm
Rm
Telkom Pension Fund
Deficit (originated in terms of the legislation)
Present value of the obligation . . . . . . . . . . . . . . . . . . . . . . . .
245
197
167
Fair value of the assets . . . . . . . . . . . . . . . . . . . . . . . . . . . .
(201)
(157)
(150)
Actuarial calculation/valuation deficit . . . . . . . . . . . . . . . . . . .
44
40
17
Principal actuarial assumptions were as follows:
ROI for post-retirement investment portfolios . . . . . . . . . . . . . . . %
13.0
13.0
13.0
Discount rate . . . . . . . . . . . . . . . . . . . . . . . . . . . . . . . . %
15.0
15.0
15.0
Expected return on plan assets . . . . . . . . . . . . . . . . . . . . . . . %
10.0
10.0
10.0
Salary inflation rate . . . . . . . . . . . . . . . . . . . . . . . . . . . . %
7.5
7.5
7.5
Funding level:
Actuarial calculation/valuation . . . . . . . . . . . . . . . . . . . . . . %
82.0
88.3
91.0
The number of employees registered under the
Telkom Pension Fund Plan . . . . . . . . . . . . . . . . . . . . . . . . . .
542
537
448
The Telkom Retirement Fund
The Telkom Retirement Fund was established on July 1, 1995 as a defined contribution plan. Existing employees were given
the option to either remain in the Telkom Pension Fund or to be transferred to the Telkom Retirement Fund. All pensioners of
the Telkom Pension Fund and employees who retired after 1 July 1995 were transferred to the Telkom Retirement Fund. At the
same time the proportionate share of the deficit relating to the transferring employees and pensioners was transferred to the
Telkom Retirement Fund. Upon the transfer the Government ceased to guarantee the deficit in the Telkom Retirement Fund.
Subsequent to July 1, 1995 further transfers of existing employees occurred.
The Telkom Retirement Fund is governed by the Pension Funds Act, Act No. 24 of 1956. In terms of section 37A of this Act,
the pension benefits payable to the pensioners cannot be reduced.
The Telkom Retirement Fund is a defined contribution fund with regards to in-service members and a defined benefit fund with
regards to pensioners. The Group guarantees the initial pensions on retirement date. The most recent statutory actuarial
valuation of the Telkom Retirement Fund was performed on March 31, 2000.

F85
TELKOM SA LIMITED
NOTES TO THE CONSOLIDATED FINANCIAL STATEMENTS
for the three years ended March 31, 2002
28. EMPLOYEE BENEFITS (continued)
The funded status of the Telkom Retirement Fund is discussed below:
2000
2001
2002
Rm
Rm
Rm
Telkom Retirement Fund
Deficit (originated on transfer from Telkom Pension Fund
on July 1, 1995 and transfers thereafter)
Actuarial calculation/valuation . . . . . . . . . . . . . . . . . . . . . . . .
1,053
945
742
The number of in service employees registered under
the Telkom Retirement Fund . . . . . . . . . . . . . . . . . . . . . . . . .
48,722
43,202
38,927
Company contributions. Refer Note 4.
Telkom Retirement Fund
Pensioners
Present value of the funded obligation . . . . . . . . . . . . . . . . . . . .
2,332
2,586
3,055
Fair value of the plan asset . . . . . . . . . . . . . . . . . . . . . . . . . .
(2,923)
(2,979)
(3,805)
Funded status . . . . . . . . . . . . . . . . . . . . . . . . . . . . . . . . .
(591)
(393)
(750)
Unrecognized net actuarial gain . . . . . . . . . . . . . . . . . . . . . . .
591
223
460
Unrecognized surplus . . . . . . . . . . . . . . . . . . . . . . . . . . . . .
(170)
(290)
The surplus is not recognized due to the legal status of surpluses
in South Africa.
Included in the fair value of plan assets is:
Office buildings occupied by Telkom . . . . . . . . . . . . . . . . . . . . .
111
111
111
Telkom bonds . . . . . . . . . . . . . . . . . . . . . . . . . . . . . . . . .
12
7
63
Principal actuarial assumptions were as follows:
Discount rate . . . . . . . . . . . . . . . . . . . . . . . . . . . . . . . . %
13.5
12.5
12.2
Expected return on plan assets . . . . . . . . . . . . . . . . . . . . . . . %
14.0
14.0
14.0
Pension increase allowance . . . . . . . . . . . . . . . . . . . . . . . . %
7.1
6.1
5.9
The number of pensioners registered under the Telkom Retirement Fund . .
12,098
12,301
13,963
Vodacom Group Pension Fund
All eligible employees of the jointly controlled entity and its wholly-owned subsidiaries are members of the Vodacom Group
Pension Fund, a defined contribution pension scheme, administered by ABSA Consultants and Actuaries (Proprietary) Limited.
The Group's share of the contribution to the pension fund amounted to R21m (2001: R21m, 2000: R15m). The Group's share
of Vodacom employees at March 31, 2002 were 2,177 (2001: 2,136, 2000: 2,046). The fund is governed by the Pension Funds
Act of 1956.
Medical benefits
TELKOM SA LIMITED makes certain contributions to medical aid funds in respect of current and retired employees. The scheme
is a defined benefit plan. The expense in respect of current employees' medical aid is disclosed in Note 4. The amounts due in
respect of post-retirement medical benefits to current and retired employees have been actuarially determined and provided for
as set out in Note 23. The Group has terminated future post-retirement medical benefits in respect of employees joining after
July 1, 2000.
There are three major categories of members entitled to the post retirement medical aid: pensioners who retired before 1994
("Pre-94"); those who retired after 1994 ("Post-94"); and the in-service members. The post-94 and the in-service members'liability is subject to a Rand cap, which increases annually with the average salary increase.
Eligible employees must be employed by Telkom until retirement age to qualify for the post-retirement medical aid.
The most recent valuation of the benefit was performed at March 31, 2001.
The Company has allocated certain investments to fund for this liability as set out in Note 11. These investments
do not qualify as plan assets.
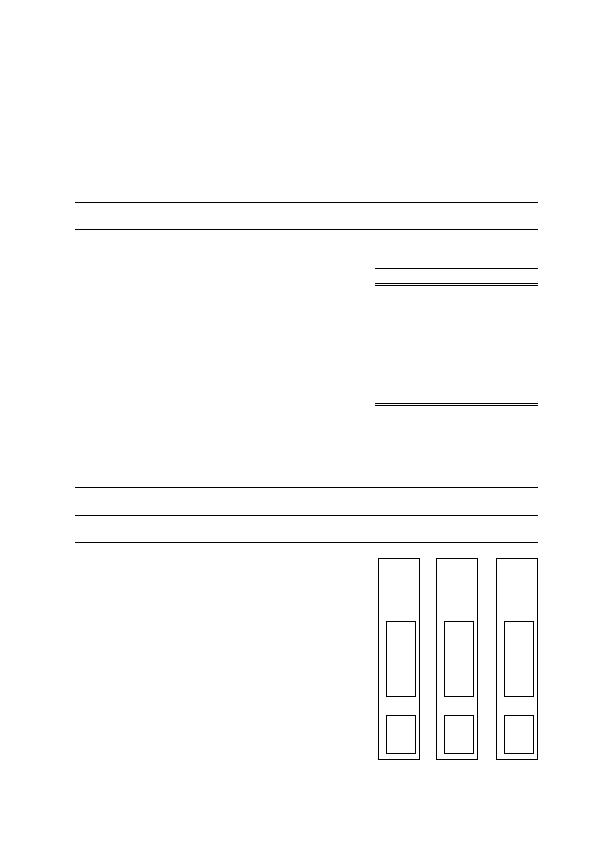
F86
TELKOM SA LIMITED
NOTES TO THE CONSOLIDATED FINANCIAL STATEMENTS
for the three years ended March 31, 2002
28. EMPLOYEE BENEFITS (continued)
Telephone rebates
TELKOM SA LIMITED provides telephone rebates to its pensioners. The most recent valuation was performed in January 2000.
Eligible employees must be employed by Telkom until retirement age to qualify for the telephone rebates. The scheme is a
defined benefit plan.
The funded status of the post-retirement liabilities is disclosed below:
2000
2001
2002
Rm
Rm
Rm
Medical aid liability
Present value of the unfunded obligation . . . . . . . . . . . . . . . . . . .
2,818
1,791
1,886
Unrecognized actuarial (loss)/gain . . . . . . . . . . . . . . . . . . . . . .
(354)
392
268
Liability as disclosed in the balance sheet (Note 23) . . . . . . . . . . . . .
2,464
2,183
2,154
Principal actuarial assumptions were as follows:
Salary inflation rate . . . . . . . . . . . . . . . . . . . . . . . . . . . . %
7.5
7.5
7.5
Medical inflation rate . . . . . . . . . . . . . . . . . . . . . . . . . . . %
10.5
10.5
10.5
Withdrawal rate . . . . . . . . . . . . . . . . . . . . . . . . . . . . . . %
30.0
30.0
30.0
Actual retirement age . . . . . . . . . . . . . . . . . . . . . . . . . . . . .
65
65
65
Average retirement age . . . . . . . . . . . . . . . . . . . . . . . . . . . .
63
63
63
Average number of members . . . . . . . . . . . . . . . . . . . . . . . . .
38,452
32,616
32,013
Average number of pensioners . . . . . . . . . . . . . . . . . . . . . . . .
9,237
8,588
8,180
Telephone rebate
Present value of the unfunded obligation . . . . . . . . . . . . . . . . . . .
124
134
146
Principal actuarial assumptions were as follows:
Discount rate . . . . . . . . . . . . . . . . . . . . . . . . . . . . . . . . %
15.0
15.0
15.0
CPI inflation rate . . . . . . . . . . . . . . . . . . . . . . . . . . . . . . %
9.5
9.5
9.5
Actual retirement age . . . . . . . . . . . . . . . . . . . . . . . . . . . . .
65
65
65
Average retirement age . . . . . . . . . . . . . . . . . . . . . . . . . . . .
63
63
63
Average number of members . . . . . . . . . . . . . . . . . . . . . . . . .
28,740
28,740
28,740
Average number of pensioners . . . . . . . . . . . . . . . . . . . . . . . .
12,305
12,305
12,305
29. RECONCILIATION OF PROFIT AFTER TAXATION TO CASH GENERATED FROM OPERATIONS
2000
2001
2002
Rm
Rm
Rm
6,327
9,832
11,605
Profit after taxation . . . . . . . . . . . . . . . . . . . . . . . . . . . . .
1,540
1,690
1,280
Finance charges . . . . . . . . . . . . . . . . . . . . . . . . . . . Note 6
2,482
3,137
2,550
Taxation . . . . . . . . . . . . . . . . . . . . . . . . . . . . . . . Note 7
501
715
873
Investment income . . . . . . . . . . . . . . . . . . . . . . . . . . Note 5
(641)
(617)
(490)
Non-cash items . . . . . . . . . . . . . . . . . . . . . . . . . . . . . . .
3,784
4,691
5,713
Depreciation and amortization . . . . . . . . . . . . . . . . . . Note 4
4,174
5,052
5,408
Increase/(Decrease) in provisions . . . . . . . . . . . . . . . . . . . . .
186
(611)
(110)
Profit on disposal of property, plant and equipment . . . . . . . Note 4
(493)
(29)
(22)
Write-off of property, plant and equipment . . . . . . . . . . . Note 4
160
47
Impairment of property, plant and equipment . . . . . . . . . . Note 4
119
398
Profit on disposal of subsidiaries and joint ventures . . . . . . Note 32
(18)
(8)
Profit on disposal of division . . . . . . . . . . . . . . . . . . Note 34
(65)
(Decrease)/Increase in working capital . . . . . . . . . . . . . . . . . .
(1,339)
216
1,679
Inventories . . . . . . . . . . . . . . . . . . . . . . . . . . . . . . . . .
126
398
246
Accounts receivable . . . . . . . . . . . . . . . . . . . . . . . . . . . .
(1,103)
(280)
(144)
Accounts payable . . . . . . . . . . . . . . . . . . . . . . . . . . . . .
(362)
98
1,577
F87
TELKOM SA LIMITED
NOTES TO THE CONSOLIDATED FINANCIAL STATEMENTS
for the three years ended March 31, 2002
2000
2001
2002
Rm
Rm
Rm
30. FINANCE CHARGES PAID
1,271
3,927
3,026
Finance charges per income statement . . . . . . . . . . . . . . . . . . .
2,482
3,137
2,550
Non-cash items . . . . . . . . . . . . . . . . . . . . . . . . . . . . . . .
(1,211)
790
476
Movements in interest accruals . . . . . . . . . . . . . . . . . . . . .
(208)
(304)
(548)
Cost of forward exchange contracts amortized . . . . . . . . . . . . .
11
(160)
Net discount amortized . . . . . . . . . . . . . . . . . . . . . . . . . .
(659)
(591)
(663)
Fair value adjustment . . . . . . . . . . . . . . . . . . . . . . . . . . .
1,332
Unrealized (gain)/loss . . . . . . . . . . . . . . . . . . . . . . . . . .
(355)
1,845
IAS 39 application adjustment . . . . . . . . . . . . . . . . . . . . . .
355
31. TAXATION PAID
257
322
914
Net asset at beginning of year . . . . . . . . . . . . . . . . . . . . . . .
(911)
(942)
(795)
Liability of joint venture acquired . . . . . . . . . . . . . . . . . . . . .
3
Interest accrual on tax receivable . . . . . . . . . . . . . . . . . . . . . .
(143)
(35)
(4)
Taxation . . . . . . . . . . . . . . . . . . . . . . . . . . . . . . . . . . .
369
501
825
Net asset at end of year . . . . . . . . . . . . . . . . . . . . . . . . . . .
942
795
888
32. DISPOSAL OF SUBSIDIARIES AND JOINT VENTURES
The Group's 50% joint venture company, Vodacom, disposed of the following:
on February 27, 2002, its 51% interest in Vodacom Sport & Entertainment (Proprietary) Limited;
on November 30, 2001, its 40% interest in Vodacom World Online (Proprietary) Limited;
on March 31, 2002, its 100% interest in Film Fun Holdings (Proprietary) Limited, Teljoy Botswana (Proprietary) Limited
and Africell Cellular Services (Proprietary) Limited; and
during 2000, 10% of Vodacom World Online (Proprietary) Limited.
These disposals were effected in order to dispose of non-core operations.
2000
2002
Rm
Rm
Aggregate carrying value of net assets disposed of:
8
38
Property, plant and equipment . . . . . . . . . . . . . . . . . . . . . . .
1
36
Inventory . . . . . . . . . . . . . . . . . . . . . . . . . . . . . . . . . .
3
Accounts receivable . . . . . . . . . . . . . . . . . . . . . . . . . . . . .
11
121
Accounts payable . . . . . . . . . . . . . . . . . . . . . . . . . . . . . .
(4)
(167)
Intangibles . . . . . . . . . . . . . . . . . . . . . . . . . . . . . . . . . .
11
Investments . . . . . . . . . . . . . . . . . . . . . . . . . . . . . . . . .
5
Loan . . . . . . . . . . . . . . . . . . . . . . . . . . . . . . . . . . . . .
14
Cash and cash equivalents . . . . . . . . . . . . . . . . . . . . . . . . .
15
Minority interest . . . . . . . . . . . . . . . . . . . . . . . . . . . . . .
(2)
Profit on disposal . . . . . . . . . . . . . . . . . . . . . . . . . . . . . .
18
8
Disposal proceeds . . . . . . . . . . . . . . . . . . . . . . . . . . . . . .
26
44
Cash and cash equivalents . . . . . . . . . . . . . . . . . . . . . . . . .
(15)
Net cash consideration . . . . . . . . . . . . . . . . . . . . . . . . . . .
26
29
Settlement method
Cash . . . . . . . . . . . . . . . . . . . . . . . . . . . . . . . . . . . . .
26
29
Current receivables . . . . . . . . . . . . . . . . . . . . . . . . . . . . .
16
Net cash inflow from disposals . . . . . . . . . . . . . . . . . . . . . .
26
13
Current receivables
R4.5m was settled in cash by the new owner on May 15,2002. The remaining amount of R11m is to be settled in two equal
instalments on August 31, 2002 and August 31, 2003.

F88
TELKOM SA LIMITED
NOTES TO THE CONSOLIDATED FINANCIAL STATEMENTS
for the three years ended March 31, 2002
33. PURCHASE OF SUBSIDIARIES, JOINT VENTURES AND MINORITY SHAREHOLDERS' INTERESTS
2000
2001
2002
Rm
Rm
Rm
Acquisitions:
The following acquisitions were made: By the company:
on October 11, 2001, an additional 10% of Telkom Directory Services
(Proprietary) Limited, bringing the Group's shareholding to 64.9% . . . . .
160
on May 16, 2001, an additional 40% of Swiftnet (Proprietary) Limited,
bringing the Group's shareholding to 100% . . . . . . . . . . . . . . . . . .
22
By the Group's 50% joint venture, Vodacom:
on August 1, 2000, 100% of Globalstar Southern Africa (Proprietary) Limited
46
on July 14, 2000, an additional 14% of Vodacom Tanzania Limited, bringing
Vodacom's shareholding to 65%. . . . . . . . . . . . . . . . . . . . . . . . .
11
Vodacom Tanzania Limited was treated as a joint venture and proportionally
consolidated at 51% in 2000. In 2001, it was consolidated in full.
During 2000, subsequent to the disposal of the internet division (Note 34),
Vodacom acquired 50% of Vodacom World Online (Proprietary) Limited . . . .
60
During 2000 Vodacom acquired 50% of GSM cellular (Proprietary) Limited,
bringing the total shareholding to 100% . . . . . . . . . . . . . . . . . . . . .
36
Change in accounting treatment:
In January 2000, 100% of Film Fun Holdings (Proprietary) Limited trading
as Teljoy Television was acquired with a view to its subsequent disposal.
Due to a change in intention this investment was consolidated in full in 2001 .
314
Vodacom Sport & Entertainment (Proprietary) Limited was treated as a joint
venture and proportionately consolidated at 50% in 2000. In 2001 it was
consolidated in full.
410
57
182
F89
TELKOM SA LIMITED
NOTES TO THE CONSOLIDATED FINANCIAL STATEMENTS
for the three years ended March 31, 2002
33. PURCHASE OF SUBSIDIARIES, JOINT VENTURES AND MINORITY SHAREHOLDERS' INTERESTS (continued)
2000
2001
Rm
Rm
The aggregate fair value of assets acquired and liabilities assumed on the
purchase of subsidiaries and joint ventures were as follows:
Aggregate fair value
Net assets acquired . . . . . . . . . . . . . . . . . . . . . . . . . . . . . . . . . . . . . . .
311
1
Property, plant and equipment . . . . . . . . . . . . . . . . . . . . . . . . . . . . . . . . .
18
116
Intangible assets . . . . . . . . . . . . . . . . . . . . . . . . . . . . . . . . . . . . . . . .
234
9
Investments . . . . . . . . . . . . . . . . . . . . . . . . . . . . . . . . . . . . . . . . . . .
3
Inventory . . . . . . . . . . . . . . . . . . . . . . . . . . . . . . . . . . . . . . . . . . . .
17
12
Accounts receivable . . . . . . . . . . . . . . . . . . . . . . . . . . . . . . . . . . . . . .
124
18
Cash and cash equivalents . . . . . . . . . . . . . . . . . . . . . . . . . . . . . . . . . . .
75
10
Shareholders' loans . . . . . . . . . . . . . . . . . . . . . . . . . . . . . . . . . . . . . . .
(79)
Interest bearing debt . . . . . . . . . . . . . . . . . . . . . . . . . . . . . . . . . . . . . .
(10)
Accounts payable . . . . . . . . . . . . . . . . . . . . . . . . . . . . . . . . . . . . . . . .
(157)
(75)
Taxation . . . . . . . . . . . . . . . . . . . . . . . . . . . . . . . . . . . . . . . . . . . . .
(3)
Goodwill . . . . . . . . . . . . . . . . . . . . . . . . . . . . . . . . . . . . . . . . . . . .
174
68
Minority interest . . . . . . . . . . . . . . . . . . . . . . . . . . . . . . . . . . . . . . . .
(2)
Purchase price . . . . . . . . . . . . . . . . . . . . . . . . . . . . . . . . . . . . . . . . .
485
67
Cash and cash equivalents . . . . . . . . . . . . . . . . . . . . . . . . . . . . . . . . . . .
(75)
(10)
Cash consideration . . . . . . . . . . . . . . . . . . . . . . . . . . . . . . . . . . . . . . .
410
57
34. DISPOSAL OF DIVISION
During 2000 Vodacom disposed of the Vodacom Internet Company which was a division of Vodacom Group (Proprietary)
Limited.
2000
Rm
Carrying value
Net assets disposed of . . . . . . . . . . . . . . . . . . . . . . . . . . . . . . . . . . . . .
47
Property, plant and equipment . . . . . . . . . . . . . . . . . . . . . . . . . . . . . . . . .
3
Inventory . . . . . . . . . . . . . . . . . . . . . . . . . . . . . . . . . . . . . . . . . . . .
1
Accounts receivable . . . . . . . . . . . . . . . . . . . . . . . . . . . . . . . . . . . . . .
54
Cash and cash equivalents . . . . . . . . . . . . . . . . . . . . . . . . . . . . . . . . . . .
12
Accounts payable . . . . . . . . . . . . . . . . . . . . . . . . . . . . . . . . . . . . . . . .
(23)
Profit on disposal . . . . . . . . . . . . . . . . . . . . . . . . . . . . . . . . . . . . . . . .
65
Disposal proceeds . . . . . . . . . . . . . . . . . . . . . . . . . . . . . . . . . . . . . . . .
112
Cash and cash equivalents . . . . . . . . . . . . . . . . . . . . . . . . . . . . . . . . . . .
(12)
Cash consideration . . . . . . . . . . . . . . . . . . . . . . . . . . . . . . . . . . . . . . .
100
F90
TELKOM SA LIMITED
NOTES TO THE CONSOLIDATED FINANCIAL STATEMENTS
for the three years ended March 31, 2002
35. SEGMENT INFORMATION
The inter-company transactions are reflected as net and are thus eliminated against segment results.
2000
2001
2002
Rm
Rm
Rm
Business segment
Consolidated revenue . . . . . . . . . . . . . . . . . . . . . . . . . . .
27,113
31,352
34,197
Fixed-line . . . . . . . . . . . . . . . . . . . . . . . . . . . . . . . . . .
23,838
26,439
27,976
To external customers . . . . . . . . . . . . . . . . . . . . . . . . . .
23,530
26,100
27,606
Inter-company . . . . . . . . . . . . . . . . . . . . . . . . . . . . . .
308
339
370
Mobile . . . . . . . . . . . . . . . . . . . . . . . . . . . . . . . . . . . .
4,786
6,638
8,075
To external customers . . . . . . . . . . . . . . . . . . . . . . . . . .
3,583
5,252
6,591
Inter-company . . . . . . . . . . . . . . . . . . . . . . . . . . . . . .
1,203
1,386
1,484
Elimination . . . . . . . . . . . . . . . . . . . . . . . . . . . . . . . . .
(1,511)
(1,725)
(1,854)
Consolidated operating profit . . . . . . . . . . . . . . . . . . . . . . .
3,882
4,925
4,213
Fixed-line . . . . . . . . . . . . . . . . . . . . . . . . . . . . . . . . . .
2,555
3,759
2,447
Mobile . . . . . . . . . . . . . . . . . . . . . . . . . . . . . . . . . . . .
1,182
1,277
1,816
Elimination . . . . . . . . . . . . . . . . . . . . . . . . . . . . . . . . .
145
(111)
(50)
Consolidated investment income . . . . . . . . . . . . . . . . . . . . .
641
617
490
Fixed-line . . . . . . . . . . . . . . . . . . . . . . . . . . . . . . . . . .
785
900
817
Mobile . . . . . . . . . . . . . . . . . . . . . . . . . . . . . . . . . . . .
16
13
16
Elimination . . . . . . . . . . . . . . . . . . . . . . . . . . . . . . . . .
(160)
(296)
(343)
Consolidated finance charges . . . . . . . . . . . . . . . . . . . . . . .
2,482
3,137
2,550
Fixed-line . . . . . . . . . . . . . . . . . . . . . . . . . . . . . . . . . .
2,299
2,941
2,557
Mobile . . . . . . . . . . . . . . . . . . . . . . . . . . . . . . . . . . . .
284
252
36
Elimination . . . . . . . . . . . . . . . . . . . . . . . . . . . . . . . . .
(101)
(56)
(43)
Consolidated taxation . . . . . . . . . . . . . . . . . . . . . . . . . . .
501
715
873
Fixed-line . . . . . . . . . . . . . . . . . . . . . . . . . . . . . . . . . .
244
332
278
Mobile . . . . . . . . . . . . . . . . . . . . . . . . . . . . . . . . . . . .
257
383
595
Consolidated assets . . . . . . . . . . . . . . . . . . . . . . . . . . . .
44,444
48,801
50,528
Fixed-line . . . . . . . . . . . . . . . . . . . . . . . . . . . . . . . . . .
39,900
42,943
43,588
Mobile . . . . . . . . . . . . . . . . . . . . . . . . . . . . . . . . . . . .
4,857
6,164
7,531
Elimination . . . . . . . . . . . . . . . . . . . . . . . . . . . . . . . . .
(313)
(306)
(591)
Investments . . . . . . . . . . . . . . . . . . . . . . . . . . . . . . . . .
389
576
780
Financial assets . . . . . . . . . . . . . . . . . . . . . . . . . . . . . . .
1,184
2,866
2,819
Tax assets . . . . . . . . . . . . . . . . . . . . . . . . . . . . . . . . . .
1,259
1,294
1,081
Total assets . . . . . . . . . . . . . . . . . . . . . . . . . . . . . . . . .
47,276
53,537
55,208
Consolidated liabilities . . . . . . . . . . . . . . . . . . . . . . . . . .
12,314
12,616
13,471
Fixed-line . . . . . . . . . . . . . . . . . . . . . . . . . . . . . . . . .
10,675
9,812
10,804
Mobile . . . . . . . . . . . . . . . . . . . . . . . . . . . . . . . . . .
1,952
3,110
3,408
Elimination . . . . . . . . . . . . . . . . . . . . . . . . . . . . . . . .
(313)
(306)
(741)
Interest-bearing debt . . . . . . . . . . . . . . . . . . . . . . . . . . . .
21,248
25,334
24,579
Tax liabilities . . . . . . . . . . . . . . . . . . . . . . . . . . . . . . . .
317
499
193
Total liabilities . . . . . . . . . . . . . . . . . . . . . . . . . . . . . . .
33,879
38,449
38,243
F91
TELKOM SA LIMITED
NOTES TO THE CONSOLIDATED FINANCIAL STATEMENTS
for the three years ended March 31, 2002
35. SEGMENT INFORMATION (continued)
2000
2001
2002
Rm
Rm
Rm
Other segment information
Capital expenditure for property, plant and equipment . . . . . . . . . .
9,461
9,889
9,004
Fixed line . . . . . . . . . . . . . . . . . . . . . . . . . . . . . . . .
8,468
8,297
6,962
Mobile . . . . . . . . . . . . . . . . . . . . . . . . . . . . . . . . .
993
1,592
2,042
Capital expenditure for intangible assets Mobile . . . . . . . . . . . .
5
97
Depreciation and amortization . . . . . . . . . . . . . . . . . . . . . .
4,174
5,052
5,408
Fixed line . . . . . . . . . . . . . . . . . . . . . . . . . . . . . . . .
3,625
4,234
4,373
Mobile . . . . . . . . . . . . . . . . . . . . . . . . . . . . . . . . .
549
818
1,035
Impairment loss/asset write-offs . . . . . . . . . . . . . . . . . . . . .
279
445
Fixed line . . . . . . . . . . . . . . . . . . . . . . . . . . . . . . . .
230
445
Mobile . . . . . . . . . . . . . . . . . . . . . . . . . . . . . . . . .
49
Geographical segment
Consolidated revenue . . . . . . . . . . . . . . . . . . . . . . . . . .
27,113
31,352
34,197
South Africa . . . . . . . . . . . . . . . . . . . . . . . . . . . . . . . .
27,094
31,318
33,830
Other African countries . . . . . . . . . . . . . . . . . . . . . . . . . .
19
92
370
Elimination . . . . . . . . . . . . . . . . . . . . . . . . . . . . . . . .
(58)
(3)
Consolidated operating profit . . . . . . . . . . . . . . . . . . . . . .
3,882
4,925
4,213
South Africa . . . . . . . . . . . . . . . . . . . . . . . . . . . . . . . .
3,879
4,940
4,175
Other African countries . . . . . . . . . . . . . . . . . . . . . . . . . .
3
(16)
41
Elimination . . . . . . . . . . . . . . . . . . . . . . . . . . . . . . . .
1
(3)
Consolidated assets
South Africa . . . . . . . . . . . . . . . . . . . . . . . . . . . . . . . .
47,246
53,293
54,367
Other African countries . . . . . . . . . . . . . . . . . . . . . . . . . .
36
235
894
Elimination . . . . . . . . . . . . . . . . . . . . . . . . . . . . . . . .
(6)
9
(53)
Total assets
47,276
53,537
55,208
"South Africa", which is also the country of domicile for TELKOM SA LIMITED, comprises the segment information relating to
TELKOM SA LIMITED and its subsidiaries as well as Vodacom's South African-based mobile communications network, the
segment information of its service providers and its other business segments. "Other African countries" comprises only
Vodacom's mobile communications networks in Tanzania, Lesotho and the Democratic Republic of the Congo.

F92
TELKOM SA LIMITED
NOTES TO THE CONSOLIDATED FINANCIAL STATEMENTS
for the three years ended March 31, 2002
2000
2001
2002
Rm
Rm
Rm
36. RELATED PARTIES
Balances with related parties not disclosed elsewhere
With joint venture:
Vodacom Group (Proprietary) Limited
Trade receivable . . . . . . . . . . . . . . . . . . . . . . . . . . . . . .
25
25
41
Trade payable . . . . . . . . . . . . . . . . . . . . . . . . . . . . . . .
(241)
(265)
(272)
Related party transactions with Vodacom
Income . . . . . . . . . . . . . . . . . . . . . . . . . . . . . . . . . . .
(308)
(377)
(370)
Expenses . . . . . . . . . . . . . . . . . . . . . . . . . . . . . . . . . .
1,203
1,386
1,484
Interest received . . . . . . . . . . . . . . . . . . . . . . . . . . . . . .
(51)
(39)
(36)
With shareholder:
Thintana Communications LLC
Management fees . . . . . . . . . . . . . . . . . . . . . . . . . . . . .
260
260
219
Government
Revenue . . . . . . . . . . . . . . . . . . . . . . . . . . . . . . . . . .
1,014
1,213
1,382
Trade receivable . . . . . . . . . . . . . . . . . . . . . . . . . . . . . .
333
172
134
Employees
Other receivable . . . . . . . . . . . . . . . . . . . . . . . . . . . . . .
186
165
170
With affiliate of director:
Note 25 regarding vehicle lease and note 37 regarding the Group's treasury function.

F93
TELKOM SA LIMITED
NOTES TO THE CONSOLIDATED FINANCIAL STATEMENTS
for the three years ended March 31, 2002
37. DIRECTORS' INTEREST
Mr E Molobi, the Chairman of the Board of directors at March 31, 2002, has the following interests as Chief Executive Officer
for Kagiso Trust Investments (Proprietary) Limited:
a 25% holding by Kagiso Trust Investments (Proprietary) Limited in BUA Telecoms, a company that is a vendor to the
Group;
a 25% holding by Kagiso Trust Investments (Proprietary) Limited in Debis Fleet Management (Proprietary) Limited, a fleet
management company to whom the Group has outsourced its vehicle fleet; and
a 50,1% holding by Kagiso Trust Investments (Proprietary) Limited in Kagiso Treasury Services (Proprietary) Limited, who
manages the Group's Treasury function.
2000
2001
2002
Rm
Rm
Rm
Directors' emoluments . . . . . . . . . . . . . . . . . . . . . . . . . . .
2
3
3
Executive . . . . . . . . . . . . . . . . . . . . . . . . . . . . . . . . . .
For other services . . . . . . . . . . . . . . . . . . . . . . . . . . .
2
2
2
Non-executive . . . . . . . . . . . . . . . . . . . . . . . . . . . . . . .
For services as directors . . . . . . . . . . . . . . . . . . . . . . . .
1
1
Emoluments per director:
Fringe and
Remuneration
Performance
other
Total 2001
Fees
*
bonus
benefits
Total 2002
R
R
R
R
R
R
Non-executive directors
Eric Molobi . . . . . . . . .
24,090
17,856
130,000
147,856
Dikgang Moseneke . . . . .
200,000
70,000
70,000
Wendy Luhabe . . . . . . .
31,350
52,690
52,690
Wendy Lucas Bull . . . . . .
21,780
56,320
56,320
Richard Menell . . . . . . .
10,890
47,560
47,560
Colin Smith . . . . . . . . .
50,560
50,560
Tlhalefeng Sekano . . . . .
24,232
24,232
Charles Valkin . . . . . . . .
25,330
51,730
51,730
Peter Moyo . . . . . . . . .
35,312
35,312
Diliza Mji . . . . . . . . . .
25,080
52,190
52,190
Sindy Zilwa . . . . . . . . .
13,258
13,258
Tan Sri Dato' Ir. Muhammad
Radzi Mansor . . . . . . . .
66,340
66,340
338,520
468,048
200,000
668,048
Executive directors
Sizwe Nxasana . . . . . . .
1,872,000
1,375,441
447,000
536,000
2,358,441*
Total emoluments
Paid by Telkom . . . . .
2,210,520
468,048
1,375,441
447,000
736,000
3,026,489
*
Included in remuneration is pension contribution for S. Nxasana of R156 000.
In the year ended March 31, 2002 R7,0m was paid to SBC Communications for services rendered by Thomas Barry.
In the year ended March 31, 2002 R3,6m was paid to Telkom Malaysia for services rendered by Shanmugan Manickam.
F94
TELKOM SA LIMITED
NOTES TO THE CONSOLIDATED FINANCIAL STATEMENTS
for the three years ended March 31, 2002
38. INTEREST IN SIGNIFICANT SUBSIDIARIES
Interest in
Issued share capital
issued ordinary
share capital
Country of
2000
2001
2002
2000
2001
2002
incorporation
%
%
%
Directory advertising
Telkom Directory Services (Proprietary)
Limited . . . . . . . . . . . . . . . . . .
RSA
R100 000
R100 000
R100 000
54.9
54.9
64.9
Data application services
Swiftnet (Proprietary) Limited . . . . . .
RSA
R50 000 000
R50 000 000
R50 000 000
60
60
100
The aggregate net profit of the two
subsidiaries is R117,2 (2001: R33,6,
2000: R143,2).
Vodacom has interests in the following
companies:
Cellular network operators
Vodacom (Proprietary) Limited . . . . . .
RSA
R100
R100
R100
100
100
100
Vodacom Lesotho (Proprietary) Limited .
LES
M4,180
M4,180
88.3
88.3
Vodacom Tanzania Limited . . . . . . . .
TZN
US$100
US$100
65
65
Service providers
Vodacom Service Provider Holding
Company (Proprietary) Limited (INV) . .
RSA
R1 020
R1 020
R1 020
100
100
100
Vodacom Service Provider Company
(Proprietary) Limited (C) . . . . . . . . .
RSA
R20
R20
R20
100
100
100
Globalstar Southern Africa (Proprietary)
Limited (S) * . . . . . . . . . . . . . . .
RSA
R100
R100
100
100
Vodac (Proprietary) Limited * . . . . . . .
RSA
R1
R1
R1
100
100
100
GSM Cellular (Proprietary) Limited * . .
RSA
R1 200
R1 200
R1 200
100
100
100
Other
Teljoy Holdings Limited (INV) . . . . . .
RSA
R1 160 000
R158 999
R158 999
100
100
100
Film Fun (Holdings) (Proprietary) Limited
(TV) . . . . . . . . . . . . . . . . . . . .
RSA
R100
R100
100
100
Vodacom Sport & Entertainment
(Proprietary) Limited (SE) . . . . . . . .
RSA
R100
51
Vodacom Equipment Company
(Proprietary) Limited * . . . . . . . . . .
RSA
R100
R100
R100
100
100
100
Vodacare (Proprietary) Limited * . . . . .
RSA
R100
R100
R100
100
100
100
Vodacom International Holdings
(Proprietary) Limited (INV) . . . . . . . .
RSA
R100
100
Vodacom International Limited (INV) . .
MAU
US$100
100
* Dormant at March 31, 2002.
Country of incorporation: RSA - Republic of South Africa; TZN -Tanzania; LES - Lesotho; MAU -Mauritius.
Nature of business: C - Cellular; S - Satellite; SE - Sport and entertainment contracts manager; TV - Television and related
rental services; INV - Investment holding company.
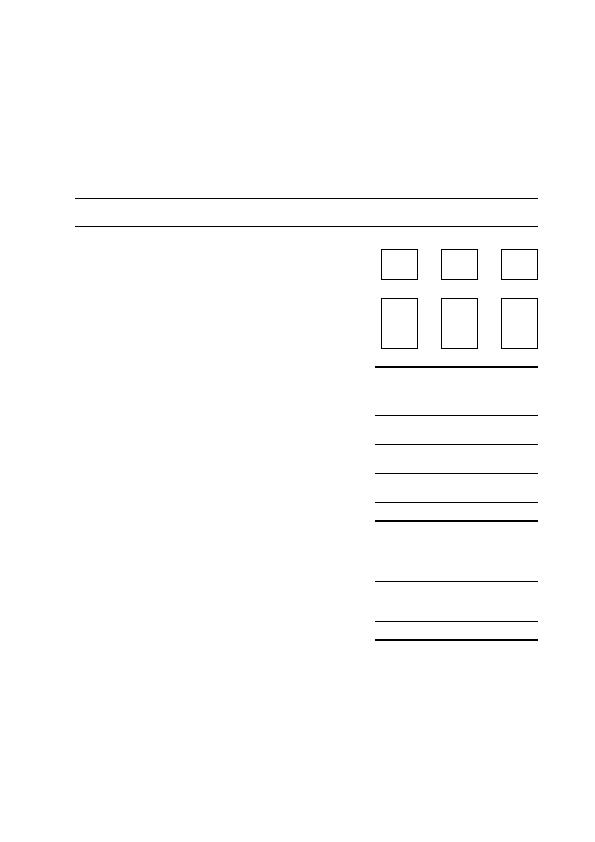
F95
TELKOM SA LIMITED
NOTES TO THE CONSOLIDATED FINANCIAL STATEMENTS
for the three years ended March 31, 2002
39. INVESTMENTS IN JOINT VENTURES
Vodacom Group (Proprietary) Limited
Telkom owns 5,000 shares of 1 cent each at cost. This amounts to a 50% shareholding in Vodacom Group (Proprietary)
Limited.
The Group's proportionate share of Vodacom's assets and liabilities is as follows:
2000
2001
2002
Rm
Rm
Rm
Total assets . . . . . . . . . . . . . . . . . . . . . . . . . . . . . . . . . .
4,932
6,171
7,679
Non-current assets . . . . . . . . . . . . . . . . . . . . . . . . . . . . . .
3,538
4,436
5,607
Current assets . . . . . . . . . . . . . . . . . . . . . . . . . . . . . . . . .
1,394
1,735
2,072
Total liabilities and reserves . . . . . . . . . . . . . . . . . . . . . . . .
(4,396)
(5,711)
(7,219)
Reserves . . . . . . . . . . . . . . . . . . . . . . . . . . . . . . . . . . . .
(1,335)
(1,753)
(2,732)
Minority interests . . . . . . . . . . . . . . . . . . . . . . . . . . . . . . .
1
6
(5)
Non-current liabilities . . . . . . . . . . . . . . . . . . . . . . . . . . . . .
(657)
(806)
(949)
Current liabilities . . . . . . . . . . . . . . . . . . . . . . . . . . . . . . .
(2,405)
(3,158)
(3,533)
Loan from joint venture partners . . . . . . . . . . . . . . . . . . . . .
536
460
460
The Group's proportionate share of revenue and expense is as follows:
Revenue . . . . . . . . . . . . . . . . . . . . . . . . . . . . . . . . . . . .
4,786
6,638
8,075
Net operating expenses . . . . . . . . . . . . . . . . . . . . . . . . . . . .
(3,588)
(5,349)
(6,243)
Profit before net financing charges . . . . . . . . . . . . . . . . . . . . . .
1,198
1,289
1,832
Net financing charges . . . . . . . . . . . . . . . . . . . . . . . . . . . . .
(284)
(252)
(36)
Net income before taxation . . . . . . . . . . . . . . . . . . . . . . . . . .
914
1,037
1,796
Taxation . . . . . . . . . . . . . . . . . . . . . . . . . . . . . . . . . . . .
(257)
(383)
(595)
Profit after taxation . . . . . . . . . . . . . . . . . . . . . . . . . . . . . .
657
654
1,201
Minority interest . . . . . . . . . . . . . . . . . . . . . . . . . . . . . . .
5
(15)
657
659
1,186
The Group's proportionate share of cash flow:
Cash flow from operating activities . . . . . . . . . . . . . . . . . . . . . .
1,171
1,805
1,908
Cash flow from investing activities . . . . . . . . . . . . . . . . . . . . . .
(1,669)
(1,426)
(2,272)
Cash flow from financing activities . . . . . . . . . . . . . . . . . . . . . .
323
(519)
285
Net decrease in cash and cash equivalents . . . . . . . . . . . . . . . . . .
(175)
(140)
(79)
Effect of exchange rate on cash and cash equivalents . . . . . . . . . . . .
48
Cash and cash equivalents at beginning of year . . . . . . . . . . . . . . .
(82)
(258)
(398)
Cash and cash equivalents at end of year . . . . . . . . . . . . . . . . . . .
(257)
(398)
(429)
Vodacom's joint ventures during 2002 included Vodacom World Online (Proprietary) Limited and Vodacom Congo. Effective
November 30, 2001, Vodacom disposed of the interest in Vodacom World Online (Proprietary) Limited. Details of the disposal
are presented in Note 32. The Group acquired its interest in Vodacom Congo on December 11, 2001.

F96
TELKOM SA LIMITED
NOTES TO THE CONSOLIDATED FINANCIAL STATEMENTS
for the three years ended March 31, 2002
40. SUBSEQUENT EVENTS
Property portfolio
In September 2002, Telkom issued an information memorandum inviting potential investors to provide, by November 2002,
preliminary submissions to purchase a substantial portion of Telkom's portfolio and enter into a sale and leaseback transaction.
This transaction is intended to further the strategy of focusing on core businesses and increasing the return on assets.
Telcordia matter
Note 26.
2% Share scheme
On the date of the initial public offering, the Government of the Republic of South Africa will transfer 2% of its
shareholding in the Company to a trust for the benefit of past and present employees.
Taxation
The South African Revenue Services ("SARS") indicated, in an assesment dated August 28, 2002, that they are disallowing thetreatment of certain income in Telkom's 1998 income tax return. The dispute related to the first time application in fiscal year
ended 1998 of Section 32 ("S32") of the Income Tax Act, 1962, which allows revenue generated by transmitting messagesinternationally to be only partly included in determining taxable income, and the deferral of unbilled revenues for tax
purposes.
On December 10, 2002, SARS agreed with Telkom's practice of claiming S32 of the Income Tax Act, 1962, for all years up to
and including March 2001. Telkom has not claimed S32 in respect of the 2002 financial year. SARS, however, disallowed
Telkom's practice of deferring certain unbilled revenue from taxable income.
The impact of the disallowance of unbilled revenue, which has been recognized as an additional income tax provision in the
Income Statement for the year ended March 31, 2002, is as follows:
Rm
Reversal of tax receivable . . . . . . . . . . . . . . .
(218)
Reversal of deferred taxation . . . . . . . . . . . . .
186
Reversal of interest accrued . . . . . . . . . . . . . .
(100)
Tax effect of interest reversal . . . . . . . . . . . . .
30
(102)
In connection with the filing of its tax return for the 2001 fiscal year, Telkom revised the basis of its calculation and increased
its estimate of the S32 benefit used for the preparation of the March 31, 2001 financial statements by an amount of R92
million. The revision has been recognized as a change in estimate and reflected as a reduction of the income tax provision for
the year ended March 31, 2002.

F97
TELKOM SA LIMITED
NOTES TO THE CONSOLIDATED FINANCIAL STATEMENTS
for the three years ended March 31, 2002
41. US GAAP INFORMATION
Differences between International Accounting Standards and US Generally Accepted Accounting Principles
The consolidated financial statements of TELKOM SA LIMITED have been prepared in accordance with International Accounting
Standards ("IAS"), which differ in certain respects from generally accepted accounting principles in the United States ("US GAAP"). Application of US GAAP would have affected the balance sheet as of March 31, 2002 and 2001 and netincome for each of the two years in the periods ended March 31, 2002 to the extent described below. A description of the
material differences between IAS and US GAAP as they relate to the Group, as well as its equity accounted investment in
Vodacom, are discussed in further detail below.
*The United States Dollar (USD) amounts shown in the footnotes have been translated at March 31, 2002 and for the year
ended March 31, 2002 from South African Rand ("ZAR") only as a matter of arithmetic computation at the South Africanexchange rate of ZAR10.535 = USD1, the buying rate on September 30, 2002, the last business day prior to the date of our
most recent balance sheet included in this submission. These amounts are unaudited and are included for the convenience of
the reader only. Such translation should not be construed as a representation that the South African Rand amounts have been
or could be converted into US Dollars at this or any other rate.
Net income and equity in accordance with US GAAP differences
The following schedule illustrates the significant adjustments to reconcile net income in accordance with IAS to the amounts
determined in accordance with US GAAP for each of the two years ended March 31, 2002 and 2001:
March 31,
March 31,
*March 31,
2001
2002
2002
Rm
Rm
US$m
Net income according to IAS . . . . . . . . . . . . . . . . . . . . . . . .
1,622
1,221
116
US GAAP adjustments Telkom:
(a) Revenue recognition . . . . . . . . . . . . . . . . . . . . . . . . . . .
(26)
29
3
(b) Sale and leaseback transaction . . . . . . . . . . . . . . . . . . . . . .
91
95
9
(c) Share issue expenses . . . . . . . . . . . . . . . . . . . . . . . . . . .
(44)
(4)
(d) Derivative financial instruments . . . . . . . . . . . . . . . . . . . . .
90
9
(e) Goodwill . . . . . . . . . . . . . . . . . . . . . . . . . . . . . . . . .
15
1
(h) Tax effect of reconciling differences . . . . . . . . . . . . . . . . . . .
(24)
(81)
(8)
(h) Additional distribution tax retained earnings . . . . . . . . . . . . .
(90)
(3)
()
(h) Capital gains tax Vodacom income . . . . . . . . . . . . . . . . . . .
(43)
(4)
US GAAP adjustments Vodacom:
(d) Derivative financial instruments . . . . . . . . . . . . . . . . . . . . .
26
2
(e) Goodwill . . . . . . . . . . . . . . . . . . . . . . . . . . . . . . . . .
(1)
(f) Joint venture accounting . . . . . . . . . . . . . . . . . . . . . . . . .
22
(40)
(4)
(g) Deferred bonus incentive scheme . . . . . . . . . . . . . . . . . . . .
4
10
1
(h) Tax effect of reconciling differences . . . . . . . . . . . . . . . . . . .
(1)
(11)
(1)
Net Income as per US GAAP before cumulative
effect of change in accounting principle . . . . . . . . . . . . . . . . . .
1,598
1,263
120
(d) Cumulative effect of a change in accounting principle
reflecting the application of SFAS 133 Telkom
(net of tax of R30m) . . . . . . . . . . . . . . . . . . . . . . . . . . .
48
4
(d) Cumulative effect of a change in accounting principle
reflecting the application of SFAS 133 Vodacom (net of tax of R3m)
6
1
Net income according to US GAAP . . . . . . . . . . . . . . . . . . . .
1,598
1,317
125
Basic and diluted EPS
The basic and diluted EPS do not differ, as there are no potentially dilutive
securities.
557,031,819 issued shares (cents)
Basic and diluted earnings per share before cumulative effect of change in
accounting principle . . . . . . . . . . . . . . . . . . . . . . . . . . . . .
286.9
226.7
21.4
Basic and diluted earnings per share for cumulative effect of change in
accounting principle . . . . . . . . . . . . . . . . . . . . . . . . . . . . .
9.8
1
Basic and diluted earnings per share . . . . . . . . . . . . . . . . . . . . .
286.9
236.5
22.4

F98
TELKOM SA LIMITED
NOTES TO THE CONSOLIDATED FINANCIAL STATEMENTS
for the three years ended March 31, 2002
41. US GAAP INFORMATION (continued)
The following is a reconciliation of the material adjustments necessary to reconcile shareholders' equity in accordance with
IAS to the amounts in accordance with US GAAP as at March 31, 2002 and 2001:
March 31,
March 31,
March 31,
2001
2002
2002
Rm
Rm
US$m
Shareholders' equity according to IAS . . . . . . . . . . . . . . . . . . .
14,972
16,832
1,598
US GAAP adjustments Telkom:
(a) Revenue recognition . . . . . . . . . . . . . . . . . . . . . . . . . . .
(1,134)
(1,105)
(105)
(b) Sale and leaseback transaction . . . . . . . . . . . . . . . . . . . . . .
(372)
(277)
(26)
(d) Derivative financial instruments . . . . . . . . . . . . . . . . . . . . .
(34)
(3)
(e) Goodwill . . . . . . . . . . . . . . . . . . . . . . . . . . . . . . . . .
15
1
(h) Tax effect of reconciling differences . . . . . . . . . . . . . . . . . . .
569
535
51
(h) Additional distribution tax retained earnings . . . . . . . . . . . . .
(360)
(423)
(40)
(h) Capital gains tax Vodacom income . . . . . . . . . . . . . . . . . .
(43)
(4)
(i) Fair value adjustment of investment . . . . . . . . . . . . . . . . . . .
45
US GAAP adjustments Vodacom:
(e) Goodwill . . . . . . . . . . . . . . . . . . . . . . . . . . . . . . . . .
2
15
1
(f) Joint venture accounting . . . . . . . . . . . . . . . . . . . . . . . . .
40
(g) Deferred bonus incentive scheme . . . . . . . . . . . . . . . . . . . .
19
29
3
(h) Tax effect of reconciling differences . . . . . . . . . . . . . . . . . . .
(5)
(9)
(1)
Shareholders' equity according to US GAAP . . . . . . . . . . . . . . .
13,776
15,535
1,475
Comprehensive income
Under US GAAP, SFAS 130 "Reporting Comprehensive Income" requires that certain items be recognized as a separate
component of equity under the caption "Accumulated Other Comprehensive income". Additionally the standard requires that
companies present comprehensive income, which is a combination of net income and changes in a company's accumulated
other comprehensive income accounts. Changes in the Group's accumulated other comprehensive income is reflected under
non-distributable reserves.
Other
Retained
comprehensive
earnings
income
Balance
Rm
Rm
Rm
Total April 1, 2000 . . . . . . . . . . . . . . . . . . . . . . . . . . . . .
3,840
3,840
Net income per US GAAP . . . . . . . . . . . . . . . . . . . . . . . . .
1,598
5,438
Increase in fair value of listed investment . . . . . . . . . . . . . . . . .
45
45
Total March 31, 2001 . . . . . . . . . . . . . . . . . . . . . . . . . . .
5,438
45
5,483
Net income per US GAAP . . . . . . . . . . . . . . . . . . . . . . . . .
1,317
6,755
Foreign currency translation adjustment . . . . . . . . . . . . . . . . . .
64
64
Increase in fair value of listed investment . . . . . . . . . . . . . . . . .
5
50
Transitional adjustment on application of SFAS 133 (net of tax of R262m)
440
Release of transitional adjustment on application of SFAS 133 to net
income for 12-month period (net of tax of R38m) . . . . . . . . . . . . .
(67)
373
Total March 31, 2002 . . . . . . . . . . . . . . . . . . . . . . . . . . .
6,755
487
7,242

F99
TELKOM SA LIMITED
NOTES TO THE CONSOLIDATED FINANCIAL STATEMENTS
for the three years ended March 31, 2002
41. US GAAP INFORMATION (continued)
Movement in shareholders' equity in accordance with US GAAP
March 31,
March 31,
March 31,
2001
2002
2002
Rm
Rm
US$m
Shareholders' equity according to US GAAP
Balance April 1 . . . . . . . . . . . . . . . . . . . . . . . . . . . . . . . .
12,133
13,776
1,308
Net income for year . . . . . . . . . . . . . . . . . . . . . . . . . . . . . .
1,598
1,317
125
Foreign currency reserves . . . . . . . . . . . . . . . . . . . . . . . . . . .
64
6
Fair value adjustments derivatives . . . . . . . . . . . . . . . . . . . . .
373
35
Fair value adjustments investments . . . . . . . . . . . . . . . . . . . . .
45
5
1
Balance March 31 . . . . . . . . . . . . . . . . . . . . . . . . . . . . . .
13,776
15,535
1,475
US GAAP income statement, balance sheet and cash flow statement
March 31,
March 31,
March 31,
2001
2002
2002
Rm
Rm
US$m
Income statements as per US GAAP
Net revenue per IAS accounts . . . . . . . . . . . . . . . . . . . . . . .
31,352
34,197
3,246
Net revenue per US GAAP . . . . . . . . . . . . . . . . . . . . . . . .
26,413
27,947
2,653
Operating income per IAS accounts . . . . . . . . . . . . . . . . . . . .
4,925
4,213
400
Operating income per US GAAP . . . . . . . . . . . . . . . . . . . . .
3,716
2,498
237
Income after financial items per IAS accounts . . . . . . . . . . . . . . .
2,405
2,153
204
Income after financial items per US GAAP . . . . . . . . . . . . . . .
1,433
618
58
Equity accounted earnings per US GAAP . . . . . . . . . . . . . . . .
684
1,177
112
Taxes per IAS accounts . . . . . . . . . . . . . . . . . . . . . . . . . . .
715
873
83
Taxes per US GAAP . . . . . . . . . . . . . . . . . . . . . . . . . . . .
446
434
41
Minority interests per IAS accounts . . . . . . . . . . . . . . . . . . . .
68
59
6
Minority interests per US GAAP . . . . . . . . . . . . . . . . . . . . .
73
44
4
Net income per IAS accounts . . . . . . . . . . . . . . . . . . . . . . . .
1,622
1,221
116
Net income per US GAAP . . . . . . . . . . . . . . . . . . . . . . . .
1,598
1,317
125
Balance sheets as per US GAAP
Non-current assets per IAS accounts . . . . . . . . . . . . . . . . . . . .
40,863
44,240
4,199
Non-current assets per US GAAP . . . . . . . . . . . . . . . . . . . .
38,444
41,714
3,960
Current assets per IAS accounts . . . . . . . . . . . . . . . . . . . . . .
12,674
10,968
1,041
Current assets per US GAAP . . . . . . . . . . . . . . . . . . . . . . .
11,080
9,229
876
Total assets per US GAAP . . . . . . . . . . . . . . . . . . . . . . . . . .
49,524
50,943
4,836
Equity per IAS accounts . . . . . . . . . . . . . . . . . . . . . . . . . .
14,972
16,832
1,598
Equity per US GAAP . . . . . . . . . . . . . . . . . . . . . . . . . . .
13,776
15,535
1,475
Minority interests per IAS accounts . . . . . . . . . . . . . . . . . . . .
116
133
13
Minority interests per US GAAP . . . . . . . . . . . . . . . . . . . . .
122
128
12
Long-term liabilities per IAS accounts . . . . . . . . . . . . . . . . . . .
23,009
25,597
2,430
Long-term liabilities per US GAAP . . . . . . . . . . . . . . . . . . .
22,212
24,649
2,340
Current liabilities per IAS accounts . . . . . . . . . . . . . . . . . . . .
15,447
12,646
1,200
Current liabilities per US GAAP . . . . . . . . . . . . . . . . . . . . .
13,414
10,631
1,009
Total equity and liabilities per US GAAP . . . . . . . . . . . . . . . . . .
49,524
50,943
4,836

F100
TELKOM SA LIMITED
NOTES TO THE CONSOLIDATED FINANCIAL STATEMENTS
for the three years ended March 31, 2002
41. US GAAP INFORMATION (continued)
March 31,
March 31,
March 31,
2001
2002
2002
Rm
Rm
US$m
Cash flow as per US GAAP
Cash flow from operating activities . . . . . . . . . . . . . . . . . . . . .
5,875
7,099
674
Cash generated from operations . . . . . . . . . . . . . . . . . . . . . . .
7,455
7,959
755
Income from investments . . . . . . . . . . . . . . . . . . . . . . . . . . .
444
459
44
Dividends received . . . . . . . . . . . . . . . . . . . . . . . . . . . . . .
240
23
Net financing charges paid . . . . . . . . . . . . . . . . . . . . . . . . . .
(1,983)
(1,416)
(134)
Taxation paid . . . . . . . . . . . . . . . . . . . . . . . . . . . . . . . . .
(41)
(143)
(14)
Cash flow from investing activities . . . . . . . . . . . . . . . . . . . . .
(8,112)
(7,128)
(677)
Cash flow from financing activities . . . . . . . . . . . . . . . . . . . . .
2,017
(905)
(86)
Net decrease in net cash and cash equivalents . . . . . . . . . . . . . . . .
(220)
(934)
(89)
Net cash and cash equivalents at beginning of year . . . . . . . . . . . . .
1,485
1,265
120
Net cash and cash equivalents at end of year . . . . . . . . . . . . . . . .
1,265
331
31
(a) Revenue recognition
The Staff of the US Securities and Exchange Commission issued Staff Accounting Bulletin 101 ("SAB 101") thataddresses revenue recognition under US GAAP. Under this guidance, revenue earned from access, installation-activation
and similar fees should be recognized over the estimated life of the customer relationship. Also, SAB 101 permits, but
does not require, companies to defer costs directly associated with such revenue and to also recognize these costs over the
life of the customer relationship. Under IAS the Group recognizes this revenue and related costs when the services are
provided and the related costs are incurred.
In accordance with the US GAAP, revenue earned from installation and activation is deferred and recognised over
the expected period of the customer relationship. The expected period of the customer relationship is 5 years
(2001 8,5 years) for telephony voice customers and 4 years (2001 4 years) for data customers.
The Group recognizes installation and activation costs, excluding those costs that are capitalized as an integral part of the
network, in the period incurred. These adjustments resulted in a decrease of R26m to income and increase to income of
R29m in 2001 and 2002, respectively.
(b) Sale and lease-back
As discussed in Note 25 on March 31, 2000, the company outsourced its entire fleet of vehicles as well as the
maintenance, fueling, insurance, tracking and other services to debis through a sale and lease-back agreement. The lease-
back was in the form of a master service level agreement covering a period of five years providing, subject to the
company's requirements, for the annual lease contracts for each vehicle under the agreement.
Under the provisions of IAS 17, the Group recorded a gain from a transaction that had transferred substantially all of the
risks and rewards incidental to ownership of the vehicles to debis as the criteria for profit recognition had been satisfied.
The Group recognized a gain in the amount of R463m in 2000 and accounted for the lease-backs as operating leases.
Under US GAAP, SFAS 13, as amended by SFAS 28, the Group determined that while the terms of the agreement
provide that the assets underlying the lease-back would be subject to annual lease contract, renewable based upon the
company's vehicle requirements and cancelable under certain terms, debis' right of first refusal to provide all of the
Group's requirements during the five-year term represents an economic compulsion to renew the leases. Accordingly, the
Group concluded that since the lease-back cover substantially all the assets that were sold under the contract for
substantially all their remaining useful lives, deferral of the related gain and recognition over the terms of the related
agreements was appropriate.
Based on the requirements of SFAS 13, a selected portion of the vehicle leases would be treated as finance leases due to
the fact that when analyzed on a vehicle by vehicle basis, the present value of the minimum lease payments of certain
individual vehicles exceed 90% of the fair value of these vehicles or the lease term represents more than 75% of the
remaining economic life of the vehicles. Accordingly, the full gain realized through the sale of the vehicles has been
reversed and the proceeds from the sale has been treated as an obligation. Rental payments have been applied to interest
expense on the obligation as well as to reduce the principal amount of the obligation. The resulting capital lease assets are
being depreciated over their remaining useful lives.

F101
TELKOM SA LIMITED
NOTES TO THE CONSOLIDATED FINANCIAL STATEMENTS
for the three years ended March 31, 2002
41. US GAAP INFORMATION (continued)
March 31,
March 31,
March 31,
2001
2002
2002
Rm
Rm
US$m
Retained earnings opening balance profit reversal . . . . . . . . . .
(463)
(372)
(35)
Recognition of profit income . . . . . . . . . . . . . . . . . . . . .
93
93
9
Depreciation adjustment . . . . . . . . . . . . . . . . . . . . . . . . .
(20)
(9)
(1)
Finance costs . . . . . . . . . . . . . . . . . . . . . . . . . . . . . .
(2)
(1)
Add back: Lease expense . . . . . . . . . . . . . . . . . . . . . . . .
20
12
1
Net impact on income statement per period . . . . . . . . . . . . . .
91
95
9
Retained earnings ending balance . . . . . . . . . . . . . . . . . . . .
(372)
(277)
(26)
Balance sheet
Capital lease assets
April 1, 2000 . . . . . . . . . . . . . . . . . . . . . . . . . . . . . .
29
Depreciation . . . . . . . . . . . . . . . . . . . . . . . . . . . . . . .
(20)
March 31, 2001 . . . . . . . . . . . . . . . . . . . . . . . . . . . . .
9
1
Depreciation . . . . . . . . . . . . . . . . . . . . . . . . . . . . . . .
(9)
(1)
March 31, 2002 . . . . . . . . . . . . . . . . . . . . . . . . . . . . .
Capital lease liability . . . . . . . . . . . . . . . . . . . . . . . . . .
11
(c) Share issue expenses
Under IAS, external costs directly attributable to the issue of new shares are shown as a deduction, net of tax in equity.
This is only allowed under US GAAP however, when the proposed listing has not been delayed more than 90 days after
incurring these costs. In 2002, Telkom's IPO was postponed more than 90 days. Therefore the costs incurred through
March 31, 2002 related to the IPO of R44m have been expensed.
(d) Derivative financial instruments
SFAS133 Fair value adjustments
The Group adopted IAS 39 and SFAS 133 on April 1, 2001. Upon adoption of IAS 39, the difference between previous
carrying amounts and the fair value of derivatives, which prior to the adoption of IAS 39 had been designated as cash
flow hedges or fair value hedges but which do not qualify for hedge accounting under IAS 39, is recognized as an
adjustment to the opening balance of retained earnings in the financial year IAS 39 is initially applied. Changes in the fair
value of derivatives subsequent to April 1, 2001 are recorded in the income statement as they do not qualify for hedge
accounting.
Under US GAAP, in accordance with SFAS 133, the company is required to recognize all derivatives on the balance sheet
at fair value. The SFAS 133 transitional adjustments (at April 1, 2001) are recorded differently than those recorded under
IAS 39. For pre-existing hedge relationships that would be considered cash flow type hedges, the transitional adjustment
should be reported in OCI as a cumulative effect of the accounting change. Any transition adjustment reported as a
cumulative effect adjustment in OCI will subsequently be reclassified into earnings in a manner consistent with the
earnings effect of the hedged transaction. For pre-existing hedge relationships that would be considered fair value type
hedges, the company adjusted the carrying values of the hedged item to its fair value, but only to the extent of an
offsetting transition adjustment from the previously designated hedging instrument. The hedged asset or liability is
subsequently accounted for in a manner consistent with the appropriate accounting for such assets and liabilities. For both
cash flow and fair value hedges any portion of the derivative that is considered ineffective at transition is reported in
income as a cumulative effect of an accounting change.

F102
TELKOM SA LIMITED
NOTES TO THE CONSOLIDATED FINANCIAL STATEMENTS
for the three years ended March 31, 2002
41. US GAAP INFORMATION (continued)
(d) Derivative financial instruments (continued)
Upon adoption on April 1, 2001, the Group recorded an adjustment to other comprehensive income of R440m (net of tax
of R262m) representing the fair value adjustment of derivatives for which the pre-existing hedge relationships would be
considered cash flow type hedges. In the 2002 fiscal year, subsequent to the adoption date, the Group reclassified from
other comprehensive income into earnings R67m (net of tax of R38m) as the hedged transaction impacted earnings. Upon
adoption, the Group also recorded an adjustment of R45m to increase the carrying value of a hedged debt instrument that
was the hedged item in what would be considered a fair value type hedge. The fair value adjustment to the hedged item is
limited to the extent of an off-setting fair value adjustment to the hedging instrument. In the 2002 fiscal year, the Group
amortised R11m of the adjustment to the hedged debt instrument into earnings. Upon adoption, the Group recorded a
cumulative effect of change in accounting principle, R54m (net of tax of R33m) representing the ineffective portion of
adjustments to record derivatives at fair value.
(e) Goodwill
Under IAS, goodwill arising on the acquisition of a foreign entity is treated as an asset of the Group and translated at the
foreign exchange rate in effect at transaction date. In accordance with IAS the Group amortizes goodwill and other
intangibles on a straight-line basis over the anticipated benefit period.
Under US GAAP, goodwill arising on the acquisition of a foreign entity is translated at the actual exchange rate at the end
of the period. Furthermore, under US GAAP with effect from July 1, 2001 goodwill and other intangibles with infinite
lives are not amortized for business combinations completed after June 30, 2001. For previously recorded goodwill and
intangibles with infinite lives, amortization ceases on March 31, 2002.
The Group is required to adopt SFAS 142 "Accounting for Goodwill and Other Intangibles" effective April 1, 2002. The
Group is required to complete the initial step of a transitional impairment test on all goodwill and indefinite lived
intangible assets as of April 1, 2002 within six months of adoption of SFAS 142. Subsequent impairment losses will be
reflected in operating income or loss in the income statement.
Management determined that an impairment of R16m existed with respect to the step acquisition of the minority interest
of Swiftnet which will be recognised as a cumulative effect of accounting change in the 2003 fiscal year.
(f)
Joint venture accounting
Under IAS, investments qualifying as joint ventures are accounted for under the proportionate consolidation method of
accounting. Under the proportionate consolidation method, the venturer records its share of each of the assets, liabilities,
income and expenses of the jointly controlled entity on a line-by-line basis with similar items in the venturer's financial
statements.
The venturer continues to record its total share of the losses in excess of the net investment in the joint venture.
However for US GAAP purposes where the joint ventures are equity accounted, losses are only recognized up to the net
investment in the joint venture, unless the investor has committed to continue providing financial support to the investee.
In 2001 and 2002, in accordance with IAS, the Group proportionately consolidated losses of R22m and R18m,
respectively, that were in excess of the Group's net investment in the joint venture. Under US GAAP these losses are not
recorded for reasons previously stated. The investment was disposed in 2002 and the gain on the sale for IAS purposes
was calculated based on a lower investment balance, resulting in excess gain of R40m compared with US GAAP.

F103
TELKOM SA LIMITED
NOTES TO THE CONSOLIDATED FINANCIAL STATEMENTS
for the three years ended March 31, 2002
41. US GAAP INFORMATION (continued)
Vodacom equity accounted earnings
Under IAS, the Group's interests in joint ventures are proportionally consolidated. Under US GAAP, interest in joint
ventures not meeting the criteria for accommodation under item 17 of Form 20-F should be reflected in the consolidated
financial statements using the equity method. The following table sets out the restated abbreviated income statement and
balance sheet of the Group joint venture company, Vodacom, after US GAAP adjustments:
March 31,
March 31,
March 31,
2001
2002
2002
Rm
Rm
US$m
Income statements as per US GAAP
Operating income . . . . . . . . . . . . . . . . . . . . . . . . . . .
2,604
3,641
346
Income after financial items . . . . . . . . . . . . . . . . . . . . . .
2,126
3,585
340
Taxes . . . . . . . . . . . . . . . . . . . . . . . . . . . . . . . . . .
(886)
(1,446)
(137)
Minority interests . . . . . . . . . . . . . . . . . . . . . . . . . . .
9
(30)
(3)
Net income before accounting changes . . . . . . . . . . . . . . . .
1,249
2,109
200
Change in accounting policy . . . . . . . . . . . . . . . . . . . . .
11
1
Net income for year . . . . . . . . . . . . . . . . . . . . . . . . . .
1,249
2,120
201
Balance sheets as per US GAAP
Non-current assets . . . . . . . . . . . . . . . . . . . . . . . . . . .
8,974
11,429
1,085
Current assets . . . . . . . . . . . . . . . . . . . . . . . . . . . . .
3,465
3,990
379
Total assets . . . . . . . . . . . . . . . . . . . . . . . . . . . . . . .
12,439
15,419
1,464
Equity . . . . . . . . . . . . . . . . . . . . . . . . . . . . . . . . .
3,195
4,874
463
Minority interests . . . . . . . . . . . . . . . . . . . . . . . . . . .
(11)
11
1
Liabilities . . . . . . . . . . . . . . . . . . . . . . . . . . . . . . .
9,255
10,534
1,000
Total equity and liabilities . . . . . . . . . . . . . . . . . . . . . . .
12,439
15,419
1,464
(g) Deferred bonus incentive scheme
Under IAS, the total value of deferred bonus entitlements as calculated at the end of each financial period are provided for
in full on the balance sheet date, based on the net present value of expected future cash flows. Under US GAAP,
compensation cost should be recognized over the service period or the vesting period if the service period is not defined,
based on the undiscounted value of the entitlements.

F104
TELKOM SA LIMITED
NOTES TO THE CONSOLIDATED FINANCIAL STATEMENTS
for the three years ended March 31, 2002
41. US GAAP INFORMATION (continued)
(h) Income taxes
Deferred tax benefits and liabilities are calculated, when applicable, for the differences between IAS and US GAAP.
Telkom is taxed at a corporate tax rate of 30% on taxable income. Telkom incurs an additional Secondary Tax on
Companies ("STC") at a rate of 12.5% on any dividends distributed to shareholders. The dividend tax is payable if andonly when dividends are distributed. Neither the Company nor the shareholders receive any future tax benefits as a result
of additional tax on dividends paid. As required under IAS, Telkom will recognize the tax effects of dividends when
distributed in future. Under US GAAP, consistent with the requirements of EITF 95-9, the company measures its income
tax expense, including the tax effect of temporary differences, using the tax rate that includes the dividend tax. STC is
calculated on retained income after the 1992 fiscal year after deducting the net gains from certain capital transactions as
defined and after giving credit for dividends received from Vodacom and other subsidiaries for which the Group had paid
the related STC tax. The following is the reconciliation of the tax expense computed using the statutory tax rate of 30% to
the effective rate of 70% (31% 2001):
March 31,
March 31,
March 31,
2001
2002
2002
Rm
Rm
US$m
Income before tax per US GAAP . . . . . . . . . . . . . . . . . . .
1,433
618
59
Expected income tax expense at statutory rate of 30% . . . . . . . .
430
186
18
Adjustments due to STC on retained income . . . . . . . . . . . . .
94
26
2
Exempt income . . . . . . . . . . . . . . . . . . . . . . . . . . . .
(375)
(1)
Unutilized tax losses . . . . . . . . . . . . . . . . . . . . . . . . . .
7
(11)
(1)
Disallowable expenses . . . . . . . . . . . . . . . . . . . . . . . . .
296
264
25
Temporary differences in joint venture . . . . . . . . . . . . . . . .
(6)
(11)
(1)
Under provision for prior year . . . . . . . . . . . . . . . . . . . . .
(62)
(6)
Adjustment on possible CGT Vodacom earnings . . . . . . . . . .
43
4
Effective tax . . . . . . . . . . . . . . . . . . . . . . . . . . . . . .
446
434
41
With respect to the Group's investment in Vodacom SFAS109 requires that deferred taxes be recognized for the effect
of the excess of the amount of financial reporting over the tax basis of such investment. According to South African tax
law, the Group would be required to pay tax at a rate of 37.78% on any increase in the appreciation in the value of its
investment since October 1, 2001. As such, deferred taxes have been recognized on the Group's share of the undistributed
earnings of Vodacom since October 1, 2001.

F105
TELKOM SA LIMITED
NOTES TO THE CONSOLIDATED FINANCIAL STATEMENTS
for the three years ended March 31, 2002
41. US GAAP INFORMATION (continued)
Deferred tax
The tax effects of the US GAAP adjustments relating to Telkom's operations have been calculated based on a tax rate
of 37.78%.
A reconciliation of the deferred tax balances under IAS to the amounts determined under US GAAP where materially
different is as follows:
March 31,
March 31,
March 31,
2001
2002
2002
Rm
Rm
US$m
Net deferred tax asset per IAS . . . . . . . . . . . . . . . . . . . . .
853
549
52
Additional distribution tax . . . . . . . . . . . . . . . . . . . . . . . .
(360)
(423)
(40)
CGT on equity investee . . . . . . . . . . . . . . . . . . . . . . . . .
(43)
(4)
Tax effect of US GAAP adjustments . . . . . . . . . . . . . . . . . .
569
535
51
Net deferred tax asset per US GAAP . . . . . . . . . . . . . . . . . .
1,062
618
59
(i)
Employee benefits
There is a difference in treatment of the transitional asset/liability on adoption of the statements under IAS and US GAAP.
In terms of FAS 87, this is amortised on a straight-line basis over the remaining lifetime of the fund effective from April
1, 1989. In terms of IAS 19, if this is a "liability" or deficit, this is either recognized immediately or alternatively
amortised over a period of five years. In the event of an asset arising, the full amount is recognized immediately.
Furthermore, IAS 19 determines that the employer limits the extent of any asset recognized on the balance sheet by the
employer to the true economic benefit available, whereas FAS 87 does not. To the extent that the "expense" calculated
under FAS 87 is lower than the actual contribution made, an asset will build up in the company accounts. IAS 19 does in
fact recognize the SA legislative position on surplus in allowing the limitation of the extent of any asset recognized to
such as is available for the economic benefit of the employer. As no surplus has been apportioned to the employer, in
terms of IAS 19, the asset is limited to zero. This has the impact of adjusting the expense coming through the income
statement to the employer's actual contribution for the period concerned. The effect of these differences has been
immaterial to the US GAAP reconciliation.

F106
TELKOM SA LIMITED
NOTES TO THE CONSOLIDATED FINANCIAL STATEMENTS
for the three years ended March 31, 2002
41. US GAAP INFORMATION (continued)
The disclosure of the retirement fund and pension fund unrecognized asset would be as follows under US GAAP:
March 31,
March 31,
March 31,
2001
2002
2002
Rm
Rm
US$m
Telkom retirement fund
Present value of the funded obligation . . . . . . . . . . . . . . . . .
2,586
3,055
290
Fair value of plan asset . . . . . . . . . . . . . . . . . . . . . . . . .
(2,979)
(3,805)
(361)
Funded status . . . . . . . . . . . . . . . . . . . . . . . . . . . . . .
(393)
(750)
(71)
Unrecognized net actuarial gain . . . . . . . . . . . . . . . . . . . . .
214
437
41
Unrecognized surplus . . . . . . . . . . . . . . . . . . . . . . . . . .
(179)
(313)
(30)
Telkom pension fund
Present value of the funded obligation . . . . . . . . . . . . . . . . .
137
113
11
Fair value of plan asset . . . . . . . . . . . . . . . . . . . . . . . . .
(185)
(190)
(18)
Funded status . . . . . . . . . . . . . . . . . . . . . . . . . . . . . .
(48)
(77)
(7)
Unrecognized net actuarial gain . . . . . . . . . . . . . . . . . . . . .
48
53
5
Unrecognized surplus . . . . . . . . . . . . . . . . . . . . . . . . . .
(24)
(2)
Additional US GAAP disclosures
Concentration of risks
The Group is party to collective bargaining agreements with unions covering the employment terms and conditions of a
significant part of their employees. Approximately 35% of the company employees are members of the Alliance of Telkom
Union and 37% of the company employees are members of the Communication Workers Union. These employees are bound
to follow the decisions of the Union. The Group has an excellent working relationship with the unions and to date, there have
been no significant disruptions to operations due to union activities.
The company has various commercial contracts with suppliers of goods and services which at a high level can be classified
into IT, Network, Commercial (inclusive of outsourced entities), Training and other. The contracts are on a three monthly basis
assessed by means of a formal risk assessment model in order to determine relevant risk exposure. Risk exposure is evaluated
against the following criteria:
the value of the contract/company spend to date;
impact of supplier/service provider of key strategic initiatives of the company;
level/intensity of associated maintenance/support received from technology suppliers;
the period that a specific technology is already introduced into the network;
the extent of customization by the company on standard technical functionality provided by supplier/service provider;
level of foreign exposure in currency associated with the product/service offering; and
inherent business and financial risk associated with a supplier.
The Group is currently the sole holder of the license to provide public switched telephony services within South Africa and
therefore the customer base is diverse and spread across the country. Telkom has embarked on a process of signing long-term
contracts with significant customers.
There is a concentration of credit risk relating to the significant number of derivative contracts entered into with international
financial institutions with a rating of A1 or better and where derivative fair market values in favour of Telkom with an
individual institution represents at least 20% of the total value of all derivative contracts in favour of Telkom. The accounting
loss the Company would incur if no amounts were recovered at March 31, 2002 is R2,6bn. The concentration developed due to
the significant depreciation of the Rand since the transactions were entered into. It is the intention of management to reduce
this concentration. No further transactions will be entered into with the affected counter-parties until a diverse group of
counter-parties is restored. Options to reduce the significant concentration are continuously being evaluated.

F107
TELKOM SA LIMITED
NOTES TO THE CONSOLIDATED FINANCIAL STATEMENTS
for the three years ended March 31, 2002
41. US GAAP INFORMATION (continued)
There has been no indication of a significant change in any factors since the reporting date that would significantly impact
estimates made by management in the most recent set of financial statements.
Restructuring
During the two years ended March 31, 2002, the Group had recognized the cost of restructuring charges associated with
management's plan to reduce the size of its work force to a comparable level for world-class telecommunication companies.
The plan involved the termination of employees, which the Group expects to be substantially completed within a period
of 12 months.
The 2002 plan affects 748 employees who will cease their services during 2002/2003 and were still employed by the
Group at year-end. These employees include operating personnel and product development and corporate staff.
For the periods April 1, 1999 to March 31, 2002 1670 employees have been affected by this process.
The following table provides a roll forward of restructuring provisions recognized by the Group during the two-year period
ended March 31, 2002:
March 31,
March 31,
March 31,
2001
2002
2002
Rm
Rm
US$m
Restructuring provision beginning of year . . . . . . . . . . . . . . . . .
Increase in provision . . . . . . . . . . . . . . . . . . . . . . . . . . . . .
132
373
35
Workforce reduction payments . . . . . . . . . . . . . . . . . . . . . . . .
(132)
(338)
(32)
Restructuring provision end of year . . . . . . . . . . . . . . . . . . . .
35
3
As part of the Company's realignment initiatives it reached agreement with Telecommunication Facilities Management
Company ("TFMC") on July 31, 2000 to outsource the following two business units:Facilities Infrastructure and Operations Services (FIO); and Property Asset Management and Development Services
(PAMDEV).
Telkom also outsourced and sold its fleet consisting of 18,686 vehicles, as well as workshops and other equipment,
as a going concern, to debis Fleet Management. The Agreement entered into by Telkom and debis Fleet Management
on the March 31, 2000 is effective for a period of five years.
Restrictions on dividend payouts
The following is a reconciliation of retained earnings per US GAAP to the amount of unrestricted retained earnings:
March 31,
March 31,
March 31,
2001
2002
2002
Rm
Rm
US$m
Retained earnings per US GAAP . . . . . . . . . . . . . . . . . . . . . . .
5,438
6,755
641
Share of retained earnings in significant investee . . . . . . . . . . . . . .
(1,754)
(2,678)
(254)
Cell Captive investment . . . . . . . . . . . . . . . . . . . . . . . . . . . .
_
(35)
(3)
Unrestricted retained earnings under US GAAP . . . . . . . . . . . . . . .
3,684
4,042
384
All distributable earnings are available for distribution based on the Group's dividend policy. The Board of Directors of
Telkom decides on an annual basis the amount of earnings to be reinvested in the operations and the amount of any remaining
funds that are available for distribution to shareholders.
F108
TELKOM SA LIMITED
NOTES TO THE CONSOLIDATED FINANCIAL STATEMENTS
for the three years ended March 31, 2002
41. US GAAP INFORMATION (continued)
Retained earnings of our investee, Vodacom is restricted, since we require the consent of other shareholders in order to require
Vodacom to declare dividends. Restricted retained earnings included in the March 31, 2002 balance amount to R2,678m.
Telkom has invested funds in a Cell Captive which will be used to fund future post-retirement medical aid costs. These funds
will be used for that purpose only and are therefore not distributable.
Leases
The Group leases certain buildings, vehicles and equipment. The bulk of the lease terms negotiated for equipment-related
premises are ten years with other leases signed for five years and three years. The bulk of non-equipment-related premises are
for three to ten years. The majority of the leases normally contain an option clause entitling Telkom to renew the lease
agreements for a period usually equal to the main lease term.
The minimum lease payments under these agreements are subject to annual escalations, which range from 8% to 12%.
Penalties in terms of lease agreements are only payable should Telkom vacate a premises and negotiate to terminate the lease
agreement prior to the expiry date, in which case a settlement payment will be negotiated in accordance with the market
conditions and location of the premises. Lease agreements are not signed for any contingency purposes. Future minimum lease
payments under operating leases are included in note 25.
As discussed above, at March 31, 2000 the Group entered into a sale and leaseback of its vehicle fleet with debis, part of
which is being accounted for under US GAAP as capital leases. While no minimum usage clause exists in this contract as
presented in Note 25, the Group is deemed to be economically compelled under US GAAP to renew such leases based upon
their historical requirements and contractual obligations to source any such requirements during the contract period
from debis.

F109
TELKOM SA LIMITED
NOTES TO THE CONSOLIDATED FINANCIAL STATEMENTS
for the three years ended March 31, 2002
41. US GAAP INFORMATION (continued)
In accordance with the agreement the Group is not allowed to lease any similar vehicles as those specified in the contract from
any other service provider during the five-year period.
The current contract does not have a forced renewal option. Any continued involvement after March 31, 2005 will be
renegotiated at the time of expiry of the current contract. The contract is structured to have no lease increases on vehicles that
are continually leased from debis. If a vehicle is however replaced by a new similar vehicle the lease payment is increased with
a percentage increase based on the South African Consumer Price Index at the time. The operating commitments at March 31,
2002 are as follows:
Buildings
Equipment
Vehicles
Total
Rm
Rm
Rm
Rm
2003 . . . . . . . . . . . . . . . . . . . . . . . . . . . . .
184
17
809
1,010
2004 . . . . . . . . . . . . . . . . . . . . . . . . . . . . .
103
18
810
931
2005 . . . . . . . . . . . . . . . . . . . . . . . . . . . . .
66
825
891
2006 . . . . . . . . . . . . . . . . . . . . . . . . . . . . .
56
56
2007 . . . . . . . . . . . . . . . . . . . . . . . . . . . . .
57
57
> 5 years . . . . . . . . . . . . . . . . . . . . . . . . . . .
217
217
Total . . . . . . . . . . . . . . . . . . . . . . . . . . . . .
683
35
2,444
3,162
The finance lease commitments at March 31, 2002 are as follows:
Buildings
Equipment
Vehicles
Total
Rm
Rm
Rm
Rm
2003 . . . . . . . . . . . . . . . . . . . . . . . . . . . . .
54
54
2004 . . . . . . . . . . . . . . . . . . . . . . . . . . . . .
60
60
2005 . . . . . . . . . . . . . . . . . . . . . . . . . . . . .
66
66
2006 . . . . . . . . . . . . . . . . . . . . . . . . . . . . .
72
72
2007 . . . . . . . . . . . . . . . . . . . . . . . . . . . . .
79
79
> 5 years . . . . . . . . . . . . . . . . . . . . . . . . . . .
1,823
1,823
Total . . . . . . . . . . . . . . . . . . . . . . . . . . . . .
2,154
2,154
Investments
The pertinent rights and privileges of the various securities outstanding have been disclosed in the financial statements. The
Group requires no collateral or other security on repurchase agreements or securities lending transactions.
Pensions
For purposes of US GAAP, pension costs for defined benefit plans are accounted for in accordance with SFAS 87 "Employers'
Accounting for Pensions" and the disclosure is presented in accordance with SFAS 132 "Employers Disclosures about
Pensions and Other Post-retirement Benefits". Presented below are the disclosures required by US GAAP that are different
from that provided under IAS. Except as described below, the plan liabilities and assets are the same under US GAAP as IAS.
The difference in the balance sheet and income statements amounts are attributable to how and when the respective standards
were implemented.

F110
TELKOM SA LIMITED
NOTES TO THE CONSOLIDATED FINANCIAL STATEMENTS
for the three years ended March 31, 2002
41. US GAAP INFORMATION (continued)
The net periodic pension costs includes the following components:
March 31,
March 31,
March 31,
2001
2002
2002
Rm
Rm
US$m
Service cost on benefits earned:
Interest cost on projected benefit obligations . . . . . . . . . . . . . . . . .
285
324
31
Expected return on plan assets . . . . . . . . . . . . . . . . . . . . . . . .
(436)
(444)
(42)
Amortization of transitional obligation . . . . . . . . . . . . . . . . . . . .
1
Amortization of unrecognized net gain . . . . . . . . . . . . . . . . . . . .
(20)
Net periodic pension costs . . . . . . . . . . . . . . . . . . . . . . . . . .
(170)
(120)
(11)
The status of the pension plan is as follows:
March 31,
March 31,
March 31,
2001
2002
2002
Rm
Rm
US$m
Benefit obligation:
At beginning of year . . . . . . . . . . . . . . . . . . . . . . . . . . . . .
2,332
2,586
245
Interest cost . . . . . . . . . . . . . . . . . . . . . . . . . . . . . . . . . .
285
324
31
Benefits paid and net cash flow . . . . . . . . . . . . . . . . . . . . . . . .
(106)
145
14
Actuarial gain . . . . . . . . . . . . . . . . . . . . . . . . . . . . . . . . .
75
Benefit obligation at end of year . . . . . . . . . . . . . . . . . . . . . . .
2,586
3,055
290
Plan assets at fair value:
At beginning of year . . . . . . . . . . . . . . . . . . . . . . . . . . . . .
2,924
2,980
283
Expected return on plan assets (2001 actual return) . . . . . . . . . . . . .
(323)
444
42
Net cash flows . . . . . . . . . . . . . . . . . . . . . . . . . . . . . . . . .
379
381
36
Plan assets at fair value at end of year . . . . . . . . . . . . . . . . . . . .
2,980
3,805
361
There is no difference in the benefit obligation at March 31, 2002 between US GAAP and IAS.
Healthcare costs
In addition to the Group's defined benefit pension plan, the Group sponsors a defined benefit healthcare plan that provides
post-retirement medical benefits to full-time employees who have worked for the Company and joined before June 30, 2000.
All employees joining after June 30, 2000 do not qualify for any post-retirement health care subsidies. The plan is
contributory, with retiree contributions adjusted annually. The Group's policy is to fund the cost of medical benefits in amounts
determined at the discretion of management.
The contribution liability is calculated as the present value of the future contributions after retirement. The Rand cap on the
subsidy applicable to active members and post-1994 continuation members has been assumed to escalate at salary inflation.

F111
TELKOM SA LIMITED
NOTES TO THE CONSOLIDATED FINANCIAL STATEMENTS
for the three years ended March 31, 2002
41. US GAAP INFORMATION (continued)
The assumed future investment returns has a significant effect on the amounts reported. A one-percentage-point change in the
assumed healthcare cost trend rate would have the following effects:
One-percentage-
point movement
Impact on total of service and interest cost components in 2002 . . . . . . . . . . . . . . . . . . .
R26m
Impact on post-retirement benefit obligation as of 2002 . . . . . . . . . . . . . . . . . . . . . . .
R294m
Statement of income classification items
US GAAP requires the disclosure of certain income statement items:
March 31,
March 31,
March 31,
2001
2002
2002
Rm
Rm
US$m
Revenues from other services . . . . . . . . . . . . . . . . . . . . . . . . .
(20,658)
(21,520)
(2,043)
Income from rentals . . . . . . . . . . . . . . . . . . . . . . . . . . . . . .
(593)
(599)
(57)
Net sales of tangible products . . . . . . . . . . . . . . . . . . . . . . . .
(131)
(120)
(12)
Income from Government . . . . . . . . . . . . . . . . . . . . . . . . . .
(891)
(1,288)
(122)
Income from related parties . . . . . . . . . . . . . . . . . . . . . . . . . .
(4,140)
(4,420)
(419)
Total operating revenue . . . . . . . . . . . . . . . . . . . . . . . . . . . .
(26,413)
(27,947)
(2,653)
Total revenue from services . . . . . . . . . . . . . . . . . . . . . . . . .
(26,282)
(27,827)
(2,641)
Subscription and connection . . . . . . . . . . . . . . . . . . . . . . . .
(4,055)
(4,283)
(407)
Domestic (local and long distance) . . . . . . . . . . . . . . . . . . . . .
(8,280)
(8,670)
(823)
Fixed to mobile . . . . . . . . . . . . . . . . . . . . . . . . . . . . . . .
(6,845)
(7,323)
(695)
International outgoing . . . . . . . . . . . . . . . . . . . . . . . . . . .
(1,284)
(1,175)
(111)
Interconnection . . . . . . . . . . . . . . . . . . . . . . . . . . . . . . .
(1,855)
(1,798)
(171)
Data . . . . . . . . . . . . . . . . . . . . . . . . . . . . . . . . . . . . .
(3,312)
(3,891)
(369)
Directories and other . . . . . . . . . . . . . . . . . . . . . . . . . . . .
(651)
(687)
(65)
Revenue from product sales . . . . . . . . . . . . . . . . . . . . . . . .
(131)
(120)
(12)
Total revenue . . . . . . . . . . . . . . . . . . . . . . . . . . . . . . . . .
(26,413)
(27,947)
(2,653)
Costs of services . . . . . . . . . . . . . . . . . . . . . . . . . . . . . . .
13,478
13,780
1,308
Cost of tangible products sold . . . . . . . . . . . . . . . . . . . . . . . .
232
232
22
Other operating expenses and SG&A . . . . . . . . . . . . . . . . . . . .
8, 987
11,437
1,086
Total operating expense . . . . . . . . . . . . . . . . . . . . . . . . . . . .
22,697
25,449
2,416
Dividends received . . . . . . . . . . . . . . . . . . . . . . . . . . . . . .
(240)
(300)
(28)
Net interest and amortization of debt discount and expense . . . . . . . . .
2,070
1,830
174

F112
TELKOM SA LIMITED
NOTES TO THE CONSOLIDATED FINANCIAL STATEMENTS
for the three years ended March 31, 2002
41. US GAAP INFORMATION (continued)
Statement of balance sheet classification items
US GAAP requires the disclosure of certain balance sheet items:
March 31,
March 31,
March 31,
2001
2002
2002
Rm
Rm
US$m
Trade receivables . . . . . . . . . . . . . . . . . . . . . . . . . . . . . . .
4,184
4,038
383
Receivables from dividends and interest . . . . . . . . . . . . . . . . . . .
295
303
29
Prepayments . . . . . . . . . . . . . . . . . . . . . . . . . . . . . . . . . .
103
124
12
Other receivables . . . . . . . . . . . . . . . . . . . . . . . . . . . . . . .
444
252
24
Total receivables . . . . . . . . . . . . . . . . . . . . . . . . . . . . . . .
5,026
4,717
448
Amounts payable for advisory, management and service fee . . . . . . . .
(9)
(23)
(2)
Amounts payable to controlled companies . . . . . . . . . . . . . . . . . .
(582)
(566)
(54)
Amounts payable to affiliates . . . . . . . . . . . . . . . . . . . . . . . . .
(100)
(150)
(14)
Trade creditors . . . . . . . . . . . . . . . . . . . . . . . . . . . . . . . .
(902)
(1,666)
(158)
Restructuring liability . . . . . . . . . . . . . . . . . . . . . . . . . . . . .
(35)
(3)
Other amounts payable . . . . . . . . . . . . . . . . . . . . . . . . . . . .
(3,505)
(3,438)
(327)
Total payable . . . . . . . . . . . . . . . . . . . . . . . . . . . . . . . . .
(5,098)
(5,878)
(558)
Allowances
The following allowances, discounts and finance charges have been netted off against balance sheet items as disclosed
in the IAS financial statements for Telkom:
March 31,
March 31,
March 31,
2001
2002
2002
Rm
Rm
US$m
Gross accounts receivable . . . . . . . . . . . . . . . . . . . . . . . . . .
5,392
5,236
497
Provision for bad debts . . . . . . . . . . . . . . . . . . . . . . . . . . . .
(366)
(519)
(49)
Closing balance accounts receivable . . . . . . . . . . . . . . . . . . . . .
5,026
4,717
448
Provision for bad debts
Opening balance . . . . . . . . . . . . . . . . . . . . . . . . . . . . . . .
493
366
35
Movement in provision . . . . . . . . . . . . . . . . . . . . . . . . . . . .
671
965
91
Write-off against provision . . . . . . . . . . . . . . . . . . . . . . . . . .
(798)
(812)
(77)
Closing balance bad debts provision . . . . . . . . . . . . . . . . . . . . .
366
519
49
Gross inventory . . . . . . . . . . . . . . . . . . . . . . . . . . . . . . .
714
465
44
Provision for obsolete stock deducted . . . . . . . . . . . . . . . . . . . .
(52)
(40)
(4)
Closing balance inventory . . . . . . . . . . . . . . . . . . . . . . . . . .
662
425
40
Provision for obsolete stock
Opening balance . . . . . . . . . . . . . . . . . . . . . . . . . . . . . . .
112
52
5
Movement in provision . . . . . . . . . . . . . . . . . . . . . . . . . . . .
105
84
8
Write-off against provision . . . . . . . . . . . . . . . . . . . . . . . . . .
(165)
(96)
(9)
Closing balance inventory . . . . . . . . . . . . . . . . . . . . . . . . . .
52
40
4

F113
TELKOM SA LIMITED
NOTES TO THE CONSOLIDATED FINANCIAL STATEMENTS
for the three years ended March 31, 2002
41. US GAAP INFORMATION (continued)
Acquisitions of minority interests
On April 1, 2001, the Group acquired the remaining 40% interest in Swiftnet for R22 million. The transaction has been
accounted for as a step acquisition of minority interest in accordance with APB Opinion No. 16. Because the minority interest
was carried at zero on the Group's consolidated financial statements, the Group has allocated the entire purchase price to
goodwill which is being amortized over a period of five years.
On October 11, 2001, the Group acquired an additional 10% interest in Telkom Directory Services for R160 million.
The transaction has been accounted for as a step acquisition of minority interest in accordance with SFAS 141.
The excess of the purchase price over the proportionate net book value acquired, comprising principally of working
capital and debt, of R125 million has been allocated to goodwill. SFAS 141 considers goodwill as a non-amortizing
asset, but requires such asset to be subject to an annual impairment test.
Had the step acquisition of minority interest described above been completed at the beginning of each of the two fixed years in
the period ended March 31, 2002, Telkom's pro forma results of operations would have been as follows:
March 31,
March 31,
March 31,
2001
2002
2002
Rm
Rm
US$m
Net revenues . . . . . . . . . . . . . . . . . . . . . . . . . . . . . . . . .
26,413
27,947
2,653
Income before cumulative effect of change in accounting principles . . . .
1,600
1,272
121
Net income . . . . . . . . . . . . . . . . . . . . . . . . . . . . . . . . . .
1,600
1,326
126
Basic and diluted earnings per share (cents) . . . . . . . . . . . . . . . . .
287
238
23
Adoption of new accounting standards
Effective April 1, 2001, the Group adopted SFAS133 "Accounting for Derivative Instruments and Hedging Activities",
as amended. The effects of adoption of the standard have been included in the reconciliation of net income and shareholders'
equity above and described in note (e) thereto. The Group also adopted SFAS 141 "Accounting for Business Combinations"
for all acquisitions consummated after June 30, 2001.
Recently issued accounting standards
Under US GAAP, accounting for goodwill and intangible assets was substantially the same as IAS until the adoption of
SFAS 141 and SFAS 142: "Goodwill and Other Intangible Assets". SFAS 141 is effective for all business acquisitions
consummated after June 30, 2001. SFAS 141 requires all business combinations consummated after June 30, 2001 to be
accounted for under the purchase method. SFAS 141 also sets forth guidelines for applying the purchase method of accounting
in the determination of intangible assets, including goodwill, acquired in a business combination.
SFAS 142 addresses the initial and ongoing financial accounting and reporting for acquired goodwill and other intangible
assets. SFAS 142 requires that goodwill be separately disclosed from other intangible assets in the balance sheet, and no longer
be amortized but tested for impairment at least annually (or more frequently if impairment indicators arise). SFAS 142 is
effective for financial statements for periods beginning on or after December 15, 2001. Additionally, the amortization
provisions of SFAS 142 are applicable to goodwill arising in all business acquisitions consummated after June 30, 2001
regardless of the adoption date of SFAS 142. Accordingly, goodwill arising from the increased investment in Telkom Directory
Services is not subject to amortization.
The Group has adopted SFAS 142 on April 1, 2002. The Group is required to complete the initial step of a transitional
impairment test within six months of adoption of SFAS 142. Management has completed the financial assessment of goodwill
for impairment and determined that an impairment of R16 million existed with respect to the step acquisition of the minority
interest in Swiftnet, which will be recognized as a cumulative effect of accounting change in fiscal 2003. Subsequent
impairment losses will be reflected in operating income or loss in the income statement.
In August 2001, the FASB issued SFAS 143, "Accounting for Obligations Associated with the Retirement of Long-Lived
Assets". SFAS 143 addresses financial accounting and reporting for the retirement obligation of an asset. This statement states
that companies should recognize the asset retirement cost, at their fair value, as part of the cost of the asset and classify the
accrued amount as a liability in the consolidated balance sheet. The asset retirement liability is then accreted to the ultimate
F114
payout as interest expense. The initial measurement of the liability would be subsequently updated for revised estimates of the
discounted cash outflows. The Statement will be effective for fiscal years beginning after June 15, 2002. The Group does not
expect the application of SFAS 143 to have a material effect on its US GAAP earnings and position.
In October 2001, the FASB issued SFAS 144, "Accounting for the Impairment or Disposal of Long-Lived Assets".
SFAS 144 addresses financial accounting and reporting for the impairment of long-lived assets and for long-lived assets to be
disposed. The Statement will be effective for fiscal years beginning after December 15, 2001. The Group does not expect the
application of SFAS 144 to have a material effect on its US GAAP earnings and position.
In April 2002, the FASB issued SFAS 145 "Rescission of SFAS 4, 44, and 64, Amendment of SFAS. 13, and Technical
Corrections". This Statement rescinds SFAS 4 "Reporting Gains and Losses from Extinguishment of Debt", and an
amendment of that Statement, SFAS 64, "Extinguishments of Debt Made to Satisfy Sinking-Fund Requirements".
SFAS144 also rescinds SFAS 44, "Accounting for Intangible Assets of Motor Carriers". SFAS 144 amends SFAS 13,
"Accounting for Leases", to eliminate an inconsistency between the required accounting for sale-leaseback transactions and the
required accounting for certain lease modifications that have economic effects that are similar to sale-leaseback transactions.
This Statement also amends other existing authoritative pronouncements to make various technical corrections, clarify
meanings, or describe their applicability under changed conditions. The Group does not expect the application
of SFAS 145 to have a material effect on its US GAAP earnings and financial position.
In 2002, the FASB issued SFAS 146 "Accounting for Costs Associated with Exit or Disposal Activities". This Statement
addresses the financial accounting and reporting for costs associated with exit or disposal activities and nullifies
EITF Issue No 94-3 "Liability Recognition for Certain Employee Termination Benefits and Other Costs to Exit an Activity
(including Certain Costs Incurred in a Restructuring)". SFAS 146 requires that a liability for a cost associated with an exit or
disposal activity be recognized when the liability is incurred. This liability does not arise when the Company has only
committed to a plan, the fundamental criteria of EITF 94-3. In addition, fair value is the objective for initial measurement of
the liability. This standard is effective for exit or disposal activities that are initiated after December 31, 2002, with early
application encouraged. The Group does not expect the application of SFAS 146 to have a material effect on its US GAAP
earnings and financial position.
In November 2002, the Emerging Issues Task Force reached a final consensus related to Revenue Arrangements with Multiple
Deliveries (EITF 00-21). The consensus requires that revenue arrangements with multiple deliverables should be divided into
separate units of accounting if (a) a delivered item has value to the customer on a stand alone basis, (b) there is objective and
reliable evidence of the fair value of the undelivered item and (c) if the arrangement includes a general right of return, delivery
or performance of the undelivered items is considered probable and substantially in the control of the vendor. Arrangement
consideration should be allocated among the separate units of accounting based on their relative fair value and appropriate
revenue recognition criteria would be applied to each separate unit of accounting. The Group has not yet determined what
effect, if any, EITF 00-21 would have on revenue and net income determined in accordance with US GAAP. The Task Force
agreed the effective date for the consensus will be for all revenue arrangements entered into in fiscal periods beginning after
June 15, 2003, with early adoption permitted. Telkom will adopt EITF 00-21 for their fiscal year beginning
April 1, 2004.

F115
P.O. Box:
35296
P.O. Box:
11007
MENLO PARK 0102
HATFIELD 0028
Tel: (012) 429 0000
Tel: (012) 482 0000
Fax:
(012) 429 0100
Fax: (012) 460 3633
REPORT OF THE INDEPENDENT AUDITORS
to the members of Vodacom Group (Proprietary) Limited
We have audited the accompanying consolidated balance sheets of Vodacom Group (Proprietary) Limited and subsidiaries
("the Group") as of March 31, 2000, 2001 and 2002 and the related consolidated statements of income, changes in equity and cash flows for each of the three years in the period ended March 31, 2002 set out in pages F116 to F183. These financial
statements are the responsibility of the Company's management. Our responsibility is to express an opinion on these financial
statements based on our audits.
We conducted our audits in accordance with auditing standards generally accepted in the United States of America. Those standards
require that we plan and perform the audit to obtain reasonable assurance about whether the financial statements are free of material
misstatement. An audit includes examining, on a test basis, evidence supporting the amounts and disclosures in the financial
statements. An audit also includes assessing the accounting principles used and significant estimates made by management, as well
as evaluating the overall financial statement presentation. We believe that our audits provide a reasonable basis for our opinion.
In our opinion, the consolidated financial statements, referred to above, present fairly, in all material respects, the financial
position of the Group as at March 31, 2000, 2001 and 2002, and the results of their operations and their cash flows for each
of the three years in the period ended March 31, 2002, in conformity with International Accounting Standards and in the
manner required by the Companies Act in South Africa.
Without qualifying our opinion above we draw attention to Note 44 containing certain restatements and adjustments regarding the
consolidated financial statements of the Group as issued previously.
Furthermore, as discussed in Note 24 to the financial statements, in 2002 the Group changed its accounting policy for financial
instruments to conform to International Accounting Standard 39 Financial Instruments: Recognition and measurement.
In addition, International Accounting Standards vary in certain significant respects from accounting principles generally
accepted in the United States of America. The application of the latter would have affected the determination of net income
profit for each of the two years in the period ended March 31, 2002 and the determination of shareholders' equity
at March 31, 2001 and March 31, 2002, to the extent summarised in Note 45 to the consolidated financial statements.
Pricewaterhouse Coopers Inc
Deloitte & Touche
Registered Accountants and Auditors
Registered Accountants and Auditors
Chartered Accountants (SA)
Chartered Accountants (SA)
Pretoria Pretoria
June 11, 2002, except for Note 44 for
June 11, 2002, except for Note 44 for
which the date is October 15, 2002
which the date is October 15, 2002
A complete list of partners is available from any of our offices
Joint auditors
PricewaterhouseCoopers Inc
Chartered Accountants (SA)
Registered Accountants and Auditors
(Registration no 1998/012055/21)
Deloitte & Touche Chartered Accountants (SA)
Registered accountants and auditors

F116
VODACOM GROUP (PROPRIETARY) LIMITED
CONSOLIDATED INCOME STATEMENTS
for the three years ended March 31, 2002
2000
2001
2002
Notes
(Restated)
(Restated)
(Restated)
Rm
Rm
Rm
Revenue . . . . . . . . . . . . . . . . . . . . . . . . . . . . .
1
9,571.6
13,276.4
16,150.7
Direct network operating cost . . . . . . . . . . . . . . . . . .
(4,701.4)
(6,916.4)
(8,464.6)
Depreciation . . . . . . . . . . . . . . . . . . . . . . . . . . .
(1,025.3)
(1,364.1)
(1,857.3)
Other operating income . . . . . . . . . . . . . . . . . . . . .
14.5
48.5
29.2
Staff expenses . . . . . . . . . . . . . . . . . . . . . . . . . .
(648.6)
(950.6)
(1,135.2)
Marketing and advertising expenses . . . . . . . . . . . . . . .
(596.5)
(514.6)
(542.0)
General administration expenses . . . . . . . . . . . . . . . . .
(306.7)
(541.1)
(403.4)
Amortisation of intangible assets . . . . . . . . . . . . . . . .
2
(73.6)
(271.5)
(212.7)
Integration costs, disposals of operations and impairments . . .
3
129.
3
(213.2)
56.4
Profit from operations . . . . . . . . . . . . . . . . . . . . .
4
2,363.3
2,553.4
3,621.1
Interest and dividends received . . . . . . . . . . . . . . . . . .
6
32.0
25.4
32.0
Net finance costs . . . . . . . . . . . . . . . . . . . . . . . . .
7
(567.2)
(504.5)
(59.8)
Profit before taxation . . . . . . . . . . . . . . . . . . . . . .
1,828.1
2,074.3
3,593.3
Taxation . . . . . . . . . . . . . . . . . . . . . . . . . . . . . .
8
(513.6)
(765.7)
(1,190.7)
Profit after taxation . . . . . . . . . . . . . . . . . . . . . . .
1,314.5
1,308.6
2,402.6
Minority interest . . . . . . . . . . . . . . . . . . . . . . . . .
0.5
9.2
(29.6)
Net profit from ordinary activities . . . . . . . . . . . . . . .
33
1,315.0
1,317.8
2,373.0
2000
2001
2002
(Restated)
(Restated)
(Restated)
R
R
R
Basic and diluted earnings per share . . . . . . . . . . . . .
33
131 500
131 780
237 300
F117
VODACOM GROUP (PROPRIETARY) LIMITED
CONSOLIDATED BALANCE SHEETS
at March 31, 2002
2000
2001
2002
Notes
(Restated)
(Restated)
(Restated)
Rm
Rm
Rm
ASSETS
Non-current assets . . . . . . . . . . . . . . . . . . . . . . .
7,076.2
8,871.6
11,213.3
Property, plant and equipment . . . . . . . . . . . . . . . . .
9
5,854.1
7,696.2
9,896.6
Intangible assets . . . . . . . . . . . . . . . . . . . . . . . .
10
939.0
822.9
796.3
Investments . . . . . . . . . . . . . . . . . . . . . . . . . .
11
15.7
13.4
22.7
Acquired business held for sale . . . . . . . . . . . . . . . .
12
121.6
Deferred taxation . . . . . . . . . . . . . . . . . . . . . . .
13
145.8
339.1
497.7
Current assets . . . . . . . . . . . . . . . . . . . . . . . . . .
2,787.6
3,470.2
4,145.3
Foreign currency derivatives . . . . . . . . . . . . . . . . . .
39
12.7
0.8
215.6
Inventory . . . . . . . . . . . . . . . . . . . . . . . . . . . .
14
222.1
398.4
306.0
Accounts receivable . . . . . . . . . . . . . . . . . . . . . .
15
1,616.7
2,273.4
2,845.9
Short-term investments . . . . . . . . . . . . . . . . . . . .
11
58.6
Bank and cash balances . . . . . . . . . . . . . . . . . . . .
32
936.1
797.6
719.2
Total assets . . . . . . . . . . . . . . . . . . . . . . . . . . . .
9,863.8
12,341.8
15,358.6
EQUITY AND LIABILITIES
Capital and reserves . . . . . . . . . . . . . . . . . . . . . .
2,671.1
3,506.0
5,463.8
Ordinary share capital . . . . . . . . . . . . . . . . . . . . .
16
Non-distributable reserves . . . . . . . . . . . . . . . . . . .
17
0.6
(2.3)
106.1
Retained earnings . . . . . . . . . . . . . . . . . . . . . . .
2,670.5
3,508.3
5,357.7
Minority interest . . . . . . . . . . . . . . . . . . . . . . . .
18
(2.2)
(11.4)
10.6
Non-current liabilities . . . . . . . . . . . . . . . . . . . . . .
1,311.5
1,580.2
1,894.4
Interest bearing debt . . . . . . . . . . . . . . . . . . . . . .
19
817.2
896.1
780.2
Deferred taxation . . . . . . . . . . . . . . . . . . . . . . .
13
455.6
607.5
926.2
Provisions . . . . . . . . . . . . . . . . . . . . . . . . . . .
23
38.7
76.6
188.0
Current liabilities . . . . . . . . . . . . . . . . . . . . . . . .
5,883.4
7,267.0
7,989.8
Shareholder loans . . . . . . . . . . . . . . . . . . . . . . .
20
1,070.0
920.0
920.0
Accounts payable . . . . . . . . . . . . . . . . . . . . . . .
21
1,754.7
3,152.8
3,201.7
Taxation payable . . . . . . . . . . . . . . . . . . . . . . . .
560.1
810.0
351.6
Non-interest bearing debt . . . . . . . . . . . . . . . . . . .
22
4.3
32.4
4.3
Provisions . . . . . . . . . . . . . . . . . . . . . . . . . . .
23
198.7
273.8
319.5
Dividends payable . . . . . . . . . . . . . . . . . . . . . . .
0.1
483.8
600.0
Short-term interest bearing debt . . . . . . . . . . . . . . . .
19
844.4
0.5
1,015.9
Bank overdraft and other short-term debt . . . . . . . . . . .
32
1,451.1
1,593.7
1,576.8
Total equity and liabilities . . . . . . . . . . . . . . . . . . .
9,863.8
12,341.8
15,358.6
COMMITMENTS AND CONTINGENT LIABILITIES . . . .
34-36

F118
VODACOM GROUP (PROPRIETARY) LIMITED
CONSOLIDATED STATEMENTS OF CHANGES IN EQUITY
for the three years ended March 31, 2002
Share capital
Retained
Non-
Total
and premium
earnings
distributable
reserves
(Restated)
(Restated)
(Restated)
(Restated)
Rm
Rm
Rm
Rm
BALANCE AT APRIL 1, 1999 . . . . . . . . . . . . . . . .
1,355.5
1,355.5
Net profit for year . . . . . . . . . . . . . . . . . . . . .
1,315.0
1,315.0
Net gains and losses not recognised in the income
statement (Note 17)
Foreign currency translation reserve . . . . . . . . . . .
0.6
0.6
BALANCE AT MARCH 31, 2000 . . . . . . . . . . . . . .
2,670.5
0.6
2,671.1
Net profit for year . . . . . . . . . . . . . . . . . . . . .
1,317.8
1,317.8
Dividends declared . . . . . . . . . . . . . . . . . . . . .
(480.0)
(480.0)
Net gains and losses not recognised in the income
statement (Note 17)
Foreign currency translation reserve . . . . . . . . . . .
(2.9)
(2.9)
BALANCE AT MARCH 31, 2001 . . . . . . . . . . . . . .
3,508.3
(2.3)
3,506.0
Change in accounting policy (Note 24) . . . . . . . . . .
84.9
84.9
BALANCE AT MARCH 31, 2001 RESTATED . . . . . .
3,593.2
(2.3)
3,590.9
Net profit for year . . . . . . . . . . . . . . . . . . . . .
2,373.0
2,373.0
Dividends declared . . . . . . . . . . . . . . . . . . . . .
(600.0)
(600.0)
Contingency reserve . . . . . . . . . . . . . . . . . . . .
(8.5)
8.5
Net gains and losses not recognised in the income
statement (Note 17)
Foreign currency translation reserve . . . . . . . . . . .
119.8
119.8
Foreign currency translation reserve
deferred taxation . . . . . . . . . . . . . . . . . . . .
(19.9)
(19.9)
BALANCE AT MARCH 31, 2002 . . . . . . . . . . . . . .
5,357.7
106.1
5,463.8

F119
VODACOM GROUP (PROPRIETARY) LIMITED
CONSOLIDATED CASH FLOW STATEMENTS
for the three years ended March 31, 2002
2000
2001
2002
Notes
(Restated)
(Restated)
(Restated)
Rm
Rm
Rm
CASH FLOW FROM OPERATING ACTIVITIES
Cash receipts from customers . . . . . . . . . . . . . . . . .
9,619.1
12,664.8
15,583.1
Cash paid to suppliers and employees . . . . . . . . . . . . .
(6,437.1)
(8,001.2)
(9,395.0)
CASH GENERATED FROM OPERATIONS . . . . . . . .
25
3,182.0
4,663.6
6,188.1
Finance costs paid . . . . . . . . . . . . . . . . . . . . . . .
26
(554.3)
(497.9)
(374.1)
Interest income received . . . . . . . . . . . . . . . . . . . .
31.3
25.4
26.5
Taxation paid . . . . . . . . . . . . . . . . . . . . . . . . . .
27
(318.3)
(567.6)
(1,539.1)
Integration costs . . . . . . . . . . . . . . . . . . . . . . . .
(13.7)
Dividends paid shareholders . . . . . . . . . . . . . . . . .
(480.0)
Dividends paid minority shareholders in subsidiaries . . . .
(6.3)
Dividends received . . . . . . . . . . . . . . . . . . . . . . .
0.7
NET CASH FLOWS FROM OPERATING ACTIVITIES . . .
2,341.4
3,609.8
3,815.1
CASH FLOW FROM INVESTING ACTIVITIES
Additions to property, plant and equipment . . . . . . . . . .
28
(2,693.2)
(2,834.9)
(4,409.1)
Proceeds on disposal of property, plant and equipment . . . .
61.7
83.0
92.4
Acquisition of intangible assets . . . . . . . . . . . . . . . .
10
(10.5)
(193.7)
Disposal of subsidiaries . . . . . . . . . . . . . . . . . . . .
29
1.7
Acquisition of subsidiaries . . . . . . . . . . . . . . . . . .
29
(699.3)
(113.8)
(0.1)
Disposal of joint ventures . . . . . . . . . . . . . . . . . . .
30
51.8
23.3
Acquisition of joint ventures . . . . . . . . . . . . . . . . .
30
(120.7)
Disposal/(Acquisition) of other investments . . . . . . . . .
(126.1)
18.0
Other investing activities . . . . . . . . . . . . . . . . . . .
(1.0)
(4.9)
(57.8)
Disposal of internet division . . . . . . . . . . . . . . . . . .
31
199.8
NET CASH FLOWS UTILISED IN INVESTING ACTIVITIES
(3,337.5)
(2,852.6)
(4,543.3)
CASH FLOW FROM FINANCING ACTIVITIES
Shareholder loans repaid . . . . . . . . . . . . . . . . . . . .
(150.0)
Interest bearing debt incurred . . . . . . . . . . . . . . . . .
1,120.6
570.6
Interest bearing debt repaid . . . . . . . . . . . . . . . . . .
(459.4)
(847.4)
Non-interest bearing debt repaid . . . . . . . . . . . . . . .
(16.9)
Finance lease capital repaid . . . . . . . . . . . . . . . . . .
(15.1)
(23.9)
NET CASH FLOWS FROM/(UTILISED) IN FINANCING
ACTIVITIES . . . . . . . . . . . . . . . . . . . . . . . . . . .
646.1
(1,038.2)
570.6
NET DECREASE IN CASH AND CASH EQUIVALENTS .
(350.0)
(281.0)
(157.6)
Cash and cash equivalents at beginning of year . . . . . . . .
(164.5)
(515.0)
(796.1)
Effect of foreign exchange rate changes . . . . . . . . . . . .
(0.5)
(0.1)
96.1
CASH AND CASH EQUIVALENTS AT END OF YEAR . .
32
(515.0)
(796.1)
(857.6)
VODACOM GROUP (PROPRIETARY) LIMITED
NOTES TO THE CONSOLIDATED FINANCIAL STATEMENTS
for the three years ended March 31, 2002
BASIS OF PREPARATION
These consolidated annual financial statements have been prepared in accordance with International Accounting Standards and
have been prepared on the historical cost basis, unless otherwise indicated. The consolidated annual financial statements have
been presented in South African Rands, as this is the currency in which the majority of the Group's transactions are denominated.
The principal accounting policies are consistent in all material respects with those applied in the previous period, except where
disclosed elsewhere.
Certain restatements and adjustments were effected to these financial statements from those previously issued by the Group.
Those restatements and adjustments that had a material effect on the financial statements are disclosed in Note 44.
The following are the principal accounting policies adopted by the Group in the preparation of these consolidated annual
financial statements:
ACCOUNTING POLICIES
1.
CONSOLIDATION
1.1
Basis of consolidation
The consolidated annual financial statements include the consolidated financial position, results of operations and cash
flows of Vodacom Group (Proprietary) Limited and its subsidiaries, both foreign and domestic, up to March 31, 2002.
Joint ventures are included using the proportionate consolidation method, whereby the Group's share of the assets,
liabilities, income, expenses and cash flows of joint ventures are combined on a line-by-line basis with similar items
in the consolidated annual financial statements.
Subsidiaries and joint ventures where control is intended to be temporary, as they are acquired and held exclusively
with a view to their subsequent disposal in the near future or the subsidiary or joint venture is operating under severe
long-term restrictions, which significantly impairs its ability to transfer funds, are not consolidated, or proportionately
consolidated. Such subsidiaries and joint ventures are accounted for as investments in terms of the accounting policy
for Financial Instruments. The Group, however, does not speculate in the acquisition and disposal of investments.
Minority interests in the consolidated balance sheet and income statement are separately presented.
Goodwill, on the acquisition of subsidiaries and joint ventures is accounted for in accordance with the Group's
accounting policy for Intangible Assets set out below.
1.2
Business combinations
Acquisitions in a business combination
Business combination acquisitions are accounted for using the purchase method of accounting, whereby the
acquisition is accounted for at its cost plus any costs directly attributable to the acquisition. Cost represents
the cash or cash equivalents paid or the fair value, at the date of the acquisition, of the purchase consideration.
Business combinations include the acquisition of subsidiaries and joint ventures.
On acquisition, the identifiable assets and liabilities of the relevant subsidiaries or joint ventures are measured
based upon the Group's interest in their fair value at the date of acquisition.
Disposals in a business combination
On subsequent disposal, the profit or loss on disposal is the difference between the selling price and the fair
value of net assets and liabilities disposed of, adjusted for any related goodwill to the extent that it has
not been amortised in the consolidated income statement in accordance with the Group's accounting policies.
1.3
Subsidiaries
Subsidiaries are those entities controlled by the Group. Control is presumed to exist where the Group has an interest
of more than one-half of the voting rights and the power to control the financial and operating activities of the entities
so as to obtain benefits from its activities. All subsidiaries are consolidated.
Inter-company balances and transactions, and resulting unrealised profits between Group companies, are eliminated
in full on consolidation.
F120
VODACOM GROUP (PROPRIETARY) LIMITED
NOTES TO THE CONSOLIDATED FINANCIAL STATEMENTS
for the three years ended March 31, 2002
1.
CONSOLIDATION (continued)
1.3
Subsidiaries (continued)
Where necessary, accounting policies of subsidiaries are adjusted to ensure that the consolidated annual financial
statements are prepared using uniform accounting policies.
Investments in subsidiaries are consolidated from the date on which the Group has power to exercise control,
up to the date on which power to exercise control ceases.
1.4
Joint ventures
Joint ventures, for the purpose of these consolidated annual financial statements, are those entities in which the Group
has joint control through a contractual arrangement with one or more other venturers.
Investments in joint ventures are proportionately consolidated from the date on which the Group has power to exercise
joint control, up to the date on which power to exercise joint control ceases.
The Group's proportionate share of inter-company balances and transactions, and resulting unrealised profit or losses,
between Group companies and jointly controlled entities are eliminated on consolidation.
2.
PROPERTY, PLANT AND EQUIPMENT
Property, plant and equipment are stated at cost less accumulated depreciation and any accumulated impairment losses. Land
is not depreciated and is recorded at cost.
Cost of property, plant and equipment includes all directly attributable expenditure incurred in the acquisition, establishment
and installation of such assets so as to bring them to a working condition for their intended use. Interest costs are not
capitalised.
Depreciation is calculated so as to write off the cost of property, plant and equipment on a straight-line basis, over their
estimated useful lives to its estimated residual value. Depreciation commences when the asset is ready for its intended use
(in the case of infrastructure assets this is deemed to be the date of acceptance). The estimated useful lives of depreciable
property, plant and equipment are as follows:
General purpose buildings
50 years
Special purpose buildings
15 years
Infrastructure
GSM
8 years
Value added services equipment
8 years
Value added services software
3 years
Community services
Containers
5 years
Cellular equipment
2 years
Information services
Equipment
4 years
Software
3 years
SIM centre
4 years
Office automation
2 - 3 years
Other assets
Motor vehicles
4 years
Furniture and fittings
5 years
Office equipment
4 years
General purpose buildings are classified as owner-occupied. They are therefore held at cost and depreciated as property,
plant and equipment, and not regarded as investment properties.
Assets held under finance leases are depreciated over their expected useful lives on the same basis as owned assets or, where
shorter, the term of the relevant lease if there is no reasonable certainty that the Group will obtain ownership by the end of
the lease term.
F121
F122
VODACOM GROUP (PROPRIETARY) LIMITED
NOTES TO THE CONSOLIDATED FINANCIAL STATEMENTS
for the three years ended March 31, 2002
2.
PROPERTY, PLANT AND EQUIPMENT (continued)
Maintenance and repairs, which neither materially add to the value of the assets nor appreciably prolong their useful lives,
are recognised as an expense in the period incurred. Minor plant and equipment items are also recognised as an expense in
the period incurred.
Profits or losses on the retirement or disposal of property, plant and equipment, determined as the difference between the
actual proceeds and the carrying amount of the assets, are recognised in the consolidated income statement in the period in
which they occur.
3.
INTANGIBLE ASSETS
Intangible assets are stated at cost less accumulated amortisation and accumulated impairment losses, if any. The residual
value of intangible assets is assumed to be zero. Intangible assets are amortised to the consolidated income statement on a
straight-line basis over their estimated useful lives, which are reviewed on an annual basis. Amortisation commences when
the intangible asset is available for use. The estimated useful lives of intangible assets are currently as follows:
Licences
Mobile
5 - 20 years
Other intangible assets
Contract mobile customers
5 years
Internet customer related
3 years
Trademarks
5 years
Goodwill
(Note 3.4)
The following are the main categories of intangible assets:
3.1
Licences
Licences, which are acquired to yield an enduring benefit, are capitalised at cost and amortised from the date of
commencement of usage rights over the duration of the licence agreement.
3.2
Customer bases
Cost of contract customer bases represents the purchase price on the acquisition of mobile or internet customer bases.
Customer bases are amortised on a straight-line basis over their estimated useful lives.
3.3
Trademarks and brands
Purchased trademarks and brands are capitalised at cost and amortised over their estimated useful lives. Expenditure
incurred to develop, maintain and renew trademarks and brands internally is recognised as an expense in the period
incurred.
3.4
Goodwill
Goodwill represents the excess of the cost of the acquisition of a subsidiary or joint venture, over the Group's interest
in the fair value of identifiable assets and liabilities at the date of acquisition, and is carried at cost less accumulated
amortisation and accumulated impairment losses, if any. Goodwill is amortised on a straight-line basis over its
estimated useful life, not exceeding 20 years.
4.
INVENTORY
Inventory is stated at the lower of cost and net realisable value. Cost is determined by the first-in-first-out method and
comprises all costs of purchase, costs of conversion and other costs incurred in bringing it to its present location and
condition. Net realisable value represents the estimated selling price in the ordinary course of business less all estimated
costs to completion and the estimated costs necessary to make the sale.
The amount of any write-down of inventory to net realisable value and all losses of inventory is recognised as an expense in
the period the write-down or loss occurs.
F123
VODACOM GROUP (PROPRIETARY) LIMITED
NOTES TO THE CONSOLIDATED FINANCIAL STATEMENTS
for the three years ended March 31, 2002
5.
FOREIGN CURRENCIES
5.1
Transactions and balances
Foreign currency transactions are translated, on initial recognition, at the foreign exchange rate ruling at the date of the
transaction.
Monetary assets and liabilities denominated in foreign currencies are translated at the foreign exchange rate ruling at
settlement date or balance sheet date whichever occurs first. Exchange differences on the settlement or translation of
monetary assets or liabilities are included in finance costs in the period in which they arise.
5.2
Foreign entities
The annual financial statements of foreign entities are translated into South African Rands for incorporation into the
consolidated annual financial statements. Assets and liabilities are translated at the foreign exchange rates ruling at
balance sheet date. Income, expenditure and cash flow items are translated at the actual foreign exchange rate or
average foreign exchange rates for the period.
Gains and losses on the translation of equity loans to foreign entities that are intended to be permanent are recognised
in equity.
All resulting unrealised exchange differences are classified as equity. On disposal, the cumulative amounts of
unrealised exchange differences that have been deferred are recognised in the consolidated income statement as part of
the gain or loss on disposal.
Goodwill adjustments arising on the acquisition of a foreign entity are treated as assets and liabilities
of the Group and translated at the foreign exchange rates ruling at transaction date.
5.3
Foreign currency hedges
Foreign currency hedges are dealt with in the Financial Instruments accounting policy.
6.
TAXATION
6.1
Current taxation
The charge for current taxation is based on the results for the period and is adjusted for items that are non-assessable
or disallowed. Current taxation is measured at the amount expected to be paid, using taxation rates and laws that have
been enacted or substantively enacted by the balance sheet date.
6.2
Deferred taxation
Deferred taxation is provided using the balance sheet liability method for all temporary differences arising between the
carrying amounts of assets and liabilities, on the consolidated balance sheet, and their respective taxation bases.
Deferred taxation is not provided on differences relating to goodwill for which amortisation is not deductible for
taxation purposes nor on the initial recognition of assets or liabilities, which is not a business combination and, at the
time of the transaction, affects neither accounting nor taxable profit or loss.
Deferred taxation liabilities are recognised for taxable temporary differences associated with investments in
subsidiaries and joint ventures, except where the Group is able to control the timing of the reversal of the temporary
differences and it is probable that it will not reverse in the foreseeable future.
Deferred taxation assets are recognised to the extent that it is probable that future taxable profit will be available
against which the associated unused taxation losses or credits and deductible temporary differences can be utilised.
Provision for taxation, which could arise if undistributed retained profit of certain subsidiaries is remitted, is only
made where a decision has been taken to remit such retained profits.
6.3
Secondary Taxation on Companies
Secondary Taxation on Companies (STC) is provided for at a rate of 12.5% on the amount of the net dividend declared
by Vodacom Group (Proprietary) Limited. It is recorded as a tax expense when dividends are declared.
F124
VODACOM GROUP (PROPRIETARY) LIMITED
NOTES TO THE CONSOLIDATED FINANCIAL STATEMENTS
for the three years ended March 31, 2002
7.
EMPLOYEE BENEFITS
7.1
Post-employment benefits
The Group provides defined contribution funds for the benefit of employees, the assets of which are held in separate
funds. The funds are funded by payments from employees and the Group. Contributions to the fund are recognised as
an expense in the period in which the employee renders the related service.
The Group has no liability for contributions to the medical aid of retired employees.
7.2
Short-term and long-term benefits
The cost of all short-term employee benefits, such as salaries, employee entitlements to leave pay, bonuses, medical
aid and other contributions, are recognised during the period in which the employee renders the related service. The
Group recognises the expected cost of bonuses only when the Group has a present legal or constructive obligation to
make such payment and a reliable estimate can be made.
7.3
Accumulative termination benefits
Accumulative termination benefits are payable whenever:
an employee's employment is terminated before the normal retirement date; or
an employee accepts voluntary redundancy.
The Group recognises termination benefits when it is constructively obliged to either terminate the employment of
current employees according to a detailed formal plan without possibility of withdrawal or to provide termination
benefits as a result of an offer made to encourage voluntary redundancy. If the benefits fall due more than 12 months
after balance sheet date, they are discounted to present value. In the case of an offer to encourage voluntary
redundancy and if the amount can be reasonably estimated, the measurement of termination benefits is based on the
number of employees expected to accept the offer.
7.4
Compensation benefits
Employees of the wholly-owned subsidiaries, including executive directors, are eligible for compensation benefits in
the form of a Deferred Bonus Incentive Scheme. Periodically, a number of entitlements are issued to employees, the
value of which depends on the seniority of the employee. Benefits of eligible employees arising from the entitlements
are determined with reference to the present value per entitlement, which is determined annually based on profits as
per the audited consolidated annual financial statements of Vodacom Group (Proprietary) Limited.
The fair value of the entitlements is calculated as the difference in the entitlement value at balance sheet date and the
value at which the entitlements were issued, multiplied by the number of entitlements allocated to a participant. Any
change in entitlement value is recorded in the income statement based on the present value of the expected future cash
out flows and recorded as a liability in the balance sheet. Participating employees are entitled to cash in the
entitlements over a six-year period.
8.
REVENUE RECOGNITION
Revenue, which excludes Value-Added Taxation and sales between Group companies, represents the invoiced value of goods
and services supplied by the Group. The Group measures revenue at the fair value of the consideration received or
receivable. Revenue is recognised only when it is probable that the economic benefits associated with a transaction will flow
to the Group and the amount of revenue, and associated costs incurred or to be incurred, can be measured reliably. If
necessary, revenue is split into separately identifiable components.
The main categories of revenue and bases of recognition for the Group are:
8.1
Contract products
These contracts may include a subsidised handset, 24-month service, activation, SIM-card and a user manual.
Revenue is recognised as follows:
The loss on the subsidised handset which includes the costs of the handset, the SIM-card and manual, is recognised
upon activation by the customer.
Activation fee revenue received from the customer is recognised upon activation by the customer.
Monthly access revenue received from the customer is recognised in the period in which the service is delivered.
F125
VODACOM GROUP (PROPRIETARY) LIMITED
NOTES TO THE CONSOLIDATED FINANCIAL STATEMENTS
for the three years ended March 31, 2002
8.
REVENUE RECOGNITION (continued)
8.1
Contract products (continued)
Airtime revenue is recognised on the usage basis. The terms and conditions of the bundled airtime products allow
the carry over of unused minutes and accumulation to a maximum of five times the monthly allocation. The unused
airtime is deferred in full.
Deferred revenue related to unused airtime is recognised when utilised by the customer. Upon termination of the
customer contract, all deferred revenue for unused airtime is recognised in income.
Any other costs incurred as a result of a new customer, are expensed upon activation as this is treated as a customer
acquisition cost.
8.2
Prepaid products
Airtime
Upon purchase of a airtime voucher the customer receives the right to make outgoing calls. Revenue is recognised
as the voucher is utilised by the customer. All airtime vouchers have an expiry date where any activated vouchers
with deferred revenue related to unused minutes are recognised upon expiration since the Group has no remaining
service obligation and the unused airtime is not refundable.
Remaining elements of prepaid packages
When a handset is sold with a prepaid package, all the costs, which include the costs of the handset, the SIM-card
and manual, together with the subsidy, is treated as a customer acquisition cost and the loss is recognised upon
activation by the customer. The cost of a package sold without a handset is also treated as a customer acquisition
cost.
The residual revenue related to the remaining elements of the prepaid packages are not separable since no objective
evidence of fair value exists. The Group currently recognises this residual amount upon activation.
8.3
Equipment sales
All equipment sales are recognised only when delivery and acceptance has taken place. Equipment sales to third party
service providers are recognised when delivery is accepted. No rights of return exist on sales to third party service
providers.
8.4
Other revenue and income
Interconnect income
Interconnect income is recognised on the usage basis.
Dividends
Dividends from investments are recognised when the right to receive payment has been established.
Interest
Interest is recognised on a time proportion basis with reference to the principal amount receivable and the effective
interest rate applicable.
9.
LEASES
9.1
Lease classification
Leases involving property, plant and equipment whereby the lessor provides finance to the lessee with the asset as
security, and where the lessee assumes the significant risks and rewards of ownership of those leased assets, are
classified as finance leases.
Leases of property, plant and equipment to the lessee, under which the lessor effectively retains the significant risks
and rewards of ownership of those leased assets, are classified as operating leases.
9.2
Group as lessee
Finance leases
Lessee finance leases are capitalised, as property, plant and equipment, at their cash equivalent cost and a
corresponding finance lease liability is raised. The cash equivalent cost is the lower of fair value or the present
value of the minimum lease payments, at inception of the lease. Such assets are depreciated in terms of the
accounting policy on property, plant and equipment stated above.
F126
VODACOM GROUP (PROPRIETARY) LIMITED
NOTES TO THE CONSOLIDATED FINANCIAL STATEMENTS
for the three years ended March 31, 2002
9.
LEASES (continued)
9.2
Group as lessee (continued)
Finance leases (continued)
Lease payments are allocated between lease finance costs and a capital reduction of the finance lease liability.
Lease finance costs are allocated to the consolidated income statement over the term of the lease using the effective
interest rate method, so as to produce a constant periodic rate of return on the remaining balance of the liability for
each period.
Operating leases
Lessee operating lease rental payments are expensed in the consolidated income statement on a straight-line basis
over the lease term.
When an operating lease is terminated before the lease term has expired any payment to the lessor that is required,
by way of penalty, is recognised as an expense in the period in which termination takes place.
10.
DERIVATIVE INSTRUMENTS
Prior to April 1, 2001, the Group entered into foreign exchange forward contracts to hedge the Group's exposure to
fluctuations in foreign currency exchange rates on specific transactions. Up to March 31, 2001, gains and losses on forward
contracts designated as hedges of identifiable foreign currency firm commitments were deferred and included in the
measurement of the related foreign currency transactions.
The portion of the premium paid or received relating to the commitment period was included in the measurement of the basis
of the related foreign currency transaction when recorded. Any remaining premium was amortised over the remaining life of
the forward contract.
Foreign exchange contract costs incurred in covering foreign currency loans are expensed over the period of the contract and
are included in finance costs.
Effective April 1, 2001, the Group adopted IAS 39: Financial Instruments: Recognition and Measurement (Revised 2000)
("IAS 39"), which requires that all derivative instruments be recorded on the balance sheet at fair value. Changes in the fairvalue of forward contracts are recorded each period in current earnings, as the forward contracts do not qualify as hedges
under IAS 39. Upon initial application of IAS 39, the Group recorded the fair value of the existing forward contracts on the
balance sheet and the corresponding gain was recognised as an adjustment of the opening balance of retained earnings.
Prior to April 1, 2001, the Group entered into interest rate swap agreements in order to manage interest rate exposure. The
net interest paid or received on the swaps was recognised as interest expense. Gains resulting from the early termination of
interest rate swap agreements were deferred and amortised as adjustments to interest expense over the remaining period
originally covered by the terminated swap.
Effective April 1, 2001 interest rate swaps are fair valued and recorded on the balance sheet in accordance with IAS 39.
The Group does not use financial instruments for trading or speculative purposes.
11.
FINANCIAL INSTRUMENTS OTHER THAN DERIVATIVES
11.1
Initial recognition and measurement
All financial instruments, other than derivatives which are dealt with above, are recognised on the consolidated balance
sheet. Financial instruments are initially recognised when the Group becomes party to the contractual terms of the
instruments and are measured at cost, which is the fair value of the consideration given (financial asset) or received
(financial liability or equity instrument) for it. Financial liabilities and equity instruments issued by the Group are
classified at initial recognition as debt or equity or compounded instruments in terms of IAS 32 on the basis of their
contractual terms. Transaction costs are included in the initial measurement of the financial instrument. Subsequent to
initial recognition, these instruments are measured as set out below.
11.2
Financial assets
The Group's principal financial assets are investments, foreign currency assets, receivables and bank and cash
balances:
Investments
Investments in equity instruments, excluding those in subsidiaries and joint ventures, are classified as available for
sale and are stated at fair value. Gains and losses from changes in fair value of available for sale financial assets
are recognised directly in equity until the financial asset is disposed of or it is determined to be impaired, at which
time the cumulative gain or loss previously recognised in equity is included in the consolidated income statement.
F127
VODACOM GROUP (PROPRIETARY) LIMITED
NOTES TO THE CONSOLIDATED FINANCIAL STATEMENTS
for the three years ended March 31, 2002
11.
FINANCIAL INSTRUMENTS OTHER THAN DERIVATIVES (continued)
11.2
Financial assets (continued)
Investments (continued)
Investments acquired principally for the purpose of generating a profit from the short-term fluctuations in price, are
classified as held for trading and are recorded and measured at fair value. Gains and losses on these investments
are recorded in the consolidated income statement.
Interest bearing investments, including investments in finance leases, are stated at original investment less principal
payments, and amortisations, and less accumulated impairment.
Receivables
Receivables originated by the Group are stated at their cost less a provision for doubtful debts. An estimate of
doubtful debts is made based on a review of all outstanding amounts at balance sheet date. Bad debts are written
off during the period in which they are identified.
The Group's policy for determining the allowance for doubtful accounts in full (unless arrangements have been
made with the debtor for payment) is as follows:
All amounts outstanding for 120 days and more.
Any specific retailers, dealers or subscribers outstanding for less than 120 days, where there is deemed to be a
significant risk of non-payment.
In addition, if accounts receivable balances are handed over for collection, they are written off in full regardless
of days outstanding. The hand over of outstanding debt is determined on a case by case basis, but usually occurs
after amounts have been outstanding for 90 days for individual subscribers and after 150 days for all other
accounts receivables.
The Group invoices its independent service providers and dealers (agents) for the revenue billed by them on behalf
of the Group. The Group, within its contractual arrangements with its agents, pays them administrative fees. The
Group receives in cash, the net amount equal to the gross revenue earned less the administrative fees payable to the
agents.
Bank and cash balances
The accounting policy for bank and cash balances is dealt with under cash and cash equivalents set out below.
11.3
Financial liabilities
The Group's principal financial liabilities are shareholder loans, interest bearing debt, non-interest bearing debt,
accounts payable, dividends payable, provisions and bank borrowings and other short-term debt:
Shareholder loans
Shareholder loans are recognised at the original proceeds received less principal payments.
Interest bearing debt
Interest bearing debt, including finance lease obligations, is recognised at amortised cost, namely original debt less
principal payments and amortisations. The accounting policy for finance lease obligations is dealt with under
leases set out above.
Accounts payable
Accounts payable are stated at their cost.
Dividends payable
Dividends payable are stated at amounts declared.
Bank borrowings and other short-term debt
The accounting policy for bank borrowings and other short-term debt is dealt with under cash and cash equivalents
set out below.
11.4
Equity instruments
The Group's principal equity instrument is ordinary share capital, which is recorded at original cost.
F128
VODACOM GROUP (PROPRIETARY) LIMITED
NOTES TO THE CONSOLIDATED FINANCIAL STATEMENTS
for the three years ended March 31, 2002
11.
FINANCIAL INSTRUMENTS OTHER THAN DERIVATIVES (continued)
11.5
De-recognition
Financial assets (or a portion thereof) are de-recognised when the Group realises the rights to the benefits specified in
the contract, the rights expire or the Group surrenders or otherwise loses control of the contractual rights that
comprise the financial asset. On de-recognition, the difference between the carrying amount of the financial asset and
proceeds receivable and any prior adjustment to reflect fair value that had been reported in equity are included in the
consolidated income statement.
Financial liabilities (or a portion thereof) are de-recognised when the obligation specified in the contract is discharged,
cancelled or expire. On de-recognition, the difference between the carrying amount of the financial liability, including
related unamortised costs and amounts paid for it are included in the consolidated income statement.
11.6
Fair value methods and assumptions
The fair value of financial instruments traded in an organised financial market are measured at the applicable quoted prices.
The fair value of financial instruments not traded in an organised financial market, is determined using a variety of
methods and assumptions that are based on market conditions and risk existing at balance sheet date, including
independent appraisals and discounted cash flow methods.
The carrying amounts of financial assets and liabilities with a maturity of less than one year are assumed to
approximate their fair value.
11.7
Offset
Where a legally enforceable right of offset exists for recognised financial assets and financial liabilities, and there is
an intention to settle the liability and realise the asset simultaneously, or to settle on a net basis, all related financial
effects are offset.
12.
PROVISIONS
Provisions are recognised when the Group has a present legal or constructive obligation resulting from past events, for which
it is probable that an outflow of resources embodying economic benefits will be required to settle the obligation and a
reliable estimate of the amount of the obligation can be made. A past event is deemed to give rise to a present obligation if,
taking into account the available evidence, it is more likely than not that a present obligation exists at balance sheet date.
The amount recognised as a provision, is the best estimate of the expenditure required to settle the present obligation at
balance sheet date, taking into account risks and uncertainties surrounding the provision.
13.
IMPAIRMENT OF ASSETS
The carrying amounts of assets, mentioned in the accounting policy notes, are assessed at each balance sheet date to
determine whether there is any indication of impairment. If any such indication exists, the Group estimates the recoverable
amount of the asset, being the higher of the asset's net selling price and its value in use. An impairment loss is recognised if
the recoverable amount of an asset is less than its carrying amount. The impairment loss is recognised as an expense in the
consolidated income statement immediately.
The net selling price represents the amount obtainable from the sale of an asset in an arm's length transaction between
knowledgeable, willing parties, less costs of disposal.
The value in use of an asset represents the expected future cash flows, from continuing use and disposal that are discounted
to their present value using an appropriate pre-tax discount rate that reflects current market assessments of the time value of
money and the risks specific to the asset.
For an asset that does not generate cash inflows largely independent of those from other assets, the recoverable amount is
determined for the cash-generating unit to which the asset belongs. An impairment loss is recognised whenever the
recoverable amount of a cash-generating unit is less than its carrying amount. The impairment loss is allocated to reduce the
carrying amount of the assets of the cash-generating unit, first to goodwill in respect of the cash generating unit, if any, and
then to the other assets on a pro rata basis based on their carrying amounts.
F129
VODACOM GROUP (PROPRIETARY) LIMITED
NOTES TO THE CONSOLIDATED FINANCIAL STATEMENTS
for the three years ended March 31, 2002
13.
IMPAIRMENT OF ASSETS (continued)
A previously recognised impairment loss is reversed if there has been a change in the estimates used to determine the
recoverable amount, however not to an amount higher than the carrying amount that would have been determined had no
impairment loss been recognised in prior periods.
After the recognition of an impairment loss, any depreciation or amortisation charge for the asset is adjusted for future
periods to allocate the asset's revised carrying amount, less its estimated residual value, on a systematic basis over its
remaining useful life.
For goodwill, a recognised impairment loss is not reversed, unless the impairment loss was caused by a specific external event
of an exceptional nature that is not expected to recur and the increase relates clearly to the reversal of the effect of that event.
14.
CASH AND CASH EQUIVALENTS
For the purpose of the consolidated cash flow statement, cash and cash equivalents comprise cash on hand, deposits held on
call, net of bank borrowings, all of which are available for use by the Group unless otherwise stated. Cash on hand is
measured at its face value. Deposits held on call are classified as loans originated by the company and carried at amortised
cost. Due to the short-term nature of these, the amortised cost approximates its fair value.
Bank borrowings, consisting of interest bearing short-term bank loans repayable on demand and overdrafts are recorded at
the proceeds received, net of direct issue costs. Finance costs, including premiums payable on settlement or redemption, are
accounted for on an accrual basis and are added to the carrying amount of the instrument to the extent that they are not
settled in the period in which they arise.
15.
EXPENSES
Marketing and advertising costs are expensed as they are incurred. Prepaid costs related to annual events sponsorships are
written-off over the duration of the event.
16.
INCENTIVES
Incentives paid to service providers and dealers for new activations, retention of existing customers and reaching specified
sales targets are expensed as incurred.
Distribution incentives paid to service providers and dealers for exclusivity, distribution assets and distribution subsidies are
deferred and expensed over the contractual relationship period.
17.
DISCONTINUING OPERATIONS
Discontinuing operations are significant, distinguishable components of an enterprise that have been sold, abandoned or are
the subject of formal plans for disposal or discontinuance.
The profit or loss on the sale or abandonment of a discontinuing operation is determined from the earlier of the enterprise
entering into a binding sale agreement for substantially all of the assets attributable to the discontinuing operation, or, the
approval and announcement of a detailed, formal plan of discontinuance by the board of directors.
18.
USE OF ESTIMATES
The preparation of financial statements in accordance with Generally Accepted Accounting Principles require the use of
estimates and assumptions that affect the reported amounts of assets and liabilities and disclosure of contingent assets and
liabilities on the date of the financial statements and the reported amounts of revenues and expenses during the reporting
period.
Although these estimates are based on management's best knowledge of current events and actions they may undertake in the
future, actual results ultimately may differ from those estimates.
19.
COMPARATIVES
Certain comparative figures have been reclassified, where required or necessary, in accordance with current period
classifications and presentation.

F130
VODACOM GROUP (PROPRIETARY) LIMITED
NOTES TO THE CONSOLIDATED FINANCIAL STATEMENTS
for the three years ended March 31, 2002
2000
2001
2002
Rm
Rm
Rm
1.
REVENUE
Airtime and access . . . . . . . . . . . . . . . . . . . . . . . . . . . .
5,320.1
7,255.1
9,486.5
Interconnect revenue . . . . . . . . . . . . . . . . . . . . . . . . . . .
2,582.9
3,260.1
4,300.9
Equipment sales . . . . . . . . . . . . . . . . . . . . . . . . . . . . . .
1,275.0
2,042.3
1,627.4
Other . . . . . . . . . . . . . . . . . . . . . . . . . . . . . . . . . . . .
101.6
458.9
434.8
International airtime . . . . . . . . . . . . . . . . . . . . . . . . . . . .
292.0
260.0
301.1
9,571.6
13,276.4
16,150.7
2.
AMORTISATION OF INTANGIBLE ASSETS
Goodwill . . . . . . . . . . . . . . . . . . . . . . . . . . . . . . . . . .
(35.8)
(150.1)
(98.9)
Licences . . . . . . . . . . . . . . . . . . . . . . . . . . . . . . . . . .
(6.7)
(7.2)
(9.4)
Trademarks . . . . . . . . . . . . . . . . . . . . . . . . . . . . . . . .
(6.3)
(16.8)
(7.1)
Customer bases . . . . . . . . . . . . . . . . . . . . . . . . . . . . . .
(24.8)
(97.4)
(97.3)
(73.6)
(271.5)
(212.7)
3.
INTEGRATION COSTS, DISPOSALS OF OPERATIONS AND
IMPAIRMENTS
Globalstar Southern Africa (Proprietary) Limited excluding
goodwill of R24.7 million for 2001 (Note 3.1) . . . . . . . . . . . . . .
(148.0)
37.7
Impairment of property, plant and equipment . . . . . . . . . . . . .
(97.7)
Impairment of shareholder loan . . . . . . . . . . . . . . . . . . . .
(4.8)
Satellite phones onerous contract . . . . . . . . . . . . . . . . . .
(45.5)
45.5
Recoupment of Gateway assets accrual (Note 36) . . . . . . . . . . .
15.0
Management fees paid to Telkom SA Limited in respect of the
Delareyville earth station (Note 36) . . . . . . . . . . . . . . . . . .
(22.8)
Capital gain on disposal of discontinued operations (Note 5) . . . . . .
129.3
1.6
19.0
Joycell Shops (Proprietary) Limited and Yellow Lizard Web
Design (Proprietary) Limited . . . . . . . . . . . . . . . . . . . . . .
1.6
2.7
Vodacom Sport & Entertainment (Proprietary) Limited . . . . . . . .
40.0
Film Fun (Holdings) (Proprietary) Limited . . . . . . . . . . . . . .
(53.8)
Vodacom World Online (Proprietary) Limited (Note 5.1) . . . . . . .
129.3
30.1
Write-off of investment in GSM Companies . . . . . . . . . . . . . . .
(0.3)
Vodacom Service Provider Company (Proprietary) Limited
Integration costs (Note 3.2) . . . . . . . . . . . . . . . . . . . . . . . .
(36.5)
Film Fun (Holdings) (Proprietary) Limited, trading as Teljoy
Integration costs (Note 3.3) . . . . . . . . . . . . . . . . . . . . . . . .
(30.3)
129.3
(213.2)
56.4
3.1
Globalstar Southern Africa (Proprietary) Limited
Vodacom Group (Proprietary) Limited acquired 100% of the share capital of Globalstar Southern Africa (Proprietary)
Limited with effect from August 1, 2000. The principal nature of the business of the company is that of a provider of
wholesale satellite airtime to cellular networks in Southern Africa. During the 2001 financial year the total goodwill
on acquisition of R24.7 million (disclosed as part of the Goodwill amortisation Notes 2 and 10) and the total
net asset value of the company was impaired by R102.5 million, as no satellite license was issued by the Independent
Communications Authority of South Africa and the international satellite company Globalstar Limited Partnership,
a United States listed company, was expected to go into Chapter 11 bankruptcy.
During the year ended March 31, 2001, a provision was made to reflect a contractual obligation of R45.5 million to
purchase satellite phones. Since a satellite licence was not issued to Globalstar Southern Africa (Proprietary) Limited,
these phones could not be utilised. The provision was reversed during the year ended March 31, 2002 as the Group
was subsequently released from this contractual obligation, and a recoupment of R15.0 million was made on certain of
the Gateway assets that were impaired in 2001.

F131
VODACOM GROUP (PROPRIETARY) LIMITED
NOTES TO THE CONSOLIDATED FINANCIAL STATEMENTS
for the three years ended March 31, 2002
3.
INTEGRATION COSTS, DISPOSALS OF OPERATIONS AND IMPAIRMENTS (continued)
3.2
Vodacom Service Provider Company (Proprietary) Limited
On July 1, 2000 the businesses of GSM Cellular (Proprietary) Limited and Vodac (Proprietary) Limited were
integrated with the business of Teljoy Cellular Services (Proprietary) Limited. Effective July 1, 2000, Teljoy Cellular
Services (Proprietary) Limited changed its name to Vodacom Service Provider Company (Proprietary) Limited.
The activities of Vodacare (Proprietary) Limited and Vodacom Equipment Company (Proprietary) Limited were also
integrated into Vodacom Service Provider Company (Proprietary) Limited on November 1, 2000.
3.3
Film Fun (Holdings) Proprietary Limited
Film Fun (Holdings) Proprietary Limited, trading as Teljoy was acquired as part of the Teljoy Holdings Limited Group
during January 2000. Non-profitable branches were closed during the 2001 financial year and the billing system,
which was not operational, was written-off.
4.
PROFIT FROM OPERATIONS
The profit from operations (including integration costs, disposals of operations and impairments (Note 3)) is arrived at after
taking the following income/(expenditure) into account:
2000
2001
2002
Rm
Rm
Rm
Net profit/(loss) on disposal of property, plant and equipment . . . . . .
(9.6)
0.4
3.4
Loss on disposal of property, plant and equipment . . . . . . . . . .
(9.8)
(8.2)
(2.6)
Profit on disposal of property, plant and equipment . . . . . . . . . .
0.2
8.6
6.0
Depreciation of property, plant and equipment (Note 9) . . . . . . . . .
(1,025.3)
(1,364.1)
(1,857.3)
Buildings . . . . . . . . . . . . . . . . . . . . . . . . . . . . . . . .
(9.5)
(10.5)
(12.7)
Infrastructure . . . . . . . . . . . . . . . . . . . . . . . . . . . . . .
(790.8)
(1,008.1)
(1,388.5)
Information services . . . . . . . . . . . . . . . . . . . . . . . . . .
(128.3)
(177.9)
(332.1)
Community services . . . . . . . . . . . . . . . . . . . . . . . . . .
(7.2)
(7.4)
(11.1)
Motor vehicles . . . . . . . . . . . . . . . . . . . . . . . . . . . . .
(1.2)
(6.7)
(19.6)
Furniture . . . . . . . . . . . . . . . . . . . . . . . . . . . . . . . .
(2.5)
(4.1)
(16.3)
Office equipment . . . . . . . . . . . . . . . . . . . . . . . . . . . .
(1.7)
(2.3)
(14.3)
Leasehold improvements . . . . . . . . . . . . . . . . . . . . . . . .
(1.6)
(2.9)
(31.0)
Other assets . . . . . . . . . . . . . . . . . . . . . . . . . . . . . . .
(82.5)
(144.2)
(31.7)
Auditors' remuneration . . . . . . . . . . . . . . . . . . . . . . . . . .
(3.6)
(9.4)
(7.3)
Current year audit fees . . . . . . . . . . . . . . . . . . . . . . . . .
(2.4)
(4.5)
(5.3)
Prior year under provision of audit fees . . . . . . . . . . . . . . . .
(0.4)
Expenses . . . . . . . . . . . . . . . . . . . . . . . . . . . . . . . .
(0.1)
(0.1)
(0.1)
Other services . . . . . . . . . . . . . . . . . . . . . . . . . . . . . .
(1.1)
(4.4)
(1.9)
Consultancy services . . . . . . . . . . . . . . . . . . . . . . . . . . .
(35.1)
(35.4)
(84.9)
Administrative fees . . . . . . . . . . . . . . . . . . . . . . . . . . .
(9.3)
(9.4)
(22.5)
Managerial fees . . . . . . . . . . . . . . . . . . . . . . . . . . . . .
(1.4)
(1.5)
(3.5)
Secretarial fees . . . . . . . . . . . . . . . . . . . . . . . . . . . . .
(0.1)
Technical fees . . . . . . . . . . . . . . . . . . . . . . . . . . . . . .
(24.4)
(24.5)
(58.8)
Operating lease rentals . . . . . . . . . . . . . . . . . . . . . . . . . .
(378.8)
(471.5)
(474.2)
GSM transmission and data lines . . . . . . . . . . . . . . . . . . . .
(301.0)
(332.3)
(336.0)
Office accommodation . . . . . . . . . . . . . . . . . . . . . . . . .
(40.7)
(66.8)
(79.7)
Other accommodation . . . . . . . . . . . . . . . . . . . . . . . . .
(32.1)
(54.3)
(49.4)
Office equipment . . . . . . . . . . . . . . . . . . . . . . . . . . . .
(5.0)
(13.1)
(7.6)
Motor vehicles . . . . . . . . . . . . . . . . . . . . . . . . . . . . .
(5.0)
(1.5)

F132
VODACOM GROUP (PROPRIETARY) LIMITED
NOTES TO THE CONSOLIDATED FINANCIAL STATEMENTS
for the three years ended March 31, 2002
4.
PROFIT FROM OPERATIONS (continued)
2000
2001
2002
Rm
Rm
Rm
Payment to other operators . . . . . . . . . . . . . . . . . . . . . . . .
(391.2)
(821.8)
(1,378.1)
Licence fees (Note 35.4) . . . . . . . . . . . . . . . . . . . . . . . . .
(271.2)
(328.8)
(384.4)
License fee GSM . . . . . . . . . . . . . . . . . . . . . . . . . . .
(271.0)
(328.8)
(384.4)
License fee C450 . . . . . . . . . . . . . . . . . . . . . . . . . . .
(0.2)
Foreign exchange losses . . . . . . . . . . . . . . . . . . . . . . . . . .
(0.1)
(11.2)
Directors' remuneration . . . . . . . . . . . . . . . . . . . . . . . . . .
(14.1)
(17.4)
(25.8)
Executive directors fees as directors: salaries . . . . . . . . . . . .
(4.5)
(5.6)
(8.3)
Executive directors fees as directors: bonuses . . . . . . . . . . . .
(8.5)
(11.3)
(16.9)
Non-executive directors fees as directors . . . . . . . . . . . . . .
(1.1)
(0.5)
(0.6)
Directors' remuneration and emoluments paid by: . . . . . . . . . . . .
(14.1)
(17.4)
(25.8)
Vodacom Group (Proprietary) Limited . . . . . . . . . . . . . . . . .
(8.8)
(11.3)
(16.2)
Subsidiaries . . . . . . . . . . . . . . . . . . . . . . . . . . . . . . .
(5.3)
(6.1)
(9.6)
Staff expenses pension and provident fund contributions . . . . . . .
(29.8)
(42.5)
(43.9)
Pension fund contributions . . . . . . . . . . . . . . . . . . . . . . .
(29.8)
(42.5)
(42.8)
Provident fund contributions . . . . . . . . . . . . . . . . . . . . . .
(1.1)
Bad debts written-off . . . . . . . . . . . . . . . . . . . . . . . . . . .
(16.5)
(107.4)
(111.2)
Decrease/(Increase) in provision for bad debts . . . . . . . . . . . . . .
(5.4)
(49.0)
64.9
The headcount of the Group at March 31, 2002 was 4,353
(2001: 4,272, 2000: 4,091).
5.
DISCONTINUED OPERATIONS
5.1
Vodacom World Online (Proprietary) Limited
On June 1, 1999, the Group disposed of the Vodacom Internet Division, which formed part of Vodacom (Proprietary)
Limited for an amount of R265.4 million to Vodacom World Online (Proprietary) Limited, a 50% joint venture of
Vodacom (Proprietary) Limited and World Online (Note 31). The Group realised a capital gain of R123.3 million on
this transaction, consisting of profits of R246.6 million less a deferred gain of R123.3 million reflecting Vodacom's
continued 50% interest in the assets contributed. On March 31, 2000, the Group disposed of 10% of the shareholding
in Vodacom World Online (Proprietary) Limited. A profit of R54.3 million arose, being the proceeds of the disposal of
R51.1 million less the realisation of the shareholder loans of R25.0 million, net liabilities of R3.2 million and deferred
profit on the sale of the Internet Division by Vodacom (Pty) Ltd of R25.0 million.
On November 9, 2001, the Group entered into a sale agreement to dispose of its 40% interest in the joint venture
company of Vodacom World Online (Proprietary) Limited to Tiscali International BV, the other party to the joint
venture. The company carried out the Group's internet service provider operations. The disposal was completed on
November 30, 2001, on which date control of Vodacom World Online (Proprietary) Limited passed to Tiscali
International BV. A profit of R30.1 million arose on the disposal of Vodacom World Online (Proprietary) Limited,
being the proceeds of disposal R31.8 million less the realisation of the shareholder's loan of R134.9 million, net
liabilities of R34.9 million and deferred profit of R98.3 million on the sale of the internet division by Vodacom
(Proprietary) Limited in the 2000 financial year (Note 30.2(b)) now realised. No tax charge or credit arose from the
transaction. The results were deconsolidated from November 30, 2001.
The Group's consolidated capital gain of R129.3 million on these disposals as disclosed in Note 3, arose from the
R123.3 million from the sale of the Internet Division, which was subsequently reduced with subscriber base costs not
capitalised of R48.3 million and the gain of R54.3 million from the disposal of its 10% shareholdings in Vodacom
World Online (Proprietary) Limited.

F133
VODACOM GROUP (PROPRIETARY) LIMITED
NOTES TO THE CONSOLIDATED FINANCIAL STATEMENTS
for the three years ended March 31, 2002
5.
DISCONTINUED OPERATIONS (continued)
5.2
Vodacom Sport & Entertainment (Proprietary) Limited
On September 1, 2001, the Group entered into a sale agreement to dispose of its 51% interest in Vodacom Sport &
Entertainment (Proprietary) Limited to South African Investments Limited ("SAIL"). The company carried out theGroup's sport and entertainment marketing operations. The disposal was completed on February 27, 2002,
on which date control of Vodacom Sport & Entertainment (Proprietary) Limited passed to SAIL.
The results were deconsolidated from February 28, 2002. A profit of R40.0 million arose on the disposal of Vodacom
Sport & Entertainment (Proprietary) Limited, being the proceeds of disposal less the carrying amount of the
subsidiary's net assets (Note 29.1(a)). No tax charge or credit arose from the transaction.
5.3
Film Fun (Holdings) (Proprietary) Limited, Teljoy Botswana (Proprietary) Limited and Africell Cellular
Services (Proprietary) Limited
The 100% shareholding in Film Fun (Holdings) (Proprietary) Limited, Teljoy Botswana (Proprietary) Limited
and Africell Cellular Services (Proprietary) Limited was sold to a management consortium for R9.0 million.
These disposals were effected in order to dispose of non-core operations. A loss of R53.8 million was realised, being
the proceeds of disposal less the carrying amount of the subsidiary's net assets (Note 29.1(b)). The sale agreements
were signed on March 27, 2002. The results were deconsolidated from March 31, 2002. The goodwill associated with
the entities was allocated on the initial acquisition of the Teljoy Group on January 31, 2000.
5.4
Results and cash flows
The results and cash flows of Vodacom Sport & Entertainment (Proprietary) Limited (VSE), Vodacom World Online
(Proprietary) Limited (VWOL), Film Fun (Holdings) (Proprietary) Limited (FFH), which have been included in the
consolidated financial statements, were as follows:
VSE
VWOL
Internet
division
Rm
Rm
Rm
2000
Income statement
Revenue . . . . . . . . . . . . . . . . . . . . . . . . . . . . . .
26.0
37.1
7.0
Expenditure . . . . . . . . . . . . . . . . . . . . . . . . . . . . .
(20.9)
(68.8)
(11.9)
Net investment income . . . . . . . . . . . . . . . . . . . . . . .
1.0
1.0
16.2
Profit/(Loss) before taxation . . . . . . . . . . . . . . . . . . . .
6.1
(30.7)
11.3
Taxation . . . . . . . . . . . . . . . . . . . . . . . . . . . . . .
(2.2)
1.7
Profit/(Loss) after taxation . . . . . . . . . . . . . . . . . . . . .
3.9
(30.7)
13.0
Cash flow statement
Net cash flows from operating activities . . . . . . . . . . . . . .
9.5
(11.1)
11.4
Net cash flows from investing activities . . . . . . . . . . . . . .
(1.2)
(142.1)
192.2
Net cash flows from financing activities . . . . . . . . . . . . . .
157.7
Net increase in cash and cash equivalents . . . . . . . . . . . . .
8.3
4.5
203.6
VSE
VWOL
FFH
Rm
Rm
Rm
2001
Income statement
Revenue . . . . . . . . . . . . . . . . . . . . . . . . . . . . . .
48.9
43.0
215.2
Expenditure . . . . . . . . . . . . . . . . . . . . . . . . . . . . .
(32.3)
(55.1)
(218.1)
Profit/(Loss) before taxation . . . . . . . . . . . . . . . . . . . .
16.6
(12.1)
(2.9)
Taxation . . . . . . . . . . . . . . . . . . . . . . . . . . . . . .
(6.0)
4.5
Profit/(Loss) after taxation . . . . . . . . . . . . . . . . . . . . .
10.6
(12.1)
1.6
Cash flow statement
Net cash flows from operating activities . . . . . . . . . . . . . .
(5.4)
(9.1)
29.8
Net cash flows from investing activities . . . . . . . . . . . . . .
(0.8)
(5.8)
(17.5)
Net cash flows from financing activities . . . . . . . . . . . . . .
4.0
48.4
Net (decrease)/increase in cash and cash equivalents . . . . . . .
(6.2)
(10.9)
60.7

F134
VODACOM GROUP (PROPRIETARY) LIMITED
NOTES TO THE CONSOLIDATED FINANCIAL STATEMENTS
for the three years ended March 31, 2002
5.
DISCONTINUED OPERATIONS (continued)
VSE
VWOL
FFH
Rm
Rm
Rm
5.4
Results and cash flows (continued)
2002
Income statement
Revenue . . . . . . . . . . . . . . . . . . . . . . . . . . . . . .
52.8
36.1
160.7
Expenditure . . . . . . . . . . . . . . . . . . . . . . . . . . . . .
(38.0)
(56.0)
(148.0)
Profit/(Loss) before taxation . . . . . . . . . . . . . . . . . . . .
14.8
(19.9)
12.7
Taxation . . . . . . . . . . . . . . . . . . . . . . . . . . . . . .
(4.3)
(0.1)
Profit/(Loss) after taxation . . . . . . . . . . . . . . . . . . . . .
10.5
(19.9)
12.6
Cash flow statement
Net cash flows from operating activities . . . . . . . . . . . . . .
(2.8)
1.4
54.2
Net cash flows from investing activities . . . . . . . . . . . . . .
(2.6)
(0.3)
Net cash flows from financing activities . . . . . . . . . . . . . .
4.8
(129.4)
Net (decrease)/increase in cash and cash equivalents . . . . . . .
(5.4)
6.2
(75.5)
The assets and liabilities related to the entities discontinued are
detailed in Notes 29 and 30.
2000
2001
2002
Rm
Rm
Rm
6.
INTEREST AND DIVIDENDS RECEIVED
Interest received banks and loans . . . . . . . . . . . . . . . . . . . .
31.3
25.4
27.7
Dividends received unlisted investments . . . . . . . . . . . . . . . .
0.7
4.3
32.0
25.4
32.0
7.
NET FINANCE COSTS
Shareholder loans . . . . . . . . . . . . . . . . . . . . . . . . . . . . .
(202.1)
(157.9)
(144.2)
Finance leases . . . . . . . . . . . . . . . . . . . . . . . . . . . . . . .
(61.2)
(60.8)
(98.9)
Funding loans . . . . . . . . . . . . . . . . . . . . . . . . . . . . . . .
(69.8)
(65.7)
(87.2)
Bank and other interest . . . . . . . . . . . . . . . . . . . . . . . . . .
(99.4)
(162.9)
(86.1)
Gain/(Loss) on forward exchange contracts and liability
revaluations (Note 7.1) . . . . . . . . . . . . . . . . . . . . . . . . . .
(133.7)
(56.1)
347.4
Interest rate swaps . . . . . . . . . . . . . . . . . . . . . . . . . . . . .
(1.0)
(1.1)
4.3
Other . . . . . . . . . . . . . . . . . . . . . . . . . . . . . . . . . . . .
4.9
(567.2)
(504.5)
(59.8)
7.1
Gain/(Loss) on forward exchange contracts and liability
revaluations
Gain on foreign liability revaluation . . . . . . . . . . . . . . . .
18.3
Loss on foreign liability revaluation . . . . . . . . . . . . . . . .
(247.8)
Gain on foreign exchange contract revaluation . . . . . . . . . .
778.4
Loss on foreign exchange contract revaluation . . . . . . . . . .
(199.0)
Realised foreign exchange gains . . . . . . . . . . . . . . . . . .
2.3
2.5
Realised foreign exchange losses . . . . . . . . . . . . . . . . .
(5.0)
Foreign exchange premiums . . . . . . . . . . . . . . . . . . . .
(133.7)
(58.4)
_
(133.7)
(56.1)
347.4
F135
VODACOM GROUP (PROPRIETARY) LIMITED
NOTES TO THE CONSOLIDATED FINANCIAL STATEMENTS
for the three years ended March 31, 2002
8.
TAXATION
2000
2001
2002
Rm
Rm
Rm
South African normal taxation . . . . . . . . . . . . . . . . . . . . . .
(556.2)
(748.3)
(1,001.7)
Current year . . . . . . . . . . . . . . . . . . . . . . . . . . . . . . .
(562.9)
(763.8)
(1,022.9)
Prior year over provision . . . . . . . . . . . . . . . . . . . . . . . .
6.7
15.5
21.2
Deferred taxation . . . . . . . . . . . . . . . . . . . . . . . . . . . . .
45.4
45.6
(82.7)
Current year . . . . . . . . . . . . . . . . . . . . . . . . . . . . . . .
28.5
50.3
(79.7)
Prior year under/(over) provision . . . . . . . . . . . . . . . . . . . .
16.1
(4.7)
(3.0)
Rate change . . . . . . . . . . . . . . . . . . . . . . . . . . . . . . .
0.8
Secondary Taxation on Companies . . . . . . . . . . . . . . . . . . . .
(1.0)
(60.5)
(74.5)
Current year . . . . . . . . . . . . . . . . . . . . . . . . . . . . . . .
(1.0)
(60.5)
(75.5)
Prior year over provision . . . . . . . . . . . . . . . . . . . . . . . .
1.0
Foreign taxation . . . . . . . . . . . . . . . . . . . . . . . . . . . . . .
(1.8)
(2.5)
(2.5)
Current year . . . . . . . . . . . . . . . . . . . . . . . . . . . . . . .
(1.8)
(2.4)
(3.7)
Prior year over/(under) provision . . . . . . . . . . . . . . . . . . . .
(0.1)
1.2
Foreign deferred taxation current year . . . . . . . . . . . . . . . . .
(29.3)
(513.6)
(765.7)
(1,190.7)
2000
2000
2001
2001
2002
2002
Rm
%
Rm
%
Rm
%
Reconciliation of rate of taxation
Normal taxation on profit before taxation . . . . . . .
548.4
30.0
622.3
30.0
1,075.2
30.0
Adjusted for:
Exempt income . . . . . . . . . . . . . . . . . . . .
(1.9)
(0.1)
(0.1)
(1.3)
Disallowable expenditure . . . . . . . . . . . . . . .
13.5
0.7
63.1
3.0
58.1
1.7
Prior year over provision . . . . . . . . . . . . . . .
(24.7)
(1.4)
(3.9)
(0.2)
(19.4)
(0.5)
Unutilised assessed loss . . . . . . . . . . . . . . . .
42.8
2.1
21.9
0.6
Utilisation of assessed loss . . . . . . . . . . . . . .
7.6
(0.4)
(2.2)
(0.1)
(0.6)
(0.1)
Foreign taxation rate differences . . . . . . . . . . .
14.1
0.4
Secondary Taxation on Companies . . . . . . . . . .
1.0
0.1
60.5
2.9
74.5
2.1
Realisation of deferred tax provided on customer base
(4.9)
(0.3)
(20.8)
(1.0)
(20.8)
(0.6)
Temporary differences in subsidiaries not provided for
(25.4)
(1.3)
4.0
0.2
(11.0)
(0.3)
Globalstar Southern Africa (Proprietary) Limited .
(4.1)
(0.1)
Vodacom Tanzania Limited . . . . . . . . . . . . .
4.0
0.2
Other . . . . . . . . . . . . . . . . . . . . . . . .
(25.4)
(1.3)
(6.9)
(0.2)
513.6
28.1
765.7
36.9
1,190.7
33.3

F136
VODACOM GROUP (PROPRIETARY) LIMITED
NOTES TO THE CONSOLIDATED FINANCIAL STATEMENTS
for the three years ended March 31, 2002
9.
PROPERTY, PLANT AND EQUIPMENT
Cost
Accumulated
Net book
depreciation
value
2000
Rm
Rm
Rm
Land and buildings . . . . . . . . . . . . . . . . . . . . . . . . . . . .
384.7
(15.7)
369.0
Infrastructure . . . . . . . . . . . . . . . . . . . . . . . . . . . . . . .
6,868.3
(1,997.6)
4,870.7
Information services . . . . . . . . . . . . . . . . . . . . . . . . . . . .
603.8
(293.6)
310.2
Community services . . . . . . . . . . . . . . . . . . . . . . . . . . . .
61.6
(41.2)
20.4
Motor vehicles . . . . . . . . . . . . . . . . . . . . . . . . . . . . . . .
6.7
(2.3)
4.4
Furniture . . . . . . . . . . . . . . . . . . . . . . . . . . . . . . . . . .
20.8
(11.1)
9.7
Office equipment . . . . . . . . . . . . . . . . . . . . . . . . . . . . .
13.9
(6.3)
7.6
Leasehold improvements . . . . . . . . . . . . . . . . . . . . . . . . .
6.3
(1.8)
4.5
Other assets . . . . . . . . . . . . . . . . . . . . . . . . . . . . . . . .
458.9
(201.3)
257.6
8,425.0
(2,570.9)
5,854.1
Cost
Accumulated
Net book
depreciation
value
2001
Rm
Rm
Rm
Land and buildings . . . . . . . . . . . . . . . . . . . . . . . . . . . .
456.6
(21.4)
435.2
Infrastructure . . . . . . . . . . . . . . . . . . . . . . . . . . . . . . .
9,428.6
(3,005.4)
6,423.2
Information services . . . . . . . . . . . . . . . . . . . . . . . . . . . .
932.1
(471.4)
460.7
Community services . . . . . . . . . . . . . . . . . . . . . . . . . . . .
80.1
(48.6)
31.5
Motor vehicles . . . . . . . . . . . . . . . . . . . . . . . . . . . . . . .
15.0
(6.2)
8.8
Furniture . . . . . . . . . . . . . . . . . . . . . . . . . . . . . . . . . .
46.5
(31.6)
14.9
Office equipment . . . . . . . . . . . . . . . . . . . . . . . . . . . . .
21.0
(13.1)
7.9
Leasehold improvements . . . . . . . . . . . . . . . . . . . . . . . . .
11.2
(6.3)
4.9
Other assets . . . . . . . . . . . . . . . . . . . . . . . . . . . . . . . .
757.7
(448.6)
309.1
11,748.8
(4,052.6)
7,696.2
Cost
Accumulated
Net book
depreciation
value
2002
Rm
Rm
Rm
Land and buildings . . . . . . . . . . . . . . . . . . . . . . . . . . . .
795.7
(34.0)
761.7
Infrastructure . . . . . . . . . . . . . . . . . . . . . . . . . . . . . . .
12,559.1
(4,393.9)
8,165.2
Information services . . . . . . . . . . . . . . . . . . . . . . . . . . . .
1,606.3
(936.6)
669.7
Community services . . . . . . . . . . . . . . . . . . . . . . . . . . . .
85.2
(55.6)
29.6
Motor vehicles . . . . . . . . . . . . . . . . . . . . . . . . . . . . . . .
67.0
(25.8)
41.2
Furniture . . . . . . . . . . . . . . . . . . . . . . . . . . . . . . . . . .
96.7
(48.6)
48.1
Office equipment . . . . . . . . . . . . . . . . . . . . . . . . . . . . .
69.0
(42.6)
26.4
Leasehold improvements . . . . . . . . . . . . . . . . . . . . . . . . .
196.6
(76.1)
120.5
Other assets . . . . . . . . . . . . . . . . . . . . . . . . . . . . . . . .
56.2
(22.0)
34.2
15,531.8
(5,635.2)
9,896.6

F137
VODACOM GROUP (PROPRIETARY) LIMITED
NOTES TO THE CONSOLIDATED FINANCIAL STATEMENTS
for the three years ended March 31, 2002
9.
PROPERTY, PLANT AND EQUIPMENT (continued)
2000
Land and
Infra-
Information
Community
Motor
Furniture
Office
Leasehold
Other
Total
buildings
structure
services
services
vehicles
equipment
improvements
assets
Rm
Rm
Rm
Rm
Rm
Rm
Rm
Rm
Rm
Rm
Opening balance .
390.1
4,024.4
234.0
13.3
3.4
10.5
5.6
1.3
218.4 4,901.0
Additions . . . . .
6.3
1,637.1
217.8
14.3
2.2
2.0
3.1
2.5
136.7 2,022.0
Disposals . . . . .
(18.0)
(0.1)
(12.5)
(40.6)
(71.2)
Depreciation . . .
(9.5)
(790.8)
(128.3)
(7.2)
(1.2)
(2.5)
(1.7)
(1.6)
(82.5) (1,025.3)
Business
combinations . . .
0.1
0.1
(0.8)
(0.3)
0.6
2.3
25.6
27.6
Closing balance . .
369.0
4,870.7
310.2
20.4
4.4
9.7
7.6
4.5
257.6 5,854.1
2001
Land and
Infra-
Information
Community
Motor
Furniture
Office
Leasehold
Other
Total
buildings
structure
services
services
vehicles
equipment
improvements
assets
Rm
Rm
Rm
Rm
Rm
Rm
Rm
Rm
Rm
Rm
Opening balance .
369.0
4,870.7
310.2
20.4
4.4
9.7
7.6
4.5
257.6 5,854.1
Additions . . . . .
109.7
2,562.8
331.6
18.5
11.2
9.3
9.8
5.0
126.3 3,184.2
Disposals . . . . .
(33.0)
(3.2)
(0.1)
(11.9)
(1.7)
(55.6)
(105.5)
Depreciation . . .
(10.5)
(1,008.1)
(177.9)
(7.4)
(6.7)
(4.1)
(2.3)
(2.9)
(144.2) (1,364.1)
Impairment and
business
combinations . . .
(2.2)
4.7
125.0
127.5
Closing balance . .
435.2
6,423.2
460.7
31.5
8.8
14.9
7.9
4.9
309.1 7,696.2
2002
Land and
Infra-
Information
Community
Motor
Furniture
Office
Leasehold
Other
Total
buildings
structure
services
services
vehicles
equipment
improvements
assets
Rm
Rm
Rm
Rm
Rm
Rm
Rm
Rm
Rm
Rm
Opening balance
as previously
reported . . . . . .
435.2
6,423.2
460.7
31.5
8.8
14.9
7.9
4.9
309.1 7,696.2
Asset category
transfers . . . . . .
95.6
(0.1)
(0.1)
(95.4)
Restated opening
balance . . . . . .
435.2
6,423.2
556.3
31.5
8.8
14.9
7.8
4.8
213.7 7,696.2
Additions . . . . .
339.6
3,050.3
476.4
9.5
20.5
39.2
15.9
94.2
39.7 4,085.3
Disposals . . . . .
(0.5)
(48.4)
(17.5)
(0.3)
(0.1)
(4.1)
(0.1)
(0.1)
(17.8)
(88.9)
Foreign currency
translation . . . . .
0.1
128.9
0.7
1.5
0.5
0.1
1.0
132.8
Depreciation . . .
(12.7)
(1,388.5)
(332.1)
(11.1)
(19.6)
(16.3)
(14.3)
(31.0)
(31.7) (1,857.3)
Other . . . . . . .
(0.1)
(0.1)
1.3
1.1
Business
combinations . . .
(12.2)
(0.2)
(4.4)
(1.0)
(54.8)
(72.6)
Asset category
transfers . . . . . .
(0.3)
(1.8)
30.3
18.4
18.0
51.6
(116.2)
Closing balance . .
761.7
8,165.2
669.7
29.6
41.2
48.1
26.4
120.5
34.2 9,896.6

F138
VODACOM GROUP (PROPRIETARY) LIMITED
NOTES TO THE CONSOLIDATED FINANCIAL STATEMENTS
for the three years ended March 31, 2002
9.
PROPERTY, PLANT AND EQUIPMENT (continued)
2000
2001
2002
Net book
Net book
Net book
value
value
value
Rm
Rm
Rm
Freehold land and buildings
Portions 859, 847, 827, the remaining extent of Portion 45 (a portion of
Portion 9), and Portion 828 (a portion of Portion 9) of farm
Randjesfontein No. 405, Registration division J.R., Province of Gauteng.
32.4
43 Kwale Road, Dar es Salaam, Tanzania . . . . . . . . . . . . . . . . .
6.8
Stand 172 Sandton . . . . . . . . . . . . . . . . . . . . . . . . . . . . .
0.5
0.5
Sectional Plan No. 33/1981, High Level Road, Sea Point, Cape Town . .
0.1
Stand 200 Chelmsfordville . . . . . . . . . . . . . . . . . . . . . . . . .
0.1
0.1
0.1
0.7
0.6
39.3
Leasehold land and buildings
Portion 827 and 828 of farm Randjesfontein No. 405 . . . . . . . . . . .
279.4
Portion 769 of farm Randjesfontein No. 405 . . . . . . . . . . . . . . . .
154.8
155.9
164.8
Stand 34083 Bellville, City of Tygerberg . . . . . . . . . . . . . . . . . .
112.6
111.1
109.5
Erven 5259 and 5260 Montague Gardens . . . . . . . . . . . . . . . . .
99.6
98.1
Holding 350 Erand Agricultural Holdings Ext. 1 . . . . . . . . . . . . . .
70.6
66.4
62.2
Holding 188 Erand Agricultural Holdings Ext. 1 . . . . . . . . . . . . . .
7.8
Stand 207 Erand Agricultural Holdings Ext. 28 . . . . . . . . . . . . . .
6.8
Portion 45 of Randjesfontein No. 405, and Holding 202 Erand
Agricultural Holdings Ext. 1 . . . . . . . . . . . . . . . . . . . . . . . .
7.8
Holding 359 Erand Agricultural Holdings Ext. 1 . . . . . . . . . . . . . .
9.9
1.6
1.6
Erand 189 Agricultural Holdings Ext. . . . . . . . . . . . . . . . . . . .
4.8
. . . . . . . . . . . . . . . . . . . . . . . . . . . . . . . . . . . . . . . .
368.3
434.6
722.4
Total freehold and leasehold land and buildings
369.0
435.2
761.7
Debt is collateralised over leasehold land and buildings and the fair value of the lease liability is R790.6 million
(2001: R496.6 million, 2000: R417.9 million).
10.
INTANGIBLE ASSETS
Cost
Accumulated
Net book
amortisation
value
Rm
Rm
Rm
2000
Goodwill . . . . . . . . . . . . . . . . . . . . . . . . . . . . . . . . . .
462.0
(88.2)
373.8
Licences . . . . . . . . . . . . . . . . . . . . . . . . . . . . . . . . . . .
104.1
(40.4)
63.7
Trademarks . . . . . . . . . . . . . . . . . . . . . . . . . . . . . . . . .
51.9
(7.4)
44.5
Customer bases . . . . . . . . . . . . . . . . . . . . . . . . . . . . . . .
486.8
(29.8)
457.0
1,104.8
(165.8)
939.0
Cost
Accumulated
Net book
amortisation
value
Rm
Rm
Rm
2001
Goodwill . . . . . . . . . . . . . . . . . . . . . . . . . . . . . . . . . .
597.4
(238.3)
359.1
Licences . . . . . . . . . . . . . . . . . . . . . . . . . . . . . . . . . . .
108.8
(47.6)
61.2
Trademarks . . . . . . . . . . . . . . . . . . . . . . . . . . . . . . . . .
67.2
(24.2)
43.0
Customer bases . . . . . . . . . . . . . . . . . . . . . . . . . . . . . . .
486.9
(127.3)
359.6
1,260.3
(437.4)
822.9

F139
VODACOM GROUP (PROPRIETARY) LIMITED
NOTES TO THE CONSOLIDATED FINANCIAL STATEMENTS
for the three years ended March 31, 2002
10.
INTANGIBLE ASSETS (continued)
Cost
Accumulated
Net book
amortisation
value
Rm
Rm
Rm
2002
Goodwill . . . . . . . . . . . . . . . . . . . . . . . . . . . . . . . . . .
669.4
(326.5)
342.9
Licences . . . . . . . . . . . . . . . . . . . . . . . . . . . . . . . . . . .
221.3
(56.9)
164.4
Trademarks . . . . . . . . . . . . . . . . . . . . . . . . . . . . . . . . .
51.5
(24.8)
26.7
Customer bases . . . . . . . . . . . . . . . . . . . . . . . . . . . . . . .
486.9
(224.6)
262.3
1,429.1
(632.8)
796.3
Reconciliation
Opening net
Additions
Foreign
Business Amortisation
Closing net
book value
currency combination
book value
translation
2000
Rm
Rm
Rm
Rm
Rm
Rm
Goodwill . . . . . . . . . .
61.4
0.5
347.7
(35.8)
373.8
Licences . . . . . . . . . .
67.6
2.5
0.3
(6.7)
63.7
Trademarks . . . . . . . .
18.0
32.8
(6.3)
44.5
Customer bases . . . . . .
39.8
7.5
434.5
(24.8)
457.0
186.8
10.5
815.3
(73.6)
939.0
Reconciliation
Opening net
Additions
Foreign
Business Amortisation
Closing net
book value
currency combination
book value
translation
2001
Rm
Rm
Rm
Rm
Rm
Rm
Goodwill . . . . . . . . . .
373.8
135.4
(150.1)
359.1
Licences . . . . . . . . . .
63.7
1.5
3.2
(7.2)
61.2
Trademarks . . . . . . . .
44.5
15.3
(16.8)
43.0
Customer bases . . . . . .
457.0
(97.4)
359.6
939.0
1.5
153.9
(271.5)
822.9
Reconciliation
Opening net
Additions
Foreign
Business Amortisation
Closing net
book value
currency combination
book value
translation
2002
Rm
Rm
Rm
Rm
Rm
Rm
Goodwill . . . . . . . . . .
359.1
98.5
(15.8)
(98.9)
342.9
Licences . . . . . . . . . .
61.2
95.2
17.5
(0.1)
(9.4)
164.4
Trademarks . . . . . . . .
43.0
(9.2)
(7.1)
26.7
Customer bases . . . . . .
359.6
(97.3)
262.3
822.9
193.7
17.5
(25.1)
(212.7)
796.3

F140
VODACOM GROUP (PROPRIETARY) LIMITED
NOTES TO THE CONSOLIDATED FINANCIAL STATEMENTS
for the three years ended March 31, 2002
2000
2001
2002
Rm
Rm
Rm
11.
INVESTMENTS
Held for trading
Money market investments (Note 11.1) . . . . . . . . . . . . . . . . . .
65.0
Less: Short-term portion of investments (Note 11.2) . . . . . . . . . . . .
(58.6)
Available for sale
Other . . . . . . . . . . . . . . . . . . . . . . . . . . . . . . . . . . . .
0.9
0.9
Originating loans
South African Investments Limited . . . . . . . . . . . . . . . . . . . . .
11.8
Long-term portion of the note receivable issued as part of the
consideration for the disposal of Vodacom Sport & Entertainment
(Proprietary) Limited. Interest is charged on this amount receivable at
the prime lending rate minus one percent per annum from the
transaction date.
Other . . . . . . . . . . . . . . . . . . . . . . . . . . . . . . . . . . . .
5.9
1.3
0.5
Investment in joint venture loan Vodacom World Online
(Proprietary) Limited . . . . . . . . . . . . . . . . . . . . . . . . . . . .
4.0
Loan to Planatel Communication Limited and Caspian
Construction Company Limited . . . . . . . . . . . . . . . . . . . . . .
4.9
11.2
4.0
15.7
13.4
22.7
11.1
Money market investments
Maturity
Interest
Market
period
rate
value
2002
Rm
Details of the maturity periods and interest rates of the money
market investments at year-end are as follows:
0 - 6 months
9.1% - 9.6%
36.2
6 - 12 months
10.0% - 11.1%
18.4
Over 12 months
9.7% - 12.0%
10.4
65.0
2000
2001
2002
Rm
Rm
Rm
11.2
Short-term portion of investments
Money market investment (Note 11.1) . . . . . . . . . . . . . . .
54.6
Short-term loans. The amounts were repaid in full in May 2002 . .
4.0
58.6
12.
ACQUIRED BUSINESS HELD FOR SALE
Film Fun (Holdings) (Proprietary) Limited:
Shares at cost less provisions and amounts written-off . . . . . . . . . . .
51.6
Loans granted . . . . . . . . . . . . . . . . . . . . . . . . . . . . . . . .
70.0
121.6
The investments relate to the acquisition of Film Fun (Holdings) (Proprietary) Limited, trading as Teljoy, during January 2000,
and is in connection with the television and rental segments of the Teljoy Holdings Group. Management's original intention
was to sell the investment in the near future (Note 29.2).
These loans were interest free and had no fixed repayment terms.

F141
VODACOM GROUP (PROPRIETARY) LIMITED
NOTES TO THE CONSOLIDATED FINANCIAL STATEMENTS
for the three years ended March 31, 2002
2000
2001
2002
Rm
Rm
Rm
13.
DEFERRED TAXATION
Deferred taxation asset . . . . . . . . . . . . . . . . . . . . . . . . . . .
145.8
339.1
497.7
Deferred taxation liability . . . . . . . . . . . . . . . . . . . . . . . . . .
(455.6)
(607.5)
(926.2)
(309.8)
(268.4)
(428.5)
13.1
Components
Capital allowances . . . . . . . . . . . . . . . . . . . . . . . . . .
(315.5)
(497.7)
(822.9)
Foreign equity revaluation reserve . . . . . . . . . . . . . . . . . .
(17.9)
Assessed losses . . . . . . . . . . . . . . . . . . . . . . . . . . . .
107.2
295.9
Provisions . . . . . . . . . . . . . . . . . . . . . . . . . . . . . .
145.8
227.6
160.8
Prepayments and other allowances . . . . . . . . . . . . . . . . .
(5.1)
4.3
41.0
Acquisition of customer base . . . . . . . . . . . . . . . . . . . .
(135.0)
(109.8)
(77.5)
Other . . . . . . . . . . . . . . . . . . . . . . . . . . . . . . . . .
(7.9)
(309.8)
(268.4)
(428.5)
13.2
Reconciliation
Balance at beginning of year . . . . . . . . . . . . . . . . . . . . .
(219.4)
(309.8)
(268.4)
Income statement (expense)/income . . . . . . . . . . . . . . . . .
44.6
45.6
(112.0)
Foreign equity revaluation reserve . . . . . . . . . . . . . . . . . .
(19.9)
Movement due to IAS 39 adjustment . . . . . . . . . . . . . . . .
(36.5)
Business combinations
Acquisition of customer base . . . . . . . . . . . . . . . . . . .
(130.3)
(4.5)
2.7
Foreign exchange differences on consolidation
of foreign subsidiaries . . . . . . . . . . . . . . . . . . . . . . .
7.2
Disposal of subsidiaries . . . . . . . . . . . . . . . . . . . . . .
(5.5)
0.3
(1.6)
Rate change . . . . . . . . . . . . . . . . . . . . . . . . . . . . .
0.8
Balance at end of year
(309.8)
(268.4)
(428.5)
Utilisation of assessed losses
Opening assessed loss . . . . . . . . . . . . . . . . . . . . . . . .
25.3
439.3
Current year assessed loss created/(utilised) . . . . . . . . . . . .
(25.3)
439.3
682.4
Closing assessed loss . . . . . . . . . . . . . . . . . . . . . . . .
439.3
1,121.7
Disposal of subsidiaries and joint venture . . . . . . . . . . . . . .
(53.3)
Utilised to reduce deferred taxation . . . . . . . . . . . . . . . . .
(357.4)
(986.3)
Assessed losses available to reduce deferred taxation
81.9
82.1
There are unused tax losses to the value of R82.1 million (2001: R81.9 million, 2000: nil) available to reduce the net
deferred taxation liability. The effect of this would be a reduction in the net deferred taxation liability to
R403.9 million (2001: R243.8 million, R2000: R309.8 million). A deferred tax asset was not recognised for the
abovementioned unused tax losses as uncertainty existed at year-end on whether future taxable profits would be
available to utilise the asset against. The recognition of the future taxable profits relating to the unrecognised deferred
tax asset will be re-assessed in the next financial period.

F142
VODACOM GROUP (PROPRIETARY) LIMITED
NOTES TO THE CONSOLIDATED FINANCIAL STATEMENTS
for the three years ended March 31, 2002
2000
2001
2002
Rm
Rm
Rm
14.
INVENTORY
Finished goods . . . . . . . . . . . . . . . . . . . . . . . . . . . . . . .
218.3
392.1
305.3
Other inventory . . . . . . . . . . . . . . . . . . . . . . . . . . . . . . .
3.8
6.3
0.7
222.1
398.4
306.0
15.
ACCOUNTS RECEIVABLE
Trade debtors (net of allowance for doubtful accounts of
R77.0 million (2001: R141.9 million, 2000: R92.9 million). . . . . . . .
1,502.7
2,041.5
2,461.4
Prepayments . . . . . . . . . . . . . . . . . . . . . . . . . . . . . . . . .
114.0
174.0
262.5
Value-added taxation . . . . . . . . . . . . . . . . . . . . . . . . . . . .
57.9
31.3
Advances made to employees for education and travel . . . . . . . . . .
10.2
South African Investments Limited short-term portion of the note
receivable issued as consideration for the disposal of Vodacom Sport and
Entertainment (Proprietary) Limited. Interest is charged on this amount
receivable at the prime lending rate minus 1% per annum from the
transaction date. . . . . . . . . . . . . . . . . . . . . . . . . . . . . . . .
11.8
Disposal of Film Fun (Holdings) (Proprietary) Limited . . . . . . . . . .
9.0
Other . . . . . . . . . . . . . . . . . . . . . . . . . . . . . . . . . . . .
59.7
1,616.7
2,273.4
2,845.9
2000
2001
2002
R
R
R
16.
ORDINARY SHARE CAPITAL
Authorised
100,000 ordinary shares of 1 cent each . . . . . . . . . . . . . . . . .
1,000
1,000
1,000
Issued
10,000 ordinary shares of 1 cent each . . . . . . . . . . . . . . . . . .
100
100
100
Unissued share capital is not under the control of the Board of Directors.

F143
VODACOM GROUP (PROPRIETARY) LIMITED
NOTES TO THE CONSOLIDATED FINANCIAL STATEMENTS
for the three years ended March 31, 2002
2000
2001
2002
Rm
Rm
Rm
17.
NON-DISTRIBUTABLE RESERVES
Foreign currency translation reserve . . . . . . . . . . . . . . . . . . . .
0.6
(2.3)
117.5
Deferred taxation on foreign currency translation reserve . . . . . . . . .
(19.9)
Contingency reserve . . . . . . . . . . . . . . . . . . . . . . . . . . . . .
8.5
0.6
(2.3)
106.1
Reconciliation
Balance at the beginning of the year . . . . . . . . . . . . . . . . . . . .
0.6
(2.3)
Foreign currency translation reserve . . . . . . . . . . . . . . . . . . . .
0.6
(2.9)
99.9
Foreign currency translation . . . . . . . . . . . . . . . . . . . . . . .
0.6
(2.9)
119.8
Deferred taxation . . . . . . . . . . . . . . . . . . . . . . . . . . . . .
(19.9)
Other non-distributable reserves:
Transferred from distributable reserves contingency reserve . . . . . . .
8.5
Balance at the end of the year . . . . . . . . . . . . . . . . . . . . . . .
0.6
(2.3)
106.1
Deferred taxation on the foreign currency translation reserve relates only
to the translation of equity loans to subsidiaries.
18.
MINORITY INTEREST
Equity
(2.2)
(11.4)
10.6
Debit balances reflected in 2001 and 2000 result from losses incurred by certain subsidiaries who have a binding obligation
to fund their percentage of the losses.
19.
INTEREST BEARING DEBT
2001
2001
2001
2002
2002
2002
Current
Long-term
Total
Current
Long-term
Total
portion
portion
portion
portion
Rm
Rm
Rm
Rm
Rm
Rm
Finance leases . . . . . . .
0.5
496.1
496.6
10.4
780.2
790.6
Funding loans . . . . . . .
400.0
400.0
440.0
440.0
Other short-term loans . .
565.5
565.5
0.5
896.1
896.6
1,015.9
780.2
1,796.1
2000
2000
2000
Current
Long-term
Total
portion
portion
Rm
Rm
Rm
Finance leases . . . . . . . . . . . . . . . . . . . . . . . . . . . . . . . .
0.7
417.2
417.9
Funding loans . . . . . . . . . . . . . . . . . . . . . . . . . . . . . . . .
820.0
400.0
1,220.0
Other short-term loans . . . . . . . . . . . . . . . . . . . . . . . . . . .
23.7
23.7
844.4
817.2
1,661.6

F144
VODACOM GROUP (PROPRIETARY) LIMITED
NOTES TO THE CONSOLIDATED FINANCIAL STATEMENTS
for the three years ended March 31, 2002
19.
INTEREST BEARING DEBT (continued)
2000
2001
2002
Rm
Rm
Rm
19.1
Finance leases
Vodacom (Proprietary) Limited . . . . . . . . . . . . . . . . . . .
416.6
495.7
502.4
The finance leases are collateralised by various land and buildings
with a book value of R443.0 million (2001: R444.9 million, 2000:
R363.5 million), bear interest at effective interest rates of between
13.85% and 14.69% and are repayable between 5 and 13 years.
Vodacom Service Provider Company (Proprietary) Limited . . . .
288.2
The finance leases are collateralised by various land and buildings
with a book value of R279.4 million, and bear interest at a variable
nominal interest rate of 13.76% compounded monthly. Payments are
made every six months in arrear and commenced on March 1, 2002.
The finance lease expires on September 1, 2011.
Vodacare (Proprietary) Limited . . . . . . . . . . . . . . . . . . .
0.4
The finances leases have been paid up in conjunction with the merger
of the company into Vodacom Service Provider Company
(Proprietary) Limited.
Teljoy Holdings Limited . . . . . . . . . . . . . . . . . . . . . . .
0.9
0.9
The finance lease bears interest at an effective interest rate of 14.5%
and is repayable by March 2004.
Less: Current portion of finance leases:
Vodacom (Proprietary) Limited . . . . . . . . . . . . . . . .
(7.1)
Vodacom Service Provider Company (Proprietary) Limited .
(3.3)
Vodacare (Proprietary) Limited . . . . . . . . . . . . . . . .
(0.4)
Teljoy Holdings Limited . . . . . . . . . . . . . . . . . . . .
(0.3)
(0.5)
(0.7)
(0.5)
(10.4)
Long-term portion of finance leases . . . . . . . . . . . . . . . . .
417.2
496.1
780.2
The fair value of the Group's finance lease liability is R790.6 million
(2001: R496.6 million, 2000: R417.9 million).
19.2
Funding loans
Commerzbank AG . . . . . . . . . . . . . . . . . . . . . . . . . .
350.0
200.0
200.0
The R200 million loan is uncollateralised, bears interest at a fixed
rate of 13.7% NACQ (Nominal Amount Compounded Quarterly)
and is repayable on March 17, 2003. The R150 million loan
was uncollateralised, bore interest at a fixed rate of 14.9%
NACM (Nominal Amount Compounded Monthly) and was repaid
on May 21, 2000.
Crdit Agricole Indosuez . . . . . . . . . . . . . . . . . . . . . .
200.0
200.0
200.0
The loan is uncollateralised, bears interest at a fixed rate of 14%
NACQ and is repayable on March 17, 2003.
RMB Corporate Finance (Proprietary) Limited . . . . . . . . . . .
670.0
Second instalment paid by Vodacom Group (Proprietary) Limited to
RMB Corporate Finance (Proprietary) Limited on April 17, 2002 for
the purchase of shares in Teljoy Holdings Limited.

F145
VODACOM GROUP (PROPRIETARY) LIMITED
NOTES TO THE CONSOLIDATED FINANCIAL STATEMENTS
for the three years ended March 31, 2002
19.
INTEREST BEARING DEBT (continued)
2000
2001
Rm
Rm
Rm
19.2
Funding loans (continued)
Vodacom Tanzania Limited . . . . . . . . . . . . . . . . . . . . .
40.0
The shareholders' loans from Planetel Communications Limited and
Caspian Construction Company Limited are uncollateralised, bear
interest at LIBOR plus 1% and are repayable when at least 60% of
the shareholders with voting powers agree on repayment.
Less: Current portion of funding loans:
Commerzbank AG . . . . . . . . . . . . . . . . . . . . . . .
(150.0)
(200.0)
Crdit Agricole Indosuez . . . . . . . . . . . . . . . . . . .
(200.0)
RMB Corporate Finance (Proprietary) Limited . . . . . . . .
(670.0)
Vodacom Tanzania Limited . . . . . . . . . . . . . . . . . .
(40.0)
(820.0)
(440.0)
Long-term portion of funding loans
400.0
400.0
The fair value of the Group's funding loan liability is
R444.6 million (2001: R413.9 million, 2000: R1,217.9 million).
19.3
Other short-term loans
Vodacom Tanzania Limited . . . . . . . . . . . . . . . . . . . . .
539.4
The loan of $47.2 million from Standard Bank of London is
uncollateralised, bears interest at an effective interest rate of
LIBOR rate plus 1.5% and is repayable by June 30, 2002.
Vodacom (Proprietary) Limited . . . . . . . . . . . . . . . . . . .
23.7
26.1
23.7
565.5
The fair value of the Group's short-term loans is R565.5 million
(2001: nil, 2000: R23.7 million).
19.4
Repayment of interest bearing debt
2003
2004
2005
2006
2007
Total
onwards
Rm
Rm
Rm
Rm
Rm
Rm
Finance leases
Vodacom (Proprietary)
Limited . . . . . . . . . . . .
7.1
(5.7)
8.7
20.4
471.9
502.4
Vodacom Service Provider
Company (Proprietary)
Limited . . . . . . . . . . . .
3.3
(2.4)
1.5
6.6
279.2
288.2
Funding loans
Commerzbank AG . . . . . .
200.0
200.0
Crdit Agricole Indosuez . .
200.0
200.0
Other short-term loans . . . .
565.5
565.5
Vodacom Tanzania Limited .
40.0
40.0
1,015.9
(8.1)
10.2
27.0
751.1
1,796.1
F115
P.O. Box:
35296
P.O. Box:
11007
MENLO PARK 0102
HATFIELD 0028
Tel: (012) 429 0000
Tel: (012) 482 0000
Fax:
(012) 429 0100
Fax: (012) 460 3633
REPORT OF THE INDEPENDENT AUDITORS
to the members of Vodacom Group (Proprietary) Limited
We have audited the accompanying consolidated balance sheets of Vodacom Group (Proprietary) Limited and subsidiaries
("the Group") as of March 31, 2000, 2001 and 2002 and the related consolidated statements of income, changes in equity and cash flows for each of the three years in the period ended March 31, 2002 set out in pages F116 to F183. These financial
statements are the responsibility of the Company's management. Our responsibility is to express an opinion on these financial
statements based on our audits.
We conducted our audits in accordance with auditing standards generally accepted in the United States of America. Those standards
require that we plan and perform the audit to obtain reasonable assurance about whether the financial statements are free of material
misstatement. An audit includes examining, on a test basis, evidence supporting the amounts and disclosures in the financial
statements. An audit also includes assessing the accounting principles used and significant estimates made by management, as well
as evaluating the overall financial statement presentation. We believe that our audits provide a reasonable basis for our opinion.
In our opinion, the consolidated financial statements, referred to above, present fairly, in all material respects, the financial
position of the Group as at March 31, 2000, 2001 and 2002, and the results of their operations and their cash flows for each
of the three years in the period ended March 31, 2002, in conformity with International Accounting Standards and in the
manner required by the Companies Act in South Africa.
Without qualifying our opinion above we draw attention to Note 44 containing certain restatements and adjustments regarding the
consolidated financial statements of the Group as issued previously.
Furthermore, as discussed in Note 24 to the financial statements, in 2002 the Group changed its accounting policy for financial
instruments to conform to International Accounting Standard 39 Financial Instruments: Recognition and measurement.
In addition, International Accounting Standards vary in certain significant respects from accounting principles generally
accepted in the United States of America. The application of the latter would have affected the determination of net income
profit for each of the two years in the period ended March 31, 2002 and the determination of shareholders' equity
at March 31, 2001 and March 31, 2002, to the extent summarised in Note 45 to the consolidated financial statements.
Pricewaterhouse Coopers Inc
Deloitte & Touche
Registered Accountants and Auditors
Registered Accountants and Auditors
Chartered Accountants (SA)
Chartered Accountants (SA)
Pretoria Pretoria
June 11, 2002, except for Note 44 for
June 11, 2002, except for Note 44 for
which the date is October 15, 2002
which the date is October 15, 2002
A complete list of partners is available from any of our offices
Joint auditors
PricewaterhouseCoopers Inc
Chartered Accountants (SA)
Registered Accountants and Auditors
(Registration no 1998/012055/21)
Deloitte & Touche Chartered Accountants (SA)
Registered accountants and auditors
F116
VODACOM GROUP (PROPRIETARY) LIMITED
CONSOLIDATED INCOME STATEMENTS
for the three years ended March 31, 2002
2000
2001
2002
Notes
(Restated)
(Restated)
(Restated)
Rm
Rm
Rm
Revenue . . . . . . . . . . . . . . . . . . . . . . . . . . . . .
1
9,571.6
13,276.4
16,150.7
Direct network operating cost . . . . . . . . . . . . . . . . . .
(4,701.4)
(6,916.4)
(8,464.6)
Depreciation . . . . . . . . . . . . . . . . . . . . . . . . . . .
(1,025.3)
(1,364.1)
(1,857.3)
Other operating income . . . . . . . . . . . . . . . . . . . . .
14.5
48.5
29.2
Staff expenses . . . . . . . . . . . . . . . . . . . . . . . . . .
(648.6)
(950.6)
(1,135.2)
Marketing and advertising expenses . . . . . . . . . . . . . . .
(596.5)
(514.6)
(542.0)
General administration expenses . . . . . . . . . . . . . . . . .
(306.7)
(541.1)
(403.4)
Amortisation of intangible assets . . . . . . . . . . . . . . . .
2
(73.6)
(271.5)
(212.7)
Integration costs, disposals of operations and impairments . . .
3
129.
3
(213.2)
56.4
Profit from operations . . . . . . . . . . . . . . . . . . . . .
4
2,363.3
2,553.4
3,621.1
Interest and dividends received . . . . . . . . . . . . . . . . . .
6
32.0
25.4
32.0
Net finance costs . . . . . . . . . . . . . . . . . . . . . . . . .
7
(567.2)
(504.5)
(59.8)
Profit before taxation . . . . . . . . . . . . . . . . . . . . . .
1,828.1
2,074.3
3,593.3
Taxation . . . . . . . . . . . . . . . . . . . . . . . . . . . . . .
8
(513.6)
(765.7)
(1,190.7)
Profit after taxation . . . . . . . . . . . . . . . . . . . . . . .
1,314.5
1,308.6
2,402.6
Minority interest . . . . . . . . . . . . . . . . . . . . . . . . .
0.5
9.2
(29.6)
Net profit from ordinary activities . . . . . . . . . . . . . . .
33
1,315.0
1,317.8
2,373.0
2000
2001
2002
(Restated)
(Restated)
(Restated)
R
R
R
Basic and diluted earnings per share . . . . . . . . . . . . .
33
131 500
131 780
237 300
F117
VODACOM GROUP (PROPRIETARY) LIMITED
CONSOLIDATED BALANCE SHEETS
at March 31, 2002
2000
2001
2002
Notes
(Restated)
(Restated)
(Restated)
Rm
Rm
Rm
ASSETS
Non-current assets . . . . . . . . . . . . . . . . . . . . . . .
7,076.2
8,871.6
11,213.3
Property, plant and equipment . . . . . . . . . . . . . . . . .
9
5,854.1
7,696.2
9,896.6
Intangible assets . . . . . . . . . . . . . . . . . . . . . . . .
10
939.0
822.9
796.3
Investments . . . . . . . . . . . . . . . . . . . . . . . . . .
11
15.7
13.4
22.7
Acquired business held for sale . . . . . . . . . . . . . . . .
12
121.6
Deferred taxation . . . . . . . . . . . . . . . . . . . . . . .
13
145.8
339.1
497.7
Current assets . . . . . . . . . . . . . . . . . . . . . . . . . .
2,787.6
3,470.2
4,145.3
Foreign currency derivatives . . . . . . . . . . . . . . . . . .
39
12.7
0.8
215.6
Inventory . . . . . . . . . . . . . . . . . . . . . . . . . . . .
14
222.1
398.4
306.0
Accounts receivable . . . . . . . . . . . . . . . . . . . . . .
15
1,616.7
2,273.4
2,845.9
Short-term investments . . . . . . . . . . . . . . . . . . . .
11
58.6
Bank and cash balances . . . . . . . . . . . . . . . . . . . .
32
936.1
797.6
719.2
Total assets . . . . . . . . . . . . . . . . . . . . . . . . . . . .
9,863.8
12,341.8
15,358.6
EQUITY AND LIABILITIES
Capital and reserves . . . . . . . . . . . . . . . . . . . . . .
2,671.1
3,506.0
5,463.8
Ordinary share capital . . . . . . . . . . . . . . . . . . . . .
16
Non-distributable reserves . . . . . . . . . . . . . . . . . . .
17
0.6
(2.3)
106.1
Retained earnings . . . . . . . . . . . . . . . . . . . . . . .
2,670.5
3,508.3
5,357.7
Minority interest . . . . . . . . . . . . . . . . . . . . . . . .
18
(2.2)
(11.4)
10.6
Non-current liabilities . . . . . . . . . . . . . . . . . . . . . .
1,311.5
1,580.2
1,894.4
Interest bearing debt . . . . . . . . . . . . . . . . . . . . . .
19
817.2
896.1
780.2
Deferred taxation . . . . . . . . . . . . . . . . . . . . . . .
13
455.6
607.5
926.2
Provisions . . . . . . . . . . . . . . . . . . . . . . . . . . .
23
38.7
76.6
188.0
Current liabilities . . . . . . . . . . . . . . . . . . . . . . . .
5,883.4
7,267.0
7,989.8
Shareholder loans . . . . . . . . . . . . . . . . . . . . . . .
20
1,070.0
920.0
920.0
Accounts payable . . . . . . . . . . . . . . . . . . . . . . .
21
1,754.7
3,152.8
3,201.7
Taxation payable . . . . . . . . . . . . . . . . . . . . . . . .
560.1
810.0
351.6
Non-interest bearing debt . . . . . . . . . . . . . . . . . . .
22
4.3
32.4
4.3
Provisions . . . . . . . . . . . . . . . . . . . . . . . . . . .
23
198.7
273.8
319.5
Dividends payable . . . . . . . . . . . . . . . . . . . . . . .
0.1
483.8
600.0
Short-term interest bearing debt . . . . . . . . . . . . . . . .
19
844.4
0.5
1,015.9
Bank overdraft and other short-term debt . . . . . . . . . . .
32
1,451.1
1,593.7
1,576.8
Total equity and liabilities . . . . . . . . . . . . . . . . . . .
9,863.8
12,341.8
15,358.6
COMMITMENTS AND CONTINGENT LIABILITIES . . . .
34-36
F118
VODACOM GROUP (PROPRIETARY) LIMITED
CONSOLIDATED STATEMENTS OF CHANGES IN EQUITY
for the three years ended March 31, 2002
Share capital
Retained
Non-
Total
and premium
earnings
distributable
reserves
(Restated)
(Restated)
(Restated)
(Restated)
Rm
Rm
Rm
Rm
BALANCE AT APRIL 1, 1999 . . . . . . . . . . . . . . . .
1,355.5
1,355.5
Net profit for year . . . . . . . . . . . . . . . . . . . . .
1,315.0
1,315.0
Net gains and losses not recognised in the income
statement (Note 17)
Foreign currency translation reserve . . . . . . . . . . .
0.6
0.6
BALANCE AT MARCH 31, 2000 . . . . . . . . . . . . . .
2,670.5
0.6
2,671.1
Net profit for year . . . . . . . . . . . . . . . . . . . . .
1,317.8
1,317.8
Dividends declared . . . . . . . . . . . . . . . . . . . . .
(480.0)
(480.0)
Net gains and losses not recognised in the income
statement (Note 17)
Foreign currency translation reserve . . . . . . . . . . .
(2.9)
(2.9)
BALANCE AT MARCH 31, 2001 . . . . . . . . . . . . . .
3,508.3
(2.3)
3,506.0
Change in accounting policy (Note 24) . . . . . . . . . .
84.9
84.9
BALANCE AT MARCH 31, 2001 RESTATED . . . . . .
3,593.2
(2.3)
3,590.9
Net profit for year . . . . . . . . . . . . . . . . . . . . .
2,373.0
2,373.0
Dividends declared . . . . . . . . . . . . . . . . . . . . .
(600.0)
(600.0)
Contingency reserve . . . . . . . . . . . . . . . . . . . .
(8.5)
8.5
Net gains and losses not recognised in the income
statement (Note 17)
Foreign currency translation reserve . . . . . . . . . . .
119.8
119.8
Foreign currency translation reserve
deferred taxation . . . . . . . . . . . . . . . . . . . .
(19.9)
(19.9)
BALANCE AT MARCH 31, 2002 . . . . . . . . . . . . . .
5,357.7
106.1
5,463.8
F119
VODACOM GROUP (PROPRIETARY) LIMITED
CONSOLIDATED CASH FLOW STATEMENTS
for the three years ended March 31, 2002
2000
2001
2002
Notes
(Restated)
(Restated)
(Restated)
Rm
Rm
Rm
CASH FLOW FROM OPERATING ACTIVITIES
Cash receipts from customers . . . . . . . . . . . . . . . . .
9,619.1
12,664.8
15,583.1
Cash paid to suppliers and employees . . . . . . . . . . . . .
(6,437.1)
(8,001.2)
(9,395.0)
CASH GENERATED FROM OPERATIONS . . . . . . . .
25
3,182.0
4,663.6
6,188.1
Finance costs paid . . . . . . . . . . . . . . . . . . . . . . .
26
(554.3)
(497.9)
(374.1)
Interest income received . . . . . . . . . . . . . . . . . . . .
31.3
25.4
26.5
Taxation paid . . . . . . . . . . . . . . . . . . . . . . . . . .
27
(318.3)
(567.6)
(1,539.1)
Integration costs . . . . . . . . . . . . . . . . . . . . . . . .
(13.7)
Dividends paid shareholders . . . . . . . . . . . . . . . . .
(480.0)
Dividends paid minority shareholders in subsidiaries . . . .
(6.3)
Dividends received . . . . . . . . . . . . . . . . . . . . . . .
0.7
NET CASH FLOWS FROM OPERATING ACTIVITIES . . .
2,341.4
3,609.8
3,815.1
CASH FLOW FROM INVESTING ACTIVITIES
Additions to property, plant and equipment . . . . . . . . . .
28
(2,693.2)
(2,834.9)
(4,409.1)
Proceeds on disposal of property, plant and equipment . . . .
61.7
83.0
92.4
Acquisition of intangible assets . . . . . . . . . . . . . . . .
10
(10.5)
(193.7)
Disposal of subsidiaries . . . . . . . . . . . . . . . . . . . .
29
1.7
Acquisition of subsidiaries . . . . . . . . . . . . . . . . . .
29
(699.3)
(113.8)
(0.1)
Disposal of joint ventures . . . . . . . . . . . . . . . . . . .
30
51.8
23.3
Acquisition of joint ventures . . . . . . . . . . . . . . . . .
30
(120.7)
Disposal/(Acquisition) of other investments . . . . . . . . .
(126.1)
18.0
Other investing activities . . . . . . . . . . . . . . . . . . .
(1.0)
(4.9)
(57.8)
Disposal of internet division . . . . . . . . . . . . . . . . . .
31
199.8
NET CASH FLOWS UTILISED IN INVESTING ACTIVITIES
(3,337.5)
(2,852.6)
(4,543.3)
CASH FLOW FROM FINANCING ACTIVITIES
Shareholder loans repaid . . . . . . . . . . . . . . . . . . . .
(150.0)
Interest bearing debt incurred . . . . . . . . . . . . . . . . .
1,120.6
570.6
Interest bearing debt repaid . . . . . . . . . . . . . . . . . .
(459.4)
(847.4)
Non-interest bearing debt repaid . . . . . . . . . . . . . . .
(16.9)
Finance lease capital repaid . . . . . . . . . . . . . . . . . .
(15.1)
(23.9)
NET CASH FLOWS FROM/(UTILISED) IN FINANCING
ACTIVITIES . . . . . . . . . . . . . . . . . . . . . . . . . . .
646.1
(1,038.2)
570.6
NET DECREASE IN CASH AND CASH EQUIVALENTS .
(350.0)
(281.0)
(157.6)
Cash and cash equivalents at beginning of year . . . . . . . .
(164.5)
(515.0)
(796.1)
Effect of foreign exchange rate changes . . . . . . . . . . . .
(0.5)
(0.1)
96.1
CASH AND CASH EQUIVALENTS AT END OF YEAR . .
32
(515.0)
(796.1)
(857.6)
VODACOM GROUP (PROPRIETARY) LIMITED
NOTES TO THE CONSOLIDATED FINANCIAL STATEMENTS
for the three years ended March 31, 2002
BASIS OF PREPARATION
These consolidated annual financial statements have been prepared in accordance with International Accounting Standards and
have been prepared on the historical cost basis, unless otherwise indicated. The consolidated annual financial statements have
been presented in South African Rands, as this is the currency in which the majority of the Group's transactions are denominated.
The principal accounting policies are consistent in all material respects with those applied in the previous period, except where
disclosed elsewhere.
Certain restatements and adjustments were effected to these financial statements from those previously issued by the Group.
Those restatements and adjustments that had a material effect on the financial statements are disclosed in Note 44.
The following are the principal accounting policies adopted by the Group in the preparation of these consolidated annual
financial statements:
ACCOUNTING POLICIES
1.
CONSOLIDATION
1.1
Basis of consolidation
The consolidated annual financial statements include the consolidated financial position, results of operations and cash
flows of Vodacom Group (Proprietary) Limited and its subsidiaries, both foreign and domestic, up to March 31, 2002.
Joint ventures are included using the proportionate consolidation method, whereby the Group's share of the assets,
liabilities, income, expenses and cash flows of joint ventures are combined on a line-by-line basis with similar items
in the consolidated annual financial statements.
Subsidiaries and joint ventures where control is intended to be temporary, as they are acquired and held exclusively
with a view to their subsequent disposal in the near future or the subsidiary or joint venture is operating under severe
long-term restrictions, which significantly impairs its ability to transfer funds, are not consolidated, or proportionately
consolidated. Such subsidiaries and joint ventures are accounted for as investments in terms of the accounting policy
for Financial Instruments. The Group, however, does not speculate in the acquisition and disposal of investments.
Minority interests in the consolidated balance sheet and income statement are separately presented.
Goodwill, on the acquisition of subsidiaries and joint ventures is accounted for in accordance with the Group's
accounting policy for Intangible Assets set out below.
1.2
Business combinations
Acquisitions in a business combination
Business combination acquisitions are accounted for using the purchase method of accounting, whereby the
acquisition is accounted for at its cost plus any costs directly attributable to the acquisition. Cost represents
the cash or cash equivalents paid or the fair value, at the date of the acquisition, of the purchase consideration.
Business combinations include the acquisition of subsidiaries and joint ventures.
On acquisition, the identifiable assets and liabilities of the relevant subsidiaries or joint ventures are measured
based upon the Group's interest in their fair value at the date of acquisition.
Disposals in a business combination
On subsequent disposal, the profit or loss on disposal is the difference between the selling price and the fair
value of net assets and liabilities disposed of, adjusted for any related goodwill to the extent that it has
not been amortised in the consolidated income statement in accordance with the Group's accounting policies.
1.3
Subsidiaries
Subsidiaries are those entities controlled by the Group. Control is presumed to exist where the Group has an interest
of more than one-half of the voting rights and the power to control the financial and operating activities of the entities
so as to obtain benefits from its activities. All subsidiaries are consolidated.
Inter-company balances and transactions, and resulting unrealised profits between Group companies, are eliminated
in full on consolidation.
F120
VODACOM GROUP (PROPRIETARY) LIMITED
NOTES TO THE CONSOLIDATED FINANCIAL STATEMENTS
for the three years ended March 31, 2002
1.
CONSOLIDATION (continued)
1.3
Subsidiaries (continued)
Where necessary, accounting policies of subsidiaries are adjusted to ensure that the consolidated annual financial
statements are prepared using uniform accounting policies.
Investments in subsidiaries are consolidated from the date on which the Group has power to exercise control,
up to the date on which power to exercise control ceases.
1.4
Joint ventures
Joint ventures, for the purpose of these consolidated annual financial statements, are those entities in which the Group
has joint control through a contractual arrangement with one or more other venturers.
Investments in joint ventures are proportionately consolidated from the date on which the Group has power to exercise
joint control, up to the date on which power to exercise joint control ceases.
The Group's proportionate share of inter-company balances and transactions, and resulting unrealised profit or losses,
between Group companies and jointly controlled entities are eliminated on consolidation.
2.
PROPERTY, PLANT AND EQUIPMENT
Property, plant and equipment are stated at cost less accumulated depreciation and any accumulated impairment losses. Land
is not depreciated and is recorded at cost.
Cost of property, plant and equipment includes all directly attributable expenditure incurred in the acquisition, establishment
and installation of such assets so as to bring them to a working condition for their intended use. Interest costs are not
capitalised.
Depreciation is calculated so as to write off the cost of property, plant and equipment on a straight-line basis, over their
estimated useful lives to its estimated residual value. Depreciation commences when the asset is ready for its intended use
(in the case of infrastructure assets this is deemed to be the date of acceptance). The estimated useful lives of depreciable
property, plant and equipment are as follows:
General purpose buildings
50 years
Special purpose buildings
15 years
Infrastructure
GSM
8 years
Value added services equipment
8 years
Value added services software
3 years
Community services
Containers
5 years
Cellular equipment
2 years
Information services
Equipment
4 years
Software
3 years
SIM centre
4 years
Office automation
2 - 3 years
Other assets
Motor vehicles
4 years
Furniture and fittings
5 years
Office equipment
4 years
General purpose buildings are classified as owner-occupied. They are therefore held at cost and depreciated as property,
plant and equipment, and not regarded as investment properties.
Assets held under finance leases are depreciated over their expected useful lives on the same basis as owned assets or, where
shorter, the term of the relevant lease if there is no reasonable certainty that the Group will obtain ownership by the end of
the lease term.
F121
F122
VODACOM GROUP (PROPRIETARY) LIMITED
NOTES TO THE CONSOLIDATED FINANCIAL STATEMENTS
for the three years ended March 31, 2002
2.
PROPERTY, PLANT AND EQUIPMENT (continued)
Maintenance and repairs, which neither materially add to the value of the assets nor appreciably prolong their useful lives,
are recognised as an expense in the period incurred. Minor plant and equipment items are also recognised as an expense in
the period incurred.
Profits or losses on the retirement or disposal of property, plant and equipment, determined as the difference between the
actual proceeds and the carrying amount of the assets, are recognised in the consolidated income statement in the period in
which they occur.
3.
INTANGIBLE ASSETS
Intangible assets are stated at cost less accumulated amortisation and accumulated impairment losses, if any. The residual
value of intangible assets is assumed to be zero. Intangible assets are amortised to the consolidated income statement on a
straight-line basis over their estimated useful lives, which are reviewed on an annual basis. Amortisation commences when
the intangible asset is available for use. The estimated useful lives of intangible assets are currently as follows:
Licences
Mobile
5 - 20 years
Other intangible assets
Contract mobile customers
5 years
Internet customer related
3 years
Trademarks
5 years
Goodwill
(Note 3.4)
The following are the main categories of intangible assets:
3.1
Licences
Licences, which are acquired to yield an enduring benefit, are capitalised at cost and amortised from the date of
commencement of usage rights over the duration of the licence agreement.
3.2
Customer bases
Cost of contract customer bases represents the purchase price on the acquisition of mobile or internet customer bases.
Customer bases are amortised on a straight-line basis over their estimated useful lives.
3.3
Trademarks and brands
Purchased trademarks and brands are capitalised at cost and amortised over their estimated useful lives. Expenditure
incurred to develop, maintain and renew trademarks and brands internally is recognised as an expense in the period
incurred.
3.4
Goodwill
Goodwill represents the excess of the cost of the acquisition of a subsidiary or joint venture, over the Group's interest
in the fair value of identifiable assets and liabilities at the date of acquisition, and is carried at cost less accumulated
amortisation and accumulated impairment losses, if any. Goodwill is amortised on a straight-line basis over its
estimated useful life, not exceeding 20 years.
4.
INVENTORY
Inventory is stated at the lower of cost and net realisable value. Cost is determined by the first-in-first-out method and
comprises all costs of purchase, costs of conversion and other costs incurred in bringing it to its present location and
condition. Net realisable value represents the estimated selling price in the ordinary course of business less all estimated
costs to completion and the estimated costs necessary to make the sale.
The amount of any write-down of inventory to net realisable value and all losses of inventory is recognised as an expense in
the period the write-down or loss occurs.
F123
VODACOM GROUP (PROPRIETARY) LIMITED
NOTES TO THE CONSOLIDATED FINANCIAL STATEMENTS
for the three years ended March 31, 2002
5.
FOREIGN CURRENCIES
5.1
Transactions and balances
Foreign currency transactions are translated, on initial recognition, at the foreign exchange rate ruling at the date of the
transaction.
Monetary assets and liabilities denominated in foreign currencies are translated at the foreign exchange rate ruling at
settlement date or balance sheet date whichever occurs first. Exchange differences on the settlement or translation of
monetary assets or liabilities are included in finance costs in the period in which they arise.
5.2
Foreign entities
The annual financial statements of foreign entities are translated into South African Rands for incorporation into the
consolidated annual financial statements. Assets and liabilities are translated at the foreign exchange rates ruling at
balance sheet date. Income, expenditure and cash flow items are translated at the actual foreign exchange rate or
average foreign exchange rates for the period.
Gains and losses on the translation of equity loans to foreign entities that are intended to be permanent are recognised
in equity.
All resulting unrealised exchange differences are classified as equity. On disposal, the cumulative amounts of
unrealised exchange differences that have been deferred are recognised in the consolidated income statement as part of
the gain or loss on disposal.
Goodwill adjustments arising on the acquisition of a foreign entity are treated as assets and liabilities
of the Group and translated at the foreign exchange rates ruling at transaction date.
5.3
Foreign currency hedges
Foreign currency hedges are dealt with in the Financial Instruments accounting policy.
6.
TAXATION
6.1
Current taxation
The charge for current taxation is based on the results for the period and is adjusted for items that are non-assessable
or disallowed. Current taxation is measured at the amount expected to be paid, using taxation rates and laws that have
been enacted or substantively enacted by the balance sheet date.
6.2
Deferred taxation
Deferred taxation is provided using the balance sheet liability method for all temporary differences arising between the
carrying amounts of assets and liabilities, on the consolidated balance sheet, and their respective taxation bases.
Deferred taxation is not provided on differences relating to goodwill for which amortisation is not deductible for
taxation purposes nor on the initial recognition of assets or liabilities, which is not a business combination and, at the
time of the transaction, affects neither accounting nor taxable profit or loss.
Deferred taxation liabilities are recognised for taxable temporary differences associated with investments in
subsidiaries and joint ventures, except where the Group is able to control the timing of the reversal of the temporary
differences and it is probable that it will not reverse in the foreseeable future.
Deferred taxation assets are recognised to the extent that it is probable that future taxable profit will be available
against which the associated unused taxation losses or credits and deductible temporary differences can be utilised.
Provision for taxation, which could arise if undistributed retained profit of certain subsidiaries is remitted, is only
made where a decision has been taken to remit such retained profits.
6.3
Secondary Taxation on Companies
Secondary Taxation on Companies (STC) is provided for at a rate of 12.5% on the amount of the net dividend declared
by Vodacom Group (Proprietary) Limited. It is recorded as a tax expense when dividends are declared.
F124
VODACOM GROUP (PROPRIETARY) LIMITED
NOTES TO THE CONSOLIDATED FINANCIAL STATEMENTS
for the three years ended March 31, 2002
7.
EMPLOYEE BENEFITS
7.1
Post-employment benefits
The Group provides defined contribution funds for the benefit of employees, the assets of which are held in separate
funds. The funds are funded by payments from employees and the Group. Contributions to the fund are recognised as
an expense in the period in which the employee renders the related service.
The Group has no liability for contributions to the medical aid of retired employees.
7.2
Short-term and long-term benefits
The cost of all short-term employee benefits, such as salaries, employee entitlements to leave pay, bonuses, medical
aid and other contributions, are recognised during the period in which the employee renders the related service. The
Group recognises the expected cost of bonuses only when the Group has a present legal or constructive obligation to
make such payment and a reliable estimate can be made.
7.3
Accumulative termination benefits
Accumulative termination benefits are payable whenever:
an employee's employment is terminated before the normal retirement date; or
an employee accepts voluntary redundancy.
The Group recognises termination benefits when it is constructively obliged to either terminate the employment of
current employees according to a detailed formal plan without possibility of withdrawal or to provide termination
benefits as a result of an offer made to encourage voluntary redundancy. If the benefits fall due more than 12 months
after balance sheet date, they are discounted to present value. In the case of an offer to encourage voluntary
redundancy and if the amount can be reasonably estimated, the measurement of termination benefits is based on the
number of employees expected to accept the offer.
7.4
Compensation benefits
Employees of the wholly-owned subsidiaries, including executive directors, are eligible for compensation benefits in
the form of a Deferred Bonus Incentive Scheme. Periodically, a number of entitlements are issued to employees, the
value of which depends on the seniority of the employee. Benefits of eligible employees arising from the entitlements
are determined with reference to the present value per entitlement, which is determined annually based on profits as
per the audited consolidated annual financial statements of Vodacom Group (Proprietary) Limited.
The fair value of the entitlements is calculated as the difference in the entitlement value at balance sheet date and the
value at which the entitlements were issued, multiplied by the number of entitlements allocated to a participant. Any
change in entitlement value is recorded in the income statement based on the present value of the expected future cash
out flows and recorded as a liability in the balance sheet. Participating employees are entitled to cash in the
entitlements over a six-year period.
8.
REVENUE RECOGNITION
Revenue, which excludes Value-Added Taxation and sales between Group companies, represents the invoiced value of goods
and services supplied by the Group. The Group measures revenue at the fair value of the consideration received or
receivable. Revenue is recognised only when it is probable that the economic benefits associated with a transaction will flow
to the Group and the amount of revenue, and associated costs incurred or to be incurred, can be measured reliably. If
necessary, revenue is split into separately identifiable components.
The main categories of revenue and bases of recognition for the Group are:
8.1
Contract products
These contracts may include a subsidised handset, 24-month service, activation, SIM-card and a user manual.
Revenue is recognised as follows:
The loss on the subsidised handset which includes the costs of the handset, the SIM-card and manual, is recognised
upon activation by the customer.
Activation fee revenue received from the customer is recognised upon activation by the customer.
Monthly access revenue received from the customer is recognised in the period in which the service is delivered.
F125
VODACOM GROUP (PROPRIETARY) LIMITED
NOTES TO THE CONSOLIDATED FINANCIAL STATEMENTS
for the three years ended March 31, 2002
8.
REVENUE RECOGNITION (continued)
8.1
Contract products (continued)
Airtime revenue is recognised on the usage basis. The terms and conditions of the bundled airtime products allow
the carry over of unused minutes and accumulation to a maximum of five times the monthly allocation. The unused
airtime is deferred in full.
Deferred revenue related to unused airtime is recognised when utilised by the customer. Upon termination of the
customer contract, all deferred revenue for unused airtime is recognised in income.
Any other costs incurred as a result of a new customer, are expensed upon activation as this is treated as a customer
acquisition cost.
8.2
Prepaid products
Airtime
Upon purchase of a airtime voucher the customer receives the right to make outgoing calls. Revenue is recognised
as the voucher is utilised by the customer. All airtime vouchers have an expiry date where any activated vouchers
with deferred revenue related to unused minutes are recognised upon expiration since the Group has no remaining
service obligation and the unused airtime is not refundable.
Remaining elements of prepaid packages
When a handset is sold with a prepaid package, all the costs, which include the costs of the handset, the SIM-card
and manual, together with the subsidy, is treated as a customer acquisition cost and the loss is recognised upon
activation by the customer. The cost of a package sold without a handset is also treated as a customer acquisition
cost.
The residual revenue related to the remaining elements of the prepaid packages are not separable since no objective
evidence of fair value exists. The Group currently recognises this residual amount upon activation.
8.3
Equipment sales
All equipment sales are recognised only when delivery and acceptance has taken place. Equipment sales to third party
service providers are recognised when delivery is accepted. No rights of return exist on sales to third party service
providers.
8.4
Other revenue and income
Interconnect income
Interconnect income is recognised on the usage basis.
Dividends
Dividends from investments are recognised when the right to receive payment has been established.
Interest
Interest is recognised on a time proportion basis with reference to the principal amount receivable and the effective
interest rate applicable.
9.
LEASES
9.1
Lease classification
Leases involving property, plant and equipment whereby the lessor provides finance to the lessee with the asset as
security, and where the lessee assumes the significant risks and rewards of ownership of those leased assets, are
classified as finance leases.
Leases of property, plant and equipment to the lessee, under which the lessor effectively retains the significant risks
and rewards of ownership of those leased assets, are classified as operating leases.
9.2
Group as lessee
Finance leases
Lessee finance leases are capitalised, as property, plant and equipment, at their cash equivalent cost and a
corresponding finance lease liability is raised. The cash equivalent cost is the lower of fair value or the present
value of the minimum lease payments, at inception of the lease. Such assets are depreciated in terms of the
accounting policy on property, plant and equipment stated above.
F126
VODACOM GROUP (PROPRIETARY) LIMITED
NOTES TO THE CONSOLIDATED FINANCIAL STATEMENTS
for the three years ended March 31, 2002
9.
LEASES (continued)
9.2
Group as lessee (continued)
Finance leases (continued)
Lease payments are allocated between lease finance costs and a capital reduction of the finance lease liability.
Lease finance costs are allocated to the consolidated income statement over the term of the lease using the effective
interest rate method, so as to produce a constant periodic rate of return on the remaining balance of the liability for
each period.
Operating leases
Lessee operating lease rental payments are expensed in the consolidated income statement on a straight-line basis
over the lease term.
When an operating lease is terminated before the lease term has expired any payment to the lessor that is required,
by way of penalty, is recognised as an expense in the period in which termination takes place.
10.
DERIVATIVE INSTRUMENTS
Prior to April 1, 2001, the Group entered into foreign exchange forward contracts to hedge the Group's exposure to
fluctuations in foreign currency exchange rates on specific transactions. Up to March 31, 2001, gains and losses on forward
contracts designated as hedges of identifiable foreign currency firm commitments were deferred and included in the
measurement of the related foreign currency transactions.
The portion of the premium paid or received relating to the commitment period was included in the measurement of the basis
of the related foreign currency transaction when recorded. Any remaining premium was amortised over the remaining life of
the forward contract.
Foreign exchange contract costs incurred in covering foreign currency loans are expensed over the period of the contract and
are included in finance costs.
Effective April 1, 2001, the Group adopted IAS 39: Financial Instruments: Recognition and Measurement (Revised 2000)
("IAS 39"), which requires that all derivative instruments be recorded on the balance sheet at fair value. Changes in the fairvalue of forward contracts are recorded each period in current earnings, as the forward contracts do not qualify as hedges
under IAS 39. Upon initial application of IAS 39, the Group recorded the fair value of the existing forward contracts on the
balance sheet and the corresponding gain was recognised as an adjustment of the opening balance of retained earnings.
Prior to April 1, 2001, the Group entered into interest rate swap agreements in order to manage interest rate exposure. The
net interest paid or received on the swaps was recognised as interest expense. Gains resulting from the early termination of
interest rate swap agreements were deferred and amortised as adjustments to interest expense over the remaining period
originally covered by the terminated swap.
Effective April 1, 2001 interest rate swaps are fair valued and recorded on the balance sheet in accordance with IAS 39.
The Group does not use financial instruments for trading or speculative purposes.
11.
FINANCIAL INSTRUMENTS OTHER THAN DERIVATIVES
11.1
Initial recognition and measurement
All financial instruments, other than derivatives which are dealt with above, are recognised on the consolidated balance
sheet. Financial instruments are initially recognised when the Group becomes party to the contractual terms of the
instruments and are measured at cost, which is the fair value of the consideration given (financial asset) or received
(financial liability or equity instrument) for it. Financial liabilities and equity instruments issued by the Group are
classified at initial recognition as debt or equity or compounded instruments in terms of IAS 32 on the basis of their
contractual terms. Transaction costs are included in the initial measurement of the financial instrument. Subsequent to
initial recognition, these instruments are measured as set out below.
11.2
Financial assets
The Group's principal financial assets are investments, foreign currency assets, receivables and bank and cash
balances:
Investments
Investments in equity instruments, excluding those in subsidiaries and joint ventures, are classified as available for
sale and are stated at fair value. Gains and losses from changes in fair value of available for sale financial assets
are recognised directly in equity until the financial asset is disposed of or it is determined to be impaired, at which
time the cumulative gain or loss previously recognised in equity is included in the consolidated income statement.
F127
VODACOM GROUP (PROPRIETARY) LIMITED
NOTES TO THE CONSOLIDATED FINANCIAL STATEMENTS
for the three years ended March 31, 2002
11.
FINANCIAL INSTRUMENTS OTHER THAN DERIVATIVES (continued)
11.2
Financial assets (continued)
Investments (continued)
Investments acquired principally for the purpose of generating a profit from the short-term fluctuations in price, are
classified as held for trading and are recorded and measured at fair value. Gains and losses on these investments
are recorded in the consolidated income statement.
Interest bearing investments, including investments in finance leases, are stated at original investment less principal
payments, and amortisations, and less accumulated impairment.
Receivables
Receivables originated by the Group are stated at their cost less a provision for doubtful debts. An estimate of
doubtful debts is made based on a review of all outstanding amounts at balance sheet date. Bad debts are written
off during the period in which they are identified.
The Group's policy for determining the allowance for doubtful accounts in full (unless arrangements have been
made with the debtor for payment) is as follows:
All amounts outstanding for 120 days and more.
Any specific retailers, dealers or subscribers outstanding for less than 120 days, where there is deemed to be a
significant risk of non-payment.
In addition, if accounts receivable balances are handed over for collection, they are written off in full regardless
of days outstanding. The hand over of outstanding debt is determined on a case by case basis, but usually occurs
after amounts have been outstanding for 90 days for individual subscribers and after 150 days for all other
accounts receivables.
The Group invoices its independent service providers and dealers (agents) for the revenue billed by them on behalf
of the Group. The Group, within its contractual arrangements with its agents, pays them administrative fees. The
Group receives in cash, the net amount equal to the gross revenue earned less the administrative fees payable to the
agents.
Bank and cash balances
The accounting policy for bank and cash balances is dealt with under cash and cash equivalents set out below.
11.3
Financial liabilities
The Group's principal financial liabilities are shareholder loans, interest bearing debt, non-interest bearing debt,
accounts payable, dividends payable, provisions and bank borrowings and other short-term debt:
Shareholder loans
Shareholder loans are recognised at the original proceeds received less principal payments.
Interest bearing debt
Interest bearing debt, including finance lease obligations, is recognised at amortised cost, namely original debt less
principal payments and amortisations. The accounting policy for finance lease obligations is dealt with under
leases set out above.
Accounts payable
Accounts payable are stated at their cost.
Dividends payable
Dividends payable are stated at amounts declared.
Bank borrowings and other short-term debt
The accounting policy for bank borrowings and other short-term debt is dealt with under cash and cash equivalents
set out below.
11.4
Equity instruments
The Group's principal equity instrument is ordinary share capital, which is recorded at original cost.
F128
VODACOM GROUP (PROPRIETARY) LIMITED
NOTES TO THE CONSOLIDATED FINANCIAL STATEMENTS
for the three years ended March 31, 2002
11.
FINANCIAL INSTRUMENTS OTHER THAN DERIVATIVES (continued)
11.5
De-recognition
Financial assets (or a portion thereof) are de-recognised when the Group realises the rights to the benefits specified in
the contract, the rights expire or the Group surrenders or otherwise loses control of the contractual rights that
comprise the financial asset. On de-recognition, the difference between the carrying amount of the financial asset and
proceeds receivable and any prior adjustment to reflect fair value that had been reported in equity are included in the
consolidated income statement.
Financial liabilities (or a portion thereof) are de-recognised when the obligation specified in the contract is discharged,
cancelled or expire. On de-recognition, the difference between the carrying amount of the financial liability, including
related unamortised costs and amounts paid for it are included in the consolidated income statement.
11.6
Fair value methods and assumptions
The fair value of financial instruments traded in an organised financial market are measured at the applicable quoted prices.
The fair value of financial instruments not traded in an organised financial market, is determined using a variety of
methods and assumptions that are based on market conditions and risk existing at balance sheet date, including
independent appraisals and discounted cash flow methods.
The carrying amounts of financial assets and liabilities with a maturity of less than one year are assumed to
approximate their fair value.
11.7
Offset
Where a legally enforceable right of offset exists for recognised financial assets and financial liabilities, and there is
an intention to settle the liability and realise the asset simultaneously, or to settle on a net basis, all related financial
effects are offset.
12.
PROVISIONS
Provisions are recognised when the Group has a present legal or constructive obligation resulting from past events, for which
it is probable that an outflow of resources embodying economic benefits will be required to settle the obligation and a
reliable estimate of the amount of the obligation can be made. A past event is deemed to give rise to a present obligation if,
taking into account the available evidence, it is more likely than not that a present obligation exists at balance sheet date.
The amount recognised as a provision, is the best estimate of the expenditure required to settle the present obligation at
balance sheet date, taking into account risks and uncertainties surrounding the provision.
13.
IMPAIRMENT OF ASSETS
The carrying amounts of assets, mentioned in the accounting policy notes, are assessed at each balance sheet date to
determine whether there is any indication of impairment. If any such indication exists, the Group estimates the recoverable
amount of the asset, being the higher of the asset's net selling price and its value in use. An impairment loss is recognised if
the recoverable amount of an asset is less than its carrying amount. The impairment loss is recognised as an expense in the
consolidated income statement immediately.
The net selling price represents the amount obtainable from the sale of an asset in an arm's length transaction between
knowledgeable, willing parties, less costs of disposal.
The value in use of an asset represents the expected future cash flows, from continuing use and disposal that are discounted
to their present value using an appropriate pre-tax discount rate that reflects current market assessments of the time value of
money and the risks specific to the asset.
For an asset that does not generate cash inflows largely independent of those from other assets, the recoverable amount is
determined for the cash-generating unit to which the asset belongs. An impairment loss is recognised whenever the
recoverable amount of a cash-generating unit is less than its carrying amount. The impairment loss is allocated to reduce the
carrying amount of the assets of the cash-generating unit, first to goodwill in respect of the cash generating unit, if any, and
then to the other assets on a pro rata basis based on their carrying amounts.
F129
VODACOM GROUP (PROPRIETARY) LIMITED
NOTES TO THE CONSOLIDATED FINANCIAL STATEMENTS
for the three years ended March 31, 2002
13.
IMPAIRMENT OF ASSETS (continued)
A previously recognised impairment loss is reversed if there has been a change in the estimates used to determine the
recoverable amount, however not to an amount higher than the carrying amount that would have been determined had no
impairment loss been recognised in prior periods.
After the recognition of an impairment loss, any depreciation or amortisation charge for the asset is adjusted for future
periods to allocate the asset's revised carrying amount, less its estimated residual value, on a systematic basis over its
remaining useful life.
For goodwill, a recognised impairment loss is not reversed, unless the impairment loss was caused by a specific external event
of an exceptional nature that is not expected to recur and the increase relates clearly to the reversal of the effect of that event.
14.
CASH AND CASH EQUIVALENTS
For the purpose of the consolidated cash flow statement, cash and cash equivalents comprise cash on hand, deposits held on
call, net of bank borrowings, all of which are available for use by the Group unless otherwise stated. Cash on hand is
measured at its face value. Deposits held on call are classified as loans originated by the company and carried at amortised
cost. Due to the short-term nature of these, the amortised cost approximates its fair value.
Bank borrowings, consisting of interest bearing short-term bank loans repayable on demand and overdrafts are recorded at
the proceeds received, net of direct issue costs. Finance costs, including premiums payable on settlement or redemption, are
accounted for on an accrual basis and are added to the carrying amount of the instrument to the extent that they are not
settled in the period in which they arise.
15.
EXPENSES
Marketing and advertising costs are expensed as they are incurred. Prepaid costs related to annual events sponsorships are
written-off over the duration of the event.
16.
INCENTIVES
Incentives paid to service providers and dealers for new activations, retention of existing customers and reaching specified
sales targets are expensed as incurred.
Distribution incentives paid to service providers and dealers for exclusivity, distribution assets and distribution subsidies are
deferred and expensed over the contractual relationship period.
17.
DISCONTINUING OPERATIONS
Discontinuing operations are significant, distinguishable components of an enterprise that have been sold, abandoned or are
the subject of formal plans for disposal or discontinuance.
The profit or loss on the sale or abandonment of a discontinuing operation is determined from the earlier of the enterprise
entering into a binding sale agreement for substantially all of the assets attributable to the discontinuing operation, or, the
approval and announcement of a detailed, formal plan of discontinuance by the board of directors.
18.
USE OF ESTIMATES
The preparation of financial statements in accordance with Generally Accepted Accounting Principles require the use of
estimates and assumptions that affect the reported amounts of assets and liabilities and disclosure of contingent assets and
liabilities on the date of the financial statements and the reported amounts of revenues and expenses during the reporting
period.
Although these estimates are based on management's best knowledge of current events and actions they may undertake in the
future, actual results ultimately may differ from those estimates.
19.
COMPARATIVES
Certain comparative figures have been reclassified, where required or necessary, in accordance with current period
classifications and presentation.
F130
VODACOM GROUP (PROPRIETARY) LIMITED
NOTES TO THE CONSOLIDATED FINANCIAL STATEMENTS
for the three years ended March 31, 2002
2000
2001
2002
Rm
Rm
Rm
1.
REVENUE
Airtime and access . . . . . . . . . . . . . . . . . . . . . . . . . . . .
5,320.1
7,255.1
9,486.5
Interconnect revenue . . . . . . . . . . . . . . . . . . . . . . . . . . .
2,582.9
3,260.1
4,300.9
Equipment sales . . . . . . . . . . . . . . . . . . . . . . . . . . . . . .
1,275.0
2,042.3
1,627.4
Other . . . . . . . . . . . . . . . . . . . . . . . . . . . . . . . . . . . .
101.6
458.9
434.8
International airtime . . . . . . . . . . . . . . . . . . . . . . . . . . . .
292.0
260.0
301.1
9,571.6
13,276.4
16,150.7
2.
AMORTISATION OF INTANGIBLE ASSETS
Goodwill . . . . . . . . . . . . . . . . . . . . . . . . . . . . . . . . . .
(35.8)
(150.1)
(98.9)
Licences . . . . . . . . . . . . . . . . . . . . . . . . . . . . . . . . . .
(6.7)
(7.2)
(9.4)
Trademarks . . . . . . . . . . . . . . . . . . . . . . . . . . . . . . . .
(6.3)
(16.8)
(7.1)
Customer bases . . . . . . . . . . . . . . . . . . . . . . . . . . . . . .
(24.8)
(97.4)
(97.3)
(73.6)
(271.5)
(212.7)
3.
INTEGRATION COSTS, DISPOSALS OF OPERATIONS AND
IMPAIRMENTS
Globalstar Southern Africa (Proprietary) Limited excluding
goodwill of R24.7 million for 2001 (Note 3.1) . . . . . . . . . . . . . .
(148.0)
37.7
Impairment of property, plant and equipment . . . . . . . . . . . . .
(97.7)
Impairment of shareholder loan . . . . . . . . . . . . . . . . . . . .
(4.8)
Satellite phones onerous contract . . . . . . . . . . . . . . . . . .
(45.5)
45.5
Recoupment of Gateway assets accrual (Note 36) . . . . . . . . . . .
15.0
Management fees paid to Telkom SA Limited in respect of the
Delareyville earth station (Note 36) . . . . . . . . . . . . . . . . . .
(22.8)
Capital gain on disposal of discontinued operations (Note 5) . . . . . .
129.3
1.6
19.0
Joycell Shops (Proprietary) Limited and Yellow Lizard Web
Design (Proprietary) Limited . . . . . . . . . . . . . . . . . . . . . .
1.6
2.7
Vodacom Sport & Entertainment (Proprietary) Limited . . . . . . . .
40.0
Film Fun (Holdings) (Proprietary) Limited . . . . . . . . . . . . . .
(53.8)
Vodacom World Online (Proprietary) Limited (Note 5.1) . . . . . . .
129.3
30.1
Write-off of investment in GSM Companies . . . . . . . . . . . . . . .
(0.3)
Vodacom Service Provider Company (Proprietary) Limited
Integration costs (Note 3.2) . . . . . . . . . . . . . . . . . . . . . . . .
(36.5)
Film Fun (Holdings) (Proprietary) Limited, trading as Teljoy
Integration costs (Note 3.3) . . . . . . . . . . . . . . . . . . . . . . . .
(30.3)
129.3
(213.2)
56.4
3.1
Globalstar Southern Africa (Proprietary) Limited
Vodacom Group (Proprietary) Limited acquired 100% of the share capital of Globalstar Southern Africa (Proprietary)
Limited with effect from August 1, 2000. The principal nature of the business of the company is that of a provider of
wholesale satellite airtime to cellular networks in Southern Africa. During the 2001 financial year the total goodwill
on acquisition of R24.7 million (disclosed as part of the Goodwill amortisation Notes 2 and 10) and the total
net asset value of the company was impaired by R102.5 million, as no satellite license was issued by the Independent
Communications Authority of South Africa and the international satellite company Globalstar Limited Partnership,
a United States listed company, was expected to go into Chapter 11 bankruptcy.
During the year ended March 31, 2001, a provision was made to reflect a contractual obligation of R45.5 million to
purchase satellite phones. Since a satellite licence was not issued to Globalstar Southern Africa (Proprietary) Limited,
these phones could not be utilised. The provision was reversed during the year ended March 31, 2002 as the Group
was subsequently released from this contractual obligation, and a recoupment of R15.0 million was made on certain of
the Gateway assets that were impaired in 2001.
F131
VODACOM GROUP (PROPRIETARY) LIMITED
NOTES TO THE CONSOLIDATED FINANCIAL STATEMENTS
for the three years ended March 31, 2002
3.
INTEGRATION COSTS, DISPOSALS OF OPERATIONS AND IMPAIRMENTS (continued)
3.2
Vodacom Service Provider Company (Proprietary) Limited
On July 1, 2000 the businesses of GSM Cellular (Proprietary) Limited and Vodac (Proprietary) Limited were
integrated with the business of Teljoy Cellular Services (Proprietary) Limited. Effective July 1, 2000, Teljoy Cellular
Services (Proprietary) Limited changed its name to Vodacom Service Provider Company (Proprietary) Limited.
The activities of Vodacare (Proprietary) Limited and Vodacom Equipment Company (Proprietary) Limited were also
integrated into Vodacom Service Provider Company (Proprietary) Limited on November 1, 2000.
3.3
Film Fun (Holdings) Proprietary Limited
Film Fun (Holdings) Proprietary Limited, trading as Teljoy was acquired as part of the Teljoy Holdings Limited Group
during January 2000. Non-profitable branches were closed during the 2001 financial year and the billing system,
which was not operational, was written-off.
4.
PROFIT FROM OPERATIONS
The profit from operations (including integration costs, disposals of operations and impairments (Note 3)) is arrived at after
taking the following income/(expenditure) into account:
2000
2001
2002
Rm
Rm
Rm
Net profit/(loss) on disposal of property, plant and equipment . . . . . .
(9.6)
0.4
3.4
Loss on disposal of property, plant and equipment . . . . . . . . . .
(9.8)
(8.2)
(2.6)
Profit on disposal of property, plant and equipment . . . . . . . . . .
0.2
8.6
6.0
Depreciation of property, plant and equipment (Note 9) . . . . . . . . .
(1,025.3)
(1,364.1)
(1,857.3)
Buildings . . . . . . . . . . . . . . . . . . . . . . . . . . . . . . . .
(9.5)
(10.5)
(12.7)
Infrastructure . . . . . . . . . . . . . . . . . . . . . . . . . . . . . .
(790.8)
(1,008.1)
(1,388.5)
Information services . . . . . . . . . . . . . . . . . . . . . . . . . .
(128.3)
(177.9)
(332.1)
Community services . . . . . . . . . . . . . . . . . . . . . . . . . .
(7.2)
(7.4)
(11.1)
Motor vehicles . . . . . . . . . . . . . . . . . . . . . . . . . . . . .
(1.2)
(6.7)
(19.6)
Furniture . . . . . . . . . . . . . . . . . . . . . . . . . . . . . . . .
(2.5)
(4.1)
(16.3)
Office equipment . . . . . . . . . . . . . . . . . . . . . . . . . . . .
(1.7)
(2.3)
(14.3)
Leasehold improvements . . . . . . . . . . . . . . . . . . . . . . . .
(1.6)
(2.9)
(31.0)
Other assets . . . . . . . . . . . . . . . . . . . . . . . . . . . . . . .
(82.5)
(144.2)
(31.7)
Auditors' remuneration . . . . . . . . . . . . . . . . . . . . . . . . . .
(3.6)
(9.4)
(7.3)
Current year audit fees . . . . . . . . . . . . . . . . . . . . . . . . .
(2.4)
(4.5)
(5.3)
Prior year under provision of audit fees . . . . . . . . . . . . . . . .
(0.4)
Expenses . . . . . . . . . . . . . . . . . . . . . . . . . . . . . . . .
(0.1)
(0.1)
(0.1)
Other services . . . . . . . . . . . . . . . . . . . . . . . . . . . . . .
(1.1)
(4.4)
(1.9)
Consultancy services . . . . . . . . . . . . . . . . . . . . . . . . . . .
(35.1)
(35.4)
(84.9)
Administrative fees . . . . . . . . . . . . . . . . . . . . . . . . . . .
(9.3)
(9.4)
(22.5)
Managerial fees . . . . . . . . . . . . . . . . . . . . . . . . . . . . .
(1.4)
(1.5)
(3.5)
Secretarial fees . . . . . . . . . . . . . . . . . . . . . . . . . . . . .
(0.1)
Technical fees . . . . . . . . . . . . . . . . . . . . . . . . . . . . . .
(24.4)
(24.5)
(58.8)
Operating lease rentals . . . . . . . . . . . . . . . . . . . . . . . . . .
(378.8)
(471.5)
(474.2)
GSM transmission and data lines . . . . . . . . . . . . . . . . . . . .
(301.0)
(332.3)
(336.0)
Office accommodation . . . . . . . . . . . . . . . . . . . . . . . . .
(40.7)
(66.8)
(79.7)
Other accommodation . . . . . . . . . . . . . . . . . . . . . . . . .
(32.1)
(54.3)
(49.4)
Office equipment . . . . . . . . . . . . . . . . . . . . . . . . . . . .
(5.0)
(13.1)
(7.6)
Motor vehicles . . . . . . . . . . . . . . . . . . . . . . . . . . . . .
(5.0)
(1.5)
F132
VODACOM GROUP (PROPRIETARY) LIMITED
NOTES TO THE CONSOLIDATED FINANCIAL STATEMENTS
for the three years ended March 31, 2002
4.
PROFIT FROM OPERATIONS (continued)
2000
2001
2002
Rm
Rm
Rm
Payment to other operators . . . . . . . . . . . . . . . . . . . . . . . .
(391.2)
(821.8)
(1,378.1)
Licence fees (Note 35.4) . . . . . . . . . . . . . . . . . . . . . . . . .
(271.2)
(328.8)
(384.4)
License fee GSM . . . . . . . . . . . . . . . . . . . . . . . . . . .
(271.0)
(328.8)
(384.4)
License fee C450 . . . . . . . . . . . . . . . . . . . . . . . . . . .
(0.2)
Foreign exchange losses . . . . . . . . . . . . . . . . . . . . . . . . . .
(0.1)
(11.2)
Directors' remuneration . . . . . . . . . . . . . . . . . . . . . . . . . .
(14.1)
(17.4)
(25.8)
Executive directors fees as directors: salaries . . . . . . . . . . . .
(4.5)
(5.6)
(8.3)
Executive directors fees as directors: bonuses . . . . . . . . . . . .
(8.5)
(11.3)
(16.9)
Non-executive directors fees as directors . . . . . . . . . . . . . .
(1.1)
(0.5)
(0.6)
Directors' remuneration and emoluments paid by: . . . . . . . . . . . .
(14.1)
(17.4)
(25.8)
Vodacom Group (Proprietary) Limited . . . . . . . . . . . . . . . . .
(8.8)
(11.3)
(16.2)
Subsidiaries . . . . . . . . . . . . . . . . . . . . . . . . . . . . . . .
(5.3)
(6.1)
(9.6)
Staff expenses pension and provident fund contributions . . . . . . .
(29.8)
(42.5)
(43.9)
Pension fund contributions . . . . . . . . . . . . . . . . . . . . . . .
(29.8)
(42.5)
(42.8)
Provident fund contributions . . . . . . . . . . . . . . . . . . . . . .
(1.1)
Bad debts written-off . . . . . . . . . . . . . . . . . . . . . . . . . . .
(16.5)
(107.4)
(111.2)
Decrease/(Increase) in provision for bad debts . . . . . . . . . . . . . .
(5.4)
(49.0)
64.9
The headcount of the Group at March 31, 2002 was 4,353
(2001: 4,272, 2000: 4,091).
5.
DISCONTINUED OPERATIONS
5.1
Vodacom World Online (Proprietary) Limited
On June 1, 1999, the Group disposed of the Vodacom Internet Division, which formed part of Vodacom (Proprietary)
Limited for an amount of R265.4 million to Vodacom World Online (Proprietary) Limited, a 50% joint venture of
Vodacom (Proprietary) Limited and World Online (Note 31). The Group realised a capital gain of R123.3 million on
this transaction, consisting of profits of R246.6 million less a deferred gain of R123.3 million reflecting Vodacom's
continued 50% interest in the assets contributed. On March 31, 2000, the Group disposed of 10% of the shareholding
in Vodacom World Online (Proprietary) Limited. A profit of R54.3 million arose, being the proceeds of the disposal of
R51.1 million less the realisation of the shareholder loans of R25.0 million, net liabilities of R3.2 million and deferred
profit on the sale of the Internet Division by Vodacom (Pty) Ltd of R25.0 million.
On November 9, 2001, the Group entered into a sale agreement to dispose of its 40% interest in the joint venture
company of Vodacom World Online (Proprietary) Limited to Tiscali International BV, the other party to the joint
venture. The company carried out the Group's internet service provider operations. The disposal was completed on
November 30, 2001, on which date control of Vodacom World Online (Proprietary) Limited passed to Tiscali
International BV. A profit of R30.1 million arose on the disposal of Vodacom World Online (Proprietary) Limited,
being the proceeds of disposal R31.8 million less the realisation of the shareholder's loan of R134.9 million, net
liabilities of R34.9 million and deferred profit of R98.3 million on the sale of the internet division by Vodacom
(Proprietary) Limited in the 2000 financial year (Note 30.2(b)) now realised. No tax charge or credit arose from the
transaction. The results were deconsolidated from November 30, 2001.
The Group's consolidated capital gain of R129.3 million on these disposals as disclosed in Note 3, arose from the
R123.3 million from the sale of the Internet Division, which was subsequently reduced with subscriber base costs not
capitalised of R48.3 million and the gain of R54.3 million from the disposal of its 10% shareholdings in Vodacom
World Online (Proprietary) Limited.
F133
VODACOM GROUP (PROPRIETARY) LIMITED
NOTES TO THE CONSOLIDATED FINANCIAL STATEMENTS
for the three years ended March 31, 2002
5.
DISCONTINUED OPERATIONS (continued)
5.2
Vodacom Sport & Entertainment (Proprietary) Limited
On September 1, 2001, the Group entered into a sale agreement to dispose of its 51% interest in Vodacom Sport &
Entertainment (Proprietary) Limited to South African Investments Limited ("SAIL"). The company carried out theGroup's sport and entertainment marketing operations. The disposal was completed on February 27, 2002,
on which date control of Vodacom Sport & Entertainment (Proprietary) Limited passed to SAIL.
The results were deconsolidated from February 28, 2002. A profit of R40.0 million arose on the disposal of Vodacom
Sport & Entertainment (Proprietary) Limited, being the proceeds of disposal less the carrying amount of the
subsidiary's net assets (Note 29.1(a)). No tax charge or credit arose from the transaction.
5.3
Film Fun (Holdings) (Proprietary) Limited, Teljoy Botswana (Proprietary) Limited and Africell Cellular
Services (Proprietary) Limited
The 100% shareholding in Film Fun (Holdings) (Proprietary) Limited, Teljoy Botswana (Proprietary) Limited
and Africell Cellular Services (Proprietary) Limited was sold to a management consortium for R9.0 million.
These disposals were effected in order to dispose of non-core operations. A loss of R53.8 million was realised, being
the proceeds of disposal less the carrying amount of the subsidiary's net assets (Note 29.1(b)). The sale agreements
were signed on March 27, 2002. The results were deconsolidated from March 31, 2002. The goodwill associated with
the entities was allocated on the initial acquisition of the Teljoy Group on January 31, 2000.
5.4
Results and cash flows
The results and cash flows of Vodacom Sport & Entertainment (Proprietary) Limited (VSE), Vodacom World Online
(Proprietary) Limited (VWOL), Film Fun (Holdings) (Proprietary) Limited (FFH), which have been included in the
consolidated financial statements, were as follows:
VSE
VWOL
Internet
division
Rm
Rm
Rm
2000
Income statement
Revenue . . . . . . . . . . . . . . . . . . . . . . . . . . . . . .
26.0
37.1
7.0
Expenditure . . . . . . . . . . . . . . . . . . . . . . . . . . . . .
(20.9)
(68.8)
(11.9)
Net investment income . . . . . . . . . . . . . . . . . . . . . . .
1.0
1.0
16.2
Profit/(Loss) before taxation . . . . . . . . . . . . . . . . . . . .
6.1
(30.7)
11.3
Taxation . . . . . . . . . . . . . . . . . . . . . . . . . . . . . .
(2.2)
1.7
Profit/(Loss) after taxation . . . . . . . . . . . . . . . . . . . . .
3.9
(30.7)
13.0
Cash flow statement
Net cash flows from operating activities . . . . . . . . . . . . . .
9.5
(11.1)
11.4
Net cash flows from investing activities . . . . . . . . . . . . . .
(1.2)
(142.1)
192.2
Net cash flows from financing activities . . . . . . . . . . . . . .
157.7
Net increase in cash and cash equivalents . . . . . . . . . . . . .
8.3
4.5
203.6
VSE
VWOL
FFH
Rm
Rm
Rm
2001
Income statement
Revenue . . . . . . . . . . . . . . . . . . . . . . . . . . . . . .
48.9
43.0
215.2
Expenditure . . . . . . . . . . . . . . . . . . . . . . . . . . . . .
(32.3)
(55.1)
(218.1)
Profit/(Loss) before taxation . . . . . . . . . . . . . . . . . . . .
16.6
(12.1)
(2.9)
Taxation . . . . . . . . . . . . . . . . . . . . . . . . . . . . . .
(6.0)
4.5
Profit/(Loss) after taxation . . . . . . . . . . . . . . . . . . . . .
10.6
(12.1)
1.6
Cash flow statement
Net cash flows from operating activities . . . . . . . . . . . . . .
(5.4)
(9.1)
29.8
Net cash flows from investing activities . . . . . . . . . . . . . .
(0.8)
(5.8)
(17.5)
Net cash flows from financing activities . . . . . . . . . . . . . .
4.0
48.4
Net (decrease)/increase in cash and cash equivalents . . . . . . .
(6.2)
(10.9)
60.7
F134
VODACOM GROUP (PROPRIETARY) LIMITED
NOTES TO THE CONSOLIDATED FINANCIAL STATEMENTS
for the three years ended March 31, 2002
5.
DISCONTINUED OPERATIONS (continued)
VSE
VWOL
FFH
Rm
Rm
Rm
5.4
Results and cash flows (continued)
2002
Income statement
Revenue . . . . . . . . . . . . . . . . . . . . . . . . . . . . . .
52.8
36.1
160.7
Expenditure . . . . . . . . . . . . . . . . . . . . . . . . . . . . .
(38.0)
(56.0)
(148.0)
Profit/(Loss) before taxation . . . . . . . . . . . . . . . . . . . .
14.8
(19.9)
12.7
Taxation . . . . . . . . . . . . . . . . . . . . . . . . . . . . . .
(4.3)
(0.1)
Profit/(Loss) after taxation . . . . . . . . . . . . . . . . . . . . .
10.5
(19.9)
12.6
Cash flow statement
Net cash flows from operating activities . . . . . . . . . . . . . .
(2.8)
1.4
54.2
Net cash flows from investing activities . . . . . . . . . . . . . .
(2.6)
(0.3)
Net cash flows from financing activities . . . . . . . . . . . . . .
4.8
(129.4)
Net (decrease)/increase in cash and cash equivalents . . . . . . .
(5.4)
6.2
(75.5)
The assets and liabilities related to the entities discontinued are
detailed in Notes 29 and 30.
2000
2001
2002
Rm
Rm
Rm
6.
INTEREST AND DIVIDENDS RECEIVED
Interest received banks and loans . . . . . . . . . . . . . . . . . . . .
31.3
25.4
27.7
Dividends received unlisted investments . . . . . . . . . . . . . . . .
0.7
4.3
32.0
25.4
32.0
7.
NET FINANCE COSTS
Shareholder loans . . . . . . . . . . . . . . . . . . . . . . . . . . . . .
(202.1)
(157.9)
(144.2)
Finance leases . . . . . . . . . . . . . . . . . . . . . . . . . . . . . . .
(61.2)
(60.8)
(98.9)
Funding loans . . . . . . . . . . . . . . . . . . . . . . . . . . . . . . .
(69.8)
(65.7)
(87.2)
Bank and other interest . . . . . . . . . . . . . . . . . . . . . . . . . .
(99.4)
(162.9)
(86.1)
Gain/(Loss) on forward exchange contracts and liability
revaluations (Note 7.1) . . . . . . . . . . . . . . . . . . . . . . . . . .
(133.7)
(56.1)
347.4
Interest rate swaps . . . . . . . . . . . . . . . . . . . . . . . . . . . . .
(1.0)
(1.1)
4.3
Other . . . . . . . . . . . . . . . . . . . . . . . . . . . . . . . . . . . .
4.9
(567.2)
(504.5)
(59.8)
7.1
Gain/(Loss) on forward exchange contracts and liability
revaluations
Gain on foreign liability revaluation . . . . . . . . . . . . . . . .
18.3
Loss on foreign liability revaluation . . . . . . . . . . . . . . . .
(247.8)
Gain on foreign exchange contract revaluation . . . . . . . . . .
778.4
Loss on foreign exchange contract revaluation . . . . . . . . . .
(199.0)
Realised foreign exchange gains . . . . . . . . . . . . . . . . . .
2.3
2.5
Realised foreign exchange losses . . . . . . . . . . . . . . . . .
(5.0)
Foreign exchange premiums . . . . . . . . . . . . . . . . . . . .
(133.7)
(58.4)
_
(133.7)
(56.1)
347.4
F135
VODACOM GROUP (PROPRIETARY) LIMITED
NOTES TO THE CONSOLIDATED FINANCIAL STATEMENTS
for the three years ended March 31, 2002
8.
TAXATION
2000
2001
2002
Rm
Rm
Rm
South African normal taxation . . . . . . . . . . . . . . . . . . . . . .
(556.2)
(748.3)
(1,001.7)
Current year . . . . . . . . . . . . . . . . . . . . . . . . . . . . . . .
(562.9)
(763.8)
(1,022.9)
Prior year over provision . . . . . . . . . . . . . . . . . . . . . . . .
6.7
15.5
21.2
Deferred taxation . . . . . . . . . . . . . . . . . . . . . . . . . . . . .
45.4
45.6
(82.7)
Current year . . . . . . . . . . . . . . . . . . . . . . . . . . . . . . .
28.5
50.3
(79.7)
Prior year under/(over) provision . . . . . . . . . . . . . . . . . . . .
16.1
(4.7)
(3.0)
Rate change . . . . . . . . . . . . . . . . . . . . . . . . . . . . . . .
0.8
Secondary Taxation on Companies . . . . . . . . . . . . . . . . . . . .
(1.0)
(60.5)
(74.5)
Current year . . . . . . . . . . . . . . . . . . . . . . . . . . . . . . .
(1.0)
(60.5)
(75.5)
Prior year over provision . . . . . . . . . . . . . . . . . . . . . . . .
1.0
Foreign taxation . . . . . . . . . . . . . . . . . . . . . . . . . . . . . .
(1.8)
(2.5)
(2.5)
Current year . . . . . . . . . . . . . . . . . . . . . . . . . . . . . . .
(1.8)
(2.4)
(3.7)
Prior year over/(under) provision . . . . . . . . . . . . . . . . . . . .
(0.1)
1.2
Foreign deferred taxation current year . . . . . . . . . . . . . . . . .
(29.3)
(513.6)
(765.7)
(1,190.7)
2000
2000
2001
2001
2002
2002
Rm
%
Rm
%
Rm
%
Reconciliation of rate of taxation
Normal taxation on profit before taxation . . . . . . .
548.4
30.0
622.3
30.0
1,075.2
30.0
Adjusted for:
Exempt income . . . . . . . . . . . . . . . . . . . .
(1.9)
(0.1)
(0.1)
(1.3)
Disallowable expenditure . . . . . . . . . . . . . . .
13.5
0.7
63.1
3.0
58.1
1.7
Prior year over provision . . . . . . . . . . . . . . .
(24.7)
(1.4)
(3.9)
(0.2)
(19.4)
(0.5)
Unutilised assessed loss . . . . . . . . . . . . . . . .
42.8
2.1
21.9
0.6
Utilisation of assessed loss . . . . . . . . . . . . . .
7.6
(0.4)
(2.2)
(0.1)
(0.6)
(0.1)
Foreign taxation rate differences . . . . . . . . . . .
14.1
0.4
Secondary Taxation on Companies . . . . . . . . . .
1.0
0.1
60.5
2.9
74.5
2.1
Realisation of deferred tax provided on customer base
(4.9)
(0.3)
(20.8)
(1.0)
(20.8)
(0.6)
Temporary differences in subsidiaries not provided for
(25.4)
(1.3)
4.0
0.2
(11.0)
(0.3)
Globalstar Southern Africa (Proprietary) Limited .
(4.1)
(0.1)
Vodacom Tanzania Limited . . . . . . . . . . . . .
4.0
0.2
Other . . . . . . . . . . . . . . . . . . . . . . . .
(25.4)
(1.3)
(6.9)
(0.2)
513.6
28.1
765.7
36.9
1,190.7
33.3
F136
VODACOM GROUP (PROPRIETARY) LIMITED
NOTES TO THE CONSOLIDATED FINANCIAL STATEMENTS
for the three years ended March 31, 2002
9.
PROPERTY, PLANT AND EQUIPMENT
Cost
Accumulated
Net book
depreciation
value
2000
Rm
Rm
Rm
Land and buildings . . . . . . . . . . . . . . . . . . . . . . . . . . . .
384.7
(15.7)
369.0
Infrastructure . . . . . . . . . . . . . . . . . . . . . . . . . . . . . . .
6,868.3
(1,997.6)
4,870.7
Information services . . . . . . . . . . . . . . . . . . . . . . . . . . . .
603.8
(293.6)
310.2
Community services . . . . . . . . . . . . . . . . . . . . . . . . . . . .
61.6
(41.2)
20.4
Motor vehicles . . . . . . . . . . . . . . . . . . . . . . . . . . . . . . .
6.7
(2.3)
4.4
Furniture . . . . . . . . . . . . . . . . . . . . . . . . . . . . . . . . . .
20.8
(11.1)
9.7
Office equipment . . . . . . . . . . . . . . . . . . . . . . . . . . . . .
13.9
(6.3)
7.6
Leasehold improvements . . . . . . . . . . . . . . . . . . . . . . . . .
6.3
(1.8)
4.5
Other assets . . . . . . . . . . . . . . . . . . . . . . . . . . . . . . . .
458.9
(201.3)
257.6
8,425.0
(2,570.9)
5,854.1
Cost
Accumulated
Net book
depreciation
value
2001
Rm
Rm
Rm
Land and buildings . . . . . . . . . . . . . . . . . . . . . . . . . . . .
456.6
(21.4)
435.2
Infrastructure . . . . . . . . . . . . . . . . . . . . . . . . . . . . . . .
9,428.6
(3,005.4)
6,423.2
Information services . . . . . . . . . . . . . . . . . . . . . . . . . . . .
932.1
(471.4)
460.7
Community services . . . . . . . . . . . . . . . . . . . . . . . . . . . .
80.1
(48.6)
31.5
Motor vehicles . . . . . . . . . . . . . . . . . . . . . . . . . . . . . . .
15.0
(6.2)
8.8
Furniture . . . . . . . . . . . . . . . . . . . . . . . . . . . . . . . . . .
46.5
(31.6)
14.9
Office equipment . . . . . . . . . . . . . . . . . . . . . . . . . . . . .
21.0
(13.1)
7.9
Leasehold improvements . . . . . . . . . . . . . . . . . . . . . . . . .
11.2
(6.3)
4.9
Other assets . . . . . . . . . . . . . . . . . . . . . . . . . . . . . . . .
757.7
(448.6)
309.1
11,748.8
(4,052.6)
7,696.2
Cost
Accumulated
Net book
depreciation
value
2002
Rm
Rm
Rm
Land and buildings . . . . . . . . . . . . . . . . . . . . . . . . . . . .
795.7
(34.0)
761.7
Infrastructure . . . . . . . . . . . . . . . . . . . . . . . . . . . . . . .
12,559.1
(4,393.9)
8,165.2
Information services . . . . . . . . . . . . . . . . . . . . . . . . . . . .
1,606.3
(936.6)
669.7
Community services . . . . . . . . . . . . . . . . . . . . . . . . . . . .
85.2
(55.6)
29.6
Motor vehicles . . . . . . . . . . . . . . . . . . . . . . . . . . . . . . .
67.0
(25.8)
41.2
Furniture . . . . . . . . . . . . . . . . . . . . . . . . . . . . . . . . . .
96.7
(48.6)
48.1
Office equipment . . . . . . . . . . . . . . . . . . . . . . . . . . . . .
69.0
(42.6)
26.4
Leasehold improvements . . . . . . . . . . . . . . . . . . . . . . . . .
196.6
(76.1)
120.5
Other assets . . . . . . . . . . . . . . . . . . . . . . . . . . . . . . . .
56.2
(22.0)
34.2
15,531.8
(5,635.2)
9,896.6
F137
VODACOM GROUP (PROPRIETARY) LIMITED
NOTES TO THE CONSOLIDATED FINANCIAL STATEMENTS
for the three years ended March 31, 2002
9.
PROPERTY, PLANT AND EQUIPMENT (continued)
2000
Land and
Infra-
Information
Community
Motor
Furniture
Office
Leasehold
Other
Total
buildings
structure
services
services
vehicles
equipment
improvements
assets
Rm
Rm
Rm
Rm
Rm
Rm
Rm
Rm
Rm
Rm
Opening balance .
390.
1
4,024.4
234.
0
13.
3
3.
4
10.
5
5.
6
1.
3
218.4 4,901.0
Additions . . . . .
6.
3
1,637.1
217.
8
14.
3
2.
2
2.
0
3.
1
2.
5
136.7 2,022.0
Disposals . . . . .
(18.0)
(0.1)
(12.5)
(40.6)
(71.2)
Depreciation . . .
(9.5)
(790.8)
(128.3)
(7.2)
(1.2)
(2.5)
(1.7)
(1.6)
(82.5) (1,025.3)
Business
combinations . . .
0.
1
0.
1
(0.8)
(0.3)
0.
6
2.
3
25.
6
27.6
Closing balance . .
369.
0
4,870.7
310.
2
20.
4
4.
4
9.
7
7.
6
4.
5
257.6 5,854.1
2001
Land and
Infra-
Information
Community
Motor
Furniture
Office
Leasehold
Other
Total
buildings
structure
services
services
vehicles
equipment
improvements
assets
Rm
Rm
Rm
Rm
Rm
Rm
Rm
Rm
Rm
Rm
Opening balance .
369.
0
4,870.7
310.
2
20.
4
4.
4
9.
7
7.
6
4.
5
257.6 5,854.1
Additions . . . . .
109.
7
2,562.8
331.
6
18.
5
11.
2
9.
3
9.
8
5.
0
126.3 3,184.2
Disposals . . . . .
(33.0)
(3.2)
(0.1)
(11.9)
(1.7)
(55.6)
(105.5)
Depreciation . . .
(10.5)
(1,008.1)
(177.9)
(7.4)
(6.7)
(4.1)
(2.3)
(2.9)
(144.2) (1,364.1)
Impairment and
business
combinations . . .
(2.2)
4.
7
125.
0
127.5
Closing balance . .
435.
2
6,423.2
460.
7
31.
5
8.
8
14.
9
7.
9
4.
9
309.1 7,696.2
2002
Land and
Infra-
Information
Community
Motor
Furniture
Office
Leasehold
Other
Total
buildings
structure
services
services
vehicles
equipment
improvements
assets
Rm
Rm
Rm
Rm
Rm
Rm
Rm
Rm
Rm
Rm
Opening balance
as previously
reported . . . . . .
435.
2
6,423.2
460.
7
31.
5
8.
8
14.
9
7.
9
4.
9
309.1 7,696.2
Asset category
transfers . . . . . .
95.
6
(0.1)
(0.1)
(95.4)
Restated opening
balance . . . . . .
435.
2
6,423.2
556.
3
31.
5
8.
8
14.
9
7.
8
4.
8
213.7 7,696.2
Additions . . . . .
339.
6
3,050.3
476.
4
9.
5
20.
5
39.
2
15.
9
94.
2
39.7 4,085.3
Disposals . . . . .
(0.5)
(48.4)
(17.5)
(0.3)
(0.1)
(4.1)
(0.1)
(0.1)
(17.8)
(88.9)
Foreign currency
translation . . . . .
0.
1
128.
9
0.
7
1.
5
0.
5
0.
1
1.
0
132.8
Depreciation . . .
(12.7)
(1,388.5)
(332.1)
(11.1)
(19.6)
(16.3)
(14.3)
(31.0)
(31.7) (1,857.3)
Other . . . . . . .
(0.1)
(0.1)
1.
3
1.1
Business
combinations . . .
(12.2)
(0.2)
(4.4)
(1.0)
(54.8)
(72.6)
Asset category
transfers . . . . . .
(0.3)
(1.8)
30.
3
18.
4
18.
0
51.
6
(116.2)
Closing balance . .
761.
7
8,165.2
669.
7
29.
6
41.
2
48.
1
26.
4
120.
5
34.2 9,896.6
F138
VODACOM GROUP (PROPRIETARY) LIMITED
NOTES TO THE CONSOLIDATED FINANCIAL STATEMENTS
for the three years ended March 31, 2002
9.
PROPERTY, PLANT AND EQUIPMENT (continued)
2000
2001
2002
Net book
Net book
Net book
value
value
value
Rm
Rm
Rm
Freehold land and buildings
Portions 859, 847, 827, the remaining extent of Portion 45 (a portion of
Portion 9), and Portion 828 (a portion of Portion 9) of farm
Randjesfontein No. 405, Registration division J.R., Province of Gauteng.
32.4
43 Kwale Road, Dar es Salaam, Tanzania . . . . . . . . . . . . . . . . .
6.8
Stand 172 Sandton . . . . . . . . . . . . . . . . . . . . . . . . . . . . .
0.5
0.5
Sectional Plan No. 33/1981, High Level Road, Sea Point, Cape Town . .
0.1
Stand 200 Chelmsfordville . . . . . . . . . . . . . . . . . . . . . . . . .
0.1
0.1
0.1
0.7
0.6
39.3
Leasehold land and buildings
Portion 827 and 828 of farm Randjesfontein No. 405 . . . . . . . . . . .
279.4
Portion 769 of farm Randjesfontein No. 405 . . . . . . . . . . . . . . . .
154.8
155.9
164.8
Stand 34083 Bellville, City of Tygerberg . . . . . . . . . . . . . . . . . .
112.6
111.1
109.5
Erven 5259 and 5260 Montague Gardens . . . . . . . . . . . . . . . . .
99.6
98.1
Holding 350 Erand Agricultural Holdings Ext. 1 . . . . . . . . . . . . . .
70.6
66.4
62.2
Holding 188 Erand Agricultural Holdings Ext. 1 . . . . . . . . . . . . . .
7.8
Stand 207 Erand Agricultural Holdings Ext. 28 . . . . . . . . . . . . . .
6.8
Portion 45 of Randjesfontein No. 405, and Holding 202 Erand
Agricultural Holdings Ext. 1 . . . . . . . . . . . . . . . . . . . . . . . .
7.8
Holding 359 Erand Agricultural Holdings Ext. 1 . . . . . . . . . . . . . .
9.9
1.6
1.6
Erand 189 Agricultural Holdings Ext. . . . . . . . . . . . . . . . . . . .
4.8
. . . . . . . . . . . . . . . . . . . . . . . . . . . . . . . . . . . . . . . .
368.3
434.6
722.4
Total freehold and leasehold land and buildings
369.0
435.2
761.7
Debt is collateralised over leasehold land and buildings and the fair value of the lease liability is R790.6 million
(2001: R496.6 million, 2000: R417.9 million).
10.
INTANGIBLE ASSETS
Cost
Accumulated
Net book
amortisation
value
Rm
Rm
Rm
2000
Goodwill . . . . . . . . . . . . . . . . . . . . . . . . . . . . . . . . . .
462.0
(88.2)
373.8
Licences . . . . . . . . . . . . . . . . . . . . . . . . . . . . . . . . . . .
104.1
(40.4)
63.7
Trademarks . . . . . . . . . . . . . . . . . . . . . . . . . . . . . . . . .
51.9
(7.4)
44.5
Customer bases . . . . . . . . . . . . . . . . . . . . . . . . . . . . . . .
486.8
(29.8)
457.0
1,104.8
(165.8)
939.0
Cost
Accumulated
Net book
amortisation
value
Rm
Rm
Rm
2001
Goodwill . . . . . . . . . . . . . . . . . . . . . . . . . . . . . . . . . .
597.4
(238.3)
359.1
Licences . . . . . . . . . . . . . . . . . . . . . . . . . . . . . . . . . . .
108.8
(47.6)
61.2
Trademarks . . . . . . . . . . . . . . . . . . . . . . . . . . . . . . . . .
67.2
(24.2)
43.0
Customer bases . . . . . . . . . . . . . . . . . . . . . . . . . . . . . . .
486.9
(127.3)
359.6
1,260.3
(437.4)
822.9
F139
VODACOM GROUP (PROPRIETARY) LIMITED
NOTES TO THE CONSOLIDATED FINANCIAL STATEMENTS
for the three years ended March 31, 2002
10.
INTANGIBLE ASSETS (continued)
Cost
Accumulated
Net book
amortisation
value
Rm
Rm
Rm
2002
Goodwill . . . . . . . . . . . . . . . . . . . . . . . . . . . . . . . . . .
669.4
(326.5)
342.9
Licences . . . . . . . . . . . . . . . . . . . . . . . . . . . . . . . . . . .
221.3
(56.9)
164.4
Trademarks . . . . . . . . . . . . . . . . . . . . . . . . . . . . . . . . .
51.5
(24.8)
26.7
Customer bases . . . . . . . . . . . . . . . . . . . . . . . . . . . . . . .
486.9
(224.6)
262.3
1,429.1
(632.8)
796.3
Reconciliation
Opening net
Additions
Foreign
Business Amortisation
Closing net
book value
currency combination
book value
translation
2000
Rm
Rm
Rm
Rm
Rm
Rm
Goodwill . . . . . . . . . .
61.4
0.5
347.7
(35.8)
373.8
Licences . . . . . . . . . .
67.6
2.5
0.3
(6.7)
63.7
Trademarks . . . . . . . .
18.0
32.8
(6.3)
44.5
Customer bases . . . . . .
39.8
7.5
434.5
(24.8)
457.0
186.8
10.5
815.3
(73.6)
939.0
Reconciliation
Opening net
Additions
Foreign
Business Amortisation
Closing net
book value
currency combination
book value
translation
2001
Rm
Rm
Rm
Rm
Rm
Rm
Goodwill . . . . . . . . . .
373.8
135.4
(150.1)
359.1
Licences . . . . . . . . . .
63.7
1.5
3.2
(7.2)
61.2
Trademarks . . . . . . . .
44.5
15.3
(16.8)
43.0
Customer bases . . . . . .
457.0
(97.4)
359.6
939.0
1.5
153.9
(271.5)
822.9
Reconciliation
Opening net
Additions
Foreign
Business Amortisation
Closing net
book value
currency combination
book value
translation
2002
Rm
Rm
Rm
Rm
Rm
Rm
Goodwill . . . . . . . . . .
359.1
98.5
(15.8)
(98.9)
342.9
Licences . . . . . . . . . .
61.2
95.2
17.5
(0.1)
(9.4)
164.4
Trademarks . . . . . . . .
43.0
(9.2)
(7.1)
26.7
Customer bases . . . . . .
359.6
(97.3)
262.3
822.9
193.7
17.5
(25.1)
(212.7)
796.3
F140
VODACOM GROUP (PROPRIETARY) LIMITED
NOTES TO THE CONSOLIDATED FINANCIAL STATEMENTS
for the three years ended March 31, 2002
2000
2001
2002
Rm
Rm
Rm
11.
INVESTMENTS
Held for trading
Money market investments (Note 11.1) . . . . . . . . . . . . . . . . . .
65.0
Less: Short-term portion of investments (Note 11.2) . . . . . . . . . . . .
(58.6)
Available for sale
Other . . . . . . . . . . . . . . . . . . . . . . . . . . . . . . . . . . . .
0.9
0.9
Originating loans
South African Investments Limited . . . . . . . . . . . . . . . . . . . . .
11.8
Long-term portion of the note receivable issued as part of the
consideration for the disposal of Vodacom Sport & Entertainment
(Proprietary) Limited. Interest is charged on this amount receivable at
the prime lending rate minus one percent per annum from the
transaction date.
Other . . . . . . . . . . . . . . . . . . . . . . . . . . . . . . . . . . . .
5.9
1.3
0.5
Investment in joint venture loan Vodacom World Online
(Proprietary) Limited . . . . . . . . . . . . . . . . . . . . . . . . . . . .
4.0
Loan to Planatel Communication Limited and Caspian
Construction Company Limited . . . . . . . . . . . . . . . . . . . . . .
4.9
11.2
4.0
15.7
13.4
22.7
11.1
Money market investments
Maturity
Interest
Market
period
rate
value
2002
Rm
Details of the maturity periods and interest rates of the money
market investments at year-end are as follows:
0 - 6 months
9.1% - 9.6%
36.2
6 - 12 months
10.0% - 11.1%
18.4
Over 12 months
9.7% - 12.0%
10.4
65.0
2000
2001
2002
Rm
Rm
Rm
11.2
Short-term portion of investments
Money market investment (Note 11.1) . . . . . . . . . . . . . . .
54.6
Short-term loans. The amounts were repaid in full in May 2002 . .
4.0
58.6
12.
ACQUIRED BUSINESS HELD FOR SALE
Film Fun (Holdings) (Proprietary) Limited:
Shares at cost less provisions and amounts written-off . . . . . . . . . . .
51.6
Loans granted . . . . . . . . . . . . . . . . . . . . . . . . . . . . . . . .
70.0
121.6
The investments relate to the acquisition of Film Fun (Holdings) (Proprietary) Limited, trading as Teljoy, during January 2000,
and is in connection with the television and rental segments of the Teljoy Holdings Group. Management's original intention
was to sell the investment in the near future (Note 29.2).
These loans were interest free and had no fixed repayment terms.
F141
VODACOM GROUP (PROPRIETARY) LIMITED
NOTES TO THE CONSOLIDATED FINANCIAL STATEMENTS
for the three years ended March 31, 2002
2000
2001
2002
Rm
Rm
Rm
13.
DEFERRED TAXATION
Deferred taxation asset . . . . . . . . . . . . . . . . . . . . . . . . . . .
145.8
339.1
497.7
Deferred taxation liability . . . . . . . . . . . . . . . . . . . . . . . . . .
(455.6)
(607.5)
(926.2)
(309.8)
(268.4)
(428.5)
13.1
Components
Capital allowances . . . . . . . . . . . . . . . . . . . . . . . . . .
(315.5)
(497.7)
(822.9)
Foreign equity revaluation reserve . . . . . . . . . . . . . . . . . .
(17.9)
Assessed losses . . . . . . . . . . . . . . . . . . . . . . . . . . . .
107.2
295.9
Provisions . . . . . . . . . . . . . . . . . . . . . . . . . . . . . .
145.8
227.6
160.8
Prepayments and other allowances . . . . . . . . . . . . . . . . .
(5.1)
4.3
41.0
Acquisition of customer base . . . . . . . . . . . . . . . . . . . .
(135.0)
(109.8)
(77.5)
Other . . . . . . . . . . . . . . . . . . . . . . . . . . . . . . . . .
(7.9)
(309.8)
(268.4)
(428.5)
13.2
Reconciliation
Balance at beginning of year . . . . . . . . . . . . . . . . . . . . .
(219.4)
(309.8)
(268.4)
Income statement (expense)/income . . . . . . . . . . . . . . . . .
44.6
45.6
(112.0)
Foreign equity revaluation reserve . . . . . . . . . . . . . . . . . .
(19.9)
Movement due to IAS 39 adjustment . . . . . . . . . . . . . . . .
(36.5)
Business combinations
Acquisition of customer base . . . . . . . . . . . . . . . . . . .
(130.3)
(4.5)
2.7
Foreign exchange differences on consolidation
of foreign subsidiaries . . . . . . . . . . . . . . . . . . . . . . .
7.2
Disposal of subsidiaries . . . . . . . . . . . . . . . . . . . . . .
(5.5)
0.3
(1.6)
Rate change . . . . . . . . . . . . . . . . . . . . . . . . . . . . .
0.8
Balance at end of year
(309.8)
(268.4)
(428.5)
Utilisation of assessed losses
Opening assessed loss . . . . . . . . . . . . . . . . . . . . . . . .
25.3
439.3
Current year assessed loss created/(utilised) . . . . . . . . . . . .
(25.3)
439.3
682.4
Closing assessed loss . . . . . . . . . . . . . . . . . . . . . . . .
439.3
1,121.7
Disposal of subsidiaries and joint venture . . . . . . . . . . . . . .
(53.3)
Utilised to reduce deferred taxation . . . . . . . . . . . . . . . . .
(357.4)
(986.3)
Assessed losses available to reduce deferred taxation
81.9
82.1
There are unused tax losses to the value of R82.1 million (2001: R81.9 million, 2000: nil) available to reduce the net
deferred taxation liability. The effect of this would be a reduction in the net deferred taxation liability to
R403.9 million (2001: R243.8 million, R2000: R309.8 million). A deferred tax asset was not recognised for the
abovementioned unused tax losses as uncertainty existed at year-end on whether future taxable profits would be
available to utilise the asset against. The recognition of the future taxable profits relating to the unrecognised deferred
tax asset will be re-assessed in the next financial period.
F142
VODACOM GROUP (PROPRIETARY) LIMITED
NOTES TO THE CONSOLIDATED FINANCIAL STATEMENTS
for the three years ended March 31, 2002
2000
2001
2002
Rm
Rm
Rm
14.
INVENTORY
Finished goods . . . . . . . . . . . . . . . . . . . . . . . . . . . . . . .
218.3
392.1
305.3
Other inventory . . . . . . . . . . . . . . . . . . . . . . . . . . . . . . .
3.8
6.3
0.7
222.1
398.4
306.0
15.
ACCOUNTS RECEIVABLE
Trade debtors (net of allowance for doubtful accounts of
R77.0 million (2001: R141.9 million, 2000: R92.9 million). . . . . . . .
1,502.7
2,041.5
2,461.4
Prepayments . . . . . . . . . . . . . . . . . . . . . . . . . . . . . . . . .
114.0
174.0
262.5
Value-added taxation . . . . . . . . . . . . . . . . . . . . . . . . . . . .
57.9
31.3
Advances made to employees for education and travel . . . . . . . . . .
10.2
South African Investments Limited short-term portion of the note
receivable issued as consideration for the disposal of Vodacom Sport and
Entertainment (Proprietary) Limited. Interest is charged on this amount
receivable at the prime lending rate minus 1% per annum from the
transaction date. . . . . . . . . . . . . . . . . . . . . . . . . . . . . . . .
11.8
Disposal of Film Fun (Holdings) (Proprietary) Limited . . . . . . . . . .
9.0
Other . . . . . . . . . . . . . . . . . . . . . . . . . . . . . . . . . . . .
59.7
1,616.7
2,273.4
2,845.9
2000
2001
2002
R
R
R
16.
ORDINARY SHARE CAPITAL
Authorised
100,000 ordinary shares of 1 cent each . . . . . . . . . . . . . . . . .
1,000
1,000
1,000
Issued
10,000 ordinary shares of 1 cent each . . . . . . . . . . . . . . . . . .
100
100
100
Unissued share capital is not under the control of the Board of Directors.
F143
VODACOM GROUP (PROPRIETARY) LIMITED
NOTES TO THE CONSOLIDATED FINANCIAL STATEMENTS
for the three years ended March 31, 2002
2000
2001
2002
Rm
Rm
Rm
17.
NON-DISTRIBUTABLE RESERVES
Foreign currency translation reserve . . . . . . . . . . . . . . . . . . . .
0.
6
( 2.3)
117.5
Deferred taxation on foreign currency translation reserve . . . . . . . . .
(19.9)
Contingency reserve . . . . . . . . . . . . . . . . . . . . . . . . . . . . .
8.5
0.
6
( 2.3)
106.1
Reconciliation
Balance at the beginning of the year . . . . . . . . . . . . . . . . . . . .
0.
6
(2.3)
Foreign currency translation reserve . . . . . . . . . . . . . . . . . . . .
0.
6
( 2.9)
99.9
Foreign currency translation . . . . . . . . . . . . . . . . . . . . . . .
0.
6
( 2.9)
119.8
Deferred taxation . . . . . . . . . . . . . . . . . . . . . . . . . . . . .
(19.9)
Other non-distributable reserves:
Transferred from distributable reserves contingency reserve . . . . . . .
8.5
Balance at the end of the year . . . . . . . . . . . . . . . . . . . . . . .
0.
6
( 2.3)
106.1
Deferred taxation on the foreign currency translation reserve relates only
to the translation of equity loans to subsidiaries.
18.
MINORITY INTEREST
Equity
(2.2)
(11.4)
10.6
Debit balances reflected in 2001 and 2000 result from losses incurred by certain subsidiaries who have a binding obligation
to fund their percentage of the losses.
19.
INTEREST BEARING DEBT
2001
2001
2001
2002
2002
2002
Current
Long-term
Total
Current
Long-term
Total
portion
portion
portion
portion
Rm
Rm
Rm
Rm
Rm
Rm
Finance leases . . . . . . .
0.
5
496.
1
496.
6
10.
4
780.
2
790.6
Funding loans . . . . . . .
400.
4000.
0
440 .
0
440.0
Other short-term loans . .
565.
5
565.5
0.
5
896.
1
896.
6
1,015.9
780.
2
1,796.1
2000
2000
2000
Current
Long-term
Total
portion
portion
Rm
Rm
Rm
Finance leases . . . . . . . . . . . . . . . . . . . . . . . . . . . . . . . .
0.
7
417.
2
417.9
Funding loans . . . . . . . . . . . . . . . . . . . . . . . . . . . . . . . .
820.
0
400.
0
1,220.0
Other short-term loans . . . . . . . . . . . . . . . . . . . . . . . . . . .
23.
7
23.7
844.
4
817.
2
1,661.6
F144
VODACOM GROUP (PROPRIETARY) LIMITED
NOTES TO THE CONSOLIDATED FINANCIAL STATEMENTS
for the three years ended March 31, 2002
19.
INTEREST BEARING DEBT (continued)
2000
2001
2002
Rm
Rm
Rm
19.
1
Finance leases
Vodacom (Proprietary) Limited . . . . . . . . . . . . . . . . . . .
416.
6
495.
7
502.4
The finance leases are collateralised by various land and buildings
with a book value of R443.0 million (2001: R444.9 million, 2000:
R363.5 million), bear interest at effective interest rates of between
13.85% and 14.69% and are repayable between 5 and 13 years.
Vodacom Service Provider Company (Proprietary) Limited . . . .
288.2
The finance leases are collateralised by various land and buildings
with a book value of R279.4 million, and bear interest at a variable
nominal interest rate of 13.76% compounded monthly. Payments are
made every six months in arrear and commenced on March 1, 2002.
The finance lease expires on September 1, 2011.
Vodacare (Proprietary) Limited . . . . . . . . . . . . . . . . . . .
0.
4
The finances leases have been paid up in conjunction with the merger
of the company into Vodacom Service Provider Company
(Proprietary) Limited.
Teljoy Holdings Limited . . . . . . . . . . . . . . . . . . . . . . .
0.
9
0.
9
The finance lease bears interest at an effective interest rate of 14.5%
and is repayable by March 2004.
Less: Current portion of finance leases:
Vodacom (Proprietary) Limited . . . . . . . . . . . . . . . .
(7.1)
Vodacom Service Provider Company (Proprietary) Limited .
(3.3)
Vodacare (Proprietary) Limited . . . . . . . . . . . . . . . .
(0.4)
Teljoy Holdings Limited . . . . . . . . . . . . . . . . . . . .
(0.3)
(0.5)
(0.7)
(0.5)
(10.4)
Long-term portion of finance leases . . . . . . . . . . . . . . . . .
417.
2
496.00
1
780.2
The fair value of the Group's finance lease liability is R790.6 million
(2001: R496.6 million, 2000: R417.9 million).
19.
2
Funding loans
Commerzbank AG . . . . . . . . . . . . . . . . . . . . . . . . . .
350.00
00
200.
0
200.0
The R200 million loan is uncollateralised, bears interest at a fixed
rate of 13.7% NACQ (Nominal Amount Compounded Quarterly)
and is repayable on March 17, 2003. The R150 million loan
was uncollateralised, bore interest at a fixed rate of 14.9%
NACM (Nominal Amount Compounded Monthly) and was repaid
on May 21, 2000.
Crdit Agricole Indosuez . . . . . . . . . . . . . . . . . . . . . .
200.00
0
200.
0
200.0
The loan is uncollateralised, bears interest at a fixed rate of 14%
NACQ and is repayable on March 17, 2003.
RMB Corporate Finance (Proprietary) Limited . . . . . . . . . . .
670.
0
Second instalment paid by Vodacom Group (Proprietary) Limited to
RMB Corporate Finance (Proprietary) Limited on April 17, 2002 for
the purchase of shares in Teljoy Holdings Limited.
F145
VODACOM GROUP (PROPRIETARY) LIMITED
NOTES TO THE CONSOLIDATED FINANCIAL STATEMENTS
for the three years ended March 31, 2002
19.
INTEREST BEARING DEBT (continued)
2000
2001
Rm
Rm
Rm
19.
2
Funding loans (continued)
Vodacom Tanzania Limited . . . . . . . . . . . . . . . . . . . . .
40.0
The shareholders' loans from Planetel Communications Limited and
Caspian Construction Company Limited are uncollateralised, bear
interest at LIBOR plus 1% and are repayable when at least 60% of
the shareholders with voting powers agree on repayment.
Less: Current portion of funding loans:
Commerzbank AG . . . . . . . . . . . . . . . . . . . . . . .
(150.0)
(200.0)
Crdit Agricole Indosuez . . . . . . . . . . . . . . . . . . .
(200.0)
RMB Corporate Finance (Proprietary) Limited . . . . . . . .
(670.0)
Vodacom Tanzania Limited . . . . . . . . . . . . . . . . . .
(40.0)
(820.0)
(440.0)
Long-term portion of funding loans
400.
0
400.
0
The fair value of the Group's funding loan liability is
R444.6 million (2001: R413.9 million, 2000: R1,217.9 million).
19.
3
Other short-term loans
Vodacom Tanzania Limited . . . . . . . . . . . . . . . . . . . . .
539.4
The loan of $47.2 million from Standard Bank of London is
uncollateralised, bears interest at an effective interest rate of
LIBOR rate plus 1.5% and is repayable by June 30, 2002.
Vodacom (Proprietary) Limited . . . . . . . . . . . . . . . . . . .
23.
7
26.1
23.
7
565.5
The fair value of the Group's short-term loans is R565.5 million
(2001: nil, 2000: R23.7 million).
19.
4
Repayment of interest bearing debt
2003
2004
2005
2006
2007
Total
onwards
Rm
Rm
Rm
Rm
Rm
Rm
Finance leases
Vodacom (Proprietary)
Limited . . . . . . . . . . . .
7.
1
(5.7)
8.
7
20.
4
471.
9
502.4
Vodacom Service Provider
Company (Proprietary)
Limited . . . . . . . . . . . .
3.
3
(2.4)
1.
5
6.
6
279.
2
288.2
Funding loans
Commerzbank AG . . . . . .
200.
0
200.0
Crdit Agricole Indosuez . .
200.
0
200.0
Other short-term loans . . . .
565.
5
565.5
Vodacom Tanzania Limited .
40.
0
40.0
1,015.9
(8.1)
10.
2
27.
0
751.
1
1,796.1

F146
VODACOM GROUP (PROPRIETARY) LIMITED
NOTES TO THE CONSOLIDATED FINANCIAL STATEMENTS
for the three years ended March 31, 2002
2000
2001
2002
Rm
Rm
Rm
20.
SHAREHOLDER LOANS
Telkom SA Limited . . . . . . . . . . . . . . . . . . . . . . . . . . . . .
535.00
00
460.
460.00
Vodafone Group Plc . . . . . . . . . . . . . . . . . . . . . . . . . . . . .
171.6
124.3
124.3
Vodafone Holdings (SA) (Proprietary) Limited . . . . . . . . . . . . . .
165.5
165.5
165.5
VenFin Finansieringskorporasie (Proprietary) Limited . . . . . . . . . . .
144.4
124.2
124.2
Descarte Investments No. 8 (Proprietary) Limited . . . . . . . . . . . . .
53.5
46.0
46.0
1,070.0
920.0
920.0
The shareholder loans are uncollateralised and bear interest at a rate of prime
plus 2% (2000, 2001 and 2002). The average effective interest rate per annum
during the year was 15.69% (2001: 17.16%, 2000: 18.81%). The loans are
repayable on demand of all the shareholders by no later than March 31, 2019.
The shareholders have deferred their right to claim or accept payment of the
amounts owing to them in favour of all other creditors in the event of the
liquidation of Vodacom Group (Proprietary) Limited or similar events.
21.
ACCOUNTS PAYABLE
Trade creditors . . . . . . . . . . . . . . . . . . . . . . . . . . . . . . .
482.3
1,423.7
2,030.0
Income charged in advance . . . . . . . . . . . . . . . . . . . . . . . . .
470.3
782.6
602.5
Capital expenditure creditors . . . . . . . . . . . . . . . . . . . . . . . .
421.6
664.8
457.8
Value-added taxation . . . . . . . . . . . . . . . . . . . . . . . . . . . .
11.0
45.5
16.3
Interest accrual . . . . . . . . . . . . . . . . . . . . . . . . . . . . . . .
22.3
28.9
5.7
Sundry accounts payable and accruals . . . . . . . . . . . . . . . . . . .
347.2
207.3
89.4
1,754.7
3,152.8
3,201.7
22.
NON-INTEREST BEARING DEBT
Vodacom Tanzania Limited . . . . . . . . . . . . . . . . . . . . . . . . .
28.1
Shareholders' loans from Planatel Communication Limited of
R15.3 million, and from Caspian Construction Company Limited of
R12.8 million, respectively. These loans are uncollateralised and no
repayment terms have been determined.
During the 2002 financial year the terms of these loans were amended and
as of April 1, 2002 they bear interest.
Vodacom Lesotho (Proprietary) Limited . . . . . . . . . . . . . . . . . .
4.3
4.3
4.3
The shareholder's loan is uncollateralised and no repayment terms have
been determined.
The fair value of the Group's non-interest bearing debt liabilities could not
be readily determined.
4.3
32.4
4.3
23.
PROVISIONS
Deferred bonus incentive provision . . . . . . . . . . . . . . . . . . . . .
123.8
214.4
311.4
Bonus provision . . . . . . . . . . . . . . . . . . . . . . . . . . . . . . .
48.1
66.0
95.8
Leave pay provision . . . . . . . . . . . . . . . . . . . . . . . . . . . . .
27.0
33.6
44.6
Warranty provision . . . . . . . . . . . . . . . . . . . . . . . . . . . . .
-
-
15.8
Other . . . . . . . . . . . . . . . . . . . . . . . . . . . . . . . . . . . .
38.5
36.4
39.9
237.4
350.4
507.5

F147
VODACOM GROUP (PROPRIETARY) LIMITED
NOTES TO THE CONSOLIDATED FINANCIAL STATEMENTS
for the three years ended March 31, 2002
23.
PROVISIONS (continued)
Reconciliation
Deferred Bonus
Leave
pay
Warranty
Other
2000
bonus
provision
provision
provision
incentive
provision
Rm
Rm
Rm
Rm
Rm
Balance at beginning of year . . . . . .
46.9
39.6
14.3
-
15.0
Provision created . . . . . . . . . . . .
76.9
39.3
12.7
-
23.5
Provision utilised . . . . . . . . . . . .
-
(30.8)
-
-
-
Balance at end of year . . . . . . . . . .
123.8
48.1
27.0
-
38.5
Reconciliation
Deferred Bonus
Leave
pay
Warranty
Other
2001
bonus
provision
provision
provision
incentive
provision
Rm
Rm
Rm
Rm
Rm
Balance at beginning of year . . . . . .
123.8
48.1
27.0
-
38.5
Provision created . . . . . . . . . . . .
133.4
48.1
13.1
-
69.5
Provision utilised . . . . . . . . . . . .
(42.8)
(30.2)
(6.5)
-
(71.6)
Balance at end of year . . . . . . . . . .
214.4
66.0
33.6
-
36.4
Reconciliation
Deferred Bonus
Leave
pay
Warranty
Other
2002
bonus
provision
provision
provision
incentive
provision
Rm
Rm
Rm
Rm
Rm
Balance at beginning of year . . . . . .
214.4
66.0
33.6
-
36.4
Provision created . . . . . . . . . . . .
161.8
112.0
19.5
53.8
84.0
Provision utilised . . . . . . . . . . . .
(64.8)
(82.2)
(8.5)
(38.0)
(80.5)
Balance at end of year . . . . . . . . . .
311.4
95.8
44.6
15.8
39.9
2000
2001
2002
Rm
Rm
Rm
Timing of provisions
Within one year . . . . . . . . . . . . . . . . . . . . . . . . . . . . . . .
198.7
273.8
319.5
After one year . . . . . . . . . . . . . . . . . . . . . . . . . . . . . . . .
38.7
76.6
188.0
237.4
350.4
507.5
23.1
Deferred bonus incentive provision
The deferred bonus incentive provision represents the present value of bonus entitlements at balance sheet date.
The value of the bonus entitlements are determined based on the audited consolidated financial statements
of Vodacom Group (Proprietary) Limited. Periodically, a number of entitlements are issued to employees,
the value of which depends on the level of the employee.
The participating rights of employees vest in two equal portions after three and six years, respectively, and employees
are entitled to cash in their entitlements within one year after the participating rights have vested. The provision
created represents the present value of the expected future cash out flows of the entitlement value at balance sheet date
less the value at which the entitlements were issued, multiplied by the number of entitlements allocated to a
participant.
The provision is utilised when eligible employees receive the value of vested entitlements.

F148
VODACOM GROUP (PROPRIETARY) LIMITED
NOTES TO THE CONSOLIDATED FINANCIAL STATEMENTS
for the three years ended March 31, 2002
23.
PROVISIONS (continued)
23.2
Bonus provision
The bonus provision consists of a profit based performance bonus. The performance bonus is payable at the sole
discretion of the shareholders in May each year to Level 1 4 employees and payable bi-annually in December and
May to Level 5 and 6 employees. The maximum bonus payable is determined by applying a specific formula based
on Vodacom Group (Proprietary) Limited's consolidated profit and the employee's achievement of performance
targets. The employee must be in service on May 31, to qualify for the bonus.
23.
3
Leave pay provision
The leave pay provision relates to vested leave pay to which employees may become entitled upon leaving the
employment of the Group. The provision arises as employees render a service that increases their entitlement to future
compensated leave. The provision is utilised when employees who are entitled to leave pay, leave the employment of
the Group or when the accrued leave due to an employee, is utilised.
23.
4
Warranty provision
During the 2002 financial year, the warranty provision was created to cover manufacturing defects in the second year
of warranty on handsets sold to customers.
24.
CHANGE IN ACCOUNTING POLICY
The Group changed its accounting policy for foreign exchange contracts and other financial instruments due to the
adoption of International Accounting Standard 39 Financial Instruments: Recognition and Measurement during the year
ended March 31, 2002. Under the new policy, the Group elected not to apply hedge accounting to foreign exchange contracts
and therefore all fair value adjustments are recognised in the income statement in the period in which they occur.
Interest rate swaps are also recorded and measured at fair value. All changes in fair value are recognised in the income
statement in the period in which they occur.
These changes have had the effect of increasing net profit for the year and retained profit at the beginning of the year, and
have been applied prospectively:
Net profit
Retained
earnings
Rm
Rm
Gross effect . . . . . . . . . . . . . . . . . . . . . . . . . . . . . . . . . . . . . . . . . .
352.3
121.4
Foreign exchange contracts . . . . . . . . . . . . . . . . . . . . . . . . . . . . . . . . . .
347.4
104.2
Derivatives interest rate swaps . . . . . . . . . . . . . . . . . . . . . . . . . . . . . . .
4.9
17.2
Taxation effect . . . . . . . . . . . . . . . . . . . . . . . . . . . . . . . . . . . . . . . .
(105.7)
(36.5)
Foreign exchange contracts . . . . . . . . . . . . . . . . . . . . . . . . . . . . . . . . . .
(104.2)
(31.3)
Interest rate swaps . . . . . . . . . . . . . . . . . . . . . . . . . . . . . . . . . . . . . .
(1.5)
(5.2)
246.6
84.9

F149
VODACOM GROUP (PROPRIETARY) LIMITED
NOTES TO THE CONSOLIDATED FINANCIAL STATEMENTS
for the three years ended March 31, 2002
2000
2001
2002
Rm
Rm
Rm
25.
CASH GENERATED FROM OPERATIONS
Profit from operations . . . . . . . . . . . . . . . . . . . . . . . . . . .
2,363.3
2,553.4
3,621.1
Adjusted for:
Depreciation of property, plant and equipment . . . . . . . . . . . . . . .
1,025.3
1,364.1
1,857.3
Net loss/(profit) on disposal of property, plant and equipment . . . . . . .
9.6
(0.4)
(3.4)
Revaluation of equity investment . . . . . . . . . . . . . . . . . . . . . .
-
-
8.9
Recoupment of Gateway asset accrual . . . . . . . . . . . . . . . . . . . -
-
(15.0)
Bad debts written-off . . . . . . . . . . . . . . . . . . . . . . . . . . . .
16.5
107.4
111.2
Capital (profit)/loss on disposal of subsidiaries . . . . . . . . . . . . . .
(129.3)
213.2
(16.3)
GSM investment write-off . . . . . . . . . . . . . . . . . . . . . . . . .
-
-
0.3
Impairment of assets . . . . . . . . . . . . . . . . . . . . . . . . . . . .
-
-
(1.0)
Amortisation of intangible assets . . . . . . . . . . . . . . . . . . . . . .
73.6
271.5
212.7
Cash flow from operations before working capital changes . . . . . . . .
3,359.0
4,509.2
5,775.8
Decrease/(Increase) in accounts receivable . . . . . . . . . . . . . . . . .
40.5
(718.9)
(264.5)
(Increase)/Decrease in inventory . . . . . . . . . . . . . . . . . . . . . .
(42.3)
(162.5)
93.3
(Decrease)/Increase in accounts payable and provisions . . . . . . . . . .
(175.2)
1,035.8
583.5
Cash generated from operations . . . . . . . . . . . . . . . . . . . . . .
3,182.0
4,663.6
6,188.1
26.
FINANCE COSTS PAID
Shareholder loans . . . . . . . . . . . . . . . . . . . . . . . . . . . . . .
(202.1)
(157.9)
(144.2)
Finance leases . . . . . . . . . . . . . . . . . . . . . . . . . . . . . . . .
(61.2)
(60.8)
(98.9)
Funding loans . . . . . . . . . . . . . . . . . . . . . . . . . . . . . . . .
(69.8)
(65.7)
(87.2)
Bank and other interest . . . . . . . . . . . . . . . . . . . . . . . . . . .
(99.4)
(162.9)
(81.2)
Interest accrual at beginning of year . . . . . . . . . . . . . . . . . . . .
(9.4)
(22.3)
(28.9)
Interest accrual at end of year . . . . . . . . . . . . . . . . . . . . . . . .
22.3
28.9
5.7
(419.6)
(440.7)
(434.7)
(Loss)/Gain on forward exchange contracts and liability revaluations . . .
(133.7)
(56.1)
347.4
Unrealised losses on revaluation of foreign exchange contracts . . . . . .
-
-
(220.4)
Unrealised losses on spot rate revaluation of creditor . . . . . . . . . . .
-
-
(41.0)
Unrealised gain on interest rate swap revaluation . . . . . . . . . . . . .
-
-
2.2
Other non-cash flow items . . . . . . . . . . . . . . . . . . . . . . . . .
-
-
(31.9)
Interest rate swaps . . . . . . . . . . . . . . . . . . . . . . . . . . . . . .
(1.0)
(1.1)
4.3
(554.3)
(497.9)
(374.1)
27.
TAXATION PAID
Taxation per the income statement . . . . . . . . . . . . . . . . . . . . .
(513.6)
(765.7)
(1,190.7)
Taxation payable at beginning of year . . . . . . . . . . . . . . . . . . .
(288.6)
(560.1)
(810.0)
Taxation payable at end of year . . . . . . . . . . . . . . . . . . . . . . .
560.1
810.0
351.6
Deferred taxation at beginning of year . . . . . . . . . . . . . . . . . . .
(219.4)
(309.8)
(268.4)
Deferred taxation at end of year . . . . . . . . . . . . . . . . . . . . . .
309.8
268.4
428.5
Business combination . . . . . . . . . . . . . . . . . . . . . . . . . . . .
(166.6)
(10.4)
(0.9)
Movement due to IAS 39 adjustment . . . . . . . . . . . . . . . . . . . .
-
-
(36.5)
Movement due to revaluation of equity loans . . . . . . . . . . . . . . .
-
-
(19.9)
Exchange difference on consolidation of foreign subsidiary . . . . . . . .
-
-
7.2
(318.3)
(567.6)
(1,539.1)

F150
VODACOM GROUP (PROPRIETARY) LIMITED
NOTES TO THE CONSOLIDATED FINANCIAL STATEMENTS
for the three years ended March 31, 2002
2000
2001
2002
Rm
Rm
Rm
28.
ADDITIONS TO PROPERTY, PLANT AND EQUIPMENT
Additions to property, plant and equipment (Note 9) . . . . . . . . . .
2,022.0
3,184.2
4,085.3
Less: Property, plant and equipment acquired in business combinations
(3.1)
-
-
Vodacom (Proprietary) Limited finance leases . . . . . . . . . . . . .
(10.4)
(106.3)
-
Vodacom Service Provider Company (Proprietary)
Limited finance leases . . . . . . . . . . . . . . . . . . . . . . . . . .
-
-
(282.2)
Increase/(Decrease) in capex-related creditors . . . . . . . . . . . . .
684.7
(243.0)
606.0
2,693.2
2,834.9
4,409.1
29.
DISPOSAL/(ACQUISITION) OF SUBSIDIARIES
Disposals of subsidiaries
Vodacom Sport & Entertainment (Proprietary) Limited
(Notes 29.1(a)) . . . . . . . . . . . . . . . . . . . . . . . . . . . . .
-
-
17.9
Film Fun (Holdings) (Proprietary) Limited (Note 29.1(b)) . . . . . . .
-
-
(16.2)
-
-
1.7
Acquisition of subsidiaries
Vodacom International Holdings (Proprietary) Limited and
Vodacom International Limited (Note 29.2(a)) . . . . . . . . . . . . .
-
-
(0.1)
Globalstar Southern Africa (Proprietary) Limited (Note 29.2(b)) . . .
-
(91.1)
-
GSM Cellular (Proprietary) Limited (Note 29.2(c)) . . . . . . . . . .
(71.4)
-
-
Vodacom Sport & Entertainment (Proprietary) Limited (Note 29.2(d)) .
-
7.9
-
Teljoy Holdings Limited (Note 29.2(e)) . . . . . . . . . . . . . . . .
(627.9)
-
-
Film Fun (Holdings) (Proprietary) Limited (Note 29.2(e)) . . . . . . .
-
(8.5)
-
Vodacom Tanzania Limited (Note 29.2(f)) . . . . . . . . . . . . . . .
-
(28.9)
-
Vodacom Tanzania Limited (Note 29.2(g)) . . . . . . . . . . . . . . .
-
6.8
-
(699.3)
(113.8)
(0.1)

F151
VODACOM GROUP (PROPRIETARY) LIMITED
NOTES TO THE CONSOLIDATED FINANCIAL STATEMENTS
for the three years ended March 31, 2002
29.
DISPOSAL/(ACQUISITION) OF SUBSIDIARIES (continued)
2000
2001
2002
Rm
Rm
Rm
29.
1
Subsidiaries disposed
(a)
Vodacom Sport and & Entertainment (Proprietary) Limited
On February 27, 2002, the Group disposed of its 51% interest
in Vodacom Sport and & Entertainment (Proprietary) Limited.
The fair value of the assets and liabilities disposed were as
follows:
Carrying amount of net assets disposed of . . . . . . . . .
-
-
9.8
Property, plant and equipment . . . . . . . . . . . . . .
-
-
1.3
Investments . . . . . . . . . . . . . . . . . . . . . . . .
-
-
2.7
Inventory . . . . . . . . . . . . . . . . . . . . . . . . .
-
-
0.5
Accounts receivable . . . . . . . . . . . . . . . . . . .
-
-
228.6
Deferred taxation . . . . . . . . . . . . . . . . . . . . .
-
-
1.6
Cash and cash equivalents . . . . . . . . . . . . . . . .
-
-
4.6
Accounts payable . . . . . . . . . . . . . . . . . . . . .
-
-
(227.9)
Taxation payable . . . . . . . . . . . . . . . . . . . . .
-
-
(0.4)
Value-added-tax payable . . . . . . . . . . . . . . . . - -
(1.2)
Minority interest . . . . . . . . . . . . . . . . . . . . . .
-
-
(4.8)
Capital gain on disposal . . . . . . . . . . . . . . . . . . .
-
-
-40.0
Selling price . . . . . . . . . . . . . . . . . . . . . . . . .
-
-
45.0
Cash and cash equivalents . . . . . . . . . . . . . . . . .
-
-
(4.6)
Cash consideration . . . . . . . . . . . . . . . . . . . . .
-
-
40.4
Less: Amount receivable . . . . . . . . . . . . . . . . . .
-
-
(22.5)
-
-
17.9
Selling price satisfied by: . . . . . . . . . . . . . . . . . -
-
45.0
Cash . . . . . . . . . . . . . . . . . . . . . . . . . . . . .
-
-
22.5
Deferred consideration to be settled in two equal instalments
on August 31, 2002 and August 31, 2003. The amount
receivable is reflected under investments and accounts
receivable as a note receivable (Notes 11 and 14) . . . . .
-
-
22.5

F152
VODACOM GROUP (PROPRIETARY) LIMITED
NOTES TO THE CONSOLIDATED FINANCIAL STATEMENTS
for the three years ended March 31, 2002
29.
DISPOSAL/(ACQUISITION) OF SUBSIDIARIES (continued)
2000
2001
2002
Rm
Rm
Rm
29.
1
Subsidiaries disposed (continued)
(b)
Film Fun (Holdings) (Proprietary) Limited
On March 31, 2002, the Group disposed of it's interest in Film
Fun (Holdings) (Proprietary) Limited, Africell Cellular
Services (Proprietary) Limited and Teljoy (Botswana)
(Proprietary) Limited. The fair value of the assets and
liabilities disposed were as follows:
Carrying amount of net assets disposed of . . . . . . . . .
-
-
62.8
Property, plant and equipment . . . . . . . . . . . . . .
-
-
64.7
Loan Teljoy Holdings Limited . . . . . . . . . . . . .
-
-
28.0
Goodwill . . . . . . . . . . . . . . . . . . . . . . . . .
-
-
15.9
Cash and cash equivalents . . . . . . . . . . . . . . . .
-
-
16.2
Accounts receivable . . . . . . . . . . . . . . . . . . .
-
-
7.2
Inventory . . . . . . . . . . . . . . . . . . . . . . . . .
-
-
5.3
Shareholding in subsidiaries . . . . . . . . . . . . . . .
-
-
4.2
Investments . . . . . . . . . . . . . . . . . . . . . . . .
-
-
3.3
Taxation receivable . . . . . . . . . . . . . . . . . . . .
-
-
1.1
Accounts payable . . . . . . . . . . . . . . . . . . . . .
-
-
(64.2)
Provision for licences . . . . . . . . . . . . . . . . . .
-
-
(25.0)
Deferred taxation . . . . . . . . . . . . . . . . . . . . .
-
-
(2.7)
Non-distributable reserve . . . . . . . . . . . . . . . . .
-
-
(0.2)
Trademark . . . . . . . . . . . . . . . . . . . . . . . .
-
-
9.0
Capital loss on disposal . . . . . . . . . . . . . . . . . . .
-
-
(53.8)
Selling price . . . . . . . . . . . . . . . . . . . . . . . . .
-
-
9.0
Cash and cash equivalents . . . . . . . . . . . . . . . . .
-
-
(16.2)
Cash consideration . . . . . . . . . . . . . . . . . . . . .
-
-
(7.2)
Less: Amount receivable . . . . . . . . . . . . . . . . . .
-
-
(9.0)
-
-
(16.2)
Selling price satisfied by: . . . . . . . . . . . . . . . . . .
9.0
Cash . . . . . . . . . . . . . . . . . . . . . . . . . . . .
-
-
Deferred consideration . . . . . . . . . . . . . . . . . .
-
-
9.0
The deferred consideration was settled in cash by the new
owners on May 15, 2002.
F153
VODACOM GROUP (PROPRIETARY) LIMITED
NOTES TO THE CONSOLIDATED FINANCIAL STATEMENTS
for the three years ended March 31, 2002
29.
DISPOSAL/(ACQUISITION) OF SUBSIDIARIES (continued)
2000
2001
2002
Rm
Rm
Rm
29.2
Subsidiaries acquired
(a)
Vodacom International Holdings (Proprietary)
Limited and Vodacom International Limited
Both companies became operational from April 1, 2001.
Vodacom Group (Proprietary) Limited holds 100% of the
issued share capital of Vodacom International Holdings
(Proprietary) Limited, who in turn holds 100% of the issued
share capital of Vodacom International Limited, a company
based in Mauritius. The fair value of the share capital acquired
is as follows:
Share capital . . . . . . . . . . . . . . . . . . . . . . . . .
-
-
(0.1)
(b)
Globalstar Southern Africa (Proprietary) Limited
During the 2001 financial year the Group acquired 100% of
Globalstar Southern Africa (Proprietary) Limited. The fair
value of the assets acquired and liabilities assumed were as
follows:
Fair value of net assets acquired . . . . . . . . . . . . . .
-
(43.5)
-
Property, plant and equipment . . . . . . . . . . . . . .
-
96.6
-
Inventory . . . . . . . . . . . . . . . . . . . . . . . . .
-
0.7
-
Accounts receivable . . . . . . . . . . . . . . . . . . .
-
1.9
-
Cash and cash equivalents . . . . . . . . . . . . . . . .
-
10.0
-
Shareholder loans . . . . . . . . . . . . . . . . . . . . .
-
(33.0)
-
Accounts payable . . . . . . . . . . . . . . . . . . . . .
-
(32.7)
-
Goodwill (amortised over five years) . . . . . . . . . . . .
-
(24.6)
-
Shareholder loans . . . . . . . . . . . . . . . . . . . . . .
-
(33.0)
-
Purchase price . . . . . . . . . . . . . . . . . . . . . . . .
-
(101.1)
-
Cash and cash equivalents . . . . . . . . . . . . . . . . .
-
10.0
-
Cash consideration . . . . . . . . . . . . . . . . . . . . .
-
(91.1)
-
(c)
GSM Cellular (Proprietary) Limited
During the 2000 financial year the Group acquired an
additional 50% of GSM Cellular (Proprietary) Limited to take
the total shareholding to 100% and resulted in the company
being treated as a subsidiary.
Fair value of net assets acquired . . . . . . . . . . . . . .
(38.9)
-
-
Long-term loans . . . . . . . . . . . . . . . . . . . . .
-
-
-
Property, plant and equipment . . . . . . . . . . . . . .
8.1
-
-
Inventory . . . . . . . . . . . . . . . . . . . . . . . . .
7.8
-
-
Accounts receivable . . . . . . . . . . . . . . . . . . .
27.2
-
-
Accounts payable . . . . . . . . . . . . . . . . . . . . .
(54.3)
-
-
Short-term loans . . . . . . . . . . . . . . . . . . . . .
-
-
-
Cash . . . . . . . . . . . . . . . . . . . . . . . . . . . .
3.9
-
-
Customer base . . . . . . . . . . . . . . . . . . . . . .
66.0
-
-
Deferred taxation customer base . . . . . . . . . . . .
(19.8)
-
-
Goodwill (amortised over five years) . . . . . . . . . . . .
(36.4)
-
-
Purchase price . . . . . . . . . . . . . . . . . . . . . . . .
(75.3)
-
-
Cash . . . . . . . . . . . . . . . . . . . . . . . . . . . . .
3.9
-
-
Cash consideration . . . . . . . . . . . . . . . . . . . . .
(71.4) -
-
F154
VODACOM GROUP (PROPRIETARY) LIMITED
NOTES TO THE CONSOLIDATED FINANCIAL STATEMENTS
for the three years ended March 31, 2002
29.
DISPOSAL/(ACQUISITION) OF SUBSIDIARIES (continued)
2000
2001
2002
Rm
Rm
Rm
29.
2
Subsidiaries acquired (continued)
(d)
Vodacom Sport and & Entertainment (Proprietary) Limited
During the financial year ended March 31, 2000, Vodacom
Sport & Entertainment (Proprietary) Limited was treated as a
joint venture and proportionately consolidated at 51%, but
from the 2001 financial year, it was consolidated in full.
The adjustments that were made are as follows:
Fair value of net assets acquired . . . . . . . . . . . . . .
-
(1.0)
-
Property, plant and equipment . . . . . . . . . . . . . .
-
0.9
-
Deferred taxation . . . . . . . . . . . . . . . . . . . . .
-
0.3
-
Investments . . . . . . . . . . . . . . . . . . . . . . . .
-
0.1
-
Accounts receivable . . . . . . . . . . . . . . . . . . .
-
9.3
-
Cash and cash equivalents . . . . . . . . . . . . . . . .
-
7.9
-
Accounts payable . . . . . . . . . . . . . . . . . . . . .
-
(15.0)
-
Taxation . . . . . . . . . . . . . . . . . . . . . . . . . .
-
(2.5)
-
Net assets acquired . . . . . . . . . . . . . . . . . . . . .
-
8.9
-
Cash consideration . . . . . . . . . . . . . . . . . . . . .
-
7.9
-
(e)
Teljoy Holdings Limited
During the 2000 financial year the Group acquired 100% of
Teljoy Holdings Limited. Included in this acquisition, the Group
acquired 100% of of Film Fun (Holdings) (Proprietary) Limited
trading as Teljoy. The investment was consolidated from the 2001
financial year (Note 12). The fair value of the assets acquired and
liabilities assumed were as follows:
Fair value of net assets acquired . . . . . . . . . . . . . .
(449.1)
(19.2)
-
Long-term loans . . . . . . . . . . . . . . . . . . . . .
(0.6)
(20.4)
-
Minority interest . . . . . . . . . . . . . . . . . . . . .
(0.8)
-
-
Deferred taxation . . . . . . . . . . . . . . . . . . . . .
(5.5)
-
-
Property, plant and equipment . . . . . . . . . . . . . .
27.6
126.9
-
Intangible assets . . . . . . . . . . . . . . . . . . . . .
33.2
0.3
-
Investments . . . . . . . . . . . . . . . . . . . . . . . .
11.0
0.3
-
Inventory . . . . . . . . . . . . . . . . . . . . . . . . .
26.1
12.9
-
Accounts receivable . . . . . . . . . . . . . . . . . . .
207.4
17.2
-
Accounts payable . . . . . . . . . . . . . . . . . . . . .
(239.8)
(46.7)
-
Cash and cash equivalents . . . . . . . . . . . . . . . .
132.5
(8.4)
-
Customer base . . . . . . . . . . . . . . . . . . . . . .
368.5
-
-
Deferred taxation customer base . . . . . . . . . . . .
(110.5)
-
-
Trademark . . . . . . . . . . . . . . . . . . . . . . . .
-
15.0
-
Deferred taxation trademark . . . . . . . . . . . . . .
-
(4.5)
-
Shareholder loans . . . . . . . . . . . . . . . . . . . . .
-
(70.0)
-
Taxation . . . . . . . . . . . . . . . . . . . . . . . . . .
-
(3.4)
-
Goodwill (amortised over five years) . . . . . . . . . . . .
(311.3)
(26.6)
-
Purchase price (2001: previously accounted for under
investing activities) . . . . . . . . . . . . . . . . . . . . .
(760.4)
(45.8)
-
Cash and cash equivalents . . . . . . . . . . . . . . . . .
132.5
-
-
Net cash-flow on acquisition of wholly-owned subsidiary .
-
54.3
-
Cash consideration . . . . . . . . . . . . . . . . . . . . .
(627.9)
(8.5)
-
F155
VODACOM GROUP (PROPRIETARY) LIMITED
NOTES TO THE CONSOLIDATED FINANCIAL STATEMENTS
for the three years ended March 31, 2002
29.
DISPOSAL/(ACQUISITION) OF SUBSIDIARIES (continued)
2000
2001
2002
Rm
Rm
Rm
29.2
Subsidiaries acquired (continued)
(f)
Vodacom Tanzania Limited
On July 14, 2000, the Group acquired an additional 14% of
Vodacom Tanzania Limited. The fair value of the assets
acquired and liabilities assumed were as follows:
Fair value of net assets acquired . . . . . . . . . . . . . .
-
9.6
-
Property, plant and equipment . . . . . . . . . . . . . .
-
6.7
-
Intangible assets . . . . . . . . . . . . . . . . . . . . .
-
6.8
-
Inventory . . . . . . . . . . . . . . . . . . . . . . . . .
-
10.2
-
Accounts receivable . . . . . . . . . . . . . . . . . . .
-
6.8
-
Cash and cash equivalents . . . . . . . . . . . . . . . .
-
2.7
-
Shareholder loans . . . . . . . . . . . . . . . . . . . . .
-
(39.2)
-
Accounts payable . . . . . . . . . . . . . . . . . . . . .
-
(3.6)
-
Minority interest . . . . . . . . . . . . . . . . . . . . . .
-
(3.4)
-
Investments previously recognised . . . . . . . . . . . . .
-
(4.9)
-
Goodwill (amortised over five years) . . . . . . . . . . . .
-
(30.2)
-
Cash consideration . . . . . . . . . . . . . . . . . . . . .
-
(28.9)
-
(g)
Vodacom Tanzania Limited
During the financial year ended March 31, 2000, Vodacom
Tanzania Limited was treated as a joint venture and
proportionately consolidated at 51%, but from the 2001
financial year, it was consolidated in full as the change in
shareholding changed the nature of the investment. The
additional percentage acquired resulted in Vodacom Group
(Proprietary) Limited obtaining control. The adjustments that
were made are as follows:
Fair value of net assets acquired . . . . . . . . . . . . . .
-
(1.0)
-
Property, plant and equipment . . . . . . . . . . . . . .
-
0.7
-
Intangible assets . . . . . . . . . . . . . . . . . . . . .
-
3.2
-
Investments . . . . . . . . . . . . . . . . . . . . . . . .
-
4.7
-
Accounts receivable . . . . . . . . . . . . . . . . . . .
-
0.4
-
Cash and cash equivalents . . . . . . . . . . . . . . . .
-
6.8
-
Non-distributable reserve . . . . . . . . . . . . . . . . .
-
0.1
-
Shareholder loans . . . . . . . . . . . . . . . . . . . . .
-
(16.0)
-
Accounts payable . . . . . . . . . . . . . . . . . . . . .
-
(0.9)
-
Net assets acquired . . . . . . . . . . . . . . . . . . . . .
-
7.8
-
Cash consideration . . . . . . . . . . . . . . . . . . . . .
-
6.8
-

F156
VODACOM GROUP (PROPRIETARY) LIMITED
NOTES TO THE CONSOLIDATED FINANCIAL STATEMENTS
for the three years ended March 31, 2002
2000
2001
2002
Rm
Rm
Rm
30.
(ACQUISITION)/DISPOSAL OF JOINT VENTURES
Disposal of joint ventures
Joint ventures disposed Vodacom World Online (Proprietary)
Limited (Note 30.2) . . . . . . . . . . . . . . . . . . . . . . . . . . .
51.8
-
23.3
Acquisition of joint ventures
Joint ventures acquired Vodacom World Online (Proprietary) Limited
(Note 30.1) . . . . . . . . . . . . . . . . . . . . . . . . . . . . . . . .
(120.7)
-
-
Vodacom Congo (R.D.C.) S.P.R.L. . . . . . . . . . . . . . . . . . . .
-
-
-
During the 2002 financial year Vodacom Congo (R.D.C.) S.P.R.L.
was formed and financed by the Group and accordingly it had no
cash effect on the Group's cash flow . . . . . . . . . . . . . . . . . .
(120.7)
-
-
30.
1
Joint ventures acquired
(a)
Vodacom World Online (Proprietary) Limited
During the 2000 financial year, subsequent to the disposal of
the Internet Division (Note 31), the Group acquired 50% of
Vodacom World Online (Proprietary) Limited.
Fair value of net assets acquired . . . . . . . . . . . . . .
(9.4)
-
-
Long-term loans . . . . . . . . . . . . . . . . . . . . .
-
-
-
Property, plant and equipment . . . . . . . . . . . . . .
3.1
-
-
Investments . . . . . . . . . . . . . . . . . . . . . . . .
-
-
-
Inventory . . . . . . . . . . . . . . . . . . . . . . . . .
0.4
-
-
Accounts receivable . . . . . . . . . . . . . . . . . . .
16.9
-
-
Accounts payable . . . . . . . . . . . . . . . . . . . . .
(23.0)
-
-
Short-term loans . . . . . . . . . . . . . . . . . . . . .
-
-
-
Cash . . . . . . . . . . . . . . . . . . . . . . . . . . . .
12.0
-
-
Goodwill (amortised over three years) . . . . . . . . . . .
(123.3)
-
-
Purchase price . . . . . . . . . . . . . . . . . . . . . . . .
(132.7)
-
-
Cash . . . . . . . . . . . . . . . . . . . . . . . . . . . . .
12.0
-
-
Cash consideration . . . . . . . . . . . . . . . . . . . . .
(120.7)
-
-
30.
2
Joint ventures disposed
(a)
Vodacom World Online (Proprietary) Limited
During the 2000 financial year, subsequent to the acquisition
described above, the Group disposed of 10% of the joint
venture in Vodacom World Online (Proprietary) Limited.
Carrying amount of net liabilities disposed of . . . . . . .
(3.2)
-
-
Property, plant and equipment . . . . . . . . . . . . . .
2.0
-
-
Accounts receivable . . . . . . . . . . . . . . . . . . .
3.7
-
-
Accounts payable . . . . . . . . . . . . . . . . . . . . .
(8.2)
-
-
Cash . . . . . . . . . . . . . . . . . . . . . . . . . . . .
(0.7)
-
-
Capital gain on disposal . . . . . . . . . . . . . . . . . . .-
54.3
-
-
Selling price . . . . . . . . . . . . . . . . . . . . . . . . .
51.1
-
-
Cash . . . . . . . . . . . . . . . . . . . . . . . . . . . . .
0.7
-
-
Cash consideration . . . . . . . . . . . . . . . . . . . . .
51.8
-
-
F157
VODACOM GROUP (PROPRIETARY) LIMITED
NOTES TO THE CONSOLIDATED FINANCIAL STATEMENTS
for the three years ended March 31, 2002
30.
(ACQUISITION)/DISPOSAL OF JOINT VENTURES (continued)
2000
2001
2002
Rm
Rm
Rm
30.2
Joint ventures disposed (continued)
(b)
Vodacom World Online (Proprietary) Limited
On November 30, 2001, the Group disposed of its 40% joint
venture shareholding in Vodacom World Online (Proprietary)
Limited. The fair value of the assets and liabilities disposed
were as follows:
Carrying amount of net assets disposed . . . . . . . . . .
-
-
1.7
Property, plant and equipment . . . . . . . . . . . . . .
-
-
6.7
Intangibles . . . . . . . . . . . . . . . . . . . . . . . .
-
-
Inventory . . . . . . . . . . . . . . . . . . . . . . . . .
-
-
0.6
Accounts receivable . . . . . . . . . . . . . . . . . . .
-
-
6.6
Taxation payable . . . . . . . . . . . . . . . . . . . . .
-
-
(0.1)
Cash and cash equivalents . . . . . . . . . . . . . . . .
-
-
8.5
Accounts payable . . . . . . . . . . . . . . . . . . . . .
-
-
(20.6)
Capital gain on disposal . . . . . . . . . . . . . . . . . . .
-
-
30.1
Selling price . . . . . . . . . . . . . . . . . . . . . . . . .
-
-
31.8
Cash and cash equivalents . . . . . . . . . . . . . . . . .
-
-
(8.5)
Cash consideration . . . . . . . . . . . . . . . . . . . . .
-
-
23.3
31.
DISPOSAL OF INTERNET DIVISION
Division disposed . . . . . . . . . . . . . . . . . . . . . . . . . . . .
199.8
-
-
31.
1
Disposal of Internet division
During the 2000 financial year the group disposed of the Vodacom
Internet division of Vodacom (Proprietary) Limited.
Carrying amount of net assets disposed of . . . . . . . . . . . .
18.8
-
-
Long-term loans . . . . . . . . . . . . . . . . . . . . .
-
-
-
Property, plant and equipment . . . . . . . . . . . . . .
6.6
-
-
Inventory . . . . . . . . . . . . . . . . . . . . . . . . .
0.9
-
-
Accounts receivable . . . . . . . . . . . . . . . . . . .
33.7
-
-
Accounts payable . . . . . . . . . . . . . . . . . . . . .
(46.4)
-
-
Cash . . . . . . . . . . . . . . . . . . . . . . . . . . . .
24.0
-
-
Short-term loans . . . . . . . . . . . . . . . . . . . . .
-
-
-
Capital gain on disposal . . . . . . . . . . . . . . . . . . .
246.6
-
-
Realised (Note 5.1) . . . . . . . . . . . . . . . . . . . .
123.3
-
-
Deferred (Note 5.1) . . . . . . . . . . . . . . . . . . . .
123.3
-
-
Selling price . . . . . . . . . . . . . . . . . . . . . . . . .
265.4
-
-
Cash . . . . . . . . . . . . . . . . . . . . . . . . . . . . .
(24.0)
-
-
Cash flow included in capital gain . . . . . . . . . . . . .
(41.6)
-
-
Cash consideration . . . . . . . . . . . . . . . . . . . . .
199.8
-
-
32.
CASH AND CASH EQUIVALENTS AT END OF YEAR
Bank and cash balances . . . . . . . . . . . . . . . . . . . . . . . . .
936.1
797.6
719.2
Bank overdrafts and other short term debt . . . . . . . . . . . . . . .
(1,451.1)
(1,593.7)
(1,576.8)
(515.0)
(796.1)
(857.6)

F158
VODACOM GROUP (PROPRIETARY) LIMITED
NOTES TO THE CONSOLIDATED FINANCIAL STATEMENTS
for the three years ended March 31, 2002
2000
2001
2002
R
R
R
33.
EARNINGS AND DIVIDEND PER SHARE
33.1
Basic and diluted earnings per share
The calculation of basic earnings per ordinary share is based
on earnings of R2,373.0 million (2001: R1,317.8 million,
2000: R1,315.0 million) and 10,000 issued ordinary shares (2001:
10,000; 2000: 10, 000) . . . . . . . . . . . . . . . . . . . . . .
131,500
131,780
237,300
Due to no dilution factors being present, basic earnings per share
equals diluted earnings per share.
33.
2
Dividend per share
The calculation of the dividend per ordinary share is based on a
declared ordinary dividend of R600.0 million (2001: R480.0
million, 2000: nil) and 10,000 issued ordinary shares (2001:
10,000; 2000: 10,000). The dividends were declared as follows:
Declared March 21, 2002 and payable June 28, 2002 (Final) . .
-
-
60,000
Declared March 15, 2001 and payable June 29, 2001 (Final) . .
-
48,000
-
-
48,000
60,000
2000
2001
2002
Rm
Rm
Rm
34.
CAPITAL COMMITMENTS
Commitments for orders in respect of existing contracts:
Vodacom (Proprietary) Limited . . . . . . . . . . . . . . . . . . . .
657.7
1,272.1
1,005.2
Vodacom Congo (R.D.C.) S.P.R.L (Euro30.4 million at R9.99) . . .
303.7
Vodacom Tanzania Limited (US$6.9 million at R11.44) . . . . . . .
-
47.5
78.9
Vodacom Service Provider Company (Proprietary) Limited . . . . .
-
290.8
59.9
Vodacom International Holdings (Proprietary) Limited . . . . . . .
-
-
2.2
Vodacom Group (Proprietary) Limited . . . . . . . . . . . . . . . .
-
-
0.3
Vodacare (Proprietary) Limited . . . . . . . . . . . . . . . . . . . .
5.3
-
-
Vodacom Lesotho (Proprietary) Limited . . . . . . . . . . . . . . .
-
5.1
-
663.0
1,615.5
1,450.2
Commitments not yet contracted for:
Vodacom (Proprietary) Limited . . . . . . . . . . . . . . . . . . . .
3,460.9
2,871.9
805.5
Vodacom Congo (R.D.C.) S.P.R.L (US$1.4 million at R11.44) . . .
-
-
16.0
Vodacom Service Provider Company (Proprietary) Limited . . . . .
-
250.8
15.9
Vodacom Tanzania Limited (US$0.9 million at R11.44) . . . . . . .
-
484.5
10.3
Vodacom Lesotho (Proprietary) Limited . . . . . . . . . . . . . . .
16.2
23.5
1.9
Vodacom Group (Proprietary) Limited . . . . . . . . . . . . . . . .
3.8
2.7
-
Vodac (Proprietary) Limited . . . . . . . . . . . . . . . . . . . . .
18.5
-
-
GSM (Proprietary) Limited . . . . . . . . . . . . . . . . . . . . . .
5.9
-
-
Teljoy Holdings Limited . . . . . . . . . . . . . . . . . . . . . . .
2.7
-
-
Other . . . . . . . . . . . . . . . . . . . . . . . . . . . . . . . . .
-
32.9
-
3,508.0
3,666.3
849.6
The capital expenditure of the Group will be financed from internal cash generation, extended supplier credit and bank credit.

F159
VODACOM GROUP (PROPRIETARY) LIMITED
NOTES TO THE CONSOLIDATED FINANCIAL STATEMENTS
for the three years ended March 31, 2002
2000
2001
2002
Rm
Rm
Rm
35.
OTHER COMMITMENTS
Operating leases . . . . . . . . . . . . . . . . . . . . . . . . . . . . .
2,780.6
3,749.3
2,313.7
Sports and marketing contracts . . . . . . . . . . . . . . . . . . . . .
154.5
388.8
321.1
Finance lease building . . . . . . . . . . . . . . . . . . . . . . . . . .
890.3
496.6
93.5
3,825.4
4,634.7
2,728.3
Within
Between two
After
Total
one year and five years
five years
Rm
Rm
Rm
Rm
35.1
Operating leases
Transmission and data lines GSM . . . . . . . . .
366.9
1,467.8
366.9
2,201.6
Office equipment . . . . . . . . . . . . . . . . . .
0.4
1.1
-
1.5
Other operating leases . . . . . . . . . . . . . . .
47.2
56.8
6.6
110.6
414.5
1,525.7
373.5
2,313.7
35.2
Sports and marketing contracts . . . . . . . . .
189.9
131.2
-
321.1
35.3
Finance lease building . . . . . . . . . . . . . .
93.5
-
-
93.5
35.4
License fees
Network operators in the Group pay monthly license fees based on their net operational income as defined in the
license agreement. Net operational income is defined as the total invoiced revenue of the licensee excluding discounts,
Value-Added Taxation and other direct taxes derived from customers of the licensee for the provision to them of the
service, less net interconnect fees and bad debts actually incurred.
2000
2001
2002
Rm
Rm
Rm
36.
CONTINGENT LIABILITIES
36.1
Globalstar Southern Africa (Proprietary) Limited
An invoice amounting to R34.0 million was raised and issued to
Globalstar Southern Africa (Proprietary) Limited on May 22, 2001,
for services rendered at the earth station in Delareyville, over a
period of 26 months. The invoice was under dispute as no formal
agreement was in place with the supplier, Telkom SA Limited, for
those services rendered. Globalstar Southern Africa (Proprietary)
Limited and Telkom SA Limited reached an agreement during the
course of the year whereby an invoice of R22.8 million, inclusive
of VAT, was issued and paid in December 2001 (Note 3) . . . . . .
34.
0
The functionality of the Gateway assets is under dispute and
Globalstar Southern Africa (Proprietary) Limited and Vodafone
Satellite Services Limited do not recognise the liability to
Globalstar LP. This amount has been written back to income as the
success of this claim is deemed to be remote (Note 3) . . . . . . .
15.0
36.
2
Legal matters . . . . . . . . . . . . . . . . . . . . . . . . . . . .
5.0

F160
VODACOM GROUP (PROPRIETARY) LIMITED
NOTES TO THE CONSOLIDATED FINANCIAL STATEMENTS
for the three years ended March 31, 2002
36.
CONTINGENT LIABILITIES (continued)
36.3
Vodacom Congo (R.D.C.) S.P.R.L.
The Group has a 51% equity interest in Vodacom Congo (R.D.C.) S.P.R.L., ("Vodacom Congo"), which commencedbusiness on December 11, 2001. This investment is governed by a shareholders' agreement which provides the
minority shareholder certain protective and participating rights. In terms of IAS 31: "Accounting for interest in Joint
Ventures", Vodacom Congo may not be consolidated as a subsidiary as it is considered to be a joint venture and has
been proportionally consolidated in the financial statements at March 31, 2002.
The Group, in terms of the shareholders' agreement, is however ultimately responsible for the funding of the
operations of Vodacom Congo. The shareholders' agreement also gives the Group the right to appoint management and
the majority of the board of the company. The Group also has a management agreement to manage the company on a
day-to-day basis. Currently Vodacom Congo is incurring losses which are expected to increase into the foreseeable
future. The 49% portion attributable to the joint venture partner of the liabilities and losses as at March 31, 2002 were
as follows:
2002
Rm
Losses . . . . . . . . . . . . . . . . . . . . . . . . . . . . . . . . . . . . . . . . . . . . . . . .
(19.3)
Liabilities . . . . . . . . . . . . . . . . . . . . . . . . . . . . . . . . . . . . . . . . . . . . . . .
(29.7)
Furthermore, the following guarantees were approved/issued by the Group in respect of Vodacom Congo subsequent to
the balance sheet date:
Company
Details
Beneficiary
Date
Euro
US$
issued
Mil
Mil
Approved and issued:
Congo (R.D.C.) S.P.R.L.
Guarantee Alcatel C.I.T.,
ABSA Bank
May 8, 2002
32.6
29.8
Alcatel Space Industries and Limited
Alcatel Altech Telecoms
(Pty) Ltd. ("Alcatel")Approved not issued:
Congo (R.D.C.) S.P.R.L.
Guarantees not yet issued
ABSA Bank
-
51.2
Limited
36.4
Negative working capital ratio
For financial years ended 2000, 2001 and 2002 the Group had a negative working capital ratio. A negative working
capital ratio arises when the Group's current liabilities are greater than the current assets. The Group's management
believes that based on its operating cash flow, it will be able to meet liabilities as they arise and that it is in compliance
with all covenants contained in borrowing agreements.
37.
RETIREMENT BENEFITS
All eligible employees of the Group and wholly-owned subsidiaries are members of the Vodacom Group Pension Fund, a
defined contribution pension scheme. Executive employees of the Group company and wholly-owned subsidiaries also have
the option to be members to the Vodacom Group Executive Provident Fund, a defined contribution provident scheme. Both
schemes are administered by ABSA Consultants and Actuaries (Proprietary) Limited. Current contributions to the pension
fund amounted to R42.8 million (2001: R42.5 million, 2000: R29.8 million). Current contributions to the provident fund
amounted to R1.1 million (2001: nil, 2000: nil). South African funds are governed by the Pension Funds Act of 1956.
F161
VODACOM GROUP (PROPRIETARY) LIMITED
NOTES TO THE CONSOLIDATED FINANCIAL STATEMENTS
for the three years ended March 31, 2002
2000
2001
2002
Rm
Rm
Rm
38.
RELATED PARTY TRANSACTIONS
38.1
Balances with related parties (not disclosed elsewhere)
Included in accounts receivable:
Telkom SA Limited interconnect . . . . . . . . . . . .
481.0
516.4
529.4
Telkom SA Limited other . . . . . . . . . . . . . . . .
-
13.8
14.1
Vodafone Group Plc . . . . . . . . . . . . . . . . . . . .
15.7
1.0
1.6
Included in accounts payable:
Telkom SA Limited . . . . . . . . . . . . . . . . . . . .
50.4
50.1
78.2
Telkom SA Limited other . . . . . . . . . . . . . . . .
-
-
3.0
Vodafone Group plc . . . . . . . . . . . . . . . . . . . .
11.6
0.8
-
38.2
Transactions with related parties
Telkom SA Limited . . . . . . . . . . . . . . . . . . . .
1,689.4
1,939.3
2,154.6
Interconnect income . . . . . . . . . . . . . . . . . .
2,405.9
2,729.1
2,942.5
Customer billing . . . . . . . . . . . . . . . . . . . .
-
43.4
24.1
Interest paid commercial . . . . . . . . . . . . . . .
-
-
0.4
Lease of transmission lines . . . . . . . . . . . . . . .
(287.5)
(321.1)
(336.0)
Interconnect fees . . . . . . . . . . . . . . . . . . . .
(276.5)
(297.0)
(305.7)
Interest payments on shareholder loan . . . . . . . . .
(101.1)
(78.9)
(72.1)
Telephone landline usage . . . . . . . . . . . . . . . .
(11.7)
(20.4)
(34.6)
Installation of transmission lines . . . . . . . . . . . .
(36.4)
(34.3)
(32.7)
Management fees . . . . . . . . . . . . . . . . . . . .
-
-
(20.0)
Site costs . . . . . . . . . . . . . . . . . . . . . . . .
(3.3)
(6.5)
(11.3)
Shareholder loan repayment . . . . . . . . . . . . . .
-
(75.0)
-
Vodafone Group Plc . . . . . . . . . . . . . . . . . . . .
(28.6)
(70.2)
(25.5)
Roaming income (transacted within the
Vodafone Group) . . . . . . . . . . . . . . . . . . . .
18.9
24.1
27.4
Roaming expense (transacted within the
Vodafone Group) . . . . . . . . . . . . . . . . . . . .
(15.1)
(24.6)
(33.4)
Interest payments on shareholder loan . . . . . . . . .
(32.4)
(22.4)
(19.5)
Shareholder loan repayment . . . . . . . . . . . . . .
-
(47.3)
-
Vodafone Holdings (SA) (Proprietary) Limited:
Interest payments on shareholder loan . . . . . . . . . .
(31.2)
(27.3)
(26.0)
VenFin Finansieringskorporasie (Proprietary) Limited . .
(27.3)
(81.1)
(56.8)
Interest payments on shareholder loan . . . . . . . . .
(27.3)
(21.3)
(19.5)
Interest payments on overdraft account . . . . . . . .
-
(39.6)
(37.3)
Shareholder loan repayment . . . . . . . . . . . . . .
-
(20.2)
-
Descarte Investments No. 8 (Proprietary) Limited . . . .
(10.1)
(15.4)
(7.2)
Interest payments on shareholder loan . . . . . . . . .
(10.1)
(7.9)
(7.2)
Shareholder loan repayment . . . . . . . . . . . . . .
-
(7.5)
-
Transactions with related parties are priced at prevailing market rates.
39.
FINANCIAL INSTRUMENTS AND RISK MANAGEMENT
The Group purchases or issues financial instruments in order to finance its operations and to manage the interest rate and
currency risks that arise from those operations and from its sources of finance. Various financial balances for example trade
debtors, trade creditors, accruals and prepayments, and provisions, arise directly from the Group's operations. Changing
market conditions expose the Group to various financial risks and have highlighted the importance of financial risk
management as an element of control for the Group. Principal financial risks faced in the normal course of the Group's
business are foreign currency rate risk, interest rates risk, credit risk, and liquidity risk.

F162
VODACOM GROUP (PROPRIETARY) LIMITED
NOTES TO THE CONSOLIDATED FINANCIAL STATEMENTS
for the three years ended March 31, 2002
39.
FINANCIAL INSTRUMENTS AND RISK MANAGEMENT (continued)
The Group finances its operations through a mixture of retained profits, bank borrowings and long-term loans. Long-term
financing is arranged locally by the South African entities. A treasury division within Vodacom Group (Proprietary) Limited
has been established to provide treasury related services within the Group, including co-ordinating access to domestic and
international financial markets, and the managing of various financial risks relating to the Group's operations.
The Group utilises derivative instruments, the objective of which is to reduce exposure to fluctuations in foreign currency
rates and interest rates, and to manage the liquidity of cash resources within the Group. Trading in derivative instruments for
speculative purposes is strictly prohibited.
Group treasury policies, risk limits, and control procedures are continuously monitored by management and the board of
directors, through the Audit Committee, the objective being to minimise exposure to foreign currency, interest rate, credit risk
and liquidity risk. These risks are managed within an approved treasury policy.
39.1
Foreign currency management
The Group enters into foreign exchange contracts to buy specified amounts of various foreign currencies in the future
at a predetermined exchange rate. The contracts are entered into in order to manage the Group's exposure to
fluctuations in foreign currency exchange rates on specific transactions. The contracts are matched with anticipated
future cash flows in foreign currencies primarily from purchases of capital equipment. The Group's policy is to enter
into foreign exchange contracts for 100% of the committed net foreign currency payments.
The Group has entered into numerous foreign exchange contracts to cover foreign capital commitments in respect of
future imports of GSM infrastructure. The total value of foreign exchange contracts at year-end was:
Forward contracts to buy foreign currency
Foreign
Forward value
Fair value
contract value
Mil
Rm
Rm
2000
United States Dollar . . . . . . . . . . . . . . . . . . . .
87.6
576.7
7.3
Deutschmark . . . . . . . . . . . . . . . . . . . . . . . .
188.3
615.3
(2.0)
Euro . . . . . . . . . . . . . . . . . . . . . . . . . . . .
26.4
167.4
1.8
Pound Sterling . . . . . . . . . . . . . . . . . . . . . . .
2.5
26.2
(0.4)
Swedish Krona . . . . . . . . . . . . . . . . . . . . . .
1.1
0.8
-
1,386.4
6.7
2001
United States Dollar . . . . . . . . . . . . . . . . . . . .
130.2
995.0
68.4
Deutschmark . . . . . . . . . . . . . . . . . . . . . . . .
90.2
322.7
8.9
Euro . . . . . . . . . . . . . . . . . . . . . . . . . . . .
41.3
300.2
(0.1)
Pound Sterling . . . . . . . . . . . . . . . . . . . . . . .
0.9
10.9
0.1
Swedish Krona . . . . . . . . . . . . . . . . . . . . . .
1.7
1.3
-
Swiss Franc . . . . . . . . . . . . . . . . . . . . . . . .
0.1
0.6
-
1,630.7
77.3
2002
United States Dollar . . . . . . . . . . . . . . . . . . . .
102.6
1,099.4
119.0
Euro . . . . . . . . . . . . . . . . . . . . . . . . . . . .
134.8
1,285.6
95.7
Pound Sterling . . . . . . . . . . . . . . . . . . . . . . .
0.2
2.6
(0.1)
2,387.6
214.6
Forward value represents the foreign contract value multiplied by the contracted forward contract rate.

F163
VODACOM GROUP (PROPRIETARY) LIMITED
NOTES TO THE CONSOLIDATED FINANCIAL STATEMENTS
for the three years ended March 31, 2002
39.
FINANCIAL INSTRUMENTS AND RISK MANAGEMENT (continued)
39.1
Foreign currency management (continued)
Forward contracts to sell foreign currency
Foreign
Forward value
Fair value
contract value
Mil
Rm
Rm
2000
United States Dollar . . . . . . . . . . . . . . . . . . . .
1.9
11.9
(0.1)
Euro . . . . . . . . . . . . . . . . . . . . . . . . . . . .
-
-
-
Deutschmark . . . . . . . . . . . . . . . . . . . . . . . .
0.6
2.0
-
13.9
(0.1)
2001
United States Dollar . . . . . . . . . . . . . . . . . . . .
1.6
12.4
(0.6)
Euro . . . . . . . . . . . . . . . . . . . . . . . . . . . .
1.2
9.3
-
Deutschmark . . . . . . . . . . . . . . . . . . . . . . . .
14.0
52.1
0.3
73.8
(0.3)
2002
United States Dollar . . . . . . . . . . . . . . . . . . . .
3.6
42.7
0.7
Euro . . . . . . . . . . . . . . . . . . . . . . . . . . . .
6.1
63.3
0.3
Pound Sterling . . . . . . . . . . . . . . . . . . . . . . .
0.1
1.0
-
107.0
1.0
Forward value represents the foreign contract value multiplied by the contracted forward contract rate.
39.2
Interest rate risk management
The Group has entered into interest rate swap contracts that entitle, or oblige, it to receive interest at fixed rate on
notional principal amounts and entitle, or oblige, it to pay interest at floating rates on the same notional principal
amounts. The interest rate swaps allow the Group to swap long-term debt from fixed rates into floating rates that are
lower, or higher, than those available if it had borrowed at fixed floating rates directly. Under the interest rates swaps,
the Group agrees with other parties to exchange, at specified quarterly intervals, the difference between fixed rate and
floating rate interest amounts calculated by reference to the agreed notional principal amounts.
At balance sheet dates the Group had two interest rate swaps:
Vodacom Group (Proprietary) Limited the Group swapped its fixed interest rate of 14.9% (2001: 14.9%, 2000:
14.9%) NACQ (Nominal Amount Compounded Quarterly) for a floating rate, linked to the BA (Banker's
Acceptance) rate plus margin of 2.00%.
Vodacom (Proprietary) Limited the Company swapped its fixed interest rate of 20.1% (2001: 20.1%, 2000:
20.1%) NACQ (Nominal Amount Compounded Quarterly) for a floating rate linked to the BA (Banker's
Acceptance) rate plus margin of 2.25%.
2000
2001
2002
Rm
Rm
Rm
Fair value of interest rate swap asset . . . . . . . . .
11.7
17.2
9.4
The fair value of the interest rate swap asset is represented by a notional principal amount of R148.8 million
(2001: R146.9 million, 2000: R142.8 million) at a floating interest rate of between 12.1% and 12.6% (2001: 12.6%,
2000: 11.8%).
39.3
Credit risk management
Financial assets, which potentially subject the Group to concentrations of credit risk, consist principally of cash, short-
term deposits and trade receivables. The Group's cash and cash equivalents and short-term deposits are placed with
high credit quality financial institutions. Trade receivables are presented net of an allowance for doubtful receivables.
Credit risk with respect to trade receivables is limited due to the large number of customers comprising the Group's
customer base and stringent credit approval processes for contracted subscribers.
The Group does not have any significant exposure to any individual customer or counter-party, except commercially to
Telkom SA Limited (the Group's largest shareholder), Mobile Telecommunications Network (Proprietary) Limited, the
Group's largest competitor, and Cell-C (Proprietary) Limited, the country's third network operator.

F164
VODACOM GROUP (PROPRIETARY) LIMITED
NOTES TO THE CONSOLIDATED FINANCIAL STATEMENTS
for the three years ended March 31, 2002
39.
FINANCIAL INSTRUMENTS AND RISK MANAGEMENT (continued)
39.3
Credit risk management (continued)
With respect to the forward exchange contracts, the Group's exposure is on the full amount of the foreign currency
payable on settlement. The Group minimises such risk by limiting the counter-parties to a group of major international
banks and does not expect to incur any losses as a result of non-performance by these counter-parties. The positions in
respect of these counter-parties are closely monitored.
The carrying amounts of financial assets included in the consolidated balance sheet represent the Group's exposure to
credit risk in relation to these assets. The credit exposure of forward exchange contracts is represented by the fair
value of the contracts.
39.4
Liquidity risk management
The Group is exposed to liquidity risk as a result of uncertain debtor related cash flows as well as capital commitments
of the Group. In terms of its borrowing requirements, the Group ensures that adequate funds in all currencies are
available to meet its expected and unexpected financial commitments through utilisation of undrawn borrowing
facilities (Note 40). In terms of its long-term liquidity risk, a reasonable balance is maintained between the period over
which assets generate funds and the period over which the respective assets are funded.
39.5
Fair value of financial instruments
At balance sheet date, the carrying amounts of cash and short-term deposits, accounts receivables, accounts payable
and accrued expenses and short-term debt approximated their fair values due to the short-term maturities of these
assets and liabilities.
The fair value of forward exchange contracts and interest rate swaps are determined, using quoted prices or, where
such prices are not available, discounted cash flow analysis is used. These amounts reflect the approximate values of
the derivative positions at balance sheet date.
40.
UNDRAWN BORROWING FACILITIES AND GUARANTEES
The Group has a twelve-month revolving credit facility of R3,327.6 million with R1,913.1 million unutilised at March 31,
2002. The facilities expiring within one year are of a general banking nature and thus subject to review at various dates
(usually on an annual basis), and it is expected that this profile will continue relative to core working capital and seasonal
peak borrowing requirements. Foreign currency term facilities are predominantly US Dollar-based, at various maturities and
are utilised for bridging and short-term working capital needs. All other loans with external financial institutions are linked to
the prime overdraft rate.
Companies within the Group have provided the following guarantees:
Company
Details
Beneficiary
2000
2001
2002
Rm
Rm
Rm
Vodacom (Proprietary)
All guarantees less than R0.2 million Various
1.9
1.9
1.9
Limited
in terms of various lease agreements
Vodacom (Proprietary)
Electricity supply
Eskom
1.0
1.0
1.0
Limited
Vodacom (Proprietary)
Standby letters of credit *
Alcatel CIT
153.2
36.2
299.9
Limited
Vodacom Service
All guarantees less than R0.1 million Various
0.4
0.4
0.4
Provider Company
in terms of various lease agreements
(Proprietary) Limited
Vodacom Service
Electricity supply
Midrand Town
1.0
1.0
1.0
Provider Company
Council
(Proprietary) Limited
157.5
40.5
304.2
* Amounts drawn on the standby letters of credit amounting to R98.4 million for 2002 and R13.7 million for 2001 are included as liabilities
in the balance sheet.
Vodacom Group (Proprietary) Limited has provided a letter of support to the Standard Bank Group for credit facilities
comprising short-term loans of US$15 million and US$32 million provided to Vodacom Tanzania Limited.
Vodacom (Proprietary) Limited provides an unlimited guarantee for borrowings entered into by Vodacom Group (Proprietary)
Limited.
F165
VODACOM GROUP (PROPRIETARY) LIMITED
NOTES TO THE CONSOLIDATED FINANCIAL STATEMENTS
for the three years ended March 31, 2002
41.
SEGMENTAL INFORMATION
The Group is primarily an integrated mobile telecommunication and data communication business located in South Africa
but does have businesses in other African countries. The primary reporting format therefore comprises the business segments
of the Group.
Unallo-
Networks
Service Other
Elimi-
Total
cated
providers
nations
Rm
Rm
Rm
Rm
Rm
Rm
2000
BUSINESS SEGMENTS
Segment revenue . . . . . . . . .
80.1
8,213.7
4,245.8
26.4
(2,994.4)
9,571.6
External . . . . . . . . . . . . -
5,345.3
4,218.0
8.3
-
9,571.6
Inter-segment . . . . . . . . .
80.1
2,868.4
27.8
18.1
(2,994.4)
-
Segment profit/(loss) from
operations . . . . . . . . . . . . .
36.2
2,328.9
80.0
5.1
(86.9)
2,363.3
Interest and dividends received . .
32.0
Finance costs . . . . . . . . . . .
(567.2)
Profit before taxation . . . . . . .
1,828.1
Included in segment profit/(loss)
from operations
Depreciation and amortisation . .
(0.8)
(1,004.3)
(71.9)
(0.2)
(21.7)
(1,098.9)
Property, plant and equipment .
(0.8)
(997.6)
(26.7)
(0.2)
-
(1,025.3)
Intangible assets . . . . . . . .
-
(6.7)
(45.2)
-
(21.7)
(73.6)
Bad debts written-off . . . . . . .
-
-
(16.5)
-
-
(16.5)
Integration costs, disposals of
operations and impairments . . .
-
-
-
-
129.3
129.3
Capital expenditure . . . . . . . .
(6.2)
(1,966.1)
(59.1)
(1.1)
-
(2,032.5)
Assets . . . . . . . . . . . . . . .
3,281.6
7,644.9
1,519.4
20.0
(2,747.9)
9,863.8
Segment assets . . . . . . . . .
3,281.6
7,644.9
1,519.4
20.0
(2,747.9)
9,718.0
Deferred taxation assets . . . .
-
-
-
-
-
145.8
Liabilities . . . . . . . . . . . . .
(2,367.1)
(4,087.1)
(895.5)
(15.7)
1,186.2
(7,194.9)
Segment liabilities . . . . . . .
(2,367.1)
(4,087.1)
(895.5)
(15.7)
1,186.2
(6,179.2)
Deferred tax liabilities . . . . .
-
-
-
-
-
(455.6)
Taxation liabilities . . . . . . .
-
-
-
-
-
(560.1)
Dividends payable . . . . . . .
-
-
-
-
-
-
F166
VODACOM GROUP (PROPRIETARY) LIMITED
NOTES TO THE CONSOLIDATED FINANCIAL STATEMENTS
for the three years ended March 31, 2002
41.
SEGMENTAL INFORMATION (continued)
Unallo-
Networks
Service Other
Elimi-
Total
cated
providers
nations
Rm
Rm
Rm
Rm
Rm
Rm
2001
BUSINESS SEGMENTS
Segment revenue . . . . . . . . .
106.3
10,728.2
6,554.3
332.7
(4,445.1)
13,276.4
External . . . . . . . . . . . .
-
6,553.2
6,417.3
305.9
-
13,276.4
Inter-segment . . . . . . . . .
106.3
4,175.0
137.0
26.8
(4,445.1)
-
Segment (loss)/profit from
operations . . . . . . . . . . . . .
(182.8)
2,755.4
13.1
(55.9)
23.6
2,553.4
Interest and dividends received . .
25.4
Finance costs . . . . . . . . . . .
(504.5)
Profit before taxation . . . . . . .
2,074.3
Included in segment (loss)/profit
from operations
Depreciation and amortisation . .
(2.1)
(1,287.5)
(92.0)
(53.8)
(200.2)
(1,635.6)
Property, plant and equipment .
(2.1)
(1,280.4)
(35.2)
(46.4)
-
(1,364.1)
Intangible assets . . . . . . . .
-
(7.1)
(56.8)
(7.4)
(200.2)
(271.5)
Bad debts written-off . . . . . . .
-
-
(107.4)
-
-
(107.4)
Integration costs, disposals of
operations and impairments . . .
(165.0)
(50.3)
(173.4)
(42.1)
217.6
(213.2)
Capital expenditure . . . . . . . .
(5.3)
(3,096.4)
(80.4)
(33.5)
31.4
(3,184.2)
Assets . . . . . . . . . . . . . . .
3,292.8
9,831.3
1,557.7
262.1
(2,941.2)
12,341.8
Segment assets . . . . . . . . .
3,292.8
9,831.3
1,557.7
262.1
(2,941.2)
12,002.7
Deferred taxation asset . . . .
-
-
-
-
-
339.1
Liabilities . . . . . . . . . . . . .
(1,418.2)
(5,423.2)
(1,313.5)
(107.8)
1,316.8
(8,847.2)
Segment liabilities . . . . . . .
(1,418.2)
(5,423.2)
(1,313.5)
(107.8)
1,316.8
(6,945.9)
Deferred taxation liability . . .
-
-
-
-
-
(607.5)
Taxation liability . . . . . . . .
-
-
-
-
-
(810.0)
Dividends payable . . . . . . .
-
-
-
-
-
(483.8)

F167
VODACOM GROUP (PROPRIETARY) LIMITED
NOTES TO THE CONSOLIDATED FINANCIAL STATEMENTS
for the three years ended March 31, 2002
41.
SEGMENTAL INFORMATION (continued)
Unallo-
Networks
Service Other
Elimi-
Total
cated
providers
nations
Rm
Rm
Rm
Rm
Rm
Rm
2002
BUSINESS SEGMENTS
Segment revenue . . . . . . . . .
13,898.2
7,121.4
311.6
(5,180.5)
16,150.7
External . . . . . . . . . . . .
9,001.4
6,900.1
249.2
-
16,150.7
Inter-segment . . . . . . . . .
4,896.8
221.3
62.4
(5,180.5)
-
Segment (loss)/profit
from operations . . . . . . . . . .
(85.0)
3,446.2
343.6
(32.6)
(51.1)
3,621.1
Interest and dividends received . .
32.0
Finance costs . . . . . . . . . . .
(59.8)
Profit before taxation . . . . . . .
3,593.3
Included in segment (loss)/profit
from operations
Depreciation and amortisation . .
(2.3)
(1,774.0)
(66.3)
(31.9)
(195.5)
(2,070.0)
Property, plant and equipment .
(2.3)
(1,762.6)
(60.7)
(31.7)
-
(1,857.3)
Intangible assets . . . . . . . .
-
(11.4)
(5.6)
(0.2)
(195.5)
(212.7)
Bad debts written-off . . . . . . .
-
-
(111.2)
-
-
(111.2)
Integration costs, disposals of
operations and impairments . . .
(109.9)
45.5
(3.5)
(20.0)
144.3
56.4
Capital expenditure . . . . . . . .
(36.1)
(3,660.2)
(562.4)
(21.7)
1.4
(4,279.0)
Assets . . . . . . . . . . . . . . .
4,737.3
12,976.0
2,466.5
679.7
(5,998.6)
15,358.6
Segment assets . . . . . . . . .
4,737.3
12,976.0
2,466.5
679.7
(5,998.6)
14,860.9
Deferred taxation assets . . . .
-
-
-
-
-
497.7
Liabilities . . . . . . . . . . . . .
(2,427.0)
(6,389.1)
(2,103.7)
(139.8)
3,053.2
(9,884.2)
Segment liabilities . . . . . . .
(2,427.0)
(6,389.1)
(2,103.7)
(139.8)
3,053.2
(8,006.4)
Deferred tax liabilities . . . . .
-
-
-
-
-
(926.2)
Taxation liabilities . . . . . . .
-
-
-
-
-
(351.6)
Dividends payable . . . . . . .
-
-
-
-
-
(600.0)
"Unallocated" comprises the reporting relevant to Vodacom Group (Proprietary) Limited the parent company in the Group,
which is primarily an investment holding company, but also offers combined administrative and shared-function services to
companies within the Group.
"Networks" comprise services provided by cellular networks within South Africa and other African countries. Services
offered by the companies include the standard voice telecommunication services of cellular networks as well as data
communication services through the cellular network, including short message servicing ("SMS") and wireless applicationprotocol ("WAP")."Service providers" comprise services provided by cellular telecommunication, satellite telecommunication and Internet
service providers within South Africa. Cellular and satellite telecommunication service providers purchase bulk airtime from
their respective networks and sell this on to their customer base. Internet service providers provide their customer base access
to the World Wide Web. The internet service provider was disposed on November 30, 2001.
"Other" comprises of other business lines of the Group, including the providing of promotion and event services as well as
providing television rental and related rental services, neither of which fall within the Group's strategic focus nor do they
constitute a separately reportable segment. The promotion and event service business, and the rental service business were
disposed on February 27, 2002 and March 31, 2002, respectively.
F168
VODACOM GROUP (PROPRIETARY) LIMITED
NOTES TO THE CONSOLIDATED FINANCIAL STATEMENTS
for the three years ended March 31, 2002
41.
SEGMENTAL INFORMATION (continued)
South Africa
Other African
Eliminations
Total
countries
Rm
Rm
Rm
Rm
2000
GEOGRAPHICAL SEGMENTS
Segment revenue . . . . . . . . . . . . . .
9,539.3
38.0
(5.7)
9,571.6
External . . . . . . . . . . . . . . . . . .
9,533.6
38.0
-
9,571.6
Inter-segment . . . . . . . . . . . . . . .
5.7
-
(5.7)
-
Segment profit/(loss) from operations . . .
2,357.1
6.2
-
2,363.3
Interest and dividends received . . . . . . .
32.0
Finance costs . . . . . . . . . . . . . . . .
(567.2)
Profit before taxation . . . . . . . . . . . .
1,828.1
Included in segment profit/(loss) from
operations
Depreciation and amortisation . . . . . . .
(1,091.8)
(7.1)
-
(1,098.9)
Property, plant and equipment . . . . . .
(1,018.2)
(7.1)
-
(1,025.3)
Intangible assets . . . . . . . . . . . . .
(73.6)
-
-
(73.6)
Bad debts written-off . . . . . . . . . . . .
(16.5)
-
-
(16.5)
Integration costs, disposals of operations
and impairments . . . . . . . . . . . . . . .
129.3
-
-
129.3
Capital expenditure . . . . . . . . . . . . .
(2,011.1)
(21.4)
-
(2,032.5)
Assets . . . . . . . . . . . . . . . . . . . .
9,656.7
72.8
(11.5)
9,863.8
Segment assets . . . . . . . . . . . . . .
9,656.7
72.8
(11.5)
9,718.0
Deferred tax assets . . . . . . . . . . . .
145.8
Liabilities . . . . . . . . . . . . . . . . . .
(6,175.2)
(15.5)
11.5
(7,194.9)
Segment liabilities . . . . . . . . . . . .
(6,175.2)
(15.5)
11.5
(6,179.2)
Deferred taxation liabilities . . . . . . .
-
-
-
(455.6)
Taxation liabilities . . . . . . . . . . . .
-
-
-
(560.1)
Dividends payable . . . . . . . . . . . .
-
-
-
F169
VODACOM GROUP (PROPRIETARY) LIMITED
NOTES TO THE CONSOLIDATED FINANCIAL STATEMENTS
for the three years ended March 31, 2002
41.
SEGMENTAL INFORMATION (continued)
South Africa
Other African
Eliminations
Total
countries
Rm
Rm
Rm
Rm
2001
GEOGRAPHICAL SEGMENTS
Segment revenue . . . . . . . . . . . . . .
13,208.0
184.4
(116.0)
13,276.4
External . . . . . . . . . . . . . . . . . .
13,092.0
184.4
-
13,276.4
Inter-segment . . . . . . . . . . . . . . .
116.0
-
(116.0)
-
Segment profit/(loss) from operations . . .
2,583.3
(31.6)
1.7
2,553.4
Interest and dividends received . . . . . . .
25.4
Finance costs . . . . . . . . . . . . . . . .
(504.5)
Profit before taxation . . . . . . . . . . . .
2,074.3
Included in segment profit/(loss)
from operations
Depreciation and amortisation . . . . . . .
(1,596.6)
(34.7)
(4.3)
(1,635.6)
Property, plant and equipment . . . . . .
(1,329.8)
(34.3)
-
(1,364.1)
Intangible assets . . . . . . . . . . . . .
(266.8)
(0.4)
(4.3)
(271.5)
Bad debts written-off . . . . . . . . . . . .
(107.4)
-
-
(107.4)
Integration costs, disposals of operations
and impairments . . . . . . . . . . . . . . .
(213.2)
-
-
(213.2)
Capital expenditure . . . . . . . . . . . . .
(2,861.6)
(354.0)
31.4
(3,184.2)
Assets . . . . . . . . . . . . . . . . . . . .
11,515.3
470.2
17.2
12,341.8
Segment assets . . . . . . . . . . . . . .
11,515.3
470.2
17.2
12,002.7
Deferred taxation asset . . . . . . . . . .
-
-
-
339.1
Liabilities . . . . . . . . . . . . . . . . . .
(6,525.8)
(396.4)
(23.7)
(8,847.2)
Segment liabilities . . . . . . . . . . . .
(6,525.8)
(396.4)
(23.7)
(6,945.9)
Deferred taxation liability . . . . . . . .
-
-
-
-(607.5)
Taxation liability . . . . . . . . . . . . .
-
-
-
(810.0)
Dividends payable . . . . . . . . . . . .
-
-
-
(483.8)
F170
VODACOM GROUP (PROPRIETARY) LIMITED
NOTES TO THE CONSOLIDATED FINANCIAL STATEMENTS
for the three years ended March 31, 2002
41.
SEGMENTAL INFORMATION (continued)
South Africa
Other African
Eliminations
Total
countries
Rm
Rm
Rm
Rm
2002
GEOGRAPHICAL SEGMENTS
Segment revenue . . . . . . . . . . . . . .
15,415.4
740.4
(5.1)
16,150.7
External . . . . . . . . . . . . . . . . . .
15,410.3
740.4
-
16,150.7
Inter-segment . . . . . . . . . . . . . . .
5.1
-
(5.1)
-
Segment profit/(loss) from operations . . .
3,545.7
81.5
(6.1)
3,621.1
Interest and dividends received . . . . . . .
32.0
Finance costs
(59.8)
Profit before taxation
3,593.3
Included in segment profit/(loss)
from operations
Depreciation and amortisation . . . . . . .
(1,939.2)
(124.7)
(6.1)
(2,070.0)
Property, plant and equipment . . . . . .
(1,737.2)
(120.1)
-
(1,857.3)
Intangible assets . . . . . . . . . . . . .
(202.0)
(4.6)
(6.1)
(212.7)
Bad debts written-off . . . . . . . . . . . .
(111.2)
-
-
(111.2)
Integration costs, disposals of operations
and impairments . . . . . . . . . . . . . . .
56.4
-
-
56.4
Capital expenditure . . . . . . . . . . . . .
(3,292.0)
(988.4)
1.4
(4,279.0)
Assets . . . . . . . . . . . . . . . . . . . .
13,179.1
1,787.5
(105.7)
15,358.6
Segment assets . . . . . . . . . . . . . .
13,179.1
1,787.5
(105.7)
14,860.9
Deferred tax assets . . . . . . . . . . . .
-
-
-
497.7
Liabilities . . . . . . . . . . . . . . . . . .
(7,152.6)
(945.1)
91.3
(9,884.2)
Segment liabilities . . . . . . . . . . . .
(7,152.6)
(945.1)
91.3
(8,006.4)
Deferred taxation liabilities . . . . . . .
-
-
-
(926.2)
Taxation liabilities . . . . . . . . . . . .
-
-
-
(351.6)
Dividends payable . . . . . . . . . . . .
-
-
-
(600.0)
"South Africa", which is also the home country of the parent, comprises the segment information relating to the South
African-based cellular network as well as all the segment information of the service providers and other business segments.
"Other African countries" comprise of only cellular networks and are located in Tanzania, Lesotho and the Democratic
Republic of Congo.
ACCOUNTING POLICIES AND BASIS OF PREPARATION
Segment information is prepared in conformity with accounting policies adopted for preparing and presenting the
consolidated financial statements.
Segment revenue excludes value-added taxation and includes inter-Group revenue. Net revenue represents segment revenue
from which inter-Group revenue has been eliminated. Sales between segments are made on a commercial basis. Segment
profit/(loss) from operations represents segment revenue less segment operating expenses. Segment expenses include direct
and operating expenses. Integration costs, disposals or operations and impairments, depreciation and amortisation have been
allocated to the segments to which they relate.
The segment assets and liabilities comprise all assets and liabilities of the different segments including those relating to
operating, investing and financing activities. Unallocated assets and liabilities comprise of deferred taxation and other
unallocatable balances.
Capital expenditure in property, plant and equipment and intangible assets have been allocated to the segments to which they
relate.

F171
VODACOM GROUP (PROPRIETARY) LIMITED
NOTES TO THE CONSOLIDATED FINANCIAL STATEMENTS
for the three years ended March 31, 2002
42.
INTEREST IN SUBSIDIARIES
The information discloses interests in subsidiaries material to the financial position of the Group.
The interest in the ordinary share capital is representative of the voting power.
Issued share capital
Interest in issued
ordinary share capital
Country of
incorporation
2000
2001
2002
2000
2001
2002
%
%
%
Cellular network operators
Vodacom (Proprietary) Limited .
RSA
R100
R100
R100
100
100
100
Vodacom Lesotho (Proprietary)
Limited . . . . . . . . . . . . . .
LES
-
M4,180
M4,180
-
88,3
88,3
Vodacom Tanzania Limited . . . .
TZN
-
US$100
US$100
-
65
65
Service providers
Vodacom Service Provider
Holding Company (Proprietary)
Limited (INV) . . . . . . . . . .
RSA
R1,020
R1,020
R1,020
100
100
100
Vodacom Service Provider
Company (Proprietary)
Limited (C) . . . . . . . . . . . .
RSA
R20
R20
R20
100
100
100
Globalstar Southern Africa
(Proprietary) Limited (S) * . . . .
RSA
-
R100
R100
-
100
100
Vodac (Proprietary) Limited * . .
RSA
R1
R1
R1
100
100
100
GSM Cellular (Proprietary)
Limited * . . . . . . . . . . . . .
RSA
R1200
R1,200
R1,200
100
100
100
Other
Teljoy Holdings Limited (INV) .
RSA
R1,160,000
R158,999
R158,999
100
100
100
Film Fun (Holdings)
(Proprietary) Limited (TV) . . . .
RSA
R100
R100
-
100
100
-
Vodacom Sport & Entertainment
(Proprietary) Limited (SE) . . . .
RSA
R100
-
-
51
-
Vodacom Equipment Company
(Proprietary) Limited * . . . . . .
RSA
R100
R100
R100
100
100
100
Vodacare (Proprietary) Limited * .
RSA
R100
R100
R100
100
100
100
Vodacom International
Holdings (Proprietary)
Limited (INV) . . . . . . . . . .
RSA
-
-
R100
-
-
100
Vodacom International
Limited (INV) . . . . . . . . . .
MAU
-
-
US$100
-
-
100
* Dormant at March 31, 2002.
RSA Republic of South Africa; TZN Tanzania; LES Lesotho; MAU Mauritius; C Cellular; S Satellite; SE Sport
and entertainment contracts manager; TV Television and related rental services; INV Investment holding company.

F172
VODACOM GROUP (PROPRIETARY) LIMITED
NOTES TO THE CONSOLIDATED FINANCIAL STATEMENTS
for the three years ended March 31, 2002
43.
INTEREST IN JOINT VENTURES
The Group's joint ventures during the 2002 financial year included Vodacom World Online (Proprietary) Limited and
Vodacom Congo (R.D.C.) S.P.R.L. Effective November 30, 2001, the Group disposed of the interest in Vodacom World
Online (Proprietary) Limited. Details of the disposal are presented in Note 30 to the consolidated financial statements. The
Group acquired its interest in Vodacom Congo (R.D.C.) S.P.R.L. on December 11, 2001.
2001
2002
2002
Vodacom
Vodacom Vodacom
World
Congo (R.D.C)
World
Online
S.P.R.L.
Online
(Proprietary) (Proprietary)
Limited
Limited
Interest held . . . . . . . . . . . . . . . . . . . . . . . . . . . .
40%
51%
40%
Rm
Rm
Rm
The Group's proportionate share of assets and liabilities:
Property, plant and equipment . . . . . . . . . . . . . . . . . .
9.9
87.0
-
Intangible assets . . . . . . . . . . . . . . . . . . . . . . . . .
38.4
216.5
-
Current assets . . . . . . . . . . . . . . . . . . . . . . . . . . .
4.9
154.9
-
53.2
458.4
-
Long-term liabilities . . . . . . . . . . . . . . . . . . . . . . .
Current liabilities . . . . . . . . . . . . . . . . . . . . . . . . .
(22.2)
(30.9)
-
Net assets . . . . . . . . . . . . . . . . . . . . . . . . . . . . .
31.0
427.5
-
The Group's proportionate share of revenue and expenditure:
Revenue . . . . . . . . . . . . . . . . . . . . . . . . . . . . . .
43.0
5.7
36.1
Loss before taxation . . . . . . . . . . . . . . . . . . . . . . .
(45.0)
(20.1)
(19.9)
Taxation . . . . . . . . . . . . . . . . . . . . . . . . . . . . . .
-
-
-
Net loss . . . . . . . . . . . . . . . . . . . . . . . . . . . . . .
(45.0)
(20.1)
(19.9)
The Group's proportionate share of cash flows:
Net cash flows from operating activities . . . . . . . . . . . . .
(9.1)
(72.3)
1.4
Net cash flows from investing activities . . . . . . . . . . . . .
(5.8)
(275.8)
-
Net cash flows from financing activities . . . . . . . . . . . . .
4.0
388.0
4.8
Net cash flow . . . . . . . . . . . . . . . . . . . . . . . . . . .
(10.9)
39.9
6.2
The Group's proportionate share of contingent liabilities
and capital commitments:
Contingent liabilities (Note 36) . . . . . . . . . . . . . . . . .
Capital commitments . . . . . . . . . . . . . . . . . . . . . . .
0.2
319.7
-
In terms of a shareholders agreement, the Group's joint venture partner in Vodacom Congo (R.D.C) S.P.R.L, Congolese
Wireless Network S.P.R.L ("CWN") has a put option which comes into effect 3 years after the commencement date,December 1, 2001, and for a maximum of five years thereafter. In terms of the option, CWN shall be entitled to put to
Vodacom International Limited such numbers of shares in and claims on loan account against Vodacom Congo (R.D.C)
S.P.R.L as constitute 19% of the entire issued share capital of that company. CWN can exercise this option in a maximum of
three tranches and each tranche must consist of at least 5% of the entire issued share capital of Vodacom Congo (R.D.C)
S.P.R.L. The option price will be the fair market value of the related shares.

F173
VODACOM GROUP (PROPRIETARY) LIMITED
NOTES TO THE CONSOLIDATED FINANCIAL STATEMENTS
for the three years ended March 31, 2002
43.
INTEREST IN JOINT VENTURES (continued)
2000
Vodacom
Vodacom
Vodacom
Vodacom
Total
Tanzania
Lesotho
World Sport
and
Limited
Limited
Online Entertain-
(Proprietary) ment
Limited
(Proprietary)
Limited
Interest held . . . . . . . . . . . . . . . . .
51%
88.3%
50% / 40%
51%
Rm
Rm
Rm
Rm
Rm
The Group's proportionate share of
assets and liabilities:
Property, plant and equipment . . . . . . .
0.4
3.8
3.2
0.5
7.9
Intangible assets . . . . . . . . . . . . . .
1.7
0.1
28.5
-
30.3
Investments . . . . . . . . . . . . . . . . .
2.5
-
-
0.1
2.6
Current assets . . . . . . . . . . . . . . . .
3.8
12.0
11.2
9.1
36.1
8.4
15.9
42.9
9.7
76.9
Long-term liabilities . . . . . . . . . . . .
-
(7.3)
-
-
(7.3)
Current liabilities . . . . . . . . . . . . . .
(0.5)
(7.7)
(13.2)
(9.3)
(30.7)
Net assets . . . . . . . . . . . . . . . . . .
7.9
0.9
29.7
0.4
38.9
The Group's proportionate share of
revenue and expenditure:
Revenue . . . . . . . . . . . . . . . . . . .
-
33.5
18.5
13.3
65.3
(Loss)/Profit before taxation . . . . . . . .
(0.5)
7.0
(32.4)
3.1
(22.8)
Taxation . . . . . . . . . . . . . . . . . . .
-
(0.6)
-
(1.1)
(1.7)
Net (loss)/profit . . . . . . . . . . . . . . .
(0.5)
6.4
(32.4)
2.0
(24.5)
The Group's proportionate share of
cash flows:
Net cash flows from operating activities . .
(0.2)
0.4
0.5
0.7
Net cash flows from investing activities . .
(0.4)
(16.1)
(6.1)
(0.6)
(23.2)
Net cash flows from financing activities . .
(6.0)
9.2
63.1
-
66.3
Net cash flow . . . . . . . . . . . . . . . .
(6.4)
(7.1)
57.4
(0.1)
43.8
The Group's proportionate share of
contingent liabilities and capital
commitments:
Contingent liabilities . . . . . . . . . . . .
-
-
-
-
-
Capital commitments . . . . . . . . . . . .
-
8.8
-
-
8.8

F174
VODACOM GROUP (PROPRIETARY) LIMITED
NOTES TO THE CONSOLIDATED FINANCIAL STATEMENTS
for the three years ended March 31, 2002
44.
RESTATEMENT OF THE FINANCIAL STATEMENTS ISSUED PREVIOUSLY
2000
2001
2002
Rm
Rm
Rm
Net profit as previously disclosed . . . . . . . . . . . . . . . .
1,359.0
1,361.7
2,337.6
Restatements and adjustments . . . . . . . . . . . . . . . . . .
(44.0)
(43.9)
35.4
Net profit as restated . . . . . . . . . . . . . . . . . . . . . . .
1,315.0
1,317.8
2,373.0
The summary of differences on restatements are set forth below and in Note 44.1 to Note 44.8:
Balance as
Share-
Intangible
Goodwill
Hedge
Deferred
Unused
Joint
Other Balance as
previously holder
assets
accounting
bonus airtime
venture
restated
reported loans
incentives
Rm
Rm
Rm
Rm
Rm
Rm
Rm
Rm
Rm
Rm
Reconciliation 2000
Income statement
Profit before taxation . . . . .
1,896.3
-
(11.0)
-
-
36.1
(93.3)
-
-
1,828.1
Taxation . . . . . . . . . . . .
(537.8)
-
7.0
-
-
(10.8)
28.0
-
-
(513.6)
Minority interest . . . . . . . .
0.5
-
-
-
-
-
-
-
-
0.5
Net profit . . . . . . . . . . .
1,359.0
-
(4.0)
-
-
25.3
(65.3)
-
-
1,315.0
Balance sheet
Capital and reserves . . . . . .
(3,770.3)
1,070.0
4.0
-
-
(40.1)
65.3
-
-
(2,671.1)
Minority interest . . . . . . . .
(2.1)
-
-
-
-
-
-
-
4.3
2.2
Liabilities . . . . . . . . . . .
(5,949.6)
(1,070.0)
(135.0)
-
-
-57.3
(93.3)
-
(4.3)
(7,194.9)
Assets . . . . . . . . . . . . .
9,722.0
-
131.0
-
-
(17.2)
28.0
-
-
9,863.8
Reconciliation 2001
Income statement
Profit before taxation . . . . .
2,168.3
-
(26.0)
-
(52.6)
(28.3)
12.9
-
-
2,074.3
Taxation . . . . . . . . . . . .
(815.8)
-
29.7
-
15.8
8.5
(3.9)
-
-
(765.7)
Minority interest . . . . . . . .
9.2
-
-
-
-
-
-
-
-
9.2
Net profit . . . . . . . . . . .
1,361.7
-
3.7
-
(36.8)
(19.8)
9.0
-
-
1,317.8
Balance sheet
Capital and reserves . . . . . .
(4,635.6)
920.0
0.3
-
173.3
(20.3)
56.3
-
-
(3,506.0)
Minority interest . . . . . . . .
7.1
-
-
-
-
-
-
-
4.3
11.4
Liabilities . . . . . . . . . . .
(7,732.6)
(920.0)
(109.8)
-
(29.1)
29.0
(80.4)
-
(4.3)
(8,847.2)
Assets . . . . . . . . . . . . .
12,361.1
-
109.5
-
(144.2)
(8.7)
24.1
-
-
12,341.8
Reconciliation 2002
Income statement
Profit before taxation . . . . .
3,589.3
-
(29.4)
0.2
39.3
8.6
(38.1)
19.2
4.2
3,593.3
Taxation . . . . . . . . . . . .
(1,227.0)
-
29.7
-
(2.2)
(2.6)
11.4
-
-
(1,190.7)
Minority interest . . . . . . . .
(24.7)
-
-
-
-
-
-
(4.9)
-
(29.6)
Net profit . . . . . . . . . . .
2,337.6
-
0.3
0.2
37.1
6.0
(26.7)
14.3
4.2
2,373.0
Balance sheet
Capital and reserves . . . . . .
(6,518.8)
920.0
(0.3)
28.5
22.3
(26.2)
83.0
27.7
-
(5,463.8)
Minority interest . . . . . . . .
(417.7)
-
-
-
-
-
--
362.8
44.3
(10.6)
Liabilities . . . . . . . . . . .
(8,819.2)
(920.0)
(77.5)
-
28.1
37.5
(118.5)
29.
7
(44.3)
(9,884.2)
Assets . . . . . . . . . . . . .
15,755.7
-
77.8
(28.5)
(50.4)
(11.3)
35.5
(420.2)
-
15,358.6
44.
1
Shareholder loans
Shareholder loans, previously disclosed under shareholders' equity, were reclassified and are now included as a
component of long-current liabilities for all periods presented.

F175
VODACOM GROUP (PROPRIETARY) LIMITED
NOTES TO THE CONSOLIDATED FINANCIAL STATEMENTS
for the three years ended March 31, 2002
44.
RESTATEMENT OF THE FINANCIAL STATEMENTS ISSUED PREVIOUSLY (continued)
44.2
Intangible assets
Previously the excess of the cost of an acquisition of a subsidiary over the Group's interest in the fair value of
identifiable assets and liabilities at the date of certain acquisitions, was classified as goodwill. However, a portion of
the excess previously classified as goodwill, related to customer bases and trademarks that have now been recorded as
separate components of intangible assets.
The amortisation periods for the goodwill previously recorded and the separate components now disclosed are
materially the same.
Deferred taxation was raised on the customer bases and trademarks, with a corresponding adjustment to goodwill.
44.3
Goodwill
Acquired goodwill in the financial statements of Vodacom Congo (R.D.C) S.P.R.L. was converted at the average rate
per month in the income statement and the closing rate in the balance sheet. This goodwill has now been translated at
the historic rate on the date of acquisition, in accordance with the Group's accounting policy, which results in a
different amortisation charge.
44.4
Hedge accounting
During the 2001 financial year, qualifying assets were capitalised at the spot rate ruling on the order date together with
the fair value movements on the related forward exchange contracts between the order date and acceptance date of the
asset. The forward exchange contracts were recorded at fair value at order date and revalued to fair value at each
reporting date of the asset. Where the assets had not been accepted at the reporting date, the fair value adjustments on
the forward exchange contracts were deferred into equity and capitalised upon the asset acceptance date. The
underlying liabilities were recorded at fair value on acceptance date and were also revalued at each reporting date.
These subsequent fair value adjustments were expensed as incurred.
The method previously applied in measuring the value of forward exchange contracts in the 2001 financial year has
been amended to correspond with the treatment applied during all years prior to the 2001 financial year. During these
years qualifying assets were capitalised at the spot rate ruling on the order date together with the unamortised
premiums on the forward exchange contract between the order date and acceptance date of the qualifying asset.
Unamortised premiums after the acceptance date of the asset were expensed over the remaining period of the forward
exchange contract. The underlying liabilities were recorded at the forward exchange rate on acceptance date. These
subsequent fair value adjustments were expensed as incurred.
The 2002 year impact is a result of adoption of IAS 39 (Note 24).
44.5
Deferred bonus incentive scheme
The fair value of the entitlements were previously calculated as the difference in the entitlement value at balance sheet
date and the value at which the entitlements were originally issued, multiplied by the number of entitlements allocated
to a participant. This increase in entitlement value, previously expensed in full to the income statement and provided
for in the balance sheet, is now based on the present value of the expected future cash out flows and recorded as a
liability in the balance sheet.
Details of the incentive scheme is set out in Note 23.1.
44.6
Unused minutes on bundled airtime packages
Revenue on bundled airtime products was previously recognised on the percentage of completion basis. The terms and
conditions of the Group's bundled airtime products allow the carry over of unused minutes and accumulation thereof
to a maximum of five times the monthly allocation of minutes. An assessment was made of the extent of minutes
carried over that would ultimately be used and the related revenue was deferred. Deferred revenue related to unused
airtime was recognised when utilised by the customer.
Currently the revenue on carry-over minutes, as explained above, is deferred and only recognised when used by the
customer or upon termination of the customer contract.
44.7
Joint venture
Vodacom Congo (R.D.C) S.P.R.L. was previously accounted for as a subsidiary. After reassessment the company was
deconsolidated and accounted for as a joint venture.

F176
VODACOM GROUP (PROPRIETARY) LIMITED
NOTES TO THE CONSOLIDATED FINANCIAL STATEMENTS
for the three years ended March 31, 2002
44.
RESTATEMENT OF THE FINANCIAL STATEMENTS ISSUED PREVIOUSLY (continued)
44.8
Other
A deemed dividend on the liquidation of a subsidiary was previously credited directly against the retained earnings
instead of being recognised in the income statement.
Furthermore, certain amounts previously disclosed under minority interest have been reclassified to interest- and non-
interest-bearing liabilities.
45.
US GAAP INFORMATION
The financial statements have been prepared in accordance with International Accounting Standards ("IAS") which differs incertain respects from Generally Accepted Accounting Principles in the United States ("US GAAP"). The effect of applyingUS GAAP principles to net profit and shareholders' equity is set out below along with an explanation of applicable
differences between IAS and US GAAP:
Notes
2001
2002
Rm
Rm
Net profit as reported in accordance with IAS . . . . . . . . . .
1,317.8
2,373.0
Items increasing/(decreasing) net profit:
Deferred bonus incentive scheme . . . . . . . . . . . . . . . . . .
(a)
7.0
20.9
Goodwill non-amortisation . . . . . . . . . . . . . . . . . . . .
(b)
-
1.9
Goodwill translation differences
on accumulated amortisation . . . . . . . . . . . . . . . . . . . .
(c)
(0.3)
(4.0)
Derivative financial instruments
reclassification of transition adjustments . . . . . . . . . . . . . .
(e)
-
52.0
Income tax rate differences . . . . . . . . . . . . . . . . . . . .
(f)
(118.3)
(227.4)
Income tax effect of US GAAP adjustments . . . . . . . . . . . .
(g)
(2.6)
(27.5)
Joint venture . . . . . . . . . . . . . . . . . . . . . . . . . . . . .
(i)
45.0
(80.0)
Net profit in accordance with US GAAP before
cumulative effect of change in accounting policy . . . . . . . . . .
1,248.6
2,108.9
Change in accounting policy upon adoption of SFAS 133
Derivative financial instruments transition adjustments . . . . . .
(e)
-
17.2
Income tax effect on above . . . . . . . . . . . . . . . . . . . . .
(g)
-
(6.5)
Net profit in accordance with US GAAP after cumulative
effect of change in accounting policy . . . . . . . . . . . . . . . .
1,248.6
2,119.6
Shareholders' equity as reported in accordance with IAS . . . .
3,506.0
5,463.8
Items increasing/(decreasing) shareholders' equity:
Deferred bonus incentive scheme . . . . . . . . . . . . . . . . . .
(a)
37.0
57.9
Goodwill non-amortisation . . . . . . . . . . . . . . . . . . . .
(b)
-
1.9
Goodwill translation differences
on accumulated amortisation . . . . . . . . . . . . . . . . . . . .
(c)
(0.3)
(4.3)
Goodwill accumulated translation differences . . . . . . . . . .
(c)
4.6
31.7
Income tax rate differences . . . . . . . . . . . . . . . . . . . .
(f)
(418.4)
(655.2)
Income tax effect of US GAAP adjustments . . . . . . . . . . . .
(f)
(13.9)
(21.8)
Joint venture . . . . . . . . . . . . . . . . . . . . . . . . . . . . .
(h)
80.0
-
Shareholders' equity in accordance with US GAAP . . . . . . . .
3,195.0
4,874.0
Movements in shareholders' equity in
accordance with US GAAP
Balance at beginning of period . . . . . . . . . . . . . . . . . . .
2,424.7
3,195.0
Net profit for period . . . . . . . . . . . . . . . . . . . . . . . . .
1,248.6
2,119.6
Dividends declared . . . . . . . . . . . . . . . . . . . . . . . . . .
(480.0)
(600.0)
Foreign currency translation reserve adjustment . . . . . . . . . .
1.7
127.0
Cumulative effect adjustment of adoption of SFAS 133,
net of taxation . . . . . . . . . . . . . . . . . . . . . . . . . . . .
-
64.8
Gain on derivatives reclassified to earnings, net of taxation . . .
-
(32.4)
Balance at end of period . . . . . . . . . . . . . . . . . . . . . . .
3,195.0
4,874.0

F177
VODACOM GROUP (PROPRIETARY) LIMITED
NOTES TO THE CONSOLIDATED FINANCIAL STATEMENTS
for the three years ended March 31, 2002
45.
US GAAP INFORMATION (continued)
Summary of differences between International Accounting Standards and accounting principles generally accepted in
the US.
A summary of the principal differences and additional disclosures applicable to the Group are set forth below:
(a)
Deferred bonus incentive scheme
Under IAS, the total value of deferred bonus entitlements as calculated at the end of each financial period is based on
the net present value of expected future cash payments as determined under the bonus formula over the vesting period.
Under US GAAP, in accordance with FIN 28 : "Accounting for Stock Appreciation Rights and Other Variable Stock
Option Awards Plans and Interpretation of APB Opinions No. 15 and 25", compensation cost is recognised over the
service period or the vesting period if the service period is not defined, based upon the undiscounted value of the
entitlements.
(b)
Goodwill non-amortisation
Under IAS, goodwill and intangible assets arising in business combinations are amortised over their estimated useful
lives.
Under US GAAP, accounting for goodwill and intangible assets was substantially the same as IAS until the adoption of
SFAS No. 141: "Business Combinations" ("SFAS 141") and SFAS No. 142: "Goodwill and Other Intangible Assets"("SFAS 142"). SFAS 141 is effective for all business acquisitions consummated after June 30, 2001. SFAS 141 requiresall business combinations consummated after June 30, 2001 to be accounted for under the purchase method. SFAS 141
also sets forth guidelines for applying the purchase method of accounting in the determination of intangible assets,
including goodwill, acquired in a business combination.
SFAS 142 addresses the initial and ongoing financial accounting and reporting for acquired goodwill and other
intangible assets. SFAS 142 requires that goodwill be separately disclosed from other intangible assets in the balance
sheet, and no longer be amortised but tested for impairment at least annually (or more frequently if impairment
indicators arise). SFAS 142 is effective for financial statements for periods beginning on or after December 15, 2001.
Additionally, the amortisation provisions of SFAS 142 are applicable to goodwill arising in all business acquisitions
consummated after June 30, 2001 regardless of the adoption date of SFAS 142. Accordingly, goodwill arising from the
investment in Vodacom Congo (R.D.C) S.P.R.L is not subject to amortisation.
The Group will adopt SFAS 142 on April 1, 2002. The Group is required to complete the initial step of a transitional
impairment test within six months of adoption of SFAS 142. However, management does not believe that a material
adjustment will be necessary upon completion of this initial assessment. Subsequent impairment losses will be reflected
in operating income or loss in the income statement.

F178
VODACOM GROUP (PROPRIETARY) LIMITED
NOTES TO THE CONSOLIDATED FINANCIAL STATEMENTS
for the three years ended March 31, 2002
45.
US GAAP INFORMATION (continued)
(c)
Goodwill translation of goodwill arising on the acquisition of a foreign entity
Under IAS, goodwill arising on the acquisition of a foreign entity is treated as an asset of the Group and translated at
the foreign exchange rate ruling at the transaction date based on the historical rate.
Under US GAAP, goodwill arising on the acquisition of Vodacom Congo (R.D.C) S.P.R.L and Vodacom Tanzania
Limited is translated at the actual exchange rate at the end of the period. The resulting foreign exchange transaction gain
or loss increases or decreases the net investment in Vodacom Congo (R.D.C) S.P.R.L. and Vodacom Tanzania Limited.
2001
2002
Rm
Rm
A reconciliation of goodwill for South African and foreign entities reported
under IAS on the balance sheet to the approximate amounts determined under
US GAAP is as follows:
Included in total goodwill reported under IAS . . . . . . . . . . . . . . . . . .
359.1
342.9
Goodwill not amortised under US GAAP . . . . . . . . . . . . . . . . . . . .
-
1.9
Additional goodwill income tax rate change . . . . . . . . . . . . . . . . .
28.5
20.1
Translation difference on amortisation . . . . . . . . . . . . . . . . . . . . . .
(0.3)
(4.3)
Translation difference on goodwill balance
4.6
31.7
As adjusted under US GAAP . . . . . . . . . . . . . . . . . . . . . . . . . .
391.9
392.3
(d)
Income taxes additional temporary differences
Under IAS, no deferred tax liability was recognised in respect of intangible assets acquired, other than in a business
combination, where there was a difference at the date of acquisition between the assigned values and the tax bases of
the assets.
Under US GAAP, a deferred tax liability (and corresponding increase in assets acquired) is recognised for all temporary
differences between the assigned values and the tax bases of intangible assets acquired. The recording of such deferred
tax liability has no net impact on net income or shareholder's equity as determined under US GAAP as the decrease in
income tax expense is off-set by a corresponding increase in amortisation (Note 45(f)).
(e)
Derivative financial instruments
The Group adopted IAS 39 and SFAS 133: "Accounting for Derivative Instruments and Hedging Activities" ("SFAS133") on April 1, 2001.
Under IAS, upon adoption of IAS 39, the difference between previous carrying amounts and the fair value of
derivatives, which prior to the adoption of IAS 39 had been designated as either fair value or cash flow hedges but do
not qualify as hedges under IAS 39, is recognised as an adjustment of the opening balance of retained earnings at the
beginning of the financial year IAS 39 is initially applied. Changes in fair value of derivatives acquired after
April 1, 2001 are recorded in the income statement.
Under US GAAP, upon adoption of SFAS 133, the difference between previous carrying amounts and fair value of
derivatives, which prior to the adoption of SFAS 133 had been cash flow type hedges but do not qualify as hedges under
SFAS 133, is recognised as a cumulative effect adjustment of other comprehensive income in the year SFAS 133 is
initially applied. This amount is subsequently released into earnings in the same period or periods during which the
hedged transaction affects earnings. During the year ended March 31, 2002 R52.0 million before taxation was released
into earnings. The difference between previous carrying amounts and fair value of derivatives, which prior to the
adoption of SFAS 133 had been fair value type hedges, is recognised as a cumulative effect adjustment in earnings.
Changes in fair value of derivatives acquired after April 1, 2001 are recorded in the income statement.

F179
VODACOM GROUP (PROPRIETARY) LIMITED
NOTES TO THE CONSOLIDATED FINANCIAL STATEMENTS
for the three years ended March 31, 2002
45.
US GAAP INFORMATION (continued)
(f)
Income tax rate differences
The tax rate in South Africa varies depending on whether income is distributed. The income tax rate is 30% but upon
distribution an additional tax (Secondary Tax on Companies or "STC") of 12.5% is due based on the amount of the
dividends net of the STC credit for dividends received during a dividend cycle.
In conformity with IAS, Vodacom reflects the STC as a component of the income tax change for the period in which
dividends are declared, IAS also requires that deferred tax be provided for at the undistributed rate of 30%.
For the purpose of US GAAP, Vodacom believes that under SFAS No. 109: "Accounting for Income Taxes"
("SFAS 109") temporary differences should be tax effected using the tax rate that will apply when income is distributed,i.e. an effective rate of 37.78% including STC.
Vodacom has therefore computed the estimated STC that would become payable upon distribution of relevant
undistributed earnings and accrued that amount as additional liability for US GAAP purposes.
The use of the higher rate not only affects the measurement of deferred tax assets and liabilities, and hence the tax
charge for any period, but because temporary differences in a business combination need to be tax effected at the higher
rate there is a consequent effect on the amount of goodwill recognised in a business combination under US GAAP.
(g)
Deferred taxation
The tax effects of the US GAAP adjustments have been calculated based on the enacted tax rate of 37.78%
(2001: 37.78%).
A reconciliation of the deferred tax balances under IAS to the approximate amounts determined under US GAAP, where
materially different, are as follows:
2001
2002
Rm
Rm
Net deferred tax liabilities:
As reported under IAS . . . . . . . . . . . . . . . . . . . . . . . . . . . . . .
268.4
428.5
Additional temporary differences (Note 45(d)) . . . . . . . . . . . . . . . . .
35.3
62.2
Income tax rate differences . . . . . . . . . . . . . . . . . . . . . . . . . . .
446.9
675.3
Tax effect of US GAAP adjustments
13.9
21.8
As adjusted under US GAAP . . . . . . . . . . . . . . . . . . . . . . . . . .
764.5
1,187.8
Under IAS, deferred tax assets on deductible temporary differences are only recognised to the extent that it is probable
that the future taxable profit will allow the deferred tax asset to be recovered.
Under US GAAP, deferred tax assets are recognised on all temporary differences. A valuation allowance is recognised if
it is more likely than not that the asset will not be recovered. For US GAAP purposes, an additional deferred tax asset
and a corresponding valuation adjustment allowance of R31.0 million (2001: R31.0 million) have no effect on the net
shareholders' equity for the year.
(h)
Capitalised interest
Under IAS, interest cost incurred during the construction period is expensed as incurred.
Under US GAAP, interest cost incurred during the construction period (i.e. period of time necessary to bring a
constructed fixed asset to the condition and location necessary for its intended use) is capitalised. The capitalised
interest is recorded as part of the asset to which it relates and is amortised over the asset's estimated useful life.
Capitalised interest was nil for the years ended March 31, 2002 and 2001 as the effect of capitalising interest, as
compared with the effect of expensing interest, was not material.

F180
VODACOM GROUP (PROPRIETARY) LIMITED
NOTES TO THE CONSOLIDATED FINANCIAL STATEMENTS
for the three years ended March 31, 2002
45.
US GAAP INFORMATION (continued)
(i)
Joint ventures
Under IAS, investments qualifying as joint ventures are accounted for under the proportionate consolidation method of
accounting. Under the proportionate consolidation method, the venturer records its share of each of the assets, liabilities,
income and expenses of the jointly controlled entity on a line-by-line basis with similar items in the venturer's financial
statements. The venturer continues to record its share of losses in excess of its net investment of the joint venture.
Under US GAAP, joint ventures are accounted for under the equity method of accounting. Under the equity method, an
investment in a joint venture is shown in the balance sheet of an investor as a single amount. Likewise, an investor's
share of earnings or losses from its investment is ordinarily shown in its income statement as a single amount. An
investor discontinues applying the equity method when its net investment (including net advances) is reduced to zero.
In 2001 and 2000, in accordance with IAS, the Group proportionately consolidated losses to the value of R45.0 million
and R35.0 million, respectively, that was in excess of the Group's net investment in the joint venture. Under US GAAP
these losses are not considered in calculating net income as the value of the investment was reduced to zero. Upon
disposal of the investment in Vodacom World Online (Proprietary) Limited in 2002, the gain on the sale was less based
on a different basis in the net investment.
Under IAS Vodacom World Online (Proprietary) Limited was proportionately consolidated in 2001 and 2002 and
Vodacom Congo (R.D.C) S.P.R.L. in 2002. The summarised financial statement information for Vodacom World Online
(Proprietary) Limited and Vodacom Congo (R.D.C) S.P.R.L. relating to Vodacom's pro rata interest is set out in
Note 43. Vodacom World Online (Proprietary) Limited was disposed of in November 2001.
(j)
Comprehensive income
Comprehensive income under US GAAP and accumulated other comprehensive income balances under US GAAP are
summarised as follows:
2001
2002
Rm
Rm
Net income under US GAAP . . . . . . . . . . . . . . . . . . . . . . . . . .
1,248.6
2,119.6
Other comprehensive income:
Foreign currency translation adjustment . . . . . . . . . . . . . . . . . . . . .
1.7
127.0
Cumulative effect adjustment of adoption of SFAS 133 . . . . . . . . . . . . .
-
64.8
Gain on derivatives reclassified to earnings
-
(32.4)
Other comprehensive income
1.7
159.4
Comprehensive income
1,250.3
2,279.0
Accumulated other comprehensive income balances:
Cumulative foreign currency translation adjustments . . . . . . . . . . . . . .
2.3
129.3
Cumulative effect adjustment of adoption of SFAS 133 . . . . . . . . . . . . .
-
32.4
(k)
Impairment of assets
Under IAS the Group is required to annually assess whether there are any indications that an asset may be impaired.
Should there be such an indicator, the asset must be tested for impairment. An impairment loss must be recognised in
the statement of operations, should an assets carrying amount exceed its recoverable amount. The impairment loss is the
difference between the assets carrying amount and its recoverable value. The recoverable amount is the higher of the
assets net selling price or its value in use. Value in use is the future cash flows to be derived from the particular asset,

F181
VODACOM GROUP (PROPRIETARY) LIMITED
NOTES TO THE CONSOLIDATED FINANCIAL STATEMENTS
for the three years ended March 31, 2002
45.
US GAAP INFORMATION (continued)
(k)
Impairment of assets (continued)
discounted to present value using a pre-tax market determined rate that reflects the current assessment of the time value
of money and the risks specific to the asset. The reversal of an impairment loss in subsequent periods is permitted when
there has been a change in economic conditions or the expected use of the asset.
Under US GAAP the Group is required to test for impairment whenever there is an indication of impairment. For assets
to be held and used, impairment is first measured by reference to undiscounted cash flows. If there is no impairment by
reference to undiscounted cash flows, no further action is required but the useful life of the asset must be reconsidered.
If impairment exists the Group must measure impairment by comparing the assets fair value to its carrying value. Fair
value is either market value (if an active market for the asset exists) or the sum of discounted future cash flows. The
discount rate reflects the risk that is specific to that asset. For assets to be disposed of, the loss recognised is the excess
of the assets carrying amount over its fair value less costs to sell. The reversal of previously recognised impairment
losses is prohibited.
During 2001, the Group recognized an impairment loss in accordance with IAS amounting to R97.7 million. No part of
that impairment loss was subsequently reversed.
During the same period in the Group recognised a loss of R45.5 million in respect of a onerous contract (Note 3) in
accordance with paragraph 8 of SFAS 5: "Accounting for Contingencies" ("SFAS 5"). Subsequent to the issuance of the2001 financial statements, it became clear that the other party to the contract was prepared to waive its right to supply
satellite phones and instead was prepared to enter into a revised contract to supply mobile phones. Accordingly,
management determined that, based on the change in circumstances arising from the willingness of the other party to
revise the contract, the Group would no longer incur a loss under the contract and therefore reversed the loss previously
provided for. The reversal of the provision, based on a change in circumstances, is not the recovery of impaired assets
but rather it represents the reversal in a subsequent period of provision for an estimated loss.
The Group currently has no material GAAP difference for impairment of assets.
(l)
Revenue recognition
Under IAS the Group recognises activation fee revenue and costs up to the amount of the related activation revenue
immediately upon activation of a new customer. Any excess costs incurred are recognised up front upon activation of a
new customer.
Under US GAAP activation fee revenues and costs up to the amount of activation revenue would be deferred and
recognised over the customer relationship period.
The Group has not presented the deferral of activation fees in the above US GAAP reconciliation, as there is no material
impact.
(m)
Recent accounting pronouncements
In July 2001, the Financial Accounting Standards Board ("FASB") issued Statements of Financial Accounting StandardsNo. 142, "Goodwill and Other Intangible Assets" ("SFAS 142"). Under SFAS 142, goodwill and intangible assets withindefinite lives are no longer amortised but are reviewed annually (or more frequently if impairment indicators arise) for
impairment. Separable intangible assets that are not deemed to have indefinite lives will continue to be amortised over
their useful lives.
The amortisation provisions of SFAS 142 apply to goodwill and intangible assets acquired after June 30, 2001. With
respect to goodwill and intangible assets acquired prior to July 1, 2001, the Group adopted SFAS 142 effective
April 1, 2002. The Group has evaluated the effect that the adoption of the provisions of SFAS 142 will have on its
results of operations and financial position.

F182
VODACOM GROUP (PROPRIETARY) LIMITED
NOTES TO THE CONSOLIDATED FINANCIAL STATEMENTS
for the three years ended March 31, 2002
45.
US GAAP INFORMATION (continued)
(m)
Recent accounting pronouncements (continued)
In August 2001, the FASB issued Statement of Financial Accounting Standards No. 143, "Accounting for Obligations,
Associated with the Retirement of Long-Lived Assets" ("SFAS 143"). SFAS 143 establishes accounting standards forrecognition and measurement of a liability at fair value for an asset retirement obligation and an addition to the
associated asset retirement cost. The accretion of interest expense each period is subsequently recorded as an expense
and added to the liability. SFAS 143 is effective for fiscal years beginning after June 15, 2002. The Group expects
determined that the adoption of SFAS 143 will not have a material impact on its results of operations and financial
position.
In October 2001, the FASB issued Statement of Financial Accounting Standards No. 144, "Accounting for the
Impairment or Disposal of Long-Lived Assets" ("SFAS 144"). SFAS 144 addresses financial accounting and reportingfor the impairment of long-lived assets and for long-lived assets to be disposed of. This statement supersedes FASB
Statement No. 121, "Accounting for the Impairment of Long-Lived Assets and for Long-Lived Assets to be disposed of"
("SFAS 121"). However, this statement retains the fundamental provisions of SFAS 121 for recognition andmeasurement of the: (a) impairment of long-lived assets to be held and used and (b) long-lived assets to be disposed of
by sale. The Group adopted SFAS 144 effective April 1, 2002 (Note 45(j)). The Group expects that the adoption of
SFAS 144 will not have a material impact on its results of operations and financial position.
In November 2001, the Emerging Issues Task Force reached a consensus on "Accounting for Consideration Given by a
Vendor to a Customer (Including a Reseller of the Vendor's Products)" ("EITF 01-09"). The purpose of Issue 01-09 is toaddress the accounting for consideration given by a vendor to a customer including both a reseller of the vendor's
products and an entity that purchases the vendor's products from a reseller. The Task Force reached a consensus that
cash consideration (including a sales incentive) given by a vendor to a customer is presumed to be a reduction of the
selling price of the vendor's products or services and therefore, should be characterized as reduction of revenue when
recognised in the vendor's income statement. That presumption is overcome and the consideration should be
characterised as cost incurred if both the following conditions are met: (a) The vendor received or will receive, an
identifiable benefit in exchange for the consideration and (b) the vendor can reasonably estimate the fair value of he
benefit identified under condition (a). The EITF should be applied no later than in financial statements for annual or
interim periods beginning after December 15, 2001. The Group expects that the adoption of EITF 01-09 will not have a
material impact on its results of operations and financial position.
In April 2002, the FASB issued Statements of Accounting Standards No. 145, "Rescission of SFAS Nos. 4, 44
and 64, Amendment of SFAS 13, and Technical Corrections as of "April 2002" ("SFAS 145"). SFAS 145 rescinds SFAS No. 4, "Reporting Gains and Losses from Extinguishment of Debt", SFAS No. 44, "Accounting for Intangible
Assets of Motor Carriers", and SFAS 64, "Extinguishments of Debt made to satisfy Sinking-Fund requirements". As a
result, gains and losses from extinguishment of debt will no longer be classified as extraordinary items unless they meet
the criteria of unusual or infrequent as described in Accounting Principles Boards Opinion 30, "Reporting the Results of
Operations Reporting the Effects of Disposal of a Segment of a Business, and Extraordinary, Unusual and Infrequently
Occurring Events and Transactions". In addition, SFAS 145 amends SFAS 13, "Accounting for Leases", to eliminate an
inconsistency between the required accounting for sale-leaseback transactions and the required accounting for certain
lease modifications that have economic effects that are similar to sale-leaseback transactions. SFAS 145 also amends
other existing authoritative pronouncements to make various technical corrections, clarify meanings, or describe their
applicability under changed conditions. SFAS 145 is effective for fiscal years beginning after May 15, 2002. The Group
is currently evaluating the impact that the adoption of SFAS 145 will have on its results of operations and financial
position. However, the Group does not believe that the adoption of SFAS 145 will have a material impact on its results
of operations and financial position.
In June 2002, the FASB issued Statement of Accounting Standards No. 146, "Accounting for Costs Associated with Exit
or Disposal Activities". This Statement addresses financial accounting and reporting for costs associated with exit or
disposal activities and nullifies Emerging Issues Task Force Issue No. 94-3, "Liability Recognition for Certain
Employee Termination Benefits and Other Costs to Exit an Activity (including Certain Costs Incurred in a
Restructuring)" ("EITF 94-3"). SFAS 146 eliminates the definition and requirements for recognition of exit costs in
F183
VODACOM GROUP (PROPRIETARY) LIMITED
NOTES TO THE CONSOLIDATED FINANCIAL STATEMENTS
for the three years ended March 31, 2002
45.
US GAAP INFORMATION (continued)
(m)
Recent accounting pronouncements (continued)
EITF 94-3. SFAS 146 requires that a liability for a cost associated with an exit or disposal activity be recognised when
the liability is incurred. Under EITF 94-3, a liability for an exit cost as defined in EITF 94-3 was recognised at the date
of an entity's commitment to an exit plan. SFAS 146 also concluded that an entity's commitment to a plan, by itself,
does not create a present obligation to others that meets the definition of a liability. SFAS 146 also establishes that fair
value is the objective for initial measurement of the liability. The Group is currently evaluating the impact that the
adoption of SFAS 146 will have on its results of operations and financial position. However, the Group does not believe
that the adoption of SFAS 146 will have a material impact on its results of operations and financial position.
A-1
REPUBLIC OF SOUTH AFRICA
The following information on the Republic of South Africa is intended as a general summary and has been extracted from
publicly available documents, and has not been prepared or independently verified by us or our advisers or the underwriters or any
of their respective affiliates or advisers:
Introduction
In 1994, South Africa held its first fully democratic national elections, culminating in the election of Mr. Nelson Mandela as
President of South Africa, then the leader of the African National Congress and the anti-apartheid movement in South Africa. In
June 1999, South Africa held its second fully democratic national elections, culminating in the election of Mr. Thabo Mbeki as
President of South Africa.
The Constitution states that South Africa is "founded on a commitment to achieve equality, to promote and protect human
dignity and to advance human rights and freedoms." It enshrines the principles of the supremacy of the rule of law, universal adult
suffrage, regular elections and multi-party democracy. The Constitution's Bill of Rights is one of the world's broadest, guaranteeing
property rights, freedom of speech, movement and political activity and giving those accused of crimes many legal protections,
including the right to a speedy trial and the right to remain silent. Among other things, the Bill of Rights enshrines the right to
adequate housing, food, water, education and healthcare and prohibits discrimination on the basis of race, gender, sexual
orientation, age, pregnancy or marital status.
South Africa must address a legacy of great divisions within the population, largely along racial lines, which have taken a heavy
toll on human development and the economy. This toll is evidenced by the chronically high unemployment rate (which some
estimates put at 30% 40% of the economically active population) and the widely divergent nature of the economy, in which vast
sections of the population suffer tremendous inadequacies in areas such as housing, sanitation, healthcare and education, while a
small minority enjoys the benefits associated with a highly developed society. Faced with these challenges, the Government of the
Republic of South Africa adopted a three year budgetary framework for social and economic policy as a basis for the design of
Government programs to address such inadequacies at the national, provincial and local levels. The National Government has
expressed its commitment to implementing these policies within a framework of fiscal discipline to ensure sustainable economic
growth.
Private sector confidence, cooperation between labor and management and reduced levels of political and criminal violence are
expected to continue to be important determinants of being able to achieve sustainable economic growth in South Africa, with the
long-term aim of creating jobs for all economically active South Africans. A dramatic increase in job opportunities will not be
easily or rapidly obtained, and unemployment is unfortunately likely to remain a feature of the South African economy in the near
future.
Despite these challenges, South Africa has the most developed economy in sub-Saharan Africa, with a GDP equal to more than
seven times that of its six immediate neighbors combined.
The major strengths of the South African economy are its strong physical and economic infrastructure, its abundant natural
resources, particularly gold, and a wide variety of other minerals including coal and uranium oxide, and its growing manufacturing
sector.
Geography and population
The Republic of South Africa is the southernmost country on the African continent, bordered on the northwest by Namibia and
Botswana; on the northeast by Zimbabwe, Mozambique and Swaziland; on the east and south by the Indian Ocean; and on the west
by the Atlantic Ocean. Lesotho forms an enclave in the northeastern part of the country. The Republic of South Africa covers an
area of approximately 1.2 million square kilometers and comprises nine provinces: Gauteng, Limpopo (previously Northern
Province), Mpumalanga, North-West Province, Free State, Eastern Cape, Northern Cape, Western Cape and KwaZulu-Natal.
The country has three capitals: Cape Town is the legislative capital, Pretoria is the executive capital and Bloemfontein is the
judicial capital. The estimated population as of mid-year 2002 was approximately 45.4 million people according to Statistics South
Africa. Major regions in South Africa include the Western Cape, with approximately 2.1 million people; KwaZulu-Natal with
approximately 8.9 million people, including Durban, the country's leading port; Eastern Cape with approximately 6.7 million
people, which includes Port Elizabeth, an industrial city and major port; and Gauteng with approximately 7.8 million people. This
area includes Johannesburg, the main financial center, Pretoria and Soweto, a township outside Johannesburg, which is one of the
largest communities in South Africa with estimates placing the population at over a million people.
A-2
According to Statistics South Africa, as of mid year 1999 approximately 55% of the population lived in urban areas. The most
densely populated parts of South Africa are the four major industrialised areas: the Pretoria/Witwatersrand/Vereeniging area of
Gauteng Province, the Durban/Pinetown/Pietermaritzburg area of KwaZulu-Natal Province, the Cape Peninsula area of the Western
Cape Province and the Port Elizabeth/Uitenhage area of the Eastern Cape Province.
Among the black population there are numerous ethnic groups. There are 11 official languages in South Africa. Until recently,
whites dominated the nonwhite majority population under the political system of racial segregation known as apartheid. Legalized
apartheid ended in the early 1990s, but South Africa is still recovering from the racial inequalities in economic power, opportunity
and lifestyle. The end of apartheid led to the lifting of trade and other sanctions against South Africa imposed by the international
community. It also led to a total reorganization of the South African Government, which since 1994 has been a nonracial democracy
based on majority rule.
Government and politics
The twentieth century produced several fundamental governmental changes in South Africa. In 1910, the Union of South Africa
was formed as a largely autonomous dominion of Britain. In 1961, South Africa became a republic and left the Commonwealth.
A new constitution in 1984 established a three-house parliament with white, colored and Asian houses, but excluded the black
majority altogether. Lengthy constitutional negotiations in the early 1990s led to the implementation of an interim constitution in
April 1994. The interim constitution was designed to encourage the sharing of power between major parties with cabinet
representation proportionate to their electoral strength. This was effectively a compromise intended to provide continuity in
Government until the adoption of a new constitution.
In December 1996, the parliament passed the Constitution of the Republic of South Africa, 1996, which came into force on
February 4, 1997. The Constitution enshrines the principles of an open and democratic society and also established a relatively
strong central Government and nine provincial governments.
The president is elected by the majority party in parliament to a five year term. The president appoints both the sole deputy
president and all members of the cabinet, without regard to party representation in the parliament.
Ultimately, legislative authority vests in a parliament, which consists of two houses, the National Assembly and the National
Council of Provinces. The National Assembly allows for 400 members elected under a list proportional representation system. The
National Council of Provinces consists of ten members from each of the nine provinces, who are elected by the members of the
provincial legislature. Each of the nine provinces has a provincial legislature and the Constitution contains a schedule which
contains a list of matters over which the provincial legislatures have concurrent competence with the national legislature as well as
certain issues over which the provincial legislatures have exclusive jurisdiction.
The judiciary is structured according to a formal court system comprising a hierarchy of courts, with the highest court in the
land in matters relating to the interpretation, protection and enforcement of the provisions of the Constitution being the
Constitutional court and in relation to non-constitutional matters, the Supreme Court of Appeal. The independence of the judiciary
is entrenched in the Constitution.
On June 2, 1999, South Africa held its second fully democratic national election. Most of South Africa's major political parties
participated in the elections, which were ultimately won by the African National Congress, led by Thabo Mbeki, which won nearly
two thirds of the legislative seats.
Economy
Economic overview
South Africa has a highly developed financial system and legal infrastructure at the core of its economy. However, it faces many
challenges in order to overcome substantial inequalities among its population pursuant to social and economic development. Large
parts of the population do not have access to adequate education, healthcare, housing or basic services in certain areas.
In the years prior to South Africa's first democratic elections in 1994, the economy suffered from the country's political
isolation, economic sanctions and poor economic growth. During the apartheid period, the Government of the Republic of South
Africa professed to follow the capitalist system, although its own economic policies were in many respects interventionist and a
large portion of the economy was owned and controlled by the state, while its racial policies compromised fundamental elements of
capitalism such as the free movement of labor. International sanctions imposed because of the Government's apartheid policies
were increasingly damaging in the late 1980s but ended in the early 1990s as the apartheid era came to a close.
When the African National Congress came to power it was feared that it would pursue socialist policies. In practice, however, its
economic policies have been geared to maximizing economic growth and attracting foreign investment. In recent years, the
economy has benefited from stable political conditions through a transition to a nonracial democracy, normalization of its
international financial and trading relations and improving economic fundamentals resulting from prudent monetary and fiscal
policies.
A-3
The Government's macroeconomic strategy for growth, employment and redistribution is based on promoting the free market
and financial and fiscal discipline and aims at economic growth, job creation and the development and distribution of basic services
to all South Africans. Some of the key elements of this strategy include reducing the budget deficit, restructuring and privatizing
certain state assets, the further relaxation of foreign exchange controls, the maintenance of positive real interest rates and sound
monetary policy and the introduction of tax incentives for foreign direct investments.
Economic indicators
The table below summarizes the main economic indicators for the Republic of South Africa:
Year ended December 31,
1998
1999
2000
2001
Economic summary
Real GDP growth rate (%) . . . . . . . . . . . . . . .
0.8
2.1
3.4
2.2
Current account (ZAR billions) . . . . . . . . . . . .
(12.9)
(3.9)
(3.7)
(1.7)
Current account as a percentage of GDP (%) . . . . .
(1.7)
(0.5)
(0.4)
(0.2)
Gold and gross foreign reserves (ZAR billion) . . . .
31.6
45.4
57.0
90.6
Rand per Dollar average (ZAR . . . . . . . . . . .
5.53
6.11
6.94
8.60
Rand per Dollar at year end (ZAR) . . . . . . . . . .
5.90
6.14
7.57
12.00
Rand per Pound Sterling average (ZAR . . . . . . .
9.16
9.89
10.49
12.39
Rand per Pound Sterling at year end (ZAR) . . . . . .
9.75
9.92
11.28
16.61
Prime lending rate at year end (percentage) . . . . . .
23.00
15.50
14.50
13.00
Inflation rate (headline CPI, annual average
year on year change) (percentage) . . . . . . . . . . .
6.9
5.2
5.3
5.7
Gross domestic product
The South African economy is the largest and most sophisticated on the African continent. The per capita GDP in South Africa
was $2,623 in 2001, which ranks South Africa alongside other middle-income countries such as Chile, Mexico, Hungary, Thailand
and Malaysia. Economic growth has in the past years begun to recover in response to substantial easing of the monetary policy by
the Reserve Bank after the emerging market crisis and an improvement in prospects for world growth and commodity prices. GDP
rose 2.1% in 1999, 3.4% in 2000 and 2.2% in 2001, compared to average annual growth of 0.7% from 1980 through 1990.
South Africa is changing economically from a producer of raw materials to an industrial nation that produces both raw materials
and commercial products. The nation's manufacturing, commerce and services have been built extensively on the foundations of
mining and farming. The manufacturing sector accounted for the largest portion of the GDP at 19.8% in 2001. Industries making
the biggest contributions to manufacturing output were food, motor vehicles, iron and steel and fabricated metal industry. The
financial services sector accounted for 19.0% of GDP in 2001, general Government services accounted for 14.3% of GDP in 2001
and wholesale and retail trade, catering and accommodation accounted for 13.9% of GDP in 2001. Mining still plays an important,
albeit it, a diminishing role in the economy, both directly and indirectly as a result of manufacturing output devoted to the
beneficiation of minerals. Mining accounted for 6.0% of GDP in 2001, while agriculture accounted for only 4.3% of GDP in 2001.
The modern industrial and commercial economy gives a minority of the population, including most whites a standard of living
equivalent to that in Western Europe, but for many who are wholly or partially excluded from the economy, incomes and lifestyles
are characteristic of developing countries. There are marked variations in economic production among different geographic areas in
South Africa. Sources estimate 40% of GDP is produced in Gauteng Province alone, while minimal commercial activity and poor
infrastructure characterize the so called former black states.
Monetary and fiscal policy and inflation
Monetary policy is the sole responsibility of the Reserve Bank, the independence of which is safeguarded by the Constitution.
The Reserve Bank's stated priority is financial stability. Monetary policy settings are guided principally by inflation targets
determined by the South African Ministry of Finance.
Headline consumer price index inflation was reduced to 5.7% in 2001 from 6.9% in 1998, while the CPIX inflation rate was
reduced to 6.6% from 7.0%. This was mainly due to increased trade liberalization in an international deflationary environment. It is
in this context of more competitive product markets and fiscal restraint that the Reserve Bank has set a 3% to 6% average inflation
target for the headline consumer price index excluding the impact of changes in interest rates in metropolitan and other urban areas
for 2002.
The fiscal deficit was cut to 1.4% of GDP in fiscal 2001/2002 data from 2.0% of GDP in fiscal 2000/2001. As of March 31,
2002, the total debt of the South African Government stood at R425 billion, or 42.9% of 2001/2002 GDP.
A-4
Foreign trade and current account
South Africa subscribed to the General Agreement on Tariffs and Trade reached in 1993 and proposed that it be awarded
developing country status. This was not accepted, but the United States backed a proposal that South Africa be treated as an
economy in transition, a status similar to that of the former communist countries of Eastern Europe. In negotiations with the
European Union, South Africa has been treated as a developing country for the purpose of trade preferences in EU markets, but it
has been denied participation in the Lome Convention agreements between the EU and 70 African, Caribbean and Pacific states
because South Africa's export capacity and the size of its economy threaten those states.
South Africa's current account deficit decreased to R1.7 billion, representing 0.2% of GDP in 2001 from R3.7 billion,
representing 0.4% of GDP in 1999. This was largely due to improved trade performance supported by an undervalued real exchange
rate. South Africa's total foreign debt was $36.9 billion, representing 29.3% of GDP, and its foreign currency denominated foreign
debt was $24.9 billion, representing 21.5% of GDP, as of December 31, 2001 compared to total foreign debt of $38.9 billion,
representing 29.9% of GDP, and foreign currency denominated foreign debt of $23.9 billion, representing 18.5% of GDP, as of
December 31, 1999. Gold and foreign exchange reserves of the South African Reserve Bank were R91.0 billion as of December 31,
2001, with the net open forward position of the bank being $4.8 billion. This has subsequently been reduced to $1.7 billion as of
August, 2002.
Currency exchange
The South African Reserve Bank in Pretoria, founded in 1920, is responsible for formulating and implementing monetary policy,
overseeing the banking system and issuing the currency. Between January 1997 and December 2001, the Rand has depreciated at an
average annual rate of 15% against the Dollar, 13% against the UK pound sterling, 7% against the Euro, 13% against the Japanese
Yen. This is primarily due to two events. The first was the emerging markets crisis in 1997 and 1998, which resulted in significant
depreciation in the currencies of emerging markets globally. The second was the deteriorating political situation in Zimbabwe, one
of South Africa's neighbors, during the course of 2000. These events were followed by a rapid fall in the US NASDAQ and a
concurrent flight to quality, including the sell off of all emerging market securities, including South African securities. During 2001
the Rand fell a further 25% against the $. This was largely the result of a deteriorating outlook for global growth which pushed the
current account back into deficit during 2002. The events surrounding September 11 in the US also brought a flight to quality back
into focus. The net result was significant downward pressure on the currency during this period. So far during 2002, the Rand
appreciated by 8% against the Dollar and 2% against the UK pound sterling.
There are a number of exchange control regulations that provide for restrictions on exporting capital from the Common
Monetary Area consisting of the Republic of South Africa, the Republic of Namibia, and the Kingdoms of Lesotho and Swaziland.
Transactions between South African residents, including corporations, and between residents and non-residents of the Common
Monetary Area are subject to these exchange control regulations which are enforced by the South African Reserve Bank.
The present exchange control system in South Africa is used principally to control capital movements. South African companies
are generally not permitted to export capital from South Africa, hold foreign currency or maintain foreign bank accounts without
the approval of the South African exchange control authorities or within authorities granted to authorized dealers in foreign
exchanges. The South African authorities have expressed a commitment to a phased liberalization of exchange controls. Exchange
controls were partially relaxed in 1996 and further relaxations occurred since then. The stated objective of the authorities is to reach
a point where there is equality of treatment between residents and non-residents in relation to inflows and outflows of capital.
Unlimited outward transfers of capital are not permitted at this stage, but the emphasis of regulation is expected to increasingly be
on the positive aspects of prudential financial supervision. Authorized dealers in foreign exchange may, against the production of
suitable documentary evidence, provide foreign exchange or hedging instruments to South African residents in respect of fixed and
ascertained foreign exchange commitments or accruals covering transactions permissible pursuant to exchange control.
Labor and employment
According to Statistics South Africa, the rate of unemployment in South Africa in 2001 was 29.5%. Unemployment is much
higher among the black population than other groups, and lowest among whites and Asians. Due to the inadequate education and
training opportunities available to blacks, the South African labor force has a high proportion of lower skilled workers. The
Government is attempting to reduce the unemployment figures through the introduction of programs such as the South African
Skills Development Act, 1999, which requires employers to contribute an amount equal to 1% of their monthly payroll to a fund
which is utilized for skills enhancement and job creation.
Approximately 20% of the economically active population in South Africa was unionized in 2001. There are well-developed
collective bargaining structures in place and many of the unions have affiliated themselves with trade union federations such as the
Congress of South African Trade Unions and the National Council of Trade Unions. A number of the trade unions and their
leaderships have close links to various political parties. Similarly, many employers have become affiliated with the employers
organizations and federations of these organizations for the purposes of collective bargaining with trade unions. The South African
National Economic Development and Labour Council is a further forum which facilitates discussion between the South African
Government, business and organized labor on various issues relating to the economy.
A-5
The South African Labour Relations Act, 1995, governs relations between employees and employers. The Labour Relations Act
provides for more expansive rights of union organization, wider power to strike, the establishment of workplace forums and the
protection of employees from unfair dismissal. It also promotes the decentralization of decision making to workplace and company
levels, while centralizing the major collective bargaining issues at industry sector levels. The Labour Relations Act essentially seeks
to establish simpler and more effective procedures for arbitration, conciliation and mediation. The Labour Relations Act also affords
benefits to employees. The introduction of the Commission for Conciliation, Mediation and Arbitration, to which disputes must be
referred prior to industrial action, significantly raises the prospects of having labor disputes resolved.
Organized labor represented by the trade union federations is opposed to the privatization of state assets and consequent
reduction in staff numbers. This viewpoint has led to past protest action and the possibility of future disruption to productivity.
Three other important statutes which enhance the rights of employees in South Africa are:
the South African Basic Conditions of Employment Act, 1997, which increased the minimum labor standards applicable in
South Africa and extended the categories of employees to whom the minimum standard legislation is applicable;
the South African Employment Equity Act, 1998, which obliges all employers, other than exempted small employers, to
implement affirmative action measures designed to ensure that suitably qualified persons from previously disadvantaged
groups have equal employment opportunities; and
the Occupational Health and Safety Act, 1993, designed to prevent illnesses and accidents by imposing duties on the
employer to remove or mitigate hazards to health and safety.
B-1
EXTRACTS FROM TELKOM'S NEW MEMORANDUM AND
ARTICLES OF ASSOCIATION
"21. DIRECTORS
21.1
Subject to the provisions of the Act, the number of directors shall be 11 (eleven).
21.2
The Class B Shareholder shall be entitled to appoint directors based upon the percentage of the issued ordinary shares
owned by the Class B Shareholder at the time of such appointment as provided below:
21.2.1
while the Class B Shareholder owns at least 25% (twenty-five percent) of the issued ordinary shares, the
Class B Shareholder shall be entitled to appoint 5 (five) directors, including 2 (two) executive directors;
21.2.2
while the Class B Shareholder owns at least 20% (twenty percent), but less than 25% (twenty-five percent), of
the issued ordinary shares, the Class B Shareholder shall be entitled to appoint 4 (four) directors, including
2 (two) executive directors;
21.2.3
while the Class B Shareholder owns at least 15% (fifteen percent), but less than 20% (twenty percent), of the
issued ordinary shares, the Class B Shareholder shall be entitled to appoint 3 (three) directors, including 2 (two)
executive directors;
21.2.4
while the Class B Shareholder owns at least 10% (ten percent), but less than 15% (fifteen percent), of the issued
ordinary shares, the Class B Shareholder shall be entitled to appoint 2 (two) directors, including 2 (two)
executive directors; and
21.2.5
while the Class B Shareholder owns at least 5% (five percent), but less than 10% (ten percent), of the issued
ordinary shares, the Class B Shareholder shall be entitled to appoint 1 (one) director, who may be an executive
director.
21.3
The Class A Shareholder shall be entitled to appoint directors based upon the percentage of the issued ordinary shares
owned by the Class A Shareholder at the time of such appointment as provided below:
21.3.1
while the Class A Shareholder owns at least 25% (twenty-five percent) of the issued ordinary shares, the
Class A Shareholder shall be entitled to appoint 5 (five) directors, including 2 (two) executive directors;
21.3.2
while the Class A Shareholder owns at least 20% (twenty percent), but less than 25% (twenty-five percent), of
the issued ordinary shares, the Class A Shareholder shall be entitled to appoint 4 (four) directors, including
1 (one) executive director;
21.3.3
while the Class A Shareholder owns at least 15% (fifteen percent), but less than 20% (twenty percent), of the
issued ordinary shares, the Class A Shareholder shall be entitled to appoint 3 (three) non-executive directors;
21.3.4
while the Class A Shareholder owns at least 10% (ten percent), but less than 15% (fifteen percent), of the issued
ordinary shares, the Class A Shareholder shall be entitled to appoint 2 (two) non-executive directors; and
21.3.5
while the Class A Shareholder owns at least 5% (five), but less than 10% (ten percent), of the issued ordinary
shares, the Class A Shareholder shall be entitled to appoint 1 (one) non-executive director.
21.4
Subject to articles 34 and 37, a general meeting shall have the power, from time to time, to appoint such number of
directors (the "ordinary directors") not appointed pursuant to article 21.2 or article 21.3 provided that the total number
of directors shall not at any time exceed the maximum number fixed by or in accordance with these articles, and
provided further that a general meeting shall not be entitled to fill a vacancy of a Class A director or a Class B director.
21.5
The Class A Shareholder shall have the power to remove or replace any Class A director at any time, with or without
cause. The Class A Shareholder shall have the exclusive power to fill a vacancy created by the removal or resignation of
any Class A director.
21.6
The Class B Shareholder shall have the power to remove or replace any Class B director at any time, with or without
cause. The Class B Shareholder shall have the exclusive power to fill any vacancy created by the resignation or removal
of any Class B director.
21.7
The appointment or removal of a Class A director or Class B director in terms of this article 21 shall be made by written
notice to the company, signed by or on behalf of the Class A Shareholder or Class B Shareholder, as the case may be,
and shall be operative as soon as the written notice is received at the office.
21.8
The continuing directors may act, notwithstanding any vacancy in their number. If, and for so long as, the number of
continuing directors is reduced below the minimum number of directors required to act as such for the time being, the
continuing directors may act only to:
21.8.1 increase the number of directors to the required minimum; or
B-2
21.8.2
summon a general meeting, provided that if there is no director able or willing to act, then any member may
convene a general meeting for that purpose.
21.9
Neither a director nor an alternate director shall be obliged to hold any qualification shares.
21.10
Subject to article 30.4, the remuneration of the directors for their services as such shall be determined from time to time
by the directors, taking into account the recommendations of the remuneration committee which shall be appointed by
the directors.
21.11
Subject to article 30.4, the directors shall be paid all travelling, subsistence and other expenses properly incurred by
them in the execution of their duties in or about the business of the company and in attending general meetings of
directors or of committees of the directors and which are authorised or ratified by the directors.
21.12
Any director who:
21.12.1 serves on any executive or other committee; or
21.12.2 devotes special attention to the business of the company; or
21.12.3 goes or resides outside the Republic for the purpose of the company; or
21.12.4
otherwise performs or binds himself to perform services which, in the opinion of the directors, are outside the
scope of the ordinary duties of a director,
may be paid such extra remuneration or allowances in addition to or in substitution of the remuneration to which he may
be entitled as a director, as the directors, excluding the director in question, may from time to time determine."
"24. CLASS A RESERVED MATTERS
24.1
For so long as the Class A Shareholder shall be a significant shareholder, and if and to the extent that any of the
following actions are not within the scope of the exclusive powers and authority delegated to the operating committee,
none of the following actions shall be taken by or in respect of the company or any subsidiary of the company (as
applicable) unless the action in question is (i) authorised by the board and (ii) the authorising resolution of the board
shall have received the affirmative vote of at least 2 (two) Class A directors:
24.1.1
approval or amendment by the company of the strategic objectives of the company or (to the extent legally
permissible) the strategic objectives of any subsidiary of the company;
24.1.2
any determination of or amendment to the management structure of the company or the schedule of
authorisations, provided that approval thereof shall not be unreasonably withheld;
24.1.3
any determination (including any amendment) made by the board (a) at any time before May 8, 2004 with
respect to the scope or revocation of the exclusive powers and authority of the operating committee or the
HRRC or (b) at any time before, on or after 8 May 2004 with respect to the countermanding, amending or
supplementing of any decision or action made or taken by the operating committee or the HRRC before that
date pursuant to their respective exclusive powers and authority;
24.1.4
formation of any committee of, or the delegation of any authority to such committee by, the board, other than as
expressly set out in these articles;
24.1.5
any increase or reduction in the issued share capital of the company or any subsidiary of the company;
24.1.6
any issue, conversion or allotment by the company of shares or other authorised shares, securities convertible
into shares or securities of the company or any issue, conversion or allotment by any subsidiary of the company
of any shares or authorised shares, securities convertible into shares or securities of that subsidiary;
24.1.7
approving or making of the dividend policy from time to time including the declaration or distribution of any
dividends by the company or any subsidiary of the company;
24.1.8
any material change in the business of the company or of any subsidiary of the company;
24.1.9
incurring, creating or assuming by the company of any indebtedness which would cause the debt/equity ratio of
the company, or of the company on a consolidated basis, to exceed 1.00;
24.1.10
any merger or consolidation involving the company where the aggregate of the payments and other
consideration given by the parties to such transaction exceeds, or any transfer of assets or liabilities of the
company or any subsidiary of the company where the sale price of such assets exceeds, in either case 5% (five
percent) of the company's gross revenues in the financial year immediately preceding the financial year in
which such transaction occurs;
24.1.11
execution, renewal, amendment or termination of any contract (for the avoidance of doubt, not including the
company's licences) between the company or any subsidiary of the company and any member or any affiliate of
such member who owns, directly or indirectly, in excess of 10% (ten percent) of the total issued ordinary shares
of the company, unless the Class A Shareholder or any of its affiliates have an interest in the contract in
question which conflicts with the company's or the applicable subsidiary's interest;
B-3
24.1.12
establishment by the company of any direct or indirect subsidiary;
24.1.13
any change to the name under which the company or any subsidiary of the company does business;
24.1.14
any change in the company's financial year or tax year;
24.1.15
any winding up or liquidation of the company or any subsidiary of the company;
24.1.16
after 7 May 2004 and, subject to article 39.4, insofar as the Act requires any such appointment to be made by
the directors, appointment of the company's auditors;
24.1.17
materially altering the terms of any employee share ownership scheme approved by a general meeting; and
24.1.18
any change or proposal to the shareholders for a change in the number of directors making up the board at any
time.
24.2
For so long as the Class A Shareholder shall be a significant shareholder, and if and to the extent that any of the actions
set forth in this article 24 are within the exclusive powers and authority conferred upon the operating committee, none
of such actions shall be taken by or in respect of the company or any subsidiary of the company (as applicable) unless
(a) authorised by the operating committee and (b) the authorising resolution of the operating committee shall have
received the affirmative vote of at least 1 (one) operating committee member appointed by the Class A Shareholder.
24.3
Notwithstanding anything to the contrary anywhere else in these articles the provisions of articles 24.1, 24.2 and 25
shall in any event fall away and be of no further force or effect at the end of 8 (eight) years from the listing date."
"25. ADDITIONAL CLASS A RESERVED MATTERS
The Class A reserved matters enumerated in article 24 shall also include, as additional Class A reserved matters, the approval
or amendment by the company of any business plans and annual budgets and (to the extent legally permissible) any business
plans or budgets or their equivalent of any subsidiary of the company, subject to the following:
25.1
such matters shall be included only if the Class A Shareholder is a significant shareholder; and
25.2
such matters shall not be included unless and until written notice permitting them to be included is given to the
company by the Class A Shareholder and the Class B Shareholder."
"26. CLASS B RESERVED MATTERS
26.1
For so long as the Class B Shareholder shall be a significant shareholder, and if and to the extent that any of the
following actions are not within the scope of the exclusive powers and authority delegated to the operating committee,
none of the following actions shall be taken by or in respect of the company or any subsidiary of the company (as
applicable) unless the action in question is (i) authorised by the board and (ii) the authorising resolution of the board
shall have received the affirmative vote of a majority of all the Class B directors:
26.1.1
approval or amendment by the company of any business plan or any annual budget or the company's strategic
objectives, or (to the extent legally permissible) any business plans or budgets or their equivalent of any
subsidiary of the company or of the strategic objectives of any subsidiary of the company;
26.1.2
any determination of or amendment to the management structure of the company or the schedule of
authorisations;
26.1.3
any determination (including any amendment) made by the board (a) at any time before May, 8 2004 with
respect to the scope or revocation of the exclusive powers and authority of the operating committee or the
HRRC or (b) at any time before, on or after 8 May 2004 with respect to the countermanding, amending or
supplementing of any decision or action made or taken by the operating committee or the HRRC before that
date pursuant to their respective exclusive powers and authority;
26.1.4
formation of any committee of, or the delegation of any authority to such committee by, the board, other than as
expressly set out in these articles;
26.1.5
appointment, dismissal and replacement of members of the company's management provided to the company by
the Class B Shareholder, or by any other person at the Class B Shareholder's instance but with the company's
consent, but only where the appointment, dismissal or replacement is to be made by the company in breach of
or otherwise than in accordance with the requirements of the strategic services agreement;
26.1.6
establishing any new, or materially amending any existing, employee compensation policies or pension,
retirement, death benefit, medical aid or other employee benefit or welfare plans, or materially altering the terms
of any employee share ownership scheme approved by a general meeting if not specifically authorised in an
annual budget;
26.1.7
any increase or reduction in the issued share capital of the company or any subsidiary of the company;
B-4
26.1.8
any issue, conversion or allotment by the company of shares or other authorised shares, securities convertible
into shares or other securities of the company or any issue, conversion or allotment by any subsidiary of the
company of any shares, securities convertible into shares or other securities of that subsidiary;
26.1.9
approving or making of the dividend policy from time to time including the declaration or distribution of any
dividends or other distributions by the company or any subsidiary of the company;
26.1.10
approval of the annual financial statements, and any other publicly released financial statements, of the company
or any subsidiary of the company;
26.1.11
any change in the financial year or tax year of the company or any subsidiary of the company;
26.1.12
any material change in the accounting policies of the company or any subsidiary of the company other than
changes which bring the company's accounting policies in conformity with IAS or its licences;
26.1.13
any material change in the business of the company or any subsidiary of the company or commencement of any
new business by the company or any subsidiary of the company;
26.1.14
incurring, creating or assuming by the company or any subsidiary of the company of any indebtedness if the
debt/equity ratio of the company, or of the company on a consolidated basis, or of any individual subsidiary of
the company, as applicable, exceeds (or would as a result thereof exceed) 1.00;
26.1.15
the granting by the company or any subsidiary of the company of any guarantee or encumbrance not specifically
authorised in an annual budget where such guarantees or encumbrances would exceed in the aggregate
R50,000,000 (fifty million Rands) during any financial year;
26.1.16
the company or any subsidiary of the company entering into any single transaction, contract or commitment (or
series of related transactions, contracts or commitments), or waiving, terminating, modifying or amending any
rights of the company or any subsidiary of the company in connection with or under any transactions, contracts
or commitments (or series of related transactions, contracts or commitments), including, without limitation, for
the acquisition or disposal of any property or assets, if such transaction, contract or commitment (or series of
related transactions, contracts or commitments) requires payments or other consideration by the parties thereto
with an aggregate value in excess of:
26.1.16.1
R100,000,000 (one hundred million Rands) until May 7, 2004; and
26.1.16.2
R200,000,000 (two hundred million Rands) thereafter;
unless the Class B Shareholder or any of its affiliates have a material interest in the transaction, contract or
commitment (or series of related transactions, contracts or commitments) in question which conflicts with the
company's or the applicable subsidiary's interest;
26.1.17
any transfer of, or any agreement to transfer, amend, terminate or renew the licences or any other
telecommunication or broadcasting licence which may at any time be held by the company or any subsidiary of
the company;
26.1.18
the company or any subsidiary of the company commencing or settling any litigation, arbitration or other
similar proceeding where
26.1.18.1
the aggregate of the claims by all parties involved exceeds R50,000,000 (fifty million Rands); or
26.1.18.2
the dispute involves or relates to any competitor of the company or of any subsidiary of the company,
or involves or relates to the government; or
26.1.18.3
there is a reasonable likelihood that the outcome of such proceeding could otherwise have a material
effect (whether adverse or positive) on the business, financial condition or prospects of the company
or any subsidiary of the company,
unless the Class B Shareholder or any of its affiliates are parties to such litigation, arbitration or other similar
proceeding and have an interest therein which conflicts with the company's or the applicable subsidiary's
interest;
26.1.19
execution, renewal, amendment or termination of any contract (for the avoidance of doubt, not including the
licences) between the company or any subsidiary of the company, on the one hand, and any member who owns,
directly or indirectly, in excess of 10% (ten percent) of the total issued ordinary shares of the company or any
affiliate of such member (or any officer or director of such member or affiliate or person which owns more than
10% (ten percent) of the issued ordinary shares of such member or affiliate), on the other hand, unless in
relation to any such contract (but excluding the strategic services agreement) the Class B Shareholder or any of
its affiliates have a material interest therein which conflicts with the company's or the applicable subsidiary's
interest;
26.1.20
establishment by the company or any subsidiary of the company of any direct or indirect subsidiary or any joint
venture, partnership or similar arrangement;
26.1.21
any change to the name under which the company or any subsidiary of the company does business;
B-5
26.1.22
either of the following:
26.1.22.1
any merger or consolidation involving the company or any subsidiary of the company where the
aggregate of the payments and other consideration given by the parties to such transaction exceeds, or
any transfer of assets or liabilities of the company or any subsidiary of the company (in one or a series
of related transactions) where the value of the transferred assets or liabilities exceeds, in either case
R50,000,000 (fifty million Rands); or
26.1.22.2
if the company has received written notice from the Class A Shareholder and the Class B Shareholder
that article 26.1.22.1 is no longer effective, then any merger or consolidation involving the company
or any subsidiary of the company where the aggregate of the payments and other consideration given
by the parties to such transaction exceeds, or any transfer of assets or liabilities of the company or any
subsidiary of the company (in one or a series of related transactions) where the value of the
transferred assets or liabilities exceeds, in either case 5% (five percent) of the company's gross
revenues in the financial year immediately preceding the financial year in which such transaction
occurs,
unless the Class B Shareholder or any of its affiliates have a material interest in any such merger or
consolidation which conflicts with the company's or the applicable subsidiary's interest;
26.1.23
any winding up or liquidation of the company or any subsidiary of the company;
26.1.24
the company or any subsidiary of the company entering into any agreement having the effect of restricting the
business or activities which the company or any subsidiary of the company may conduct;
26.1.25
after May 7, 2004, and, subject to article 39.4, insofar as the Act requires any such appointment to be made by
the directors, appointment of the company's auditors; and
26.1.26
any change or proposal to the shareholders for a change in the number of directors making up the board at any
time.
26.2
For so long as the Class B Shareholder shall be a significant shareholder, and if and to the extent that any of the actions
set forth in this article 26 are within the exclusive powers and scope of authority conferred upon the operating
committee, none of such actions shall be taken by or in respect of the company or any subsidiary of the company (as
applicable) unless (a) authorised by the operating committee and (b) the authorising resolution of the operating
committee shall have received the affirmative vote of at least 1 (one) operating committee member appointed by the
Class B Shareholder.
26.3
The Class B reserved matters enumerated in this article 26 shall not include those reserved matters set forth in
articles 26.1.2, 26.1.3, 26.1.4, 26.1.6, 26.1.16, 26.1.18, 26.1.20 and 26.1.22.1 if the company receives written notice to
that effect from the Class A Shareholder and the Class B Shareholder pursuant to their obligation to give such notice
at the end of any period of time in terms of any shareholders' agreement between them if and after Thintana
Communications LLC (as the holder of the Class B Share at or immediately after the date of registration of the special
resolution adopting these articles) transfers the Class B Share to a transferee permitted by any such shareholders'
agreement.
26.4
Notwithstanding anything to the contrary anywhere else in these articles, the provisions of articles 26.1, 26.2 and 26.3
shall in any event fall away and be of no further force or effect at the end of 8 (eight) years from the listing date."
"36. OPERATING COMMITTEE
The Company shall have an operating committee until May 7, 2004, which shall be constituted in accordance with, and be
subject to the following provisions:
36.1
Membership
36.1.1
The operating committee shall consist of 5 (five) voting members and 4 (four) ex officio non-voting members,
made up as follows:
36.1.1.1
the CEO, 2 (two) Class A Shareholder voting opco appointees and 2 (two) Class B Shareholder voting
opco appointees, all as ex officio voting members; and
36.1.1.2
2 (two) Class A Shareholder non-voting opco appointees and 2 (two) Class B Shareholder non-voting
opco appointees, all as non-voting members.
36.1.2
The Class A Shareholder shall, while it is a significant shareholder, be entitled to appoint the 2 (two) Class A
Shareholder voting opco appointees and the 2 (two) Class A Shareholder non-voting opco appointees (all of
whom shall be known as the "Class A opco appointees") and 1 (one) or more alternates to each of them (which
alternates may also be Class A opco appointees) and shall have the power to remove and to replace and fill any
vacancies in respect of, any of the members and alternate members so appointed by the Class A Shareholder,
provided that if at any time the Class A Shareholder ceases to be a significant shareholder the board shall be
entitled, as if it were the Class A Shareholder, to make all the appointments to the operating committee that the
Class A Shareholder would have been able to make in terms of this article 36.1.2 had it not ceased to be a
significant shareholder.
B-6
36.1.3
The Class B Shareholder shall, while it is a significant shareholder, be entitled to appoint the 2 (two) Class B
Shareholder voting opco appointees and the 2 (two) Class B Shareholder non-voting opco appointees (all of
whom shall be known as the "Class B opco appointees") and 1 (one) or more alternates to each of them (which
alternates may also be Class B opco appointees) and shall have the power to remove and to replace and fill any
vacancies in respect of, any of the members and alternate members so appointed by the Class B Shareholder,
provided that if at any time the Class B Shareholder ceases to be a significant shareholder the board shall be
entitled, as if it were the Class B Shareholder, to make all the appointments to the operating committee that the
Class B Shareholder would have been able to make in terms of this article 36.1.3 had it not ceased to be a
significant shareholder.
36.1.4
The CEO shall be the chairperson of the operating committee.
36.1.5
Any appointment or removal by the Class A Shareholder or the Class B Shareholder in terms of article 36.1
shall be made by written notice to the company, signed by or on behalf of the Class A Shareholder or Class B
Shareholder, as the case may be, and shall be operative as soon as the written notice is received at the office.
36.2
Powers of the Operating Committee
36.2.1
Subject to article 36.2.2, the operating committee shall have the exclusive power and authority to:
36.2.1.1
implement any business plan or annual budget; and implement (in conformity with any business plan
or annual budget) all issues and matters relating to achievement of the company's obligations under
the licenses, including, without limitation, network expansion, equipment procurement, tariff setting
and packaging, customer service and marketing;
36.2.1.2
prepare, review and recommend to the board business plans and any amendment of the business plans
as provided in article 36.13 and each and any business plan of any subsidiary of the company and any
amendment of such business plans;
36.2.1.3
prepare, review and recommend to the board the annual budgets and any amendment of the annual
budgets and all budgets of each subsidiary of the company and any amendment of such budgets, and
approve such annual budget and budgets (and amendments) to the extent provided in article 36.12;
36.2.1.4
implement the management structure and recommend to the board any amendment thereto;
36.2.1.5
review and recommend to the board any amendment to the schedule of authorisations; and
36.2.1.6
delegate authority to, and direct members of, the company's management with respect to any matters
that are within the authority of the operating committee pursuant to this article 36.2.
36.2.2
The operating committee's exclusive powers and authority set out in article 36.2.1 shall be revocable in whole
or in part at any time by the board as a board reserved matter in accordance with articles 24 and 26.
36.2.3
The board may also determine as a board reserved matter in accordance with articles 24 and 26, to
countermand, amend or supplement any decisions or actions made or taken by the operating committee
pursuant to its exclusive powers and authority set out in article 36.2.1.
36.3
Term of the Operating Committee
36.3.1
Unless determined otherwise by the board as a board reserved matter in accordance with articles 24 and 26, the
operating committee shall terminate and cease to exist after May, 7 2004 and all the powers and any authority
held by it at that date shall revert to the board. However, the board may determine, as a board reserved matter in
accordance with articles 24 and 26, to extend the term of the operating committee or to re-establish the
operating committee, in each case with such authority as the board may determine as a reserved matter in
accordance with articles 24 and 26.
36.4
Meetings of the operating committee
36.4.1
Number of Meetings and Voting
The operating committee may meet for the dispatch of business, adjourn and otherwise regulate its meetings as
it thinks fit, provided that the operating committee shall meet at least once every month.
36.4.2
Quorum
The quorum necessary for the transaction of the business of the operating committee shall be at least 3 (three)
voting members (or their alternates); provided, that notwithstanding that a quorum may be present at any
meeting of the operating committee, no action shall be taken at any such meeting (other than a decision to
dissolve or adjourn such meeting) unless the CEO (or his alternate) is present, and at least 1 (one) of the Class
A Shareholder voting opco appointees (or their alternates) and 1 (one) of the Class B Shareholder voting opco
appointees (or their alternates) are present. If the CEO (or his alternate) is not present at a meeting of the
operating committee otherwise duly constituted, the meeting shall be dissolved or adjourned for at least
24 (twenty four) hours, and if such meeting is so adjourned then the presence of the CEO (or his alternate) shall
not be required to take any action at any resulting adjourned meeting. If none of the Class A Shareholder voting
B-7
opco appointees (or their alternates) or none of the Class B Shareholder voting opco appointees (or their
alternates) are present at a meeting of the operating committee otherwise duly constituted, the meeting shall be
dissolved or adjourned for at least 24 (twenty four) hours and if the meeting is so adjourned then the presence
of a Class A Shareholder voting opco appointee (or his alternate) or Class B Shareholder voting opco appointee
(or his alternate), as the case may be, shall not be required to take any action at any resulting adjourned
meeting.
36.4.3
Convening a Meeting
Either the CEO, a Class A Shareholder voting opco appointee or a Class B Shareholder voting opco appointee
may convene a meeting of the operating committee at any time. At the request of the CEO, a Class A
Shareholder voting opco appointee or a Class B Shareholder voting opco appointee the secretary of the
company shall convene a meeting.
36.4.4
Notice for Meetings
The operating committee shall determine the number of days notice to be given for operating committee
meetings (and the adjournment thereof) and the form and the medium for giving any such notice.
36.4.5
Dissolution and Adjournment of Meetings
The chairperson of the operating committee may, with the unanimous consent of any meeting at which a
quorum is present (and shall if so directed by the meeting), dissolve any meeting of the operating committee or
adjourn and give notice accordingly of any meeting of the operating committee from time to time and from
place to place. Should a quorum not be present at any meeting of the operating committee within 30 (thirty)
minutes after the appointed time, the chairperson of the meeting shall:
36.4.5.1
adjourn such meeting, subject to article 36.4.2, to such time and such place as the meeting shall
determine; or
36.4.5.2
dissolve such meeting.
36.4.6
Business at Adjourned Meetings
No business shall be transacted at the resumption of any adjourned meeting of the operating committee other
than the business left unfinished at the meeting from which the adjournment took place.
36.5
Chairperson of operating committee Meetings
The CEO shall act as the chairperson of meetings of the operating committee; provided, that if at any meeting the CEO
is not present in person within 5 (five) minutes after the time appointed for holding the meeting, the voting members
present shall elect a person to be chairperson of the meeting. The CEO shall not be considered present in person at the
meeting (for the purpose of acting as chairperson of the meeting only) by virtue of his alternate being present at the
meeting.
36.6
Voting
All matters put to a vote at any meeting of the operating committee shall be approved only by an affirmative vote of a
majority of the members of such committee, and in the event of an equality of votes on any matter to be considered by
the operating committee, the Class A Shareholder voting opco appointee present at the meeting, or if there is more than
1 (one) any one of them as they may decide as and when the equality of votes occurs, shall have a casting vote.
36.7
Minutes
36.7.1
The operating committee shall cause minutes to be kept, which shall include the following particulars:
36.7.1.1
the names of the voting members and non-voting members present (or, as the case may be, their
alternates) at each meeting of the operating committee; and
36.7.1.2
all resolutions proposed and passed or not passed and such other proceedings at each meeting as the
operating committee thinks fit.
36.7.2
The secretary of the company shall act as secretary of the operating committee; provided, that if at any meeting
the secretary of the company is not present in person within 5 (five) minutes after the time appointed for
holding the meeting or if the voting members present otherwise determine, the voting members present shall
elect a person to be the secretary for the meeting.
36.7.3
Signing of the Minutes
The minutes of each meeting of the operating committee shall be signed by:
36.7.3.1
the chairperson of the meeting or by the chairperson of the next succeeding meeting; and
36.7.3.2
any 1 (one) of the Class B opco appointees who was present at the meeting at which the proceedings
took place.
B-8
36.7.4
Extract from Minutes
Any extract from or copy of the minutes of a meeting of the operating committee purporting to be signed by :
36.7.4.1
any 1 (one) of the Class B opco appointees; and
36.7.4.2
the chairperson of the meeting or by any voting member of the operating committee or by the
secretary of such meeting,
shall be prima facie proof of the contents of the minutes.
36.8
Committee meetings by Conference Call
The operating committee may meet by telephone or video conference if all members can hear all other members.
A member of the operating committee who participates in a meeting of the operating committee by either of those
means shall be considered present at the meeting for all purposes.
36.9
Attendees
The board, the Class A Shareholder and the Class B Shareholder may from time to time designate representatives who
may attend any and all meetings of the operating committee. The number of representatives whom the board, the Class
A Shareholder or the Class B Shareholder may so designate for attendance at any meeting of the operating committee
shall not exceed 3 (three). Such representatives may be designated by the board, the Class A Shareholder or the Class B
Shareholder, as the case may be, for attendance at any meeting by notice to the operating committee at any time prior to
the commencement of the meeting. Any such representatives who attend a meeting of the operating committee shall be
entitled to address the operating committee at the request of any member thereof with respect to any matter on the
agenda for the applicable meeting but shall not be entitled to vote.
36.10
Written Resolutions of the operating committee
36.10.1
Authority
A duly minuted resolution in writing signed by all the voting members of the operating committee or, as the
case may be, their respective alternates, shall be as valid and effectual as a resolution passed at a meeting of the
operating committee duly called and constituted.
36.10.2
Requirements for Written Resolutions
Any such written resolution may consist of 1 (one) or more documents signed by 1 (one) or more voting
members of the operating committee (or as the case may be, their respective alternates), shall have regard to the
provisions of section 242(2) of the Act and shall be delivered to the secretary of the company without delay and
be recorded by him or her in the company's minute book for the operating committee.
36.10.3
Date of Approval
Each such written resolution shall be deemed to have been passed on the day it was signed by the last voting
member, unless a statement to the contrary is made in the resolution.
36.10.4
Confirmation of Written Resolution
A written resolution, which is not signed by all the voting members of the operating committee, shall be
inoperative until confirmed by a meeting of the operating committee.
36.11
Reports to the Board
The chairperson of the operating committee shall report on all action and activities taken by the operating committee
and on the current operations and status of the company at each meeting of the board.
36.12
Annual Budgets
36.12.1
Until the date on which the operating committee terminates in terms of article 36.3.1, or its authority under
article 36.2.1.3 in respect of the annual budget is revoked pursuant to article 36.2.2, the following provisions
shall apply:
36.12.1.1
The operating committee shall, not later than 1 (one) month prior to the commencement of each
financial year of the company, cause to be prepared in accordance with article 36.12.1.3 below a
proposed annual budget, which shall be approved as provided in article 36.12.1.4 below. Each such
proposed annual budget shall include with respect to the company and its subsidiaries for such
financial year:
(i)
budgeted capital and operating expenditures;
(ii)
a budgeted income statement;
(iii)
a budgeted balance sheet;
(iv)
budgeted borrowings and repayment of borrowings; and
(v)
a budgeted cash flow statement.
36.12.1.2
Each annual budget shall generally be prepared with such detail as is commercially reasonable and
customary for a business which is similar in size to the company's business.
B-9
36.12.1.3
Each annual budget shall be prepared by or under the direction of such manager or managers as
determined by the operating committee from time to time. The operating committee shall engage in
early consultation with the board and shall give due consideration to the views of the board with
respect to the preparation of each annual budget.
36.12.1.4
The board shall consider, and shall act upon (i.e., approve or disapprove), as a board reserved matter
in accordance with articles 25 and 26, any annual budget approved by the operating committee and
presented to the board by the operating committee, within 10 (ten) days after each director receives a
copy of the proposed annual budget. If the board does not approve the proposed annual budget
presented to it, then the operating committee shall prepare a second proposed annual budget for the
same financial year for submission to the board for approval, which may be the same as the first
proposal; provided, that in connection with the preparation of such second proposed annual budget,
the operating committee shall consult with the board and shall give due consideration to the reasons
expressed by the board for rejecting the operating committee's first proposal for such annual budget.
The board shall consider and shall approve or disapprove as a board reserved matter in accordance
with articles 25 and 26, the second proposed annual budget for such financial year presented by the
operating committee to the board within 10 (ten) days after each director receives a copy of the
second proposed annual budget. If the board fails to approve the second proposed annual budget, then
the operating committee shall thereafter be permitted to adopt an annual budget for such financial year
in its discretion, except that budgeting capital expenditures and budgeted total operating expenses for
such financial year shall not be more than 120% (one hundred twenty percent) of the amounts
projected for such items in the business plan for such financial year.
36.12.1.5
The operating committee may amend annual budgets subject to compliance with the procedures
detailed in article 36.12.1.4 above.
36.12.2
After the date on which the operating committee terminates in terms of article 36.3.1, or its authority under
article 36.2.1.3 in respect of the annual budget is revoked pursuant to article 36.2.2, the board in its discretion
may adopt and amend the annual budget as a board reserved matter in accordance with articles 25 and 26.
36.13
Business plan
36.13.1
Until the date on which the operating committee terminates in terms of article 36.3.1, or its authority under
article 36.2.1.2 in respect of the business plan is revoked pursuant to article 36.2.2:
36.13.1.1
The operating committee shall review the business plan of the company from time to time and in any
event on an annual basis at least 1 (one) month prior to the commencement of each financial year of
the company. The board may amend the business plan (and may adopt other business plans, and
amend such other business plans) from time to time, as a board reserved matter in accordance with
articles 25 and 26, only upon the recommendation of the operating committee.
36.13.1.2
If at any time the board shall fail to adopt a business plan or approve any amendment to the business
plan recommended by the operating committee, then the procedures set forth in article 36.12.1.4 (but
excluding the last sentence) shall apply mutatis mutandis, provided that if the board fails to approve
the second of any proposed business plan recommended to it by the operating committee, then the
operating committee shall thereafter be permitted to adopt a business plan for the financial year in
question in its discretion, subject to the provisions of article 36.13.3.
36.13.2
After the date on which the operating committee terminates in terms of article 36.3.1, or its authority under
article 36.2.1.2 in respect of the business plan is revoked pursuant to article 36.2.2, the board in its discretion
may adopt and amend business plans as a board reserved matter in accordance with articles 25 and 26.
36.13.3
The foregoing provisions of this article 36.13 notwithstanding, if the annual budget for any financial year which
is approved in accordance with these articles is inconsistent with any business plan with respect to such
financial year, then such business plan shall be deemed automatically amended with respect to such financial
year as appropriate to take into account the effects of the annual budget so approved (and, if applicable, as so
amended).
36.14
Dissolution of the Operating Committee
If at any time there shall cease to be a Class B Share in existence, the provisions of this article 36 shall cease to be of
any further force or effect."
"43. LIMITATION ON SHARE OWNERSHIP
43.1
The purpose of this article 43 is to prevent any person or persons acting in concert, other than an exempt shareholder,
from owning, directly or indirectly, more than 15% (fifteen percent) of the issued shares of any class of shares in the
company."
As to United States Law
Paul, Hastings, Janofsky & Walker LLP
75 East 55th Street
New York, NY 10022
As to South African Law
Huntley Mdlulwa Inc.
1st Floor, Sabvest House
46A Wierda Valley
Sandton, 2196
Suite 356
Private Bag X6
Benmore, 2010
As to South African Law
Maponya Inc.
2nd Floor
Sanlam Centre
Pretoria, 0002
P O Box 13659
The Tramshed, Pretoria, 0126
As to South African Law
Qunta, Inc.
20th Floor, ABSA Centre
2 Riebeeck Street
Cape Town, 8001
P O Box 3713
Cape Town, 8000
As to South African Law
Werksmans Inc.
155, 5th Street
Sandown 2196
Private Bag 10015,
Sandton, 2146
As to South African Law
Nalane Manaka Attorneys
14th Floor
Sanlam Centre Building
Jeppe and von Weilligh Streets
Johannesburg, 2001
P O Box 2787
Johannesburg, 2000
As to South African Law
Mukwevho Adekeye Incorporated
Saddle Drive
Woodmead Office Park
Woodmead, 2157
P O Box 1049
Gallo Manor, 2052
As to United States Law As to South African Law
Skadden, Arps, Slate, Meagher & Flom LLP Acting as corporate law advisers and consultants to
One Canada Square the Government of South Africa
Canary Wharf on a number of matters relating to the global
London, E14 5DS offering but not including preparation of
the prospectus
Edward Nathan & Friedland (Proprietary) Limited
4th Floor, The Forum
3 Maude Street, Sandown, 2196
P O Box 783347, Sandton, 2146
As to United States Law
Freshfields Bruckhaus Deringer
65 Fleet Street
London, EC4Y 1HS
As to South African Law
Chuene, Kwinana & Motsatse Inc.
1st Floor, The Galleries
163 Jan Smuts Avenue
Parkwood, 2193
P O Box 3523
Parklands, 2121
As to South African Law
Deneys Reitz Inc.
82 Maude Street
Sandton, 2196
P O Box 784903
Sandton, 2146
UBS Warburg Corporate Finance (South Africa) (Proprietary) Limited
(Registration number 1994/008363/07),
a subsidiary of UBS AG
64 Wierda Road East
Wierda Valley, Sandton, 2196
P O Box 652863, Benmore, 2010
AMB Holdings Limited
Registration number 1995/003054/06
15th Floor, The Forum
Maude Street, Sandton, 2196
P O Box 786833, Sandton, 2146
CORPORATE INFORMATION AND ADVISORS
LEGAL ADVISORS TO TELKOM SA LIMITED
LEGAL ADVISORS TO THE UNDERWRITERS
FINANCIAL ADVISORS TO TELKOM SA LIMITED
LEGAL ADVISORS TO
THE GOVERNMENT OF THE REPUBLIC OF SOUTH AFRICA
PRINTED BY INCE (PTY) LTD
INDEPENDENT AUDITORS
For Telkom SA Limited
Ernst & Young
52 Corlett Drive
Illovo, 2196
P O Box 2322
Johannesburg, 2000
For Vodacom Group (Proprietary) Limited
PricewaterhouseCoopers, Inc.
232 Ida Street
Menlo Park, 0107
P O Box 35296
Menlo Park, 0102
Deloitte & Touche
221 Waterkloof Road
Waterkloof
Pretoria, 0181
P O Box 11007
Hatfield, 0028
JOINT GLOBAL CO-ORDINATORS
Deutsche Bank AG London
Winchester House
1 Great Winchester Street
London, EC2N 2DB
J.P. Morgan Securities Ltd.
60 Victoria Embankment
London, EC4Y OJP
COMMERCIAL BANKERS
ABSA Bank Limited
Registration number 1986/004794/06
ABSA Tower East
170 Main Street
Johannesburg, 2001
P O Box 7735
Johannesburg, 2000
REGISTERED AND HEAD OFFICE OF
TELKOM SA LIMITED
Telkom Towers North
152 Proes Street
Pretoria, 0002
Private Bag X881
Pretoria, 0001
COMPANY SECRETARY
Vincent Vikimpi Mashale
(B Comm (Hons))
Telkom Towers North
152 Proes Street
Pretoria, 0002
Private Bag X881
Pretoria, 0001
TRANSFER SECRETARY
Computershare Investor Services Limited
Registration number 1958/003546/06
70 Marshall Street
Johannesburg, 2001
P O Box 61051, Marshalltown, 2107
JOINT GLOBAL CO-ORDINATORS CONSORTIUM MEMBERS
Standard Corporate and Merchant
Bank
(A division of The Standard Bank of
South Africa Limited)
Registration number 1962/000738/06
3 Simmonds Street
Johannesburg, 2001
P O Box 61344
Marshalltown, 2017
African Harvest Capital
(Proprietary) Limited
Registration number 1998/001469/07
3rd Floor
Sanclare Building
21 Dreyer Street
Claremont, 7700, Cape Town
Private Bag X9936
Sandton, 2146
Wipcapital (Proprietary) Limited
Registration number 1997/021195/07
61 Central Street
Houghton, 2198
Postnet Suite 104
Private Bag X2600
Houghton, 2041
Through and including the 25th day after the date of this prospectus, all dealers effecting transactions in these
securities, whether or not participating in this global offering, may be required to deliver a prospectus. This is in
addition to the dealers' obligation to deliver a prospectus when acting as underwriters and with respect to their unsold
allotments or subscriptions.
ordinary shares in the form of ordinary shares
or American Depositary Shares
TELKOM SA LIMITED
PROSPECTUS
Deutsche Bank Securities
JPMorgan
Prospectus dated , 2003
II-1
PART II
INFORMATION NOT REQUIRED IN PROSPECTUS
ITEM 6
INDEMNIFICATION OF DIRECTORS AND OFFICERS
Our articles of association will provide as following:
"Every director, alternate director, operating committee member, alternate operating committee member, manager,
secretary and other office of the company shall be indemnified out of the company's funds against all liability
incurred by him in defending any proceedings (whether civil or criminal) arising out of any actual or alleged
negligence, default, breach of duty of trust on his part in relation to the company in which judgment is given in his
favor or in which he is acquitted or in connection with any matter in which relief is granted to him by the court
in terms of the Act."
Telkom and the Government of the Republic of South Africa have agreed to indemnify the Underwriters and to
provide contribution in circumstances where indemnification is unavailable pursuant to the agreement.
Telkom has purchased Directors and Officers' Liability Insurance.
Directors of Telkom who are also employees of subsidiaries of Telkom may be entitled to indemnification from
such subsidiaries for certain liabilities and expenses incurred as a result of serving as directors of Telkom. Directors of
Telkom who are also employees of shareholders of Telkom may be entitled to indemnification from such shareholders
for certain liabilities and expenses incurred as a result of serving as directors of Telkom.
ITEM 7
RECENT SALES OF UNREGISTERED SECURITIES
The following sets forth the date of sale and title and amount of securities sold within the last three years that were
not registered by Telkom:
R1,500,000,000 aggregate principal amount of 13% unsecured local bonds due May 31, 2004, issued on
November 30, 1998 and July 29, 1999. The offering was underwritten by Standard Corporate and Merchant
Bank, a division of The Standard Bank of South Africa Limited, JP Morgan Securities South Africa (Proprietary)
Limited, Deutsche Bank AG, Rand Merchant Bank and African Merchant Bank. The aggregate underwriting
commission paid was R1,687,500. The offering was exempt under Regulation S of the Securities Act of 1933.
R2,300,000 aggregate principal amount of 10.75% unsecured local bonds due September 30, 2003, issued on
March 15, 2001, June 26, 2001 and July 24, 2001. The offering was underwritten by Deutsche Bank AG and
Rand Merchant Bank, a division of FirstRand Bank Limited, joint lead managers, and Merrill Lynch South
Africa, senior co-lead manager. The aggregate underwriting commission paid was R1,581,250. The offering was
exempt under Regulation S of the Securities Act of 1933.
R1,500,000,000 aggregate principal amount of 10.5% unsecured local bonds due October 31, 2006, issued on
October 31, 2001. The offering was underwritten by Standard Corporate and Merchant Bank, a division of The
Standard Bank of South Africa Limited, lead underwriter, Investec Bank Limited and JP Morgan Securities
South Africa (Proprietary) Limited and, co-lead managers, and Nedcor Investment Bank (Proprietary) Limited
and Wipcapital (Proprietary) Limited, joint managers. The underwriting commission was R750,000. The offering
was exempt under Regulation S of the Securities Act of 1933.

II-2
ITEM 8
EXHIBITS AND FINANCIAL STATEMENT SCHEDULES
(A) EXHIBITS
Exhibit number
Description
1.1
Form of Underwriting Agreement. (3)
3.1
Memorandum and Articles of Association of Telkom SA Limited. (1)
4.1
Form of Ordinary Share Certificate. (1)
4.2
Deposit Agreement, among Telkom SA Limited, the The Bank of New York, as Depositary and
Owners and Beneficial Owners of American Depositary Receipts issued thereunder, including the
form of American Depositary Receipt. (2)
5.1
Opinion of Werksmans Inc., South African counsel to the Registrant. (3)
5.2
Opinion of Emmet, Marvin & Martin, LLP, United States, Counsel to the Depositary. (2)
10.1
Strategic Services Agreement, dated January 16, 2003, among Telkom SA Limited, Thintana
Communications, SBC International Management Services Inc. and Telekom Management Services
SDN Berhad. (1)
10.2
Strategic Services Agreement, dated May 14, 1997, among Telkom SA Limited, Thintana
Communications LLC, SBC International Management Services Inc. and Telekom Management
Services SDN Berhad. (1)
10.3
Agreement dated July 31, 2000 between Telkom SA Limited and Telecommunication Facilities
Management Company (Proprietary) Limited. (1)
10.4
Exclusive Facilities Management Services Agreement, dated March 31, 2001, between Telkom SA
Limited and Systems Applications Projects (Africa) (Proprietary) Limited. (1)
10.5
Multiparty Implementation Agreement, dated September 30, 1993, among Telkom SA Limited,
Vodacom Group (Proprietary) Limited, Mobile Telephone Network (Proprietary) Limited, the
Postmaster General and the Government of the Republic of South Africa. (1)
10.6
Interconnection Agreement, dated February 16, 1994, among Telkom SA Limited and
Vodacom Group (Proprietary) Limited, as amended by agreements among Telkom SA Limited,
Vodacom Group Proprietary Limited and MTN on August 22, 1996, January 12, 1998, July 21, 1998,
and September 4, 2001. (1)
10.7
Interconnection Agreement, dated February 16, 1994 between Telkom SA Limited and MTN, as
amended by agreements among Telkom SA Limited, Vodacom Group (Proprietary) Limited, and
MTN on August 22, 1996, January 12, 1998, July 21, 1998 and September 14, 2001. (1)
10.8
Interconnection Agreement, dated August 31, 2001, between Telkom SA Limited and Cell C, as
amended by agreement among Telkom SA Limited, Vodacom Group (Proprietary) Limited and
Cell C, dated September 18, 2001. (1)
10.9
Joint Venture Agreement, dated March 31, 1995, between Telkom SA Limited, Vodafone Group plc,
Rembrant Group Limited, Vodacom Group, Vodacom, Vodac and Vodafone Holdings (SA)
(Proprietary) Limited. (1)
10.10
Shareholders' Agreement, dated January 16, 2003, between the Minister for Communications of the
Government of the Republic of South Africa and Thintana Communications LLC. (1)
10.11
Registration Rights Agreement, dated January 16, 2003, among the Minister for Communications of
the Government of the Republic of South Africa, Thintana Communications LLC and Telkom SA
Limited. (1)
21.1
Subsidiaries of the Registrant. (1)
23.1(a)
Consent of Ernst & Young related to their report, dated December 12, 2002. (1)
23.1(b)
Consent of Ernst & Young related to their report, dated December 10, 2002. (1)
23.2(a)
Consent of Deloitte & Touche and PricewaterhouseCoopers Inc. related to their report, dated
June 11, 2002, except for the Note 44 which the date is October 15 2002 (1)
23.2(b)
Consent of Deloitte & Touche and PricewaterhouseCoopers Inc. related to their report dated December 12,
2002. (1)
23.3
Consent of Werksmans Inc. (included in Exhibit 5.1). (1)
23.4
Consent of Emmet, Marvin & Martin, LLP (included in Exhibit 5.2). (2)
24.1
Power of Attorney of Directors and Officers of the Registrant (included on Signature Pages).
(1) Filed herewith.
(2)
Incorporated by reference to the Registration Statement on Form F-6 submitted to the Securities and Exchange Commission on November 8,
2002 with respect to American Depositary Shares representing the ordinary shares.
(3) To be filed.
.
II-3
(B)
FINANCIAL STATEMENT SCHEDULES
Not Applicable.
ITEM 9
UNDERTAKINGS
The undersigned registrant hereby undertakes to provide to the underwriters at the closing specified in the
underwriting agreements certificates in such denominations and registered in such names as required by the
underwriters to permit prompt delivery to each purchaser.
Insofar as indemnification for liabilities arising under the Securities Act of 1933 may be permitted to directors,
officers and controlling persons of the registrant pursuant to the foregoing provisions, or otherwise, the registrant has
been advised that in the opinion of the Securities and Exchange Commission such indemnification is against public
policy as expressed in the Act and is, therefore, unenforceable. In the event that a claim for indemnification against
such liabilities (other than the payment by the registrant of expenses incurred or paid by a director, officer or
controlling person of the registrant in the successful defense of any action, suit or proceeding) is asserted by such
director, officer or controlling person in connection with the securities being registered, the registrant will, unless in
the opinion of its counsel the matter has been settled by controlling precedent, submit to a court of appropriate
jurisdiction the question whether such indemnification by it is against public policy as expressed in the Act and will be
governed by the final adjudication of such issue.
The undersigned registrant hereby undertakes that:
For purposes of determining any liability under the Securities Act of 1933, the information omitted from the
form of prospectus filed as part of this registration statement in reliance on Rule 430A and contained in a form
of prospectus filed by the registrant pursuant to Rule 424(b)(1) or (4) or 497(h) under the Securities Act shall be
deemed to be part of this registration statement as of the time it is declared effective.
For the purpose of determining any liability under the Securities Act of 1933, each post-effective amendment
that contains a form of prospectus shall be deemed to be a new registration statement relating to the securities
offered therein, and the offering of such securities at that time shall be deemed to be the initial bona fide offering
thereof.

SIGNATURES
Pursuant to the requirements of the Securities Act of 1933, the Registrant certifies that it has reasonable grounds to
believe that it meets all of the requirements for filing on Form F-1 and has duly caused this registration statement to be
signed on its behalf by the undersigned, thereunto duly authorized, in Johannesburg, South Africa, on the
day of January, 2003,
TELKOM SA LIMITED
By:____/S/____________________________________________
Name: Sizwe Nxasana
Title: Chief Executive Officer
POWER OF ATTORNEY
Each person whose signature appears below hereby severally constitute and appoint Sizwe Nxasana, Anthony
Lewis, Shawn McKenzie and John Gibson, and each of them with full power to act alone, his or her true and lawful
attorneys-in-fact and agents, with full power of substitution and resubstitution and revocation, for each of him or her
and in his or her name, place, and stead, in any and all capacities, to sign any and all amendments (including post-
effective amendments) and additions to this registration statement, and to file or cause to be filed the same, with all
exhibits thereto, and other documents in connection therewith, with the Securities and Exchange Commission, and
hereby grant unto such attorneys-in-fact and agents, and each of them, the full power and authority to do and perform
each and every act and thing requisite and necessary to be done in and about the foregoing, as fully to all intents and
purposes, as each of him or her might or could do in person, hereby ratifying and confirming all that said attorneys-in-
fact and agents, or any of them, or their respective substitutes, may lawfully do or cause to be done by virtue hereof.
Pursuant to the requirements of the Securities Act of 1933, this registration statement and the prospectus has been
signed by the following persons in the capacities and on the dates indicated:
Name_________________________
Title_____________________________________________________
Date________________
/S/ Chief Executive Officer; Executive Director (principal executive
January 30 , 2003
officer)
Sizwe Nxasana
/S/ Non-executive Chairperson of the Board and Director
January 30 , 2003
Nomazizi Mtshotshisa
/S/ Chief Financial Officer (principal financial and accounting officer)
January 30 , 2003
Anthony Lewis
/S/ Non-executive Director
January 30 , 2003
Wendy Luhabe
/S/ Non-executive Director
January 30 , 2003
Tan Sri Dat Ir Muhammad
Radzi Mansor
II-4
Name________________________
Title__________________________________________
Date______________________
/S/ Chief Operating Officer; Executive Director
January 30 , 2003
Shawn McKenzie
/ S/ Non-executive Director
January 30 , 2003
Richard Menell
/S/ Non-executive Director
January 30 , 2003
Dr. Diliza Mji
/S/ Non-executive Director
January 30 , 2003
Peter Moyo
/S/ Non-executive Director
January 30 , 2003
Tlhalefang Sekano
/S/ Non-executive Director
January 30 , 2003
Colin Smith
/S/ Chief Strategic Officer, Executive Director
January 30 , 2003
Chian Khai Tan
/S/ Non-executive Director
January 30 , 2003
Charles Valkin
/S/ Non-executive Director
January 30 , 2003
Themba Vilakazi
II-5

II-6
/S/ Non-executive Director
January 29 , 2003
Jonathan P. Klug Sr.
SIGNATURE OF US AUTHORIZED REPRESENTATIVE OF TELKOM SA LIMITED
Pursuant to the Securities Act of 1933, as amended, the undersigned, the duly authorized representative in the United
States of Telkom SA Limited, has signed this registration statement or amendment thereto in the City of Newark,
State of Delaware, on the 29
day of January, 2003.
By: /S/
Name: Donald J. Puglisi
Title: Managing Director

II-7
EXHIBIT INDEX
Exhibit number
Description
1.1
Form of Und
erwriting Agreement. (3)
3.1
Memorandum and Articles of Association of Telkom SA Limited. (1)
4.1
Form of Ordinary Share Certificate. (1)
4.2
Deposit Agreement, among Telkom SA Limited, the The Bank of New York, as Depositary and
Owners and Beneficial Owners of American Depositary Receipts issued thereunder, including the
form of American Depositary Receipt. (2)
5.1
Opinion of Werksmans Inc., South African counsel to the Registrant. (3)
5.2
Opinion of Emmet, Marvin & Martin, LLP, United States, Counsel to the Depositary. (2)
10.1
Strategic Services Agreement, dated January 16, 2003, among Telkom SA Limited, Thintana
Communications, SBC International Management Services Inc. and Telekom Management Services
SDN Berhad. (1)
10.2
Strategic Services Agreement, dated May 14, 1997, among Telkom SA Limited, Thintana
Communications LLC, SBC International Management Services Inc. and Telekom Management
Services SDN Berhad. (1)
10.3
Agreement dated July 31, 2000 between Telkom SA Limited and Telecommunication Facilities
Management Company (Proprietary) Limited. (1)
10.4
Exclusive Facilities Management Services Agreement, dated March 31, 2001, between Telkom SA
Limited and Systems Applications Projects (Africa) (Proprietary) Limited. (1)
10.5
Multiparty Implementation Agreement, dated September 30, 1993, among Telkom SA Limited,
Vodacom Group (Proprietary) Limited, Mobile Telephone Network (Proprietary) Limited, the
Postmaster General and the Government of the Republic of South Africa. (1)
10.6
Interconnection Agreement, dated February 16, 1994, among Telkom SA Limited and
Vodacom Group (Proprietary) Limited, as amended by agreements among Telkom SA Limited,
Vodacom Group Proprietary Limited and MTN on August 22, 1996, January 12, 1998, July 21, 1998,
and September 4, 2001.(1)
10.7
Interconnection Agreement, dated February 16, 1994 between Telkom SA Limited and MTN, as
amended by agreements among Telkom SA Limited, Vodacom Group (Proprietary) Limited, and
MTN on August 22, 1996, January 12, 1998, July 21, 1998 and September 14, 2001. (1)
10.8
Interconnection Agreement, dated August 31, 2001, between Telkom SA Limited and Cell C, as
amended by agreement among Telkom SA Limited, Vodacom Group (Proprietary) Limited and
Cell C, dated September 18, 2001. (1)
10.9
Joint Venture Agreement, dated March 31, 1995, between Telkom SA Limited, Vodafone Group plc,
Rembrant Group Limited, Vodacom Group, Vodacom, Vodac and Vodafone Holdings (SA)
(Proprietary) Limited. (1)
10.10
Shareholders' Agreement, dated January 16, 2003, between the Minister for Communications of the
Government of the Republic of South Africa and Thintana Communications LLC. (1)
10.11
Registration Rights Agreement, dated January 16, 2003, among the Minister for Communications of
the Government of the Republic of South Africa, Thintana Communications LLC and Telkom SA
Limited. (1)
21.1
Subsidiaries of the Registrant. (1)
23.1(a)
Consent of Ernst & Young related to their report, dated December 12, 2002. (1)
23.1(b)
Consent of Ernst & Young related to their report, dated December 10, 2002. (1)
23.2(a)
Consent of Deloitte & Touche and PricewaterhouseCoopers Inc. related to their report, dated
June 11.2002, except for theNote 44 which the date is October 15, 2002. (1)
23.2(b)
Consent of Deloitte & Touche and PricewaterhouseCoopers Inc, related to there report dated December 12, 2002. (1)
23.3
Consent of Werksmans Inc. (included in Exhibit 5.1). (1)
23.4
Consent of Emmet, Marvin & Martin, LLP (included in Exhibit 5.2). (2)
24.1
Power of Attorney of Directors and Officers of the Registrant (included on Signature Pages).
(1) Filed herewith.
(2)
Incorporated by reference to the Registration Statement on Form F-6 submitted to the Securities and Exchange Commission on November 8,
2002 with respect to American Depositary Shares representing the ordinary shares.
(3) To be filed.