Exhibit 99.1
| AXIS Capital Investor Day 2007 Quality, Sustainability and Profitability June 7, 2007 |
| Safe Harbor Disclosure Statements in this presentation that are not historical facts, including statements regarding our estimates, beliefs, expectations, intentions, strategies or projections, may be “forward-looking statements” within the meaning of the U.S. federal securities laws, including the Private Securities Litigation Reform Act of 1995. We intend these forward-looking statements to be covered by the safe harbor provisions for forward-looking statements in the United States securities laws. In some cases, these statements can be identified by the use of forward-looking words such as “may,” “should,” “could,” “anticipate,” “estimate,” “expect,” “plan,” “believe,” “predict,” “potential,” “intend” or similar expressions. Our expectations are not guarantees and are based on currently available competitive, financial and economic data along with our operating plans. Forward-looking statements contained in this presentation may include, but are not limited to, information regarding our estimates of losses related to hurricanes and other catastrophes, our expectations regarding pricing and other market conditions, our growth prospects, the amount of our acquisition costs, the amount of our net losses and loss reserves, the projected amount of our capital expenditures, managing interest rate and foreign currency risks, valuations of potential interest rate shifts and foreign currency rate changes and measurements of potential losses in fair market values of our investment portfolio. These statements involve risks, uncertainties and assumptions. Actual events or results may differ materially from our expectations. Important factors that could cause actual events or results to be materially different from our expectations include (1) our limited operating history, (2) the occurrence of natural and man-made disasters, (3) actual claims exceeding our loss reserves, (4) the failure of any of the loss limitation methods we employ, (5) the effects of emerging claims and coverage issues, (6) the failure of our cedants to adequately evaluate risks, (7) the loss of one or more key executives, (8) a decline in our ratings with rating agencies, (9) loss of business provided to us by our major brokers, (10) changes in governmental regulations, (11) increased competition, (12) general economic conditions, (13) changes in the political environment of certain countries in which we operate or underwrite business and (14) other matters that can be found in our filings with the Securities and Exchange Commission. Forward-looking statements are only as of the date they are made, and we do not undertake any obligation to update or revise publicly any forward-looking statements, whether as a result of new information, future events or otherwise. Cautionary Statement Regarding Forward-looking Statements |
| Non-GAAP Disclosure We have presented diluted book value per common share calculated using the “if converted” method, which is a non-GAAP financial measure. This measure takes into account the effect of the full conversion of our outstanding stock options, warrants, restricted stock and phantom stock units. As we have no present plans to reacquire such dilutive securities, the calculation assumes the retention of all proceeds upon exercise and the resulting issuance of common shares to remain outstanding. Because we had dilutive common shares outstanding in each of the periods presented, we believe diluted book value per share provides useful information for investors to measure shareholder returns. This measure should not be viewed as a substitute for book value per share, the most comparable GAAP generated measure. A reconciliation of diluted book value per share to basic book value per share is presented on page 157 of this presentation. |
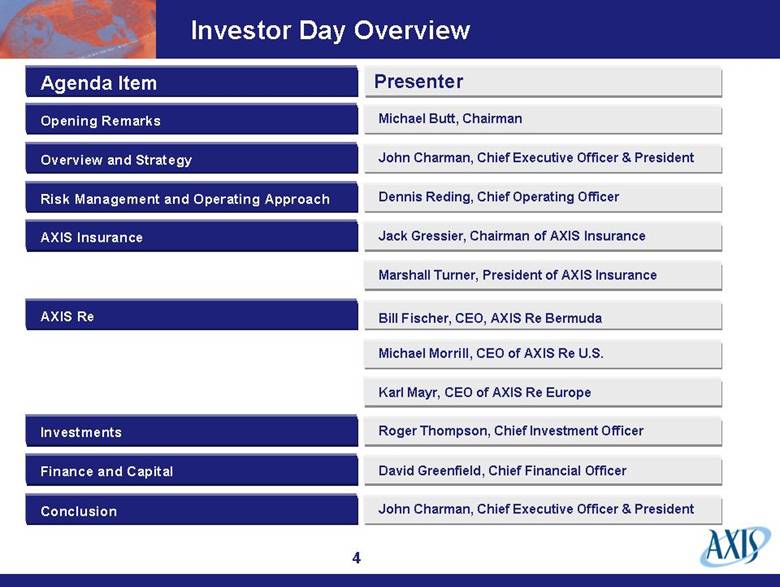
| Investor Day Overview Presenter Michael Butt, Chairman Opening Remarks Agenda Item Overview and Strategy John Charman, Chief Executive Officer & President Risk Management and Operating Approach Dennis Reding, Chief Operating Officer AXIS Insurance Jack Gressier, Chairman of AXIS Insurance Marshall Turner, President of AXIS Insurance AXIS Re Bill Fischer, CEO, AXIS Re Bermuda Michael Morrill, CEO of AXIS Re U.S. Karl Mayr, CEO of AXIS Re Europe Investments Conclusion Roger Thompson, Chief Investment Officer John Charman, Chief Executive Officer & President Finance and Capital David Greenfield, Chief Financial Officer |
| Investor Day Objectives Demonstrate the strength and depth of our management team Demonstrate our differentiation and competitive positioning Demonstrate the high quality of our earnings Provide a strategic update |
| Overview and Strategy |
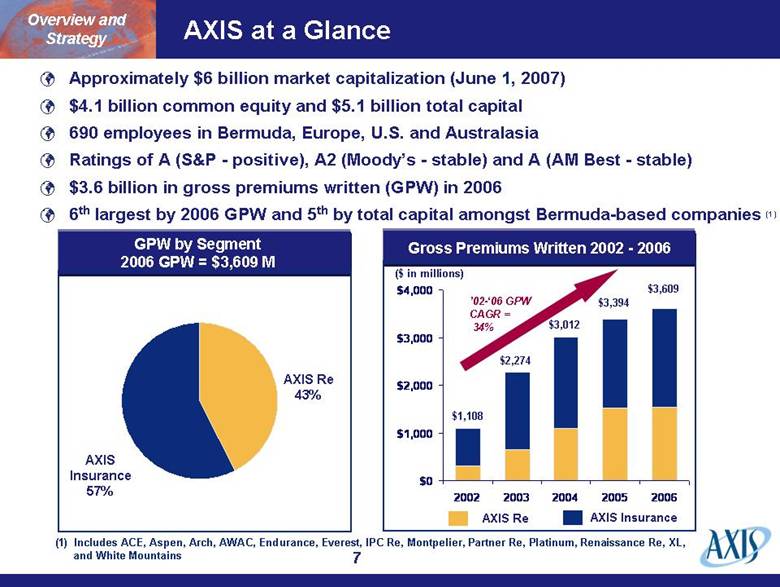
| Approximately $6 billion market capitalization (June 1, 2007) $4.1 billion common equity and $5.1 billion total capital 690 employees in Bermuda, Europe, U.S. and Australasia Ratings of A (S&P - positive), A2 (Moody’s - stable) and A (AM Best - stable) $3.6 billion in gross premiums written (GPW) in 2006 6th largest by 2006 GPW and 5th by total capital amongst Bermuda-based companies (1) GPW by Segment 2006 GPW = $3,609 M AXIS Re 43% AXIS Insurance 57% AXIS Insurance AXIS Re $1,108 $2,274 $3,012 $3,394 $3,609 ($ in millions) Gross Premiums Written 2002 - 2006 ’02-‘06 GPW CAGR = 34% Overview and Strategy AXIS at a Glance (1) Includes ACE, Aspen, Arch, AWAC, Endurance, Everest, IPC Re, Montpelier, Partner Re, Platinum, Renaissance Re, XL, and White Mountains $0 $1,000 $2,000 $3,000 $4,000 2002 2003 2004 2005 2006 |
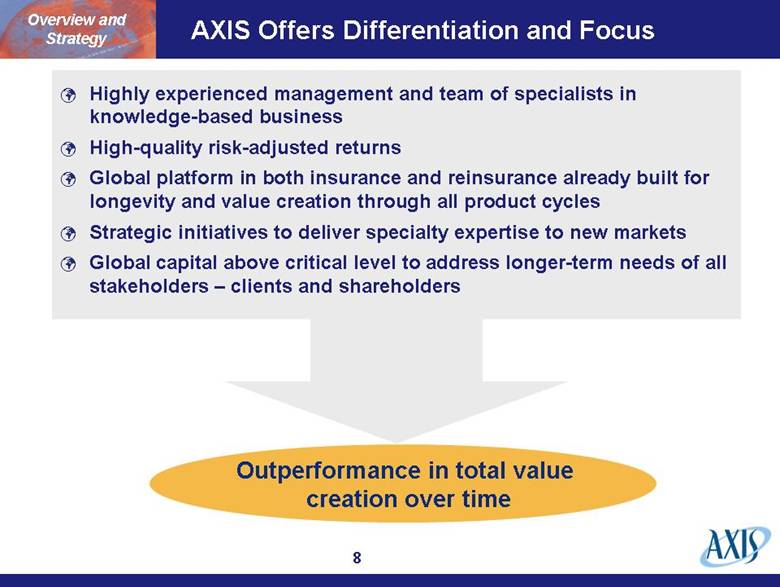
| AXIS Offers Differentiation and Focus Highly experienced management and team of specialists in knowledge-based business High-quality risk-adjusted returns Global platform in both insurance and reinsurance already built for longevity and value creation through all product cycles Strategic initiatives to deliver specialty expertise to new markets Global capital above critical level to address longer-term needs of all stakeholders – clients and shareholders Overview and Strategy Outperformance in total value creation over time |
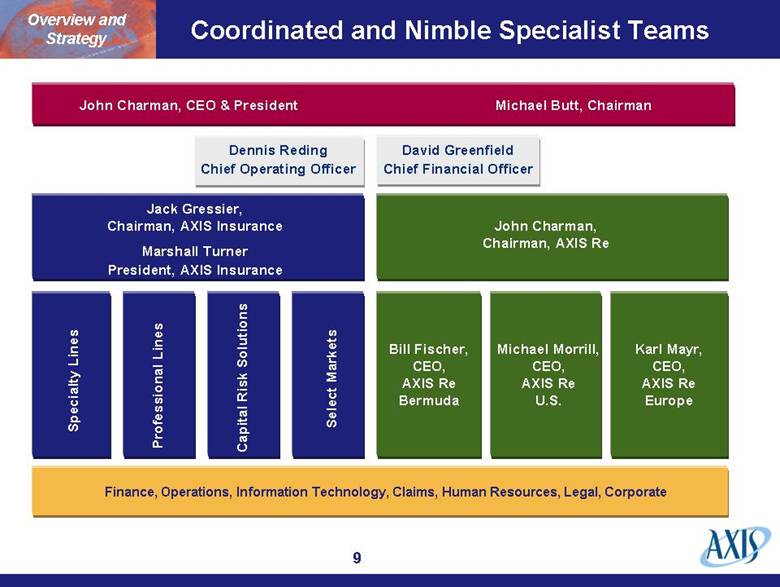
| Coordinated and Nimble Specialist Teams John Charman, CEO & President Michael Butt, Chairman Jack Gressier, Chairman, AXIS Insurance Marshall Turner President, AXIS Insurance Specialty Lines Finance, Operations, Information Technology, Claims, Human Resources, Legal, Corporate Dennis Reding Chief Operating Officer David Greenfield Chief Financial Officer Professional Lines Capital Risk Solutions Select Markets John Charman, Chairman, AXIS Re Bill Fischer, CEO, AXIS Re Bermuda Michael Morrill, CEO, AXIS Re U.S. Karl Mayr, CEO, AXIS Re Europe Overview and Strategy |
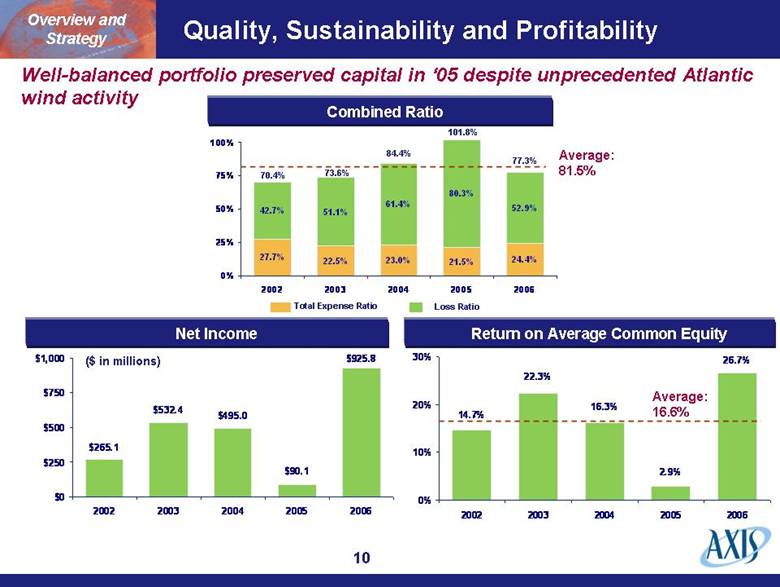
| Quality, Sustainability and Profitability ($ in millions) 70.4% 73.6% 84.4% 101.8% 77.3% Total Expense Ratio Loss Ratio Average: 81.5% Average: 16.6% Well-balanced portfolio preserved capital in ‘05 despite unprecedented Atlantic wind activity Overview and Strategy Return on Average Common Equity Net Income Combined Ratio 27.7% 22.5% 23.0% 21.5% 24.4% 42.7% 51.1% 61.4% 80.3% 52.9% 0% 25% 50% 75% 100% 2002 2003 2004 2005 2006 $925.8 $90.1 $495.0 $532.4 $265.1 $0 $250 $500 $750 $1,000 2002 2003 2004 2005 2006 26.7% 2.9% 16.3% 22.3% 14.7% 0% 10% 20% 30% 2002 2003 2004 2005 2006 |
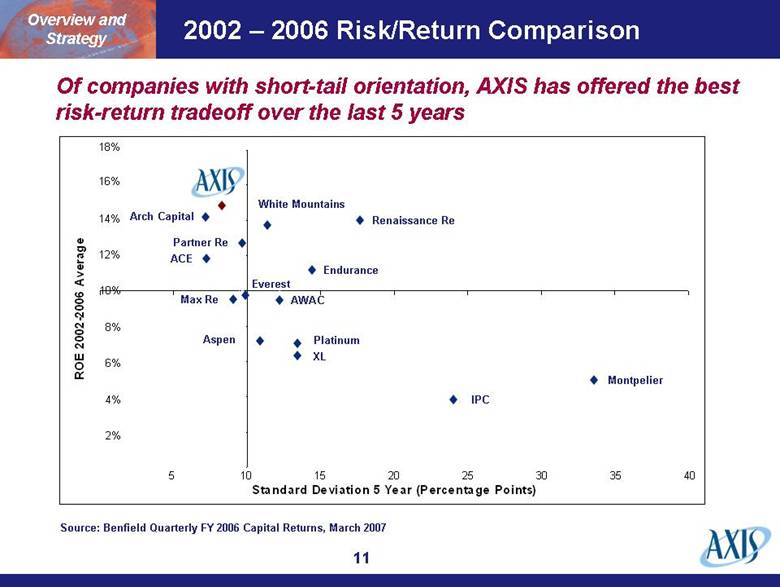
| 2002 – 2006 Risk/Return Comparison Montpelier XL Platinum Aspen AWAC Max Re Endurance ACE Everest Partner Re Arch Capital White Mountains Renaissance Re 2% 4% 6% 8% 10% 12% 14% 16% 18% 5 10 15 20 25 30 35 40 Source: Benfield Quarterly FY 2006 Capital Returns, March 2007 Overview and Strategy IPC Standard Deviation 5 Year (Percentage Points) ROE 2002-2006 Average Of companies with short-tail orientation, AXIS has offered the best risk-return tradeoff over the last 5 years |
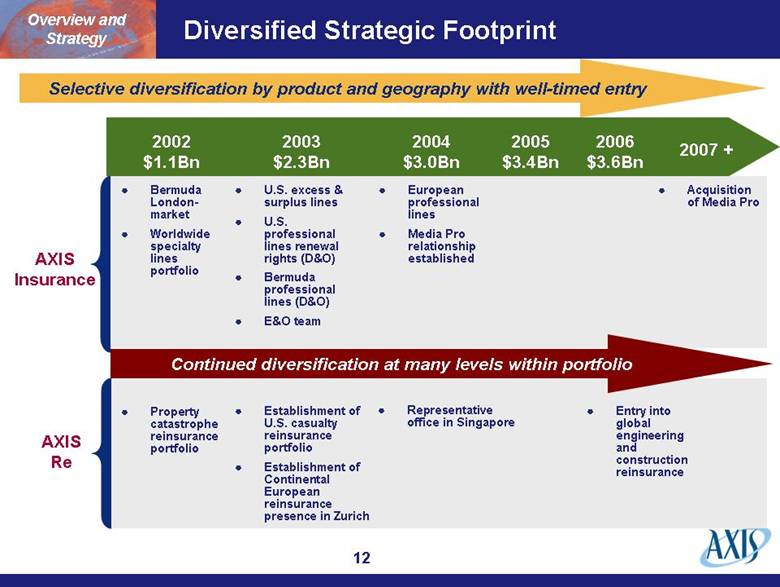
| Diversified Strategic Footprint 2002 $1.1Bn 2003 $2.3Bn 2004 $3.0Bn 2005 $3.4Bn 2006 $3.6Bn 2007 + Bermuda London-market Worldwide specialty lines portfolio U.S. excess & surplus lines U.S. professional lines renewal rights (D&O) Bermuda professional lines (D&O) E&O team European professional lines Media Pro relationship established Acquisition of Media Pro AXIS Re Property catastrophe reinsurance portfolio Establishment of U.S. casualty reinsurance portfolio Establishment of Continental European reinsurance presence in Zurich AXIS Insurance Representative office in Singapore Selective diversification by product and geography with well-timed entry Continued diversification at many levels within portfolio Overview and Strategy Entry into global engineering and construction reinsurance |
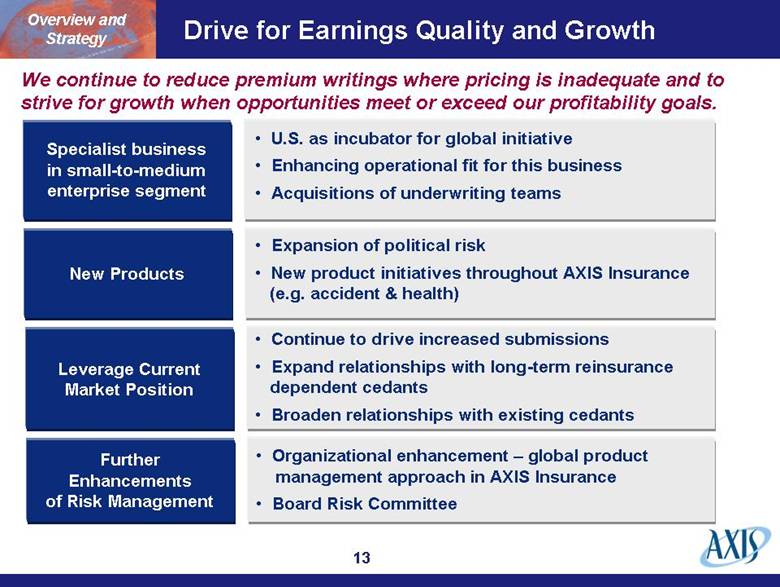
| Drive for Earnings Quality and Growth Overview and Strategy Specialist business in small-to-medium enterprise segment New Products Further Enhancements of Risk Management We continue to reduce premium writings where pricing is inadequate and to strive for growth when opportunities meet or exceed our profitability goals. Leverage Current Market Position Continue to drive increased submissions Expand relationships with long-term reinsurance dependent cedants Broaden relationships with existing cedants Expansion of political risk New product initiatives throughout AXIS Insurance (e.g. accident & health) Organizational enhancement – global product management approach in AXIS Insurance Board Risk Committee U.S. as incubator for global initiative Enhancing operational fit for this business Acquisitions of underwriting teams |
| Risk Management and Operating Approach |
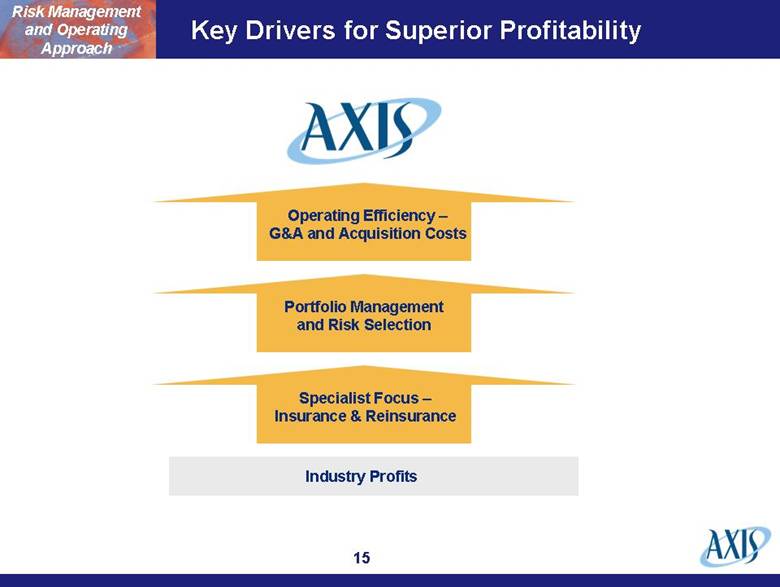
| Key Drivers for Superior Profitability Portfolio Management and Risk Selection Industry Profits Specialist Focus – Insurance & Reinsurance Operating Efficiency – G&A and Acquisition Costs Risk Management and Operating Approach |
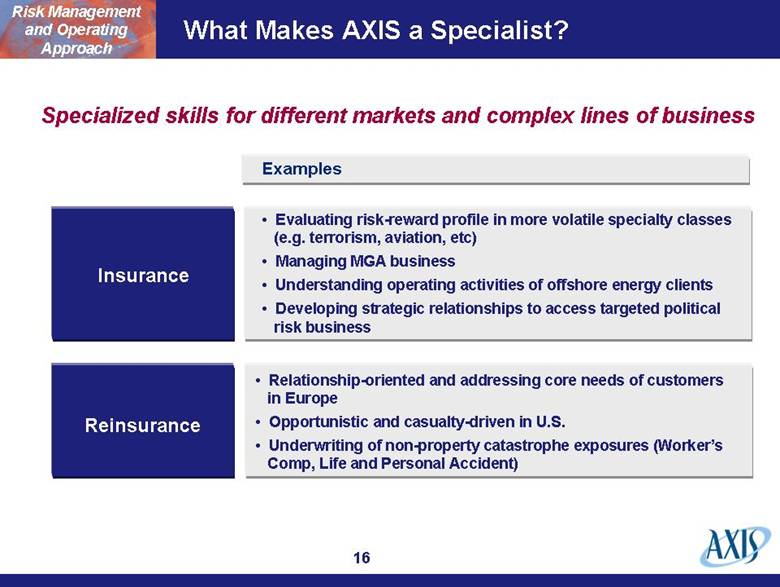
| What Makes AXIS a Specialist? Specialized skills for different markets and complex lines of business Risk Management and Operating Approach Reinsurance Insurance Examples Evaluating risk-reward profile in more volatile specialty classes (e.g. terrorism, aviation, etc) Managing MGA business Understanding operating activities of offshore energy clients Developing strategic relationships to access targeted political risk business Relationship-oriented and addressing core needs of customers in Europe Opportunistic and casualty-driven in U.S. Underwriting of non-property catastrophe exposures (Worker’s Comp, Life and Personal Accident) |
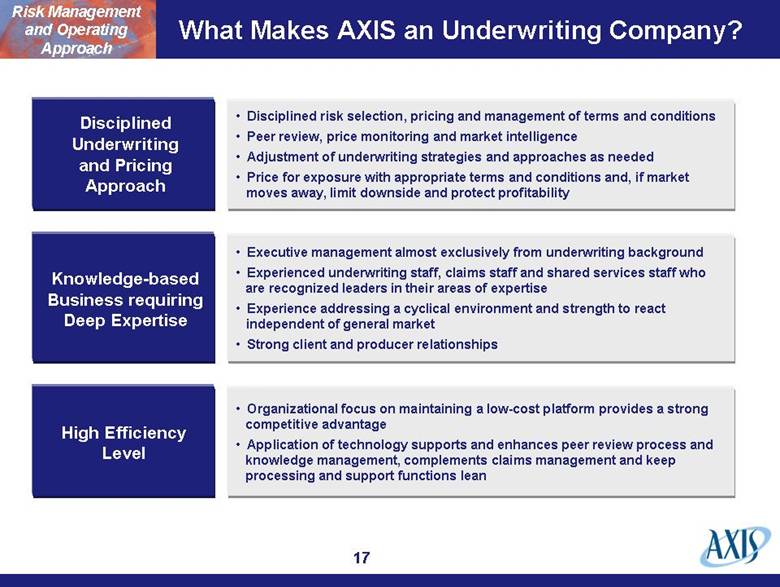
| What Makes AXIS an Underwriting Company? Disciplined Underwriting and Pricing Approach Knowledge-based Business requiring Deep Expertise High Efficiency Level Risk Management and Operating Approach Organizational focus on maintaining a low-cost platform provides a strong competitive advantage Application of technology supports and enhances peer review process and knowledge management, complements claims management and keep processing and support functions lean Executive management almost exclusively from underwriting background Experienced underwriting staff, claims staff and shared services staff who are recognized leaders in their areas of expertise Experience addressing a cyclical environment and strength to react independent of general market Strong client and producer relationships Disciplined risk selection, pricing and management of terms and conditions Peer review, price monitoring and market intelligence Adjustment of underwriting strategies and approaches as needed Price for exposure with appropriate terms and conditions and, if market moves away, limit downside and protect profitability |
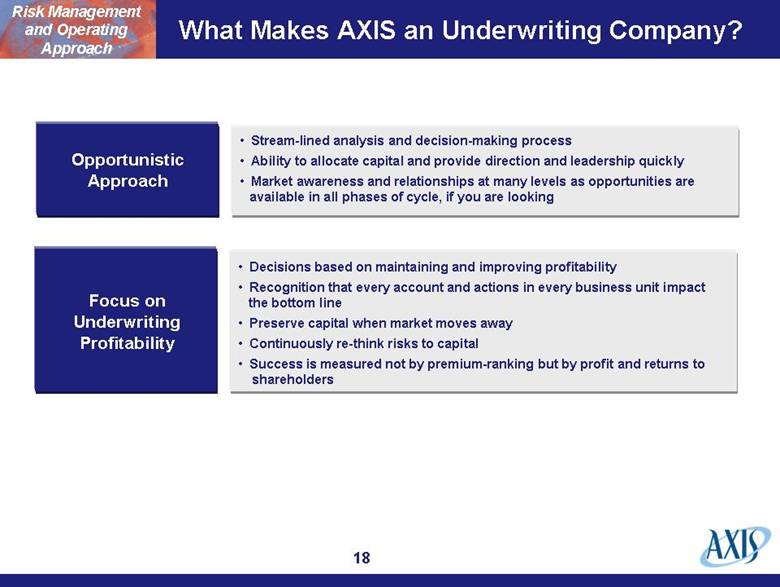
| What Makes AXIS an Underwriting Company? Opportunistic Approach Focus on Underwriting Profitability Risk Management and Operating Approach Decisions based on maintaining and improving profitability Recognition that every account and actions in every business unit impact the bottom line Preserve capital when market moves away Continuously re-think risks to capital Success is measured not by premium-ranking but by profit and returns to shareholders Stream-lined analysis and decision-making process Ability to allocate capital and provide direction and leadership quickly Market awareness and relationships at many levels as opportunities are available in all phases of cycle, if you are looking |
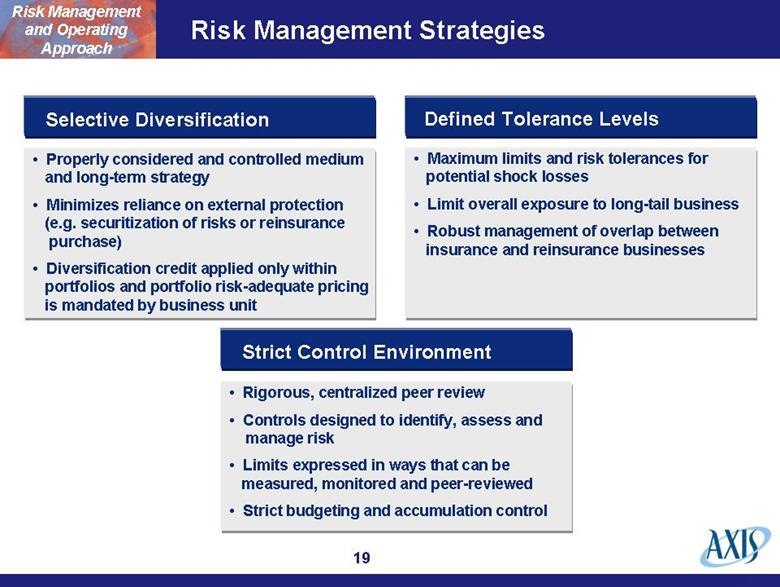
| Risk Management Strategies Selective Diversification Strict Control Environment Defined Tolerance Levels Risk Management and Operating Approach Maximum limits and risk tolerances for potential shock losses Limit overall exposure to long-tail business Robust management of overlap between insurance and reinsurance businesses Rigorous, centralized peer review Controls designed to identify, assess and manage risk Limits expressed in ways that can be measured, monitored and peer-reviewed Strict budgeting and accumulation control Properly considered and controlled medium and long-term strategy Minimizes reliance on external protection (e.g. securitization of risks or reinsurance purchase) Diversification credit applied only within portfolios and portfolio risk-adequate pricing is mandated by business unit |
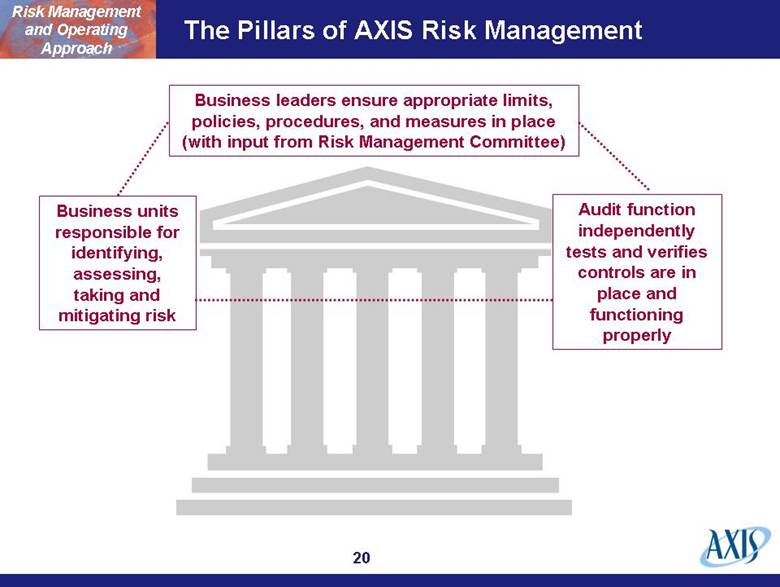
| The Pillars of AXIS Risk Management Business units responsible for identifying, assessing, taking and mitigating risk Business leaders ensure appropriate limits, policies, procedures, and measures in place (with input from Risk Management Committee) Audit function independently tests and verifies controls are in place and functioning properly Risk Management and Operating Approach |
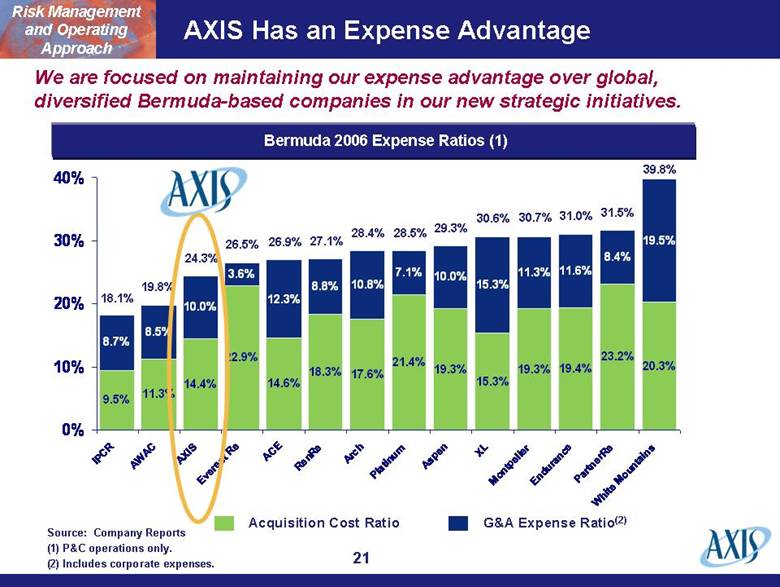
| AXIS Has an Expense Advantage Acquisition Cost Ratio G&A Expense Ratio(2) Source: Company Reports (1) P&C operations only. (2) Includes corporate expenses. 18.1% 19.8% 24.3% 26.5% 26.9% 27.1% 28.4% 28.5% 29.3% 30.6% 30.7% 31.0% 31.5% 39.8% Risk Management and Operating Approach We are focused on maintaining our expense advantage over global, diversified Bermuda-based companies in our new strategic initiatives. Bermuda 2006 Expense Ratios (1) 9.5% 11.3% 14.4% 22.9% 14.6% 18.3% 17.6% 21.4% 19.3% 15.3% 19.3% 19.4% 23.2% 20.3% 8.7% 8.5% 10.0% 3.6% 12.3% 8.8% 10.8% 7.1% 10.0% 15.3% 11.3% 11.6% 8.4% 19.5% 0% 10% 20% 30% 40% IPCR AWAC AXIS Everest Re ACE RenRe Arch Platinum Aspen XL Montpelier Endurance PartnerRe White Mountains |
| AXIS Insurance |
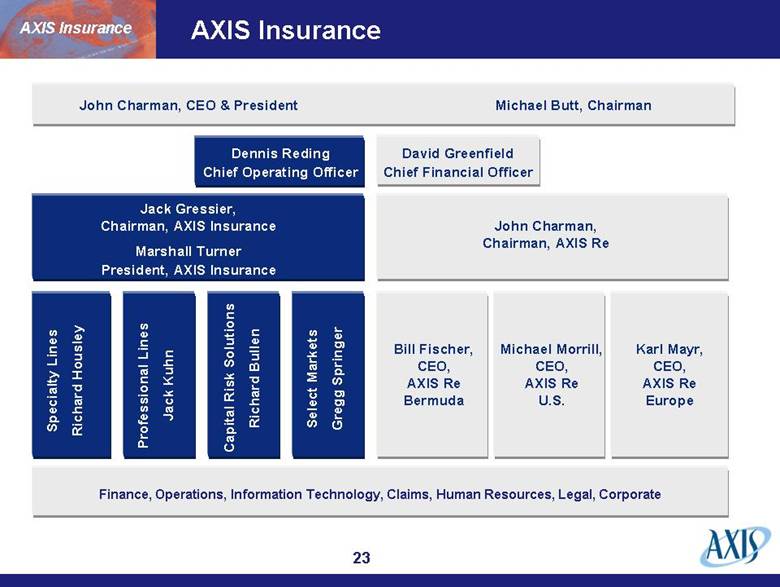
| AXIS Insurance John Charman, CEO & President Michael Butt, Chairman Jack Gressier, Chairman, AXIS Insurance Marshall Turner President, AXIS Insurance Specialty Lines Richard Housley Finance, Operations, Information Technology, Claims, Human Resources, Legal, Corporate Dennis Reding Chief Operating Officer David Greenfield Chief Financial Officer Professional Lines Jack Kuhn Select Markets Gregg Springer John Charman, Chairman, AXIS Re Bill Fischer, CEO, AXIS Re Bermuda Capital Risk Solutions Richard Bullen Michael Morrill, CEO, AXIS Re U.S. Karl Mayr, CEO, AXIS Re Europe AXIS Insurance |
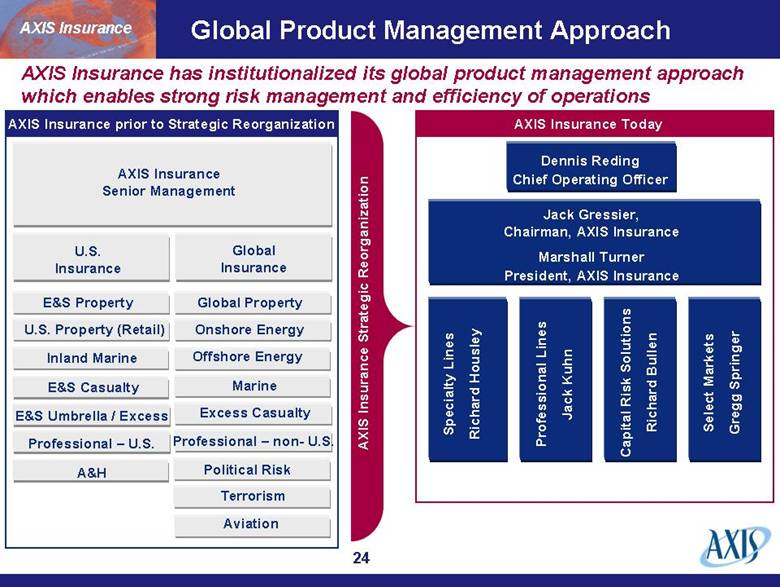
| Global Product Management Approach Jack Gressier, Chairman, AXIS Insurance Marshall Turner President, AXIS Insurance Specialty Lines Richard Housley Dennis Reding Chief Operating Officer Select Markets Gregg Springer AXIS Insurance Senior Management Capital Risk Solutions Richard Bullen Global Insurance Professional Lines Jack Kuhn U.S. Insurance E&S Property U.S. Property (Retail) Inland Marine E&S Casualty E&S Umbrella / Excess Professional – U.S. Global Property Onshore Energy Offshore Energy Marine Excess Casualty Professional – non- U.S. Political Risk Aviation Terrorism A&H AXIS Insurance has institutionalized its global product management approach which enables strong risk management and efficiency of operations AXIS Insurance prior to Strategic Reorganization AXIS Insurance Today AXIS Insurance Strategic Reorganization AXIS Insurance |
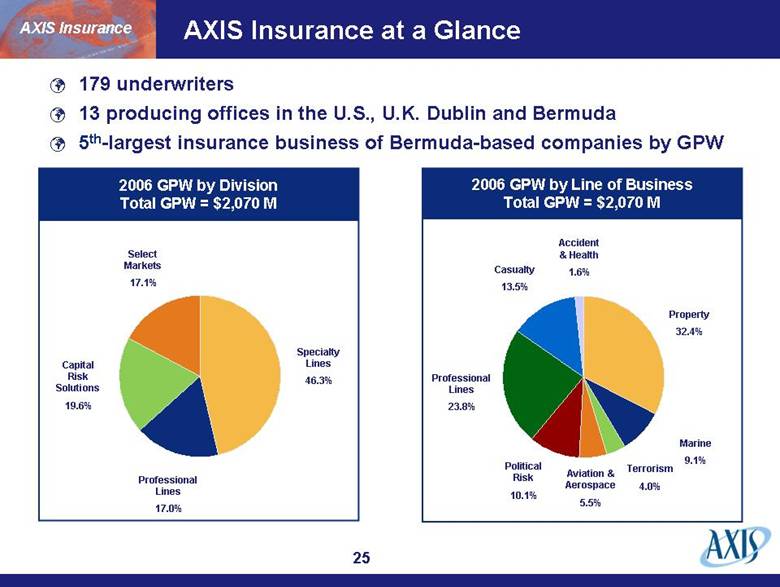
| AXIS Insurance at a Glance Specialty Lines 46.3% Professional Lines 17.0% Capital Risk Solutions 19.6% Select Markets 17.1% 2006 GPW by Division Total GPW = $2,070 M Property 32.4% Political Risk 10.1% Professional Lines 23.8% Casualty 13.5% Accident & Health 1.6% 2006 GPW by Line of Business Total GPW = $2,070 M Marine 9.1% Terrorism 4.0% Aviation & Aerospace 5.5% AXIS Insurance 179 underwriters 13 producing offices in the U.S., U.K. Dublin and Bermuda 5th-largest insurance business of Bermuda-based companies by GPW |
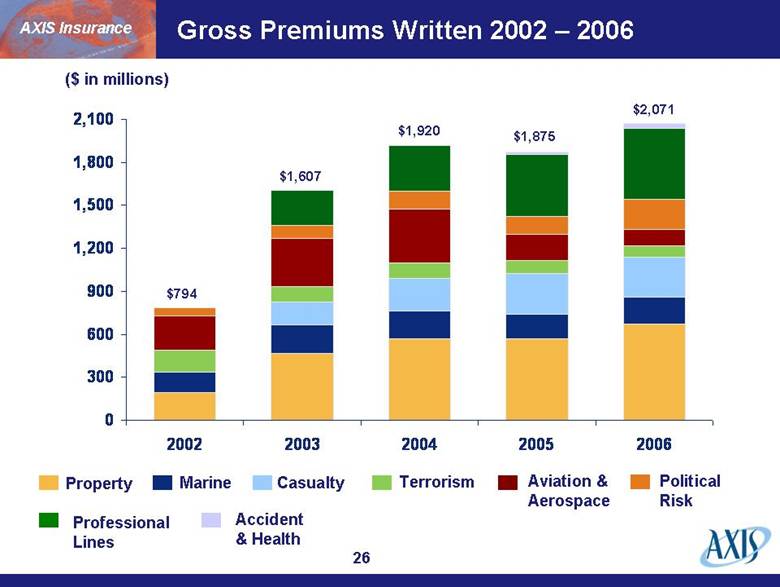
| Gross Premiums Written 2002 – 2006 ($ in millions) $794 $1,607 $1,920 Property Marine Terrorism Aviation & Aerospace $1,875 $2,071 Political Risk Professional Lines Casualty Accident & Health AXIS Insurance 0 300 600 900 1,200 1,500 1,800 2,100 2002 2003 2004 2005 2006 |
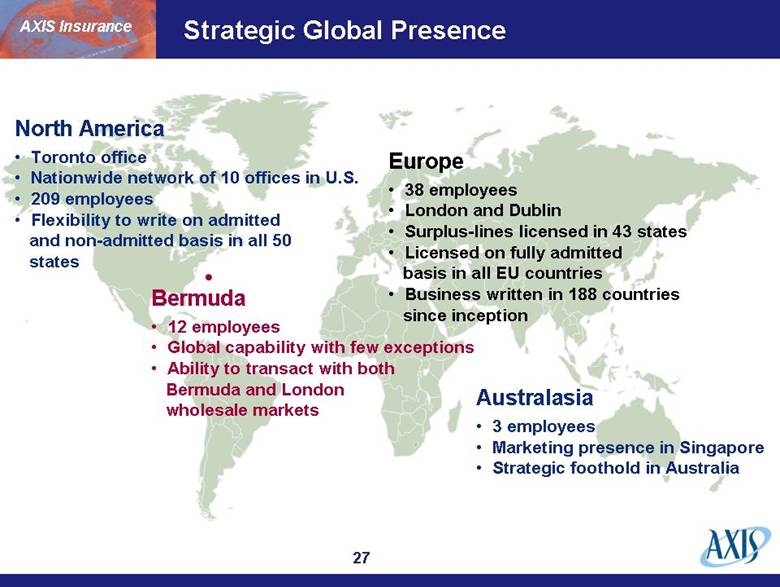
| Strategic Global Presence North America Toronto office Nationwide network of 10 offices in U.S. 209 employees Flexibility to write on admitted and non-admitted basis in all 50 states Bermuda 12 employees Global capability with few exceptions Ability to transact with both Bermuda and London wholesale markets Europe 38 employees London and Dublin Surplus-lines licensed in 43 states Licensed on fully admitted basis in all EU countries Business written in 188 countries since inception AXIS Insurance Australasia 3 employees Marketing presence in Singapore Strategic foothold in Australia |
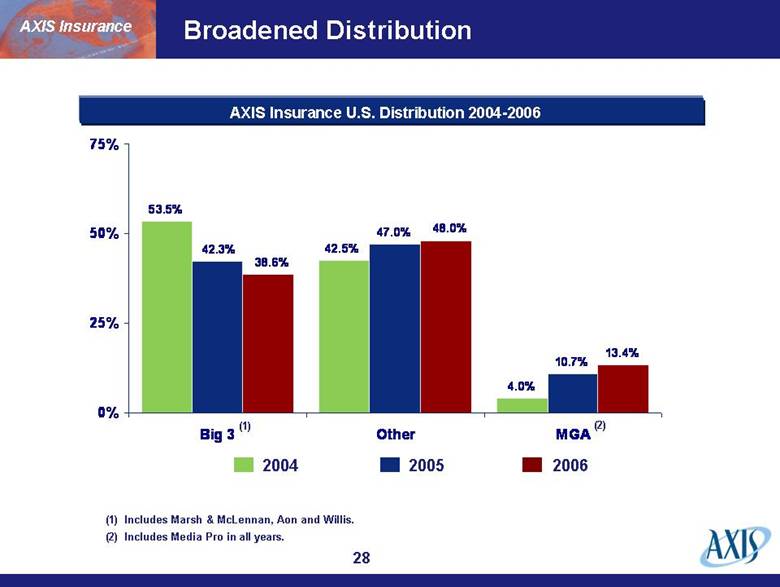
| Broadened Distribution 2004 2005 2006 (1) (1) Includes Marsh & McLennan, Aon and Willis. (2) Includes Media Pro in all years. AXIS Insurance AXIS Insurance U.S. Distribution 2004-2006 (2) 53.5% 4.0% 47.0% 10.7% 13.4% 42.5% 42.3% 38.6% 48.0% 0% 25% 50% 75% Big 3 Other MGA |
| AXIS Insurance – Specialty Lines |

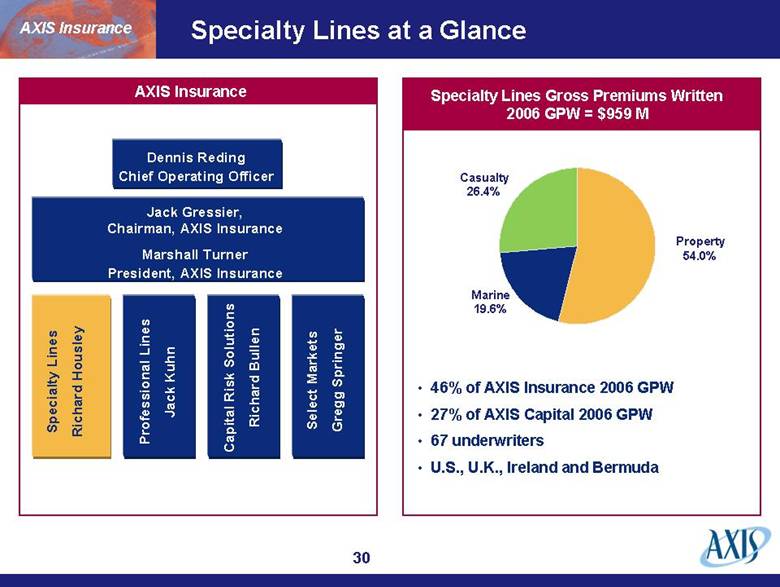
| Specialty Lines at a Glance Jack Gressier, Chairman, AXIS Insurance Marshall Turner President, AXIS Insurance Specialty Lines Richard Housley Dennis Reding Chief Operating Officer Select Markets Gregg Springer Capital Risk Solutions Richard Bullen Professional Lines Jack Kuhn AXIS Insurance Marine 19.6% Casualty 26.4% Property 54.0% Specialty Lines Gross Premiums Written 2006 GPW = $959 M AXIS Insurance 46% of AXIS Insurance 2006 GPW 27% of AXIS Capital 2006 GPW 67 underwriters U.S., U.K., Ireland and Bermuda |
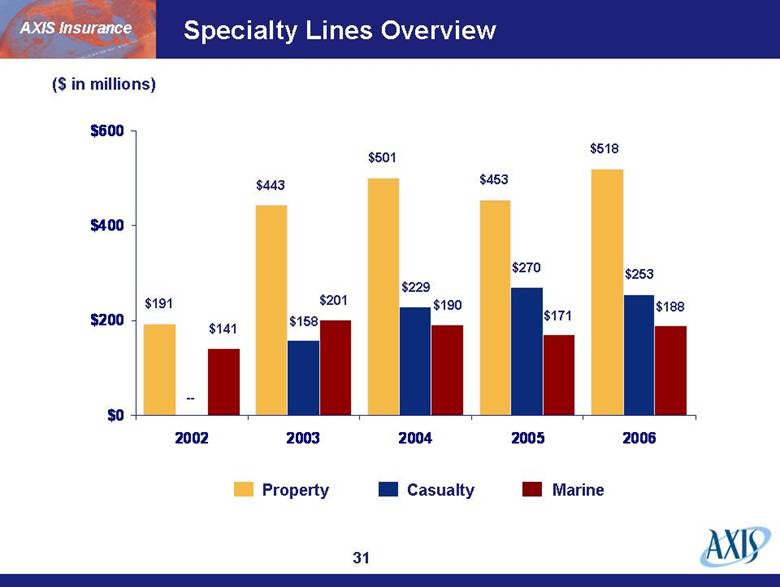
| Specialty Lines Overview Property Casualty Marine ($ in millions) $191 $443 $501 $453 $518 $141 $158 $201 $229 $190 $270 $171 $253 $188 -- AXIS Insurance $0 $200 $400 $600 2002 2003 2004 2005 2006 |
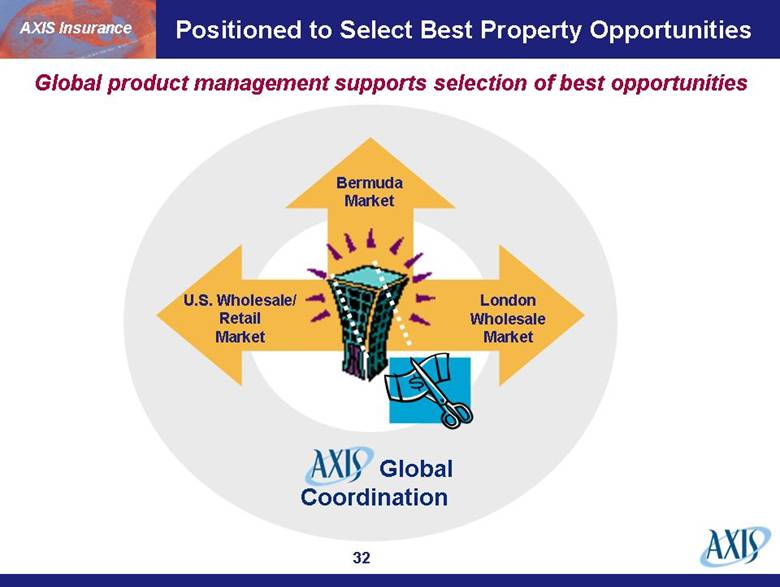
| AXIS Insurance Positioned to Select Best Property Opportunities Bermuda Market London Wholesale Market U.S. Wholesale/ Retail Market Global product management supports selection of best opportunities Global Coordination |
| Cat exposures are modelled and managed by centralized catastrophe management unit Managed within allocated PML limits Includes allocations for non-modelled exposures Reinsurance purchased to maximize our gross and net premium / return potential within net PML constraints Emphasis on Insurance to Value analysis Continual monitoring of “regulatory risk” AXIS Insurance Catastrophe Exposure Management |
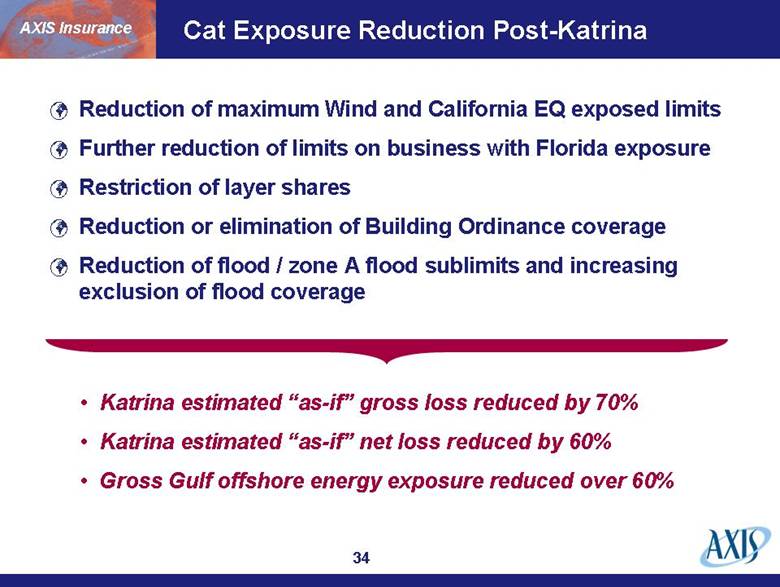
| Reduction of maximum Wind and California EQ exposed limits Further reduction of limits on business with Florida exposure Restriction of layer shares Reduction or elimination of Building Ordinance coverage Reduction of flood / zone A flood sublimits and increasing exclusion of flood coverage AXIS Insurance Cat Exposure Reduction Post-Katrina Katrina estimated “as-if” gross loss reduced by 70% Katrina estimated “as-if” net loss reduced by 60% Gross Gulf offshore energy exposure reduced over 60% |
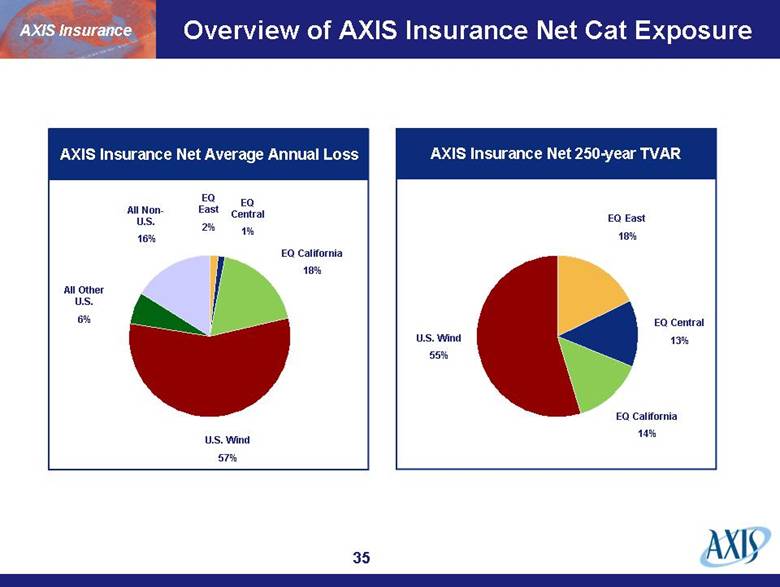
| Overview of AXIS Insurance Net Cat Exposure EQ California 18% U.S. Wind 57% EQ East 2% EQ Central 1% AXIS Insurance Net Average Annual Loss AXIS Insurance Net 250-year TVAR AXIS Insurance EQ California 14% U.S. Wind 55% EQ East 18% EQ Central 13% All Other U.S. 6% All Non-U.S. 16% |
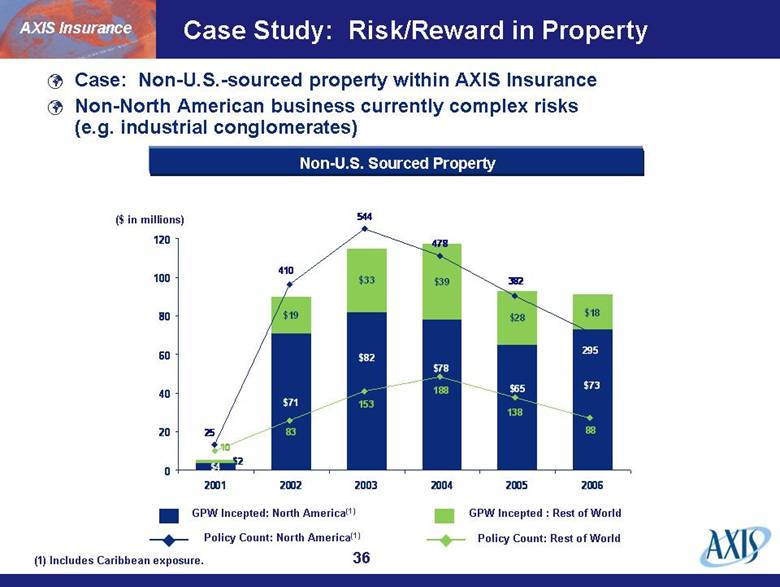
| ($ in millions) GPW Incepted: North America(1) GPW Incepted : Rest of World (1) Includes Caribbean exposure. Policy Count: North America(1) Policy Count: Rest of World AXIS Insurance Non-U.S. Sourced Property Case Study: Risk/Reward in Property $4 $71 $19 $33 $39 $28 $18 $73 $65 $78 $82 $2 0 20 40 60 80 100 120 2001 2002 2003 2004 2005 2006 25 295 382 478 410 544 83 10 153 188 138 88 Case: Non-U.S.-sourced property within AXIS Insurance Non-North American business currently complex risks (e.g. industrial conglomerates) |
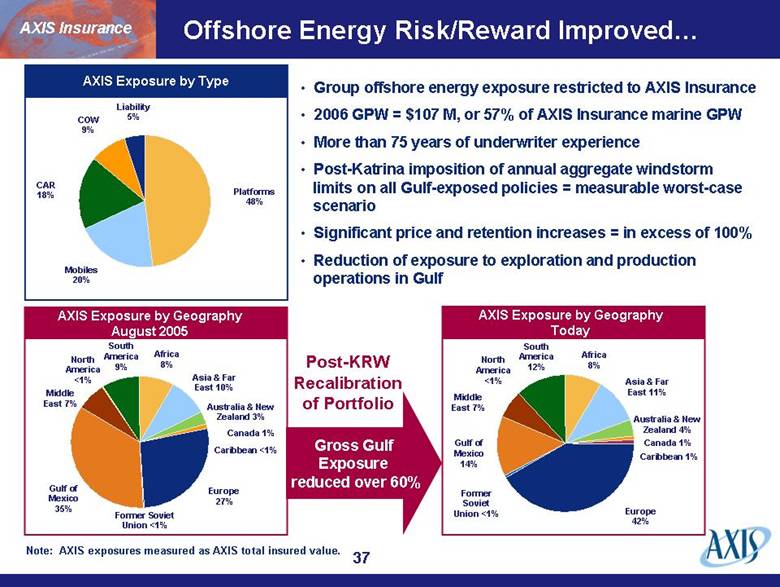
| Offshore Energy Risk/Reward Improved Africa 8% Asia & Far East 10% Australia & New Zealand 3% Canada 1% Europe 27% Gulf of Mexico 35% Middle East 7% South America 9% Africa 8% Asia & Far East 11% Australia & New Zealand 4% Canada 1% Caribbean 1% Europe 42% Former Soviet Union <1% Former Soviet Union <1% Gulf of Mexico 14% Middle East 7% South America 12% Caribbean <1% North America <1% North America <1% AXIS Exposure by Geography August 2005 AXIS Exposure as of [Date] Gross Gulf Exposure reduced over 60% Post-KRW Recalibration of Portfolio Liability 5% Platforms 48% Mobiles 20% CAR 18% COW 9% AXIS Exposure by Type Note: AXIS exposures measured as AXIS total insured value. AXIS Exposure by Geography Today AXIS Insurance Group offshore energy exposure restricted to AXIS Insurance 2006 GPW = $107 M, or 57% of AXIS Insurance marine GPW More than 75 years of underwriter experience Post-Katrina imposition of annual aggregate windstorm limits on all Gulf-exposed policies = measurable worst-case scenario Significant price and retention increases = in excess of 100% Reduction of exposure to exploration and production operations in Gulf |
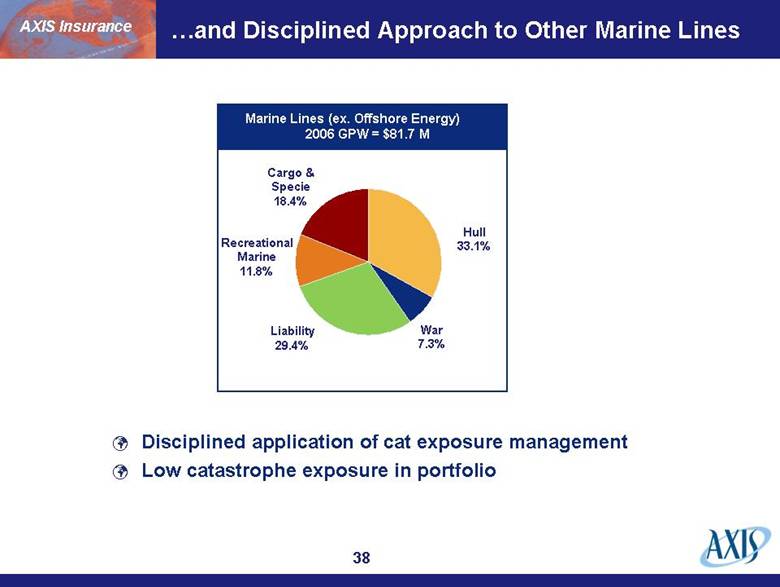
| AXIS Insurance War 7.3% Cargo & Specie 18.4% Hull 33.1% Liability 29.4% Marine Lines (ex. Offshore Energy) 2006 GPW = $81.7 M Disciplined application of cat exposure management Low catastrophe exposure in portfolio Recreational Marine 11.8% and Disciplined Approach to Other Marine Lines |
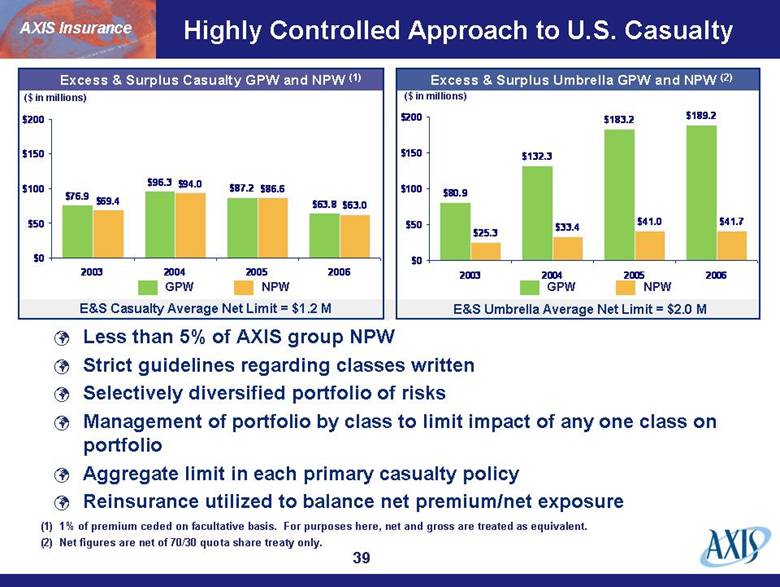
| AXIS Insurance Highly Controlled Approach to U.S. Casualty Excess & Surplus Casualty GPW and NPW (1) ($ in millions) Excess & Surplus Umbrella GPW and NPW (2) ($ in millions) NPW GPW NPW GPW (1) 1% of premium ceded on facultative basis. For purposes here, net and gross are treated as equivalent. (2) Net figures are net of 70/30 quota share treaty only. E&S Casualty Average Net Limit = $1.2 M E&S Umbrella Average Net Limit = $2.0 M Less than 5% of AXIS group NPW Strict guidelines regarding classes written Selectively diversified portfolio of risks Management of portfolio by class to limit impact of any one class on portfolio Aggregate limit in each primary casualty policy Reinsurance utilized to balance net premium/net exposure $80.9 $132.3 $183.2 $189.2 $25.3 $33.4 $41.0 $41.7 $0 $50 $100 $150 $200 2003 2004 2005 2006 $76.9 $96.3 $87.2 $63.8 $69.4 $94.0 $86.6 $63.0 $0 $50 $100 $150 $200 2003 2004 2005 2006 |
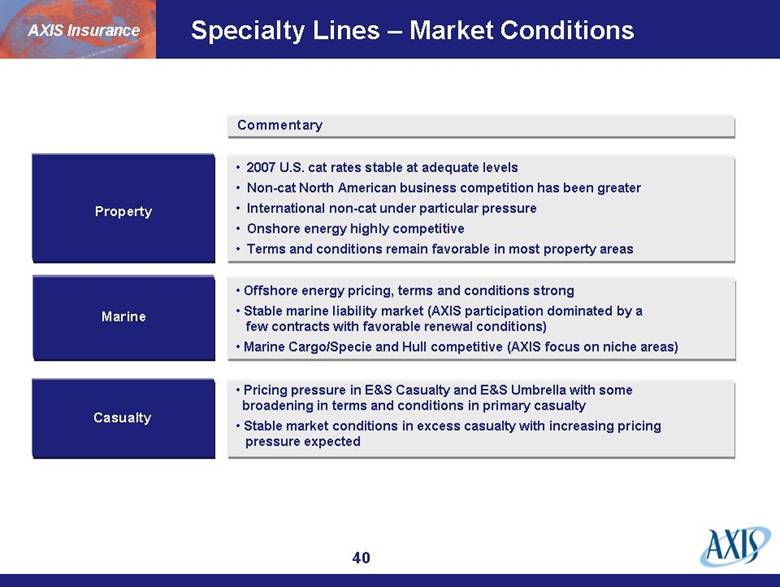
| Specialty Lines – Market Conditions Commentary Marine Offshore energy pricing, terms and conditions strong Stable marine liability market (AXIS participation dominated by a few contracts with favorable renewal conditions) Marine Cargo/Specie and Hull competitive (AXIS focus on niche areas) Pricing pressure in E&S Casualty and E&S Umbrella with some broadening in terms and conditions in primary casualty Stable market conditions in excess casualty with increasing pricing pressure expected Property Casualty AXIS Insurance 2007 U.S. cat rates stable at adequate levels Non-cat North American business competition has been greater International non-cat under particular pressure Onshore energy highly competitive Terms and conditions remain favorable in most property areas |
| AXIS Insurance – Professional Lines |

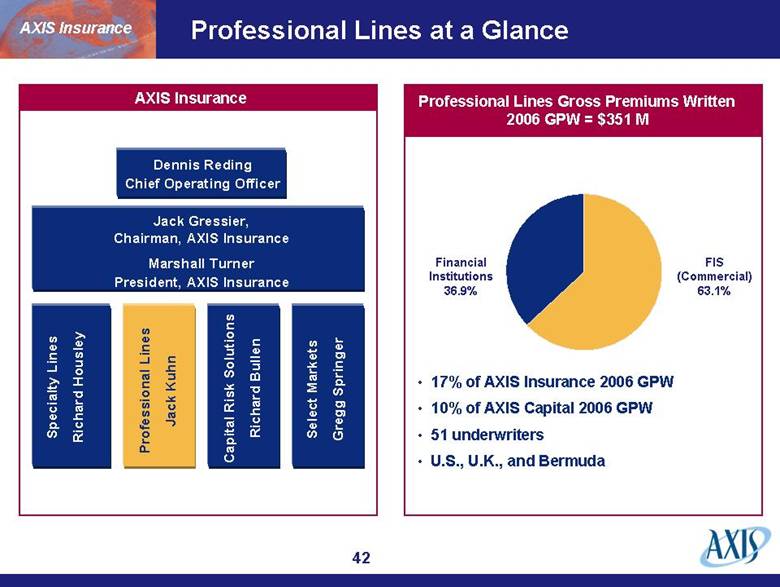
| Professional Lines at a Glance Jack Gressier, Chairman, AXIS Insurance Marshall Turner President, AXIS Insurance Specialty Lines Richard Housley Dennis Reding Chief Operating Officer Capital Risk Solutions Select Markets Gregg Springer Richard Bullen Professional Lines Jack Kuhn AXIS Insurance Financial Institutions 36.9% FIS (Commercial) 63.1% Professional Lines Gross Premiums Written 2006 GPW = $351 M AXIS Insurance 17% of AXIS Insurance 2006 GPW 10% of AXIS Capital 2006 GPW 51 underwriters U.S., U.K., and Bermuda |
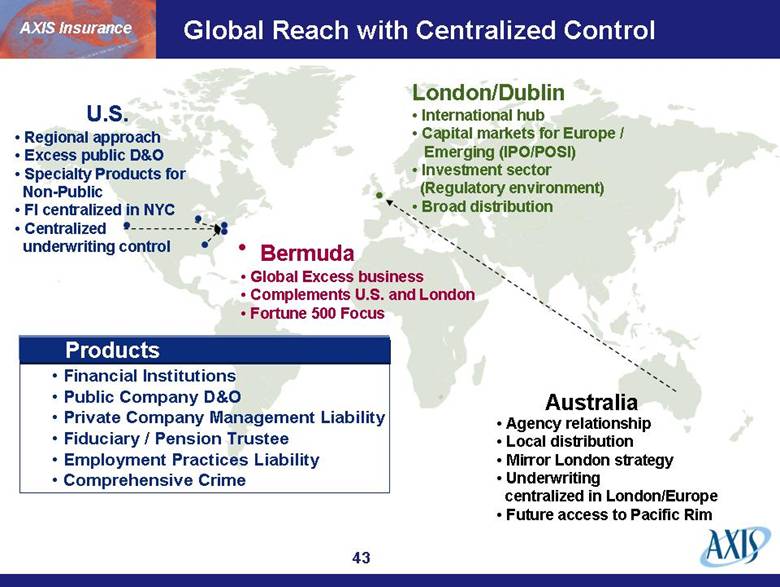
| Global Reach with Centralized Control Bermuda London/Dublin Australia U.S. Regional approach Excess public D&O Specialty Products for Non-Public FI centralized in NYC Centralized underwriting control Global Excess business Complements U.S. and London Fortune 500 Focus International hub Capital markets for Europe / Emerging (IPO/POSI) Investment sector (Regulatory environment) Broad distribution Agency relationship Local distribution Mirror London strategy Underwriting centralized in London/Europe Future access to Pacific Rim Financial Institutions Public Company D&O Private Company Management Liability Fiduciary / Pension Trustee Employment Practices Liability Comprehensive Crime Products AXIS Insurance |
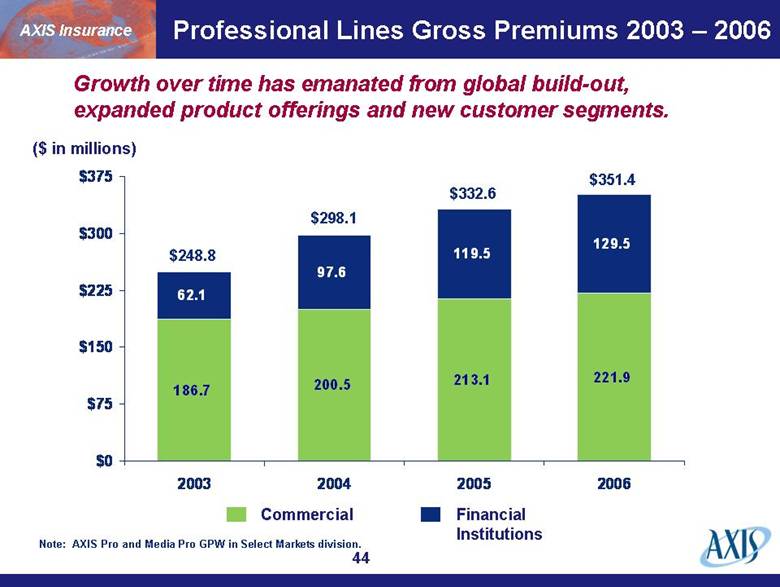
| Professional Lines Gross Premiums 2003 – 2006 Commercial Financial Institutions ($ in millions) $248.8 $298.1 $332.6 $351.4 Growth over time has emanated from global build-out, expanded product offerings and new customer segments. AXIS Insurance Note: AXIS Pro and Media Pro GPW in Select Markets division. 186.7 200.5 213.1 221.9 62.1 97.6 119.5 129.5 $0 $75 $150 $225 $300 $375 2003 2004 2005 2006 |
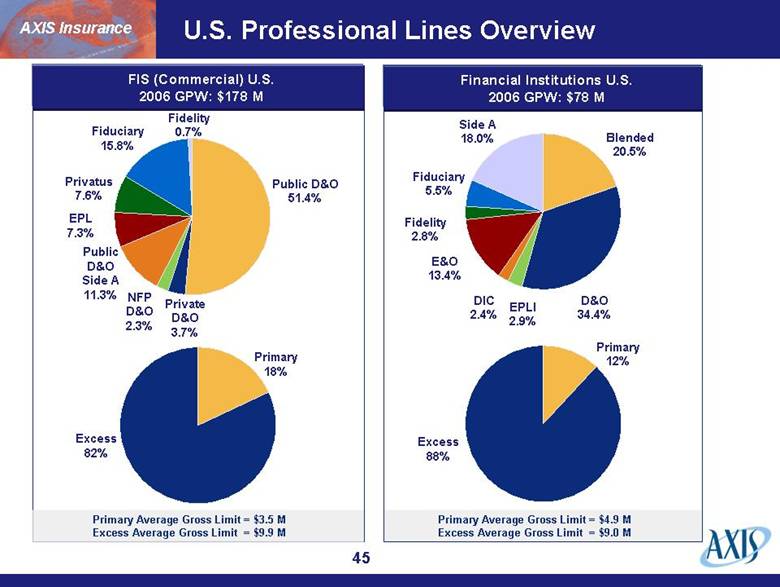
| U.S. Professional Lines Overview Private D&O 3.7% NFP D&O 2.3% Public D&O Side A 11.3% Fiduciary 15.8% Fidelity 0.7% Public D&O 51.4% EPL 7.3% Privatus 7.6% AXIS Insurance FIS (Commercial) U.S. 2006 GPW: $178 M Excess 82% Primary 18% Primary Average Gross Limit = $3.5 M Excess Average Gross Limit = $9.9 M Financial Institutions U.S. 2006 GPW: $78 M Primary Average Gross Limit = $4.9 M Excess Average Gross Limit = $9.0 M D&O 34.4% EPLI 2.9% DIC 2.4% Side A 18.0% E&O 13.4% Blended 20.5% Fidelity 2.8% Fiduciary 5.5% Excess 88% Primary 12% |
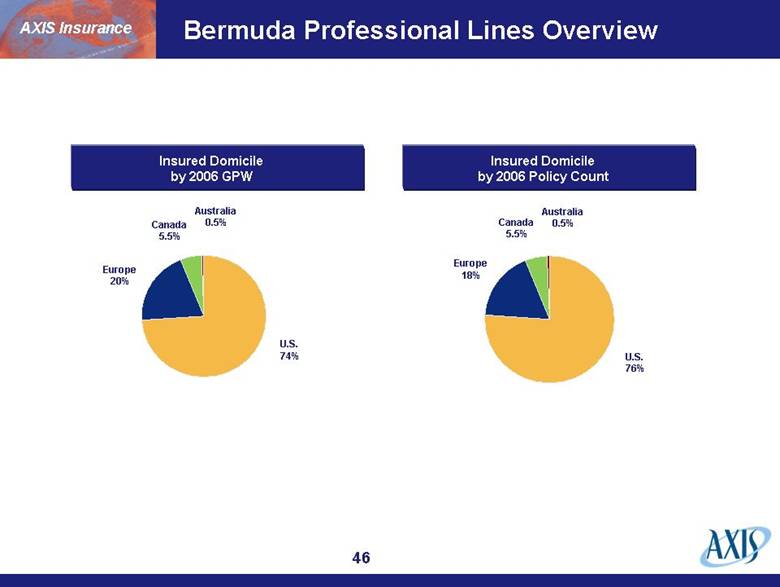
| Bermuda Professional Lines Overview U.S. 74% Europe 20% Australia 0.5% Canada 5.5% AXIS Insurance Europe 18% U.S. 76% Canada 5.5% Australia 0.5% Insured Domicile by 2006 GPW Insured Domicile by 2006 Policy Count |
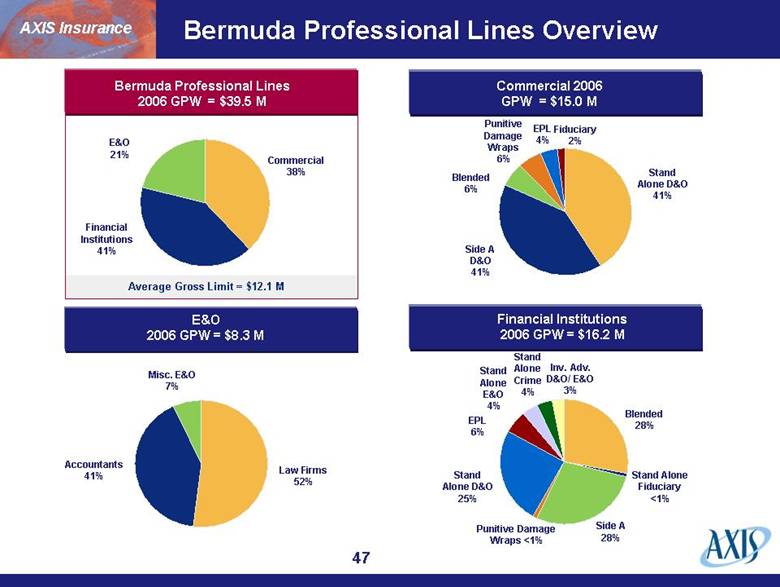
| Bermuda Professional Lines Overview Blended 28% Punitive Damage Wraps <1% Stand Alone D&O 25% EPL 6% Stand Alone E&O 4% Stand Alone Crime 4% Stand Alone D&O 41% Blended 6% Law Firms 52% Accountants 41% AXIS Insurance Commercial 2006 GPW = $15.0 M Financial Institutions 2006 GPW = $16.2 M E&O 2006 GPW = $8.3 M Side A D&O 41% Punitive Damage Wraps 6% EPL 4% Fiduciary 2% Stand Alone Fiduciary <1% Side A 28% Inv. Adv. D&O/ E&O 3% Misc. E&O 7% Financial Institutions 41% Commercial 38% E&O 21% Bermuda Professional Lines 2006 GPW = $39.5 M Average Gross Limit = $12.1 M |
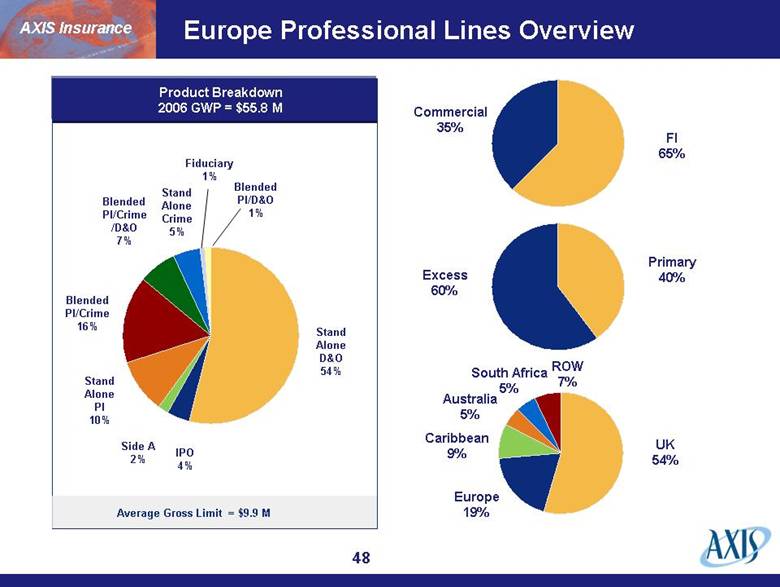
| Europe Professional Lines Overview IPO 4% Side A 2% Stand Alone PI 10% Stand Alone Crime 5% Fiduciary 1% Stand Alone D&O 54% Blended PI/Crime 16% Blended PI/Crime /D&O 7% Product Breakdown 2006 GWP = $55.8 M Blended PI/D&O 1% AXIS Insurance FI 65% Commercial 35% Primary 40% Excess 60% UK 54% Europe 19% Caribbean 9% Australia 5% South Africa 5% ROW 7% Average Gross Limit = $9.9 M |
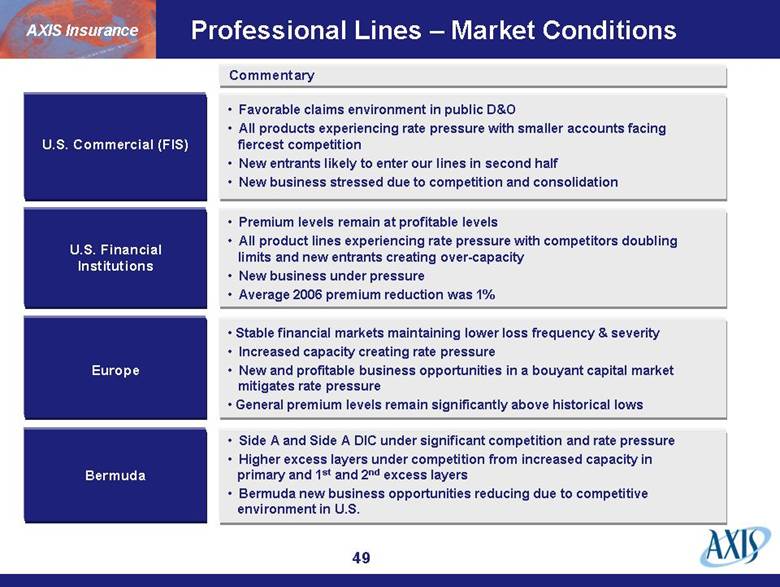
| Professional Lines – Market Conditions Commentary Stable financial markets maintaining lower loss frequency & severity Increased capacity creating rate pressure New and profitable business opportunities in a bouyant capital market mitigates rate pressure General premium levels remain significantly above historical lows Europe U.S. Commercial (FIS) AXIS Insurance U.S. Financial Institutions Bermuda Side A and Side A DIC under significant competition and rate pressure Higher excess layers under competition from increased capacity in primary and 1st and 2nd excess layers Bermuda new business opportunities reducing due to competitive environment in U.S. Premium levels remain at profitable levels All product lines experiencing rate pressure with competitors doubling limits and new entrants creating over-capacity New business under pressure Average 2006 premium reduction was 1% Favorable claims environment in public D&O All products experiencing rate pressure with smaller accounts facing fiercest competition New entrants likely to enter our lines in second half New business stressed due to competition and consolidation |
| AXIS Insurance – Select Markets |
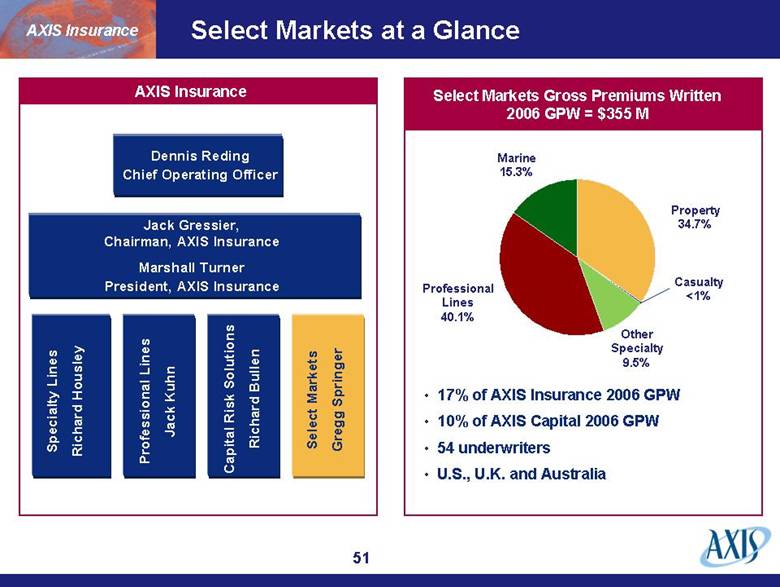
| Select Markets at a Glance Jack Gressier, Chairman, AXIS Insurance Marshall Turner President, AXIS Insurance Specialty Lines Richard Housley Select Markets Gregg Springer Capital Risk Solutions Richard Bullen Professional Lines Jack Kuhn AXIS Insurance Professional Lines 40.1% Property 34.7% Select Markets Gross Premiums Written 2006 GPW = $355 M Casualty <1% Other Specialty 9.5% Marine 15.3% Dennis Reding Chief Operating Officer AXIS Insurance 17% of AXIS Insurance 2006 GPW 10% of AXIS Capital 2006 GPW 54 underwriters U.S., U.K. and Australia |
| Characteristics of Targeted Business Premium per policy up to $50k Less complex business Higher item count required to leverage expense base Focused on small end of commercial market Key to profitability and success is leading expense ratio Non-subscription / 100% business AXIS Insurance |
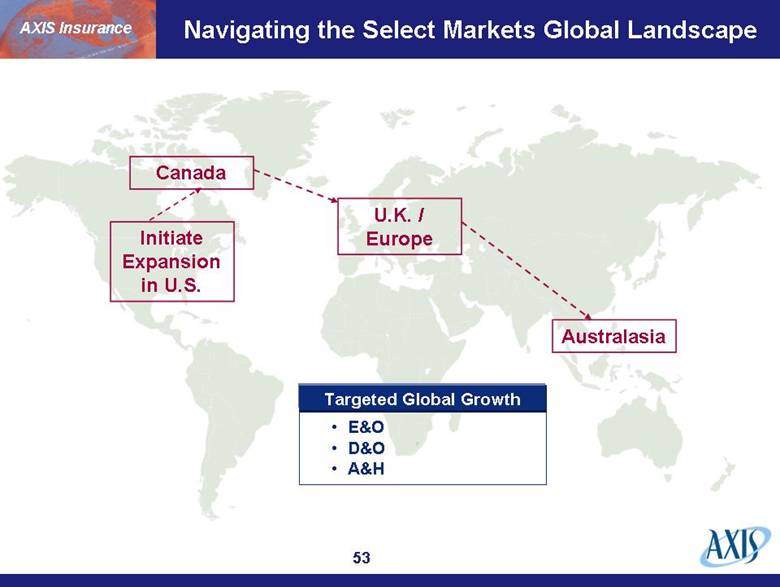
| Initiate Expansion in U.S. Targeted Global Growth AXIS Insurance Canada U.K. / Europe Australasia Navigating the Select Markets Global Landscape E&O D&O A&H |
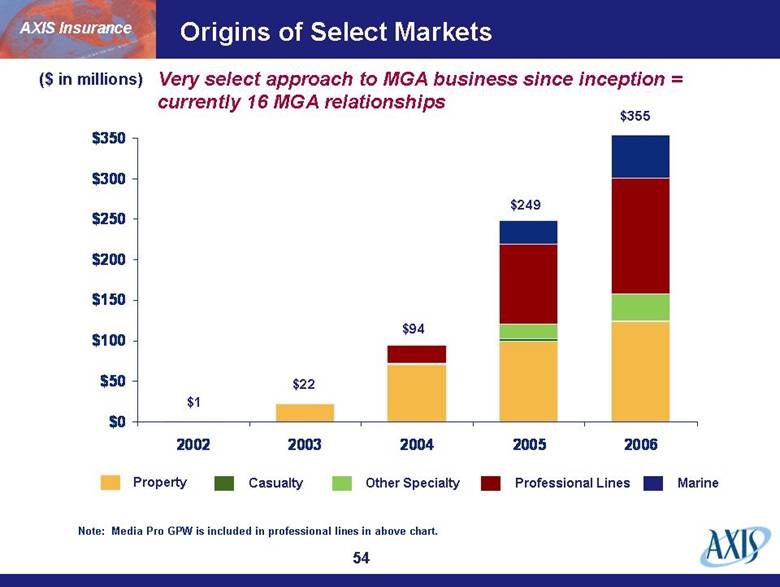
| Origins of Select Markets ($ in millions) Property Other Specialty Professional Lines Casualty $94 $249 $355 Very select approach to MGA business since inception = currently 16 MGA relationships AXIS Insurance Marine Note: Media Pro GPW is included in professional lines in above chart. $22 $1 $0 $50 $100 $150 $200 $250 $300 $350 2002 2003 2004 2005 2006 |
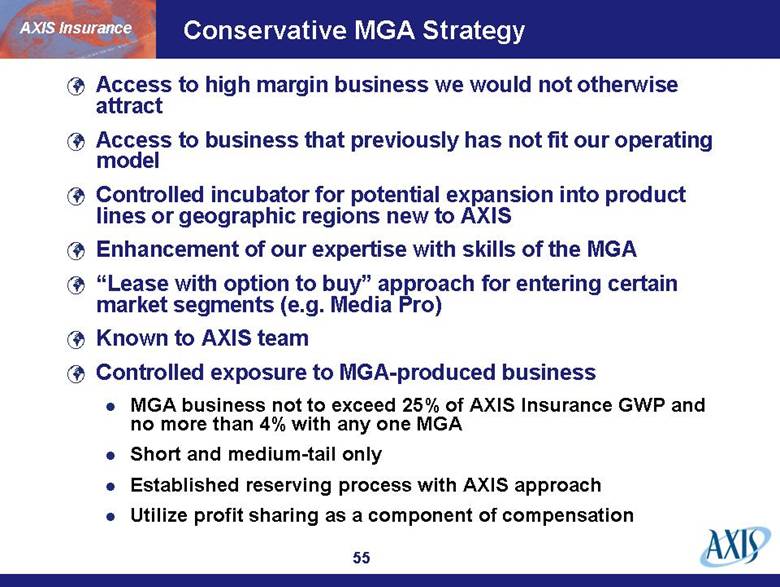
| Conservative MGA Strategy Access to high margin business we would not otherwise attract Access to business that previously has not fit our operating model Controlled incubator for potential expansion into product lines or geographic regions new to AXIS Enhancement of our expertise with skills of the MGA “Lease with option to buy” approach for entering certain market segments (e.g. Media Pro) Known to AXIS team Controlled exposure to MGA-produced business MGA business not to exceed 25% of AXIS Insurance GWP and no more than 4% with any one MGA Short and medium-tail only Established reserving process with AXIS approach Utilize profit sharing as a component of compensation AXIS Insurance |
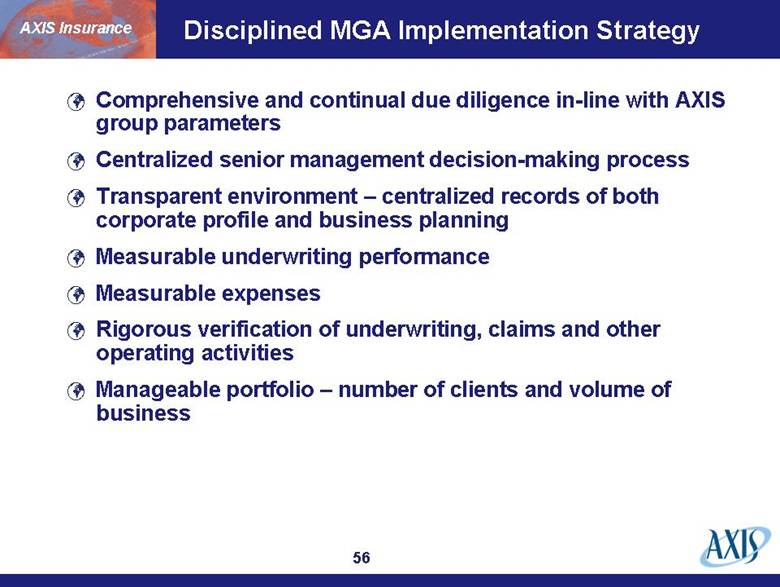
| Disciplined MGA Implementation Strategy Comprehensive and continual due diligence in-line with AXIS group parameters Centralized senior management decision-making process Transparent environment – centralized records of both corporate profile and business planning Measurable underwriting performance Measurable expenses Rigorous verification of underwriting, claims and other operating activities Manageable portfolio – number of clients and volume of business AXIS Insurance |
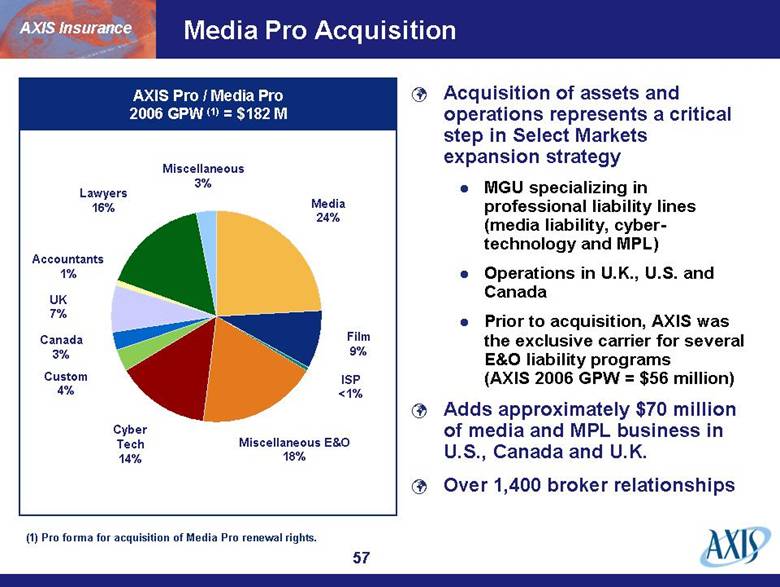
| Media Pro Acquisition AXIS Pro / Media Pro 2006 GPW (1) By Class of Business Acquisition of assets and operations represents a critical step in Select Markets expansion strategy MGU specializing in professional liability lines (media liability, cyber-technology and MPL) Operations in U.K., U.S. and Canada Prior to acquisition, AXIS was the exclusive carrier for several E&O liability programs (AXIS 2006 GPW = $56 million) Adds approximately $70 million of media and MPL business in U.S., Canada and U.K. Over 1,400 broker relationships (1) Pro forma for acquisition of Media Pro renewal rights. Media 24% Custom 4% Lawyers 16% AXIS Pro / Media Pro 2006 GPW (1) = $182 M Miscellaneous E&O 18% Cyber Tech 14% UK 7% Accountants 1% Miscellaneous 3% Film 9% Canada3% ISP <1% AXIS Insurance |
| Select Markets Global Expansion Strategy Business already addressed in very select fashion largely through MGA distribution Some MGA business will not fit “auto-written” model and will continue on MGA basis Significant opportunity exists to transact the balance more efficiently without sacrificing our diligence and underwriting standards Near-term goal: Address efficiency in areas where we already have considerable expertise and knowledge of portfolio Medium-term goal: Address small-premium, high item-count specialty business in specific niche or target markets in U.S., U.K., Europe, and Australasia AXIS Insurance |
| AXIS Insurance – Capital Risk Solutions |

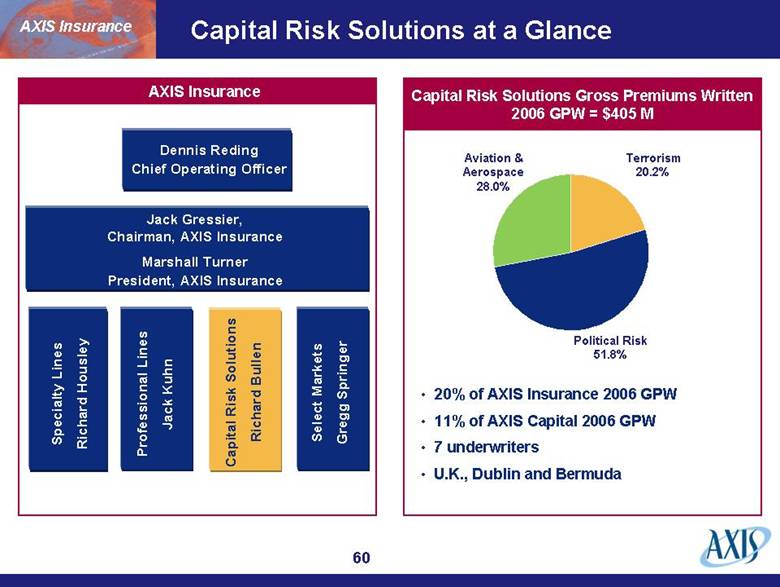
| Capital Risk Solutions at a Glance Jack Gressier, Chairman, AXIS Insurance Marshall Turner President, AXIS Insurance Specialty Lines Richard Housley Dennis Reding Chief Operating Officer Capital Risk Solutions Select Markets Gregg Springer Capital Risk Solutions Richard Bullen Professional Lines Jack Kuhn AXIS Insurance Aviation & Aerospace 28.0% Terrorism 20.2% Political Risk 51.8% Capital Risk Solutions Gross Premiums Written 2006 GPW = $405 M AXIS Insurance 20% of AXIS Insurance 2006 GPW 11% of AXIS Capital 2006 GPW 7 underwriters U.K., Dublin and Bermuda |
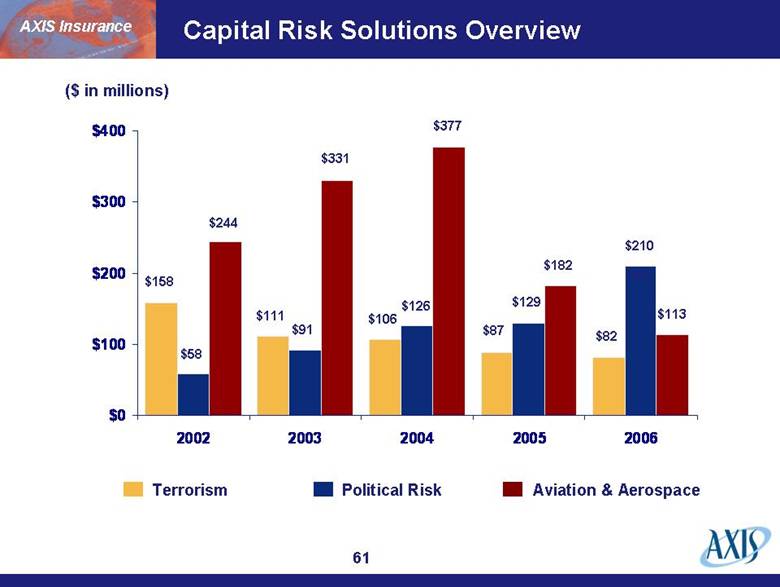
| Capital Risk Solutions Overview Terrorism Political Risk Aviation & Aerospace ($ in millions) $158 $111 $106 $87 $82 $244 $91 $331 $126 $377 $129 $182 253 $113 $210 $58 AXIS Insurance $0 $100 $200 $300 $400 2002 2003 2004 2005 2006 |
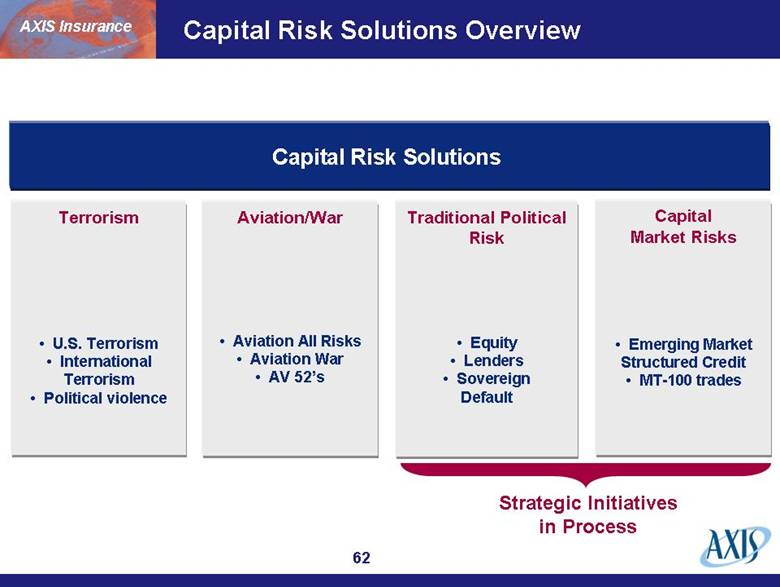
| Capital Risk Solutions Aviation/War Aviation All Risks Aviation War AV 52’s Terrorism U.S. Terrorism International Terrorism Political violence Capital Market Risks Emerging Market Structured Credit MT-100 trades Traditional Political Risk Equity Lenders Sovereign Default Strategic Initiatives in Process Capital Risk Solutions Overview AXIS Insurance |
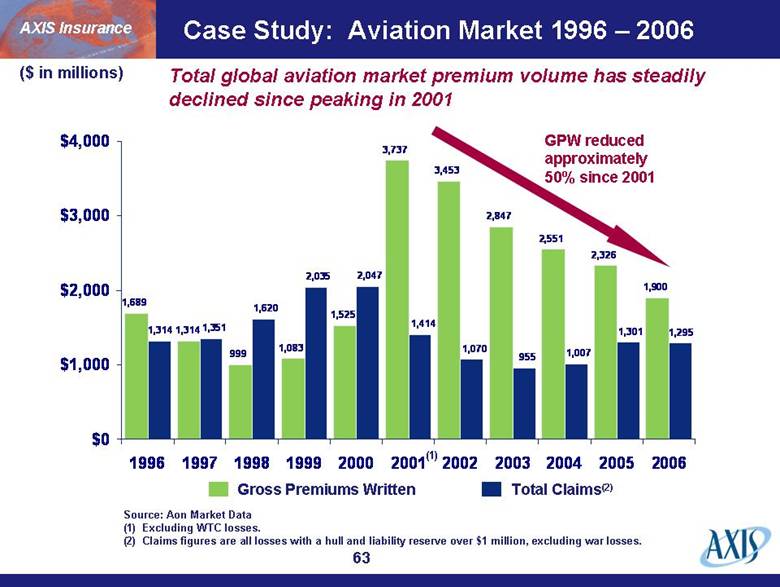
| Case Study: Aviation Market 1996 – 2006 Gross Premiums Written Total Claims(2) ($ in millions) Source: Aon Market Data (1) Excluding WTC losses. (2) Claims figures are all losses with a hull and liability reserve over $1 million, excluding war losses. (1) AXIS Insurance Total global aviation market premium volume has steadily declined since peaking in 2001 GPW reduced approximately 50% since 2001 1,689 999 1,083 1,525 3,737 3,453 2,847 2,551 2,326 1,900 1,314 1,295 1,301 1,007 955 1,070 1,414 1,620 2,047 2,035 1,314 1,351 $0 $1,000 $2,000 $3,000 $4,000 1996 1997 1998 1999 2000 2001 2002 2003 2004 2005 2006 |
| AXIS Insurance $84 $178 $364 $328 $233 ($ in millions) All Risk AV52 War Airline-related GPW In-force by Underwriting Year AXIS airline-related GPW reduced 77% since 2004 Cycle Management: AXIS Airline-Related Portfolio $0 $100 $200 $300 $400 2002 2003 2004 2005 2006 |

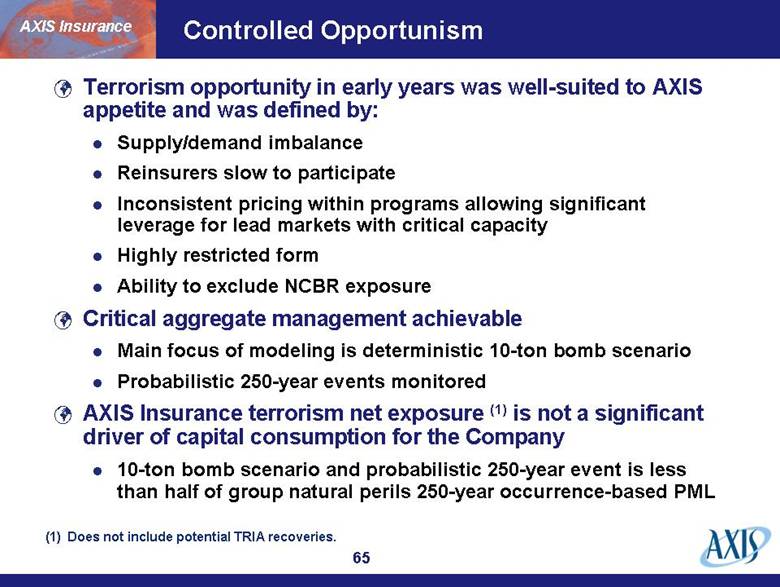
| Terrorism opportunity in early years was well-suited to AXIS appetite and was defined by: Supply/demand imbalance Reinsurers slow to participate Inconsistent pricing within programs allowing significant leverage for lead markets with critical capacity Highly restricted form Ability to exclude NCBR exposure Critical aggregate management achievable Main focus of modeling is deterministic 10-ton bomb scenario Probabilistic 250-year events monitored AXIS Insurance terrorism net exposure (1) is not a significant driver of capital consumption for the Company 10-ton bomb scenario and probabilistic 250-year event is less than half of group natural perils 250-year occurrence-based PML AXIS Insurance Controlled Opportunism (1) Does not include potential TRIA recoveries. |
| Capital Risk Solutions Expansion Strategy Centerpiece is political risk and associated lines of emerging market risk High levels of embedded underwriting expertise Strategic partnerships built on high level of trust and transparency in place Scale of market and opportunity dwarfs that of the global non-life insurance industry Competitive advantage to date has been in the area of product development AXIS Insurance |
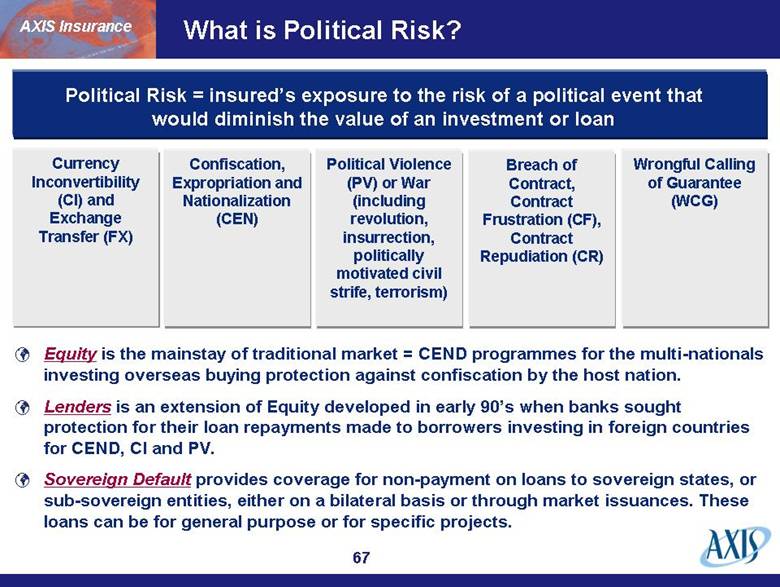
| Political Risk = insured’s exposure to the risk of a political event that would diminish the value of an investment or loan Wrongful Calling of Guarantee (WCG) Breach of Contract, Contract Frustration (CF), Contract Repudiation (CR) Political Violence (PV) or War (including revolution, insurrection, politically motivated civil strife, terrorism) Confiscation, Expropriation and Nationalization (CEN) Currency Inconvertibility (CI) and Exchange Transfer (FX) What is Political Risk? Equity is the mainstay of traditional market = CEND programmes for the multi-nationals investing overseas buying protection against confiscation by the host nation. Lenders is an extension of Equity developed in early 90’s when banks sought protection for their loan repayments made to borrowers investing in foreign countries for CEND, CI and PV. Sovereign Default provides coverage for non-payment on loans to sovereign states, or sub-sovereign entities, either on a bilateral basis or through market issuances. These loans can be for general purpose or for specific projects. AXIS Insurance |
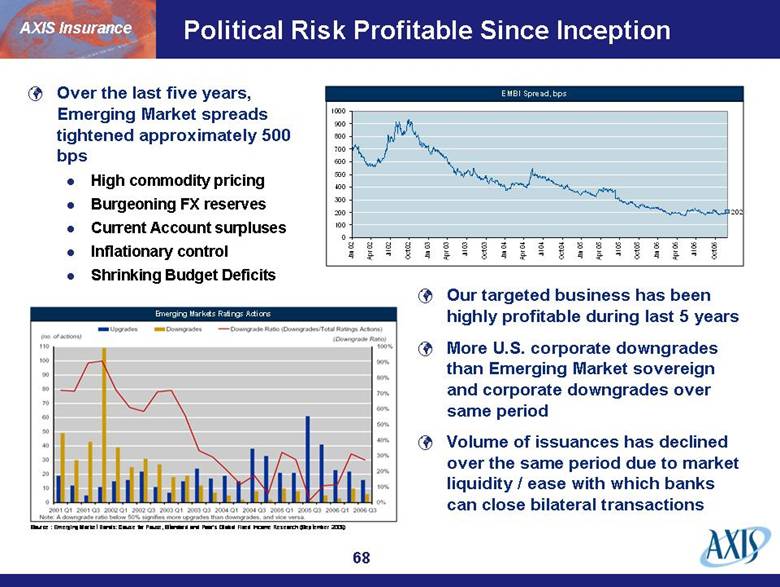
| Political Risk Profitable Since Inception Our targeted business has been highly profitable during last 5 years More U.S. corporate downgrades than Emerging Market sovereign and corporate downgrades over same period Volume of issuances has declined over the same period due to market liquidity / ease with which banks can close bilateral transactions Over the last five years, Emerging Market spreads tightened approximately 500 bps High commodity pricing Burgeoning FX reserves Current Account surpluses Inflationary control Shrinking Budget Deficits AXIS Insurance Emerging Markets Ratings Actions Source : Emerging Market Bonds: Cause for Pause, Standard and Poor’s Global Fixed Income Research (September 2006) 202 0 100 200 300 400 500 600 700 800 900 1000 Jan 02 Apr 02 Jul 02 Oct 02 Jan 03 Apr 03 Jul 03 Oct 03 Jan 04 Apr 04 Jul 04 Oct 04 Jan 05 Apr 05 Jul 05 Oct 05 Jan 06 Apr 06 Jul 06 Oct 06 EMBI Spread, bps |
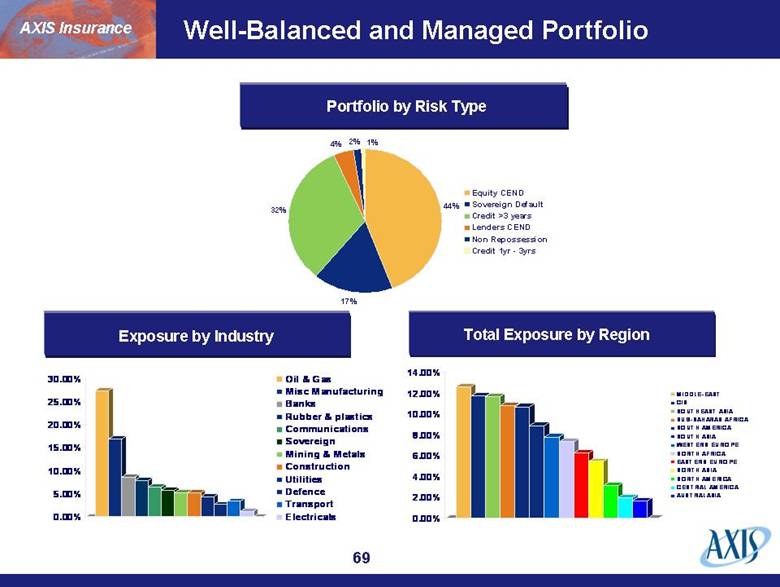
| Well-Balanced and Managed Portfolio Total Exposure by Region Portfolio by Risk Type Exposure by Industry AXIS Insurance 0.00% 2.00% 4.00% 6.00% 8.00% 10.00% 12.00% 14.00% MIDDLE-EAST CIS SOUTHEAST ASIA SUB-SAHARAN AFRICA SOUTH AMERICA SOUTH ASIA WESTERN EUROPE NORTH AFRICA EASTERN EUROPE NORTH ASIA NORTH AMERICA CENTRAL AMERICA AUSTRALASIA 44% 17% 32% 4% 2% 1% Equity CEND Sovereign Default Credit >3 years Lenders CEND Non Repossession Credit 1yr - 3yrs 0.00% 5.00% 10.00% 15.00% 20.00% 25.00% 30.00% Oil & Gas Misc Manufacturing Banks Rubber & plastics Communications Sovereign Mining & Metals Construction Utilities Defence Transport Electricals |
| Evolving Political Risk AXIS Insurance Coverage sought for risks placed in the capital markets: Protection of the issuance either through Political Risk/ Credit-enhanced policies offered for bond holders at large Specific entities seeking protection for their own book Ability to write transactions which do not support trade-related finance increase opportunity Implementation of Basel II creates opportunity Political Risk Annual Premium by Type Emerging Market Structured Credit % of in-force portfolio < 25% 0% 10% 20% 30% 40% 50% 60% 70% 80% 90% 100% 2001 2002 2003 2004 2005 2006 2007 Credit CEND / NON-HON / SD Repo War CI |

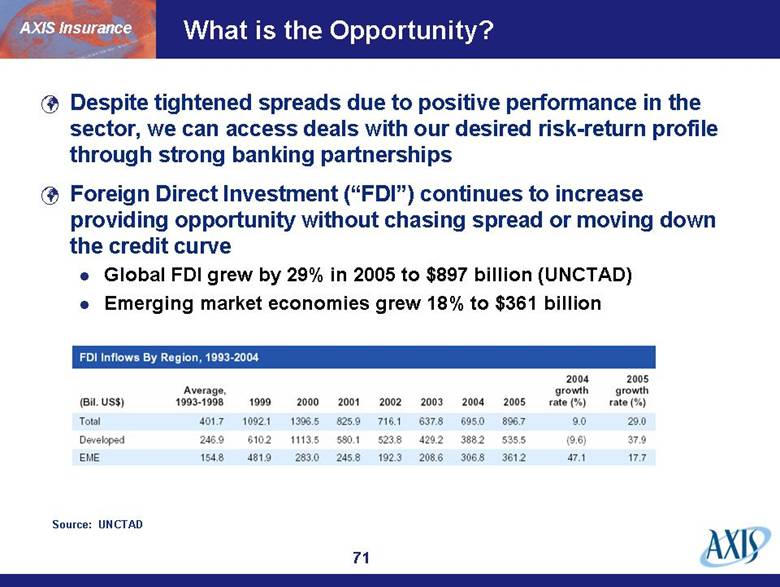
| What is the Opportunity? Despite tightened spreads due to positive performance in the sector, we can access deals with our desired risk-return profile through strong banking partnerships Foreign Direct Investment (“FDI”) continues to increase providing opportunity without chasing spread or moving down the credit curve Global FDI grew by 29% in 2005 to $897 billion (UNCTAD) Emerging market economies grew 18% to $361 billion AXIS Insurance Source: UNCTAD |
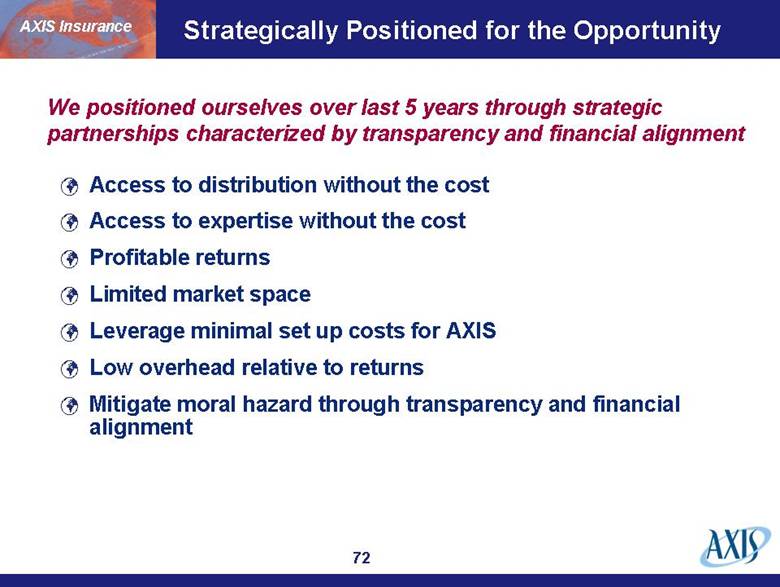
| Access to distribution without the cost Access to expertise without the cost Profitable returns Limited market space Leverage minimal set up costs for AXIS Low overhead relative to returns Mitigate moral hazard through transparency and financial alignment AXIS Insurance Strategically Positioned for the Opportunity We positioned ourselves over last 5 years through strategic partnerships characterized by transparency and financial alignment |
| AXIS Insurance Questions? |
| AXIS Re |
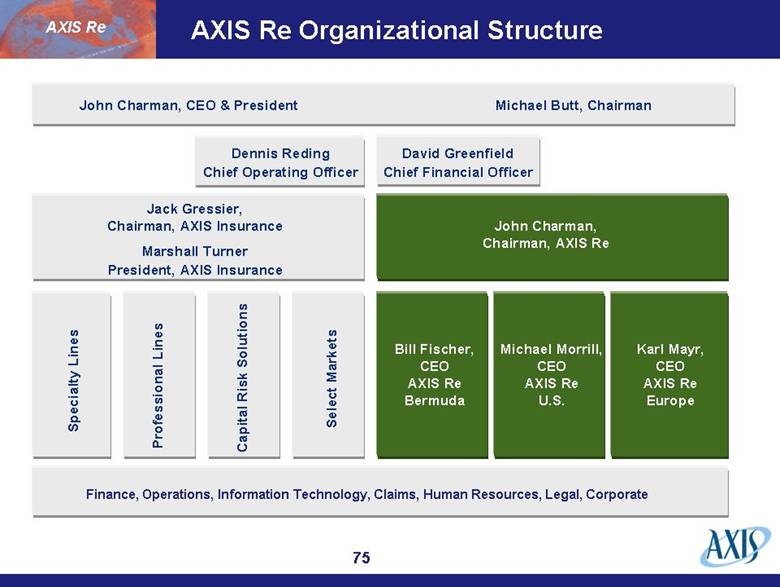
| AXIS Re Organizational Structure John Charman, CEO & President Michael Butt, Chairman Jack Gressier, Chairman, AXIS Insurance Marshall Turner President, AXIS Insurance Specialty Lines Finance, Operations, Information Technology, Claims, Human Resources, Legal, Corporate Jack Gressier Chairman, AXIS Insurance Dennis Reding Chief Operating Officer David Greenfield Chief Financial Officer Professional Lines Capital Risk Solutions Select Markets John Charman, Chairman, AXIS Re Bill Fischer, CEO AXIS Re Bermuda Michael Morrill, CEO AXIS Re U.S. Karl Mayr, CEO AXIS Re Europe AXIS Re |
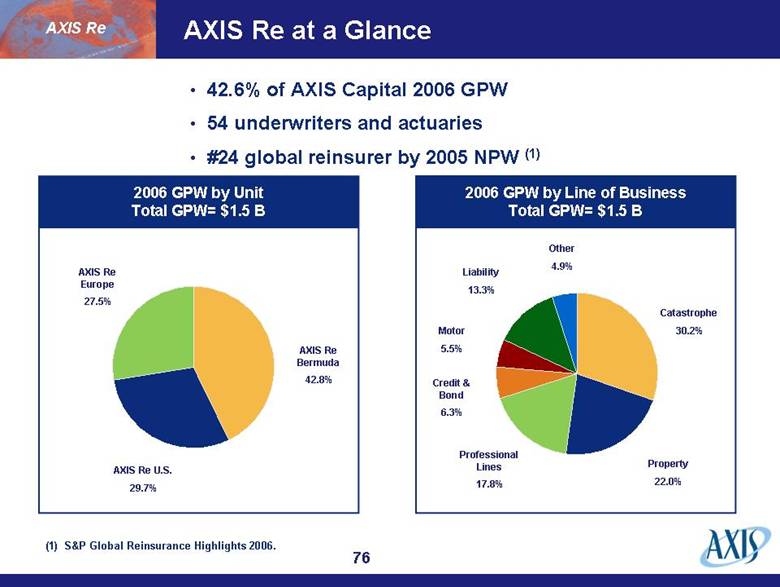
| AXIS Re at a Glance AXIS Re Bermuda 42.8% AXIS Re U.S. 29.7% AXIS Re Europe 27.5% 2006 GPW by Unit Total GPW= $1.5 B Catastrophe 30.2% Motor 5.5% Liability 13.3% Other 4.9% 2006 GPW by Line of Business Total GPW= $1.5 B Property 22.0% Professional Lines 17.8% Credit & Bond 6.3% AXIS Re (1) S&P Global Reinsurance Highlights 2006. 42.6% of AXIS Capital 2006 GPW 54 underwriters and actuaries #24 global reinsurer by 2005 NPW (1) |
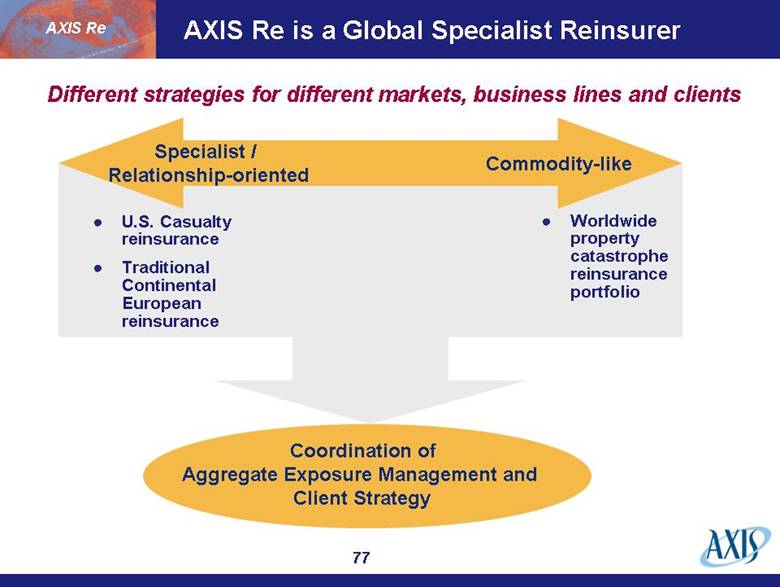
| AXIS Re is a Global Specialist Reinsurer Worldwide property catastrophe reinsurance portfolio U.S. Casualty reinsurance Traditional Continental European reinsurance Specialist / Relationship-oriented Commodity-like AXIS Re Coordination of Aggregate Exposure Management and Client Strategy Different strategies for different markets, business lines and clients |
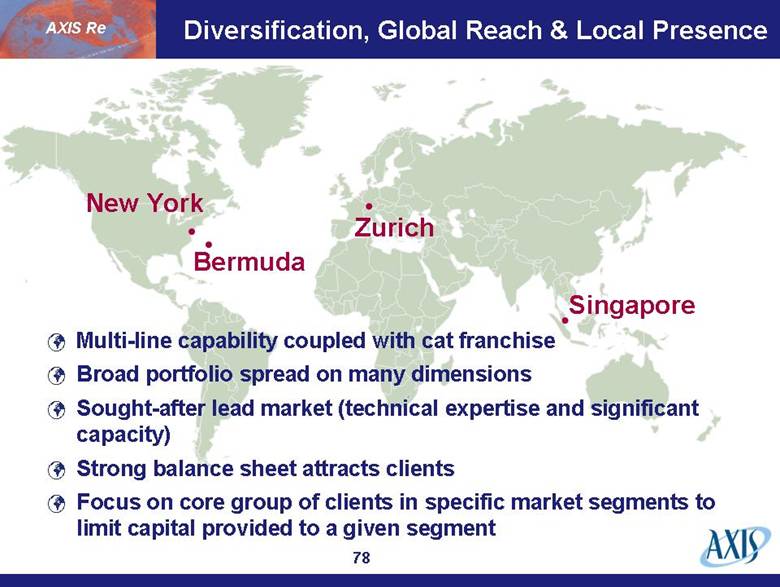
| Diversification, Global Reach & Local Presence New York Bermuda Zurich AXIS Re Multi-line capability coupled with cat franchise Broad portfolio spread on many dimensions Sought-after lead market (technical expertise and significant capacity) Strong balance sheet attracts clients Focus on core group of clients in specific market segments to limit capital provided to a given segment Singapore |
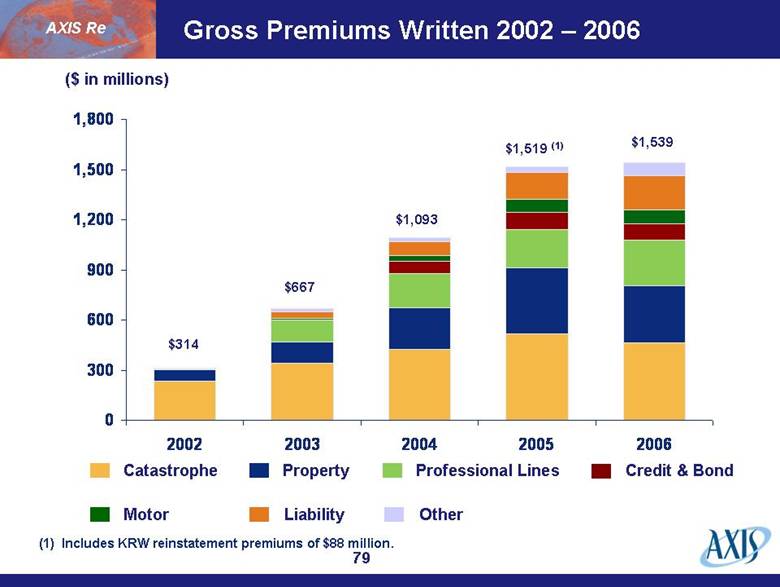
| Gross Premiums Written 2002 – 2006 ($ in millions) $667 $1,093 $1,519 (1) $1,539 Catastrophe Property Professional Lines Credit & Bond Motor Liability Other $314 (1) Includes KRW reinstatement premiums of $88 million. AXIS Re 0 300 600 900 1,200 1,500 1,800 2002 2003 2004 2005 2006 |
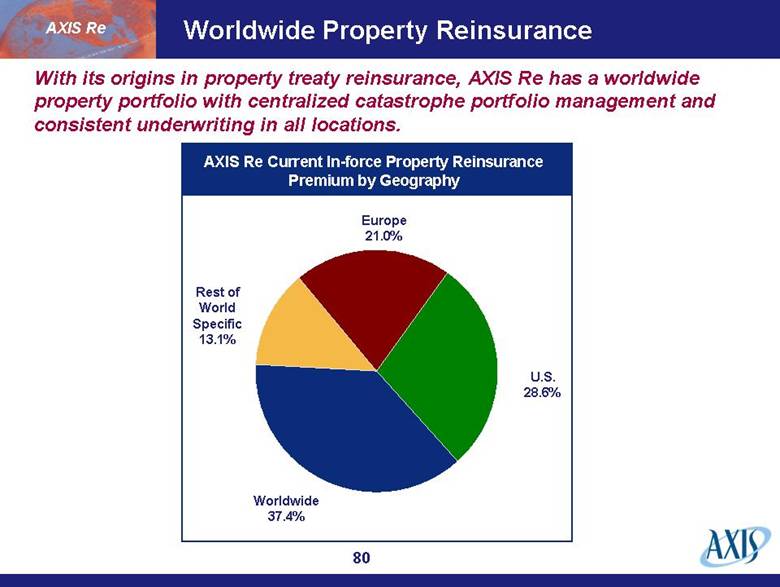
| Worldwide Property Reinsurance Europe 21.0% U.S. 28.6% Worldwide 37.4% Rest of World Specific 13.1% AXIS Re Current In-force Property Reinsurance Premium by Geography AXIS Re With its origins in property treaty reinsurance, AXIS Re has a worldwide property portfolio with centralized catastrophe portfolio management and consistent underwriting in all locations. |
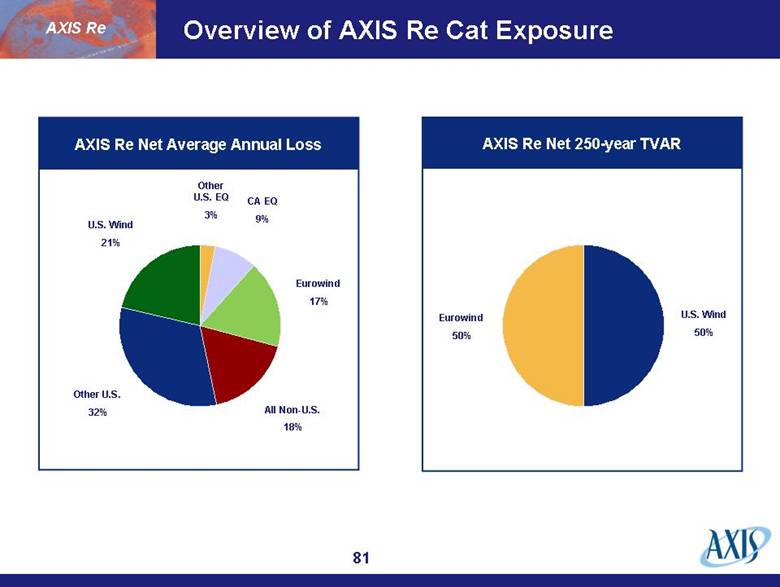
| Overview of AXIS Re Cat Exposure U.S. Wind 21% All Non-U.S. 18% Other U.S. EQ 3% AXIS Re Net Average Annual Loss AXIS Re Net 250-year TVAR U.S. Wind 50% Eurowind 50% CA EQ 9% Eurowind 17% Other U.S. 32% AXIS Re |
| AXIS Re Bermuda |
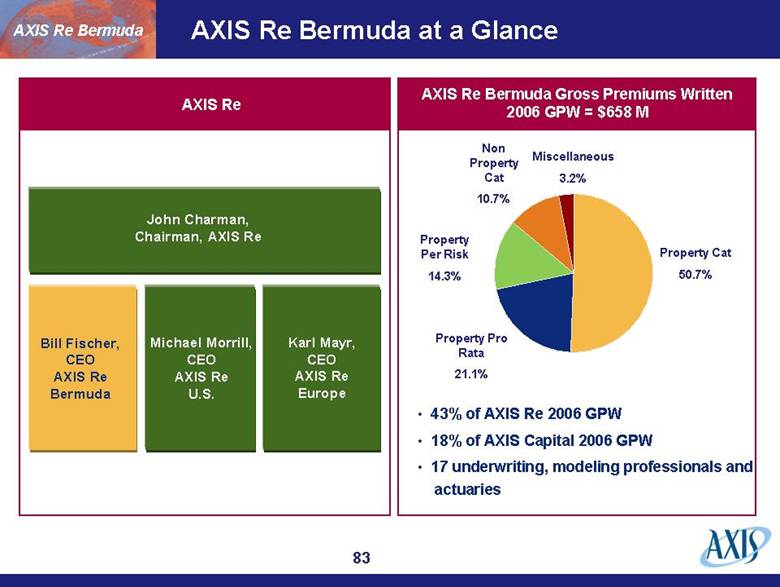
| AXIS Re Bermuda at a Glance John Charman, Chairman, AXIS Re Bill Fischer, CEO AXIS Re Bermuda Michael Morrill, CEO AXIS Re U.S. Karl Mayr, CEO AXIS Re Europe AXIS Re Bermuda Gross Premiums Written 2006 GPW = $658 M AXIS Re AXIS Re Bermuda Property Cat 50.7% Property Pro Rata 21.1% Property Per Risk 14.3% Non Property Cat 10.7% Miscellaneous 3.2% 43% of AXIS Re 2006 GPW 18% of AXIS Capital 2006 GPW 17 underwriting, modeling professionals and actuaries |
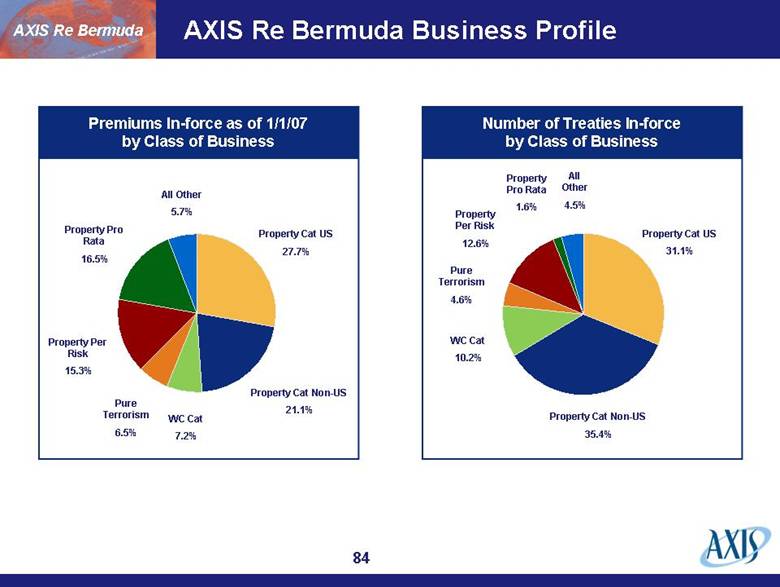
| AXIS Re Bermuda Business Profile Property Cat US 27.7% WC Cat 7.2% Pure Terrorism 6.5% Property Per Risk 15.3% All Other 5.7% Premiums In-force as of 1/1/07 by Class of Business Property Cat Non-US 21.1% Property Pro Rata 16.5% Property Cat US 31.1% WC Cat 10.2% Pure Terrorism 4.6% Property Per Risk 12.6% All Other 4.5% Number of Treaties In-force by Class of Business Property Cat Non-US 35.4% Property Pro Rata 1.6% AXIS Re Bermuda |
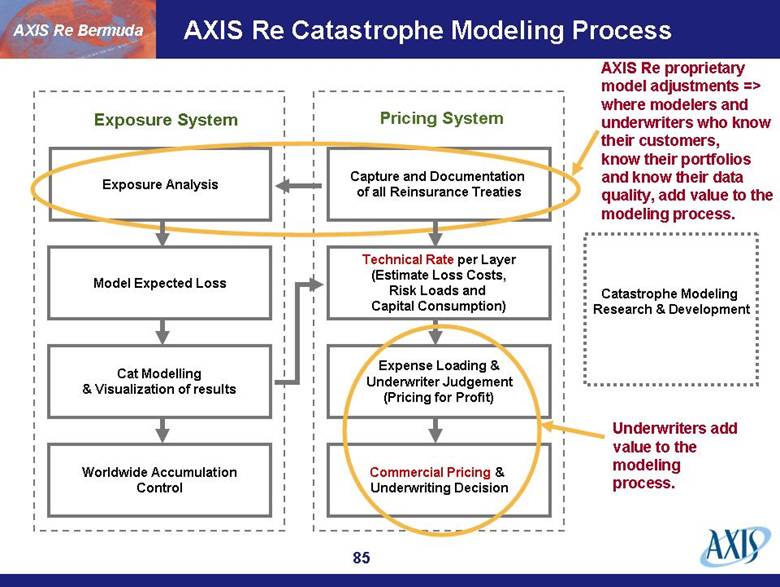
| AXIS Re Catastrophe Modeling Process Capture and Documentation of all Reinsurance Treaties Technical Rate per Layer (Estimate Loss Costs, Risk Loads and Capital Consumption) Expense Loading & Underwriter Judgement (Pricing for Profit) Commercial Pricing & Underwriting Decision Exposure Analysis Model Expected Loss Cat Modelling & Visualization of results Worldwide Accumulation Control Catastrophe Modeling Research & Development Exposure System Pricing System AXIS Re proprietary model adjustments => where modelers and underwriters who know their customers, know their portfolios and know their data quality, add value to the modeling process. Underwriters add value to the modeling process. AXIS Re Bermuda |
| AXIS has invested substantially in its proprietary Exposure Management System (EMS) EMS produces various standard summaries of incoming exposure data and allows for the creation of custom report Analysis is mandated on all property catastrophe treaties In 2007, AXIS is conducting data audits to validate cedants’ exposure data Ability to easily compare data quality between clients Future application is pricing of contracts explicitly for data quality, using relativity indices to the industry average Proprietary Exposure Management System AXIS Re Bermuda |
| Modeling – Value Added Vulnerabiliy Frequency Find the “right“ ground-up curves for AXIS cat pricing and accumulation control Find and eliminate inconsistencies in each model (Lines of Business, coverages, construction types, occupancy types, regional vulnerabilities relative to each other) Compare analysis results between models Annual peer review and weight study Model 1 Model 2 Model 3 AXIS View AXIS Re Bermuda Loss Ratio % 0.10% 0.08% 0.06% 0.04% 0.02% 0.00% Return period 0 50 100 150 200 250 |

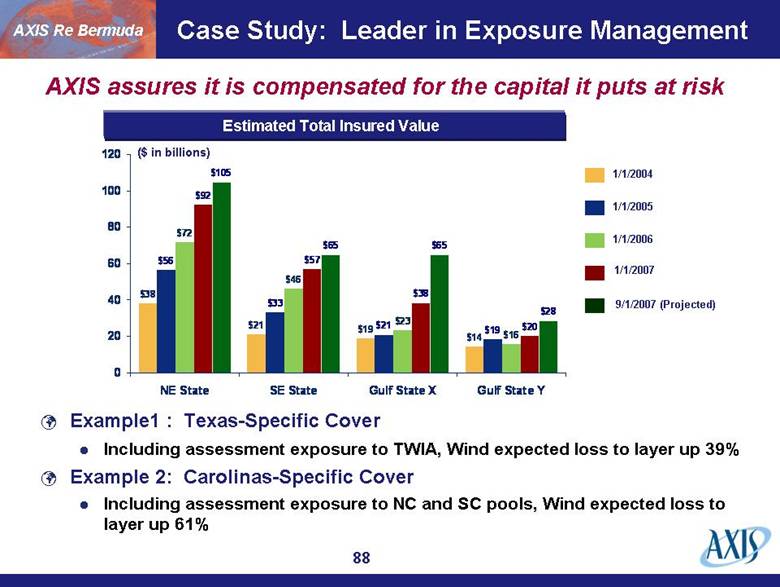
| Case Study: Leader in Exposure Management ($ in billions) 1/1/2004 1/1/2005 1/1/2006 9/1/2007 (Projected) Example1 : Texas-Specific Cover Including assessment exposure to TWIA, Wind expected loss to layer up 39% Example 2: Carolinas-Specific Cover Including assessment exposure to NC and SC pools, Wind expected loss to layer up 61% Estimated Total Insured Value 1/1/2007 AXIS Re Bermuda AXIS assures it is compensated for the capital it puts at risk $38 $21 $19 $14 $56 $33 $21 $19 $72 $46 $23 $16 $92 $57 $38 $20 $105 $65 $65 $28 0 20 40 60 80 100 120 NE State SE State Gulf State X Gulf State Y |
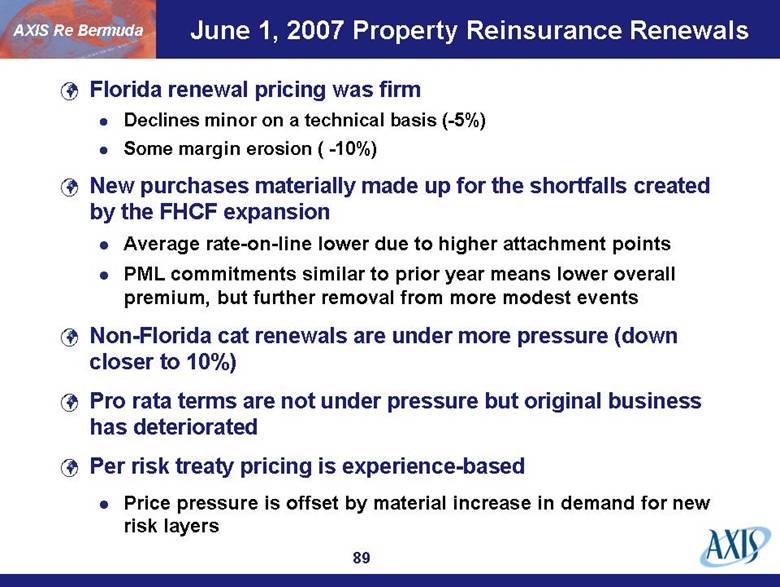
| June 1, 2007 Property Reinsurance Renewals Florida renewal pricing was firm Declines minor on a technical basis (-5%) Some margin erosion ( -10%) New purchases materially made up for the shortfalls created by the FHCF expansion Average rate-on-line lower due to higher attachment points PML commitments similar to prior year means lower overall premium, but further removal from more modest events Non-Florida cat renewals are under more pressure (down closer to 10%) Pro rata terms are not under pressure but original business has deteriorated Per risk treaty pricing is experience-based Price pressure is offset by material increase in demand for new risk layers AXIS Re Bermuda |
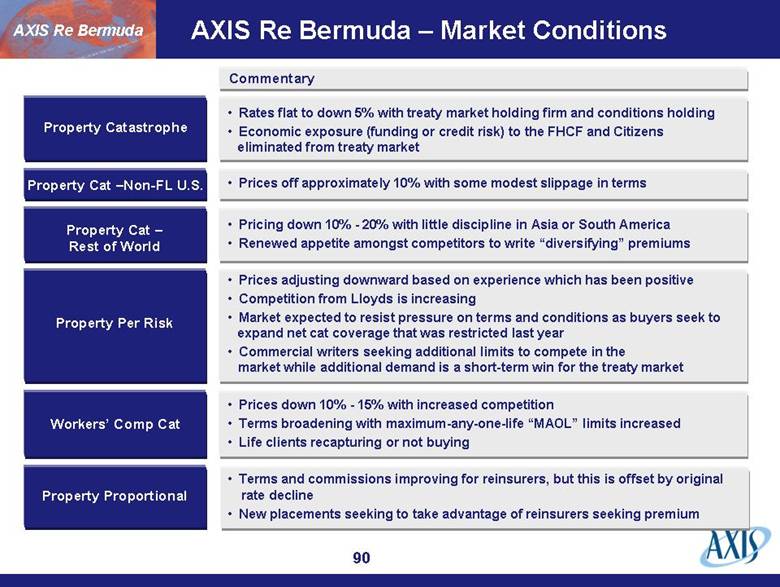
| AXIS Re Bermuda – Market Conditions Commentary Property Cat – Rest of World Property Catastrophe Property Cat –Non-FL U.S. Property Per Risk AXIS Re Bermuda Workers’ Comp Cat Property Proportional Terms and commissions improving for reinsurers, but this is offset by original rate decline New placements seeking to take advantage of reinsurers seeking premium Prices down 10% - 15% with increased competition Terms broadening with maximum-any-one-life “MAOL” limits increased Life clients recapturing or not buying Prices adjusting downward based on experience which has been positive Competition from Lloyds is increasing Market expected to resist pressure on terms and conditions as buyers seek to expand net cat coverage that was restricted last year Commercial writers seeking additional limits to compete in the market while additional demand is a short-term win for the treaty market Prices off approximately 10% with some modest slippage in terms Rates flat to down 5% with treaty market holding firm and conditions holding Economic exposure (funding or credit risk) to the FHCF and Citizens eliminated from treaty market Pricing down 10% - 20% with little discipline in Asia or South America Renewed appetite amongst competitors to write “diversifying” premiums |
| AXIS Re U.S. |
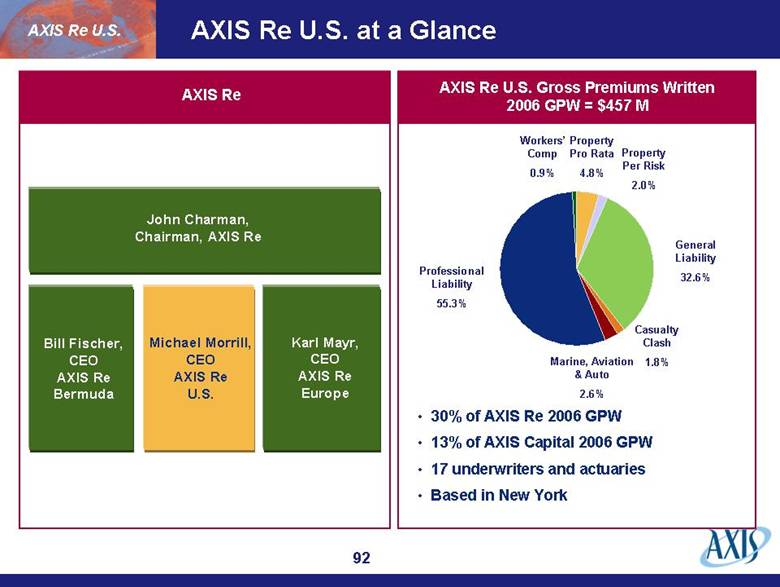
| AXIS Re U.S. at a Glance John Charman, Chairman, AXIS Re Bill Fischer, CEO AXIS Re Bermuda Michael Morrill, CEO AXIS Re U.S. Karl Mayr, CEO AXIS Re Europe AXIS Re U.S. Gross Premiums Written 2006 GPW = $457 M AXIS Re AXIS Re U.S. Property Per Risk 2.0% Casualty Clash 1.8% Professional Liability 55.3% Marine, Aviation & Auto 2.6% Workers’ Comp 0.9% General Liability 32.6% Property Pro Rata 4.8% 30% of AXIS Re 2006 GPW 13% of AXIS Capital 2006 GPW 17 underwriters and actuaries Based in New York |
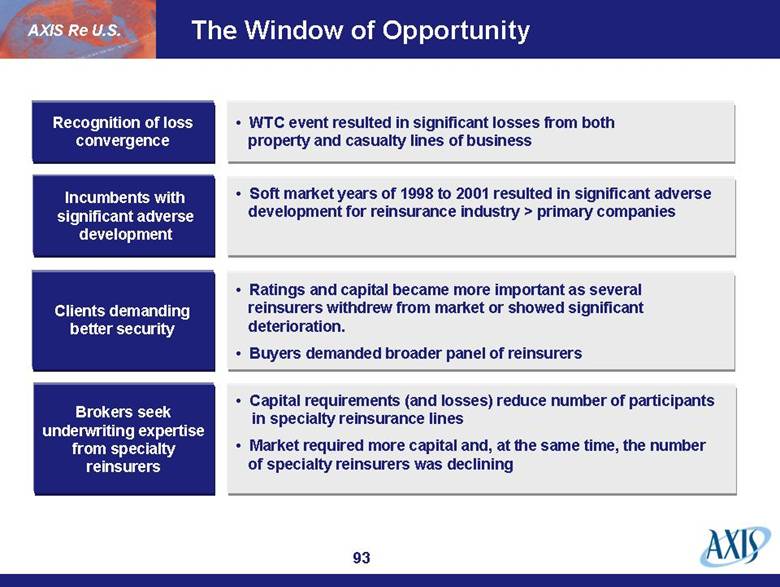
| The Window of Opportunity AXIS Re U.S. Incumbents with significant adverse development Recognition of loss convergence Clients demanding better security Brokers seek underwriting expertise from specialty reinsurers Capital requirements (and losses) reduce number of participants in specialty reinsurance lines Market required more capital and, at the same time, the number of specialty reinsurers was declining Ratings and capital became more important as several reinsurers withdrew from market or showed significant deterioration. Buyers demanded broader panel of reinsurers Soft market years of 1998 to 2001 resulted in significant adverse development for reinsurance industry > primary companies WTC event resulted in significant losses from both property and casualty lines of business |
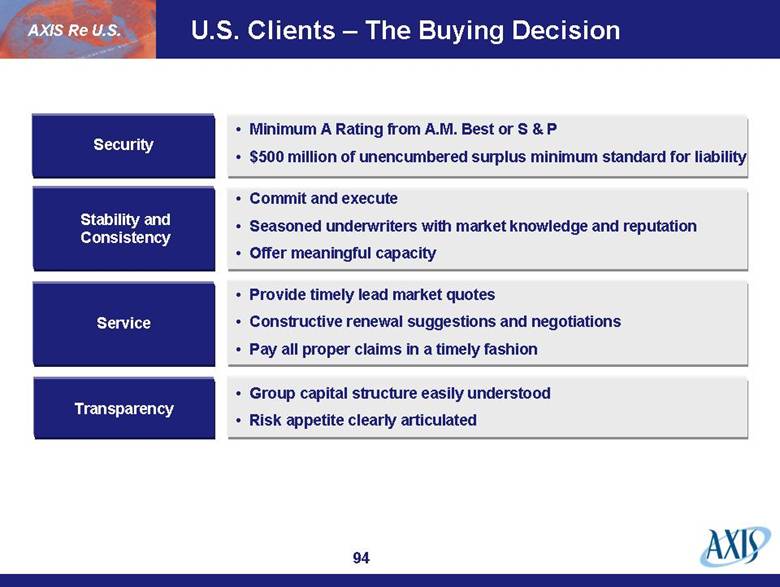
| U.S. Clients – The Buying Decision AXIS Re U.S. Stability and Consistency Security Service Transparency Group capital structure easily understood Risk appetite clearly articulated Provide timely lead market quotes Constructive renewal suggestions and negotiations Pay all proper claims in a timely fashion Commit and execute Seasoned underwriters with market knowledge and reputation Offer meaningful capacity Minimum A Rating from A.M. Best or S & P $500 million of unencumbered surplus minimum standard for liability |
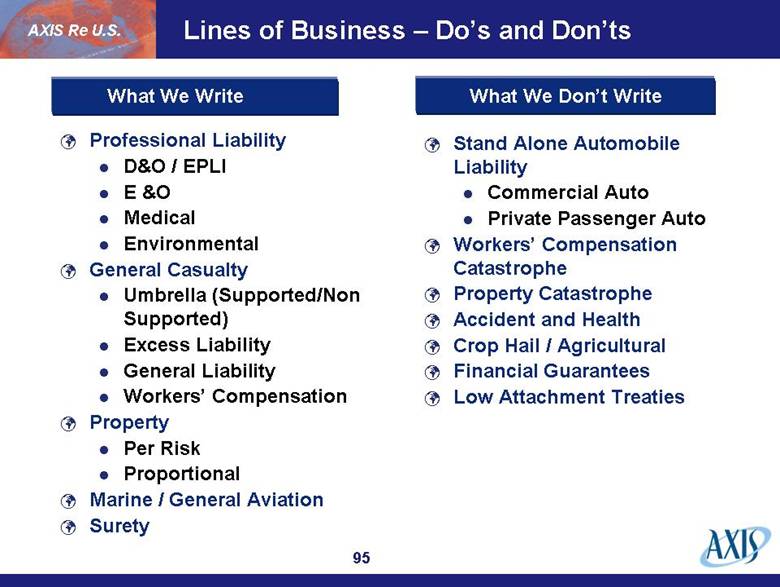
| Lines of Business – Do’s and Don’ts Professional Liability D&O / EPLI E &O Medical Environmental General Casualty Umbrella (Supported/Non Supported) Excess Liability General Liability Workers’ Compensation Property Per Risk Proportional Marine / General Aviation Surety Stand Alone Automobile Liability Commercial Auto Private Passenger Auto Workers’ Compensation Catastrophe Property Catastrophe Accident and Health Crop Hail / Agricultural Financial Guarantees Low Attachment Treaties AXIS Re U.S. What We Write What We Don’t Write |
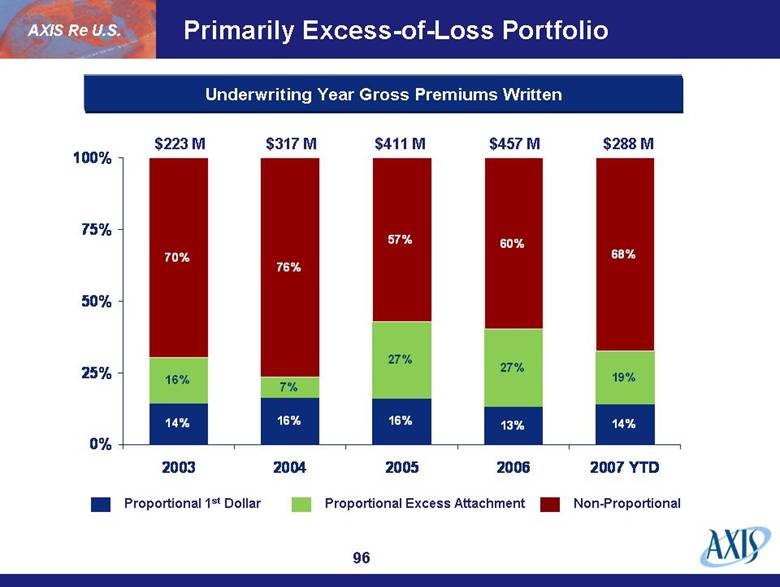
| Primarily Excess-of-Loss Portfolio Proportional 1st Dollar Proportional Excess Attachment Non-Proportional $223 M $317 M $411 M $457 M $288 M AXIS Re U.S. Underwriting Year Gross Premiums Written 14% 16% 16% 13% 14% 16% 7% 27% 27% 19% 70% 76% 57% 60% 68% 0% 25% 50% 75% 100% 2003 2004 2005 2006 2007 YTD |
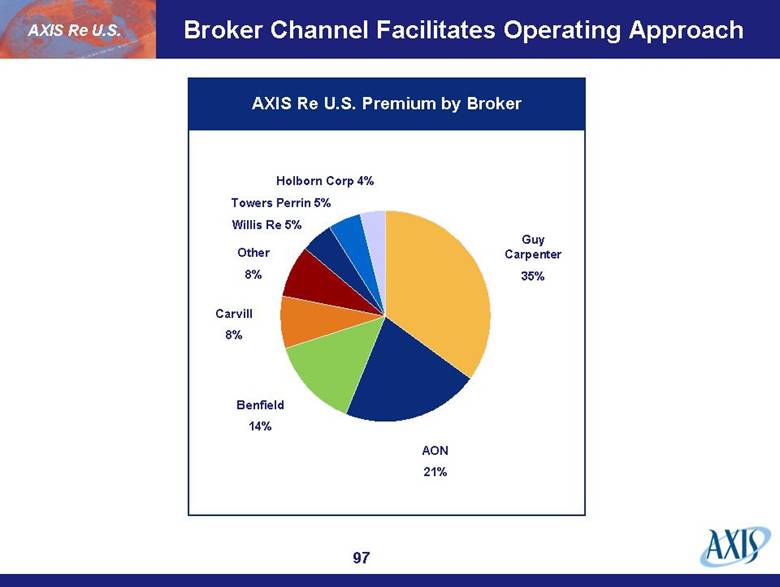
| Guy Carpenter 35% Carvill 8% Towers Perrin 5% AXIS Re U.S. Premium by Broker AON 21% Benfield 14% Other 8% Willis Re 5% Holborn Corp 4% AXIS Re U.S. Broker Channel Facilitates Operating Approach |
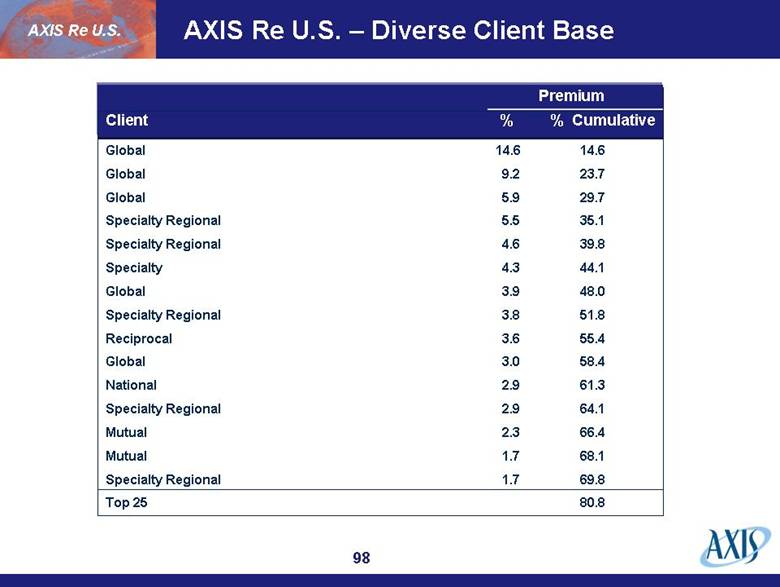
| AXIS Re U.S. – Diverse Client Base Global 14.6 14.6 Global 9.2 23.7 Global 5.9 29.7 Specialty Regional 5.5 35.1 Specialty Regional 4.6 39.8 Specialty 4.3 44.1 Global 3.9 48.0 Specialty Regional 3.8 51.8 Reciprocal 3.6 55.4 Global 3.0 58.4 National 2.9 61.3 Specialty Regional 2.9 64.1 Mutual 2.3 66.4 Mutual 1.7 68.1 Specialty Regional 1.7 69.8 Top 25 80.8 AXIS Re U.S. Premium Client % % Cumulative |
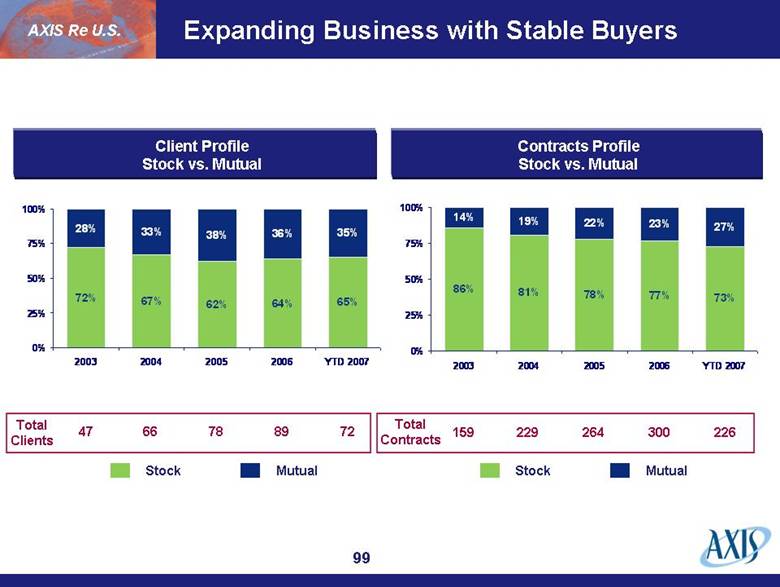
| Client Profile Stock vs. Mutual Stock Mutual Total Clients 47 66 78 89 72 Contracts Profile Stock vs. Mutual Total Contracts 159 229 264 300 226 Stock Mutual Expanding Business with Stable Buyers AXIS Re U.S. 72% 67% 62% 64% 65% 28% 33% 38% 36% 35% 0% 25% 50% 75% 100% 2003 2004 2005 2006 YTD 2007 86% 81% 78% 77% 73% 14% 19% 22% 23% 27% 0% 25% 50% 75% 100% 2003 2004 2005 2006 YTD 2007 |
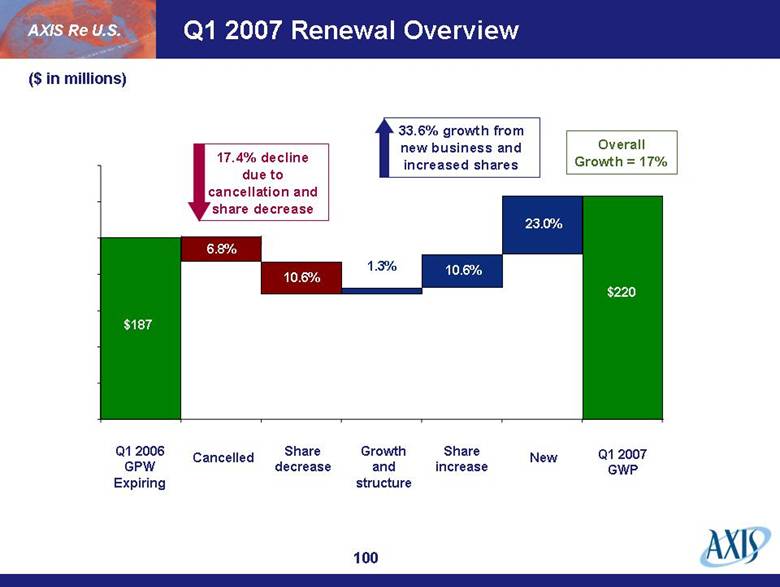
| Q1 2007 Renewal Overview $187 6.8% 10.6% 1.3% 10.6% 23.0% Q1 2006 GPW Expiring Cancelled Share decrease Growth and structure Share increase New Q1 2007 GWP ($ in millions) 17.4% decline due to cancellation and share decrease 33.6% growth from new business and increased shares Overall Growth = 17% AXIS Re U.S. $220 |
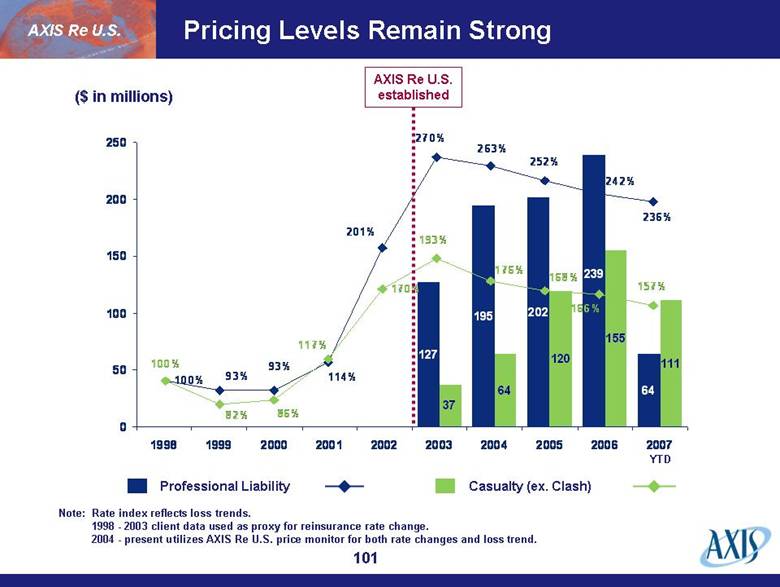
| Pricing Levels Remain Strong ($ in millions) Professional Liability Casualty (ex. Clash) AXIS Re U.S. AXIS Re U.S. established YTD Note: Rate index reflects loss trends. 1998 - 2003 client data used as proxy for reinsurance rate change. 2004 - present utilizes AXIS Re U.S. price monitor for both rate changes and loss trend. 195 202 64 37 155 111 239 127 64 120 0 50 100 150 200 250 1998 1999 2000 2001 2002 2003 2004 2005 2006 2007 100% 170% 114% 93% 93% 236% 242% 252% 263% 270% 201% 157% 166% 176% 168% 193% 117% 86% 82% 100% |
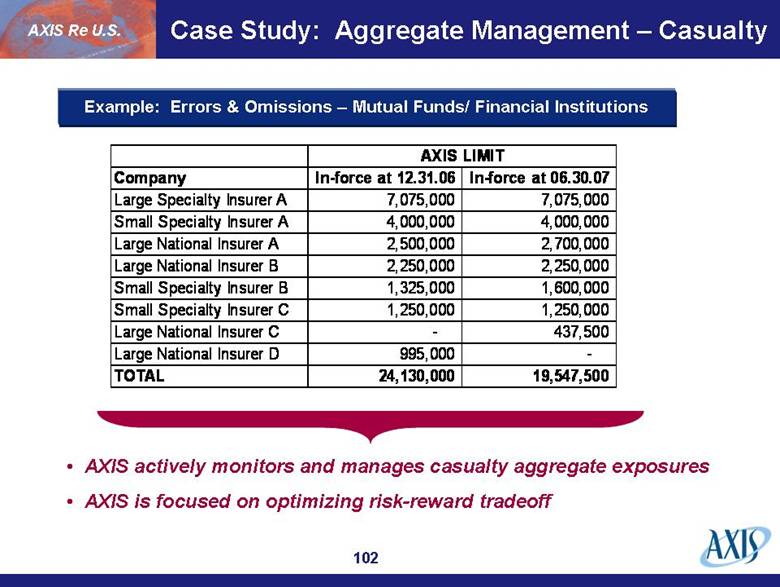
| Case Study: Aggregate Management – Casualty AXIS Re U.S. Example: Errors & Omissions – Mutual Funds/ Financial Institutions Company In-force at 12.31.06 In-force at 06.30.07 Large Specialty Insurer A 7,075,000 7,075,000 Small Specialty Insurer A 4,000,000 4,000,000 Large National Insurer A 2,500,000 2,700,000 Large National Insurer B 2,250,000 2,250,000 Small Specialty Insurer B 1,325,000 1,600,000 Small Specialty Insurer C 1,250,000 1,250,000 Large National Insurer C - 437,500 Large National Insurer D 995,000 - TOTAL 24,130,000 19,547,500 AXIS LIMIT AXIS actively monitors and manages casualty aggregate exposures AXIS is focused on optimizing risk-reward tradeoff |
| Case Studies: Reserving and Claims Case 1: Small Medical Mutual Insurance Company Specialist law firm retained by AXIS to evaluate client’s claims practices Attorneys identified process problems relating to claims reserving AXIS Actuaries revised pricing to reflect reserve uncertainty Appropriate renewal terms were derived Case 2: Large National Lawyers Malpractice Writer Specialist law firm retained by AXIS to evaluate client’s claims practices Attorneys identified problems relating to client’s claim reporting practices Client responded by revising internal procedures regarding claims reporting AXIS Re U.S. Information acquired in AXIS claims audits, which utilize third-party specialists, mitigates reserving uncertainties |
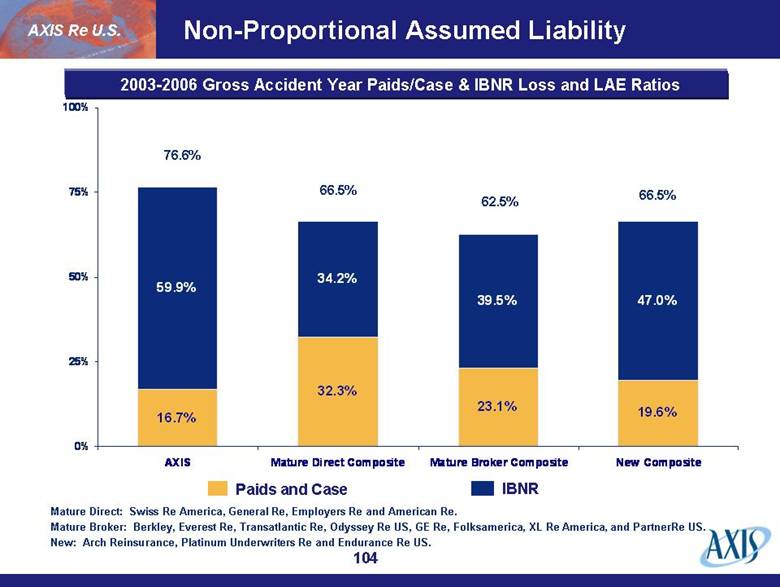
| Non-Proportional Assumed Liability Paids and Case IBNR 2003-2006 Gross Accident Year Paids/Case & IBNR Loss and LAE Ratios 62.5% 66.5% 66.5% 76.6% Mature Direct: Swiss Re America, General Re, Employers Re and American Re. Mature Broker: Berkley, Everest Re, Transatlantic Re, Odyssey Re US, GE Re, Folksamerica, XL Re America, and PartnerRe US. New: Arch Reinsurance, Platinum Underwriters Re and Endurance Re US. AXIS Re U.S. 16.7% 32.3% 23.1% 19.6% 59.9% 34.2% 39.5% 47.0% 0% 25% 50% 75% 100% AXIS Mature Direct Composite Mature Broker Composite New Composite |
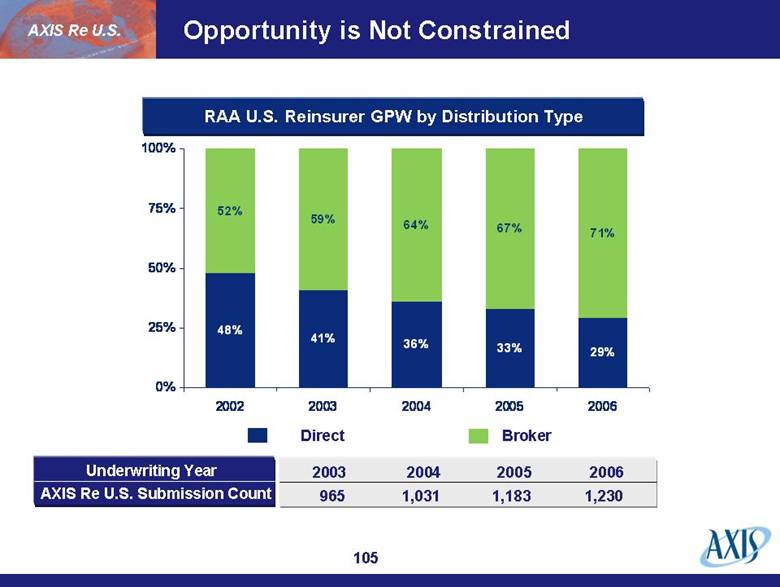
| Opportunity is Not Constrained Direct Broker AXIS Re U.S. RAA U.S. Reinsurer GPW by Distribution Type Underwriting Year AXIS Re U.S. Submission Count 2003 2004 2005 2006 48% 41% 36% 33% 29% 52% 59% 64% 67% 71% 0% 25% 50% 75% 100% 2002 2003 2004 2005 2006 965 1,031 1,183 1,230 |
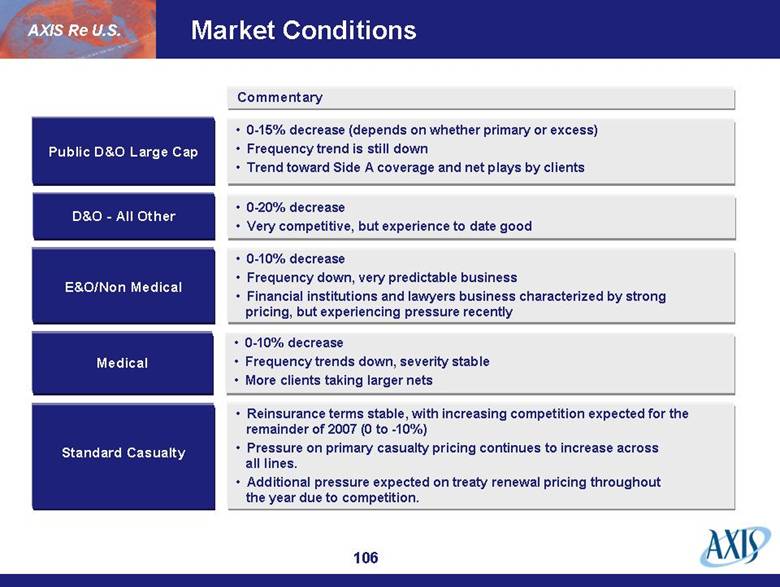
| Market Conditions Commentary [Line of Business] AXIS Re U.S. D&O - All Other Public D&O Large Cap E&O/Non Medical Medical Standard Casualty Reinsurance terms stable, with increasing competition expected for the remainder of 2007 (0 to -10%) Pressure on primary casualty pricing continues to increase across all lines. Additional pressure expected on treaty renewal pricing throughout the year due to competition. 0-10% decrease Frequency trends down, severity stable More clients taking larger nets 0-10% decrease Frequency down, very predictable business Financial institutions and lawyers business characterized by strong pricing, but experiencing pressure recently 0-20% decrease Very competitive, but experience to date good 0-15% decrease (depends on whether primary or excess) Frequency trend is still down Trend toward Side A coverage and net plays by clients |
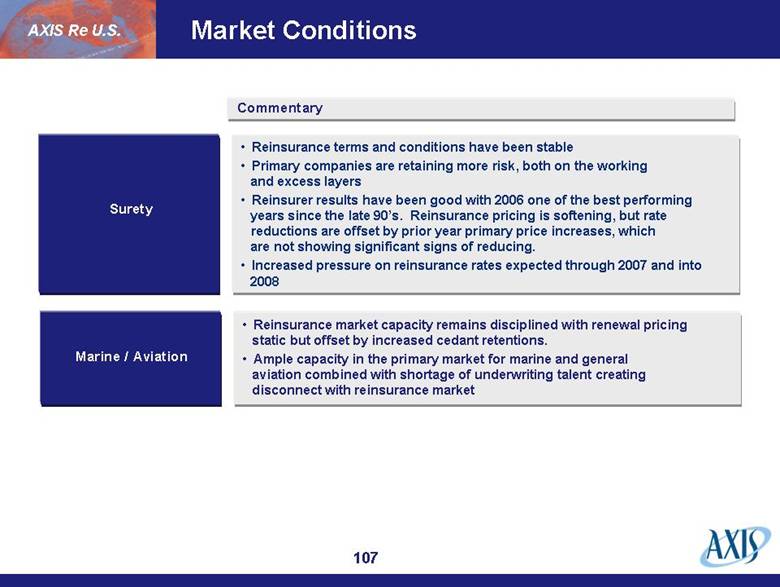
| Market Conditions Commentary Surety AXIS Re U.S. Marine / Aviation Reinsurance market capacity remains disciplined with renewal pricing static but offset by increased cedant retentions. Ample capacity in the primary market for marine and general aviation combined with shortage of underwriting talent creating disconnect with reinsurance market Reinsurance terms and conditions have been stable Primary companies are retaining more risk, both on the working and excess layers Reinsurer results have been good with 2006 one of the best performing years since the late 90’s. Reinsurance pricing is softening, but rate reductions are offset by prior year primary price increases, which are not showing significant signs of reducing. Increased pressure on reinsurance rates expected through 2007 and into 2008 |
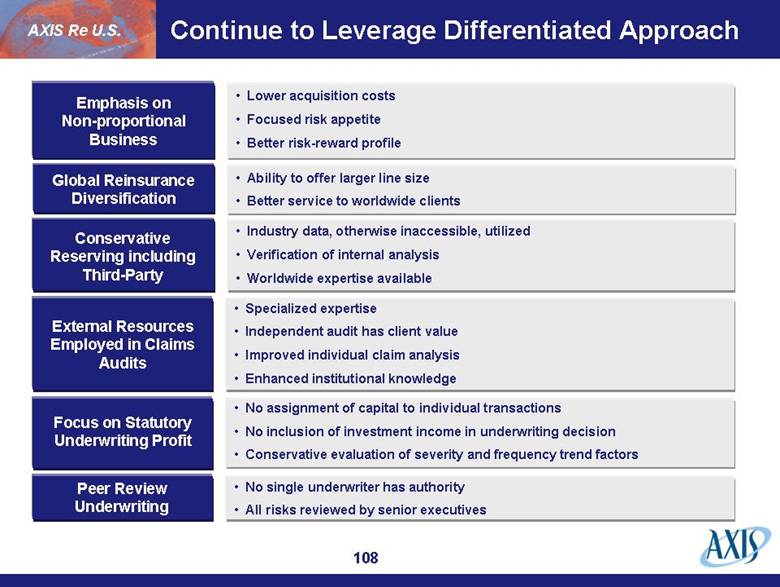
| Continue to Leverage Differentiated Approach AXIS Re U.S. Global Reinsurance Diversification Emphasis on Non-proportional Business Conservative Reserving including Third-Party External Resources Employed in Claims Audits Focus on Statutory Underwriting Profit Peer Review Underwriting No single underwriter has authority All risks reviewed by senior executives No assignment of capital to individual transactions No inclusion of investment income in underwriting decision Conservative evaluation of severity and frequency trend factors Specialized expertise Independent audit has client value Improved individual claim analysis Enhanced institutional knowledge Industry data, otherwise inaccessible, utilized Verification of internal analysis Worldwide expertise available Ability to offer larger line size Better service to worldwide clients Lower acquisition costs Focused risk appetite Better risk-reward profile |
| AXIS Re Europe |

| AXIS Re Europe at a Glance John Charman, Chairman, AXIS Re Bill Fischer, CEO AXIS Re Bermuda Michael Morrill, CEO AXIS Re U.S. Karl Mayr, CEO AXIS Re Europe AXIS Re Europe Gross Premiums Written 2006 GPW = $423 M AXIS Re AXIS Re Europe Property Per Risk 9.9% Credit & Bond 23.1% Motor 21.2% Liability 11.8% Property Cat 14.2% Property Pro Rata 9.9% Engineering 9.9% 28% of AXIS Re 2006 GPW 12% of AXIS Capital 2006 GPW 20 underwriters, modeling professionals and actuaries Based in Zurich |

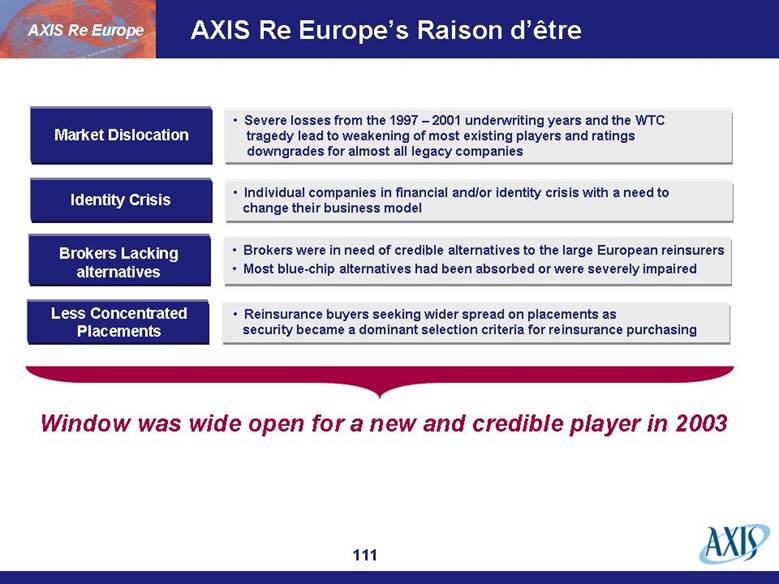
| AXIS Re Europe’s Raison d’être Market Dislocation Identity Crisis Brokers Lacking alternatives Less Concentrated Placements Window was wide open for a new and credible player in 2003 AXIS Re Europe Reinsurance buyers seeking wider spread on placements as security became a dominant selection criteria for reinsurance purchasing Brokers were in need of credible alternatives to the large European reinsurers Most blue-chip alternatives had been absorbed or were severely impaired Individual companies in financial and/or identity crisis with a need to change their business model Severe losses from the 1997 – 2001 underwriting years and the WTC tragedy lead to weakening of most existing players and ratings downgrades for almost all legacy companies |
|
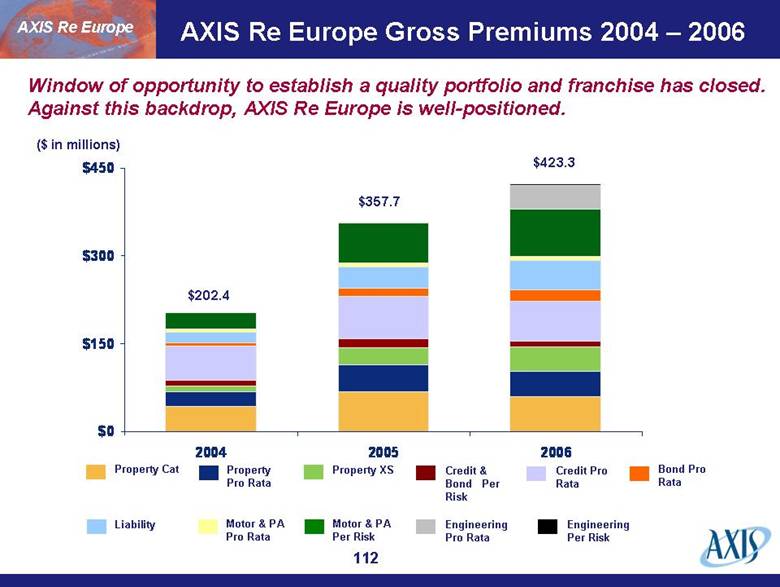
| AXIS Re Europe Gross Premiums 2004 – 2006 ($ in millions) Property Cat Property XS Credit & Bond Per Risk Property Pro Rata $423.3 $357.7 $202.4 Bond Pro Rata Liability Credit Pro Rata Motor & PA Pro Rata Motor & PA Per Risk Engineering Pro Rata Engineering Per Risk AXIS Re Europe Window of opportunity to establish a quality portfolio and franchise has closed. Against this backdrop, AXIS Re Europe is well-positioned. $0 $150 $300 $450 2004 2005 2006 |
| Continental Europe – The Buying Decision Predictability Regional or local presence with deep understanding of European business culture essential Regional and local companies prefer to deal with native speakers Property Catastrophe and Motor Liability are predominant lines of business Liability not essential for majority of buyers Continuity CAT and Motor Driven Presence AXIS Re Europe Security Pro-Rata Driven Many markets still predominantly pro rata driven (i.e. Germany, Austria, Italy, Spain, Portugal, Greece and Turkey) Solvency II will continuously impact purchased reinsurance structure: less pro rata, more volatility transferred Minimum A rating from S&P $500 million minimum capital and surplus to qualify for expanded first tier Demanding clear view on reinsurer strategic direction Monitoring reinsurer issues early Credibility of management Customer relationship manager of utmost importance Move from relationship-driven to relationship-supported business model Customers in general offer renewal opportunity and expect a sincere effort to align with market price |
|

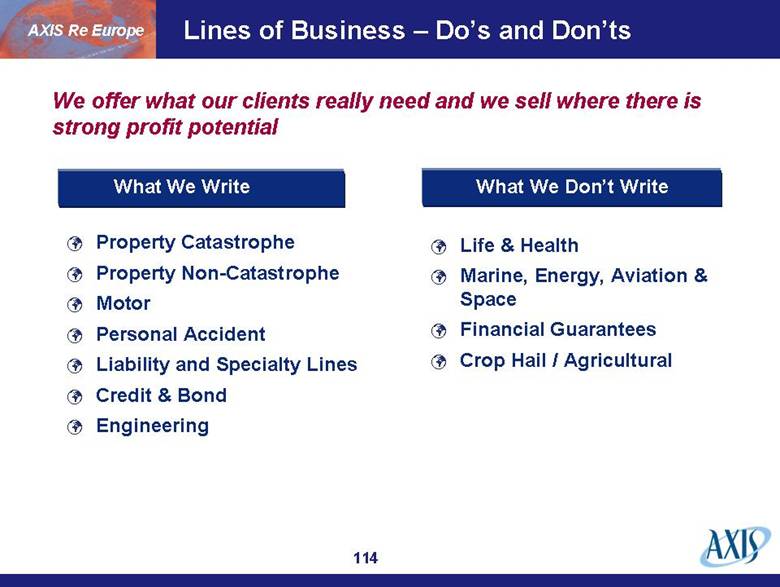
| Lines of Business – Do’s and Don’ts Property Catastrophe Property Non-Catastrophe Motor Personal Accident Liability and Specialty Lines Credit & Bond Engineering Life & Health Marine, Energy, Aviation & Space Financial Guarantees Crop Hail / Agricultural AXIS Re Europe We offer what our clients really need and we sell where there is strong profit potential What We Write What We Don’t Write |
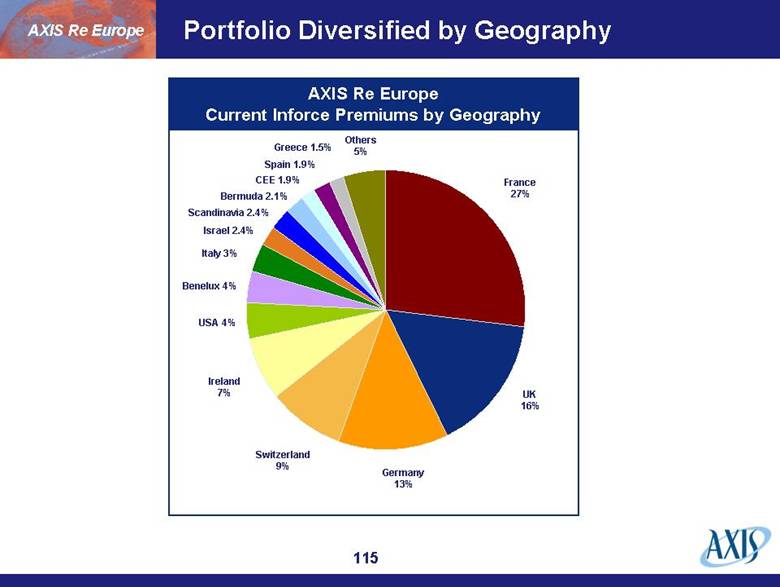
| Portfolio Diversified by Geography AXIS Re Europe France 27% UK 16% Germany 13% Switzerland 9% Ireland 7% USA 4% Benelux 4% Italy 3% Israel 2.4% Scandinavia 2.4% Bermuda 2.1% CEE 1.9% Spain 1.9% Greece 1.5% Others 5% AXIS Re Europe Current Inforce Premiums by Geography |
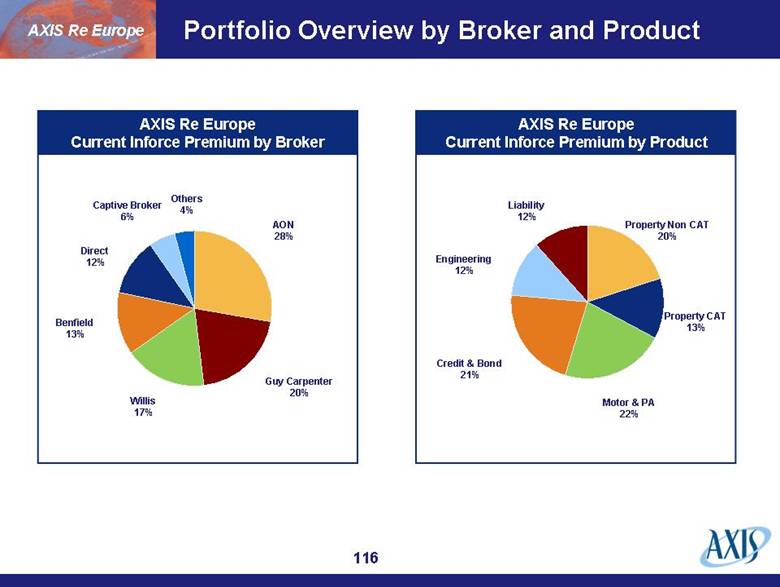
| Portfolio Overview by Broker and Product AXIS Re Europe AON 28% Guy Carpenter 20% Willis 17% Benfield 13% Direct 12% Captive Broker 6% Others 4% Property Non CAT 20% Property CAT 13% Motor & PA 22% Credit & Bond 21% Engineering 12% Liability 12% AXIS Re Europe Current Inforce Premium by Broker AXIS Re Europe Current Inforce Premium by Product |
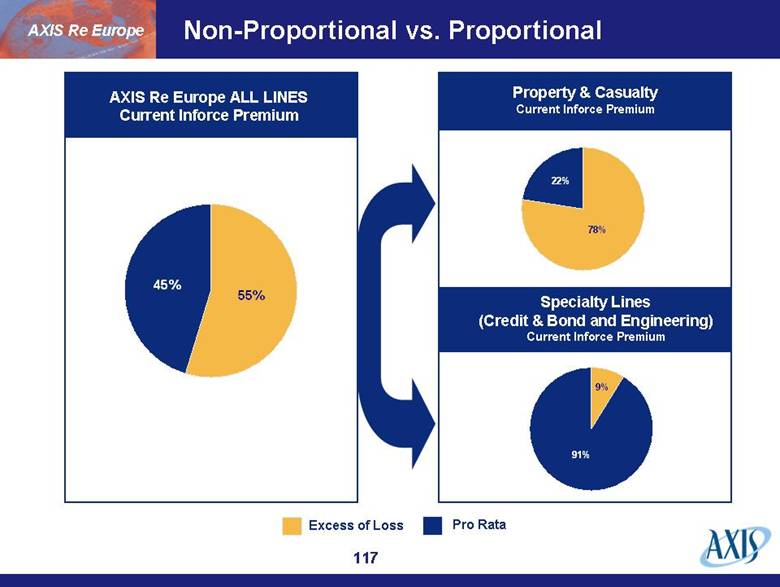
| Non-Proportional vs. Proportional 78% 20% AXIS Re Europe Excess of Loss Pro Rata AXIS Re Europe ALL LINES Current Inforce Premium Property & Casualty Current Inforce Premium Specialty Lines (Credit & Bond and Engineering) Current Inforce Premium 55% 45% 91% 9% 22% 78% |
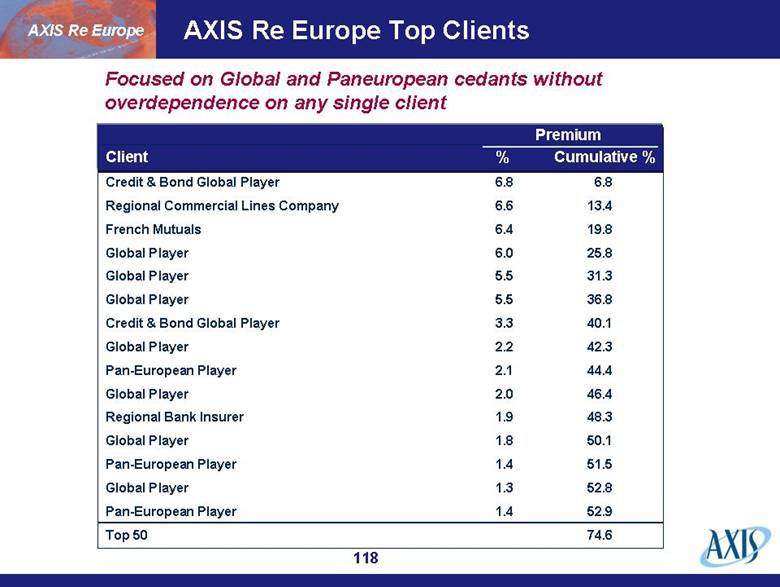
| AXIS Re Europe Top Clients Credit & Bond Global Player 6.8 6.8 Regional Commercial Lines Company 6.6 13.4 French Mutuals 6.4 19.8 Global Player 6.0 25.8 Global Player 5.5 31.3 Global Player 5.5 36.8 Credit & Bond Global Player 3.3 40.1 Global Player 2.2 42.3 Pan-European Player 2.1 44.4 Global Player 2.0 46.4 Regional Bank Insurer 1.9 48.3 Global Player 1.8 50.1 Pan-European Player 1.4 51.5 Global Player 1.3 52.8 Pan-European Player 1.4 52.9 Top 50 74.6 AXIS Re Europe Focused on Global and Paneuropean cedants without overdependence on any single client Premium Client % Cumulative % |
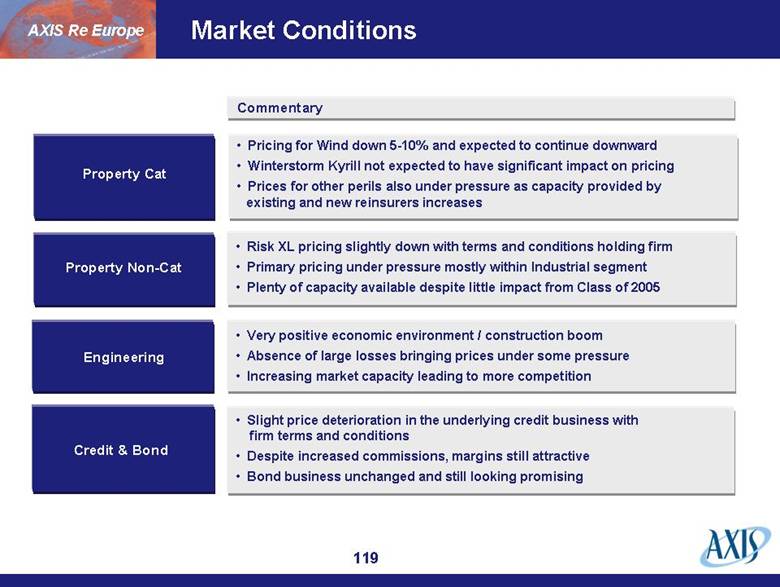
| Market Conditions AXIS Re Europe Commentary Property Cat Property Non-Cat Engineering Credit & Bond Slight price deterioration in the underlying credit business with firm terms and conditions Despite increased commissions, margins still attractive Bond business unchanged and still looking promising Very positive economic environment / construction boom Absence of large losses bringing prices under some pressure Increasing market capacity leading to more competition Risk XL pricing slightly down with terms and conditions holding firm Primary pricing under pressure mostly within Industrial segment Plenty of capacity available despite little impact from Class of 2005 Pricing for Wind down 5-10% and expected to continue downward Winterstorm Kyrill not expected to have significant impact on pricing Prices for other perils also under pressure as capacity provided by existing and new reinsurers increases |
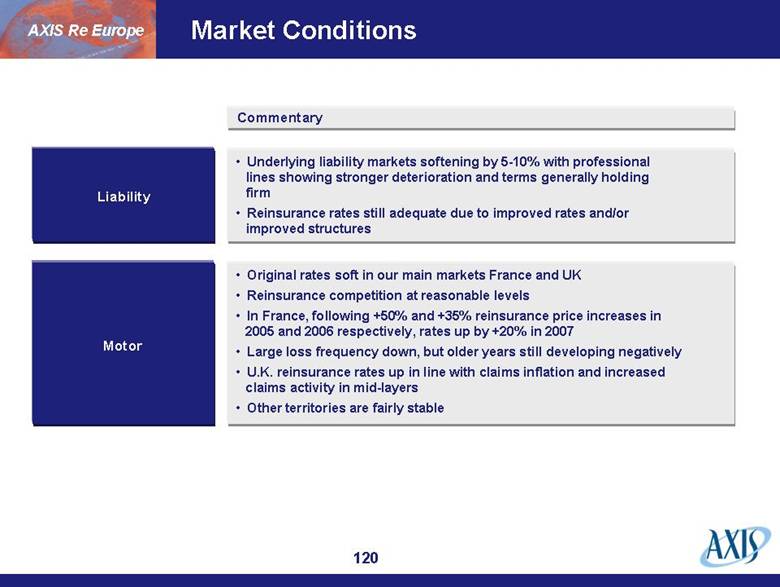
| Market Conditions AXIS Re Europe Commentary Liability Motor Original rates soft in our main markets France and UK Reinsurance competition at reasonable levels In France, following +50% and +35% reinsurance price increases in 2005 and 2006 respectively, rates up by +20% in 2007 Large loss frequency down, but older years still developing negatively U.K. reinsurance rates up in line with claims inflation and increased claims activity in mid-layers Other territories are fairly stable Underlying liability markets softening by 5-10% with professional lines showing stronger deterioration and terms generally holding firm Reinsurance rates still adequate due to improved rates and/or improved structures |
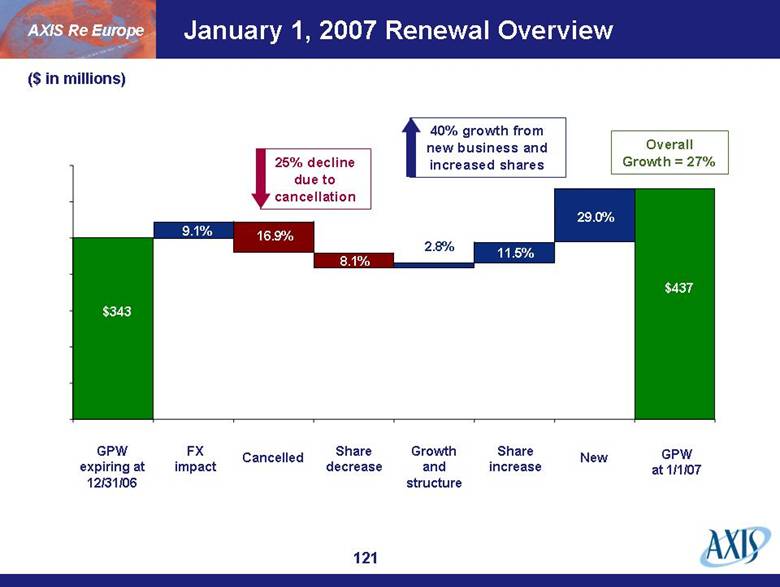
| January 1, 2007 Renewal Overview $343 9.1% 16.9% 8.1% 2.8% 11.5% 29.0% $437 GPW expiring at 12/31/06 FX impact Cancelled Share decrease Growth and structure Share increase New GPW at 1/1/07 AXIS Re Europe ($ in millions) 25% decline due to cancellation 40% growth from new business and increased shares Overall Growth = 27% |
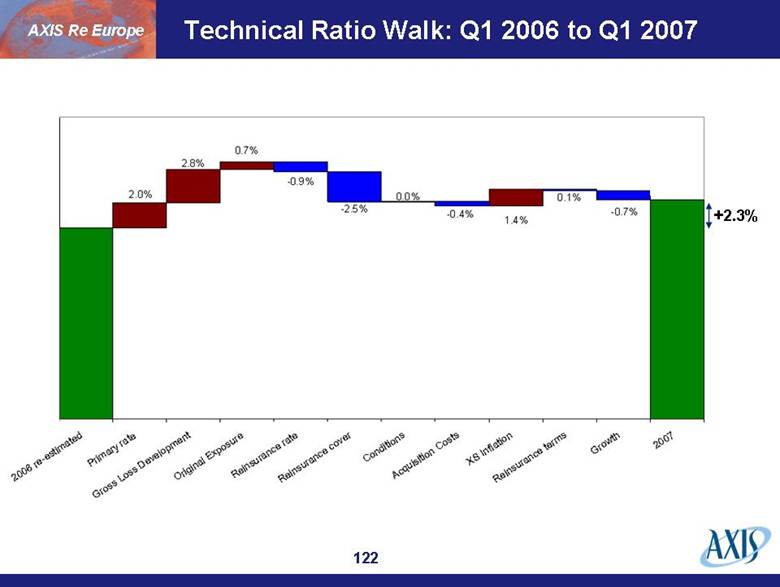
| Technical Ratio Walk: Q1 2006 to Q1 2007 AXIS Re Europe +2.3% |
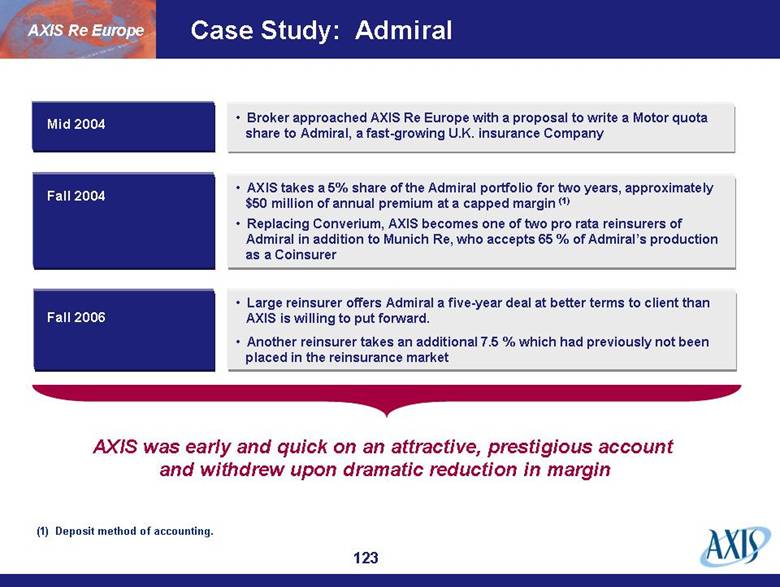
| Case Study: Admiral Fall 2004 Mid 2004 Fall 2006 AXIS Re Europe AXIS was early and quick on an attractive, prestigious account and withdrew upon dramatic reduction in margin (1) Deposit method of accounting. Large reinsurer offers Admiral a five-year deal at better terms to client than AXIS is willing to put forward. Another reinsurer takes an additional 7.5 % which had previously not been placed in the reinsurance market AXIS takes a 5% share of the Admiral portfolio for two years, approximately $50 million of annual premium at a capped margin (1) Replacing Converium, AXIS becomes one of two pro rata reinsurers of Admiral in addition to Munich Re, who accepts 65 % of Admiral’s production as a Coinsurer Broker approached AXIS Re Europe with a proposal to write a Motor quota share to Admiral, a fast-growing U.K. insurance Company |
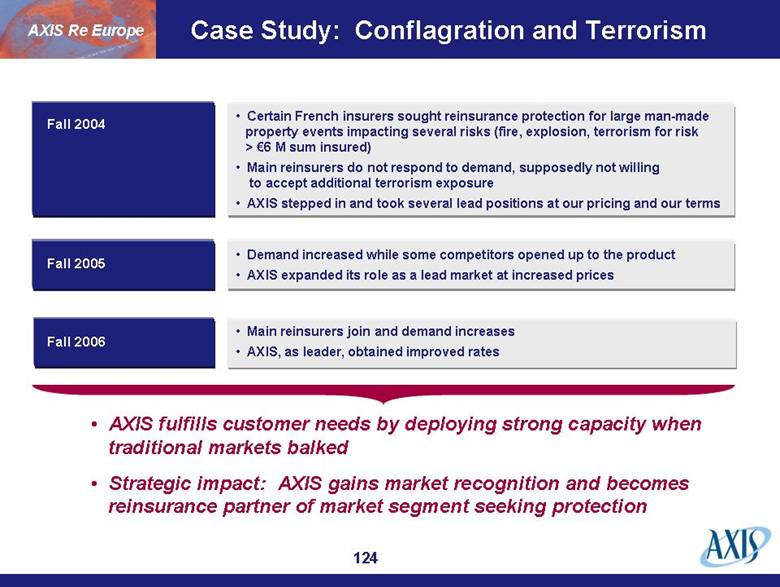
| Case Study: Conflagration and Terrorism Fall 2004 Fall 2005 Fall 2006 AXIS Re Europe AXIS fulfills customer needs by deploying strong capacity when traditional markets balked Strategic impact: AXIS gains market recognition and becomes reinsurance partner of market segment seeking protection Main reinsurers join and demand increases AXIS, as leader, obtained improved rates Demand increased while some competitors opened up to the product AXIS expanded its role as a lead market at increased prices Certain French insurers sought reinsurance protection for large man-made property events impacting several risks (fire, explosion, terrorism for risk > €6 M sum insured) Main reinsurers do not respond to demand, supposedly not willing to accept additional terrorism exposure AXIS stepped in and took several lead positions at our pricing and our terms |
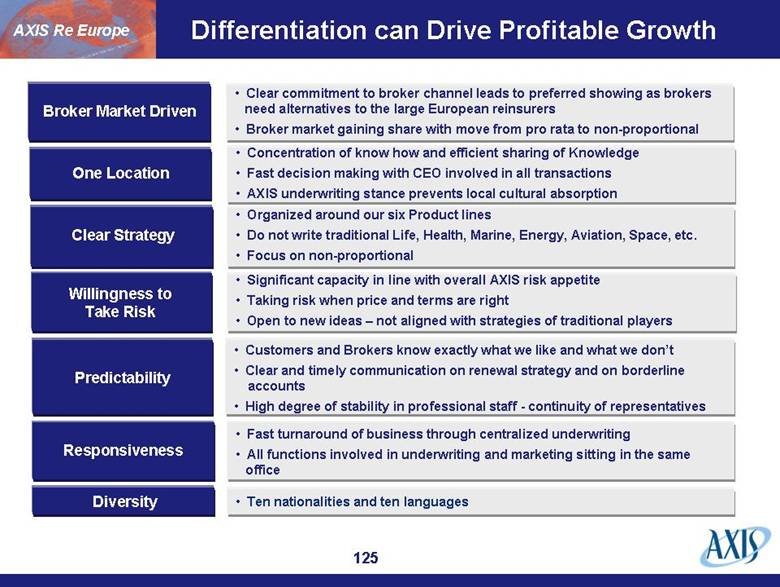
| Differentiation can Drive Profitable Growth Broker Market Driven Clear Strategy Willingness to Take Risk AXIS Re Europe One Location Predictability Responsiveness Diversity Ten nationalities and ten languages Fast turnaround of business through centralized underwriting All functions involved in underwriting and marketing sitting in the same office Customers and Brokers know exactly what we like and what we don’t Clear and timely communication on renewal strategy and on borderline accounts High degree of stability in professional staff - continuity of representatives Significant capacity in line with overall AXIS risk appetite Taking risk when price and terms are right Open to new ideas – not aligned with strategies of traditional players Organized around our six Product lines Do not write traditional Life, Health, Marine, Energy, Aviation, Space, etc. Focus on non-proportional Concentration of know how and efficient sharing of Knowledge Fast decision making with CEO involved in all transactions AXIS underwriting stance prevents local cultural absorption Clear commitment to broker channel leads to preferred showing as brokers need alternatives to the large European reinsurers Broker market gaining share with move from pro rata to non-proportional |
| Responsiveness AXIS Re Europe Combining Bermudian underwriting focus and entrepreneurial spirit with Continental European market knowledge and culture = The Eurobermudian European or Bermudian? |

| AXIS Re Questions? |
| Investments |

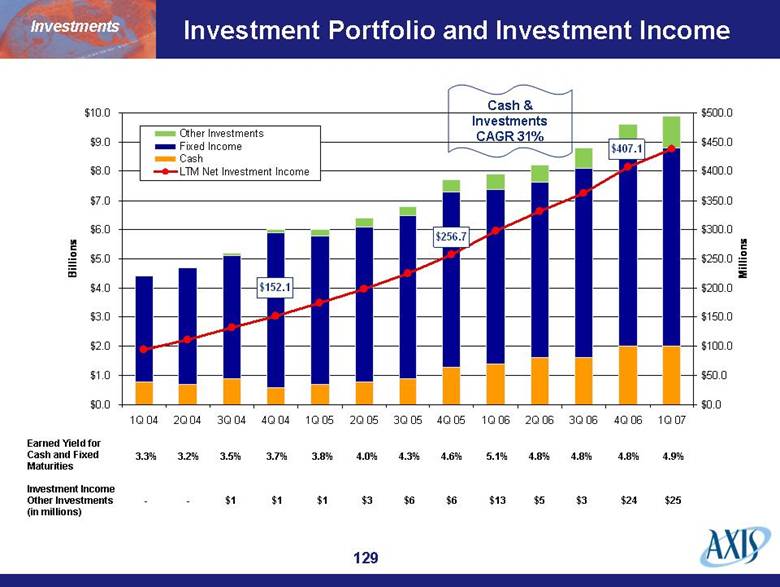
| Investment Portfolio and Investment Income $25 $24 $3 $5 $13 $6 $6 $3 $1 $1 $1 - - Investment Income Other Investments (in millions) 4.9% 4.8% 4.8% 4.8% 5.1% 4.6% 4.3% 4.0% 3.8% 3.7% 3.5% 3.2% 3.3% Earned Yield for Cash and Fixed Maturities Cash & Investments CAGR 31% Investments $152.1 $256.7 $407.1 $0.0 $1.0 $2.0 $3.0 $4.0 $5.0 $6.0 $7.0 $8.0 $9.0 $10.0 1Q 04 2Q 04 3Q 04 4Q 04 1Q 05 2Q 05 3Q 05 4Q 05 1Q 06 2Q 06 3Q 06 4Q 06 1Q 07 Billions $0.0 $50.0 $100.0 $150.0 $200.0 $250.0 $300.0 $350.0 $400.0 $450.0 $500.0 Millions Other Investments Fixed Income Cash LTM Net Investment Income |
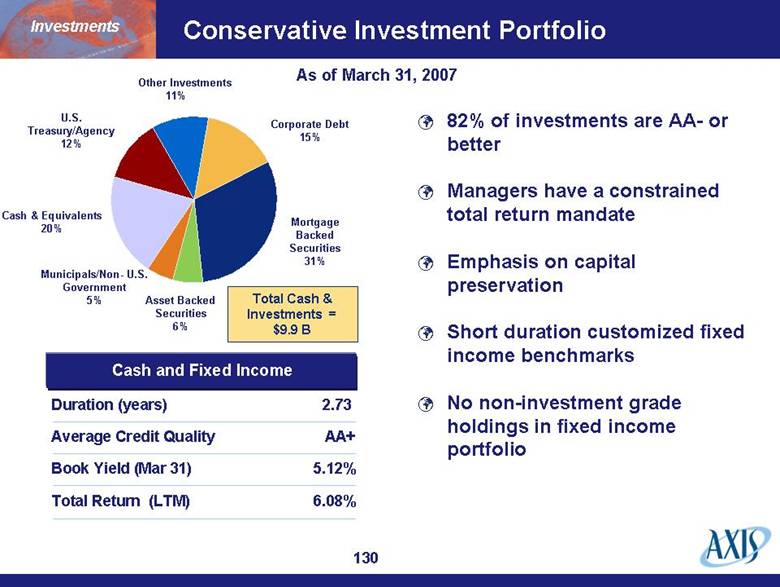
| Conservative Investment Portfolio Mortgage Backed Securities 31% Corporate Debt 15% U.S. Treasury/Agency 12% Asset Backed Securities 6% Cash & Equivalents 20% Municipals/Non- U.S. Government 5% Cash and Fixed Income Duration (years) Average Credit Quality Book Yield (Mar 31) Total Return (LTM) 2.73 AA+ 5.12% 6.08% As of March 31, 2007 82% of investments are AA- or better Managers have a constrained total return mandate Emphasis on capital preservation Short duration customized fixed income benchmarks No non-investment grade holdings in fixed income portfolio Other Investments 11% Total Cash & Investments = $9.9 B Investments |
| Fixed Income Portfolio – Controls Conservative investment guidelines Weighted average rating minimum of AA-; 10% limit on BBB category Diversification by sector and issuer Duration targets Clear guidelines following downgrade Statutory concerns are taken into consideration No derivative positions other than currency hedges All new guidelines and guideline changes approved by Finance Committee All portfolios externally managed by reputable investment managers who are approved by Finance Committee No exposure to lower-rated tranches of sub-prime mortgages in portfolio Investments |
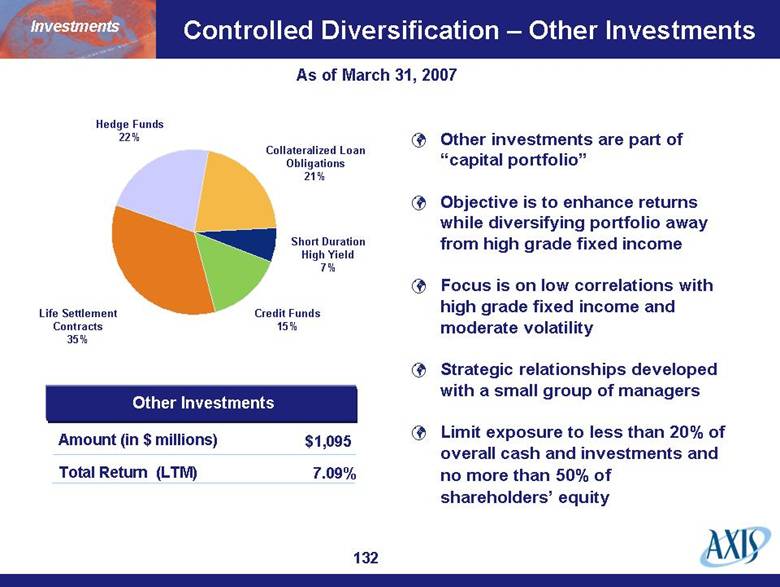
| Controlled Diversification – Other Investments Short Duration High Yield 7% Collateralized Loan Obligations 21% Hedge Funds 22% Credit Funds 15% Life Settlement Contracts 35% Other Investments Amount (in $ millions) Total Return (LTM) $1,095 7.09% As of March 31, 2007 Other investments are part of “capital portfolio” Objective is to enhance returns while diversifying portfolio away from high grade fixed income Focus is on low correlations with high grade fixed income and moderate volatility Strategic relationships developed with a small group of managers Limit exposure to less than 20% of overall cash and investments and no more than 50% of shareholders’ equity Investments |
| Strategic Asset Allocation Aggregate portfolio supports both liabilities and capital That which supports liabilities - currency and duration matched, and consists of cash and high-grade fixed income That which supports capital - at defined risk tolerance level and consists of cash, high grade fixed income and other investments Overall risk tolerance for aggregate portfolio is a 4% volatility target with no more than 10% of Shareholders’ Equity at risk Continue to allocate capital pool away from U.S. high-grade fixed income on opportunistic basis Focus for capital pool is providing consistent risk-adjusted returns Investments |
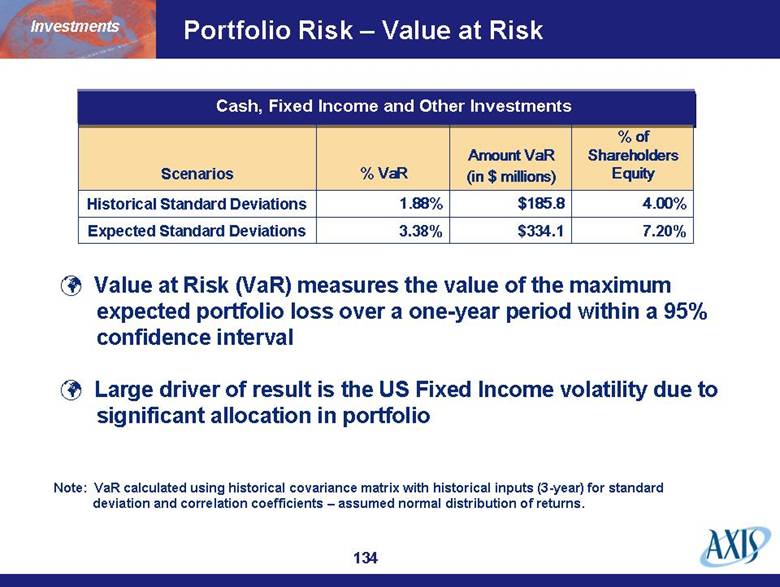
| Portfolio Risk – Value at Risk 7.20% 4.00% % of Shareholders Equity 3.38% 1.88% Amount VaR (in $ millions) $334.1 Expected Standard Deviations $185.8 Historical Standard Deviations Cash, Fixed Income and Other Investments Investments Note: VaR calculated using historical covariance matrix with historical inputs (3-year) for standard deviation and correlation coefficients – assumed normal distribution of returns. Value at Risk (VaR) measures the value of the maximum expected portfolio loss over a one-year period within a 95% confidence interval Large driver of result is the US Fixed Income volatility due to significant allocation in portfolio Scenarios % VaR |
| Finance and Capital |
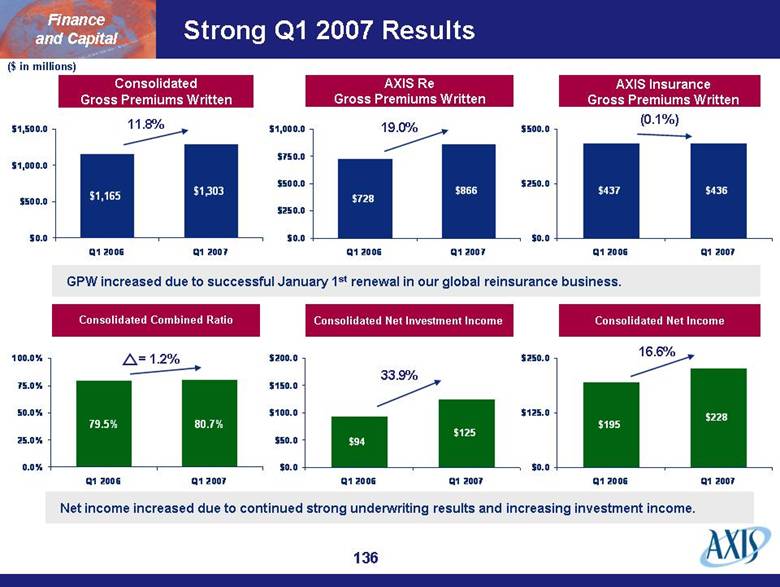
| Strong Q1 2007 Results Consolidated Gross Premiums Written 11.8% AXIS Re Gross Premiums Written 19.0% AXIS Insurance Gross Premiums Written (0.1%) Consolidated Combined Ratio = 1.2% 33.9% Consolidated Net Income Consolidated Net Investment Income 16.6% ($ in millions) GPW increased due to successful January 1st renewal in our global reinsurance business. Net income increased due to continued strong underwriting results and increasing investment income. Finance and Capital $1,165 $1,303 $0.0 $500.0 $1,000.0 $1,500.0 Q1 2006 Q1 2007 $728 $866 $0.0 $250.0 $500.0 $750.0 $1,000.0 Q1 2006 Q1 2007 $437 $436 $0.0 $250.0 $500.0 Q1 2006 Q1 2007 79.5% 80.7% 0.0% 25.0% 50.0% 75.0% 100.0% Q1 2006 Q1 2007 $94 $125 $0.0 $50.0 $100.0 $150.0 $200.0 Q1 2006 Q1 2007 $195 $228 $0.0 $125.0 $250.0 Q1 2006 Q1 2007 |
| Financial Objectives to Drive Shareholder Value Achieve minimum 15% ROE and outperform in value creation (book value per share + dividend growth) over long-term for shareholders Sufficient potential profit to absorb major events (capital preservation) Strong balance sheet supported by disciplined reserving and characterized by modest financial leverage Satisfy needs of client stakeholders to support disciplined expansion of franchise over time Maintain financial strength ratings and continuously evaluate ratings position Allocate capital with preference to our core competency – underwriting risks Finance and Capital Shareholder value is strongly linked to our ability to deliver value to our clients. |
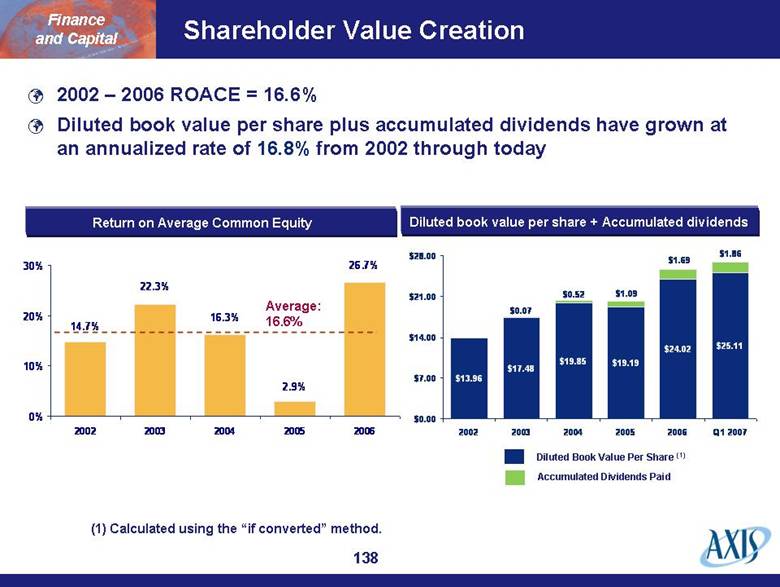
| Shareholder Value Creation Diluted Book Value Per Share (1) (1) Calculated using the “if converted” method. Accumulated Dividends Paid Finance and Capital Diluted book value per share + Accumulated dividends Return on Average Common Equity Average: 16.6% 2002 – 2006 ROACE = 16.6% Diluted book value per share plus accumulated dividends have grown at an annualized rate of 16.8% from 2002 through today $25.11 $24.02 $19.19 $19.85 $17.48 $13.96 $1.86 $1.69 $1.09 $0.07 $0.52 $0.00 $7.00 $14.00 $21.00 $28.00 2002 2003 2004 2005 2006 Q1 2007 26.7% 2.9% 16.3% 22.3% 14.7% 0% 10% 20% 30% 2002 2003 2004 2005 2006 |
| Disciplined Management of Cat Exposure Rigorous risk-return analysis embedded in both our insurance and reinsurance segments Cat exposure appropriately sized relative to our capital base and diversified earnings Occurrence-based PML in 1-in-250 year event by zone limited to 25% of total capital and allocated between AXIS Insurance and AXIS Re Utilizing latest expected loss assumptions and including AXIS assumptions regarding non-modeled risks Significantly improved risk-adjusted margins in peak zones with reduced gross exposure in all zones Finance and Capital |
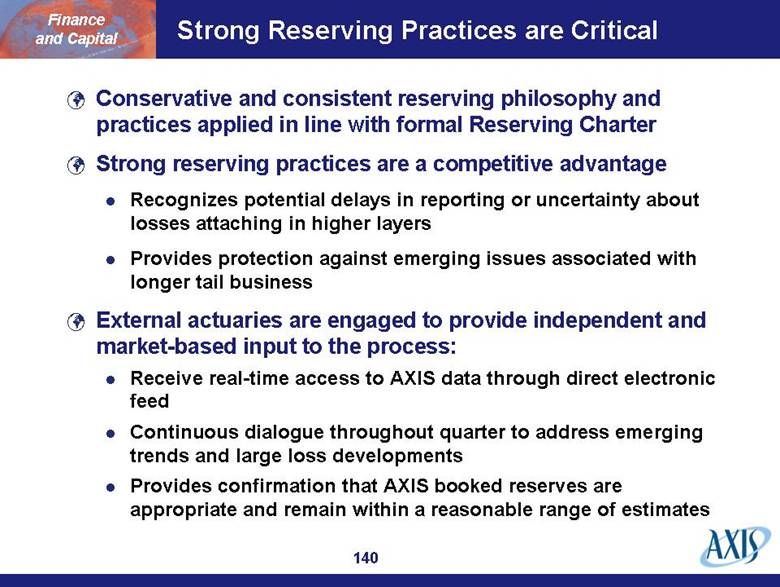
| Strong Reserving Practices are Critical Conservative and consistent reserving philosophy and practices applied in line with formal Reserving Charter Strong reserving practices are a competitive advantage Recognizes potential delays in reporting or uncertainty about losses attaching in higher layers Provides protection against emerging issues associated with longer tail business External actuaries are engaged to provide independent and market-based input to the process: Receive real-time access to AXIS data through direct electronic feed Continuous dialogue throughout quarter to address emerging trends and large loss developments Provides confirmation that AXIS booked reserves are appropriate and remain within a reasonable range of estimates Finance and Capital |
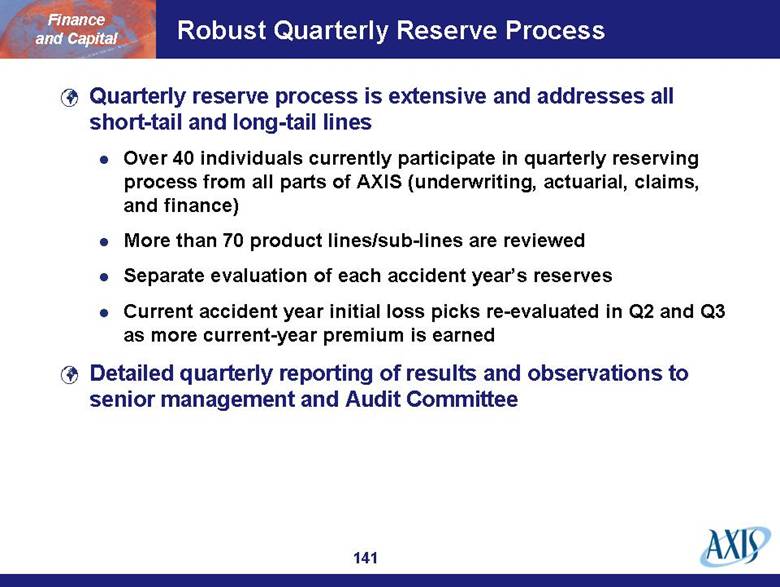
| Robust Quarterly Reserve Process Quarterly reserve process is extensive and addresses all short-tail and long-tail lines Over 40 individuals currently participate in quarterly reserving process from all parts of AXIS (underwriting, actuarial, claims, and finance) More than 70 product lines/sub-lines are reviewed Separate evaluation of each accident year’s reserves Current accident year initial loss picks re-evaluated in Q2 and Q3 as more current-year premium is earned Detailed quarterly reporting of results and observations to senior management and Audit Committee Finance and Capital |
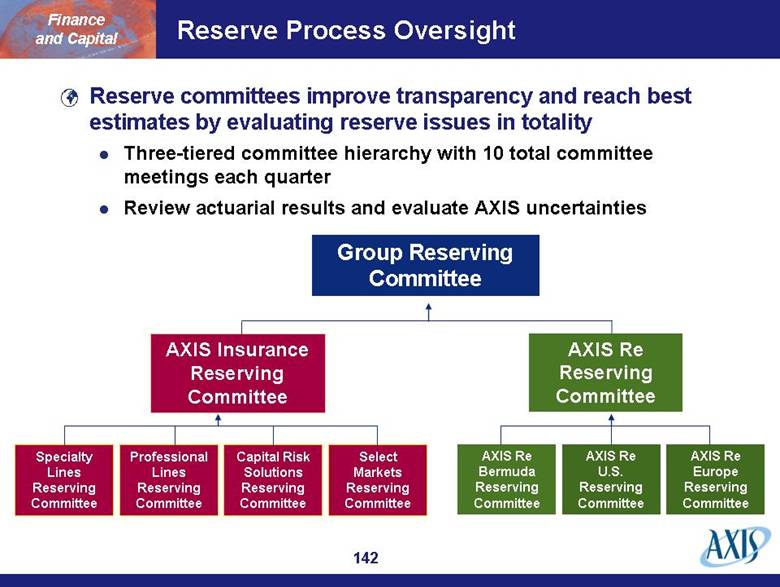
| Reserve Process Oversight Reserve committees improve transparency and reach best estimates by evaluating reserve issues in totality Three-tiered committee hierarchy with 10 total committee meetings each quarter Review actuarial results and evaluate AXIS uncertainties Finance and Capital Group Reserving Committee AXIS Insurance Reserving Committee AXIS Re Reserving Committee Specialty Lines Reserving Committee Professional Lines Reserving Committee Capital Risk Solutions Reserving Committee Select Markets Reserving Committee AXIS Re Bermuda Reserving Committee AXIS Re U.S. Reserving Committee AXIS Re Europe Reserving Committee |
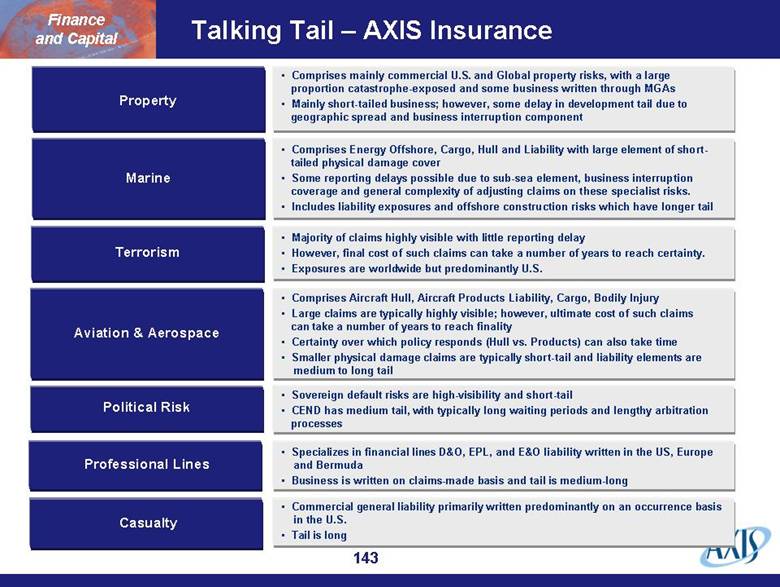
| Talking Tail – AXIS Insurance Property Marine Terrorism Aviation & Aerospace Political Risk Professional Lines Casualty Finance and Capital Commercial general liability primarily written predominantly on an occurrence basis in the U.S. Tail is long Specializes in financial lines D&O, EPL, and E&O liability written in the US, Europe and Bermuda Business is written on claims-made basis and tail is medium-long Sovereign default risks are high-visibility and short-tail CEND has medium tail, with typically long waiting periods and lengthy arbitration processes Comprises Aircraft Hull, Aircraft Products Liability, Cargo, Bodily Injury Large claims are typically highly visible; however, ultimate cost of such claims can take a number of years to reach finality Certainty over which policy responds (Hull vs. Products) can also take time Smaller physical damage claims are typically short-tail and liability elements are medium to long tail Majority of claims highly visible with little reporting delay However, final cost of such claims can take a number of years to reach certainty. Exposures are worldwide but predominantly U.S. Comprises Energy Offshore, Cargo, Hull and Liability with large element of short- tailed physical damage cover Some reporting delays possible due to sub-sea element, business interruption coverage and general complexity of adjusting claims on these specialist risks. Includes liability exposures and offshore construction risks which have longer tail Comprises mainly commercial U.S. and Global property risks, with a large proportion catastrophe-exposed and some business written through MGAs Mainly short-tailed business; however, some delay in development tail due to geographic spread and business interruption component |
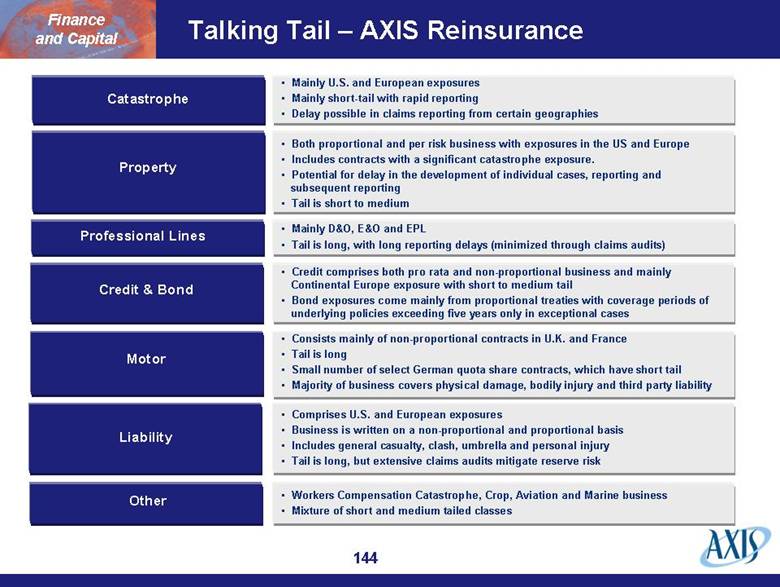
| Talking Tail – AXIS Reinsurance Catastrophe Property Professional Lines Credit & Bond Motor Liability Other Finance and Capital Workers Compensation Catastrophe, Crop, Aviation and Marine business Mixture of short and medium tailed classes Comprises U.S. and European exposures Business is written on a non-proportional and proportional basis Includes general casualty, clash, umbrella and personal injury Tail is long, but extensive claims audits mitigate reserve risk Consists mainly of non-proportional contracts in U.K. and France Tail is long Small number of select German quota share contracts, which have short tail Majority of business covers physical damage, bodily injury and third party liability Credit comprises both pro rata and non-proportional business and mainly Continental Europe exposure with short to medium tail Bond exposures come mainly from proportional treaties with coverage periods of underlying policies exceeding five years only in exceptional cases Mainly D&O, E&O and EPL Tail is long, with long reporting delays (minimized through claims audits) Both proportional and per risk business with exposures in the US and Europe Includes contracts with a significant catastrophe exposure. Potential for delay in the development of individual cases, reporting and subsequent reporting Tail is short to medium Mainly U.S. and European exposures Mainly short-tail with rapid reporting Delay possible in claims reporting from certain geographies |
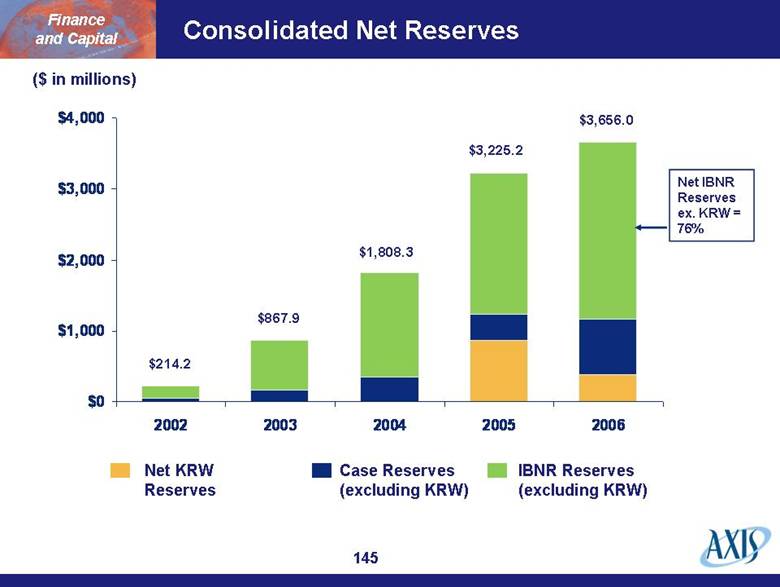
| Consolidated Net Reserves ($ in millions) IBNR Reserves (excluding KRW) Case Reserves (excluding KRW) Net KRW Reserves $214.2 $867.9 $1,808.3 $3,225.2 $3,656.0 Net IBNR Reserves ex. KRW = 76% Finance and Capital $0 $1,000 $2,000 $3,000 $4,000 2002 2003 2004 2005 2006 |
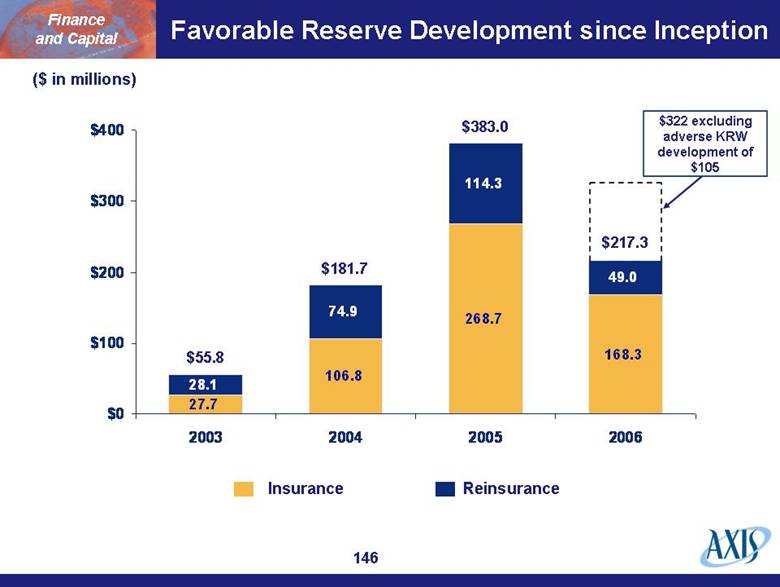
| Favorable Reserve Development since Inception ($ in millions) Reinsurance Insurance $55.8 $181.7 $383.0 $217.3 $322 excluding adverse KRW development of $105 Finance and Capital 27.7 106.8 268.7 168.3 28.1 74.9 114.3 49.0 $0 $100 $200 $300 $400 2003 2004 2005 2006 |
| Modest Financial Leverage = Financial Flexibility Finance and Capital ($ in millions) $2,817 $3,737 $4,011 $4,912 Common Equity Series A Preferred Equity Series B Preferred Equity Debt $1,961 $5,141 Capitalization Ratios as of March 31, 2007 Debt /Total Capital 9.7% Debt + Preferred / Total Capital 19.4% 1,961 2,817 3,238 3,012 3,913 4,142 250 250 250 250 250 250 499 499 499 499 $0 $1,000 $2,000 $3,000 $4,000 $5,000 $6,000 2002 2003 2004 2005 2006 Q1 2007 |

| Capital in the Right Places Bermuda = $3,501 M 68% U.S. = $905 M 18% Europe = $717 M 14% Statutory Surplus by Geography Total Adjusted Statutory Surplus as of 3/31/07 = $5.1 B Finance and Capital |
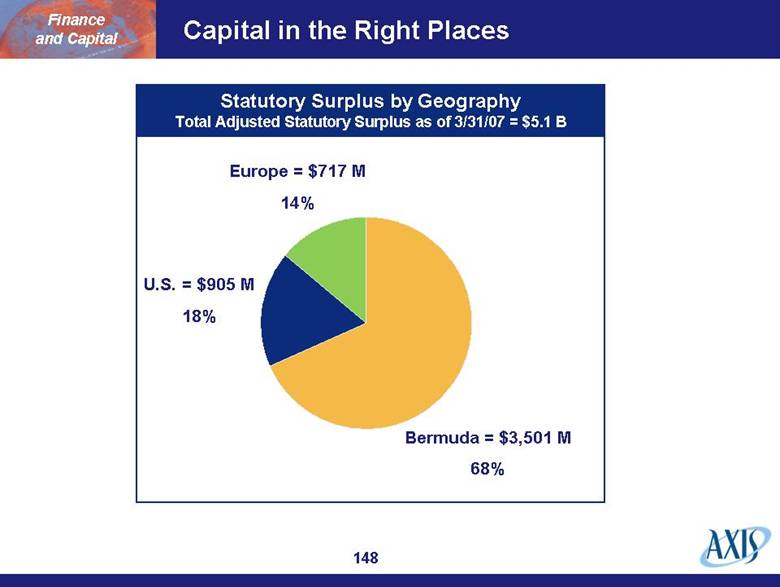
| Consistently Strong Ratings Finance and Capital A- A- A A A A A Standard & Poor’s A.M. Best 2001 2002 2003 2004 2005 2006 2007 Moody’s A A A A A A Positive Outlook KRW Ratings Stable A2 A2 A2 A2 |
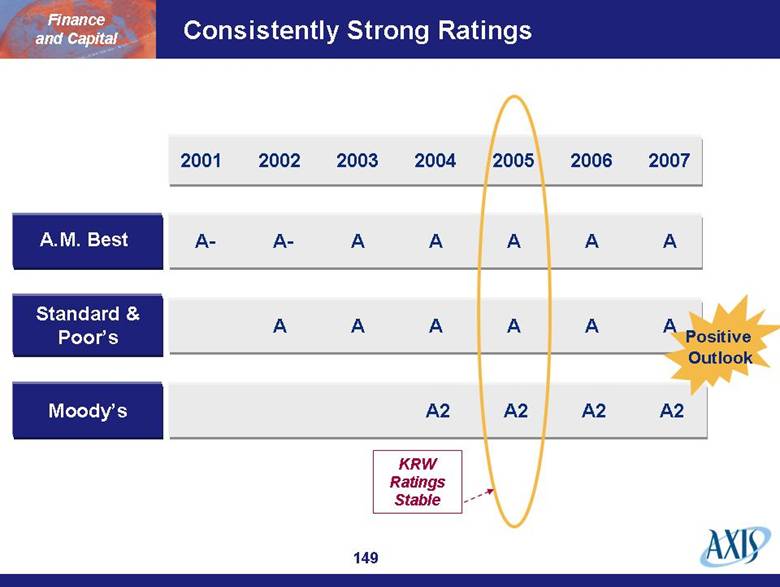
| Focused Capital Management (1) Excludes dividend declared but not yet paid for Q2 ’07. Total Common Equity Raised: $539 Dividends $335 Share Repurchases 451 Total Capital Returned $786 Finance and Capital ($ in millions, except per share amounts) Common Equity Raised Dividends & Share Repurchases CommonDividends Share Repurchases Equity Raised Dividends Declared Per Common Share (1) $78 $94 $102 $350 $101 $50 $11 ($339) ($200) (400) (300) (200) (100) 0 100 200 300 400 500 2003 2004 2005 2006 2007 YTD $0.14 $0.66 $0.62 $0.60 $0.50 $0.00 $0.25 $0.50 $0.75 2003 2004 2005 2006 2007 YTD Annualized Dividend growth since our IPO in 2003 Opportunistic share repurchases Capital raised to fund attractive opportunities |
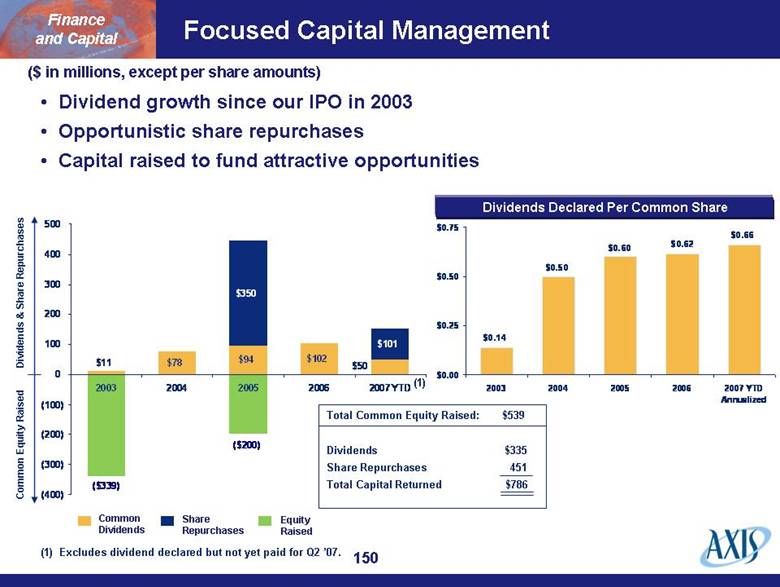
| Capital Management Capital management to date has balanced competing forces of clients/regulators/rating agencies and shareholders and has recognized the development of the Company: Rating agencies moving the bar Reputational risk in start-up years Critical mass in jurisdictions where capital has been committed to build franchise Business has grown every year since inception In December 2006, quarterly dividends increased by 10% to $0.66 per share Current dividend yield of 1.7% Payout ratio (2) of 12.2% Board authorized repurchase program of $400 million in December 2006 $101 million repurchased since authorization $299 million remaining authorization Finance and Capital (1) Based upon Street consensus earnings estimate of $5.39 per share as of June 1, 2007. |
| Conclusion |

| Current State of the Cycle Peak reached, but price declines vary by line Majority of business, aside from the more volatile lines (e.g. aviation and terrorism), at or above adequate level Continued focus on accessing more business for review Risk selection critical at this point in the cycle Targeted returns achievable with AXIS execution Medium-term strategic initiatives are not impacted by state of P&C cycle Conclusion |
| Achieving Our Targeted Returns Conclusion Continue to optimize risk-return in underwriting, investments and strategic risk areas Capital management in 2007 and beyond Recognition of strategic initiatives in place for the medium-term Capital we choose to hold for strategic reasons and not utilized in underwriting dedicated to “capital” pool of investment portfolio Flexibility in current capital structure for return of capital Underwriting Profit Investment Income Stable Increasing |
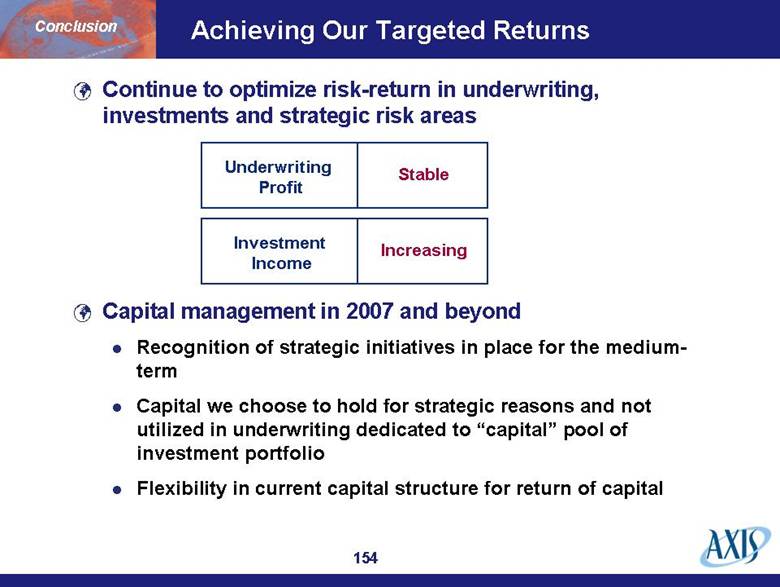
| AXIS = An Investment in Outperformance Highly experienced management and team of specialists in knowledge-based business High-quality risk-adjusted returns Global platform in both insurance and reinsurance already built for longevity and value creation through all product cycles Strategic initiatives to deliver specialty expertise to new markets Global capital above critical level to address longer-term needs of all stakeholders – clients and shareholders Outperformance in total value creation over time Conclusion |
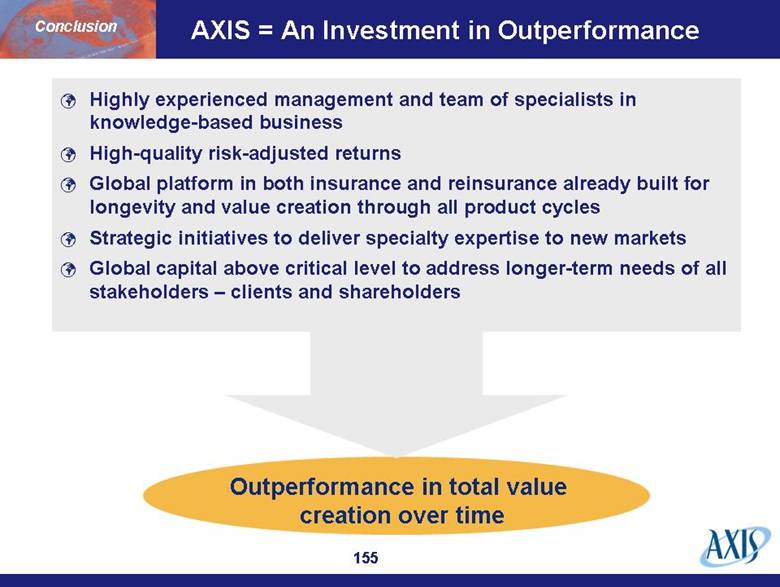
| AXIS Capital Final Questions? |
| Non-GAAP Disclosure Reconciliation of Diluted Book Value per Share to Basic Book Value per Share At March 31 ( in thousands, except per share) 2007 2006 2005 2004 2003 2002 Common shareholders' equity 4,141,747 $ 3,912,647 $ 3,012,351 $ 3,238,064 $ 2,817,148 $ 1,961,033 $ Shares outstanding 150,417 149,982 148,831 152,737 152,456 138,160 Book value per share 27.54 $ 26.09 $ 20.24 $ 21.20 $ 18.48 $ 14.19 $ Diluted book value on a "as if converted basis" Common shareholders equity 4,141,747 3,912,647 3,012,351 3,238,064 2,817,148 1,961,033 add in: 94,835 94,811 117,808 94,724 244,811 243,166 244,363 244,363 244,812 244,812 62,630 58,323 Adjusted shareholders equity 4,480,945 $ 4,251,821 $ 3,374,971 $ 3,577,600 $ 3,124,589 $ 2,262,522 $ As if converted diluted shares Shares outstanding 150,417 149,982 148,831 152,737 152,456 138,160 add in: 55 46 38 28 18 9 3,273 2,229 1,172 2,183 1,885 - 5,058 5,147 6,174 5,694 4,695 4,476 19,562 19,644 19,651 19,619 19,691 19,453 Diluted shares outstanding 178,365 177,048 175,866 180,261 178,745 162,098 Diluted book value per share 25.11 $ 24.02 $ 19.19 $ 19.85 $ 17.48 $ 13.96 $ At December 31 exercise of warrants exersice of options vesting of restricted stock vested phantom stock units outstanding proceeds on exercise of warrants proceeds on excerise of options |
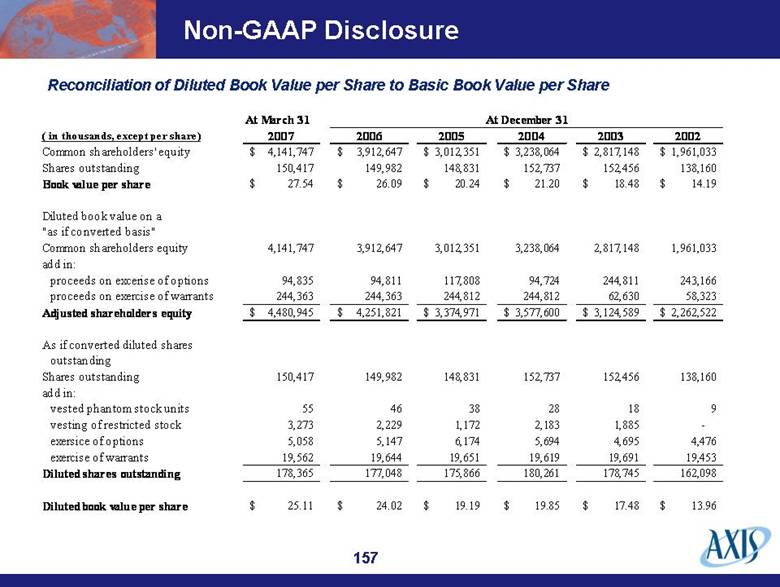
| AXIS Capital Investor Day 2007 Quality, Sustainability and Profitability June 7, 2007 |