Exhibit 99
Investor Meetings February/March 2020

Safe Harbor Statement FORWARD - LOOKING STATEMENTS: This document contains “forward - looking statements” within the meaning of section 27A of the Securities Act of 1933 and section 21E of the Securities Exchange Act of 1934. All statements, other than statements of historical facts included in this presentation, including statements regarding our e sti mates, beliefs, expectations, intentions, strategies or projections , including without limitation the information under the heading “Group Improvement Targets,” are forward - looking statements. We i ntend these forward looking statements to be covered by the safe harbor provisions for forward - looking statements in the United States federal securities la ws. In some cases, these statements can be identified by the use of forward - looking words such as “may,” “should,” “could,” “anticipate,” “estimate,” “expect,” “plan,” “be lieve,” “predict,” “potential,” “intend,” “target” or similar expressions. These forward - looking statements are not historical facts, and are based upon current expectations, estimates and p rojections, and various assumptions, many of which, by their nature, are inherently uncertain and beyond management's control. Forward - looking statements contained in this p resentation may include, but are not limited to, information regarding our estimates of losses related to catastrophes and other large losses, measurements of potential losse s i n the fair market value of our investment portfolio and derivative contracts, our expectations regarding the performance of our business, our financial results, our li qui dity and capital resources, the outcome of our strategic initiatives, our expectations regarding estimated synergies and the success of the integration of acquired entities , o ur expectations regarding the estimated benefits and synergies related to our transformation program, our expectations regarding pricing and other market conditions, our grow th prospects, and valuations of the potential impact of movements in interest rates, equity securities' prices, credit spreads and foreign currency rates. Forward - looking statements only reflect our expectations and are not guarantees of performance. These statements involve risks, uncertainties and assumptions. Accordingly, there are or will be important factors that could cause actual events or results to differ materially from those indicated in su ch statements. We believe that these factors, include but are not limited to, the following: • the cyclical nature of the (re)insurance business leading to periods with excess underwriting capacity and unfavorable premium rates; • the occurrence and magnitude of natural and man - made disasters; • the impact of global climate change on our business, including the possibility that we do not adequately assess or reserve for the increased frequency and severity of natural catastrophes; • losses from war, terrorism and political unrest or other unanticipated losses, • actual claims exceeding our loss reserves; • general economic, capital and credit market conditions, • the failure of any of the loss limitation methods we employ; • the effects of emerging claims, coverage and regulatory issues, including uncertainty related to coverage definitions, limits, terms and conditions; • our inability to purchase reinsurance or collect amounts due to us; • the breach by third parties in our program business of their obligations to us; • difficulties with technology and/or data security; • the failure of our policyholders and intermediaries to pay premiums, • the failure of our cedants to adequately evaluate risks; • inability to obtain additional capital on favorable terms, or at all; • the loss of one or more key executives; • a decline in our ratings with rating agencies; • loss of business provided to us by our major brokers and credit risk due to our reliance on brokers; • changes in accounting policies or practices; • the use of industry catastrophe models and changes to these models; • changes in governmental regulations and potential government intervention in our industry, • failure to comply with certain laws and regulations relating to sanctions and foreign corrupt practices; • increased competition; • changes in the political environment of certain countries in which we operate or underwrite business including the United Kingdom's expected withdrawal from the European Union; • fluctuations in interest rates, credit spreads, equity securities' prices and/or currency values, • the failure to successfully integrate acquired businesses or realize the expected synergies resulting from such acquisitions; • the failure to realize the expected benefits or synergies relating to the Company's transformation initiative; • changes in tax laws, and • the other factors including but not limited to those described under Item 1A, 'Risk Factors' and Item 7, 'Management's Discussion and Analysis of Financial Condition and Results of Operations' in our most recent Annual Report on Form 10 - K, filed with the Securities and Exchange Commission ("SEC"), as such factors may be updated from time to time in our periodic and other filings with the SEC, which are accessible on the SEC's website at www.sec.gov . • We undertake no obligation to update or revise publicly any forward - looking statements, whether as a result of new information, future events or otherwise. 1
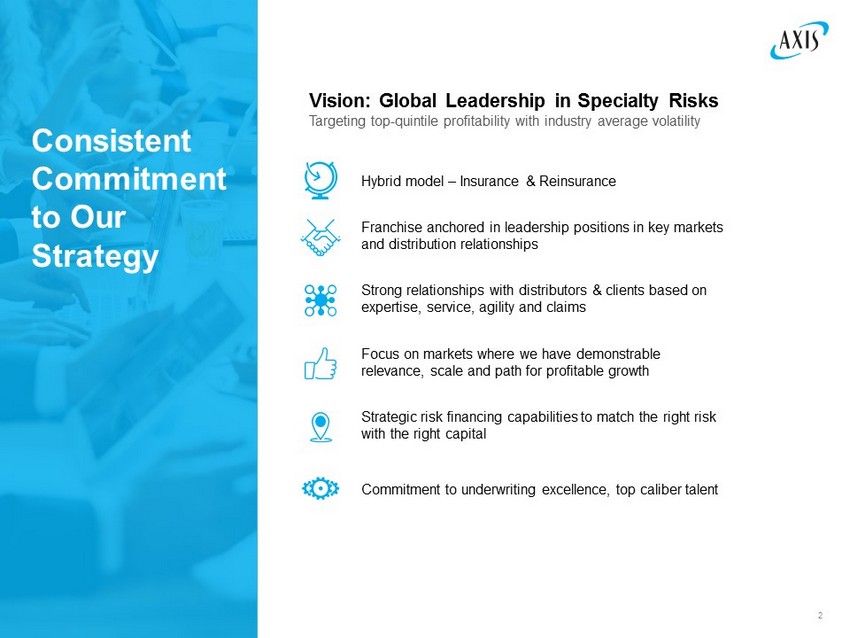
Vision: Global Leadership in Specialty Risks Targeting top - quintile profitability with industry average volatility Hybrid model – Insurance & Reinsurance Franchise anchored in leadership positions in key markets and distribution relationships Strong relationships with distributors & clients based on expertise, service, agility and claims Focus on markets where we have demonstrable relevance, scale and path for profitable growth Strategic risk financing capabilities to match the right risk with the right capital Consistent Commitment to Our Strategy Commitment to underwriting excellence, top caliber talent 2
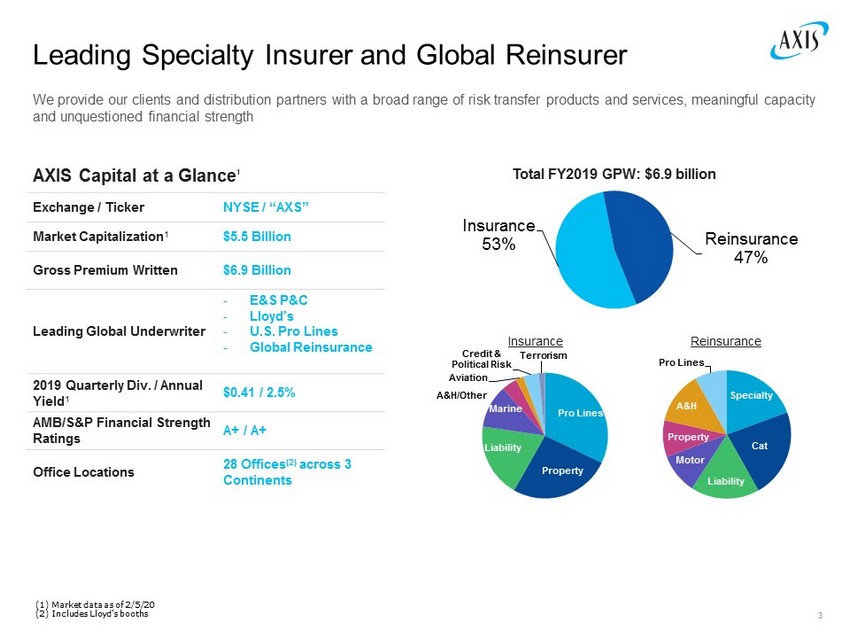
Pro Lines Property Liability Marine A&H/Other Aviation Credit & Political Risk Terrorism AXIS Capital at a Glance 1 Exchange / Ticker NYSE / “AXS” Market Capitalization 1 $5.5 Billion Gross Premium Written $6.9 Billion Leading Global Underwriter - E&S P&C - Lloyd’s - U.S. Pro Lines - Global Reinsurance 2019 Quarterly Div. / Annual Yield 1 $0.41 / 2.5% AMB/S&P Financial Strength Ratings A+ / A+ Office Locations 28 Offices (2) across 3 Continents Leading Specialty Insurer and Global Reinsurer We provide our clients and distribution partners with a broad range of risk transfer products and services, meaningful capaci ty and unquestioned financial strength Insurance 53% Reinsurance 47% Total FY2019 GPW: $6.9 billion Specialty Cat Liability Motor Property A&H Pro Lines Insurance Reinsurance (1) Market data as of 2/5/20 (2) Includes Lloyd’s booths 3
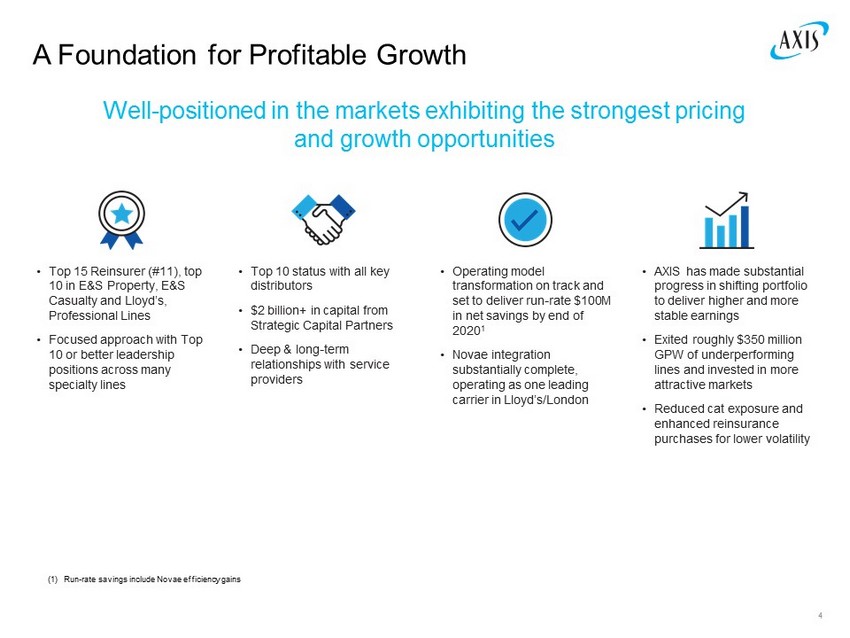
A Foundation for Profitable Growth Well - positioned in the markets exhibiting the strongest pricing and growth opportunities • Top 15 Reinsurer (#11), top 10 in E&S Property, E&S Casualty and Lloyd’s, Professional Lines • Focused approach with Top 10 or better leadership positions across many specialty lines • Top 10 status with all key distributors • $2 billion+ in capital from Strategic Capital Partners • Deep & long - term relationships with service providers • Operating model transformation on track and set to deliver run - rate $100M in net savings by end of 2020 1 • Novae integration substantially complete, operating as one leading carrier in Lloyd’s/London • AXIS has made substantial progress in shifting portfolio to deliver higher and more stable earnings • Exited roughly $350 million GPW of underperforming lines and invested in more attractive markets • Reduced cat exposure and enhanced reinsurance purchases for lower volatility 4 (1) Run - rate savings include Novae efficiency gains
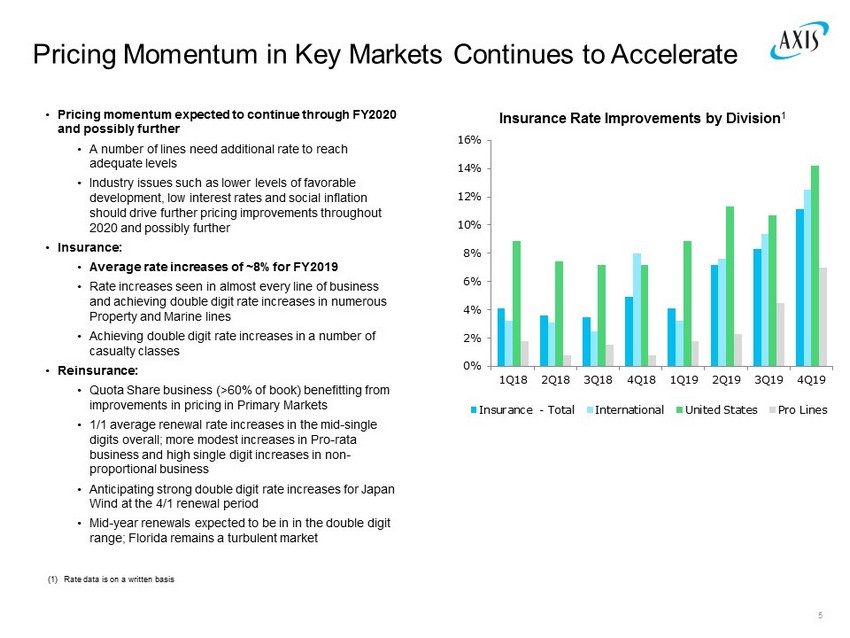
• Pricing momentum expected to continue through FY2020 and possibly further • A number of lines need additional rate to reach adequate levels • Industry issues such as lower levels of favorable development, low interest rates and social inflation should drive further pricing improvements throughout 2020 and possibly further • Insurance: • Average rate increases of ~8% for FY2019 • Rate increases seen in almost every line of business and achieving double digit rate increases in numerous Property and Marine lines • Achieving double digit rate increases in a number of casualty classes • Reinsurance: • Quota Share business (>60% of book) benefitting from improvements in pricing in Primary Markets • 1/1 average renewal rate increases in the mid - single digits overall; more modest increases in Pro - rata business and high single digit increases in non - proportional business • Anticipating strong double digit rate increases for Japan Wind at the 4/1 renewal period • Mid - year renewals expected to be in in the double digit range; Florida remains a turbulent market Pricing Momentum in Key Markets Continues to Accelerate 5 (1) Rate data is on a written basis 0% 2% 4% 6% 8% 10% 12% 14% 16% 1Q18 2Q18 3Q18 4Q18 1Q19 2Q19 3Q19 4Q19 Insurance - Total International United States Pro Lines Insurance Rate Improvements by Division 1
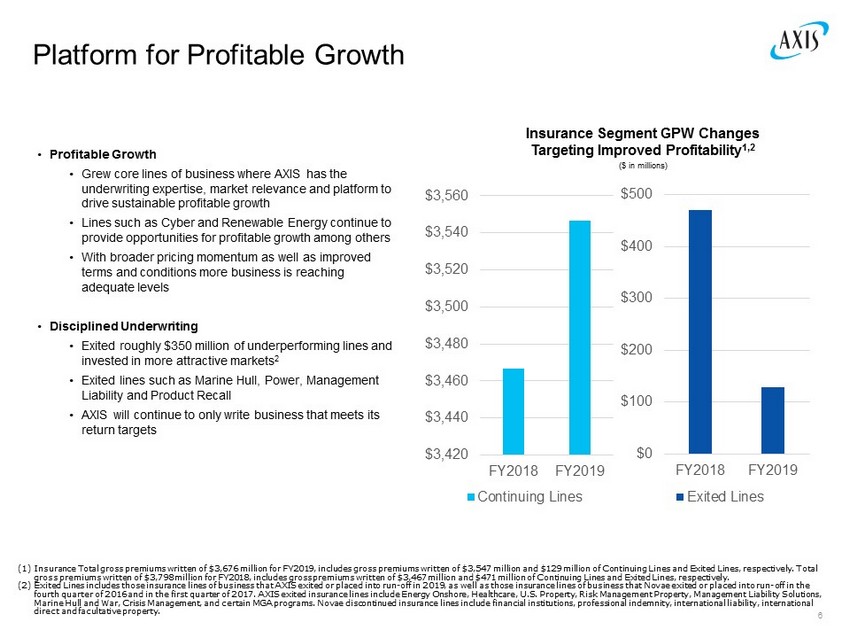
• Profitable Growth • Grew core lines of business where AXIS has the underwriting expertise, market relevance and platform to drive sustainable profitable growth • Lines such as Cyber and Renewable Energy continue to provide opportunities for profitable growth among others • With broader pricing momentum as well as improved terms and conditions more business is reaching adequate levels • Disciplined Underwriting • Exited roughly $350 million of underperforming lines and invested in more attractive markets 2 • Exited lines such as Marine Hull, Power, Management Liability and Product Recall • AXIS will continue to only write business that meets its return targets Platform for Profitable Growth 6 Insurance Segment GPW Changes Targeting Improved Profitability 1,2 $3,420 $3,440 $3,460 $3,480 $3,500 $3,520 $3,540 $3,560 FY2018 FY2019 Continuing Lines $0 $100 $200 $300 $400 $500 FY2018 FY2019 Exited Lines ($ in millions) (1) Insurance Total gross premiums written of $3,676 million for FY2019, includes gross premiums written of $3,547 million and $1 29 million of Continuing Lines and Exited Lines, respectively. Total gross premiums written of $3,798 million for FY2018, includes gross premiums written of $3,467 million and $471 million of Co nti nuing Lines and Exited Lines, respectively. (2) Exited Lines includes those insurance lines of business that AXIS exited or placed into run - off in 2019, as well as those insura nce lines of business that Novae exited or placed into run - off in the fourth quarter of 2016 and in the first quarter of 2017. AXIS exited insurance lines include Energy Onshore, Healthcare, U.S. Pr operty, Risk Management Property, Management Liability Solutions, Marine Hull and War, Crisis Management, and certain MGA programs. Novae discontinued insurance lines include financial instit uti ons, professional indemnity, international liability, international direct and facultative property.

Underwriting Actions Drive Underlying Performance 7 Group Loss Ratio Improvement Loss ratio improvement driven by: • Enhanced pricing, improved terms/conditions and lower limits drive improved loss ratios coupled with greater stability • Portfolio construction coupled with improved mix of business 79.2% 66.6% 66.4% 63.7% 61.7% 60.6% 50% 55% 60% 65% 70% 75% 80% FY2017 FY2018 FY2019 FY2017 FY2018 FY2019 Reported Loss Ratio AY Ex - Cat Loss Ratio
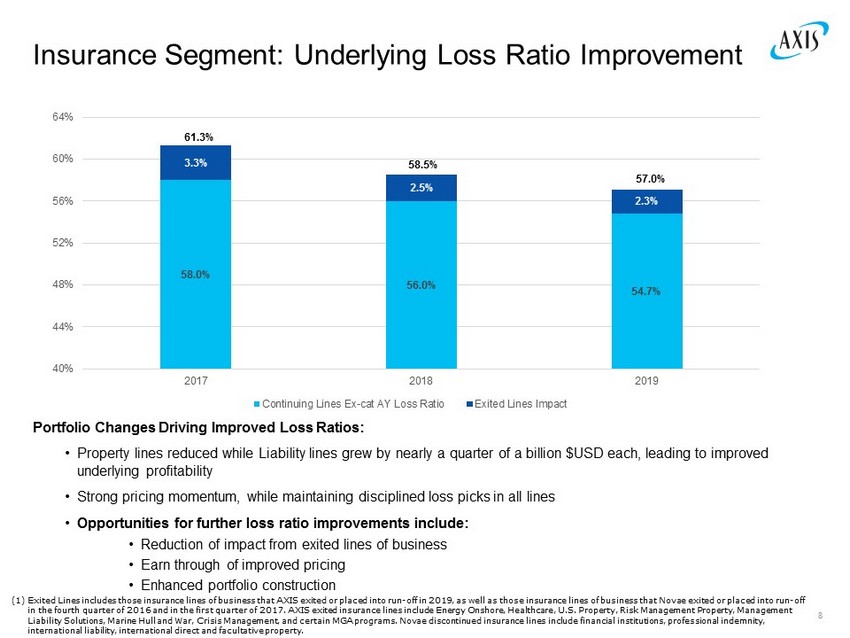
58.0% 56.0% 54.7% 3.3% 2.5% 2.3% 40% 44% 48% 52% 56% 60% 64% 2017 2018 2019 Continuing Lines Ex-cat AY Loss Ratio Exited Lines Impact 58.5% 57.0% Insurance Segment: Underlying Loss Ratio Improvement 8 Portfolio Changes Driving Improved Loss Ratios: • Property lines reduced while Liability lines grew by nearly a quarter of a billion $USD each, leading to improved underlying profitability • Strong pricing momentum, while maintaining disciplined loss picks in all lines • Opportunities for further loss ratio improvements include: • Reduction of impact from exited lines of business • Earn through of improved pricing • Enhanced portfolio construction 61.3% (1) Exited Lines includes those insurance lines of business that AXIS exited or placed into run - off in 2019, as well as those insura nce lines of business that Novae exited or placed into run - off in the fourth quarter of 2016 and in the first quarter of 2017. AXIS exited insurance lines include Energy Onshore, Healthcar e, U.S. Property, Risk Management Property, Management Liability Solutions, Marine Hull and War, Crisis Management, and certain MGA programs. Novae discontinued insurance lines inc lud e financial institutions, professional indemnity, international liability, international direct and facultative property.
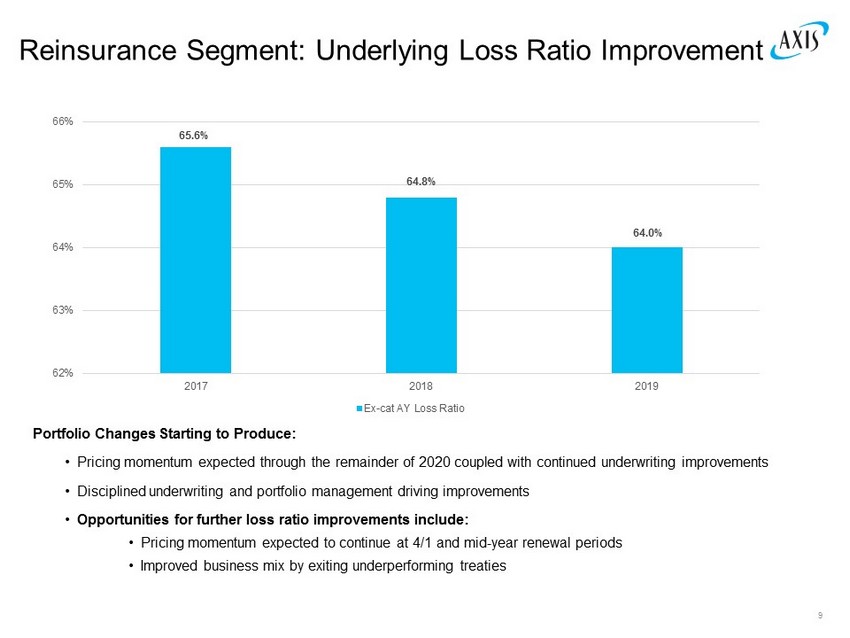
65.6% 64.8% 64.0% 62% 63% 64% 65% 66% 2017 2018 2019 Ex-cat AY Loss Ratio Reinsurance Segment: Underlying Loss Ratio Improvement 9 Portfolio Changes Starting to Produce: • Pricing momentum expected through the remainder of 2020 coupled with continued underwriting improvements • Disciplined underwriting and portfolio management driving improvements • Opportunities for further loss ratio improvements include: • Pricing momentum expected to continue at 4/1 and mid - year renewal periods • Improved business mix by exiting underperforming treaties
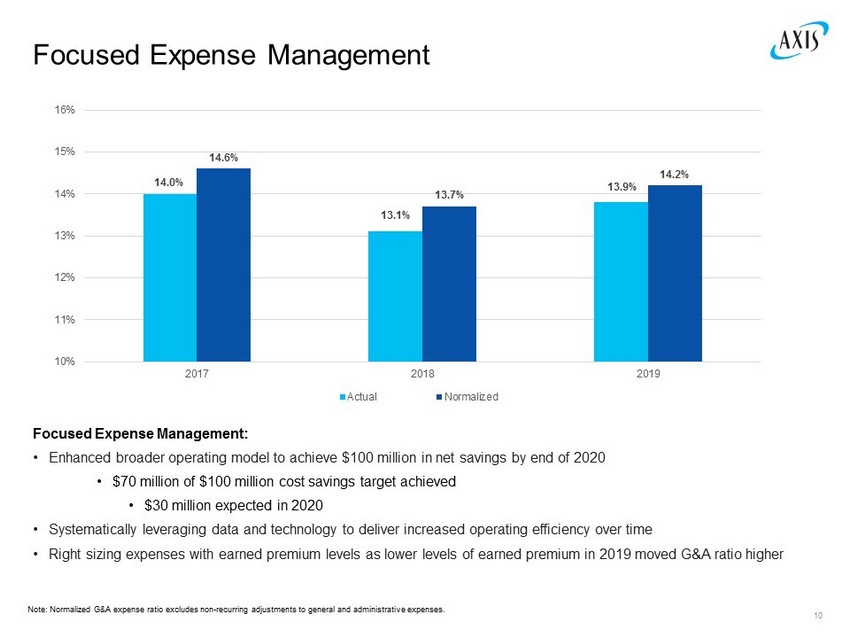
Focused Expense Management 10 Focused Expense Management: • Enhanced broader operating model to achieve $100 million in net savings by end of 2020 • $70 million of $100 million cost savings target achieved • $30 million expected in 2020 • Systematically leveraging data and technology to deliver increased operating efficiency over time • Right sizing expenses with earned premium levels as lower levels of earned premium in 2019 moved G&A ratio higher 14.0% 13.1% 13.9% 14.6% 13.7% 14.2% 10% 11% 12% 13% 14% 15% 16% 2017 2018 2019 Actual Normalized Note: Normalized G&A expense ratio excludes non - recurring adjustments to general and administrative expenses.
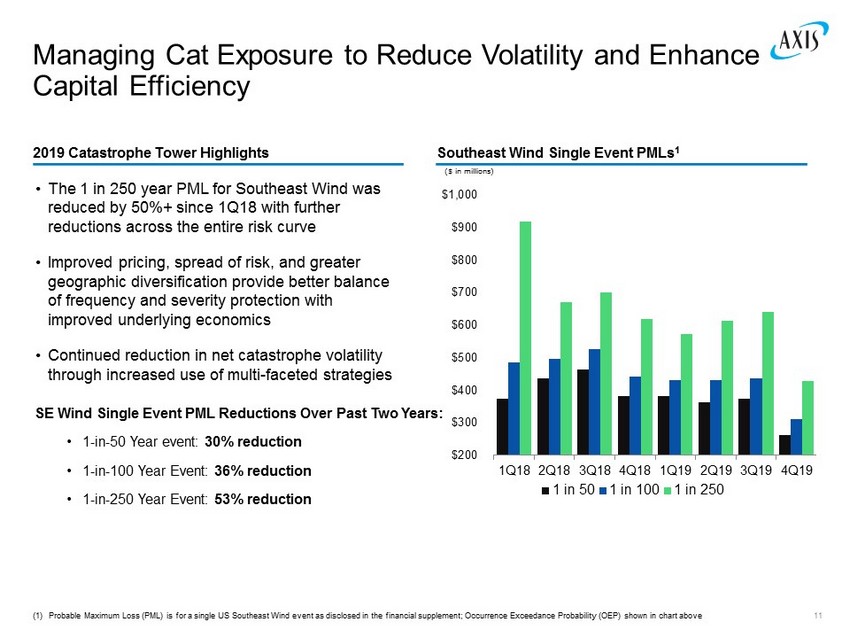
Managing Cat Exposure to Reduce Volatility and Enhance Capital Efficiency Southeast Wind Single Event PMLs 1 2019 Catastrophe Tower Highlights ($ in millions) $200 $300 $400 $500 $600 $700 $800 $900 $1,000 1Q18 2Q18 3Q18 4Q18 1Q19 2Q19 3Q19 4Q19 1 in 50 1 in 100 1 in 250 • The 1 in 250 year PML for Southeast Wind was reduced by 50%+ since 1Q18 with further reductions across the entire risk curve • Improved pricing, spread of risk, and greater geographic diversification provide better balance of frequency and severity protection with improved underlying economics • Continued reduction in net catastrophe volatility through increased use of multi - faceted strategies (1) Probable Maximum Loss (PML) is for a single US Southeast Wind event as disclosed in the financial supplement; Occurrence Exce eda nce Probability (OEP) shown in chart above 11 SE Wind Single Event PML Reductions Over Past Two Years: • 1 - in - 50 Year event: 30% reduction • 1 - in - 100 Year Event: 36% reduction • 1 - in - 250 Year Event: 53% reduction
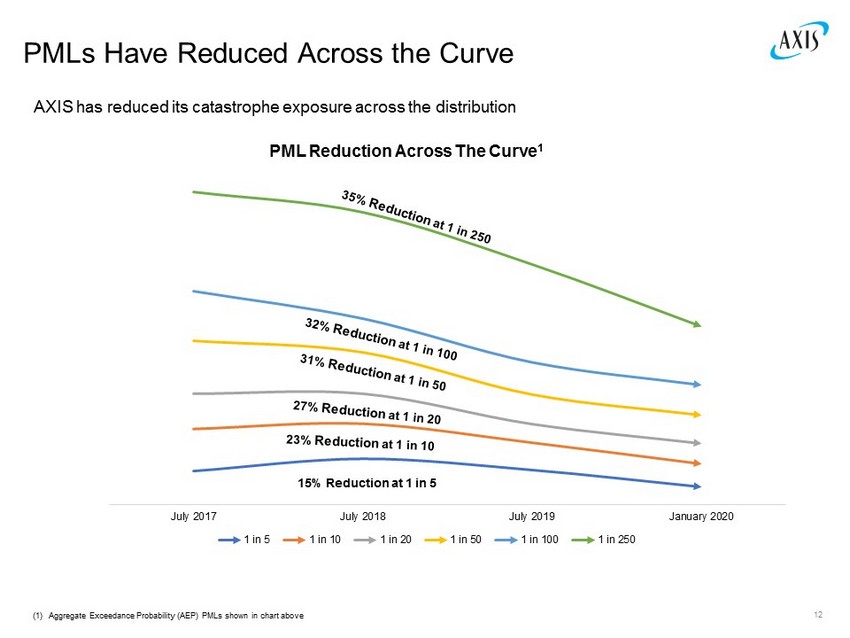
PMLs Have Reduced Across the Curve AXIS has reduced its catastrophe exposure across the distribution 12 $300M $500M $700M $900M $1,100M $1,300M $1,500M July 2017 July 2018 July 2019 January 2020 PML Reduction Across The Curve 1 1 in 5 1 in 10 1 in 20 1 in 50 1 in 100 1 in 250 15% Reduction at 1 in 5 (1) Aggregate Exceedance Probability (AEP) PMLs shown in chart above
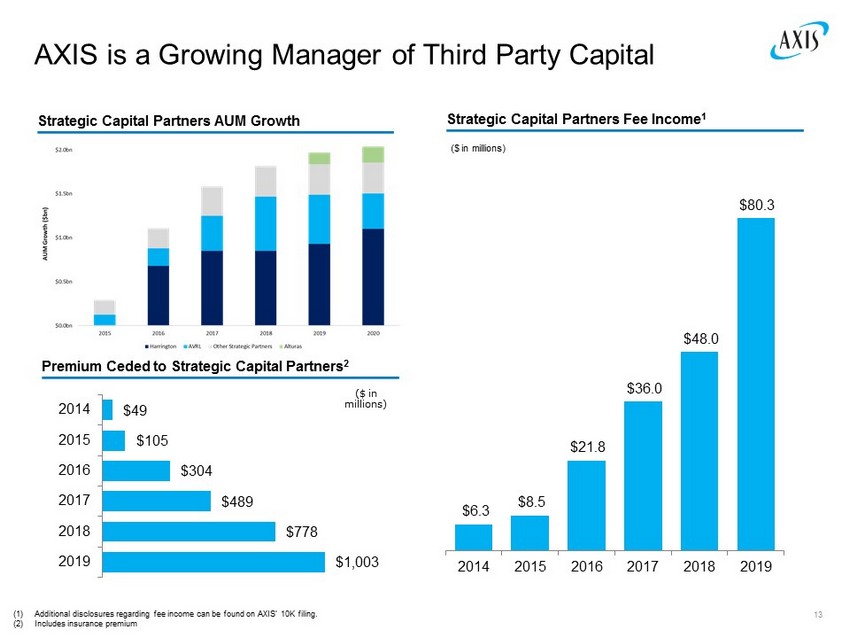
AXIS is a Growing Manager of Third Party Capital Strategic Capital Partners Fee Income 1 Strategic Capital Partners AUM Growth Premium Ceded to Strategic Capital Partners 2 ($ in millions) ($ in millions) $1,003 $778 $489 $304 $105 $49 2019 2018 2017 2016 2015 2014 (1) Additional disclosures regarding fee income can be found on AXIS’ 10K filing. (2) Includes insurance premium 13 $6.3 $8.5 $21.8 $36.0 $48.0 $80.3 2014 2015 2016 2017 2018 2019
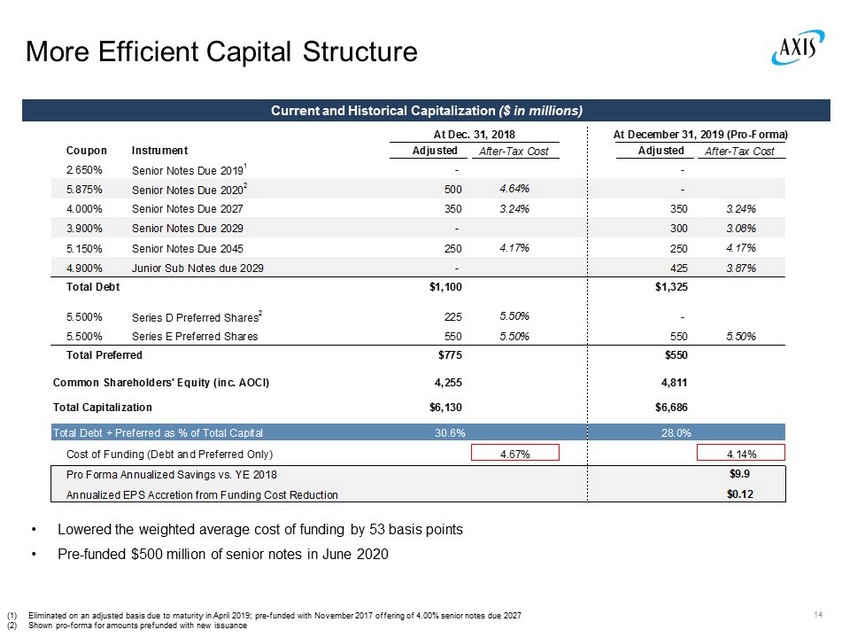
14 More Efficient Capital Structure Current and Historical Capitalization ($ in millions) (1) Eliminated on an adjusted basis due to maturity in April 2019; pre - funded with November 2017 offering of 4.00% senior notes due 2027 (2) Shown pro - forma for amounts prefunded with new issuance • Lowered the weighted average cost of funding by 53 basis points • Pre - funded $500 million of senior notes in June 2020 At Dec. 31, 2018 At December 31, 2019 (Pro-Forma) Coupon Instrument Adjusted After-Tax Cost Adjusted After-Tax Cost 2.650% Senior Notes Due 2019 1 - - 5.875% Senior Notes Due 2020 2 500 4.64% - 4.000% Senior Notes Due 2027 350 3.24% 350 3.24% 3.900% Senior Notes Due 2029 - 300 3.08% 5.150% Senior Notes Due 2045 250 4.17% 250 4.17% 4.900% Junior Sub Notes due 2029 - 425 3.87% Total Debt $1,100 $1,325 5.500% Series D Preferred Shares 2 225 5.50% - 5.500% Series E Preferred Shares 550 5.50% 550 5.50% Total Preferred $775 $550 Common Shareholders' Equity (inc. AOCI) 4,255 4,811 Total Capitalization $6,130 $6,686 Total Debt + Preferred as % of Total Capital 30.6% 28.0% Cost of Funding (Debt and Preferred Only) 4.67% 4.14% Pro Forma Annualized Savings vs. YE 2018 $9.9 Annualized EPS Accretion from Funding Cost Reduction $0.12
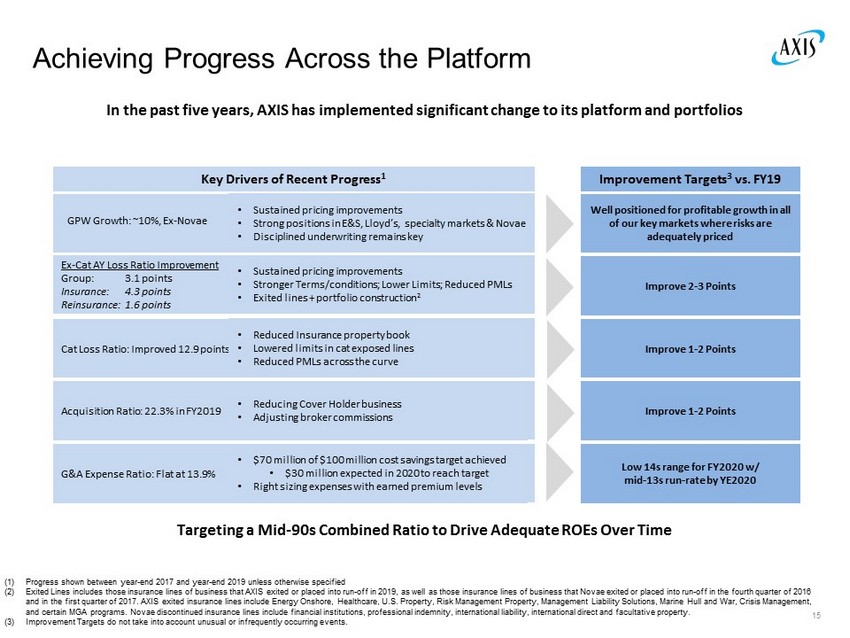
Key Drivers of Recent Progress 1 Cat Loss Ratio: Improved 12.9 points Acquisition Ratio: 22.3% in FY2019 G&A Expense Ratio: Flat at 13.9% GPW Growth: ~10%, Ex - Novae Achieving Progress Across the Platform In the past five years, AXIS has implemented significant change to its platform and portfolios 15 Improve 2 - 3 Points Improvement Targets 3 vs. FY19 • Reduced Insurance property book • Lowered limits in cat exposed lines • Reduced PMLs across the curve • Reducing Cover Holder business • Adjusting broker commissions • $70 million of $100 million cost savings target achieved • $30 million expected in 2020 to reach target • Right sizing expenses with earned premium levels Improve 1 - 2 Points 13.5% Run - Rate by YE2020 Ex - Cat AY Loss Ratio Improvement Group: 3.1 points Insurance: 4.3 points Reinsurance: 1.6 points • Sustained pricing improvements • Stronger Terms/conditions; Lower Limits; Reduced PMLs • Exited lines + portfolio construction 2 (1) Progress shown between year - end 2017 and year - end 2019 unless otherwise specified (2) Exited Lines includes those insurance lines of business that AXIS exited or placed into run - off in 2019, as well as those insura nce lines of business that Novae exited or placed into run - off in the fourth quarter of 2016 and in the first quarter of 2017. AXIS exited insurance lines include Energy Onshore, Healthcare, U.S. Property, Risk Managem ent Property, Management Liability Solutions, Marine Hull and War, Crisis Management, and certain MGA programs. Novae discontinued insurance lines include financial institutions, professional indemnity, internat ion al liability, international direct and facultative property. (3) Improvement Targets do not take into account unusual or infrequently occurring events. Improve 1 - 2 Points Low 14s range for FY2020 w/ mid - 13s run - rate by YE2020 Improve 1 - 2 Points Well positioned for profitable growth in all of our key markets where risks are adequately priced Targeting a Mid - 90s Combined Ratio to Drive Adequate ROEs Over Time • Sustained pricing improvements • Strong positions in E&S, Lloyd’s, specialty markets & Novae • Disciplined underwriting remains key
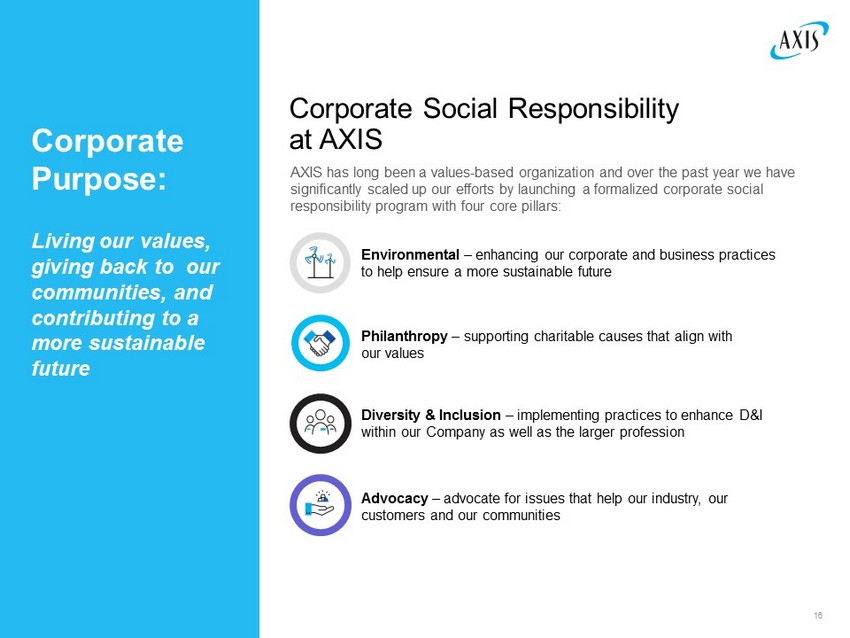
Corporate Social Responsibility at AXIS Philanthropy – supporting charitable causes that align with our values Diversity & Inclusion – implementing practices to enhance D&I within our Company as well as the larger profession Corporate Purpose: Living our values, giving back to our communities, and contributing to a more sustainable future Advocacy – advocate for issues that help our industry, our customers and our communities AXIS has long been a values - based organization and over the past year we have significantly scaled up our efforts by launching a formalized corporate social responsibility program with four core pillars: Environmental – enhancing our corporate and business practices to help ensure a more sustainable future 16
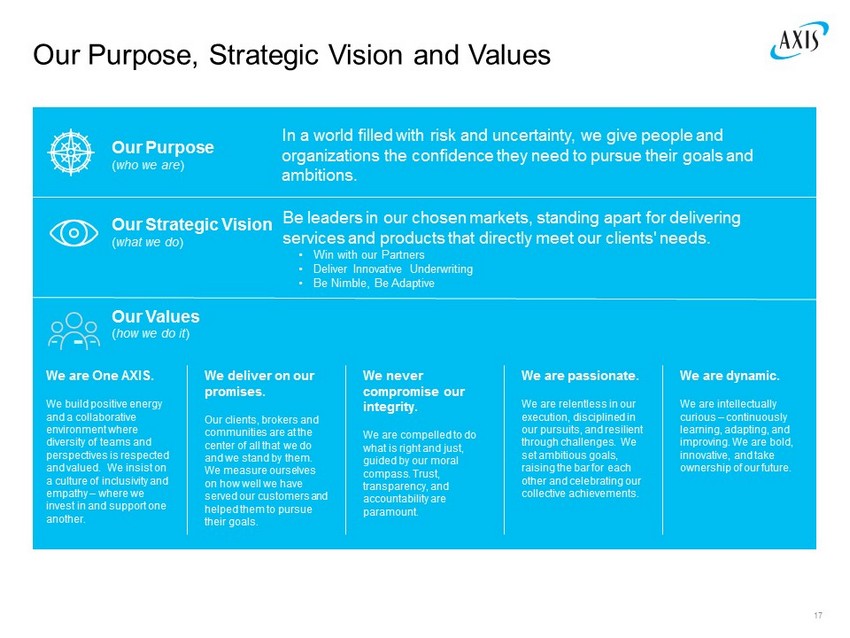
Our Purpose, Strategic Vision and Values 17 Our Purpose ( who we are ) Our Strategic Vision ( what we do ) Our Values ( how we do it ) We are One AXIS. We build positive energy and a collaborative environment where diversity of teams and perspectives is respected and valued. We insist on a culture of inclusivity and empathy – where we invest in and support one another. We deliver on our promises. Our clients, brokers and communities are at the center of all that we do and we stand by them. We measure ourselves on how well we have served our customers and helped them to pursue their goals. We never compromise our integrity. We are compelled to do what is right and just, guided by our moral compass. Trust, transparency, and accountability are paramount. We are passionate. We are relentless in our execution, disciplined in our pursuits, and resilient through challenges. We set ambitious goals, raising the bar for each other and celebrating our collective achievements. We are dynamic. We are intellectually curious – continuously learning, adapting, and improving. We are bold, innovative, and take ownership of our future. In a world filled with risk and uncertainty, we give people and organizations the confidence they need to pursue their goals and ambitions. Be leaders in our chosen markets, standing apart for delivering services and products that directly meet our clients' needs. • Win with our Partners • Deliver Innovative Underwriting • Be Nimble, Be Adaptive
Conclusion AXIS is a leading specialty insurer and global reinsurer Strong franchise with superior position in chosen specialty markets to maximize benefits of current pricing momentum Pace of underwriting margin improvement should accelerate given ongoing portfolio improvements and acceleration in pricing Enhanced use of reinsurance, retro and third party capital driving better risk adjusted returns with lower volatility Building a foundation for a stronger, more stable underwriter of specialty risks 18
19