Exhibit 99.1

Investor Meetings February/March 2019

Safe Harbor Statement Statements in this presentation that are not historical facts, including statements regarding our estimates, beliefs, expecta tio ns, intentions, strategies or projections, may be “forward - looking statements” within the meaning of the U.S. federal securities laws, including the Private Securities Lit igation Reform Act of 1995. We intend these forward - looking statements to be covered by the safe harbor provisions for forward - looking statements in the United States securities laws. In some cases, these statements can be identified by the use of forward - looking words such as “may,” “should,” “could,” “will,” “anticipate,” “ estimate,” “expect,” “plan,” “believe,” “predict,” “potential,” “intend” or similar expressions. Our expectations are not guarantees and are based on currently avail abl e competitive, financial and economic data along with our operating plans. Forward - looking statements contained in this presentation may include, but are not limited to, information regarding our estimates of losses related to catastrophes and other large losses, measurements of potential losses in the fair value of our in vestment portfolio, our expectations regarding pricing and other market conditions and valuations of the potential impact of movements in interest rates, equity p ric es, credit spreads and foreign currency rates. Forward - looking statements only reflect our expectations and are not guarantees of performance. Accordingly, there are or will b e important factors that could cause actual results to differ materially from those indicated in such statements. We believe that these factors include, but are n ot limited to, the following: the cyclical nature of the (re)insurance business leading to periods with excess underwriting capacity and unfavorable premium rates; increased competition and consolidation in the (re) insurance industry; general economic, capital and credit market conditions; the occurrence and magnitude of natural and man - made disasters; losses from war, terrorism and political unrest or other unanticipated losses; a decline in our ratings with rating agencies; actual claims exceeding our loss reserves; the effects of emerging claims, coverage and regulatory issues, including uncertainty related to coverage definitions, limits, terms and conditions; our inability to purchase reinsurance or collect amounts due to us; fluctuations in interest rates, credit spreads, equity prices and/or currency values; the failure of any of the loss limitation methods we employ; our inability to purchase reinsurance or collect amounts due to us; the use of industry catastrophe models and changes to these models; changes in accounting policies or practices; the failure to realize the expected benefits or synergies relating to the Company’s transformation initiative and the integration of Novae Group plc; the failure of our cedants to adequately evaluate risks; the breach by third parties in our program business of their obligations to us; difficulties with technology and/or data security; changes in the political environment of certain countries in which we operate or underwrite business including the United Kingdom's expected withdrawal from the European Union; inability to obtain additional capital on favorable terms, or at all; inability to obtain necessary credit; changes in governmental regulations and potential government intervention in our industry; failure to comply with certain laws and regulations relating to sanctions and foreign corrupt practices; the loss of business provided to us by our major brokers and credit risk due to our reliance on brokers; the failure of our policyholders and intermediaries to pay premiums; the loss of one or more key executives; changes in tax laws; and the other factors set forth in our most recent Annual report on Form 10 - K filed with the Securities and Exchange Commission ("SEC"), as such factors may be updated from time to time in our periodic and other filings with the SEC, which are accessible on the SEC's website at www.sec.gov

Target Leadership in Global Specialty Risks Targeting Top - quintile profitability with industry average volatility Hybrid model – Insurance & Reinsurance Franchise anchored in leadership positions in key markets and distribution relationships Strong relationships with distributors & clients based on expertise, service, agility and claims Focus on markets where we have demonstrable relevance, scale and path for profitable growth Strategic risk financing capabilities to match the right risk with the right capital Consistent Commitment to Our Strategy 3 Commitment to superior capabilities and talent
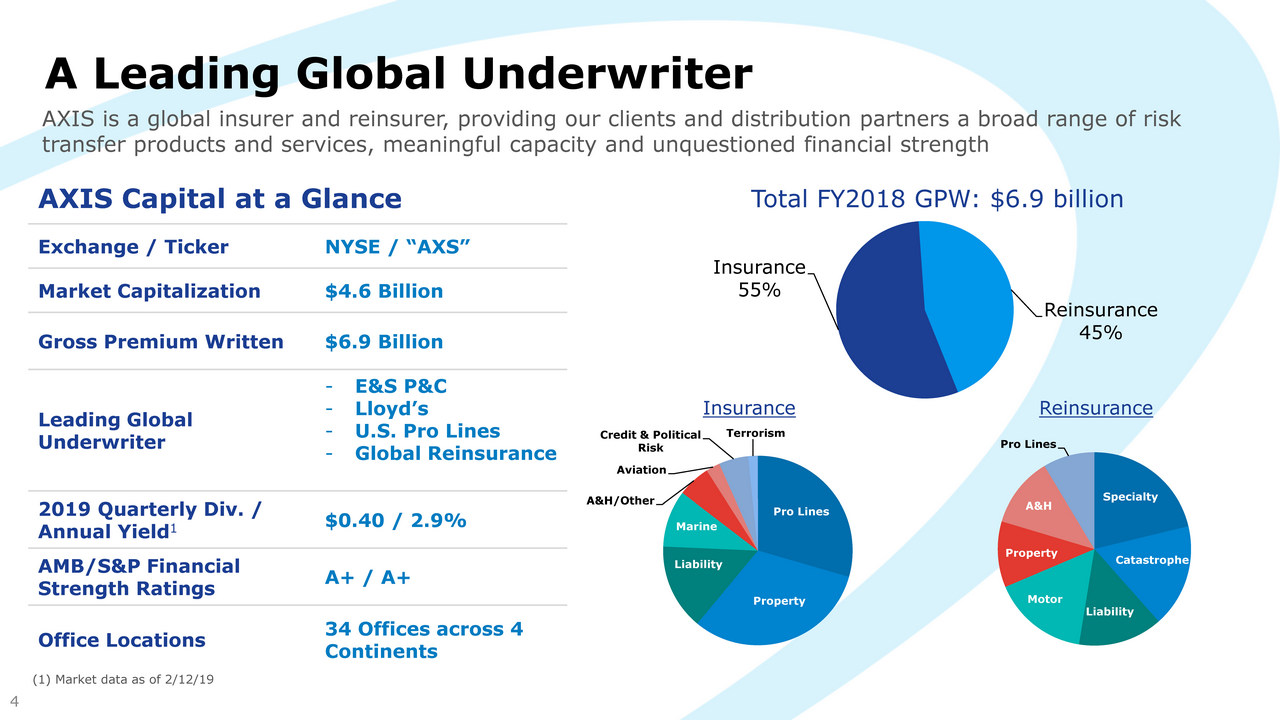
AXIS Capital at a Glance Exchange / Ticker NYSE / “AXS” Market Capitalization $4.6 Billion Gross Premium Written $ 6.9 Billion Leading Global Underwriter - E&S P&C - Lloyd’s - U.S . Pro Lines - Global Reinsurance 2019 Quarterly Div. / Annual Yield 1 $ 0.40 / 2.9% AMB/S&P Financial Strength Ratings A+ / A+ Office Locations 34 Offices across 4 Continents Pro Lines Property Liability Marine A&H/Other Aviation Credit & Political Risk Terrorism A Leading Global Underwriter (1) Market data as of 2/12/19 AXIS is a global insurer and reinsurer, providing our clients and distribution partners a broad range of risk transfer products and services, meaningful capacity and unquestioned financial strength Insurance 55% Reinsurance 45% Total FY2018 GPW : $ 6.9 billion 4 Specialty Catastrophe Liability Motor Property A&H Pro Lines Insurance Reinsurance
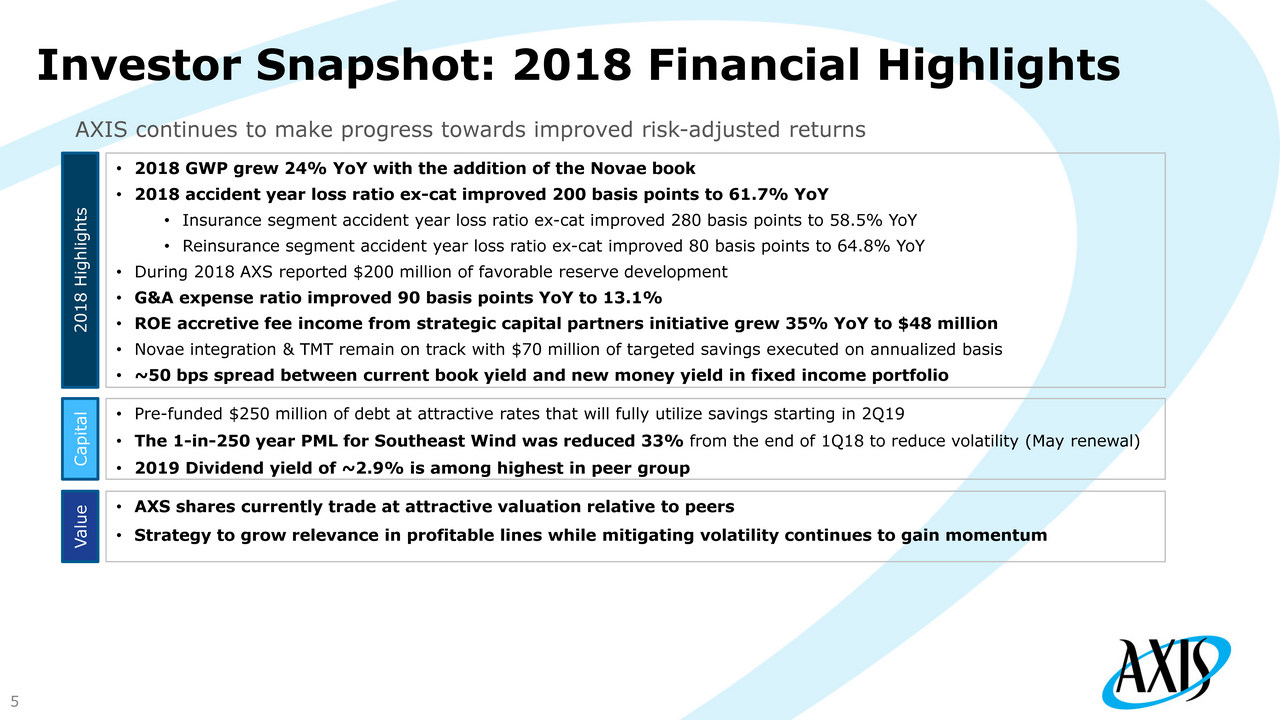
Investor Snapshot: 2018 Financial Highlights 2018 Highlights • 2018 GWP grew 24% YoY with the addition of the Novae book • 2018 accident year loss ratio ex - cat improved 200 basis points to 61.7% YoY • Insurance segment accident year loss ratio ex - cat improved 280 basis points to 58.5% YoY • Reinsurance segment accident year loss ratio ex - cat improved 80 basis points to 64.8% YoY • During 2018 AXS reported $200 million of favorable reserve development • G&A expense ratio improved 90 basis points YoY to 13.1% • ROE accretive fee income from strategic capital partners initiative grew 35% YoY to $48 million • Novae integration & TMT remain on track with $70 million of targeted savings executed on annualized basis • ~50 bps spread between current book yield and new money yield in fixed income portfolio Value Capital • Pre - funded $250 million of debt at attractive rates that will fully utilize savings starting in 2Q19 • The 1 - in - 250 year PML for Southeast Wind was reduced 33% from the end of 1Q18 to reduce volatility (May renewal) • 2019 Dividend yield of ~2.9% is among highest in peer group • AXS shares currently trade at attractive valuation relative to peers • Strategy to grow relevance in profitable lines while mitigating volatility continues to gain momentum AXIS continues to make progress towards improved risk - adjusted returns 5
2018: A Year of Operational Achievements Focus on disciplined underwriting supported by investments in differentiated products, talent, technology and client service • Novae integration largely complete • Top 10 Lloyd’s insurer • ~75% of the way through executing our run - rate cost savings of $60 million • Successful rollout of transformation initiative • On track for $40 million of savings net of internal reinvestments in people and data & analytics • Creation of Global Underwriting & Analytics team • Launched AXIS Digital Ventures • Within Insurance created a consolidated Global Cyber & Technology Unit • Merged A&H into the Insurance and Reinsurance segments • New service model for Finance & IT • Portfolio Optimization • Disciplined underwriting actions to improve portfolio • Lowered net catastrophe exposure • Net acquirer of top talent 6
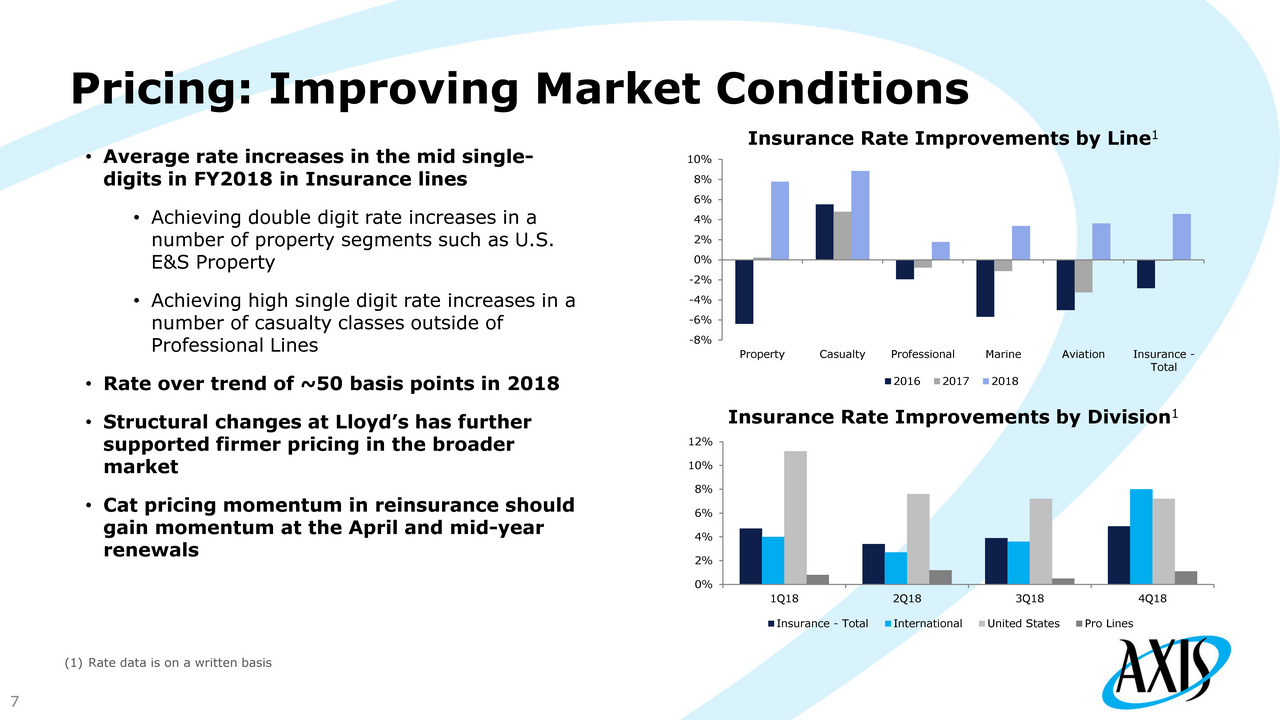
Pricing: Improving Market Conditions • Average rate increases in the mid single - digits in FY2018 in Insurance lines • Achieving double digit rate increases in a number of property segments such as U.S. E&S Property • Achieving high single digit rate increases in a number of casualty classes outside of Professional Lines • Rate over trend of ~50 basis points in 2018 • Structural changes at Lloyd’s has further supported firmer pricing in the broader market • Cat pricing momentum in reinsurance should gain momentum at the April and mid - year renewals Insurance Rate Improvements by Line 1 (1) Rate data is on a written basis Insurance Rate Improvements by Division 1 0% 2% 4% 6% 8% 10% 12% 1Q18 2Q18 3Q18 4Q18 Insurance - Total International United States Pro Lines 7 -8% -6% -4% -2% 0% 2% 4% 6% 8% 10% Property Casualty Professional Marine Aviation Insurance - Total 2016 2017 2018
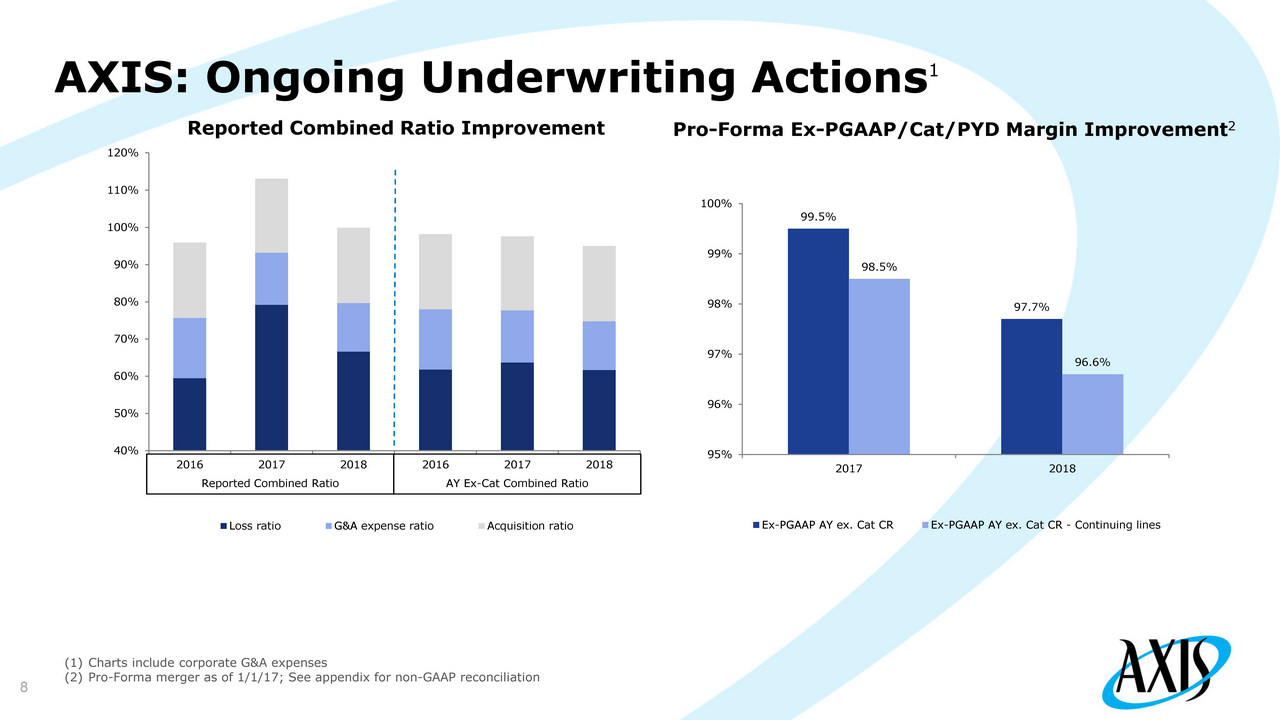
AXIS: Ongoing Underwriting Actions 1 8 Pro - Forma Ex - PGAAP/Cat/PYD Margin Improvement 2 40% 50% 60% 70% 80% 90% 100% 110% 120% 2016 2017 2018 2016 2017 2018 Loss ratio G&A expense ratio Acquisition ratio Reported Combined Ratio AY Ex - Cat Combined Ratio Reported Combined Ratio Improvement (1) Charts include corporate G&A expenses (2) Pro - Forma merger as of 1/1/17; See appendix for non - GAAP reconciliation 99.5% 97.7% 98.5% 96.6% 95% 96% 97% 98% 99% 100% 2017 2018 Ex-PGAAP AY ex. Cat CR Ex-PGAAP AY ex. Cat CR - Continuing lines
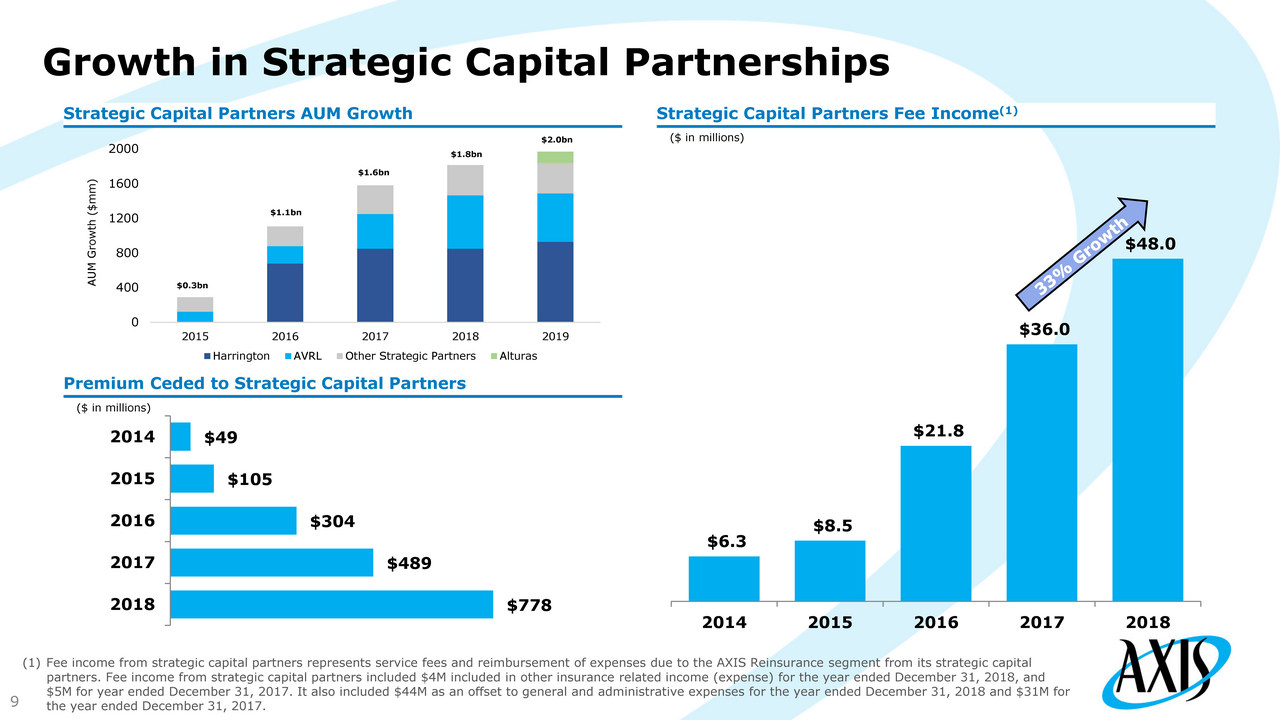
Growth in Strategic Capital Partnerships 9 Strategic Capital Partners Fee Income (1) Strategic Capital Partners AUM Growth Premium Ceded to Strategic Capital Partners ($ in millions) ($ in millions) $6.3 $8.5 $21.8 $36.0 $48.0 2014 2015 2016 2017 2018 $778 $489 $304 $105 $49 2018 2017 2016 2015 2014 (1) Fee income from strategic capital partners represents service fees and reimbursement of expenses due to the AXIS Reinsurance seg ment from its strategic capital partners. Fee income from strategic capital partners included $4M included in other insurance related income (expense) for the year ended December 31, 2018, and $5M for year ended December 31, 2017. It also included $44M as an offset to general and administrative expenses for the year ended December 31, 2018 and $31M for the year ended December 31, 2017. 0 400 800 1200 1600 2000 2015 2016 2017 2018 2019 AUM Growth ($mm) Harrington AVRL Other Strategic Partners Alturas $1.1bn $1.6bn $1.8bn $2.0bn $0.3bn
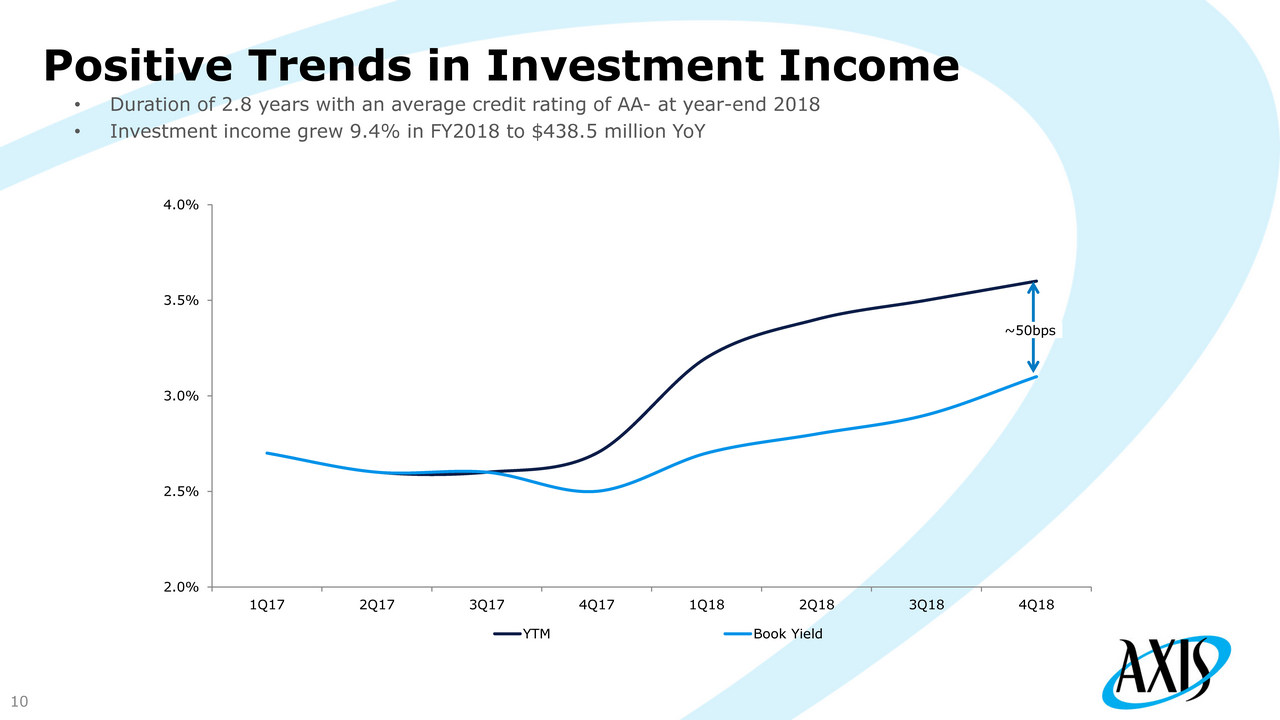
Positive Trends in Investment Income 10 2.0% 2.5% 3.0% 3.5% 4.0% 1Q17 2Q17 3Q17 4Q17 1Q18 2Q18 3Q18 4Q18 YTM Book Yield • Duration of 2.8 years with an average credit rating of AA - at year - end 2018 • Investment income grew 9.4% in FY2018 to $438.5 million YoY ~50bps
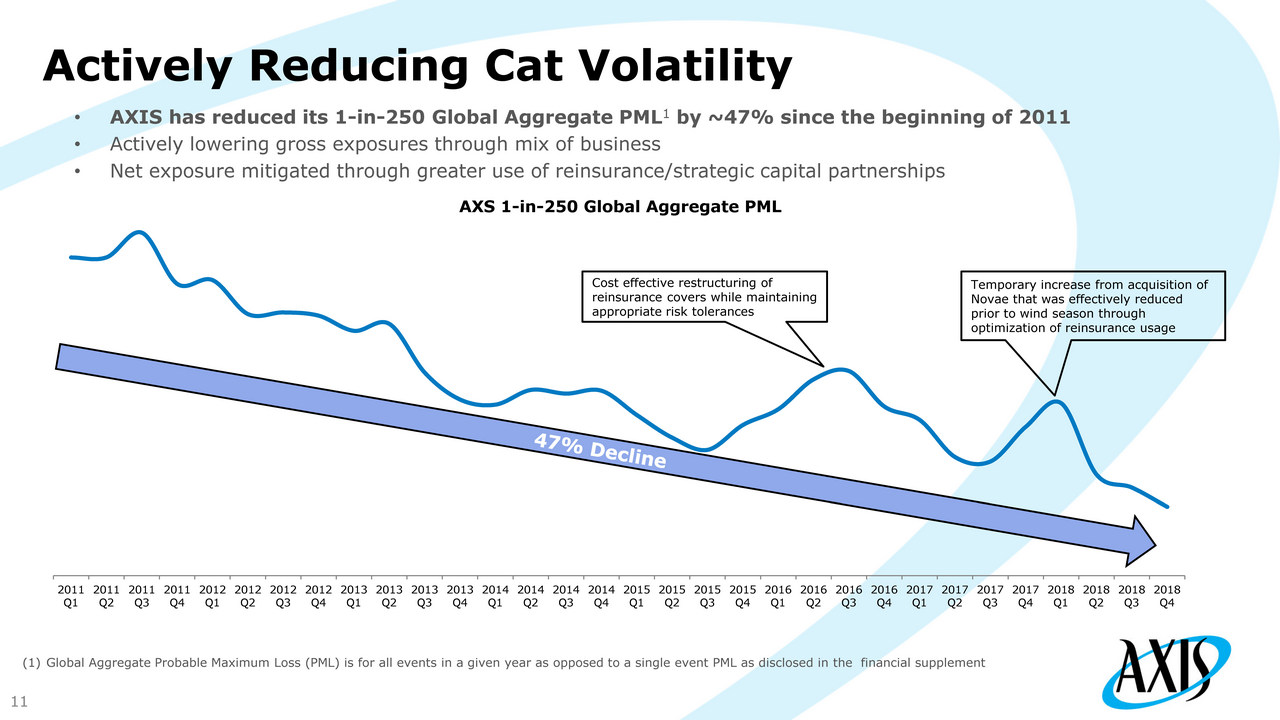
Actively Reducing Cat Volatility 11 • AXIS has reduced its 1 - in - 250 Global Aggregate PML 1 by ~47% since the beginning of 2011 • Actively lowering gross exposures through mix of business • Net exposure mitigated through greater use of reinsurance/strategic capital partnerships (1) Global Aggregate Probable Maximum Loss (PML) is for all events in a given year as opposed to a single event PML as disclosed in the financial supplement 2011 Q1 2011 Q2 2011 Q3 2011 Q4 2012 Q1 2012 Q2 2012 Q3 2012 Q4 2013 Q1 2013 Q2 2013 Q3 2013 Q4 2014 Q1 2014 Q2 2014 Q3 2014 Q4 2015 Q1 2015 Q2 2015 Q3 2015 Q4 2016 Q1 2016 Q2 2016 Q3 2016 Q4 2017 Q1 2017 Q2 2017 Q3 2017 Q4 2018 Q1 2018 Q2 2018 Q3 2018 Q4 AXS 1 - in - 250 Global Aggregate PML Temporary increase from acquisition of Novae that was effectively reduced prior to wind season through optimization of reinsurance usage Cost effective restructuring of reinsurance covers while maintaining appropriate risk tolerances
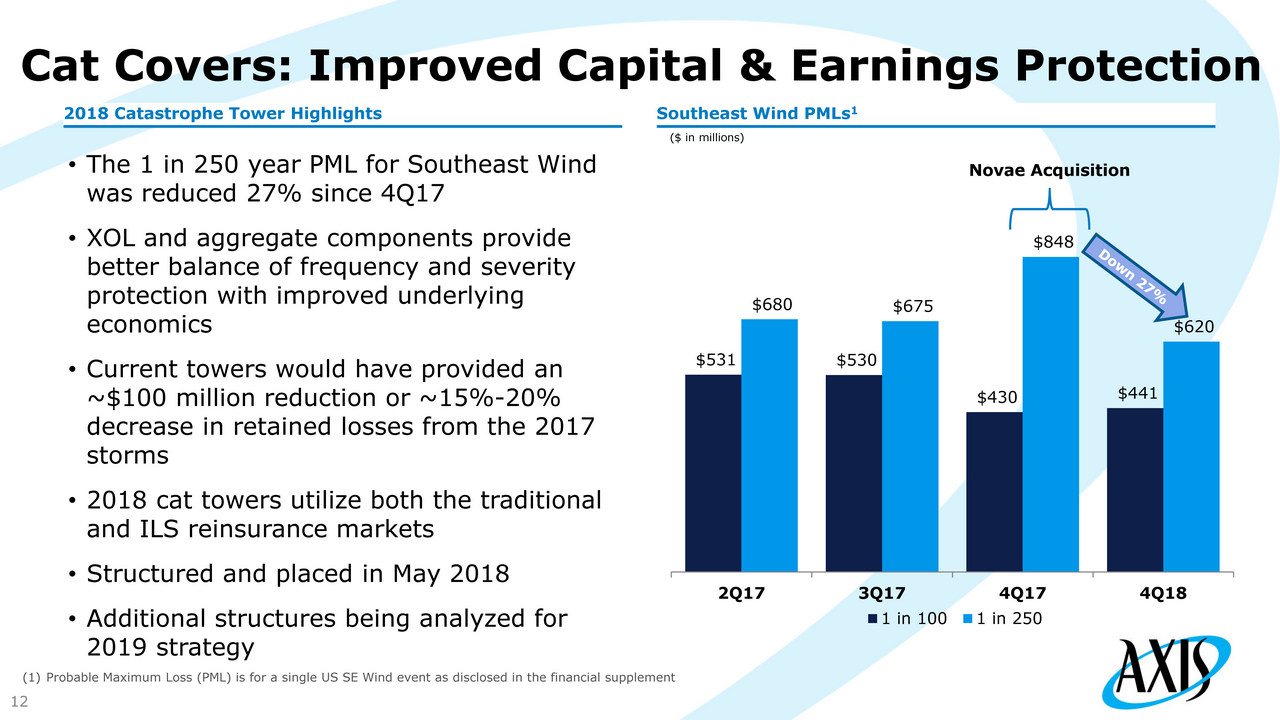
Cat Covers: Improved Capital & Earnings Protection 12 Southeast Wind PMLs 1 2018 Catastrophe Tower Highlights ($ in millions) $531 $530 $430 $441 $680 $675 $848 $620 2Q17 3Q17 4Q17 4Q18 1 in 100 1 in 250 Novae Acquisition • The 1 in 250 year PML for Southeast Wind was reduced 27% since 4Q17 • XOL and aggregate components provide better balance of frequency and severity protection with improved underlying economics • Current towers would have provided an ~$ 100 million reduction or ~15% - 20% decrease in retained losses from the 2017 storms • 2018 cat towers utilize both the traditional and ILS reinsurance markets • Structured and placed in May 2018 • Additional structures being analyzed for 2019 strategy (1) Probable Maximum Loss (PML) is for a single US SE Wind event as disclosed in the financial supplement
Conclusion Transformed AXIS into a relevant player in core specialty markets Superior attributes deliver more defensible market position Substantial progress in transitioning portfolio for greater balance and profitability, with lower volatility Actions already taken will lead to stronger performance in 2018 and beyond Positioned for growth and profitability 13
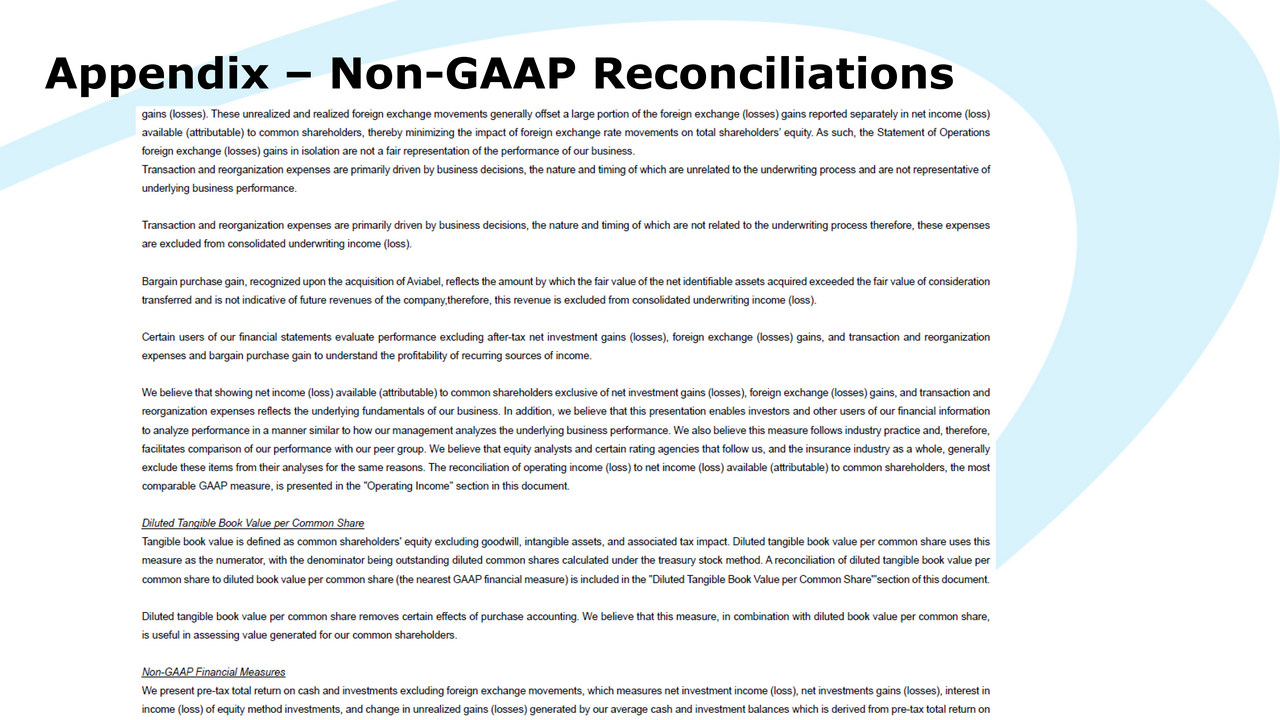
Appendix – Non - GAAP Reconciliations
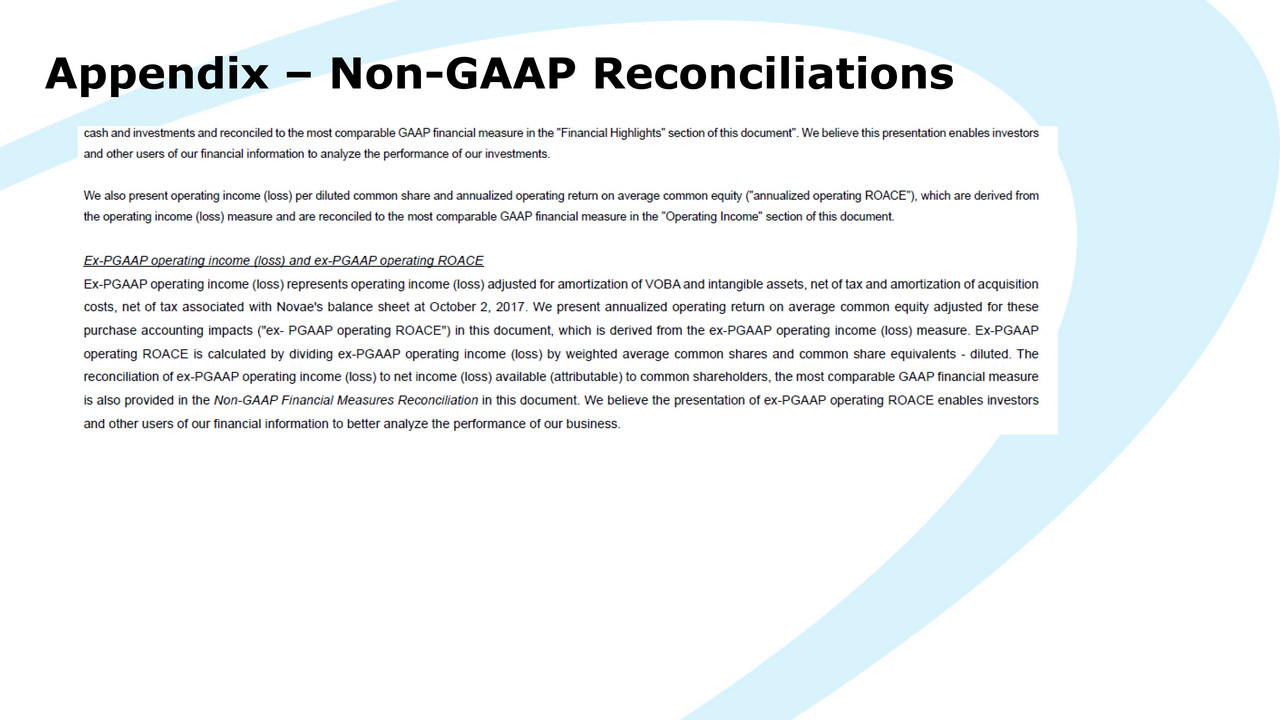
Appendix – Non - GAAP Reconciliations
Appendix – Non - GAAP Reconciliations
Appendix – Non - GAAP Reconciliations
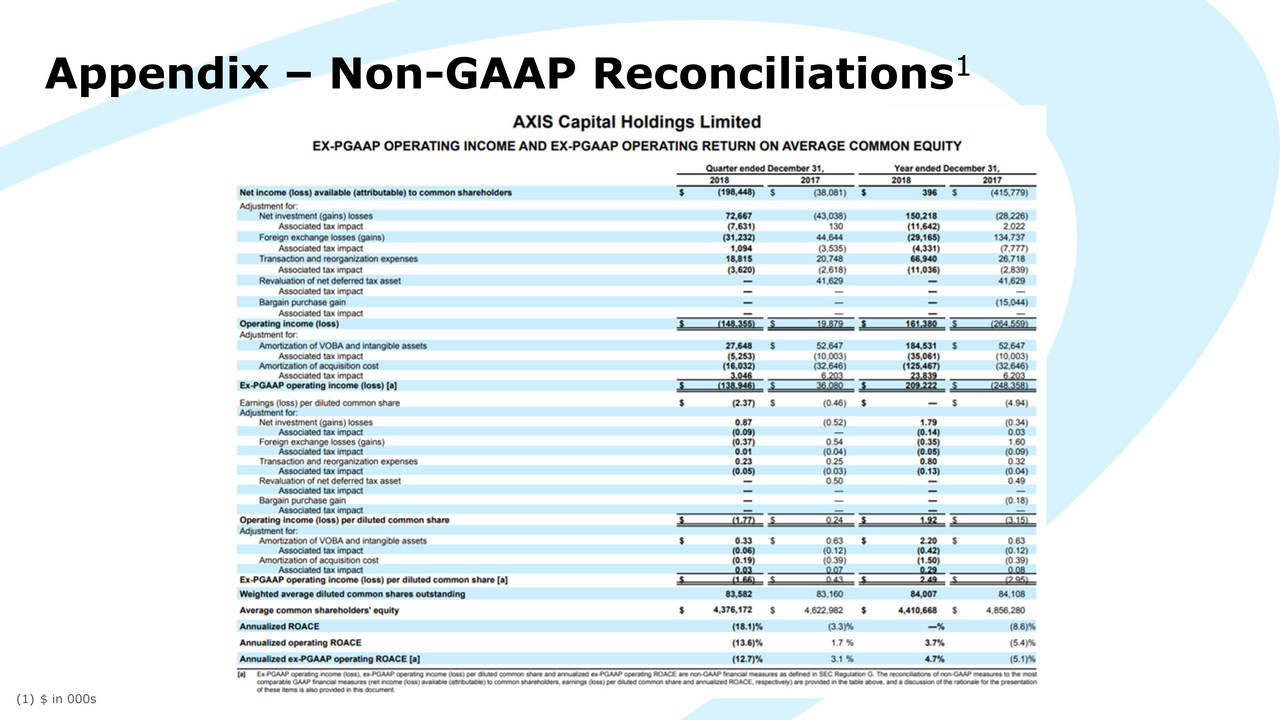
Appendix – Non - GAAP Reconciliations 1 (1) $ in 000s
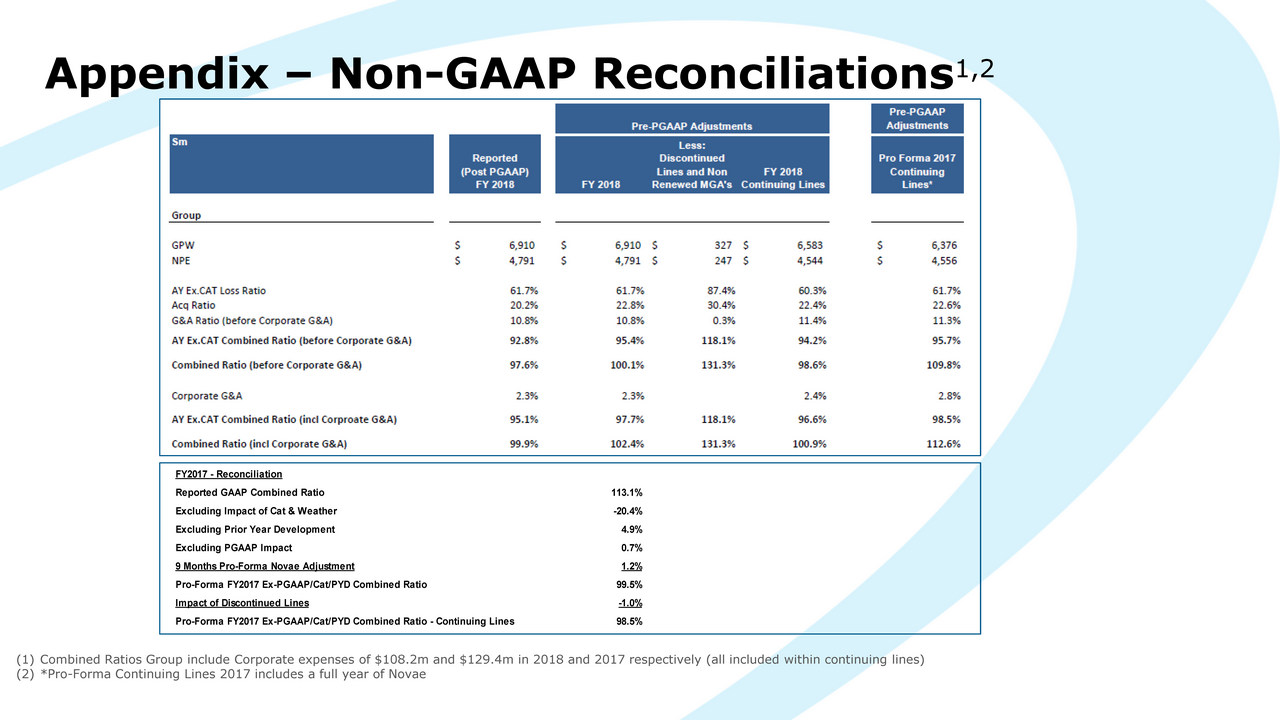
Appendix – Non - GAAP Reconciliations 1,2 (1) Combined Ratios Group include Corporate expenses of $108.2m and $129.4m in 2018 and 2017 respectively (all included within co nti nuing lines ) (2) *Pro - Forma Continuing Lines 2017 includes a full year of Novae FY2017 - Reconciliation Reported GAAP Combined Ratio 113.1% Excluding Impact of Cat & Weather -20.4% Excluding Prior Year Development 4.9% Excluding PGAAP Impact 0.7% 9 Months Pro-Forma Novae Adjustment 1.2% Pro-Forma FY2017 Ex-PGAAP/Cat/PYD Combined Ratio 99.5% Impact of Discontinued Lines -1.0% Pro-Forma FY2017 Ex-PGAAP/Cat/PYD Combined Ratio - Continuing Lines 98.5%