Exhibit 99.1

Investor Meetings May 2019

Safe Harbor Statement FORWARD - LOOKING STATEMENTS: This document contains “forward - looking statements” within the meaning of section 27A of the Securities Act of 1933 and section 21E of the Securities Exchange Act of 1934. All statements, other than statements of historical facts included in this document, including statements regarding our estimates , b eliefs, expectations, intentions, strategies or projections, are "forward - looking statements". We intend these forward - looking statements to be covered by the safe harbor provisions for for ward - looking statements in the United States federal securities laws. In some cases, these statements can be identified by the use of forward - looking words such as “may,” “should,” “could,” “anticipate,” “estimate,” “expect,” “plan,” “believe,” “predict,” “potential,” “intend” or similar expressions. These forward - looking statements are not historical facts, a nd are based upon current expectations, estimates and projections, and various assumptions, many of which, by their nature, are inherently uncertain and beyond management's contro l. Forward - looking statements contained in this document may include, but are not limited to, information regarding our estimates o f losses related to catastrophes and other large losses, measurements of potential losses in the fair market value of our investment portfolio, our expectations regarding the perform anc e of our business, our financial results, our liquidity and capital resources, the outcome of our strategic initiatives, our expectations regarding estimated synergies and the succe ss of the integration of acquired entities, our expectations regarding the estimated benefits and synergies related to the Company's transformation program, our expectations regarding pricing, rate and other market conditions, our growth prospects, and valuations of the potential impact of movements in interest rates, equity securities' prices, credit spreads a nd foreign currency rates. Forward - looking statements only reflect our expectations and are not guarantees of performance. These statements involve risks, uncertainties an d assumptions. Accordingly, there are or will be important factors that could cause actual results to differ materially from those indicated in such statements. We be lieve that these factors include, but are not limited to, the following: • the cyclical nature of the re(insurance) business leading to periods with excess underwriting capacity and unfavorable premium rates, • the occurrence and magnitude of natural and man - made disasters, • the impact of global climate change on our business, including the possibility that we do not adequately assess or reserve for the increased frequency and severity of natural catastrophes, • losses from war, terrorism and political unrest or other unanticipated losses, • actual claims exceeding our loss reserves, • general economic, capital and credit market conditions, • the failure of any of the loss limitation methods we employ, • the effects of emerging claims, coverage and regulatory issues, including uncertainty related to coverage definitions, limits, terms and conditions, • our inability to purchase reinsurance or collect amounts due to us, • the breach by third parties in our program business of their obligations to us, • difficulties with technology and/or data security, • the failure of our policyholders and intermediaries to pay premiums, • the failure of our cedants to adequately evaluate risks, • inability to obtain additional capital on favorable terms, or at all, • the loss of one or more key executives, • a decline in our ratings with rating agencies, • loss of business provided to us by our major brokers and credit risk due to our reliance on brokers, • changes in accounting policies or practices, • the use of industry catastrophe models and changes to these models, • changes in governmental regulations and potential government intervention in our industry, • failure to comply with certain laws and regulations relating to sanctions and foreign corrupt practices, • increased competition, changes in the political environment of certain countries in which we operate or underwrite business including the United Kingdom's expected withdrawal from the European Union, • fluctuations in interest rates, credit spreads, equity securities' prices and/or currency values, • the failure to successfully integrate acquired businesses or realize the expected synergies resulting from such acquisitions, the failure to realize the expected benefits or synergies relating to the Company's transformation initiative, • changes in tax laws, and • the other factors including but not limited to those described under Item 1A, 'Risk Factors' and Item 7, 'Management's Discussion and Analysis of Financial Condition and Results of Operations' in our most recent Annual Report on Form 10 - K, filed with the Securities and Exchange Commission ("SEC"), as those factors may be updated from time to time in our periodic and other filings with the SEC, which are accessible on the SEC's website at www.sec.gov . • We undertake no obligation to update or revise publicly any forward - looking statements, whether as a result of new information, future events or otherwise.
Target Leadership in Global Specialty Risks Targeting Top - quintile profitability with industry average volatility Hybrid model – Insurance & Reinsurance Franchise anchored in leadership positions in key markets and distribution relationships Strong relationships with distributors & clients based on expertise, service, agility and claims Focus on markets where we have demonstrable relevance, scale and path for profitable growth Strategic risk financing capabilities to match the right risk with the right capital Consistent Commitment to Our Strategy 3 Commitment to superior capabilities and talent
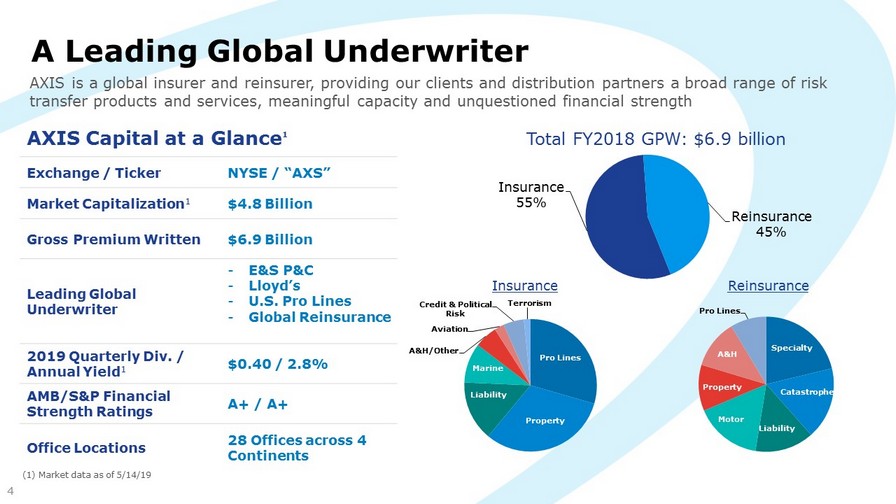
AXIS Capital at a Glance 1 Exchange / Ticker NYSE / “AXS” Market Capitalization 1 $ 4.8 Billion Gross Premium Written $ 6.9 Billion Leading Global Underwriter - E&S P&C - Lloyd’s - U.S . Pro Lines - Global Reinsurance 2019 Quarterly Div. / Annual Yield 1 $ 0.40 / 2.8% AMB/S&P Financial Strength Ratings A+ / A+ Office Locations 28 Offices across 4 Continents Pro Lines Property Liability Marine A&H/Other Aviation Credit & Political Risk Terrorism A Leading Global Underwriter (1) Market data as of 5/14/19 AXIS is a global insurer and reinsurer, providing our clients and distribution partners a broad range of risk transfer products and services, meaningful capacity and unquestioned financial strength Insurance 55% Reinsurance 45% Total FY2018 GPW : $ 6.9 billion 4 Specialty Catastrophe Liability Motor Property A&H Pro Lines Insurance Reinsurance

2018 S et the Stage to Drive Performance in 2019 & Beyond Focus on disciplined underwriting supported by investments in differentiated products, talent, technology and client service • Novae integration largely complete • Leading Lloyd’s insurer • ~80% of the way through executing our run - rate cost savings of $60 million • Successful rollout of transformation initiative • On track for $40 million of savings net of internal reinvestments in people and data & analytics • Creation of Global Underwriting & Analytics team • Launched AXIS Digital Ventures • Within Insurance created a consolidated Global Cyber & Technology Unit • Merged A&H into the Insurance and Reinsurance segments • New service model for Finance & IT • Portfolio Optimization • Disciplined underwriting actions to improve portfolio • Lowered net catastrophe exposure • Net acquirer of top talent 5

Investor Snapshot: 1Q19 Financial Highlights 1 1Q19 Highlights • 1Q19 GWP totaled $2.6 billion, ~flat YoY, driven by disciplined underwriting underpinned by strategic growth • 1Q19 accident year loss ratio improved 150bps YoY to 59.8% • Insurance segment accident year loss ratio improved 180 basis points YoY to 57.6% • Reinsurance segment accident year loss ratio improved 120 basis points YoY to 62.0% • 1Q19 fee income from strategic capital partners initiative grew 51% YoY to $20 million • ROE accretive fee income growth aided by the launching of new Alturas vehicles • Novae integration & transformation initiative remain on track with ~$70 million of targeted savings executed (annualized) • Net investment income grew 6.2% YoY to $107.3 million • Ex - PGAAP operating ROACE of 10.2%; Book value per diluted share grew 5.8% to $52.84 sequentially 2 Value Capital • Paid down $250 million of debt in April 2019 after pre - funding that debt at attractive rates • The 1 - in - 250 year PML for Southeast Wind was reduced 38% from the end of 1Q18 to reduce volatility • 2019 Dividend yield of ~ 2.8% is among highest in peer group • AXS shares currently trade at attractive valuation relative to peers • Strategy to grow relevance in profitable lines while mitigating volatility continues to gain momentum AXIS continues to make progress towards improved risk - adjusted returns 6 (1) Market data as of 5/14/19 (2) See reconciliation to non - GAAP financial measures in appendix; Ex - PGAAP operating return on average common equity ("ex - PGAAP operating ROACE") is a non - GAAP financial measures as defined in SEC Regulation G. The reconciliation to the most comparable GAAP financial measure annualized return on average common equ ity and a discussion of the rationale for the presentation of this non - GAAP financial measure is included later in this document.
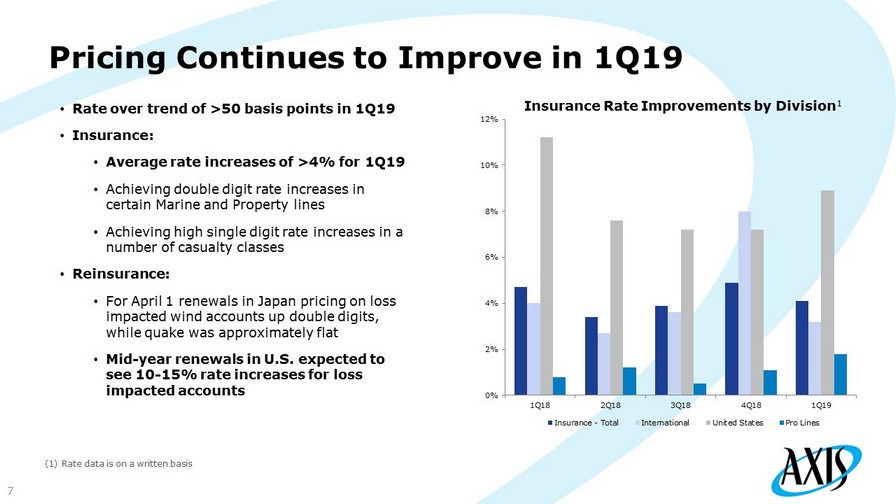
0% 2% 4% 6% 8% 10% 12% 1Q18 2Q18 3Q18 4Q18 1Q19 Insurance - Total International United States Pro Lines Pricing Continues to Improve in 1Q19 • Rate over trend of > 50 basis points in 1Q19 • Insurance: • Average rate increases of >4% for 1Q19 • Achieving double digit rate increases in certain Marine and Property lines • Achieving high single digit rate increases in a number of casualty classes • Reinsurance: • For April 1 renewals in Japan pricing on loss impacted wind accounts up double digits, while quake was approximately flat • Mid - year renewals in U.S. expected to see 10 - 15% rate increases for loss impacted accounts (1) Rate data is on a written basis Insurance Rate Improvements by Division 1 7
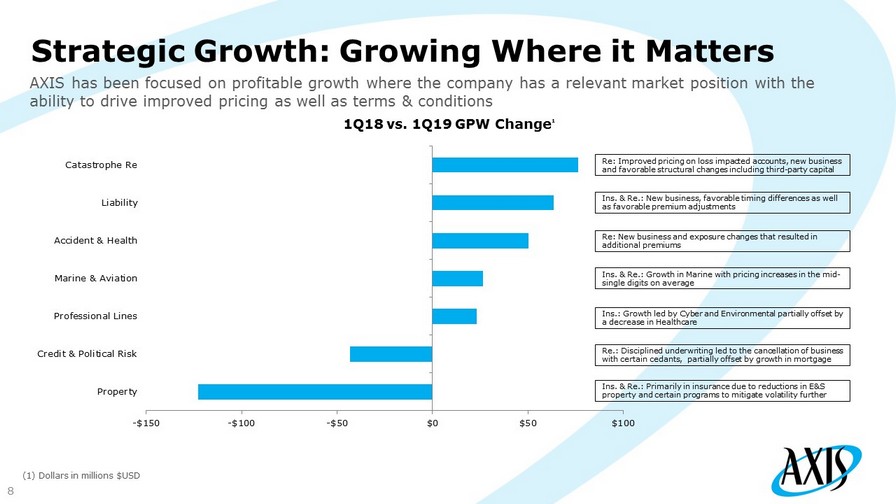
Strategic Growth: Growing Where it Matters (1) Dollars in millions $USD AXIS has been focused on profitable growth where the company has a relevant market position with the ability to drive improved pricing as well as terms & conditions 8 -$150 -$100 -$50 $0 $50 $100 Property Credit & Political Risk Professional Lines Marine & Aviation Accident & Health Liability Catastrophe Re 1Q18 vs. 1Q19 GPW Change 1 Re: Improved pricing on loss impacted accounts, new business and favorable structural changes including third - party capital Ins. & Re.: New business, favorable timing differences as well as favorable premium adjustments Re : New business and exposure changes that resulted in additional premiums Ins. & Re.: Growth in Marine with pricing increases in the mid - single digits on average Ins.: Growth led by Cyber and Environmental partially offset by a decrease in Healthcare Re.: Disciplined underwriting led to the cancellation of business with certain cedants , partially offset by growth in mortgage Ins. & Re.: Primarily in insurance due to reductions in E&S property and certain programs to mitigate volatility further
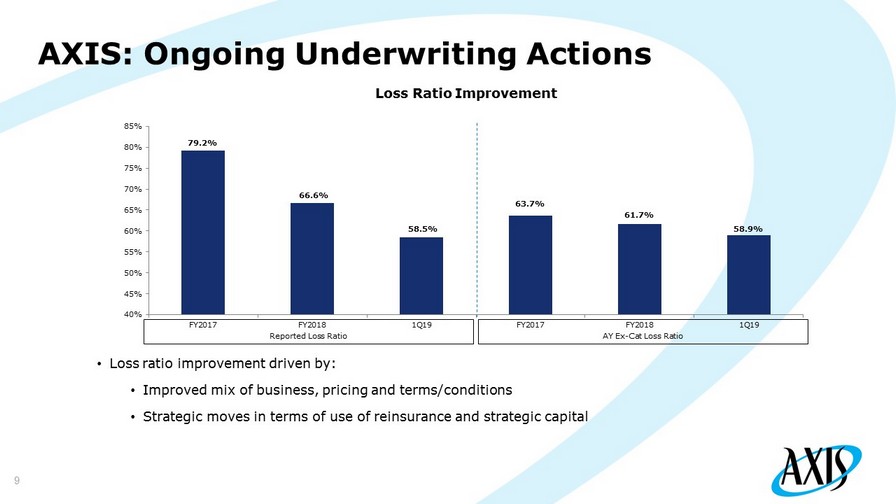
AXIS: Ongoing Underwriting Actions 9 Loss Ratio Improvement 79.2% 66.6% 58.5% 63.7% 61.7% 58.9% 40% 45% 50% 55% 60% 65% 70% 75% 80% 85% FY2017 FY2018 1Q19 FY2017 FY2018 1Q19 Reported Loss Ratio AY Ex - Cat Loss Ratio • Loss ratio improvement driven by: • Improved mix of business, pricing and terms/conditions • Strategic moves in terms of use of reinsurance and strategic capital
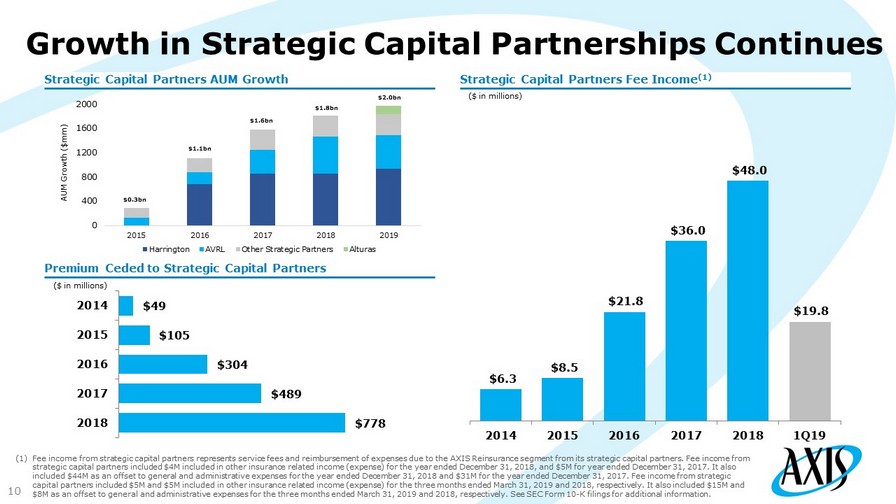
Growth in Strategic Capital Partnerships Continues 10 Strategic Capital Partners Fee Income (1) Strategic Capital Partners AUM Growth Premium Ceded to Strategic Capital Partners ($ in millions) ($ in millions) $6.3 $8.5 $21.8 $36.0 $48.0 $19.8 2014 2015 2016 2017 2018 1Q19 $778 $489 $304 $105 $49 2018 2017 2016 2015 2014 (1) Fee income from strategic capital partners represents service fees and reimbursement of expenses due to the AXIS Reinsurance seg ment from its strategic capital partners. Fee income from strategic capital partners included $4M included in other insurance related income (expense) for the year ended December 31, 2018, and $5M for year ended December 31, 2017. It also included $44M as an offset to general and administrative expenses for the year ended December 31, 2018 and $31M for the year ended December 31, 2017 . Fee income from strategic capital partners included $5M and $5M included in other insurance related income (expense) for the three months ended March 31, 2019 and 2018, respectively. It als o i ncluded $ 15 M and $ 8M as an offset to general and administrative expenses for the three months ended March 31, 2019 and 2018, respectively . See SEC Form 10 - K filings for additional information. 0 400 800 1200 1600 2000 2015 2016 2017 2018 2019 AUM Growth ($mm) Harrington AVRL Other Strategic Partners Alturas $1.1bn $1.6bn $1.8bn $2.0bn $0.3bn
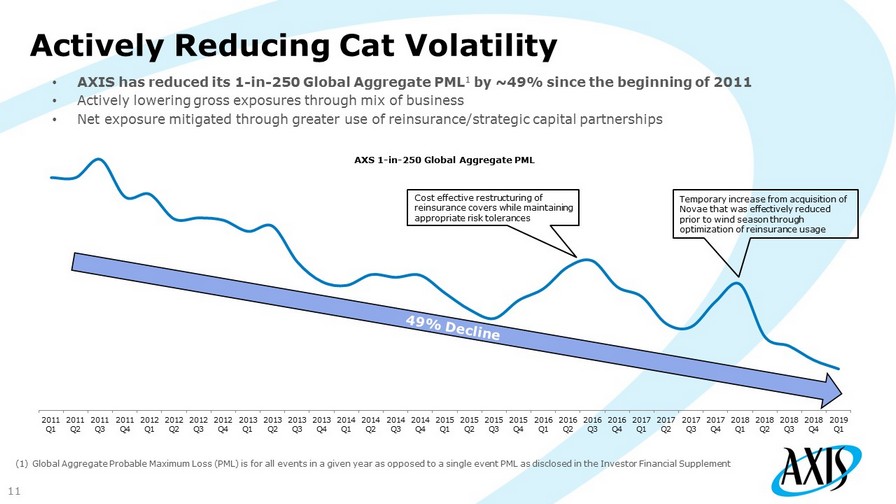
Actively Reducing Cat Volatility 11 • AXIS has reduced its 1 - in - 250 Global Aggregate PML 1 by ~49% since the beginning of 2011 • Actively lowering gross exposures through mix of business • Net exposure mitigated through greater use of reinsurance/strategic capital partnerships (1) Global Aggregate Probable Maximum Loss (PML) is for all events in a given year as opposed to a single event PML as disclosed in the Investor F inancial S upplement Temporary increase from acquisition of Novae that was effectively reduced prior to wind season through optimization of reinsurance usage Cost effective restructuring of reinsurance covers while maintaining appropriate risk tolerances 2011 Q1 2011 Q2 2011 Q3 2011 Q4 2012 Q1 2012 Q2 2012 Q3 2012 Q4 2013 Q1 2013 Q2 2013 Q3 2013 Q4 2014 Q1 2014 Q2 2014 Q3 2014 Q4 2015 Q1 2015 Q2 2015 Q3 2015 Q4 2016 Q1 2016 Q2 2016 Q3 2016 Q4 2017 Q1 2017 Q2 2017 Q3 2017 Q4 2018 Q1 2018 Q2 2018 Q3 2018 Q4 2019 Q1 AXS 1 - in - 250 Global Aggregate PML

Cat Covers: Improved Capital & Earnings Protection 12 Southeast Wind PMLs 1 2018 Catastrophe Tower Highlights ($ in millions) $430 $485 $441 $432 $848 $919 $620 $572 4Q17 1Q18 4Q18 1Q19 1 in 100 1 in 250 • The 1 in 250 year PML for Southeast Wind was reduced by 38% since 1Q18 • XOL and aggregate components provide better balance of frequency and severity protection with improved underlying economics • 2019 cat towers utilize both the traditional and ILS reinsurance markets • Continued reduction in net catastrophe volatility through increased use of multi - faceted strategies (1) Probable Maximum Loss (PML) is for a single US Southeast Wind event as disclosed in the financial supplement
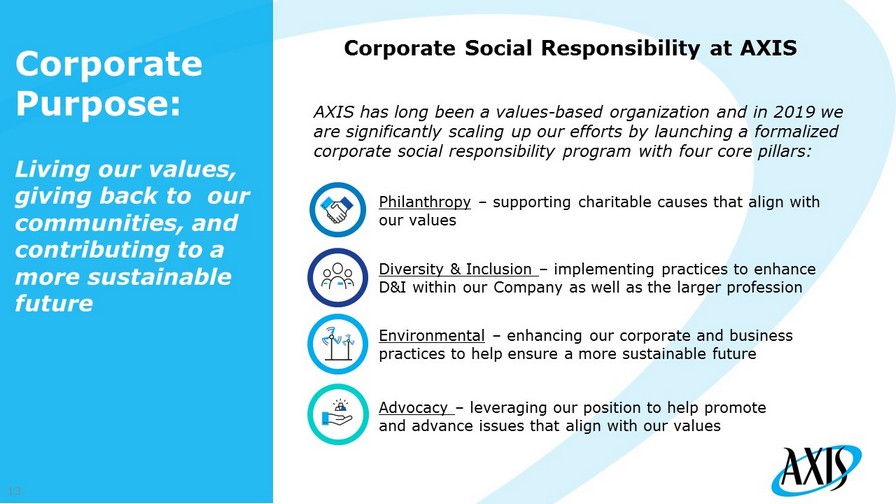
Corporate Social Responsibility at AXIS Philanthropy – supporting charitable causes that align with our values Diversity & Inclusion – implementing practices to enhance D&I within our Company as well as the larger profession Environmental – enhancing our corporate and business practices to help ensure a more sustainable future Corporate Purpose: Living our values, giving back to our communities, and contributing to a more sustainable future 13 Advocacy – leveraging our position to help promote and advance issues that align with our values AXIS has long been a values - based organization and in 2019 we are significantly scaling up our efforts by launching a formalized corporate social responsibility program with four core pillars:
Conclusion AXIS is a relevant player in its chosen core specialty markets Superior attributes deliver more defensible market position Substantial progress in transitioning portfolio for greater balance and profitability, with lower volatility Actions already taken will lead to stronger performance in 2019 and beyond Thought leadership in core specialty m arkets 14

Appendix I – Non - GAAP Financial Measures We present our results of operations in the way we believe will be most meaningful and useful to investors, analysts, rating age ncies and others who use our financial information to evaluate our performance. Some of the measurements we use are considered non - GAAP financial measures under SEC rules and regulations. In this document , we present operating income (loss) ( in total and on a per share basis ), annualized operating return on average common equity ("operating ROACE"), operating income (loss) ( in total and on a per share basis ) and annualized ex - PGAAP operating ROACE which are non - GAAP financial measures as defined in SEC Regulation G. We believe that these non - GAAP financial measures, which may be defined and calculated differently by other companies, better explain and enhance the understanding of our resul ts of operations. However, these measures should not be viewed as a substitute for those determined in accordance with accounting principles ge ner ally accepted in the United States of America ("U.S. GAAP"). Operating Income (Loss) Operating income (loss) represents after - tax operational results exclusive of net investment gains (losses), foreign exchange losses (gain s), transaction and reorganization expenses, and interest in income (loss) of equity method investments. Although the investment of premiums to generate income and investment gains (losses) is an integral part of our operations, t he determination to realize investment gains (losses) is independent of the underwriting process and is heavily influenced by the availability of ma rket opportunities. Furthermore, many users believe that the timing of the realization of investment gains (losses) is somewhat opportunistic for ma ny companies. Foreign exchange losses (gains) in our consolidated statements of operations primarily relate to the impact of foreign exchan ge rate movements on net insurance related - liabilities. However, this movement is only one element of the overall impact of foreign exchange rate fluctuations on our financial position. We recognize unrealized foreign exchange losses (gains) on our available - for - sale investments in other compr ehensive income (loss) and foreign exchange losses (gains) realized upon the sale of these investments in net investments gains (losses). In add ition, we recognize unrealized foreign exchange losses (gains) on our equity securities and foreign exchange losses (gains) realized upon the sal e o f these investment in net investment gains (losses).These unrealized and realized foreign exchange losses (gains) generally offset a large porti on of the foreign exchange losses (gains) reported separately in net income (loss) available (attributable) to common shareholders, thereby min imi zing the impact of foreign exchange rate movements on total shareholders' equity. As such, foreign exchange losses (gains) in our consolidate d s tatements of operations in isolation are not a fair representation of the performance of our business . Transaction and reorganization expenses are primarily driven by business decisions, the nature and timing of which are not re lat ed to the underwriting process, therefore, these expenses are excluded from operating income (loss). Interest in income (loss) of equity method investments is primarily driven by business decisions, the nature and timing of wh ich are not related to the underwriting process, therefore, this income (loss) is excluded from operating income (loss ).

Appendix I – Non - GAAP Financial Measures Certain users of our financial statements evaluate performance exclusive of after - tax net investment gains (losses), foreign exc hange losses (gains), transaction and reorganization expenses, and interest in income (loss) of equity method investments to understand th e p rofitability of recurring sources of income. We believe that showing net income (loss) available (attributable) to common shareholders exclusive of after - tax net investment gains (losses), foreign exchange losses (gains), transaction and reorganization expenses, and interest in income (loss) of equity method inve stm ents reflects the underlying fundamentals of our business. In addition, we believe that this presentation enables investors and other users of our financial information to analyze performance in a manner similar to how our management analyzes the underlying business performance. We al so believe this measure follows industry practice and, therefore, facilitates comparison of our performance with our peer group. We beli eve that equity analysts and certain rating agencies that follow us, and the insurance industry as a whole, generally exclude these items fro m t heir analyses for the same reasons. The reconciliation of operating income (loss) to net income (loss) available (attributable) to common share hol ders, the most comparable GAAP financial measure, is presented in Appendix II of this document. We also present operating income (loss) per diluted common share and annualized operating ROACE, which are derived from the o per ating income (loss) measure and are reconciled to the most comparable GAAP financial measures, earnings per diluted common share and annua liz ed return on average common equity ("ROACE"), respectively, in Appendix II of this document. Ex - PGAAP Operating Income (Loss) Ex - PGAAP operating income (loss) represents operating income (loss) exclusive of amortization of VOBA and intangible assets, net of tax and amortization of acquisition costs, net of tax associated with Novae's balance sheet at October 2, 2017 (the "closing date" or "a cquisition date"). The reconciliation of ex - PGAAP operating income (loss) to net income (loss) available (attributable) to common shareholders, the most comparable GAAP financial measure, is presented in Appendix II of this document. We also present ex - PGAAP operating income (loss) per diluted common share and annualized ex - PGAAP operating ROACE, which are der ived from the ex - PGAAP operating income (loss) measure and are reconciled to the most comparable GAAP financial measures, earnings per dil uted common share and annualized ROACE, respectively, are also presented in Appendix II of this document. We believe the presentation of ex - PGAAP operating income (loss), ex - PGAAP operating income (loss) per diluted common share and a nnualized ex - PGAAP operating ROACE enables investors and other users of our financial information to better analyze the performance of our business.
Appendix I – Non - GAAP Financial Measures Acquisition of Novae On October 2, 2017, we acquired Novae. We identified VOBA which represents the present value of the expected underwriting pro fit within policies that were in - force at the closing date of the transaction. In addition, the allocation of the acquisition price to the assets ac quired and liabilities assumed of Novae based on estimated fair values at the acquisition date, resulted in the write - off of the deferred acquisition c ost asset on Novae's balance sheet at the acquisition date as the value of policies in - force on that date are considered within VOBA. Consequently, n et income (loss) in the three months ended March 31, 2019 and 2018 included the recognition of premium attributable to Novae's balance sheet at the acquisition date without the recognition of the associated acquisition costs.

Appendix II – Non - GAAP Reconciliations