Exhibit 99.3
 |
 |
Statements in this presentation that are not historical facts, including statements regarding our estimates, beliefs, expectations, intentions, strategies or projections, may be “forward-looking statements” within the meaning of the U.S. federal securities laws, including the Private Securities Litigation Reform Act of 1995. We intend these forward-looking statements to be covered by the safe harbor provisions for forward-looking statements in the United States securities laws. In some cases, these statements can be identified by the use of forward-looking words such as “may,” “should,” “could,” “anticipate,” “estimate,” “expect,” “plan,” “believe,” “predict,” “potential,” “intend” or similar expressions. Our expectations are not guarantees and are based on currently available competitive, financial and economic data along with our operating plans. Forward-looking statements contained in this presentation may include, but are not limited to, information regarding measurements of potential losses in the fair value of our investment portfolio, our expectations regarding pricing and other market conditions and valuations of the potential impact of movements in interest rates, equity prices, credit spreads and foreign currency rates.
Forward-looking statements only reflect our expectations and are not guarantees of performance. Accordingly, there are or will be important factors that could cause actual results to differ materially from those indicated in such statements. We believe that these factors include, but are not limited to, the following:
| • | the occurrence of natural and man-made disasters, |
| • | actual claims exceeding our loss reserves, |
| • | general economic, capital and credit market conditions, |
| • | the failure of any of the loss limitation methods we employ, |
| • | the effects of emerging claims and coverage issues, |
| • | the failure of our cedants to adequately evaluate risks, |
| • | the loss of one or more key executives, |
| • | a decline in our ratings with rating agencies, |
| • | loss of business provided to us by our major brokers, |
| • | changes in accounting policies or practices, |
| • | changes in governmental regulations, |
| • | increased competition, |
| • | changes in the political environment of certain countries in which we operate or underwrite business, and |
| • | fluctuations in interest rates, credit spreads, equity prices and/or currency values. |
We undertake no obligation to update or revise publicly any forward-looking statements, whether as a result of new information, future events or otherwise.
This report is for informational purposes only. It should be read in conjunction with the documents that we file with the Securities and Exchange Commission pursuant to the Securities Act of 1933 and the Securities Exchange Act of 1934.


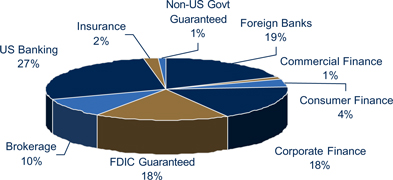
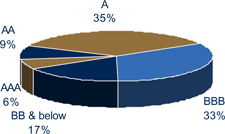
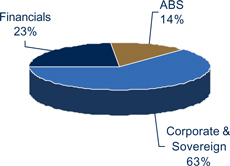
(As of March 31, 2009)
Total Cash and Investments: $10.4 Billion
|
| Total Portfolio Allocation | Total Portfolio Ratings Allocation | |
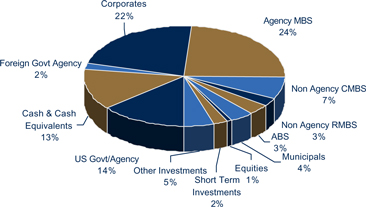 | 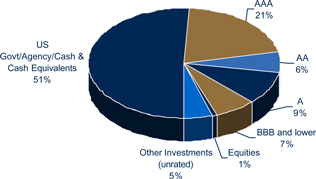 | |
Note: Other investments include hedge funds, CLO equity tranches, credit funds and short duration high yield funds
3

(As of March 31, 2009)
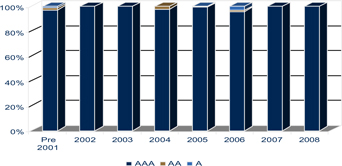
Total Non Agency CMBS: $741 Million (7% of total portfolio)
|
| Rating by Vintage ($ in millions) | Rating by Vintage (%) | |
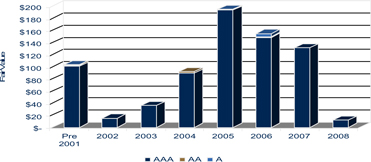 |  | |
Fair Value ($ in millions)
| ||||||||
Vintage
|
AAA
|
AA
|
A
|
Total
| ||||
2008
|
$12
|
$ -
|
$ -
|
$12
| ||||
2007
|
132
|
-
|
-
|
132
| ||||
2006
|
149
|
1
|
5
|
154
| ||||
2005
|
194
|
-
|
1
|
195
| ||||
Other
|
243
|
4
|
1
|
248
| ||||
Total
|
$730
|
$5
|
$6
|
$741
| ||||
Net Unrealized Loss ($ in millions) | ||||||||
Net Unrealized Loss
| $(179)
| $(6)
| $(2)
| $(187)
| ||||
Key Characteristics | ||
| • | 98.5% AAA, 97.1% super senior tranches | |
• |
176 securities | |
• |
Weighted average life of 4.06 years | |
• |
Duration of 3.36 | |
• |
Book yield is 5.36% | |
•
|
Average price of 82% of par
| |
4

(As of March 31, 2009)
Collateral Property Type ($ in millions)
| Maturity Detail ($ in millions)
| |||||||||||||||
| Asset Class | Amortized Cost | Net Unrealized Loss | Fair Value | Years to Maturity | Amortized Cost | Net Unrealized Loss | Fair Value | |||||||||
Office | $304 | $(64) | $240 | < 2 | $281 | $(13) | $268 | |||||||||
Retail | 286 | (56) | 230 | 2.1 – 3 | 47 | (8) | 39 | |||||||||
Multifamily | 148 | (28) | 120 | 3.1 – 4 | 64 | (10) | 53 | |||||||||
Hotel | 74 | (16) | 58 | 4.1 – 5 | 53 | (6) | 47 | |||||||||
Industrial | 42 | (8) | 34 | 5.1 – 7 | 257 | (72) | 185 | |||||||||
Mixed use | 18 | (3) | 14 | 7.1 – 10 | 227 | (78) | 149 | |||||||||
Self storage | 17 | (4) | 14 |
Total
| $928
| $(187)
| $741
| |||||||||
Mobile home | 15 | (3) | 12 | |||||||||||||
Healthcare | 4 | (1) | 3 | |||||||||||||
Other | 20 | (4) | 16 | |||||||||||||
Total
| $928
| $(187)
| $741
| |||||||||||||
• |
Average loan to value of the underlying collateral is 69.2 | |
• |
Average subordination has improved to 26.7% from 24.5% at origination | |
• |
Current percentage of defeased collateral is 11.4% | |
•
|
Average current collateral delinquency is 1.91%
|
5

(As of March 31, 2009)
Total Agency and Non-Agency RMBS: $2.8 Billion (27% of total portfolio)
|
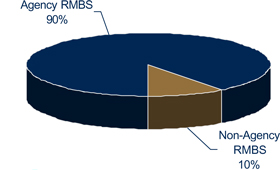
Key Characteristics – Agency RMBS | ||||
• |
Primarily pass-through securities issued by the Federal Home Loan Mortgage Corporation, Federal National Mortgage Association, and the Government National Mortgage Association. | |||
• |
These securities have an | |||
amortized cost of $2.4 billion with a net unrealized gain of $58 million.
| ||||
Key Characteristics – Non-Agency RMBS | ||
• |
Non-Agency RMBS have an amortized cost | |
| of $367 million with net unrealized loss of | ||
| $87 million | ||
• |
This sector includes prime, Alt-A and | |
| subprime collateral. | ||
• |
Non-Agency RMBS is 89.6% AAA-rated as | |
detailed on the following slides
|
6

(As of March 31, 2009)
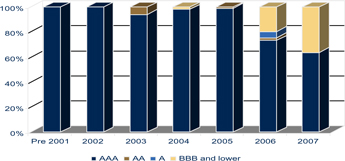
Rating by Vintage ($ in millions)
| Rating by Vintage (%)
|
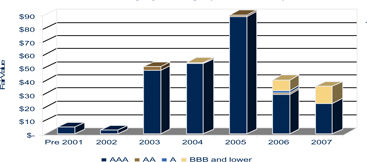
Fair Value ($ in millions)
| ||||||||||
Vintage
|
AAA
|
AA
|
A
|
BBB and lower
|
Total
| |||||
2007
|
$23
|
$-
|
$-
|
$13
|
$36
| |||||
2006
| 30
|
1
|
2
|
8
|
41
| |||||
2005
|
89
|
1
|
-
|
-
|
90
| |||||
2004
|
53
|
-
|
-
|
1
|
54
| |||||
Other
|
57
|
3
|
-
|
-
|
59
| |||||
Total
|
$251
|
$6
|
$2
|
$22
|
$280
| |||||
Net Unrealized Loss ($ in millions) | ||||||||||
Net Unrealized
| $(71)
| $(3)
| $ -
| $(13)
| $(87)
| |||||
Key Characteristics | ||
| • | 89.6% AAA | |
• |
154 securities | |
• |
Weighted average life of 4.4 years | |
• |
Book yield is 5.89% | |
• |
Average price of 77% of par | |
•
|
Duration of 0.02
| |
7

(As of March 31, 2009)
Maturity Detail ($ in millions)
| Years to Maturity | Amortized Cost | Net Unrealized Loss | Fair Value | |||
< 2 | $93 | $(16) | $77 | |||
2.1 – 3 | 20 | (2) | 17 | |||
3.1 – 4 | 43 | (10) | 34 | |||
4.1 – 5 | 92 | (28) | 64 | |||
5.1 – 7 | 63 | (16) | 47 | |||
7.1 – 10 | 40 | (10) | 30 | |||
>10 | 16 | (5) | 12 | |||
Total
|
$367
|
$(87)
|
$280
| |||
• |
The fair value of securities with Subprime content is $23 million (Non-Agency RMBS $2 million and ABS $21 million). | |
• |
The fair value of securities with Alt-A content is $97 million (Non-Agency RMBS $96 million and ABS $1 million).
|
Note: Our Alt-A and Subprime classification is determined by the underlying collateral, a security with any level of Alt-A or Subprime collateral is classified as such even if the collateral is majority prime.
8

(As of March 31, 2009)
Total Corporate Debt: $ 2.3 Billion (22% of total portfolio) |
• |
Average corporate debt rating of A | |
• |
Weighted average life of 4.7 years | |
• |
Duration of 3.3 | |
•
|
Book Yield is 4.67%
|
9
*Medium-Term Notes provide access to European credit issuances.

(As of March 31, 2009)
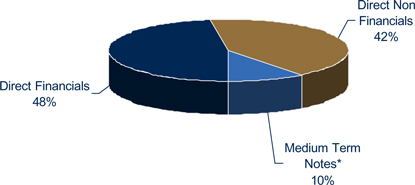
Financials by Subsector: $1.1 Billion (10% of total portfolio)
|
•
|
Included in Financials are $205 million of FDIC guaranteed bonds
|
10

(As of March 31, 2009)
Top 10 Direct Financial Holdings
| Financials by Rating ($ in millions)
| |||||||||||||||||
Amortized Cost | Net Unrealized Loss | Fair Value | Amortized Cost | % of Amortized Cost | Net Unrealized Loss | Fair Value | ||||||||||||
| General Electric | $108 | $(6) | $102 | AAA | $347 | 29% | $(9) | $339 | ||||||||||
JP Morgan Chase & Co | 82 | (5) | 77 | AA | 328 | 27% | (35) | 293 | ||||||||||
| Wells Fargo & Co | 84 | (8) | 76 | A | 443 | 37% | (50) | 392 | ||||||||||
| Bank of America | 78 | (19) | 59 | BBB and lower | 86 | 7% | (26) | 59 | ||||||||||
| Citigroup Inc | 63 | (10) | 53 |
Total
| $1,204
| 100%
| $(120)
| $1,084
| ||||||||||
| Morgan Stanley | 45 | (1) | 44 | |||||||||||||||
| American Express | 31 | 1 | 30 | |||||||||||||||
| HSBC Holdings | 34 | (6) | 28 | |||||||||||||||
| Goldman Sachs | 31 | (2) | 28 | |||||||||||||||
Nationwide Building Society | 20 | - | 20 | |||||||||||||||
11

(As of March 31, 2009)
Non-Financials By Subsector: $956 Million (9% of total portfolio)
|
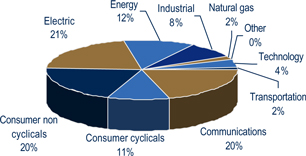
Subsector Detail ($ in millions)
| ||||||||
Amortized Cost | % of Amortized | Net Unrealized Gain/ (Loss) | Fair Value | |||||
| Communications | $198 | 20% | $(4) | $194 | ||||
Consumer cyclicals | 105 | 11% | (4) | 101 | ||||
Consumer non cyclicals | 189 | 19% | 3 | 192 | ||||
| Electric | 208 | 21% | (6) | 202 | ||||
| Energy | 119 | 12% | (3) | 116 | ||||
| Industrial | 77 | 8% | (1) | 76 | ||||
| Natural gas | 20 | 2% | (1) | 19 | ||||
| REIT | 4 | 1% | (1) | 3 | ||||
| Technology | 36 | 4% | - | 36 | ||||
| Transportation | 18 | 2% | (1) | 17 | ||||
Total
|
$973
|
100%
|
$(18)
|
$956
| ||||
12

(As of March 31, 2009)
Top 10 Direct Non-Financial Holdings ($ in millions)
| Non Financials by Rating ($ in millions)
| |||||||||||||||||
Amortized Cost | Net Unrealized Gain/ | Fair Value | Amortized Cost | % of Amortized | Net Unrealized Gain/ (Loss) | Fair Value | ||||||||||||
Verizon Communications | $56 | $2 | $58 | AAA | $6 | - | $- | $6 | ||||||||||
| AT&T | 50 | - | 50 | AA | 126 | 13% | 1 | 127 | ||||||||||
Tokyo Electric Power Co Inc | 45 | (4) | 41 | A | 512 | 53% | (4) | 507 | ||||||||||
Procter & Gamble | 40 | 1 | 41 | BBB | 330 | 34% | (15) | 315 | ||||||||||
Duke Energy Corp | 32 | 1 | 33 |
Total
|
$973
|
100%
|
$(18)
|
$956
| ||||||||||
Dominion Resources Inc | 24 | - | 24 | |||||||||||||||
Comcast Corporation | 24 | (1) | 23 | |||||||||||||||
| IBM | 20 | - | 20 | |||||||||||||||
Toyota Motor Corp | 20 | (1) | 19 | |||||||||||||||
Consolidated Edison Inc | 20 | (1) | 19 | |||||||||||||||
13

(As of March 31, 2009)
Medium-Term Notes ($ in millions)
Amortized Cost | Net Unrealized Loss | Fair Value | % of Total | |||||
Medium-Term Notes
| $614
| $(375)
| $239
| 2.3
| ||||
| Fair Value by Region | Fair Value by Rating | Fair Value by Sector | ||
|
|
| ||
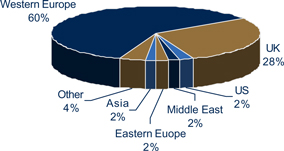
• |
Credit issuances accessed via medium-term notes which employ leverage | |
| • | Current leverage 0.53 (For each unit of client capital an additional 0.53 of borrowed capital is employed) | |
| • | Investment results driven by changes in credit spreads | |
•
| Average yield of medium-term notes is LIBOR + 243bps
|
14

(As of March 31, 2009)
ABS by Subsector: $352 Million (3% of total portfolio)
|
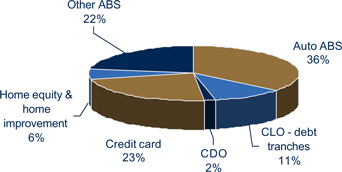
Subsector Detail ($ in millions)
| ||||||||
Amortized Cost | % of Amortized Cost | Net Unrealized Loss | Fair Value | |||||
| Auto ABS | $125 | 32% | $- | $125 | ||||
CLO – debt tranches | 57 | 15% | (18) | 39 | ||||
CDO | 11 | 3% | (5) | 6 | ||||
Credit card | 83 | 22% | (2) | 81 | ||||
Home equity & home improvement | 27 | 7% | (5) | 22 | ||||
Other ABS | 82 | 21% | (3) | 80 | ||||
Total
|
$385
|
100%
|
$(33)
|
$352
| ||||
15

(As of March 31, 2009)
Maturity Detail ($ in millions)
| Rating Detail ($ in millions)
| |||||||||||||||||||
Years to Maturity | Amortized Cost | % of Amortized Cost | Net Unrealized Loss | Fair Value | Amortized Cost | % of Amortized | Net Unrealized Loss | Fair Value | ||||||||||||
| < 2 | $166 | 43% | $(3) | $163 | AAA | $310 | 81% | $(12) | $299 | |||||||||||
| 2.1 – 3 | 37 | 10% | (2) | 36 | AA | 1 | - | (1) | - | |||||||||||
| 3.1 – 4 | 42 | 11% | (4) | 38 | A | 35 | 9% | (10) | 24 | |||||||||||
| 4.1 – 5 | 66 | 17% | (11) | 54 | BBB and lower | 40 | 10% | (11) | 29 | |||||||||||
| 5.1 – 7 | 24 | 6% | (7) | 16 |
Total
|
$385
|
100%
|
$(33)
|
$352
| |||||||||||
| 7.1 – 10 | 40 | 10% | (3) | 36 | ||||||||||||||||
| >10 | 11 | 3% | (2) | 9 | ||||||||||||||||
Total
|
$385
|
100%
|
$(33)
|
$352
| ||||||||||||||||
Vintage Detail ($ in millions)
Vintage
|
AAA
|
AA
|
A
|
BBB and lower
|
Total
| |||||
2009
|
$27
|
-
|
-
|
-
|
$27
| |||||
2008
|
95
|
-
|
-
|
-
|
95
| |||||
2007
|
82
|
-
|
-
|
6
|
89
| |||||
2006
|
62
|
-
|
-
|
6
|
68
| |||||
Other
|
32
|
-
|
24
|
16
|
72
| |||||
Total
|
$299
|
$-
|
$24
|
$29
|
$352
| |||||
Net Unrealized Loss
| $(12)
| $-
| $(10)
| $(11)
| $(33)
| |||||
Key Characteristics | ||
| • | 85% AAA | |
• |
133 securities | |
• |
Weighted average life of 3.13 years | |
• |
Duration of 0.76 | |
• |
Book yield is 4.9% | |
•
|
Average price of 92% of par
| |
16

(As of March 31, 2009)
Total Other Investments: $494 million (5% of total portfolio)
|
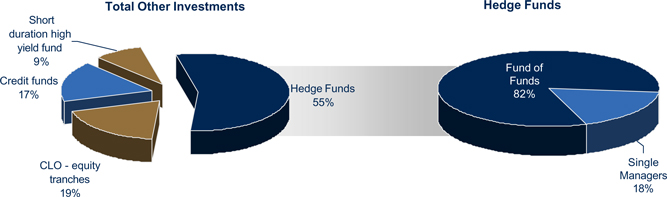
Key Characteristics | ||
| • | Short duration high yield fund – invests mainly in high yield bonds with an average maturity of 2.5 years and average rating of B+ | |
• |
Credit Funds – invest in non-investment grade credit and are currently comprised of 69% bank loans and 31% distressed debt | |
• |
CLO equity tranches – equity tranches of cash flow collateralized loan obligations that invest primarily in first-lien bank loans | |
•
|
Single Managers – invest in event driven, equity long short, and energy MLP strategies
| |
17

(As of March 31, 2009)
Invested Assets ($ in millions)
| $ in millions | Amortized Cost | Net Unrealized Loss | Fair Value | |||
Fixed maturities | $8,981 | $(742) | $8,239 | |||
Equities | 127 | (49) | 78 | |||
Short-term investments | 228 | (2) | 225 | |||
Total
| $9,336
| $(793)
| $8,542
| |||

18