 AXIS Capital Holdings Limited Investment Portfolio Supplemental Information and Data March 31, 2010 Exhibit 99.3 |
 Cautionary Note on Forward Looking Statements Statements in this presentation that are not historical facts, including statements regarding our estimates, beliefs, expectations, intentions, strategies or projections, may be “forward-looking statements” within the meaning of the U.S. federal securities laws, including the Private Securities Litigation Reform Act of 1995. We intend these forward-looking statements to be covered by the safe harbor provisions for forward-looking statements in the United States securities laws. In some cases, these statements can be identified by the use of forward- looking words such as “may,” “should,” “could,” “anticipate,” “estimate,” “expect,” “plan,” “believe,” “predict,” “potential,” “intend” or similar expressions. Our expectations are not guarantees and are based on currently available competitive, financial and economic data along with our operating plans. Forward-looking statements contained in this presentation may include, but are not limited to, information regarding measurements of potential losses in the fair value of our investment portfolio, our expectations regarding pricing and other market conditions and valuations of the potential impact of movements in interest rates, equity prices, credit spreads and foreign currency rates. Forward-looking statements only reflect our expectations and are not guarantees of performance. Accordingly, there are or will be important factors that could cause actual results to differ materially from those indicated in such statements. We believe that these factors include, but are not limited to, the following: • the occurrence of natural and man-made disasters, • actual claims exceeding our loss reserves, • general economic, capital and credit market conditions, • the failure of any of the loss limitation methods we employ, • the effects of emerging claims and coverage issues, • the failure of our cedants to adequately evaluate risks, • the loss of one or more key executives, • a decline in our ratings with rating agencies, • loss of business provided to us by our major brokers, • changes in accounting policies or practices, • changes in governmental regulations, • increased competition, • changes in the political environment of certain countries in which we operate or underwrite business, and • fluctuations in interest rates, credit spreads, equity prices and/or currency values. We undertake no obligation to update or revise publicly any forward-looking statements, whether as a result of new information, future events or otherwise. This report is for informational purposes only. It should be read in conjunction with the documents that we file with the Securities and Exchange Commission pursuant to the Securities Act of 1933 and the Securities Exchange Act of 1934. |
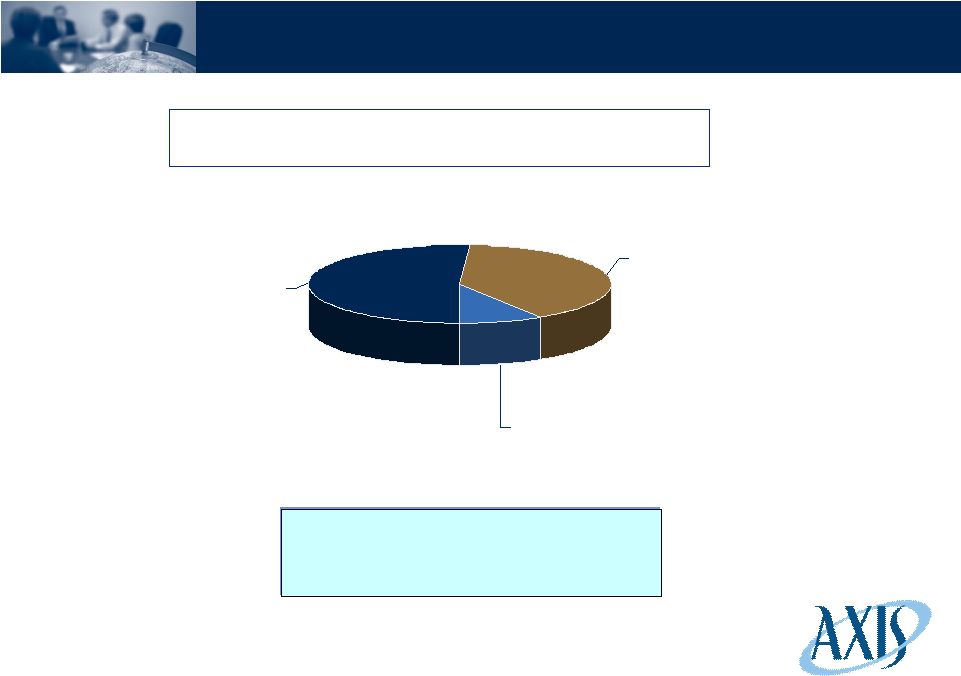
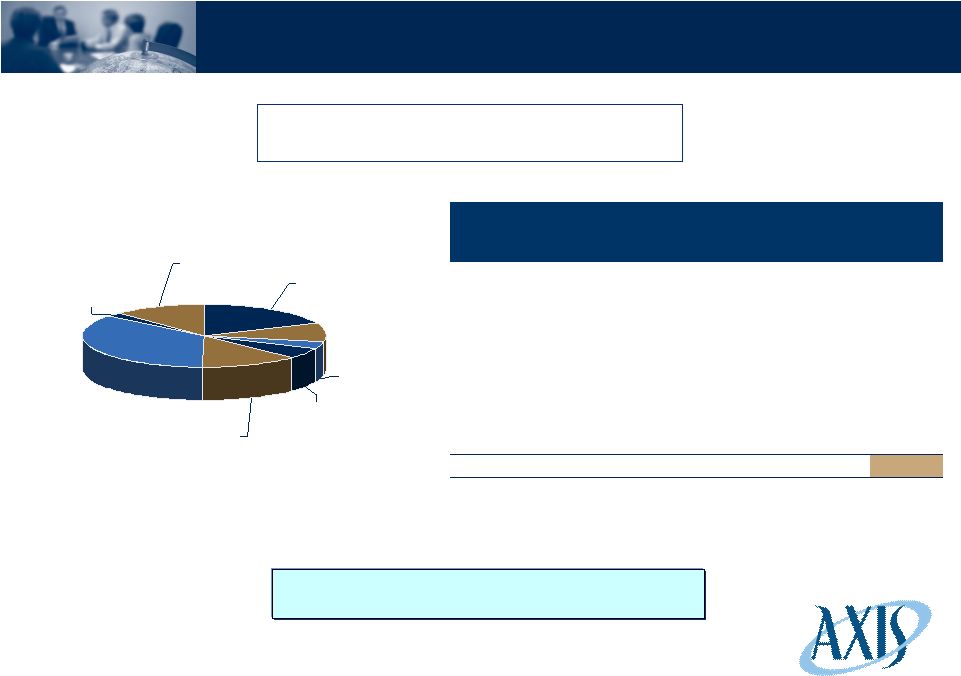
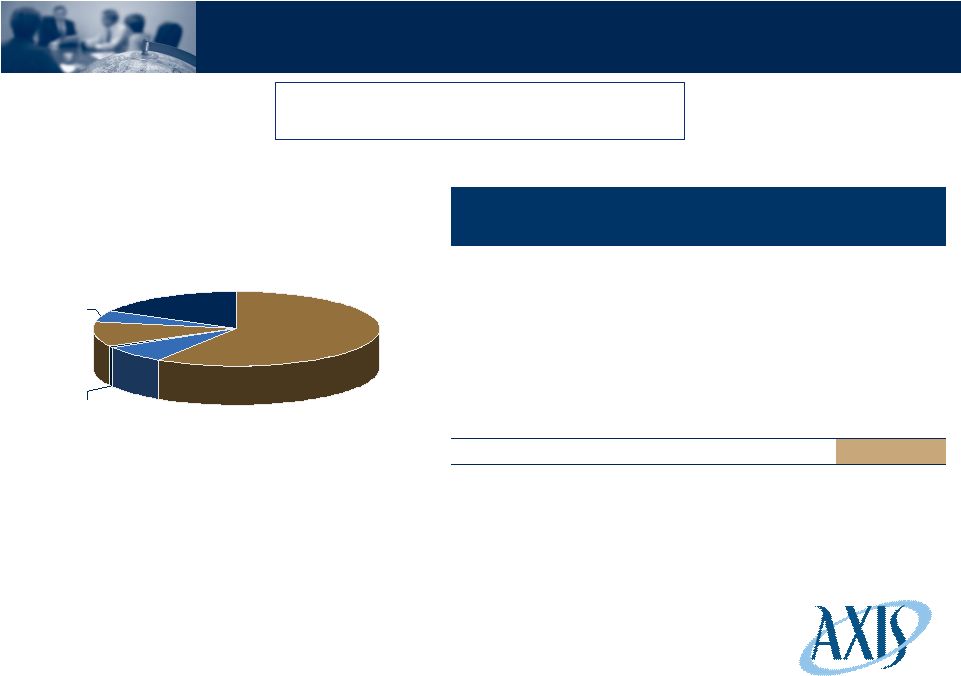
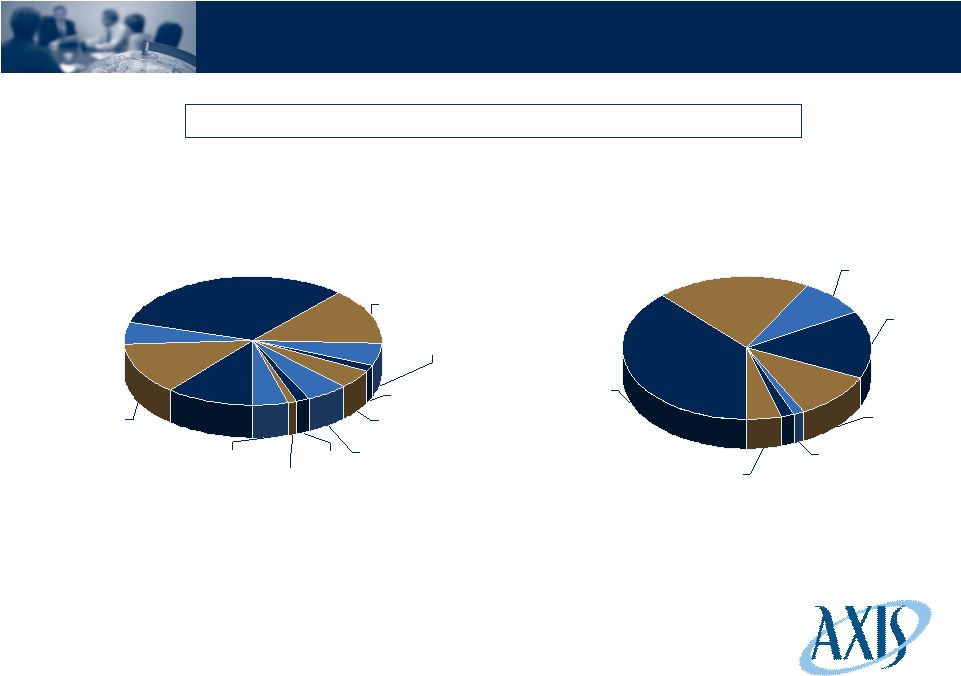 3 Total Cash and Invested Assets Total Cash and Invested Assets: $12.1 Billion Total Portfolio Allocation Total Portfolio Ratings Allocation Note: Other investments include hedge funds, CLO equity tranches, credit funds and short duration high yield fund. (As of March 31, 2010) Equities 2% Short Term Investments 1% Other Investments 4% Municipals 5% Corporates 32% Foreign Govt Agency 6% Cash & Cash Equivalents 13% US Govt/Agency 11% Agency MBS 14% ABS 4% Non Agency RMBS 2% Non Agency CMBS 6% AAA 20% AA 9% Equities 2% Below BBB 2% BBB 10% A 15% US Govt/Agency/Cash & Cash Equivalents/ Agency MBS 38% Other Investments (unrated) 4% |
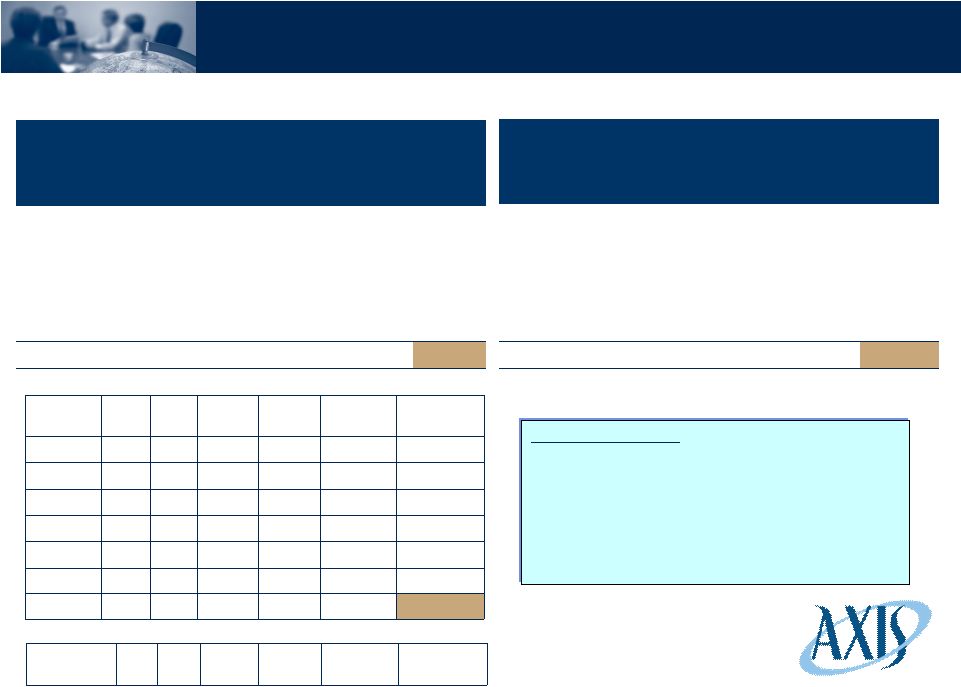
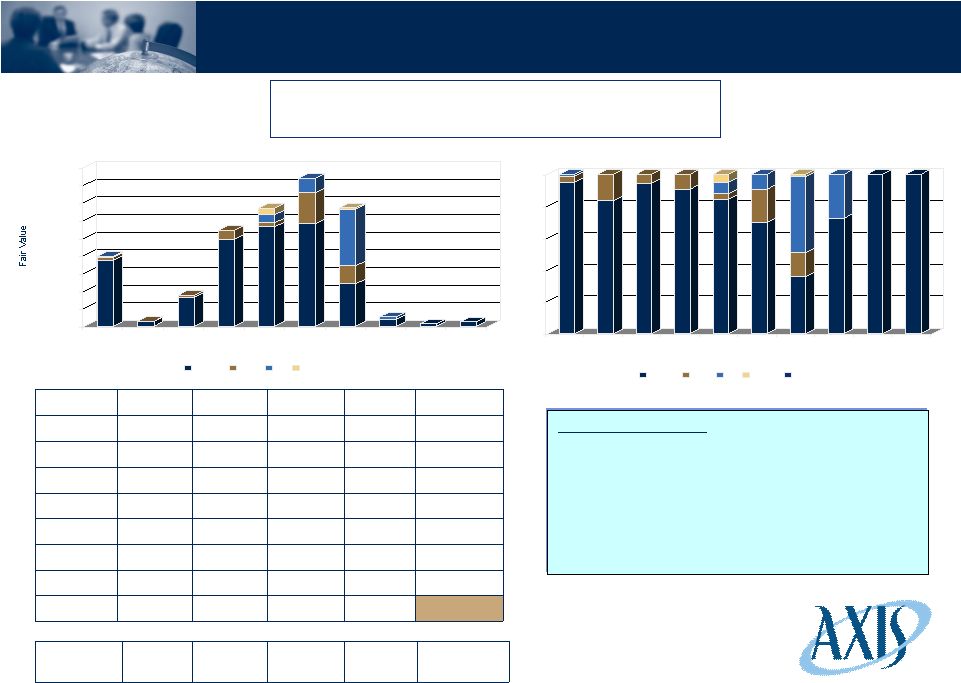 Non-Agency CMBS: Detail Fair Value ($ in millions) Net Unrealized Gain/(Loss) ($ in millions) Rating by Vintage (%) Rating by Vintage ($ in millions) Vintage AAA AA A BBB Total 2010 $5 $- $- $- $5 2009 3 - - - 3 2008 8 - 3 - 11 2007 48 20 64 1 133 2006 116 34 16 - 166 2005 112 6 9 7 134 Other 212 16 1 - 229 Total $504 $76 $93 $8 $681 Net Unrealized $16 $2 $(2) $(1) $15 4 Key Characteristics • 74.1% AAA, 94.1% senior/super senior tranches • 149 securities • Weighted average life of 4.8 years • Duration of 3.54 • Book yield is 5.59% • Average price of 101% of par (As of March 31, 2010) Total Non Agency CMBS: $681 Million (6% of total portfolio) $- $20 $40 $60 $80 $100 $120 $140 $160 $180 Pre 2001 2002 2003 2004 2005 2006 2007 2008 2009 2010 AAA AA A BBB 0% 20% 40% 60% 80% 100% Pre 2001 2002 2003 2004 2005 2006 2007 2008 2009 2010 AAA AA A BBB |
 Non-Agency CMBS: Detail (Continued) • Average loan to value of the underlying collateral is 71.8 • Average subordination has improved to 27.2% from 24.7% at origination • Current percentage of defeased collateral is 8.43% • Average current collateral delinquency is 7.99% Asset Class Amortized Cost Net Unrealized Gain Fair Value Office $218 $4 $222 Retail 213 5 218 Multifamily 104 2 106 Hotel 49 1 50 Industrial 30 1 31 Mixed use 15 1 16 Self storage 13 - 13 Mobile home 11 - 11 Healthcare 4 - 4 Other 9 1 10 Total $666 $15 $681 5 Years to Maturity Amortized Cost Net Unrealized Gain/(Loss) Fair Value < 2 $89 $1 $90 2.1 – 3 72 3 75 3.1 – 4 71 3 74 4.1 – 5 113 5 118 5.1 – 7 224 4 228 7.1 – 10 88 (1) 87 > 10 9 - 9 Total $666 $15 $681 Collateral Property Type ($ in millions) Maturity Detail ($ in millions) (As of March 31, 2010) |
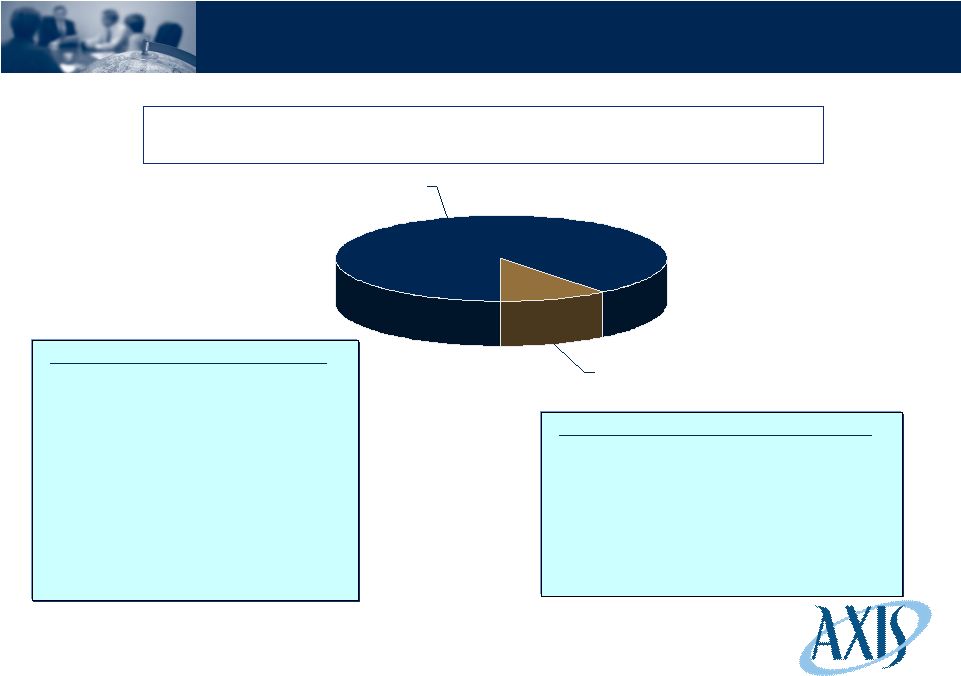 6 Investment Grade Fixed Income: RMBS Key Characteristics – Non Agency RMBS • Non-Agency RMBS have an amortized cost of $222 million with net unrealized loss of $22 million • This sector includes prime, Alt-A and subprime collateral • Non-Agency RMBS is 49.2% AAA-rated as detailed on the following slides Total Agency and Non-Agency RMBS: $1.9 Billion (16% of total portfolio) Key Characteristics – Agency RMBS • Primarily pass-through securities issued by the Federal Home Loan Mortgage Corporation, Federal National Mortgage Association, and the Government National Mortgage Association • These securities have an amortized cost of $1.6 billion with a net unrealized gain of $40 million • Duration of 2.98 • Book yield is 4.27% (As of March 31, 2010) Agency RMBS 89% Non-Agency RMBS 11% |
 Non-Agency RMBS: Detail Fair Value ($ in millions) Rating by Vintage (%) Rating by Vintage ($ in millions) Vintage AAA AA A BBB Below BBB Total 2010 $3 $- $- $- $- $3 2009 2 - - - - 2 2007 1 6 10 - 14 31 2006 7 2 - - 23 32 2005 22 3 - 12 21 58 2004 30 2 1 1 2 36 Other 33 4 - - 1 38 Total $98 $17 $11 $13 $61 $200 Net Unrealized $(7) $(2) $(2) $(3) $(8) $(22) Net Unrealized Loss ($ in millions) 7 Key Characteristics • 49.2% AAA • 163 securities • Weighted average life of 4.5 years • Book yield is 5.73% • Average price of 85% of par • Duration of 0.12 (As of March 31, 2010) $- $10 $20 $30 $40 $50 $60 Pre 2001 2002 2003 2004 2005 2006 2007 2009 2010 AAA AA A BBB Below BBB 0% 20% 40% 60% 80% 100% Pre 2001 2002 2003 2004 2005 2006 2007 2009 2010 AAA AA A BBB Below BBB |
 Non-Agency RMBS: Detail (Continued) Years to Maturity Amortized Cost Net Unrealized Loss Fair Value < 2 $29 $(1) $28 2.1 – 3 38 (1) 37 3.1 – 4 31 (2) 29 4.1 – 5 28 (4) 24 5.1 – 7 72 (8) 64 7.1 – 10 14 (4) 10 >10 10 (2) 8 Total $222 $(22) $200 Maturity Detail ($ in millions) 8 • The fair value of securities with Subprime content is $15 million • The fair value of securities with Alt-A content is $56 million (As of March 31, 2010) Note: Our Alt-A and Subprime classification is determined by the underlying collateral. A security with any level of Alt-A or Subprime collateral is classified as such even if the majority of the collateral is prime. |
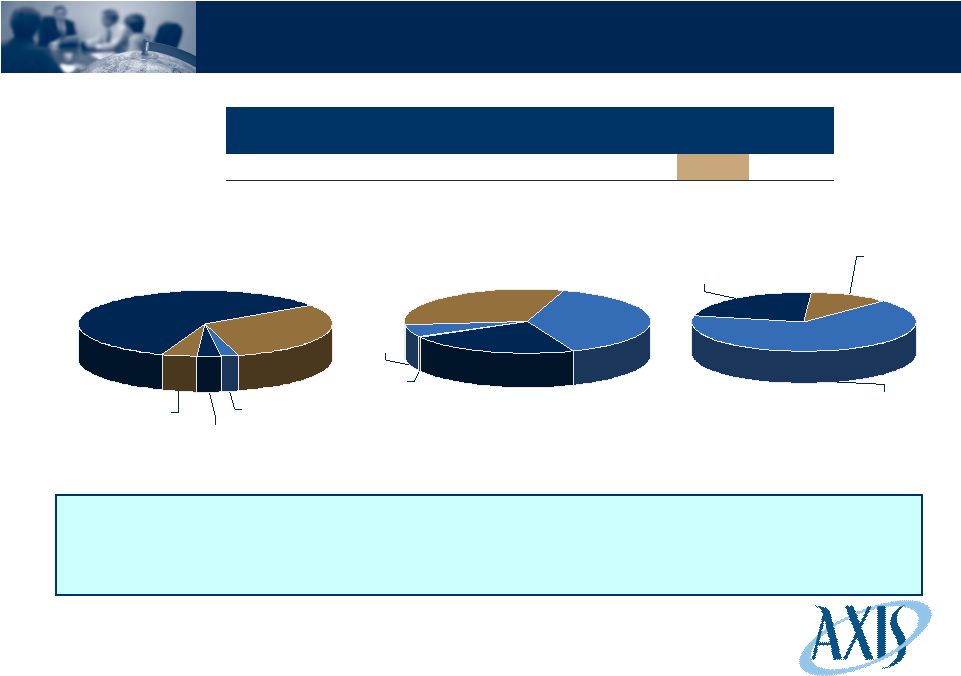
 9 Investment Grade Fixed Income: Corporate Debt Total Corporate Debt: $3.9 Billion (32% of total portfolio) (As of March 31, 2010) *Medium-Term Notes primarily comprise European credit issuances Direct Non Financials 40% Medium Term Notes* 9% Direct Financials 51% • Average corporate debt rating A • Weighted average life of 4.62 years • Duration of 3.59 • Book Yield is 4.5% |
 Investment Grade Corporate Debt: Financials Financials by Subsector: $2.0 Billion (16% of total portfolio) 10 (As of March 31, 2010) Commercial Finance 10% Consumer Finance 3% Corporate Finance 6% Brokerage 13% US Banking 35% Non US Govt Guaranteed 12% Foreign Banks 19% Insurance 2% Amortized Cost Net Unrealized Gain/(Loss) Fair Value US Banking $689 $10 $699 Brokerage 244 10 254 Commercial Finance 185 3 188 Consumer Finance 63 2 65 Corporate Finance 112 1 113 Foreign Banks 373 (5) 368 Insurance 43 1 44 Non US Govt Guaranteed 238 - 238 Total $1,947 $22 $1,969 • Included in Investment Grade Corporate Debt for Financials are $154 million of FDIC guaranteed bonds |
 Corporate Debt - Financials: Detail Amortized Cost Net Unrealized Gain Fair Value Bank of America $136 $3 $139 JP Morgan Chase 132 6 138 Morgan Stanley 132 3 135 General Electric Co 89 2 91 Citigroup Inc 87 3 90 Goldman Sachs 81 4 85 Credit Suisse 62 2 64 Wells Fargo & Co 62 2 64 HSBC Holdings PLC 61 2 63 American Express 34 1 35 Top 10 Direct Financial Holdings ($ in millions) Amortized Cost Net Unrealized Gain Fair Value AAA $465 $1 $466 AA 435 1 436 A 894 16 910 BBB 114 4 118 Below BBB 39 - 39 Total $1,947 $22 $1,969 Financials by Rating ($ in millions) (As of March 31, 2010) 11 |
 Investment Grade Corporate Debt: Non-Financials Amortized Cost Net Unrealized Gain Fair Value Communications $388 $14 $402 Consumer cyclicals 99 1 100 Consumer non cyclicals 285 8 293 Electric 207 9 216 Energy 170 8 178 Industrial 165 7 172 Natural gas 89 1 90 Other 19 - 19 Technology 58 2 60 Transportation 20 1 21 Total $1,500 $51 $1,551 Non-Financials By Subsector: $1.6 Billion (13% of total portfolio) (As of March 31, 2010) 12 Subsector Detail ($ in millions) Consumer cyclicals 6% Technology 4% Other 1% Industrial 11% Transportation 1% Communications 27% Natural gas 6% Energy 11% Consumer non cyclicals 19% Electric 14% |
 Top 10 Direct Non-Financial Holdings ($ in millions) Corporate Debt - Non-Financials: Detail Amortized Cost Net Unrealized Gain Fair Value Verizon Communications $98 $7 $105 AT&T 53 2 55 Time Warner Cable 48 2 50 Comcast Corporation 42 2 44 Kraft Foods Inc 37 1 38 Duke Energy 35 2 37 International Paper Co 33 3 36 Roche Holding AG 30 1 31 Canadian Natural Resources Ltd 27 1 28 Kinder Morgan Energy Partners 27 - 27 Amortized Cost Net Unrealized Gain Fair Value AAA $2 $- $2 AA 132 3 135 A 606 24 630 BBB 748 24 772 Below BBB 12 - 12 Total $1,500 $51 $1,551 Non Financials by Rating ($ in millions) 13 (As of March 31, 2010) |
 14 Investment Grade Corporate Debt: Medium-Term Notes • Credit issuances accessed via medium-term notes which employ leverage • Current leverage 0.48 (for each unit of client capital an additional 0.48 of borrowed capital is employed) • Investment results driven by changes in credit spreads and the yield based on LIBOR plus the credit spread • Average yield of medium-term notes is LIBOR + 278 bps Fair Value by Region Amortized Cost Net Unrealized Gain Fair Value % of Total Portfolio Medium-Term Notes $302 $40 $342 2.8 Fair Value by Rating Fair Value by Sector Medium-Term Notes ($ in millions) (As of March 31, 2010) Middle East 2% UK 30% Western Europe 61% Eastern Europe 3% Other 4% Below BBB 23% BBB 39% AAA 1% AA 6% A 31% ABS 12% Financials 23% Corporate & Sovereign 65% |
 Investment Grade Fixed Income: ABS Amortized Cost Net Unrealized Gain/(Loss) Fair Value Auto ABS $330 $3 $333 CLO – debt tranches 57 (14) 43 CDO 5 (1) 4 Credit card 60 - 60 Equipment 27 - 27 Other ABS 94 2 96 Total $573 $(10) $563 15 ABS by Subsector: $563 Million (4% of total portfolio) (As of March 31, 2010) Auto ABS 59% Equipment 5% Credit card 11% CDO 1% CLO - debt tranches 7% Other ABS 17% Subsector Detail ($ in millions) |
 ABS: Detail Years to Maturity Amortized Cost Net Unrealized Gain/(Loss) Fair Value < 2 $305 $2 $307 2.1 – 3 74 - 74 3.1 – 4 71 (6) 65 4.1 – 5 45 (3) 42 5.1 – 7 30 (4) 26 7.1 – 10 44 2 46 >10 4 (1) 3 Total $573 $(10) $563 16 Maturity Detail ($ in millions) Vintage Detail ($ in millions) (As of March 31, 2010) Vintage AAA AA A BBB Below BBB Total 2010 $81 $- $- $- $- $81 2009 246 - - - - 246 2008 109 - - - - 109 2007 27 - 1 - - 28 2006 25 - - 1 - 26 Other 28 - 10 12 23 73 Total $516 $- $11 $13 $23 $563 Net Unrealized $7 $ - $(2) $(5) $(10) $(10) Key Characteristics • 91.6% AAA • 90 securities • Weighted average life of 2.66 years • Duration of 1.41 • Book yield is 2.3% • Average price of 100% of par Amortized Cost Net Unrealized Gain/(Loss) Fair Value AAA $510 $7 $517 AA - - - A 13 (2) 11 BBB 18 (5) 13 Below BBB 32 (10) 22 Total $573 $(10) $563 Rating Detail ($ in millions) Net Unrealized Loss ($ in millions) |
 Fund of Funds 70% Single Managers 30% Other Investments Overview CLO - equity tranches 11% Hedge Funds 60% Short duration high yield fund 10% Credit funds 19% Total Other Investments: $539 million (4% of total portfolio) (As of March 31, 2010) Hedge Funds Total Other Investments Key Characteristics • Short duration high yield fund – invests mainly in high yield bonds with an average maturity of 2.9 years and average rating of B+ • Credit funds – invest in bank loans, investment grade credit and distressed debt • CLO equity tranches – equity tranches of cash flow collateralized loan obligations that invest primarily in first-lien bank loans • Fund of Funds – seek to achieve attractive risk adjusted total returns by investing in a large diversified portfolio of asset managers • Single managers – invest in event driven, equity long short, and energy MLP strategies 17 |