 AXIS Capital Holdings Limited Investment Portfolio Supplemental Information and Data December 31, 2010 Exhibit 99.3 |
 Cautionary Note on Forward Looking Statements Statements in this presentation that are not historical facts, including statements regarding our estimates, beliefs, expectations, intentions, strategies or projections, may be “forward-looking statements” within the meaning of the U.S. federal securities laws, including the Private Securities Litigation Reform Act of 1995. We intend these forward-looking statements to be covered by the safe harbor provisions for forward-looking statements in the United States securities laws. In some cases, these statements can be identified by the use of forward- looking words such as “may,” “should,” “could,” “anticipate,” “estimate,” “expect,” “plan,” “believe,” “predict,” “potential,” “intend” or similar expressions. Our expectations are not guarantees and are based on currently available competitive, financial and economic data along with our operating plans. Forward-looking statements contained in this presentation may include, but are not limited to, information regarding measurements of potential losses in the fair value of our investment portfolio, our expectations regarding pricing and other market conditions and valuations of the potential impact of movements in interest rates, equity prices, credit spreads and foreign currency rates. Forward-looking statements only reflect our expectations and are not guarantees of performance. Accordingly, there are or will be important factors that could cause actual results to differ materially from those indicated in such statements. We believe that these factors include, but are not limited to, the following: • the occurrence of natural and man-made disasters, • actual claims exceeding our loss reserves, • general economic, capital and credit market conditions, • the failure of any of the loss limitation methods we employ, • the effects of emerging claims and coverage issues, • the failure of our cedants to adequately evaluate risks, • the loss of one or more key executives, • a decline in our ratings with rating agencies, • loss of business provided to us by our major brokers, • changes in accounting policies or practices, • changes in governmental regulations, • increased competition, • changes in the political environment of certain countries in which we operate or underwrite business, and • fluctuations in interest rates, credit spreads, equity prices and/or currency values. We undertake no obligation to update or revise publicly any forward-looking statements, whether as a result of new information, future events or otherwise. This report is for informational purposes only. It should be read in conjunction with the documents that we file with the Securities and Exchange Commission pursuant to the Securities Act of 1933 and the Securities Exchange Act of 1934. |
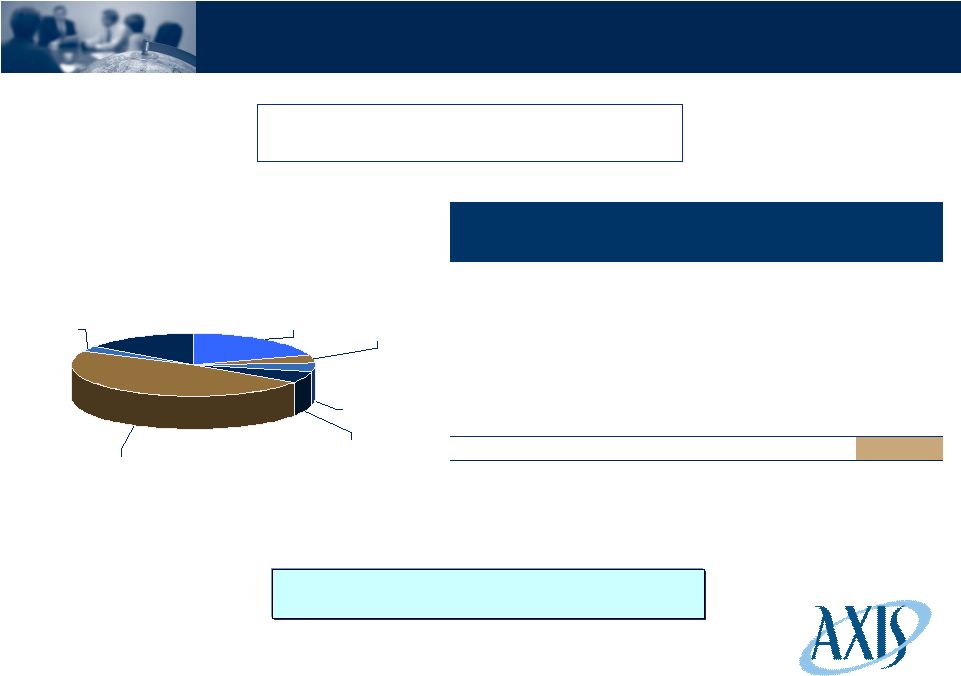
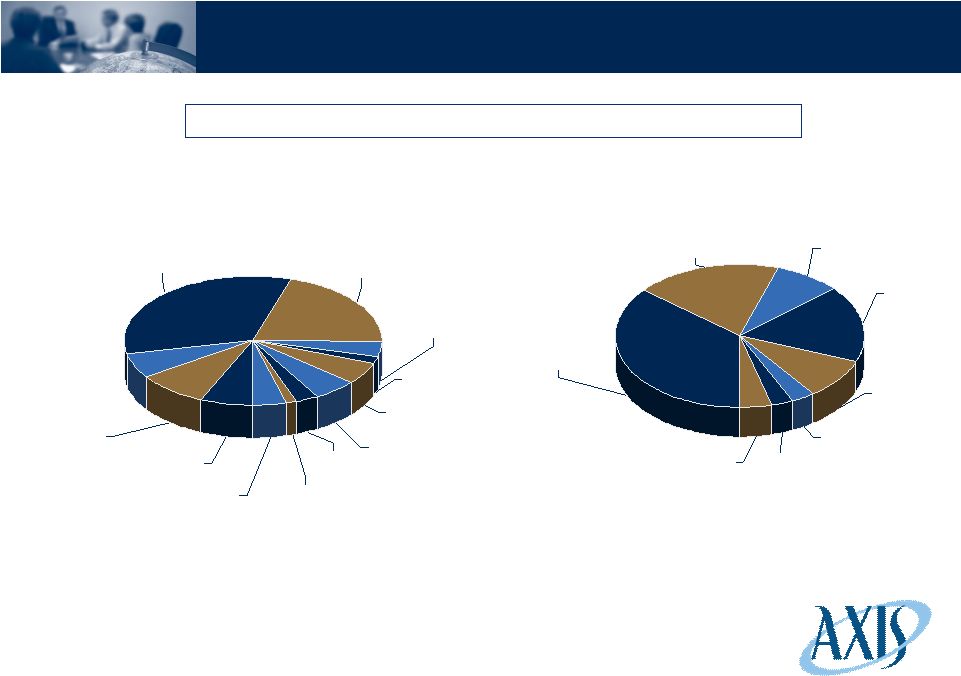 3 Total Cash and Invested Assets Total Cash and Invested Assets: $12.6 Billion Total Portfolio Allocation Total Portfolio Ratings Allocation Note: Other investments include hedge funds, CLO equity tranches and credit funds. (As of December 31, 2010) Equities 3% Short Term Investments 1% Other Investments 4% Municipals 6% Corporates 32% Foreign Govt Agency 6% Cash & Cash Equivalents 9% US Govt/Agency 7% Agency MBS 21% ABS 5% Non Agency RMBS 2% Non Agency CMBS 4% AAA 19% AA 9% Equities 3% Below BBB 3% BBB 9% A 17% US Govt/Agency/Cash & Cash Equivalents/Agency MBS 36% Other Investments (unrated) 4% |
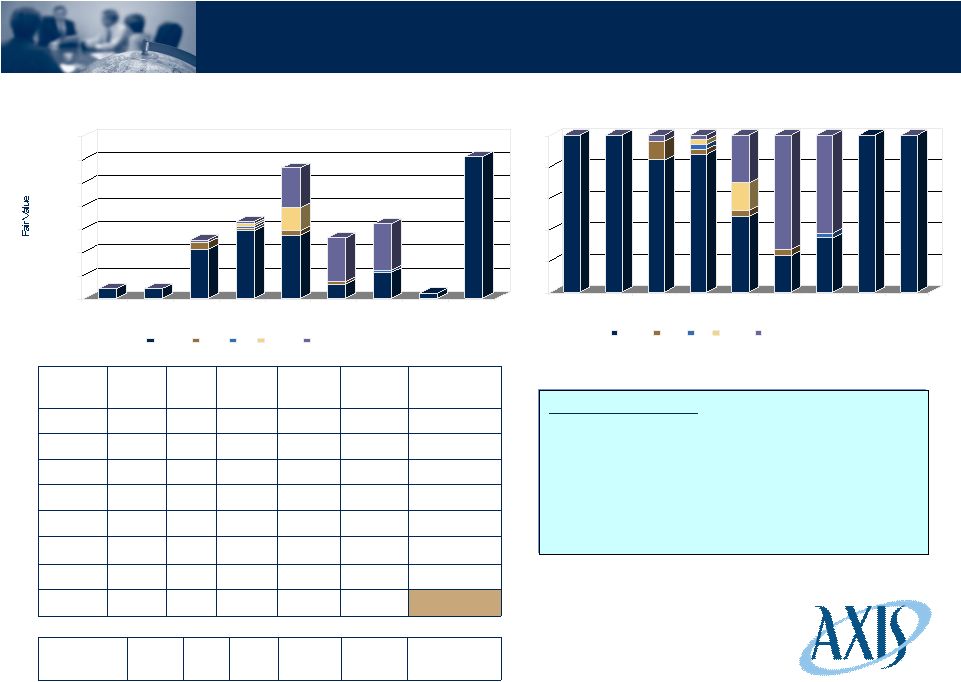
 Non-Agency CMBS: Detail Fair Value ($ in millions) Net Unrealized Gain ($ in millions) Rating by Vintage (%) Rating by Vintage ($ in millions) Vintage AAA AA A BBB Total 2010 $49 $- $- $- $49 2009 17 6 - - 23 2008 6 - - - 6 2007 8 1 52 2 63 2006 70 21 12 - 103 2005 88 8 8 - 104 Other 120 7 - - 127 Total $358 $43 $72 $2 $475 Net Unrealized $14 $2 $5 $- $21 4 Key Characteristics • 75.3% AAA, 96.1% senior/super senior tranches • 115 securities • Weighted average life of 5.23 years • Duration of 3.4 • Book yield is 5.42% • Average price of 104% of par (As of December 31, 2010) Total Non Agency CMBS: $475 Million (4% of total portfolio) $- $20 $40 $60 $80 $100 $120 Pre 2001 2002 2003 2004 2005 2006 2007 2008 2009 2010 AAA AA A BBB 0% 20% 40% 60% 80% 100% Pre 2001 2002 2003 2004 2005 2006 2007 2008 2009 2010 AAA AA A BBB |
 Non-Agency CMBS: Detail (Continued) • Average loan to value of the underlying collateral is 75.6 • Average subordination has improved to 27.1% from 26.2% at origination • Current percentage of defeased collateral is 6.80% • Average current collateral delinquency is 17.64% Asset Class Amortized Cost Net Unrealized Gain Fair Value Retail $144 $7 $151 Office 137 6 143 Multifamily 61 3 64 Hotel 34 1 35 Industrial 23 1 24 Mixed use 13 1 14 Self storage 11 1 12 Mobile home 9 - 9 Healthcare 7 - 7 Other 15 1 16 Total $454 $21 $475 5 Years to Maturity Amortized Cost Net Unrealized Gain Fair Value < 2 $93 $1 $94 2.1 – 3 40 2 42 3.1 – 4 31 1 32 4.1 – 5 34 2 36 5.1 – 7 213 15 228 7.1 – 10 32 - 32 > 10 11 - 11 Total $454 $21 $475 Collateral Property Type ($ in millions) Maturity Detail ($ in millions) (As of December 31, 2010) |
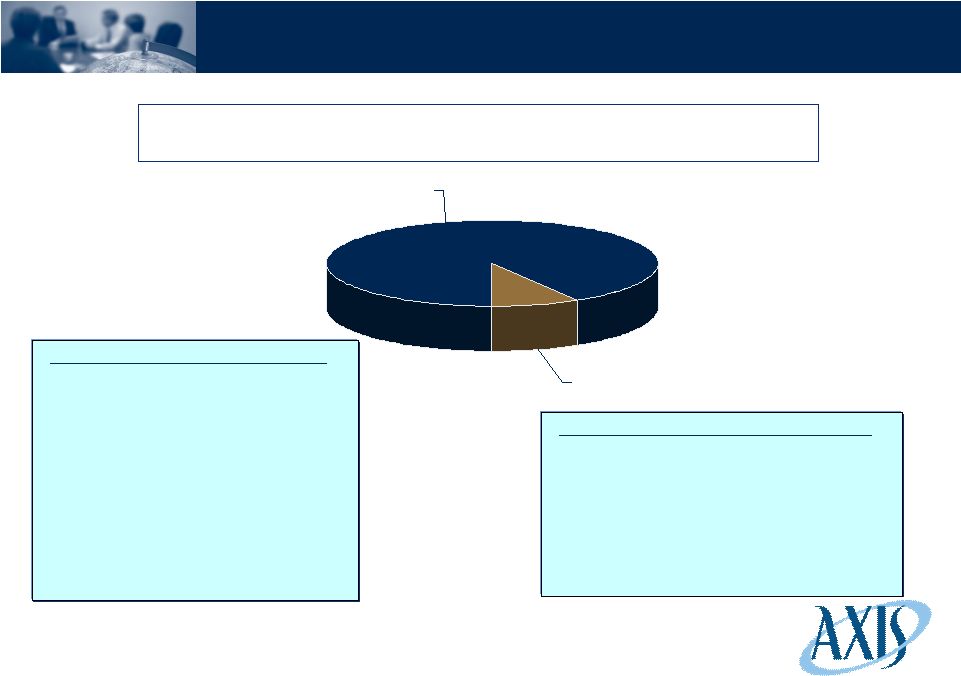 6 Agency and Non-Agency RMBS: Detail Key Characteristics – Non Agency RMBS • Non-Agency RMBS have an amortized cost of $252 million with net unrealized loss of $8 million • This sector includes prime, Alt-A and subprime collateral • Non-Agency RMBS is 67.4% AAA-rated as detailed on the following slides Total Agency and Non-Agency RMBS: $2.8 Billion (22% of total portfolio) Key Characteristics – Agency RMBS • Primarily pass-through securities issued by the Federal Home Loan Mortgage Corporation, Federal National Mortgage Association, and the Government National Mortgage Association • These securities have an amortized cost of $2.6 billion with a net unrealized gain of $22 million • Duration of 3.45 • Book yield is 2.60% (As of December 31, 2010) Agency RMBS 91% Non-Agency RMBS 9% |
 Non-Agency RMBS: Detail Fair Value ($ in millions) Rating by Vintage (%) Rating by Vintage ($ in millions) Vintage AAA AA A BBB Below BBB Total 2010 $61 $- $- $- $- $61 2009 2 - - - - 2 2007 11 - 1 - 20 32 2006 6 1 - - 19 26 2005 27 2 - 11 17 57 2004 29 1 1 1 1 33 Other 28 4 - - 1 33 Total $164 $8 $2 $12 $58 $244 Net Unrealized $(4) $(1) $- $(1) $(2) $(8) Net Unrealized (Loss) ($ in millions) 7 Key Characteristics • 67.4% AAA • 169 securities • Weighted average life of 8.28 years • Duration of 0.24 • Book yield is 4.87% • Average price of 94% par (As of December 31, 2010) $- $10 $20 $30 $40 $50 $60 $70 Pre 2001 2002 2003 2004 2005 2006 2007 2009 2010 AAA AA A BBB Below BBB 0% 20% 40% 60% 80% 100% Pre 2001 2002 2003 2004 2005 2006 2007 2009 2010 AAA AA A BBB Below BBB |
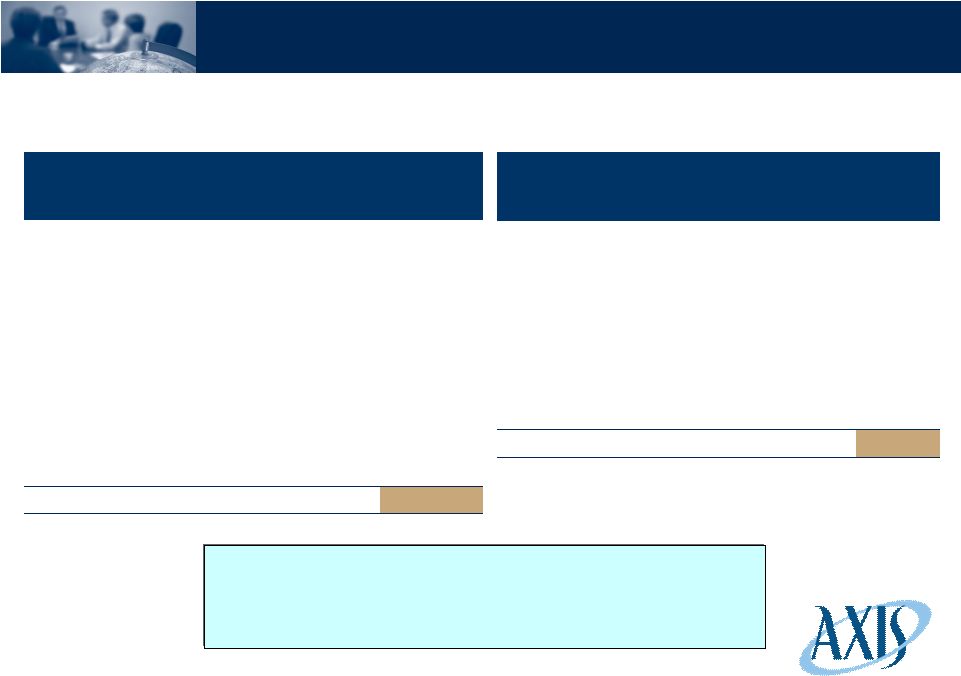
 Direct Non Financials 56% Medium Term Notes* 3% Direct Financials 41% 8 Corporate Debt: Detail Total Corporate Debt: $4.2 Billion (32% of total portfolio) (As of December 31, 2010) *Medium-Term Notes primarily comprise European credit issuances • Average corporate debt rating A- • Weighted average life of years 4.40 • Duration of 3.46 • Book Yield is 4.83% |
 Corporate Debt – Financials: Details Financials by Subsector: $1.7 Billion (14% of total portfolio) 9 (As of December 31, 2010) Commercial Finance 4% Consumer Finance 5% Corporate Finance 5% US Banking/Brokerage 48% Insurance 3% Foreign Banks 20% Non US Govt Guaranteed 15% Amortized Cost Net Unrealized Gain Fair Value US Banking / Brokerage $792 $27 $819 Foreign Banks 344 1 345 Non US Govt Guaranteed 259 3 262 Corporate Finance 94 - 94 Consumer Finance 80 3 83 Commercial Finance 72 - 72 Insurance 47 1 48 Total $1,688 $35 $1,723 • Included in Investment Grade Corporate Debt for Financials are $49 million of FDIC guaranteed bonds |
 Corporate Debt – Financials: Details (Continued) Amortized Cost Net Unrealized Gain Fair Value JP Morgan Chase $138 $3 $141 Morgan Stanley 130 2 132 Bank of America 104 3 107 General Electric Co 92 - 92 Goldman Sachs 87 4 91 Citigroup Inc 86 5 91 HSBC Holdings PLC 66 2 68 US Bancorp 66 - 66 Credit Suisse 45 2 47 KFW Group Corp 45 - 45 Top 10 Direct Financial Holdings ($ in millions) Amortized Cost Net Unrealized Gain Fair Value AAA $292 $6 $298 AA 389 4 393 A 886 20 906 BBB 110 5 115 Below BBB 11 - 11 Total $1,688 $35 $1,723 Financials by Rating ($ in millions) (As of December 31, 2010) 10 |
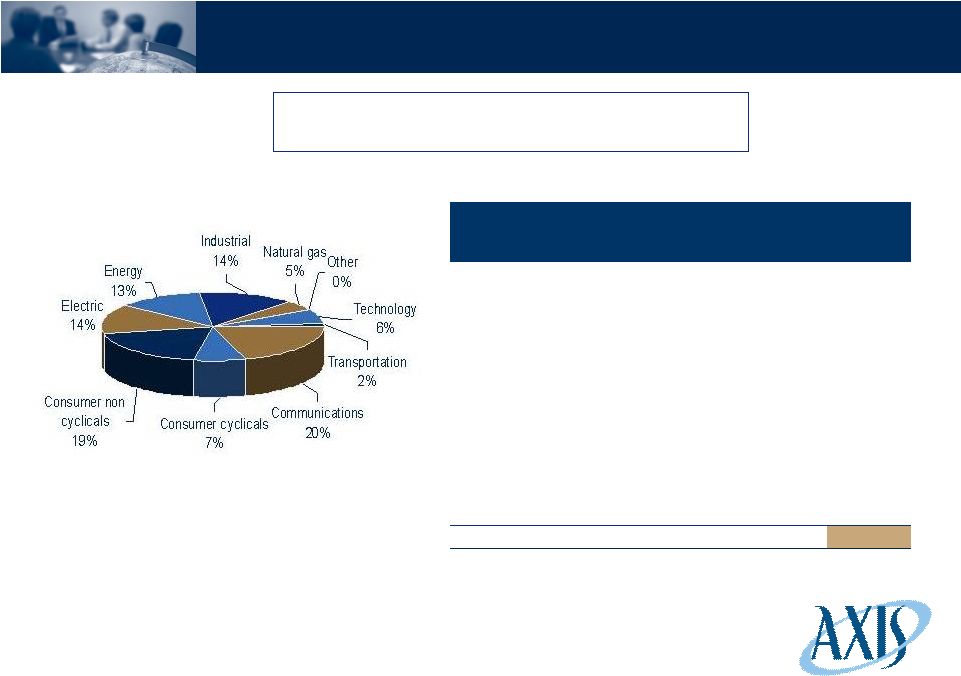 Corporate Debt – Non-Financials: Detail Amortized Cost Net Unrealized Gain Fair Value Communications $460 $16 $476 Consumer non cyclicals 420 14 434 Electric 318 10 328 Industrial 314 6 320 Energy 281 11 292 Consumer cyclicals 171 2 173 Technology 148 1 149 Natural gas 108 2 110 Transportation 37 0 37 Other 11 0 11 Total $2,268 $62 $2,330 Non-Financials By Subsector: $2.3 Billion (18% of total portfolio) (As of December 31, 2010) 11 Subsector Detail ($ in millions) |
 Top 10 Direct Non-Financial Holdings ($ in millions) Corporate Debt – Non-Financials: Detail (Continued) Amortized Cost Net Unrealized Gain/(Loss) Fair Value BP PLC 75 4 79 Kraft Foods Inc. 59 3 62 Duke Energy Corp 56 2 58 AT&T 55 2 57 Anheuser-Busch 47 1 48 Directv 45 (1) 44 Occidental Petroleum Corp 42 2 44 Time Warner Cable 41 2 43 Verizon Communications Inc. 40 4 44 Pfizer Inc 35 1 36 Amortized Cost Net Unrealized Gain Fair Value AAA $42 $- $42 AA 154 5 159 A 927 34 961 BBB 890 22 912 Below BBB 255 1 256 Total $2,268 $62 $2,330 Non Financials by Rating ($ in millions) 12 (As of December 31, 2010) |
 ABS: Detail Amortized Cost Net Unrealized Gain/(Loss) Fair Value Auto $354 $4 $358 Student Loan 122 3 125 Credit card 83 - 83 CLO – debt tranches 57 (14) 43 Equipment 15 - 15 CDO 4 - 4 Other ABS 33 1 34 Total $668 $(6) $662 13 ABS by Subsector: $662 Million (5% of total portfolio) (As of December 31, 2010) Subsector Detail ($ in millions) Key Characteristics • 93.1% AAA • 105 securities • Weighted average life of years 3.75 • Duration of 1.04 • Book yield is 1.97% • Average price of 102% of par |
 Fund of Funds 66% Single Managers 34% Other Investments Overview CLO - equity tranches 11% Credit funds 20% Hedge Funds 69% Total Other Investments: $519 million (4% of total portfolio) (As of December 31, 2010) 14 Key Characteristics • Credit funds – invest in bank loans, investment grade credit and distressed debt • CLO equity tranches – equity tranches of cash flow collateralized loan obligations that invest primarily in first-lien bank loans • Fund of Funds – seek to achieve attractive risk adjusted total returns by investing in a large diversified portfolio of asset managers • Single managers – invest in event driven, equity long short, and energy MLP strategies Hedge Funds Total Other Investments |