Exhibit 99.2
AXIS
AXIS Capital Holdings Limited
INVESTOR FINANCIAL SUPPLEMENT
SECOND QUARTER 2011
AXIS Capital Holdings Limited
92 Pitts Bay Road
Pembroke HM 08 Bermuda
Contact Information:
Linda Ventresca
Investor Relations
441 405 2727
investorrelations@axiscapital.com
Website Information:
www.axiscapital.com
This report is for informational purposes only. It should be read in conjunction
with the documents that we file with the Securities and Exchange Commission
pursuant to the Securities Act of 1933 and the Securities Exchange Act of 1934.
AXIS Capital Holdings Limited
FINANCIAL SUPPLEMENT TABLE OF CONTENTS
Page(s)
Basis of Presentation i - iii
I. Financial Highlights 1
II. Income Statements
a. Consolidated Statements of Income - Quarterly 2
b. Consolidated Statements of Income - Year to Date 3
b. Consolidated Segment Data 4
d. Gross Premium Written by Segment by Line of Business 5
e. Segment Data - Quarterly 6-7
f. Net Investment Income - Quarterly 8
III. Balance Sheets
a. Consolidated Balance Sheets 9
b. Cash and Invested Assets:
• Cash and Invested Assets Portfolio 10
• Cash and Invested Assets Composition - Quarterly 11
• Corporate Debt Composition 12
• Ten Largest Issuer Holdings in Fixed Maturity Portfolio 13
• Mortgage Backed and Assets Backed Securities Composition 14
c. Reinsurance Recoverable Analysis 15-16
IV. Loss Reserve Analysis
a. Paid to Incurred Analysis 17
b. Paid to Incurred Analysis by Segment 18
c. Paid to Incurred Analysis by Segment - Quarterly 19-20
d. Impact of Major 2011 Catastrophe Events 21
e. Net Probable Maximum Losses to Certain Peak Industry Catastrophe Exposures
V. Share Analysis
a. Earnings Per Common Share Analysis - As Reported, GAAP 23
b. Earnings Per Common Share Analysis and Common Share Rollforward - Quarterly 24
c. Diluted Book Value Per Common Share Analysis 25
VI. Non-GAAP Financial Measures
a. Non-GAAP Financial Measure Reconciliation 26
AXIS
AXIS Capital Holdings Limited
BASIS OF PRESENTATION
DEFINITIONS AND PRESENTATION
Unless otherwise noted, all data is in thousands, except for per share amounts and ratio information.
All financial information contained herein is unaudited, except for the consolidated balance sheet at December 31, 2010.
Amounts may not reconcile exactly due to rounding differences.
NM - Not meaningful; NR - Not Reported; NA - Not applicable
CAUTIONARY NOTE REGARDING FORWARD-LOOKING STATEMENTS:
Statements in this presentation that are not historical facts, including statements regarding our estimates, beliefs, expectations, intentions, strategies or projections, may be “forward-looking statements” within the meaning of the U.S. federal securities laws, including the Private Securities Litigation Reform Act of 1995. We intend these forward-looking statements to be covered by the safe harbor provisions for forward-looking statements in the United States securities laws. In some cases, these statements can be identified by the use of forward-looking words such as “may,” “should,” “could,” “anticipate,” “estimate,” “expect,” “plan,” “believe,” “predict,” “potential,” “intend” or similar expressions. Our expectations are not guarantees and are based on currently available competitive, financial and economic data along with our operating plans. Forward-looking statements contained in this presentation may include, but are not limited to, information regarding our estimates of losses related to catastrophes and other large losses, measurements of potential losses in the fair market value of our investment portfolio, our expectations regarding pricing and other market conditions, our growth prospects, and valuations of the potential impact of movements in interest rates, equity prices, credit spreads and foreign currency rates.
Forward-looking statements only reflect our expectations and are not guarantees of performance. Accordingly, there are or will be important factors that could cause actual results to differ materially from those indicated in such statements. We believe that these factors include, but are not limited to, the following:
• the occurrence and magnitude of natural and man-made disasters,
• actual claims exceeding our loss reserves,
• general economic, capital and credit market conditions,
• the failure of any of the loss limitation methods we employ,
• the effects of emerging claims, coverage and regulatory issues,
• the failure of our cedants to adequately evaluate risks,
• inability to obtain additional capital on favorable terms, or at all,
• the loss of one or more key executives,
• a decline in our ratings with rating agencies,
• loss of business provided to us by our major brokers,
• changes in accounting policies or practices,
• the use of industry catastrophe models and changes to those models,
• changes in governmental regulations,
• increased competition,
• changes in the political environment of certain countries in which we operate or underwrite business, and
• fluctuations in interest rates, credit spreads, equity prices and/or currency values.
We undertake no obligation to update or revise publicly any forward-looking statements, whether as a result of new information, future events or otherwise.
i
AXIS
AXIS Capital Holdings Limited
BASIS OF PRESENTATION
BUSINESS DESCRIPTIONS
INSURANCE SEGMENT
Our insurance segment offers specialty insurance products to a variety of niche markets on a worldwide basis. The following are the lines of business in our insurance segment:
Property: provides physical loss or damage, business interruption and machinery breakdown coverage for virtually all types of property, including commercial buildings, residential premises, construction projects and onshore energy installations. This line of business consists of both primary and excess risks, some of which are catastrophe-exposed.
Marine: provides coverage for traditional marine classes, including offshore energy, cargo, liability, recreational marine, fine art, specie, hull and war. Offshore energy coverages include physical damage, business interruption, operators extra expense and liability coverage for all aspects of offshore upstream energy, from exploration and construction through the operation and distribution phases.
Terrorism: provides coverage for physical damage and business interruption of an insured following an act of terrorism.
Aviation: provides hull and liability and specific war coverage primarily for passenger airlines but also for cargo operations, general aviation operations, airports, aviation authorities, security firms and product manufacturers.
Credit and political risk: provides credit and political risk insurance products for banks and corporations. Coverage is provided for a range of risks including sovereign default, credit default, political violence, currency inconvertibility and non-transfer, expropriation, aircraft non-repossession and contract frustration due to political events. The credit insurance coverage is primarily for lenders seeking to mitigate the risk of non-payment from their borrowers in emerging markets. For the credit insurance contracts, it is necessary for the buyer of the insurance (most often a bank) to hold an insured asset (most often an underlying loan) in order to claim compensation under the insurance contract. The traditional political risk coverage provides protection against sovereign actions that result in the impairment of cross-border investments for banks and major corporations (known as “CEND” coverages).
Professional lines: provides coverage for directors’ and officers’ liability, errors and omissions liability, employment practices liability, fiduciary liability, crime, professional indemnity and other financial insurance related coverages for commercial enterprises, financial institutions and not-for-profit organizations. This business is predominantly written on a claims-made basis.
Liability: primarily targets primary and low/mid-level excess and umbrella commercial liability risks in the U.S. excess and surplus lines markets. Target industry sectors include construction, manufacturing, transportation and trucking and other services.
Accident & Health: Global Accident & Health business, including accidental death and sickness insurance for employer and affinity groups, financial institutions, schools and colleges, as well as accident reinsurance for catastrophic events on a quota share and/or excess of loss basis, with aggregate and/or per person deductibles.
ii
AXIS
AXIS Capital Holdings Limited
BASIS OF PRESENTATION
BUSINESS DESCRIPTIONS (CONTINUED)
REINSURANCE SEGMENT
Our reinsurance segment provides non-life reinsurance to insurance companies on a worldwide basis. The following are the lines of business in our reinsurance segment:
Catastrophe: provides protection for most catastrophic losses that are covered in the underlying insurance policies written by our cedants. The exposure in the underlying policies is principally property exposure but also covers other exposures including workers compensation, personal accident and life. The principal perils in this portfolio are hurricane and windstorm, earthquake, flood, tornado, hail and fire. In some instances, terrorism may be a covered peril or the only peril. We underwrite catastrophe reinsurance principally on an excess of loss basis.
Property: includes reinsurance written on both a proportional and a per risk excess of loss basis and covers underlying personal lines and commercial property exposures. Here the primary reason for the product is not simply to protect against catastrophic perils, however they are normally included with limitations.
Professional Liability: covers directors’ and officers’ liability, employment practices liability, medical malpractice, lawyers’ and accountants’ liability, environmental liability and miscellaneous errors and omissions insurance risks. The underlying business is predominantly written on a claims-made basis. Business is written on both a proportional and excess of loss basis.
Credit and Bond: consists of reinsurance of trade credit insurance products and includes both proportional and excess of loss structures. The underlying insurance indemnifies sellers of goods and services in the event of a payment default by the buyer of those goods and services. Also included in this line of business is coverage for losses arising from a broad array of surety bonds issued by bond insurers principally to satisfy regulatory demands in a variety of jurisdictions around the world.
Motor: provides coverage to cedants for motor liability and, to a lesser degree, property damage losses arising out of any one occurrence. The occurrence can involve one or many claimants where the ceding insurer aggregates the claims from the occurrence.
Liability: provides coverage to insurers of standard casualty business, excess and surplus casualty business and specialty casualty programs. The primary focus of the underlying business is general liability, although workers compensation and auto liability are also written.
Engineering: provides coverage for all types of construction risks and risks associated with erection, testing and commissioning of machinery and plants during the construction stage. This line of business also includes coverage for losses arising from operational failures of machinery, plant and equipment and electronic equipment as well as business interruption.
Other: includes aviation, marine, personal accident and crop reinsurance.
iii
AXIS
AXIS Capital Holdings Limited
FINANCIAL HIGHLIGHTS
Quarter ended June 30, Six months ended June 30,
2011 2010 Change 2011 2010 Change
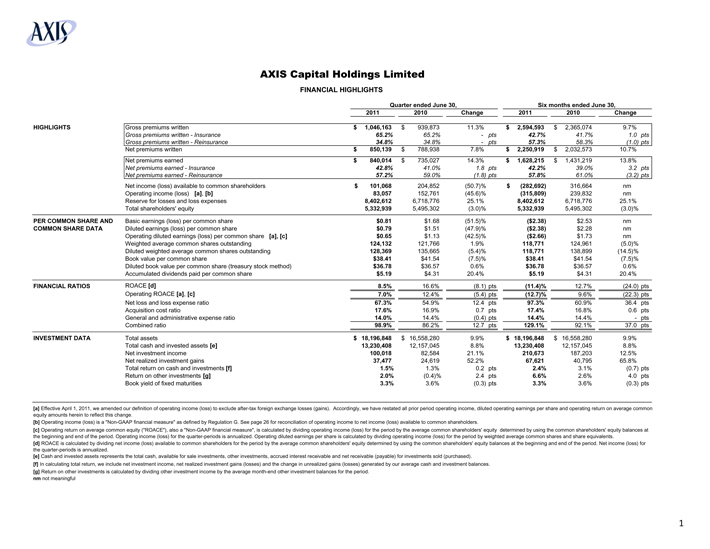
HIGHLIGHTS Gross premiums written $ 1,046,163 $ 939,873 11.3% $ 2,594,593 $ 2,365,074 9.7%
Gross premiums written - Insurance 65.2% 65.2% - pts 42.7% 41.7% 1.0 pts
Gross premiums written - Reinsurance 34.8% 34.8% - pts 57.3% 58.3% (1.0) pts
Net premiums written $ 850,139 $ 788,938 7.8% $ 2,250,919 $ 2,032,573 10.7%
Net premiums earned $ 840,014 $ 735,027 14.3% $ 1,628,215 $ 1,431,219 13.8%
Net premiums earned - Insurance 42.8% 41.0% 1.8 pts 42.2% 39.0% 3.2 pts
Net premiums earned - Reinsurance 57.2% 59.0% (1.8) pts 57.8% 61.0% (3.2) pts
Net income (loss) available to common shareholders $ 101,068 204,852 (50.7)% $ (282,692) 316,664 nm
Operating income (loss) [a], [b] 83,057 152,761 (45.6)% (315,809) 239,832 nm
Reserve for losses and loss expenses 8,402,612 6,718,776 25.1% 8,402,612 6,718,776 25.1%
Total shareholders’ equity 5,332,939 5,495,302 (3.0)% 5,332,939 5,495,302 (3.0)%
PER COMMON SHARE AND Basic earnings (loss) per common share $0.81 $1.68 (51.5)% ($2.38) $2.53 nm
COMMON SHARE DATA Diluted earnings (loss) per common share $0.79 $1.51 (47.9)% ($2.38) $2.28 nm
Operating diluted earnings (loss) per common share [a], [c] $0.65 $1.13 (42.5)% ($2.66) $1.73 nm
Weighted average common shares outstanding 124,132 121,766 1.9% 118,771 124,961 (5.0)%
Diluted weighted average common shares outstanding 128,369 135,665 (5.4)% 118,771 138,899 (14.5)%
Book value per common share $38.41 $41.54 (7.5)% $38.41 $41.54 (7.5)%
Diluted book value per common share (treasury stock method) $36.78 $36.57 0.6% $36.78 $36.57 0.6%
Accumulated dividends paid per common share $5.19 $4.31 20.4% $5.19 $4.31 20.4%
FINANCIAL RATIOS ROACE [d] 8.5% 16.6% (8.1) pts (11.4)% 12.7% (24.0) pts
Operating ROACE [a], [c] 7.0% 12.4% (5.4) pts(12.7)% 9.6% (22.3) pts
Net loss and loss expense ratio 67.3% 54.9% 12.4 pts 97.3% 60.9% 36.4 pts
Acquisition cost ratio 17.6% 16.9% 0.7 pts 17.4% 16.8% 0.6 pts
General and administrative expense ratio 14.0% 14.4% (0.4) pts 14.4% 14.4% - pts
Combined ratio 98.9% 86.2% 12.7 pts 129.1% 92.1% 37.0 pts
INVESTMENT DATA Total assets $ 18,196,848 $ 16,558,280 9.9% $ 18,196,848 $ 16,558,280 9.9%
Total cash and invested assets [e] 13,230,408 12,157,045 8.8% 13,230,408 12,157,045 8.8%
Net investment income 100,018 82,584 21.1% 210,673 187,203 12.5%
Net realized investment gains 37,477 24,619 52.2% 67,621 40,795 65.8%
Total return on cash and investments [f] 1.5% 1.3% 0.2 pts 2.4% 3.1% (0.7) pts
Return on other investments [g] 2.0% (0.4)% 2.4 pts 6.6% 2.6% 4.0 pts
Book yield of fixed maturities 3.3% 3.6% (0.3) pts 3.3% 3.6% (0.3) pts
[a] Effective April 1, 2011, we amended our definition of operating income (loss) to exclude after-tax foreign exchange losses (gains). Accordingly, we have restated all prior period operating income, diluted operating earnings per share and operating return on average common equity amounts herein to reflect this change.
[b] Operating income (loss) is a “Non-GAAP financial measure” as defined by Regulation G. See page 26 for reconciliation of operating income to net income (loss) available to common shareholders.
[c] Operating return on average common equity (“ROACE”), also a “Non-GAAP financial measure”, is calculated by dividing operating income (loss) for the period by the average common shareholders’ equity determined by using the common shareholders’ equity balances at the beginning and end of the period. Operating income (loss) for the quarter-periods is annualized. Operating diluted earnings per share is calculated by dividing operating income (loss) for the period by weighted average common shares and share equivalents.
[d] ROACE is calculated by dividing net income (loss) available to common shareholders for the period by the average common shareholders’ equity determined by using the common shareholders’ equity balances at the beginning and end of the period. Net income (loss) for the quarter-periods is annualized.
[e] Cash and invested assets represents the total cash, available for sale investments, other investments, accrued interest receivable and net receivable (payable) for investments sold (purchased).
[f] In calculating total return, we include net investment income, net realized investment gains (losses) and the change in unrealized gains (losses) generated by our average cash and investment balances.
[g] Return on other investments is calculated by dividing other investment income by the average month-end other investment balances for the period.
nm not meaningful
1
AXIS
AXIS Capital Holdings Limited
CONSOLIDATED STATEMENTS OF INCOME - QUARTERLY
Q2 2011 Q1 2011 Q4 2010 Q3 2010 Q2 2010 Q2 2009
UNDERWRITING REVENUES
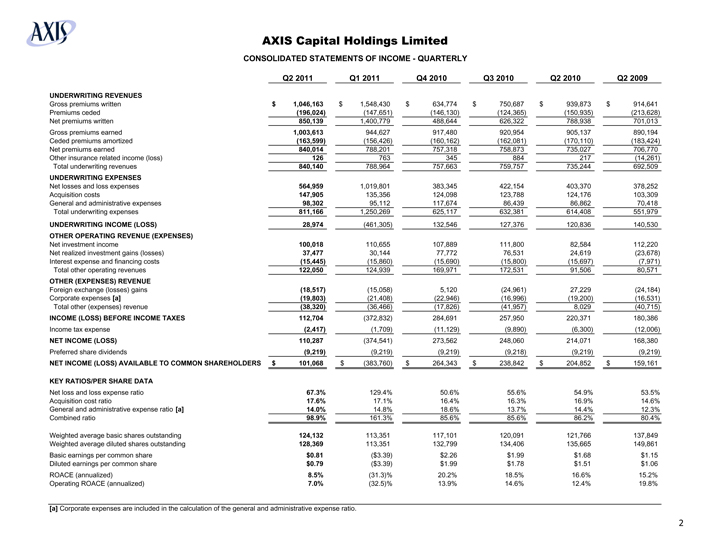
Gross premiums written $ 1,046,163 $ 1,548,430 $ 634,774 $ 750,687 $ 939,873 $ 914,641
Premiums ceded (196,024) (147,651) (146,130) (124,365) (150,935) (213,628)
Net premiums written 850,139 1,400,779 488,644 626,322 788,938 701,013
Gross premiums earned 1,003,613 944,627 917,480 920,954 905,137 890,194
Ceded premiums amortized (163,599) (156,426) (160,162) (162,081) (170,110) (183,424)
Net premiums earned 840,014 788,201 757,318 758,873 735,027 706,770
Other insurance related income (loss) 126 763 345 884 217 (14,261)
Total underwriting revenues 840,140 788,964 757,663 759,757 735,244 692,509
UNDERWRITING EXPENSES
Net losses and loss expenses 564,959 1,019,801 383,345 422,154 403,370 378,252
Acquisition costs 147,905 135,356 124,098 123,788 124,176 103,309
General and administrative expenses 98,302 95,112 117,674 86,439 86,862 70,418
Total underwriting expenses 811,166 1,250,269 625,117 632,381 614,408 551,979
UNDERWRITING INCOME (LOSS) 28,974 (461,305) 132,546 127,376 120,836 140,530
OTHER OPERATING REVENUE (EXPENSES)
Net investment income 100,018 110,655 107,889 111,800 82,584 112,220
Net realized investment gains (losses) 37,477 30,144 77,772 76,531 24,619 (23,678)
Interest expense and financing costs (15,445) (15,860) (15,690) (15,800) (15,697) (7,971)
Total other operating revenues 122,050 124,939 169,971 172,531 91,506 80,571
OTHER (EXPENSES) REVENUE
Foreign exchange (losses) gains (18,517) (15,058) 5,120 (24,961) 27,229 (24,184)
Corporate expenses [a] (19,803) (21,408) (22,946) (16,996) (19,200) (16,531)
Total other (expenses) revenue (38,320) (36,466) (17,826) (41,957) 8,029 (40,715)
INCOME (LOSS) BEFORE INCOME TAXES 112,704 (372,832) 284,691 257,950 220,371 180,386
Income tax expense (2,417) (1,709) (11,129) (9,890) (6,300) (12,006)
NET INCOME (LOSS) 110,287 (374,541) 273,562 248,060 214,071 168,380
Preferred share dividends (9,219) (9,219) (9,219) (9,218) (9,219) (9,219)
NET INCOME (LOSS) AVAILABLE TO COMMON SHAREHOLDERS $ 101,068 $ (383,760) $ 264,343 $ 238,842 $ 204,852 $ 159,161
KEY RATIOS/PER SHARE DATA
Net loss and loss expense ratio 67.3% 129.4% 50.6% 55.6% 54.9% 53.5%
Acquisition cost ratio 17.6% 17.1% 16.4% 16.3% 16.9% 14.6%
General and administrative expense ratio [a] 14.0% 14.8% 18.6% 13.7% 14.4% 12.3%
Combined ratio 98.9% 161.3% 85.6% 85.6% 86.2% 80.4%
Weighted average basic shares outstanding 124,132 113,351 117,101 120,091 121,766 137,849
Weighted average diluted shares outstanding 128,369 113,351 132,799 134,406 135,665 149,861
Basic earnings per common share $0.81 ($3.39) $2.26 $1.99 $1.68 $1.15
Diluted earnings per common share $0.79 ($3.39) $1.99 $1.78 $1.51 $1.06
ROACE (annualized) 8.5% (31.3)% 20.2% 18.5% 16.6% 15.2%
Operating ROACE (annualized) 7.0% (32.5)% 13.9% 14.6% 12.4% 19.8%
[a] Corporate expenses are included in the calculation of the general and administrative expense ratio.
2
AXIS Capital Holdings Limited
CONSOLIDATED STATEMENTS OF INCOME - YEAR TO DATE
Six months ended June 30, Year ended December 31,
2011 2010 2009 2010 2009
UNDERWRITING REVENUES
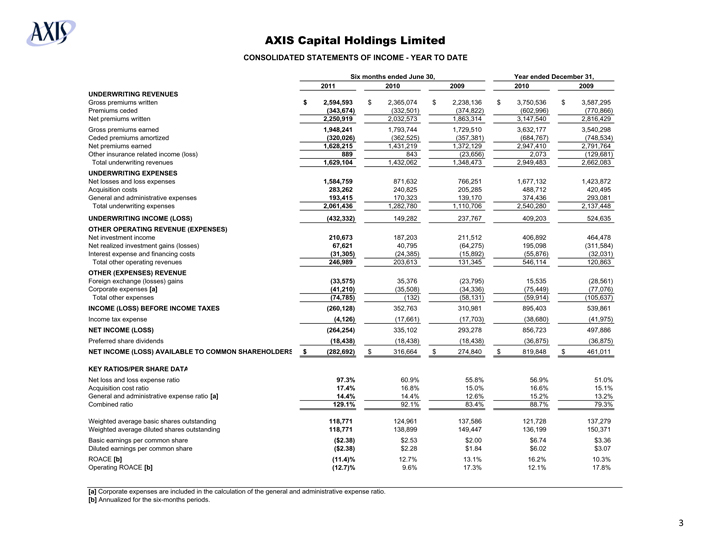
Gross premiums written $ 2,594,593 $ 2,365,074 $ 2,238,136 $ 3,750,536 $ 3,587,295
Premiums ceded (343,674) (332,501)(374,822)(602,996)(770,866)
Net premiums written 2,250,919 2,032,573 1,863,314 3,147,540 2,816,429
Gross premiums earned 1,948,241 1,793,744 1,729,510 3,632,177 3,540,298
Ceded premiums amortized (320,026) (362,525) (357,381) (684,767) (748,534)
Net premiums earned 1,628,215 1,431,219 1,372,129 2,947,410 2,791,764
Other insurance related income (loss) 889 843 (23,656) 2,073 (129,681)
Total underwriting revenues 1,629,104 1,432,062 1,348,473 2,949,483 2,662,083
UNDERWRITING EXPENSES
Net losses and loss expenses 1,584,759 871,632 766,251 1,677,132 1,423,872
Acquisition costs 283,262 240,825 205,285 488,712 420,495
General and administrative expenses 193,415 170,323 139,170 374,436 293,081
Total underwriting expenses 2,061,436 1,282,780 1,110,706 2,540,280 2,137,448
UNDERWRITING INCOME (LOSS) (432,332) 149,282 237,767 409,203 524,635
OTHER OPERATING REVENUE (EXPENSES)
Net investment income 210,673 187,203 211,512 406,892 464,478
Net realized investment gains (losses) 67,621 40,795 (64,275) 195,098 (311,584)
Interest expense and financing costs (31,305) (24,385) (15,892) (55,876) (32,031)
Total other operating revenues 246,989 203,613 131,345 546,114 120,863
OTHER (EXPENSES) REVENUE
Foreign exchange (losses) gains (33,575) 35,376 (23,795) 15,535 (28,561)
Corporate expenses [a] (41,210) (35,508) (34,336) (75,449) (77,076)
Total other expenses (74,785) (132) (58,131) (59,914) (105,637)
INCOME (LOSS) BEFORE INCOME TAXES (260,128) 352,763 310,981 895,403 539,861
Income tax expense (4,126) (17,661) (17,703) (38,680) (41,975)
NET INCOME (LOSS) (264,254) 335,102 293,278 856,723 497,886
Preferred share dividends (18,438) (18,438) (18,438) (36,875) (36,875)
NET INCOME (LOSS) AVAILABLE TO COMMON SHAREHOLDERS $ (282,692) $ 316,664 $ 274,840 $ 819,848 $ 461,011
KEY RATIOS/PER SHARE DATA
Net loss and loss expense ratio 97.3% 60.9% 55.8% 56.9% 51.0%
Acquisition cost ratio 17.4% 16.8% 15.0% 16.6% 15.1%
General and administrative expense ratio [a] 14.4% 14.4% 12.6% 15.2% 13.2%
Combined ratio 129.1% 92.1% 83.4% 88.7% 79.3%
Weighted average basic shares outstanding 118,771 124,961 137,586 121,728 137,279
Weighted average diluted shares outstanding 118,771 138,899 149,447 136,199 150,371
Basic earnings per common share ($2.38) $2.53 $2.00 $6.74 $3.36
Diluted earnings per common share ($2.38) $2.28 $1.84 $6.02 $3.07
ROACE [b] (11.4)% 12.7% 13.1% 16.2% 10.3%
Operating ROACE [b] (12.7)% 9.6% 17.3% 12.1% 17.8%
[a] Corporate expenses are included in the calculation of the general and administrative expense ratio.
[b] Annualized for the six-months periods.
3
AXIS Capital Holdings Limited
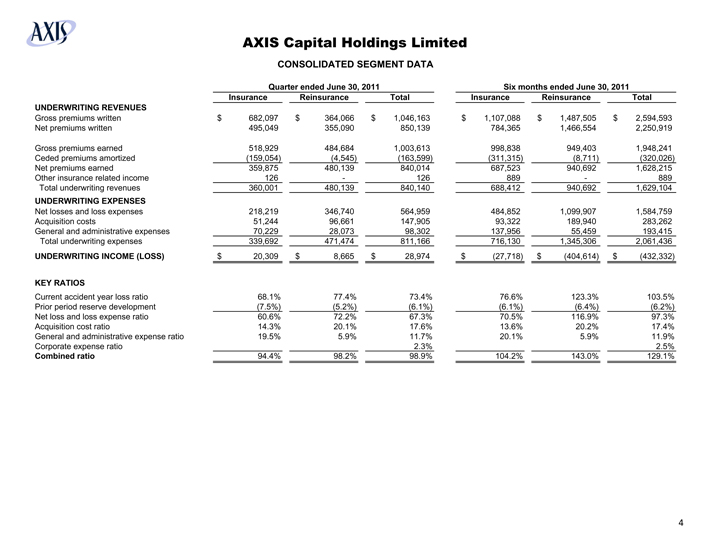
CONSOLIDATED SEGMENT DATA
Quarter ended June 30, 2011 Six months ended June 30, 2011
Insurance Reinsurance Total Insurance Reinsurance Total
UNDERWRITING REVENUES
Gross premiums written $ 682,097 $ 364,066 $ 1,046,163 $ 1,107,088 $ 1,487,505 $ 2,594,593
Net premiums written 495,049 355,090 850,139 784,365 1,466,554 2,250,919
Gross premiums earned 518,929 484,684 1,003,613 998,838 949,403 1,948,241
Ceded premiums amortized (159,054) (4,545) (163,599) (311,315) (8,711) (320,026)
Net premiums earned 359,875 480,139 840,014 687,523 940,692 1,628,215
Other insurance related income 126 -126 889 - 889
Total underwriting revenues 360,001 480,139 840,140 688,412 940,692 1,629,104
UNDERWRITING EXPENSES
Net losses and loss expenses 218,219 346,740 564,959 484,852 1,099,907 1,584,759
Acquisition costs 51,244 96,661 147,905 93,322 189,940 283,262
General and administrative expenses 70,229 28,073 98,302 137,956 55,459 193,415
Total underwriting expenses 339,692 471,474 811,166 716,130 1,345,306 2,061,436
UNDERWRITING INCOME (LOSS) $ 20,309 $ 8,665 $ 28,974 $ (27,718) $ (404,614) $ (432,332)
KEY RATIOS
Current accident year loss ratio 68.1% 77.4% 73.4% 76.6% 123.3% 103.5%
Prior period reserve development (7.5%) (5.2%) (6.1%) (6.1%) (6.4%) (6.2%)
Net loss and loss expense ratio 60.6% 72.2% 67.3% 70.5% 116.9% 97.3%
Acquisition cost ratio 14.3% 20.1% 17.6% 13.6% 20.2% 17.4%
General and administrative expense ratio 19.5% 5.9% 11.7% 20.1% 5.9% 11.9%
Corporate expense ratio 2.3% 2.5%
Combined ratio 94.4% 98.2% 98.9% 104.2% 143.0% 129.1%
4
AXIS Capital Holdings Limited
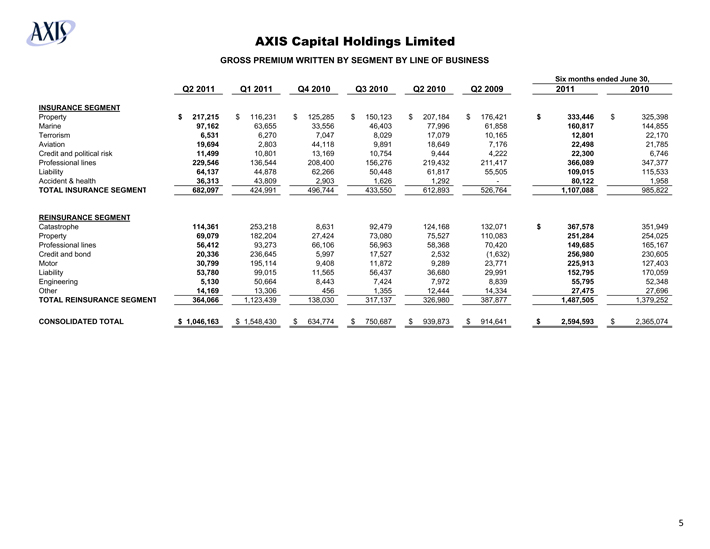
GROSS PREMIUM WRITTEN BY SEGMENT BY LINE OF BUSINESS
Six months ended June 30,
Q2 2011 Q1 2011 Q4 2010 Q3 2010 Q2 2010 Q2 2009 2011 2010
INSURANCE SEGMENT
Property $ 217,215 $ 116,231 $ 125,285 $ 150,123 $ 207,184 $ 176,421 $ 333,446 $ 325,398
Marine 97,162 63,655 33,556 46,403 77,996 61,858 160,817 144,855
Terrorism 6,531 6,270 7,047 8,029 17,079 10,165 12,801 22,170
Aviation 19,694 2,803 44,118 9,891 18,649 7,176 22,498 21,785
Credit and political risk 11,499 10,801 13,169 10,754 9,444 4,222 22,300 6,746
Professional lines 229,546 136,544 208,400 156,276 219,432 211,417 366,089 347,377
Liability 64,137 44,878 62,266 50,448 61,817 55,505 109,015 115,533
Accident & health 36,313 43,809 2,903 1,626 1,292 - 80,122 1,958
TOTAL INSURANCE SEGMENT 682,097 424,991 496,744 433,550 612,893 526,764 1,107,088 985,822
REINSURANCE SEGMENT
Catastrophe 114,361 253,218 8,631 92,479 124,168 132,071 $ 367,578 351,949
Property 69,079 182,204 27,424 73,080 75,527 110,083 251,284 254,025
Professional lines 56,412 93,273 66,106 56,963 58,368 70,420 149,685 165,167
Credit and bond 20,336 236,645 5,997 17,527 2,532 (1,632) 256,980 230,605
Motor 30,799 195,114 9,408 11,872 9,289 23,771 225,913 127,403
Liability 53,780 99,015 11,565 56,437 36,680 29,991 152,795 170,059
Engineering 5,130 50,664 8,443 7,424 7,972 8,839 55,795 52,348
Other 14,169 13,306 456 1,355 12,444 14,334 27,475 27,696
TOTAL REINSURANCE SEGMENT 364,066 1,123,439 138,030 317,137 326,980 387,877 1,487,505 1,379,252
CONSOLIDATED TOTAL $ 1,046,163 $ 1,548,430 $ 634,774 $ 750,687 $ 939,873 $ 914,641 $ 2,594,593 $ 2,365,074
5
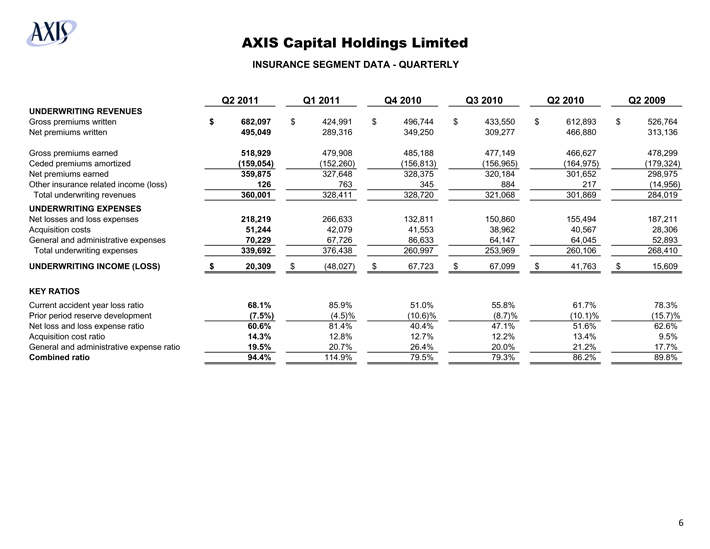
AXIS Capital Holdings Limited
INSURANCE SEGMENT DATA - QUARTERLY
Q2 2011 Q1 2011 Q4 2010 Q3 2010 Q2 2010 Q2 2009
UNDERWRITING REVENUES
Gross premiums written $ 682,097 $ 424,991 $ 496,744 $ 433,550 $ 612,893 $ 526,764
Net premiums written 495,049 289,316 349,250 309,277 466,880 313,136
Gross premiums earned 518,929 479,908 485,188 477,149 466,627 478,299
Ceded premiums amortized (159,054) (152,260) (156,813) (156,965) (164,975) (179,324)
Net premiums earned 359,875 327,648 328,375 320,184 301,652 298,975
Other insurance related income (loss) 126 763 345 884 217 (14,956)
Total underwriting revenues 360,001 328,411 328,720 321,068 301,869 284,019
UNDERWRITING EXPENSES
Net losses and loss expenses 218,219 266,633 132,811 150,860 155,494 187,211
Acquisition costs 51,244 42,079 41,553 38,962 40,567 28,306
General and administrative expenses 70,229 67,726 86,633 64,147 64,045 52,893
Total underwriting expenses 339,692 376,438 260,997 253,969 260,106 268,410
UNDERWRITING INCOME (LOSS) $ 20,309 $ (48,027) $ 67,723 $ 67,099 $ 41,763 $ 15,609
KEY RATIOS
Current accident year loss ratio 68.1% 85.9% 51.0% 55.8% 61.7% 78.3%
Prior period reserve development (7.5%)(4.5)%(10.6)%(8.7)%(10.1)%(15.7)%
Net loss and loss expense ratio 60.6% 81.4% 40.4% 47.1% 51.6% 62.6%
Acquisition cost ratio 14.3% 12.8% 12.7% 12.2% 13.4% 9.5%
General and administrative expense ratio 19.5% 20.7% 26.4% 20.0% 21.2% 17.7%
Combined ratio 94.4% 114.9% 79.5% 79.3% 86.2% 89.8%
6
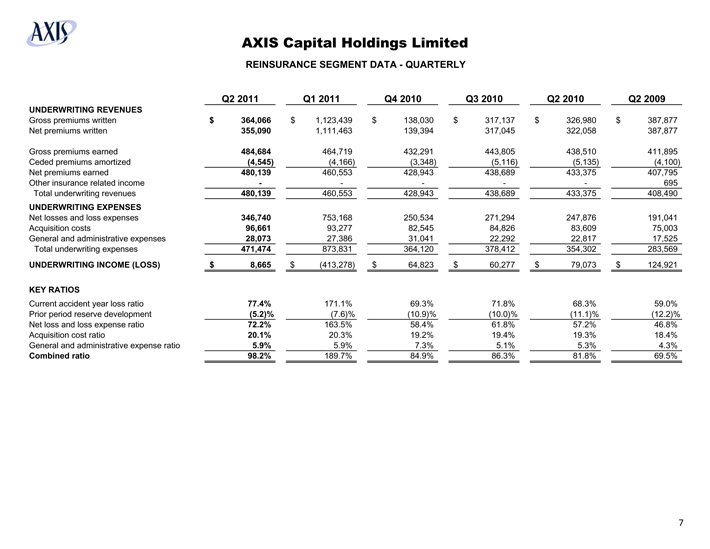
AXIS Capital Holdings Limited
REINSURANCE SEGMENT DATA - QUARTERLY
Q2 2011 Q1 2011 Q4 2010 Q3 2010 Q2 2010 Q2 2009
UNDERWRITING REVENUES
Gross premiums written $ 364,066 $ 1,123,439 $ 138,030 $ 317,137 $ 326,980 $ 387,877
Net premiums written 355,090 1,111,463 139,394 317,045 322,058 387,877
Gross premiums earned 484,684 464,719 432,291 443,805 438,510 411,895
Ceded premiums amortized (4,545) (4,166) (3,348) (5,116) (5,135) (4,100)
Net premiums earned 480,139 460,553 428,943 438,689 433,375 407,795
Other insurance related income - - - - - 695
Total underwriting revenues 480,139 460,553 428,943 438,689 433,375 408,490
UNDERWRITING EXPENSES
Net losses and loss expenses 346,740 753,168 250,534 271,294 247,876 191,041
Acquisition costs 96,661 93,277 82,545 84,826 83,609 75,003
General and administrative expenses 28,073 27,386 31,041 22,292 22,817 17,525
Total underwriting expenses 471,474 873,831 364,120 378,412 354,302 283,569
UNDERWRITING INCOME (LOSS) $ 8,665 $ (413,278) $ 64,823 $ 60,277 $ 79,073 $ 124,921
KEY RATIOS
Current accident year loss ratio 77.4% 171.1% 69.3% 71.8% 68.3% 59.0%
Prior period reserve development (5.2)% (7.6)% (10.9)% (10.0)% (11.1)% (12.2)%
Net loss and loss expense ratio 72.2% 163.5% 58.4% 61.8% 57.2% 46.8%
Acquisition cost ratio 20.1% 20.3% 19.2% 19.4% 19.3% 18.4%
General and administrative expense ratio 5.9% 5.9% 7.3% 5.1% 5.3% 4.3%
Combined ratio 98.2% 189.7% 84.9% 86.3% 81.8% 69.5%
7
AXIS Capital Holdings Limited
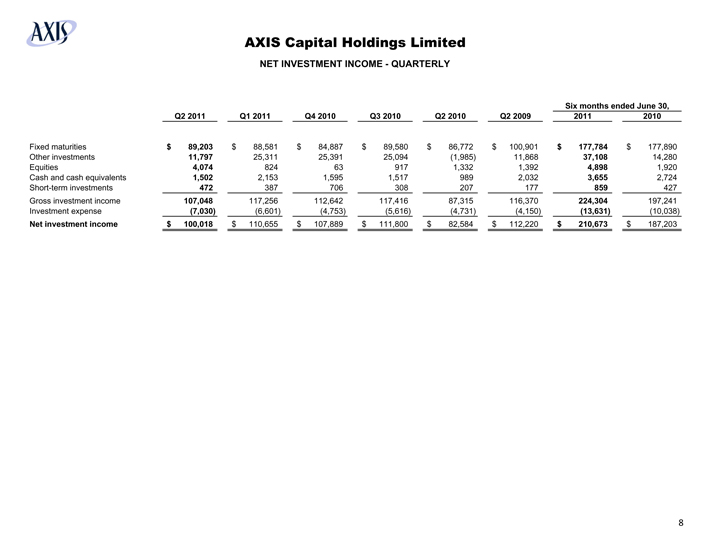
NET INVESTMENT INCOME - QUARTERLY
Six months ended June 30,
Q2 2011 Q1 2011 Q4 2010 Q3 2010 Q2 2010 Q2 2009 2011 2010
Fixed maturities $ 89,203 $ 88,581 $ 84,887 $ 89,580 $ 86,772 $ 100,901 $ 177,784 $ 177,890
Other investments 11,797 25,311 25,391 25,094 (1,985) 11,868 37,108 14,280
Equities 4,074 824 63 917 1,332 1,392 4,898 1,920
Cash and cash equivalents 1,502 2,153 1,595 1,517 989 2,032 3,655 2,724
Short-term investments 472 387 706 308 207 177 859 427
Gross investment income 107,048 117,256 112,642 117,416 87,315 116,370 224,304 197,241
Investment expense (7,030) (6,601) (4,753) (5,616) (4,731) (4,150) (13,631) (10,038)
Net investment income $ 100,018 $ 110,655 $ 107,889 $ 111,800 $ 82,584 $ 112,220 $ 210,673 $ 187,203
8
AXIS Capital Holdings Limited
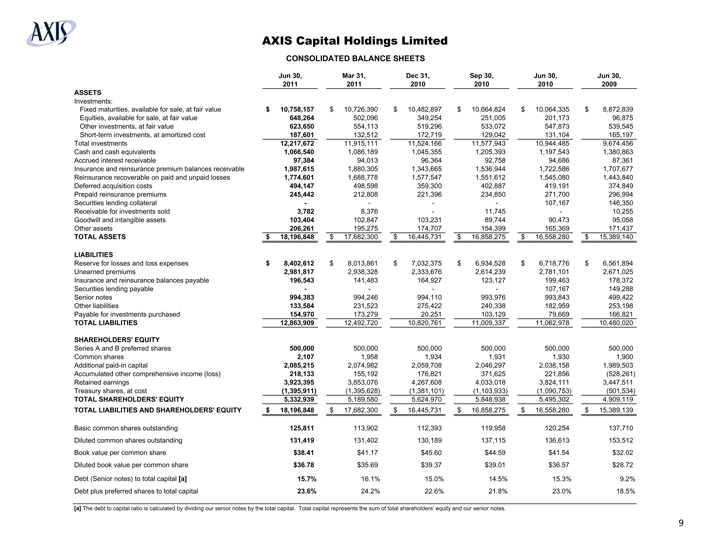
CONSOLIDATED BALANCE SHEETS
Jun 30, 2011 Mar 31, 2011 Dec 31, 2010 Sep 30, 2010 Jun 30, 2010 Jun 30, 2009
ASSETS
Investments:
Fixed maturities, available for sale, at fair value $ 10,758,157 $ 10,726,390 $ 10,482,897 $ 10,664,824 $ 10,064,335 $ 8,872,839
Equities, available for sale, at fair value 648,264 502,096 349,254 251,005 201,173 96,875
Other investments, at fair value 623,650 554,113 519,296 533,072 547,873 539,545
Short-term investments, at amortized cost 187,601 132,512 172,719 129,042 131,104 165,197
Total investments 12,217,672 11,915,111 11,524,166 11,577,943 10,944,485 9,674,456
Cash and cash equivalents 1,066,540 1,086,189 1,045,355 1,205,393 1,197,543 1,380,863
Accrued interest receivable 97,384 94,013 96,364 92,758 94,686 87,361
Insurance and reinsurance premium balances receivable 1,987,615 1,880,305 1,343,665 1,536,944 1,722,586 1,707,677
Reinsurance recoverable on paid and unpaid losses 1,774,601 1,688,778 1,577,547 1,551,612 1,545,080 1,443,840
Deferred acquisition costs 494,147 498,598 359,300 402,887 419,191 374,849
Prepaid reinsurance premiums 245,442 212,808 221,396 234,850 271,700 296,994
Securities lending collateral - - - - 107,167 146,350
Receivable for investments sold 3,782 8,376 - 11,745 - 10,255
Goodwill and intangible assets 103,404 102,847 103,231 89,744 90,473 95,058
Other assets 206,261 195,275 174,707 154,399 165,369 171,437
TOTAL ASSETS $ 18,196,848 $ 17,682,300 $ 16,445,731 $ 16,858,275 $ 16,558,280 $ 15,389,140
LIABILITIES
Reserve for losses and loss expenses $ 8,402,612 $ 8,013,861 $ 7,032,375 $ 6,934,528 $ 6,718,776 $ 6,561,894
Unearned premiums 2,981,817 2,938,328 2,333,676 2,614,239 2,781,101 2,671,025
Insurance and reinsurance balances payable 196,543 141,483 164,927 123,127 199,463 178,372
Securities lending payable - - - - 107,167 149,288
Senior notes 994,383 994,246 994,110 993,976 993,843 499,422
Other liabilities 133,584 231,523 275,422 240,338 182,959 253,198
Payable for investments purchased 154,970 173,279 20,251 103,129 79,669 166,821
TOTAL LIABILITIES 12,863,909 12,492,720 10,820,761 11,009,337 11,062,978 10,480,020
SHAREHOLDERS’ EQUITY
Series A and B preferred shares 500,000 500,000 500,000 500,000 500,000 500,000
Common shares 2,107 1,958 1,934 1,931 1,930 1,900
Additional paid-in capital 2,085,215 2,074,982 2,059,708 2,046,297 2,038,158 1,989,503
Accumulated other comprehensive income (loss) 218,133 155,192 176,821 371,625 221,856 (528,261)
Retained earnings 3,923,395 3,853,076 4,267,608 4,033,018 3,824,111 3,447,511
Treasury shares, at cost (1,395,911) (1,395,628) (1,381,101) (1,103,933) (1,090,753) (501,534)
TOTAL SHAREHOLDERS’ EQUITY 5,332,939 5,189,580 5,624,970 5,848,938 5,495,302 4,909,119
TOTAL LIABILITIES AND SHAREHOLDERS’ EQUITY $ 18,196,848 $ 17,682,300 $ 16,445,731 $ 16,858,275 $ 16,558,280 $ 15,389,139
Basic common shares outstanding 125,811 113,902 112,393 119,958 120,254 137,710
Diluted common shares outstanding 131,419 131,402 130,189 137,115 136,613 153,512
Book value per common share $38.41 $41.17 $45.60 $44.59 $41.54 $32.02
Diluted book value per common share $36.78 $35.69 $39.37 $39.01 $36.57 $28.72
Debt (Senior notes) to total capital [a] 15.7% 16.1% 15.0% 14.5% 15.3% 9.2%
Debt plus preferred shares to total capital 23.6% 24.2% 22.6% 21.8% 23.0% 18.5%
[a] The debt to capital ratio is calculated by dividing our senior notes by the total capital. Total capital represents the sum of total shareholders’ equity and our senior notes.
9
AXIS Capital Holdings Limited
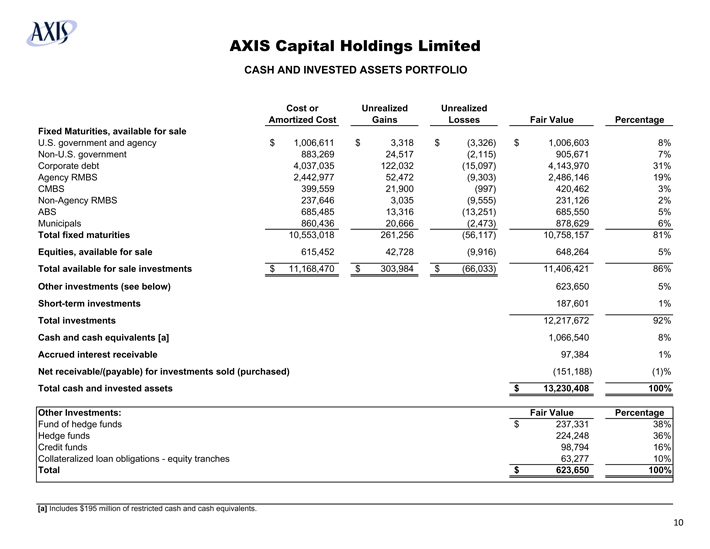
CASH AND INVESTED ASSETS PORTFOLIO
Cost or Amortized Cost
Unrealized Gains
Unrealized Losses
Fair Value
Percentage
Fixed Maturities, available for sale
U.S. government and agency $ 1,006,611 $ 3,318 $ (3,326) $ 1,006,603 8%
Non-U.S. government 883,269 24,517 (2,115) 905,671 7%
Corporate debt 4,037,035 122,032 (15,097) 4,143,970 31%
Agency RMBS 2,442,977 52,472 (9,303) 2,486,146 19%
CMBS 399,559 21,900 (997) 420,462 3%
Non-Agency RMBS 237,646 3,035 (9,555) 231,126 2%
ABS 685,485 13,316 (13,251) 685,550 5%
Municipals 860,436 20,666 (2,473) 878,629 6%
Total fixed maturities 10,553,018 261,256 (56,117) 10,758,157 81%
Equities, available for sale 615,452 42,728 (9,916) 648,264 5%
Total available for sale investments $ 11,168,470 $ 303,984 $ (66,033) 11,406,421 86%
Other investments (see below) 623,650 5%
Short-term investments 187,601 1%
Total investments 12,217,672 92%
Cash and cash equivalents [a] 1,066,540 8%
Accrued interest receivable 97,384 1%
Net receivable/(payable) for investments sold (purchased) (151,188) (1)%
Total cash and invested assets $ 13,230,408 100%
Other Investments: Fair Value Percentage
Fund of hedge funds $ 237,331 38%
Hedge funds 224,248 36%
Credit funds 98,794 16%
Collateralized loan obligations - equity tranches 63,277 10%
Total $ 623,650 100%
[a] Includes $195 million of restricted cash and cash equivalents.
10
AXIS Capital Holdings Limited
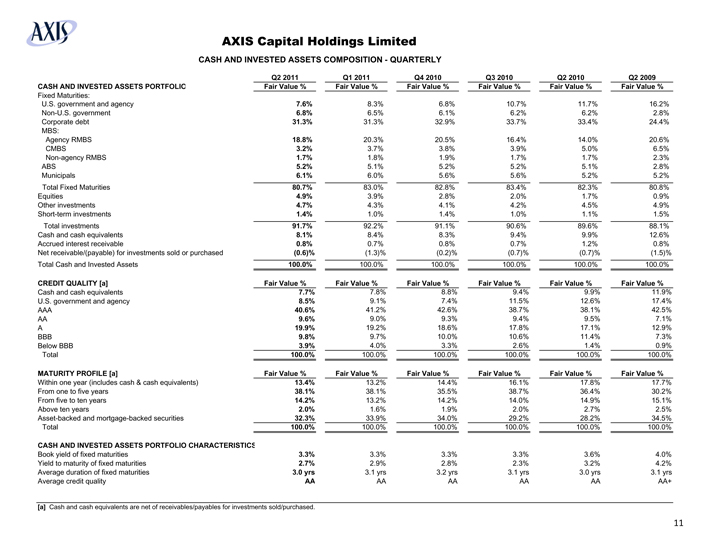
CASH AND INVESTED ASSETS COMPOSITION - QUARTERLY
Q2 2011 Q1 2011 Q4 2010 Q3 2010 Q2 2010 Q2 2009
CASH AND INVESTED ASSETS PORTFOLIO Fair Value % Fair Value % Fair Value % Fair Value % Fair Value % Fair Value %
Fixed Maturities:
U.S. government and agency 7.6% 8.3% 6.8% 10.7% 11.7% 16.2%
Non-U.S. government 6.8% 6.5% 6.1% 6.2% 6.2% 2.8%
Corporate debt 31.3% 31.3% 32.9% 33.7% 33.4% 24.4%
MBS:
Agency RMBS 18.8% 20.3% 20.5% 16.4% 14.0% 20.6%
CMBS 3.2% 3.7% 3.8% 3.9% 5.0% 6.5%
Non-agency RMBS 1.7% 1.8% 1.9% 1.7% 1.7% 2.3%
ABS 5.2% 5.1% 5.2% 5.2% 5.1% 2.8%
Municipals 6.1% 6.0% 5.6% 5.6% 5.2% 5.2%
Total Fixed Maturities 80.7% 83.0% 82.8% 83.4% 82.3% 80.8%
Equities 4.9% 3.9% 2.8% 2.0% 1.7% 0.9%
Other investments 4.7% 4.3% 4.1% 4.2% 4.5% 4.9%
Short-term investments 1.4% 1.0% 1.4% 1.0% 1.1% 1.5%
Total investments 91.7% 92.2% 91.1% 90.6% 89.6% 88.1%
Cash and cash equivalents 8.1% 8.4% 8.3% 9.4% 9.9% 12.6%
Accrued interest receivable 0.8% 0.7% 0.8% 0.7% 1.2% 0.8%
Net receivable/(payable) for investments sold or purchased (0.6)% (1.3)% (0.2)% (0.7)% (0.7)% (1.5)%
Total Cash and Invested Assets 100.0% 100.0% 100.0% 100.0% 100.0% 100.0%
CREDIT QUALITY [a] Fair Value % Fair Value % Fair Value % Fair Value % Fair Value % Fair Value %
Cash and cash equivalents 7.7% 7.8% 8.8% 9.4% 9.9% 11.9%
U.S. government and agency 8.5% 9.1% 7.4% 11.5% 12.6% 17.4%
AAA 40.6% 41.2% 42.6% 38.7% 38.1% 42.5%
AA 9.6% 9.0% 9.3% 9.4% 9.5% 7.1%
A 19.9% 19.2% 18.6% 17.8% 17.1% 12.9%
BBB 9.8% 9.7% 10.0% 10.6% 11.4% 7.3%
Below BBB 3.9% 4.0% 3.3% 2.6% 1.4% 0.9%
Total 100.0% 100.0% 100.0% 100.0% 100.0% 100.0%
MATURITY PROFILE [a] Fair Value % Fair Value % Fair Value % Fair Value % Fair Value % Fair Value %
Within one year (includes cash & cash equivalents) 13.4% 13.2% 14.4% 16.1% 17.8% 17.7%
From one to five years 38.1% 38.1% 35.5% 38.7% 36.4% 30.2%
From five to ten years 14.2% 13.2% 14.2% 14.0% 14.9% 15.1%
Above ten years 2.0% 1.6% 1.9% 2.0% 2.7% 2.5%
Asset-backed and mortgage-backed securities 32.3% 33.9% 34.0% 29.2% 28.2% 34.5%
Total 100.0% 100.0% 100.0% 100.0% 100.0% 100.0%
CASH AND INVESTED ASSETS PORTFOLIO CHARACTERISTICS
Book yield of fixed maturities 3.3% 3.3% 3.3% 3.3% 3.6% 4.0%
Yield to maturity of fixed maturities 2.7% 2.9% 2.8% 2.3% 3.2% 4.2%
Average duration of fixed maturities 3.0 yrs 3.1 yrs 3.2 yrs 3.1 yrs 3.0 yrs 3.1 yrs
Average credit quality AA AA AA AA AA AA+
[a] Cash and cash equivalents are net of receivables/payables for investments sold/purchased.
11
AXIS Capital Holdings Limited
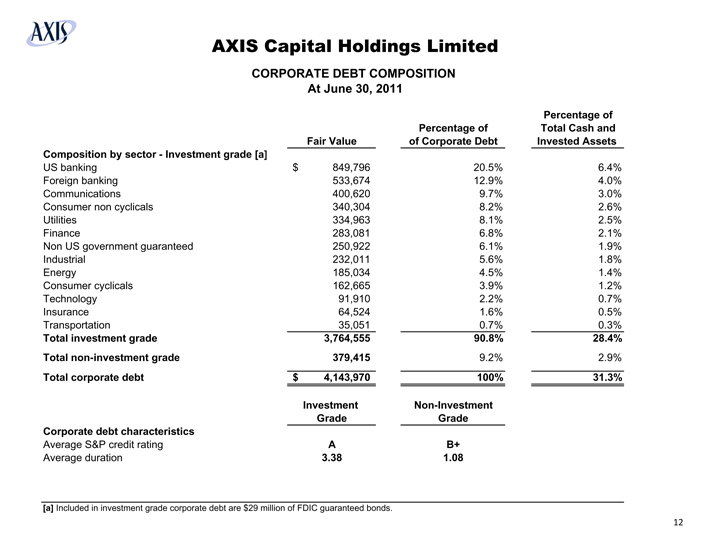
CORPORATE DEBT COMPOSITION
At June 30, 2011
Fair Value
Percentage of of Corporate Debt
Percentage of Total Cash and Invested Assets
Composition by sector - Investment grade [a]
US banking $ 849,796 20.5% 6.4%
Foreign banking 533,674 12.9% 4.0%
Communications 400,620 9.7% 3.0%
Consumer non cyclicals 340,304 8.2% 2.6%
Utilities 334,963 8.1% 2.5%
Finance 283,081 6.8% 2.1%
Non US government guaranteed 250,922 6.1% 1.9%
Industrial 232,011 5.6% 1.8%
Energy 185,034 4.5% 1.4%
Consumer cyclicals 162,665 3.9% 1.2%
Technology 91,910 2.2% 0.7%
Insurance 64,524 1.6% 0.5%
Transportation 35,051 0.7% 0.3%
Total investment grade 3,764,555 90.8% 28.4%
Total non-investment grade 379,415 9.2% 2.9%
Total corporate debt $ 4,143,970 100% 31.3%
Investment Grade Non-Investment Grade
Corporate debt characteristics
Average S&P credit rating A B+
Average duration 3.38 1.08
[a] Included in investment grade corporate debt are $29 million of FDIC guaranteed bonds.
12
AXIS Capital Holdings Limited
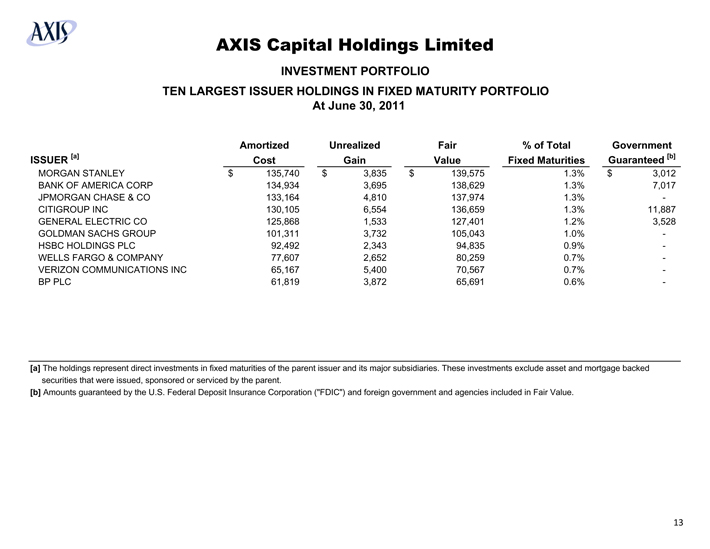
INVESTMENT PORTFOLIO
TEN LARGEST ISSUER HOLDINGS IN FIXED MATURITY PORTFOLIO
At June 30, 2011
ISSUER [a]
Amortized Cost
Unrealized Gain
Fair Value
% of Total Fixed Maturities
Government Guaranteed [b]
MORGAN STANLEY $ 135,740 $ 3,835 $ 139,575 1.3% $ 3,012
BANK OF AMERICA CORP 134,934 3,695 138,629 1.3% 7,017
JPMORGAN CHASE & CO 133,164 4,810 137,974 1.3% -
CITIGROUP INC 130,105 6,554 136,659 1.3% 11,887
GENERAL ELECTRIC CO 125,868 1,533 127,401 1.2% 3,528
GOLDMAN SACHS GROUP 101,311 3,732 105,043 1.0% -
HSBC HOLDINGS PLC 92,492 2,343 94,835 0.9% -
WELLS FARGO & COMPANY 77,607 2,652 80,259 0.7% -
VERIZON COMMUNICATIONS INC 65,167 5,400 70,567 0.7% -
BP PLC 61,819 3,872 65,691 0.6% -
[a] The holdings represent direct investments in fixed maturities of the parent issuer and its major subsidiaries. These investments exclude asset and mortgage backed securities that were issued, sponsored or serviced by the parent.
[b] Amounts guaranteed by the U.S. Federal Deposit Insurance Corporation (“FDIC”) and foreign government and agencies included in Fair Value.
13
AXIS Capital Holdings Limited
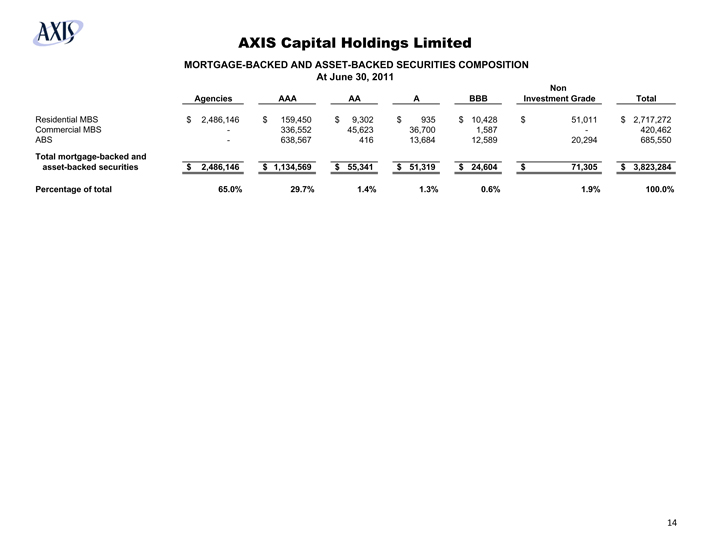
MORTGAGE-BACKED AND ASSET-BACKED SECURITIES COMPOSITION
At June 30, 2011
Agencies
AAA
AA
A
BBB
Non Investment Grade
Total
Residential MBS $ 2,486,146 $ 159,450 $ 9,302 $ 935 $ 10,428 $ 51,011 $ 2,717,272
Commercial MBS - 336,552 45,623 36,700 1,587 - 420,462
ABS - 638,567 416 13,684 12,589 20,294 685,550
Total mortgage-backed and asset-backed securities $ 2,486,146 $ 1,134,569 $ 55,341 $ 51,319 $ 24,604 $ 71,305 $ 3,823,284
Percentage of total 65.0% 29.7% 1.4% 1.3% 0.6% 1.9% 100.0%
14
AXIS Capital Holdings Limited
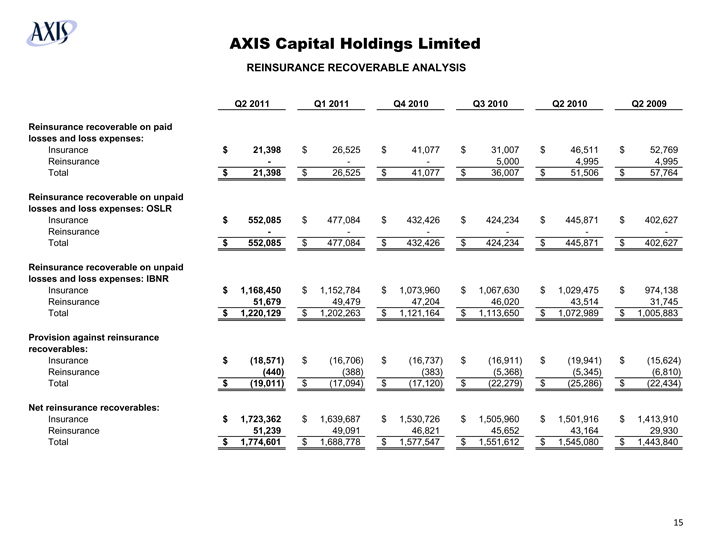
REINSURANCE RECOVERABLE ANALYSIS
Q2 2011 Q1 2011 Q4 2010 Q3 2010 Q2 2010 Q2 2009
Reinsurance recoverable on paid losses and loss expenses:
Insurance $ 21,398 $ 26,525 $ 41,077 $ 31,007 $ 46,511 $ 52,769
Reinsurance - - - 5,000 4,995 4,995
Total $ 21,398 $ 26,525 $ 41,077 $ 36,007 $ 51,506 $ 57,764
Reinsurance recoverable on unpaid losses and loss expenses: OSLR
Insurance $ 552,085 $ 477,084 $ 432,426 $ 424,234 $ 445,871 $ 402,627
Reinsurance - - - - - -
Total $ 552,085 $ 477,084 $ 432,426 $ 424,234 $ 445,871 $ 402,627
Reinsurance recoverable on unpaid losses and loss expenses: IBNR
Insurance $ 1,168,450 $ 1,152,784 $ 1,073,960 $ 1,067,630 $ 1,029,475 $ 974,138
Reinsurance 51,679 49,479 47,204 46,020 43,514 31,745
Total $ 1,220,129 $ 1,202,263 $ 1,121,164 $ 1,113,650 $ 1,072,989 $ 1,005,883
Provision against reinsurance recoverables:
Insurance $ (18,571) $ (16,706) $ (16,737) $ (16,911) $ (19,941) $ (15,624)
Reinsurance (440) (388) (383) (5,368) (5,345) (6,810)
Total $ (19,011) $ (17,094) $ (17,120) $ (22,279) $ (25,286) $ (22,434)
Net reinsurance recoverables:
Insurance $ 1,723,362 $ 1,639,687 $ 1,530,726 $ 1,505,960 $ 1,501,916 $ 1,413,910
Reinsurance 51,239 49,091 46,821 45,652 43,164 29,930
Total $ 1,774,601 $ 1,688,778 $ 1,577,547 $ 1,551,612 $ 1,545,080 $ 1,443,840
15
AXIS Capital Holdings Limited
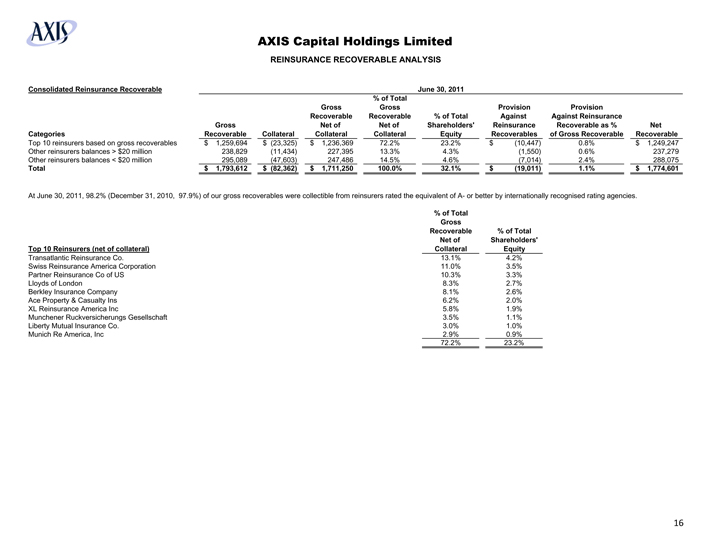
REINSURANCE RECOVERABLE ANALYSIS
Consolidated Reinsurance Recoverable June 30, 2011
Categories Gross Recoverable Collateral Gross Recoverable Net of Collateral % of Total Gross Recoverable Net of Collateral % of Total Shareholders’ Equity Provision Against Reinsurance Recoverables Provision Against Reinsurance Recoverable as % of Gross Recoverable Net Recoverable
Top 10 reinsurers based on gross recoverables $ 1,259,694 $ (23,325) $ 1,236,369 72.2% 23.2% $ (10,447) 0.8% $ 1,249,247
Other reinsurers balances > $20 million 238,829 (11,434) 227,395 13.3% 4.3% (1,550) 0.6% 237,279
Other reinsurers balances < $20 million 295,089 (47,603) 247,486 14.5% 4.6% (7,014) 2.4% 288,075
Total $ 1,793,612 $ (82,362) $ 1,711,250 100.0% 32.1% $ (19,011) 1.1% $ 1,774,601
At June 30, 2011, 98.2% (December 31, 2010, 97.9%) of our gross recoverables were collectible from reinsurers rated the equivalent of A- or better by internationally recognised rating agencies.
Top 10 Reinsurers (net of collateral) % of Total Gross Recoverable Net of Collateral % of Total Shareholders’ Equity
Transatlantic Reinsurance Co. 13.1% 4.2%
Swiss Reinsurance America Corporation 11.0% 3.5%
Partner Reinsurance Co of US 10.3% 3.3%
Lloyds of London 8.3% 2.7%
Berkley Insurance Company 8.1% 2.6%
Ace Property & Casualty Ins 6.2% 2.0%
XL Reinsurance America Inc 5.8% 1.9%
Munchener Ruckversicherungs Gesellschaft 3.5% 1.1%
Liberty Mutual Insurance Co. 3.0% 1.0%
Munich Re America, Inc 2.9% 0.9%
72.2% 23.2%
16
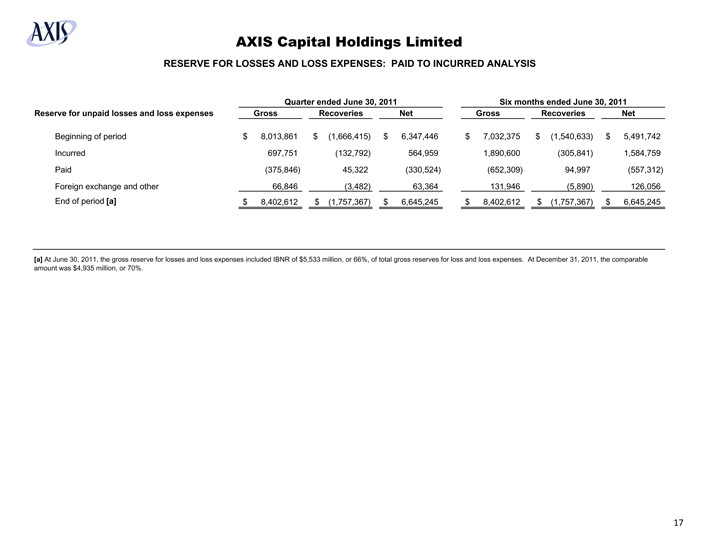
AXIS Capital Holdings Limited
RESERVE FOR LOSSES AND LOSS EXPENSES: PAID TO INCURRED ANALYSIS
Quarter ended June 30, 2011 Six months ended June 30, 2011
Reserve for unpaid losses and loss expenses Gross Recoveries Net Gross Recoveries Net
Beginning of period $ 8,013,861 $ (1,666,415) $ 6,347,446 $ 7,032,375 $ (1,540,633) $ 5,491,742
Incurred 697,751 (132,792) 564,959 1,890,600 (305,841) 1,584,759
Paid (375,846) 45,322 (330,524) (652,309) 94,997 (557,312)
Foreign exchange and other 66,846 (3,482) 63,364 131,946 (5,890) 126,056
End of period [a] $ 8,402,612 $ (1,757,367) $ 6,645,245 $ 8,402,612 $ (1,757,367) $ 6,645,245
[a] At June 30, 2011, the gross reserve for losses and loss expenses included IBNR of $5,533 million, or 66%, of total gross reserves for loss and loss expenses. At December 31, 2011, the comparable amount was $4,935 million, or 70%.
17
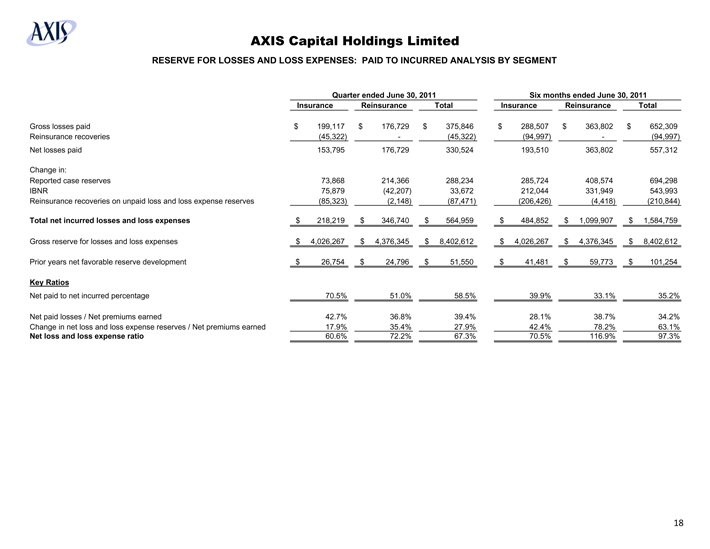
AXIS Capital Holdings Limited
RESERVE FOR LOSSES AND LOSS EXPENSES: PAID TO INCURRED ANALYSIS BY SEGMENT
Quarter ended June 30, 2011 Six months ended June 30, 2011
Insurance Reinsurance Total Insurance Reinsurance Total
Gross losses paid $ 199,117 $ 176,729 $ 375,846 $ 288,507 $ 363,802 $ 652,309
Reinsurance recoveries (45,322) - (45,322) (94,997) - (94,997)
Net losses paid 153,795 176,729 330,524 193,510 363,802 557,312
Change in:
Reported case reserves 73,868 214,366 288,234 285,724 408,574 694,298
IBNR 75,879 (42,207) 33,672 212,044 331,949 543,993
Reinsurance recoveries on unpaid loss and loss expense reserves (85,323) (2,148) (87,471) (206,426) (4,418) (210,844)
Total net incurred losses and loss expenses $ 218,219 $ 346,740 $ 564,959 $ 484,852 $ 1,099,907 $ 1,584,759
Gross reserve for losses and loss expenses $ 4,026,267 $ 4,376,345 $ 8,402,612 $ 4,026,267 $ 4,376,345 $ 8,402,612
Prior years net favorable reserve development $ 26,754 $ 24,796 $ 51,550 $ 41,481 $ 59,773 $ 101,254
Key Ratios
Net paid to net incurred percentage 70.5% 51.0% 58.5% 39.9% 33.1% 35.2%
Net paid losses / Net premiums earned 42.7% 36.8% 39.4% 28.1% 38.7% 34.2%
Change in net loss and loss expense reserves / Net premiums earned 17.9% 35.4% 27.9% 42.4% 78.2% 63.1%
Net loss and loss expense ratio 60.6% 72.2% 67.3% 70.5% 116.9% 97.3%
18
AXIS Capital Holdings Limited
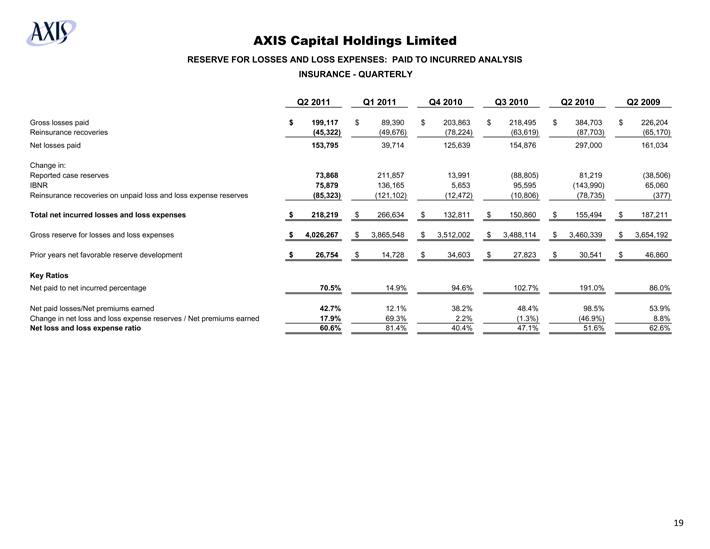
RESERVE FOR LOSSES AND LOSS EXPENSES: PAID TO INCURRED ANALYSIS
INSURANCE - QUARTERLY
Q2 2011 Q1 2011 Q4 2010 Q3 2010 Q2 2010 Q2 2009
Gross losses paid $ 199,117 $ 89,390 $ 203,863 $ 218,495 $ 384,703 $ 226,204
Reinsurance recoveries (45,322) (49,676) (78,224) (63,619) (87,703) (65,170)
Net losses paid 153,795 39,714 125,639 154,876 297,000 161,034
Change in:
Reported case reserves 73,868 211,857 13,991 (88,805) 81,219 (38,506)
IBNR 75,879 136,165 5,653 95,595 (143,990) 65,060
Reinsurance recoveries on unpaid loss and loss expense reserves (85,323) (121,102) (12,472) (10,806) (78,735) (377)
Total net incurred losses and loss expenses $ 218,219 $ 266,634 $ 132,811 $ 150,860 $ 155,494 $ 187,211
Gross reserve for losses and loss expenses $ 4,026,267 $ 3,865,548 $ 3,512,002 $ 3,488,114 $ 3,460,339 $ 3,654,192
Prior years net favorable reserve development $ 26,754 $ 14,728 $ 34,603 $ 27,823 $ 30,541 $ 46,860
Key Ratios
Net paid to net incurred percentage 70.5% 14.9% 94.6% 102.7% 191.0% 86.0%
Net paid losses/Net premiums earned 42.7% 12.1% 38.2% 48.4% 98.5% 53.9%
Change in net loss and loss expense reserves / Net premiums earned 17.9% 69.3% 2.2% (1.3%) (46.9%) 8.8%
Net loss and loss expense ratio 60.6% 81.4% 40.4% 47.1% 51.6% 62.6%
19
AXIS Capital Holdings Limited
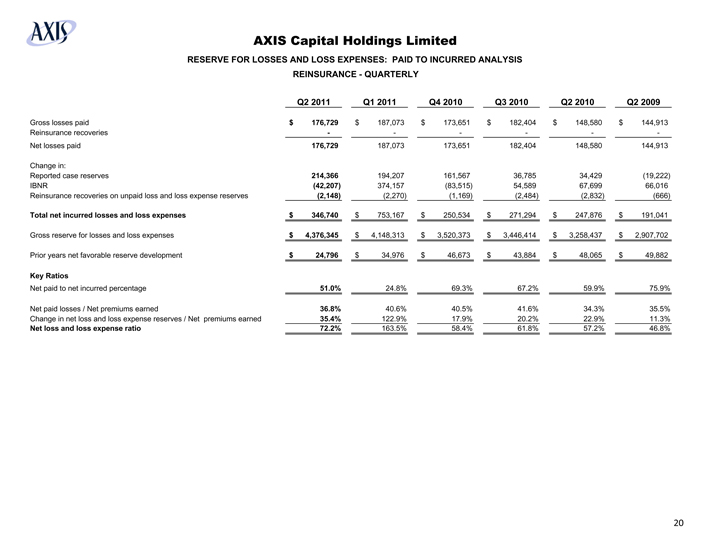
RESERVE FOR LOSSES AND LOSS EXPENSES: PAID TO INCURRED ANALYSIS
REINSURANCE - QUARTERLY
Q2 2011 Q1 2011 Q4 2010 Q3 2010 Q2 2010 Q2 2009
Gross losses paid $ 176,729 $ 187,073 $ 173,651 $ 182,404 $ 148,580 $ 144,913
Reinsurance recoveries - - - - - -
Net losses paid 176,729 187,073 173,651 182,404 148,580 144,913
Change in:
Reported case reserves 214,366 194,207 161,567 36,785 34,429 (19,222)
IBNR (42,207) 374,157 (83,515) 54,589 67,699 66,016
Reinsurance recoveries on unpaid loss and loss expense reserves (2,148) (2,270) (1,169) (2,484) (2,832) (666)
Total net incurred losses and loss expenses $ 346,740 $ 753,167 $ 250,534 $ 271,294 $ 247,876 $ 191,041
Gross reserve for losses and loss expenses $ 4,376,345 $ 4,148,313 $ 3,520,373 $ 3,446,414 $ 3,258,437 $ 2,907,702
Prior years net favorable reserve development $ 24,796 $ 34,976 $ 46,673 $ 43,884 $ 48,065 $ 49,882
Key Ratios
Net paid to net incurred percentage 51.0% 24.8% 69.3% 67.2% 59.9% 75.9%
Net paid losses / Net premiums earned 36.8% 40.6% 40.5% 41.6% 34.3% 35.5%
Change in net loss and loss expense reserves / Net premiums earned 35.4% 122.9% 17.9% 20.2% 22.9% 11.3%
Net loss and loss expense ratio 72.2% 163.5% 58.4% 61.8% 57.2% 46.8%
20
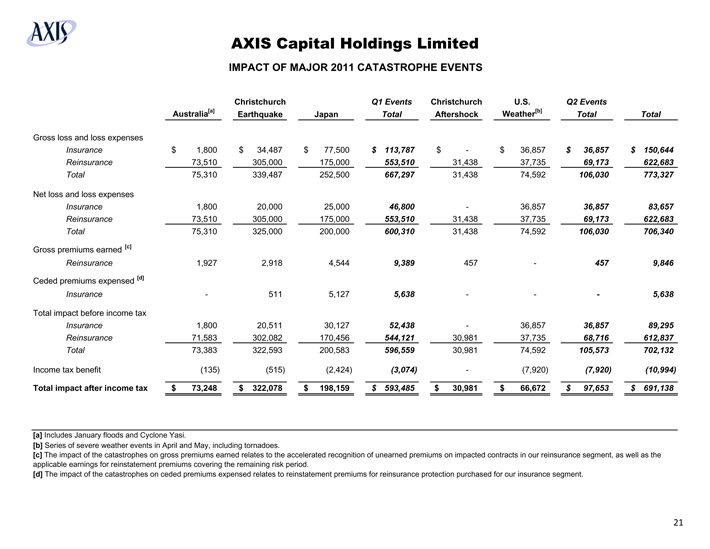
AXIS Capital Holdings Limited
IMPACT OF MAJOR 2011 CATASTROPHE EVENTS
Australia[a] Christchurch Earthquake Japan Q1 Events Total Christchurch Aftershock U.S. Weather[b] Q2 Events Total Total
Gross loss and loss expenses
Insurance $ 1,800 $ 34,487 $ 77,500 $ 113,787 $ - $ 36,857 $ 36,857 $ 150,644
Reinsurance 73,510 305,000 175,000 553,510 31,438 37,735 69,173 622,683
Total 75,310 339,487 252,500 667,297 31,438 74,592 106,030 773,327
Net loss and loss expenses
Insurance 1,800 20,000 25,000 46,800 - 36,857 36,857 83,657
Reinsurance 73,510 305,000 175,000 553,510 31,438 37,735 69,173 622,683
Total 75,310 325,000 200,000 600,310 31,438 74,592 106,030 706,340
Gross premiums earned [c]
Reinsurance 1,927 2,918 4,544 9,389 457 - 457 9,846
Ceded premiums expensed [d]
Insurance - 511 5,127 5,638 - - - 5,638
Total impact before income tax
Insurance 1,800 20,511 30,127 52,438 - 36,857 36,857 89,295
Reinsurance 71,583 302,082 170,456 544,121 30,981 37,735 68,716 612,837
Total 73,383 322,593 200,583 596,559 30,981 74,592 105,573 702,132
Income tax benefit (135) (515) (2,424) (3,074) - (7,920) (7,920) (10,994)
Total impact after income tax $ 73,248 $ 322,078 $ 198,159 $ 593,485 $ 30,981 $ 66,672 $ 97,653 $ 691,138
[a] Includes January floods and Cyclone Yasi.
[b] Series of severe weather events in April and May, including tornadoes.
[c] The impact of the catastrophes on gross premiums earned relates to the accelerated recognition of unearned premiums on impacted contracts in our reinsurance segment, as well as the applicable earnings for reinstatement premiums covering the remaining risk period.
[d] The impact of the catastrophes on ceded premiums expensed relates to reinstatement premiums for reinsurance protection purchased for our insurance segment.
21
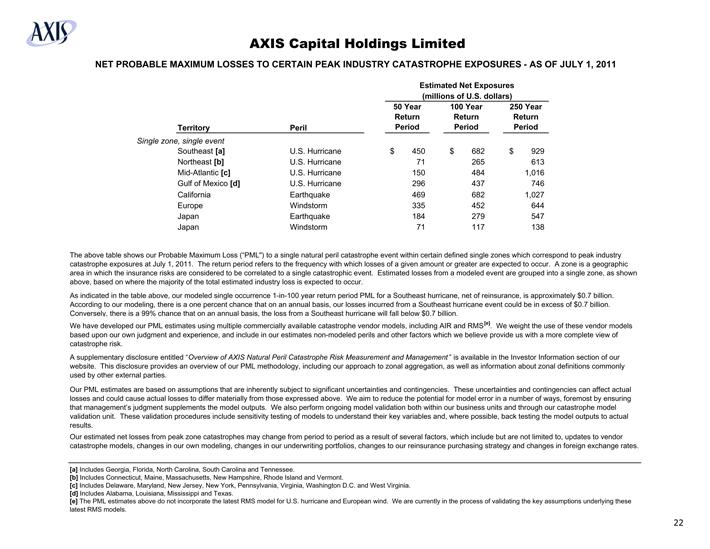
AXIS Capital Holdings Limited
NET PROBABLE MAXIMUM LOSSES TO CERTAIN PEAK INDUSTRY CATASTROPHE EXPOSURES - AS OF JULY 1, 2011
Estimated Net Exposures
(millions of U.S. dollars)
Territory Peril 50 Year Return Period 100 Year Return Period 250 Year Return Period
Single zone, single event
Southeast [a] U.S. Hurricane $ 450 $ 682 $ 929
Northeast [b] U.S. Hurricane 71 265 613
Mid-Atlantic [c] U.S. Hurricane 150 484 1,016
Gulf of Mexico [d] U.S. Hurricane 296 437 746
California Earthquake 469 682 1,027
Europe Windstorm 335 452 644
Japan Earthquake 184 279 547
Japan Windstorm 71 117 138
The above table shows our Probable Maximum Loss (“PML”) to a single natural peril catastrophe event within certain defined single zones which correspond to peak industry catastrophe exposures at July 1, 2011. The return period refers to the frequency with which losses of a given amount or greater are expected to occur. A zone is a geographic area in which the insurance risks are considered to be correlated to a single catastrophic event. Estimated losses from a modeled event are grouped into a single zone, as shown above, based on where the majority of the total estimated industry loss is expected to occur.
As indicated in the table above, our modeled single occurrence 1-in-100 year return period PML for a Southeast hurricane, net of reinsurance, is approximately $0.7 billion. According to our modeling, there is a one percent chance that on an annual basis, our losses incurred from a Southeast hurricane event could be in excess of $0.7 billion. Conversely, there is a 99% chance that on an annual basis, the loss from a Southeast hurricane will fall below $0.7 billion.
We have developed our PML estimates using multiple commercially available catastrophe vendor models, including AIR and RMS[e]. We weight the use of these vendor models based upon our own judgment and experience, and include in our estimates non-modeled perils and other factors which we believe provide us with a more complete view of catastrophe risk.
A supplementary disclosure entitled “Overview of AXIS Natural Peril Catastrophe Risk Measurement and Management” is available in the Investor Information section of our website. This disclosure provides an overview of our PML methodology, including our approach to zonal aggregation, as well as information about zonal definitions commonly used by other external parties.
Our PML estimates are based on assumptions that are inherently subject to significant uncertainties and contingencies. These uncertainties and contingencies can affect actual losses and could cause actual losses to differ materially from those expressed above. We aim to reduce the potential for model error in a number of ways, foremost by ensuring that management’s judgment supplements the model outputs. We also perform ongoing model validation both within our business units and through our catastrophe model validation unit. These validation procedures include sensitivity testing of models to understand their key variables and, where possible, back testing the model outputs to actual results.
Our estimated net losses from peak zone catastrophes may change from period to period as a result of several factors, which include but are not limited to, updates to vendor catastrophe models, changes in our own modeling, changes in our underwriting portfolios, changes to our reinsurance purchasing strategy and changes in foreign exchange rates.
[a] Includes Georgia, Florida, North Carolina, South Carolina and Tennessee.
[b] Includes Connecticut, Maine, Massachusetts, New Hampshire, Rhode Island and Vermont.
[c] Includes Delaware, Maryland, New Jersey, New York, Pennsylvania, Virginia, Washington D.C. and West Virginia.
[d] Includes Alabama, Louisiana, Mississippi and Texas.
[e] The PML estimates above do not incorporate the latest RMS model for U.S. hurricane and European wind. We are currently in the process of validating the key assumptions underlying these latest RMS models.
22

AXIS Capital Holdings Limited
EARNINGS PER COMMON SHARE INFORMATION - AS REPORTED, GAAP
Quarter ended June 30, Six months ended June 30,
2011 2010 2011 2010
Net income (loss) available to common shareholders $ 101,068 $ 204,852 $ (282,692) $ 316,664
WEIGHTED AVERAGE COMMON SHARES OUTSTANDING:
Weighted average basic shares outstanding 124,132 121,766 118,771 124,961
Dilutive share equivalents:
Warrants [a] 2,915 11,866 - 11,771
Stock compensation plans [a] 1,322 2,033 - 2,167
Weighted average diluted shares outstanding 128,369 135,665 118,771 138,899
EARNINGS (LOSS) PER COMMON SHARE
Basic $0.81 $1.68 ($2.38) $2.53
Diluted $0.79 $1.51 ($2.38) $2.28
[a] Due to the net loss incurred in the six months ended June 30, 2011, these securities were not included in the computation of diluted earnings per share, because of their anti-dilutive effect.
23
AXIS Capital Holdings Limited
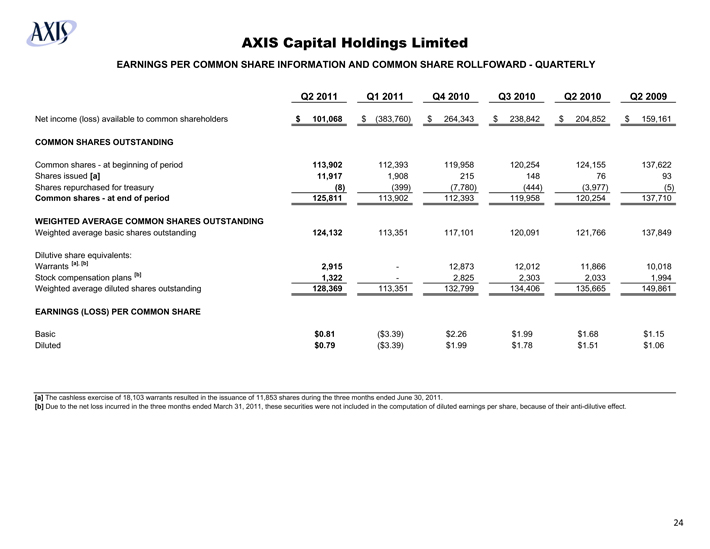
EARNINGS PER COMMON SHARE INFORMATION AND COMMON SHARE ROLLFOWARD - QUARTERLY
Q2 2011 Q1 2011 Q4 2010 Q3 2010 Q2 2010 Q2 2009
Net income (loss) available to common shareholders $ 101,068 $ (383,760) $ 264,343 $ 238,842 $ 204,852 $ 159,161
COMMON SHARES OUTSTANDING
Common shares - at beginning of period 113,902 112,393 119,958 120,254 124,155 137,622
Shares issued [a] 11,917 1,908 215 148 76 93
Shares repurchased for treasury (8) (399) (7,780) (444) (3,977) (5)
Common shares - at end of period 125,811 113,902 112,393 119,958 120,254 137,710
WEIGHTED AVERAGE COMMON SHARES OUTSTANDING
Weighted average basic shares outstanding 124,132 113,351 117,101 120,091 121,766 137,849
Dilutive share equivalents:
Warrants [a], [b] 2,915 - 12,873 12,012 11,866 10,018
Stock compensation plans [b] 1,322 - 2,825 2,303 2,033 1,994
Weighted average diluted shares outstanding 128,369 113,351 132,799 134,406 135,665 149,861
EARNINGS (LOSS) PER COMMON SHARE
Basic $0.81 ($3.39) $2.26 $1.99 $1.68 $1.15
Diluted $0.79 ($3.39) $1.99 $1.78 $1.51 $1.06
[a] The cashless exercise of 18,103 warrants resulted in the issuance of 11,853 shares during the three months ended June 30, 2011.
[b] Due to the net loss incurred in the three months ended March 31, 2011, these securities were not included in the computation of diluted earnings per share, because of their anti-dilutive effect.
24
AXIS Capital Holdings Limited
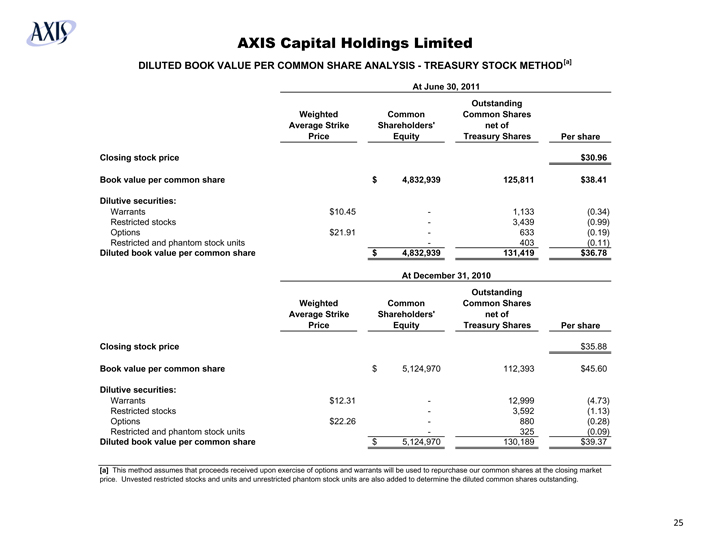
DILUTED BOOK VALUE PER COMMON SHARE ANALYSIS - TREASURY STOCK METHOD [a]
At June 30, 2011
Weighted Average Strike Price Common Shareholders’ Equity Outstanding Common Shares net of Treasury Shares Per share
Closing stock price $30.96
Book value per common share $ 4,832,939 125,811 $38.41
Dilutive securities:
Warrants $10.45 - 1,133 (0.34)
Restricted stocks - 3,439 (0.99)
Options $21.91 - 633 (0.19)
Restricted and phantom stock units - 403 (0.11)
Diluted book value per common share $ 4,832,939 131,419 $36.78
At December 31, 2010
Weighted Average Strike Price Common Shareholders’ Equity Outstanding Common Shares net of Treasury Shares Per share
Closing stock price $35.88
Book value per common share $ 5,124,970 112,393 $45.60
Dilutive securities:
Warrants $12.31 - 12,999 (4.73)
Restricted stocks - 3,592 (1.13)
Options $22.26 - 880 (0.28)
Restricted and phantom stock units - 325 (0.09)
Diluted book value per common share $ 5,124,970 130,189 $39.37
[a] This method assumes that proceeds received upon exercise of options and warrants will be used to repurchase our common shares at the closing market price. Unvested restricted stocks and units and unrestricted phantom stock units are also added to determine the diluted common shares outstanding.
25
AXIS Capital Holdings Limited
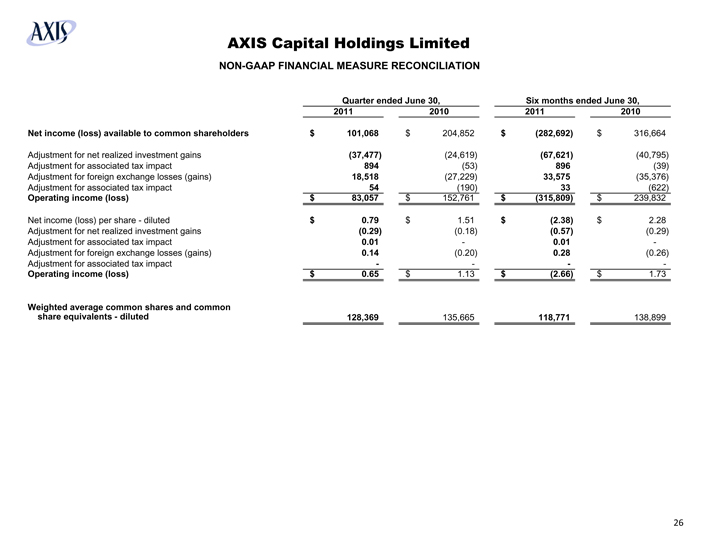
NON-GAAP FINANCIAL MEASURE RECONCILIATION
Quarter ended June 30, Six months ended June 30,
2011 2010 2011 2010
Net income (loss) available to common shareholders $ 101,068 $ 204,852 $ (282,692) $ 316,664
Adjustment for net realized investment gains (37,477) (24,619) (67,621) (40,795)
Adjustment for associated tax impact 894 (53) 896 (39)
Adjustment for foreign exchange losses (gains) 18,518 (27,229) 33,575 (35,376)
Adjustment for associated tax impact 54 (190) 33 (622)
Operating income (loss) $ 83,057 $ 152,761 $ (315,809) $ 239,832
Net income (loss) per share - diluted $ 0.79 $ 1.51 $ (2.38) $ 2.28
Adjustment for net realized investment gains (0.29) (0.18) (0.57) (0.29)
Adjustment for associated tax impact 0.01 - 0.01 -
Adjustment for foreign exchange losses (gains) 0.14 (0.20) 0.28 (0.26)
Adjustment for associated tax impact - - - -
Operating income (loss) $ 0.65 $ 1.13 $ (2.66) $ 1.73
Weighted average common shares and common share equivalents - diluted 128,369 135,665 118,771 138,899
26