AXIS Capital Albert Benchimol, President & CEO February 10, 2016 Bank of America Merrill Lynch 2016 Insurance Conference, New York, NY Exhibit 99.1
Safe Harbor Statement Statements in this presentation that are not historical facts, including statements regarding our estimates, beliefs, expectations, intentions, strategies or projections, may be “forward-looking statements” within the meaning of the U.S. federal securities laws, including the Private Securities Litigation Reform Act of 1995. We intend these forward-looking statements to be covered by the safe harbor provisions for forward-looking statements in the United States securities laws. In some cases, these statements can be identified by the use of forward-looking words such as “may,” “should,” “could,” “anticipate,” “estimate,” “expect,” “plan,” “believe,” “predict,” “potential,” “intend” or similar expressions. Our expectations are not guarantees and are based on currently available competitive, financial and economic data along with our operating plans. Forward-looking statements contained in this presentation may include, but are not limited to, information regarding our estimates of losses related to catastrophes and other large losses, measurements of potential losses in the fair value of our investment portfolio, our expectations regarding pricing and other market conditions and valuations of the potential impact of movements in interest rates, equity prices, credit spreads and foreign currency rates. Forward-looking statements only reflect our expectations and are not guarantees of performance. Accordingly, there are or will be important factors that could cause actual results to differ materially from those indicated in such statements. We believe that these factors include, but are not limited to, the following: The occurrence and magnitude of natural and man-made disasters, Actual claims exceeding our loss reserves, General economic, capital and credit market conditions, The failure of any of the loss limitation methods we employ, The effects of emerging claims, coverage and regulatory issues, including uncertainty related to coverage definitions, The failure of our cedants to adequately evaluate risks, Inability to obtain additional capital on favorable terms, or at all, The loss of one or more key executives, A decline in our ratings with rating agencies, Loss of business provided to us by our major brokers, Changes in accounting policies or practices, The use of industry catastrophe models and changes to these models, Changes in governmental regulations, Increased competition, Changes in the political environment of certain countries in which we operate or underwrite business, and Fluctuations in interest rates, credit spreads, equity prices and/or currency values.
Investment Highlights Global leader in specialty risks with both insurance and reinsurance platforms Successful track record confirms strength of value proposition Excellent financial strength Executing on strategic initiatives designed to improve relative returns independent of P&C cycle Building 21st century (re)insurance model to take advantage of transformational trends in the marketplace
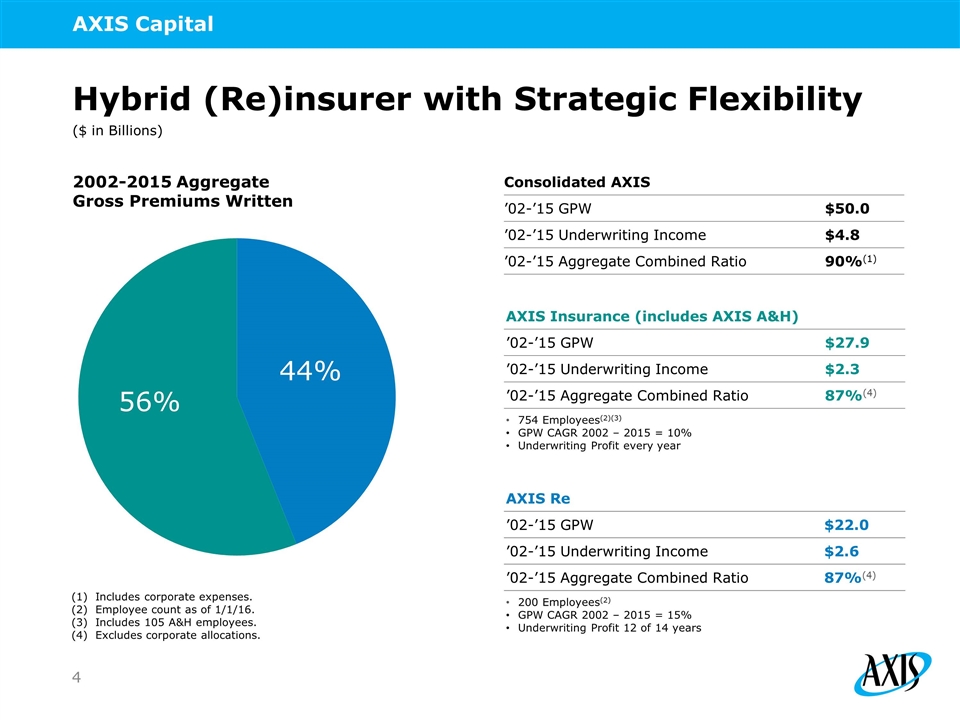
Hybrid (Re)insurer with Strategic Flexibility AXIS Insurance (includes AXIS A&H) ’02-’15 GPW $27.9 ’02-’15 Underwriting Income $2.3 ’02-’15 Aggregate Combined Ratio 87%(4) 754 Employees(2)(3) GPW CAGR 2002 – 2015 = 10% Underwriting Profit every year 2002-2015 Aggregate Gross Premiums Written Consolidated AXIS ’02-’15 GPW $50.0 ’02-’15 Underwriting Income $4.8 ’02-’15 Aggregate Combined Ratio 90%(1) AXIS Re ’02-’15 GPW $22.0 ’02-’15 Underwriting Income $2.6 ’02-’15 Aggregate Combined Ratio 87%(4) 200 Employees(2) GPW CAGR 2002 – 2015 = 15% Underwriting Profit 12 of 14 years ($ in Billions) Includes corporate expenses. Employee count as of 1/1/16. Includes 105 A&H employees. Excludes corporate allocations.
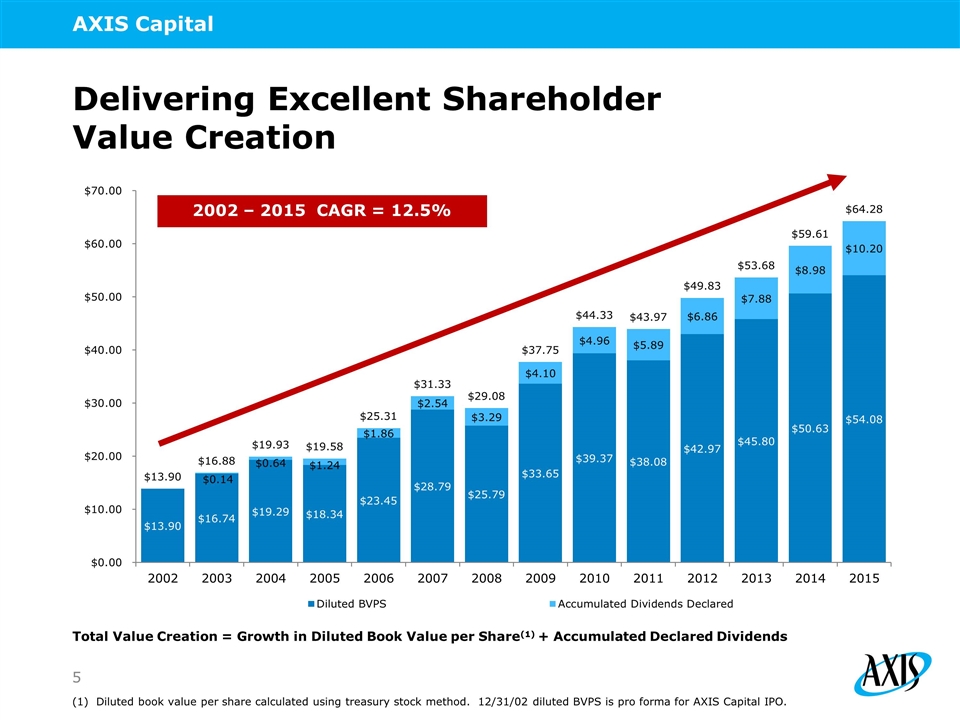
Delivering Excellent Shareholder Value Creation Diluted book value per share calculated using treasury stock method. 12/31/02 diluted BVPS is pro forma for AXIS Capital IPO. Total Value Creation = Growth in Diluted Book Value per Share(1) + Accumulated Declared Dividends 2002 – 2015 CAGR = 12.5%
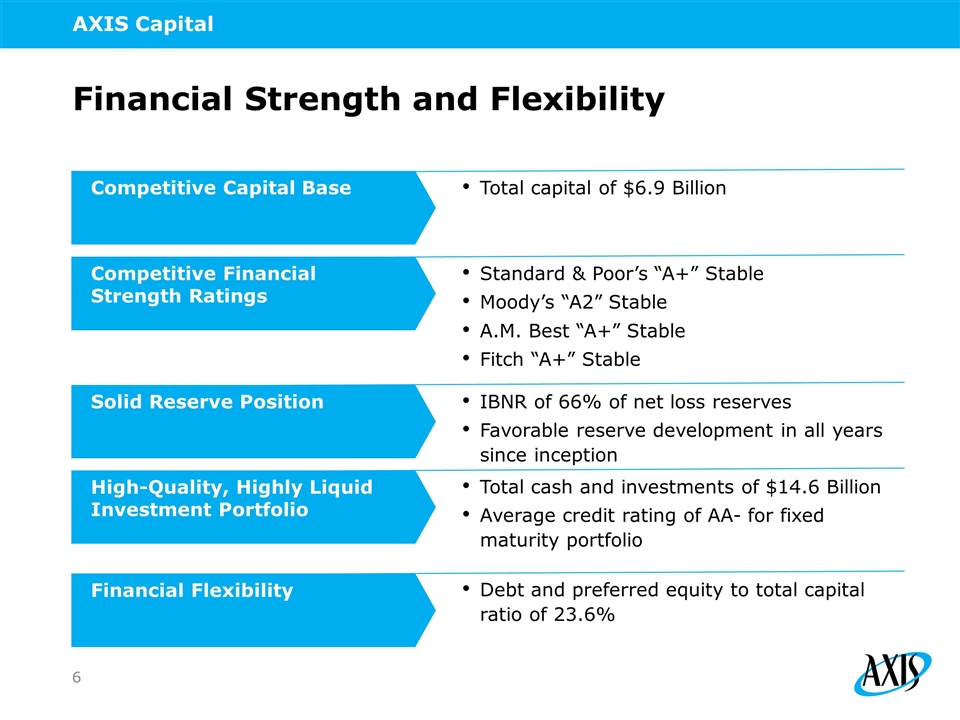
Total capital of $6.9 Billion Financial Strength and Flexibility Standard & Poor’s “A+” Stable Moody’s “A2” Stable A.M. Best “A+” Stable Fitch “A+” Stable Competitive Financial Strength Ratings IBNR of 66% of net loss reserves Favorable reserve development in all years since inception Total cash and investments of $14.6 Billion Average credit rating of AA- for fixed maturity portfolio Debt and preferred equity to total capital ratio of 23.6% Competitive Capital Base Solid Reserve Position High-Quality, Highly Liquid Investment Portfolio Financial Flexibility
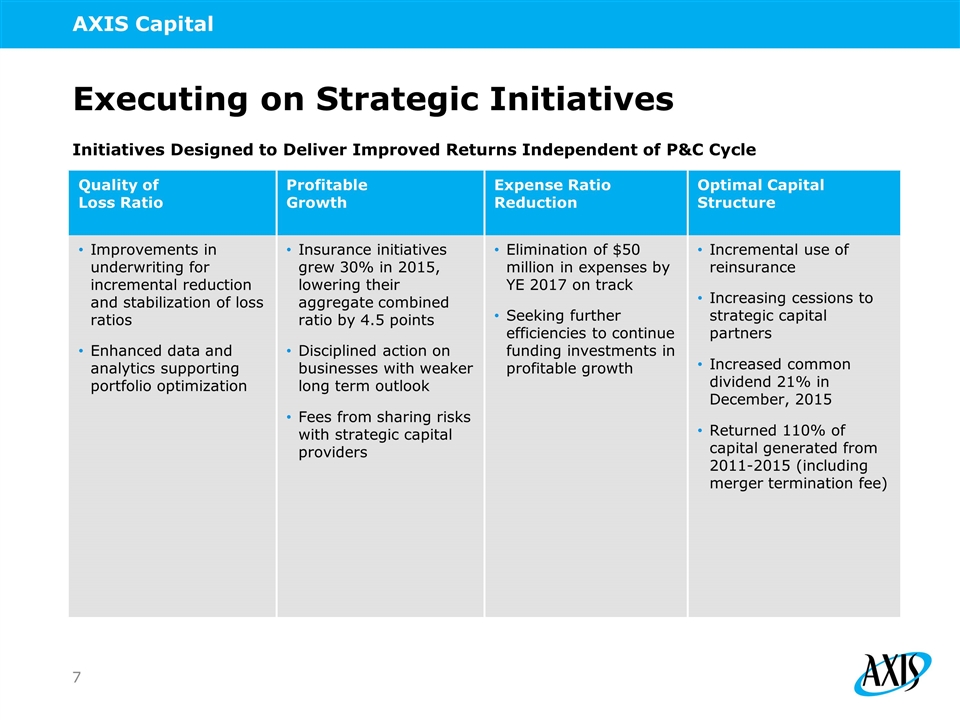
Initiatives Designed to Deliver Improved Returns Independent of P&C Cycle Executing on Strategic Initiatives Quality of Loss Ratio Profitable Growth Expense Ratio Reduction Optimal Capital Structure Improvements in underwriting for incremental reduction and stabilization of loss ratios Enhanced data and analytics supporting portfolio optimization Insurance initiatives grew 30% in 2015, lowering their aggregate combined ratio by 4.5 points Disciplined action on businesses with weaker long term outlook Fees from sharing risks with strategic capital providers Elimination of $50 million in expenses by YE 2017 on track Seeking further efficiencies to continue funding investments in profitable growth Incremental use of reinsurance Increasing cessions to strategic capital partners Increased common dividend 21% in December, 2015 Returned 110% of capital generated from 2011-2015 (including merger termination fee)
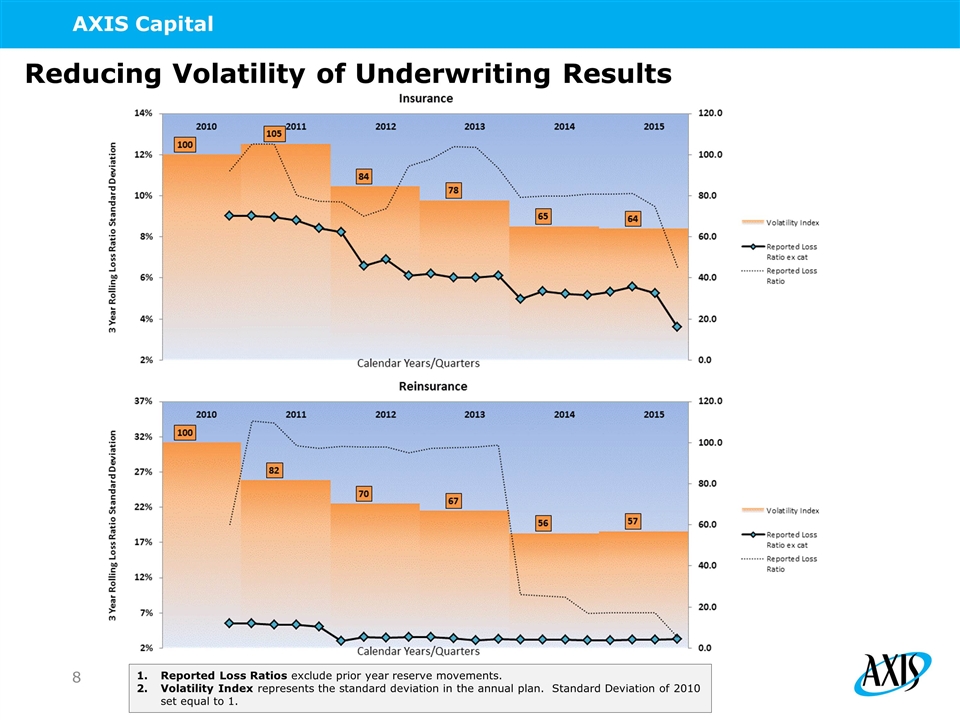
Reducing Volatility of Underwriting Results Reported Loss Ratios exclude prior year reserve movements. Volatility Index represents the standard deviation in the annual plan. Standard Deviation of 2010 set equal to 1.
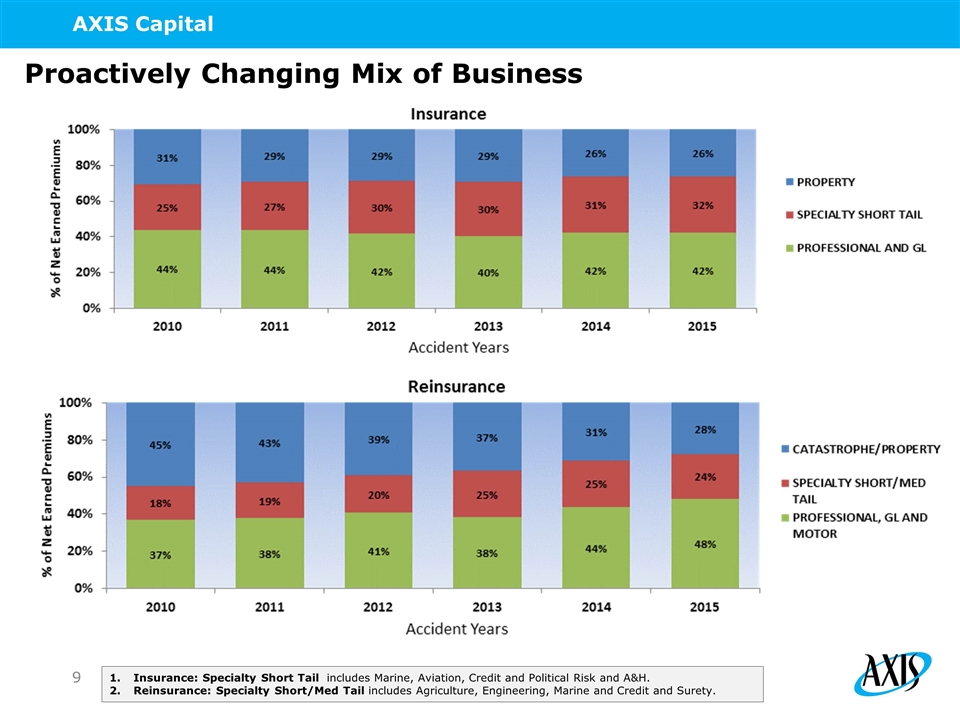
Proactively Changing Mix of Business Insurance: Specialty Short Tail includes Marine, Aviation, Credit and Political Risk and A&H. Reinsurance: Specialty Short/Med Tail includes Agriculture, Engineering, Marine and Credit and Surety.
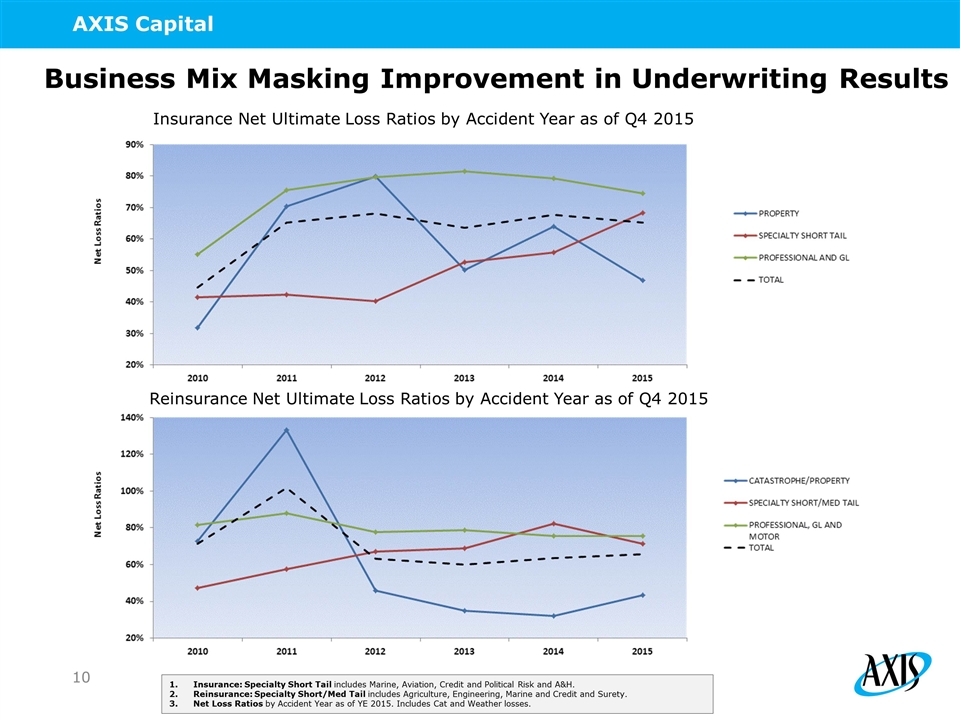
Insurance: Specialty Short Tail includes Marine, Aviation, Credit and Political Risk and A&H. Reinsurance: Specialty Short/Med Tail includes Agriculture, Engineering, Marine and Credit and Surety. Net Loss Ratios by Accident Year as of YE 2015. Includes Cat and Weather losses. Business Mix Masking Improvement in Underwriting Results Insurance Net Ultimate Loss Ratios by Accident Year as of Q4 2015 Reinsurance Net Ultimate Loss Ratios by Accident Year as of Q4 2015
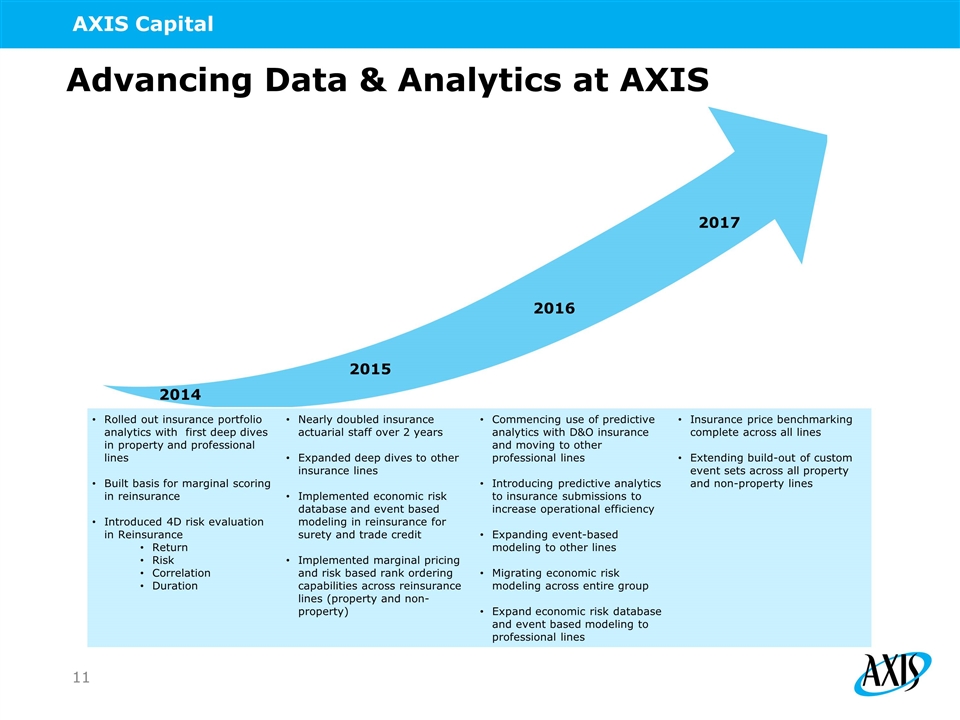
Advancing Data & Analytics at AXIS 2014 2016 2017 Rolled out insurance portfolio analytics with first deep dives in property and professional lines Built basis for marginal scoring in reinsurance Introduced 4D risk evaluation in Reinsurance Return Risk Correlation Duration Nearly doubled insurance actuarial staff over 2 years Expanded deep dives to other insurance lines Implemented economic risk database and event based modeling in reinsurance for surety and trade credit Implemented marginal pricing and risk based rank ordering capabilities across reinsurance lines (property and non-property) Commencing use of predictive analytics with D&O insurance and moving to other professional lines Introducing predictive analytics to insurance submissions to increase operational efficiency Expanding event-based modeling to other lines Migrating economic risk modeling across entire group Expand economic risk database and event based modeling to professional lines Insurance price benchmarking complete across all lines Extending build-out of custom event sets across all property and non-property lines 2015
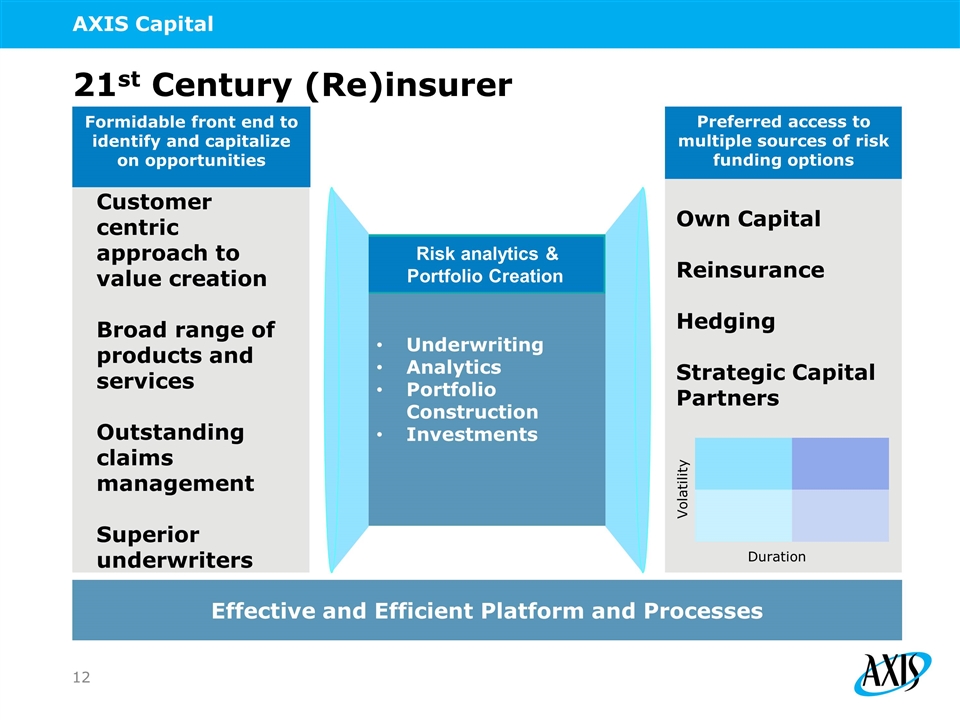
21st Century (Re)insurer Risk Sourcing Risk Funding Customer centric approach to value creation Broad range of products and services Outstanding claims management Superior underwriters Underwriting Analytics Portfolio Construction Investments Effective and Efficient Platform and Processes Risk analytics & Portfolio Creation Formidable front end to identify and capitalize on opportunities Preferred access to multiple sources of risk funding options Own Capital Reinsurance Hedging Strategic Capital Partners Duration Volatility
Conclusion Increasing relevance of the AXIS franchise Delivering targeted near and medium-term return enhancements Investing in next-generation specialty (re)insurer model Well positioned to seize opportunities in a transitioning market

Question & Answer Session


