0001214816us-gaap:ShortdurationInsuranceContractsAccidentYear2015Memberaxs:LiabilityLineMemberaxs:InsuranceMember2024-12-31
UNITED STATES
SECURITIES AND EXCHANGE COMMISSION
Washington, D.C. 20549
FORM 10-K
☒ ANNUAL REPORT PURSUANT TO SECTION 13 OR 15(d)
OF THE SECURITIES EXCHANGE ACT OF 1934
For the fiscal year ended December 31, 2024
OR
☐ TRANSITION REPORT PURSUANT TO SECTION 13 OR 15(d)
OF THE SECURITIES EXCHANGE ACT OF 1934
For the transition period from to
Commission file number 001-31721
AXIS CAPITAL HOLDINGS LIMITED
(Exact name of registrant as specified in its charter)
Bermuda
(State or other jurisdiction of incorporation or organization)
98-0395986
(I.R.S. Employer Identification No.)
92 Pitts Bay Road, Pembroke, Bermuda HM 08
(Address of principal executive offices and zip code)
(441) 496-2600
(Registrant’s telephone number, including area code)
Securities registered pursuant to Section 12(b) of the Act: | | | | | | | | |
| Title of each class | Trading Symbol(s) | Name of each exchange on which registered |
| Common shares, par value $0.0125 per share | AXS | New York Stock Exchange |
| Depositary shares, each representing a 1/100th interest in a 5.50% Series E preferred share | AXS PRE | New York Stock Exchange |
Securities registered pursuant to Section 12(g) of the Act: None
Indicate by check mark if the registrant is a well-known seasoned issuer, as defined in Rule 405 of the Securities Act. Yes ☒ No ☐
Indicate by check mark if the registrant is not required to file reports pursuant to Section 13 or Section 15(d) of the Act. Yes ☐ No ☒
Indicate by check mark whether the registrant (1) has filed all reports required to be filed by Section 13 or 15(d) of the Securities Exchange Act of 1934 during the preceding 12 months (or for such shorter period that the registrant was required to file such reports), and (2) has been subject to such filing requirements for the past 90 days. Yes ☒ No ☐
Indicate by check mark whether the registrant has submitted electronically every Interactive Data File required to be submitted pursuant to Rule 405 of Regulation S-T (§232.405 of this chapter) during the preceding 12 months (or for such shorter period that the registrant was required to submit such files). Yes ☒ No ☐
Indicate by check mark whether the registrant is a large accelerated filer, an accelerated filer, a non-accelerated filer, a smaller reporting company or an emerging growth company. See the definitions of "large accelerated filer", "accelerated filer", "smaller reporting company" and "emerging growth company" in Rule 12b-2 of the Exchange Act.
Large accelerated filer ☒ Accelerated filer ☐
Non-accelerated filer ☐ Smaller reporting company ☐
Emerging growth company ☐
If an emerging growth company, indicate by check mark if the registrant has elected not to use the extended transition period for complying with any new or revised financial accounting standards provided pursuant to Section 13(a) of the Exchange Act. ☐
Indicate by check mark whether the registrant has filed a report on and attestation to its management’s assessment of the effectiveness of its internal control over financial reporting under Section 404(b) of the Sarbanes-Oxley Act (15 U.S.C. 7262(b)) by the registered public accounting firm that prepared or issued its audit report. Yes ☒ No ☐
If securities are registered pursuant to Section 12(b) of the Act, indicate by check mark whether the financial statements of the registrant included in the filing reflect the correction of an error to previously issued financial statements. ☐
Indicate by check mark whether any of those error corrections are restatements that required a recovery analysis of incentive-based compensation received by any of the registrant’s executive officers during the relevant recovery period pursuant to §240.10D-1(b). ☐
Indicate by check mark whether the registrant is a shell company (as defined in Rule 12b-2 of the Act). Yes ☐ No ☒
The aggregate market value of the voting and non-voting common equity held by non-affiliates of the registrant, computed by reference to the closing price at the last business day of the registrant’s most recently completed second fiscal quarter, June 30, 2024, was approximately $5.9 billion.
At February 21, 2025, there were 80,786,584 common shares outstanding, $0.0125 par value per share, of the registrant.
DOCUMENTS INCORPORATED BY REFERENCE
Portions of the registrant’s definitive proxy statement to be filed with the Securities and Exchange Commission pursuant to Regulation 14A relating to the annual meeting of shareholders to be held on May 16, 2025 are incorporated by reference in response to items 10, 11, 12, 13 and 14 in Part III of this Form 10-K. The definitive proxy statement will be filed with the Securities and Exchange Commission not later than 120 days after the registrant's fiscal year ended December 31, 2024.
AXIS CAPITAL HOLDINGS LIMITED
TABLE OF CONTENTS | | | | | | | | |
| | |
| | | Page |
| | PART I | |
| | |
| Item 1. | | |
| | |
| Item 1A. | | |
| | |
| Item 1B. | | |
| | |
| Item 1C. | | |
| | |
| Item 2. | | |
| | |
| Item 3. | | |
| | |
| Item 4. | | |
| | |
| PART II | |
| | |
| Item 5. | | |
| | |
| Item 6. | | |
| | |
| Item 7. | | |
| | |
| Item 7A. | | |
| | |
| Item 8. | | |
| | |
| Item 9. | | |
| | |
| Item 9A. | | |
| | |
| Item 9B. | | |
| | |
| Item 9C. | | |
| | |
| PART III | |
| | |
| Item 10. | | |
| | |
| Item 11. | | |
| | |
| Item 12. | | |
| | |
| Item 13. | | |
| | |
| Item 14. | | |
| | |
| PART IV | |
| | |
| Item 15. | | |
| | |
| Item 16. | | |
Cautionary Note Regarding Forward-Looking Statements
This Annual Report on Form 10-K contains forward-looking statements within the meaning of Section 27A of the Securities Act of 1933 and Section 21E of the Securities Exchange Act of 1934. All statements, other than statements of historical facts included in this report, including statements regarding our estimates, beliefs, expectations, intentions, strategies or projections are forward-looking statements. We intend these forward-looking statements to be covered by the safe harbor provisions for forward-looking statements in the United States ("U.S.") federal securities laws. In some cases, these statements can be identified by the use of forward-looking words such as "may", "should", "could", "anticipate", "estimate", "expect", "plan", "believe", "predict", "potential", "aim", "will", "target", "intend" or similar expressions. These forward-looking statements are not historical facts, and are based on current expectations, estimates and projections, and various assumptions, many of which, by their nature, are inherently uncertain and beyond management's control.
Forward-looking statements contained in this report may include, but are not limited to, information regarding our estimates for losses and loss expenses, measurements of potential losses in the fair value of our investment portfolio and derivative contracts, our expectations regarding the performance of our business, our financial results, our liquidity and capital resources, the outcome of our strategic initiatives, our expectations regarding the closing of the loss portfolio transfer reinsurance agreement with Cavello Bay Reinsurance Limited, a wholly-owned subsidiary of Enstar Group Limited, our expectations regarding pricing, and other market and economic conditions including the liquidity of financial markets, developments in the commercial real estate market, inflation, our growth prospects, and valuations of the potential impact of movements in interest rates, credit spreads, equity securities' prices, and foreign currency exchange rates.
Forward-looking statements only reflect our expectations and are not guarantees of performance. These statements involve risks, uncertainties and assumptions. Accordingly, there are or will be important factors that could cause actual events or results to differ materially from those indicated in such statements.
We believe that these factors include, but are not limited to, those described below in 'Summary of Risk Factors' and in more detail under Item 1A, 'Risk Factors' of this report, as those factors may be updated from time to time in our periodic and other filings with the Securities and Exchange Commission (the "SEC"), which are accessible on the SEC's website at www.sec.gov.
We undertake no obligation to update or revise publicly any forward-looking statements, whether as a result of new information, future events or otherwise.
In this Form 10-K, references to "AXIS Capital" refer to AXIS Capital Holdings Limited and references to "we", "us", "our", "AXIS", the "Group" or the "Company" refer to AXIS Capital Holdings Limited and its direct and indirect subsidiaries and branches.
Summary of Risk Factors
Investing in our common stock involves substantial risks, and our ability to successfully operate our business is subject to numerous risks, including those that are generally associated with operating in the insurance and reinsurance industry. Some of the more significant material challenges and risks include the following:
Insurance Risk
Insurance risk is the inherent uncertainty as to the occurrence, amount and timing of insurance and reinsurance liabilities transferred to us through the underwriting process.
•Insurance and reinsurance business is historically cyclical, and we expect to experience periods with excess underwriting capacity and unfavorable premium rates.
•We may be adversely impacted by a wide variety of natural catastrophes or man-made catastrophes. The incidence and severity of catastrophes are inherently unpredictable and losses from catastrophes could be substantial. Our exposure to natural catastrophe losses may be increased by climate change, where we may have exposure to physical, transition and liability risks, as well as increasing regulation in the area of climate change. Other man-made catastrophes, such as cyber-attacks and other data security incidents, remain relatively new and therefore incorporate high degrees of uncertainty around their impact.
•We may be adversely affected by losses related to the conflict in the Middle East, Russia's invasion of Ukraine, terrorism and political unrest, or other unanticipated losses.
•We may be adversely impacted by social and economic inflation. Our operations, like those of other insurers and reinsurers, are susceptible to the effects of inflation because premiums are established before the ultimate amounts of losses and loss expenses are known.
•We may be adversely affected by the effects of emerging claims, systemic risks and coverage issues and/or if actual claims exceed our reserves for losses and loss expenses ("loss reserves"). The actual final cost of settling outstanding claims, as well as claims expected to arise from the unexpired period of risk, is uncertain. There are many other factors that would cause loss reserves to increase or decrease, which include, but are not limited to, emerging claims, systemic risks and coverage issues such as changes in claim severity.
•We may be adversely affected by the failure of our loss limitation strategy, including the use of reinsurance.
•We may be adversely affected by the failure of models used to support key decisions.
Strategic Risk
Strategic risks affect or are created by an organization’s business strategy and strategic objectives. Our review of strategic risk evaluates not only internal and external challenges that might cause our chosen strategy to fail but also evaluates major risks that could affect our long-term performance and position.
•We may be adversely affected by competition and consolidation in the insurance and reinsurance industry. Increased competition could result in fewer submissions, lower premium rates, less favorable policy terms and conditions, and greater costs of customer acquisition and retention.
•We have been and may continue to be adversely affected by a deterioration in global economic conditions. Economic uncertainty and market turmoil has affected and may in the future affect, among other aspects of our business, the demand for and claims made under our products, the ability of customers, counterparties and others to establish or maintain their relationships with us, our ability to access and efficiently use capital resources and our investment performance.
•We may be adversely affected by changes in the political environment of certain countries in which we operate or underwrite business.
•We may be adversely affected by loss of business provided by a major broker.
•We may be adversely affected by a downgrade in our financial strength or credit rating. If we experience a credit rating downgrade, withdrawal or negative watch/outlook in the future, we could incur higher borrowing costs and may have more limited means to access capital. It could also result in a substantial loss of business.
•We may be adversely affected by the increasing scrutiny and evolving expectations from investors, customers, regulators, policymakers and other stakeholders regarding environmental, social and governance matters.
Market Risk
Market risk is the risk that our financial instruments, which include derivatives, may be negatively impacted by movements in financial market prices or rates such as interest rates, credit spreads, equity securities' prices and foreign currency exchange rates.
•Our operating results, investment and derivative instrument portfolios may be adversely impacted by capital markets risk related to changes in interest rates, foreign currency exchange rates, credit spreads, equity securities' prices and other factors.
Liquidity Risk
Liquidity risk is the risk that we may not have sufficient cash to meet our obligations when they are due, or would have to incur excessive costs to do so.
•Our underwriting activities may expose us to liquidity risk. This stems mainly from the need to pay claims on potential extreme loss events and regulatory constraints that limit the flow of funds within the Group.
Credit Risk
Credit risk represents the risk of incurring financial loss due to the diminished creditworthiness (reduced financial strength and, ultimately, possibly default) and concentration of our third-party counterparties.
•We may be adversely impacted if we are unable to collect amounts due to us from our counterparties – most materially reinsurers, but also including brokers, agents and customers.
Operational Risk
Operational risk represents the risk of loss as a result of inadequate processes, system and network failures, human error or external events, including but not limited to direct or indirect financial loss, reputational damage, customer dissatisfaction, and legal and regulatory penalties.
•We may be adversely impacted by failure of the processes, people or systems that we rely on to maintain our operations and manage the operational risks inherent to our business, including those outsourced to third parties.
Regulatory Risk
Regulatory risk represents the risk arising from our failure to comply with legal, statutory or regulatory obligations.
•Our insurance and reinsurance subsidiaries conduct business globally and are subject to varying degrees of regulation, including data protection, privacy, and cybersecurity laws, in multiple jurisdictions. We may be adversely affected if we inadvertently fail to comply fully with, or obtain exemption from, relevant regulations.
Risks Related to the Ownership of our Securities
•In addition to the risks to our business listed above, there are certain other risks related to the ownership of our securities, for example relating to our holding company structure or provisions in our organizational documents and bye-laws.
Risks Related to Taxation
•We may be adversely impacted by changes in tax rules or changes in the interpretation of existing tax rules in the multiple jurisdictions in which we operate.
Readers should carefully consider the risks noted above together with the risks detailed in Item 1A, 'Risk Factors' and all of the other information included in this report.
Website and Social Media Disclosure
We use our website (www.axiscapital.com) and our corporate LinkedIn (AXIS Capital) and X Corp. (@AXIS_Capital) accounts as channels of distribution of Company information. The information we post through these channels may be deemed material. Accordingly, investors should monitor these channels, in addition to following our press releases, SEC filings and public conference calls and webcasts. In addition, e-mail alerts and other information about AXIS Capital may be received by those enrolled in our "E-mail Alerts" program, which can be found in the Investor Information section of our website (www.axiscapital.com). The contents of our website and social media channels are not part of this Annual Report on Form 10-K.
PART I
In this Form 10-K, references to "AXIS Capital" refer to AXIS Capital Holdings Limited and references to "we", "us", "our", "AXIS", the "Group" or the "Company" refer to AXIS Capital Holdings Limited and its direct and indirect subsidiaries and branches, including: AXIS Specialty Holdings Bermuda Limited, AXIS Specialty Limited ("AXIS Specialty Bermuda"), AXIS Specialty Limited (Singapore Branch), AXIS Specialty Insurance Limited ("AXIS Specialty Insurance Bermuda"), AXIS Specialty Investments Limited, AXIS Specialty Investments II Limited, AXIS Specialty UK Holdings Limited, AXIS Managing Agency Ltd., AXIS Corporate Capital UK Limited (corporate member that provided 70% capital support to AXIS Syndicate 1686 ("Syndicate 1686") through December 31, 2024), Novae Group Limited, AXIS UK Services Limited, AXIS UK Services Limited (Irish Branch), AXIS Underwriting Limited, AXIS Corporate Capital UK II Limited (corporate member that provided 30% capital support to Syndicate 1686 through December 31, 2024 and 100% capital support to Syndicate 1686 effective January 1, 2025 and 100% capital support to AXIS Energy Transition Syndicate 2050 ("Syndicate 2050")), AXIS ILS, Ltd., AXIS Reinsurance Managers Limited ("AXIS Reinsurance Managers"), AXIS Specialty Holdings Ireland Limited, AXIS Specialty Europe SE ("AXIS Specialty Europe"), AXIS Specialty Europe SE (UK Branch), AXIS Specialty Europe SE (Belgium Branch), AXIS Re SE, AXIS Re SE, Dublin (Zurich Branch) ("AXIS Re Europe"), AXIS Re SE Escritório de Representação No Brasil Ltda., AXIS Specialty Global Holdings Limited, AXIS Specialty U.S. Holdings, Inc., AXIS Reinsurance Company ("AXIS Re U.S."), AXIS Reinsurance Company (Canadian Branch), AXIS Specialty U.S. Services, Inc., AXIS Specialty U.S. Services, Inc. (U.K. Branch), AXIS Specialty Canada Services, ULC, AXIS Group Services, Inc., AXIS ILS, Inc., AXIS Insurance Company ("AXIS Insurance Co."), AXIS Surplus Insurance Company ("AXIS Surplus"), AXIS Group Benefits LLC, AXIS Specialty Insurance Company ("AXIS Specialty U.S."), AXIS Specialty Finance LLC and AXIS Specialty Finance PLC, unless the context suggests otherwise.
Unless otherwise noted, tabular dollars are in thousands. Amounts may not reconcile due to rounding differences.
General
AXIS is a global specialty underwriter and provider of insurance and reinsurance solutions with operations in Bermuda, the United States ("U.S."), Europe, Singapore and Canada. Our underwriting operations are organized around our global underwriting platforms, AXIS Insurance and AXIS Re.
The markets in which we operate have historically been cyclical. During periods of reduced underwriting capacity, pricing, and policy terms and conditions are generally more favorable for insurers and reinsurers. Conversely, during periods of excess underwriting capacity, defined by the availability of capital, competition can result in lower pricing and less favorable policy terms and conditions for insurers and reinsurers. Historically, underwriting capacity has been impacted by a range of factors, including systemic risks such as industry losses and catastrophes, as well as changes in legal, regulatory and rating agency guidelines, investment results, and the financial strength and ratings of competitors.
In 2024, we leveraged firming market conditions to grow in a number of attractive specialty lines insurance and treaty reinsurance markets and we continued to re-balance our portfolio towards less volatile lines of business. At December 31, 2024, we had common shareholders’ equity of $5.5 billion, total capital of $7.4 billion and total assets of $32.5 billion.
Our Business Strategy
We are a global specialty underwriter and provider of insurance and reinsurance solutions and are a leader in many of the markets where we choose to compete. We provide our clients and distribution partners with a broad range of risk transfer products and services, and strong capacity, backed by excellent financial strength. We manage our portfolio holistically, aiming to construct the optimum balance of risks, consistent with our risk appetite and the development of our franchise. We nurture an ethical, entrepreneurial, disciplined and inclusive culture that promotes outstanding client service, intelligent risk taking, operating efficiency, corporate citizenship and the achievement of superior risk-adjusted returns for our shareholders. We believe that the achievement of our objectives will position us as a global specialty underwriting leader, enabling us to deliver sustained profitable growth and increased shareholder value.
We aim to execute on our business strategy through the following multi-pronged approach:
We offer a diversified range of products and services across market segments and geographies: Our position as a global specialty underwriter and provider of insurance and reinsurance solutions gives us insight into the opportunities and challenges in a variety of markets. We are headquartered in Bermuda and have operations in the U.S., Canada, and Europe including Dublin, London, Zurich and Brussels, and Singapore. We service the Latin America specialty insurance and facultative reinsurance market through London and our other locations. In addition, we provide specialty insurance and reinsurance solutions to the Asia Pacific region through our London, Zurich and Bermuda offices.
We underwrite a balanced portfolio of risks, including complex and volatile lines, deploying capital within risk limits, diversification and risk management: Risk management is a strategic priority embedded in our organizational structure and we are continuously monitoring, reviewing, and refining our enterprise risk management practices. We combine judgment and experience with data-driven analysis, enhancing our overall risk selection process.
We modulate our risk appetite and deployment of capital across the underwriting cycle, commensurate with available market opportunities and returns: In response to market dynamics, we recognize opportunities as they develop and react quickly as new trends emerge. Our risk analytics provide important and continuous feedback, further assisting with the ongoing assessment of our risk appetite and strategic capital deployment. We have been successful in adding new underwriting teams, extending our product lines, finding new distribution channels and entering new geographies. When we do not find sufficiently attractive uses for our capital, we may return excess capital to our shareholders through share repurchases and dividends.
We develop and maintain deep, trusting and mutually beneficial relationships with clients and distribution partners, offering high levels of service and effective solutions for risk management needs: Our management team has extensive industry experience, deep product knowledge, long-standing market relationships and a top caliber claims capability. We primarily transact in specialty markets, where risks are complex, and are also growing our transactional specialty business targeting the lower middle market. We invest in data and technology and are exploring AI capabilities and tools to empower our underwriters and enhance the service that we provide to our customers. Our intellectual capital and proven client-service capability attract clients and distribution partners looking for solutions.
We maintain excellent financial strength, characterized by financial discipline and transparency: Our total capital of $7.4 billion at December 31, 2024 as well as our high-quality and liquid investment portfolio and our operating subsidiary ratings of "A+" ("Strong") by Standard & Poor's and "A" ("Excellent") by the A.M. Best Company, Inc. ("A.M. Best") are key indicators of our financial strength.
We attract, develop, retain and motivate teams of experts: We aim to attract and retain top talent in the industry and to motivate our employees to make decisions that are in the best interest of our clients and shareholders. We foster a culture that prioritizes ethics, risk awareness and achievement, while also promoting inclusion, professionalism, responsibility, integrity, discipline and entrepreneurship. As a result, we believe that our staff is well-positioned to make the best underwriting and strategic decisions for AXIS.
Our key financial metrics for performance measurement of the Company include operating return on average common equity ("operating ROACE"), which is reconciled to the most comparable GAAP financial measure, return on average common equity ("ROACE"), in Item 7 'Management's Discussion and Analysis of Financial Condition and Results of Operations – Non-GAAP Financial Measures Reconciliation', on an annual basis, as well as relative total shareholder return and adjusted book value per diluted common share ("Adjusted DBVPS") over the long term. Adjusted DBVPS represents average annual growth in book value per diluted common share, generally adjusted for dividends, unrealized investment gains (losses) recognized in accumulated other comprehensive income (loss) and share repurchases. Across the Group, we are focused on realizing our goal of delivering sustained profitable growth and increased shareholder value.
Segment Information
Our underwriting operations are organized around our global underwriting platforms, AXIS Insurance and AXIS Re. We have determined that we have two reportable segments, insurance and reinsurance. We do not allocate assets by segment, with the exception of goodwill and intangible assets.
Refer to Item 7 'Management’s Discussion and Analysis of Financial Condition and Results of Operations' for further details on our reportable segments and Item 8, Note 3 to the Consolidated Financial Statements 'Segment Information' for further details on our reportable segments and a description of the geographic distribution of gross premiums written based on the location of our subsidiaries.
The table below presents gross premiums written in each of our reportable segments for each of the most recent three years:
| | | | | | | | | | | | | | | | | | | | | | | |
| | | | | | | |
| Year ended December 31, | 2024 | | 2023 | | 2022 | |
| | | | | | | |
| Insurance | $ | 6,615,584 | | | $ | 6,140,764 | | | $ | 5,585,581 | | |
| Reinsurance | 2,390,304 | | | 2,215,761 | | | 2,629,014 | | |
| Total | $ | 9,005,888 | | | $ | 8,356,525 | | | $ | 8,214,595 | | |
| | | | | | | |
Insurance Segment
Lines of Business and Distribution
Our insurance segment offers specialty insurance products to a variety of niche markets on a worldwide basis. The following are the lines of business in our insurance segment:
•Professional Lines: provides directors’ and officers’ liability, errors and omissions liability, employment practices liability, fiduciary liability, crime, professional indemnity, medical malpractice and other financial insurance related covers for public and private commercial enterprises, financial institutions, not-for-profit organizations and other professional service providers. This business is predominantly written on a claims-made basis.
•Property: provides physical loss or damage, business interruption and machinery breakdown cover for virtually all types of property, including commercial buildings, residential premises, construction projects, property in transit, onshore renewable energy installations, and physical damage and business interruption following an act of terrorism. This line of business includes primary and excess risks, some of which are catastrophe-exposed.
•Liability: provides cover for primary and low to mid-level excess and umbrella commercial liability, and environmental liability risks in the U.S. wholesale markets in addition to primary and excess of loss employers, public, and products liability business predominately in the U.K. Target industry sectors include construction, manufacturing, transportation and trucking, and other services.
•Cyber: provides cover for cyber, technology errors and omissions, media and miscellaneous professional liability. Cover is provided for a range of risks including data recovery and bricking, cyber-crime, liability and regulatory actions, business interruption, extortion, reputational harm, Payment Card Industry Data Security Standard and media liability.
•Marine and Aviation: Marine provides cover for a range of exposures including offshore energy, offshore renewable energy, cargo, liability including kidnap and ransom, fine art, specie, and hull war. Offshore energy coverages include physical damage, business interruption, operator's extra expense and liability coverage for all aspects of offshore upstream energy, from exploration and construction through the operation and distribution phases. Aviation provides hull and liability, and specific war cover primarily for passenger airlines but also for cargo operations, general aviation operations, airports, aviation authorities, security firms and product manufacturers.
•Accident and Health: includes personal accident, travel insurance and specialty health products for employer and affinity groups, and pet insurance.
•Credit and Political Risk: provides credit and political risk insurance products for banks, commodity traders, corporations, and multilateral and export credit agencies. Cover is provided for a range of risks including sovereign and corporate credit default, political violence, currency inconvertibility and non-transfer, expropriation, aircraft non-repossession and contract frustration due to political events. Surety bonds are also provided to large corporate and commercial clients, and to mid to large sized construction clients.
We produce business primarily through wholesale and retail brokers worldwide. Some of our insurance products are also distributed through managing general agents ("MGAs") and managing general underwriters ("MGUs"). In the U.S., we have the ability to write business on an admitted basis using forms and rates filed with state insurance regulators and on a non-admitted or surplus lines basis, which provides flexibility in forms and rates, as these are not filed with state regulators. Our ability to write business on a non-admitted basis in the U.S. provides us with the pricing flexibility needed to write non-standard coverages. Substantially all of our insurance business is subject to aggregate limits, in addition to event limits.
Gross premiums written by broker, shown individually where premiums by broker were 10% or more of the total in any of the last three years, were as follows:
| | | | | | | | | | | | | | | | | | | | | | | | | | | | | | | | | | | | | | | | | |
| | | | | | | | | | | | | |
| Year ended December 31, | 2024 | | 2023 | | 2022 | |
| | | | | | | | | | | | | |
| AmWINS Group Inc. | $ | 787,703 | | | 12 | % | | $ | 719,651 | | | 12 | % | | $ | 605,727 | | | 11 | % | |
| Ryan Specialty Group | 690,825 | | | 10 | % | | 606,583 | | | 10 | % | | 486,639 | | | 9 | % | |
| Marsh & McLennan Companies Inc. | 658,638 | | | 10 | % | | 610,186 | | | 10 | % | | 630,085 | | | 11 | % | |
| Aon plc | 633,297 | | | 10 | % | | 677,930 | | | 11 | % | | 697,103 | | | 12 | % | |
| Other brokers | 2,592,262 | | | 39 | % | | 2,471,284 | | | 40 | % | | 2,276,962 | | | 41 | % | |
| Other managing general agencies and underwriters (1) | 1,252,859 | | | 19 | % | | 1,055,130 | | | 17 | % | | 889,065 | | | 16 | % | |
| Total | $ | 6,615,584 | | | 100 | % | | $ | 6,140,764 | | | 100 | % | | $ | 5,585,581 | | | 100 | % | |
| | | | | | | | | | | | | |
(1) Includes gross premiums written by MGAs and MGUs that are not affiliated to brokers who produced 10% or more of the total gross premiums written in any of the last three years.
No insured accounted for more than 10% of the gross premiums written in the insurance segment.
Competitive Environment
In our insurance segment, where competition is focused on price, service, availability of capacity, appetite and distribution, among other considerations, we compete globally and locally with North American and other carriers. We believe we can achieve positive differentiation through underwriting expertise in our chosen lines of business and market segments, providing customized solutions for our strategic partners and top caliber claims service levels to our customers. In addition, our investment in building an agile business model is expected to enable us to more quickly bring innovative products and services to market while delivering value to our customers and driving profitable growth.
Reinsurance Segment
Lines of Business and Distribution
Our reinsurance segment provides treaty reinsurance to insurance companies on a worldwide basis, written on an excess of loss or a proportional basis. For excess of loss business, we typically indemnify the reinsured for a portion of losses, individually and in the aggregate, in excess of a specified individual or aggregate loss deductible. For proportional business, we assume an agreed percentage of the underlying premiums and accept liability for the same percentage of losses and loss expenses.
Our business is primarily produced through reinsurance brokers worldwide. The following are the lines of business in our reinsurance segment:
•Liability: provides protection to insurers of admitted casualty business, excess and surplus lines casualty business and specialty casualty programs. The primary focus of the underlying business is general liability, workers' compensation, auto liability, environmental liability, and excess casualty.
•Accident and Health: includes personal accident, specialty health, accidental death, travel, life and disability reinsurance products which are offered on a proportional and catastrophic or per life excess of loss basis.
•Professional Lines: provides protection for directors’ and officers’ liability, employment practices liability, medical malpractice, professional indemnity, cyber and miscellaneous errors and omissions insurance risks. The underlying business is predominantly written on a claims-made basis. This business is written on a proportional and excess of loss basis.
•Credit and Surety: Credit reinsurance provides protection for trade credit insurance, and credit and political risk insurance. Trade credit insurance protects sellers of goods and services in the event of a non-payment by the buyer of those goods and services. Credit and political risk insurance covers a range of risks predominantly corporate and sovereign non-payment. Surety reinsurance provides protection for losses arising from a broad array of surety bonds issued by insurers to satisfy regulatory demands, contract, and commercial obligations in a variety of jurisdictions around the world. Mortgage reinsurance is provided to mortgage guaranty insurers, U.S. government-sponsored entities and other mortgage market participants. These entities seek to manage their credit risk exposure emanating from defined pools of mortgage loans.
•Motor: provides protection to insurers for motor liability and motor property damage losses arising out of any one occurrence. A loss occurrence can involve one or many claimants where the ceding insurer aggregates the claims from the occurrence. Traditional non-proportional and proportional reinsurance as well as structured solutions are offered predominantly relating to European exposures.
•Agriculture: provides protection for risks associated with the production of food and fiber on a global basis for primary insurance companies writing multi-peril crop insurance, crop hail, and named peril covers, as well as custom risk transfer mechanisms for agricultural dependent industries with exposures to crop yield and/or price deviations. This business is written on a proportional and aggregate stop loss reinsurance basis.
•Marine and Aviation: Marine includes specialty marine exposures such as cargo, hull, pleasure craft, marine liability, inland marine and offshore energy. The principal perils covered by policies in this portfolio include physical loss, damage and/or liability arising from natural perils of the seas or land, man-made events including fire and explosion, stranding/sinking/salvage, pollution, shipowners and maritime employers liability. This business is written on a non-proportional and proportional basis. Aviation provides cover for airline, aerospace and general aviation exposures. This business is written on a proportional and non-proportional basis. The Company exited Aviation business effective January 1, 2023.
Run-off lines
•Catastrophe: provides protection for most catastrophic losses that are covered in the underlying insurance policies written by our cedants. The underlying policies principally cover property-related exposures but other exposures including personal accident are also covered. The principal perils covered by policies in this portfolio include hurricane and windstorm, earthquake, flood, tornado, hail and fire. In some instances, terrorism may be a covered peril or the only peril. This business is written on a proportional and an excess of loss basis. The Company exited this line of business in June 2022.
•Property: provides protection for property damage and related losses resulting from natural and man-made perils that are covered in the underlying personal and commercial lines insurance policies written by our cedants. The predominant exposure is to property damage, but other risks, including business interruption and other non-property losses, may also be covered when arising from a covered peril. The most significant perils covered by policies in this portfolio include windstorm, tornado and earthquake, but other perils such as freezes, riots, flood, industrial explosions, fire, hail and a number of other loss events are also included. This business is written on a proportional and excess of loss basis. The Company exited this line of business in June 2022.
•Engineering: provides protection for all types of construction risks and risks associated with erection, testing and commissioning of machinery and plants during the construction stage. This line of business also includes cover for losses arising from operational failures of machinery, plant and equipment, and electronic equipment as well as business interruption. The Company exited this line of business in 2020.
Gross premiums written by broker, shown individually where premiums by broker were 10% or more of the total in any of the last three years, were as follows:
| | | | | | | | | | | | | | | | | | | | | | | | | | | | | | | | | | | | | | | | | |
| | | | | | | | | | | | | |
| Year ended December 31, | 2024 | | 2023 | | 2022 | |
| | | | | | | | | | | | | |
| Aon plc | $ | 589,324 | | | 25 | % | | $ | 595,587 | | | 27 | % | | $ | 659,811 | | | 25 | % | |
| Marsh & McLennan Companies Inc. | 561,906 | | | 24 | % | | 594,287 | | | 27 | % | | 739,380 | | | 28 | % | |
| Arthur J. Gallagher & Co | 512,000 | | | 21 | % | | 398,093 | | | 18 | % | | 379,822 | | | 14 | % | |
| | | | | | | | | | | | | |
| Other brokers | 374,313 | | | 15 | % | | 343,130 | | | 16 | % | | 231,200 | | | 9 | % | |
| Direct | 194,809 | | | 8 | % | | 163,073 | | | 7 | % | | 444,930 | | | 17 | % | |
| Managing general agencies and underwriters | 157,952 | | | 7 | % | | 121,591 | | | 5 | % | | 173,871 | | | 7 | % | |
| Total | $ | 2,390,304 | | | 100 | % | | $ | 2,215,761 | | | 100 | % | | $ | 2,629,014 | | | 100 | % | |
| | | | | | | | | | | | | |
No cedant accounted for more than 10% of the gross premiums written in the reinsurance segment.
Competitive Environment
In our reinsurance segment, competition tends to be focused on availability, service, financial strength and price. We compete with major North American and other reinsurers and reinsurance departments of numerous multi-line insurance organizations. In addition to traditional market participants, we also compete with new market entrants supported by alternative capital sources offering risk transfer solutions on a collateralized or other non-traditional basis. Our clients may also acquire reinsurance protection through capital market products such as catastrophe bonds and insurance loss warranties. We believe that we achieve a competitive advantage through our diversified global product offerings, responsiveness to customer needs and ability to provide sophisticated and innovative products. We offer excellent claims management, strong financial strength ratings and an ability to leverage our balance sheet and relationships with strategic capital partners to provide strong capacity.
Cash and Investments
We seek to balance the investment portfolio's objectives of increasing book value with the generation of relatively stable investment income, while providing sufficient liquidity to meet our claims and other obligations. Liquidity needs arising from potential claims are of primary importance and are considered in asset class participation and the asset allocation process. A significant portion of our investment portfolio is dedicated to investment grade fixed maturities that will generate cash flows that match expected claim payouts.
To diversify risk and optimize the growth in book value, we may invest in other asset classes such as equity securities, high yield securities and alternative investments (e.g., private equity funds), which provide higher potential total rates of return. These individual investment classes involve varying degrees of risk, including the potential for more volatile returns and reduced liquidity. However, as part of a balanced portfolio, they also provide diversification from interest rate and credit risk.
With regard to our investment portfolio, we primarily utilize third-party investment managers for security selection and trade execution functions, subject to guidelines and objectives for each asset class. This enables us to actively manage our investment portfolio with access to top performers specializing in various products and markets. We select managers based on various criteria including investment style, performance history and corporate governance. In addition, we monitor approved investment asset classes for each subsidiary through analysis of our operating environment, including expected volatility of cash flows, overall capital position, regulatory and rating agency considerations. The Finance Committee of our Board of Directors approves overall group asset allocation ranges and investment policy to ensure that they are consistent with our overall goals, strategies and objectives. We also have an Investment and Finance Committee, comprised of members of our senior management team, which oversees the implementation of our investment strategy.
Refer to Item 7 'Management’s Discussion and Analysis of Financial Condition and Results of Operations – Cash and Investments' and Item 8, Note 5 to the Consolidated Financial Statements 'Investments' for further details on our investment portfolio.
Refer to 'Risk and Capital Management' for further details on management of investment risk.
General
Our insurance and reinsurance entities are regulated in most countries, although the degree and type of regulation varies significantly from one jurisdiction to another. We may become subject to regulation in new jurisdictions or to additional regulations in existing jurisdictions. To the extent we are aware of impending changes in regulation, our project teams prepare us to comply with such anticipated changes on a timely basis. The following describes the current material regulations under which the Company operates.
Bermuda
Our Bermuda insurance operating subsidiary, AXIS Specialty Bermuda, is a Class 4 general business insurer subject to the Insurance Act 1978, amendments thereto and related regulations of Bermuda ("Insurance Act"). In addition, AXIS Specialty Insurance Bermuda was incorporated on August 19, 2024 as a Bermuda exempt company, and was licensed on December 17, 2024 as a Class 4 insurer under the Insurance Act.
The Insurance Act provides that no person may carry on any insurance or reinsurance business in or from within Bermuda unless registered as an insurer by the Bermuda Monetary Authority ("BMA") under the Insurance Act. The Insurance Act imposes upon Bermuda insurance companies' solvency and liquidity standards, and auditing and reporting requirements, and grants the BMA powers to supervise, investigate, require information and demand the production of documents and intervene in the affairs of insurance companies.
Significant requirements pertaining to Class 4 insurers include the appointment of an independent auditor, the appointment of a loss reserve specialist, the appointment of a principal representative in Bermuda, the filing of annual Statutory Financial Returns together with annual GAAP financial statements and an annual Capital and Solvency Return, compliance with minimum and enhanced capital requirements, together with certain restrictions on reductions of capital and the payment of dividends and distributions as well as group solvency and supervision rules, if applicable, and compliance with the Insurance Code of Conduct.
Effective January 1, 2016, the BMA was granted full "equivalence" under Solvency II (refer to 'Ireland' below) for Bermuda’s commercial insurance sector, including Class 4 insurers.
The BMA acts as group supervisor of AXIS Capital and has designated AXIS Specialty Bermuda as the 'designated insurer' of the Group. In accordance with the group supervision and insurance group solvency rules, AXIS Capital is required to prepare and submit an annual group Statutory Financial Return, annual audited group GAAP financial statements, an annual group Capital and Solvency Return and quarterly group unaudited GAAP financial statements, and to appoint a group actuary and a group auditor. AXIS Capital also files an annual capital and solvency return and must ensure compliance with minimum and enhanced capital requirements. In late 2024, the BMA published a consultation paper outlining its plans to directly supervise group holding companies, where these are based in Bermuda. The consultation period ended in January 2025, and final rules are expected to be published during the first quarter of 2025, with groups being given 12 months to implement any required changes.
In August 2022, the BMA published a revised version of the Insurance Code of Conduct ("Insurance Code"). Overall, the amendments aim to improve and enhance the Insurance Code and its application, while at the same time incorporating various administrative changes. The most substantive changes to the Insurance Code relate to:
(i) Corporate Governance, including a new requirement that the board of directors of an insurer that is a subsidiary of a Bermuda registered insurance group, such as AXIS Specialty Bermuda, must have an appropriate number of non-executive directors;
(ii) Risk Management Framework, including the addition of a definition of "Environment, Social and Governance Risk"; and
(iii) Outsourcing, including enhanced requirements for material outsourcing arrangements.
The Insurance Code, as amended, came into force on September 1, 2022. Bermuda insurers and insurance groups were required to be compliant with sections 1 through 7 of the Insurance Code by September 1, 2023 and applicable parts of section 8 of the Insurance Code by March 1, 2023.
AXIS Reinsurance Managers is regulated by the BMA as an insurance manager. As an insurance manager, AXIS Reinsurance Managers is required to register with the BMA pursuant to the Insurance Act. AXIS Reinsurance Managers is also required to comply with the Insurance Manager Code of Conduct.
AXIS Capital, AXIS Specialty Bermuda, AXIS Specialty Insurance Bermuda, AXIS Specialty Holdings Bermuda Limited, AXIS Specialty Investments Limited, AXIS ILS Ltd., AXIS Specialty Investments II Limited and AXIS Reinsurance Managers must comply with provisions of the Bermuda Companies Act 1981 of Bermuda, as amended ("Companies Act"), regulating the payment of dividends and distributions. A Bermuda company may not declare or pay a dividend or make a distribution out of contributed surplus if there are reasonable grounds for believing that:
(a) the company is, or would after the payment be, unable to pay its liabilities as they become due; or
(b) the realizable value of the company’s assets would thereby be less than its liabilities.
The Singapore branch of AXIS Specialty Bermuda, AXIS Specialty Limited (Singapore Branch), established in 2008, is regulated by the Monetary Authority of Singapore ("MAS") pursuant to The Insurance Act of Singapore, which imposes significant regulations relating to capital adequacy, risk management, governance, audit and actuarial requirements. AXIS Specialty Limited (Singapore Branch) is registered by the Accounting and Corporate Regulatory Authority ("ACRA") as a foreign company in Singapore and is also regulated by ACRA pursuant to the Singapore Companies Act. Prior to establishing its Singapore branch, AXIS Specialty Bermuda had maintained a representative office in Singapore since 2004. AXIS Specialty Bermuda ceased writing new business through its branch in Singapore, effective January 1, 2024, and plans to close this branch, subject to meeting all regulatory and legal requirements.
AXIS Specialty Bermuda has reinsurance permissions in China and the Netherlands. AXIS Specialty Limited (Singapore Branch) has separate reinsurance permissions in China.
AXIS Re SE and AXIS Specialty Europe SE may both write reinsurance in Bermuda under Solvency II equivalence between Bermuda and the European Union ("EU").
AXIS Managing Agency Ltd. may write general insurance and reinsurance in Bermuda using Lloyd's of London ("Lloyd's") licenses (refer to 'U.K. and Lloyd's of London' below).
United States
U.S. Insurance Holding Company Regulation of AXIS Capital’s Insurance Subsidiaries
As members of an insurance holding company system, each of AXIS Insurance Co., AXIS Re U.S., AXIS Specialty U.S. and AXIS Surplus (collectively the "U.S. Insurance Subsidiaries") are subject to the insurance holding company laws and regulations of the states in which they do business. These laws generally require each of the U.S. Insurance Subsidiaries to register with its domestic state insurance department and to furnish financial and other information which may materially affect the operations, management or financial condition within the holding company system. All transactions within a holding company system that involve an insurance company must be fair and equitable. Notice to the applicable insurance department is required prior to the consummation of transactions affecting the ownership or control of an insurer and of certain material transactions between an insurer and an entity in its holding company system, and certain transactions may not be consummated without the department’s prior approval.
State Insurance Regulation
AXIS Re U.S. is licensed to transact insurance and reinsurance throughout the U.S. and in Puerto Rico. AXIS Re U.S. is also authorized to transact insurance and reinsurance throughout Canada through its Canadian branch and has reinsurance permissions in Argentina, Brazil, and Ecuador. AXIS Insurance Co. is licensed to transact insurance and reinsurance throughout the U.S. AXIS Specialty U.S. is licensed to transact insurance and reinsurance throughout the U.S., except California, Iowa, Maine, New Mexico, New York and Wyoming. AXIS Surplus is eligible to write insurance on a surplus lines basis throughout the U.S., Puerto Rico and the U.S. Virgin Islands.
Our U.S. Insurance Subsidiaries are subject to regulation and supervision by their respective states of domicile and by other jurisdictions in which they do business. The regulations generally are derived from statutes that delegate regulatory and supervisory powers to an insurance official. The regulatory framework varies from state to state, but generally relates to approval of policy forms and rates, the standards of solvency that must be met and maintained, including risk-based capital standards, material transactions between an insurer and its affiliates, the licensing of insurers, agents and brokers, restrictions on insurance policy terminations, and limitations on the amount and nature of certain investments, limitations on the net amount of insurance of a single risk compared to the insurer’s surplus, deposits of securities for the benefit of policyholders, methods of accounting, periodic examinations of the financial condition and market conduct of insurance companies, the form and content of reports of financial condition required to be filed, and reserves for unearned premiums, losses, expenses and other obligations.
Our U.S. Insurance Subsidiaries are required to file detailed quarterly statutory financial statements with state insurance regulators in each of the states in which they conduct business. In addition, the U.S. Insurance Subsidiaries’ operations and accounts are subject to financial condition and market conduct examination at regular intervals by state regulators.
Regulators and rating agencies use statutory surplus as a measure to assess our U.S. Insurance Subsidiaries’ ability to support business operations and pay dividends. Our U.S. Insurance Subsidiaries are subject to various state statutory and regulatory restrictions that limit the amount of dividends that may be paid from earned surplus without prior approval from regulatory authorities. These restrictions differ by state, but generally are based on calculations using statutory surplus, statutory net income and investment income. In addition, many state regulators use the National Association of Insurance Commissioners promulgated risk-based capital requirements as a means of identifying insurance companies that may be under-capitalized.
Although generally the insurance industry is not directly regulated by the federal government, federal legislation and initiatives can affect the industry and our business. Certain sections of the Dodd-Frank Wall Street Reform and Consumer Protection Act of 2010 ("Dodd-Frank") pertain to the regulation and business of insurance. Specifically, the Federal Insurance Office ("FIO") has limited authority to collect information and report on the business of insurance to Congress. In addition, Dodd-Frank contains the Non-Admitted and Reinsurance Reform Act of 2010 ("NRRA"). NRRA facilitates the payment of surplus lines taxes, simplifies the granting of alien insurers to become surplus lines authorized and coordinates the credit for certain reinsurance.
AXIS Group Benefits LLC, a provider of voluntary, limited benefit, affordable health plans and other employee benefits coverage for hourly and part-time workers and their families, is an authorized insurance producer in all U.S. states except Hawaii. As a resident insurance producer in Arizona, AXIS Group Benefits LLC is subject to regulation and supervision by the Arizona Department of Insurance and is also subject to the regulation and supervision of the other states in which AXIS Group Benefits LLC transacts business.
AXIS ILS, Inc., incorporated in Delaware, is a marketing services company for insurance linked securities sponsored by the Company. AXIS Specialty Underwriters, Inc. was a Florida licensed reinsurance intermediary. Following the closure of our Florida office in 2021, AXIS Specialty Underwriters' coverholder agreement with Syndicate 1686 was terminated, effective December 31, 2021. All regulatory licenses in Florida for AXIS Specialty Underwriters, Inc. were terminated in 2022, however, the entity remained registered in Delaware and was renamed AXIS ILS, Inc.
U.S. Authorizations of our Non-U.S. Insurance Subsidiaries
The insurance laws of each U.S. state regulate or prohibit the sale of insurance and reinsurance by insurers and reinsurers that are not admitted to do business within their jurisdictions or otherwise conduct business pursuant to exemptions. AXIS Specialty Europe is eligible to write surplus lines business throughout the U.S. and in Puerto Rico. AXIS Managing Agency Ltd. is eligible to use Lloyd's licenses to (i) write surplus lines business throughout the U.S. and in all U.S. territories, and (ii) write non-life reinsurance business throughout the U.S. and in all U.S. territories, except for accident and health reinsurance in New York.
In addition to the regulatory requirements imposed by the jurisdictions in which they are licensed, reinsurers’ business operations are affected by regulatory requirements in various states of the U.S. governing "credit for reinsurance" that are imposed on their ceding companies. In general, a ceding company obtaining reinsurance from a reinsurer that is licensed or approved by the jurisdiction or state in which the ceding company files statutory financial statements is permitted to reflect in its statutory financial statements a credit in an aggregate amount equal to the ceding company’s liability for unearned premiums (which is that portion of premiums written which applies to the unexpired portion of the policy period), loss reserves and loss expense reserves ceded to the reinsurer. The great majority of states, however, permit a credit to statutory surplus to be recognized resulting from reinsurance obtained from a non-licensed or non-accredited reinsurer to the extent that the reinsurer provides a letter of credit, trust fund or other acceptable security arrangement. A few states do not allow credit for reinsurance ceded to non-licensed reinsurers except in certain limited circumstances, and others impose additional requirements that make it difficult to become accredited. In connection with the establishment of a Multi-Beneficiary Reinsurance Trust, AXIS Specialty Bermuda obtained accredited or trusted reinsurer status in all U.S. jurisdictions except for New York.
During 2022, AXIS Specialty Bermuda obtained reciprocal jurisdiction reinsurer status with Missouri as its lead state. Reinsurers licensed in reciprocal jurisdictions (which include EU member states, Bermuda, Japan and Switzerland) are not required to post reinsurance collateral if approved as reciprocal jurisdiction reinsurers. With its approval from Missouri, AXIS Specialty Bermuda applied for and received passporting approvals from California, Connecticut, Delaware, Florida, Illinois, New York, Ohio, Rhode Island, and Texas. "Passporting" refers to the process by which a state has the discretion to defer to the determination by another state that a reinsurer is a reciprocal jurisdiction reinsurer, thereby excusing the approved reinsurer from collateral requirements in such state.
Ireland
Our Ireland domiciled insurer and reinsurer are subject to the Solvency II Directive (Directive 2009/138/EC), as amended ("Solvency II"). Solvency II represents a consolidation and modernization of existing European Commission Solvency I insurance and reinsurance regulation and supervision and includes a harmonized risk-based solvency and reporting regime for the insurance/reinsurance sector. Solvency II covers three main areas: (i) the valuation of assets and liabilities and related solvency capital requirements; (ii) governance requirements including key functions of compliance, internal audit, actuarial and risk management; and (iii) legal entity and EU group reporting and disclosure requirements including public disclosures. The capital requirement must be computed using the Solvency II standard formula unless the Central Bank of Ireland ("CBI") has previously authorized a company to use its own internal model. Certain of our European legal entities are subject to Solvency II.
AXIS Specialty Europe
AXIS Specialty Europe is a European public limited liability company incorporated as a non-life insurer under the laws of Ireland. It is a Societas Europaea (SE), or European society company, and has been registered in accordance with EU law. As an SE company, AXIS Specialty Europe can more easily merge with companies in European member states and also transfer its domicile to other Member States of the EU AXIS Specialty Europe is authorized and regulated by the CBI pursuant to the Insurance Acts 1909 to 2000, as amended, repealed or replaced, the Central Bank Acts 1942 to 2014, as amended, repealed or replaced, and EU regulation relating to general insurance and statutory instruments made thereunder. AXIS Specialty Europe is authorized to conduct business in 16 non-life insurance classes throughout the EU and the European Economic Area ("EEA"), which includes each of the Member States of the EU with the addition of Iceland, Liechtenstein and Norway. AXIS Specialty Europe may also write reinsurance business within the classes of insurance business for which it is authorized.
AXIS Specialty Europe is subject to Solvency II. In accordance with Solvency II, AXIS Specialty Europe is permitted to provide insurance services to clients located in any EEA Member State ("Freedom of Services"), subject to compliance with any "general good requirements" as may be established by the applicable EEA Member State regulator. AXIS Specialty Europe has notified the CBI of its intention to provide insurance services on a Freedom of Services basis in all EEA countries.
Solvency II also permits AXIS Specialty Europe to carry on insurance business in any EEA Member State under the principle of "Freedom of Establishment" subject to the prior approval of the CBI. AXIS Specialty Europe operates under Freedom of Establishment in Belgium through its branch established in this jurisdiction.
AXIS Specialty Europe also has a U.K. branch that transacts general insurance business in the U.K. and trades as AXIS Specialty London. The U.K. withdrew from the EU on January 31, 2020 and is now considered a third-country. In order to maintain business continuity, AXIS Specialty Europe submitted an application to the Prudential Regulatory Authority ("PRA") in 2018 for authorization of a third-country branch. This application was approved on October 28, 2022, and the UK Branch of AXIS Specialty Europe is now fully regulated by both the PRA and the Financial Conduct Authority ("FCA").
AXIS Specialty Europe has local regulatory permission to carry on insurance business in Jersey, and has permission to write surplus lines business in all 50 U.S. states, Puerto Rico, and Washington D.C. It also has reinsurance permissions in India, China, Argentina, Mexico, Panama, Paraguay, Honduras, Ecuador, Colombia and Guatemala.
AXIS Re SE
AXIS Re SE is a European public limited liability company incorporated as a reinsurer under the laws of Ireland. AXIS Re SE is also a Societas Europaea (SE), or European society company, registered in accordance with EU law. AXIS Re SE is authorized by the CBI as a composite reinsurer (non-life and life) in accordance with the Insurance Acts 1909 to 2000, as amended, repealed or replaced, the Central Bank Acts 1942 to 2014, as amended, repealed or replaced, and EU regulation applicable to reinsurance and statutory instruments made thereunder. AXIS Re SE is authorized to transact reinsurance throughout the EU and the EEA and is subject to Solvency II.
AXIS Re SE conducts business through its branch in Zurich, Switzerland, trading as AXIS Re Europe (see 'Switzerland' below).
AXIS Re SE Escritório de Representação No Brasil Ltda. was established in Brazil as a subsidiary of AXIS Re SE to facilitate the Brazilian Superintendence of Private Insurance ("SUSEP") regulatory requirements for approval of a representative office of AXIS Re SE and for the registration of AXIS Re SE with SUSEP as an admitted reinsurer.
AXIS Re SE has reinsurance permissions in Argentina, Bolivia, Brazil, China, Chile, Colombia, Dominican Republic, Ecuador, El Salvador, Guatemala, Honduras, India, Mexico, Nicaragua, Panama, Paraguay, and Peru.
AXIS Specialty Holdings Ireland Limited
AXIS Specialty Holdings Ireland Limited is incorporated in Ireland, and is the limited liability holding company for AXIS Specialty Europe, AXIS Re SE, and formerly Contessa Limited, which was dissolved on April 11, 2024.
AXIS Specialty Global Holdings Limited
AXIS Specialty Global Holdings Limited is incorporated in Ireland, and is the limited liability holding company for AXIS Capital's U.S. Insurance subsidiaries.
Other AXIS Entities
AXIS Specialty Bermuda may write reinsurance under Solvency II equivalence granted to Bermuda by the EU AXIS Managing Agency Ltd. is eligible to write insurance (except permanent health) and reinsurance business in Ireland through Lloyd's Europe.
U.K. and Lloyd's of London
In the U.K., under the Financial Services and Markets Act 2000 ("FSMA"), no person may carry on a regulated activity unless authorized or exempt. Effecting or intermediating contracts of insurance or reinsurance are regulated activities requiring authorization. Effecting contracts of insurance requires authorization by the PRA and is regulated by the FCA. Intermediating contracts of insurance requires authorization by the FCA.
Under the Financial Services Act 2012, the FCA is a conduct regulator for all U.K. firms carrying on regulated activity in the U.K. while the PRA is the prudential regulator for U.K. banks, building societies, credit unions, insurers and major investment firms. As a prudential regulator, the PRA's general objective is to promote the safety and soundness of the firms it regulates. The PRA rules require financial firms to hold sufficient capital and have adequate risk controls in place.
The FCA's statutory strategic objective is to ensure that relevant markets function well and have operational objectives to protect consumers and protect financial markets and to promote competition. It makes rules covering how the firm must be managed and requirements relating to the firm’s systems and controls, how business must be conducted and the firm’s arrangements to manage financial crime risk. The PRA and the FCA require regular and ad hoc reporting and monitor compliance with their respective rule books through a variety of means including the collection of data, industry reviews and site visits.
AXIS Managing Agency Ltd.
AXIS Managing Agency Ltd. is authorized and regulated by the PRA and regulated by the FCA to conduct insurance and reinsurance business and is a Lloyd's managing agent authorized by Lloyd's to manage our syndicates, Syndicate 1686 and AXIS Energy Transition Syndicate 2050 ("Syndicate 2050"). Syndicate 2050 commenced underwriting business on April 1, 2024.
Lloyd’s is a society of corporate and individual members that underwrite insurance and reinsurance as members of syndicates. A syndicate is made up of one or more members that form a group to accept insurance and reinsurance risks. Each syndicate is managed by a managing agent that writes insurance business on behalf of the members of the syndicate. Syndicate members receive profits or bear losses in proportion to their respective shares in the syndicate for each underwriting year of account.
Lloyd’s is subject to U.K. law and is authorized under the FSMA. The Lloyd’s Act 1982 defines the governance structure and rules under which the society operates. Under the Lloyd's Act 1982, the Council of Lloyd’s is responsible for managing, supervising and supporting the Lloyd's market. Lloyd's agrees to syndicates' business plans and evaluates performance against those plans. Syndicates are required to underwrite only in accordance with their agreed business plans. If they fail to do so, Lloyd’s can take a range of actions including, as a last resort, prohibiting a syndicate from underwriting.
Lloyd’s has a global network of licenses and authorizations, and underwriters at Lloyd's may write business in countries where Lloyd’s has authorized status or exemptions available to non-admitted insurers or reinsurers. Lloyd’s licenses can only be used if the Syndicate Business Forecast, agreed annually with Lloyd’s, names those countries. Lloyd’s also manages and protects the Lloyd’s network of international licenses, monitors syndicates’ compliance with Lloyd’s Principles for doing business and is responsible for setting both member and central capital levels.
AXIS Managing Agency Ltd. operated an underwriting division at Lloyd’s Insurance Company (China) Limited, a wholly-owned subsidiary of the Corporation of Lloyd’s which allowed it to underwrite reinsurance in China. Syndicate 1686 ceased underwriting business on the Lloyd's China platform effective December 31, 2021. This business was placed in run-off effective January 1, 2022.
AXIS Corporate Capital UK Limited
AXIS Corporate Capital UK Limited is a corporate member of Syndicate 1686, providing 70% capital support. It ceased providing capital support to Syndicate 1686 on December 31, 2024.
AXIS Corporate Capital UK II Limited
AXIS Corporate Capital UK II Limited is a corporate member of Syndicate 1686, providing 30% capital support. It provides 100% capital support to Syndicate 1686 with effect from January 1, 2025.
AXIS Corporate Capital UK II Limited is also a corporate member of Syndicate 2050, providing 100% capital support.
AXIS Underwriting Limited
AXIS Underwriting Limited is authorized and regulated by the FCA as an insurance intermediary. AXIS Underwriting Limited underwrites insurance on behalf of AXIS Specialty Europe and at Lloyd's on behalf of Syndicate 1686.
Contessa Limited
Effective December 2019, Contessa Limited ceased writing insurance on behalf of AXIS Specialty Europe and was dissolved on April 11, 2024. AXIS Specialty Europe manages the Contessa book of business on a run-off basis.
AXIS Specialty UK Holdings Limited
AXIS Specialty UK Holdings Limited is incorporated under the laws of England and Wales, and is the limited liability holding company for AXIS Managing Agency Ltd., AXIS Corporate Capital UK Limited and Novae Group Limited.
Reinsurance
AXIS Managing Agency Ltd. remains able to conduct non-life facultative, proportional and excess of loss reinsurance throughout the EEA via Lloyd’s Europe. UK regulated firms' access to EU markets generally depend on the rules each Member State applies to third country regulated firms.
AXIS Re SE currently transacts reinsurance business in the EEA pursuant to European law. In November 2020, the U.K. granted equivalence under Solvency II to EEA supervised reinsurers, including AXIS Re SE, allowing such reinsurers to continue operations without interruption.
Switzerland
AXIS Re SE's branch in Zurich, Switzerland trades as AXIS Re Europe and is registered in Zurich as AXIS Re SE, Dublin (Zurich Branch). The CBI remains responsible for the prudential supervision of the branch. The Swiss Financial Market Supervisory Authority does not impose additional regulation upon a Swiss branch of a company exclusively engaged in providing reinsurance.
AXIS Managing Agency Ltd. is eligible to use Lloyd's licenses to write all classes of insurance business, except life, sickness and legal expenses in Switzerland, and is authorized to write the same classes of reinsurance business in Switzerland.
Singapore
AXIS Specialty Bermuda historically conducted insurance and reinsurance business from its branch in Singapore, AXIS Specialty Limited (Singapore Branch), subject to the supervision of the BMA and the MAS. The BMA and the MAS impose significant regulations relating to capital adequacy, risk management, governance and audit and actuarial requirements. AXIS Specialty Limited (Singapore Branch) is registered by ACRA as a foreign company in Singapore and is also regulated by ACRA pursuant to the Singapore Companies Act. AXIS Specialty Bermuda ceased writing new business through its branch in Singapore, effective January 1, 2024, and plans to close this branch, subject to meeting all regulatory and legal requirements.
AXIS Managing Agency Ltd. is eligible to use Lloyd's licenses to write insurance from Singapore with the exception of certain compulsory classes and life business. Singapore business may also be written from outside Singapore in certain circumstances where it is placed with a Singapore intermediary licensed by the MAS to place business at Lloyd's or by dealing directly with the insured.
Canada
AXIS Re U.S. conducts insurance and reinsurance business from its branch in Canada, AXIS Reinsurance Company (Canadian Branch), subject to the supervision of the New York State Department of Financial Services and the Office of the Superintendent of Financial Institutions Canada ("OSFI"), the federal regulatory authority that supervises federal Canadian and non-Canadian insurance companies operating in Canada pursuant to the Insurance Companies Act (Canada). The branch is authorized by OSFI to transact insurance and reinsurance. In addition, the branch is subject to the laws and regulations of each of the provinces and territories in which it is licensed.
AXIS Managing Agency Ltd. is eligible to use Lloyd's licenses to write insurance in and from Canada, subject to the laws and regulations of each of the provinces and territories in which it is licensed, with the following exceptions: hail insurance in respect of crop in the province of Quebec; home warranty insurance in the province of British Columbia; life insurance; credit protection insurance; title insurance; surety; and mortgage default insurance. AXIS Managing Agency Ltd., through Lloyd's, is authorized to write reinsurance in and from Canada subject to certain restrictions relating to life reinsurance.
Belgium
AXIS Specialty Europe conducts insurance from its Belgium branch, AXIS Specialty Europe SE (Belgium Branch), which is subject to CBI prudential supervision and limited regulation by the NBB.
Non-Admitted Insurance and Reinsurance
The Company also insures and reinsures risks in many countries, including the above countries, pursuant to regulatory permissions and exemptions available to non-admitted insurers and reinsurers.
AXIS Managing Agency Ltd. is eligible to use Lloyd's licenses to write insurance and reinsurance business where Lloyd's has authorized status or pursuant to regulatory exemptions available to non-admitted insurers and reinsurers.
AXIS Capital’s mission is not only to deliver strong financial results, but also to help our clients, brokers and partners navigate the challenges of a volatile world. We believe our teammates distinguish us from our competitors and are critical to our success as a specialty underwriter that leads with purpose and lives our values every day. Our workforce’s strength is grounded in our values: Excellence, Stronger Together, Decisiveness and People. These values represent behaviors that we hold ourselves and others accountable for every day. We recognize that our strength lies in our people, and therefore, one of our core strategies is to invest in and support our employees, including in the following areas of focus:
Talent Development
At AXIS, investing in our people is a top priority. We provide our teammates with a suite of professional development tools, resources and training modules to help navigate career experiences and upskill across our global organization. We provide our teammates with professional development and career planning opportunities, including an online learning and development hub that reflects our commitment to continuing education, and offering financial assistance for external professional development opportunities and tuition reimbursement for certain part-time business-related degree and certificate programs. We've also expanded our manager resources and training on "how to" create meaningful employee development plans.
Health, Safety and Wellness
We are committed to the health, safety and wellness of our workforce and offer our teammates a variety of tools to support their physical, emotional and financial well-being. Examples include access to mental health resources, back-up child and elder care and on-demand fertility, maternity, postpartum and return-to-work assistance. We offer a hybrid working model that provides flexibility to our teammates. We strive to be an employer of choice and we expect this approach will help us recruit and retain talent.
Inclusion
By actively embracing a variety of perspectives, experiences and backgrounds and ensuring equal treatment for all, we strive to make AXIS a more rewarding and inclusive place to work. AXIS in 2024 continued to progress its inclusion efforts through a formalized, five pillar approach that includes:
•Offering internal education and awareness training for teammates;
•Applying recruitment and mobility best practices, including internal career mobility for existing teammates;
•Providing career development opportunities to help develop and retain our existing teammates;
•Ongoing measurement to better understand our workforce; and
•Advocacy to help drive change across the insurance industry.
Mental Health and Well-Being
Supporting the mental health and well-being of our teammates has long been a priority for AXIS. In 2024, we hosted a variety of internal learning events, offered activities for our teammates focused on Mental Health Awareness month and World Mental Health Day, and promoted broader internal and external advocacy initiatives to promote mental health and well-being.
Teammate Engagement
We understand that employee engagement leads to a more satisfying and fulfilling workplace and motivates teammates to do their best work. Our engagement initiatives include our global recognition program, community building events and our teammate-led charitable giving program. Our CEO hosts Company-wide calls on a monthly basis including discussions with members of senior management and leads regular small group conversations with randomly selected groups of teammates. Feedback is collected and fed back through our How We Work working group to address teammate ideas and concerns.
As part of the overall transformation strategy, we underwent a culture renovation, re-evaluating our current values and developing new values and values-driven behaviors with the input of teammates. The goal was to relaunch values that reflect the current company and behaviors that will provide guidance on how we achieve our goals while sustaining a healthy culture.
Compensation and Benefits
To attract and retain our industry's top talent, we offer teammates a total rewards program that is designed to incentivize exceptional performance. Our compensation packages align with our pay-for-performance philosophy and are assessed on an annual basis following year-end performance reviews. Our packages are also regularly benchmarked against similarly-sized specialty insurance, reinsurance and financial services companies in our talent markets. Compensation components include market competitive salaries and short-term annual incentive programs (i.e., bonus payments) and, for senior level teammates, long-term incentives such as equity grants. To provide share ownership throughout all levels of our organization, we recently introduced a one-time equity grant for our teammates who do not receive equity as part of their annual compensation. Our comprehensive benefits packages include health and welfare plans for employees and their families, retirement savings plans with employer contributions and work-life benefits, including parental leave policies, flexible work arrangements for eligible teammates and charitable matching programs.
At AXIS, we are committed to fair pay and delivering equal pay for equal work regardless of gender, race or other personal characteristics. In support of our commitment to equal pay practices, all compensation offers are reviewed against internal peers to ensure equal pay at the job level, while year-end incentive awards are reviewed for bias based on gender and ethnic diversity. Furthermore, regular pay equity audits are conducted with action taken to address any areas of concern.
Succession Planning
We have a robust talent and succession planning process. On an annual basis, management conducts talent reviews for all AXIS teammates, focusing on high performing and high potential talent, emerging talent, and diverse talent. This information is used to drive both employee development plans and succession planning. In 2024, succession plans were completed for each member of the Executive Committee and the other critical roles across AXIS. On an annual basis, our Board receives a robust succession plan for each member of our Executive Committee, including the CEO.
Employees
At December 31, 2024, we had 1,876 employees. During 2024, the number of employees decreased by approximately 8% and our voluntary turnover rate was 11.9% compared to 10.9% in 2023.
We use our trademarks, including among others, our "AXIS" trademarks for the global marketing of our products and services, and we believe that we sufficiently safeguard our trademark portfolio to protect our rights.
Our Internet website address is www.axiscapital.com. Information contained in our website is not part of this report.
We make available free of charge, through our internet website, our Annual Report on Form 10-K, Quarterly Reports on Form 10-Q, Current Reports on Form 8-K, and amendments to those reports filed or furnished pursuant to Section 13(a) or 15(d) of the Exchange Act as soon as reasonably practicable after such material is electronically filed with, or furnished to, the SEC.
RISK AND CAPITAL MANAGEMENT
Risk Management Framework – Overview
Mission and Objectives
The mission of Enterprise Risk Management ("ERM") is to promptly identify, assess, manage, monitor, and report risks that affect the achievement of our strategic, operational, and financial objectives. The key objectives of our ERM framework are to:
•Protect our capital base and earnings by monitoring risks against our stated risk appetite and limits;
•Promote a sound risk management culture through disciplined and informed risk taking;
•Enhance value creation and contribute to an optimal risk-return profile by providing the basis for efficient capital deployment;
•Support our group-wide decision-making process by providing reliable and timely risk information; and
•Safeguard our reputation.
The ERM framework applies to all lines of business and corporate functions.
Risk Governance
At the heart of our ERM framework is a governance process with responsibilities for identifying, assessing, managing, monitoring, and reporting risks. We articulate roles and responsibilities for risk management throughout the organization, from the Board of Directors and the Chief Executive Officer to our business and corporate functions, thus embedding risk management throughout the Company (refer to 'Risk Governance and Risk Management Organization' below).
Our risk policies are a formal set of documents that outline key drivers of risk and responsibilities for managing individual and aggregate risks. Our qualitative and quantitative risk reporting framework provides transparency and early warning indicators to senior management with regard to our overall risk profile, adherence to risk appetite and limits and management actions at the Group and legal entity level.
Various governance and control bodies coordinate to help ensure that objectives are being achieved, risks are identified, and appropriately managed, and internal controls are in place and operating effectively.
Internal Capital Model
An important aspect of our ERM framework is our internal capital model. Utilizing this modeling framework provides us with a holistic view of the capital we put at risk in any year by allowing us to understand the relative interaction among the known risks impacting us. This integrated approach recognizes that a single risk factor can affect different sub-portfolios and that different risk factors can have different mutual dependencies. We continuously review and update our model and its parameters as our risk landscape and external environment continue to evolve.
As well as being used to measure internal risk capital (refer to 'Capital Management' below), our internal capital model is used as a tool in managing our business, specifically to help allocate capital to the businesses that will provide the best returns. We also use the internal model to support portfolio monitoring, reinsurance and retrocession (collectively referred to as "reinsurance") purchasing, and investment asset allocations.
Our internal capital model is an integral part of the business planning process which provides an assessment as to whether our prospective business and investment strategies are in line with our defined risk appetite and objectives at the Group and legal entity level. The model also provides a basis for optimizing our risk-return profile by providing consistent risk measurement across the Group. The model outputs are reviewed and supplemented with management’s judgment and business experience and expertise. The internal capital model is subject to regular updates and validations.
Risk Diversification
As a global insurer and reinsurer with a wide product offering across different businesses, diversification is a key component of our business model and risk framework. Diversification enhances our ability to manage our risks by limiting the impact of a single event and contributing to relatively stable long-term results and our general risk profile. The degree to which the diversification effect can be realized depends not only on the correlation between risks but also the level of relative concentration of those risks. Therefore, our aim is to maintain a balanced risk profile without any disproportionately large risks. Our internal capital model considers the level of correlation and diversification between individual risks, and we measure concentration risk consistently across our business in terms of pre/post diversified internal risk capital requirements.
Risk Appetite and Limit Framework
Our integrated ERM framework considers material risks that arise both internally and externally, that could impact our business. Material risks that might accumulate and have the potential to produce substantial losses are subject to our group-wide risk appetite and limit framework. Our risk appetite, as authorized by the Board of Directors, represents the amount of risk that we are willing to accept in pursuit of our strategic objectives, within the constraints imposed by our capital resources as well as the expectations of our stakeholders as to the type of risks we hold within our business. At an annual aggregated level, we also monitor and manage the potential financial loss from the accumulation of risk exposure in any one year.
Specific risk limits are defined and translated into a consistent framework across our identified risk categories and across our legal entities and are intended to limit the impact of individual risk types or accumulations of risk. Individual limits are established through an iterative process to ensure that the overall framework complies with our group-wide requirements on capital adequacy and risk accumulation.
We monitor risks against our documented risk appetite and defined limits and report any deviations through our risk reporting framework.
External Perspectives
Various external stakeholders, among them regulators, rating agencies, investors and accounting bodies, place emphasis on the importance of sound risk management in the insurance and reinsurance industry. We monitor developments in the external environment and evolve our ERM framework and risk management practices accordingly.
Risk Governance and Risk Management Organization
The key elements of our governance framework, as it relates specifically to risk management, are described below:
Board of Directors
The Risk Committee of the Board of Directors ("Risk Committee") assists the directors in overseeing the integrity and effectiveness of our ERM framework and ensuring that our risk mitigation activities are consistent with that framework. The Risk Committee reviews, approves and monitors our overall risk strategy, risk appetite, and key risk limits, and receives regular reports from the Group Risk Management function ("Group Risk") to ensure any significant risk issues are being addressed by management. The Risk Committee further reviews, with management and Internal Audit, the Group’s risk policies and satisfies itself that effective systems of risk management and controls are established and maintained.
Among its other responsibilities, the Risk Committee reviews and approves our annual Own Risk and Solvency Assessment ("ORSA") report. The Risk Committee also assesses the independence and objectivity of our Group Risk function, approves its terms of reference, and reviews its ongoing activities. In addition, the Risk Committee conducts a review and provides a recommendation to the Board of Directors regarding the appointment and/or removal of the Chief Risk Officer. The Risk Committee meets with the Chief Risk Officer in separate executive sessions on a regular basis.
The Finance Committee of the Board of Directors oversees the Group’s investment of funds and adequacy of financing facilities. This includes approval of the Group’s strategic asset allocation plan.
The Audit Committee of the Board of Directors, which is supported by Internal Audit, is responsible for overseeing internal controls and compliance procedures, and also reviews with management and the Chair of the Risk Committee the Group’s policies regarding risk assessment and risk management.
Group Executives
The Executive Committee formulates our business objectives and risk strategy within the overall risk appetite set by the Board of Directors. It allocates capital resources and sets limits across the Group, with the objective of balancing return and risk. While the Executive Committee is responsible overall for risk management, it has delegated some authority to the executive level Risk Management Committee ("RMC") consisting of the President and Chief Executive Officer, Chief Financial Officer, Group Chief Underwriting Officer, Chief Risk Officer, Chief Actuary - Reserving and Capital, and Chief Administrative and Legal Officer.
The RMC is responsible for overseeing the integrity and effectiveness of the Group's ERM framework and ensuring that the Group's risk mitigation activities are consistent with that framework, including a review of the annual business plan relative to our risk limits. In addition to the RMC, there is an established framework of separate yet complementary management committees and sub-committees, focusing on particular aspects of ERM including the following:
Management Committees
•The Underwriting Committee oversees the integrity and effectiveness of our Underwriting Governance Framework ensuring our underwriting activities are consistent with that framework.
•The Investment & Finance Committee oversees the Group’s investment activities, which includes monitoring market risks, the performance of our investment managers and the Group’s asset-liability management, liquidity positions and investment policies and guidelines. The Investment & Finance Committee also prepares the Group’s strategic asset allocation ranges and presents it to the Finance Committee of the Board of Directors for approval.
•The Capital Management Committee oversees the integrity and effectiveness of our capital management policy, including the capital management policies of our legal entities and branches, and oversees the availability of capital within the Group.
•The Group Reserving Committee ensures appropriate oversight and validation of the Group reserves for losses and loss expenses ("loss reserves").
•Enterprise Portfolio and Project Management Group ("EPPG") is responsible for governing project investments across the Group. It ensures that our investments align with our business strategies and that projects can be executed effectively and efficiently.
RMC Sub-Committees
•The Exposure Management Committee oversees the Group's exposure management framework for catastrophe and non-catastrophe business, including the validation of modeling, threats framework, accumulation practices and monitoring of management appetites.
•The Reinsurance Security Committee ("RSC") sets out the financial security requirements of our reinsurance counterparties and approves counterparties, as needed.
•The Internal Model Committee oversees the Group's internal model framework, including the key model assumptions, methodology and validation framework.
•The Operational Risk Committee oversees the Group's operational risk framework for identifying, assessing, managing, monitoring, and reporting of operational risk and facilitates the embedding of effective operational risk management practices throughout the Group.
•The Emerging Risks Working Group oversees the processes for identifying, assessing, managing, monitoring, and reporting current and potential emerging risks and opportunities.
•The Environmental Working Group replaced the Climate Change Working Group and focuses specifically on climate-related risks and opportunities and oversees climate risk initiatives.
Group Risk Management
As a general principle, management in each of the lines of business and corporate functions is responsible in the first instance for the risks and returns of its decisions. Management is the 'owner' of risk management processes and is responsible for managing our business within defined risk limits.
The Chief Risk Officer, who reports to the Chief Financial Officer and the Chair of the Risk Committee leads our independent Group Risk function, and is responsible for oversight and implementation of the Group's ERM framework, as well as providing guidance and support for risk management practices. Group Risk is responsible for developing methods and processes for identifying, assessing, managing, monitoring, and reporting risk. This forms the basis for informing the Risk Committee and RMC of the Group’s risk profile. Group Risk develops our ERM framework and oversees the adherence to this framework at the Group and legal entity level. Our Chief Risk Officer regularly reports risk matters to the Chief Financial Officer, Executive Committee, RMC, and the Risk Committee.
Internal Audit, an independent, objective function, reports to the Audit Committee of the Board of Directors on the effectiveness of our ERM framework. This includes assurance that key business risks have been adequately identified and managed appropriately and that our system of internal control is operating effectively. Internal Audit also coordinates risk-based audits, compliance reviews and other specific initiatives to evaluate and address risk within targeted areas of our business.
Our risk governance structure is further complemented by our legal team which seeks to mitigate legal and regulatory compliance risks with support from other teams. This includes ensuring that significant developments in law and regulation are observed and that we react appropriately to impending legislative and regulatory changes and applicable court rulings.
Risk Landscape
Our risk landscape comprises insurance, strategic, market, liquidity, credit, and operational risks that arise as a result of undertaking our business activities. We provide definitions of these risk categories as well as descriptions of management of these risks below. Across these risk categories, we identify and evaluate emerging threats and opportunities through a framework that includes the assessment of potential surprise factors that could affect exposures.
Our risk landscape is reviewed and reported on a regular basis to ensure that it remains up-to-date based on the evolving risk profile of the Company. In addition, we undertake ongoing risk assessments across all enterprise risks, the output of which is captured in our Risk Register that is reviewed and reported through our governance structure.
Insurance Risk
Insurance risk is the inherent uncertainty as to the occurrence, amount and timing of insurance and reinsurance liabilities transferred to us through the underwriting process.
Since our inception in 2001, we have expanded our international presence, with underwriting offices in Bermuda, the U.S., Europe, and Canada. Our disciplined underwriting approach coupled with a peer review process has enabled us to manage this growth in a controlled and consistent manner.
A key component of the Group's underwriting risk governance is our peer review processes, which allow for a collaborative review of risk and pricing, and ensure that underwriting is within established guidelines and procedures. Underwriting guidelines are in place to provide a framework for consistent pricing and risk analysis and to ensure alignment to the Group's risk appetite. Limits are set on underwriting capacity and cascade authority to individuals based on their specific roles and expertise and are established on a tiering basis which is differentiated by the type of loss. Loss scenario and subject exposure have been specified with increasing level of granularity for lower tiers. Tiered appetites have been set for each line of business, with considerations of exposure from each line on the basis of (1) Aggregate (2) Occurrence and (3) Risk and Clash losses. The risk management team monitors both management and board limits to ensure effective management and oversight.
We also have significant audit coverage across our lines of business, including Management Initiated Audits ("MIAs"). MIAs are audits of underwriting and claims files performed by teams independent of those who originated the transactions, the purpose of which is to test the robustness of our underwriting and claims processes and to recognize any early indicators of future trends in our operational risk environment.
Pricing
Premiums for insurance and reinsurance contracts are intended to cover expected claim costs, acquisition costs, operating costs, and an adequate level of profit margin commensurate to the risk being assumed. Premium amounts are typically agreed upfront, whereas the claims costs materialize over an extended period, especially for liability lines. The social, economic, and legal environments may evolve differently over that period compared to the original expectation. Additionally, inherent variability in claim counts and amounts could result in higher overall claim costs than expected in a given year. These factors could lead to a shortfall in premiums charged at the time of underwriting the policy. Premium risk can increase in times of heightened uncertainty in claim cost trends and at times when demand-supply imbalance results in competitive pricing.
We mitigate premium risk in our portfolio through four main levers. First, we take a vigilant and cautious approach on claims cost trends, and we review these assumptions regularly and frequently. Second, in some of our contracts we include loss and/or exposure adjustment features that flex premium and/or acquisition costs in response to higher-than-expected exposures and/or claim costs. Third, we employ underwriting action and reinsurance protection to minimize volatility in our claims experience by managing aggregation of limits and by maintaining balance between portfolio margin and limits deployed. Last, we continually enhance our processes including refining our models to ensure we grow the portfolio at times when pricing is in surplus and we shrink the portfolio at times when pricing is in deficit.
Reinsurance Purchasing
Another key component of our mitigation of insurance risk is the purchase of reinsurance to protect our business on a treaty (covering a portfolio of risks) and facultative (single risk) basis.
For treaty reinsurance, we purchase proportional and non-proportional cover.
Under proportional reinsurance, we cede an agreed percentage of the premiums and the losses and loss expenses on the policies we underwrite. We primarily use proportional reinsurance for our liability, professional lines and accident and health insurance portfolios, as well as on select property insurance portfolios, where we protect against higher loss frequency rather than specific events. We also purchase proportional reinsurance for our accident and health, credit and surety, liability, motor, professional lines, cyber, and marine and aviation reinsurance portfolios, which includes cessions to our strategic capital partners.
We use non-proportional reinsurance, whereby losses up to a certain amount (i.e., our retention) are borne by us. By using non-proportional reinsurance, we can limit our liability with a retention, which reflects our willingness and ability to bear risk, and is therefore in line with our risk appetite. We primarily purchase the following forms of non-proportional reinsurance:
•Excess of loss per risk – our reinsurer(s) indemnify us for loss amounts in excess of our retention, for all individual policies effected, as defined in the treaty terms and conditions. Per-risk treaties are an effective means of risk mitigation against large single losses (e.g., a large fire claim).
•Catastrophe excess of loss – provides annual aggregate or per loss occurrence loss cover for our insurance portfolio against the accumulation of losses incurred from a single event (e.g., windstorm).
We have a centralized Risk Funding team which coordinates external treaty reinsurance purchasing (including retrocession) across the Group and a separate AXIS ILS (Insurance Linked Securities) team, which coordinates the sourcing and structuring of third-party capital to support our underwriting. Risk Funding and AXIS ILS teams are overseen by our Reinsurance Purchasing Group ("RPG"). The RPG, which includes, among others, our President and Chief Executive Officer, Chief Financial Officer, Chief Risk Officer, Group Chief Underwriting Officer and representatives from the business leadership, approves each treaty placement and aims to ensure that appropriate diversification exists within our RSC approved counterparty panels.
Facultative reinsurance provides risk transfer on a case by case basis. In certain circumstances, we use facultative reinsurance to complement treaty reinsurance by covering additional risks over and above what is already covered by treaties. Facultative reinsurance is monitored by the Risk Funding team.
Natural Catastrophes
Natural catastrophes such as hurricanes, windstorms, earthquakes, floods, tornados, hail and fire represent a challenge for risk management due to their accumulation potential and occurrence volatility. In managing natural catastrophe risk, our internal risk limit framework aims to limit the loss of capital due to a single event and the loss of capital which would occur from multiple (but perhaps smaller) events in any year. Within this framework, we have an established risk limit for single event, single zone probable maximum loss ("PML") within defined zones. For example, at the 1-in-100-year return period, we are not willing to expose more than 10% of common equity to a single event within a single zone.
The table below shows our net PML to a single natural peril catastrophe event within certain defined single zones which correspond to peak industry catastrophe exposures at January 1, 2025 and 2024:
| | | | | | | | | | | | | | | | | | | | | | | | | | | | | | | | | | | | | | | | | | | | | | | |
| | | | | | | | | | | | | | | |
| Estimated Net Exposures
(millions of U.S. dollars) | January 1, 2025 | | January 1, 2024 | |
| Territory | | Peril | 50 Year
Return
Period | | 100 Year
Return
Period | | 250 Year
Return
Period | | 50 Year
Return
Period | | 100 Year
Return
Period | | 250 Year
Return
Period | |
| Single zone, single event | | | | | | | | | | | | | | |
| Southeast | | U.S. Hurricane | $ | 141 | | | $ | 160 | | | $ | 228 | | | $ | 114 | | | $ | 131 | | | $ | 149 | | |
| Northeast | | U.S. Hurricane | 12 | | | 34 | | | 73 | | | 9 | | | 26 | | | 59 | | |
| Mid-Atlantic | | U.S. Hurricane | 60 | | | 105 | | | 127 | | | 41 | | | 85 | | | 111 | | |
| Gulf of Mexico | | U.S. Hurricane | 122 | | | 139 | | | 158 | | | 104 | | | 124 | | | 143 | | |
| Europe | | Windstorm | 62 | | | 89 | | | 111 | | | 59 | | | 87 | | | 107 | | |
| Japan | | Windstorm | 5 | | | 6 | | | 13 | | | 10 | | | 12 | | | 21 | | |
| Japan | | Earthquake | 30 | | | 49 | | | 87 | | | 41 | | | 67 | | | 114 | | |
| California | | Earthquake | 133 | | | 162 | | | 194 | | | 115 | | | 137 | | | 163 | | |
| | | | | | | | | | | | | | | |
The return period refers to the frequency with which losses of a given amount or greater are expected to occur. A zone is a geographic area in which the insurance risks are considered to be correlated to a single catastrophic event. Estimated losses from a modeled event are grouped into a single zone, as shown above, based on where the majority of the total estimated industry loss is expected to occur. In managing zonal concentrations, we aim to ensure that the geography of single events is suitably captured, but distinct enough that they track specific types of events. For example, our definition of Southeast wind encompasses five states, including Florida, while our definition of Gulf of Mexico windstorm encompasses four states, including Texas.
Our PMLs take into account the fact that an event may trigger claims in a number of lines of business. For instance, our U.S. hurricane modeling includes the estimated pre-tax impact to our financial results arising from our property lines of business including energy business, and our marine and aviation lines of business. Our PMLs include assumptions regarding the location, size and magnitude of an event, the frequency of events, a property's construction type and susceptibility to damage, and the cost of rebuilding the property. Loss estimates for non-U.S. zones will be subject to foreign currency exchange rates, although we may mitigate this currency variability from a book value perspective.
As indicated in the table above, our modeled single occurrence 1-in-100-year return period PML for a Southeast U.S. hurricane, net of reinsurance, is approximately $160 million. According to our modeling, there is a one percent chance that on an annual basis losses incurred from a Southeast U.S. hurricane event could be in excess of $160 million. Conversely, there is a 99% chance that on an annual basis the loss from a Southeast U.S. hurricane will fall below $160 million.
PMLs are based on results of stochastic models that consider a wide range of possible events, their losses and probabilities. It is important to consider that an actual event does not necessarily resemble one of the stochastic events and the specific characteristics of an actual event can lead to substantial differences between actual and modeled losses.
We have developed our PML estimates by combining judgment and experience with the outputs from the catastrophe model, commercially available from Verisk Analytics, Inc., that we also use for pricing catastrophe risk. This model covers the major peril regions where we face potential exposure. Additionally, we have included our estimate of non-modeled perils and other factors, that we believe provides us with a more complete view of catastrophe risk.
Our PML estimates are based on assumptions that are inherently subject to significant uncertainties and contingencies. These uncertainties and contingencies can affect actual losses and could cause actual losses to differ materially from those expressed above. We aim to reduce the potential for model error in a number of ways, the most important of which is by ensuring that management’s judgment supplements the model outputs. Models are continuously validated at the line of business and at a group level by our exposure management center of excellence. These validation procedures include sensitivity testing of models to understand their key variables and, where possible, back testing the model outputs to actual results.
Estimated net losses from peak zone catastrophes may change from period to period as a result of several factors, that include but are not limited to, updates to vendor catastrophe models, changes to internal view of risk, underwriting portfolios, reinsurance purchasing strategy and foreign currency exchange rates.
Man-Made Catastrophes
Consistent with our management of natural peril catastrophe exposures, we take a similarly focused and analytical approach to the management of man-made catastrophes. Man-made catastrophes, which include such risks as train collisions, airplane crashes or terrorism, and other intentionally destructive acts, including cyber-attacks, are harder to model in terms of assumptions regarding intensity and frequency. For these risks we couple commercially available vendor models with our bespoke modeling and underwriting judgment and expertise. This allows us to take advantage of business opportunities related to man-made catastrophe exposures particularly where we can measure and limit the risk sufficiently as well as obtain risk-adequate pricing.
As an example of our approach, our assessment of terrorism risk is based on a mixture of qualitative and quantitative data (e.g., for estimating property damage, business interruption, mortality and morbidity subsequent to an attack of a predefined magnitude), which we use to limit and manage our aggregate terrorism exposure. We use commercially available vendor modeling and bespoke modeling tools to measure accumulations around potential terrorism accumulation zones on a deterministic and probabilistic basis. We supplement the results of our modeling with underwriting judgment.
Reserving Risk
The estimation of loss reserves is subject to uncertainty as the settlement of claims is dependent on future events and developments. There are many factors that would cause loss reserves to increase or decrease, which include, but are not limited to emerging claims and coverage issues, changes in the legislative, regulatory, social and economic environment and unexpected changes in loss inflation. The estimation of loss reserves could also be adversely affected by the failure of our loss limitation strategy and/or the failure of models used to support key decisions.
We calculate loss reserves in accordance with actuarial best practice based on substantiated methodologies and assumptions. In addition, we have well established processes in place for determining loss reserves, which we ensure are consistently applied. Our loss reserving process demands data quality and reliability and requires a quantitative and qualitative review of overall reserves and individual large claims. Within a structured control framework, claims information is communicated on a regular basis throughout our organization, including to senior management, to provide an increased awareness of losses that have occurred throughout the insurance markets. The detailed and analytical reserving approach that follows is designed to absorb and understand the latest information on reported and unreported claims, to recognize the resultant exposure as quickly as possible, and to record appropriate loss reserves in our consolidated financial statements.
Reserving for longer tail lines of business represents a significant component of reserving risk. When loss trends prove to be higher than those underlying our reserving assumptions, the risk is greater because loss reserves recorded in our consolidated financial statements cover claims arising from several years of underwriting activity and these reserves are likely to be adversely affected by unfavorable loss trends. We manage and mitigate reserving risk on longer tail business in a variety of ways. First, the longer tail business we write is part of a well-balanced and diversified global portfolio of business. Second, we follow a disciplined underwriting process that utilizes available information, including industry trends.
Another significant component of reserving risk relates to the estimation of losses in the aftermath of a major catastrophe event. Refer to Item 7 'Management’s Discussion and Analysis of Financial Condition and Results of Operations – Critical Accounting Estimates – Reserves for Losses and Loss Expenses' for further details. Refer also to Item 8, Note 8 to the Consolidated Financial Statements 'Reserve for Losses and Loss Expenses – Reserving Methodology – Reserving for Catastrophic Events' for further details.
Claims Handling Risk
In accepting risk, we are committing to the payment of claims and therefore these risks must be understood and controlled. We have claims teams dedicated to our main lines of business. Our claim teams include a diverse group of experienced professionals, including claims adjusters and attorneys. We also use approved external service providers, such as independent adjusters and appraisers, surveyors, accountants, investigators, and specialist attorneys, as appropriate.
We maintain claims handling guidelines, which include details on claims reporting controls and claims reporting escalation procedures, for all our claims teams. Large claims matters are reported on a weekly basis in claims summaries that are circulated to our underwriters, senior management and others involved in the reserving process. To maintain communication between underwriting and claims teams, claims personnel regularly report at underwriting meetings and frequently attend client meetings.
We foster a strong culture of review among our claims teams. This includes MIAs whereby senior claims handlers and/or external audit resources audit a sample of claim files. The process is designed to ensure consistency between the claims teams and to develop group-wide best practices.
When we receive notice of a claim, regardless of size, it is recorded in our claims and financial systems. In addition, we produce alerts regarding significant events and potential losses, regardless of whether we have exposure. These alerts allow a direct notification to be communicated to underwriters and senior management worldwide. Similarly, for natural peril catastrophes, we have developed a catastrophe database, along with catastrophe coding in certain systems, that allows for the gathering, analyzing, and reporting of loss information as it develops from early modeled results to fully adjusted and paid losses.
Strategic Risk
Strategic risks affect or are created by an organization’s business strategy and strategic objectives. Our review of strategic risk evaluates not only internal and external challenges that might cause our chosen strategy to fail but also evaluates major risks that could affect our long-term performance and position.
We believe it is imperative that we consider the business risks associated with, and mitigated by, each strategy. We also view strategic risk not only as the negative impact of risk but also the sub-optimization of gain. Fundamentally, we believe that we are set up for success if we analyze both value protection and value creation.
Environmental risk and sustainability have become major topics that encompass a wide range of issues, including climate change and other environmental risks. In line with our strategy, we have put in place several measures to identify, assess, manage, and monitor potential exposure to climate risks, for example physical, transition and liability risks.
At least on a quarterly basis, the Executive Committee meets and receives holistic information about execution against strategy and makes decisions to adjust and/or advance strategy. In addition, strategies employed throughout our business in support of the broader enterprise strategy are reviewed in the context of a broader governance structure by business leadership and are ultimately approved by the Board of Directors.
Market Risk
Market risk is the risk that our financial instruments, which include derivatives, may be negatively impacted by movements in financial market prices or rates, such as interest rates, credit spreads, equity securities' prices and foreign currency exchange rates. Fluctuations in market prices or rates primarily affect our investment portfolio.
Through asset-liability management, we aim to ensure that market risks influence the economic value of our investments and our loss reserves and other liabilities in the same way, thus mitigating the effect of market fluctuations. For example, we reflect important features of our liabilities, such as maturity patterns and foreign currency structures, on the asset side of the balance sheet by acquiring investments with similar characteristics.
We supplement our asset-liability management with various internal policies and limits. As part of our strategic asset allocation process, different strategic asset classes are simulated and stressed to evaluate the 'optimal' frontier, given return objectives and risk constraints. Our investments team manages asset classes to control aggregation of risk and provide a consistent approach to constructing portfolios and the selection process of external asset managers. We have limits on the concentration of investments by single issuers and certain asset classes, and we limit the level of illiquid investments (refer to 'Liquidity Risk' below).
We stress test our investment portfolios using historical and hypothetical scenarios to analyze the impact of unusual market conditions and to ensure potential investment losses remain within our risk appetite. At an annual aggregated level, we manage the total risk exposure of our investment portfolio so that the 'total return' investment loss in any one year is unlikely to exceed a defined percentage of our common equity at a defined return period.
We mitigate foreign currency risk by seeking to match our estimated insurance and reinsurance liabilities payable in foreign currencies with assets, including cash and investments that are denominated in the same foreign currencies. Where necessary, we use derivative financial instruments for economic hedging purposes. For example, in certain circumstances, we use foreign exchange forward contracts to economically hedge portions of our unmatched foreign currency exposures.
Liquidity Risk
Liquidity risk is the risk that we may not have sufficient cash to meet our obligations when they are due or would have to incur excessive costs to do so.
As an insurer and reinsurer, our core business generates liquidity primarily through premiums, investment income and the maturity/sale of investments. Our exposure to liquidity risk stems mainly from the need to pay claims on potential extreme loss events and regulatory constraints that limit the flow of funds within the Group. To manage these risks, we have a range of liquidity policies and procedures in place which are described below:
•We maintain cash and cash equivalents and a high quality, liquid investment portfolio to meet expected outflows, as well as those that could result from a range of potential stress events. We place limits on the maximum percentage of cash and investments that may be in an illiquid form as well as on the minimum percentage of unrestricted cash and liquid investment grade fixed maturity securities.
•We maintain committed borrowing facilities, as well as access to diverse funding sources, to cover contingencies. Funding sources include liquid cash and invested assets, external debt issuances and lines of credit.
Credit Risk
Credit risk represents the risk of incurring financial loss due to the diminished creditworthiness (reduced financial strength and, ultimately, possibly default) of our third-party counterparties.
We distinguish between various forms of credit exposure including the risk of issuer default from instruments in which we invest, such as corporate bonds, counterparty exposure in a direct contractual relationship, such as reinsurance or loss portfolio transfers, the credit risk related to our premium balances receivable, including those from brokers and other intermediaries, and the risk we assume through our insurance contracts, such as our credit and political risk, and credit and surety lines of business.
Credit Risk Aggregation
Refer to Item 8, Note 12 to the Consolidated Financial Statements 'Commitment and Contingencies' – Concentration of Credit Risk – Credit Risk Aggregation
Credit Risk Relating to Cash and Investments
Refer to Item 8, Note 12 to the Consolidated Financial Statements 'Commitment and Contingencies' – Concentration of Credit Risk – Cash and Investments
Credit Risk Relating to Reinsurance Recoverables
Refer to Item 8, Note 12 to the Consolidated Financial Statements 'Commitment and Contingencies' – Concentration of Credit Risk – Reinsurance Recoverable on Unpaid and Paid Losses and Loss Expenses
Credit Risk Relating to Premium Balances Receivable
Refer to Item 8, Note 12 to the Consolidated Financial Statements 'Commitment and Contingencies' – Concentration of Credit Risk – Insurance and Reinsurance Premium Balances Receivable
Credit Risk Relating to our Underwriting Portfolio
We provide credit insurance primarily for lenders (financial institutions) and commodity traders seeking to mitigate the risk of non-payment from their borrowers and trading counterparties. This product complements our traditional political risk insurance business. For the credit insurance contracts, it is necessary for the buyer of the insurance, most often a bank or commodity trader, to hold an insured asset, most often an underlying loan, or sale and purchase contract in order to claim compensation under the insurance contract. The majority of the credit insurance provided is for single-name illiquid risks that can be individually analyzed and underwritten, primarily in the form of senior secured bank loans but also unsecured payment obligations in the case of shorter term trade credit. As part of the underwriting process, an evaluation of creditworthiness and reputation of the obligor is critical. We generally require our clients to retain a share of each transaction that we insure. A key element to our underwriting analysis is the assessment of recovery in the event of default, and, accordingly, the strength of the collateral and the enforceability of rights to the collateral are paramount.
Generally, we do not underwrite insurance for structured finance products that would expose us to mark-to-market losses. In addition, our credit insurance contracts typically do not include terms which would introduce liquidity risk, most notably in the form of a collateralization requirement upon a ratings downgrade.
We also provide protection against sovereign default or sovereign actions that result in impairment of cross-border investments for banks and corporations. Our contracts generally include conditions precedent to our liability relating to the enforceability of the insured transaction and restricting amendments to the transaction documentation, obligations on the insured to prevent and minimize losses, subrogation rights, including rights to have the insured asset transferred to us, and waiting periods. Under most of our policies, a loss payment is made in the event that the debtor failed to pay our client when payment is due subject to a waiting period of up to 180 days.
In addition, we provide surety bonds to large corporate and commercial clients, and to mid to large sized construction clients.
We provide reinsurance of credit, political risk and surety bond insurers exposed to the risks of financial loss arising from non-payment of trade receivables or other credit obligations covered by a policy (credit insurance) or non-performance of obligations (surety). Our credit reinsurance exposures are concentrated within developed economies, our political risk exposures are concentrated in developing economies and our surety bond exposures are concentrated in Latin America and developed economies. Surety reinsurance provides protection for losses arising from a broad array of surety bonds issued by insurers to satisfy regulatory demands, contract and commercial obligations in a variety of jurisdictions around the world. We provide coverage to the mortgage industry through insurance and reinsurance of mortgage insurance companies, U.S. government-sponsored entity credit risk sharing transactions, and other mortgage market participants. We focus on credit risk transfer from Federal Home Loan Mortgage Corporation and Federal National Mortgage Association, in the single-family, fixed rate, conforming mortgage space. We also provide this cover globally in a select number of developed countries. These entities seek to manage their credit risk exposure emanating from defined pools of mortgage loans. Our exposure to credit risk (credit, surety and mortgage) is monitored and managed through robust underwriting within defined parameters for credit quality and concentration, continuous monitoring of the housing and credit markets, as well as limits on our PML resulting from a severe economic downturn.
Operational Risk
Operational risk represents the risk of loss as a result of inadequate processes, system and network failures, human error or external events, including but not limited to direct or indirect financial loss, reputational damage, customer dissatisfaction, and legal and regulatory penalties.
Group Risk is responsible for coordinating and overseeing a group-wide framework for monitoring operational risk management. As part of this oversight, we facilitate the identification, assessment and management of key operational risks through several processes, risk assessments, operational risk events and various stress testing exercises.
We manage transaction type operational risks through the application of process controls throughout our business. The Risk Register is used as a detailed repository of each of the key drivers of risk the company is exposed to, along with the key controls and Key Risk Indicators ("KRIs") that are in place to maintain the level of risk within the defined risk appetite. There is a quarterly certification process, whereby control owners confirm the performance of the controls and identify any issues to be followed up. Risk assessments are undertaken annually to test and verify the accuracy and completeness of the mitigation measures in place.
We also maintain an operational risk event database (containing both actual events as well as near misses) to help us monitor and analyze potential operational risk issues, identify any trends, and, where necessary, put in place improvement actions to avoid occurrence or recurrence of operational events.
We supplement this with thematic deep dive reviews to identify the key drivers of risk and review and challenge the appropriateness of current mitigation strategies and make recommendations for improvement.
We have specific processes and systems in place to focus on high priority operational matters, such as managing business resilience, information security, and third-party vendor risk, which are described below:
•Major failures and disasters that could cause a severe disruption to working environments, facilities, and personnel, represent a significant operational risk to our business. Our Business Continuity Management framework strives to protect critical business services and the functions that support these business services from these effects to enable us to carry out our core tasks on time and at the quality required.
•We have developed a number of Information Technology ("IT") platforms, applications and security controls to support our business activities worldwide. Dedicated security standards are in place for our IT systems to ensure the proper use, availability and protection of our information assets.
•We have enhanced our governance processes for the prioritization of projects, to ensure greater transparency of the decision-making process, the alignment of teams working on the same projects, consistency of approach and alignment to strategy.
•Our use of third-party vendors exposes us to a number of increased operational risks, including the risk of security breaches, fraud, non-compliance with laws and regulations or internal guidelines and inadequate service. We manage material third-party vendor risk, by, among other things, performing a thorough risk assessment on potential large vendors, reviewing a vendor’s financial stability, ability to provide ongoing service and business resilience planning.
Capital Management
Our capital management strategy is to maximize long-term shareholder value by, among other things, optimizing capital allocation and minimizing our cost of capital. We manage our capital in accordance with our Capital Management Policy. We hold an adequate level of capital for business and investment opportunities as well as risk and shock events. We ensure our capital levels satisfy our minimum solvency targets including our own view of risk from our internal capital model and regulatory and rating agency capital requirements, which are described below:
•Internal risk capital - We use our internal capital model to assess the capital consumption of our business, measuring and monitoring the potential aggregation of risk at extreme return periods.
•Regulatory capital requirements - In each country in which we operate, the local regulator specifies the minimum amount and type of capital that each of the regulated entities must hold in support of their liabilities and business plans. We target to hold, in addition to the minimum capital required to comply with the solvency requirements, an adequate buffer to ensure that each of our regulated entities meets its local capital requirements. Refer to Item 8, Note 22 to the Consolidated Financial Statements 'Statutory Financial Information' for further details.
•Rating agency capital requirements - Rating agencies apply their own models to evaluate the relationship between the required risk capital of a company and its available capital resources. The assessment of capital adequacy is usually an integral part of the rating agency process. Meeting rating agency capital requirements and maintaining strong credit ratings are strategic business objectives of the Company. Refer to Item 7 'Management’s Discussion and Analysis of Financial Condition and Results of Operations – Liquidity and Capital Resources' for further details.
Our capital management strategy identifies the point at which management needs to consider raising capital, amending our business plan or executing capital management activities well before capital approaches the minimum requirements ("early warning indicator"). This allows us to take appropriate measures to ensure the continued strength and appropriateness of our capital and solvency positions, and enables us to take advantage of opportunities as they arise. Such measures are performed as and when required and include traditional capital management tools (e.g., dividends, share buy-backs, issuance of shares or debt) or through changes to our risk exposure (e.g., recalibration of our investment portfolio or changes to our reinsurance purchasing strategy).
We also consider an amount of capital beyond which capital could be considered "excess". Where we do not find sufficiently attractive opportunities and returns for our excess capital, we may return capital to our shareholders through share repurchases and/or dividends. In doing so, we seek to maintain an appropriate balance between higher returns for our shareholders and the security provided by a sound capital position.
Insurance Risk
Insurance risk is the inherent uncertainty as to the occurrence, amount and timing of insurance and reinsurance liabilities transferred to us through the underwriting process.
The insurance and reinsurance business is historically cyclical, and we expect to experience periods with excess underwriting capacity and unfavorable premium rates.
The insurance and reinsurance business historically has been a cyclical industry characterized by periods of intense price competition due to excess underwriting capacity, as well as periods when shortages of capacity permit favorable premium levels. An increase in premium rates is often followed by an increased supply of insurance and reinsurance capacity, via capital driven by new entrants, new capital market instruments and structures and/or the commitment of additional capital by existing insurers and reinsurers. Any of these factors could lead to a significant reduction in premium rates, less favorable policy terms, increased expenses for customer acquisition and retention, and fewer submissions for our underwriting services. In addition to these considerations, changes in the frequency and severity of losses suffered by insureds and insurers may affect the cycles of the insurance and reinsurance business significantly, which in turn could affect our business, results of operations or financial condition.
Our results of operations, financial condition or liquidity could be adversely affected by the occurrence of natural and man-made disasters, as well as outbreaks of pandemic or contagious diseases.
We have exposure to unexpected losses resulting from natural disasters, man-made catastrophes and other catastrophe events predominantly in our insurance business. Catastrophes can be caused by various events, including hurricanes, typhoons, earthquakes, tsunamis, hailstorms, floods, severe winter weather, fires, drought and other natural disasters and outbreaks of pandemic or contagious diseases. Catastrophes can also be man-made, such as terrorist attacks and other intentionally destructive acts, including those involving nuclear, biological, chemical or radiological events, cyberattacks and other data security incidents, explosions and infrastructure failures. The incidence and severity of catastrophes are inherently unpredictable and losses from catastrophes could be substantial.
Increases in the values and concentrations of insured property, particularly in coastal regions, and increases in the cost of construction materials required to rebuild affected properties, may continue to increase the impact of natural catastrophe events. Changes in global climate conditions may further increase the frequency and severity of natural catastrophe activity and losses. Secondary perils, for example severe convective storms, may also become increasingly impactful. Similarly, changes in global political and economic conditions may increase both the frequency and severity of man-made catastrophe events. Our business also has exposure to global or nationally occurring pandemics caused by highly infectious and potentially fatal diseases. The impact of catastrophe events in years 2024, 2023 and 2022 included the recognition of the net losses and loss expenses of:
•$226 million, in the aggregate, primarily related to Hurricanes Milton, Helene, and Beryl, and the Red Sea Conflict in 2024;
•$138 million, in the aggregate, primarily related to Cyclone Gabrielle and other weather-related events in 2023; and
•$403 million, in the aggregate, primarily related to Hurricane Ian, the Russia-Ukraine war, Winter Storm Elliot, June European Convective Storms, and the COVID-19 pandemic in 2022.
These events materially reduced net income in the years noted. Although we manage our exposure to such events through the use of underwriting controls and the purchase of third-party reinsurance protection, catastrophe events are inherently unpredictable and the actual nature of such events when they occur could be more frequent or severe than contemplated in our pricing and risk management expectations. As a result, the occurrence of one or more catastrophe events could have a material adverse effect on our results of operations, financial condition or liquidity.
Risks from cybersecurity threats and other data security incidents are dynamic and fast evolving, and could be exacerbated by geopolitical tensions, including hostile actions taken by nation-states and terrorist organizations. There is a risk that increases in the frequency and severity of cybersecurity incidents affecting us, our clients, or our third-party service providers could materially adversely affect our results of operations, financial condition or liquidity. The losses incurred from these risks are also dependent on our clients’ and our third-party service providers' cybersecurity practices and defenses, as well as how policy terms and conditions interact with the evolving threat landscape. In addition, our exposure to cybersecurity incidents potentially includes exposure through "non-affirmative" coverages, meaning risks and potential losses associated with policies where cybersecurity risk is not explicitly included or excluded in the policy terms and conditions. As this is a relatively new risk, even in cases where losses from cybersecurity incidents are explicitly excluded, there can be no assurance that a court or arbitration panel will interpret policy language in line with the intention of the exclusion.
We could face losses from war, terrorism, political unrest, and geopolitical uncertainty, and these or other unanticipated losses could have an adverse effect on our results of operations, financial condition or liquidity.
We have exposure to losses, both through underwriting and investments, resulting from acts of terrorism, political unrest and geopolitical instability, including, but not limited to, events related to Russia’s invasion of Ukraine, the conflict in the Middle East and in many regions of the world. Russia’s invasion of Ukraine is having a profound impact on energy markets, particularly in Europe, which is impacting and may continue to impact economic conditions and investment returns. In certain instances, we specifically insure and reinsure risks resulting from acts of terrorism. Even in cases where we attempt to exclude losses from terrorism and certain other similar risks from some coverages written by us, there can be no assurance that a court or arbitration panel will interpret policy language or otherwise issue a ruling favorable to us. Accordingly, we can offer no assurance that our loss reserves will be adequate to cover losses should they materialize beyond expectation.
We have limited terrorism coverage in our own reinsurance program for our exposure to catastrophe losses related to acts of terrorism. On December 20, 2019, the President of the United States signed the Terrorism Risk Insurance Program Reauthorization Act of 2019 ("TRIP"), extending the program through December 31, 2027. Although TRIP provides benefits in the event of certain acts of terrorism, those benefits are subject to a deductible and to other limitations. Under TRIP, once losses attributable to certain acts of terrorism exceed 20% of direct commercial property and liability insurance premiums for the preceding calendar year, the federal government will reimburse insurers for 80% of losses in excess of this deductible.
Notably, TRIP does not provide coverage for reinsurance losses. Given the unpredictable frequency and severity of terrorism losses, as well as the limited terrorism coverage in our own reinsurance program, future losses from acts of terrorism could materially and adversely affect our results of operations, financial condition or liquidity in future periods.
Our credit and political risk insurance line of business protects insureds with interests in foreign jurisdictions in the event that governmental action prevents them from exercising their contractual rights, and may also protect their assets against physical damage perils. The insurance provided may include cover for losses arising from expropriation, forced abandonment, license cancellation, trade embargo, contract frustration, non-payment, war on land or political violence (including terrorism, revolution, insurrection and civil unrest).
Our credit and political risk line of business also provides non-payment coverage on specific loan obligations. We insure sovereign non-payment and corporate non-payment as a result of commercial as well as political risk events. The vast majority of the corporate non-payment credit insurance provided is for single-named illiquid risks, primarily in the form of senior bank loans that can be individually analyzed and underwritten. Generally, we do not underwrite insurance for structured finance products that would expose us to mark-to-market losses. In addition, our credit insurance contracts typically do not include terms which would introduce liquidity risk, most notably in the form of a collateralization requirement upon a ratings downgrade. We also manage our exposure by, among other things, setting credit limits by country, region, industry and individual counterparty, and regularly reviewing our aggregate exposures. However, due to globalization, political instability in one region can spread to other regions. Geopolitical uncertainty regarding a variety of domestic and international matters, such as the U.S. political and regulatory environment and the potential for default by U.S., Canadian or by one or more European sovereign debt issuers, could have a material adverse effect on our results of operations, investment portfolio, financial condition or liquidity.
We may be adversely impacted by economic and social inflation.
Our operations, like those of other insurers and reinsurers, are susceptible to the effects of economic and social inflation because premiums are established before actual losses and loss expenses are known. Although we consider the potential effects of economic and social inflation when setting premium rates, premiums may not fully offset the effects of inflation and thus may not adequately underwrite the risks we insure and reinsure. Loss reserves include assumptions about future payments for settlement of claims and claims-handling expenses. To the extent economic and social inflation causes costs to increase above loss reserves established for claims, we will be required to increase loss reserves with a corresponding reduction in net income in the period in which the deficiency is identified, which may have a material adverse effect on our results of operations or financial condition. Unanticipated higher economic inflation could also lead to higher interest rates, which would negatively impact the value of our fixed income securities and potentially other investments. In addition, to the extent that unanticipated higher economic inflation in different geographies leads to currency fluctuations, we may also experience increased volatility on foreign exchange gains and losses.
Global climate change, and increasing regulation relating to climate change, may have an adverse effect on our results of operations, financial condition or liquidity.
We are potentially exposed to different aspects of climate risk, specifically, physical, credit, investment, liability and transition risks, as a result of climate change.
Physical risks include weather-related events and longer-term shifts in climate patterns and emanate primarily from the underwriting of property insurance and reinsurance. Climate change has added to the unpredictability and frequency of natural disasters in certain parts of the world and has created additional uncertainty as to future trends and exposures. Although the loss experience of catastrophe insurers and reinsurers has historically been characterized as low frequency, in recent years, the frequency of severe weather-related events has increased, and this trend may continue in the future. Climate change is likely to expose us to an increased frequency and/or severity of weather-related losses, and there is a risk that our pricing of these perils or our management of the associated aggregations does not appropriately allow for changes in climate.
Over the longer term, climate change may have an impact on the economic viability of certain lines of business if suitable adjustments in price and coverage cannot be achieved.
Additionally, catastrophic events and the effects of climate change could result in increased credit exposure to reinsurers and other counterparties with whom we transact business, declines in the value of investments we hold and disruptions to our physical infrastructure, systems, networks and operations.
Changes in security asset prices such as real estate, stocks and long-term bonds may impact the value of our investments, resulting in realized or unrealized losses on our invested assets. Climate-related risks to security asset prices can include, but are not limited to: (i) changes in supply/demand characteristics for fossil fuels (e.g., coal, oil, natural gas); (ii) advances in low-carbon technology and renewable energy development; (iii) effects of extreme weather events on the physical and operational exposure of issuers; and the (iv) transition that these companies make towards addressing climate risk in their own businesses.
We may also be exposed to liability risks. Liability risks relate to losses or damages suffered by our insureds from physical or transition risks, such as losses stemming from climate-related litigation in liability lines. These risks could arise from management and boards of directors not fully considering or responding to the impacts of climate change, or not appropriately disclosing current and future risks. In addition, new regulatory developments, increased litigation activity and subsequent liability issues associated with climate change or greenhouse gas emissions may lead to losses under environmental liability, product liability and directors and officers or professional liability, particularly where the emitter is deemed to have misled investors. In addition, there is a link between liability risk and transition risk as the failure of companies to shift towards a low-carbon future and mitigate the impacts of climate change may lead to losses incurred by insureds.
There is additionally a risk that certain elements of our business cease to be viable as a result of climate change transition risks, which relate to losses driven by policy, legal, technological, and market changes to address climate risks and include changes in consumer behavior, shareholder preferences, and any additional regulatory and legislative requirements, such as carbon taxes. Through its fossil fuel policy, AXIS Capital has committed to fully phasing out thermal coal from its insurance and facultative reinsurance portfolios no later than 2030 in OECD countries and 2040 globally. Additionally, by the end of 2025, AXIS Capital has committed to phasing out any existing investments in companies in the thermal coal or oil sands industries that exceed its policy thresholds in its fossil fuel policy. If we are unable to achieve our objectives relating to
climate change or our current response to climate change is perceived to be ineffective or insufficient, or the way we respond is perceived negatively, our business and reputation may suffer. In addition, there remains a risk that our financial condition or operating performance may be impacted by changes in our business model arising from climate change transition and by the performance of strategies we put in place to manage this transition.
We are also subject to complex and changing laws, regulations and public policy debates relating to climate change and other environmental risks, including overlapping, yet distinct, climate change-related disclosure requirements in multiple jurisdictions. These are difficult to predict and quantify, may conflict with one another, and may impose additional costs on us, which in turn could have an adverse impact on our business. The introduction of the Corporate Sustainability Reporting Directive ("CSRD") together with the EU Taxonomy Regulation, are the central components of the sustainability reporting requirements underpinning the EU’s sustainable finance strategy. CSRD requires disclosures against the European Sustainability Reporting Standards ("ESRS") and EU Taxonomy. We are required to collect a substantial amount of data across the organization to enable our reporting against CSRD requirements and this is likely to incur additional costs.
While the Securities and Exchange Commission (SEC) Climate Regulations (issued March 6th 2024) have been paused, there is potential for additional disclosure requirements should these be implemented. There is also a risk that, should the SEC move forward with its additional climate disclosure requirements, that regulators in certain states may develop their own enhanced reporting requirements. Changes in regulations relating to climate change or our own leadership decisions implemented as a result of assessing the impact of climate change on our business may result in an increase in the cost of doing business or a decrease in premiums.
The effects of emerging claim and/or coverage issues on our business are uncertain.
As industry practices and legal, judicial, social, political, technological and other environmental conditions change, unexpected issues related to systemic risks, claims and coverage may emerge. These issues may adversely affect our business by either extending coverage beyond our underwriting intent or by increasing the frequency and/or severity of claims. For example, the 2008 global financial crisis resulted in a higher level of claim activity on professional lines insurance and reinsurance business. Moreover, legislative, regulatory, judicial or social influences may impose new obligations on insurers or reinsurers that extend coverage beyond the intended contractual obligations, or result in an increase in the frequency or severity of claims beyond expected levels, for example as described in the climate change risk factor. In some instances, the effects of these changes may not become apparent until after we have issued the impacted insurance or reinsurance contracts. In addition, actual losses may vary materially from the current estimate of losses based on a number of factors (refer to 'If actual claims exceed our loss reserves, our financial results could be adversely affected' below). As a result, the full extent of liability under an insurance or reinsurance contract may not be known for many years after the contract is issued and a loss occurs.
If actual claims exceed loss reserves, our financial results could be adversely affected.
While we believe that loss reserves at December 31, 2024 are adequate, new information, events or circumstances, may lead to future developments in ultimate losses being significantly greater or less than the loss reserves currently provided. The actual final cost of settling claims outstanding at December 31, 2024, as well as claims expected to arise from the unexpired period of risk, is uncertain. There are many factors that would cause loss reserves to increase or decrease, which include, but are not limited to, changes in claim severity, changes in the expected level of reported claims, judicial action changing the scope and/or liability of coverage, changes in the legislative, regulatory, social and economic environment and unexpected changes in loss inflation.
When establishing our single point best estimate of loss reserves at December 31, 2024, management considered actuarial estimates and applied informed judgment regarding qualitative factors that may not be fully captured in actuarial estimates. Such factors included, but were not limited to, an examination of trend assumptions, the timing of the emergence of claims, volume and complexity of claims, current social and judicial trends, potential severity of individual claims and the extent of internal historical loss data versus new industry information.
Changes to previous estimates of prior year loss reserves can adversely impact the reported calendar year underwriting results if loss reserves prove to be insufficient, or can favorably impact reported results if loss reserves prove to be higher than actual claim payments. If net income is insufficient to absorb a required increase in loss reserves, we would incur a net loss and could incur a reduction in capital.
The failure of our loss limitation strategy could have a material adverse effect on our results of operations, financial condition or liquidity.
We seek to mitigate loss exposure through multiple methods. For example, we write a number of reinsurance contracts on an excess of loss basis. Excess of loss reinsurance indemnifies the reinsured for losses in excess of a specified amount. We generally limit the line size for each client and line of business on our insurance business and purchase reinsurance for many of our lines of business. In the case of proportional reinsurance treaties, we seek per occurrence limitations or losses and loss expenses ratio caps to limit the impact of losses from any one event. In proportional reinsurance, the reinsurer shares a proportional part of the premiums and losses of the reinsured. On an account by account basis, we may also put in place facultative reinsurance to limit specific exposures. We also seek to limit our loss exposure through geographic diversification. Geographic zone limitations involve significant underwriting judgments, including the determination of the area of the zones and the inclusion of a particular policy within a particular zone’s limits. In addition, various provisions of our insurance policies and reinsurance contracts, such as limitations or exclusions from coverage or choice of forum negotiated to limit our risks, may not be enforceable in the manner we intend. We cannot be sure that these loss limitation methods will effectively prevent a material loss exposure, which could have a material adverse effect on our results of operations, financial condition or liquidity.
If we choose to purchase reinsurance, we may be unable to do so on favorable terms or at all.
We purchase reinsurance for our insurance and reinsurance operations in order to mitigate the volatility of losses on our financial results. From time to time, market conditions have limited, and in some cases have prevented, insurers and reinsurers from obtaining the types and amounts of reinsurance that they consider adequate for their business needs. There is no guarantee that our desired amounts of reinsurance or retrocessional reinsurance will be available in the marketplace in the future. In the current environment, our ability to renew our current reinsurance or retrocessional reinsurance arrangements or obtain desired amounts of new or replacement coverage on favorable terms may be substantially reduced as a result of the impact of inflation, industry catastrophic losses to reinsurer capital and the appetite for certain lines of business. In addition to capacity risk, the remaining capacity may not be on terms we deem appropriate or acceptable or with companies with whom we want to do business. If we are unable to renew our current reinsurance or retrocessional reinsurance or purchase new or replacement coverage on favorable terms or at all, the amount of business we are willing to write may be limited or our protection from losses due to large loss events may be materially reduced.
We utilize models to assist our decision making in key areas such as underwriting, reserving, investment management, capital assessment, risk management, reinsurance purchasing and the evaluation of our catastrophe risk, and we could be adversely impacted if these models are inadequate or unfit for the purpose for which they are being used.
We employ various modeling techniques (for example, scenarios, predictive, stochastic and/or forecasting) to analyze and estimate exposures and risks associated with our assets and liabilities. We utilize modeled outputs and related analyses to assist us in decision-making, for example, related to underwriting and pricing, reserving, investment, capital assessment, risk management, reinsurance purchasing and the evaluation of our catastrophe risk through estimates of probable maximum losses, or "PMLs". The modeled outputs and related analyses, both from proprietary and third-party models, are subject to various assumptions, professional judgment, uncertainties and the inherent limitations of any statistical analysis, including the use and quality of historical internal and industry data. These models may turn out to be inadequate representations of the underlying subject matter, including as a result of inaccurate inputs or application thereof (whether due to data error, human error or otherwise). Further, to the extent we incorporate automation and machine learning as part of our modeling process, this may lead to heightened risk. Consequently, actual losses from loss events, whether from individual components (for example, wind, flood, earthquake, etc.) or in the aggregate, may differ materially from modeled results. If, based upon these models or other factors, we misprice our products or underestimate the frequency and/or severity of loss events, our results of operations, financial condition or liquidity may be adversely affected. In addition, PMLs are based on results of stochastic models that consider a wide range of possible events, their losses and probabilities. It is important to consider that stochastic events are not an exact representation of actual events. Thus, an actual event does not necessarily resemble one of the stochastic events, and the specific characteristics of the actual event can lead to substantial differences between actual and modelled losses.
With respect to the evaluation of our catastrophe risk, our modeling utilizes a mix of historical data, scientific theory and mathematical methods. Output from multiple commercially available vendor models serves as a key input in our PML estimation process. We believe that there is considerable inherent uncertainty in the data and parameter inputs for these vendor models. In that regard, there is no universal standard in the preparation of insured data for use in the models and the running of modeling software. In our view, the accuracy of the models depends heavily on the availability of detailed insured loss data from actual recent large catastrophes. Due to the limited number of events, there is significant potential for substantial differences between the modeled loss estimate and actual company experience for a single large catastrophe event. This potential difference could be even greater for perils with limited or no modeled annual frequency. We perform our own vendor model validation (including sensitivity analysis and backtesting, where possible) and supplement model output with historical loss information and analysis and management judgment. In addition, we derive our own estimates for non-modeled perils. Despite this, our PML estimates are subject to a high degree of uncertainty, and actual losses from catastrophe events may differ materially.
We could be materially adversely affected if managing general agents, general agents, coverholders, other producers and third-party administrators in our program business exceed their underwriting and/or claims settlement authorities or otherwise breach obligations owed to us.
In program business conducted by the insurance segment, following our underwriting, financial, claims and information technology due diligence reviews, we authorize managing general agents, general agents, coverholders and other producers to write business and settle claims on our behalf within prescribed authorities. Once a program/coverholder commences, we must rely on the underwriting, operational and claims controls of these entities to write business within the authorities provided by us. Although we monitor our programs/coverholders on an ongoing basis, our monitoring efforts may not be adequate or these entities may exceed their underwriting or claims settlement authorities or otherwise breach obligations owed to us. To the extent that these entities exceed their authorities or otherwise breach obligations owed to us in the future, our results of operations or financial condition could be materially adversely affected.
Strategic Risk
Strategic risks affect or are created by an organization’s business strategy and strategic objectives. Our review of strategic risk evaluates not only internal and external challenges that might cause our chosen strategy to fail but also evaluates major risks that could affect our long-term performance and position.
Competition and consolidation in the insurance/reinsurance industry could reduce our growth and profitability.
The insurance/reinsurance industry is highly competitive. We compete on an international and regional basis with major U.S., Bermuda, European and other international insurers and reinsurers, including Lloyd's syndicates, some of which have greater financial, marketing and management resources. We also compete with new companies that enter the insurance/reinsurance markets. In addition, capital market participants have created alternative products that are intended to compete with insurance and reinsurance products. New and alternative capital inflows in the insurance/reinsurance industry and the retention by insured and cedants of more business may cause an excess supply of insurance and reinsurance capital. There has been a large amount of merger and acquisition activity in the insurance/reinsurance sector in recent years, which may continue. We may experience increased competition as a result of that consolidation with consolidated entities having enhanced market power. Increased competition could result in fewer submissions, lower premium rates, less favorable policy terms and conditions and greater costs of customer acquisition and retention. If industry pricing does not meet our hurdle rate, we may reduce our future underwriting activities. These factors could have a material adverse effect on our growth and profitability.
The insurance industry is undergoing extensive technological change. There is increasing focus by traditional insurance industry participants, technology companies, including new insurance technology companies ("InsurTech") and others, on using technology and innovation (including artificial intelligence, digital platforms, data analytics, and robotics) to disrupt and/or enhance current business models and operations. This includes market-wide enabling technology initiatives (e.g., Blueprint 2 in the London Market). If we do not adapt to these technological changes, it could harm our ability to compete, which could have a material adverse impact on our growth or profitability.
Furthermore, enhanced competition could drive innovation, technological change and changing customer preferences in the markets in which we operate, and these changes could pose other risks to our businesses. For example, they could result in increasing expenses as we make investments to innovate our products and services.
Global economic conditions could adversely affect our business, results of operations or financial condition.
The global economic environment continues to be impacted by inflationary pressures; fiscal or monetary policies; uncertainty concerning the future path of interest rates; the effect of social, economic, and political conditions and geopolitical events, including as a result of changes in U.S. presidential administrations or Congress; the implementation of tariffs and other protectionist trade policies; and the possibility of a recession, government shutdowns, debt ceilings, and funding. During 2022 and the first half of 2023, inflation reached and stayed unusually high in many parts of the world, and central banks in the U.S. and other countries raised interest rates to counter inflation by slowing economic activity. Uncertainty and market turmoil has affected and may in the future affect, among other aspects of our business, the demand for and claims made under our products, the ability of customers, counterparties and others to establish or maintain their relationships with us, our ability to access and efficiently use internal and external capital resources and our investment performance and portfolio. We also provide coverage to the mortgage industry through insurance and reinsurance of mortgage insurance companies and U.S. government sponsored entity credit risk sharing transactions, and deteriorating economic conditions could cause mortgage insurance losses to increase and adversely affect our results of operations or financial condition.
In addition, steps taken by central banks to control inflation and/or governments to stabilize financial markets and improve economic conditions may be ineffective, and actual or anticipated efforts to continue to unwind some of such steps could disrupt financial markets and/or could adversely impact the value of our investment portfolio. Further increases in interest rates would decrease unrealized gains and/or increase unrealized losses on our debt securities portfolio, partially offset by our ability to earn higher rates of return on reinvested funds. Higher inflation could lead to even higher interest rates, which would continue to negatively impact the value of our existing fixed income or other investments.
Given the ongoing global economic uncertainties, evolving market conditions may continue to affect our results of operations, financial condition, and capital resources. In the event that there is additional deterioration or volatility in financial markets or general economic conditions, our results of operations, financial condition, capital resources, and competitive landscape could be materially and adversely affected.
In connection with the implementation of our corporate strategies, we face risks associated with the acquisition or disposition of businesses, the entry into new lines of business, the integration of acquired businesses and the growth and development of these businesses.
As part of our strategy, we have pursued and may continue to pursue growth through acquisitions, or we may dispose of or exit businesses we currently own. The success of this strategy is dependent upon our ability to identify appropriate acquisition and disposition targets, negotiate transactions on favorable terms, complete transactions and, in the case of acquisitions, successfully integrate them into our existing businesses. If a proposed transaction is not consummated, the time and resources spent in researching it could adversely result in missed opportunities to locate and acquire other businesses. In addition, the negotiation of potential acquisitions as well as the integration of an acquired business or new personnel could result in a substantial diversion of management resources. Successful integration may depend on, among other things, our ability to effectively integrate acquired businesses or new personnel into our existing risk management and financial and operational reporting systems, our ability to effectively manage any regulatory issues created by our entry into new markets and geographic locations, our ability to retain key personnel and other operational and economic factors. There can be no assurance that the integration of acquired businesses or new personnel will be successful, or that we will realize anticipated synergies, cost savings and operational efficiencies, or that the business acquired will prove to be profitable or sustainable. Acquisitions could involve numerous additional risks such as potential losses from unanticipated litigation, levels of claims and an inability to generate sufficient revenue to offset acquisition costs. Failure to manage these risks could materially and adversely affect our business, financial condition and results of operations. If we dispose of or otherwise exit certain businesses, there can be no assurance that we will not incur certain disposition related charges, or that we will be able to reduce overhead related to the divested assets.
From time to time, either through acquisitions or internal development, we may enter new lines of business or offer new products and services within existing lines of business. These new lines of business or new products and services may present additional risks, particularly in instances where the markets are not fully developed. Such risks include the investment of significant time and resources; the possibility that these efforts will not be successful, or that we are unable to retain clients; and the risk of additional liabilities associated with these efforts. Failure to manage these risks in the development of new lines of businesses could materially and adversely affect our business, financial condition and results of operations.
New regulations relating to the U.K.'s withdrawal from the EU could adversely affect us.
In January 2020, the U.K. ceased to be a member of the EU ("Brexit"). AXIS Specialty Europe SE accesses the U.K. market through a third country branch in the U.K. In February 2023, the European Insurance and Occupational Pensions Authority ("EIOPA") published a Supervisory Statement on governance of third country branches. Although this Supervisory Statement is directed towards national supervisory authorities, it does set out how EIOPA expects third country branches to be supervised across the EU. In Ireland, the Central Bank of Ireland ("CBI") has published its response to this Supervisory Statement and made its expectations of the insurers clear. In line with this Supervisory Statement, AXIS Specialty Europe SE is required to demonstrate, at all times, an appropriate level of corporate substance in Ireland proportionate to the nature, scale and complexity of its business.
Lloyd’s accesses the EU market through its Belgium based insurance company, Lloyd’s Insurance Company S.A., which has a third country branch in the U.K. In Belgium, the National Bank of Belgium has not yet made any public announcement regarding the EIOPA Supervisory Statement. As Lloyd's is a key platform for AXIS, a change to the status quo by the National Bank of Belgium could impact Lloyd’s Insurance Company S.A., and consequently AXIS Managing Agency. This would potentially limit AXIS' ability to access the EEA market through the Lloyd's platform. We continue to monitor this situation closely.
Since we depend on a few brokers for a large portion of our revenues, loss of business provided by any one of them could have a material adverse effect on our business.
We market our insurance and reinsurance products worldwide primarily through insurance and reinsurance brokers and derive a significant portion of our business from a limited number of brokers. Aon plc, Marsh & McLennan Companies, Inc. and Arthur J. Gallagher & Co., provided 38% of gross premiums written in 2024. Our relationships with our brokers are based on the quality of our underwriting and claims services, as well as our financial strength ratings. Any deterioration in these factors could result in the brokers advising our clients to place their business with other insurers and reinsurers. In addition, our brokers also have, or may in the future acquire, ownership interests in insurance and reinsurance companies that may compete with us. These brokers may then favor their own insurers and reinsurers over other companies. Loss of all or a substantial portion of the business provided by one or more of these brokers could have a material adverse effect on our business.
A downgrade in our financial strength or credit ratings by one or more rating agencies could adversely affect our business, results of operations, financial condition or liquidity.
Financial strength, claims paying and credit ratings are important factors in establishing the competitive position of insurance companies and maintaining customer confidence in us and in our ability to market insurance products. Independent rating agencies analyze the financial performance and condition of insurers on an ongoing basis.
We have experienced, and there can be no assurance that we will not experience in the future, a ratings downgrade or other negative action from one of the independent rating agencies. This could arise from a change in our financial performance, our financial condition or a change in ratings methodology. Ratings agencies may also heighten the level of scrutiny they apply when analyzing companies in our industry, adjust upward the capital and other requirements employed in their models and/or discontinue credit and debt instruments or other structures deployed for maintenance of certain rating levels. A downgrade, withdrawal or negative watch/outlook by any independent rating agency could cause our competitive position in the insurance/reinsurance industry to suffer and make it more difficult for us to market our products. In addition, if we experience a credit rating downgrade, withdrawal or negative watch/outlook in the future, we could incur higher borrowing costs and may have more limited means to access capital. A downgrade, withdrawal or negative watch/outlook could also result in a substantial loss of business for us, as ceding companies and brokers that place such business may move to other insurers and reinsurers with higher ratings. We would also be required to post collateral under the terms of certain of our policies of reinsurance.
We may require additional capital in the future, which may not be available or may only be available on unfavorable terms.
Our future capital requirements depend on many factors, including rating agency and regulatory requirements, the performance of our investment portfolio, our ability to write new business successfully, the frequency and severity of catastrophe events and our ability to establish premium rates and loss reserves at levels sufficient to cover losses. We may need to raise additional funds through financings. If we are unable to do so, it may curtail our ability to conduct our business.
Any equity or debt financing, if available at all, may be on terms that are not favorable to us. As economic and market uncertainty continues, it is possible that access to the capital markets may become more constrained and cost of capital may increase. Equity financings could be dilutive to our existing shareholders and could result in the issuance of securities that have rights, preferences and privileges that are senior to those of our other securities. If we cannot obtain adequate capital on favorable terms or at all, our business, operating results and financial condition could be adversely affected.
Our inability to obtain the necessary credit could adversely affect our ability to offer reinsurance in certain markets.
Neither AXIS Specialty Bermuda nor AXIS Re SE is licensed or admitted as an insurer or reinsurer in any jurisdiction other than Bermuda, Ireland, Singapore and Brazil. Because the U.S. and certain other jurisdictions do not permit insurance companies to take credit on their statutory financial statements for reinsurance obtained from unlicensed or non-admitted insurers unless appropriate security mechanisms are in place, our reinsurance clients in these jurisdictions typically require AXIS Specialty Bermuda and AXIS Re SE to provide letters of credit or other collateral, unless such reinsures have obtained reciprocal jurisdiction reinsurer status in the reinsured's domiciliary state. Our credit facilities are used to post letters of credit. However, if our credit facilities are not sufficient or if we are unable to renew our credit facilities or arrange for other types of security on commercially affordable terms, AXIS Specialty Bermuda and AXIS Re SE could be limited in their ability to write business for some of our clients.
We could be adversely affected by turnover of senior management, the loss of one or more key executives, an inability to attract and retain qualified personnel or by the inability of an executive to obtain a Bermuda work permit.
Our success depends on our ability to retain our existing key executives and to attract, hire and retain additional qualified personnel. There is significant competition from within the insurance industry and from businesses outside the industry for exceptional employees, especially in key positions. Our competitors may be able to offer a work environment with higher compensation or more opportunities. Any new personnel we hire may not be or become as productive as we expect, as we may face challenges in adequately or appropriately integrating them into our workforce and culture. Our effort to retain and develop personnel may also result in significant additional expenses, which could adversely affect our profitability. The loss of any of our key executives or the inability to attract, hire and retain senior management and other highly qualified personnel (whether as a result of an insufficient number of qualified applicants, difficulty in recruiting new employees, or inadequate resources to train, integrate, and retain qualified employees) could adversely affect our ability to conduct our business. Changes to or turnover among senior management or key executives could disrupt the Company’s strategic focus and operational capabilities. Unexpected or abrupt departures may result in the failure to effectively transfer roles, responsibilities, and institutional knowledge and may impede our ability to act quickly and efficiently in executing our business strategy as we devote resources to recruiting new personnel or transitioning existing personnel to fill those roles. Moreover, changes in local employment legislation, taxation and the approach of regulatory bodies to compensation practices within our operating jurisdictions may impact our ability to recruit and retain qualified personnel or the cost to us of doing so. In addition, health emergencies or pandemics could impact our ability to attract and retain key personnel. There can be no assurance that we will be successful in identifying, hiring or retaining successors on terms acceptable to us.
With few exceptions, generally only Bermudians, spouses of Bermudians or Permanent Resident Certificate holders (collectively, "Residents") may engage in any gainful occupation in Bermuda without an appropriate governmental work permit. Work permits may be granted or extended by the Bermuda government only upon showing that, after proper public advertisement (in most cases), no Residents who meet the minimum standard requirements for the advertised position have applied for the position. Work permits are generally granted for one-, three- or five-year durations. Expatriate workers can, subject to the above, continue to be employed in Bermuda indefinitely by reapplying for work permits. All executives who periodically work in our Bermuda office and who require work permits have obtained them.
Increasing scrutiny and evolving expectations from investors, customers, regulators, policymakers and other stakeholders regarding environmental, social and governance matters may adversely affect our reputation or otherwise adversely impact our share price, demand for our securities and business and results of operations.
Investors, customers, regulators, policymakers and other stakeholders have placed increased importance on environmental, social and governance ("ESG") practices and disclosures. Certain institutional investors, investor advocacy groups, investment funds, creditors and other influential financial markets participants have become increasingly focused on companies' ESG practices and disclosures in evaluating their investments and business relationships. The heightened and sometimes conflicting stakeholder focus on ESG issues related to our business requires the continuous monitoring of various and evolving laws, regulations, standards and expectations and the associated reporting requirements.
In addition, regulators have adopted and likely will continue to adopt pro- or anti-ESG-related rules and guidance, which may conflict with one another and impose additional costs on us. Pressure from key stakeholders to comply with additional voluntary ESG-related initiatives or frameworks could also require us to make substantial investments in ESG matters, which could impact the results of our operations. ESG encompasses a wide range of issues, including climate change and other environmental risks, inclusion and governance standards. We cannot predict whether our business decisions, business strategy and disclosures relating to ESG issues will meet the expectations or requirements of relevant stakeholders, including certain key institutional shareholders. In the event that we publicly disclose, voluntarily or otherwise, certain goals or initiatives regarding ESG matters, we could fail, or we could be perceived to fail, in our achievement of such initiatives or goals, or we could be criticized for the scope of such initiatives or goals. This could result in adverse publicity, reputational harm, or loss of customer and/or investor confidence, which could adversely affect our business and results of operations.
Pandemics or other outbreaks of contagious diseases and efforts to mitigate their spread have had, and could in the future have, widespread impacts on the way we operate.
The spread of COVID-19 and mitigating measures caused unprecedented disruptions to the global economy and normal business operations across sectors and countries, including the sectors and countries in which we operate. Future pandemics or other outbreaks of contagious diseases may result in similar or worse economic implications and disruptions.
Market Risk
Market risk is the risk that our financial instruments, which include derivatives, may be negatively impacted by movements in financial market prices or rates such as interest rates, credit spreads, equity securities' prices and foreign currency exchange rates.
Our investment portfolios are exposed to significant capital markets risk related to changes in interest rates, credit spreads and equity prices, as well as other risks, which may adversely affect our results of operations or financial condition.
The performance of our cash and investments portfolio has a significant impact on our financial results. A failure to successfully execute our investment strategy could have a significant impact on our results of operations or financial condition.
Our investment portfolio is subject to a variety of market risks, including risks relating to general economic conditions, interest rate fluctuations, equity price risk, foreign currency movements, pre-payment or reinvestment risk, liquidity risk and credit risk. We manage market risks through, among other things, stressing diversification and conservation of principal and liquidity in our investment guidelines. An extended period of poor global financial market returns would adversely impact the value of our investment portfolio.
Fixed maturities, which represent 84% of our total investments and 70% of total cash and investments at December 31, 2024, may be adversely impacted by changes in interest rates or credit spreads. Increases in yields could cause the fair value of our investment portfolio to decrease, resulting in a lower book value (refer to Item 7A 'Quantitative and Qualitative Disclosure About Market Risk' for further details) and capital resources. A decline in yields may result in reductions in our investment income as new funds and proceeds from sales and maturities of fixed income securities are reinvested at lower rates. This reduces our overall future profitability. Interest rates and credit spreads are highly sensitive to many factors, including governmental and central bank monetary policies, inflation, domestic and international economic and political conditions, corporate profitability and other factors beyond our control.
Our portfolios of "other investments" and equity securities expose us to market price variability, driven by a number of factors outside of our control including, but not limited to, global equity market performance. Given our reliance on external investment managers, we are also exposed to operational risks, which may include, but are not limited to, a failure to follow our investment guidelines, technological and staffing deficiencies and inadequate disaster recovery plans.
Our derivative instrument counterparties may default on amounts owed to us due to bankruptcy, insolvency, lack of liquidity, adverse economic conditions, operational failure, fraud or other reasons. Even if we are entitled to collateral in circumstances of default, such collateral may be illiquid or proceeds from such collateral when liquidated may not be sufficient to recover the full amount of the obligation.
Our operating results may be adversely affected by currency fluctuations.
Our reporting currency is the U.S. dollar. However, a portion of gross premiums are written and ceded in currencies other than the U.S. dollar and a portion of gross and ceded loss reserves are in currencies other than the U.S. dollar. In addition, a portion of our investment portfolio is denominated in currencies other than the U.S. dollar. We may in the future experience losses or gains resulting from fluctuations in the values of these non-U.S. currencies. Although we manage our foreign currency exposure through matching of our major foreign-denominated assets and liabilities, as well as through use of currency derivatives, there is no guarantee that we will successfully mitigate our exposure to foreign exchange losses due to unfavorable currency fluctuations. If we fail to manage our foreign currency exposures or experience unfavorable currency fluctuations due to factors such as political unrest, sovereign debt concerns, inflation or other macro-economic factors in jurisdictions in which we operate our results of operations could be materially adversely impacted.
Liquidity Risk
Liquidity risk is the risk that we may not have sufficient cash to meet our obligations when they are due, or would have to incur excessive costs to do so.
Our underwriting activities may expose us to liquidity risks.
Our exposure to liquidity risk stems mainly from the need to pay claims on potential extreme loss events and regulatory constraints that limit the flow of funds within the Group. We maintain cash and cash equivalents and high quality, liquid securities to meet expected outflows, including outflows that could result from a range of potential stress events. We place internal limits on the maximum percentage of cash and investments that may be in an illiquid form as well as on the minimum percentage of our asset portfolio that must be invested in unrestricted cash and liquid investment grade fixed income securities.
Additionally, we have access to diverse funding sources to cover contingencies. Funding sources include asset sales and external debt issuances, and we may seek to establish additional borrowing facilities to cover such contingencies. We conduct stress tests to ensure the sufficiency of these funding sources in extreme scenarios. However, there remains a risk that in certain circumstances, our results of operations or financial condition may be adversely impacted by our inability to access appropriate liquidity or the cost of doing so.
Credit Risk
Credit risk represents the risk of incurring financial loss due to the diminished creditworthiness (reduced financial strength and, ultimately, possibly default) and concentration of our third-party counterparties (refer to 'Market Risk' above for a discussion of credit risk as it relates to the investment portfolio).
If we successfully purchase reinsurance or execute portfolio transactions, we may be unable to collect amounts due to us.
A reinsurer’s insolvency, or inability or refusal to make payments under the terms of its reinsurance agreement with us, could have a material adverse effect on our business because we remain liable to the insured. We face counterparty risk whenever we purchase reinsurance or retrocessional reinsurance, or enter into loss portfolio transactions. Inflation and industry catastrophic losses have heightened this risk as counterparties experience economic strains and uncertainty. Consequently, the insolvency, inability or unwillingness of any of our present or future reinsurers to make timely payments to us under the terms of our reinsurance or retrocessional agreements or portfolio transactions contracts could have a material adverse effect on our results of operations, financial condition, or liquidity. Collateralization of reinsurance obligations is an important tool that we employ to mitigate credit risk, however residual risk remains.
Our reliance on brokers subjects us to credit risk.
In accordance with industry practice, we pay amounts owed on claims under our insurance and reinsurance contracts to brokers, and these brokers pay these amounts to clients that have purchased insurance and reinsurance from us. Although the law is unsettled and depends upon the facts and circumstances of the particular case, in some jurisdictions, if a broker fails to make such a payment, we might remain liable to the insured or ceding insurer for the deficiency.
Conversely, in certain jurisdictions, when the insured or ceding insurer pays premiums for these policies to brokers for payment to us, these premiums might be considered to have been paid to us and the insured or ceding insurer will no longer be liable to us for those amounts, whether or not we have actually received the premiums from the broker. Consequently, we assume a degree of credit risk associated with brokers with whom we transact business. These risks are heightened during periods characterized by financial market instability and/or an economic downturn or recession.
Certain of our policyholders and intermediaries may not pay premiums owed to us due to insolvency or other reasons.
Insolvency, liquidity problems, distressed financial conditions or the general macro-economic conditions may increase the risk that policyholders or intermediaries, such as insurance brokers, may not pay a part of or the full amount of premiums owed to us, despite an obligation to do so. The terms of our contracts may not permit us to cancel our insurance even though we have not received payment. If non-payment becomes widespread, due to insolvency, lack of liquidity, adverse economic conditions, operational failure or otherwise, it could have a material adverse impact on our revenues and results of operations.
Operational Risk
Operational risk represents the risk of loss as a result of inadequate processes, system and network failures, human error or external events, including but not limited to direct or indirect financial loss, reputational damage, customer dissatisfaction, and legal and regulatory penalties.
We rely on our processes, people, and systems to maintain our operations and manage the operational risks inherent to our business. Any errors, omissions or misconduct by our employees or third-party agents in the execution of these processes may result in financial losses.
We rely on the execution of our processes, people, and systems to maintain and execute our operations. We seek to monitor and control our exposure to risks arising from these processes through an enterprise risk management framework, internal controls, management review and other processes. We cannot provide total assurance that these processes will effectively identify or control all risks, or that our employees and third-party agents will effectively execute them. Loss may result from, among other things, actual or alleged fraud; errors; or failure to document transactions properly, obtain proper internal authorization, comply with underwriting or other internal guidelines, or comply with regulatory requirements.
Further, we have launched a strategic initiative aimed at improving our operating model. The 'How We Work' program is driving and overseeing the changes being made across the organization to build momentum and establish AXIS as an efficient and sustainable organization. These changes could result in heightened operational risk as the business adapts to new ways of working.
If we experience difficulties with technology and/or data security, our ability to conduct our business might be adversely affected.
While technology can streamline many business processes and ultimately reduce the cost of operations, technology initiatives present certain risks. Our business is dependent upon our employees’ and outsourcers’ ability to perform, in an efficient and uninterrupted fashion, necessary business functions such as processing policies and paying claims. A shutdown or inability to access one or more of our outsourcers' facilities, a power outage, or a failure of one or more of our outsourcers' information technology, telecommunications or other systems and networks could significantly impair our ability to perform such functions on a timely basis. If sustained or repeated, such a business interruption, system failure or service denial could result in a deterioration of our ability to write and process business, provide customer service, pay claims in a timely manner or perform other necessary business functions. Our robust business continuity plan, which addresses the risk of such business interruption, system or network failure or service denial, with input from both internal and external stakeholders, may be inadequate and our systems and networks may still be impacted. Unauthorized access to our systems and networks, computer viruses, deceptive communications (such as phishing attacks), malware, hackers and other cybersecurity threats and external hazards, including catastrophe events, could expose us to data loss, damages, interruptions or delays in our business, remediation costs, claims, and damage to our reputation.
Any of these eventualities could result in a material and adverse effect on our business, results of operations and financial condition.
Like other global companies, we are regularly the target of attempted cyberattacks and other data security threats and must continuously monitor and develop our information technology systems, networks and infrastructure to prevent, detect, address and mitigate the risk of threats to our data, systems, and networks. These cyberattacks and other data security incidents have included, or may in the future include: viruses, malware or other malicious code, ransomware, software bugs, deceptive social engineering campaigns (also known as "phishing" or "spoofing"), credential stuffing, account takeovers, loss or theft of assets, employee errors or malfeasance, third-party errors or malfeasance, as well as system and network failures and other similar security events, which could result in the loss of, unauthorized access to or disclosure of, or the misuse or misappropriation of, confidential, personal, proprietary or other information.
Over time, and particularly recently, the sophistication and frequency of these threats continues to increase, and may be difficult to detect for long periods of time. For example, cyberattacks may be conducted by organized groups and individuals with a wide range of motives and expertise, including organized criminal groups, “hacktivists,” terrorists, nation states, nation-state supported actors and others While administrative and technical controls, along with other preventive actions, may reduce the risk of cyberattacks and other data security incidents and protect our information technology, they may be insufficient to thwart cyberattacks and/or prevent other data security breaches to our systems or networks. Moreover, we may be unable to anticipate these threats or react in a timely manner. As these threats continually evolve, we may be required to devote substantial additional resources to modify or enhance our information security systems and networks and our cybersecurity program.
While we generally perform cybersecurity diligence on our key service providers, we do not control our service providers and our ability to monitor their cybersecurity is limited. Some of our service providers may store or have access to our data and may not have effective controls, processes, or practices to protect our information from loss, unauthorized disclosure, unauthorized use or misappropriation. A vulnerability in our service providers’ software or systems, a failure of our service providers’ safeguards, policies or procedures, could result in a cyberattack or other data security incident which could harm our business.
While we have not experienced a material cybersecurity incident, to the extent any such incident results in a loss or damage to our data, or inappropriate disclosure of our confidential, personal, proprietary or other information or that of others, it could impact our operations, cause significant damage to our reputation, affect our relationships with our customers and clients, lead to claims against us under various data privacy laws, result in regulatory action, fines, damages, injunctions, or penalties and ultimately have a material adverse effect on our business or operations.
We also operate in a number of jurisdictions with strict data protection privacy, cybersecurity and other related laws, which could be violated in the event of a cybersecurity incident, or by personnel. Failure to comply with these obligations, including a failure to make adequate or timely disclosure to the public, regulators, or law enforcement agencies following any such incident, can give rise to monetary fines and other penalties that could be material.
Our business may be adversely affected if third-party service providers fail to satisfactorily perform certain technology and business process functions.
We outsource certain technology and business process functions to third parties. If we do not effectively develop and implement our outsourcing strategy, or if third-party service providers do not perform as anticipated or we experience technological or other problems with a transition to a third-party service provider, we may not realize productivity improvements or cost efficiencies and may experience operational difficulties, increased costs and a loss of business. In addition, our outsourcing of certain technology and business process functions to third parties may expose us to enhanced risk related to data security, which could result in monetary and reputational damages. In addition, our ability to receive services from third-party providers could be impacted by political instability or unanticipated regulatory requirements which in turn could materially adversely affect our ability to conduct our business.
Regulatory Risk
Regulatory risk represents the risk arising from our failure to comply with legal, statutory or regulatory obligations.
Compliance with data protection, privacy and cybersecurity laws and regulations governing the processing of personal information is a legal requirement, and non-compliance may impede our services or result in increased costs. Failure to comply could result in material fines and/or penalties imposed by data protection and/or financial services regulators. In addition, any data breach may have an adverse effect on our reputation, results of operations or financial condition, or have other adverse consequences.
Our business relies on the processing of data, including personal information, in many jurisdictions and the movement of such data across national borders. The collection, storage, handling, disclosure, use, transfer, security and other processing of personal information that occurs in connection with our business is subject to federal, state, local and foreign data protection and privacy laws, regulations, rules, industry standards and other obligations. These legal requirements are not uniform and continue to evolve, and regulatory scrutiny in this area is increasing around the world. In many cases, these laws and regulations apply not only to third-party transactions, but also to transfers of information within the Group. Data protection, privacy and cybersecurity laws may be interpreted and applied differently from country to country and may create inconsistent or conflicting requirements.
In Europe, the U.K., and Switzerland, there are data protection laws that have extra-territorial effect. These data protection laws require compliance by all companies that process data of EU, U.K., and Swiss citizens, regardless of the company’s location, and also impose obligations on companies processing data of non-E. citizens. The data protection laws also impose requirements regarding the processing of personal data and confers rights on data subjects, including rights of access to their personal data, deletion of their personal data, the "right to be forgotten" and the right to "portability" of personal data.
We also need to comply with data protection laws in the U.S and Canada. In the U.S., there continue to be many changes in the data protection and privacy landscape. As states continue to focus on data protection, our compliance burden may increase.
Further, while we strive to publish and prominently display privacy policies that are accurate, comprehensive, and compliant with applicable laws, regulations, rules and industry standards, we cannot ensure that our privacy policies and other statements regarding our practices will be sufficient to protect us from claims, proceedings, liability or adverse publicity relating to data protection, privacy or cybersecurity. Although we endeavor to comply with our privacy policies, we may at times fail to do so or be alleged to have failed to do so. The publication of our privacy policies and other documentation that provide promises and assurances about data protection, privacy and cybersecurity can subject us to potential government or legal action if they are found to be deceptive, unfair, or misrepresentative of our actual practices. Any concerns about our data protection, privacy and cybersecurity practices, even if unfounded, could damage our reputation and adversely affect our business.
Compliance with obligations imposed by data protection, privacy, and cybersecurity legislation, including Bermuda’s Personal Information Protection Act and Quebec’s Law 25, requires investment in appropriate technical or organizational measures designed to safeguard the rights and freedoms of data subjects. Such investment may result in significant costs to our business and may require us to modify certain of our business practices. In addition, enforcement actions, investigations and the imposition of substantial fines and penalties by regulatory authorities as a result of data security incidents and privacy violations have increased dramatically over the past several years. The enactment of more restrictive laws, rules, regulations or future enforcement actions or investigations could impact us through increased costs or restrictions on our business, and noncompliance could result in regulatory penalties and significant legal liability.
Any failure or perceived failure by us to comply with applicable data protection, privacy and cybersecurity laws, regulations, rules, industry standards and other obligations, or compromise of security that results in unauthorized access to, or unauthorized loss, destruction, use, modification, acquisition, disclosure, release or transfer of personal, sensitive, confidential or other client or Company information, could subject us to increased costs or restrictions on our business, future enforcement actions or investigations, regulatory penalties, claims, fines, criminal prosecution, judgments, awards, sanctions, monetary damages, costly litigation (including class actions) and significant legal liability. Such events could also result in negative publicity and damage to our reputation, distract our management and technical personnel, adversely affect the demand for our products and services and cause us to lose business, which could therefore have a material adverse effect on our results of operations or financial condition.
Our insurance and reinsurance subsidiaries are subject to supervision and regulation. Changes to existing regulation and supervisory standards, or failure to comply with them, could have an adverse effect on our business, results of operations and financial condition, or result in negative publicity, reputational damage or harm to our relationships.
Our insurance and reinsurance subsidiaries conduct business globally and are subject to varying degrees of regulation and supervision in multiple jurisdictions. In particular, in the U.K., Lloyd's has supervisory powers that pose unique regulatory risks. The laws and regulations of the jurisdictions and markets, including Lloyd's, in which our insurance and reinsurance subsidiaries are domiciled or operate require, among other things, that our subsidiaries maintain minimum levels of statutory capital and liquidity, meet solvency standards, participate in guaranty funds and submit to periodic examinations of their financial condition and compliance with underwriting and other regulations. These laws and regulations also limit or restrict payments of dividends and reductions in capital. Statutes, regulations and policies may also restrict the ability of these subsidiaries to write insurance and reinsurance contracts, make certain investments and distribute funds. The purpose of insurance laws and regulations generally is to protect insureds and ceding insurance companies, not our shareholders. We may not be able to comply fully with, or obtain appropriate exemptions from, these laws and regulations, which could result in restrictions on our ability to do business or undertake activities that are regulated in one or more of the jurisdictions in which we conduct business and could subject us to fines and other sanctions. In addition, changes in the laws or regulations to which our insurance and reinsurance subsidiaries are subject or in the interpretation thereof by enforcement or regulatory agencies could impact the competitive market, as well as the way we conduct our business and manage our capital, resulting in lower revenues and higher costs. This in turn could have a material adverse effect on our business, results of operations and financial condition. The rate of legal and regulatory change, particularly in the U.K. and Ireland, has been increasing in recent years, with initiatives such as Consumer Duty in the U.K. and the Individual Accountability Framework in Ireland adding to the regulatory burden on our operating entities. Further to this, increased regulatory scrutiny in the form of reviews and inspections can put a strain on our resources. Further to this, we are seeing an increase in both the pace of, and severity of, regulatory change in Bermuda. The Bermuda Monetary Authority ("BMA") has indicated that it intends to change how it supervises insurance groups, which would result in a fundamental change to how the Group is supervised. At present, the BMA regulates the Group as its group supervisor, through AXIS Specialty Limited ("ASL") as Designated Insurer. The proposed new regime would see the BMA instead directly supervise the Group, doing away with the Designated Insurer regime that is currently in place. While this may not have a material impact on the Group on a day-to-day basis, it could lead to increased governance requirements.
Insurance regulatory authorities have broad authority to initiate investigations or other proceedings, and, in connection with a failure to comply with applicable laws and regulations, could impose adverse consequences, including fines, penalties, injunctions, denial or revocation of an operating license or approval, increased scrutiny or oversight, limitations on engaging in a particular business, or redress to clients. Further to this, regimes such as the Senior Managers and Certification Regime in the UK, and the Individual Accountability Regime in Ireland, place personal responsibility on key members of senior staff and Board members, meaning the regulators can take action directly against these individuals as well. These actions also could result in negative publicity, reputational damage or harm to client, employee or other relationships.
Potential government intervention in our industry as a result of recent events and instability in the marketplace for insurance products could hinder our flexibility and negatively affect the business opportunities that may be available to us in the market.
Government intervention and the possibility of future government intervention have created uncertainty in insurance and reinsurance markets. Government and regulators generally require insurers and reinsurers to have high solvency ratios and localized capital to ensure the protection of policyholders to the possible detriment of other constituents, including shareholders of insurers and reinsurers. Government, regulatory and judicial actions across multiple jurisdictions in relation to business interruption insurance have exacerbated the uncertainty by altering the interpretation of our contracts or extending or changing coverage (beyond the obligations set forth within those contracts or beyond what was intended by the parties).
Certain U.S. and non-U.S. judicial and regulatory authorities, including U.S. Attorneys offices and certain state attorneys general, occasionally commence investigations into business practices in the insurance industry. In addition, although the U.S. federal government has not historically regulated insurance, there have been proposals from time to time to impose federal regulation on the U.S. insurance industry. As a result, we are unable to predict what, if any, changes to laws and regulations impacting the U.S. insurance industry may be enacted by the U.S. Congress or the new presidential administration and what the impact of any such changes will be upon our business, financial condition, and results of operations. Further, Dodd-Frank gives the Federal Reserve supervisory authority over certain U.S. financial services companies, including insurance companies, if they are designated as 'systemically important' by a two-thirds vote of a Financial Stability Oversight Council. While we do not believe that we are systemically important, as defined in Dodd-Frank or additional federal or state regulation that is adopted in the future could impose significant burdens on us, impact the ways in which we conduct our business and govern our subsidiaries, increase compliance costs, increase the levels of capital required to operate our subsidiaries, duplicate state regulation and/or result in a competitive disadvantage.
Our European insurance and reinsurance entities are subject to local laws that implement the Solvency II Directive. Solvency II covers three main areas:
i.the valuation of assets and liabilities on a Solvency II economic basis and risk-based solvency and capital requirements;
ii.governance requirements including requirements relating to the key functions of compliance, internal audit, actuarial and risk management; and
iii.new supervisory legal entity and group reporting and disclosure requirements including public disclosures.
Since Brexit, the U.K. Government and Regulators have been reviewing the Solvency II regime, with a view to making it more bespoke to the U.K. market. The Solvency U.K. regime came into force on December 31, 2024, and marks a fundamental change to the previous regime. The European Commission has published its updates to the Solvency II regime, with Member States having 2 years to transpose this Directive.
While we cannot predict the exact nature, timing or scope of possible governmental initiatives, such proposals could materially adversely affect our business by, among other things:
•Providing reinsurance capacity in markets and to consumers that we target;
•Requiring our further participation in industry pools and guaranty associations;
•Expanding the scope of coverage under existing policies; e.g., following large disasters;
•Further regulating the terms of insurance and reinsurance contracts; or
•Disproportionately benefiting the companies of one country over those of another.
Our business is subject to certain laws and regulations relating to sanctions and foreign corrupt practices, the violation of which could have a material adverse effect on our financial condition and operating results.
We must comply with all applicable economic and financial sanctions, other trade controls and anti-bribery laws and regulations of the U.S. and other foreign jurisdictions where we operate, including Bermuda, the U.K. and the European Union. U.S. laws and regulations applicable to us include the economic trade sanctions laws and regulations administered by the U.S. Department of Treasury’s Office of Foreign Assets Control as well as certain laws administered by the U.S. Department of State. These laws and regulations are complex, frequently changing, and increasing in number, and they may impose additional prohibitions or compliance obligations on our dealings in certain countries and territories, including sanctions imposed on Russia and certain Ukraine territories. In addition, we are subject to the Foreign Corrupt Practices Act and other anti-bribery laws, such as the Irish Criminal Justice (Corruption Offences) Act, the Bermuda Bribery Act and the U.K. Bribery Act, which generally bar corrupt payments or unreasonable gifts. Although we have policies and controls in place that are designed to ensure compliance with these laws and regulations, it is possible that an employee or an agent acting on our behalf could fail to comply with applicable laws and regulations and, due to the complex nature of the risks, it may not always be possible for us to ascertain compliance with such laws and regulations. In such event, we could be exposed to civil penalties, criminal penalties and other sanctions, including fines or other unintended punitive actions. In addition, such violations could damage our business and/or our reputation. All of the foregoing could have a material adverse effect on our financial condition and operating results.
Risks Related to the Ownership of our Securities
In addition to the risks to our business listed above, there are certain other risks related to the ownership of our securities.
The price of our common shares may be volatile.
There has been significant volatility in the market for equity securities in recent years. During 2024, 2023, and 2022, the closing price of our common shares fluctuated from a low of $54.27 to a high of $94.05, a low of $51.68 to a high of $63.47, and a low of $48.77 to a high of $60.66, respectively. The price of our common shares may not remain at or exceed current levels. The following factors, in addition to those described in other risk factors above, may have a material adverse effect on the market price of our common stock:
•actual or anticipated variations in our quarterly results, including as a result of catastrophes or our investment performance;
•any share repurchase program;
•changes in market valuation of companies in the insurance/reinsurance industry;
•changes in expectations of future financial performance or changes in estimates of securities analysts;
•fluctuations in stock market processes and volumes;
•issuances or sales of common shares or other securities in the future;
•the addition or departure of key personnel;
•changes in tax law; and
•announcements by us or our competitors of acquisitions, investments or strategic alliances.
Stock markets in the U.S. continue to experience volatile price and volume fluctuations. Such fluctuations, as well as the general political situation, current economic conditions or interest rate or currency rate fluctuations, could materially adversely affect the market price of our stock.
Our ability to pay dividends and to make payments on indebtedness may be constrained by our holding company structure.
AXIS Capital is a holding company and has no direct operations of its own. AXIS Capital has no significant operations or assets other than its ownership of the shares of its operating insurance and reinsurance subsidiaries, AXIS Specialty Bermuda, AXIS Re SE, AXIS Specialty Europe SE, the Members of Lloyd's (AXIS Corporate Capital UK Limited and AXIS Corporate Capital UK II Limited), AXIS Re U.S., AXIS Specialty U.S., AXIS Specialty Insurance Limited, AXIS Surplus and AXIS Insurance Co. (collectively, our "Insurance Subsidiaries"). Dividends and other permitted distributions from our Insurance Subsidiaries (in some cases through our subsidiary holding companies) are our primary source of funds to meet ongoing cash requirements, including debt service payments and other expenses, and to pay dividends to our shareholders. Our Insurance Subsidiaries are subject to significant regulatory restrictions limiting their ability to declare and pay dividends and make distributions. In addition, the ability of our Insurance Subsidiaries to pay dividends to AXIS Capital could be constrained by our dependence on financial strength ratings from independent rating agencies. Our ratings from these agencies depend to a large extent on the capitalization levels of our Insurance Subsidiaries. The inability of our Insurance Subsidiaries to pay dividends in an amount sufficient to enable us to meet our cash requirements at the holding company level could have a material adverse effect on our business and our ability to pay dividends and make payments on our indebtedness.
AXIS Capital is a Bermuda company and it may be difficult to enforce judgments against it or its directors and executive officers.
AXIS Capital is incorporated pursuant to the laws of Bermuda, and our business is based in Bermuda. In addition, some of our directors and officers reside outside the U.S., and a substantial portion of our assets and the assets of such persons are located in jurisdictions outside the U.S. As a result, it may be difficult or impossible to effect service of process within the U.S. upon us or those persons or to recover against us or them on judgments of U.S. courts, including judgments predicated upon civil liability provisions of the U.S. federal securities laws. Further, it may not be possible to bring a claim in Bermuda against us or our directors and officers for violation of U.S. federal securities laws because these laws may not have extraterritorial effect and/or may not be enforceable in Bermuda. A Bermuda court may, however, impose civil liability, including the possibility of monetary damages, on us or our directors and officers in a suit brought in the Supreme Court of Bermuda if the Bermuda court considers that it has jurisdiction to hear and decide any such claim.
There are provisions in our organizational documents that may reduce or increase the voting rights of our shares.
Our bye-laws generally provide that shareholders have one vote for each common share held by them and are entitled to vote, on a non-cumulative basis, at all meetings of shareholders. However, the voting rights exercisable by a shareholder may be limited so that certain persons or groups are not deemed to hold 9.5% or more of the voting power conferred by our shares. Under these provisions, some shareholders may have the right to exercise their voting rights limited to less than one vote per share. Moreover, these provisions could have the effect of reducing the voting power of some shareholders who would not otherwise be subject to the limitation by virtue of their direct share ownership. In addition, our Board of Directors may limit a shareholder’s exercise of voting rights where it deems it necessary to do so to avoid adverse tax, legal or regulatory consequences.
We also have the authority under our bye-laws to request information from any shareholder for the purpose of determining whether a shareholder’s voting rights are to be limited pursuant to the bye-laws. If a shareholder fails to respond to our request for information or submits incomplete or inaccurate information in response to a request by us, we may, in our sole discretion, eliminate the shareholder’s voting rights.
There are provisions in our bye-laws that may restrict the ability to transfer common shares and which may require shareholders to sell their common shares.
Our bye-laws provide that our Board of Directors may decline to register a transfer of any common shares under certain circumstances, including if the Board has reason to believe that any non-de minimis adverse tax, regulatory or legal consequences to us, any of our subsidiaries or any of our shareholders may occur as a result of such transfer. Our bye-laws also provide that if our Board of Directors determines that share ownership by a person may result in non-de minimis adverse tax, legal or regulatory consequences to us, any of our subsidiaries or any of our shareholders, then we have the option, but not the obligation, to require such person to sell to us or to third parties to whom we assign the repurchase right for fair value the minimum number of common shares held by such person that is necessary to eliminate the non-de minimis adverse tax, legal or regulatory consequences.
Applicable insurance laws may make it difficult to effect a change of control of our company.
Before a person can acquire control of a U.S. insurance company, prior written approval must be obtained from the insurance commissioner of the state where the domestic insurer is domiciled. Prior to granting approval of an application to acquire control of a domestic insurer, the state insurance commissioner will consider such factors as the financial strength of the acquirer, the integrity and management of the acquirer’s board of directors and executive officers, the acquirer’s plans for the future operations of the domestic insurer and any anti-competitive results that may arise from the consummation of the acquisition of control. Generally, state statutes provide that control over a domestic insurer is presumed to exist if any person, directly or indirectly, owns, controls, holds with the power to vote, or holds proxies representing, 10% or more of the voting securities of the domestic insurer. Because a person acquiring 10% or more of our common shares would indirectly control the same percentage of the stock of the AXIS U.S. Subsidiaries, the insurance change of control laws of Connecticut, Illinois and New York would likely apply to such a transaction.
The Insurance Act in Bermuda requires that where the shares of a registered insurer or reinsurer, or the shares of its parent, are traded on a recognized stock exchange, and a person becomes a 10%, 20%, 33% or 50% shareholder controller of that insurer or reinsurer, that person shall, within 45 days, notify the BMA in writing that they have become such a controller. In addition, a person who is a shareholder controller of a Class 4 insurer or reinsurer (such as AXIS Specialty Bermuda) whose shares or shares of its parent company are traded on a recognized stock exchange must serve the BMA with a notice in writing that they have reduced or disposed of their holding in the insurer or reinsurer where the proportion of voting rights in the insurer or reinsurer held by them will have reached or has fallen below 10%, 20%, 33% or 50%, as the case may be, not later than 45 days after such reduction or disposal.
The definition of shareholder controller is set out in the Insurance Act but generally refers to a person who;
(i) holds 10% or more of the shares carrying rights to vote at a shareholders’ meeting of the registered insurer or reinsurer or its parent;
(ii) is entitled to exercise, or control the exercise of, 10% or more of the voting power at any shareholders meeting of the registered insurer or reinsurer or its parent; or
(iii) is able to exercise significant influence over the management of the registered insurer or reinsurer or its parent by virtue of its shareholding or its entitlement to exercise, or control the exercise of, the voting power at any shareholders’ meeting of the registered insurer or reinsurer or its parent company.
The BMA may object to any person holding 10% or more of our common shares if it appears to the BMA that such person is not, or is no longer, a fit and proper person to be such a holder. In such a case, the BMA may require the shareholder to reduce its holding of common shares or direct, among other things, that voting rights attaching to the common shares shall not be exercisable. A person who does not comply with such a notice or direction from the BMA may be guilty of an offense and subject to a variety of enforcement actions.
In addition, the Insurance Acts and Regulations in Ireland require that anyone acquiring or disposing of a direct or indirect holding in an Irish authorized insurance or reinsurance company (such as AXIS Specialty Europe or AXIS Re SE) that represents 10% or more of the capital or of the voting rights of such company or that makes it possible to exercise a significant influence over the management of such company, or anyone who proposes to decrease or increase that holding to specified levels, must first notify the Central Bank of Ireland ("CBI") of their intention to do so. They also require any Irish authorized insurance or reinsurance company that becomes aware of any acquisitions or disposals of its capital involving the specified levels to notify the CBI. The specified levels are 20%, 33% and 50% or such other level of ownership that results in the company becoming the acquirer’s subsidiary within the meaning of article 20 of the European Communities (Non-Life Insurance) Framework Regulations 1994.
The CBI has three months from the date of submission of a notification within which to oppose the proposed transaction if the CBI is not satisfied as to the suitability of the acquirer in view of the necessity "to ensure prudent and sound management of the insurance or reinsurance undertaking concerned". Any person owning 10% or more of the capital or voting rights or an amount that makes it possible to exercise a significant influence over the management of AXIS Capital would be considered to have a "qualifying holding" in AXIS Specialty Europe SE and AXIS Re SE.
In the U.K., the Prudential Regulation Authority ("PRA") and the Financial Conduct Authority ("FCA") regulate the acquisition of "control" of any U.K. insurance companies and Lloyd's managing agents that are authorized under the Financial Services and Markets Act 2000 ("FSMA"). Any legal entity or individual that (together with any person with whom it or they are "acting in concert") directly or indirectly acquires 10% or more of the shares in a U.K. authorized insurance company or Lloyd's managing agent, or their parent company, or is entitled to exercise or control the exercise of 10% or more of the voting power in such authorized insurance company or Lloyd's managing agent or their parent company, would be considered to have acquired "control" for the purposes of the relevant legislation, as would a person who had significant influence over the management of such authorized insurance company or their parent company by virtue of their shareholding or voting power in either. A purchase of 10% or more of the ordinary shares of the Company would therefore be considered to have acquired "control" of AXIS Managing Agency Ltd. Under FSMA, any person proposing to acquire "control" over a U.K. authorized insurance company must give prior notification to the PRA of their intention to do so. The PRA, which will consult with the FCA, would then have 60 working days to consider that person's application to acquire "control" (although this 60 working day period can be extended by up to 30 additional working days in certain circumstances where the regulators have questions relating to the application). Failure to make the relevant prior application could result in action being taken against AXIS Managing Agency Ltd. by the PRA.
A person who is already deemed to have "control" will require prior approval of the PRA if such person increases their level of "control" beyond certain percentages. These percentages are 20%, 30% and 50%. Similar requirements apply in relation to the acquisition of control of a U.K. authorized person which is an insurance intermediary (such as AXIS Underwriting Limited) except that the approval must be obtained from the FCA rather than the PRA and the threshold triggering the requirement for prior approval is 20% of the shares or voting power in the insurance intermediary or its parent company. The approval of the Council of Lloyd's is also required in relation to the change of control of a Lloyd's managing agent or member. Broadly, Lloyd's applies the same tests in relation to control as are set out in the FSMA (see above) and in practice coordinates its approval process with that of the PRA.
While our bye-laws limit the voting power of any shareholder to less than 9.5%, there can be no assurance that the applicable regulatory body would agree that a shareholder who owned 10% or more of our shares did not, because of the limitation on the voting power of such shares, control the applicable Insurance Subsidiary. These laws may discourage potential acquisition proposals and may delay, deter or prevent a change of control of the Company, including transactions that some or all of our shareholders might consider to be desirable.
Anti-takeover provisions in our bye-laws could impede an attempt to replace our directors or to effect a change in control, which could diminish the value of our common shares.
Our bye-laws contain provisions that may make it more difficult for shareholders to replace our directors and could delay or prevent a change of control that a shareholder might consider favorable. These provisions include a staggered board of directors (in which the directors of the class elected at each annual general meeting holds office for a term of three years, with the term of each class expiring at successive annual general meetings of shareholders), limitations on the ability of shareholders to remove directors other than for cause, limitations on voting rights and restrictions on transfer of our common shares. These provisions may prevent a shareholder from receiving the benefit from any premium over the market price of our shares offered by a bidder in a potential takeover. Even in the absence of an attempt to effect a change in management or a takeover attempt, these provisions may adversely affect the prevailing market price of our shares if they are viewed as discouraging takeover attempts in the future.
Risks Related to Taxation
Changes in tax laws resulting from the recommendations of the Organization for Economic Corporation and Development ("OECD") could materially adversely affect us.
The OECD launched a global initiative among member and non-member countries on measures to limit harmful tax competition, known as the "Base Erosion and Profit Shifting" ("BEPS") project and, in 2015, published reports containing a suite of recommended actions. These measures are largely directed at counteracting the effects of low-tax and preferential tax regimes in countries around the world, including expanding the definition of permanent establishment and updating the rules for attributing profits to permanent establishments, tightening transfer pricing rules to ensure that outcomes are in line with value creation, neutralizing the effect of hybrid financial instruments and limiting the deductibility of interest costs for tax purposes and preventing double tax treaty abuse. Many countries have changed or announced future changes to their tax laws in response to the BEPS project. On May 31, 2019, the OECD published a "Programme of Work", designed to address the tax challenges created by an increasingly digitalized economy. This was divided into two pillars. The first pillar addresses the broader challenge of a digitalized economy and focuses on the allocation of group profits among taxing jurisdictions, based on a market-based concept rather than the historical "permanent establishment" concept ("Pillar One"). The second pillar addresses the remaining BEPS risk of profit shifting to entities in low tax jurisdictions by introducing a global minimum tax ("Pillar Two").
Pillar One
On October 11, 2023, the members of the OECD/G20 Inclusive Framework on BEPS (the "Inclusive Framework") published a multilateral convention to implement rules which coordinate a reallocation of taxing rights to market jurisdictions in accordance with Pillar One. Pillar One is expected to apply to groups with adjusted revenues in excess of €20 billion and specific exemptions have been incorporated in the multilateral convention for regulated financial institutions. The application of the multilateral convention on Pillar One is therefore not expected to have a material impact on our effective tax rate, however these rules remain subject to ongoing negotiation and implementation.
Pillar Two
On December 20, 2021, the OECD released proposed model legislation for Pillar Two which was approved by 135 countries (the "Model Rules"). The Model Rules included a set of rules, principally the income inclusion rule and undertaxed payments rules, which together have the intended effect of imposing a minimum tax rate of 15% on multinational groups with revenues in excess of €750 million. Additionally, the Model Rules anticipated the implementation of qualifying domestic top-up taxes ("QDMTT") in local jurisdictions. Broadly, these QDMTTs are intended to provide jurisdictions with the right to charge top-up taxes on entities located in that jurisdiction if those entities have an effective tax rate of less than 15%. Additionally, the Model Rules anticipated the implementation of qualifying domestic top-up taxes ("QDMTT") in local jurisdictions. Broadly, these QDMTTs are intended to provide jurisdictions with the right to charge top-up taxes on entities located in that jurisdiction if those entities have an effective tax rate of less than 15%. A number of jurisdictions in which we operate have implemented the Model Rules into domestic legislation, including the implementation of QDMTTs, with effect for accounting periods starting on or after 31 December 2023.
Although domestic legislation implemented to affect the Model Rules is not expected to have a material effect on our global effective tax rate in the current accounting period, these taxes remain subject to a multilateral review process which is subject to ongoing development and the interpretation of these rules by tax authorities remains uncertain. The responses to Pillar 2 by various jurisdictions in which we operate (including the interpretation of domestic legislation by local tax authorities) will result in a material compliance burden with ongoing monitoring and filing requirements.
We will be liable to tax under the Corporate Income Tax Act 2023 of Bermuda, which may have an adverse effect on our results of operations.
The Bermuda Minister of Finance, under the Exempted Undertakings Tax Protection Act 1966 of Bermuda, as amended, has given each of our Bermuda resident companies an assurance that if any legislation is enacted in Bermuda that would impose tax computed on profits or income, or computed on any capital asset, gain or appreciation, or any tax in the nature of estate duty or inheritance tax, then the imposition of any such tax will not be applicable to our Bermuda resident companies or any of their respective operations, shares, debentures or other obligations until March 31, 2035.
Notwithstanding the above, on December 27, 2023, the Bermuda government enacted a corporate income tax which will apply for accounting periods starting on or after January 1, 2025. Importantly, under the Corporate Income Tax Act 2023 of Bermuda, any liability to the tax will apply regardless of any assurances previously provided under the Exempted Undertakings Tax Protection Act 1966 of Bermuda. This tax will likely have a material impact on our effective tax rate in future accounting periods.
Broadly, the Bermuda corporate income tax is intended to be treated as a covered tax for the purposes of Pillar Two and therefore no double taxation is expected to arise from these rules and the top-up taxes under Pillar Two in other jurisdictions. However, the treatment of the Bermuda corporate income tax as a covered tax is subject to interpretation in other jurisdictions and therefore remains uncertain at this time. The OECD published administrative guidance on January 15, 2025 regarding transition rules for deferred tax accounting attributes. This guidance may cause a portion of the Bermuda corporate income tax to not be regarded as a covered tax for purposes of Pillar Two in other jurisdictions, this may have a material impact on our future effective tax rate.
Our non-U.S. companies may be subject to U.S. tax that may have an adverse effect on our results of operations.
We intend to manage our business so that each of our non-U.S. companies, apart from our Lloyd's operations with U.S. effectively connected income, will operate in such a manner that none of these companies should be subject to U.S. tax (other than U.S. excise tax on insurance or reinsurance premiums attributable to insuring or reinsuring U.S. risks and U.S. withholding tax on some types of U.S. source investment income), because none of these companies should be treated as engaged in a trade or business within the U.S. However, because there is considerable uncertainty as to the activities that constitute being engaged in a trade or business within the U.S., we cannot be certain that the U.S. Internal Revenue Service will not contend successfully that any of our non-U.S. companies is/are engaged in a trade or business in the U.S. If any of our non-U.S. companies were considered to be engaged in a trade or business in the U.S., it could be subject to U.S. corporate income and additional branch profits taxes on the portion of its earnings effectively connected to such U.S. business. If this were to be the case, our results of operations could be materially adversely affected.
Changes in U.S. tax law could adversely affect us.
The tax treatment of non-U.S. companies and their U.S. and non-U.S. subsidiaries may be the subject of future legislation. We cannot predict the particulars of any proposed legislation, or whether such legislation would have any effect on us. Future legislation in the U.S. may arise in an effort to harmonize U.S. tax law with OECD Pillar Two initiatives. No assurance may be given that future legislative, administrative, or judicial developments will not produce an adverse U.S. tax consequence to us. If any such adverse developments do occur, our results of operations may be materially adversely affected.
Our non-U.K. companies may be subject to U.K. tax that may have an adverse effect on our results of operations.
We intend to operate in such a manner so that none of our non-U.K. companies are resident in the U.K. for tax purposes and that none of our non-U.K. resident companies, other than AXIS Specialty Europe and AXIS Specialty U.S. Services, Inc., have a permanent establishment in the U.K. Accordingly, we expect that none of our non-U.K. resident companies, other than AXIS Specialty Europe and AXIS Specialty U.S. Services, Inc., will be subject to U.K. tax. Nevertheless, because neither case law nor U.K. statutes conclusively define the activities that constitute trading in the U.K. through a permanent establishment, the U.K. tax authority might contend successfully that one or more of our non-U.K. companies, in addition to AXIS Specialty Europe and AXIS Specialty U.S. Services, Inc., is trading in the U.K. through a permanent establishment in the U.K. and therefore subject to U.K. tax.
In addition, there are circumstances in which companies that are neither resident in the U.K., nor entitled to the protection afforded by a double tax treaty between the U.K. and the jurisdiction in which they are resident, may be exposed to income tax in the U.K. (other than by deduction or withholding) on the profits of a trade carried on there even if that trade is not carried on through a permanent establishment. We intend to operate in such a manner that none of our companies will be subject to U.K. income tax in this respect.
If any of our non-U.K. resident companies were treated as being resident in the U.K. for U.K. corporation tax purposes, or if any of our non-U.K. companies, other than AXIS Specialty Europe or AXIS Specialty U.S. Services, Inc., were to be treated as carrying on a trade in the U.K., whether or not through a permanent establishment, our results of operations could be materially adversely affected.
The U.K. diverted profits tax ("DPT") is separate from U.K. corporation tax and is charged at a higher rate. It is an anti-avoidance measure aimed at protecting the U.K. tax base against the artificial diversion of profits that are being earned by activities carried out in the U.K. but which are not otherwise being taxed in the U.K., in particular as a result of arrangements between companies in the same multinational group. The U.K. network of double tax treaties does not offer protection from a DPT charge. In the event that the rules apply to certain arrangements, upfront payment of the U.K. tax authority’s estimate of the deemed tax liability may be required. If any of our non-U.K. companies is liable to DPT, our results could be materially adversely affected.
In accordance with the Model Rules on Pillar Two, the U.K. government has enacted legislation to implement a QDMTT which seeks to ensure that U.K. tax resident companies have an effective tax rate in excess of 15% (broadly, this is determined in line with effective tax rates under the Model Rules on Pillar Two). Therefore, if our U.K. tax resident companies have an effective tax rate of less than 15%, the QDMTT may adversely affect our results.
Changes in U.K. tax law could adversely affect us.
AXIS Specialty Europe, AXIS Specialty U.S. Services, Inc. and our U.K. resident companies are treated as taxable in the U.K. Future changes in the basis or rate of U.K. corporation tax could materially adversely affect the operations of these companies.
Our non-Irish companies may be subject to Irish tax that may have an adverse effect on our results of operations.
We intend to operate our non-Irish resident companies in such a manner so that none of our non-Irish resident companies are resident in Ireland for tax purposes and are not treated as carrying on a trade through a branch or agency in Ireland.
Accordingly, we expect that none of our non-Irish resident companies will be subject to Irish corporation tax. Nevertheless, since the determination as to whether a company is resident in Ireland is a question of fact to be determined based on a number of different factors and since neither case law nor Irish legislation conclusively defines the activities that constitute trading in Ireland through a branch or agency, the Irish Revenue Commissioners might contend successfully that one or more of our non-Irish companies is resident in or otherwise trading through a branch or agency in Ireland and therefore subject to Irish corporation tax. If this were the case, our results of operations could be materially adversely affected.
In accordance with the Model Rules on Pillar Two, the Irish government has enacted legislation to implement a QDMTT which seeks to ensure that Irish tax resident companies have an effective tax rate in excess of 15%. Therefore, if our Irish tax resident companies have an effective tax rate of less than 15%, the QDMTT may adversely affect our results.
Changes in Irish tax law could adversely affect us.
Trading income derived from the insurance and reinsurance business carried on in Ireland by AXIS Specialty Europe and AXIS Re SE is generally taxed in Ireland at a rate of 12.5%. Over the past number of years, various EU. member states have, from time to time, called for harmonization of the corporate tax base within the EU Ireland, along with other member states, has consistently resisted any movement towards standardized corporate tax rates or tax base in the EU The Government of Ireland has also made clear its commitment to retain the 12.5% rate of corporation tax. If, however, tax laws in Ireland change so as to increase the general corporation tax rate, our results of operations could be materially adversely affected. Irish profits would become subject to the 15% global minimum tax rate pursuant to the European Commission Directive discussed above.
If investments held by AXIS Specialty Europe SE or AXIS Re SE are determined not to be integral to the insurance and reinsurance business carried on by those companies, additional Irish tax could be imposed and our business and financial results could be adversely affected.
Based on administrative practice, taxable income derived from investments made by AXIS Specialty Europe and AXIS Re SE is generally taxed in Ireland at the rate of 12.5% on the grounds that such investments either form part of the permanent capital required by regulatory authorities or are otherwise integral to the insurance and reinsurance business carried on by those companies. AXIS Specialty Europe and AXIS Re SE intend to operate in such a manner so that the level of investments held by such companies does not exceed the amount that is integral to the insurance and reinsurance business carried on by AXIS Specialty Europe and AXIS Re SE. If, however, investment income earned by AXIS Specialty Europe or AXIS Re SE is deemed to be non-trading income, Irish corporation tax could apply to such investment income at a rate higher than the general 12.5% rate, and our results of operations could be materially adversely affected.
Changes in tax laws resulting from the proposals included in the European Commission’s draft third Anti-Tax Avoidance Directive ("ATAD III") could materially adversely affect us.
The EU has sought to harmonize the response of member states to the BEPS reports via the Anti-Tax Avoidance Directives ("the ATAD and the ATAD II"). The ATAD and the ATAD II require all EU member states to apply certain specified anti-avoidance measures, including a controlled foreign companies regime, limitations on interest deduction and anti-hybrid rules. On December 22, 2021, the European Commission proposed and issued a draft third directive (ATAD III) which aims to combat the abuse of investment structures that do not carry out actual economic activities, specifically "shell companies". ATAD III proposes to introduce a minimum substance test and reporting requirements for multinational groups to identify "shell companies". However, ATAD III must be unanimously agreed between EU Member States and remains subject to negotiation and opposition by certain EU Member States. Changes to tax laws and additional reporting requirements could increase the tax burden and the complexity and cost of tax compliance.
Our operations may be adversely affected by a transfer pricing adjustment in computing taxable profits.
Any affiliated arrangements between contracting parties established in different jurisdictions are subject to transfer pricing regimes. Consequently, if any arrangement (including any reinsurance or financing arrangements) is found not to be on arm’s length terms, an adjustment will be required to compute taxable profits as if the arrangement were on arm’s length terms. Any transfer pricing adjustment could materially adversely impact the tax charge suffered by the relevant tax-paying company.
Effective January 1, 2016, Bermuda implemented country by country reporting ("CBCR") whereby multinational groups are required to report details of their operations and intra-group transactions in each jurisdiction. It is possible that our approach to transfer pricing may become subject to greater scrutiny from the tax authorities in the jurisdictions in which we operate, which may lead to transfer pricing audits in the future.
General Risk Factors
Future changes in current accounting practices may adversely impact our reported financial results.
Future changes in accounting practices may result in significant additional expenses and may affect the calculation of financial statement line items. For example, this could occur if we are required to prepare information relating to prior periods or if we are required to apply new requirements retroactively.
ITEM 1B. UNRESOLVED STAFF COMMENTS At December 31, 2024, we had no outstanding, unresolved comments from the SEC staff.
Risk Management and Strategy
The Company’s information risk management program is designed to protect the confidentiality of nonpublic, sensitive information and the integrity and availability of our information systems. The program includes policies and procedures that identify how security measures and controls are developed, implemented, and maintained. We have designed our enterprise-wide information security program consistent with industry standards using the National Institute of Standards and Technology Cybersecurity Framework (NIST CSF) as a guide to help us identify, assess, and manage cybersecurity risks relevant to our business. Risk assessment, risk-based analysis, and judgment are used to select security controls to address risks. Information about cybersecurity risks and our risk management processes is collected, analyzed and considered as part of our overall enterprise risk management program.
Key components of our cybersecurity risk management program include:
•risk assessments designed to help identify cybersecurity risks to our critical systems, information, and services.
•a security team principally responsible for managing (1) our cybersecurity policies & risk assessment processes, (2) security architecture and engineering, (3) identifying vulnerabilities, managing remediation, and testing of our security controls, and (4) our cybersecurity monitoring & incident response.
•the use of external service providers, where appropriate, to assess, test or otherwise assist with aspects of our security processes.
•managing a cybersecurity awareness and training program that covers employees and contractors who access internal systems.
•a cybersecurity incident response plan that includes procedures for responding to various types of cybersecurity incidents and tested through periodic tabletop exercises.
•a third-party security risk assessment team, which is involved with identifying, assessing, and controlling risks that occur due to interactions with third parties including vendors and procurement.
•restricted physical access to critical areas, servers, and network equipment.
•support of our business continuity and disaster response plans.
Impact of Material Risk
To date, no cybersecurity incidents have materially impacted the Company, including the Company's business strategy, results of operations, or financial conditions. However, financial institutions face risks from threat actors that focus on attacks of critical information systems infrastructure assets, disruption to operations, and ransomware groups that steal data, encrypt systems, and demand a payment. The Company relies on third-party software, third-party hardware, and third-party vendors to manage critical aspects of our operations which may be at risk of cybersecurity threats. As described above, we utilize a risk-based approach and judgment to determine the security controls to implement, and it is possible we may not implement appropriate controls if we do not recognize or underestimate a particular risk. In addition, security controls, no matter how well designed or implemented, may only mitigate and not fully eliminate risks and events, and when detected by security tools or third parties, may not always be immediately understood or acted upon. Although the Company has implemented cybersecurity policies, procedures and controls intended to mitigate these risks and the likelihood of these risks occurring may not be high, if these risks are realized the impact could be material, such as in the event of a material cybersecurity incident.
Additionally, in Item 1A, 'Risk Factors' we discuss forward-looking cybersecurity risks that could have a material impact on us. Our disclosures in Item 1A should be read in conjunction with this Item 1C.
Management & Board Governance
With over 30 years of industry cybersecurity experience, the Company’s Chief Information Security Officer ("CISO") is the member of the Company’s management team with primary responsibility for the development, operation, and maintenance of the Company’s information security program. The CISO supervises the Company’s cybersecurity team, facilitates the incident response plan and acts as the liaison to the Company’s executive management team, including relaying strategies, resource requests and incident updates. The Company’s security event monitoring and detection capabilities are performed by our Cybersecurity team and third parties through the use of processes and tooling. Cybersecurity incidents are responded to by a multi-disciplinary Incident Response team and if appropriate, escalated to our Cybersecurity Disclosure Subcommittee, Executive Management, and the Board. The level of escalation will vary depending on the severity and scope of the cyber incident. In the event of a severe cyber incident, the CISO will escalate to the relevant subcommittee to determine the course of action. All relevant roles are trained on their responsibilities regularly. The Board, along with the Risk and Audit Committees of the Board, oversees our information security program. In 2024, our Board and Risk and Audit Committees received periodic updates throughout the year on cybersecurity matters, and these updates are part of their standing agendas. These updates include reports regarding items such as cybersecurity strategies, program effectiveness, key risks and performance metrics related to the Company’s information security program and the Company’s mitigating controls.
The Company has an enterprise risk management function that oversees the identification, prioritization, and mitigation of the Company’s enterprise risks, and cybersecurity is a risk category addressed by that function. The Company uses governance, risk and compliance tools to assess, identify and manage its cybersecurity risks.
ITEM 2. PROPERTIES
We maintain leased office facilities in Bermuda, the U.S., Europe, Singapore, and Canada. We renew and enter into leases in the ordinary course of business as required. Our global headquarters is located at AXIS House, 92 Pitts Bay Road, Pembroke HM 08, Bermuda. We believe that our office space is sufficient for us to conduct our operations for the foreseeable future.
ITEM 3. LEGAL PROCEEDINGS From time to time, we are subject to routine legal proceedings, including arbitrations, arising in the ordinary course of business. These legal proceedings generally relate to claims asserted by or against us in the ordinary course of its insurance or reinsurance operations. Estimated amounts payable related to these proceedings are included in reserve for losses and loss expenses in our consolidated balance sheets.
We are not party to any material legal proceedings arising outside the ordinary course of business.
ITEM 4. MINE SAFETY DISCLOSURES Not Applicable.
PART II
ITEM 5. MARKET FOR REGISTRANT’S COMMON EQUITY, RELATED STOCKHOLDER MATTERS AND ISSUER PURCHASES OF EQUITY SECURITIES
Our common shares are listed on the New York Stock Exchange under the symbol "AXS".
On February 21, 2025, the number of holders of record of our common shares was 17. This figure does not represent the actual number of beneficial owners of our common shares because shares are frequently held in "street name" by securities dealers and others for the benefit of beneficial owners who may vote the shares.
We have a history of paying quarterly cash dividends. While we expect to continue paying comparable cash dividends in the foreseeable future, the declaration and payment of future dividends is at the discretion of our Board of Directors and will depend on many factors including, but not limited to, our net income, financial condition, business needs, capital and surplus requirements of our operating subsidiaries and regulatory and contractual restrictions, including those detailed in our credit facilities. Refer to Item 7 'Management’s Discussion and Analysis of Financial Condition and Results of Operations – Liquidity and Capital Resources' for further details.
Issuer Purchases of Equity Securities
Common Shares
The following table shows information regarding the number of common shares repurchased in the quarter ended December 31, 2024:
| | | | | | | | | | | | | | |
| Period | Total number of shares purchased(a) (b) | Average
price paid
per share | Total number of shares purchased as part of publicly announced programs(a) | Maximum number (or approximate dollar value) of shares that may yet be purchased under the programs(c) (d) |
| October 1-31, 2024 | 4 | | $79.72 | | — | | $260 million |
| November 1-30, 2024 | 418 | | $85.45 | | 413 | | $225 million |
| December 1-31, 2024 | 271 | | $92.45 | | 268 | | $200 million |
| Total | 693 | | | 681 | | $200 million |
(a)In thousands.
(b)Includes shares repurchased from employees to satisfy personal withholding tax liabilities that arise on the vesting of share-settled restricted stock units under our 2017 Long-Term Equity Compensation Plans.
(c)At June 30, 2024, authorization under the Company's share repurchase program approved in December 2023 was exhausted.
(d)On May 16, 2024, the Company's Board of Directors approved a new share repurchase program for up to $300 million of common shares. The new share repurchase program is open-ended, allowing us to repurchase its shares from time to time in the open market or privately negotiated transactions, depending on market conditions.
Performance Graph
Set forth below is a line graph comparing the dollar change in the cumulative total shareholder return on the Company's Common Shares from December 31, 2019, through December 31, 2024, as compared to the cumulative total return of the Standard & Poor's 500 Stock Index and the cumulative total return of the Standard & Poor's Property-Casualty Insurance Index. The cumulative total shareholder return is a concept used to compare the performance of a company's stock over time and is the ratio of the stock price change plus the cumulative amount of dividends over the specified time period (assuming dividend reinvestment), to the stock price at the beginning of the time period. The chart depicts the value on December 31, 2020, 2021, 2022, 2023, and 2024 of a $100 investment made on December 31, 2019, with all dividends reinvested.
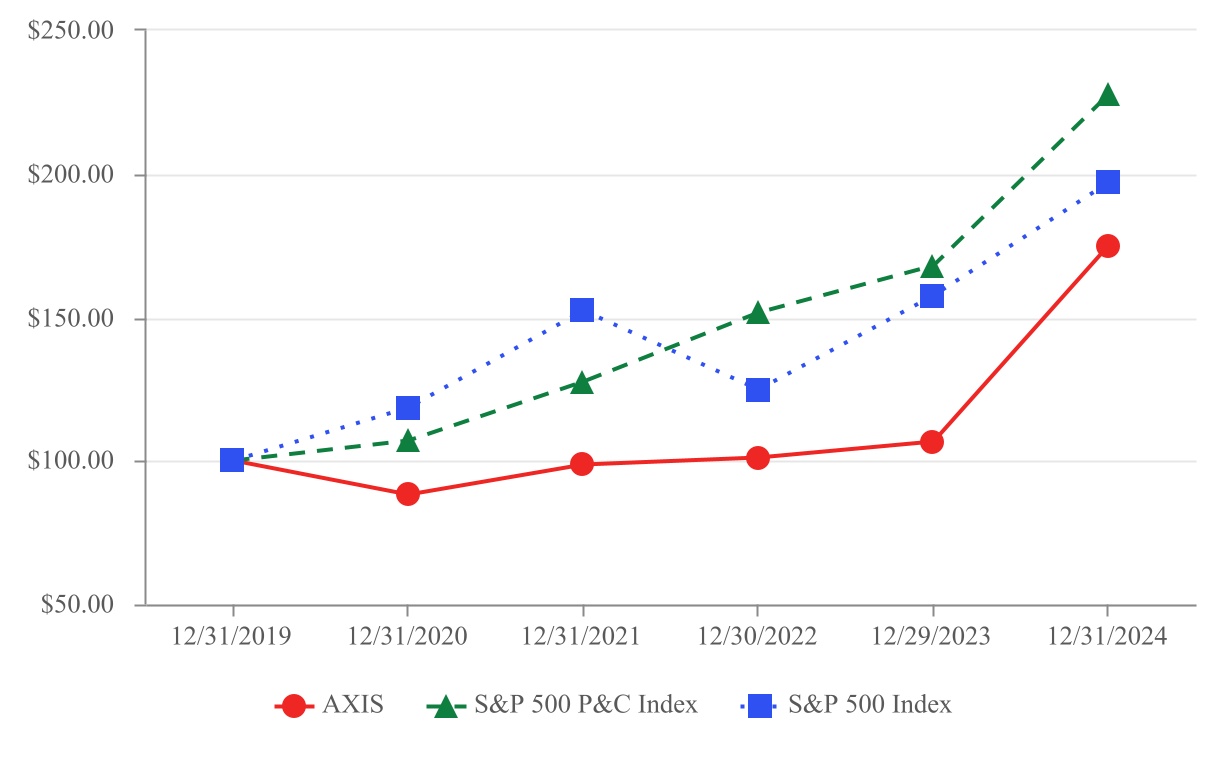
| | | | | | | | | | | | | | | | | | | | |
| 12/31/2019 | 12/31/2020 | 12/31/2021 | 12/30/2022 | 12/29/2023 | 12/31/2024 |
| AXIS Capital Holdings Limited | $100.00 | $88.10 | $98.50 | $101.10 | $106.70 | $174.90 |
| S&P 500 P&C Index | $100.00 | $106.96 | $127.58 | $151.65 | $168.05 | $227.67 |
| S&P 500 Index | $100.00 | $118.40 | $152.39 | $124.79 | $157.59 | $197.02 |
ITEM 6. [RESERVED]
ITEM 7. MANAGEMENT’S DISCUSSION AND ANALYSIS OF FINANCIAL CONDITION AND RESULTS OF OPERATIONS
The following is a discussion and analysis of our results of operations for the years ended December 31, 2024 and 2023, and our financial condition at December 31, 2024 and 2023. This should be read in conjunction with Item 8 'Financial Statements and Supplementary Data' of this report. Unless otherwise noted, tabular dollars are in thousands, except per share amounts. Amounts may not reconcile due to rounding differences.
| | | | | |
| | Page |
| |
| 2024 Financial Highlights | |
| |
| Overview | |
| |
| Consolidated Results of Operations | |
| |
| Results by Segment: | |
| |
| i) Insurance Segment | |
| |
| ii) Reinsurance Segment | |
| |
| Net Investment Income and Net Investment Gains (Losses) | |
| |
| Other Expenses (Revenues), Net | |
| |
| Financial Measures | |
| |
| Non-GAAP Financial Measures Reconciliation | |
| |
| Cash and Investments | |
| |
| Liquidity and Capital Resources | |
| |
| Critical Accounting Estimates | |
| |
| i) Reserve for Losses and Loss Expenses | |
| |
| ii) Reinsurance Recoverable on Unpaid Losses and Loss Expenses | |
| |
| iii) Gross Premiums Written | |
| |
| iv) Net Premiums Earned | |
| |
| v) Fair Value Measurements of Financial Assets and Liabilities | |
| |
| vi) Impairment Losses and the Allowance for Expected Credit Losses - Fixed Maturities, Available for Sale | |
| |
| Recent Accounting Pronouncements | |
| |
| |
2024 FINANCIAL HIGHLIGHTS
2024 Consolidated Results of Operations
•Net income available to common shareholders of $1.1 billion, or $12.49 per common share, and $12.35 per diluted common share
•Operating income(1) of $952 million, or $11.18 per diluted common share(1)
•Gross premiums written of $9.0 billion
•Net premiums written of $5.8 billion
•Net premiums earned of $5.3 billion
•Pre-tax catastrophe and weather-related losses, net of reinsurance, of $226 million ($182 million, after-tax), (Insurance: $216 million; Reinsurance: $10 million), or 4.3 points including $111 million or 2.1 points attributable to Hurricanes Milton, Helene and Beryl, together with $13 million, or 0.3 points attributable to the Red Sea Conflict.
•Net favorable prior year reserve development of $24 million
•Underwriting income(2) of $571 million and combined ratio of 92.3%
•Net investment income of $759 million
•Net investment losses of $139 million
•Foreign exchange gains of $51 million
•Reorganization expenses of $26 million
•Income tax benefit of $56 million, inclusive of a net deferred tax benefit of $177 million attributable to Bermuda's Corporate Income Tax Act 2023. Refer to 'Management's Discussion and Analysis of Financial Condition and Results of Operations – Overview – Recent Developments – Bermuda Corporate Income Tax Act 2023 for further details.
2024 Consolidated Financial Condition
•Total cash and investments of $18.0 billion; fixed maturities, short-term investments, and cash and cash equivalents comprise 88% of total cash and investments and have an average credit rating of AA-
•Total assets of $32.5 billion
•Reserve for losses and loss expenses of $17.2 billion and reinsurance recoverable on unpaid and paid losses and loss expenses of $7.4 billion.
•Debt of $1.3 billion and a debt to total capital ratio(3) of 17.8%
•Total common shares repurchased were 3.1 million shares for a total of $216 million, including $200 million repurchased pursuant to our Board-authorized share repurchase program, and $16 million from employees to facilitate the satisfaction of their personal withholding tax liabilities that arise on vesting of share-settled restricted stock units
•Common shareholders’ equity of $5.5 billion; book value per diluted common share of $65.27
(1) Operating income (loss) and operating income (loss) per diluted common share are non-GAAP financial measures as defined in Item 10(e) of SEC Regulation S-K. The reconciliations to the most comparable GAAP financial measures, net income (loss) available (attributable) to common shareholders and earnings (loss) per diluted common share, respectively, and a discussion of the rationale for the presentation of these items are provided in 'Management's Discussion and Analysis of Financial Condition and Results of Operations – Non-GAAP Financial Measures Reconciliation'.
(2)Consolidated underwriting income (loss) is a non-GAAP financial measure as defined in Item 10(e) of SEC Regulation S-K. The reconciliation to the most comparable GAAP financial measure, net income (loss), is presented in 'Management's Discussion and Analysis of Financial Condition and Results of Operations – Consolidated Results of Operations', and a discussion of the rationale for its presentation is provided in 'Management’s Discussion and Analysis of Financial Condition and Results of Operations – Non-GAAP Financial Measures Reconciliation'.
(3)The debt to total capital ratio is calculated by dividing debt by total capital. Total capital represents the sum of total shareholders’ equity and debt.
OVERVIEW
Business Overview
AXIS Capital, through its operating subsidiaries, is a global specialty underwriter and provider of insurance and reinsurance solutions with operations in Bermuda, the U.S., Europe, Singapore and Canada. Our underwriting operations are organized around our global underwriting platforms, AXIS Insurance and AXIS Re.
We provide our clients and distribution partners with a broad range of risk transfer products and services, and strong capacity, backed by excellent financial strength. We manage our portfolio holistically, aiming to construct the optimum portfolio of risks, consistent with our risk appetite and the development of our franchise. We nurture an ethical, entrepreneurial, disciplined and diverse culture that promotes outstanding client service, intelligent risk taking, operating efficiency, corporate citizenship and the achievement of superior risk-adjusted returns for our shareholders. We believe that the achievement of our objectives will position us as a global specialty underwriting leader. The execution of our business strategy in 2024 included the following:
•growing in a number of attractive specialty lines insurance and treaty reinsurance markets including U.S. excess and surplus lines and Lloyd's specialty insurance business;
•re-balancing our portfolio towards less volatile lines of business, that carry attractive returns while deploying capital within risk limit tolerance, diversification criteria and risk management strategy;
•investing in attractive growth markets and advancing capabilities to address more transactional specialist business targeting the lower middle market with our key distribution partners;
•leveraging our global platform to introduce our products and services to new regions including the continued expansion of our North America product capabilities;
•continuing the implementation of a more focused distribution strategy while building mutually beneficial relationships with clients and partners;
•improving the effectiveness and efficiency of our operating platforms and processes through our "How We Work" program;
•investing in data and technology, and exploring AI capabilities and tools, to empower our underwriters and enhance the service that we provide to our customers;
•utilizing reinsurance markets and third-party capital relationships;
•fostering a positive workplace environment that enables us to attract, retain and develop top talent; and
•growing our corporate citizenship program to support our communities and help contribute to a more sustainable future.
Outlook
We are executing on our commitment to advance AXIS as a specialty underwriting leader that delivers consistent, profitable growth. Our market positioning, diversified book of business, specialty underwriting acumen, global platform, claims management capabilities, and deep distribution relationships, supported by a conservative and well performing investment portfolio, provide the foundation for additional profitable growth in select specialty markets.
The overall outlook for the property and casualty market continues to be largely favorable for specialty insurance and reinsurance carriers. Looking at the trends impacting our business:
•Following multiple years of rate increases outpacing loss cost trends across the specialty sector, pricing is now more moderate, with the exception of casualty lines, due to the emergence of new capital in areas where the market has performed particularly well. We will continue to lean into sectors, and sub sectors, where premium adequacy metrics remain strong and where we see market dislocations creating opportunity for profitable growth.
•The wholesale channel continues to experience submission growth due to continued dislocations in the standard lines markets. This dynamic enables specialty carriers to target growth opportunities with a disciplined underwriting appetite and strategy.
•Pricing momentum in non-proportional reinsurance continues while our proportional reinsurance business is benefiting from rate increases in the underlying business. While we expect these market conditions to persist, we are seeing nuances by line of business with motor and marine lines under the most pressure. We continue to focus on underwriting discipline and targeted profitable growth.
Across the business, we will continue to pursue attractive opportunities by employing a focused underwriting strategy and selective appetite. Where price continues to deliver adequate profitability, we will look to grow within our risk and volatility guidelines. With a strengthened book of business, and an expanding footprint in attractive specialty markets, we believe AXIS remains positioned to drive profitable growth in 2025 and beyond.
Recent Developments
Share Repurchase program
On February 6, 2025, authorization under the Company's share repurchase program approved in May 2024 (refer to Item 8, Note 15 to the Consolidated Financial Statements 'Shareholders' Equity') was exhausted.
On February 19, 2025, the Company's Board of Directors approved a new share repurchase program for up to $400 million of the Company's common shares. The new share repurchase program is open-ended, allowing the Company to repurchase its shares from time to time in the open market or privately negotiated transactions, depending on market conditions.
Loss Portfolio Transfer Reinsurance Agreement with Enstar
On December 13, 2024, we entered into a loss portfolio transfer reinsurance agreement with Cavello Bay Reinsurance Limited, a wholly-owned subsidiary of Enstar Group Limited ("Enstar") to retrocede a portfolio of reinsurance business predominantly related to 2021 and prior underwriting years (refer to Item 8, Note 18 to the Consolidated Financial Statements 'Related Party Transactions' for further details). The transaction is subject to regulatory approvals and other customary conditions and is expected to close during the first half of 2025.
The transaction is structured as a 75% ground-up quota share retrocession of net reserves for losses and loss expenses of approximately $3.1 billion at September 30, 2024 and provides cover up to a policy limit of approximately $940 million. The transaction is deemed to have met the established criteria for retroactive reinsurance accounting (refer to Item 8, Note 9 to the Consolidated Financial Statements 'Reinsurance' for further details).
Under the terms of the loss portfolio transfer reinsurance agreement, we will retain responsibility for the management of claims.
Although retroactive reinsurance accounting may result in volatility to our results in the short-term, the loss portfolio transfer reinsurance agreement will protect us from prior year reserve development on the subject business over the contract term, provided this remains within the limit of the agreements.
AXIS Syndicate 2050
On April 1, 2024, AXIS Energy Transition Syndicate 2050 ("Syndicate 2050") which is dedicated to providing capacity for new energy projects with a critical role in supporting the transition to net zero, commenced underwriting. AXIS Corporate Capital UK II Limited is the sole corporate member of Syndicate 2050. AXIS Managing Agency operates as managing agent for Syndicate 2050.
How We Work Program
Reorganization expenses of $26 million incurred in 2024 primarily related to severance costs attributable to our "How We Work" program which is focused on simplifying our operating structure.
Bermuda Corporate Income Tax Act of 2023
On December 27, 2023, the Bermuda government enacted the Corporate Income Tax Act 2023 (the "Act") which will apply a corporate income tax of 15% for fiscal years beginning on or after January 1, 2025. The Act includes a provision referred to as the economic transition adjustment ("Bermuda ETA"), which is intended to provide a fair and equitable transition into the tax regime. Pursuant to the Act and subsequently issued guidance, we recorded a net deferred tax asset of $177 million during the year ended December 31, 2024. Initially, we expected to utilize mainly over a ten-year period. We expect to incur increased taxes in Bermuda beginning in 2025. The Bermuda net deferred tax benefit is excluded from operating income (loss).
Organization for Economic Cooperation and Development ("OECD") Update
On January 15, 2025, the OECD issued guidelines that limit the use of the Bermuda ETA and similar assets in other jurisdictions in which we operate under GLoBE rules. The guidelines clarify the use of deferred tax assets under transition rules and limits the benefit of deferred tax assets relating to transactions that occurred after November 30, 2021. The guidelines seek to restrict the benefit of the Bermuda ETA to 20% of the balance at January 1, 2025 to be utilized in 2025 and 2026, thereafter GLoBE rules will ensure the balance of the asset is subject to the global minimum tax of 15%.
CONSOLIDATED RESULTS OF OPERATIONS
| | | | | | | | | | | | | | | | | | | | | | | | | | | | | | | | | | | | | | | |
| | | | | | | | | | | | | |
| Year ended December 31, | | 2024 | | % Change | | 2023 | | % Change | | 2022 | | |
| | | | | | | | | | | | | |
| Underwriting revenues: | | | | | | | | | | | | |
| Gross premiums written | | $ | 9,005,888 | | | 8% | | $ | 8,356,525 | | | 2% | | $ | 8,214,595 | | | |
| Net premiums written | | 5,757,351 | | | 13% | | 5,102,325 | | | (3%) | | 5,263,056 | | | |
| Net premiums earned | | 5,306,235 | | | 4% | | 5,083,781 | | | (1%) | | 5,160,326 | | | |
| Other insurance related income | | 30,721 | | | 37% | | 22,495 | | | 72% | | 13,073 | | | |
| Underwriting expenses: | | | | | | | | | | | | |
| Net losses and loss expenses | | (3,158,487) | | | (7%) | | (3,393,102) | | | 5% | | (3,242,410) | | | |
| Acquisition costs | | (1,070,551) | | | 7% | | (1,000,945) | | | (2%) | | (1,022,017) | | | |
| Underwriting-related general and administrative expenses(1) | | (536,442) | | | (3%) | | (551,467) | | | —% | | (550,289) | | | |
| Underwriting income(2) | | 571,476 | | | | | 160,762 | | | | | 358,683 | | | |
| | | | | | | | | | | | | |
| Net investment income | | 759,229 | | | 24% | | 611,742 | | | 46% | | 418,829 | | | |
| Net investment gains (losses) | | (138,534) | | | 86% | | (74,630) | | | (84%) | | (456,789) | | | |
| Corporate expenses(1) | | (129,760) | | | (2%) | | (132,979) | | | 2% | | (130,054) | | | |
| Foreign exchange (losses) gains | | 50,822 | | | nm | | (58,115) | | | nm | | 157,945 | | | |
| Interest expense and financing costs | | (67,766) | | | (1%) | | (68,421) | | | 8% | | (63,146) | | | |
| Reorganization expenses | | (26,312) | | | (9%) | | (28,997) | | | (8%) | | (31,426) | | | |
| | | | | | | | | | | | | |
| Amortization of intangible assets | | (10,917) | | | —% | | (10,917) | | | —% | | (10,917) | | | |
| Income before income taxes and interest in income of equity method investments | | 1,008,238 | | | | | 398,445 | | | | | 243,125 | | | |
| Income tax (expense) benefit | | 55,595 | | | nm | | (26,316) | | | 19% | | (22,037) | | | |
| Interest in income of equity method investments | | 17,953 | | | nm | | 4,163 | | | nm | | 1,995 | | | |
| Net income | | 1,081,786 | | | | | 376,292 | | | | | 223,083 | | | |
| Preferred share dividends | | (30,250) | | | —% | | (30,250) | | | —% | | (30,250) | | | |
| | | | | | | | | | | | | |
| Net income available to common shareholders | | $ | 1,051,536 | | | | | $ | 346,042 | | | | | $ | 192,833 | | | |
| | | | | | | | | | | | | |
| | | | | | | | | | | | | |
nm – not meaningful is defined as a variance greater than +/-100%
(1)Underwriting-related general and administrative expenses is a non-GAAP financial measure as defined in Item 10(e) of SEC Regulation S-K. The reconciliation to general and administrative expenses, the most comparable GAAP financial measure, also included corporate expenses of $130 million, $133 million, and $130 million for 2024, 2023, and 2022, respectively. Refer to 'Management’s Discussion and Analysis of Financial Condition and Results of Operations – Other Expenses (Revenues), Net' for further details on corporate expenses. Refer also to 'Management’s Discussion and Analysis of Financial Condition and Results of Operations – Non-GAAP Financial Measures Reconciliation' for further details.
(2)Consolidated underwriting income (loss) is a non-GAAP financial measure as defined in Item 10(e) of SEC Regulation S-K. The reconciliation to net income (loss), the most comparable GAAP financial measure, is presented in the table above. Refer also to 'Management’s Discussion and Analysis of Financial Condition and Results of Operations – Non-GAAP Financial Measures Reconciliation' for further details.
Underwriting Revenues
Underwriting revenues by segment were as follows: | | | | | | | | | | | | | | | | | | | | | | | | | | | | | | | | | | | |
| | | | | | | | | | | |
| Year ended December 31, | 2024 | | % Change | | 2023 | | % Change | | 2022 | |
| | | | | | | | | | | |
| Gross premiums written: | | | | | | | | | | |
| Insurance | $ | 6,615,584 | | 8% | | $ | 6,140,764 | | 10% | | $ | 5,585,581 | |
| Reinsurance | 2,390,304 | | 8% | | 2,215,761 | | (16%) | | 2,629,014 | |
| Total gross premiums written | $ | 9,005,888 | | 8% | | $ | 8,356,525 | | 2% | | $ | 8,214,595 | |
| | | | | | | | | | | |
| Percent of gross premiums written ceded: | | | | | | | | | | |
| Insurance | 36 | % | | (3 pts) | | 39 | % | | (1 pt) | | 40 | % | |
| Reinsurance | 37 | % | | (2 pts) | | 39 | % | | 11 pts | | 28 | % | |
| Total percent of gross premiums written ceded | 36 | % | | (3 pts) | | 39 | % | | 3 pts | | 36 | % | |
| | | | | | | | | | | |
| Net premiums written: | | | | | | | | | | |
| Insurance | $ | 4,250,545 | | 13% | | $ | 3,758,720 | | 11% | | $ | 3,377,906 | |
| Reinsurance | 1,506,806 | | 12% | | 1,343,605 | | (29%) | | 1,885,150 | |
| Total net premiums written | $ | 5,757,351 | | 13% | | $ | 5,102,325 | | (3%) | | $ | 5,263,056 | |
| | | | | | | | | | | |
| Net premiums earned: | | | | | | | | | | |
| Insurance | $ | 3,926,036 | | 13% | | $ | 3,461,700 | | 10% | | $ | 3,134,155 | |
| Reinsurance | 1,380,199 | | (15%) | | 1,622,081 | | (20%) | | 2,026,171 | |
| Total net premiums earned | $ | 5,306,235 | | 4% | | $ | 5,083,781 | | (1%) | | $ | 5,160,326 | |
| | | | | | | | | | | |
Refer to 'Management's Discussion and Analysis of Financial Condition and Results of Operations – Results by Segment' for further details on underwriting revenues.
Combined Ratio
The components of the combined ratio were as follows: | | | | | | | | | | | | | | | | | | | | | | | | | | | | | | | | | | | |
| | | | | | | | | | | |
| Year ended December 31, | 2024 | | % Point
Change | | 2023 | | % Point
Change | | 2022 | |
| | | | | | | | | | | |
| Current accident year loss ratio, excluding catastrophe and weather-related losses (1) | 55.7 | % | | (0.2) | | | 55.9 | % | | 0.4 | | | 55.5 | % | |
| Catastrophe and weather-related losses ratio(1) | 4.3 | % | | 1.6 | | | 2.7 | % | | (5.1) | | | 7.8 | % | |
| Current accident year loss ratio(1) | 60.0 | % | | 1.4 | | | 58.6 | % | | (4.7) | | | 63.3 | % | |
| Prior year reserve development ratio | (0.5 | %) | | (8.6) | | | 8.1 | % | | 8.6 | | | (0.5 | %) | |
| Net losses and loss expenses ratio | 59.5 | % | | (7.2) | | | 66.7 | % | | 3.9 | | | 62.8 | % | |
| Acquisition cost ratio | 20.2 | % | | 0.5 | | | 19.7 | % | | (0.1) | | | 19.8 | % | |
| General and administrative expense ratio(2) | 12.6 | % | | (0.9) | | | 13.5 | % | | 0.3 | | | 13.2 | % | |
| Combined ratio | 92.3 | % | | (7.6) | | | 99.9 | % | | 4.1 | | | 95.8 | % | |
| | | | | | | | | | | |
(1)Current accident year loss ratio, catastrophe and weather-related losses ratio and current accident year loss ratio, excluding catastrophe and weather-related losses are non-GAAP financial measures as defined in Item 10(e) of SEC Regulation S-K. The reconciliations to the most comparable GAAP financial measure, net losses and loss expenses ratio is provided above and a discussion of the rationale for the presentation of these items are provided in 'Management’s Discussion and Analysis of Financial Condition and Results of Operations – Non-GAAP Financial Measures Reconciliation'.
(2)The general and administration expense ratio included corporate expenses not allocated to underwriting segments of 2.4%, 2.6% and 2.5% for 2024, 2023 and 2022, respectively. Refer to 'Management’s Discussion and Analysis of Financial Condition and Results of Operations – Other Expenses (Revenues), Net' for further details.
Refer to 'Management's Discussion and Analysis of Financial Condition and Results of Operations – Results by Segment' for further details on underwriting expenses.
RESULTS BY SEGMENT
Insurance Segment
Results for the insurance segment were as follows: | | | | | | | | | | | | | | | | | | | | | | | | | | | | | | | | | | | |
| | | | | | | | | | | |
| Year ended December 31, | 2024 | | % Change | | 2023 | | % Change | | 2022 | |
| | | | | | | | | | | |
| Revenues: | | | | | | | | | | |
| Gross premiums written | $ | 6,615,584 | | | 8% | | $ | 6,140,764 | | | 10% | | $ | 5,585,581 | | |
| Net premiums written | 4,250,545 | | | 13% | | 3,758,720 | | | 11% | | 3,377,906 | | |
| Net premiums earned | 3,926,036 | | | 13% | | 3,461,700 | | | 10% | | 3,134,155 | | |
| Other insurance related income (loss) | 94 | | | nm | | (198) | | | nm | | 559 | | |
| | | | | | | | | | | |
| Expenses: | | | | | | | | | | |
| Current accident year net losses and loss expenses | (2,261,629) | | | | | (1,903,648) | | | | | (1,802,204) | | |
| Prior year reserve development | 16,209 | | | | | (176,353) | | | | | 16,350 | | |
| Acquisition costs | (766,915) | | | | | (648,463) | | | | | (577,838) | | |
| Underwriting-related general and administrative expenses | (485,929) | | | | | (472,094) | | | | | (443,704) | | |
| | | | | | | | | | | |
| Underwriting income | $ | 427,866 | | | | | $ | 260,944 | | | | | $ | 327,318 | | |
| | | | | | | | | | | |
| Ratios: | | | % Point
Change | | | | % Point
Change | | | |
| Current accident year loss ratio, excluding catastrophe and weather-related losses | 52.1 | % | | 0.3 | | 51.8 | % | | 0.8 | | 51.0 | % | |
| Catastrophe and weather-related losses ratio | 5.5 | % | | 2.3 | | 3.2 | % | | (3.3) | | 6.5 | % | |
| Current accident year loss ratio | 57.6 | % | | 2.6 | | 55.0 | % | | (2.5) | | 57.5 | % | |
| Prior year reserve development ratio | (0.4 | %) | | (5.5) | | 5.1 | % | | 5.6 | | (0.5 | %) | |
| Net losses and loss expenses ratio | 57.2 | % | | (2.9) | | 60.1 | % | | 3.1 | | 57.0 | % | |
| Acquisition cost ratio | 19.5 | % | | 0.8 | | 18.7 | % | | 0.3 | | 18.4 | % | |
| Underwriting-related general and administrative expense ratio | 12.4 | % | | (1.3) | | 13.7 | % | | (0.5) | | 14.2 | % | |
| Combined ratio | 89.1 | % | | (3.4) | | 92.5 | % | | 2.9 | | 89.6 | % | |
| | | | | | | | | | | |
nm – not meaningful
Gross Premiums Written
Gross premiums written by line of business were as follows: | | | | | | | | | | | | | | | | | | | | | | | | | | | | | | | | | | | | | | | | | | | | | | | | | | | | | |
| | | | | | | | | | | | | | | | | |
| | | | | | | | % Change | |
| Year ended December 31, | 2024 | | 2023 | | 2022 | | 2023 to 2024 | | 2022 to 2023 | |
| | | | | | | | | | | | | | | | | |
| Professional lines | $ | 1,162,323 | | | 18 | % | | $ | 1,140,695 | | | 19 | % | | $ | 1,322,966 | | | 24 | % | | 2 | % | | (14 | %) | |
| Property | 2,050,329 | | | 31 | % | | 1,736,586 | | | 28 | % | | 1,357,489 | | | 24 | % | | 18 | % | | 28 | % | |
| Liability | 1,251,603 | | | 19 | % | | 1,256,951 | | | 20 | % | | 1,138,645 | | | 20 | % | | — | % | | 10 | % | |
| Cyber | 561,937 | | | 8 | % | | 649,160 | | | 11 | % | | 644,746 | | | 12 | % | | (13 | %) | | 1 | % | |
| Marine and aviation | 815,168 | | | 12 | % | | 771,162 | | | 13 | % | | 652,687 | | | 12 | % | | 6 | % | | 18 | % | |
| Accident and health | 450,810 | | | 7 | % | | 333,559 | | | 5 | % | | 258,399 | | | 5 | % | | 35 | % | | 29 | % | |
| Credit and political risk | 323,414 | | | 5 | % | | 252,651 | | | 4 | % | | 210,649 | | | 3 | % | | 28 | % | | 20 | % | |
| Total | $ | 6,615,584 | | | 100 | % | | $ | 6,140,764 | | | 100 | % | | $ | 5,585,581 | | | 100 | % | | 8 | % | | 10 | % | |
| | | | | | | | | | | | | | | | | |
Gross premiums written in 2024 increased by $475 million, or 8% ($457 million, or 7%, on a constant currency basis(1)), compared to 2023. The increase was primarily attributable to property, accident and health, credit and political risk, marine and aviation, and professional lines, partially offset by decreases in cyber and liability lines.
The increase in property lines was due to new business, a higher level of premiums and increased rate associated with renewed business and increased lines sizes on several programs.
The increase in accident and health lines was primarily driven by new pet insurance business, a higher level of premiums and increased rate associated with renewed pet insurance business and premium adjustments related to several contracts at Lloyds, partially offset by non-renewals.
The increase in credit and political risk lines was attributable to new surety program business and new credit business at Lloyds, partially offset by non-renewals associated with the exit from Singapore in January 2024 and non-renewals of political risk business at Lloyds.
The increase in marine and aviation lines was related to new marine liability business, premium adjustments principally associated with marine war business written on a line slip basis, new business and the timing of renewals of marine offshore energy business and favorable rate changes in marine business as well as aviation business, partially offset by fewer business opportunities and the timing of renewals of marine offshore renewable energy business.
The increase in professional lines was attributable to higher level of activity in transactional liability business, partially offset by a decrease in U.S. public D&O business reflecting weaker pricing in that market.
The decrease in cyber lines was due to lower levels of premiums associated with the cancellation of two significant programs, and premium adjustments related to business written on a line slip basis, partially offset by a higher level of premiums associated with renewed business.
The decrease in liability lines was driven by underwriting actions taken to reposition the U.S. primary casualty portfolio, and a lower level of premiums associated with the cancellation of a significant program, partially offset by favorable rate change and new business associated with U.S. excess casualty business.
(1) Amounts presented on a constant currency basis are non-GAAP financial measures as defined in Item10 (e) of SEC Regulation S-K. The constant currency basis is calculated by applying the average foreign exchange rate from the current year to the prior year balance.
Ceded Premiums Written
Ceded premiums written in 2024 were $2,365 million, or 36% of gross premiums written, compared to $2,382 million, or 39% in 2023. The decrease in ceded premiums written of $17 million, or 1% was primarily driven by decreases in cyber and professional lines, partially offset by increases in accident and health, property, credit and political risk, marine and aviation and liability lines.
The decreases in cyber, and professional lines were due to the restructuring of significant existing quota share treaties. The decrease in cyber lines also reflected the decrease in gross premiums written for 2024, compared to 2023.
The increase in accident and health lines was driven by a new quota share treaty and reflected the increase in gross premiums written for 2024, compared to 2023.
The increase in property lines reflected the increase in gross premiums written for 2024, compared to 2023, partially offset by the restructuring of a significant existing quota share treaty.
The increase in credit and political risk lines reflected the increase in gross premiums written for 2024, compared to 2023.
The increase in marine and aviation lines was attributable to reinstatement premiums associated with losses and loss expenses in 2024.
Net Premiums Earned
Net premiums earned by line of business were as follows: | | | | | | | | | | | | | | | | | | | | | | | | | | | | | | | | | | | | | | | | | | | | | | | | | | | | | |
| | | | | | | | | | | | | | | | | |
| | | | | | | | % Change | |
| Year ended December 31, | 2024 | | 2023 | | 2022 | | 2023 to 2024 | | 2022 to 2023 | |
| | | | | | | | | | | | | | | | | |
| Professional lines | $ | 817,535 | | | 21 | % | | $ | 764,558 | | | 22 | % | | $ | 817,924 | | | 26 | % | | 7 | % | | (7 | %) | |
| Property | 1,139,308 | | | 28 | % | | 878,849 | | | 26 | % | | 755,986 | | | 24 | % | | 30 | % | | 16 | % | |
| Liability | 494,561 | | | 13 | % | | 496,381 | | | 14 | % | | 459,775 | | | 15 | % | | — | % | | 8 | % | |
| Cyber | 347,842 | | | 9 | % | | 323,025 | | | 9 | % | | 309,004 | | | 10 | % | | 8 | % | | 5 | % | |
| Marine and aviation | 614,826 | | | 16 | % | | 567,292 | | | 16 | % | | 479,499 | | | 15 | % | | 8 | % | | 18 | % | |
| Accident and health | 360,894 | | | 9 | % | | 306,061 | | | 9 | % | | 209,548 | | | 7 | % | | 18 | % | | 46 | % | |
| Credit and political risk | 151,070 | | | 4 | % | | 125,534 | | | 4 | % | | 102,419 | | | 3 | % | | 20 | % | | 23 | % | |
| Total | $ | 3,926,036 | | | 100 | % | | $ | 3,461,700 | | | 100 | % | | $ | 3,134,155 | | | 100 | % | | 13 | % | | 10 | % | |
| | | | | | | | | | | | | | | | | |
Net premiums earned in 2024 increased by $464 million, or 13%, compared to 2023. The increase was primarily driven by increases in gross premiums earned in property, accident and health, marine and aviation, and credit and political risk lines, together with decreases in ceded premiums earned in professional lines and cyber lines. These amounts were partially offset by increases in ceded premiums earned in property, credit and political risk, accident and health, and marine and aviation lines together with decreases in gross premiums earned in professional lines and cyber lines.
Loss Ratio
The components of the loss ratio were as follows:
| | | | | | | | | | | | | | | | | | | | | | | | | | | | | | | | | | | |
| | | | | | | | | | | |
| Year ended December 31, | 2024 | | % Point
Change | | 2023 | | % Point
Change | | 2022 | |
| | | | | | | | | | | |
| Current accident year loss ratio | 57.6 | % | | 2.6 | | | 55.0 | % | | (2.5) | | | 57.5 | % | |
| Prior year reserve development ratio | (0.4 | %) | | (5.5) | | | 5.1 | % | | 5.6 | | | (0.5 | %) | |
| Loss ratio | 57.2 | % | | (2.9) | | | 60.1 | % | | 3.1 | | | 57.0 | % | |
| | | | | | | | | | | |
Current Accident Year Loss Ratio
The current accident year loss ratio increased to 57.6% in 2024 from 55.0% in 2023. The increase in the current accident year loss ratio was impacted by a higher level of catastrophe and weather-related losses.
During 2024, catastrophe and weather-related losses, net of reinsurance, were $216 million, or 5.5 points, including natural catastrophe and weather-related losses of $203 million, or 5.2 points, primarily attributable to Hurricanes Milton, Helene, and Beryl, and other weather-related events. The remaining losses of $13 million, or 0.3 points were attributable to the Red Sea Conflict.
Comparatively, in 2023, catastrophe and weather-related losses, net of reinsurance, were $111 million, or 3.2 points, primarily attributable to the conflict in the Middle East, the Earthquake in Turkey, Maui wildfires, Cyclone Gabrielle, Typhoon Mawar and other weather-related events.
Adjusting for the impact of the catastrophe and weather-related losses, the current accident year loss ratio increased to 52.1% in 2024 from 51.8% in 2023. The increase was principally due to higher loss ratios in liability and cyber lines, partially offset by the change in business mix attributable to the increase in property business written in recent periods which is associated with a relatively lower loss ratio.
Prior Year Reserve Development
Refer to Item 8, Note 8 to the Consolidated Financial Statements 'Reserve for Losses and Loss Expenses' for details of prior year reserve development by segment, line of business and accident year.
Acquisition Cost Ratio
The acquisition cost ratio increased to 19.5% in 2024 from 18.7% in 2023, primarily related to an increase in profit commission expense driven by improved loss performance mainly in accident and health lines, and a decrease in ceding commissions due to changes in business mix driven by the decrease in professional lines business written in recent periods which is associated with relatively higher ceding commissions and the increase in property business written in recent periods which is associated with relatively lower ceding commissions.
Underwriting-Related General and Administrative Expense Ratio
The underwriting-related general and administrative expense ratio decreased to 12.4% in 2024 from 13.7% in 2023, mainly driven by increases in net premiums earned, partially offset by an increase in performance-related compensation costs.
Reinsurance Segment
Results for the reinsurance segment were as follows: | | | | | | | | | | | | | | | | | | | | | | | | | | | | | | | | | | | |
| | | | | | | | | | | |
| Year ended December 31, | 2024 | | % Change | | 2023 | | % Change | | 2022 | |
| | | | | | | | | | | |
| Revenues: | | | | | | | | | | |
| Gross premiums written | $ | 2,390,304 | | | 8% | | $ | 2,215,761 | | | (16%) | | $ | 2,629,014 | | |
| Net premiums written | 1,506,806 | | | 12% | | 1,343,605 | | | (29%) | | 1,885,150 | | |
| Net premiums earned | 1,380,199 | | | (15%) | | 1,622,081 | | | (20%) | | 2,026,171 | | |
| Other insurance related income | 30,627 | | | 35% | | 22,693 | | | 81% | | 12,514 | | |
| | | | | | | | | | | |
| Expenses: | | | | | | | | | | |
| Current accident year net losses and loss expenses | (921,181) | | | | | (1,077,572) | | | | | (1,465,739) | | |
| Prior year reserve development | 8,114 | | | | | (235,529) | | | | | 9,183 | | |
| Acquisition costs | (303,636) | | | | | (352,482) | | | | | (444,179) | | |
| Underwriting-related general and administrative expenses | (50,513) | | | | | (79,373) | | | | | (106,585) | | |
| | | | | | | | | | | |
| Underwriting income (loss) | $ | 143,610 | | | | | $ | (100,182) | | | | | $ | 31,365 | | |
| | | | | | | | | | | |
| Ratios: | | | % Point
Change | | | | % Point
Change | | | |
| Current accident year loss ratio, excluding catastrophe and weather-related losses | 66.0 | % | | 1.2 | | 64.8 | % | | 2.2 | | 62.6 | % | |
| Catastrophe and weather-related losses ratio | 0.7 | % | | (0.9) | | 1.6 | % | | (8.1) | | 9.7 | % | |
| Current accident year loss ratio | 66.7 | % | | 0.3 | | 66.4 | % | | (5.9) | | 72.3 | % | |
| Prior year reserve development ratio | (0.5 | %) | | (15.1) | | 14.6 | % | | 15.0 | | (0.4 | %) | |
| Net losses and loss expenses ratio | 66.2 | % | | (14.8) | | 81.0 | % | | 9.1 | | 71.9 | % | |
| Acquisition cost ratio | 22.0 | % | | 0.3 | | 21.7 | % | | (0.2) | | 21.9 | % | |
| Underwriting-related general and administrative expense ratio | 3.6 | % | | (1.3) | | 4.9 | % | | (0.4) | | 5.3 | % | |
| Combined ratio | 91.8 | % | | (15.8) | | 107.6 | % | | 8.5 | | 99.1 | % | |
| | | | | | | | | | | |
Gross Premiums Written:
Gross premiums written by line of business were as follows: | | | | | | | | | | | | | | | | | | | | | | | | | | | | | | | | | | | | | | | | | | | | | | | | | | | | | |
| | | | | | | | | | | | | | | | | |
| | | | | | | | | | | | | | % Change | |
| Year ended December 31, | 2024 | | 2023 | | 2022 | | 2023 to 2024 | | 2022 to 2023 | |
| | | | | | | | | | | | | | | | | |
| Liability | $ | 616,333 | | | 26 | % | | $ | 642,801 | | | 29 | % | | $ | 719,831 | | | 27 | % | | (4 | %) | | (11 | %) | |
| Accident and health | 436,296 | | | 18 | % | | 396,668 | | | 18 | % | | 411,891 | | | 16 | % | | 10 | % | | (4 | %) | |
| Professional lines | 421,846 | | | 18 | % | | 379,222 | | | 17 | % | | 400,807 | | | 15 | % | | 11 | % | | (5 | %) | |
| Credit and surety | 417,717 | | | 17 | % | | 351,083 | | | 16 | % | | 298,565 | | | 11 | % | | 19 | % | | 18 | % | |
| Motor | 238,961 | | | 10 | % | | 201,466 | | | 9 | % | | 239,794 | | | 9 | % | | 19 | % | | (16 | %) | |
| Agriculture | 150,373 | | | 6 | % | | 126,300 | | | 6 | % | | 128,012 | | | 5 | % | | 19 | % | | (1 | %) | |
| Marine and aviation | 82,274 | | | 3 | % | | 62,260 | | | 3 | % | | 93,371 | | | 4 | % | | 32 | % | | (33 | %) | |
| Run-off lines | | | | | | | | | | | | | | | | |
| Catastrophe | 10,823 | | | 1 | % | | 30,175 | | | 1 | % | | 222,810 | | | 9 | % | | (64 | %) | | (86 | %) | |
| Property | 3,130 | | | — | % | | 21,513 | | | 1 | % | | 103,492 | | | 4 | % | | (85 | %) | | (79 | %) | |
| Engineering | 12,551 | | | 1 | % | | 4,273 | | | — | % | | 10,441 | | | — | % | | nm | | (59 | %) | |
| Total run-off lines | 26,504 | | | 2 | % | | 55,961 | | | 2 | % | | 336,743 | | | 13 | % | | (53 | %) | | (83 | %) | |
| | | | | | | | | | | | | | | | | |
| Total | $ | 2,390,304 | | | 100 | % | | $ | 2,215,761 | | | 100 | % | | $ | 2,629,014 | | | 100 | % | | 8 | % | | (16 | %) | |
| | | | | | | | | | | | | | | | | |
nm – not meaningful
Gross premiums written in 2024 increased by $175 million, or 8%, compared to 2023. The increase was primarily attributable to credit and surety, professional lines, accident and health, motor, agriculture, marine and aviation, and engineering lines, partially offset by decreases in liability, catastrophe and property lines.
The increase in credit and surety lines was driven by new business, including new structured credit and political risk business and new mortgage business, together with premium adjustments associated with mortgage business.
The increase in professional lines was attributable to new cyber business and increased line sizes on a several cyber contracts, partially offset by negative premium adjustments associated with challenging market conditions in 2024, compared to positive premium adjustments associated with favorable market conditions in 2023, non-renewals of several under-performing contracts and the timing of renewals of two significant contracts.
The increase in accident and health lines was due to new business and positive premium adjustments in 2024, compared to the negative premium adjustments in 2023, partially offset by decreased line sizes on several contracts.
The increase in motor lines was attributable to the timing of the renewal of a significant proportional contract and new non-proportional business associated with favorable market conditions, a higher level of positive premium adjustments related to non-proportional business associated with favorable market conditions in 2024, compared to 2023, together with the impact of foreign exchange movements, partially offset by non-renewals and decreased line sizes on several proportional contracts associated with repositioning the portfolio.
The increase in agriculture lines was due to new business and increased line sizes on several contracts, partially offset by negative premium adjustments associated with challenging market conditions in 2024, compared to positive premium adjustments in 2023.
The increase in marine and aviation lines was driven by new proportional and non-proportional marine business.
The increase in engineering lines was due to a higher level of positive prior year premium adjustments in 2024, compared to 2023.
The decrease in liability lines was related to the restructuring of several significant contracts, a lower level of U.S. exposed risks, and a lower level of positive premium adjustments in 2024, compared to 2023, partially offset by new business.
The decreases in catastrophe and property lines were attributable to the exit from these lines of business in June 2022.
Ceded Premiums Written
Ceded premiums written in 2024 were $883 million, or 37%, of gross premiums written, compared to $872 million, or 39%, in 2023. The increase in ceded premiums written of $11 million, or 1%, was primarily driven by increases in credit and surety, accident and health, motor and agriculture lines, partially offset by decreases in liability, professional lines and catastrophe lines.
The increase in credit and surety lines reflected the increase in gross premiums written for 2024, compared to 2023, and the restructuring of a significant quota share retrocession treaty with a strategic capital partner, partially offset by the non-renewal of a significant quota share retrocession treaty.
The increase in accident and health lines reflected the increase in gross premiums written for 2024, compared to 2023.
The increase in motor lines reflected the increase in gross premiums written for 2024, compared to 2023, partially offset by the restructuring of a significant quota share retrocession treaty with a strategic capital partner.
The increase in agriculture lines was related to premiums ceded to a new whole account quota share retrocessional treaty.
The decrease in liability lines was attributable to the restructuring of significant quota share retrocession treaties with strategic capital partners and the decrease in gross premiums written for 2024, compared to 2023.
The decrease in professional lines was driven by the restructuring of significant quota share retrocession treaties with strategic capital partners, partially offset by the increase in gross premiums written for 2024, compared to 2023.
The decrease in catastrophe lines reflected the decrease in gross premiums written for 2024, compared to 2023 following the exit from this line of business in June 2022.
Net Premiums Earned
Net premiums earned by line of business were as follows:
| | | | | | | | | | | | | | | | | | | | | | | | | | | | | | | | | | | | | | | | | | | | | | | | | | | | | |
| | | | | | | | | | | | | | | | | |
| | | | | | | | | | | | | | % Change | |
| Year ended December 31, | 2024 | | 2023 | | 2022 | | 2023 to 2024 | | 2022 to 2023 | |
| | | | | | | | | | | | | | | | | |
| Liability | $ | 309,265 | | | 22 | % | | $ | 403,239 | | | 25 | % | | $ | 484,681 | | | 24 | % | | (23 | %) | | (17 | %) | |
| Accident and health | 322,932 | | | 23 | % | | 341,806 | | | 21 | % | | 368,747 | | | 18 | % | | (6 | %) | | (7 | %) | |
| Professional lines | 169,074 | | | 12 | % | | 205,404 | | | 13 | % | | 250,911 | | | 12 | % | | (18 | %) | | (18 | %) | |
| Credit and surety | 231,780 | | | 17 | % | | 236,408 | | | 15 | % | | 192,926 | | | 10 | % | | (2 | %) | | 23 | % | |
| Motor | 123,545 | | | 9 | % | | 155,942 | | | 10 | % | | 205,774 | | | 10 | % | | (21 | %) | | (24 | %) | |
| Agriculture | 126,549 | | | 9 | % | | 121,628 | | | 7 | % | | 122,289 | | | 6 | % | | 4 | % | | (1 | %) | |
| Marine and aviation | 64,609 | | | 5 | % | | 65,658 | | | 4 | % | | 78,504 | | | 4 | % | | (2 | %) | | (16 | %) | |
| Run-off lines | | | | | | | | | | | | | | | | |
| Catastrophe | 13,412 | | | 2 | % | | 33,963 | | | 1 | % | | 156,232 | | | 7 | % | | (61 | %) | | (78 | %) | |
| Property | 6,266 | | | — | % | | 44,508 | | | 3 | % | | 135,480 | | | 7 | % | | (86 | %) | | (67 | %) | |
| Engineering | 12,767 | | | 1 | % | | 13,525 | | | 1 | % | | 30,627 | | | 2 | % | | (6 | %) | | (56 | %) | |
| Total run-off lines | 32,445 | | | 3 | % | | 91,996 | | | 5 | % | | 322,339 | | | 16 | % | | (65 | %) | | (71 | %) | |
| | | | | | | | | | | | | | | | | |
| Total | $ | 1,380,199 | | | 100 | % | | $ | 1,622,081 | | | 100 | % | | $ | 2,026,171 | | | 100 | % | | (15 | %) | | (20 | %) | |
| | | | | | | | | | | | | | | | | |
Net premiums earned in 2024 decreased by $242 million, or 15%, ($225 million, or 14%, on a constant currency basis), compared to 2023. The decrease was primarily driven by increases in ceded premiums earned in liability, professional lines, accident and health, and motor lines, together with decreases in gross premiums earned in property, catastrophe and liability lines. These amounts were partially offset by a decrease in ceded premiums earned in catastrophe lines, together with increases in gross premiums earned in professional lines, and accident and health lines.
Other Insurance Related Income (Loss)
Other insurance related income of $31 million in 2024, compared to other insurance related income of $23 million in 2023, an increase of $8 million, primarily driven by interest on loan advances to Monarch Point Re.
Loss Ratio
The components of the loss ratio were as follows: | | | | | | | | | | | | | | | | | | | | | | | | | | | | | | | | | | | | | | |
| | | | | | | | | | | | |
| Year ended December 31, | | 2024 | | % Point
Change | | 2023 | | % Point
Change | | 2022 | |
| | | | | | | | | | | | |
| Current accident year loss ratio | | 66.7 | % | | 0.3 | | | 66.4 | % | | (5.9) | | | 72.3 | % | |
| Prior year reserve development ratio | | (0.5 | %) | | (15.1) | | | 14.6 | % | | 15.0 | | | (0.4 | %) | |
| Loss ratio | | 66.2 | % | | (14.8) | | | 81.0 | % | | 9.1 | | | 71.9 | % | |
| | | | | | | | | | | | |
Current Accident Year Loss Ratio
The current accident year loss ratio increased to 66.7% in 2024 from 66.4% in 2023.
During 2024, catastrophe and weather-related losses, net of reinsurance, were $10 million, or 0.7 points, primarily attributable to Hurricanes Milton and Helene and other weather-related events.
Comparatively, in 2023, catastrophe and weather-related losses, net of reinsurance, were $27 million, or 1.6 points, primarily attributable to Cyclone Gabrielle and other weather-related events.
Adjusting for the impact of the catastrophe and weather-related losses, the current accident year loss ratio increased to 66.0% in 2024 from 64.8% in 2023. The increase was principally due to a higher loss ratio in liability lines, partially offset by the impact of the loss expense related to the retrocession agreement entered into with Monarch Point Re reflected in the prior year.
Prior Year Reserve Development
Refer to Item 8, Note 8 to the Consolidated Financial Statements 'Reserve for Losses and Loss Expenses' for details of prior year reserve development by segment, line of business and accident year.
Acquisition Cost Ratio
The acquisition cost ratio increased to 22.0% in 2024 from 21.7% in 2023, primarily related to adjustments attributable to loss-sensitive features driven by improved loss performance mainly in motor and liability lines.
In addition, an increase in costs associated with changes in business mix due to increases in credit and surety, and professional lines business written in the recent periods which is associated with relatively higher acquisition cost ratios together with decreases in property and catastrophe business written in the recent periods which is associated with relatively lower acquisition cost ratios, contributed to the increase in the acquisition cost ratio to 22.0% in 2024 from 21.7% in 2023.
The acquisition cost ratio in 2024 benefited from the impact of changes in business mix on retrocessional contracts driven by increases in credit and surety, and accident and health business written in recent periods together with the decrease in catastrophe business written in recent periods. In addition, the acquisition cost ratio in 2024 benefited from a decrease in costs associated with changes in business mix within motor lines.
Underwriting-Related General and Administrative Expense Ratio
The underwriting-related general and administrative expense ratio decreased to 3.6% in 2024 from 4.9% in 2023, mainly driven by an increase in fees related to arrangements with strategic capital partners to $54 million in 2024, from $38 million in 2023, and a decrease in information technology costs, partially offset by a decrease in net premiums earned.
NET INVESTMENT INCOME AND NET INVESTMENT GAINS (LOSSES)
Net Investment Income
Net investment income from our cash and investment portfolio by major asset class was as follows: | | | | | | | | | | | | | | | | | | | | | | | | | | | | | | | | | | | |
| | | | | | | | | | | |
| Year ended December 31, | 2024 | | % Change | | 2023 | | % Change | | 2022 | |
| | | | | | | | | | | |
| Fixed maturities | $ | 620,704 | | | 21% | | $ | 514,842 | | | 56% | | $ | 329,858 | | |
| Other investments | 48,666 | | | nm | | 20,411 | | | (64%) | | 57,043 | | |
| Equity securities | 12,922 | | | 7% | | 12,088 | | | 16% | | 10,390 | | |
| Mortgage loans | 34,028 | | | (4%) | | 35,312 | | | 51% | | 23,407 | | |
| Cash and cash equivalents | 59,600 | | | 19% | | 50,261 | | | nm | | 20,273 | | |
| Short-term investments | 12,569 | | | 41% | | 8,924 | | | nm | | 3,535 | | |
| Gross investment income | 788,489 | | | 23% | | 641,838 | | | 44% | | 444,506 | | |
| Investment expense | (29,260) | | | (3%) | | (30,096) | | | 17% | | (25,677) | | |
| Net investment income | $ | 759,229 | | | 24% | | $ | 611,742 | | | 46% | | $ | 418,829 | | |
| | | | | | | | | | | |
| Pre-tax yield:(1) | | | | | | | | | | |
| Fixed maturities | 4.5 | % | | | | 3.9 | % | | | | 2.6 | % | |
| | | | | | | | | | | |
nm – not meaningful
(1)Pre-tax yield is calculated by dividing net investment income by the average month-end amortized cost balances for the periods indicated.
Fixed Maturities
2024 versus 2023: Net investment income in 2024 increased by $106 million or 21%, compared to 2023 due to increases in yields.
Other Investments
Other investments include multi-strategy funds, direct lending funds, private equity funds, real estate funds, other privately held investments and an indirect investment in CLO-Equities. These investments are recorded at fair value, with changes in fair value and income distributions reported in net investment income. Consequently, the pre-tax return on other investments may vary materially year over year, particularly during volatile equity and credit markets.
Net investment income from other investments was as follows:
| | | | | | | | | | | | | | | | | | | | | | | |
| | | | | | | |
| Year ended December 31, | 2024 | | 2023 | | 2022 | |
| | | | | | | |
| Multi-strategy, direct lending, private equity and real estate funds | $ | 41,277 | | | $ | 20,867 | | | $ | 39,151 | | |
| Other privately held investments | 6,502 | | | (2,875) | | | 14,931 | | |
| CLO-Equities | 887 | | | 2,419 | | | 2,961 | | |
| Total net investment income from other investments | $ | 48,666 | | | $ | 20,411 | | | $ | 57,043 | | |
| | | | | | | |
| Pre-tax return on other investments(1) | 5.2 | % | | 2.1 | % | | 5.9 | % | |
| | | | | | | |
(1)Pre-tax return on other investments is calculated by dividing total net investment income from other investments by the average month-end fair value balances held for the periods indicated.
2024 versus 2023: Pre-tax return on other investments in 2024 increased to 5.2%, compared to 2.1% in 2023. The increase was primarily attributable to higher returns from private equity funds and other privately held investments.
Net Investment Gains (Losses)
Fixed maturities classified as available for sale are reported at fair value. Realized gains (losses) on fixed maturities are reported in net investment gains (losses) when these securities are sold or impaired.
Equity securities are reported at fair value. Realized gains (losses) on equity securities are also reported in net investment gains (losses) when securities are sold or impaired. In addition, changes in the fair values of equity securities are reported in net investment gains (losses).
Changes in the fair value of investment derivatives, mainly foreign exchange forward contracts are recorded in net investment gains (losses).
Net investment gains (losses) were as follows:
| | | | | | | | | | | | | | | | | | | | | | | |
| | | | | | | |
| Year ended December 31, | 2024 | | 2023 | | 2022 | |
| | | | | | | |
| On sale of investments: | | | | | | |
| Fixed maturities, short-term investments, and cash and cash equivalents | $ | (153,249) | | | $ | (125,160) | | | $ | (311,822) | | |
| Equity securities | 17,041 | | | 16,208 | | | 7,281 | | |
| Mortgage loans | (7,215) | | | — | | | — | | |
| | (143,423) | | | (108,952) | | | (304,541) | | |
| (Increase) decrease in allowance for expected credit losses, fixed maturities, available for sale | 6,821 | | | 974 | | | (11,421) | | |
| (Increase) decrease in allowance for expected credit losses, mortgage loans | (17,159) | | | (6,220) | | | — | | |
| Impairment losses (1) | (408) | | | (12,757) | | | (12,568) | | |
| | | | | | | |
| Change in fair value of investment derivatives | 1,783 | | | (1,456) | | | 7,656 | | |
| Net unrealized gains (losses) on equity securities | 13,852 | | | 53,781 | | | (135,915) | | |
| Net investment gains (losses) | $ | (138,534) | | | $ | (74,630) | | | $ | (456,789) | | |
| | | | | | | |
(1) Related to instances where we intend to sell securities, or it is more likely than not that we will be required to sell securities before their anticipated recovery.
On Sale of Investments and Net Unrealized Gains (Losses) on Equity Securities
Generally, sales of individual securities occur when there are changes in the relative value, credit quality, or duration of a particular issue. We may also sell securities to re-balance our investment portfolio in order to change exposure to particular asset classes or sectors.
2024 versus 2023: Net investment losses in 2024 were $139 million compared to net investment losses of $75 million in 2023. Net investment losses reported in 2024 mainly reflected net realized losses on the sale of corporate debt, Agency RMBS and U.S. government, partially offset by net realized and unrealized gains on equity securities.
Net investment losses reported in 2023 mainly reflected net realized losses on the sale of corporate debt, U.S. government and Non-Agency CMBS, partially offset by net unrealized gains on equity securities.
(Increase) Decrease in Allowance for Expected Credit Losses, Fixed Maturities, Available for Sale
2024 versus 2023: The allowance for expected credit losses decreased by $7 million in 2024 compared to $1 million in 2023, primarily related to the sale of securities. Refer to Item 8, Note 5(i) to the Consolidated Financial Statements 'Investments'.
(Increase) Decrease in Allowance for Expected Credit Losses, Mortgage Loans
2024 versus 2023: The allowance for expected credit losses increased by $17 million in 2024 compared to $6 million in 2023, primarily related to commercial mortgage loans exposed to the office sector. Refer to Item 8, Note 5(d) to the Consolidated Financial Statements 'Investments'.
Impairment Losses
The impairment losses (refer to 'Critical Accounting Estimates – Impairment losses' for further details) recognized in net income were as follows:
2024 versus 2023: Impairment losses in 2024 were $nil compared to impairment losses of $13 million in 2023. The impairment losses in 2023 were principally due to impairments of non-investment grade corporate debt securities that we intended to sell or where we determined that it was more likely than not that we were required to sell securities before their anticipated recovery.
Change in Fair Value of Investment Derivatives
We economically hedge foreign exchange exposure with derivative contracts.
During 2024, foreign exchange hedges resulted in $2 million of net gains which primarily related to securities denominated in pound sterling and euro which experienced volatility during 2024.
During 2023, foreign exchange hedges resulted in $1 million of net losses which primarily related to securities denominated in pound sterling and euro which experienced volatility during 2023.
Our derivative instruments are not designated as hedges. Therefore, net unrealized gains (losses) on the hedged securities were recorded in accumulated other comprehensive income (loss) in total shareholders’ equity.
Total Return
Our investment strategy is to take a long-term view by actively managing our investment portfolio to maximize total return within certain guidelines and constraints. In assessing returns under this approach, we include net investment income, net investment gains (losses), the change in unrealized gains (losses) on fixed maturities, and interest in income (loss) of equity method investments generated by our investment portfolio.
Total return on cash and investments was as follows:
| | | | | | | | | | | | | | | | | | | | | | | |
| | | | | | | |
| Year ended December 31, | 2024 | | 2023 | | 2022 | |
| | | | | | | |
| Net investment income | $ | 759,229 | | | $ | 611,742 | | | $ | 418,829 | | |
| Net investment gains (losses) | (138,534) | | | (74,630) | | | (456,789) | | |
| Change in net unrealized gains (losses) on fixed maturities(1) | 125,742 | | | 448,477 | | | (909,150) | | |
| Interest in income of equity method investments | 17,953 | | | 4,163 | | | 1,995 | | |
| Total | $ | 764,390 | | | $ | 989,752 | | | $ | (945,115) | | |
| | | | | | | |
| Average cash and investments(2) | $ | 17,409,516 | | | $ | 16,155,418 | | | $ | 15,963,535 | | |
| | | | | | | |
| Pre-tax, total return on average cash and investments: | | | | | | |
| Including investment related foreign exchange movements | 4.4 | % | | 6.1 | % | | (5.9 | %) | |
| Excluding investment related foreign exchange movements(3) | 4.8 | % | | 5.8 | % | | (5.2 | %) | |
| | | | | | | |
(1)Change in net unrealized gains (losses) on fixed maturities is calculated by taking net unrealized gains (losses) at year end less net unrealized gains (losses) at the prior year end.
(2)The average cash and investments balance is the average of the monthly fair value balances.
(3)Pre-tax total return on cash and investments excluding foreign exchange movements is a non-GAAP financial measure as defined in Item 10(e) of SEC Regulation S-K. The reconciliation to pre-tax total return on cash and investments, the most comparable GAAP financial measure, included foreign exchange (losses) gains of $(63) million, $51 million and $(110) million for the years ended December 31, 2024, 2023 and 2022, respectively.
OTHER EXPENSES (REVENUES), NET
The following table provides a summary of other expenses (revenues), net:
| | | | | | | | | | | | | | | | | | | | | | | | | | | | | | | | | | | |
| | | | | | | | | | | |
| Year ended December 31, | 2024 | | % Change | | 2023 | | % Change | | 2022 | |
| | | | | | | | | | | |
| Corporate expenses | $ | 129,760 | | | (2%) | | $ | 132,979 | | | 2% | | $ | 130,054 | | |
| Foreign exchange losses (gains) | (50,822) | | | nm | | 58,115 | | | nm | | (157,945) | | |
| Interest expense and financing costs | 67,766 | | | (1%) | | 68,421 | | | 8% | | 63,146 | | |
| Income tax expense (benefit) | (55,595) | | | nm | | 26,316 | | | 19% | | 22,037 | | |
| Total | $ | 91,109 | | | | | $ | 285,831 | | | | | $ | 57,292 | | |
| | | | | | | | | | | |
nm – not meaningful
Corporate Expenses
Corporate expenses include holding company costs necessary to support our worldwide insurance and reinsurance operations and costs associated with operating as a publicly-traded company. As a percentage of net premiums earned, corporate expenses decreased to 2.4% in 2024 from 2.6% in 2023.
The decrease in corporate expenses in 2024 was mainly driven by decreases in executive-related compensation costs associated with the transition in our senior leadership and personnel costs, partially offset by increases in professional fees and information technology costs.
Foreign Exchange Losses (Gains)
Foreign exchange gains in 2024 were primarily related to the impact of the strengthening of the U.S. dollar on the remeasurement of net insurance-related liabilities denominated in euro and Canadian dollar, partially offset by the weakening of the U.S. dollar on the remeasurement of net insurance-related liabilities denominated in pound sterling.
Foreign exchange losses in 2023 were primarily related to the impact of the weakening of the U.S. dollar on the remeasurement of net insurance-related liabilities denominated in pound sterling, euro and Canadian dollar.
Interest Expense and Financing Costs
Interest expense and financing costs are related to interest due on the senior unsecured notes, junior subordinated notes and the Federal Home Loan advances ("FHLB advances") received in 2024 and 2023.
Interest expense and financing costs decreased by $1 million in 2024, compared to 2023, due to the repayment of FHLB advances in 2024.
Income Tax Expense (Benefit)
Income tax expense (benefit) primarily results from income (loss) generated by our foreign operations in the U.S. and Europe. Our effective tax rate, which is calculated as income tax expense (benefit) divided by income (loss) before tax including interest in income (loss) of equity method investments, was (5.4%), 6.5%, and 9.0% in 2024, 2023, and 2022, respectively. This effective rate can vary between years depending on the distribution of net income (loss) among tax jurisdictions, as well as other factors.
The tax benefit of $56 million in 2024 was principally due to the recognition of an income tax benefit of $177 million related to a future Bermuda corporate income tax rate of 15%, pursuant to the Corporate Income Tax Act 2023 and adjustments related to certain deferred tax assets and deferred tax liabilities that are no longer required, partially offset by pre-tax income in our U.S., U.K. and European operations.
In 2024, the valuation allowance decreased by $19 million. The net gain incurred by AXIS Re SE, the Irish reinsurance company, resulted in the release of a valuation allowance of $13 million against the net deferred tax assets of AXIS Re SE and AXIS Re Europe, the Swiss branch of the Irish reinsurance company, of which $8 million was released to net income (loss) and $5 million was released in other comprehensive income (loss). A valuation allowance of $7 million was also released against foreign tax credits held by AXIS Specialty Europe SE.
At December 31, 2024, the U.S. operations had a deferred tax asset of $19 million for the unrealized losses on its fixed maturities that were recorded in other comprehensive income (loss). We examined the need for a valuation allowance and after considering all positive and negative evidence concluded a valuation allowance against its net unrealized investment losses in the U.S was not required.
At December 31, 2024, the Bermuda operations had a deferred tax asset of $17 million for the unrealized losses on its fixed maturities that were recorded in other comprehensive income (loss). We examined the need for a valuation allowance and after considering all positive and negative evidence concluded a valuation allowance against its net unrealized investment losses in Bermuda was not required.
The tax expense of $26 million in 2023 was principally due to pre-tax income in our U.K. and European insurance operations, partially offset by the recognition of a tax benefit in Bermuda on unrealized investment losses included in other comprehensive income (loss) due to the enactment of corporate income tax that will take effect in 2025, and pre-tax losses in our U.S. operations.
In 2023, the valuation allowance decreased by $21 million. The net gain incurred by AXIS Re SE, the Irish reinsurance company, resulted in the release of a valuation allowance of $25 million against the net deferred tax assets of AXIS Re SE and AXIS Re Europe, the Swiss branch of the Irish reinsurance company, of which $12 million was released in net income (loss) and $13 million was released to other comprehensive income (loss). A valuation allowance of $2 million was also released against U.S. foreign tax credits that were utilized. A valuation allowance of $6 million was recorded against foreign tax credits held by AXIS Specialty Europe SE.
At December 31, 2023, the U.S. operations had a deferred tax asset of $41 million for the unrealized losses on its fixed maturities that were recorded in other comprehensive income (loss). We examined the need for a valuation allowance and after considering all positive and negative evidence concluded a valuation allowance against its net unrealized investment losses in the U.S was not required.
At December 31, 2023, the Bermuda operations had a deferred tax asset of $13 million for the unrealized losses on its fixed maturities that were recorded in other comprehensive income (loss). We examined the need for a valuation allowance and after considering all positive and negative evidence concluded a valuation allowance against its net unrealized investment losses in Bermuda was not required.
FINANCIAL MEASURES
We believe that the following financial indicators are important in evaluating performance and measuring the overall growth in value generated for common shareholders:
| | | | | | | | | | | | | | | | | | | | | | | |
| | | | | | | |
| Year ended and at December 31, | 2024 | | 2023 | | 2022 | |
| | | | | | | |
| Return on average common equity(1) | 20.5 | % | | 7.9 | % | | 4.3 | % | |
| Operating return on average common equity(2) | 18.6 | % | | 11.0 | % | | 11.1 | % | |
| Book value per diluted common share(3) | $ | 65.27 | | | $ | 54.06 | | | $ | 46.95 | | |
| Cash dividends declared per common share | $ | 1.76 | | | $ | 1.76 | | | $ | 1.73 | | |
| Increase (decrease) in book value per diluted common share adjusted for dividends | $ | 12.97 | | | $ | 8.87 | | | $ | (7.10) | | |
| | | | | | | |
(1) Return on average common equity ("ROACE") is calculated by dividing net income (loss) available (attributable) to common shareholders for the year by the average common shareholders' equity determined using the common shareholders' equity balances at the beginning and end of the year.
(2) Operating return on average common equity ("operating ROACE"), is a non-GAAP financial measure as defined in Item 10(e) of SEC Regulation S-K. The reconciliation to the most comparable GAAP financial measure, ROACE, and a discussion of the rationale for its presentation is provided in 'Management’s Discussion and Analysis of Financial Condition and Results of Operations – Non-GAAP Financial Measures Reconciliation'.
(3) Book value per diluted common share represents common shareholders’ equity divided by the number of diluted common share outstanding, determined using the treasury stock method. Cash-settled restricted stock units are excluded.
Return on Average Common Equity
Our objective is to generate superior returns on capital that appropriately reward common shareholders for the risks we assume and to grow revenue only when we expect the returns will meet or exceed our requirements. We recognize that the nature of underwriting cycles and the frequency or severity of large loss events in any one year may challenge the ability to achieve a profitability target in any specific period.
ROACE reflects the impact of net income (loss) available (attributable) to common shareholders, including net investment gains (losses), foreign exchange losses (gains), reorganization expenses, interest in income (loss) of equity method investments and Bermuda net deferred tax asset.
The increase in ROACE in 2024, compared to 2023, was primarily driven by increases in underwriting income and net investment income, foreign exchange gains, an income tax benefit and an increase in interest in income of equity method investments, partially offset by an increase in average common shareholders' equity and an increase in net investment losses.
Operating ROACE excludes the impact of net investment gains (losses), foreign exchange losses (gains), reorganization expenses, interest in income (loss) of equity method investments and Bermuda net deferred tax asset.
The increase in operating ROACE in 2024, compared to 2023, was primarily driven by increases in underwriting income and net investment income and an income tax benefit, partially offset by an increase in average common shareholders' equity.
Book Value per Diluted Common Share
We consider book value per diluted common share to be an appropriate measure of returns to common shareholders, as we believe growth in book value on a diluted basis will ultimately translate into appreciation of our stock price.
In 2024, book value per diluted common share increased by 21%, driven by net income for the year, and net unrealized investment gains reported in accumulated other comprehensive income (loss), partially offset by common dividends declared.
In 2023, book value per diluted common share increased by 15%, driven by net income for the year, and net unrealized investment gains reported in accumulated other comprehensive income (loss), partially offset by common dividends declared.
Cash Dividends Declared per Common Share
We believe in returning excess capital to shareholders by way of dividends. Accordingly, dividend policy is an integral part of the value we create for shareholders. Our Board of Directors has approved quarterly common share dividends for twenty one consecutive years.
Book Value per Diluted Common Share Adjusted for Dividends
Taken together, we believe that growth in book value per diluted common share and common share dividends declared represent the total value created for common shareholders. As companies in the insurance industry have differing dividend payout policies, we believe that investors use the book value per diluted common share adjusted for dividends metric to measure comparable performance across the industry.
In 2024, the increase in total value of $12.97, or 24%, was driven by net income for the year, and net unrealized investment gains reported in accumulated other comprehensive income (loss).
In 2023, the increase in total value of $8.87, or 19%, was driven by net income for the year, and net unrealized investment gains reported in accumulated other comprehensive income (loss).
NON-GAAP FINANCIAL MEASURES RECONCILIATION
| | | | | | | | | | | | | | | | | | | | | | | | |
| | | | | | | | |
| Year ended December 31, | 2024 | | 2023 | | 2022 | | |
| | | | | | | | |
| Net income available to common shareholders | $ | 1,051,536 | | $ | 346,042 | | | $ | 192,833 | | | |
| Net investment (gains) losses | 138,534 | | 74,630 | | | 456,789 | | | |
| Foreign exchange losses (gains) | (50,822) | | 58,115 | | | (157,945) | | | |
| Reorganization expenses | 26,312 | | 28,997 | | | 31,426 | | | |
| Interest in income of equity method investments | (17,953) | | (4,163) | | | (1,995) | | | |
| Bermuda net deferred tax asset(1) | (176,923) | | — | | | — | | | |
| Income tax benefit(2) | (18,649) | | (17,488) | | | (23,177) | | | |
| Operating income | $ | 952,035 | | $ | 486,133 | | | $ | 497,931 | | | |
| | | | | | | | |
| Earnings per diluted common share | $ | 12.35 | | $ | 4.02 | | $ | 2.25 | | |
| Net investment (gains) losses | 1.63 | | 0.87 | | 5.33 | | |
| Foreign exchange losses (gains) | (0.60) | | 0.68 | | (1.84) | | |
| Reorganization expenses | 0.31 | | 0.34 | | 0.37 | | |
| Interest in income of equity method investments | (0.21) | | (0.05) | | (0.02) | | |
| Bermuda net deferred tax asset | (2.08) | | — | | — | | |
| Income tax benefit | (0.22) | | (0.21) | | (0.28) | | |
| Operating income per diluted common share | $ | 11.18 | | $ | 5.65 | | $ | 5.81 | | |
| | | | | | | | |
| Weighted average diluted common shares outstanding(3) | 85,176 | | 86,012 | | | 85,669 | | | |
| | | | | | | | |
| Average common shareholders' equity | $ | 5,126,288 | | $ | 4,401,553 | | $ | 4,475,283 | | |
| | | | | | | | |
| Return on average common equity | 20.5% | | 7.9% | | 4.3% | | |
| | | | | | | | |
| Operating return on average common equity | 18.6% | | 11.0% | | 11.1% | | |
| | | | | | | | |
(1)Net deferred tax benefit due to the recognition of deferred tax assets net of deferred tax liabilities related to a future Bermuda corporate income tax rate of 15%, pursuant to the Corporate Income Tax Act 2023.
(2)Tax expense (benefit) associated with the adjustments to net income (loss) available (attributable) to common shareholders. Tax impact is estimated by applying the statutory rates of applicable jurisdictions.
(3)Refer to Item 8, Note 14 to the Consolidated Financial Statements 'Earnings Per Common Share' for further details.
Rationale for the Use of Non-GAAP Financial Measures
We present our results of operations in a way we believe will be meaningful and useful to investors, analysts, rating agencies and others who use our financial information to evaluate our performance. Some of the measurements we use are considered non-GAAP financial measures under SEC rules and regulations. In this Management's Discussion and Analysis of Financial Condition and Results of Operations ("MD&A"), we present underwriting-related general and administrative expenses, consolidated underwriting income (loss), current accident year loss ratio, catastrophe and weather-related losses ratio, current accident year loss ratio, excluding catastrophe and weather-related losses, operating income (loss) (in total and on a per share basis), operating return on average common equity ("operating ROACE"), amounts presented on a constant currency basis and pre-tax total return on cash and investments excluding foreign exchange movements, which are non-GAAP financial measures as defined in Item 10(e) of SEC Regulation S-K. We believe that these non-GAAP financial measures, which may be defined and calculated differently by other companies, help explain and enhance the understanding of our results of operations. However, these measures should not be viewed as a substitute for those determined in accordance with accounting principles generally accepted in the United States of America ("U.S. GAAP").
Underwriting-Related General and Administrative Expenses
Underwriting-related general and administrative expenses include those general and administrative expenses that are incremental and/or directly attributable to our underwriting operations. While this measure is presented in Item 8, Note 3 to the Consolidated Financial Statements 'Segment Information', it is considered a non-GAAP financial measure when presented elsewhere on a consolidated basis.
Corporate expenses include holding company costs necessary to support our worldwide insurance and reinsurance operations and costs associated with operating as a publicly-traded company. As these costs are not incremental and/or directly attributable to our underwriting operations, these costs are excluded from underwriting-related general and administrative expenses, and therefore, consolidated underwriting income (loss). General and administrative expenses, the most comparable GAAP financial measure to underwriting-related general and administrative expenses, also includes corporate expenses.
The reconciliation of underwriting-related general and administrative expenses to general and administrative expenses, the most comparable GAAP financial measure, is presented in 'Management's Discussion and Analysis of Financial Condition and Results of Operations – Consolidated Results of Operations'.
Consolidated Underwriting Income (Loss)
Consolidated underwriting income (loss) is a pre-tax measure of underwriting profitability that takes into account net premiums earned and other insurance related income (loss) as revenues and net losses and loss expenses, acquisition costs and underwriting-related general and administrative expenses as expenses. While this measure is presented in Item 8, Note 3 to the Consolidated Financial Statements 'Segment Information', it is considered a non-GAAP financial measure when presented elsewhere on a consolidated basis.
We evaluate our underwriting results separately from the performance of our investment portfolio. As a result, we believe it is appropriate to exclude net investment income and net investment gains (losses) from our underwriting profitability measure.
Foreign exchange losses (gains) in our consolidated statements of operations primarily relate to the impact of foreign exchange rate movements on our net insurance-related liabilities. However, we manage our investment portfolio in such a way that unrealized and realized foreign exchange losses (gains) on our investment portfolio, including unrealized foreign exchange losses (gains) on our equity securities, and foreign exchange losses (gains) realized on the sale of our available for sale investments and equity securities recognized in net investment gains (losses), and unrealized foreign exchange losses (gains) on our available for sale investments in other comprehensive income (loss), generally offset a large portion of the foreign exchange losses (gains) arising from our underwriting portfolio, thereby minimizing the impact of foreign exchange rate movements on total shareholders' equity. As a result, we believe that foreign exchange losses (gains) in our consolidated statements of operations in isolation are not a meaningful contributor to our underwriting performance. Therefore, foreign exchange losses (gains) are excluded from consolidated underwriting income (loss).
Interest expense and financing costs primarily relate to interest payable on our debt and Federal Home Loan Bank advances. As these expenses are not incremental and/or directly attributable to our underwriting operations, these expenses are excluded from underwriting-related general and administrative expenses and, therefore, consolidated underwriting income (loss).
Reorganization expenses in 2024 primarily related to severance costs attributable to our "How We Work" program which is focused on simplifying our operating structure. Reorganization expenses in 2023 primarily related to impairments of computer software assets and severance costs attributable to our "How We Work" program. Reorganization expenses in 2022 primarily related to severance costs and impairments of computer software assets mainly attributable to our exit from catastrophe and property reinsurance lines of business which was part of an overall approach to reduce our exposure to volatile catastrophe risk. Reorganization expenses are primarily driven by business decisions, the nature and timing of which are not related to the underwriting process. Therefore, these expenses are excluded from consolidated underwriting income (loss).
Amortization of intangible assets arose from business decisions, the nature and timing of which are not related to the underwriting process. Therefore, these expenses are excluded from consolidated underwriting income (loss).
We believe that the presentation of underwriting-related general and administrative expenses and consolidated underwriting income (loss) provides investors with an enhanced understanding of our results of operations, by highlighting the underlying pre-tax profitability of our underwriting activities. The reconciliation of consolidated underwriting income (loss) to net income (loss), the most comparable GAAP financial measure, is presented in 'Management's Discussion and Analysis of Financial Condition and Results of Operations – Consolidated Results of Operations'.
Current Accident Year Loss Ratio
Current accident year loss ratio represents net losses and loss expenses ratio exclusive of net favorable (adverse) prior year reserve development. We believe that the presentation of current accident year loss ratio provides investors with an enhanced understanding of our results of operations by highlighting net losses and loss expenses associated with our underwriting activities excluding the impact of volatile prior year reserve development. The reconciliation of current accident year loss ratio to net losses and loss expenses ratio, the most comparable GAAP financial measure, is presented in 'Management's Discussion and Analysis of Financial Condition and Results of Operations – Consolidated Results of Operations'.
Catastrophe and Weather-Related Losses Ratio and Current Accident Year Loss Ratio, excluding Catastrophe and Weather-Related Losses
Catastrophe and weather-related losses ratio represents net losses and loss expenses ratio associated with natural disasters, man-made catastrophes, other catastrophe events and other weather-related events exclusive of net favorable (adverse) prior year reserve development.
Current accident year loss ratio, excluding catastrophe and weather-related losses represents net losses and loss expenses ratio exclusive of net favorable (adverse) prior year reserve development and net losses and loss expenses associated with natural disasters, man-made catastrophes, other catastrophe events and other weather-related events.
We believe that the presentation of these ratios that separately identify net losses and loss expenses associated with catastrophe and weather-related events provide investors with an enhanced understanding of our results of operations due to the inherently unpredictable nature of the occurrence of these events, the potential magnitude of these losses and the complexity that affects our ability to accurately estimate ultimate losses associated with these events.
The reconciliation of catastrophe and weather-related losses ratio and current accident year loss ratio, excluding catastrophe and weather-related losses to net losses and loss expenses ratio, the most comparable GAAP financial measure, is presented in 'Management's Discussion and Analysis of Financial Condition and Results of Operations – Consolidated Results of Operations'.
Operating Income (Loss)
Operating income (loss) represents after-tax operational results exclusive of net investment gains (losses), foreign exchange losses (gains), reorganization expenses and interest in income (loss) of equity method investments and Bermuda net deferred tax asset.
Although the investment of premiums to generate income and investment gains (losses) is an integral part of our operations, the determination to realize investment gains (losses) is independent of the underwriting process and is heavily influenced by the availability of market opportunities. Furthermore, many users believe that the timing of the realization of investment gains (losses) is somewhat opportunistic for many companies.
Foreign exchange losses (gains) in our consolidated statements of operations primarily relate to the impact of foreign exchange rate movements on net insurance-related liabilities. However, we manage our investment portfolio in such a way
that unrealized and realized foreign exchange losses (gains) on our investment portfolio, including unrealized foreign exchange losses (gains) on our equity securities and foreign exchange losses (gains) realized on the sale of our available for sale investments and equity securities recognized in net investment gains (losses) and unrealized foreign exchange losses (gains) on our available for sale investments in other comprehensive income (loss), generally offset a large portion of the foreign exchange losses (gains) arising from our underwriting portfolio, thereby minimizing the impact of foreign exchange rate movements on total shareholders' equity. As a result, we believe that foreign exchange losses (gains) in our consolidated statements of operations in isolation are not a meaningful contributor to the performance of our business. Therefore, foreign exchange losses (gains) are excluded from operating income (loss).
Reorganization expenses in 2024 primarily related to severance costs attributable to our "How We Work" program which is focused on simplifying our operating structure. Reorganization expenses in 2023 primarily related to impairments of computer software assets and severance costs attributable to our "How We Work" program. Reorganization expenses in 2022 primarily related to severance costs and impairments of computer software assets mainly attributable to our exit from catastrophe and property reinsurance lines of business which was part of an overall approach to reduce our exposure to volatile catastrophe risk. Reorganization expenses are primarily driven by business decisions, the nature and timing of which are not related to the underwriting process. Therefore, these expenses are excluded from operating income (loss).
Interest in income (loss) of equity method investments is primarily driven by business decisions, the nature and timing of which are not related to the underwriting process. Therefore, this income (loss) is excluded from operating income (loss).
Bermuda net deferred tax asset is due to the recognition of deferred tax assets net of deferred tax liabilities related to a future Bermuda corporate income tax rate of 15%, pursuant to the Corporate Income Tax Act 2023 effective for fiscal years beginning on or after January 1, 2025. The Bermuda net deferred tax asset is not related to the underwriting process. Therefore, this income is excluded from operating income (loss).
Certain users of our financial statements evaluate performance exclusive of after-tax net investment gains (losses), foreign exchange losses (gains), reorganization expenses, and interest in income (loss) of equity method investments and Bermuda net deferred tax asset in order to understand the profitability of recurring sources of income.
We believe that showing net income (loss) available (attributable) to common shareholders exclusive of after-tax net investment gains (losses), foreign exchange losses (gains), reorganization expenses, interest in income (loss) of equity method investments and Bermuda net deferred tax asset reflects the underlying fundamentals of our business. In addition, we believe that this presentation enables investors and other users of our financial information to analyze performance in a manner similar to how our management analyzes the underlying business performance. We also believe this measure follows industry practice and, therefore, facilitates comparison of our performance with our peer group. We believe that equity analysts and certain rating agencies that follow us, and the insurance industry as a whole, generally exclude these items from their analyses for the same reasons. The reconciliation of operating income (loss) to net income (loss) available (attributable) to common shareholders, the most comparable GAAP financial measure, is presented above.
We also present operating income (loss) per diluted common share and operating ROACE, which are derived from the operating income (loss) measure and are reconciled above to the most comparable GAAP financial measures, earnings (loss) per diluted common share and return on average common equity ("ROACE"), respectively.
Constant Currency Basis
We present gross premiums written and net premiums earned on a constant currency basis in this MD&A. The amounts presented on a constant currency basis are calculated by applying the average foreign exchange rate from the current year to the prior year amounts. We believe this presentation enables investors and other users of our financial information to analyze growth in gross premiums written and net premiums earned on a constant basis. The reconciliation to gross premiums written and net premiums earned on a GAAP basis is presented in 'Management’s Discussion and Analysis of Financial Condition and Results of Operations – Results by Segment'.
Pre-Tax Total Return on Cash and Investments excluding Foreign Exchange Movements
Pre-tax total return on cash and investments excluding foreign exchange movements measures net investment income (loss), net investments gains (losses), interest in income (loss) of equity method investments, and change in unrealized gains (losses) generated by average cash and investment balances. We believe this presentation enables investors and other users of our financial information to analyze the performance of our investment portfolio. The reconciliation of pre-tax total return on cash and investments excluding foreign exchange movements to pre-tax total return on cash and investments, the most comparable GAAP financial measure, is presented in 'Management’s Discussion and Analysis of Financial Condition and Results of Operations – Net Investment Income and Net Investment Gains (Losses)'.
CASH AND INVESTMENTS
Details of cash and investments are as follows: | | | | | | | | | | | | | | | | | | | | | |
| | | | | | | | | |
| | | | December 31, 2024 | | | | December 31, 2023 | |
| | | | Fair value | | | | Fair value | |
| | | | | | | | | |
| Fixed maturities, available for sale | | | $ | 12,152,753 | | | | | $ | 12,234,742 | | |
| Fixed maturities, held to maturity(1) | | | 436,751 | | | | | 675,851 | | |
| Equity securities | | | 579,274 | | | | | 588,511 | | |
| Mortgage loans | | | 505,697 | | | | | 610,148 | | |
| Other investments | | | 930,278 | | | | | 949,413 | | |
| Equity method investments | | | 206,994 | | | | | 174,634 | | |
| Short-term investments | | | 223,666 | | | | | 17,216 | | |
| Total investments | | | $ | 15,035,413 | | | | | $ | 15,250,515 | | |
| | | | | | | | | |
| Cash and cash equivalents(2) | | | $ | 3,063,621 | | | | | $ | 1,383,985 | | |
| | | | | | | | | |
(1)Presented at net carrying value of $443 million (2023: $686 million) in the consolidated balance sheets.
(2)Includes restricted cash and cash equivalents of $920 million and $431 million for 2024 and 2023, respectively.
Overview
The fair value of total investments decreased by $215 million in 2024, as market value gains, reinvestment of interest income and cashflows from operations were offset by an increase in cash and cash equivalents.
Cash and Cash equivalents
At December 31, 2024, cash and cash equivalents were $3.1 billion compared to $1.4 billion at December 31, 2023, an increase of $1.7 billion, in anticipation of premiums to be paid for the LPT Agreement (refer to '2024 Financial, Highlights'), on receipt of regulatory approval.
An analysis of our investment portfolio by asset class is detailed below:
Fixed Maturities
Details of our fixed maturities portfolio are as follows:
| | | | | | | | | | | | | | | | | | | | | | | | | | | | | |
| | | | | | | | | |
| | December 31, 2024 | | December 31, 2023 | |
| | Fair value | | % of total | | Fair value | | % of total | |
| | | | | | | | | |
| Fixed maturities: | | | | | | | | |
| U.S. government and agency | $ | 2,802,986 | | | 22 | % | | $ | 3,007,528 | | | 23 | % | |
| Non-U.S. government | 729,939 | | | 6 | % | | 723,959 | | | 6 | % | |
| Corporate debt | 4,957,807 | | | 39 | % | | 4,560,843 | | | 35 | % | |
| Agency RMBS | 1,184,845 | | | 9 | % | | 1,634,661 | | | 13 | % | |
| CMBS | 819,608 | | | 7 | % | | 839,696 | | | 7 | % | |
| Non-agency RMBS | 122,536 | | | 1 | % | | 153,396 | | | 1 | % | |
| ABS | 1,860,966 | | | 15 | % | | 1,832,151 | | | 14 | % | |
| Municipals(1) | 110,817 | | | 1 | % | | 158,359 | | | 1 | % | |
| Total | $ | 12,589,504 | | | 100 | % | | $ | 12,910,593 | | | 100 | % | |
| | | | | | | | | |
| Credit ratings: | | | | | | | | |
| U.S. government and agency | $ | 2,802,986 | | | 22 | % | | $ | 3,007,528 | | | 23 | % | |
| AAA(2) | 2,665,334 | | | 21 | % | | 2,745,192 | | | 21 | % | |
| AA | 2,354,372 | | | 19 | % | | 2,646,798 | | | 21 | % | |
| A | 2,090,516 | | | 17 | % | | 2,044,683 | | | 16 | % | |
| BBB | 1,190,381 | | | 9 | % | | 1,416,552 | | | 11 | % | |
| Below BBB(3) | 1,485,915 | | | 12 | % | | 1,049,840 | | | 8 | % | |
| Total | $ | 12,589,504 | | | 100 | % | | $ | 12,910,593 | | | 100 | % | |
| | | | | | | | | |
(1)Includes bonds issued by states, municipalities, and political subdivisions.
(2)Includes U.S. government-sponsored agencies, residential mortgage-backed securities ("RMBS") and commercial mortgage-backed securities ("CMBS").
(3)Non-investment grade and non-rated securities.
At December 31, 2024, fixed maturities had a weighted average credit rating of A+ (2023: AA-), a book yield of 4.5% (2023: 4.2%), and an average duration of 2.8 years (2023: 3.0 years).
At December 31, 2024, fixed maturities together with short-term investments, and cash and cash equivalents (i.e., total investments of $15.9 billion) had a weighted average credit rating of AA- (2023: AA-) and an average duration of 2.5 years (2023: 2.7 years).
Our methodology for assigning credit ratings to fixed maturities is in line with the methodology used for the Barclays U.S. Aggregate Bond index. This methodology uses the midpoint of Standard & Poor's (S&P), Moody's and Fitch ratings. When ratings from only two of these agencies are available, the lower rating is used. When only one agency rates a security, that rating is used. When ratings provided by S&P, Moody's and Fitch are not available, ratings from other nationally recognized agencies are used.
To calculate the weighted average credit rating for fixed maturities, we assign points to each rating with the highest points assigned to the highest rating (AAA) and the lowest points assigned to the lowest rating (D) and then calculate the weighted average based on the fair values of the individual securities. Securities that are not rated are excluded from weighted average calculations. At December 31, 2024, the fair value of fixed maturities not rated was $3 million (2023: $17 million).
In addition to managing credit risk exposure within our fixed maturities portfolio we also monitor the aggregation of country risk exposure on a group-wide basis. Country risk exposure is the risk that events in a country, such as currency crises, regulatory changes and other political events, will adversely affect the ability of obligors in the country to honor their obligations. For corporate debt and structured securities, we measure the country of risk exposure based on a number of factors, including but not limited to location of management, principal operations and country of revenues.
An analysis of our fixed maturities portfolio by major asset classes is detailed below:
Non-U.S. Government
Non-U.S. government securities include bonds issued by non-U.S. governments and their agencies along with supranational organizations (collectively also known as sovereign debt securities).
Details of exposures to governments in the eurozone and other non-U.S. government concentrations by fair value are as follows:
| | | | | | | | | | | | | | | | | | | | | | | | | | | | | | | | | | | | | | | | | |
| | | | | | | | | | | | | |
| | December 31, 2024 | | December 31, 2023 | |
| Country | Fair value | | % of total | | Weighted
average
credit rating | | Fair value | | % of total | | Weighted
average
credit rating | |
| | | | | | | | | | | | | |
| Eurozone countries: | | | | | | | | | | | | |
| Supranationals(1) | $ | 43,494 | | | 6 | % | | AAA | | $ | 41,888 | | | 6 | % | | AAA | |
| Germany | 25,126 | | | 3 | % | | AAA | | 26,788 | | | 4 | % | | AAA | |
| Netherlands | 6,584 | | | 1 | % | | AAA | | 14,604 | | | 2 | % | | AA+ | |
| France | 6,127 | | | 1 | % | | A | | 2,637 | | | — | % | | A- | |
| | | | | | | | | | | | | |
| | | | | | | | | | | | | |
| | | | | | | | | | | | | |
| | | | | | | | | | | | | |
| | | | | | | | | | | | | |
| | | | | | | | | | | | | |
| Total eurozone | 81,331 | | | 11 | % | | AA+ | | 85,917 | | | 12 | % | | AAA | |
| | | | | | | | | | | | | |
| Other concentrations: | | | | | | | | | | | | |
| Canada | 322,111 | | | 44 | % | | AA+ | | 338,384 | | | 47 | % | | AA+ | |
| United Kingdom | 259,282 | | | 36 | % | | AA- | | 224,809 | | | 31 | % | | AA- | |
| Mexico | 3,303 | | | — | % | | BBB | | 7,478 | | | 1 | % | | BBB | |
| Other | 63,912 | | | 9 | % | | BBB | | 67,371 | | | 9 | % | | AA+ | |
| Total other concentrations | 648,608 | | | 89 | % | | AA | | 638,042 | | | 88 | % | | AA | |
| Total non-U.S. government | $ | 729,939 | | | 100 | % | | AA | | $ | 723,959 | | | 100 | % | | AA | |
| | | | | | | | | | | | | |
(1)Includes supranationals only in the eurozone.
At December 31, 2024, net unrealized losses on non-U.S. government securities were $23 million (2023: $6 million) which included gross unrealized foreign exchange losses of $19 million (2023: $6 million), mainly related to U.K. government bonds.
Corporate Debt
Corporate debt securities consist primarily of investment grade debt of a wide variety of corporate issuers and industries.
Details of our corporate debt securities portfolio by sector are as follows:
| | | | | | | | | | | | | | | | | | | | | | | | | | | | | | | | | | | | | | | | | |
| | | | | | | | | | | | | |
| | December 31, 2024 | | December 31, 2023 | |
| | Fair value | | % of total | | Weighted
average
credit rating | | Fair value | | % of total | | Weighted
average
credit rating | |
| | | | | | | | | | | | | |
| Financial institutions: | | | | | | | | | | | | |
| U.S. banks | $ | 679,827 | | | 14 | % | | A | | $ | 760,807 | | | 17 | % | | A | |
| Corporate/commercial finance | 558,577 | | | 11 | % | | BBB | | 465,953 | | | 10 | % | | BBB | |
| Non-U.S. banks | 411,074 | | | 8 | % | | A | | 397,097 | | | 9 | % | | A | |
| Insurance | 223,503 | | | 5 | % | | A- | | 150,553 | | | 3 | % | | A | |
| Investment brokerage | 132,237 | | | 3 | % | | BBB | | 104,881 | | | 2 | % | | BBB+ | |
| Total financial institutions | 2,005,218 | | | 41 | % | | A- | | 1,879,291 | | | 41 | % | | A- | |
| Consumer non-cyclicals | 515,072 | | | 10 | % | | BBB- | | 518,596 | | | 11 | % | | BBB | |
| Consumer cyclical | 506,912 | | | 10 | % | | BB | | 472,162 | | | 10 | % | | BB+ | |
| Communications | 336,192 | | | 7 | % | | BB+ | | 359,590 | | | 8 | % | | BBB- | |
| Industrials | 533,401 | | | 11 | % | | BB | | 451,066 | | | 10 | % | | BB | |
| Technology | 299,938 | | | 6 | % | | BB+ | | 230,864 | | | 5 | % | | BBB- | |
| Utilities | 253,756 | | | 5 | % | | A- | | 215,787 | | | 5 | % | | BBB+ | |
| Energy | 252,851 | | | 5 | % | | BBB- | | 204,682 | | | 4 | % | | BBB- | |
| Other | 254,467 | | | 5 | % | | A | | 228,805 | | | 6 | % | | A+ | |
| Total | $ | 4,957,807 | | | 100 | % | | BBB | | $ | 4,560,843 | | | 100 | % | | BBB | |
| | | | | | | | | | | | | |
| Credit quality summary: | | | | | | | | | | | | |
| Investment grade | $ | 3,477,840 | | | 70 | % | | A- | | $ | 3,537,795 | | | 78 | % | | A- | |
| Non-investment grade | 1,479,967 | | | 30 | % | | B+ | | 1,023,048 | | | 22 | % | | B+ | |
| Total | $ | 4,957,807 | | | 100 | % | | BBB | | $ | 4,560,843 | | | 100 | % | | BBB | |
| | | | | | | | | | | | | |
At December 31, 2024, our non-investment grade portfolio had a fair value of $1,480 million (2023: $1,023 million), a weighted average credit rating of B+ (2023: B+) and duration of 2.2 years (2023: 2.4 years). At December 31, 2024, our corporate debt portfolio, including non-investment grade securities, had a duration of 3.2 years (2023: 3.4 years).
Mortgage-Backed Securities
Details of the fair values of our RMBS and CMBS portfolios by credit rating are as follows:
| | | | | | | | | | | | | | | | | | | | | | | | | | | | | |
| | | | | | | | | |
| | December 31, 2024 | | December 31, 2023 | |
| | RMBS | | CMBS | | RMBS | | CMBS | |
| | | | | | | | | |
| Government agency | $ | 1,184,845 | | | $ | 142,214 | | | $ | 1,634,661 | | | $ | 69,973 | | |
| AAA | 115,115 | | | 614,801 | | | 144,437 | | | 711,636 | | |
| AA | 5,280 | | | 51,411 | | | 5,389 | | | 45,094 | | |
| A | 250 | | | 7,439 | | | 1,371 | | | 6,937 | | |
| BBB | 81 | | | 2,732 | | | 100 | | | 650 | | |
| Below BBB(1) | 1,810 | | | 1,011 | | | 2,099 | | | 5,406 | | |
| Total | $ | 1,307,381 | | | $ | 819,608 | | | $ | 1,788,057 | | | $ | 839,696 | | |
| | | | | | | | | |
(1)Non-investment grade securities and non-rated securities.
Residential MBS
Agency RMBS consist of bonds issued by the Federal National Mortgage Association, the Federal Home Loan Mortgage Corporation and the Government National Mortgage Association, which are primarily AA+ rated and are supported by loans which are diversified across geographical areas. At December 31, 2024, agency RMBS had an average duration of 5.2 years (2023: 5.2 years).
Non-agency RMBS mainly include investment grade bonds originated by non-agencies. At December 31, 2024, 98% (2023: 98%) of our non-agency RMBS were rated AA or better. At December 31, 2024, non-agency RMBS had an average duration of 4.3 years (2023: 4.0 years) and weighted average life of 5.4 years (2023: 5.6 years).
Commercial MBS
CMBS mainly include investment grade bonds originated by non-agencies. At December 31, 2024, 99% (2023: 98%) of our CMBS were rated AA or better. At December 31, 2024, the weighted average estimated subordination percentage of the portfolio was 34% (2023: 37%), which represents the current weighted average estimated percentage of the capital structure subordinated to the investment holding that is available to absorb losses before the security incurs the first dollar loss of principal. At December 31, 2024, CMBS had an average duration of 2.7 years (2023: 2.2 years) and weighted average life of 3.7 years (2023: 2.8 years).
Asset-Backed Securities
ABS mainly include investment grade bonds backed by pools of loans with a variety of underlying collateral, including auto loans, student loans, credit card receivables and collateralized loan obligations ("CLOs") originated by a variety of financial institutions.
Details of the fair value of our ABS portfolio by underlying collateral and credit rating are as follows:
| | | | | | | | | | | | | | | | | | | | | | | | | | | | | | | | | | | | | | | | | |
| | | | | | | | | | | | | |
| | Asset-backed securities | |
| | AAA | | AA | | A | | BBB | | Below BBB | | Total | |
| | | | | | | | | | | | | |
| At December 31, 2024 | | | | | | | |
| CLO - debt tranches | $ | 599,224 | | | $ | 303,480 | | | $ | 54,712 | | | $ | 29,861 | | | $ | — | | | $ | 987,277 | | |
| Auto loans | 447,594 | | | — | | | — | | | — | | | — | | | 447,594 | | |
| Student loans | 56,995 | | | 11,968 | | | — | | | — | | | — | | | 68,963 | | |
| Credit card receivables | 71,390 | | | 577 | | | — | | | — | | | — | | | 71,967 | | |
| Other | 262,632 | | | 674 | | | 16,747 | | | 3,527 | | | 1,585 | | | 285,165 | | |
| Total | $ | 1,437,835 | | | $ | 316,699 | | | $ | 71,459 | | | $ | 33,388 | | | $ | 1,585 | | | $ | 1,860,966 | | |
| % of total | 77% | | 17% | | 4% | | 2% | | —% | | 100% | |
| | | | | | | | | | | | | |
| At December 31, 2023 | | | | | | | |
| CLO - debt tranches | $ | 793,769 | | | $ | 334,573 | | | $ | 71,621 | | | $ | 28,419 | | | $ | — | | | $ | 1,228,382 | | |
| Auto loans | 267,430 | | | — | | | — | | | — | | | — | | | 267,430 | | |
| Student loans | 62,914 | | | 14,596 | | | — | | | — | | | — | | | 77,510 | | |
| Credit card receivables | 68,568 | | | 558 | | | — | | | — | | | — | | | 69,126 | | |
| Other | 155,826 | | | 7,888 | | | 18,879 | | | 6,763 | | | 347 | | | 189,703 | | |
| Total | $ | 1,348,507 | | | $ | 357,615 | | | $ | 90,500 | | | $ | 35,182 | | | $ | 347 | | | $ | 1,832,151 | | |
| % of total | 73% | | 20% | | 5% | | 2% | | —% | | 100% | |
| | | | | | | | | | | | | |
At December 31, 2024, the average duration our ABS portfolio was 1.0 year (2023: 0.6 years) and the weighted average life was 3.1 years (2023: 3.0 years).
Municipals
Municipals comprise revenue bonds and general obligation bonds issued by U.S. domiciled state and municipal entities and are primarily held in the taxable portfolios of our U.S. subsidiaries.
At December 31, 2024, our municipals had a fair value of $111 million (2023: $158 million), a weighted average credit rating of AA- (2023: AA-) and duration of 3.3 years (2023: 3.9 years).
Gross Unrealized Losses
At December 31, 2024, the gross unrealized losses on our fixed maturities, available for sale portfolio were $311 million (2023: $481 million).
Investment grade fixed maturities, available for sale
The severity of the unrealized loss position as a percentage of amortized cost for all investment grade fixed maturities in an unrealized loss position including any impact of foreign exchange losses (gains) was as follows: | | | | | | | | | | | | | | | | | | | | | | | | | | | | | | | | | | | | | | | | | |
| | | | | | | | | | | | | |
| | December 31, 2024 | | December 31, 2023 | |
| Severity of
Unrealized Loss | Fair value | | Gross
unrealized
losses | | % of
total gross
unrealized
losses | | Fair value | | Gross
unrealized
losses | | % of
total gross
unrealized
losses | |
| | | | | | | | | | | | | |
| 0-10% | $ | 5,564,985 | | | $ | (147,136) | | | 50 | % | | $ | 5,843,552 | | | $ | (194,115) | | | 42 | % | |
| 10-20% | 866,342 | | | (138,082) | | | 46 | % | | 1,590,548 | | | (245,428) | | | 52 | % | |
| 20-30% | 43,062 | | | (11,696) | | | 4 | % | | 102,208 | | | (26,886) | | | 6 | % | |
| 30-40% | 183 | | | (89) | | | — | % | | 193 | | | (79) | | | — | % | |
| 40-50% | — | | | — | | | — | % | | — | | | — | | | — | % | |
| > 50% | 132 | | | (41) | | | — | % | | 946 | | | (1,070) | | | — | % | |
| Total | $ | 6,474,704 | | | $ | (297,044) | | | 100 | % | | $ | 7,537,447 | | | $ | (467,578) | | | 100 | % | |
| | | | | | | | | | | | | |
The decrease in gross unrealized losses on investment grade fixed maturities primarily reflected the realization of losses throughout the year.
Non-investment grade fixed maturities, available for sale
The severity of the unrealized loss position as a percentage of amortized cost for all non-investment grade fixed maturities in an unrealized loss position including any impact of foreign exchange losses (gains) was as follows:
| | | | | | | | | | | | | | | | | | | | | | | | | | | | | | | | | | | | | | | | | |
| | | | | | | | | | | | | |
| | December 31, 2024 | | December 31, 2023 | |
| Severity of
Unrealized Loss | Fair value | | Gross
unrealized
losses | | % of
total gross
unrealized
losses | | Fair value | | Gross
unrealized
losses | | % of
total gross
unrealized
losses | |
| | | | | | | | | | | | | |
| 0-10% | $ | 643,929 | | | $ | (11,655) | | | 82 | % | | $ | 348,188 | | | $ | (9,597) | | | 74 | % | |
| 10-20% | 12,210 | | | (1,601) | | | 11 | % | | 23,295 | | | (3,073) | | | 24 | % | |
| 20-30% | 1,387 | | | (354) | | | 2 | % | | 1,475 | | | (112) | | | 1 | % | |
| 30-40% | 1,557 | | | (602) | | | 4 | % | | — | | | — | | | — | % | |
| 40-50% | 289 | | | (75) | | | 1 | % | | — | | | — | | | — | % | |
| > 50% | 4 | | | (4) | | | — | % | | 45 | | | (155) | | | 1 | % | |
| Total | $ | 659,376 | | | $ | (14,291) | | | 100 | % | | $ | 373,003 | | | $ | (12,937) | | | 100 | % | |
| | | | | | | | | | | | | |
The increase in gross unrealized losses on non-investment grade fixed maturities was a result of an increase in non-investment grade fixed income holdings.
Equity Securities
At December 31, 2024, net unrealized gains on equity securities were $59 million (2023: $45 million). The increase was driven by the rally in global equity markets.
Mortgage Loans
During 2024, investment in commercial mortgage loans decreased to $506 million from $610 million, a decrease of $104 million. The commercial mortgage loans are high quality, and collateralized by a variety of commercial properties and diversified geographically throughout the U.S. and by property type to reduce the risk of concentration. At December 31, 2024, the allowance for expected credit loss of $23 million (2023: $6 million) was primarily related to commercial properties exposed to the office sector.
Other Investments
Details of our other investments portfolio are as follows: | | | | | | | | | | | | | | | | | | | | | | | | | | | | | |
| | | | | | | | | |
| | December 31, 2024 | | December 31, 2023 | |
| | | | | | | | | |
| | | | | | | | | |
| | | | | | | | | |
| Multi-strategy funds | $ | 24,919 | | | 3 | % | | $ | 24,619 | | | 3 | % | |
| | | | | | | | | |
| | | | | | | | | |
| | | | | | | | | |
| Direct lending funds | 171,048 | | | 18 | % | | 192,270 | | | 20 | % | |
| Private equity funds | 320,690 | | | 35 | % | | 301,712 | | | 32 | % | |
| Real estate funds | 291,640 | | | 31 | % | | 317,325 | | | 33 | % | |
| Total multi-strategy, direct lending, private equity and real estate funds | 808,297 | | | 87 | % | | 835,926 | | | 88 | % | |
| | | | | | | | | |
| CLO-Equities | — | | | — | % | | 5,300 | | | 1 | % | |
| Other privately held investments | 121,981 | | | 13 | % | | 108,187 | | | 11 | % | |
| | | | | | | | | |
| Total other investments | $ | 930,278 | | | 100 | % | | $ | 949,413 | | | 100 | % | |
| | | | | | | | | |
Refer to Item 8, Note 5(e) to the Consolidated Financial Statements 'Investments'.
Equity Method Investments
Our ownership interests in Harrington Reinsurance Holdings Limited ("Harrington") and Monarch Point Re (ISAC) Ltd. and Monarch Point Re (ISA 2023) Ltd. (collectively "Monarch Point Re") are reported in interest in income (loss) of equity method investments.
Interest in income (loss) of equity method investments was $18 million in 2024 compared to $4 million in 2023, an increase of $14 million, principally attributable to net investment income and underwriting income related to these ownership interests.
Restricted Assets
Refer to Item 8, Note 5(j) to the Consolidated Financial Statements 'Investments'.
LIQUIDITY AND CAPITAL RESOURCES
Liquidity
Liquidity is a measure of a company’s ability to generate cash flows sufficient to meet the short-term and long-term cash requirements of its business operations. We manage liquidity at the holding company and operating subsidiary level.
Holding Company
As a holding company, AXIS Capital has no operations of its own and its assets consist primarily of investments in its subsidiaries. Accordingly, AXIS Capital’s future cash flows depend on the availability of dividends or other statutorily permissible distributions, such as returns of capital, from its subsidiaries.
The ability to pay such dividends and/or distributions is limited by the applicable laws and regulations of the various countries and states in which AXIS Capital’s subsidiaries operate (refer to Item 8, Note 22 to the Consolidated Financial Statements 'Statutory Financial Information' for further details), as well as the need to maintain capital levels to adequately support insurance and reinsurance operations, and to preserve financial strength ratings issued by independent rating agencies.
During 2024, AXIS Capital received $459 million (2023: $375 million) of distributions from its subsidiaries. AXIS Capital’s primary uses of funds are dividend payments to common and preferred shareholders, interest and principal payments on debt, capital investments in subsidiaries, and payment of corporate operating expenses. We believe the dividend/distribution capacity of AXIS Capital’s subsidiaries, that was $1.4 billion at December 31, 2024 (2023: $0.9 billion) will provide AXIS Capital with sufficient liquidity for the foreseeable future.
Operating Subsidiaries
AXIS Capital’s operating subsidiaries primarily derive cash from the net inflow of premiums less claim payments related to underwriting activities and from net investment income. Historically, these cash receipts have been sufficient to fund the operating expenses of these subsidiaries, as well as to fund dividend payments to AXIS Capital. The subsidiaries’ remaining cash flows are generally invested in our investment portfolio and have also been used to fund common share repurchases in recent years.
The insurance and reinsurance business of our operating subsidiaries inherently provide liquidity, as premiums are received in advance (sometimes substantially in advance) of the time losses are paid. However, the amount of cash required to fund loss payments can fluctuate significantly from period to period, due to the low frequency/high severity nature of certain types of business we write.
Consolidated cash flows from operating, investing and financing activities in the last three years were as follows: | | | | | | | | | | | | | | | | | | | | | | | |
| | | | | | | |
| Total cash provided by (used in)(1) | 2024 | | 2023 | | 2022 | |
| | | | | | | |
| Operating activities | $ | 1,844,813 | | | $ | 1,255,559 | | | $ | 798,038 | | |
| Investing activities | 280,452 | | | (855,610) | | | (761,620) | | |
| Financing activities | (417,294) | | | (202,371) | | | (149,622) | | |
| Effect of exchange rate changes on cash | (28,335) | | | 11,754 | | | (29,833) | | |
| Increase (decrease) in cash and cash equivalents | $ | 1,679,636 | | | $ | 209,332 | | | $ | (143,037) | | |
| | | | | | | |
(1) Refer to Item 8, 'Consolidated Statements of Cash Flows' for further details.
Operating activities
•Net cash provided by operating activities was $1,845 million in 2024 compared to $1,256 million in 2023. Cash inflows from insurance and reinsurance operations typically include premiums, net of acquisition costs, and reinsurance recoverables. Cash outflows principally include payments of losses and loss expenses, payments of premiums to reinsurers and operating expenses. Cash provided by operating activities can fluctuate due to timing differences between the collection of premiums and reinsurance recoverables and the payment of losses and loss expenses, and the payment of premiums to reinsurers.
•Operating cash inflows increased in 2024 compared to 2023, primarily attributable to increases in premiums received, reinsurance recoverables received, and interest and dividends received from our investment portfolio together with a decrease in payments of premiums to reinsurers partially offset by an increase in payments of losses and loss expenses.
Investing activities
•Investing cash inflows in 2024 were principally related to the net proceeds from the sale and redemption of fixed maturities of $281 million, unsettled payable for reverse repurchase agreements included in cash and cash equivalents of $247 million, net proceeds from the sales of other investments of $66 million and equity securities of $40 million, and the net proceeds from the sales and repayment of mortgage loans of $81 million, partially offset by net purchases of short-term investments of $204 million and loan advances made to third party reinsurers of $199 million.
•Investing cash outflows in 2023 were principally related to the net purchases of fixed maturities of $554 million, equity securities of $34 million, equity method investments of $22 million, loan advances made to third party reinsurers of $350 million and purchases of other assets of $31 million, partially offset by the net proceeds from the sale of other investments of $67 million and net proceeds from the sales and redemptions/repayments of short-term investments of $56 million and mortgage loans of $12 million.
Financing activities
•Financing cash outflows in 2024 were principally due to the repurchase of common shares of $216 million, dividends paid to common and preferred shareholders of $182 million, and the repayment of the Federal Home Loan Bank advances of $19 million.
•Financing cash outflows in 2023 were principally due to dividends paid to common and preferred shareholders of $184 million, and the repurchase of common shares of $24 million, partially offset by the receipt of the Federal Home Loan Bank advances of $5 million.
•The declaration and payment of future dividends and share repurchases is at the discretion of our Board of Directors and will depend on many factors including, but not limited to, our net income, financial condition, business needs, capital and surplus requirements of our operating subsidiaries and regulatory and contractual restrictions, including those detailed in our credit facilities (refer to 'Capital Resources – Share Repurchases' below for further details).
We have generated positive operating cash flows in all years since 2003, with the exception of 2009 which was impacted by the global financial crisis. These positive cash flows were generated even with the recognition of significant catastrophe and weather-related losses including the impact of the COVID-19 pandemic in 2020 and 2021.
Net losses and loss expenses, gross of reinstatement premiums, included estimates of ultimate losses for catastrophe and weather-related losses of $226 million in 2024, $138 million in 2023 and $404 million in 2022. There remains significant uncertainty associated with estimates of ultimate losses for certain of these events (refer to 'Underwriting Results – Insurance segment – Current Accident Year Loss' and 'Underwriting Results – Reinsurance segment – Current Accident Year Loss Ratio' for further details), as well as the timing of the associated cash outflows.
Should claim payment obligations accelerate beyond our ability to fund payments from operating cash flows, we would utilize cash and cash equivalent balances and/or liquidate a portion of our investment portfolio.
For context, at January 1, 2024, our largest 1-in-250 year return period, single occurrence, single-zone modeled probable maximum loss (Southeast U.S. Hurricane) was approximately $228 million, net of reinsurance. Claim payments pertaining to such an event would be paid out over a period spanning many months. Our internal risk tolerance framework aims to limit the loss of capital due to a single event and the loss of capital that would occur from multiple but perhaps smaller events, in any year (refer to Item 1 'Risk and Capital Management' for further details).
Our investment portfolio is heavily weighted towards conservative, high quality and highly liquid securities. We expect that, if necessary, cash and invested assets of approximately $15.2 billion at December 31, 2024 (2023 $13.6 billion) could be available in one to three business days under normal market conditions. Of this amount, $6.9 billion (2023 $5.3 billion) related to restricted assets, which primarily support our obligations in regulatory jurisdictions where we operate as a non-admitted carrier (refer to Item 8, Note 5(j) to the Consolidated Financial Statements 'Investments' for further details).
We expect that cash flows generated from operations, combined with the liquidity provided by our investment portfolio, to be sufficient to cover required cash outflows and other contractual commitments through the foreseeable future (refer to 'Contractual Obligations and Commitments' below for further details).
Capital Resources
In addition to common equity, we have utilized other external sources of financing, including debt, preferred shares, and letter of credit facilities to support our business operations. We believe that we hold sufficient capital to allow us to take advantage of market opportunities and to maintain our financial strength ratings, as well as to comply with various local statutory regulations. We monitor capital adequacy on a regular basis and adjust our capital base according to the needs of our business (refer to Item 1 'Risk and Capital Management' for further details).
The following table summarizes consolidated capital: | | | | | | | | | | | | | | | | | |
| | | | | |
| At December 31, | 2024 | | 2023 | |
| | | | | |
| Debt | $ | 1,315,179 | | | $ | 1,313,714 | | |
| | | | | |
| Preferred shares | 550,000 | | | 550,000 | | |
| Common equity | 5,539,379 | | | 4,713,196 | | |
| Shareholders’ equity | 6,089,379 | | | 5,263,196 | | |
| Total capital | $ | 7,404,558 | | | $ | 6,576,910 | | |
| | | | | |
| Ratio of debt to total capital | 17.8 | % | | 20.0 | % | |
| | | | | |
| | | | | |
We finance our operations with a combination of debt and equity capital. The debt to total capital ratio provides an indication of our capital structure, along with some insight into our financial strength.
We believe that our financial flexibility remains strong. Adjustments are made if developments occur that are different from previous expectations.
Debt
Debt represents the 5.150% Senior Notes issued in 2014, which will mature in 2045, the 4.000% Senior Notes issued in 2017, which will mature in 2027, the 3.900% Senior Notes issued in 2019, which will mature in 2029, and the 4.900% Junior Subordinated Notes issued in 2019, which will mature in 2040 (refer to Item 8, Note 10(a) to the Consolidated Financial Statements 'Debt and Financing Arrangements' for further details).
The 3.900% Senior Notes and the 4.900% Junior Subordinated Notes were issued to finance the repayment of $500 million aggregate principal amount of 5.875% Senior Notes that matured in June 2020 and to finance the redemption of Series D preferred shares on January 17, 2020 (refer to 'Preferred Shares' below for further details).
Federal Home Loan Bank Advances
The Company's subsidiaries, AXIS Insurance Company and AXIS Surplus Insurance Company, are members of the Federal Home Loan Bank of Chicago ("FHLB").
Members may borrow from the FHLB at competitive rates subject to certain conditions. At December 31, 2024, the companies had admitted assets of approximately $3.2 billion (2023: $3.0 billion) which provides borrowing capacity of up to approximately $798 million (2023: $759 million). Conditions of membership include maintaining sufficient collateral deposits for funding, a requirement to maintain member stock at 0.4% of mortgage-related assets at December 31st of the prior year, and a requirement to purchase additional member stock of 2.0% or 4.5% of any amount borrowed (refer to Item 8, Note 11 to the Consolidated Financial Statements 'Federal Home Loan Bank Advances').
At December 31, 2024, the Company had borrowings under the FHLB program of $66 million (2023: $86 million). On September 11, 2024, the Company repaid borrowings under the FHLB program of $10 million, at their stated maturity. On October 31, 2024, the Company repaid borrowings under the FHLB program of $9 million, at their stated maturity.
The FHLB advances have maturities in 2025 and interest payable at interest rates between 4.5% and 5.5% (2023: 5.6% and 5.9%). For the year ended December 31, 2024, the Company incurred interest expense of $4 million (2023: $5 million). The borrowings under the FHLB program are secured by cash and investments with a fair value of $72 million (2023: $95 million).
Preferred Shares
Series E Preferred Shares
On November 7, 2016, we issued $550 million of 5.50% Series E preferred shares with a liquidation preference of $2,500 per share (equivalent to $25 per depositary share). Dividends on the Series E preferred shares are non-cumulative. To the extent declared, dividends accumulate, with respect to each dividend period, in an amount per share equal to 5.50% of the liquidation preference per annum (equivalent to $137.50 per Series E preferred share and $1.375 per depositary share). We could redeem these shares on or after November 7, 2021 at a redemption price of $2,500 per Series E preferred share (equivalent to $25 per depositary share) (refer to Item 8, Note 15 to the Consolidated Financial Statements 'Shareholders' Equity' for further details).
Secured Letter of Credit Facilities
We routinely enter into agreements with financial institutions to obtain secured letter of credit facilities.
These facilities are primarily used for the issuance of letters of credit, in the normal course of operations, to certain insurance and reinsurance entities that purchase reinsurance protection from us. These letters of credit allow those operations to take credit, under local insurance regulations, for reinsurance obtained in jurisdictions where AXIS Capital’s subsidiaries are not licensed or otherwise admitted as an insurer. The value of our letters of credit outstanding is driven by, among other factors, the amount of unearned premiums, development of loss reserves, the payment patterns of loss reserves, the expansion of our business and the loss experience of that business.
A portion of these facilities may also be used for liquidity purposes.
At December 31, 2024, certain of AXIS Capital’s operating subsidiaries (the "Participating Subsidiaries") had a $300 million letter of credit facility available from Citibank Europe plc ("Citibank") (the "$300 million Facility").
At December 31, 2024, letters of credit outstanding were $235 million (2023: $325 million) (refer to Item 8, Note 10 to the Consolidated Financial Statements 'Debt and Financing Arrangements' for further details).
Common Equity
During the year ended December 31, 2024, common equity increased by $826 million. The following table reconciles opening and closing common equity positions:
| | | | | | | | | | | | | | | | | | | | |
| | | | | | |
| Year ended December 31, | | 2024 | | 2023 | |
| | | | | | |
| Common equity - opening | | $ | 4,713,196 | | | $ | 4,089,910 | | |
| Share-based compensation expense | | 40,487 | | | 57,207 | | |
| Change in unrealized gains (losses) on available for sale investments, net of tax | | 122,042 | | | 396,036 | | |
| Foreign currency translation adjustment | | (23,763) | | | (1,572) | | |
| Net income | | 1,081,786 | | | 376,292 | | |
| Preferred share dividends | | (30,250) | | | (30,250) | | |
| Common share dividends | | (150,495) | | | (152,536) | | |
| Treasury shares repurchased | | (215,868) | | | (23,596) | | |
| | | | | | |
| | | | | | |
| Treasury shares reissued | | 2,244 | | | 1,705 | | |
| Common equity - closing | | $ | 5,539,379 | | | $ | 4,713,196 | | |
| | | | | | |
Share Repurchases
During 2024, we repurchased 3.1 million common shares for a total of $216 million, including $200 million repurchased pursuant to our Board-authorized share repurchase program, and $16 million from employees to facilitate the satisfaction of their personal withholding tax liabilities that arise on vesting of share-settled restricted stock units granted under our 2017 Long-Term Equity Compensation Plans.
At June 30, 2024, authorization under the Company's share repurchase program approved in December 2023 was exhausted.
On May 16, 2024, the Company's Board of Directors approved a new share repurchase program for up to $300 million of the Company's common shares. The new share repurchase program is open-ended, allowing the Company to repurchase its shares from time to time in the open market or privately negotiated transactions, depending on market conditions. At December 31, 2024, we had $200 million of remaining authorization under our open-ended Board-authorized share repurchase program for common share repurchases.
Refer to Item 5 'Market for Registrant's Common Equity, Related Stockholder Matters and Issuer Purchases of Equity Securities' and Item 8, Note 15 to the Consolidated Financial Statements 'Shareholders' Equity' for further details.
Shelf Registrations
On November 9, 2022, we filed an unallocated universal shelf registration statement with the SEC, which became effective on filing. Pursuant to the shelf registration, we may issue an unlimited amount of equity, debt, warrants, purchase contracts or a combination of these securities. Our intent and ability to issue securities pursuant to this registration statement will depend on market conditions at the time of any proposed offering.
Financial Strength Ratings
Operating subsidiaries
Our principal insurance and reinsurance operating subsidiaries are assigned financial strength ratings from internationally recognized rating agencies, including Standard & Poor’s, A.M. Best, and Moody’s Investors Service. These ratings are publicly announced and are available directly from the agencies, and on our website.
Financial strength ratings represent the opinions of the rating agencies on the overall financial strength of a company and its capacity to meet the obligations of its insurance and reinsurance contracts. Independent ratings are one of the important factors that establish a competitive position in insurance and reinsurance markets. The rating agencies consider many factors in determining the financial strength rating of an insurance company, including the relative level of statutory surplus necessary to support the business operations of the company. These ratings are based on factors considered by the rating agencies to be relevant to policyholders, agents and intermediaries and are not directed toward the protection of investors. Ratings are not recommendations to buy, sell or hold securities.
The following are the most recent financial strength ratings from internationally recognized agencies in relation to our principal insurance and insurance operating subsidiaries:
| | | | | | | | | | | | | | | | | | | | | | | | | | | | | | | | |
| | | | | | | | | | |
| Rating agency | | Agency’s description of rating | | Rating and outlook | | Agency’s rating
definition | | Ranking of rating | |
| | | | | | |
| Standard & Poor’s | | An "opinion about the financial security characteristics of an insurance organization, with respect to its ability to pay under its insurance policies and contracts, in accordance with their terms". | | A+ (Stable) (1) | | "Strong capacity to meet its financial commitments" | | The 'A' category is the third highest out of ten major rating categories. The second through eighth major rating categories may be modified by the addition of a plus or minus sign to show relative standing within the major rating categories. | |
| | | | | | |
| A.M. Best | | An "opinion of an insurer’s financial strength and ability to meet its ongoing insurance policy and contract obligations". | | A (Stable) | | "Excellent ability to meet ongoing insurance obligations" | | The 'A' category is the third highest rating out of fourteen. Ratings outlooks ('Positive', 'Negative' and 'Stable') are assigned to indicate a rating’s potential direction over an intermediate term, generally defined as 36 months. | |
| | | | | | |
| Moody’s Investors Service | | "Opinions of the ability of insurance companies to pay punctually senior policyholder claims and obligations." | | A2 (Stable) (2)
| | "Offers good financial security" | | The 'A' category is the third highest out of nine rating categories. Each of the second through seventh categories are subdivided into three subcategories, as indicated by an appended numerical modifier of '1', '2' and '3'. The '1' modifier indicates that the obligation ranks in the higher end of the rating category, the '2' modifier indicates a mid-category ranking and the '3' modifier indicates a ranking in the lower end of the rating category. | |
(1) On July 20, 2022, Standard and Poor's revised its outlook from negative to stable due to improved underwriting performance and reduced prospective earnings volatility as a result of our exit from property and catastrophe reinsurance lines of business.
(2) On May 31, 2022, Moody's Investors Service revised its outlook from negative to stable due to improved core underwriting profitability and reduced catastrophe risk exposure.
Non-operating holding companies
On November 17, 2023, Standard and Poor's placed AXIS Capital Holding Limited and the securities guaranteed by this non-operating holding company on CreditWatch Negative due to the potential regulatory restrictions to payments from Bermuda-based insurance and reinsurance operating companies to non-operating holding companies.
On January 29, 2024, Standard and Poor's removed AXIS Capital Holdings Limited and related securities from Negative CreditWatch and affirmed the Issuer Credit Rating of AXIS Capital Holding Company at A- (Stable). In addition, Standard & Poor's also reaffirmed the A+ Financial Strength and issuer credit ratings on all core operating subsidiaries (Stable).
The stable outlook reflects Standard and Poor's expectation that AXIS will sustain its strong competitive position supported by solid, less-volatile underwriting performance, and will maintain capital adequacy at the 99.99% (or extreme stress) level in 2023-2025.
Contractual Obligations and Commitments
At December 31, 2024, contractual obligations and commitments by period due were: | | | | | | | | | | | | | | | | | | | | | | | | | | | | | | | | | | | | | | |
| | | | | | | | | | | | |
| | | Payment due by period | |
| Contractual obligations and commitments | | Total | | Less than 1
year | | 1-3 years | | 3-5 years | | More than
5 years | |
| | | | | | | | | | | | |
| Operating activities | | | | | | | | | | | |
| Estimated gross losses and loss expenses payments(1) | | $ | 17,218,929 | | | $ | 5,194,285 | | | $ | 5,778,979 | | | $ | 2,917,873 | | | $ | 3,327,792 | | |
| Operating lease obligations(2) | | 133,220 | | | 17,787 | | | 28,207 | | | 24,563 | | | 62,663 | | |
| Investing activities | | | | | | | | | | | |
| Unfunded investment commitments(3) | | 629,447 | | | 244,743 | | | 129,123 | | | 19,386 | | | 236,195 | | |
| Financing activities | | | | | | | | | | | |
| Debt (principal payments)(4) | | 1,325,000 | | | — | | | 350,000 | | | 300,000 | | | 675,000 | | |
| Debt (interest payments)(4)(5) | | 469,647 | | | 60,932 | | | 121,115 | | | 87,790 | | | 199,810 | | |
| Total | | $ | 19,776,243 | | | $ | 5,517,747 | | | $ | 6,407,424 | | | $ | 3,349,612 | | | $ | 4,501,460 | | |
| | | | | | | | | | | | |
(1)We are obligated to pay claims for specified loss events covered by the insurance and reinsurance contracts that we write. Loss payments represent our most significant future payment obligation. In contrast to our other contractual obligations, cash payments are not determinable from the terms specified within the underlying contracts. Our best estimate of reserve for losses and loss expenses is reflected in the table above. Actual amounts and timing may differ materially from our best estimate (refer to ‘Critical Accounting Estimates – Reserve for Losses and Loss Expenses’ for further details). We have not taken into account corresponding reinsurance recoverable on unpaid amounts that would be due to us.
(2)In the ordinary course of business, we renew and enter into new leases for office space that expire at various dates (refer to Item 8, Note 13 to the Consolidated Financial Statements 'Leases' for further details).
(3)We have $526 million of unfunded investment commitments related to our other investments portfolio, which are callable by our investment managers (refer to Item 8, Note 5(e) to the Consolidated Financial Statements 'Investments' and Note 12(e) to the Consolidated Financial Statements 'Commitment and Contingencies' for further details). In addition, we have $9 million of unfunded commitments related to our commercial mortgage loans portfolio and $94 million of unfunded commitments related to our corporate debt portfolio.
(4)Refer to Item 8, Note 10(a) to the Consolidated Financial Statements 'Debt and Financing Arrangements' for further details.
(5)Debt (interest payments) includes $10 million of unamortized discount and debt issuance expenses (refer to Item 8, Note 10(a) to the Consolidated Financial Statements 'Debt and Financing Arrangements' for further details).
CRITICAL ACCOUNTING ESTIMATES
The consolidated financial statements include certain amounts that are inherently uncertain and judgmental in nature. As a result, we are required to make assumptions and best estimates to determine the reported values. We consider an accounting estimate to be critical if: (1) it requires that significant assumptions be made to deal with uncertainties and (2) changes in the estimate could have a material impact on our results of operations, financial condition, or liquidity.
We believe that the material items requiring such subjective and complex estimates are:
•reserves for losses and loss expenses;
•reinsurance recoverable on unpaid losses and loss expenses, including the allowance for expected credit losses;
•gross premiums written and net premiums earned;
•fair value measurements of financial assets and liabilities; and
•the allowance for credit losses associated with fixed maturities, available for sale.
Significant accounting policies are also important to understanding the consolidated financial statements (refer to Item 8, Note 2 to the Consolidated Financial Statements 'Basis of Presentation and Significant Accounting Policies' for further details).
We believe that the amounts included in the consolidated financial statements reflect management's best judgment. However, factors such as those described in Item 1A 'Risk Factors' could cause actual events or results to differ materially from the underlying assumptions and estimates which could lead to a material adverse impact on our results of operations, financial condition, or liquidity.
Reserve for Losses and Loss Expenses
Overview
We believe the most significant accounting judgment we make is the estimate of reserve for losses and loss expenses ("loss reserves"). Loss reserves represent management’s estimate of the unpaid portion of our ultimate liability for losses and loss expenses ("ultimate losses") for insured and reinsured events that have occurred at or before the balance sheet date. Loss reserves reflect claims that have been reported ("case reserves") to us and claims that have been incurred but not reported ("IBNR") to us. Loss reserves represent our best estimate of what the ultimate settlement and administration of claims will cost, based on our assessment of facts and circumstances known at that particular point in time.
Loss reserves are not an exact calculation of the liability but instead are complex estimates. The process of estimating loss reserves involves a number of variables (refer to 'Selection of Reported Reserves – Management's Best Estimate' below for further details). We review estimates of loss reserves each reporting period and consider all significant facts and circumstances known at that particular point in time. As additional experience and other data become available and/or laws and legal interpretations change, we may adjust previous estimates of loss reserves. Adjustments are recognized in the period in which they are determined. Therefore, they can impact that period's underwriting results either favorably, indicating that current estimates are lower than previous estimates, or adversely, indicating that current estimates are higher than previous estimates.
Case Reserves
With respect to insurance business, we are generally notified of losses by our insureds and/or their brokers. Based on this information, our claims personnel estimate ultimate losses arising from the claim, including the cost of administering the claims settlement process. These estimates reflect the judgment of our claims personnel based on general reserving practices, the experience and knowledge of such personnel regarding the nature of the specific claim and, where appropriate, the advice of legal counsel, loss adjusters and other relevant consultants.
With respect to reinsurance business, we are generally notified of losses by ceding companies and/or their brokers. For excess of loss contracts, we are typically notified of insured losses on specific contracts and record a case reserve for the estimated ultimate liability arising from the claim. For contracts written on a proportional basis, we typically receive aggregated claims information and record a case reserve for the estimated ultimate liability arising from the claim based on that information. Proportional reinsurance contracts typically require that losses in excess of pre-defined amounts be separately notified so we can adequately evaluate them. Our claims department evaluates each specific loss notification we receive and records additional case reserves when a ceding company’s reserve for a claim is not considered adequate. We also undertake an extensive program of cedant audits, using outsourced legal and industry experience where necessary. This allows us to review cedants’ claims administration practices to ensure that reserves are consistent with exposures, adequately established, and properly reported in a timely manner.
IBNR
The estimation of IBNR is necessary due to potential development on reported claims and the time lag between when a loss event occurs and when it is actually reported, which is referred to as a reporting lag. Reporting lags may arise from a number of factors, including but not limited to the nature of the loss, the use of intermediaries and complexities in the claims adjusting process. As we do not have specific information on IBNR, it must be estimated. IBNR is calculated by deducting incurred losses (i.e., paid losses and case reserves) from management’s best estimate of ultimate losses. In contrast to case reserves, which are established at the contract level, IBNR reserves are generally estimated at an aggregate level and cannot be identified as reserves for a particular loss event or contract (refer to 'Reserving for Catastrophic Events' below for further details).
Reserving Methodology
Refer to Item 8, Note 8 to the Consolidated Financial Statements 'Reserve for Losses and Loss Expenses – Reserving Methodology – Sources of Information' for a description of the collection and analysis of data used in our quarterly loss reserving process.
Refer to Item 8, Note 8 to the Consolidated Financial Statements 'Reserve for Losses and Loss Expenses – Reserving Methodology – Actuarial Analysis' for a description of the reserve estimation methods, Expected Loss Ratio Method ("ELR Method"), Loss Development Method (also referred to as the "Chain Ladder Method" or "Link Ratio Method") and Bornhuetter-Ferguson Method ("BF Method") which are commonly employed by our actuaries together with a discussion of their strengths and weaknesses.
Refer to Item 8, Note 8 to the Consolidated Financial Statements 'Reserve for Losses and Loss Expenses – Reserving Methodology – Key Actuarial Assumptions', which notes that the most significant assumptions used in our quarterly loss reserving process are expected loss ratios ("ELRs") and loss development patterns.
Gross Loss Reserves by Line of Business
Gross loss reserves for each of the reportable segments, segregated between case reserves and IBNR, by line of business are shown below:
| | | | | | | | | | | | | | | | | | | | | | | | | | | | | | | | | | | | | | | | | |
| | | | | | | | | | | | | |
| | 2024 | | 2023 | |
| At December 31, | Case reserves | | IBNR | | Total | | Case reserves | | IBNR | | Total | |
| | | | | | | | | | | | | |
| Insurance segment: | | | | | | | | | | | | |
| Property | $ | 571,477 | | | $ | 732,266 | | | $ | 1,303,743 | | | $ | 556,306 | | | $ | 523,713 | | | $ | 1,080,019 | | |
| Accident and health | 31,929 | | | 112,027 | | | 143,956 | | | 28,767 | | | 89,371 | | | 118,137 | | |
| Marine and aviation | 542,057 | | | 625,448 | | | 1,167,505 | | | 449,455 | | | 532,284 | | | 981,739 | | |
| Cyber | 167,657 | | | 688,807 | | | 856,464 | | | 192,784 | | | 589,018 | | | 781,802 | | |
| Professional lines | 677,277 | | | 2,637,017 | | | 3,314,294 | | | 685,083 | | | 2,523,194 | | | 3,208,277 | | |
| Credit and political risk(1) | (30,023) | | | 255,181 | | | 225,158 | | | (45,138) | | | 208,975 | | | 163,838 | | |
| Liability | 686,990 | | | 2,801,593 | | | 3,488,583 | | | 576,529 | | | 2,597,068 | | | 3,173,597 | | |
| Total Insurance | 2,647,364 | | | 7,852,339 | | | 10,499,703 | | | 2,443,786 | | | 7,063,623 | | | 9,507,409 | | |
| | | | | | | | | | | | | |
| Reinsurance segment: | | | | | | | | | | | | |
| Accident and health | 46,150 | | | 205,030 | | | 251,180 | | | 55,185 | | | 177,602 | | | 232,787 | | |
| Agriculture | 38,557 | | | 146,408 | | | 184,964 | | | 43,011 | | | 109,372 | | | 152,383 | | |
| Marine and aviation | 70,595 | | | 104,761 | | | 175,355 | | | 79,792 | | | 91,369 | | | 171,161 | | |
| Professional lines | 503,440 | | | 876,563 | | | 1,380,003 | | | 558,556 | | | 860,748 | | | 1,419,304 | | |
| Credit and surety | 172,794 | | | 258,121 | | | 430,915 | | | 171,298 | | | 196,735 | | | 368,033 | | |
| Motor | 744,467 | | | 403,558 | | | 1,148,025 | | | 809,811 | | | 372,331 | | | 1,182,142 | | |
| Liability | 793,040 | | | 1,637,890 | | | 2,430,930 | | | 733,697 | | | 1,694,122 | | | 2,427,818 | | |
| Run-off lines | | | | | | | | | | | | |
| Catastrophe | 204,448 | | | 204,697 | | | 409,145 | | | 373,031 | | | 196,573 | | | 569,604 | | |
| Property | 141,215 | | | 60,042 | | | 201,257 | | | 204,217 | | | 77,440 | | | 281,657 | | |
| Engineering | 71,833 | | | 35,617 | | | 107,452 | | | 86,877 | | | 34,842 | | | 121,720 | | |
| Total run-off lines | 417,496 | | | 300,356 | | | 717,854 | | | 664,125 | | | 308,855 | | | 972,981 | | |
| | | | | | | | | | | | | |
| Total Reinsurance | 2,786,539 | | | 3,932,687 | | | 6,719,226 | | | 3,115,475 | | | 3,811,134 | | | 6,926,609 | | |
| | | | | | | | | | | | | |
| Total | $ | 5,433,903 | | | $ | 11,785,026 | | | $ | 17,218,929 | | | $ | 5,559,261 | | | $ | 10,874,757 | | | $ | 16,434,018 | | |
| | | | | | | | | | | | | |
(1) Significant gross claims associated with certain credit and political risk contracts were paid in advance of recoveries being received from the corresponding security that resulted in negative gross case reserves of $(54) million at December 31, 2024 (2023: $(60) million) and related negative reinsurance recoverable on unpaid losses and loss expenses of $(27) million at December 31, 2024 (2023: $(29) million). Refer to 'Reserving for Credit and Political Risk Business' below for further details.
In order to capture the key dynamics of loss reserve development and potential volatility, lines of business should be considered according to their potential expected length of loss emergence and settlement, generally referred to as the "tail". Favorable development on prior accident year reserves indicates that current estimates are lower than previous estimates, while adverse development on prior accident year reserves indicates that current estimates are higher than previous estimates.
Although estimates of ultimate losses for shorter tail business are inherently more certain than for longer tail business, significant judgment is still required. For example, much of our excess insurance and excess of loss reinsurance business has high attachment points. Therefore, it is often difficult to estimate whether claims will exceed those attachment points. In addition, the inherent uncertainties relating to catastrophe events further add to the complexity of estimating potential exposure. Further, we use managing general agents ("MGAs") and other producers for certain business in the insurance segment, which can delay the reporting of loss information. We expect the majority of development for an accident year or underwriting year to be recognized in the subsequent one to three years.
Factors that contribute additional uncertainty to estimates for longer tail business include, but are not limited to:
•potential volatility of actuarial estimates, the number of years of development it takes to produce a significant incurred loss as a percentage of ultimate losses;
•inherent uncertainties about loss trends, claims inflation (e.g., medical, judicial, social) and general economic conditions; and
•the possibility of future litigation, legislative or judicial change that may impact future loss experience relative to prior industry loss experience relied on in reserve estimation.
Refer to Item 8, Note 8 to the Consolidated Financial Statements 'Reserve for Losses and Loss Expenses – Reserve for Losses and Loss Expenses – Prior Year Reserve Development' for a discussion of prior year reserve development by segment, line of business and accident year, and see further details specific to insurance and reinsurance credit and political risk business below.
Refer to 'Reserving for Credit and Political Risk Business' below for a discussion of specific loss reserving considerations related to insurance and reinsurance credit and political risk business below.
Reserving for Credit and Political Risk Business
Refer to Item 8, Note 8 to the Consolidated Financial Statements 'Reserve for Losses and Loss Expenses – 'Net incurred and Paid Claims Development Tables by Accident Year – Insurance segment – Insurance Credit and Political Risk' and 'Reserve for Losses and Loss Expenses – 'Net incurred and Paid Claims Development Tables by Accident Year – Reinsurance segment – Reinsurance Credit and Surety' for details of this line of business and the associated key actuarial assumptions.
An important and distinguishing feature of many of these contracts is the contractual right, subsequent to payment of a claim to an insured, to be subrogated to, or otherwise have an interest in, the insured’s rights of recovery under an insured loan or facility agreement. These estimated recoveries are recorded as an offset to credit and political risk gross loss reserves. The lag between the date of a claim payment and the ultimate recovery from the corresponding security can result in negative case reserves at a point in time. Significant gross claims associated with certain credit and political risk contracts were paid in advance of recoveries being received from the corresponding security that resulted in negative gross case reserves of $(54) million at December 31, 2024 (2023: $(60) million) and related negative reinsurance recoverable on unpaid losses and loss expenses of $(27) million at December 31, 2024 (2023: $(29) million). Refer to 'Critical Accounting Estimates – Reinsurance Recoverable on Unpaid Losses and Loss Expenses' for further details.
The nature of the underlying collateral is specific to each transaction. Therefore, we estimate the value of this collateral on a contract-by-contract basis. This valuation process is inherently subjective and involves the application of management’s judgment because active markets for the collateral often do not exist. Estimates of values are based on numerous inputs, including information provided by our insureds, as well as third-party sources including rating agencies, asset valuation specialists and other publicly available information. We also assess any post-event circumstances, including restructurings, liquidations and possession of asset proposals/agreements.
In some instances, on becoming aware of a loss event related to credit and political risk business, we negotiate a final settlement of all of our policy liabilities for a fixed amount. In most circumstances, this occurs when the insured moves to realize the benefit of the collateral that underlies the insured loan or facility and presents us with a net settlement proposal that represents a full and final payment by us under the terms of the policy. In consideration for this payment, we secure a cancellation of the policy, or a release of all claims, and waive our right to pursue a recovery of these settlement payments against the collateral that may have been available to us under the insured loan or facility agreement. In certain circumstances, cancellation by way of net settlement or full payment can result in an adjustment to the premium associated with the policy.
Additionally, when we consider prior year reserve development for the credit and political risk line of business, it is important to note that the multi-year nature of this business distorts loss ratios when a single accident year is considered in isolation. Premiums for these contracts generally earn evenly over the contract term, therefore, are reflected in multiple accident years. In contrast, losses incurred on these contracts, which can be characterized as low in frequency and high in severity, are reflected in a single accident year.
Refer to Item 8, Note 8 to the Consolidated Financial Statements 'Reserve for Losses and Loss Expenses – Reserve for Losses and Loss Expenses – Prior Year Reserve Development' for further details of prior year reserve development for the insurance and reinsurance credit and political risk lines of business.
Reserving for Catastrophic Events
Refer to Item 8, Note 8 to the Consolidated Financial Statements 'Reserve for Losses and Loss Expenses – Reserving Methodology – Reserving for Catastrophic Events' for further details.
In addition to those noted in Item 8, Note 8 to the Consolidated Financial Statements 'Reserve for Losses and Loss Expenses – Reserving Methodology – Reserving for Catastrophic Events' there are additional risks that affect our ability to accurately estimate ultimate losses for catastrophic events. For example, the estimates of loss reserves related to hurricanes and earthquakes can be affected by factors including, but not limited to, the inability to access portions of impacted areas, infrastructure disruptions, the complexity of factors contributing to losses, legal and regulatory uncertainties, complexities involved in estimating business interruption losses and additional living expenses, the impact of demand surge, fraud and the limited nature of information available. For hurricanes, additional complex coverage factors may include determining whether damage was caused by flooding or wind, evaluating general liability and pollution exposures, and mold damage. The timing of a catastrophe, for example, near the end of a reporting period, can also affect the level of information available to us to estimate loss reserves for that reporting period.
Results of operations for 2024 were impacted by natural and man-made catastrophe activity (refer to 'Underwriting Results – Insurance segment – Current Accident Year Loss Ratio' and 'Underwriting Results – Reinsurance segment – Current Accident Year Loss Ratio' for further details).
Selection of Reported Reserves – Management’s Best Estimate
Refer to Item 8, Note 8 to the Consolidated Financial Statements 'Reserve for Losses and Loss Expenses – Reserving Methodology – Selection of Reported Reserves – Management’s Best Estimate' for further details.
Independent Actuarial Review
On an annual basis, we engage an independent actuarial firm to provide an actuarial opinion on the reasonableness of loss reserves for each of our operating subsidiaries and statutory reporting entities as these actuarial opinions are required to meet various insurance regulatory requirements. The actuarial firm also discusses its conclusions from the annual review with management and presents its findings to the Audit Committee of the Board of Directors.
Sensitivity Analysis
While we believe that loss reserves at December 31, 2024 are adequate, new information, events or circumstances may result in ultimate losses that are materially greater or less than provided for in our loss reserves. As previously noted, there are many factors that may cause reserves to increase or decrease, particularly those related to catastrophe losses and longer tail lines of business.
Expected loss ratios are a key assumption in estimates of ultimate losses for business at an early stage of development. A higher expected loss ratio results in a higher ultimate loss estimate, and vice versa.
Assumed loss development patterns are another significant assumption in estimating loss reserves. Accelerating a loss reporting pattern (i.e., shortening the claim tail) results in lower ultimate losses, as the estimated proportion of losses already incurred would be higher.
The effect on estimates of gross loss reserves of reasonably likely changes in the two key assumptions used to estimate gross loss reserves at December 31, 2024 was as follows:
| | | | | | | | | | | | | | | | | | | | | | | |
| | | | | | | |
| INSURANCE | |
| Development pattern | Expected loss ratio | |
| | Higher Loss Reserves (Lower Loss Reserves) | |
| Property | 5% lower | | Unchanged | | 5% higher | |
| | | | | | | |
| 3 months shorter | $ | (106,929) | | | $ | (62,679) | | | $ | (17,177) | | |
| Unchanged | (43,132) | | | — | | | 47,100 | | |
| 3 months longer | 42,413 | | | 87,203 | | | 136,746 | | |
| | | | | | | |
| Accident and health | 5% lower | | Unchanged | | 5% higher | |
| | | | | | | |
| 3 months shorter | $ | (20,761) | | | $ | (12,288) | | | $ | (1,721) | | |
| Unchanged | (10,591) | | | — | | | 10,753 | | |
| 3 months longer | 35,025 | | | 49,774 | | | 63,040 | | |
| | | | | | | |
| Marine and aviation | 5% lower | | Unchanged | | 5% higher | |
| | | | | | | |
| 3 months shorter | $ | (63,371) | | | $ | (34,241) | | | $ | (5,111) | | |
| Unchanged | (29,959) | | | — | | | 30,154 | | |
| 3 months longer | 11,686 | | | 43,400 | | | 75,239 | | |
| | | | | | | |
| Cyber | 10% lower | | Unchanged | | 10% higher | |
| | | | | | | |
| 6 months shorter | $ | (98,088) | | | $ | (18,487) | | | $ | 60,147 | | |
| Unchanged | (68,961) | | | — | | | 76,700 | | |
| 6 months longer | (21,785) | | | 46,045 | | | 121,667 | | |
| | | | | | | |
| Professional lines | 10% lower | | Unchanged | | 10% higher | |
| | | | | | | |
| 6 months shorter | $ | (311,393) | | | $ | (89,458) | | | $ | 132,786 | | |
| Unchanged | (228,276) | | | — | | | 219,525 | | |
| 6 months longer | (120,136) | | | 113,038 | | | 346,656 | | |
| | | | | | | |
| Credit and political risk | 10% lower | | Unchanged | | 10% higher | |
| | | | | | | |
| 6 months shorter | $ | (6,786) | | | $ | (239) | | | $ | 5,214 | | |
| Unchanged | (6,572) | | | — | | | 5,476 | | |
| 6 months longer | (6,247) | | | 360 | | | 5,873 | | |
| | | | | | | |
| Liability | 10% lower | | Unchanged | | 10% higher | |
| | | | | | | |
| 6 months shorter | $ | (573,710) | | | $ | (331,990) | | | $ | (90,270) | | |
| Unchanged | (274,069) | | | — | | | 269,033 | | |
| 6 months longer | 46,525 | | | 348,454 | | | 650,382 | | |
| | | | | | | |
| | | | | | | | | | | | | | | | | | | | | | | |
| | | | | | | |
| REINSURANCE | |
| Development pattern | Expected loss ratio | |
| | Higher Loss Reserves (Lower Loss Reserves) | |
| Accident and health | 5% lower | | Unchanged | | 5% higher | |
| 3 months shorter | $ | (56,340) | | | $ | (46,924) | | | $ | (37,508) | | |
| Unchanged | (11,670) | | | — | | | 10,624 | | |
| 3 months longer | 53,109 | | | 66,749 | | | 80,263 | | |
| Agriculture | 5% lower | | Unchanged | | 5% higher | |
| 3 months shorter | $ | (8,341) | | | $ | — | | | $ | 8,945 | | |
| Unchanged | (8,340) | | | — | | | 8,944 | | |
| 3 months longer | (8,340) | | | — | | | 8,944 | | |
| Marine and aviation | 5% lower | | Unchanged | | 5% higher | |
| 3 months shorter | $ | (13,939) | | | $ | (9,885) | | | $ | (5,832) | | |
| Unchanged | (4,483) | | | — | | | 4,483 | | |
| 3 months longer | 5,049 | | | 9,944 | | | 14,840 | | |
| Professional lines | 10% lower | | Unchanged | | 10% higher | |
| 6 months shorter | $ | (132,279) | | | $ | (55,670) | | | $ | 23,612 | | |
| Unchanged | (76,044) | | | — | | | 79,349 | | |
| 6 months longer | (2,081) | | | 74,300 | | | 154,097 | | |
| Credit and surety | 10% lower | | Unchanged | | 10% higher | |
| 6 months shorter | $ | (45,315) | | | $ | (13,770) | | | $ | 17,776 | | |
| Unchanged | (32,264) | | | — | | | 32,429 | | |
| 6 months longer | (12,310) | | | 19,590 | | | 53,178 | | |
| Motor | 10% lower | | Unchanged | | 10% higher | |
| 6 months shorter | $ | (46,169) | | | $ | (17,383) | | | $ | 11,435 | | |
| Unchanged | (29,850) | | | — | | | 29,990 | | |
| 6 months longer | 9,941 | | | 36,605 | | | 63,518 | | |
| Liability | 10% lower | | Unchanged | | 10% higher | |
| 6 months shorter | $ | (305,463) | | | $ | (163,160) | | | $ | (22,997) | | |
| Unchanged | (151,442) | | | — | | | 148,857 | | |
| 6 months longer | 32,288 | | | 194,326 | | | 351,288 | | |
| Reinsurance run-off lines | 5% lower | | Unchanged | | 5% higher | |
| 3 months shorter | $ | (31,675) | | | $ | (4,953) | | | $ | 27,895 | | |
| Unchanged | (26,759) | | | — | | | 32,874 | | |
| 3 months longer | (20,253) | | | 6,537 | | | 39,451 | | |
| | | | | | | |
| | | | | | | |
| | | | | | | |
| | | | | | | |
| | | | | | | |
| | | | | | | |
| | | | | | | |
| | | | | | | |
| | | | | | | |
| | | | | | | |
| | | | | | | |
| | | | | | | |
| | | | | | | |
The results show the cumulative increase (decrease) in loss reserves across all accident years.
For example, if assumed loss development pattern for insurance property business was three months shorter with no accompanying change in ELR assumption, loss reserves may decrease by approximately $63 million. Each of the impacts detailed in the tables is estimated individually, without consideration for any correlation among key assumptions or among lines of business. Therefore, it would be inappropriate to take each of the amounts and add them together in an attempt to estimate total volatility. Additionally, it is noted that in some instances, for example the projection of catastrophe estimates or credit and political risks estimates, development patterns are not appropriate as more bespoke techniques are used. While we believe the variations in the expected loss ratios and loss development patterns presented could be reasonably expected, our historical loss data regarding variability is generally limited and actual variations may be greater or less than these amounts.
It is also important to note that the variations are not meant to be a "best-case" or "worst-case" series of scenarios and, therefore, it is possible that future variations in loss reserves may be more or less than the amounts presented. While we believe that these are reasonably likely scenarios, we do not believe this sensitivity analysis should be considered an actual reserve range.
Reinsurance Recoverable on Unpaid Losses and Loss Expenses
In the normal course of business, we purchase facultative and treaty reinsurance protection to limit ultimate losses and to reduce loss aggregation risk. To the extent that reinsurers do not meet their obligations under the reinsurance agreements, we remain liable. Consequently, we are exposed to credit risk associated with reinsurance recoverable on unpaid and paid losses and loss expenses to the extent that any of our reinsurers are unable or unwilling to pay claims.
Reinsurance recoverables on unpaid losses and loss expenses ("reinsurance recoverables") for each of the reportable segments, segregated between case reserves and IBNR, by line of business are shown below:
| | | | | | | | | | | | | | | | | | | | | | | | | | | | | | | | | | | | | | | | | |
| | | | | | | | | | | | | |
| | 2024 | | 2023 | |
| At December 31, | Case
reserves | | IBNR | | Total | | Case
reserves | | IBNR | | Total | |
| | | | | | | | | | | | | |
| Insurance segment: | | | | | | | | | | | | |
| Property | $ | 206,654 | | | $ | 269,708 | | | $ | 476,362 | | | $ | 194,760 | | | $ | 207,462 | | | $ | 402,222 | | |
| Accident and health | 709 | | | 8,856 | | | 9,565 | | | 1,411 | | | 1,595 | | | 3,006 | | |
| Marine and aviation | 148,426 | | | 199,636 | | | 348,062 | | | 153,065 | | | 125,149 | | | 278,215 | | |
| Cyber | 105,506 | | | 349,794 | | | 455,301 | | | 115,969 | | | 314,658 | | | 430,627 | | |
| Professional lines | 349,971 | | | 1,015,072 | | | 1,365,043 | | | 392,104 | | | 1,050,442 | | | 1,442,546 | | |
| Credit and political risk (1) | (14,827) | | | 50,129 | | | 35,302 | | | (21,575) | | | 56,767 | | | 35,191 | | |
| Liability | 396,119 | | | 1,710,401 | | | 2,106,520 | | | 315,641 | | | 1,569,591 | | | 1,885,232 | | |
| Total Insurance | 1,192,558 | | | 3,603,596 | | | 4,796,155 | | | 1,151,375 | | | 3,325,664 | | | 4,477,039 | | |
| | | | | | | | | | | | | |
| Reinsurance segment: | | | | | | | | | | | | |
| Accident and health | 8,462 | | | 53,262 | | | 61,724 | | | 8,556 | | | 40,758 | | | 49,314 | | |
| Agriculture | 1,858 | | | 9,059 | | | 10,917 | | | 5,917 | | | 2,425 | | | 8,343 | | |
| Marine and aviation | 12,896 | | | 13,377 | | | 26,273 | | | 19,432 | | | 13,754 | | | 33,185 | | |
| Professional lines | 96,241 | | | 344,331 | | | 440,572 | | | 89,621 | | | 280,724 | | | 370,345 | | |
| Credit and surety | 52,266 | | | 80,208 | | | 132,474 | | | 44,027 | | | 59,147 | | | 103,174 | | |
| Motor | 175,825 | | | 176,613 | | | 352,438 | | | 164,488 | | | 150,855 | | | 315,344 | | |
| Liability | 212,154 | | | 601,642 | | | 813,796 | | | 162,216 | | | 527,925 | | | 690,141 | | |
| Run-off lines | | | | | | | | | | | | |
| Catastrophe | 100,892 | | | 95,662 | | | 196,554 | | | 172,703 | | | 90,557 | | | 263,260 | | |
| Property | 11,302 | | | (1,475) | | | 9,827 | | | 12,788 | | | (31) | | | 12,757 | | |
| Engineering | 95 | | | 73 | | | 167 | | | 111 | | | 71 | | | 181 | | |
| Total run-off lines | 112,289 | | | 94,260 | | | 206,548 | | | 185,602 | | | 90,597 | | | 276,198 | | |
| | | | | | | | | | | | | |
| Total Reinsurance | 671,991 | | | 1,372,752 | | | 2,044,742 | | | 679,859 | | | 1,166,185 | | | 1,846,044 | | |
| | | | | | | | | | | | | |
| Total | $ | 1,864,549 | | | $ | 4,976,348 | | | $ | 6,840,897 | | | $ | 1,831,234 | | | $ | 4,491,849 | | | $ | 6,323,083 | | |
| | | | | | | | | | | | | |
(1) Significant gross claims associated with certain credit and political risk contracts were paid in advance of recoveries being received from the corresponding security that resulted in negative gross case reserves of $(54) million at December 31, 2024 (2023: $(60) million) and related negative reinsurance recoverables related to case reserves of $(27) million at December 31, 2024 (2023: $(29) million). Refer to 'Critical Accounting Estimates – Reserve for Losses and Loss Expenses – Reserving for Credit and Political Risk Business' for further details.
At December 31, 2024, reinsurance recoverables as a percentage of loss reserves was 40% (2023: 38%).
The recognition of reinsurance recoverables requires two key estimates as follows:
•The first estimate is the amount of loss reserves to be ceded to our reinsurers. This amount consists of amounts related to case reserves and amounts related to IBNR. Refer to Item 8, Note 2 to the Consolidated Financial Statements 'Basis of Presentation and Significant Accounting Policies' for further details.
•The second estimate is the amount of the reinsurance recoverable balance that we believe ultimately will not be collected from reinsurers. We are selective in choosing reinsurers, buying reinsurance principally from reinsurers with a strong financial condition and industry ratings. The amount we ultimately collect may differ from our estimate due to the ability and willingness of reinsurers to pay claims, which may be negatively impacted by factors such as insolvency, contractual disputes over contract language or coverage and/or other reasons. In addition, economic conditions and/or operational performance of a particular reinsurer may deteriorate, and this could also affect the ability and willingness of a reinsurer to meet their contractual obligations.
Consequently, we review reinsurance recoverables at least quarterly to estimate an allowance for expected credit losses. Refer to Item 8, Note 2 to the Consolidated Financial Statements 'Basis of Presentation and Significant Accounting Policies' for further details.
At December 31, 2024, the allowance for expected credit losses was $43 million (2023: $37 million). We have not written off any significant reinsurance recoverable balances in the last three years.
At December 31, 2024, the use of different assumptions could have a material effect on the allowance for expected credit losses. To the extent the creditworthiness of our reinsurers deteriorates due to an adverse event affecting the reinsurance industry, such as a large number of catastrophes, uncollectible amounts could be significantly greater than the allowance for expected credit losses. Given the various considerations used to estimate the allowance for expected credit losses, we cannot precisely quantify the effect a specific industry event may have on the allowance for expected credit losses.
At December 31, 2024, reinsurance recoverables on unpaid and paid losses and loss expenses included 17% that is fully collateralized by the Company’s reinsurers, 81% that is recoverable from reinsurers rated A- or higher by A.M. Best and 2% that is recoverable from reinsurers rated lower than A- by A.M. Best (2023: 14%, 83% and 3%, respectively). Refer to Item 8, Note 12 to the Consolidated Financial Statements 'Commitments and Contingencies' for an analysis of the credit risk associated with reinsurance recoverables.
Gross Premiums Written
Revenues primarily relate to premiums generated by our underwriting operations. The basis for recognizing gross premiums written varies by policy or contract type. Refer to Item 8, Note 2 to the Consolidated Financial Statements 'Basis of Presentation and Significant Accounting Policies' for further details.
Insurance Segment
For the majority of our insurance business, a fixed premium that is identified in the policy is recorded at the inception of the policy. This premium is adjusted if underlying insured values change. We actively monitor underlying insured values, and any adjustments to premiums are recognized in the period in which they are determined. Gross premiums written on a fixed premium basis accounted for 94% of the segment’s gross premiums written for the years ended December 31, 2024 and 2023. Some of this business is written through MGAs, third parties granted authority to bind risks on our behalf in accordance with our underwriting guidelines. For this business, premiums are recorded based on monthly statements received from MGAs or best estimates based on historical experience.
The remainder of our insurance business is written on a line slip or proportional basis, where we assume an agreed proportion of the premiums and losses of a particular risk or group of risks along with other unrelated insurers. As premiums for this business are not identified in the policy, premiums are recognized at the inception of the policy based on estimates provided by clients through brokers (refer to 'Reinsurance Segment' below for further details). We review these premium estimates on a quarterly basis and any adjustments to premium estimates are recognized in the period in which they are determined. Gross premiums written on a line slip or proportional basis accounted for 6% of the segment’s gross premiums written for the years ended December 31, 2024 and 2023.
For the credit and political risk line of business, we write certain policies on a multi-year basis. Premiums in respect of these policies are recorded at the inception of the policy based on management’s best estimate of premiums to be received, including assumptions relating to prepayments/refinancing. At December 31, 2024, the average duration of unearned premiums for credit and political risk line of business was 5.6 years (2023: 5.7 years).
Reinsurance Segment
The reinsurance segment provides cover to cedants (i.e., insurance companies) on an excess of loss or on a proportional basis. In most cases, cedants seek protection from us for business that they have not yet written at the time they enter into agreements with us. Therefore, cedants must estimate their underlying premiums when purchasing reinsurance cover from us.
Excess of loss reinsurance contracts with cedants typically include minimum or deposit premium provisions. For excess of loss reinsurance contracts, minimum or deposit premiums are generally considered to be the best estimate of premiums at the inception of the contract. The minimum or deposit premium is normally adjusted at the end of the contract period to reflect changes in the underlying risks in force during the contract period. Any adjustments to minimum or deposit premiums are recognized in the period in which they are determined. Gross premiums written for excess of loss reinsurance contracts accounted for 40% and 39% of the reinsurance segment’s gross premiums written for the years ended December 31, 2024 and 2023, respectively.
Many of our excess of loss reinsurance contracts also include provisions for automatic reinstatement of coverage in the event of a loss. In a year of significant loss events, reinstatement premiums will be higher than in a year in which there are no large loss events. Refer to Item 8, Note 2 to the Consolidated Financial Statements 'Basis of Presentation and Significant Accounting Policies' and 'Critical Accounting Estimates – Reserve for Losses and Loss Expenses' above for further details.
For proportional reinsurance contracts, premiums are recognized at the inception of the contract based on estimates to be received from ceding companies. We review these premium estimates on a quarterly basis and evaluate their reasonability in light of premiums reported by cedants. Factors contributing to changes in initial premium estimates may include:
•changes in renewal rates or rates of new business accepted by cedants (changes could result from changes in the relevant insurance market that could affect more than one of our cedants or could be a consequence of changes in the marketing strategy or risk appetite of an individual cedant);
•changes in underlying exposure values; and/or
•changes in rates being charged by cedants.
As a result of this review process, any adjustments to premium estimates are recognized in the period in which they are determined. Changes in premium estimates could be material to gross premiums written in the period. Changes in premium estimates could be also material to net premiums earned in the period in which they are determined, as any adjustment may be substantially or fully earned. Gross premiums written for proportional reinsurance contracts, including adjustments to premium estimates established in prior years, accounted for 60% and 61% of the reinsurance segment’s gross premiums written for the years ended December 31, 2024 and 2023, respectively.
Gross premiums written for proportional reinsurance contracts incepting during the year were as follows:
| | | | | | | | | | | | | | | | | | | | | | | |
| | | | | | | |
| Year ended December 31, | 2024 | | 2023 | | 2022 | |
| | | | | | | |
| Liability | $ | 365,854 | | | $ | 356,022 | | | $ | 376,462 | | |
| Accident and health | 310,907 | | | 298,577 | | | 307,082 | | |
| Professional lines | 343,208 | | | 280,381 | | | 236,454 | | |
| Credit and surety | 205,393 | | | 169,297 | | | 133,853 | | |
| Motor | 40,848 | | | 68,136 | | | 135,954 | | |
| Agriculture | 140,714 | | | 99,806 | | | 112,452 | | |
| Marine and aviation | 30,916 | | | 19,839 | | | 22,081 | | |
| Run-off lines | | | | | | |
| Catastrophe | — | | | 1,343 | | | 3,463 | | |
| Property | 297 | | | 3,000 | | | 60,204 | | |
| Engineering | — | | | — | | | — | | |
| Total run-off lines | 297 | | | 4,343 | | | 63,667 | | |
| | | | | | | |
| Total estimated premiums | $ | 1,438,137 | | | $ | 1,296,401 | | | $ | 1,388,005 | | |
| | | | | | | |
| Gross premiums written (reinsurance segment) | $ | 2,390,304 | | | $ | 2,215,761 | | | $ | 2,629,014 | | |
| As a % of total gross premiums written | 60 | % | | 59 | % | | 53 | % | |
| | | | | | | |
Historical experience has shown that cumulative adjustments to initial premium estimates for proportional reinsurance contracts have ranged from (2%) to 9% over the last 5 years.
We believe that a reasonably likely change to 2024 initial premium estimates for proportional reinsurance contracts would be 3% in either direction. A change in initial premium estimates of this magnitude would result in a change in gross premiums written of approximately $43 million. A change in initial premium estimates of this magnitude would not have a material impact on pre-tax net income, after considering current losses and loss expenses ratios together with acquisition cost ratios.
However, larger variations, positive or negative, are possible.
Net Premiums Earned
Premiums are earned over the period during which we are exposed to the underlying risk. Changes in circumstances subsequent to the inception of contracts can impact the earning periods. For example, when exposure limits for a contract are reached, any associated unearned premiums are fully earned. This can have a significant impact on net premiums earned, particularly for multi-year contracts such as those in the credit and political risk line of business.
Fixed premium insurance policies and excess of loss reinsurance contracts are generally written on a "losses occurring" or "claims made" basis over the term of the contract. Consequently, premiums are earned evenly over the contract term, which is generally 12 months.
Line slip or proportional insurance policies and proportional reinsurance contracts are generally written on a "risks attaching" basis, covering claims that relate to the underlying policies written during the terms of these contracts. As the underlying business incepts throughout the contract term which is typically one year, and the underlying business typically has a one year coverage period, these premiums are generally earned evenly over a 24-month period.
Fair Value Measurements of Financial Assets and Liabilities
Fair value is defined as the price to sell an asset or transfer a liability (i.e., the "exit price") in an orderly transaction between market participants. Refer to Item 8, Note 6 to the Consolidated Financial Statements 'Fair Value Measurements' for information on the valuation techniques, including significant inputs and assumptions generally used in estimating the fair values of our financial instruments.
Fixed Maturities and Equity Securities
At December 31, 2024, the fair values of 94% (2023: 94%) of total fixed maturities and equity securities were based on prices provided by globally recognized independent pricing services where we have a current and detailed understanding of how their prices were derived. The remaining securities were priced by either non-binding broker quotes or internal valuation models.
Generally, we obtain quotes directly from broker-dealers who are active in the corresponding markets when prices are unavailable from independent pricing services. This may also be the case if the pricing from pricing services is not reflective of current market levels, as detected by our pricing control tolerance procedures. Generally, broker-dealers value securities through their trading desks based on observable market inputs. Their pricing methodologies include mapping securities based on trade data, bids or offers, observed spreads and performance on newly issued securities. They may also establish pricing through observing secondary trading of similar securities.
At December 31, 2024 and 2023, we did not adjust any pricing provided by independent pricing services.
Management Pricing Validation
While we obtain pricing from independent pricing services and/or broker-dealers, management is ultimately responsible for determining the fair value measurements of all securities. To ensure fair value measurement is applied consistently and in accordance with U.S. GAAP, annually, we update our understanding of the pricing methodologies used by the pricing services and broker-dealers.
We also challenge any prices we believe may not be representative of fair value under current market conditions. Our review process includes, but is not limited to:
•initial and ongoing evaluation of the pricing methodologies and valuation models used by outside parties to calculate fair value;
•quantitative analysis;
•a review of multiple quotes obtained in the pricing process and the range of resulting fair values for each security, if available; and
•randomly selecting purchased or sold securities and comparing the executed prices to the fair value estimates provided by the independent pricing sources and broker-dealers.
Other Investments
Multi-strategy Funds, Direct Lending Funds, Private Equity Funds and Real Estate Funds
The fair values of multi-strategy funds, direct lending funds, private equity funds and real estate funds are estimated using net asset values (NAVs) as advised by external fund managers or third-party administrators. At December 31, 2024, the estimated fair value of our investments in these funds was $808 million (2023: $836 million). Refer to Item 8, Note 6 to the Consolidated Financial Statements 'Fair Value Measurements' for further details.
CLO-Equities
The fair values of CLO-Equities are estimated using a discounted cash flow model prepared by an external investment manager. At December 31, 2024, the estimated fair value of our indirect investment in CLO-Equities was $nil (2023: $5 million). Refer to Item 8, Note 6 to the Consolidated Financial Statements 'Fair Value Measurements' for further details.
Other Privately Held Investments
Other privately held investments include common shares, preferred shares, convertible notes, convertible preferred shares, investments in limited partnerships (refer to "private company investment funds" below), and a variable yield security.
These investments are initially valued at cost, which approximates fair value. In subsequent measurement periods, the fair values of these investments are derived from one or a combination of valuation methodologies which consider factors including recent capital raises by the investee companies, comparable precedent transaction multiples, comparable publicly traded multiples, third-party valuations, discounted cash-flow models, and other techniques that consider the industry and development stage of each investee company. The fair value of the variable yield security was determined using an externally developed discounted cash flow model.
At December 31, 2024, the estimated fair value of these investments was $92 million (2023: $87 million). Refer to Item 8, Note 6 to the Consolidated Financial Statements 'Fair Value Measurements' for further details.
Other privately held investments includes investments in private company investment funds focusing on financial services technology companies with an emphasis on insurance technology companies ("private company investment funds").
The fair values of private company investment funds are estimated using NAVs as advised by external fund managers or third-party administrators. At December 31, 2024, the estimated fair value of our investments in these funds was $30 million (2023: $21 million). Refer to Item 8, Note 6 to the Consolidated Financial Statements 'Fair Value Measurements' for further details.
Impairment Losses and the Allowance for Expected Credit Losses - Fixed Maturities, Available for Sale
Fixed maturities classified as available for sale are reported at fair value at the balance sheet date and are presented net of an allowance for expected credit losses. Our available for sale ("AFS") investment portfolio is the largest component of total assets, and it is a multiple of shareholders’ equity. As a result, impairment losses could be material to our results of operations and financial condition particularly during periods of dislocation in financial markets.
A fixed maturity, available for sale security is impaired if the fair value of the investment is below amortized cost. On a quarterly basis, the Company evaluates all fixed maturities, available for sale for impairment losses.
Details regarding our processes for the identification of impairments of fixed maturities, available for sale and the recognition of the related impairment losses are disclosed in Item 8, Note 2 to the Consolidated Financial Statements 'Basis of Presentation and Significant Accounting Policies'.
In addition, the methodologies and significant inputs used to estimate the allowance for expected credit losses are disclosed in Item 8, Note 5(i) to the Consolidated Financial Statements 'Investments'.
At December 31, 2024, we recorded an allowance for expected credit losses of $4 million (2023: $11 million) and for the year ended December 31, 2024, we recorded impairment losses of $nil (2023: $13 million) (refer to 'Net Investment Income and Net Investment Gains (Losses)' for further details). The allowance for expected credit loss is charged to net income (loss) and is included in net investment gains (losses) in the consolidated statements of operations.
Intent or Requirement to Sell
From time to time, we may sell fixed maturities, available for sale subsequent to the balance sheet date that we did not intend to sell at the balance sheet date. Conversely, we may not sell fixed maturities, available for sale that we intended to sell at the balance sheet date. These changes in intent may arise due to events occurring subsequent to the balance sheet date. The types of events that may result in a change in intent include, but are not limited to, significant changes in the economic facts and circumstances related to the specific issuer, changes in liquidity needs, or changes in tax laws or the regulatory environment.
U.S. Treasury Securities and Other Highly Rated Debt Instruments
Our credit impairment review process excludes fixed maturities, available for sale guaranteed, either explicitly or implicitly, by the U.S. government and its agencies (U.S. Government, U.S. Agency and U.S. Agency RMBS) because we anticipate these securities will not be settled below amortized cost. These securities are evaluated for intent or requirement to sell at a loss.
RECENT ACCOUNTING PRONOUNCEMENTS At December 31, 2024, there were no recently issued accounting pronouncements that we have not yet adopted that we expect could have a material impact on our results of operations, financial condition or liquidity.
ITEM 7A. QUANTITATIVE AND QUALITATIVE DISCLOSURE ABOUT MARKET RISK
Market risk is the risk that our financial instruments, which include derivatives, may be negatively impacted by movements in financial market prices or rates such as interest rates, credit spreads, equity securities' prices, and foreign currency exchange rates (refer to Item 1 'Risk and Capital Management' for further details).
We own a substantial amount of assets whose fair values are subject to market risks.
At December 31, 2024, 96% (2023: 95%) of fixed maturities are classified as available for sale, therefore changes in fair values caused by changes in interest rates and foreign currency exchange rates have an immediate impact on other comprehensive income (loss), total shareholders’ equity and book value per common share but do not have an immediate impact on net income (loss). Changes in these market risks impact net income (loss) when, and if, securities are sold, or an impairment charge or an allowance for expected credit losses is recorded.
Equity securities are reported at fair value, with changes in fair values recognized in net income (loss).
At December 31, 2024 and 2023, we also invested in alternative investments including multi-strategy funds, direct lending funds, private equity funds, real estate funds, CLO-Equities and other privately held investments. These investments are also exposed to market risks, with the changes in fair values immediately reported in net income (loss).
Sensitivity Analysis
The following is a sensitivity analysis of our primary market risk exposures at December 31, 2024 and 2023.
Our policies to address these risks in 2024 were not materially different from 2023. We do not currently anticipate significant changes in our primary market risk exposures or in how those exposures are managed in future reporting periods based on what is known or expected to be in effect in future reporting periods.
Interest Rate and Credit Spread Risk
Interest rate risk includes fluctuations in interest rates and credit spreads that have a direct impact on the fair values of fixed maturities. As interest rates rise and credit spreads widen, the fair value of fixed maturities falls.
We monitor sensitivity to interest rate and credit spread changes by revaluing fixed maturities using a variety of different interest rates (inclusive of credit spreads). We use duration and convexity at the security level to estimate the change in fair value that would result from a change in each security’s yield. Duration measures the price sensitivity of an asset to changes in yield rates. Convexity measures how the duration of the security changes with interest rates. The duration and convexity analysis take into account changes in prepayment expectations for MBS and ABS. The analysis is performed at the security level and aggregated to the asset category levels.
The following table presents the estimated pre-tax impact on the fair value of fixed maturities classified as available for sale due to an instantaneous increase in the U.S. yield curve of 100 basis points and an additional 100 basis point credit spread widening for corporate debt, non-agency commercial MBS and residential MBS, ABS and municipal bond securities:
| | | | | | | | | | | | | | | | | | | | | | | | | | | | | |
| | | | | | | | | |
| | Fair value | | Potential adverse change in fair value | |
Increase in
interest rate
by 100
basis points | | Widening of
credit spreads
by 100
basis points | | Total | |
| | | | | | | | | |
| At December 31, 2024 | | | | | | | | |
| U.S. government and agency | $ | 2,802,986 | | | $ | (60,634) | | | $ | — | | | $ | (60,634) | | |
| Non-U.S. government | 729,939 | | | (22,143) | | | — | | | (22,143) | | |
| Agency RMBS | 1,184,845 | | | (61,576) | | | — | | | (61,576) | | |
| | | | | | | | | |
| Securities exposed to credit spreads: | | | | | | | | |
| Corporate debt | 4,842,190 | | | (154,058) | | | (166,011) | | | (320,069) | | |
| CMBS | 819,608 | | | (21,745) | | | (24,749) | | | (46,494) | | |
| Non-agency RMBS | 122,536 | | | (5,287) | | | (5,090) | | | (10,377) | | |
| ABS | 1,539,832 | | | (17,343) | | | (35,727) | | | (53,070) | | |
| Municipals | 110,817 | | | (3,675) | | | (3,751) | | | (7,426) | | |
| | $ | 12,152,753 | | | $ | (346,461) | | | $ | (235,328) | | | $ | (581,789) | | |
| | | | | | | | | |
| At December 31, 2023 | | | | | | | | |
| U.S. government and agency | $ | 3,007,528 | | | $ | (81,945) | | | $ | — | | | $ | (81,945) | | |
| Non-U.S. government | 723,959 | | | (22,534) | | | — | | | (22,534) | | |
| Agency RMBS | 1,634,661 | | | (84,719) | | | — | | | (84,719) | | |
| | | | | | | | | |
| Securities exposed to credit spreads: | | | | | | | | |
| Corporate debt | 4,474,172 | | | (151,894) | | | (158,759) | | | (310,653) | | |
| CMBS | 839,696 | | | (18,120) | | | (21,917) | | | (40,037) | | |
| Non-agency RMBS | 153,396 | | | (6,158) | | | (5,849) | | | (12,007) | | |
| ABS | 1,242,971 | | | (10,436) | | | (36,132) | | | (46,568) | | |
| Municipals | 158,359 | | | (6,234) | | | (6,336) | | | (12,570) | | |
| | $ | 12,234,742 | | | $ | (382,040) | | | $ | (228,993) | | | $ | (611,033) | | |
| | | | | | | | | |
U.S. government agencies have a limited range of spread widening. Therefore, 100 basis points of spread widening for these securities is highly improbable in normal market conditions. Our non-U.S. government debt obligations are highly-rated, and we believe the potential for future widening of credit spreads would also be limited for these securities. Certain of our holdings in non-agency RMBS and ABS have floating interest rates, which mitigate interest rate risk exposure.
The above sensitivity analysis should not be construed as our prediction of future market events, but rather an illustration of the impact of such events.
In addition, our investment in bond mutual funds is exposed to interest rate risk. However, this exposure is largely mitigated by the short duration of the underlying securities.
Equity Price Risk
Our portfolio of equity securities, excluding the bond mutual funds, has exposure to equity price risk. This risk is defined as the potential loss in fair value resulting from adverse changes in stock prices. The global equity portfolio is managed to a benchmark composite index, which consists of a blend of the S&P 500 and MSCI World indices. Changes in the underlying indices have a corresponding impact on the overall portfolio. At December 31, 2024, the fair value of equity securities was $323 million (2023: $295 million). At December 31, 2024, the impact of a 20% decline in the overall market prices of our equity exposures would be $65 million (2023: $59 million), on a pre-tax basis.
Our investment in multi-strategy funds has significant exposure to equity strategies with net long positions. At December 31, 2024, the fair value of multi-strategy funds was $25 million (2023: $25 million). At December 31, 2024, the impact of an instantaneous 15% decline in the fair value of our investment in multi-strategy funds would be $4 million (2023: $4 million), on a pre-tax basis.
Foreign Currency Risk
The following table presents a sensitivity analysis of total net foreign currency exposures: | | | | | | | | | | | | | | | | | | | | | | | | | | | | | | | | | | | | | | | | | | | | | | | |
| | | | | | | | | | | | | | | |
| | AUD | | CAD | | EUR | | GBP | | JPY | | Other | | Total | |
| | | | | | | | | | | | | | | |
| At December 31, 2024 | | | | | | | | | | | | | | |
| Net managed assets (liabilities), excluding derivatives | $ | 87,511 | | $ | 366,541 | | $ | (344,739) | | $ | 15,836 | | $ | (38,893) | | $ | 88,887 | | $ | 175,143 | |
| Foreign currency derivatives, net | (69,834) | | (356,150) | | 290,800 | | 36,430 | | 35,648 | | (112,409) | | (175,515) | |
| Net managed foreign currency exposure | 17,677 | | 10,391 | | (53,939) | | 52,266 | | (3,245) | | (23,522) | | (372) | |
| Other net foreign currency exposure | — | | 55 | | (607) | | 19 | | — | | 1 | | (532) | |
| Total net foreign currency exposure | $ | 17,677 | | $ | 10,446 | | $ | (54,546) | | $ | 52,285 | | $ | (3,245) | | $ | (23,521) | | $ | (904) | |
| Net foreign currency exposure as a percentage of total shareholders’ equity | 0.3 | % | | 0.2 | % | | (0.9 | %) | | 0.9 | % | | (0.1 | %) | | (0.4 | %) | | — | % | |
| Pre-tax impact of net foreign currency exposure on shareholders’ equity given a hypothetical 10% rate movement(1) | $ | 1,768 | | $ | 1,045 | | $ | (5,455) | | $ | 5,229 | | $ | (325) | | $ | (2,352) | | $ | (90) | |
| | | | | | | | | | | | | | | |
| At December 31, 2023 | | | | | | | | | | | | | | |
| Net managed assets (liabilities), excluding derivatives | $ | 38,348 | | $ | 430,256 | | $ | (452,726) | | $ | (145,992) | | $ | (43,047) | | $ | 56,012 | | $ | (117,149) | |
| Foreign currency derivatives, net | (23,240) | | (403,952) | | 401,195 | | 127,122 | | 24,317 | | (114,294) | | 11,148 | |
| Net managed foreign currency exposure | 15,108 | | 26,304 | | (51,531) | | (18,870) | | (18,730) | | (58,282) | | (106,001) | |
| Other net foreign currency exposure | — | | 175 | | (555) | | (59) | | — | | — | | (439) | |
| Total net foreign currency exposure | $ | 15,108 | | $ | 26,479 | | $ | (52,086) | | $ | (18,929) | | $ | (18,730) | | $ | (58,282) | | $ | (106,440) | |
| Net foreign currency exposure as a percentage of total shareholders’ equity | 0.3 | % | | 0.5 | % | | (1.0 | %) | | (0.4 | %) | | (0.4 | %) | | (1.1 | %) | | (2.0 | %) | |
| Pre-tax impact of net foreign currency exposure on shareholders’ equity given a hypothetical 10% rate movement(1) | $ | 1,511 | | $ | 2,648 | | $ | (5,209) | | $ | (1,893) | | $ | (1,873) | | $ | (5,828) | | $ | (10,644) | |
| | | | | | | | | | | | | | | |
(1)Assumes 10% appreciation in underlying currencies relative to the U.S. dollar.
Net Managed Foreign Currency Exposure
Our net managed foreign currency exposure is subject to internal risk tolerance standards. For significant foreign currency exposures, defined as those where net asset/liability position exceeds the greater of 1% of total shareholders' equity or $50 million, the value of assets denominated in those currencies should fall within a range of 90 - 110% of liabilities denominated in the same currency. In addition, aggregate foreign currency exposure is subject to the same tolerance range. We may use derivative instruments to maintain net managed foreign currency exposures within our risk tolerance levels.
Other Net Foreign Currency Exposure
In 2024, other net foreign currency exposure primarily consisted of residual foreign currency exposure from externally managed portfolios where the external manager hedges the foreign currency exposure.
During 2023, other net foreign currency exposure primarily consisted of residual foreign currency exposure from externally managed portfolios where the external manager hedges the foreign currency exposure.
ITEM 8. FINANCIAL STATEMENTS AND SUPPLEMENTARY DATA
| | | | | | | | |
| Index to Consolidated Financial Statements and Accompanying Notes | Page |
| |
| Report of Independent Registered Public Accounting Firm - PCAOB ID No. 5230 | . | |
| |
| Consolidated Balance Sheets at December 31, 2024 and 2023 | |
| |
| Consolidated Statements of Operations for the years ended December 31, 2024, 2023 and 2022 | |
| |
| Consolidated Statements of Comprehensive Income (Loss) for the years ended December 31, 2024, 2023 and 2022 | |
| |
| Consolidated Statements of Changes in Shareholders' Equity for the years ended December 31, 2024, 2023 and 2022 | |
| |
| Consolidated Statements of Cash Flows for the years ended December 31, 2024, 2023 and 2022 | |
| |
| Notes to Consolidated Financial Statements | |
| |
| Note 1 – Organization | |
| | |
| Note 2 – Basis of Presentation and Significant Accounting Policies | |
| |
| Note 3 – Segment Information | |
| |
| Note 4 – Goodwill and Intangible Assets | |
| |
| Note 5 – Investments | |
| |
| Note 6 – Fair Value Measurements | |
| |
| Note 7 – Derivative Instruments | |
| |
| Note 8 – Reserve for Losses and Loss Expenses | |
| |
| Note 9 – Reinsurance | |
| |
| Note 10 – Debt and Financing Arrangements | |
| |
| Note 11 – Federal Home Loan Bank Advances | |
|
| Note 12 – Commitments and Contingencies | |
| |
| Note 13 – Leases | |
| |
| Note 14 – Earnings Per Common Share | |
| |
| Note 15 – Shareholders’ Equity | |
| |
| Note 16 – Retirement Plans | |
| |
| Note 17 – Share-Based Compensation | |
| |
| Note 18 – Related Party Transactions | |
| |
| Note 19 – Reorganization Expenses | |
| |
| Note 20 – Income Taxes | |
| |
| Note 21 – Other Comprehensive Income (Loss) | |
| |
| Note 22 – Statutory Financial Information | |
| |
| Note 23 – Subsequent Events | |
| |
REPORT OF INDEPENDENT REGISTERED PUBLIC ACCOUNTING FIRM
To the Shareholders and the Board of Directors of AXIS Capital Holdings Limited
Opinion on the Financial Statements
We have audited the accompanying consolidated balance sheets of AXIS Capital Holdings Limited and subsidiaries (the "Company") as of December 31, 2024 and 2023, the related consolidated statements of operations, comprehensive income, changes in shareholders' equity, and cash flows, for each of the three years in the period ended December 31, 2024, and the related notes and the schedules listed in the Index at Item 15 (collectively referred to as the "financial statements"). In our opinion, the financial statements present fairly, in all material respects, the financial position of the Company as of December 31, 2024 and 2023, and the results of its operations and its cash flows for each of the three years in the period ended December 31, 2024, in conformity with accounting principles generally accepted in the United States of America.
We have also audited, in accordance with the standards of the Public Company Accounting Oversight Board (United States) (PCAOB), the Company's internal control over financial reporting as of December 31, 2024, based on criteria established in Internal Control — Integrated Framework (2013) issued by the Committee of Sponsoring Organizations of the Treadway Commission and our report dated February 26, 2025, expressed an unqualified opinion on the Company's internal control over financial reporting.
Basis for Opinion
These financial statements are the responsibility of the Company's management. Our responsibility is to express an opinion on the Company's financial statements based on our audits. We are a public accounting firm registered with the PCAOB and are required to be independent with respect to the Company in accordance with the U.S. federal securities laws and the applicable rules and regulations of the Securities and Exchange Commission and the PCAOB.
We conducted our audits in accordance with the standards of the PCAOB. Those standards require that we plan and perform the audit to obtain reasonable assurance about whether the financial statements are free of material misstatement, whether due to error or fraud. Our audits included performing procedures to assess the risks of material misstatement of the financial statements, whether due to error or fraud, and performing procedures that respond to those risks. Such procedures included examining, on a test basis, evidence regarding the amounts and disclosures in the financial statements. Our audits also included evaluating the accounting principles used and significant estimates made by management, as well as evaluating the overall presentation of the financial statements. We believe that our audits provide a reasonable basis for our opinion.
Critical Audit Matter
The critical audit matter communicated below is a matter arising from the current-period audit of the financial statements that was communicated or required to be communicated to the audit committee and that (1) relates to accounts or disclosures that are material to the financial statements and (2) involved our especially challenging, subjective, or complex judgments. The communication of critical audit matters does not alter in any way our opinion on the financial statements, taken as a whole, and we are not, by communicating the critical audit matter below, providing a separate opinion on the critical audit matter or on the accounts or disclosures to which it relates.
Reserve for losses and loss expenses - Refer to Notes 2 and 8 to the consolidated financial statements
Critical Audit Matter Description
The Company’s estimate of loss and loss expense reserves is derived using expected trends in claim severity and frequency and other factors that may vary significantly as claims are settled. The estimate is sensitive to significant assumptions, including the initial expected loss ratio and loss development factors. The estimate is also sensitive to the selection of actuarial methods and weighting of these methods applied to project the ultimate losses, the estimation of ultimate reserves associated with catastrophic events, and other factors. Further, not all catastrophic events can be modeled using traditional actuarial methodologies, which increases the degree of judgment needed in estimating loss reserves for such events.
Auditing the Company’s methods, assumptions and best estimate of the cost of the ultimate settlement and administration of claims represented by the incurred but not reported ("IBNR") claims included in recorded loss and loss adjustment reserves involved especially subjective auditor judgment and an increased extent of effort, including the involvement of our actuarial specialists.
How the Critical Audit Matter Was Addressed in the Audit
Our audit procedures related to reserves for losses and loss expenses included the following, among others:
•We tested the effectiveness of controls over the valuation of the recorded loss and loss expense reserves, including the review and approval process that management has in place for significant actuarial methods and assumptions used and the approval of management’s best estimate of loss and loss expense reserves.
•We tested the completeness and accuracy of the underlying data that served as the basis for the Company’s actuarial analysis, including historical claims data, to test the reasonableness of key inputs to the actuarial estimate.
•With the assistance of our actuarial specialists:
–We independently developed an estimate of the reserves for selected classes of business, compared our estimates to those booked by the Company, and evaluated the differences.
–We evaluated the Company’s methodologies against recognized actuarial practices for the remaining classes. We also evaluated the assumptions used by the Company using our industry knowledge and experience and other analytical procedures.
–We compared the results of the reserve study prepared by third party actuaries to management’s best estimate and evaluated the differences.
| | | | | |
| |
| /s/ | Deloitte Ltd. |
| Hamilton, Bermuda |
| February 26, 2025 |
We have served as the Company's auditor since 2001.
AXIS CAPITAL HOLDINGS LIMITED
CONSOLIDATED BALANCE SHEETS
DECEMBER 31, 2024 AND 2023 | | | | | | | | | | | |
| 2024 | | 2023 |
| | (in thousands) |
| Assets | | | |
| Investments: | | | |
Fixed maturities, available for sale, at fair value (Amortized cost 2024: $12,419,905; 2023: $12,634,254 Allowance for expected credit losses 2024: $3,938; 2023: $10,759) | $ | 12,152,753 | | | $ | 12,234,742 | |
Fixed maturities, held to maturity, at amortized cost (Fair value 2024: $436,751; 2023: $675,851 Allowance for expected credit losses 2024: $nil; 2023: $nil) | 443,400 | | | 686,296 | |
Equity securities, at fair value (Cost 2024: $520,743; 2023: $543,833) | 579,274 | | | 588,511 | |
Mortgage loans, held for investment, at fair value (Allowance for expected credit losses 2024: $23,378; 2023: $6,220) | 505,697 | | | 610,148 | |
| Other investments, at fair value | 930,278 | | | 949,413 | |
| Equity method investments | 206,994 | | | 174,634 | |
| Short-term investments, at fair value | 223,666 | | | 17,216 | |
| Total investments | 15,042,062 | | | 15,260,960 | |
| Cash and cash equivalents | 2,143,471 | | | 953,476 | |
| Restricted cash and cash equivalents | 920,150 | | | 430,509 | |
| Accrued interest receivable | 114,012 | | | 106,055 | |
Insurance and reinsurance premium balances receivable (Allowance for expected credit losses 2024: $17,339; 2023: $11,997) | 3,169,355 | | | 3,067,554 | |
Reinsurance recoverable on unpaid losses and loss expenses (Allowance for expected credit losses 2024: $43,445; 2023: $36,611) | 6,840,897 | | | 6,323,083 | |
| Reinsurance recoverable on paid losses and loss expenses | 546,287 | | | 575,847 | |
| Deferred acquisition costs | 524,837 | | | 450,950 | |
| Prepaid reinsurance premiums | 1,936,979 | | | 1,916,087 | |
| Receivable for investments sold | 3,693 | | | 8,767 | |
| Goodwill | 66,498 | | | 100,801 | |
| Intangible assets | 175,967 | | | 186,883 | |
| | | |
| Operating lease right-of-use assets | 92,516 | | | 108,093 | |
| Loan advances made | 247,775 | | | 305,222 | |
| Other assets | 695,794 | | | 456,385 | |
| Total assets | $ | 32,520,293 | | | $ | 30,250,672 | |
| Liabilities | | | |
| Reserve for losses and loss expenses | $ | 17,218,929 | | | $ | 16,434,018 | |
| Unearned premiums | 5,211,865 | | | 4,747,602 | |
| Insurance and reinsurance balances payable | 1,713,798 | | | 1,792,719 | |
| Debt | 1,315,179 | | | 1,313,714 | |
| Federal Home Loan Bank advances | 66,380 | | | 85,790 | |
| Payable for investments purchased | 269,728 | | | 26,093 | |
| Operating lease liabilities | 106,614 | | | 123,101 | |
| Other liabilities | 528,421 | | | 464,439 | |
| Total liabilities | 26,430,914 | | | 24,987,476 | |
| Commitments and Contingencies | | | |
| | | |
| | | |
| Shareholders' equity | | | |
| Preferred shares | 550,000 | | | 550,000 | |
Common shares (shares issued 2024: 176,580; 2023: 176,580 shares outstanding 2024: 82,984; 2023: 85,286) | 2,206 | | | 2,206 | |
| Additional paid-in capital | 2,394,063 | | | 2,383,030 | |
| Accumulated other comprehensive income (loss) | (267,557) | | | (365,836) | |
| Retained earnings | 7,341,569 | | | 6,440,528 | |
Treasury shares, at cost (2024: 93,596; 2023: 91,294) | (3,930,902) | | | (3,746,732) | |
| | | |
| | | |
| Total shareholders’ equity | 6,089,379 | | | 5,263,196 | |
| Total liabilities and shareholders’ equity | $ | 32,520,293 | | | $ | 30,250,672 | |
See accompanying notes to Consolidated Financial Statements.
116
AXIS CAPITAL HOLDINGS LIMITED
CONSOLIDATED STATEMENTS OF OPERATIONS
FOR THE YEARS ENDED DECEMBER 31, 2024, 2023, AND 2022 | | | | | | | | | | | | | | | | | |
| 2024 | | 2023 | | 2022 |
| | (in thousands, except for per share amounts) |
| Revenues | | | | | |
| Net premiums earned | $ | 5,306,235 | | | $ | 5,083,781 | | | $ | 5,160,326 | |
| Net investment income | 759,229 | | | 611,742 | | | 418,829 | |
| Other insurance related income | 30,721 | | | 22,495 | | | 13,073 | |
| Net investment gains (losses): | | | | | |
| Increase in allowance for expected credit losses | (10,338) | | | (5,246) | | | (11,421) | |
| Impairment losses | (408) | | | (12,757) | | | (12,568) | |
| | | | | |
| | | | | |
| Other realized and unrealized investment gains (losses) | (127,788) | | | (56,627) | | | (432,800) | |
| Total net investment gains (losses) | (138,534) | | | (74,630) | | | (456,789) | |
| Total revenues | 5,957,651 | | | 5,643,388 | | | 5,135,439 | |
| | | | | |
| Expenses | | | | | |
| Net losses and loss expenses | 3,158,487 | | | 3,393,102 | | | 3,242,410 | |
| Acquisition costs | 1,070,551 | | | 1,000,945 | | | 1,022,017 | |
| General and administrative expenses | 666,202 | | | 684,446 | | | 680,343 | |
| Foreign exchange losses (gains) | (50,822) | | | 58,115 | | | (157,945) | |
| Interest expense and financing costs | 67,766 | | | 68,421 | | | 63,146 | |
| Reorganization expenses | 26,312 | | | 28,997 | | | 31,426 | |
| | | | | |
| Amortization of intangible assets | 10,917 | | | 10,917 | | | 10,917 | |
| Total expenses | 4,949,413 | | | 5,244,943 | | | 4,892,314 | |
| | | | | |
| Income before income taxes and interest in income of equity method investments | 1,008,238 | | | 398,445 | | | 243,125 | |
| Income tax (expense) benefit | 55,595 | | | (26,316) | | | (22,037) | |
| Interest in income of equity method investments | 17,953 | | | 4,163 | | | 1,995 | |
| | | | | |
| Net income | 1,081,786 | | | 376,292 | | | 223,083 | |
| Preferred share dividends | 30,250 | | | 30,250 | | | 30,250 | |
| | | | | |
| Net income available to common shareholders | $ | 1,051,536 | | | $ | 346,042 | | | $ | 192,833 | |
| | | | | |
| Per share data | | | | | |
| Earnings per common share: | | | | | |
| Earnings per common share | $ | 12.49 | | | $ | 4.06 | | | $ | 2.27 | |
| Earnings per diluted common share | $ | 12.35 | | | $ | 4.02 | | | $ | 2.25 | |
| Weighted average common shares outstanding | 84,165 | | | 85,142 | | | 84,864 | |
| Weighted average diluted common shares outstanding | 85,176 | | | 86,012 | | | 85,669 | |
See accompanying notes to Consolidated Financial Statements.
117
AXIS CAPITAL HOLDINGS LIMITED
CONSOLIDATED STATEMENTS OF COMPREHENSIVE INCOME (LOSS)
FOR THE YEARS ENDED DECEMBER 31, 2024, 2023, AND 2022
| | | | | | | | | | | | | | | | | |
| 2024 | | 2023 | | 2022 |
| | (in thousands) |
| Net income | $ | 1,081,786 | | | $ | 376,292 | | | $ | 223,083 | |
| | | | | |
| Other comprehensive income (loss), net of tax: | | | | | |
| Available for sale investments: | | | | | |
| Unrealized gains (losses) arising during the year for which an allowance for expected credit losses has not been recognized | (33,030) | | | 257,940 | | | (1,043,625) | |
| Unrealized gains (losses) arising during the year for which an allowance for expected credit losses has been recognized | (248) | | | 9,583 | | | (67,150) | |
| Adjustment for reclassification of net realized (gains) losses and impairment losses recognized in net income (loss) | 155,320 | | | 128,513 | | | 304,925 | |
| Unrealized gains (losses) arising during the year, net of reclassification adjustment | 122,042 | | | 396,036 | | | (805,850) | |
| | | | | |
| Foreign currency translation adjustment | (23,763) | | | (1,572) | | | (10,986) | |
| | | | | |
| Total other comprehensive income (loss), net of tax | 98,279 | | | 394,464 | | | (816,836) | |
| Comprehensive income (loss) | $ | 1,180,065 | | | $ | 770,756 | | | $ | (593,753) | |
See accompanying notes to Consolidated Financial Statements.
118
AXIS CAPITAL HOLDINGS LIMITED
CONSOLIDATED STATEMENTS OF CHANGES IN SHAREHOLDERS' EQUITY
FOR THE YEARS ENDED DECEMBER 31, 2024, 2023, AND 2022
| | | | | | | | | | | | | | | | | |
| 2024 | | 2023 | | 2022 |
| (in thousands) |
| Preferred shares | | | | | |
| | | | | |
| | | | | |
| | | | | |
| Balance at beginning and end of year | $ | 550,000 | | | $ | 550,000 | | | $ | 550,000 | |
| | | | | |
| Common shares (par value) | | | | | |
| | | | | |
| | | | | |
| Balance at beginning and end of year | 2,206 | | | 2,206 | | | 2,206 | |
| | | | | |
| Additional paid-in capital | | | | | |
| Balance at beginning of year | 2,383,030 | | | 2,366,253 | | | 2,346,179 | |
| | | | | |
| Treasury shares reissued | (29,454) | | | (40,430) | | | (31,175) | |
| | | | | |
| | | | | |
| | | | | |
| | | | | |
| Share-based compensation expense | 40,487 | | | 57,207 | | | 51,249 | |
| Balance at end of year | 2,394,063 | | | 2,383,030 | | | 2,366,253 | |
| | | | | |
| Accumulated other comprehensive income (loss) | | | | | |
| Balance at beginning of year | (365,836) | | | (760,300) | | | 56,536 | |
| Unrealized gains (losses) on available for sale investments, net of tax: | | | | | |
| Balance at beginning of year | (347,659) | | | (743,695) | | | 62,155 | |
| | | | | |
| | | | | |
| Unrealized gains (losses) arising during the year, net of reclassification adjustment | 122,042 | | | 396,036 | | | (805,850) | |
| | | | | |
| Balance at end of year | (225,617) | | | (347,659) | | | (743,695) | |
| Cumulative foreign currency translation adjustments, net of tax: | | | | | |
| Balance at beginning of year | (18,177) | | | (16,605) | | | (5,619) | |
| Foreign currency translation adjustment | (23,763) | | | (1,572) | | | (10,986) | |
| Balance at end of year | (41,940) | | | (18,177) | | | (16,605) | |
| | | | | |
| | | | | |
| | | | | |
| | | | | |
| Balance at end of year | (267,557) | | | (365,836) | | | (760,300) | |
| | | | | |
| Retained earnings | | | | | |
| Balance at beginning of year | 6,440,528 | | | 6,247,022 | | | 6,204,745 | |
| | | | | |
| | | | | |
| Net income | 1,081,786 | | | 376,292 | | | 223,083 | |
| | | | | |
Preferred share dividends (1) | (30,250) | | | (30,250) | | | (30,250) | |
| | | | | |
Common share dividends (1) | (150,495) | | | (152,536) | | | (150,556) | |
| Balance at end of year | 7,341,569 | | | 6,440,528 | | | 6,247,022 | |
| | | | | |
| Treasury shares, at cost | | | | | |
| Balance at beginning of year | (3,746,732) | | | (3,765,271) | | | (3,749,010) | |
| Shares repurchased | (215,868) | | | (23,596) | | | (48,981) | |
| Shares reissued | 31,698 | | | 42,135 | | | 32,720 | |
| Balance at end of year | (3,930,902) | | | (3,746,732) | | | (3,765,271) | |
| | | | | |
| | | | | |
| Total shareholders' equity | $ | 6,089,379 | | | $ | 5,263,196 | | | $ | 4,639,910 | |
| | | | | |
(1) Refer to Note 15 'Shareholders' Equity' for details on dividends declared and paid related to the Company's common and preferred shares.
See accompanying notes to Consolidated Financial Statements.
119
AXIS CAPITAL HOLDINGS LIMITED
CONSOLIDATED STATEMENTS OF CASH FLOWS
FOR THE YEARS ENDED DECEMBER 31, 2024, 2023, AND 2022
| | | | | | | | | | | | | | | | | |
| 2024 | | 2023 | | 2022 |
| | (in thousands) |
| Cash flows from operating activities: | | | | | |
| Net income | $ | 1,081,786 | | | $ | 376,292 | | | $ | 223,083 | |
| Adjustments to reconcile net income to net cash provided by operating activities: | | | | | |
Net investment losses (1) | 144,175 | | | 74,630 | | | 456,789 | |
| Net realized and unrealized gains on other investments | (47,203) | | | (19,682) | | | (55,757) | |
| Amortization of fixed maturities | (38,428) | | | (20,167) | | | 26,138 | |
| Interest in income of equity method investments | (17,953) | | | (4,163) | | | (1,995) | |
| | | | | |
| Other amortization and depreciation | 55,306 | | | 75,552 | | | 68,288 | |
| Share-based compensation expense, net of cash payments | 42,731 | | | 54,120 | | | 48,494 | |
| | | | | |
| | | | | |
| Changes in: | | | | | |
| Accrued interest receivable | (8,441) | | | (11,777) | | | (30,432) | |
| Reinsurance recoverable on unpaid losses and loss expenses | (543,442) | | | (493,831) | | | (825,608) | |
| Reinsurance recoverable on paid losses and loss expenses | (3,764) | | | (60,860) | | | 92,781 | |
| Deferred acquisition costs | (74,506) | | | 21,499 | | | (10,548) | |
| Prepaid reinsurance premiums | (31,265) | | | (365,732) | | | (176,498) | |
| Reserve for losses and loss expenses | 841,727 | | | 1,272,999 | | | 544,459 | |
| Unearned premiums | 482,867 | | | 388,747 | | | 287,082 | |
| Insurance and reinsurance balances, net | 118,271 | | | 13,813 | | | 197,610 | |
| Other items | (157,048) | | | (45,881) | | | (45,848) | |
| Net cash provided by operating activities | 1,844,813 | | | 1,255,559 | | | 798,038 | |
| | | | | |
| Cash flows from investing activities: | | | | | |
| Purchases of: | | | | | |
| Fixed maturities, available for sale | (10,530,382) | | | (6,348,753) | | | (7,476,440) | |
| Fixed maturities, held to maturity | (105,755) | | | (37,499) | | | (255,610) | |
| Equity securities | (114,519) | | | (89,502) | | | (94,324) | |
| Mortgage loans | (17,655) | | | (24,867) | | | (117,023) | |
| Other investments | (69,596) | | | (91,010) | | | (147,717) | |
| Equity method investments | (14,407) | | | (22,183) | | | — | |
| Short-term investments | (331,267) | | | (247,499) | | | (176,968) | |
| Unsettled payable for reverse repurchase agreements included in cash and cash equivalents | 247,495 | | | — | | | — | |
| Proceeds from the sale of: | | | | | |
| Fixed maturities, available for sale | 9,059,672 | | | 4,848,826 | | | 6,110,148 | |
| Equity securities | 154,645 | | | 55,651 | | | 138,542 | |
| Other investments | 135,975 | | | 158,348 | | | 156,719 | |
| Short-term investments | 58,151 | | | 227,318 | | | 116,752 | |
| Proceeds from redemption of fixed maturities, available for sale | 1,508,473 | | | 934,017 | | | 1,018,922 | |
| Proceeds from redemption of fixed maturities, held to maturity | 348,812 | | | 49,609 | | | 3,541 | |
| Proceeds from redemption of short-term investments | 69,010 | | | 76,545 | | | 20,124 | |
| Proceeds from the repayment of mortgage loans | 98,241 | | | 36,375 | | | 84,365 | |
| Proceeds from the purchase of other assets, net | (17,396) | | | (31,144) | | | (36,829) | |
| | | | | |
| | | | | |
| | | | | |
| Loan advances made | (199,045) | | | (349,842) | | | (105,822) | |
| Net cash provided by (used in) investing activities | 280,452 | | | (855,610) | | | (761,620) | |
| | | | | |
| Cash flows from financing activities: | | | | | |
| | | | | |
| | | | | |
| | | | | |
| | | | | |
| Repurchase of common shares - open market | (199,944) | | | — | | | (34,987) | |
| Taxes paid on withholding shares | (15,925) | | | (23,596) | | | (13,994) | |
| Dividends paid - common shares | (151,765) | | | (153,775) | | | (149,341) | |
| | | | | |
| Dividends paid - preferred shares | (30,250) | | | (30,250) | | | (30,250) | |
| Federal Home Loan Bank advances, net | (19,410) | | | 5,250 | | | 78,950 | |
| | | | | |
| | | | | |
| | | | | |
| Net cash used in financing activities | (417,294) | | | (202,371) | | | (149,622) | |
| | | | | |
| Effect of exchange rate changes on foreign currency cash, cash equivalents and restricted cash | (28,335) | | | 11,754 | | | (29,833) | |
| Increase (decrease) in cash, cash equivalents and restricted cash | 1,679,636 | | | 209,332 | | | (143,037) | |
| Cash, cash equivalents and restricted cash - beginning of year | 1,383,985 | | | 1,174,653 | | | 1,317,690 | |
| Cash, cash equivalents and restricted cash - end of year | $ | 3,063,621 | | | $ | 1,383,985 | | | $ | 1,174,653 | |
| | | | | |
(1) In 2024, net investment losses in the consolidated statement of cash flows included net realized gains on overseas deposits of $6 million that are included in net investment gains (losses) in the consolidated statement of operations. |
| | | | | |
See accompanying notes to Consolidated Financial Statements.
120
AXIS CAPITAL HOLDINGS LIMITED
CONSOLIDATED STATEMENTS OF CASH FLOWS (CONTINUED)
FOR THE YEARS ENDED DECEMBER 31, 2024, 2023, AND 2022
| | | | | | | | | | | | | | | | | |
| | | | | |
| Supplemental disclosures of cash flow information: | 2024 | | 2023 | | 2022 |
| Income taxes paid | $ | 80,557 | | | $ | 77,479 | | | $ | 33,418 | |
| Interest paid | $ | 64,180 | | | $ | 63,596 | | | $ | 59,886 | |
Supplemental disclosures of cash flow information:
In 2024, $236 million related to loan advances to Monarch Point Re (ISA 2023 and ISA 2024) Ltd. ("Monarch Point Re") was repaid and was treated as a non-cash activity in the consolidated statement of cash flows. In addition, $227 million related to reinsurance balances payables due to Monarch Point Re under retrocession agreements and $32 million related to ceded losses and loss expenses due from Monarch Point Re under retrocession agreements were settled and each amount was treated as a non-cash activity in the consolidated statement of cash flows. Further, $14 million related to interest on loans advanced to Monarch Point Re was received in advance and was treated as a non-cash activity in the consolidated statement of cash flows (refer to Note 18 'Related Party Transactions').
In 2024, $75 million related to a loan advanced to a third-party reinsurer was repaid and $75 million related to reinsurance balances payables due to the third-party reinsurer under retrocession agreements was settled and each amount was treated as a non-cash activity in the consolidated statement of cash flows (refer to Note 10 'Debt').
In 2023, $72 million related to a loan advanced to Monarch Point Re (ISA 2023) Ltd. ("Monarch Point Re") was repaid and was treated as a non-cash activity in the consolidated statement of cash flows. In addition, $66 million related to reinsurance balances payables due to Monarch Point Re under the retrocession agreement and $4 million related to ceded losses and loss expenses due from Monarch Point Re under the retrocession agreement were settled and each amount was treated as a non-cash activity in the consolidated statement of cash flows. Further, $12 million related to interest on the loan advanced to Monarch Point Re was received in advance and was treated as a non-cash activity in the consolidated statement of cash flows (refer to Note 18 'Related Party Transactions').
In 2023, $110 million related to a loan advanced to a third-party reinsurer was repaid and was treated as a non-cash activity in the consolidated statement of cash flows. In addition, $107 million related to reinsurance balances payables due to the third- party reinsurer under the retrocession agreement and $21 million related to ceded losses and loss expenses due from the third- party reinsurer under the retrocession agreement were settled and each amount was treated as a non-cash activity in the consolidated statement of cash flows. Further, $4 million related to interest on the loan advanced to a third-party reinsurer was received in advance and was treated as a non-cash activity in the consolidated statement of cash flows (refer to Note 10 'Debt').
In 2022, the Company borrowed $81 million under the FHLB program, of which $2 million was settled by way of a transfer of member stock (refer to Note 11 'Federal Home Loan Advances').
In 2022, $90 million related to a loan advanced to a third-party reinsurer was repaid and was treated as a non-cash activity in the consolidated statement of cash flows. In addition, $88 million related to reinsurance balances payables due to the third-party reinsurer under the retrocession agreement and $9 million related to ceded losses and loss expenses due from the third- party reinsurer under the retrocession agreement were settled and each amount was treated as a non-cash activity in the consolidated statement of cash flows. Further, $1 million related to interest on the loan advanced to a third-party reinsurer was received in advance and was treated as a non-cash activity in the consolidated statement of cash flows (refer to Note 10 'Debt').
See accompanying notes to Consolidated Financial Statements.
121
AXIS CAPITAL HOLDINGS LIMITED
NOTES TO CONSOLIDATED FINANCIAL STATEMENTS
DECEMBER 31, 2024, 2023, AND 2022
1. ORGANIZATION
AXIS Capital Holdings Limited ("AXIS Capital" and together with its wholly-owned subsidiaries the "Company"), was incorporated on December 9, 2002, under the laws of Bermuda. The Company is a global specialty underwriter and provider of insurance and reinsurance solutions. The Company's principal operating subsidiaries, located in Bermuda, the United States ("U.S."), Europe, Singapore and Canada, are described below:
•AXIS Specialty Limited ("AXIS Specialty Bermuda"), a Bermuda domiciled company, is licensed to provide specialty lines insurance and treaty reinsurance products on a worldwide basis. In addition, AXIS Specialty Bermuda conducts insurance and reinsurance business through its branch in Singapore, AXIS Specialty Limited (Singapore Branch). AXIS Specialty Bermuda ceased writing new business through its branch in Singapore on January 1, 2024, and will close this branch, subject to meeting all regulatory and legal requirements. AXIS Specialty Insurance Limited ("AXIS Specialty Insurance Bermuda"), a Bermuda domiciled company, incorporated on August 19, 2024, was licensed on December 17, 2024 to provide specialty lines insurance and treaty reinsurance products on a worldwide basis.
•AXIS Insurance Company, domiciled in Illinois, and AXIS Reinsurance Company, domiciled in New York, together with AXIS Reinsurance Company (Canadian Branch) are licensed to offer a range of specialty lines insurance and treaty reinsurance products to a variety of niche markets on a worldwide basis. AXIS Surplus Insurance Company, domiciled in Illinois, is eligible to write insurance on a surplus lines basis.
•AXIS Specialty Europe SE ("AXIS Specialty Europe") is a European public limited liability company, incorporated as a non-life insurer under the laws of Ireland. It is a Societas Europaea (SE), or European society company registered in accordance with company law of the EU. AXIS Specialty Europe also conducts insurance business through its branch in the United Kingdom ("U.K."), AXIS Specialty Europe SE (UK Branch).
The U.K. withdrew from the European Union on January 31, 2020 and is now considered a third-country. Effective October 28, 2022, AXIS Specialty Europe SE (UK Branch) is fully regulated by the Prudential Regulation Authority and the U.K. Financial Conduct Authority as a third-country branch.
•AXIS Re SE is a European public limited liability company, incorporated as a reinsurer under the laws of Ireland. AXIS Re SE is also a Societas Europaea (SE), or European society company registered in accordance with company law of the EU. AXIS Re SE also conducts reinsurance business through its branch in Switzerland, AXIS Re SE, Dublin (Zurich Branch).
•The Company operates in the Lloyd's of London ("Lloyd's") market through its corporate members AXIS Corporate Capital UK Limited and AXIS Corporate Capital UK II Limited, that provided 70% and 30% capital support, respectively, to AXIS Syndicate 1686 ("Syndicate 1686") through December 31, 2024. AXIS Corporate Capital UK II Limited will provide 100% capital support to Syndicate 1686 for underwriting activities effective January 1, 2025. Syndicate 1686 is managed by AXIS Managing Agency Ltd. ("AXIS Managing Agency").
•AXIS Energy Transition Syndicate 2050 ("Syndicate 2050") commenced underwriting on April 1, 2024. AXIS Corporate Capital UK II Limited is the sole corporate member of Syndicate 2050. Syndicate 2050 is managed by AXIS Managing Agency.
•AXIS Reinsurance Managers Limited ("AXIS Reinsurance Managers") is regulated by the BMA as an insurance manager and generates fee income from services provided to strategic capital partners.
AXIS CAPITAL HOLDINGS LIMITED
NOTES TO CONSOLIDATED FINANCIAL STATEMENTS
DECEMBER 31, 2024, 2023, AND 2022
2. BASIS OF PRESENTATION AND SIGNIFICANT ACCOUNTING POLICIES
Basis of Presentation
These consolidated financial statements have been prepared in accordance with accounting principles generally accepted in the United States of America ("U.S. GAAP") and the rules and regulations of the U.S. Securities and Exchange Commission ("SEC") and include AXIS Capital Holdings Limited and its wholly-owned subsidiaries.
All inter-company accounts and transactions have been eliminated.
Tabular dollar and share amounts are in thousands, with the exception of per share amounts. All amounts are reported in U.S. dollars.
Use of Estimates
The preparation of these consolidated financial statements requires management to make estimates and assumptions that affect the reported amount of assets and liabilities, and disclosure of contingent assets and liabilities at the date of the consolidated financial statements and the reported amounts of revenues and expenses during the reporting period. While management believes that the amounts included in the consolidated financial statements reflect its best estimates and assumptions, actual results could differ from those estimates. The Company’s principal estimates include:
•reserve for losses and loss expenses;
•reinsurance recoverable on unpaid losses and loss expenses, including the allowance for expected credit losses;
•gross premiums written and net premiums earned;
•fair value measurements of financial assets and liabilities; and
•the allowance for credit losses associated with fixed maturities, available for sale.
The Company's significant accounting policies are as follows:
a) Investments
Fixed Maturities, Available for Sale, at Fair Value and Fixed Maturities, Held to Maturity, at Amortized Cost
Fixed maturities classified as available for sale are reported at fair value (refer to Note 6 'Fair Value Measurements') and are presented net of an allowance for expected credit losses. The change in fair values of fixed maturities, net of tax is recognized in accumulated other comprehensive income (loss) ("AOCI") in total shareholders’ equity.
Fixed maturities are classified as held to maturity when the Company has the positive intent and ability to hold the securities to maturity or redemption. Fixed maturities classified as held to maturity are reported at amortized cost and are presented net of an allowance for expected credit losses.
Net investment income includes interest income and the amortization of market premiums and discounts and is presented net of investment expenses. Investment income is recognized when earned. Purchases and sales of fixed maturities are recorded on a trade-date basis and realized gains (losses) on sales of fixed maturities are determined based on the specific identification method. Realized gains (losses) on fixed maturities are included in net investment gains (losses) in the consolidated statements of operations.
The Company recognizes investment income from fixed maturities based on the constant effective yield method, which includes an adjustment for estimated principal repayments, if applicable. The effective yield used to determine the amortization of fixed maturities subject to prepayment risk (e.g., asset-backed, mortgage-backed and other structured securities) is recalculated and adjusted periodically based on historical and/or projected future cash flows. Adjustments to the yield for highly rated prepayable fixed maturities are accounted for using the retrospective method. Adjustments to the yield for other prepayable fixed maturities are accounted for using the prospective method.
AXIS CAPITAL HOLDINGS LIMITED
NOTES TO CONSOLIDATED FINANCIAL STATEMENTS
DECEMBER 31, 2024, 2023, AND 2022
2. BASIS OF PRESENTATION AND SIGNIFICANT ACCOUNTING POLICIES (CONTINUED)
Credit Losses - Fixed Maturities, Available for Sale
A fixed maturity, available for sale security is impaired if the fair value of the investment is below amortized cost. On a quarterly basis, the Company evaluates all fixed maturities, available for sale securities for impairment losses.
If a fixed maturity, available for sale security is impaired and the Company intends to sell the security or it is more likely than not that the Company will be required to sell the security before its anticipated recovery, the full amount of the impairment loss is charged to net income (loss) and is included in net investment gains (losses).
In instances where the Company intends to hold the impaired fixed maturity, available for sale security the Company determines whether the decline in fair value below the amortized cost basis has resulted from a credit loss or other factors. If the Company does not anticipate to fully recover the amortized cost, an allowance for expected credit losses is established. The allowance for expected credit losses is limited to the difference between a security's amortized cost basis and its fair value. The allowance for expected credit losses is charged to net income (loss) and is included in net investment gains (losses).
On a quarterly basis, the Company assesses whether unrealized losses on fixed maturities, available for sale represent credit impairments by considering the following factors:
a.the extent to which the fair value is less than amortized cost;
b.adverse conditions related to the security, industry, or geographical area;
c.downgrades in the security's credit rating by a credit rating agency; and
d.failure of the issuer to make scheduled principal or interest payments.
The length of time a security has been in an unrealized loss position no longer impacts the determination of whether a credit loss exists.
If a security is assessed to be credit impaired, it is subject to a discounted cash flow analysis by comparing the present value of expected future cash flows with the amortized cost basis. If the present value of expected cash flows is less than the amortized cost, a credit loss exists and an allowance for expected credit losses is recognized. If the present value of expected future cash flows is equal to or greater than the amortized cost basis, an expected credit loss does not exist.
The non-credit impairment amount of the loss (i.e., related to interest rates, market conditions, etc.) is recognized in other comprehensive income (loss).
The Company reports accrued interest receivable related to available for sale debt securities separately and has elected not to measure an allowance for expected credit losses for accrued interest receivable. Write-offs of accrued interest receivable balances are recognized in net investment gains (losses) in the consolidated statements of operations in the period in which they are deemed uncollectible.
Credit Losses - Fixed Maturities, Held to Maturity
A fixed maturity, held to maturity security is impaired if the fair value of the investment is below amortized cost. On a quarterly basis, the Company evaluates all fixed maturities, held to maturity securities for impairment losses.
The Company's fixed maturity, held to maturity securities portfolio consists of asset-backed securities ("ABS") and corporate debt securities.
AXIS CAPITAL HOLDINGS LIMITED
NOTES TO CONSOLIDATED FINANCIAL STATEMENTS
DECEMBER 31, 2024, 2023, AND 2022
2. BASIS OF PRESENTATION AND SIGNIFICANT ACCOUNTING POLICIES (CONTINUED)
The Company's ABS, held to maturity consist of CLO debt tranched securities. The Company uses a scenario-based approach to review its CLO debt portfolio and reviews subordination levels of these securities to determine their ability to absorb credit losses of the underlying collateral. If losses are forecast to be below the subordination level for a tranche held by the Company, the security is determined not to have a credit loss.
To estimate expected credit losses for corporate debt securities, held to maturity, the Company's projected cash flows are primarily driven by assumptions regarding the severity of loss, which is a function of the probability of default and projected recovery rates. The Company's default and recovery rates are based on credit ratings, credit analysis and macroeconomic forecasts.
The allowance for expected credit losses is estimated based on the Company’s analysis of projected lifetime losses. The allowance for expected credit losses is charged to net income (loss) and is included in net investment gains (losses). Any adjustment to the allowance for expected credit losses is recognized in the period in which it is determined.
Equity Securities, at Fair Value
Equity securities are reported at fair value. The change in the fair values of equity securities, net of tax is recognized in net investment gains (losses) in the consolidated statements of operations.
Net investment income includes dividend income and is presented net of investment expenses. Investment income is recognized when earned. Purchases and sales of equity securities are recorded on a trade-date basis and realized gains (losses) on sales of equity securities are determined based on the specific identification method. Realized gains (losses) on equity securities are included in net investment gains (losses) in the consolidated statements of operations.
Mortgage Loans, Held for Investment, at Fair Value
Mortgage loans, held for investment are reported at amortized cost which is calculated as the unpaid principal balance, adjusted for any unamortized premium or discount, deferred fees or expenses.
Interest income and prepayment fees are recognized when earned. Interest income is recognized based on an effective yield method which gives effect to the amortization of premiums and accretion of discounts.
Mortgage loans, held for investment are presented net of an allowance for expected credit losses. The allowance for expected credit losses is estimated based on the Company’s analysis of projected lifetime losses. These projections take into account the Company’s experience with credit quality indicators, loan losses, defaults, loss severity, and loss expectations for loans with similar risk characteristics. These evaluations are revised as conditions change and new information becomes available.
The allowance for expected credit losses is recognized in net investment gains (losses) in the consolidated statements of operations. Any adjustment to the allowance for expected credit losses is recognized in the period in which it is determined.
Other Investments
Other investments are recorded at fair value (refer to Note 6 'Fair Value Measurements'). Changes in fair value and realized gains (losses) are reported in net investment income in the consolidated statements of operations.
Equity Method Investments
Investments in which the Company has significant influence over the operating and financial policies of the investee are classified as equity method investments and are accounted for using the equity method of accounting. In applying the equity method of accounting, investments are initially recorded at cost and are subsequently adjusted based on the Company’s proportionate share of net income or loss of the investee. Adjustments are based on the most recently available financial information from the investee. Changes in the carrying value of these investments are recorded in net income (loss) as interest in income (loss) of equity method investments.
AXIS CAPITAL HOLDINGS LIMITED
NOTES TO CONSOLIDATED FINANCIAL STATEMENTS
DECEMBER 31, 2024, 2023, AND 2022
2. BASIS OF PRESENTATION AND SIGNIFICANT ACCOUNTING POLICIES (CONTINUED)
Short-term Investments
Short-term investments primarily comprise highly liquid debt securities with maturities greater than three months but less than one year from the date of purchase. These investments are carried at amortized cost, which approximates fair value.
b) Cash and Cash Equivalents
Cash equivalents include money-market funds, fixed interest deposits and reverse repurchase agreements with a maturity of under 90 days when purchased. Cash and cash equivalents are recorded at amortized cost, which approximates fair value due to the short-term, liquid nature of these securities. Restricted cash primarily relates to funds held in trust to support obligations in regulatory jurisdictions where the Company operates as a non-admitted carrier and to support underwriting activities at Lloyd's.
c) Premiums and Acquisition Costs
Premiums
Insurance premiums written are recorded in accordance with the terms of the underlying policies.
Reinsurance premiums are recorded at the inception of the contract based on estimates received from ceding companies.
For multi-year contracts insurance and reinsurance premiums are recorded at the inception of the contract based on management’s best estimate of total premiums to be received. Premiums are recognized on an annual basis for multi-year contracts where the cedant has the ability to unilaterally commute or cancel coverage within the term of the contract.
Any adjustments to insurance and reinsurance premium estimates are recognized in the period in which they are determined.
Insurance and reinsurance premiums are earned over the period during which the Company is exposed to the underlying risk, which is generally one to two years with the exception of multi-year contracts. Unearned premiums represent the portion of premiums which relate to the unexpired term under contracts in force.
Reinstatement premiums are recognized and earned at the time a loss event occurs and losses are recorded, where the coverage limits for the remaining life of the contract are reinstated under pre-defined contract terms. The recognition of reinstatement premiums is based on estimates of losses and loss expenses, which reflects management’s judgment (refer to Note 2(d) 'Losses and Loss Expenses').
Insurance and reinsurance premium balances receivable ("premium balances receivable") are reviewed for impairment at least quarterly and are presented net of an allowance for expected credit losses. The allowance for expected credit losses is estimated based on the Company's analysis of amounts due, historical delinquencies and write-offs, and current economic conditions, together with reasonable and supportable forecasts of short-term economic conditions.
The allowance for expected credit losses is recognized in net income (loss). Any adjustment to the allowance for expected credit losses is recognized in the period in which it is determined.
Write-offs of premium balances receivable, together with associated allowances for expected credit losses, are recognized in the period in which balances are deemed uncollectible. The Company does not have a history of significant write-offs.
Acquisition Costs
Acquisition costs vary with and are directly related to the successful acquisition efforts of acquiring new or renewing existing insurance and reinsurance contracts and consist primarily of fees and commissions paid to brokers and premium taxes. In addition, certain of the Company's contracts include profit commission provisions or other adjustable features that are estimated based on expected losses and loss expenses for those contracts. Acquisition costs are shown net of commissions on reinsurance purchased. Net acquisition costs are deferred and charged to net income (loss) as the related premium is earned.
AXIS CAPITAL HOLDINGS LIMITED
NOTES TO CONSOLIDATED FINANCIAL STATEMENTS
DECEMBER 31, 2024, 2023, AND 2022
2. BASIS OF PRESENTATION AND SIGNIFICANT ACCOUNTING POLICIES (CONTINUED)
Insurance and reinsurance premium balances receivable is presented net of acquisition costs when contract terms provide for the right of offset.
Anticipated losses and loss expenses, other costs and investment income related to these premiums are considered in assessing the recoverability of deferred acquisition costs. Deferred acquisition cost amounts that are assessed to be irrecoverable are recognized in net income (loss) in the period in which the determination is made. Compensation expenses for personnel involved in contract acquisition, and advertising costs, are charged to net income (loss) when incurred.
d) Losses and Loss Expenses
Reserve for losses and loss expenses represents an estimate of the unpaid portion of the ultimate liability for losses and loss expenses for insured and reinsured events that have occurred at or before the balance sheet date. These amounts reflect claims that have been reported ("case reserves") and claims that have been incurred but have not yet been reported ("IBNR") and are reduced for estimated amounts of salvage and subrogation recoveries.
The Company reviews its reserve for losses and loss expenses on a quarterly basis. Case reserves are primarily established based on amounts reported by clients and/or their brokers. Management estimates IBNR after reviewing detailed actuarial analyses and applying informed judgment regarding qualitative factors that may not be fully captured in the actuarial estimates. A variety of actuarial methods are utilized in this process, including the Expected Loss Ratio, Chain Ladder and Bornhuetter-Ferguson methods. The estimate is highly dependent on management’s judgment as to which method(s) are most appropriate for a particular accident/underwriting year and line of business. Historical claims data may be supplemented with industry benchmarks when applying these methodologies.
Any adjustments to estimates of reserve for losses and loss expenses are recognized in the period in which they are determined. While the Company believes that its reserves for losses and loss expenses are adequate, this estimate requires significant judgment and new information, events or circumstances may result in ultimate losses that are materially greater or less than provided for in the consolidated balance sheets.
e) Reinsurance
In the normal course of business, the Company purchases facultative and treaty reinsurance protection to limit its ultimate losses and to reduce its loss aggregation risk. The premiums paid to reinsurers (i.e., ceded premiums written) are recognized over the coverage period. Prepaid reinsurance premiums represent the portion of premiums ceded which relate to the unexpired term of the contracts in force. Reinstatement premiums are recognized and earned at the time a loss event occurs and losses are recorded, where the coverage limits for the remaining life of the contract are reinstated under pre-defined contract terms.
Reinsurance recoverable on unpaid losses and loss expenses ("reinsurance recoverables") related to case reserves is estimated on a case-by-case basis by applying the terms of applicable reinsurance cover to individual case reserve estimates. Reinsurance recoverables related to IBNR is generally developed as part of the Company's loss reserving process, therefore, its estimation is subject to similar risks and uncertainties as the estimation of IBNR. Estimates of amounts to be ceded under excess of loss reinsurance contracts also take into account pricing information for those contracts and require greater judgment than estimates for proportional contracts.
Reinsurance recoverable balances are reviewed for impairment at least quarterly and are presented net of an allowance for expected credit losses.
A case-specific allowance for expected credit losses against reinsurance recoverables that we deem are unlikely to be collected in full, is estimated based on the Company's analysis of amounts due, historical delinquencies and write-offs. In addition, a default analysis is used to estimate an allowance for expected credit losses on the remainder of the reinsurance recoverable balance. The principal components of the default analysis are reinsurance recoverable balances by reinsurer and default factors applied to estimate uncollectible amounts based on reinsurers’ credit ratings and the length of collection
AXIS CAPITAL HOLDINGS LIMITED
NOTES TO CONSOLIDATED FINANCIAL STATEMENTS
DECEMBER 31, 2024, 2023, AND 2022
2. BASIS OF PRESENTATION AND SIGNIFICANT ACCOUNTING POLICIES (CONTINUED)
periods. The default factors are based on a model developed by a major rating agency. The default analysis considers current and forecasted economic conditions.
The allowance for expected credit losses is recognized in net income (loss). Any adjustment to the allowance for expected credit losses is recognized in the period in which it is determined. Write-offs of reinsurance recoverable balances, together with associated allowances for expected credit losses, are recognized in the period in which balances are deemed uncollectible. The Company does not have a history of significant write-offs.
Retroactive Reinsurance
Retroactive reinsurance reimburses a ceding company for liabilities incurred as a result of past insurable events covered under contracts subject to the reinsurance. In certain instances, reinsurance contracts cover losses both on a prospective basis and on a retroactive basis and where practical the Company bifurcates the prospective and retroactive elements of these reinsurance contracts and accounts for each element separately. Initial gains in connection with retroactive reinsurance contracts are deferred and amortized into net income (loss) over the claims settlement period while losses are recognized immediately. When changes in the estimated amount recoverable from the reinsurer or in the timing of receipts related to that amount occur, a cumulative amortization adjustment is recognized in net income (loss) in the period in which the change is determined so that the deferred gain reflects the balance that would have existed had the revised estimate been available at the inception of the reinsurance transaction.
f) Foreign Exchange
The functional currency of the Company and the majority of its subsidiaries is the U.S. dollar. All foreign currency transactions are initially measured and recorded in functional currency using the rates of exchange prevailing at the transaction date.
Monetary assets and liabilities denominated in foreign currency are remeasured to functional currency at the rates of exchange in effect at the balance sheet date with the resulting foreign exchange losses (gains) generally being recognized in the consolidated statements of operations. Foreign exchange losses (gains) related to available for sale securities denominated in foreign currency represent an unrealized appreciation (depreciation) in the market value of the securities and are included in AOCI in total shareholders’ equity. Non-monetary assets and liabilities denominated in foreign currency are not subsequently remeasured.
The Company’s reporting currency is the U.S. dollar. Assets and liabilities of the Company's subsidiaries and branches where the functional currency is not the U.S. dollar, are translated into U.S. dollars using the rates of exchange in effect at the balance sheet date, and revenue and expenses are translated using the weighted average foreign exchange rates for the period. The effect of translation adjustments is reported as a separate component of AOCI in total shareholders’ equity.
g) Share-based Compensation
The Company is authorized to issue restricted shares, restricted stock units, performance restricted stock units, stock options, stock appreciation rights and other equity-based awards to its employees and directors. The Company's plan includes share-settled and cash-settled service awards and share-settled performance awards.
Restricted Stock Units - Share-Settled and Cash-Settled
The fair value of share-settled and cash-settled service awards is based on market value of the Company's common shares measured at the grant date and is expensed over the requisite service period. The fair value of the cash-settled service awards is recognized as a liability in the consolidated balance sheets and is remeasured at the end of each reporting period. The Company recognizes forfeitures when they occur.
AXIS CAPITAL HOLDINGS LIMITED
NOTES TO CONSOLIDATED FINANCIAL STATEMENTS
DECEMBER 31, 2024, 2023, AND 2022
2. BASIS OF PRESENTATION AND SIGNIFICANT ACCOUNTING POLICIES (CONTINUED)
Performance Restricted Stock Units - Share-Settled
The fair value of share-settled performance awards which include a market condition is measured on the grant date using a Monte Carlo simulation model which requires inputs including share price, expected volatility, expected term, expected dividend yield and risk-free interest rates. The fair value of share-settled performance awards which include a performance condition is based on the closing price of the Company's common shares measured at the grant date.
The fair value of share-settled performance awards is recognized on a straight-line basis over the requisite service period. The Company recognizes forfeitures when they occur.
h) Derivative Instruments
The Company may enter into derivative instruments such as futures, options, interest rate swaps and foreign currency forward contracts as part of its overall foreign currency risk management strategy, to obtain exposure to a particular financial market or for yield enhancement.
From time to time the Company may also enter into insurance and reinsurance contracts that meet the Financial Accounting Standards Board's ("FASB") definition of a derivative contract.
The Company measures all derivative instruments at fair value (refer to Note 6 'Fair Value Measurements') and recognizes these instruments in either other assets or other liabilities in the consolidated balance sheets. Subsequent changes in fair value and realized gains (losses) are recognized in net income (loss) in the consolidated statements of operations.
i) Goodwill and Intangible Assets
The Company recognizes goodwill and other intangible assets in connection with certain acquisitions. Goodwill represents the excess of the purchase price paid over the fair value of the net assets acquired in these acquisitions and is not amortized. Other intangible assets with a finite life are amortized over the estimated useful live of the intangible asset. Other intangible assets with an indefinite life are not amortized.
The Company tests goodwill and indefinite-lived intangible assets for potential impairment during the fourth quarter each year and between annual tests if an event occurs or changes in circumstances indicate that the asset is impaired. Such events or circumstances may include an economic downturn in a geographic market or a change in the assessment of future operations.
For the purpose of evaluating goodwill for impairment, the Company may first perform a qualitative assessment to determine whether it is necessary to perform a quantitative goodwill impairment test. If determined to be necessary, the quantitative test compares the fair value of a reporting unit with its carrying amount, including goodwill. If the fair value of a reporting unit exceeds its carrying amount, goodwill of the reporting unit is considered not impaired. If the carrying amount of the reporting unit exceeds the fair value, an impairment loss is recognized in an amount equal to that excess, limited to the total amount of goodwill allocated to that reporting unit.
For the purpose of evaluating indefinite-lived intangibles for impairment, the Company may first perform a qualitative assessment to determine whether it is necessary to perform the quantitative impairment test. If the Company elects to perform a qualitative assessment, it first assesses qualitative factors to determine whether it is more likely than not that an indefinite lived intangible asset is impaired. If the Company determines that it is more likely than not that the indefinite lived intangible asset is impaired, the Company performs the quantitative impairment test.
For the purposes of evaluating goodwill and indefinite-lived intangible assets for impairment, the Company has an unconditional option to bypass the qualitative assessment in any period and proceed directly to performing the quantitative impairment test. The Company may resume performing the qualitative assessment in any subsequent period.
AXIS CAPITAL HOLDINGS LIMITED
NOTES TO CONSOLIDATED FINANCIAL STATEMENTS
DECEMBER 31, 2024, 2023, AND 2022
2. BASIS OF PRESENTATION AND SIGNIFICANT ACCOUNTING POLICIES (CONTINUED)
For other finite-lived intangible assets the Company tests for recoverability whenever events or changes in circumstances indicate its carrying amount may not be recoverable. The Company recognizes an impairment loss if the carrying amount of the asset is not recoverable and exceeds its fair value. The carrying amount of a finite-lived intangible asset is not recoverable if it exceeds the sum of the undiscounted cash flows expected to result from the use and eventual disposition of the asset.
If goodwill or an intangible asset is impaired, the carrying value of the asset is reduced to fair value and a corresponding expense is recorded in the consolidated statements of operations.
j) Income Taxes
Certain subsidiaries and branches of the Company operate in jurisdictions where they are subject to taxation.
Current and deferred income taxes are charged or credited to net income (loss), or in certain cases to AOCI, based on enacted tax laws and rates applicable in the relevant jurisdiction in the period in which the tax becomes accruable or realizable.
Deferred income taxes are provided for all temporary differences between the bases of assets and liabilities reported in the consolidated balance sheets and those reported in the various jurisdictional tax returns. When the assessment indicates that it is more likely than not that a portion of a deferred tax asset will not be realized in the foreseeable future, a valuation allowance against deferred tax assets is recorded.
The Company recognizes the tax benefits of uncertain tax positions only when the position is more-likely-than-not to be sustained on audit by the relevant taxing authorities.
k) Treasury Shares
Common shares repurchased by the Company and not subsequently canceled are classified as treasury shares and are recorded at cost. This results in a reduction of shareholders’ equity in the consolidated balance sheets. The Company uses the average cost method to determine the cost of shares reissued from treasury.
l) Leases
The Company recognizes a liability to make lease payments (the lease liability) and a right-of-use asset representing its right to use the underlying asset for the lease term related to office property and equipment leases.
The Company accounts for non-lease components separately from lease components. As a result, the non-lease components associated with the Company's leases are not included in the lease liabilities and right-of-use assets in the Company's consolidated balance sheets.
The Company does not record office property and equipment leases with an initial term of 12 months or less (short-term) in the Company's consolidated balance sheets.
m) New Accounting Standards Adopted in 2024
Segment Reporting
Effective October 1, 2024, the Company adopted Accounting Standards Update ("ASU" or "Update") ASU 2023-07 "Segment Reporting (Topic 280) - Improvements to Reportable Segment Disclosures" which aims to improve reportable segment disclosures, primarily through enhanced disclosures about significant segment expenses. The amendments applicable to the Company require disclosure of significant segment expenses that are regularly provided to the chief operating decision maker ("CODM") and are included within the Company's reported measure of segment profit or loss (collectively referred to as the "significant expense principle"). In addition, the Company is required to disclose the title and position of the CODM and an explanation of how the CODM uses the reported measure of segment profit or loss in assessing segment performance and deciding how to allocate resources (refer to Note 3 'Segment Information').The adoption of this guidance did not impact the Company's results of operations, financial condition, or liquidity.
AXIS CAPITAL HOLDINGS LIMITED
NOTES TO CONSOLIDATED FINANCIAL STATEMENTS
DECEMBER 31, 2024, 2023, AND 2022
2. BASIS OF PRESENTATION AND SIGNIFICANT ACCOUNTING POLICIES (CONTINUED)
n) Recently Issued Accounting Standards Not Yet Adopted
Improvements to Income Tax Disclosures
In December 2023, the FASB issued ASU 2023-09 "Income Taxes (Topic 740) - Improvements to Income Tax Disclosures". The amendments in this Update provide more transparency about income tax information through improvements to income tax disclosures primarily related to the rate reconciliation and income taxes paid information as follows:
Rate Reconciliation
The amendments in this Update require that public business entities on an annual basis (1) disclose specific categories in the rate reconciliation and (2) provide additional information for reconciling items that meet a quantitative threshold (if the effect of those reconciling items is equal to or greater than 5 percent of the amount computed by multiplying pretax income (or loss) by the applicable statutory income tax rate).
Income Taxes Paid
The amendments in this Update require that all entities disclose on an annual basis (1) the amount of income taxes paid (net of refunds received) disaggregated by federal (national), state, and foreign taxes and (2) the amount of income taxes paid (net of refunds received) disaggregated by individual jurisdictions in which income taxes paid (net of refunds received) if equal to or greater than 5 percent of total income taxes paid (net of refunds received)
Other Disclosures
The amendments in this Update require that all entities disclose (1) income (or loss) from continuing operations before income tax expense (or benefit) disaggregated between domestic and foreign and (2) income tax expense (or benefit) from continuing operations disaggregated by federal (national), state, and foreign.
The amendments in this Update eliminate the requirement for all entities to (1) disclose the nature and estimate of the range of the reasonably possible change in the unrecognized tax benefits balance in the next 12 months or (2) make a statement that an estimate of the range cannot be made.
The amendments in this Update remove the requirement to disclose the cumulative amount of each type of temporary difference when a deferred tax liability is not recognized because of the exceptions to comprehensive recognition of deferred taxes related to subsidiaries.
The guidance is effective for annual periods beginning after December 15, 2024. Early adoption is permitted. The amendments should be applied on a prospective basis. Retrospective application permitted.
AXIS CAPITAL HOLDINGS LIMITED
NOTES TO CONSOLIDATED FINANCIAL STATEMENTS
DECEMBER 31, 2024, 2023, AND 2022
2. BASIS OF PRESENTATION AND SIGNIFICANT ACCOUNTING POLICIES (CONTINUED)
Disaggregation of Income Statement Expenses
On November 4, 2024, the FASB issued ASU 2024-03 "Income Statement - Reporting Comprehensive Income - Expense Disaggregation Disclosures (Subtopic 220-40) "Disaggregation of Income Statement Expense" which requires disaggregated disclosure of income statement expenses for public business entities. The ASU does not change the expense captions an entity presents on the face of the income statement; rather, it requires disaggregation of certain expense captions into specified categories in disclosures within the footnotes to the financial statements.
The amendments require public business entities to disclose disaggregated information about specific natural expense categories underlying certain income statement expense line items that are considered "relevant" (referred to as "relevant expense captions") because they include one or more of the five natural expense categories. Such disclosures must be made on an annual and interim basis in a tabular format in the footnotes to the financial statements. The ASU requires entities to disaggregate any relevant expense caption presented on the face of the income statement within continuing operations into applicable natural expense categories including (1) employee compensation (2) depreciation and (3) intangible asset amortization.
The guidance is effective for fiscal years beginning after December 15, 2026 and for interim periods, effective within fiscal years beginning after December 15, 2027.
AXIS CAPITAL HOLDINGS LIMITED
NOTES TO CONSOLIDATED FINANCIAL STATEMENTS
DECEMBER 31, 2024, 2023, AND 2022
3. SEGMENT INFORMATION
AXIS Capital's underwriting operations are organized around its global underwriting platforms, AXIS Insurance and AXIS Re. The Company has determined that it has two reportable segments, insurance and reinsurance.
Insurance
The Company's insurance segment offers specialty insurance products to a variety of niche markets on a worldwide basis. The product lines in this segment are professional lines, property, liability, cyber, marine and aviation, accident and health, and credit and political risk.
Reinsurance
The Company's reinsurance segment provides treaty reinsurance to insurance companies on a worldwide basis. The product lines in this segment are liability, accident and health, professional lines, credit and surety, motor, agriculture, marine and aviation, and run-off lines which include catastrophe and property lines of business that the Company placed into run-off in 2022 and engineering lines of business that the Company placed into run-off in 2020.
The Company has identified its President and Chief Executive Officer as its chief operating decision maker ("CODM"). The CODM evaluates performance and decides how to allocate resources based on underwriting income (loss) for each of the Company's reportable segments. During quarterly Results Review meetings, an analysis of each reportable segment's underwriting income (loss) compared to the same period in the prior year, and compared to plan, is provided by business leaders to the CODM to facilitate the evaluation of segment performance.
The Company does not allocate its assets by segment, with the exception of goodwill and intangible assets.
The following tables present the underwriting results of the Company's reportable segments, as well as the carrying amounts of allocated goodwill and intangible assets:
AXIS CAPITAL HOLDINGS LIMITED
NOTES TO CONSOLIDATED FINANCIAL STATEMENTS
DECEMBER 31, 2024, 2023, AND 2022
3. SEGMENT INFORMATION (CONTINUED)
| | | | | | | | | | | | | | | | | | | | | | | |
| | | | | | | |
| At and year ended December 31, 2024 | Insurance | | Reinsurance | | Total | |
| | | | | | | |
| Gross premiums written | $ | 6,615,584 | | | $ | 2,390,304 | | | $ | 9,005,888 | | |
| Net premiums written | 4,250,545 | | | 1,506,806 | | | 5,757,351 | | |
| Net premiums earned | 3,926,036 | | | 1,380,199 | | | 5,306,235 | | |
| Other insurance related income | 94 | | | 30,627 | | | 30,721 | | |
| Current accident year net losses and loss expenses | (2,261,629) | | | (921,181) | | | (3,182,810) | | |
| Net favorable prior year reserve development | 16,209 | | | 8,114 | | | 24,323 | | |
| | | | | | | |
| Acquisition costs | (766,915) | | | (303,636) | | | (1,070,551) | | |
| Underwriting-related general and administrative expenses | (485,929) | | | (50,513) | | | (536,442) | | |
| Underwriting income | $ | 427,866 | | | $ | 143,610 | | | 571,476 | | |
| | | | | | | |
| Net investment income | | | | | 759,229 | | |
| Net investment gains (losses) | | | | | (138,534) | | |
| Corporate expenses | | | | | (129,760) | | |
| Foreign exchange gains | | | | | 50,822 | | |
| Interest expense and financing costs | | | | | (67,766) | | |
| | | | | | | |
| | | | | | | |
| | | | | | | |
| Reorganization expenses | | | | | (26,312) | | |
| | | | | | | |
| Amortization of intangible assets | | | | | (10,917) | | |
| Income before income taxes and interest in income of equity method investments | | | | | 1,008,238 | | |
| Income tax benefit | | | | | 55,595 | | |
| Interest in income of equity method investments | | | | | 17,953 | | |
| Net income | | | | | 1,081,786 | | |
| Preferred share dividends | | | | | 30,250 | | |
| Net income available to common shareholders | | | | | $ | 1,051,536 | | |
| | | | | | | |
| Current accident year loss ratio | 57.6 | % | | 66.7 | % | | 60.0 | % | |
| Prior year reserve development ratio | (0.4 | %) | | (0.5 | %) | | (0.5 | %) | |
| Net losses and loss expenses ratio | 57.2 | % | | 66.2 | % | | 59.5 | % | |
| Acquisition cost ratio | 19.5 | % | | 22.0 | % | | 20.2 | % | |
| General and administrative expense ratio | 12.4 | % | | 3.6 | % | | 12.6 | % | |
| Combined ratio | 89.1 | % | | 91.8 | % | | 92.3 | % | |
| | | | | | | |
| Goodwill and intangible assets | $ | 242,465 | | | $ | — | | | $ | 242,465 | | |
| | | | | | | |
AXIS CAPITAL HOLDINGS LIMITED
NOTES TO CONSOLIDATED FINANCIAL STATEMENTS
DECEMBER 31, 2024, 2023, AND 2022
3. SEGMENT INFORMATION (CONTINUED)
| | | | | | | | | | | | | | | | | | | | | | | |
| | | | | | | |
| At and year ended December 31, 2023 | Insurance | | Reinsurance | | Total | |
| | | | | | | |
| Gross premiums written | $ | 6,140,764 | | | $ | 2,215,761 | | | $ | 8,356,525 | | |
| Net premiums written | 3,758,720 | | | 1,343,605 | | | 5,102,325 | | |
| Net premiums earned | 3,461,700 | | | 1,622,081 | | | 5,083,781 | | |
| Other insurance related income (loss) | (198) | | | 22,693 | | | 22,495 | | |
| Current accident year net losses and loss expenses | (1,903,648) | | | (1,077,572) | | | (2,981,220) | | |
| Net favorable (adverse) prior year reserve development | (176,353) | | | (235,529) | | | (411,882) | | |
| | | | | | | |
| Acquisition costs | (648,463) | | | (352,482) | | | (1,000,945) | | |
| Underwriting-related general and administrative expenses | (472,094) | | | (79,373) | | | (551,467) | | |
| Underwriting income (loss) | $ | 260,944 | | | $ | (100,182) | | | 160,762 | | |
| | | | | | | |
| Net investment income | | | | | 611,742 | | |
| Net investment gains (losses) | | | | | (74,630) | | |
| Corporate expenses | | | | | (132,979) | | |
| Foreign exchange (losses) gains | | | | | (58,115) | | |
| Interest expense and financing costs | | | | | (68,421) | | |
| | | | | | | |
| | | | | | | |
| | | | | | | |
| | | | | | | |
| Reorganization expenses | | | | | (28,997) | | |
| | | | | | | |
| Amortization of intangible assets | | | | | (10,917) | | |
| Income before income taxes and interest in income of equity method investments | | | | | 398,445 | | |
| Income tax (expense) benefit | | | | | (26,316) | | |
| Interest in income of equity method investments | | | | | 4,163 | | |
| Net income | | | | | 376,292 | | |
| Preferred share dividends | | | | | 30,250 | | |
| Net income available to common shareholders | | | | | $ | 346,042 | | |
| | | | | | | |
| Current accident year loss ratio | 55.0 | % | | 66.4 | % | | 58.6 | % | |
| Prior year reserve development ratio | 5.1 | % | | 14.6 | % | | 8.1 | % | |
| Net losses and loss expenses ratio | 60.1 | % | | 81.0 | % | | 66.7 | % | |
| Acquisition cost ratio | 18.7 | % | | 21.7 | % | | 19.7 | % | |
| General and administrative expense ratio | 13.7 | % | | 4.9 | % | | 13.5 | % | |
| Combined ratio | 92.5 | % | | 107.6 | % | | 99.9 | % | |
| | | | | | | |
| Goodwill and intangible assets | $ | 287,684 | | | $ | — | | | $ | 287,684 | | |
| | | | | | | |
AXIS CAPITAL HOLDINGS LIMITED
NOTES TO CONSOLIDATED FINANCIAL STATEMENTS
DECEMBER 31, 2024, 2023, AND 2022
3. SEGMENT INFORMATION (CONTINUED)
| | | | | | | | | | | | | | | | | | | | | | | |
| | | | | | | |
| At and year ended December 31, 2022 | Insurance | | Reinsurance | | Total | |
| | | | | | | |
| Gross premiums written | $ | 5,585,581 | | | $ | 2,629,014 | | | $ | 8,214,595 | | |
| Net premiums written | 3,377,906 | | | 1,885,150 | | | 5,263,056 | | |
| Net premiums earned | 3,134,155 | | | 2,026,171 | | | 5,160,326 | | |
| Other insurance related income | 559 | | | 12,514 | | | 13,073 | | |
| Current accident year net losses and loss expenses | (1,802,204) | | | (1,465,739) | | | (3,267,943) | | |
| Net favorable prior year reserve development | 16,350 | | | 9,183 | | | 25,533 | | |
| | | | | | | |
| Acquisition costs | (577,838) | | | (444,179) | | | (1,022,017) | | |
| Underwriting-related general and administrative expenses | (443,704) | | | (106,585) | | | (550,289) | | |
| Underwriting income | $ | 327,318 | | | $ | 31,365 | | | 358,683 | | |
| | | | | | | |
| Net investment income | | | | | 418,829 | | |
| Net investment gains (losses) | | | | | (456,789) | | |
| Corporate expenses | | | | | (130,054) | | |
| Foreign exchange gains | | | | | 157,945 | | |
| Interest expense and financing costs | | | | | (63,146) | | |
| Reorganization expenses | | | | | (31,426) | | |
| | | | | | | |
| Amortization of intangible assets | | | | | (10,917) | | |
| Income before income taxes and interest in income of equity method investments | | | | | 243,125 | | |
| Income tax (expense) benefit | | | | | (22,037) | | |
| Interest in income of equity method investments | | | | | 1,995 | | |
| Net income | | | | | 223,083 | | |
| Preferred share dividends | | | | | 30,250 | | |
| Net income available to common shareholders | | | | | $ | 192,833 | | |
| | | | | | | |
| Current accident year loss ratio | 57.5 | % | | 72.3 | % | | 63.3 | % | |
| Prior year reserve development ratio | (0.5 | %) | | (0.4 | %) | | (0.5 | %) | |
| Net losses and loss expenses ratio | 57.0 | % | | 71.9 | % | | 62.8 | % | |
| Acquisition cost ratio | 18.4 | % | | 21.9 | % | | 19.8 | % | |
| General and administrative expense ratio | 14.2 | % | | 5.3 | % | | 13.2 | % | |
| Combined ratio | 89.6 | % | | 99.1 | % | | 95.8 | % | |
| | | | | | | |
| Goodwill and intangible assets | $ | 298,601 | | | $ | — | | | $ | 298,601 | | |
| | | | | | | |
AXIS CAPITAL HOLDINGS LIMITED
NOTES TO CONSOLIDATED FINANCIAL STATEMENTS
DECEMBER 31, 2024, 2023, AND 2022
3. SEGMENT INFORMATION (CONTINUED)
The following table presents gross premiums written by the geographical location of the Company's subsidiaries:
| | | | | | | | | | | | | | | | | | | | | | | |
| | | | | | | |
| Years ended December 31, | 2024 | | 2023 | | 2022 | |
| | | | | | | |
| U.S. | $ | 4,864,074 | | | $ | 4,484,789 | | | $ | 4,342,707 | | |
| Ireland | 1,923,006 | | | 1,837,177 | | | 1,931,815 | | |
| Lloyd's of London | 1,998,217 | | | 1,759,990 | | | 1,567,458 | | |
| Bermuda | 220,591 | | | 274,569 | | | 372,615 | | |
| Gross premiums written | $ | 9,005,888 | | | $ | 8,356,525 | | | $ | 8,214,595 | | |
| | | | | | | |
The following table presents net premiums earned by segment and line of business: | | | | | | | | | | | | | | | | | | | | | | | |
| | | | | | | |
| Years ended December 31, | 2024 | | 2023 | | 2022 | |
| | | | | | | |
| Insurance | | | | | | |
| Professional lines | $ | 817,535 | | | $ | 764,558 | | | $ | 817,924 | | |
| Property | 1,139,308 | | | 878,849 | | | 755,986 | | |
| Liability | 494,561 | | | 496,381 | | | 459,775 | | |
| Cyber | 347,842 | | | 323,025 | | | 309,004 | | |
| Marine and aviation | 614,826 | | | 567,292 | | | 479,499 | | |
| Accident and health | 360,894 | | | 306,061 | | | 209,548 | | |
| Credit and political risk | 151,070 | | | 125,534 | | | 102,419 | | |
| Total Insurance | 3,926,036 | | | 3,461,700 | | | 3,134,155 | | |
| | | | | | | |
| Reinsurance | | | | | | |
| Liability | 309,265 | | | 403,239 | | | 484,681 | | |
| Accident and health | 322,932 | | | 341,806 | | | 368,747 | | |
| Professional lines | 169,074 | | | 205,404 | | | 250,911 | | |
| Credit and surety | 231,780 | | | 236,408 | | | 192,926 | | |
| Motor | 123,545 | | | 155,942 | | | 205,774 | | |
| Agriculture | 126,549 | | | 121,628 | | | 122,289 | | |
| Marine and aviation | 64,609 | | | 65,658 | | | 78,504 | | |
| Run-off lines | | | | | | |
| Catastrophe | 13,412 | | | 33,963 | | | 156,232 | | |
| Property | 6,266 | | | 44,508 | | | 135,480 | | |
| Engineering | 12,767 | | | 13,525 | | | 30,627 | | |
| Total run-off lines | 32,445 | | | 91,996 | | | 322,339 | | |
| | | | | | | |
| Total Reinsurance | 1,380,199 | | | 1,622,081 | | | 2,026,171 | | |
| | | | | | | |
| Total | $ | 5,306,235 | | | $ | 5,083,781 | | | $ | 5,160,326 | | |
| | | | | | | |
AXIS CAPITAL HOLDINGS LIMITED
NOTES TO CONSOLIDATED FINANCIAL STATEMENTS
DECEMBER 31, 2024, 2023 AND 2022
4. GOODWILL AND INTANGIBLE ASSETS
The table below provides details of goodwill and intangible assets related to the Company's insurance segment:
| | | | | | | | | | | | | | | | | | | | | | | | | | | | | |
| | | | | | | | | |
| | Goodwill | | Intangible
assets with an
indefinite life | | Intangible
assets with a
finite life | | Total | |
| | | | | | | | | |
| At December 31, 2022 | | | | | | | | |
| Gross amount | $ | 95,890 | | | $ | 120,785 | | | $ | 394,604 | | | $ | 611,279 | | |
| Accumulated amortization | n/a | | n/a | | (306,671) | | | (306,671) | | |
| Accumulated translation adjustment | 4,911 | | | — | | | — | | | 4,911 | | |
| | 100,801 | | | 120,785 | | | 87,933 | | | 309,519 | | |
| Amortization | n/a | | n/a | | (10,917) | | | (10,917) | | |
| Impairment charges | — | | | — | | | — | | | — | | |
| At December 31, 2023 | | | | | | | | |
| Gross amount | 95,890 | | | 120,785 | | | 394,604 | | | 611,279 | | |
| Accumulated amortization | n/a | | n/a | | (317,588) | | | (317,588) | | |
| Accumulated translation adjustment | 4,911 | | | — | | | — | | | 4,911 | | |
| | 100,801 | | | 120,785 | | | 77,016 | | | 298,602 | | |
| Amortization | n/a | | n/a | | (10,917) | | | (10,917) | | |
| Impairment charges | — | | | — | | | — | | | — | | |
| At December 31, 2024 | | | | | | | | |
| Gross amount | 95,890 | | | 120,785 | | | 394,604 | | | 611,279 | | |
| Accumulated amortization | n/a | | n/a | | (328,505) | | | (328,505) | | |
| Accumulated translation adjustment | 4,911 | | | — | | | — | | | 4,911 | | |
| | 100,801 | | | 120,785 | | | 66,099 | | | 287,685 | | |
| Amortization | n/a | | n/a | | (10,917) | | | (10,917) | | |
| Impairment charges | — | | | — | | | — | | | — | | |
| Tax-related adjustments | (34,303) | | | — | | | — | | | (34,303) | | |
| | $ | 66,498 | | | $ | 120,785 | | | $ | 55,182 | | | $ | 242,465 | | |
| | | | | | | | | |
n/a – not applicable
Intangible Assets with an Indefinite Life
Intangible assets with an indefinite life include U.S. state licenses that provide a legal right to transact business indefinitely and the value of Lloyd's syndicate capacity, which represents the right to underwrite a certain allocated limit of premium in the Lloyd's market.
Impairment Review
For the years ended December 31, 2024, 2023 and 2022, the Company's impairment review of goodwill did not result in the recognition of an impairment loss.
Tax-related Adjustments
During the year ended December 31, 2024, the Company assessed that certain deferred tax assets and deferred tax liabilities were no longer required and recognized a tax-related adjustment of $34 million.
AXIS CAPITAL HOLDINGS LIMITED
NOTES TO CONSOLIDATED FINANCIAL STATEMENTS
DECEMBER 31, 2024, 2023 AND 2022
4. GOODWILL AND INTANGIBLE ASSETS (CONTINUED)
The tables below provide details of the gross amount and accumulated amortization by category of value of business acquired ("VOBA") and intangible assets:
| | | | | | | | | | | | | | | | | | | | | | | | | | |
| | | VOBA and intangible assets | |
| At December 31, 2024 | | Gross amount | | Accumulated amortization | | Total | |
| | | | | | | | |
| U.S. state licenses | | $ | 26,036 | | | n/a | | $ | 26,036 | | |
| Syndicate capacity (2) | | 94,748 | | | n/a | | 94,748 | | |
| Customer relationships and customers lists (1) | | 13,330 | | | (12,993) | | | 337 | | |
| VOBA(2) | | 256,942 | | | (256,942) | | | — | | |
| Coverholders (2) | | 63,565 | | | (38,408) | | | 25,157 | | |
| Large brokers (2) | | 46,641 | | | (22,545) | | | 24,096 | | |
| SME brokers (2) | | 14,126 | | | (8,533) | | | 5,593 | | |
| | | $ | 515,388 | | | $ | (339,421) | | | $ | 175,967 | | |
| | | | | | | | |
n/a – not applicable
(1) On April 1, 2015, the Company completed its acquisition of Ternian Insurance Group LLC and recognized the definite life intangible assets detailed above.
(2) On October 2, 2017, the Company acquired Novae and recognized finite lived intangible assets, including VOBA, distribution networks, and indefinite lived intangible assets related to Lloyd's syndicate capacity, all detailed above.
| | | | | | | | | | | | | | | | | | | | | | | | | | |
| | | VOBA and intangible assets | |
| At December 31, 2023 | | Gross amount | | Accumulated amortization | | Total | |
| | | | | | | | |
| U.S. state licenses | | $ | 26,036 | | | n/a | | $ | 26,036 | | |
| Syndicate capacity (2) | | 94,748 | | | n/a | | 94,748 | | |
| Customer relationships and customers lists (1) | | 13,330 | | | (11,661) | | | 1,669 | | |
| VOBA(2) | | 256,942 | | | (256,942) | | | — | | |
| Coverholders (2) | | 63,565 | | | (33,110) | | | 30,455 | | |
| Large brokers (2) | | 46,641 | | | (19,435) | | | 27,206 | | |
| SME brokers (2) | | 14,126 | | | (7,357) | | | 6,769 | | |
| | | $ | 515,388 | | | $ | (328,505) | | | $ | 186,883 | | |
| | | | | | | | |
n/a – not applicable
(1) On April 1, 2015, the Company completed its acquisition of Ternian Insurance Group LLC (renamed AXIS Group Benefits LLC in 2022) and recognized the definite life intangible assets detailed above.
(2) On October 2, 2017, the Company acquired Novae Group plc ("Novae") and recognized finite lived intangible assets, including VOBA, distribution networks, and indefinite lived intangible assets related to Lloyd's syndicate capacity, all detailed above.
AXIS CAPITAL HOLDINGS LIMITED
NOTES TO CONSOLIDATED FINANCIAL STATEMENTS
DECEMBER 31, 2024, 2023 AND 2022
4. GOODWILL AND INTANGIBLE ASSETS (CONTINUED)
The table below provides details of estimated amortization expense of intangible assets with a finite life:
| | | | | | | | | | | | | | | | | | | | | | | | | | |
| | | | | | | | |
| | | | | | | Total | |
| | | | | | | | |
| | | | | | | | |
| 2025 | | | | | | $ | 9,921 | | |
| 2026 | | | | | | 9,583 | | |
| 2027 | | | | | | 9,583 | | |
| 2028 | | | | | | 9,583 | | |
| 2029 | | | | | | 7,965 | | |
| After 2029 | | | | | | 8,547 | | |
| Total remaining amortization expense | | | | | | 55,182 | | |
| Indefinite lived intangible assets | | | | | | 120,785 | | |
| Total intangible assets | | | | | | $ | 175,967 | | |
| | | | | | | | |
The estimated remaining average useful life of finite lived intangible assets is 6 years.
AXIS CAPITAL HOLDINGS LIMITED
NOTES TO CONSOLIDATED FINANCIAL STATEMENTS
DECEMBER 31, 2024, 2023 AND 2022
5. INVESTMENTS
a) Fixed Maturities, Available for Sale
The following table provides the amortized cost and fair values of the Company's fixed maturities classified as available for sale:
| | | | | | | | | | | | | | | | | | | | | | | | | | | | | | | | | | | | | |
| | | | | | | | | | | | | |
| | Amortized
cost | | Allowance for expected credit losses | | Gross
unrealized
gains | | Gross
unrealized
losses | | Fair
value | | | |
| | | | | | | | | | | | | |
| At December 31, 2024 | | | | | | | | | | | | |
| Available for sale | | | | | | | | | | | | |
| U.S. government and agency | $ | 2,830,111 | | | $ | — | | | $ | 6,011 | | | $ | (33,136) | | | $ | 2,802,986 | | | | |
| Non-U.S. government | 753,315 | | | — | | | 2,584 | | | (25,960) | | | 729,939 | | | | |
| Corporate debt | 4,941,510 | | | (3,690) | | | 30,594 | | | (126,224) | | | 4,842,190 | | | | |
| Agency RMBS(1) | 1,245,681 | | | — | | | 1,154 | | | (61,990) | | | 1,184,845 | | | | |
| CMBS(2) | 852,534 | | | — | | | 1,244 | | | (34,170) | | | 819,608 | | | | |
| Non-agency RMBS | 132,116 | | | (195) | | | 597 | | | (9,982) | | | 122,536 | | | | |
| ABS(3) | 1,547,350 | | | (53) | | | 5,812 | | | (13,277) | | | 1,539,832 | | | | |
| Municipals(4) | 117,288 | | | — | | | 125 | | | (6,596) | | | 110,817 | | | | |
| Total fixed maturities, available for sale | $ | 12,419,905 | | | $ | (3,938) | | | $ | 48,121 | | | $ | (311,335) | | | $ | 12,152,753 | | | | |
| | | | | | | | | | | | | |
| At December 31, 2023 | | | | | | | | | | | | |
| Available for sale | | | | | | | | | | | | |
| U.S. government and agency | $ | 3,049,445 | | | $ | — | | | $ | 13,211 | | | $ | (55,128) | | | $ | 3,007,528 | | | | |
| Non-U.S. government | 729,761 | | | (30) | | | 13,089 | | | (18,861) | | | 723,959 | | | | |
| Corporate debt | 4,651,654 | | | (10,438) | | | 49,434 | | | (216,478) | | | 4,474,172 | | | | |
| Agency RMBS(1) | 1,706,204 | | | — | | | 11,495 | | | (83,038) | | | 1,634,661 | | | | |
| CMBS(2) | 897,553 | | | — | | | 551 | | | (58,408) | | | 839,696 | | | | |
| Non-agency RMBS | 165,910 | | | (194) | | | 713 | | | (13,033) | | | 153,396 | | | | |
| ABS(3) | 1,265,187 | | | (50) | | | 2,855 | | | (25,021) | | | 1,242,971 | | | | |
| Municipals(4) | 168,540 | | | (47) | | | 414 | | | (10,548) | | | 158,359 | | | | |
| Total fixed maturities, available for sale | $ | 12,634,254 | | | $ | (10,759) | | | $ | 91,762 | | | $ | (480,515) | | | $ | 12,234,742 | | | | |
| | | | | | | | | | | | | |
(1)Residential mortgage-backed securities ("RMBS") originated by U.S. government-sponsored agencies.
(2)Commercial mortgage-backed securities ("CMBS").
(3)Asset-backed securities ("ABS") include debt tranched securities collateralized primarily by auto loans, student loans, credit card receivables and collateralized loan obligations ("CLOs").
(4)Municipals include bonds issued by states, municipalities and political subdivisions.
AXIS CAPITAL HOLDINGS LIMITED
NOTES TO CONSOLIDATED FINANCIAL STATEMENTS
DECEMBER 31, 2024, 2023 AND 2022
5. INVESTMENTS (CONTINUED)
Contractual Maturities
Expected maturities may differ from contractual maturities because borrowers may have the right to call or prepay obligations with or without call or prepayment penalties.
The table below provides the contractual maturities of fixed maturities classified as available for sale:
| | | | | | | | | | | | | | | | | | | | | | | |
| | | | | | | |
| | Amortized
cost | | Fair
value | | % of Total
fair value | |
| | | | | | | |
| At December 31, 2024 | | | | | | |
| Maturity | | | | | | |
| Due in one year or less | $ | 895,177 | | | $ | 885,866 | | | 7.4 | % | |
| Due after one year through five years | 5,637,336 | | | 5,567,905 | | | 45.8 | % | |
| Due after five years through ten years | 1,895,116 | | | 1,826,564 | | | 15.0 | % | |
| Due after ten years | 214,595 | | | 205,597 | | | 1.7 | % | |
| | 8,642,224 | | | 8,485,932 | | | 69.9 | % | |
| Agency RMBS | 1,245,681 | | | 1,184,845 | | | 9.7 | % | |
| CMBS | 852,534 | | | 819,608 | | | 6.7 | % | |
| Non-agency RMBS | 132,116 | | | 122,536 | | | 1.0 | % | |
| ABS | 1,547,350 | | | 1,539,832 | | | 12.7 | % | |
| Total | $ | 12,419,905 | | | $ | 12,152,753 | | | 100.0 | % | |
| | | | | | | |
| At December 31, 2023 | | | | | | |
| Maturity | | | | | | |
| Due in one year or less | $ | 474,557 | | | $ | 463,789 | | | 3.6 | % | |
| Due after one year through five years | 5,902,571 | | | 5,790,493 | | | 47.3 | % | |
| Due after five years through ten years | 2,064,619 | | | 1,954,449 | | | 16.0 | % | |
| Due after ten years | 157,653 | | | 155,287 | | | 1.3 | % | |
| | 8,599,400 | | | 8,364,018 | | | 68.2 | % | |
| Agency RMBS | 1,706,204 | | | 1,634,661 | | | 13.4 | % | |
| CMBS | 897,553 | | | 839,696 | | | 6.9 | % | |
| Non-agency RMBS | 165,910 | | | 153,396 | | | 1.3 | % | |
| ABS | 1,265,187 | | | 1,242,971 | | | 10.2 | % | |
| Total | $ | 12,634,254 | | | $ | 12,234,742 | | | 100.0 | % | |
| | | | | | | |
AXIS CAPITAL HOLDINGS LIMITED
NOTES TO CONSOLIDATED FINANCIAL STATEMENTS
DECEMBER 31, 2024, 2023 AND 2022
5. INVESTMENTS (CONTINUED)
Gross Unrealized Losses
The following table summarizes fixed maturities, available for sale in an unrealized loss position and the aggregate fair value and gross unrealized loss by length of time the security has continuously been in an unrealized loss position:
| | | | | | | | | | | | | | | | | | | | | | | | | | | | | | | | | | | | | | | | | |
| | | | | | | | | | | | | |
| | 12 months or greater | | Less than 12 months | | Total | |
| | Fair
value | | Unrealized
losses | | Fair
value | | Unrealized
losses | | Fair
value | | Unrealized
losses | |
| | | | | | | | | | | | | |
| At December 31, 2024 | | | | | | | | | | | | |
| Fixed maturities, available for sale | | | | | | | | | | | | |
| U.S. government and agency | $ | 262,368 | | | $ | (17,515) | | | $ | 1,026,139 | | | $ | (15,621) | | | $ | 1,288,507 | | | $ | (33,136) | | |
| Non-U.S. government | 98,846 | | | (9,179) | | | 457,889 | | | (16,781) | | | 556,735 | | | (25,960) | | |
| Corporate debt | 934,975 | | | (78,979) | | | 2,032,254 | | | (47,245) | | | 2,967,229 | | | (126,224) | | |
| Agency RMBS | 280,550 | | | (35,333) | | | 749,040 | | | (26,657) | | | 1,029,590 | | | (61,990) | | |
| CMBS | 410,213 | | | (22,334) | | | 260,411 | | | (11,836) | | | 670,624 | | | (34,170) | | |
| Non-agency RMBS | 69,418 | | | (9,900) | | | 8,302 | | | (82) | | | 77,720 | | | (9,982) | | |
| ABS | 147,281 | | | (8,471) | | | 295,897 | | | (4,806) | | | 443,178 | | | (13,277) | | |
| Municipals | 49,495 | | | (4,198) | | | 51,002 | | | (2,398) | | | 100,497 | | | (6,596) | | |
| Total fixed maturities, available for sale | $ | 2,253,146 | | | $ | (185,909) | | | $ | 4,880,934 | | | $ | (125,426) | | | $ | 7,134,080 | | | $ | (311,335) | | |
| | | | | | | | | | | | | |
| | | | | | | | | | | | | |
| | | | | | | | | | | | | |
| | | | | | | | | | | | | |
| | | | | | | | | | | | | |
| | | | | | | | | | | | | |
| At December 31, 2023 | | | | | | | | | | | | |
| Fixed maturities, available for sale | | | | | | | | | | | | |
| U.S. government and agency | $ | 846,503 | | | $ | (42,465) | | | $ | 867,733 | | | $ | (12,663) | | | $ | 1,714,236 | | | $ | (55,128) | | |
| Non-U.S. government | 233,038 | | | (18,178) | | | 115,112 | | | (683) | | | 348,150 | | | (18,861) | | |
| Corporate debt | 2,623,304 | | | (210,512) | | | 240,813 | | | (5,966) | | | 2,864,117 | | | (216,478) | | |
| Agency RMBS | 778,656 | | | (80,070) | | | 218,606 | | | (2,968) | | | 997,262 | | | (83,038) | | |
| CMBS | 703,411 | | | (54,856) | | | 75,242 | | | (3,552) | | | 778,653 | | | (58,408) | | |
| Non-agency RMBS | 98,483 | | | (13,013) | | | 10,017 | | | (20) | | | 108,500 | | | (13,033) | | |
| ABS | 879,743 | | | (24,747) | | | 83,582 | | | (274) | | | 963,325 | | | (25,021) | | |
| Municipals | 129,969 | | | (10,156) | | | 6,238 | | | (392) | | | 136,207 | | | (10,548) | | |
| Total fixed maturities, available for sale | $ | 6,293,107 | | | $ | (453,997) | | | $ | 1,617,343 | | | $ | (26,518) | | | $ | 7,910,450 | | | $ | (480,515) | | |
| | | | | | | | | | | | | |
| | | | | | | | | | | | | |
| | | | | | | | | | | | | |
| | | | | | | | | | | | | |
| | | | | | | | | | | | | |
| | | | | | | | | | | | | |
At December 31, 2024, 3,994 fixed maturities (2023: 3,535) were in an unrealized loss position of $311 million (2023: $481 million) of which $14 million (2023: $13 million) was related to securities below investment grade or not rated.
At December 31, 2024, 2,108 fixed maturities (2023: 3,212) had been in a continuous unrealized loss position for twelve months or greater and had a fair value of $2,253 million (2023: $6,293 million).
The unrealized losses of $311 million (2023: $481 million) were due to non-credit factors and were expected to be recovered as the related securities approach maturity.
At December 31, 2024, the Company did not intend to sell the securities in an unrealized loss position and it is more likely than not that the Company will not be required to sell these securities before the anticipated recovery of their amortized costs.
AXIS CAPITAL HOLDINGS LIMITED
NOTES TO CONSOLIDATED FINANCIAL STATEMENTS
DECEMBER 31, 2024, 2023 AND 2022
5. INVESTMENTS (CONTINUED)
b) Fixed Maturities, Held to Maturity
The following table provides the amortized cost and fair values of the Company's fixed maturities classified as held to maturity:
| | | | | | | | | | | | | | | | | | | | | | | | | | | | | | | | | | | | | | | | | | | |
| | Amortized cost | | Allowance for expected credit losses | | Net carrying value | | Gross
unrealized
gains | | Gross unrealized losses | | Fair value | | | |
| | | | | | | | | | | | | | | |
| At December 31, 2024 | | | | | | | | | | | | | | |
| Held to maturity | | | | | | | | | | | | | | |
| Corporate debt | $ | 122,706 | | | $ | — | | | $ | 122,706 | | | $ | 675 | | | $ | (7,764) | | | $ | 115,617 | | | | |
| ABS(1) | 320,694 | | | — | | | 320,694 | | | 560 | | | (120) | | | 321,134 | | | | |
| Total fixed maturities, held to maturity | $ | 443,400 | | | $ | — | | | $ | 443,400 | | | $ | 1,235 | | | $ | (7,884) | | | $ | 436,751 | | | | |
| | | | | | | | | | | | | | | |
| At December 31, 2023 | | | | | | | | | | | | | | |
| Held to maturity | | | | | | | | | | | | | | |
| Corporate debt | $ | 95,200 | | | $ | — | | | $ | 95,200 | | | $ | 298 | | | $ | (8,827) | | | $ | 86,671 | | | | |
| ABS(1) | 591,096 | | | — | | | 591,096 | | | 5 | | | (1,921) | | | 589,180 | | | | |
| Total fixed maturities, held to maturity | $ | 686,296 | | | $ | — | | | $ | 686,296 | | | $ | 303 | | | $ | (10,748) | | | $ | 675,851 | | | | |
| | | | | | | | | | | | | | | |
(1)Asset-backed securities ("ABS") include debt tranched securities collateralized primarily by collateralized loan obligations ("CLOs").
At December 31, 2024, fixed maturities, held to maturity of $443 million (2023: $686 million) were presented net of an allowance for expected credit losses of $nil (2023: $nil).
The Company's ABS, held to maturity consist of CLO debt tranched securities ("CLO Debt"). The Company uses a scenario-based approach to review its CLO Debt portfolio and reviews subordination levels of these securities to determine their ability to absorb credit losses of the underlying collateral. If losses are forecast to be below the subordination level for a tranche held by the Company, the security is determined not to have a credit loss. At December 31, 2024 and 2023, the allowance for credit losses expected to be recognized over the life of the Company's ABS, held to maturity was $nil.
To estimate expected credit losses for corporate debt securities, held to maturity, the Company's projected cash flows are primarily driven by assumptions regarding the severity of loss, which is a function of the probability of default and projected recovery rates. The Company's default and recovery rates are based on credit ratings, credit analysis and macroeconomic forecasts. At December 31, 2024 and 2023, the allowance for credit losses expected to be recognized over the life of the Company's corporate debt, held to maturity was $nil.
Contractual Maturities
Expected maturities may differ from contractual maturities because borrowers may have the right to call or prepay obligations with or without call or prepayment penalties. ABS classified as held to maturity had a net carrying value of $321 million (2023: $591 million).
Corporate debt classified as held to maturity with a net carrying value of $28 million (2023: $nil) is due between 1 year and 3 years and corporate debt classified as held to maturity with a net carrying value of $95 million (2023: $95 million) is due between 3 years and 10 years.
AXIS CAPITAL HOLDINGS LIMITED
NOTES TO CONSOLIDATED FINANCIAL STATEMENTS
DECEMBER 31, 2024, 2023 AND 2022
5. INVESTMENTS (CONTINUED)
c) Equity Securities
The following table provides the cost and fair values of the Company's equity securities: | | | | | | | | | | | | | | | | | | | | | | | | | | | | | |
| | | | | | | | | |
| | Cost | | Gross
unrealized
gains | | Gross
unrealized
losses | | Fair
value | |
| | | | | | | | | |
| At December 31, 2024 | | | | | | | | |
| Equity securities | | | | | | | | |
| Common stocks | $ | 3,061 | | | $ | 65 | | | $ | (488) | | | $ | 2,638 | | |
| Preferred stocks | 5,843 | | | 136 | | | (112) | | | 5,867 | | |
| Exchange-traded funds | 188,771 | | | 126,477 | | | (1,206) | | | 314,042 | | |
| Bond mutual funds | 323,068 | | | 540 | | | (66,881) | | | 256,727 | | |
| Total equity securities | $ | 520,743 | | | $ | 127,218 | | | $ | (68,687) | | | $ | 579,274 | | |
| | | | | | | | | |
| At December 31, 2023 | | | | | | | | |
| Equity securities | | | | | | | | |
| Common stocks | $ | 2,843 | | | $ | 101 | | | $ | (398) | | | $ | 2,546 | | |
| Preferred stocks | 5,496 | | | 218 | | | (113) | | | 5,601 | | |
| Exchange-traded funds | 182,989 | | | 105,858 | | | (1,572) | | | 287,275 | | |
| Bond mutual funds | 352,505 | | | 4,119 | | | (63,535) | | | 293,089 | | |
| Total equity securities | $ | 543,833 | | | $ | 110,296 | | | $ | (65,618) | | | $ | 588,511 | | |
| | | | | | | | | |
AXIS CAPITAL HOLDINGS LIMITED
NOTES TO CONSOLIDATED FINANCIAL STATEMENTS
DECEMBER 31, 2024, 2023 AND 2022
5. INVESTMENTS (CONTINUED)
d) Mortgage Loans
The following table provides details of the Company's mortgage loans, held for investment: | | | | | | | | | | | | | | | | | | | | | | | | | | | | | |
| | December 31, 2024 | | December 31, 2023 | |
| | Carrying value | | % of Total | | Carrying value | | % of Total | |
| | | | | | | | | |
| Mortgage loans held for investment: | | | | | | | | |
| Commercial | $ | 529,075 | | | 105 | % | | $ | 616,368 | | | 101 | % | |
| | | | | | | | | |
| Allowance for expected credit losses | (23,378) | | | (5 | %) | | (6,220) | | | (1 | %) | |
| Total mortgage loans held for investment | $ | 505,697 | | | 100 | % | | $ | 610,148 | | | 100 | % | |
| | | | | | | | | |
The primary credit quality indicators for commercial mortgage loans are the debt service coverage ratio which compares a property’s net operating income to amounts needed to service the principal and interest due under the loan, (generally, the lower the debt service coverage ratio, the higher the risk of experiencing a credit loss) and the loan-to-value ratio which compares the unpaid principal balance of the loan to the estimated fair value of the underlying collateral (generally, the higher the loan-to-value ratio, the higher the risk of experiencing a credit loss). The debt service coverage ratio and loan-to-value ratio, as well as the values utilized in calculating these ratios, are updated quarterly.
The Company has a high quality commercial mortgage loan portfolio with a weighted average debt service coverage ratio of 1.7x (2023: 1.9x) and a weighted average loan-to-value ratio of 78% (2023: 71%). At December 31, 2024 and 2023, there were no past due amounts associated with the commercial mortgage loans held by the Company.
On a quarterly basis, the Company's exposure to commercial mortgage loans in the office sector, that represents 43% (2023: 41%) of the total mortgage loan portfolio, is evaluated for credit losses based on inputs unique to this sector. This assessment utilizes historical credit loss experience adjusted to reflect current conditions and management forecasts. Further, collateral dependent commercial mortgage loans (e.g., when the borrower is experiencing financial difficulty, including when foreclosure is reasonably possible or probable) are evaluated individually for credit losses. The allowance for expected credit losses for a collateral dependent loan is established as the excess of amortized cost over the estimated fair value of the loan's underlying collateral, less selling cost when foreclosure is probable.
Accordingly, any change in estimated credit losses is recognized as a change in the allowance for expected credit losses and is recorded in net investment gains (losses).
At December 31, 2024, the Company's mortgage loan portfolio had an allowance for expected credit losses of $23 million (2023: $6 million).
AXIS CAPITAL HOLDINGS LIMITED
NOTES TO CONSOLIDATED FINANCIAL STATEMENTS
DECEMBER 31, 2024, 2023 AND 2022
5. INVESTMENTS (CONTINUED)
e) Other Investments
The following table provides a summary of the Company's other investments, together with additional information relating to the liquidity of each category: | | | | | | | | | | | | | | | | | | | | | | | | | | | | | |
| | | | | | | | | |
| | Fair value | | Redemption frequency
(if currently eligible) | | Redemption
notice period | |
| | | | | | | | | |
| At December 31, 2024 | | | | | | | | |
| | | | | | | | | |
| Multi-strategy funds | $ | 24,919 | | | 3 | % | | Quarterly | | 60-90 days | |
| | | | | | | | | |
| Direct lending funds | 171,048 | | | 18 | % | | Quarterly(1) | | 90 days | |
| Private equity funds | 320,690 | | | 35 | % | | n/a | | n/a | |
| Real estate funds | 291,640 | | | 31 | % | | Quarterly(2), Annually(3) | | 45-90 days | |
| CLO-Equities | — | | | — | % | | n/a | | n/a | |
| Other privately held investments | 121,981 | | | 13 | % | | n/a | | n/a | |
| | | | | | | | | |
| Total other investments | $ | 930,278 | | | 100 | % | | | | | |
| | | | | | | | | |
| At December 31, 2023 | | | | | | | | |
| | | | | | | | | |
| Multi-strategy funds | $ | 24,619 | | | 3 | % | | Quarterly | | 60-90 days | |
| | | | | | | | | |
| Direct lending funds | 192,270 | | | 20 | % | | Quarterly(1) | | 90 days | |
| Private equity funds | 301,712 | | | 32 | % | | n/a | | n/a | |
| Real estate funds | 317,325 | | | 33 | % | | Quarterly(2), Annually(3) | | 45-90 days | |
| CLO-Equities | 5,300 | | | 1 | % | | n/a | | n/a | |
| Other privately held investments | 108,187 | | | 11 | % | | n/a | | n/a | |
| | | | | | | | | |
| Total other investments | $ | 949,413 | | | 100 | % | | | | | |
| | | | | | | | | |
n/a – not applicable
(1)Applies to one fund with a fair value of $3 million (2023: $17 million).
(2)Applies to one fund with a fair value of $51 million (2023: $66 million).
(3)Applies to one fund with a fair value of $21 million (2023: $25 million).
The investment strategies for the above funds are as follows:
•Multi-strategy funds: Seek to achieve above-market returns by pursuing multiple investment strategies to diversify risks and reduce volatility. This category includes funds of hedge funds which invest in a large pool of hedge funds across a diversified range of hedge fund strategies.
•Direct lending funds: Seek to achieve attractive risk-adjusted returns, including current income generation, by investing in funds which provide financing directly to borrowers.
•Private equity funds: Seek to achieve attractive risk-adjusted returns by investing in private transactions over the course of several years.
•Real estate funds: Seek to achieve attractive risk-adjusted returns by making and managing investments in real estate and real estate securities and businesses.
AXIS CAPITAL HOLDINGS LIMITED
NOTES TO CONSOLIDATED FINANCIAL STATEMENTS
DECEMBER 31, 2024, 2023 AND 2022
5. INVESTMENTS (CONTINUED)
Two common redemption restrictions which may impact the Company's ability to redeem multi-strategy funds are gates and lockups. A gate is a suspension of redemptions which may be implemented by the general partner or investment manager of the fund in order to defer, in whole or in part, the redemption request in the event the aggregate amount of redemption requests exceeds a predetermined percentage of the fund’s net assets which may otherwise hinder the general partner or investment manager’s ability to liquidate holdings in an orderly fashion in order to generate the cash necessary to fund extraordinarily large redemption payouts. A lockup period is the initial amount of time an investor is contractually required to hold the security before having the ability to redeem. During 2024 and 2023, neither of these restrictions impacted the Company's redemption requests. At December 31, 2024, there were no multi-strategy fund holdings (2023: nil) where the Company is still within the lockup period.
At December 31, 2024, the Company had $28 million (2023: $28 million) of unfunded commitments as a limited partner in multi-strategy funds. Once the full amount of committed capital has been called by the General Partner of each of these funds, the assets will not be fully returned until after the completion of the funds' investment term. These funds have investment terms ranging from two years to the dissolution of the underlying fund.
At December 31, 2024, the Company had $170 million (2023: $192 million) of unfunded commitments as a limited partner in direct lending funds. Once the full amount of committed capital has been called by the General Partner of each of these funds, the assets will not be fully returned until the completion of the fund's investment term. These funds have investment terms ranging from three to ten years and the General Partners of certain funds have the option to extend the term by up to three years.
At December 31, 2024, the Company had $215 million (2023: $145 million) of unfunded commitments as a limited partner in private equity funds. The life of the funds is subject to the dissolution of the underlying funds. The Company expects the overall holding period to be over six years.
At December 31, 2024, the Company had $91 million (2023: $107 million) of unfunded commitments as a limited partner in real estate funds. These funds include an open-ended fund and funds with investment terms ranging from two years to the dissolution of the underlying fund.
At December 31, 2024, the Company had $21 million (2023: $30 million) of unfunded commitments as a limited partner in three private company investment funds focusing on financial services technology companies with an emphasis on insurance technology companies ("private company investment funds"). Two of these funds have investment terms of five years and one fund has an investment term of ten years.
f) Equity Method Investments
During 2023, the Company paid $22 million to acquire 18% of the common equity of Monarch Point Re (ISAC) Ltd. and Monarch Point Re (ISA 2023) Ltd., a collateralized reinsurance company formed under the laws of Bermuda as an incorporated segregated accounts company under the Incorporated Segregated Accounts Companies Act 2019, as amended (the "ISAC Act"). During 2024, the Company paid $14 million to acquire 18% of the common equity of Monarch Point Re (ISA 2024) Ltd., (Monarch Point Re (ISAC) Ltd., Monarch Point Re (ISA 2023) Ltd. and Monarch Point Re (ISA 2024) Ltd., individually or collectively "Monarch Point Re").
The Company retrocedes a diversified portfolio of casualty reinsurance business to Monarch Point Re and Stone Point Credit Adviser LLC, a wholly owned subsidiary of Stone Point Capital, LLC ("Stone Point" refer to Note 18 'Related Party Transactions') serves as its investment manager. As an investor, the Company expects to benefit from underwriting fees generated by Monarch Point Re and the income and capital appreciation Stone Point seeks to deliver through its investment management services.
Monarch Point Re is not a Variable Interest Entity ("VIE") that is required to be included in the Company's consolidated financial statements. The Company accounts for its ownership interest in Monarch Point Re under the equity method of accounting.
AXIS CAPITAL HOLDINGS LIMITED
NOTES TO CONSOLIDATED FINANCIAL STATEMENTS
DECEMBER 31, 2024, 2023 AND 2022
5. INVESTMENTS (CONTINUED)
During 2016, the Company paid $108 million including direct transaction costs to acquire 19% of the common equity of Harrington Reinsurance Holdings Limited ("Harrington"), the parent company of Harrington Re Ltd. ("Harrington Re"), an independent reinsurance company jointly sponsored by the Company and The Blackstone Group L.P. ("Blackstone"). Following share tender offers in 2024 and 2023, the Company's ownership interest in Harrington increased to 22% and 20%, respectively.
Through long-term service agreements, the Company serves as Harrington Re's reinsurance underwriting manager and Blackstone serves as exclusive investment management service provider. As an investor, the Company expects to benefit from underwriting profit generated by Harrington Re and the income and capital appreciation Blackstone seeks to deliver through its investment management services. In addition, the Company has entered into an arrangement with Blackstone under which underwriting and investment related fees will be shared equally.
The Company accounts for its ownership interest in Harrington under the equity method of accounting. The Company's proportionate share of the underlying equity in net assets resulted in a basis difference of $5 million which represents initial transactions costs.
g) Variable Interest Entities
In the normal course of investing activities, the Company actively manages allocations to non-controlling tranches of structured securities which are variable interests issued by VIEs. These structured securities include RMBS, CMBS and ABS.
The Company also invests in limited partnerships which represent 74% of the Company's other investments. The investments in limited partnerships include multi-strategy funds, direct lending funds, private equity funds and real estate funds, that are variable interests issued by VIEs (refer to Note 5(e) 'Other Investments').
The Company does not have the power to direct the activities that are most significant to the economic performance of these VIEs. Therefore, the Company is not the primary beneficiary of these VIEs. The maximum exposure to loss on these interests is limited to the amount of commitment made by the Company. The Company has not provided financial or other support to these structured securities other than the original investment.
h) Net Investment Income
Net investment income was derived from the following sources: | | | | | | | | | | | | | | | | | | | | | | | |
| | | | | | | |
| Year ended December 31, | 2024 | | 2023 | | 2022 | |
| | | | | | | |
| Fixed maturities | $ | 620,704 | | | $ | 514,842 | | | $ | 329,858 | | |
| Other investments | 48,666 | | | 20,411 | | | 57,043 | | |
| Equity securities | 12,922 | | | 12,088 | | | 10,390 | | |
| Mortgage loans | 34,028 | | | 35,312 | | | 23,407 | | |
| Cash and cash equivalents | 59,600 | | | 50,261 | | | 20,273 | | |
| Short-term investments | 12,569 | | | 8,924 | | | 3,535 | | |
| Gross investment income | 788,489 | | | 641,838 | | | 444,506 | | |
| Investment expenses | (29,260) | | | (30,096) | | | (25,677) | | |
| Net investment income | $ | 759,229 | | | $ | 611,742 | | | $ | 418,829 | | |
| | | | | | | |
AXIS CAPITAL HOLDINGS LIMITED
NOTES TO CONSOLIDATED FINANCIAL STATEMENTS
DECEMBER 31, 2024, 2023 AND 2022
5. INVESTMENTS (CONTINUED)
i) Net Investment Gains (Losses)
The following table provides an analysis of net investment gains (losses): | | | | | | | | | | | | | | | | | | | | | | | |
| | | | | | | |
| Year ended December 31, | 2024 | | 2023 | | 2022 | |
| | | | | | | |
| Gross realized investment gains | | | | | | |
| Fixed maturities, short-term investments, and cash and cash equivalents | $ | 77,525 | | | $ | 32,920 | | | $ | 16,671 | | |
| Equity securities | 32,292 | | | 16,847 | | | 7,687 | | |
| Gross realized investment gains | 109,817 | | | 49,767 | | | 24,358 | | |
| Gross realized investment losses | | | | | | |
| Fixed maturities, short-term investments, and cash and cash equivalents | (230,774) | | | (158,080) | | | (328,493) | | |
| Equity securities | (15,251) | | | (639) | | | (406) | | |
| Mortgage loans | (7,215) | | | — | | | — | | |
| Gross realized investment losses | (253,240) | | | (158,719) | | | (328,899) | | |
| (Increase) decrease in allowance for expected credit losses, fixed maturities, available for sale | 6,821 | | | 974 | | | (11,421) | | |
| (Increase) decrease in allowance for expected credit losses, mortgage loans | (17,159) | | | (6,220) | | | — | | |
| Impairment losses(1) | (408) | | | (12,757) | | | (12,568) | | |
| | | | | | | |
| Change in fair value of investment derivatives(2) | 1,783 | | | (1,456) | | | 7,656 | | |
| Net unrealized gains (losses) on equity securities | 13,852 | | | 53,781 | | | (135,915) | | |
| Net investment losses | $ | (138,534) | | | $ | (74,630) | | | $ | (456,789) | | |
| | | | | | | |
(1)Related to instances where the Company intends to sell securities or it is more likely than not that the Company will be required to sell securities before their anticipated recovery.
(2)Refer to Note 7 'Derivative Instruments'.
The following table provides a reconciliation of the beginning and ending balances of the allowance for expected credit losses on fixed maturities classified as available for sale: | | | | | | | | | | | | | | | | | | | | | | | |
| | | | | |
| Year ended December 31, | 2024 | | 2023 | | 2022 | |
| | | | | | | |
| Balance at beginning of period | $ | 10,759 | | | $ | 11,733 | | | $ | 313 | | |
| Expected credit losses on securities where credit losses were not previously recognized | 926 | | | 5,200 | | | 17,830 | | |
| Additions (reductions) for expected credit losses on securities where credit losses were previously recognized | (2,319) | | | 4,934 | | | (3,831) | | |
| Impairments of securities which the Company intends to sell or more likely than not will be required to sell | — | | | — | | | — | | |
| Securities sold/redeemed/matured | (5,428) | | | (11,108) | | | (2,579) | | |
| Balance at end of period | $ | 3,938 | | | $ | 10,759 | | | $ | 11,733 | | |
| | | | | | | |
AXIS CAPITAL HOLDINGS LIMITED
NOTES TO CONSOLIDATED FINANCIAL STATEMENTS
DECEMBER 31, 2024, 2023 AND 2022
5. INVESTMENTS (CONTINUED)
The following table provides a reconciliation of the beginning and ending balances of the allowance for expected credit losses on mortgage loans: | | | | | | | | | | | | | | | | | | | | | | | |
| | | | | |
| Year ended December 31, | 2024 | | 2023 | | 2022 | |
| | | | | | | |
| Balance at beginning of period | $ | 6,220 | | | $ | — | | | $ | — | | |
| Expected credit losses on loans where credit losses were not previously recognized | 21,757 | | | 6,220 | | | — | | |
| Additions (reductions) for expected credit losses on loans where credit losses were previously recognized | 2,616 | | | — | | | — | | |
| Loans sold/redeemed/matured | (7,215) | | | — | | | — | | |
| Balance at end of period | $ | 23,378 | | | $ | 6,220 | | | $ | — | | |
| | | | | | | |
Fixed Maturities
The Company evaluates available for sale securities for expected credit losses when fair value is below amortized cost. If the Company intends to sell or will be required to sell the security before its anticipated recovery, the full amount of the impairment loss is charged to net income (loss). If the Company does not intend to sell or will not be required to sell the security before its anticipated recovery, an allowance for expected credit losses is established and the portion of the loss that relates to credit losses is recorded in net income (loss).
A summary of credit loss activity by asset class, the significant inputs and the methodology used to estimate credit losses are described below.
U.S. Government, U.S. Agency and U.S. Agency RMBS
Unrealized losses on securities issued or backed, either explicitly or implicitly by the U.S. government are not analyzed for credit losses. The Company has concluded that the possibility of a credit loss on these securities is highly unlikely due to the explicit U.S. government guarantee related to certain securities (e.g., Government National Mortgage Association issuances) and the implicit guarantee related to other securities that has been validated by past actions (e.g., U.S. government bailout of Federal National Mortgage Association and Federal Home Loan Mortgage Corporation during the 2008 credit crisis).
Although these securities are not analyzed for credit losses, they are evaluated for intention to sell and likely requirement to sell.
Non-U.S. Government
Non-U.S. government securities are evaluated for expected credit losses primarily through qualitative assessments of the likelihood of credit losses using information such as severity of unrealized losses, credit ratings and price volatility. At December 31, 2024, the gross unrealized losses of $26 million included foreign exchange losses of $19 million.
At December 31, 2023, the gross unrealized losses of $19 million included foreign exchange losses of $6 million. At December 31, 2023, the allowance for expected credit losses on non-U.S. government fixed maturities related to loss severity where the forecasted recovery to amortized cost is uncertain.
Corporate Debt
To estimate expected credit losses for corporate debt securities, the Company's projected cash flows are primarily driven by assumptions regarding the severity of loss, probability of default and projected recovery rates. The Company's default and loss severity rates are based on credit rating, credit analysis and macroeconomic forecasts. At December 31, 2024 and 2023, the allowance for expected credit losses on corporate debt securities mainly related to loss severity where the forecasted recovery to amortized cost was uncertain.
AXIS CAPITAL HOLDINGS LIMITED
NOTES TO CONSOLIDATED FINANCIAL STATEMENTS
DECEMBER 31, 2024, 2023 AND 2022
5. INVESTMENTS (CONTINUED)
CMBS
The Company's investments in CMBS are diversified and primarily rated AA or better. At December 31, 2024, CMBS had a weighted average estimated subordination percentage of 34% (2023: 37%). Based on discounted cash flows at December 31, 2024 and 2023, the current level of subordination is sufficient to cover the estimated loan losses on the underlying collateral of the CMBS.
Non-agency RMBS
To estimate expected credit losses for non-agency RMBS, the Company's projected cash flows incorporated underlying data from widely accepted third-party data sources along with certain internal assumptions and judgments regarding the future performance of the security. These assumptions included default, delinquency, loss severity and prepayment rates.
At December 31, 2024, the fair value of the Company's non-agency RMBS was $123 million (2023: $153 million), consisting primarily of $15 million (2023: $34 million) of Prime and $92 million (2023: $100 million) of Alt-A, Non-qualified, and Home Equity MBS. At December 31, 2024 and 2023, the allowance for expected credit losses on non-agency RMBS related to loss severity where the forecasted recovery to amortized cost is uncertain.
ABS
The Company's investments in ABS consist mainly of CLO Debt purchased primarily as new issues between 2018 and 2024. Substantially all of these new issues had credit ratings of AA or better. The Company utilizes a scenario-based approach to review its CLO Debt portfolio based on the current asset market price. The Company also reviews subordination levels of these securities to determine their ability to absorb credit losses of underlying collateral. If losses are forecast to be below the subordination level for a tranche held by the Company, the security is determined not to have a credit loss. At December 31, 2024 and 2023, the allowance for expected credit losses on ABS related to loss severity where the forecasted recovery to amortized cost is uncertain.
Municipals
Municipal securities are evaluated for expected credit losses primarily through qualitative assessments of the likelihood of credit losses using information such as severity of unrealized losses, credit ratings and price volatility. At December 31, 2024 and 2023, the allowance for expected credit losses on municipals related to loss severity where the forecasted recovery to amortized cost is uncertain.
AXIS CAPITAL HOLDINGS LIMITED
NOTES TO CONSOLIDATED FINANCIAL STATEMENTS
DECEMBER 31, 2024, 2023 AND 2022
5. INVESTMENTS (CONTINUED)
j) Restricted Assets
In order to support the Company's obligations in regulatory jurisdictions where it operates as a non-admitted carrier, the Company provides collateral in the form of assets held in trust including $2 billion related to AXIS Specialty Insurance Bermuda (refer to Note 1 'Organization') and, to a lesser extent, letters of credit (refer to Note 10(c) 'Debt and Financing Arrangements').
In addition, the Company operates in the Lloyd’s market through its corporate members, AXIS Corporate Capital UK Limited and AXIS Corporate Capital UK II Limited (refer to Note 1 'Organization'). Lloyd’s sets capital requirements for corporate members annually through the application of a capital model that is based on regulatory rules pursuant to Directive 2009/138/EC of the European Parliament and of the Council of 25 November 2009 on the taking up and pursuit of business of Insurance and Reinsurance (Solvency II) ("Solvency II").
The capital provided to support underwriting, or Funds at Lloyd’s ("FAL"), may be satisfied by cash, certain investments and letters of credit provided by approved banks (refer to Note 12 'Commitments and Contingencies' and Note 22 'Statutory Financial Information').
At December 31, 2024, collateral held in trust for third-party agreements of $2,602 million (2023: $2,598 million) included $572 million (2023: $550 million) of fixed maturities, and cash of $237 million (2023: $296 million) held on deposit to support the underwriting activities of Syndicate 1686.
The Company's restricted investments and cash primarily consist of high-quality fixed maturity and short-term investment securities.
The table below provides the fair values of the Company's restricted investments and cash:
| | | | | | | | | | | | | | | | | | | | |
| | | | | | |
| At December 31, | | 2024 | | 2023 | |
| | | | | | |
| Collateral in trust for inter-company agreements | | $ | 2,549,220 | | | $ | 614,089 | | |
| Collateral for secured letter of credit facility | | 208,090 | | | 423,522 | | |
| Funds at Lloyd's | | 883,362 | | | 893,177 | | |
| Collateral in trust for third-party agreements | | 2,602,306 | | | 2,597,633 | | |
| Securities on deposit or in trust with regulatory authorities | | 632,268 | | | 772,472 | | |
| Total restricted investments and cash | | $ | 6,875,246 | | | $ | 5,300,893 | | |
| | | | | | |
k) Reverse Repurchase Agreements
At December 31, 2024, the Company held $543 million (2023: $12 million) of reverse repurchase agreements. These loans are fully collateralized, are generally outstanding for a short period of time and are presented on a gross basis as part of cash and cash equivalents in the Company's consolidated balance sheets. The required collateral for these loans is either cash or U.S. Treasuries at a minimum rate of 102% of the loan principal. Upon maturity, the Company receives principal and interest income. The Company monitors the estimated fair value of the securities loaned and borrowed on a daily basis with additional collateral obtained as necessary throughout the duration of the transaction.
AXIS CAPITAL HOLDINGS LIMITED
NOTES TO CONSOLIDATED FINANCIAL STATEMENTS
DECEMBER 31, 2024, 2023 AND 2022
6. FAIR VALUE MEASUREMENTS
Fair Value Hierarchy
Fair value is defined as the price to sell an asset or transfer a liability (i.e., the "exit price") in an orderly transaction between market participants. U.S. GAAP prescribes a fair value hierarchy that prioritizes the inputs to valuation techniques used to measure fair value. The hierarchy gives the highest priority to quoted prices in active markets and the lowest priority to unobservable data. The level in the hierarchy within which a given fair value measurement falls is determined based on the lowest level input that is significant to the measurement. The hierarchy is broken down into three levels as follows:
•Level 1 - Valuations based on unadjusted quoted prices in active markets for identical assets or liabilities that the Company has the ability to access.
•Level 2 - Valuations based on quoted prices in active markets for similar assets or liabilities, quoted prices for identical assets or liabilities in inactive markets, or for which significant inputs are observable (e.g., interest rates, yield curves, prepayment speeds, default rates, loss severities, etc.) or can be corroborated by observable market data.
•Level 3 - Valuations based on inputs that are unobservable and significant to the overall fair value measurement. The unobservable inputs reflect the Company's judgments about assumptions that market participants might use.
The availability of observable inputs can vary from financial instrument to financial instrument and is affected by a wide variety of factors including, for example, the type of financial instrument, whether the financial instrument is new and not yet established in the marketplace, and other characteristics particular to the transaction. To the extent that valuation is based on models or inputs that are less observable or unobservable in the market, the determination of fair value requires significantly more judgment.
Accordingly, the degree of judgment exercised by management in determining fair value is greatest for financial instruments categorized as Level 3. In periods of market dislocation, the observability of prices and inputs may be reduced for many financial instruments. This may lead the Company to change the selection of valuation technique (from market to cash flow approach) or may cause the Company to use multiple valuation techniques to estimate the fair value of a financial instrument. This circumstance could cause an instrument to be reclassified between levels within the fair value hierarchy.
Valuation Techniques
The valuation techniques, including significant inputs and assumptions generally used to determine the fair values of the Company's financial instruments as well as the classification of the fair values of its financial instruments in the fair value hierarchy are described in detail below.
Fixed Maturities
At each valuation date, the Company uses the market approach valuation technique to estimate the fair value of its fixed maturities portfolio, where possible. The market approach includes, but is not limited to, prices obtained from third-party pricing services for identical or comparable securities and the use of "pricing matrix models" using observable market inputs such as yield curves, credit risks and spreads, measures of volatility, and prepayment speeds. Pricing from third-party pricing services is sourced from multiple vendors, where available, and the Company maintains a vendor hierarchy by asset type based on historical pricing experience and vendor expertise. Where prices are unavailable from pricing services, the Company obtains non-binding quotes from broker-dealers who are active in the corresponding markets. The valuation techniques including significant inputs and assumptions generally used to determine the fair values of the Company's fixed maturities by asset class as well as the classifications of the fair values of these securities in the fair value hierarchy are described in detail below.
AXIS CAPITAL HOLDINGS LIMITED
NOTES TO CONSOLIDATED FINANCIAL STATEMENTS
DECEMBER 31, 2024, 2023 AND 2022
6. FAIR VALUE MEASUREMENTS (CONTINUED)
U.S. Government and Agency
U.S. government and agency securities consist primarily of bonds issued by the U.S. Treasury and mortgage pass-through agencies such as the Federal National Mortgage Association, the Federal Home Loan Mortgage Corporation and the Government National Mortgage Association. As the fair values of U.S. Treasury securities are based on unadjusted quoted market prices in active markets, the fair values of these securities are classified as Level 1. The fair values of U.S. government agency securities are determined using the spread above the risk-free yield curve. As the yields for the risk-free yield curve and the spreads are observable market inputs, the fair values of U.S. government agency securities are classified as Level 2.
Non-U.S. Government
Non-U.S. government securities include bonds issued by non-U.S. governments and their agencies along with supranational organizations (collectively also known as sovereign debt securities). The fair values of these securities are based on prices obtained from international indices or valuation models that include inputs such as interest rate yield curves, cross-currency basis index spreads and country credit spreads for structures similar to the sovereign bond in terms of issuer, maturity and seniority. As the significant inputs used to price these securities are observable market inputs, the fair values of non-U.S. government securities are classified as Level 2.
Corporate Debt
Corporate debt securities consist primarily of investment grade debt of a wide variety of corporate issuers and industries. The fair values of these securities are generally determined using the spread above the risk-free yield curve. These spreads are generally obtained from the new issue market, secondary trading and broker-dealer quotes. As the yields for the risk-free yield curve and the spreads are observable market inputs, the fair values of corporate debt securities are generally classified as Level 2. Where pricing is unavailable from pricing services, the Company obtains non-binding quotes from broker-dealers to estimate fair value. This is generally the case when there is a low volume of trading activity and current transactions are not orderly. In this event, the fair values of these securities are classified as Level 3.
Agency RMBS
Agency RMBS consist of bonds issued by the Federal National Mortgage Association, the Federal Home Loan Mortgage Corporation and the Government National Mortgage Association. The fair values of these securities are priced using a mortgage pool specific model which uses daily inputs from the active to be announced market and the spread associated with each mortgage pool based on vintage. As the significant inputs used to price these securities are observable market inputs, the fair values of Agency RMBS are classified as Level 2.
CMBS
CMBS mainly include investment grade bonds originated by non-agencies. The fair values of these securities are determined using a pricing model which uses dealer quotes and other available trade information along with security level characteristics to determine deal specific spreads. As the significant inputs used to price these securities are observable market inputs, the fair values of CMBS are generally classified as Level 2. Where pricing is unavailable from pricing services, the Company obtains non-binding quotes from broker-dealers to estimate fair value. This is generally the case when there is a low volume of trading activity and current transactions are not orderly. In this event, the fair values of these securities are classified as Level 3.
AXIS CAPITAL HOLDINGS LIMITED
NOTES TO CONSOLIDATED FINANCIAL STATEMENTS
DECEMBER 31, 2024, 2023 AND 2022
6. FAIR VALUE MEASUREMENTS (CONTINUED)
Non-agency RMBS
Non-agency RMBS mainly include investment grade bonds originated by non-agencies. The fair values of these securities are determined using an option adjusted spread model or other relevant models, which use inputs including available trade information or broker quotes, prepayment and default projections based on historical statistics of the underlying collateral and current market data. As the significant inputs used to price these securities are observable market inputs, the fair values of non-agency RMBS are generally classified as Level 2. Where pricing is unavailable from pricing services, the Company obtains non-binding quotes from broker-dealers to estimate fair value. This is generally the case when there is a low volume of trading activity and current transactions are not orderly. In this event, the fair values of these securities are classified as Level 3.
ABS
ABS mainly include investment grade bonds backed by pools of loans with a variety of underlying collateral, including auto loans, student loans, credit card receivables and collateralized loan obligations ("CLOs"), originated by a variety of financial institutions. The fair values of these securities are determined using a model which uses prepayment speeds and spreads sourced primarily from the new issue market. As the significant inputs used to price these securities are observable market inputs, the fair values of ABS are generally classified as Level 2. Where pricing is unavailable from pricing services, the Company obtains non-binding quotes from broker-dealers to estimate fair value. This is generally the case when there is a low volume of trading activity and current transactions are not orderly. In this event, the fair values of these securities are classified as Level 3.
Municipals
Municipals comprise revenue bonds and general obligation bonds issued by U.S. domiciled state and municipal entities. The fair values of these securities are determined using spreads obtained from the new issue market, trade prices and broker-dealers quotes. As the significant inputs used to price these securities are observable market inputs, the fair values of municipals are classified as Level 2.
Equity Securities
Equity securities include common stocks, preferred stocks, exchange-traded funds and bond mutual funds. As the fair values of common stocks and exchange-traded funds are based on unadjusted quoted market prices in active markets, the fair values of these securities are classified as Level 1. As the significant inputs used to price preferred stocks are observable market inputs, the fair value of these securities are classified as Level 2. As bond mutual funds have daily liquidity, the fair values of these securities are classified as Level 2.
Other Investments
The fair value of an indirect investment in CLO-Equities is estimated using an income approach valuation technique, specifically an externally developed discounted cash flow model due to the lack of observable and relevant trades in secondary markets. As the significant inputs used to price this security are unobservable, the fair value of the indirect investment in CLO-Equities is classified as Level 3.
Other privately held investments include common shares, preferred shares, convertible notes, convertible preferred shares, a variable yield security and private company investment funds.
AXIS CAPITAL HOLDINGS LIMITED
NOTES TO CONSOLIDATED FINANCIAL STATEMENTS
DECEMBER 31, 2024, 2023 AND 2022
6. FAIR VALUE MEASUREMENTS (CONTINUED)
These investments are initially valued at cost, which approximates fair value. In subsequent measurement periods, the fair values of these investments are generally derived from one or a combination of valuation methodologies which consider factors including recent capital raises by the investee companies, comparable precedent transaction multiples, comparable publicly traded multiples, third-party valuations, discounted cash-flow models, and other techniques that consider the industry and development stage of each investee company. The fair value of the variable yield security is determined using an externally developed discounted cash flow model. In order to assess the reasonableness of the information received from investee companies, the Company maintains an understanding of current market conditions, historical results, and emerging trends that may impact the results of operations, financial condition or liquidity of these companies. In addition, the Company engages in regular communication with management at investee companies.
As the significant inputs used to price these investments are unobservable, the fair values of other privately held investments are classified as Level 3. The fair values of private company investment funds are estimated using net asset valuations ("NAVs") as advised by external fund managers or third-party administrators.
Short-term Investments
Short-term investments primarily comprise highly liquid securities with maturities greater than three months but less than one year from the date of purchase. These securities are typically not actively traded due to their approaching maturity, therefore their amortized cost approximates fair value. The fair values of short-term investments are classified as Level 2.
Derivative Instruments
Derivative instruments include foreign exchange forward contracts that are customized to the Company's economic hedging strategies and trade in the over-the-counter derivative market. The fair values of these derivatives are determined using a market approach valuation technique based on significant observable market inputs from third-party pricing vendors, non-binding broker-dealer quotes and/or recent trading activity. As the significant inputs used to price these derivatives are observable market inputs, the fair values of these derivatives are classified as Level 2.
AXIS CAPITAL HOLDINGS LIMITED
NOTES TO CONSOLIDATED FINANCIAL STATEMENTS
DECEMBER 31, 2024, 2023 AND 2022
6. FAIR VALUE MEASUREMENTS (CONTINUED)
The tables below present the financial instruments measured at fair value on a recurring basis for the periods indicated: | | | | | | | | | | | | | | | | | | | | | | | | | | | | | | | | | | | |
| | Quoted prices in active markets
for identical assets (Level 1) | | Significant other observable
inputs (Level 2) | | Significant unobservable inputs (Level 3) | | Fair value based on NAV practical expedient | | Total fair value | |
| | | | | | | | | | | |
| At December 31, 2024 | | | | | | | | | | |
| Assets | | | | | | | | | | |
| Fixed maturities, available for sale | | | | | | | | | | |
| U.S. government and agency | $ | 2,767,315 | | | $ | 35,671 | | | $ | — | | | $ | — | | | $ | 2,802,986 | | |
| Non-U.S. government | — | | | 729,939 | | | — | | | — | | | 729,939 | | |
| Corporate debt | — | | | 4,715,799 | | | 126,391 | | | — | | | 4,842,190 | | |
| Agency RMBS | — | | | 1,184,845 | | | — | | | — | | | 1,184,845 | | |
| CMBS | — | | | 819,608 | | | — | | | — | | | 819,608 | | |
| Non-agency RMBS | — | | | 122,536 | | | — | | | — | | | 122,536 | | |
| ABS | — | | | 1,519,000 | | | 20,832 | | | — | | | 1,539,832 | | |
| Municipals | — | | | 110,817 | | | — | | | — | | | 110,817 | | |
| | 2,767,315 | | | 9,238,215 | | | 147,223 | | | — | | | 12,152,753 | | |
| Equity securities | | | | | | | | | | |
| Common stocks | 2,638 | | | — | | | — | | | — | | | 2,638 | | |
| Preferred stocks | 3 | | | 5,864 | | | — | | | — | | | 5,867 | | |
| Exchange-traded funds | 314,042 | | | — | | | — | | | — | | | 314,042 | | |
| Bond mutual funds | — | | | 256,727 | | | — | | | — | | | 256,727 | | |
| | 316,683 | | | 262,591 | | | — | | | — | | | 579,274 | | |
| Other investments | | | | | | | | | | |
| Multi-strategy funds | — | | | — | | | — | | | 24,919 | | | 24,919 | | |
| Direct lending funds | — | | | — | | | — | | | 171,048 | | | 171,048 | | |
| Private equity funds | — | | | — | | | — | | | 320,690 | | | 320,690 | | |
| Real estate funds | — | | | — | | | — | | | 291,640 | | | 291,640 | | |
| CLO-Equities | — | | | — | | | — | | | — | | | — | | |
| Other privately held investments | — | | | — | | | 92,230 | | | 29,751 | | | 121,981 | | |
| | | | | | | | | | | |
| | — | | | — | | | 92,230 | | | 838,048 | | | 930,278 | | |
| Short-term investments | — | | | 223,666 | | | — | | | — | | | 223,666 | | |
| Other assets | | | | | | | | | | |
| Derivative instruments (refer to Note 7) | — | | | 9,439 | | | — | | | — | | | 9,439 | | |
| | | | | | | | | | | |
| Total Assets | $ | 3,083,998 | | | $ | 9,733,911 | | | $ | 239,453 | | | $ | 838,048 | | | $ | 13,895,410 | | |
| Liabilities | | | | | | | | | | |
| Derivative instruments (refer to Note 7) | $ | — | | | $ | 3,100 | | | $ | — | | | $ | — | | | $ | 3,100 | | |
| | | | | | | | | | | |
| Total Liabilities | $ | — | | | $ | 3,100 | | | $ | — | | | $ | — | | | $ | 3,100 | | |
| | | | | | | | | | | |
AXIS CAPITAL HOLDINGS LIMITED
NOTES TO CONSOLIDATED FINANCIAL STATEMENTS
DECEMBER 31, 2024, 2023 AND 2022
6. FAIR VALUE MEASUREMENTS (CONTINUED)
| | | | | | | | | | | | | | | | | | | | | | | | | | | | | | | | | | | |
| | Quoted prices in active markets
for identical assets (Level 1) | | Significant other observable
inputs (Level 2) | | Significant unobservable inputs (Level 3) | | Fair value based on NAV practical expedient | | Total fair value | |
| | | | | | | | | | | |
| At December 31, 2023 | | | | | | | | | | |
| Assets | | | | | | | | | | |
| Fixed maturities, available for sale | | | | | | | | | | |
| U.S. government and agency | $ | 2,989,612 | | | $ | 17,916 | | | $ | — | | | $ | — | | | $ | 3,007,528 | | |
| Non-U.S. government | — | | | 723,959 | | | — | | | — | | | 723,959 | | |
| Corporate debt | — | | | 4,338,419 | | | 135,753 | | | — | | | 4,474,172 | | |
| Agency RMBS | — | | | 1,634,661 | | | — | | | — | | | 1,634,661 | | |
| CMBS | — | | | 839,696 | | | — | | | — | | | 839,696 | | |
| Non-agency RMBS | — | | | 153,396 | | | — | | | — | | | 153,396 | | |
| ABS | — | | | 1,242,971 | | | — | | | — | | | 1,242,971 | | |
| Municipals | — | | | 158,359 | | | — | | | — | | | 158,359 | | |
| | 2,989,612 | | | 9,109,377 | | | 135,753 | | | — | | | 12,234,742 | | |
| Equity securities | | | | | | | | | | |
| Common stocks | 2,546 | | | — | | | — | | | — | | | 2,546 | | |
| Preferred stocks | 1 | | | 5,600 | | | — | | | — | | | 5,601 | | |
| Exchange-traded funds | 287,275 | | | — | | | — | | | — | | | 287,275 | | |
| Bond mutual funds | — | | | 293,089 | | | — | | | — | | | 293,089 | | |
| | 289,822 | | | 298,689 | | | — | | | — | | | 588,511 | | |
| Other investments | | | | | | | | | | |
| Multi-strategy funds | — | | | — | | | — | | | 24,619 | | | 24,619 | | |
| Direct lending funds | — | | | — | | | — | | | 192,270 | | | 192,270 | | |
| Private equity funds | — | | | — | | | — | | | 301,712 | | | 301,712 | | |
| Real estate funds | — | | | — | | | — | | | 317,325 | | | 317,325 | | |
| CLO-Equities | — | | | — | | | 5,300 | | | — | | | 5,300 | | |
| Other privately held investments | — | | | — | | | 87,289 | | | 20,898 | | | 108,187 | | |
| | | | | | | | | | | |
| | — | | | — | | | 92,589 | | | 856,824 | | | 949,413 | | |
| Short-term investments | — | | | 17,216 | | | — | | | — | | | 17,216 | | |
| Other assets | | | | | | | | | | |
| Derivative instruments (refer to Note 7) | — | | | 4,424 | | | — | | | — | | | 4,424 | | |
| | | | | | | | | | | |
| Total Assets | $ | 3,279,434 | | | $ | 9,429,706 | | | $ | 228,342 | | | $ | 856,824 | | | $ | 13,794,306 | | |
| Liabilities | | | | | | | | | | |
| Derivative instruments (refer to Note 7) | $ | — | | | $ | 10,165 | | | $ | — | | | $ | — | | | $ | 10,165 | | |
| | | | | | | | | | | |
| Total Liabilities | $ | — | | | $ | 10,165 | | | $ | — | | | $ | — | | | $ | 10,165 | | |
| | | | | | | | | | | |
AXIS CAPITAL HOLDINGS LIMITED
NOTES TO CONSOLIDATED FINANCIAL STATEMENTS
DECEMBER 31, 2024, 2023 AND 2022
6. FAIR VALUE MEASUREMENTS (CONTINUED)
The following table quantifies the significant unobservable inputs used in estimating fair values at December 31, 2024 of investments classified as Level 3 in the fair value hierarchy:
| | | | | | | | | | | | | | | | | | | | | | | |
| | | | | | | |
| | Asset fair value | Valuation technique | Unobservable input | Amount /Range | Weighted
average | |
| | | | | | | |
| Other investments - Other privately
held investments | $ | 14,912 | | Discounted cash flow | Discount rate | 5.7% | 5.7% | |
| | | Default rate | 0.5% | 0.5% | |
| | | | Loss absorption yield | 1.0% | 1.0% | |
| | | | Estimated maturity date | 0 - 1 year | 1 year | |
| | | | | | | |
| | | | | | | |
| | | | | | | |
Note: Fixed maturities of $147 million that are classified as Level 3 are excluded from the above table as these securities are priced using broker-dealer quotes. In addition, other privately held investments of $77 million that are classified as Level 3 are excluded from the above table as these investments are priced using capital statements received from investee companies.
Other Investments - Other Privately Held Securities
Other privately held securities are initially valued at cost which approximates fair value. In subsequent measurement periods, the fair value of the variable yield security was determined using an externally developed discounted cash flow model. This model includes inputs that are specific to that investment. The inputs used in the fair value measurement include an appropriate discount rate, default rate, loss absorption rate and estimated maturity date. The selection of an appropriate discount rate is judgmental and is the most significant unobservable input used in the valuation of this investment. A significant increase (decrease) in this input in isolation could result in significantly lower (higher) fair value measurement for this investment. In order to assess the reasonableness of the inputs the Company uses in the discounted cash flow model, the Company maintains an understanding of current market conditions, historical results, as well as investee specific information that may impact future cash flows.
AXIS CAPITAL HOLDINGS LIMITED
NOTES TO CONSOLIDATED FINANCIAL STATEMENTS
DECEMBER 31, 2024, 2023 AND 2022
6. FAIR VALUE MEASUREMENTS (CONTINUED)
The following table presents changes in Level 3 for financial instruments measured at fair value on a recurring basis:
| | | | | | | | | | | | | | | | | | | | | | | | | | | | | | | | | | | | | | | | | | | | | | | | | | | | | | | | | | | | | | | | | |
| | Opening
balance | | Transfers
into
Level 3 | | Transfers
out of
Level 3 | | Included in net income(1) | | Included in OCI (2) | | Purchases | | Sales | | Settlements/
distributions | | Closing
balance | | Change in unrealized gains/(losses) (3) | |
| | | | | | | | | | | | | | | | | | | | | |
| Year ended December 31, 2024 | | | | | | | | | | | | | | | | | |
| Fixed maturities, available for sale | | | | | | | | | | | | | | | | | | | |
| Corporate debt | $ | 135,753 | | | $ | — | | | $ | (20,832) | | | $ | (1,347) | | | $ | 2,051 | | | $ | 35,744 | | | $ | (165) | | | $ | (24,813) | | | $ | 126,391 | | | $ | — | | |
| | | | | | | | | | | | | | | | | | | | | |
| | | | | | | | | | | | | | | | | | | | | |
| ABS | — | | | 20,832 | | | — | | | — | | | — | | | — | | | — | | | — | | | 20,832 | | | — | | |
| | 135,753 | | | 20,832 | | | (20,832) | | | (1,347) | | | 2,051 | | | 35,744 | | | (165) | | | (24,813) | | | 147,223 | | | — | | |
| Other investments | | | | | | | | | | | | | | | | | | | |
| | | | | | | | | | | | | | | | | | | | | |
| | | | | | | | | | | | | | | | | | | | | |
| | | | | | | | | | | | | | | | | | | | | |
| CLO-Equities | 5,300 | | | — | | | — | | | 849 | | | — | | | — | | | — | | | (6,149) | | | — | | | — | | |
| Other privately held investments | 87,289 | | | — | | | (6,899) | | | 4,024 | | | — | | | 12,238 | | | — | | | (4,422) | | | 92,230 | | | 4,024 | | |
| | 92,589 | | | — | | | (6,899) | | | 4,873 | | | — | | | 12,238 | | | — | | | (10,571) | | | 92,230 | | | 4,024 | | |
| | | | | | | | | | | | | | | | | | | | |
| | | | | | | | | | | | | | | | | | | | | |
| | | | | | | | | | | | | | | | | | | | | |
| | | | | | | | | | | | | | | | | | | | | |
| Total assets | $ | 228,342 | | | $ | 20,832 | | | $ | (27,731) | | | $ | 3,526 | | | $ | 2,051 | | | $ | 47,982 | | | $ | (165) | | | $ | (35,384) | | | $ | 239,453 | | | $ | 4,024 | | |
| | | | | | | | | | | | | | | | | | | | | |
| | | | | | | | | | | | | | | | | | | | |
| | | | | | | | | | | | | | | | | | | | | |
| | | | | | | | | | | | | | | | | | | | | |
| | | | | | | | | | | | | | | | | | | | | |
| Year ended December 31, 2023 | | | | | | | | | | | | | | | | | |
| Fixed maturities, available for sale | | | | | | | | | | | | | | | | | | | |
| Corporate debt | $ | 119,104 | | | $ | — | | | $ | — | | | $ | (8,527) | | | $ | 2,438 | | | $ | 38,173 | | | $ | (770) | | | $ | (14,665) | | | $ | 135,753 | | | $ | — | | |
| | | | | | | | | | | | | | | | | | | | | |
| | | | | | | | | | | | | | | | | | | | | |
| ABS | — | | | — | | | — | | | — | | | — | | | — | | | — | | | — | | | — | | | — | | |
| | 119,104 | | | — | | | — | | | (8,527) | | | 2,438 | | | 38,173 | | | (770) | | | (14,665) | | | 135,753 | | | — | | |
| Other investments | | | | | | | | | | | | | | | | | | | |
| | | | | | | | | | | | | | | | | | | | | |
| | | | | | | | | | | | | | | | | | | | | |
| | | | | | | | | | | | | | | | | | | | | |
| CLO-Equities | 5,016 | | | — | | | — | | | 2,395 | | | — | | | — | | | — | | | (2,111) | | | 5,300 | | | 2,395 | | |
| Other privately held investments | 136,158 | | | — | | | (25,510) | | | (9,904) | | | — | | | 21,077 | | | (34,532) | | | — | | | 87,289 | | | (17,986) | | |
| | 141,174 | | | — | | | (25,510) | | | (7,509) | | | — | | | 21,077 | | | (34,532) | | | (2,111) | | | 92,589 | | | (15,591) | | |
| | | | | | | | | | | | | | | | | | | | |
| | | | | | | | | | | | | | | | | | | | | |
| | | | | | | | | | | | | | | | | | | | | |
| | | | | | | | | | | | | | | | | | | | | |
| Total assets | $ | 260,278 | | | $ | — | | | $ | (25,510) | | | $ | (16,036) | | | $ | 2,438 | | | $ | 59,250 | | | $ | (35,302) | | | $ | (16,776) | | | $ | 228,342 | | | $ | (15,591) | | |
| | | | | | | | | | | | | | | | | | | | | |
| | | | | | | | | | | | | | | | | | | | |
| | | | | | | | | | | | | | | | | | | | | |
| | | | | | | | | | | | | | | | | | | | | |
| | | | | | | | | | | | | | | | | | | | | |
(1) Realized gains (losses) on fixed maturities and realized and unrealized gains (losses) on other assets and other liabilities included in net income are included in net investment gains (losses). Realized and unrealized gains (losses) on other investments included in net income are included in net investment income.
(2) Unrealized gains (losses) on fixed maturities are included in other comprehensive income ("OCI").
(3) Change in unrealized gains (losses) relating to assets and liabilities held at the reporting date.
AXIS CAPITAL HOLDINGS LIMITED
NOTES TO CONSOLIDATED FINANCIAL STATEMENTS
DECEMBER 31, 2024, 2023 AND 2022
6. FAIR VALUE MEASUREMENTS (CONTINUED)
Transfers into Level 3 from Level 2
There were no transfers into Level 3 from Level 2 during 2024 and 2023.
Transfers out of Level 3 into Level 2
There were no transfers out of Level 3 into Level 2 during 2024 and 2023.
During 2024 there was a change in an asset classification that resulted in a Level 3 corporate bond being reclassified as a Level 3 ABS.
Other Transfers out of Level 3
During 2024, one private company investment fund included in other privately held investments in the consolidated balance sheets was transferred from Level 3 to the NAV practical expedient.
During 2023, two private company investment funds included in other privately held investments in the consolidated balance sheets were transferred from Level 3 to the NAV practical expedient. In addition, the Company's investment in Monarch Point Re was transferred from Level 3 to equity method investments (refer to Note 5(f) 'Equity Method Investments').
Measuring the Fair Value of Other Investments Using Net Asset Valuations
The fair values of multi-strategy funds, direct lending funds, private equity funds, real estate funds and private company investment funds are estimated using NAVs as advised by external fund managers or third-party administrators. For these funds, NAVs are based on the manager's or administrator's valuation of the underlying holdings in accordance with the fund's governing documents and in accordance with U.S. GAAP.
For multi-strategy funds, direct lending funds, private equity funds, real estate funds and private company investment funds, valuation statements are typically released on a reporting lag. Therefore, the Company estimates the fair value of these funds by starting with the most recent fund valuations and adjusting for capital calls, redemptions, drawdowns and distributions. Return estimates are not available from the relevant fund managers for these funds, therefore the Company typically has a reporting lag in its fair value measurements of these funds. At December 31, 2024 and 2023, all funds measured at fair value using NAVs are reported generally on a one quarter lag.
The Company often does not have access to financial information relating to the underlying securities held within the funds, therefore, management is unable to corroborate the fair values placed on the securities underlying the asset valuations provided by fund managers or fund administrators. In order to assess the reasonableness of the NAVs, the Company performs a number of monitoring procedures on a quarterly basis, to assess the quality of the information provided by fund managers and fund administrators. These procedures include, but are not limited to, regular review and discussion of each fund's performance with its manager, regular evaluation of fund performance against applicable benchmarks and the backtesting of the Company's fair value estimates against subsequently received NAVs. Backtesting involves comparing the Company's previously reported fair values for each fund against NAVs per audited financial statements (for year-end values) and final NAVs from fund managers and fund administrators (for interim values).
The fair values of multi-strategy funds, direct lending funds, private equity funds, real estate funds and private company investment funds, are measured using the NAV practical expedient, therefore the fair values of these funds have not been categorized within the fair value hierarchy.
AXIS CAPITAL HOLDINGS LIMITED
NOTES TO CONSOLIDATED FINANCIAL STATEMENTS
DECEMBER 31, 2024, 2023 AND 2022
6. FAIR VALUE MEASUREMENTS (CONTINUED)
Financial Instruments Disclosed, But Not Carried, at Fair Value
The fair value of financial instruments accounting guidance also applies to financial instruments disclosed, but not carried, at fair value, except for certain financial instruments, including insurance contracts.
At December 31, 2024, the carrying values of cash and cash equivalents including restricted amounts, accrued investment income, receivable for investments sold, certain other assets, payable for investments purchased and certain other liabilities approximated fair values due to their short maturities. As these financial instruments are not actively traded, their fair values are classified as Level 2.
At December 31, 2024, the Company's fixed maturities, held to maturity, were recorded at amortized cost with a carrying value of $443 million (2023: $686 million) and a fair value of $437 million (2023: $676 million). The fair values of these securities are determined using a model which uses prepayment speeds and spreads sourced primarily from the new issue market. As the significant inputs used to price these securities are observable market inputs, their fair values are classified as Level 2.
At December 31, 2024, the carrying value of mortgage loans, held for investment, approximated fair value. The fair values of mortgage loans are primarily determined by estimating expected future cash flows and discounting them using current interest rates for similar mortgage loans with similar credit risk or are determined from pricing for similar loans. As mortgage loans are not actively traded, their fair values are classified as Level 3.
At December 31, 2024, the Company's debt was recorded at amortized cost with a carrying value of $1,315 million (2023: $1,314 million) and a fair value of $1,247 million (2023: $1,198 million). The fair value of the Company's debt is based on prices obtained from a third-party pricing service and is determined using the spread above the risk-free yield curve. These spreads are generally obtained from the new issue market, secondary trading and broker-dealer quotes. As the yields for the risk-free yield curve and the spreads are observable market inputs, the fair value of this debt is classified as Level 2.
At December 31, 2024, Federal Home Loan Bank advances were recorded at amortized cost with a carrying value of $66 million (2023: $86 million) and a fair value of $66 million (2023: $86 million). As these advances are not actively traded, their fair values are classified as Level 2.
AXIS CAPITAL HOLDINGS LIMITED
NOTES TO CONSOLIDATED FINANCIAL STATEMENTS
DECEMBER 31, 2024, 2023 AND 2022
7. DERIVATIVE INSTRUMENTS
The following table provides the balance sheet classifications of derivatives recorded at fair value:
| | | | | | | | | | | | | | | | | | | | | | | | | | | | | | | | | | | | | | | | | |
| | | | | | | | | | | | | |
| | December 31, 2024 | | December 31, 2023 | |
| | Derivative
notional
amount | | Derivative asset fair value(1) | | Derivative liability fair value(1) | | Derivative
notional
amount | | Derivative asset fair value(1) | | Derivative liability fair value(1) | |
| | | | | | | | | | | | | |
| Relating to investment portfolio: | | | | | | | | | | | | |
| Foreign exchange forward contracts | $ | 17,655 | | | $ | 323 | | | $ | — | | | $ | 49,307 | | | $ | 66 | | | $ | 274 | | |
| | | | | | | | | | | | | |
| | | | | | | | | | | | | |
| Relating to underwriting portfolio: | | | | | | | | | | | | |
| Foreign exchange forward contracts | 1,323,714 | | | 9,116 | | | 3,100 | | | 1,347,559 | | | 4,358 | | | 9,891 | | |
| | | | | | | | | | | | | |
| | | | | | | | | | | | | |
| | | | | | | | | | | | | |
| Total derivatives | | | $ | 9,439 | | | $ | 3,100 | | | | | $ | 4,424 | | | $ | 10,165 | | |
| | | | | | | | | | | | | |
(1)Derivative assets and derivative liabilities are classified within other assets and other liabilities in the consolidated balance sheets.
The notional amounts of derivative contracts represent the basis on which amounts paid or received are calculated and are presented in the above table to quantify the volume of the Company's derivative activities. Notional amounts are not reflective of credit risk.
None of the Company's derivative instruments are designated as hedges.
Offsetting Assets and Liabilities
The Company's derivative instruments are generally traded under International Swaps and Derivatives Association master netting agreements which establish terms that apply to all transactions. In the event of a bankruptcy or other stipulated event, master netting agreements provide that individual positions be replaced with a new amount, usually referred to as the termination amount, determined by taking into account market prices and converting into a single currency. Effectively, this contractual close-out netting reduces credit exposure from gross to net exposure.
The following table provides a reconciliation of gross derivative assets and liabilities to the net amounts presented in the consolidated balance sheets, with the difference being attributable to the impact of master netting agreements:
| | | | | | | | | | | | | | | | | | | | | | | | | | | | | |
| | December 31, 2024 | | December 31, 2023 | |
| | Gross amounts | Gross amounts offset | Net amounts(1) | | Gross amounts | Gross amounts offset | Net amounts(1) | |
| | | | | | | | | |
| Derivative assets | $ | 20,067 | | $ | (10,628) | | $ | 9,439 | | | $ | 8,708 | | $ | (4,284) | | $ | 4,424 | | |
| Derivative liabilities | $ | 13,728 | | $ | (10,628) | | $ | 3,100 | | | $ | 14,449 | | $ | (4,284) | | $ | 10,165 | | |
| | | | | | | | | |
(1)Net asset and liability derivatives are classified within other assets and other liabilities in the consolidated balance sheets.
Refer to Note 5 'Investments' for information on reverse repurchase agreements.
a) Relating to Investment Portfolio
Foreign Currency Risk
The Company's investment portfolio is exposed to foreign currency risk. Therefore, the fair values of its investments are partially influenced by changes in foreign currency exchange rates. The Company may enter into foreign exchange forward contracts to manage the effect of this foreign currency risk. These foreign currency hedging activities are not designated as specific hedges for financial reporting purposes.
AXIS CAPITAL HOLDINGS LIMITED
NOTES TO CONSOLIDATED FINANCIAL STATEMENTS
DECEMBER 31, 2024, 2023 AND 2022
7. DERIVATIVE INSTRUMENTS (CONTINUED)
b) Relating to Underwriting Portfolio
Foreign Currency Risk
The Company's insurance and reinsurance subsidiaries and branches operate in various countries. Some of its business is written in currencies other than the U.S. dollar, therefore the underwriting portfolio is exposed to significant foreign currency risk. The Company manages foreign currency risk by seeking to match its foreign-denominated net liabilities under insurance and reinsurance contracts with cash and investments that are denominated in the same currencies. The Company uses derivative instruments, specifically, forward contracts to economically hedge foreign currency exposures.
Other Underwriting-related Risks
The Company enters into insurance and reinsurance contracts that are accounted for as derivatives. These insurance or reinsurance contracts provide indemnification to an insured or cedant as a result of a change in a variable as opposed to an identifiable insurable event. The Company considers these contracts to be part of its underwriting operations.
The following table provides the total unrealized and realized gains (losses) recognized in net income (loss) for derivatives not designated as hedges:
| | | | | | | | | | | | | | | | | | | | | | | | | | |
| | | | | | | | |
| | Consolidated statement of operations line item that includes gain (loss) recognized
in net income (loss) | Amount of gain (loss) recognized in
net income (loss) | |
| | |
| | 2024 | | 2023 | | 2022 | |
| | | | | | | | |
| Relating to investment portfolio: | | | | | | | |
| Foreign exchange forward contracts | Net investment gains (losses) | $ | 1,783 | | | $ | (1,456) | | | $ | 7,656 | | |
| | | | | | | | |
| Relating to underwriting portfolio: | | | | | | | |
| Foreign exchange forward contracts | Foreign exchange (losses) gains | 13,399 | | | 8,121 | | | (31,609) | | |
| | | | | | | | |
| | | | | | | | |
| Other underwriting-related contracts | Other insurance related income | — | | | — | | | 3,542 | | |
| Total | | $ | 15,182 | | | $ | 6,665 | | | $ | (20,411) | | |
| | | | | | | | |
AXIS CAPITAL HOLDINGS LIMITED
NOTES TO CONSOLIDATED FINANCIAL STATEMENTS
DECEMBER 31, 2024, 2023 AND 2022
8. RESERVE FOR LOSSES AND LOSS EXPENSES
Reserving Methodology
Sources of Information
The Company's loss reserving process begins with the collection and analysis of paid and incurred claim data for each of the Company's segments. The segment data is disaggregated by line of business and further disaggregated by underwriting year and accident year. Underwriting year or accident year information is used to analyze the Company's business and to estimate reserves for losses and loss expenses. Lines of business are reviewed to ensure that the underlying contracts have homogeneous loss development characteristics, while remaining large enough to make the estimation of trends credible. The Company's lines of business are reviewed on a regular basis and adjusted over time as the Company's business evolves. The paid and incurred claim data serves as a key input to many of the methods employed by the Company's actuaries.
Actuarial Analysis
Multiple actuarial methods are available to estimate ultimate losses. Each method has its own assumptions and its own advantages and disadvantages, with no single estimation method being better than the others in all situations and no one set of assumption variables being meaningful for all lines of business. The relative strengths and weaknesses of the particular estimation methods when applied to a particular group of claims can also change over time.
The following is a brief description of the reserve estimation methods commonly employed by the Company's actuaries including a discussion of their particular strengths and weaknesses:
•Expected Loss Ratio Method ("ELR Method"): This method estimates ultimate losses for an accident year or underwriting year by applying an expected loss ratio ("ELR") to the earned or written premium for that year. Generally, expected loss ratios are based on one or more of (a) an analysis of historical loss experience to date, (b) pricing information and (c) industry benchmark information, adjusted as appropriate, to reflect premium rate changes, loss and exposure trends, and terms and conditions. This method is insensitive to actual incurred losses for the accident year or underwriting year in question and is, therefore, often useful in the early stages of development when very few losses have been incurred. Conversely, the lack of sensitivity to incurred/paid losses for the accident year or underwriting year in question means that this method is usually inappropriate in later stages of an accident year or underwriting year’s development.
•Loss Development Method (also referred to as the "Chain Ladder Method" or "Link Ratio Method"): This method assumes that the losses incurred/paid for each accident year or underwriting year at a particular development stage follow a relatively similar pattern. It assumes that on average, every accident year or underwriting year will display the same percentage of ultimate losses incurred/paid at the same point in time after the inception of that year. The percentages incurred/paid are established for each development stage (e.g., 12 months, 24 months, etc.) after examining averages from historical loss development data and/or, in limited instances, industry benchmark information. Ultimate losses are then estimated by multiplying the actual incurred/paid losses by the reciprocal of the established incurred/paid percentage. The strengths of this method are that it reacts to loss emergence/payments and that it makes full use of historical claim emergence/payment experience. However, this method has weaknesses when the underlying assumption of stable loss development/payment patterns is not valid. This could be the consequence of changes in business mix, claim inflation trends or claim reporting practices and/or the presence of large claims, among other things. Furthermore, this method tends to produce volatile estimates of ultimate losses where there is volatility in the underlying incurred/paid patterns. In particular, where the expected percentage of incurred/paid losses is low, small deviations between actual and expected claims can lead to very volatile estimates of ultimate losses. As a result, this method is often unsuitable at early development stages for an accident year or underwriting year.
AXIS CAPITAL HOLDINGS LIMITED
NOTES TO CONSOLIDATED FINANCIAL STATEMENTS
DECEMBER 31, 2024, 2023 AND 2022
8. RESERVE FOR LOSSES AND LOSS EXPENSES (CONTINUED)
•Bornhuetter-Ferguson Method ("BF Method"): This method can be seen as a combination of the ELR and Loss Development Methods, under which the Loss Development Method is given progressively more weight as an accident year or underwriting year matures. The main advantage of the BF Method is that it provides a more stable estimate of ultimate losses than the Loss Development Method at earlier stages of development, while remaining more responsive to emerging loss development than the ELR Method. In addition, the BF Method allows for the incorporation of external market information through the use of expected loss ratios, whereas the Loss Development Method does not incorporate such information.
As part of the loss reserving process, the Company's actuaries employ the estimation method(s) that they believe will produce the most reliable estimate of ultimate losses, at that particular evaluation date, for each line of business and accident year or underwriting year combination. Often, this is a blend (i.e., weighted average) of the results of two or more appropriate actuarial methods.
These ultimate loss estimates are generally utilized to evaluate the adequacy of ultimate loss estimates for previous accident or underwriting years, established in the prior reporting period. For the initial estimate of the current accident or underwriting year, the available claim data is typically insufficient to produce a reliable estimate of ultimate losses. As a result, initial estimates for an accident or underwriting year are generally based on the ELR Method for longer tailed lines and a BF Method for shorter tailed lines.
The initial ELR for each line of business is established by the Company's actuaries at the start of the year as part of the planning process, taking into consideration prior accident years’ or underwriting years' experience and industry benchmark information, adjusted after considering factors such as loss and exposure trends, rate differences, changes in contract terms and conditions, business mix changes and other known differences between the current and prior accident or underwriting years. The initial expected loss ratios for a given accident or underwriting year may be modified over time if the underlying assumptions, such as loss development or premium rate changes, differ from the original assumptions.
Key Actuarial Assumptions
The use of the above actuarial methods requires the Company to make certain explicit assumptions, the most significant of which are expected loss ratios and loss development patterns and the Company relies on historical loss experience in establishing these assumptions. In establishing expected loss ratios for the insurance segment, consideration is given to a number of other factors, including exposure trends, rate adequacy on new and renewal business, ceded reinsurance costs, changes in claims emergence and the Company's underwriters’ view of terms and conditions in the market environment. For the reinsurance segment, expected loss ratios are based on a contract-by-contract review, which considers information provided by clients together with estimates provided by the Company's underwriters and actuaries about the impact of changes in pricing, terms and conditions and coverage. Market experience for some lines of business as compiled and analyzed by an independent actuarial firm is also considered, as appropriate.
Reserving for Catastrophic Events
The Company cannot estimate losses from widespread catastrophic events, such as hurricanes and earthquakes, using the traditional actuarial methods described above. The magnitude and complexity of losses associated with certain of these events inherently increase the level of uncertainty and, therefore, the level of management judgment involved in arriving at estimated net reserves for losses and loss expenses. As a result, actual losses for these events may ultimately differ materially from the Company's current estimates.
AXIS CAPITAL HOLDINGS LIMITED
NOTES TO CONSOLIDATED FINANCIAL STATEMENTS
DECEMBER 31, 2024, 2023 AND 2022
8. RESERVE FOR LOSSES AND LOSS EXPENSES (CONTINUED)
Net reserves for losses and loss expenses related to catastrophes represent the Company's best estimate of losses and loss expenses that have been incurred at December 31, 2024. The determination of these net reserves for losses and loss expenses is estimated by management after a catastrophe occurs by completing an in-depth analysis of individual contracts which may potentially have been impacted by the catastrophic event. This in-depth analysis may rely on several sources of information including:
•estimates of the size of insured industry losses from the catastrophic event and the Company's corresponding market share;
•a review of the Company's portfolio of contracts to identify those contracts which may be exposed to the catastrophic event;
•a review of the Company's claims notifications
•a review of modeled loss estimates based on information previously reported by customers and brokers, including exposure data obtained during the underwriting process;
•a review of the coverage provided by the Company's ceded reinsurance;
•discussions of the impact of the event with customers and brokers; and
•catastrophe bulletins published by various independent statistical reporting agencies.
A blend of these information sources is generally used to arrive at aggregate estimates of the ultimate losses arising from these catastrophic events.
While the Company believes its estimate of net reserves for losses and loss expenses is adequate for losses and loss expenses that have been incurred at December 31, 2024 based on current facts and circumstances, the Company monitors changes in paid and incurred losses in relation to each catastrophe in subsequent reporting periods and adjustments are made to estimates of ultimate losses for each event if there are developments that are different from previous expectations. Adjustments are recorded in the period in which they are identified. Actual losses for these events may ultimately differ materially from the Company's current estimates.
Selection of Reported Reserves – Management’s Best Estimate
The Company's loss reserving process involves the collaboration of its underwriting, claims, actuarial, ceded reinsurance and finance departments, including multiple committee meetings and culminates with the approval of a single point best estimate by the Company's Group Reserving Committee, which comprises senior management. In selecting this best estimate, management considers actuarial estimates and applies informed judgment regarding qualitative factors that may not be fully captured in these actuarial estimates. Such factors include, but are not limited to, the timing of the emergence of claims, volume and complexity of claims, social and judicial trends, potential severity of individual claims and the extent of Company historical loss data versus industry benchmark information. While these qualitative factors are considered in arriving at the point estimate, no specific provisions for qualitative factors are established.
Reserve for Losses and Loss Expenses
Reserve for losses and loss expenses comprise the following: | | | | | | | | | | | | | | | | | |
| | | | | |
| At December 31, | 2024 | | 2023 | |
| | | | | |
| Reserve for reported losses and loss expenses | $ | 5,433,903 | | | $ | 5,559,261 | | |
| Reserve for losses incurred but not reported | 11,785,026 | | | 10,874,757 | | |
| Reserve for losses and loss expenses | $ | 17,218,929 | | | $ | 16,434,018 | | |
| | | | | |
AXIS CAPITAL HOLDINGS LIMITED
NOTES TO CONSOLIDATED FINANCIAL STATEMENTS
DECEMBER 31, 2024, 2023 AND 2022
8. RESERVE FOR LOSSES AND LOSS EXPENSES (CONTINUED)
Reserve Roll-forward
The following table presents a reconciliation of the Company's beginning and ending gross reserves for losses and loss expenses and net reserves for unpaid losses and loss expenses:
| | | | | | | | | | | | | | | | | | | | | | | |
| | | | | | | |
| Year ended December 31, | 2024 | | 2023 | | 2022 | |
| | | | | | | |
| Gross reserve for losses and loss expenses, beginning of year | $ | 16,434,018 | | | $ | 15,168,863 | | | $ | 14,653,094 | | |
| Less reinsurance recoverable on unpaid losses and loss expenses, beginning of year | (6,323,083) | | | (5,831,172) | | | (5,017,611) | | |
| Net reserve for unpaid losses and loss expenses, beginning of year | 10,110,935 | | | 9,337,691 | | | 9,635,483 | | |
| | | | | | | |
| Net incurred losses and loss expenses related to: | | | | | | |
| Current year | 3,182,810 | | | 2,981,220 | | | 3,267,943 | | |
| Prior years | (24,323) | | | 411,882 | | | (25,533) | | |
| | 3,158,487 | | | 3,393,102 | | | 3,242,410 | | |
| Net paid losses and loss expenses related to: | | | | | | |
| Current year | (538,709) | | | (488,016) | | | (457,857) | | |
| Prior years | (2,360,100) | | | (2,185,588) | | | (2,397,213) | | |
| | (2,898,809) | | | (2,673,604) | | | (2,855,070) | | |
| | | | | | | |
| Foreign exchange and other | 7,419 | | | 53,746 | | | (685,132) | | |
| | | | | | | |
| Net reserve for unpaid losses and loss expenses, end of year | 10,378,032 | | | 10,110,935 | | | 9,337,691 | | |
| Reinsurance recoverable on unpaid losses and loss expenses, end of year | 6,840,897 | | | 6,323,083 | | | 5,831,172 | | |
| Gross reserve for losses and loss expenses, end of year | $ | 17,218,929 | | | $ | 16,434,018 | | | $ | 15,168,863 | | |
| | | | | | | |
The Company writes business with loss experience generally characterized as low frequency and high severity in nature, which can result in volatility in its financial results. During 2024, 2023 and 2022, the Company recognized catastrophe and weather-related losses, net of reinstatement premiums, of $226 million, $138 million and $403 million.
On September 22, 2023, the Company entered into a retrocession reinsurance agreement with a third-party reinsurer which was deemed to have met the established criteria for retroactive reinsurance accounting. At December 31, 2023, foreign exchange and other included an increase in reinsurance recoverable on unpaid losses of $74 million related to this transaction.
On December 9, 2022, the Company entered into loss portfolio transfer reinsurance agreements with a third-party reinsurer which were deemed to have met the established criteria for retroactive reinsurance accounting. At December 31, 2022, foreign exchange and other included an increase in reinsurance recoverable on unpaid losses of $422 million related to this transaction.
AXIS CAPITAL HOLDINGS LIMITED
NOTES TO CONSOLIDATED FINANCIAL STATEMENTS
DECEMBER 31, 2024, 2023 AND 2022
8. RESERVE FOR LOSSES AND LOSS EXPENSES (CONTINUED)
Estimates for Catastrophe Events
At December 31, 2024, net reserves for losses and loss expenses included estimated amounts for numerous catastrophe events. The magnitude and complexity of losses arising from certain of these events inherently increase the level of uncertainty and, therefore, the level of management judgment involved in arriving at estimated net reserves for losses and loss expenses. These events include Hurricane Milton and Hurricane Helene in 2024, Cyclone Gabrielle in 2023, Hurricane Ian, Winter Storm Elliot, June European Convective Storms, the Russia-Ukraine war and COVID-19 in 2022. As a result, actual losses for these events may ultimately differ materially from the Company's current estimates.
Prior Year Reserve Development
The Company's net favorable (adverse) prior year reserve development arises from changes to estimates for losses and loss expenses related to loss events that occurred in previous calendar years. The following table presents net favorable (adverse) prior year reserve development by segment:
| | | | | | | | | | | | | | | | | | | | | | | | |
| | Favorable (Adverse) | | |
| | Insurance | | Reinsurance | | Total | | |
| | | | | | | | |
| Year ended December 31, 2024 | $ | 16,209 | | | $ | 8,114 | | | $ | 24,323 | | | |
| Year ended December 31, 2023 | $ | (176,353) | | | $ | (235,529) | | | $ | (411,882) | | | |
| Year ended December 31, 2022 | $ | 16,350 | | | $ | 9,183 | | | $ | 25,533 | | | |
| | | | | | | | |
The following sections provide further details on net favorable (adverse) prior year reserve development by segment, line of business and accident year.
Insurance Segment: | | | | | | | | | | | | | | | | | | | | | | | |
| | Favorable (Adverse) | |
| Years ended December 31, | 2024 | | 2023 | | 2022 | |
| | | | | | | |
| Property | $ | 17,718 | | | $ | 16,195 | | | $ | 52,512 | | |
| Accident and health | 4,191 | | | (10,236) | | | (12,856) | | |
| Marine and aviation | (10,656) | | | 26,977 | | | 27,927 | | |
| Cyber | — | | | 35,579 | | | 8,416 | | |
| Professional lines | — | | | (41,243) | | | (29,093) | | |
| Credit and political risk | 4,956 | | | 31,691 | | | 24,361 | | |
| Liability | — | | | (235,316) | | | (54,917) | | |
| Total | $ | 16,209 | | | $ | (176,353) | | | $ | 16,350 | | |
| | | | | | | |
In 2024, we recognized $16 million of net favorable prior year reserve development, the principal components of which were:
•$18 million of net favorable prior year reserve development on property business primarily due to better than expected loss emergence mainly related to the 2022 accident year.
•$5 million of net favorable prior year reserve development on credit and political risk business primarily due to better than expected loss emergence related to 2013 and older accident years and 2019 through 2022 accident years.
•$4 million of net favorable prior year development on accident and health business primarily due to better than expected loss emergence related to pet insurance business.
AXIS CAPITAL HOLDINGS LIMITED
NOTES TO CONSOLIDATED FINANCIAL STATEMENTS
DECEMBER 31, 2024, 2023 AND 2022
8. RESERVE FOR LOSSES AND LOSS EXPENSES (CONTINUED)
•$11 million of net adverse prior year reserve development on marine and aviation business primarily due to an increase in the loss estimate attributable to a specific large claim related to the 2019 accident year.
In 2023, we recognized $176 million of net adverse prior year reserve development, the principal components of which were:
•$235 million of net adverse prior year reserve development on liability business primarily due to reserve strengthening within the U.S. primary casualty book of business mainly related to 2022 and older accident years and U.S. programs books of business mainly related to 2017 through 2022 accident years. The reserve strengthening was attributable to updated trend assumptions, emerging development patterns and new industry data reflecting the impact of current economic and social inflation trends in the U.S. casualty market.
•$41 million of net adverse prior year reserve development on professional lines business primarily due to reserve strengthening within the U.S. financial institutions, U.S. commercial management solutions, U.S. design professional and environmental, and the international book of business related to 2019 and older accident years, and increases in loss estimates attributable to specific large claims within the international book of business related to 2012 and older accident years.
•$10 million of net adverse prior year development on accident and health business primarily due to reserve strengthening within the international book of business mainly related to the 2021 and 2022 accident years.
•$36 million of net favorable prior year reserve development on cyber business primarily due to better than expected loss emergence related to most accident years, partially offset by increases in loss estimates attributable to specific large claims related to the 2020 accident year.
•$32 million of net favorable prior year reserve development on credit and political risk business primarily due to a decrease in the loss estimate attributable to a specific large claim related to the 2020 accident year and better than expected loss emergence related to several accident years.
•$27 million of net favorable prior year reserve development on marine and aviation business primarily due to better than expected loss emergence attributable to the marine cargo and aviation books of business related to several accident years and better than expected loss emergence attributable to several catastrophe events.
•$16 million of net favorable prior year reserve development on property business primarily due to better than expected loss emergence mainly related to 2017 through 2019 accident years and better than expected loss emergence attributable to 2022 catastrophe events, partially offset by increases in loss estimates attributable to two specific large claims within the E&S book of business related to the 2016 and 2022 accident years.
In 2022, we recognized $16 million of net favorable prior year reserve development, the principal components of which were:
•$53 million of net favorable prior year reserve development on property business primarily due to better than expected loss emergence attributable to 2018 and 2020 catastrophe events and decreases in loss estimates attributable to specific large claims related to 2012 and older accident years.
•$28 million of net favorable prior year reserve development on marine and aviation business primarily due to better than expected loss emergence attributable to the marine cargo and specie, and marine offshore energy books of business mainly related to the 2018, 2019 and 2021 accident years, and better than expected loss emergence attributable to aviation business mainly related to the 2021 accident year.
•$24 million of net favorable prior year reserve development on credit and political risk business primarily due to better than expected loss emergence mainly related to 2017 through 2021 accident years.
AXIS CAPITAL HOLDINGS LIMITED
NOTES TO CONSOLIDATED FINANCIAL STATEMENTS
DECEMBER 31, 2024, 2023 AND 2022
8. RESERVE FOR LOSSES AND LOSS EXPENSES (CONTINUED)
•$8 million of net favorable prior year reserve development on cyber business primarily due to better than expected loss emergence mainly related to 2020 and older accident years, partially offset by reserve strengthening related to the 2021 accident year.
•$55 million of net adverse prior year reserve development on liability business primarily due to reserve strengthening within the U.S. programs book of business mainly related to 2016 through 2021 accident years, and the U.S. primary casualty book of business mainly related to 2015 through 2018 and the 2021 accident years.
•$29 million of net adverse prior year reserve development on professional lines business primarily due to reserve strengthening within the U.S. commercial management solutions book of business mainly related to the 2015, 2018 and 2019 accident years.
•$13 million of net adverse prior year development on accident and health business primarily due to reserve strengthening mainly related to 2019 through 2021 accident years.
AXIS CAPITAL HOLDINGS LIMITED
NOTES TO CONSOLIDATED FINANCIAL STATEMENTS
DECEMBER 31, 2024, 2023 AND 2022
8. RESERVE FOR LOSSES AND LOSS EXPENSES (CONTINUED)
Reinsurance Segment:
| | | | | | | | | | | | | | | | | | | | | | | |
| | Favorable (Adverse) | |
| Years ended December 31, | 2024 | | 2023 | | 2022 | |
| | | | | | | |
| Accident and health | $ | — | | | $ | 29,947 | | | $ | 14,199 | | |
| Agriculture | — | | | 10,781 | | | 11,703 | | |
| Marine and aviation | 4,111 | | | 12,595 | | | 2,597 | | |
| Professional lines | — | | | (92,181) | | | (54,820) | | |
| Credit and surety | 4,003 | | | 8,306 | | | 43,567 | | |
| Motor | — | | | (9,653) | | | 18,161 | | |
| Liability | — | | | (262,114) | | | (58,148) | | |
| Run-off lines | | | | | | |
| Catastrophe | — | | | 46,297 | | | (504) | | |
| Property | — | | | 15,225 | | | 42,523 | | |
| Engineering | — | | | 5,268 | | | (10,095) | | |
| Total run-off lines | — | | | 66,790 | | | 31,924 | | |
| Total | $ | 8,114 | | | $ | (235,529) | | | $ | 9,183 | | |
| | | | | | | |
In 2024, we recognized $8 million of net favorable prior year reserve development, the principal components of which were:
•$4 million of net favorable prior year reserve development on marine and aviation business primarily due to better than expected loss emergence mainly related to the 2022 accident year.
•$4 million of net favorable prior year reserve development on credit and surety business primarily due to better than expected loss emergence attributable to the mortgage book of business mainly related to the 2020 accident year.
In 2023, we recognized $236 million of net adverse prior year reserve development, the principal components of which were:
•$262 million of net adverse prior year reserve development on liability business primarily due to reserve strengthening within the U.S. casualty and U.S. multiline/regional books of business related to all accident years. The reserve strengthening was attributable to updated trend assumptions, emerging development patterns and new industry data reflecting the impact of current economic and social inflation trends in the U.S. casualty market.
•$92 million of net adverse prior year reserve development on professional lines business primarily due to reserve strengthening within the U.S. proportional book of business mainly related to 2019 and older accident years, partially offset by better than expected loss emergence mainly related to the 2021 and 2022 accident years.
•$10 million of net adverse prior year reserve development on motor business primarily due to reserve strengthening to reflect increased estimates of future loss trend due to inflation and reserve strengthening attributable to the proportional book of business mainly related to 2018 through 2022 accident years.
•$30 million of net favorable prior year reserve development on accident and health business primarily due to better than expected loss emergence mainly related to 2018 through 2021 accident years.
•$13 million of net favorable prior year reserve development on marine and aviation business primarily due to better than expected loss emergence mainly related to the 2021 and 2022 accident years.
AXIS CAPITAL HOLDINGS LIMITED
NOTES TO CONSOLIDATED FINANCIAL STATEMENTS
DECEMBER 31, 2024, 2023 AND 2022
8. RESERVE FOR LOSSES AND LOSS EXPENSES (CONTINUED)
•$11 million of net favorable prior year reserve development on agriculture business primarily due to better than expected loss emergence mainly related to the 2022 accident year.
•$8 million of net favorable prior year reserve development on credit and surety business primarily due to better than expected loss emergence attributable to the international credit and mortgage books of business mainly related to the 2018 and 2019 accident years and the 2021 and 2022 accident years, partially offset by increases in loss estimates attributable to specific large claims related to the 2020 accident year.
Run-off lines
•$46 million of net favorable prior year reserve development on catastrophe business primarily due to better than expected loss emergence mainly attributable to 2022 events.
•$15 million of net favorable prior year reserve development on property business primarily due to better than expected loss emergence mainly attributable to 2022 catastrophe events.
•$5 million of net favorable prior year reserve development on engineering business primarily due to better than expected loss emergence mainly related to older accident years.
In 2022, we recognized $9 million of net favorable prior year reserve development, the principal components of which were:
•$44 million of net favorable prior year reserve development on credit and surety business primarily due to better than expected loss emergence mainly related to 2015 through 2021 accident years, most notably within the mortgage book of business related to the 2020 and 2021 accident years.
•$18 million of net favorable prior year reserve development on motor business primarily due to better than expected loss emergence mainly related to 2017 through 2020 accident years.
•$14 million of net favorable prior year reserve development on accident and health business primarily due to better than expected loss emergence mainly related to 2019 through 2021 accident years.
•$12 million of net favorable prior year reserve development on agriculture business primarily due to better than expected loss emergence mainly related to the 2019 and 2021 accident years.
•$58 million of net adverse prior year reserve development on liability business primarily due to increases in loss estimates attributable to specific large claims related to the 2018 and 2021 accident years and reserve strengthening within the U.S. non-proportional book of business related to 2016 through 2019 accident years.
•$55 million of net adverse prior year reserve development on professional lines business primarily due to increases in loss estimates attributable to one cedant related to several accident years, and reserve strengthening within the U.S. public D&O proportional book of business related to 2017 and older accident years.
Run-off lines
•$43 million of net favorable prior year reserve development on property business primarily due to better than expected loss emergence attributable to 2017 through 2021 catastrophe events and better than expected attritional loss emergence related to the 2021 accident year.
•$10 million of net adverse prior year reserve development on engineering business primarily due to increases in loss estimates attributable to specific large claims mainly related to the 2011, 2018 and 2019 accident years.
AXIS CAPITAL HOLDINGS LIMITED
NOTES TO CONSOLIDATED FINANCIAL STATEMENTS
DECEMBER 31, 2024, 2023 AND 2022
8. RESERVE FOR LOSSES AND LOSS EXPENSES (CONTINUED)
Net Incurred and Paid Claims Development Tables by Accident Year
The following tables present net incurred and paid claims development by accident year, total incurred-but-not-reported liabilities plus expected development on reported claims, cumulative reported claims frequency and average annual percentage payout of incurred claims by age for each line of business. The loss development tables are presented on an accident year basis for each line of business in the insurance and reinsurance segments. The Company does not discount reserves for losses and loss expenses.
Non-U.S. dollar denominated loss data is converted to U.S. dollar at the rates of exchange in effect at the balance sheet date for material underlying currencies. Fluctuations in foreign currency exchange rates may cause material shifts in loss development. Reserves for losses and loss expenses disclosed in the consolidated balance sheets are also remeasured using the rates of exchange in effect at the balance sheet date.
There are many considerations in establishing net reserves for losses and loss expenses. An attempt to evaluate net reserves for losses and loss expenses using solely the paid losses and claim counts presented in these tables could be misleading. When projecting net reserves for losses and loss expenses, the Company relies on several inputs in addition to the information presented in this disclosure including case incurred loss projections, changes in mix of business, external trends, and additional qualitative information. The Company cautions against mechanical application of standard actuarial methodologies to project ultimate losses using data presented in this disclosure.
Insurance Segment
The reporting of cumulative claims frequency for the lines of business within the insurance segment has been measured by counting the number of unique claim references including claim references assigned to nil and nominal case reserves. Claim references are grouped by claimant by loss event for each line of business. For certain insurance facilities and business produced by managing general agents where underlying data is reported to the Company in an aggregated format, the information necessary to provide cumulative claims frequency is not available therefore reporting of claims frequency is deemed to be impracticable.
Insurance Property
The property line of business provides physical loss or damage, business interruption and machinery breakdown cover for virtually all types of property, including commercial buildings, residential premises, construction projects, property in transit, onshore renewable energy installations, and physical damage and business interruption following an act of terrorism. This line of business includes primary and excess risks, some of which are catastrophe-exposed.
In general, reporting and payment patterns are relatively short although they can be volatile due to the incidence of catastrophe events.
AXIS CAPITAL HOLDINGS LIMITED
NOTES TO CONSOLIDATED FINANCIAL STATEMENTS
DECEMBER 31, 2024, 2023 AND 2022
8. RESERVE FOR LOSSES AND LOSS EXPENSES (CONTINUED)
| | | | | | | | | | | | | | | | | | | | | | | | | | | | | | | | | | | | | | |
| Insurance property |
| Incurred claims and allocated claim adjustment expenses, net of reinsurance | At December 31, 2024 |
| For the years ended December 31, | Total of incurred-but-not-reported liabilities plus expected development on reported claims | Cumulative number of reported claims |
| Accident year | 2015 unaudited | 2016 unaudited | 2017 unaudited | 2018 unaudited | 2019 unaudited | 2020 unaudited | 2021 unaudited | 2022 unaudited | 2023 unaudited | 2024 |
| 2015 | $ | 207,189 | | $ | 199,448 | | $ | 191,577 | | $ | 189,373 | | $ | 186,032 | | $ | 187,860 | | $ | 177,908 | | $ | 180,172 | | $ | 180,785 | | $ | 184,012 | | $ | 1,053 | | 4,199 |
| 2016 | | 261,565 | | 284,462 | | 276,891 | | 262,436 | | 256,514 | | 256,766 | | 256,192 | | 261,379 | | 260,698 | | (854) | | 6,685 |
| 2017 | | | 789,318 | | 694,953 | | 682,582 | | 673,336 | | 668,663 | | 668,986 | | 663,510 | | 662,072 | | 11,091 | | 10,117 |
| 2018 | | | | 600,141 | | 629,218 | | 608,937 | | 601,674 | | 600,469 | | 591,064 | | 585,484 | | 5,167 | | 9,701 |
| 2019 | | | | | 368,594 | | 357,615 | | 349,495 | | 360,367 | | 343,816 | | 343,852 | | 1,904 | | 9,630 |
| 2020 | | | | | | 644,750 | | 627,229 | | 575,827 | | 584,608 | | 590,238 | | 15,480 | | 12,528 |
| 2021 | | | | | | | 375,981 | | 370,445 | | 366,781 | | 366,639 | | 10,732 | | 7,943 |
| 2022 | | | | | | | | 411,156 | | 413,181 | | 396,296 | | 27,546 | | 7,707 |
| 2023 | | | | | | | | | 395,636 | | 392,842 | | 95,149 | | 7,143 |
| 2024 | | | | | | | | | | 539,252 | | 274,741 | | 6,578 |
| | | | | | | | | Total | $ | 4,321,385 | | | |
| | | | | | | | | | | | |
| | | | | | | | | | | | | | | | | | | | | | | | | | | | | | | | | | | | | | |
| Insurance property | | | | | | |
| Cumulative paid claims and allocated claim adjustment expenses, net of reinsurance | | | | | | |
| For the years ended December 31, | | | | | | |
| Accident year | 2015 unaudited | 2016 unaudited | 2017 unaudited | 2018 unaudited | 2019 unaudited | 2020 unaudited | 2021 unaudited | 2022 unaudited | 2023 unaudited | 2024 | | | | | | |
| 2015 | $ | 67,399 | | $ | 144,389 | | $ | 165,268 | | $ | 178,896 | | $ | 178,566 | | $ | 184,856 | | $ | 176,079 | | $ | 180,900 | | $ | 180,576 | | $ | 182,683 | | | | | | | |
| 2016 | | 82,296 | | 204,637 | | 240,568 | | 248,054 | | 248,118 | | 252,951 | | 250,353 | | 256,535 | | 260,805 | | | | | | | |
| 2017 | | | 190,148 | | 509,202 | | 616,838 | | 644,936 | | 639,939 | | 629,525 | | 641,640 | | 642,182 | | | | | | | |
| 2018 | | | | 218,293 | | 461,816 | | 554,132 | | 564,129 | | 581,594 | | 567,762 | | 576,747 | | | | | | | |
| 2019 | | | | | 145,556 | | 251,877 | | 298,564 | | 335,077 | | 323,935 | | 328,429 | | | | | | | |
| 2020 | | | | | | 181,138 | | 420,774 | | 474,714 | | 523,474 | | 553,239 | | | | | | | |
| 2021 | | | | | | | 133,671 | | 284,332 | | 319,737 | | 338,393 | | | | | | | |
| 2022 | | | | | | | | 96,815 | | 259,261 | | 323,805 | | | | | | | |
| 2023 | | | | | | | | | 90,343 | | 206,885 | | | | | | | |
| 2024 | | | | | | | | | | 111,368 | | | | | | | |
| Total | 3,524,536 | | | | | | | |
| | | | | | | |
| All outstanding liabilities before 2015, net of reinsurance | 13,825 | | | | | | | |
| | | | | | | |
| Liabilities for claims and claim adjustment expenses, net of reinsurance | $ | 810,674 | | | | | | | |
| | | | | | | | | | | | | | | | |
| | | | | | | | | | | | | | | | |
AXIS CAPITAL HOLDINGS LIMITED
NOTES TO CONSOLIDATED FINANCIAL STATEMENTS
DECEMBER 31, 2024, 2023 AND 2022
8. RESERVE FOR LOSSES AND LOSS EXPENSES (CONTINUED)
| | | | | | | | | | | | | | | | | | | | | | | | | | | | | |
| Insurance property |
| Average annual percentage payout of incurred claims by age, net of reinsurance (unaudited) |
| Year 1 | Year 2 | Year 3 | Year 4 | Year 5 | Year 6 | Year 7 | Year 8 | Year 9 | Year 10 |
| 31.2% | 40.2% | 13.2% | 5.7% | 0.6% | 0.5% | (0.6%) | 1.7% | 0.7% | 1.1% |
Insurance Accident and Health
The accident and health line of business includes personal accident, travel insurance and specialty health products for employer and affinity groups, and pet insurance.
In general, reporting and payment patterns are relatively short although they can be volatile due to the incidence of catastrophe events. An increase in limited benefits medical business written in 2017 resulted in a significant increase in reported claims observed in that year and subsequent years.
| | | | | | | | | | | | | | | | | | | | | | | | | | | | | | | | | | | | | | |
| Insurance accident and health |
| Incurred claims and allocated claim adjustment expenses, net of reinsurance | At December 31, 2024 |
| For the years ended December 31, | Total of incurred-but-not-reported liabilities plus expected development on reported claims | Cumulative number of reported claims |
| Accident year | 2015 unaudited | 2016 unaudited | 2017 unaudited | 2018 unaudited | 2019 unaudited | 2020 unaudited | 2021 unaudited | 2022 unaudited | 2023 unaudited | 2024 |
| 2015 | $ | 70,003 | | $ | 68,570 | | $ | 65,066 | | $ | 63,278 | | $ | 63,844 | | $ | 63,527 | | $ | 62,860 | | $ | 63,519 | | $ | 60,850 | | $ | 60,933 | | $ | 1,075 | | 44,138 |
| 2016 | | 84,654 | | 84,824 | | 85,219 | | 86,343 | | 86,029 | | 87,038 | | 86,822 | | 86,249 | | 85,654 | | 860 | | 87,001 |
| 2017 | | | 113,374 | | 119,968 | | 117,761 | | 115,848 | | 115,913 | | 115,798 | | 116,916 | | 117,082 | | 74 | | 688,000 |
| 2018 | | | | 110,256 | | 114,418 | | 113,478 | | 111,552 | | 112,563 | | 113,253 | | 114,193 | | 130 | | 745,012 |
| 2019 | | | | | 73,130 | | 74,067 | | 64,562 | | 68,028 | | 67,110 | | 69,578 | | 556 | | 675,633 |
| 2020 | | | | | | 69,137 | | 62,944 | | 66,164 | | 62,922 | | 64,902 | | 555 | | 718,518 |
| 2021 | | | | | | | 68,873 | | 70,639 | | 76,918 | | 75,036 | | 1,664 | | 440,175 |
| 2022 | | | | | | | | 97,576 | | 98,228 | | 95,259 | | 2,660 | | 400,429 |
| 2023 | | | | | | | | | 170,186 | | 163,983 | | 19,627 | | 406,521 |
| 2024 | | | | | | | | | | 207,466 | | 74,872 | | 365,749 |
| | | | | | | | | Total | $ | 1,054,086 | | | |
| | | | | | | | | | | | |
AXIS CAPITAL HOLDINGS LIMITED
NOTES TO CONSOLIDATED FINANCIAL STATEMENTS
DECEMBER 31, 2024, 2023 AND 2022
8. RESERVE FOR LOSSES AND LOSS EXPENSES (CONTINUED)
| | | | | | | | | | | | | | | | | | | | | | | | | | | | | | | | | | | |
| Insurance accident and health |
| Cumulative paid claims and allocated claim adjustment expenses, net of reinsurance | | | |
| For the years ended December 31, | | | |
| Accident year | 2015 unaudited | 2016 unaudited | 2017 unaudited | 2018 unaudited | 2019 unaudited | 2020 unaudited | 2021 unaudited | 2022 unaudited | 2023 unaudited | 2024 | | | |
| 2015 | $ | 31,140 | | $ | 56,263 | | $ | 59,293 | | $ | 60,154 | | $ | 61,163 | | $ | 61,032 | | $ | 61,684 | | $ | 61,775 | | $ | 59,672 | | $ | 59,820 | | | | |
| 2016 | | 41,127 | | 78,239 | | 82,003 | | 82,836 | | 83,897 | | 84,288 | | 84,989 | | 84,125 | | 84,869 | | | | |
| 2017 | | | 62,733 | | 108,219 | | 113,393 | | 114,788 | | 115,890 | | 115,070 | | 116,933 | | 117,122 | | | | |
| 2018 | | | | 61,218 | | 105,324 | | 107,655 | | 111,312 | | 112,202 | | 113,014 | | 114,104 | | | | |
| 2019 | | | | | 44,652 | | 60,623 | | 62,033 | | 66,971 | | 66,828 | | 68,263 | | | | |
| 2020 | | | | | | 36,035 | | 51,481 | | 59,608 | | 57,944 | | 61,786 | | | | |
| 2021 | | | | | | | 38,828 | | 60,470 | | 68,183 | | 69,489 | | | | |
| 2022 | | | | | | | | 45,663 | | 80,164 | | 87,242 | | | | |
| 2023 | | | | | | | | | 93,765 | | 135,134 | | | | |
| 2024 | | | | | | | | | | 122,628 | | | | |
| Total | 920,457 | | | | |
| | | | |
| All outstanding liabilities before 2015, net of reinsurance | 656 | | | | |
| | | | |
| Liabilities for claims and claim adjustment expenses, net of reinsurance | $ | 134,285 | | | | |
| | | | | | | | | | | | | |
| | | | | | | | | | | | | | | | | | | | | | | | | | | | | |
| Insurance accident and health |
| Average annual percentage payout of incurred claims by age, net of reinsurance (unaudited) |
| Year 1 | Year 2 | Year 3 | Year 4 | Year 5 | Year 6 | Year 7 | Year 8 | Year 9 | Year 10 |
| 54.2% | 33.2% | 6.0% | 1.9% | 1.7% | 0.5% | 1.1% | (0.2%) | (1.3%) | 0.2% |
Insurance Marine and Aviation
The marine line of business provides cover for a range of exposures including offshore energy, renewable offshore energy, cargo, liability including kidnap and ransom, fine art, specie, and hull war. Offshore energy coverages include physical damage, business interruption, operator's extra expense and liability coverage for all aspects of offshore upstream energy from exploration and construction through the operation and distribution phases.
The complex nature of claims arising under marine policies tends to result in reporting and payment patterns that are longer than those of the property line of business with marine liability exhibiting the longest reporting and payment patterns as claims involve passengers and third parties. Exposure to natural perils such as windstorm and earthquake can result in volatility.
The aviation line of business provides cover for hull and liability, and specific war cover primarily for passenger airlines but also for cargo operations, general aviation operations, airports, aviation authorities, security firms and product manufacturers.
The claims reporting pattern varies by insurance coverage provided. Losses arising from war or terrorism and damage to hulls of aircraft are generally reported quickly compared with liability claims which involve passengers and third parties and generally exhibit longer reporting and payment patterns.
AXIS CAPITAL HOLDINGS LIMITED
NOTES TO CONSOLIDATED FINANCIAL STATEMENTS
DECEMBER 31, 2024, 2023 AND 2022
8. RESERVE FOR LOSSES AND LOSS EXPENSES (CONTINUED)
| | | | | | | | | | | | | | | | | | | | | | | | | | | | | | | | | | | | | | |
| Insurance marine and aviation |
| Incurred claims and allocated claim adjustment expenses, net of reinsurance | At December 31, 2024 |
| For the years ended December 31, | Total of incurred-but-not-reported liabilities plus expected development on reported claims | Cumulative number of reported claims |
| Accident year | 2015 unaudited | 2016 unaudited | 2017 unaudited | 2018 unaudited | 2019 unaudited | 2020 unaudited | 2021 unaudited | 2022 unaudited | 2023 unaudited | 2024 |
| 2015 | $ | 186,023 | | $ | 164,397 | | $ | 159,304 | | $ | 151,503 | | $ | 138,907 | | $ | 144,418 | | $ | 143,385 | | $ | 143,359 | | $ | 141,862 | | $ | 141,557 | | $ | 1 | | 4,316 |
| 2016 | | 115,442 | | 111,630 | | 109,092 | | 101,322 | | 100,703 | | 99,830 | | 100,732 | | 101,680 | | 100,809 | | 2,930 | | 4,898 |
| 2017 | | | 260,225 | | 227,207 | | 224,246 | | 222,060 | | 213,940 | | 213,545 | | 212,002 | | 211,499 | | 5,926 | | 8,589 |
| 2018 | | | | 234,768 | | 251,517 | | 237,372 | | 230,422 | | 223,605 | | 225,057 | | 225,769 | | 11,695 | | 8,787 |
| 2019 | | | | | 213,917 | | 208,026 | | 210,690 | | 223,032 | | 221,512 | | 246,540 | | 4,556 | | 7,755 |
| 2020 | | | | | | 207,122 | | 178,537 | | 161,953 | | 163,264 | | 167,229 | | 9,134 | | 6,533 |
| 2021 | | | | | | | 238,454 | | 219,002 | | 201,232 | | 222,356 | | 20,126 | | 6,922 |
| 2022 | | | | | | | | 263,742 | | 254,138 | | 255,744 | | 68,596 | | 7,650 |
| 2023 | | | | | | | | | 297,529 | | 261,711 | | 99,643 | | 7,266 |
| 2024 | | | | | | | | | | 341,298 | | 185,817 | | 6,103 |
| | | | | | | | | Total | $ | 2,174,512 | | | |
| | | | | | | | | | | | |
| | | | | | | | | | | | | | | | | | | | | | | | | | | | | | | | |
| Insurance marine and aviation |
| Cumulative paid claims and allocated claim adjustment expenses, net of reinsurance |
| For the years ended December 31, |
| Accident year | 2015 unaudited | 2016 unaudited | 2017 unaudited | 2018 unaudited | 2019 unaudited | 2020 unaudited | 2021 unaudited | 2022 unaudited | 2023 unaudited | 2024 |
| 2015 | $ | 29,464 | | $ | 68,918 | | $ | 123,818 | | $ | 128,652 | | $ | 131,418 | | $ | 134,176 | | $ | 140,256 | | $ | 140,443 | | $ | 140,449 | | $ | 140,441 | |
| 2016 | | 22,868 | | 50,881 | | 82,738 | | 89,721 | | 91,648 | | 93,576 | | 96,663 | | 97,321 | | 96,224 | |
| 2017 | | | 34,748 | | 104,908 | | 137,887 | | 169,479 | | 178,013 | | 181,766 | | 193,220 | | 198,539 | |
| 2018 | | | | 46,694 | | 121,096 | | 156,641 | | 169,862 | | 181,261 | | 193,550 | | 199,341 | |
| 2019 | | | | | 53,526 | | 101,596 | | 143,642 | | 168,768 | | 176,353 | | 189,630 | |
| 2020 | | | | | | 44,330 | | 83,545 | | 105,145 | | 117,734 | | 131,309 | |
| 2021 | | | | | | | 26,424 | | 68,306 | | 106,333 | | 144,284 | |
| 2022 | | | | | | | | 29,699 | | 99,980 | | 138,256 | |
| 2023 | | | | | | | | | 36,159 | | 91,653 | |
| 2024 | | | | | | | | | | 62,738 | |
| Total | 1,392,415 | |
| |
| All outstanding liabilities before 2015, net of reinsurance | 13,787 | |
| |
| Liabilities for claims and claim adjustment expenses, net of reinsurance | $ | 795,884 | |
| | | | | | | | | | |
AXIS CAPITAL HOLDINGS LIMITED
NOTES TO CONSOLIDATED FINANCIAL STATEMENTS
DECEMBER 31, 2024, 2023 AND 2022
8. RESERVE FOR LOSSES AND LOSS EXPENSES (CONTINUED)
| | | | | | | | | | | | | | | | | | | | | | | | | | | | | |
| Insurance marine and aviation |
| Average annual percentage payout of incurred claims by age, net of reinsurance (unaudited) |
| Year 1 | Year 2 | Year 3 | Year 4 | Year 5 | Year 6 | Year 7 | Year 8 | Year 9 | Year 10 |
| 18.5% | 25.8% | 20.5% | 9.4% | 4.0% | 3.3% | 3.9% | 1.1% | (0.6%) | —% |
Insurance Cyber
The cyber line of business provides cover for cyber, technology errors and omissions, media and miscellaneous professional liability. Cover is provided for a range of risks including data recovery and bricking, cyber-crime, liability and regulatory actions, business interruption, extortion, reputational harm, Payment Card Industry Data Security Standard and media liability.
Typically, this line of business takes longer to develop but specific first party coverages tend to develop more quickly than third party coverages.
| | | | | | | | | | | | | | | | | | | | | | | | | | | | | | | | | | | | | | | |
| Insurance cyber |
| Incurred claims and allocated claim adjustment expenses, net of reinsurance | At December 31, 2024 | |
| For the years ended December 31, | Total of incurred-but-not-reported liabilities plus expected development on reported claims | Cumulative number of reported claims | |
| Accident year | 2015 unaudited | 2016 unaudited | 2017 unaudited | 2018 unaudited | 2019 unaudited | 2020 unaudited | 2021 unaudited | 2022 unaudited | 2023 unaudited | 2024 | |
| 2015 | $ | 65,231 | | $ | 63,595 | | $ | 63,066 | | $ | 51,250 | | $ | 50,357 | | $ | 50,758 | | $ | 52,526 | | $ | 49,795 | | $ | 48,042 | | $ | 48,036 | | $ | 2,226 | | 1,428 | |
| 2016 | | 58,741 | | 56,565 | | 58,261 | | 40,266 | | 37,322 | | 29,929 | | 27,873 | | 25,258 | | 25,254 | | 1,079 | | 1,671 | |
| 2017 | | | 53,187 | | 50,794 | | 56,783 | | 51,931 | | 50,910 | | 48,696 | | 48,343 | | 46,036 | | (4) | | 1,817 | |
| 2018 | | | | 33,429 | | 31,966 | | 33,962 | | 30,558 | | 26,168 | | 23,902 | | 29,447 | | 1,845 | | 2,156 | |
| 2019 | | | | | 54,237 | | 56,994 | | 80,098 | | 80,157 | | 71,246 | | 63,767 | | 3,608 | | 2,904 | |
| 2020 | | | | | | 113,305 | | 104,869 | | 101,604 | | 124,751 | | 133,525 | | 24,605 | | 2,880 | |
| 2021 | | | | | | | 124,709 | | 133,593 | | 104,732 | | 105,722 | | 21,145 | | 2,450 | |
| 2022 | | | | | | | | 128,483 | | 119,436 | | 119,484 | | 61,903 | | 1,766 | |
| 2023 | | | | | | | | | 126,838 | | 126,343 | | 57,395 | | 2,336 | |
| 2024 | | | | | | | | | | 158,180 | | 138,542 | | 1,325 | |
| | | | | | | | | Total | $ | 855,794 | | | | |
| | | | |
AXIS CAPITAL HOLDINGS LIMITED
NOTES TO CONSOLIDATED FINANCIAL STATEMENTS
DECEMBER 31, 2024, 2023 AND 2022
8. RESERVE FOR LOSSES AND LOSS EXPENSES (CONTINUED)
| | | | | | | | | | | | | | | | | | | | | | | | | | | | | | | | |
| Insurance cyber |
| Cumulative paid claims and allocated claim adjustment expenses, net of reinsurance |
| For the years ended December 31, |
| Accident year | 2015 unaudited | 2016 unaudited | 2017 unaudited | 2018 unaudited | 2019 unaudited | 2020 unaudited | 2021 unaudited | 2022 unaudited | 2023 unaudited | 2024 |
| 2015 | $ | 5,572 | | $ | 15,333 | | $ | 25,544 | | $ | 28,501 | | $ | 30,865 | | $ | 39,470 | | $ | 42,515 | | $ | 43,635 | | $ | 45,432 | | $ | 45,318 | |
| 2016 | | 1,348 | | 4,637 | | 14,141 | | 18,502 | | 21,333 | | 23,136 | | 23,207 | | 24,054 | | 24,054 | |
| 2017 | | | 9,354 | | 19,165 | | 28,331 | | 35,897 | | 38,029 | | 40,554 | | 39,997 | | 47,274 | |
| 2018 | | | | 2,171 | | 7,327 | | 9,874 | | 14,790 | | 19,226 | | 18,329 | | 26,263 | |
| 2019 | | | | | 2,764 | | 20,249 | | 31,445 | | 58,696 | | 54,986 | | 55,026 | |
| 2020 | | | | | | 17,700 | | 49,529 | | 62,548 | | 81,129 | | 102,650 | |
| 2021 | | | | | | | 24,077 | | 65,332 | | 74,856 | | 82,803 | |
| 2022 | | | | | | | | 7,796 | | 37,446 | | 52,479 | |
| 2023 | | | | | | | | | 9,094 | | 45,086 | |
| 2024 | | | | | | | | | | 11,906 | |
| Total | 492,859 | |
| |
| All outstanding liabilities before 2015, net of reinsurance | 7,614 | |
| |
| Liabilities for claims and claim adjustment expenses, net of reinsurance | $ | 370,549 | |
| | | | | | | | | | |
| | | | | | | | | | | | | | | | | | | | | | | | | | | | | |
| Insurance cyber |
| Average annual percentage payout of incurred claims by age, net of reinsurance (unaudited) |
| Year 1 | Year 2 | Year 3 | Year 4 | Year 5 | Year 6 | Year 7 | Year 8 | Year 9 | Year 10 |
| 10.6% | 24.0% | 17.1% | 17.2% | 7.7% | 5.5% | 8.1% | 7.2% | 1.9% | (0.2%) |
Insurance Professional Lines
The professional lines line of business provides directors’ and officers’ liability, errors and omissions liability, employment practices liability, fiduciary liability, crime, professional indemnity, medical malpractice and other financial insurance related covers for public and private commercial enterprises, financial institutions, not-for-profit organizations and other professional service providers. This business is predominantly written on a claims-made basis.
Typically, this line of business is anticipated to exhibit longer reporting and payment patterns than most other insurance lines of business.
AXIS CAPITAL HOLDINGS LIMITED
NOTES TO CONSOLIDATED FINANCIAL STATEMENTS
DECEMBER 31, 2024, 2023 AND 2022
8. RESERVE FOR LOSSES AND LOSS EXPENSES (CONTINUED)
| | | | | | | | | | | | | | | | | | | | | | | | | | | | | | | | | | | | | | |
| Insurance professional lines |
| Incurred claims and allocated claim adjustment expenses, net of reinsurance | At December 31, 2024 |
| For the years ended December 31, | Total of incurred-but-not-reported liabilities plus expected development on reported claims | Cumulative number of reported claims |
| Accident year | 2015 unaudited | 2016 unaudited | 2017 unaudited | 2018 unaudited | 2019 unaudited | 2020 unaudited | 2021 unaudited | 2022 unaudited | 2023 unaudited | 2024 |
| 2015 | $ | 308,206 | | $ | 308,832 | | $ | 315,378 | | $ | 301,759 | | $ | 288,635 | | $ | 271,774 | | $ | 270,615 | | $ | 281,645 | | $ | 280,054 | | $ | 285,261 | | $ | 12,111 | | 9,662 |
| 2016 | | 287,119 | | 291,739 | | 295,992 | | 314,273 | | 326,544 | | 336,376 | | 337,725 | | 354,094 | | 359,445 | | 21,448 | | 10,949 |
| 2017 | | | 336,606 | | 339,010 | | 371,856 | | 372,365 | | 388,467 | | 386,243 | | 390,818 | | 395,866 | | 37,337 | | 12,966 |
| 2018 | | | | 323,638 | | 339,960 | | 388,834 | | 419,568 | | 445,299 | | 464,430 | | 467,834 | | 32,176 | | 15,537 |
| 2019 | | | | | 345,193 | | 360,720 | | 375,361 | | 408,326 | | 455,966 | | 466,546 | | 74,818 | | 14,793 |
| 2020 | | | | | | 320,300 | | 318,886 | | 299,016 | | 290,925 | | 292,430 | | 92,856 | | 9,634 |
| 2021 | | | | | | | 375,982 | | 366,527 | | 323,579 | | 320,376 | | 157,986 | | 8,656 |
| 2022 | | | | | | | | 457,637 | | 443,592 | | 437,668 | | 297,452 | | 8,740 |
| 2023 | | | | | | | | | 438,129 | | 440,324 | | 335,563 | | 10,252 |
| 2024 | | | | | | | | | | 488,514 | | 459,342 | | 7,556 |
| | | | | | | | | Total | $ | 3,954,264 | | | |
| | | | | | | | | | | | |
| | | | | | | | | | | | | | | | | | | | | | | | | | | | | | | | |
| Insurance professional lines |
| Cumulative paid claims and allocated claim adjustment expenses, net of reinsurance |
| For the years ended December 31, |
| Accident year | 2015 unaudited | 2016 unaudited | 2017 unaudited | 2018 unaudited | 2019 unaudited | 2020 unaudited | 2021 unaudited | 2022 unaudited | 2023 unaudited | 2024 |
| 2015 | $ | 14,128 | | $ | 51,028 | | $ | 110,043 | | $ | 138,151 | | $ | 169,386 | | $ | 199,105 | | $ | 211,577 | | $ | 223,040 | | $ | 247,794 | | $ | 253,620 | |
| 2016 | | 14,341 | | 65,656 | | 130,951 | | 171,190 | | 209,142 | | 233,400 | | 274,502 | | 288,796 | | 315,673 | |
| 2017 | | | 11,401 | | 51,055 | | 107,721 | | 165,829 | | 196,246 | | 266,159 | | 287,549 | | 313,285 | |
| 2018 | | | | 18,147 | | 74,121 | | 141,470 | | 203,168 | | 263,460 | | 333,899 | | 380,200 | |
| 2019 | | | | | 24,714 | | 75,980 | | 132,159 | | 204,491 | | 287,110 | | 333,147 | |
| 2020 | | | | | | 8,542 | | 43,600 | | 96,537 | | 124,128 | | 168,911 | |
| 2021 | | | | | | | 9,677 | | 38,157 | | 82,947 | | 126,636 | |
| 2022 | | | | | | | | 10,815 | | 45,645 | | 100,835 | |
| 2023 | | | | | | | | | 12,057 | | 55,586 | |
| 2024 | | | | | | | | | | 15,815 | |
| Total | 2,063,708 | |
| |
| All outstanding liabilities before 2015, net of reinsurance | 143,974 | |
| |
| Liabilities for claims and claim adjustment expenses, net of reinsurance | $ | 2,034,530 | |
| | | | | | | | | | |
AXIS CAPITAL HOLDINGS LIMITED
NOTES TO CONSOLIDATED FINANCIAL STATEMENTS
DECEMBER 31, 2024, 2023 AND 2022
8. RESERVE FOR LOSSES AND LOSS EXPENSES (CONTINUED)
| | | | | | | | | | | | | | | | | | | | | | | | | | | | | |
| Insurance professional lines |
| Average annual percentage payout of incurred claims by age, net of reinsurance (unaudited) |
| Year 1 | Year 2 | Year 3 | Year 4 | Year 5 | Year 6 | Year 7 | Year 8 | Year 9 | Year 10 |
| 3.5% | 11.0% | 15.5% | 12.5% | 12.5% | 12.0% | 7.8% | 4.8% | 8.1% | 2.0% |
Insurance Credit and Political Risk
The credit and political risk line of business provides credit and political risk insurance products for banks, commodity traders, corporations and multilateral and export credit agencies. Cover is provided for a range of risks including sovereign and corporate credit default, political violence, currency inconvertibility and non-transfer, expropriation, aircraft non-repossession and contract frustration due to political events. Surety bonds are also provided to large corporate and commercial clients and to mid to large sized construction clients.
The credit insurance coverage is primarily for lenders seeking to mitigate the risk of non-payment from their borrowers. In order to claim compensation under a credit insurance contract, the insured (most often a bank) cannot assign, without the Company's prior agreement, the insured contract (most often a loan) to any third-party and is normally obliged to hold a material portion of insured asset on their books, unhedged and uninsured. Claims for this business tend to be characterized by their severity risk, as opposed to their frequency risk.
Given the nature of the business, under the notification provisions of credit insurance policies issued by the Company, it anticipates being advised of an insured event within a relatively short time period. Consequently, the Company generally estimates ultimate losses based on a contract-by-contract analysis which considers the contracts’ terms, the facts and circumstances of underlying loss events and qualitative input from claims managers. Despite notification, credit and political risk claim reporting and payment patterns are anticipated to be volatile and can take longer to develop due to the complex nature of claims and the potential additional time that may be required to realize subrogation assets.
| | | | | | | | | | | | | | | | | | | | | | | | | | | | | | | | | | | | | | |
| Insurance credit and political risk |
| Incurred claims and allocated claim adjustment expenses, net of reinsurance | At December 31, 2024 |
| For the years ended December 31, | Total of incurred-but-not-reported liabilities plus expected development on reported claims | Cumulative number of reported claims |
| Accident year | 2015 unaudited | 2016 unaudited | 2017 unaudited | 2018 unaudited | 2019 unaudited | 2020 unaudited | 2021 unaudited | 2022 unaudited | 2023 unaudited | 2024 |
| 2015 | $ | 30,329 | | $ | 30,368 | | $ | 27,524 | | $ | 26,012 | | $ | 25,930 | | $ | 24,851 | | $ | 24,189 | | $ | 23,309 | | $ | 23,309 | | $ | 23,309 | | $ | — | | 2 |
| 2016 | | 43,327 | | 45,899 | | 43,409 | | 43,980 | | 27,766 | | 26,785 | | 25,705 | | 25,705 | | 25,703 | | (2) | | 2 |
| 2017 | | | 47,743 | | 32,467 | | 25,783 | | 18,118 | | 15,867 | | 10,904 | | 8,404 | | 7,744 | | 3,167 | | 4 |
| 2018 | | | | 42,339 | | 33,166 | | 32,057 | | 24,093 | | 20,464 | | 23,774 | | 24,379 | | 5,084 | | 2 |
| 2019 | | | | | 52,570 | | 80,386 | | 75,270 | | 73,703 | | 70,922 | | 69,499 | | 10,431 | | 33 |
| 2020 | | | | | | 60,857 | | 69,650 | | 60,212 | | 49,018 | | 47,927 | | 18,124 | | 44 |
| 2021 | | | | | | | 42,063 | | 36,817 | | 26,140 | | 26,769 | | 12,908 | | 24 |
| 2022 | | | | | | | | 45,035 | | 44,078 | | 43,030 | | 34,088 | | 27 |
| 2023 | | | | | | | | | 58,702 | | 59,525 | | 40,167 | | 31 |
| 2024 | | | | | | | | | | 71,968 | | 67,838 | | 20 |
| | | | | | | | | Total | $ | 399,853 | | | |
| | | | | | | | | | | | |
AXIS CAPITAL HOLDINGS LIMITED
NOTES TO CONSOLIDATED FINANCIAL STATEMENTS
DECEMBER 31, 2024, 2023 AND 2022
8. RESERVE FOR LOSSES AND LOSS EXPENSES (CONTINUED)
| | | | | | | | | | | | | | | | | | | | | | | | | | | | | | | | |
| Insurance credit and political risk |
| Cumulative paid claims and allocated claim adjustment expenses, net of reinsurance |
| For the years ended December 31, |
| Accident year | 2015 unaudited | 2016 unaudited | 2017 unaudited | 2018 unaudited | 2019 unaudited | 2020 unaudited | 2021 unaudited | 2022 unaudited | 2023 unaudited | 2024 |
| 2015 | $ | — | | $ | 23,309 | | $ | 23,309 | | $ | 23,309 | | $ | 23,309 | | $ | 23,309 | | $ | 23,309 | | $ | 23,309 | | $ | 23,309 | | $ | 23,309 | |
| 2016 | | — | | 25,705 | | 25,705 | | 25,705 | | 25,705 | | 25,705 | | 25,705 | | 25,705 | | 25,705 | |
| 2017 | | | 397 | | 3,985 | | 9,138 | | 11,573 | | 10,786 | | 10,237 | | 8,514 | | 5,940 | |
| 2018 | | | | 5,327 | | 13,300 | | 15,299 | | 11,376 | | 19,486 | | 23,362 | | 22,928 | |
| 2019 | | | | | 15,859 | | 46,227 | | 53,489 | | 56,682 | | 54,747 | | 53,948 | |
| 2020 | | | | | | 9,416 | | 88,017 | | 55,084 | | 50,349 | | 50,018 | |
| 2021 | | | | | | | 2,769 | | (378) | | 8,207 | | 12,683 | |
| 2022 | | | | | | | | 2,798 | | 8,096 | | 7,007 | |
| 2023 | | | | | | | | | 2,738 | | 16,261 | |
| 2024 | | | | | | | | | | 4,019 | |
| Total | 221,818 | |
| |
| All outstanding liabilities before 2015, net of reinsurance | 5,977 | |
| |
| Liabilities for claims and claim adjustment expenses, net of reinsurance | $ | 184,012 | |
| | | | | | | | | | |
| | | | | | | | | | | | | | | | | | | | | | | | | | | | | |
| Insurance credit and political risk |
| Average annual percentage payout of incurred claims by age, net of reinsurance (unaudited) |
| Year 1 | Year 2 | Year 3 | Year 4 | Year 5 | Year 6 | Year 7 | Year 8 | Year 9 | Year 10 |
| 9.6% | 56.7% | 5.8% | 3.8% | 3.3% | 1.5% | (6.0%) | (11.1%) | —% | —% |
Insurance Liability
The liability line of business primarily targets primary and low to mid-level excess and umbrella commercial liability, and environmental liability risks in the U.S. wholesale markets in addition to primary and excess of loss employers, public, and products liability business predominately in the U.K. Target industry sectors include construction, manufacturing, transportation and trucking and other services.
Typically, this line of business is anticipated to exhibit longer claim reporting and payment patterns than most other insurance lines of business and claims are often reported and ultimately paid or settled years, or even decades, after the related loss events occur.
AXIS CAPITAL HOLDINGS LIMITED
NOTES TO CONSOLIDATED FINANCIAL STATEMENTS
DECEMBER 31, 2024, 2023 AND 2022
8. RESERVE FOR LOSSES AND LOSS EXPENSES (CONTINUED)
| | | | | | | | | | | | | | | | | | | | | | | | | | | | | | | | | | | | | | |
| Insurance liability |
| Incurred claims and allocated claim adjustment expenses, net of reinsurance | At December 31, 2024 |
| For the years ended December 31, | Total of incurred-but-not-reported liabilities plus expected development on reported claims | Cumulative number of reported claims |
| Accident year | 2015 unaudited | 2016 unaudited | 2017 unaudited | 2018 unaudited | 2019 unaudited | 2020 unaudited | 2021 unaudited | 2022 unaudited | 2023 unaudited | 2024 |
| 2015 | $ | 128,433 | | $ | 127,087 | | $ | 137,188 | | $ | 164,685 | | $ | 182,354 | | $ | 187,650 | | $ | 186,575 | | $ | 187,816 | | $ | 189,335 | | $ | 194,101 | | $ | 21,585 | | 6,886 |
| 2016 | | 124,296 | | 130,074 | | 128,697 | | 127,257 | | 119,989 | | 119,993 | | 125,396 | | 124,751 | | 124,707 | | 11,666 | | 7,755 |
| 2017 | | | 166,690 | | 165,181 | | 183,687 | | 199,054 | | 203,242 | | 213,374 | | 249,403 | | 247,666 | | 27,690 | | 8,903 |
| 2018 | | | | 166,951 | | 167,040 | | 189,916 | | 203,849 | | 215,235 | | 250,910 | | 258,462 | | 34,684 | | 8,731 |
| 2019 | | | | | 191,681 | | 192,509 | | 221,935 | | 236,977 | | 299,503 | | 300,576 | | 42,047 | | 8,398 |
| 2020 | | | | | | 223,954 | | 224,321 | | 230,122 | | 248,412 | | 245,534 | | 54,701 | | 6,408 |
| 2021 | | | | | | | 231,577 | | 244,781 | | 301,010 | | 292,933 | | 75,781 | | 7,246 |
| 2022 | | | | | | | | 322,623 | | 356,752 | | 357,079 | | 162,714 | | 8,258 |
| 2023 | | | | | | | | | 363,821 | | 360,192 | | 255,535 | | 7,085 |
| 2024 | | | | | | | | | | 379,635 | | 351,221 | | 3,727 |
| | | | | | | | | Total | $ | 2,760,885 | | | |
| | | | | | | | | | | | |
| | | | | | | | | | | | | | | | | | | | | | | | | | | | | | | | |
| Insurance liability |
| Cumulative paid claims and allocated claim adjustment expenses, net of reinsurance |
| For the years ended December 31, |
| Accident year | 2015 unaudited | 2016 unaudited | 2017 unaudited | 2018 unaudited | 2019 unaudited | 2020 unaudited | 2021 unaudited | 2022 unaudited | 2023 unaudited | 2024 |
| 2015 | $ | 5,436 | | $ | 22,200 | | $ | 39,394 | | $ | 92,350 | | $ | 119,836 | | $ | 140,484 | | $ | 150,293 | | $ | 158,595 | | $ | 162,235 | | $ | 166,225 | |
| 2016 | | 6,299 | | 23,211 | | 36,317 | | 56,319 | | 66,157 | | 79,396 | | 95,615 | | 102,588 | | 106,095 | |
| 2017 | | | 5,354 | | 29,185 | | 58,560 | | 114,856 | | 142,497 | | 167,554 | | 189,184 | | 201,124 | |
| 2018 | | | | 9,252 | | 34,843 | | 72,057 | | 118,847 | | 158,255 | | 188,416 | | 200,368 | |
| 2019 | | | | | 7,787 | | 39,694 | | 83,412 | | 138,666 | | 191,870 | | 223,818 | |
| 2020 | | | | | | 8,129 | | 25,094 | | 75,733 | | 118,034 | | 155,974 | |
| 2021 | | | | | | | 13,384 | | 51,736 | | 103,537 | | 166,205 | |
| 2022 | | | | | | | | 13,191 | | 53,365 | | 124,788 | |
| 2023 | | | | | | | | | 9,829 | | 54,318 | |
| 2024 | | | | | | | | | | 12,241 | |
| Total | 1,411,156 | |
| |
| All outstanding liabilities before 2015, net of reinsurance | 59,273 | |
| |
| Liabilities for claims and claim adjustment expenses, net of reinsurance | $ | 1,409,002 | |
| | | | | | | | | | |
AXIS CAPITAL HOLDINGS LIMITED
NOTES TO CONSOLIDATED FINANCIAL STATEMENTS
DECEMBER 31, 2024, 2023 AND 2022
8. RESERVE FOR LOSSES AND LOSS EXPENSES (CONTINUED)
| | | | | | | | | | | | | | | | | | | | | | | | | | | | | |
| Insurance liability |
| Average annual percentage payout of incurred claims by age, net of reinsurance (unaudited) |
| Year 1 | Year 2 | Year 3 | Year 4 | Year 5 | Year 6 | Year 7 | Year 8 | Year 9 | Year 10 |
| 3.4% | 10.7% | 14.8% | 20.2% | 13.6% | 10.7% | 7.9% | 4.9% | 2.4% | 2.1% |
Reinsurance Segment
The presentation of net incurred and paid claims development tables by accident year for the reinsurance segment is challenging due to the need to allocate loss information related to proportional treaties to the appropriate accident years. Information related to proportional treaty reinsurance contracts is generally submitted to the Company via quarterly bordereaux reporting by underwriting year, with a supplemental listing of large losses. Large losses can be allocated to the corresponding accident years accurately. The remaining losses can generally only be allocated to accident years based on estimated premiums earned and loss reporting patterns. To the extent management’s assumptions and allocation procedures differ from the actual loss development patterns, the actual loss development may differ materially from the net incurred and paid claims development presented in the tables below.
The reporting of cumulative claims frequency for the lines of business within the reinsurance segment is deemed to be impracticable as the information necessary to provide cumulative claims frequency for these lines of business is not available to the Company.
Reinsurance Accident and Health
The accident and health line of business includes personal accident, specialty health, accidental death, travel, life and disability reinsurance products which are offered on a proportional and catastrophic or per life excess of loss basis.
In general, reporting and payment patterns are relatively short although they can be volatile due to the incidence of catastrophe events.
| | | | | | | | | | | | | | | | | | | | | | | | | | | | | | | | | | | | |
| Reinsurance accident and health | | |
| Incurred claims and allocated claim adjustment expenses, net of reinsurance | December 31, 2024 | |
| For the years ended December 31, | Total of incurred-but-not-reported liabilities plus expected development on reported claims | |
| Accident Year | 2015 unaudited | 2016 unaudited | 2017 unaudited | 2018 unaudited | 2019 unaudited | 2020 unaudited | 2021 unaudited | 2022 unaudited | 2023 unaudited | 2024 | |
| 2015 | $ | 93,754 | | $ | 100,350 | | $ | 93,862 | | $ | 93,627 | | $ | 92,906 | | $ | 93,243 | | $ | 92,251 | | $ | 92,221 | | $ | 92,966 | | $ | 92,914 | | $ | 84 | | |
| 2016 | | 170,604 | | 191,077 | | 188,189 | | 189,806 | | 189,280 | | 190,290 | | 190,190 | | 190,319 | | 190,971 | | 655 | | |
| 2017 | | | 183,761 | | 189,292 | | 183,173 | | 182,013 | | 183,023 | | 182,973 | | 181,916 | | 182,326 | | 384 | | |
| 2018 | | | | 193,622 | | 200,151 | | 197,880 | | 200,611 | | 199,949 | | 196,940 | | 197,152 | | 1,119 | | |
| 2019 | | | | | 217,364 | | 211,873 | | 207,308 | | 204,907 | | 198,928 | | 199,155 | | 1,108 | | |
| 2020 | | | | | | 226,693 | | 220,449 | | 213,245 | | 199,261 | | 198,843 | | 504 | | |
| 2021 | | | | | | | 231,917 | | 226,777 | | 222,084 | | 218,106 | | 3,442 | | |
| 2022 | | | | | | | | 267,051 | | 262,981 | | 256,577 | | 19,738 | | |
| 2023 | | | | | | | | | 242,835 | | 251,034 | | 43,093 | | |
| 2024 | | | | | | | | | | 215,960 | | 77,080 | | |
| | | | | | | | | Total | $ | 2,003,038 | | | |
| | | | | | | | | | | | |
AXIS CAPITAL HOLDINGS LIMITED
NOTES TO CONSOLIDATED FINANCIAL STATEMENTS
DECEMBER 31, 2024, 2023 AND 2022
8. RESERVE FOR LOSSES AND LOSS EXPENSES (CONTINUED)
| | | | | | | | | | | | | | | | | | | | | | | | | | | | | | | | |
| Reinsurance accident and health |
| Cumulative paid claims and allocated claim adjustment expenses, net of reinsurance |
| For the years ended December 31, |
| Accident Year | 2015 unaudited | 2016 unaudited | 2017 unaudited | 2018 unaudited | 2019 unaudited | 2020 unaudited | 2021 unaudited | 2022 unaudited | 2023 unaudited | 2024 |
| 2015 | $ | 23,392 | | $ | 77,212 | | $ | 88,583 | | $ | 91,789 | | $ | 91,895 | | $ | 92,362 | | $ | 93,787 | | $ | 93,599 | | $ | 92,328 | | $ | 92,314 | |
| 2016 | | 50,017 | | 149,814 | | 180,891 | | 187,052 | | 189,036 | | 188,632 | | 189,558 | | 189,146 | | 189,131 | |
| 2017 | | | 79,215 | | 156,941 | | 171,794 | | 178,569 | | 179,075 | | 179,725 | | 179,491 | | 179,715 | |
| 2018 | | | | 72,826 | | 164,972 | | 191,414 | | 190,959 | | 194,064 | | 194,539 | | 194,680 | |
| 2019 | | | | | 67,755 | | 169,294 | | 195,595 | | 196,317 | | 194,411 | | 199,235 | |
| 2020 | | | | | | 81,783 | | 171,822 | | 210,093 | | 191,899 | | 192,168 | |
| 2021 | | | | | | | 68,549 | | 179,195 | | 209,615 | | 212,355 | |
| 2022 | | | | | | | | 101,488 | | 213,363 | | 234,448 | |
| 2023 | | | | | | | | | 130,720 | | 199,466 | |
| 2024 | | | | | | | | | | 123,147 | |
| Total | 1,816,659 | |
| |
| All outstanding liabilities before 2015, net of reinsurance | 1,291 | |
| |
| Liabilities for claims and claim adjustment expenses, net of reinsurance | $ | 187,670 | |
| | | | | | | | | | |
| | | | | | | | | | | | | | | | | | | | | | | | | | | | | |
| Reinsurance accident and health |
| Average annual percentage payout of incurred claims by age, net of reinsurance (unaudited) |
| Year 1 | Year 2 | Year 3 | Year 4 | Year 5 | Year 6 | Year 7 | Year 8 | Year 9 | Year 10 |
| 38.7% | 46.4% | 13.1% | 0.4% | 0.4% | 0.7% | 0.5% | (0.1%) | (0.7%) | —% |
Reinsurance Agriculture
The agriculture line of business provides protection for risks associated with the production of food and fiber on a global basis for primary insurance companies writing multi-peril crop insurance, crop hail, and named peril covers, as well as custom risk transfer mechanisms for agricultural dependent industries with exposures to crop yield and/or price deviations. This business is written on a proportional and aggregate stop loss reinsurance basis.
In general, reporting and payment patterns are relatively short although they can be volatile due to the incidence of extreme weather events and in some territories take longer to settle due to government involvement in the loss adjustment process.
AXIS CAPITAL HOLDINGS LIMITED
NOTES TO CONSOLIDATED FINANCIAL STATEMENTS
DECEMBER 31, 2024, 2023 AND 2022
8. RESERVE FOR LOSSES AND LOSS EXPENSES (CONTINUED)
| | | | | | | | | | | | | | | | | | | | | | | | | | | | | | | | | | | |
| Reinsurance agriculture |
| Incurred claims and allocated claim adjustment expenses, net of reinsurance | December 31, 2024 |
| For the years ended December 31, | Total of incurred-but-not-reported liabilities plus expected development on reported claims |
| Accident Year | 2015 unaudited | 2016 unaudited | 2017 unaudited | 2018 unaudited | 2019 unaudited | 2020 unaudited | 2021 unaudited | 2022 unaudited | 2023 unaudited | 2024 |
| 2015 | $ | 103,144 | | $ | 95,576 | | $ | 95,321 | | $ | 95,308 | | $ | 95,314 | | $ | 95,492 | | $ | 95,476 | | $ | 95,608 | | $ | 96,225 | | $ | 96,287 | | $ | (3) | |
| 2016 | | 123,359 | | 117,045 | | 110,207 | | 108,795 | | 109,042 | | 108,219 | | 108,167 | | 108,912 | | 108,701 | | 14 | |
| 2017 | | | 151,526 | | 144,159 | | 138,274 | | 139,344 | | 138,810 | | 137,342 | | 136,483 | | 133,371 | | 36 | |
| 2018 | | | | 140,830 | | 147,182 | | 140,727 | | 140,457 | | 139,823 | | 142,610 | | 146,050 | | 399 | |
| 2019 | | | | | 182,793 | | 185,089 | | 187,599 | | 183,213 | | 182,923 | | 184,383 | | 323 | |
| 2020 | | | | | | 62,506 | | 62,636 | | 63,702 | | 61,801 | | 59,833 | | 153 | |
| 2021 | | | | | | | 69,694 | | 61,057 | | 57,608 | | 56,784 | | 3,740 | |
| 2022 | | | | | | | | 101,001 | | 91,299 | | 90,378 | | 3,573 | |
| 2023 | | | | | | | | | 103,003 | | 104,308 | | 45,157 | |
| 2024 | | | | | | | | | | 90,163 | | 82,981 | |
| | | | | | | | | Total | $ | 1,070,258 | | |
| | | | | | | | | | | |
| | | | | | | | | | | | | | | | | | | | | | | | | | | | | | | | |
| Reinsurance agriculture |
| Cumulative paid claims and allocated claim adjustment expenses, net of reinsurance |
| For the years ended December 31, |
| Accident Year | 2015 unaudited | 2016 unaudited | 2017 unaudited | 2018 unaudited | 2019 unaudited | 2020 unaudited | 2021 unaudited | 2022 unaudited | 2023 unaudited | 2024 |
| 2015 | $ | 1,716 | | $ | 65,845 | | $ | 92,954 | | $ | 94,511 | | $ | 94,848 | | $ | 95,442 | | $ | 95,431 | | $ | 95,586 | | $ | 96,198 | | $ | 96,237 | |
| 2016 | | 9,489 | | 61,772 | | 107,559 | | 109,092 | | 108,564 | | 108,324 | | 108,364 | | 108,915 | | 108,609 | |
| 2017 | | | 7,444 | | 124,429 | | 137,338 | | 138,468 | | 137,308 | | 137,255 | | 136,431 | | 133,133 | |
| 2018 | | | | 5,115 | | 127,449 | | 135,514 | | 141,607 | | 138,233 | | 143,905 | | 144,073 | |
| 2019 | | | | | 28,854 | | 154,426 | | 174,094 | | 178,098 | | 177,587 | | 179,673 | |
| 2020 | | | | | | 17,454 | | 47,254 | | 54,101 | | 55,182 | | 55,589 | |
| 2021 | | | | | | | 2,952 | | 32,715 | | 45,895 | | 48,518 | |
| 2022 | | | | | | | | 15,344 | | 55,371 | | 75,383 | |
| 2023 | | | | | | | | | 14,591 | | 47,580 | |
| 2024 | | | | | | | | | | 3,654 | |
| Total | 892,449 | |
| |
| All outstanding liabilities before 2015, net of reinsurance | 162 | |
| |
| Liabilities for claims and claim adjustment expenses, net of reinsurance | $ | 177,971 | |
| | | | | | | | | | |
AXIS CAPITAL HOLDINGS LIMITED
NOTES TO CONSOLIDATED FINANCIAL STATEMENTS
DECEMBER 31, 2024, 2023 AND 2022
8. RESERVE FOR LOSSES AND LOSS EXPENSES (CONTINUED)
| | | | | | | | | | | | | | | | | | | | | | | | | | | | | |
| Reinsurance agriculture |
| Average annual percentage payout of incurred claims by age, net of reinsurance (unaudited) |
| Year 1 | Year 2 | Year 3 | Year 4 | Year 5 | Year 6 | Year 7 | Year 8 | Year 9 | Year 10 |
| 10.5% | 59.2% | 19.1% | 2.4% | (0.5%) | 1.1% | (0.1%) | (0.6%) | 0.2% | —% |
Reinsurance Marine and Aviation
The marine line of business includes specialty marine exposures such as cargo, hull, pleasure craft, marine liability, inland marine and offshore energy. The principal perils covered by policies in this portfolio include physical loss, damage and/or liability arising from natural perils of the seas or land, man-made events including fire and explosion, stranding/sinking/salvage, pollution, shipowners and maritime employers liability. This business is written on a non-proportional and proportional basis.
The aviation line of business provides cover for airline, aerospace and general aviation exposures. This business is written on a proportional and non-proportional basis. The Company exited Aviation business effective January 1, 2023.
Losses arising from marine and aviation lines of business are generally reported quickly with the exception of marine and aviation liability claims which tend to exhibit longer reporting and payment patterns as claims involve passengers and third parties.
| | | | | | | | | | | | | | | | | | | | | | | | | | | | | | | | | | | |
| Reinsurance marine and aviation |
| Incurred claims and allocated claim adjustment expenses, net of reinsurance | December 31, 2024 |
| For the years ended December 31, | Total of incurred-but-not-reported liabilities plus expected development on reported claims |
| Accident Year | 2015 unaudited | 2016 unaudited | 2017 unaudited | 2018 unaudited | 2019 unaudited | 2020 unaudited | 2021 unaudited | 2022 unaudited | 2023 unaudited | 2024 |
| 2015 | $ | 10,360 | | $ | 9,193 | | $ | 10,777 | | $ | 14,938 | | $ | 12,589 | | $ | 12,220 | | $ | 11,986 | | $ | 11,937 | | $ | 11,993 | | $ | 11,964 | | $ | 441 | |
| 2016 | | 32,111 | | 34,714 | | 35,092 | | 36,486 | | 34,982 | | 35,309 | | 35,715 | | 35,208 | | 35,920 | | 131 | |
| 2017 | | | 54,853 | | 42,541 | | 40,935 | | 46,176 | | 42,787 | | 40,443 | | 40,366 | | 41,445 | | 78 | |
| 2018 | | | | 18,797 | | 27,331 | | 26,877 | | 43,264 | | 46,729 | | 48,103 | | 47,392 | | 1,198 | |
| 2019 | | | | | 69,487 | | 81,921 | | 79,650 | | 81,494 | | 84,590 | | 86,262 | | 4,059 | |
| 2020 | | | | | | 40,006 | | 41,273 | | 37,298 | | 36,464 | | 37,990 | | 1,803 | |
| 2021 | | | | | | | 43,366 | | 40,438 | | 35,108 | | 38,786 | | 1,642 | |
| 2022 | | | | | | | | 68,401 | | 58,762 | | 49,649 | | 17,062 | |
| 2023 | | | | | | | | | 40,526 | | 37,916 | | 20,892 | |
| 2024 | | | | | | | | | | 48,826 | | 41,877 | |
| | | | | | | | | Total | $ | 436,150 | | |
| | | | | | | | | | | |
AXIS CAPITAL HOLDINGS LIMITED
NOTES TO CONSOLIDATED FINANCIAL STATEMENTS
DECEMBER 31, 2024, 2023 AND 2022
8. RESERVE FOR LOSSES AND LOSS EXPENSES (CONTINUED)
| | | | | | | | | | | | | | | | | | | | | | | | | | | | | | | | |
| Reinsurance marine and aviation |
| Cumulative paid claims and allocated claim adjustment expenses, net of reinsurance |
| For the years ended December 31, |
| Accident Year | 2015 unaudited | 2016 unaudited | 2017 unaudited | 2018 unaudited | 2019 unaudited | 2020 unaudited | 2021 unaudited | 2022 unaudited | 2023 unaudited | 2024 |
| 2015 | $ | 416 | | $ | 2,646 | | $ | 6,417 | | $ | 8,620 | | $ | 10,177 | | $ | 10,972 | | $ | 10,798 | | $ | 10,879 | | $ | 11,012 | | $ | 11,274 | |
| 2016 | | 2,626 | | 18,704 | | 25,747 | | 29,664 | | 32,375 | | 33,422 | | 34,013 | | 34,223 | | 34,605 | |
| 2017 | | | 2,674 | | 23,370 | | 28,664 | | 33,578 | | 36,600 | | 36,708 | | 37,610 | | 39,064 | |
| 2018 | | | | 1,776 | | 10,815 | | 24,223 | | 30,639 | | 34,252 | | 37,601 | | 39,599 | |
| 2019 | | | | | 10,672 | | 27,031 | | 34,246 | | 52,675 | | 67,673 | | 72,288 | |
| 2020 | | | | | | 3,983 | | 16,455 | | 23,525 | | 29,316 | | 32,332 | |
| 2021 | | | | | | | 5,407 | | 12,160 | | 20,118 | | 27,671 | |
| 2022 | | | | | | | | 7,732 | | 18,402 | | 24,732 | |
| 2023 | | | | | | | | | 1,472 | | 6,902 | |
| 2024 | | | | | | | | | | 2,045 | |
| Total | 290,512 | |
| |
| All outstanding liabilities before 2015, net of reinsurance | 3,706 | |
| |
| Liabilities for claims and claim adjustment expenses, net of reinsurance | $ | 149,344 | |
| | | | | | | | | | |
| | | | | | | | | | | | | | | | | | | | | | | | | | | | | |
| Reinsurance marine and aviation |
| Average annual percentage payout of incurred claims by age, net of reinsurance (unaudited) |
| Year 1 | Year 2 | Year 3 | Year 4 | Year 5 | Year 6 | Year 7 | Year 8 | Year 9 | Year 10 |
| 8.2% | 26.4% | 19.1% | 15.8% | 10.1% | 4.4% | 1.6% | 1.6% | 1.1% | 2.2% |
Reinsurance Professional Lines
The professional lines line of business provides protection for directors' and officers' liability, employment practices liability, medical malpractice, professional indemnity, cyber, and miscellaneous errors and omissions insurance risks. The underlying business is predominantly written on a claims-made basis. This business is written on a proportional and excess of loss basis.
Typically, this line of business is anticipated to exhibit longer claim reporting and payment patterns than most other reinsurance lines of business.
AXIS CAPITAL HOLDINGS LIMITED
NOTES TO CONSOLIDATED FINANCIAL STATEMENTS
DECEMBER 31, 2024, 2023 AND 2022
8. RESERVE FOR LOSSES AND LOSS EXPENSES (CONTINUED)
| | | | | | | | | | | | | | | | | | | | | | | | | | | | | | | | | | | |
| Reinsurance professional lines |
| Incurred claims and allocated claim adjustment expenses, net of reinsurance | At December 31, 2024 |
| For the years ended December 31, | Total of incurred-but-not-reported liabilities plus expected development on reported claims |
| Accident year | 2015 unaudited | 2016 unaudited | 2017 unaudited | 2018 unaudited | 2019 unaudited | 2020 unaudited | 2021 unaudited | 2022 unaudited | 2023 unaudited | 2024 |
| 2015 | $ | 211,361 | | $ | 211,024 | | $ | 213,232 | | $ | 223,865 | | $ | 230,444 | | $ | 227,420 | | $ | 233,925 | | $ | 239,843 | | $ | 250,896 | | $ | 250,292 | | $ | 15,211 | |
| 2016 | | 194,564 | | 195,543 | | 198,934 | | 226,305 | | 253,676 | | 253,578 | | 265,439 | | 277,105 | | 276,527 | | 18,210 | |
| 2017 | | | 154,215 | | 154,560 | | 160,679 | | 176,245 | | 185,849 | | 208,425 | | 237,237 | | 237,500 | | 27,326 | |
| 2018 | | | | 144,599 | | 146,713 | | 153,514 | | 164,134 | | 172,179 | | 193,077 | | 190,588 | | (677) | |
| 2019 | | | | | 135,866 | | 135,003 | | 138,634 | | 143,617 | | 154,826 | | 149,984 | | 15,699 | |
| 2020 | | | | | | 138,881 | | 138,846 | | 133,815 | | 131,679 | | 135,632 | | 55,500 | |
| 2021 | | | | | | | 147,464 | | 139,462 | | 134,870 | | 135,793 | | 77,868 | |
| 2022 | | | | | | | | 168,535 | | 152,352 | | 152,014 | | 99,800 | |
| 2023 | | | | | | | | | 135,093 | | 135,427 | | 106,522 | |
| 2024 | | | | | | | | | | 106,558 | | 96,010 | |
| | | | | | | | | Total | $ | 1,770,315 | | |
| | | | | | | | | | | |
| | | | | | | | | | | | | | | | | | | | | | | | | | | | | | | | |
| Reinsurance professional lines |
| Cumulative paid claims and allocated claim adjustment expenses, net of reinsurance |
| For the years ended December 31, |
| Accident year | 2015 unaudited | 2016 unaudited | 2017 unaudited | 2018 unaudited | 2019 unaudited | 2020 unaudited | 2021 unaudited | 2022 unaudited | 2023 unaudited | 2024 |
| 2015 | $ | 3,134 | | $ | 13,502 | | $ | 41,440 | | $ | 79,127 | | $ | 111,504 | | $ | 131,185 | | $ | 151,960 | | $ | 169,894 | | $ | 183,371 | | $ | 199,230 | |
| 2016 | | 1,752 | | 20,397 | | 52,347 | | 94,682 | | 124,288 | | 152,878 | | 180,296 | | 201,985 | | 222,284 | |
| 2017 | | | 2,812 | | 14,746 | | 39,723 | | 62,483 | | 88,279 | | 115,586 | | 136,560 | | 165,728 | |
| 2018 | | | | 273 | | 2,495 | | 30,964 | | 56,426 | | 81,129 | | 112,549 | | 137,940 | |
| 2019 | | | | | 362 | | 13,463 | | 33,104 | | 52,368 | | 74,942 | | 97,450 | |
| 2020 | | | | | | 3,820 | | 13,773 | | 26,460 | | 40,009 | | 57,776 | |
| 2021 | | | | | | | 4,337 | | 11,320 | | 22,453 | | 38,523 | |
| 2022 | | | | | | | | 3,233 | | 11,684 | | 28,924 | |
| 2023 | | | | | | | | | 3,452 | | 12,388 | |
| 2024 | | | | | | | | | | 2,962 | |
| Total | 963,205 | |
| |
| All outstanding liabilities before 2015, net of reinsurance | 136,065 | |
| |
| Liabilities for claims and claim adjustment expenses, net of reinsurance | $ | 943,175 | |
| | | | | | | | | | |
AXIS CAPITAL HOLDINGS LIMITED
NOTES TO CONSOLIDATED FINANCIAL STATEMENTS
DECEMBER 31, 2024, 2023 AND 2022
8. RESERVE FOR LOSSES AND LOSS EXPENSES (CONTINUED)
| | | | | | | | | | | | | | | | | | | | | | | | | | | | | |
| Reinsurance professional lines |
| Average annual percentage payout of incurred claims by age, net of reinsurance (unaudited) |
| Year 1 | Year 2 | Year 3 | Year 4 | Year 5 | Year 6 | Year 7 | Year 8 | Year 9 | Year 10 |
| 1.7% | 5.6% | 11.3% | 12.6% | 12.6% | 12.2% | 10.1% | 9.1% | 6.4% | 6.3% |
Reinsurance Credit and Surety
The credit and surety line of business which provides protection for trade credit insurance and credit and political risk insurance. Trade credit insurance protects sellers of goods and services in the event of a non-payment by the buyer of those goods and services. Credit and political risk insurance covers a range of risks predominantly corporate and sovereign non-payment. Surety reinsurance provides protection for losses arising from a broad array of surety bonds issued by insurers to satisfy regulatory demands, contract, and commercial obligations in a variety of jurisdictions around the world. Mortgage reinsurance is provided to mortgage guaranty insurers, U.S. government-sponsored entities and other mortgage participants. These entities seek to manage their credit risk exposure emanating from defined pools of mortgage loans.
Initial and most recent underwriting year loss projections are generally based on the ELR Method, with consideration given to qualitative factors. Given that there is a quicker and more stable reporting pattern for trade credit and mortgage business, the Company generally commences the transition to experience-based methods sooner for these lines of business than for surety business.
| | | | | | | | | | | | | | | | | | | | | | | | | | | | | | | | | | | |
| Reinsurance credit and surety |
| Incurred claims and allocated claim adjustment expenses, net of reinsurance | At December 31, 2024 |
| For the years ended December 31, | Total of incurred-but-not-reported liabilities plus expected development on reported claims |
| Accident year | 2015 unaudited | 2016 unaudited | 2017 unaudited | 2018 unaudited | 2019 unaudited | 2020 unaudited | 2021 unaudited | 2022 unaudited | 2023 unaudited | 2024 |
| 2015 | $ | 156,256 | | $ | 159,662 | | $ | 154,425 | | $ | 150,883 | | $ | 132,750 | | $ | 133,679 | | $ | 134,817 | | $ | 129,441 | | $ | 125,761 | | $ | 125,755 | | $ | 1,361 | |
| 2016 | | 138,199 | | 136,760 | | 144,405 | | 119,427 | | 112,113 | | 109,778 | | 107,428 | | 109,579 | | 111,169 | | 592 | |
| 2017 | | | 135,014 | | 128,141 | | 122,255 | | 113,551 | | 111,099 | | 110,948 | | 111,360 | | 110,277 | | 2,239 | |
| 2018 | | | | 108,874 | | 115,673 | | 109,266 | | 106,339 | | 101,044 | | 87,774 | | 87,535 | | 3,276 | |
| 2019 | | | | | 72,245 | | 64,952 | | 64,711 | | 62,649 | | 54,467 | | 54,501 | | 3,369 | |
| 2020 | | | | | | 76,156 | | 82,568 | | 68,240 | | 94,044 | | 89,395 | | 13,239 | |
| 2021 | | | | | | | 51,523 | | 43,356 | | 40,832 | | 41,061 | | 13,639 | |
| 2022 | | | | | | | | 63,310 | | 50,474 | | 50,203 | | 30,771 | |
| 2023 | | | | | | | | | 85,730 | | 85,451 | | 45,993 | |
| 2024 | | | | | | | | | | 79,933 | | 54,383 | |
| | | | | | | | | Total | $ | 835,280 | | |
| | | | | | | | | | | |
AXIS CAPITAL HOLDINGS LIMITED
NOTES TO CONSOLIDATED FINANCIAL STATEMENTS
DECEMBER 31, 2024, 2023 AND 2022
8. RESERVE FOR LOSSES AND LOSS EXPENSES (CONTINUED)
| | | | | | | | | | | | | | | | | | | | | | | | | | | | | | | | |
| Reinsurance credit and surety |
| Cumulative paid claims and allocated claim adjustment expenses, net of reinsurance |
| For the years ended December 31, |
| Accident year | 2015 unaudited | 2016 unaudited | 2017 unaudited | 2018 unaudited | 2019 unaudited | 2020 unaudited | 2021 unaudited | 2022 unaudited | 2023 unaudited | 2024 |
| 2015 | $ | 32,721 | | $ | 78,814 | | $ | 95,640 | | $ | 111,972 | | $ | 113,904 | | $ | 117,515 | | $ | 118,370 | | $ | 117,224 | | $ | 114,711 | | $ | 115,099 | |
| 2016 | | 41,639 | | 70,896 | | 88,974 | | 98,411 | | 99,415 | | 97,926 | | 97,638 | | 99,762 | | 99,527 | |
| 2017 | | | 37,018 | | 71,362 | | 87,088 | | 98,480 | | 96,569 | | 99,473 | | 100,308 | | 100,954 | |
| 2018 | | | | 38,619 | | 65,916 | | 69,263 | | 80,736 | | 82,379 | | 83,859 | | 84,092 | |
| 2019 | | | | | 19,163 | | 29,432 | | 42,248 | | 44,277 | | 46,442 | | 46,199 | |
| 2020 | | | | | | 25,277 | | 33,572 | | 38,972 | | 43,304 | | 48,666 | |
| 2021 | | | | | | | 4,460 | | 8,909 | | 16,768 | | 18,726 | |
| 2022 | | | | | | | | 6,845 | | 10,916 | | 13,259 | |
| 2023 | | | | | | | | | 10,314 | | 20,167 | |
| 2024 | | | | | | | | | | 11,398 | |
| Total | 558,087 | |
| |
| All outstanding liabilities before 2015, net of reinsurance | 28,849 | |
| |
| Liabilities for claims and claim adjustment expenses, net of reinsurance | $ | 306,042 | |
| | | | | | | | | | |
| | | | | | | | | | | | | | | | | | | | | | | | | | | | | |
| Reinsurance credit and surety |
| Average annual percentage payout of incurred claims by age, net of reinsurance (unaudited) |
| Year 1 | Year 2 | Year 3 | Year 4 | Year 5 | Year 6 | Year 7 | Year 8 | Year 9 | Year 10 |
| 25.6% | 20.4% | 12.6% | 8.3% | 2.1% | 1.1% | 0.4% | 0.5% | (1.1%) | 0.3% |
Reinsurance Motor
The motor line of business provides protection to insurers for motor liability and motor property damage losses arising out of any one occurrence. A loss occurrence can involve one or many claimants where the ceding insurer aggregates the claims from the occurrence. The Company offers traditional non-proportional and proportional reinsurance as well as structured solutions predominantly relating to European exposures.
The motor non-proportional business consists of standard excess of loss contracts written for cedants in several European countries with most of the premium related to two major markets, U.K. and France. Since 2009/2010, an increasing number of large bodily injury settlements in the U.K. market were settled using indexed annuities (Periodical Payment Orders "PPOs"). This led to a materially longer development tail on the older accident years for the U.K. non-proportional motor book. This also resulted in the inclusion of capitalization clauses on a number of U.K. motor treaties which allow reinsurers to settle claims arising under PPOs with a lump sum payment, to help mitigate the lengthening of the development tail on more recent accident years.
In 2017, the U.K. Ministry of Justice announced a decrease in the discount rate to be used to calculate lump sum awards in U.K. bodily injury cases, known as the Ogden Rate. Effective March 20, 2017, the Ogden rate changed from plus 2.5% to minus 0.75%. This resulted in a trend toward a lower number of claims settlements using PPOs and an increase in projected ultimate losses, particularly related to recent accident years.
Effective August 5, 2019, the Ogden rate changed from minus 0.75% to minus 0.25%. This resulted in a decrease in projected ultimate losses, particularly related to recent accident years.
AXIS CAPITAL HOLDINGS LIMITED
NOTES TO CONSOLIDATED FINANCIAL STATEMENTS
DECEMBER 31, 2024, 2023 AND 2022
8. RESERVE FOR LOSSES AND LOSS EXPENSES (CONTINUED)
The motor proportional business generally has a shorter reported and payment pattern, relative to the motor non-proportional business.
| | | | | | | | | | | | | | | | | | | | | | | | | | | | | | | | | | | |
| Reinsurance motor |
| Incurred claims and allocated claim adjustment expenses, net of reinsurance | At December 31, 2024 |
| For the years ended December 31, | Total of incurred-but-not-reported liabilities plus expected development on reported claims |
| Accident year | 2015 unaudited | 2016 unaudited | 2017 unaudited | 2018 unaudited | 2019 unaudited | 2020 unaudited | 2021 unaudited | 2022 unaudited | 2023 unaudited | 2024 |
| 2015 | $ | 215,985 | | $ | 208,783 | | $ | 212,699 | | $ | 214,510 | | $ | 204,009 | | $ | 203,169 | | $ | 200,453 | | $ | 200,843 | | $ | 199,519 | | $ | 199,471 | | $ | 10,658 | |
| 2016 | | 239,098 | | 252,847 | | 254,013 | | 244,592 | | 236,810 | | 234,357 | | 238,113 | | 238,717 | | 238,942 | | 1,903 | |
| 2017 | | | 353,883 | | 358,716 | | 347,805 | | 348,494 | | 349,584 | | 344,966 | | 351,598 | | 351,699 | | 21,818 | |
| 2018 | | | | 348,090 | | 343,752 | | 354,625 | | 351,594 | | 339,260 | | 351,737 | | 350,894 | | 17,085 | |
| 2019 | | | | | 331,840 | | 330,204 | | 330,904 | | 321,798 | | 326,641 | | 326,155 | | 7,574 | |
| 2020 | | | | | | 209,930 | | 212,344 | | 208,823 | | 192,333 | | 192,990 | | 7,877 | |
| 2021 | | | | | | | 176,116 | | 176,135 | | 178,461 | | 178,561 | | 22,550 | |
| 2022 | | | | | | | | 154,073 | | 166,810 | | 158,097 | | 24,177 | |
| 2023 | | | | | | | | | 121,411 | | 128,732 | | 23,925 | |
| 2024 | | | | | | | | | | 84,425 | | 50,610 | |
| | | | | | | | | Total | $ | 2,209,966 | | |
| | | | | | | | | | | |
| | | | | | | | | | | | | | | | | | | | | | | | | | | | | | | | |
| Reinsurance motor |
| Cumulative paid claims and allocated claim adjustment expenses, net of reinsurance |
| For the years ended December 31, |
| Accident year | 2015 unaudited | 2016 unaudited | 2017 unaudited | 2018 unaudited | 2019 unaudited | 2020 unaudited | 2021 unaudited | 2022 unaudited | 2023 unaudited | 2024 |
| 2015 | $ | 57,035 | | $ | 90,219 | | $ | 109,330 | | $ | 126,014 | | $ | 141,391 | | $ | 141,761 | | $ | 164,226 | | $ | 169,228 | | $ | 171,272 | | $ | 175,513 | |
| 2016 | | 60,117 | | 101,425 | | 124,192 | | 141,526 | | 153,840 | | 177,453 | | 184,773 | | 193,160 | | 202,406 | |
| 2017 | | | 71,292 | | 130,330 | | 159,573 | | 193,899 | | 215,552 | | 238,380 | | 256,263 | | 266,624 | |
| 2018 | | | | 83,155 | | 138,377 | | 201,610 | | 210,849 | | 234,853 | | 254,645 | | 273,683 | |
| 2019 | | | | | 89,950 | | 182,006 | | 198,344 | | 219,950 | | 238,617 | | 257,423 | |
| 2020 | | | | | | 43,468 | | 94,350 | | 113,316 | | 125,200 | | 134,082 | |
| 2021 | | | | | | | 41,657 | | 74,997 | | 92,381 | | 104,602 | |
| 2022 | | | | | | | | 35,075 | | 51,509 | | 63,668 | |
| 2023 | | | | | | | | | 25,966 | | 44,970 | |
| 2024 | | | | | | | | | | 15,114 | |
| Total | 1,538,085 | |
| |
| All outstanding liabilities before 2015, net of reinsurance | 262,566 | |
| |
| Liabilities for claims and claim adjustment expenses, net of reinsurance | $ | 934,447 | |
| | | | | | | | | | |
AXIS CAPITAL HOLDINGS LIMITED
NOTES TO CONSOLIDATED FINANCIAL STATEMENTS
DECEMBER 31, 2024, 2023 AND 2022
8. RESERVE FOR LOSSES AND LOSS EXPENSES (CONTINUED)
| | | | | | | | | | | | | | | | | | | | | | | | | | | | | |
| Reinsurance motor |
| Average annual percentage payout of incurred claims by age, net of reinsurance (unaudited) |
| Year 1 | Year 2 | Year 3 | Year 4 | Year 5 | Year 6 | Year 7 | Year 8 | Year 9 | Year 10 |
| 23.2% | 18.3% | 9.7% | 6.8% | 6.0% | 5.6% | 6.2% | 3.0% | 2.5% | 2.1% |
Reinsurance Liability
The liability line of business provides protection to insurers of admitted casualty business, excess and surplus lines casualty business and specialty casualty programs. The primary focus of the underlying business is general liability, workers' compensation, auto liability, environmental liability, and excess casualty.
Typically, this line of business is anticipated to exhibit longer claim reporting and payment patterns than most other reinsurance lines of business and claims are often reported and ultimately paid or settled years, or even decades, after the related loss events occur.
| | | | | | | | | | | | | | | | | | | | | | | | | | | | | | | | | | | |
| Reinsurance liability |
| Incurred claims and allocated claim adjustment expenses, net of reinsurance | At December 31, 2024 |
| For the years ended December 31, | Total of incurred-but-not-reported liabilities plus expected development on reported claims |
| Accident year | 2015 unaudited | 2016 unaudited | 2017 unaudited | 2018 unaudited | 2019 unaudited | 2020 unaudited | 2021 unaudited | 2022 unaudited | 2023 unaudited | 2024 |
| 2015 | $ | 213,111 | | $ | 213,356 | | $ | 214,303 | | $ | 214,193 | | $ | 212,052 | | $ | 212,453 | | $ | 202,266 | | $ | 205,170 | | $ | 215,869 | | $ | 215,609 | | $ | 12,588 | |
| 2016 | | 238,237 | | 243,345 | | 248,154 | | 251,425 | | 260,727 | | 264,490 | | 271,912 | | 311,876 | | 313,766 | | 30,063 | |
| 2017 | | | 273,121 | | 267,788 | | 276,627 | | 285,245 | | 294,535 | | 303,916 | | 339,798 | | 338,776 | | 25,655 | |
| 2018 | | | | 262,170 | | 266,567 | | 271,505 | | 284,659 | | 304,407 | | 349,520 | | 349,317 | | 47,871 | |
| 2019 | | | | | 262,105 | | 270,541 | | 272,501 | | 271,351 | | 329,313 | | 334,773 | | 82,959 | |
| 2020 | | | | | | 282,298 | | 282,700 | | 277,534 | | 303,976 | | 307,787 | | 104,900 | |
| 2021 | | | | | | | 302,849 | | 310,334 | | 343,399 | | 334,588 | | 139,743 | |
| 2022 | | | | | | | | 346,756 | | 341,727 | | 334,639 | | 165,420 | |
| 2023 | | | | | | | | | 273,950 | | 273,571 | | 170,489 | |
| 2024 | | | | | | | | | | 247,866 | | 217,212 | |
| | | | | | | | | Total | $ | 3,050,692 | | |
| | | | | | | | | | | |
AXIS CAPITAL HOLDINGS LIMITED
NOTES TO CONSOLIDATED FINANCIAL STATEMENTS
DECEMBER 31, 2024, 2023 AND 2022
8. RESERVE FOR LOSSES AND LOSS EXPENSES (CONTINUED)
| | | | | | | | | | | | | | | | | | | | | | | | | | | | | | | | |
| Reinsurance liability |
| Cumulative paid claims and allocated claim adjustment expenses, net of reinsurance |
| For the years ended December 31, |
| Accident year | 2015 unaudited | 2016 unaudited | 2017 unaudited | 2018 unaudited | 2019 unaudited | 2020 unaudited | 2021 unaudited | 2022 unaudited | 2023 unaudited | 2024 |
| 2015 | $ | 7,266 | | $ | 27,432 | | $ | 54,372 | | $ | 80,691 | | $ | 108,548 | | $ | 130,417 | | $ | 141,135 | | $ | 151,506 | | $ | 166,279 | | $ | 178,276 | |
| 2016 | | 11,837 | | 37,527 | | 69,136 | | 111,165 | | 142,074 | | 165,531 | | 188,319 | | 215,185 | | 234,297 | |
| 2017 | | | 12,394 | | 41,984 | | 78,240 | | 120,145 | | 157,920 | | 192,427 | | 223,321 | | 250,245 | |
| 2018 | | | | 19,352 | | 49,673 | | 84,839 | | 127,457 | | 165,827 | | 206,294 | | 244,159 | |
| 2019 | | | | | 19,288 | | 45,132 | | 79,439 | | 119,854 | | 158,542 | | 201,377 | |
| 2020 | | | | | | 16,930 | | 48,916 | | 82,113 | | 119,248 | | 152,616 | |
| 2021 | | | | | | | 10,882 | | 58,253 | | 98,671 | | 145,566 | |
| 2022 | | | | | | | | 18,024 | | 51,960 | | 102,346 | |
| 2023 | | | | | | | | | 14,979 | | 45,121 | |
| 2024 | | | | | | | | | | 13,368 | |
| Total | 1,567,371 | |
| |
| All outstanding liabilities before 2015, net of reinsurance | 127,910 | |
| |
| Liabilities for claims and claim adjustment expenses, net of reinsurance | $ | 1,611,231 | |
| | | | | | | | | | |
| | | | | | | | | | | | | | | | | | | | | | | | | | | | | |
| Reinsurance liability |
| Average annual percentage payout of incurred claims by age, net of reinsurance (unaudited) |
| Year 1 | Year 2 | Year 3 | Year 4 | Year 5 | Year 6 | Year 7 | Year 8 | Year 9 | Year 10 |
| 4.7% | 9.8% | 11.5% | 12.6% | 11.2% | 10.4% | 8.1% | 7.1% | 6.5% | 5.6% |
Reinsurance Run-off lines
Run-off lines include catastrophe, property, and engineering lines of business.
The catastrophe line of business provides protection for most catastrophic losses that are covered in the underlying insurance policies written by the Company's cedants. The underlying policies principally cover property-related exposures but other exposures including worker's compensation and personal accident are also covered. The principal perils covered by policies in this portfolio include hurricane and windstorm, earthquake, flood, tornado, hail and fire. In some instances, terrorism may be a covered peril or the only peril. This business is written on a proportional and an excess of loss basis. The Company exited this line of business in June 2022.
The property line of business provides protection for property damage and related losses resulting from natural and man-made perils that are covered in underlying personal and commercial lines insurance policies written by the Company's cedants. The predominant exposure is to property damage, but other risks, including business interruption and other non-property losses, may also be covered when arising from a covered peril. The most significant perils covered by policies in this portfolio include windstorm, tornado and earthquake, but other perils such as freezes, riots, flood, industrial explosions, fire, hail and a number of other loss events are also included. This business is written on a proportional and excess of loss basis. The Company exited this line of business in June 2022.
AXIS CAPITAL HOLDINGS LIMITED
NOTES TO CONSOLIDATED FINANCIAL STATEMENTS
DECEMBER 31, 2024, 2023 AND 2022
8. RESERVE FOR LOSSES AND LOSS EXPENSES (CONTINUED)
The engineering line of business provides protection for all types of construction risks and risks associated with erection, testing and commissioning of machinery and plants during the construction stage. This line of business also includes cover for losses arising from operational failures of machinery, plant and equipment, and electronic equipment as well as business interruption. The Company exited this line of business in 2020.
In general, reporting and payment patterns are relatively short although they can be volatile due to the incidence of catastrophe events. Losses from engineering exposures tend to develop slower than the other reinsurance run-off lines of business.
| | | | | | | | | | | | | | | | | | | | | | | | | | | | | | | | | | | |
| Reinsurance run-off |
| Incurred claims and allocated claim adjustment expenses, net of reinsurance | At December 31, 2024 |
| For the years ended December 31, | Total of incurred-but-not-reported liabilities plus expected development on reported claims |
| Accident year | 2015 unaudited | 2016 unaudited | 2017 unaudited | 2018 unaudited | 2019 unaudited | 2020 unaudited | 2021 unaudited | 2022 unaudited | 2023 unaudited | 2024 |
| 2015 | $ | 264,343 | | $ | 252,265 | | $ | 252,266 | | $ | 243,094 | | $ | 241,916 | | $ | 246,713 | | $ | 244,566 | | $ | 242,674 | | $ | 240,289 | | $ | 240,152 | | $ | 1,636 | |
| 2016 | | 278,963 | | 277,871 | | 275,202 | | 269,952 | | 273,294 | | 273,472 | | 273,184 | | 266,307 | | 265,991 | | 3,048 | |
| 2017 | | | 701,995 | | 702,732 | | 743,852 | | 744,427 | | 742,270 | | 733,045 | | 725,458 | | 729,636 | | 23,633 | |
| 2018 | | | | 518,635 | | 603,305 | | 617,932 | | 603,972 | | 589,801 | | 589,927 | | 587,086 | | 14,977 | |
| 2019 | | | | | 431,902 | | 407,538 | | 387,635 | | 372,883 | | 366,152 | | 368,869 | | 14,143 | |
| 2020 | | | | | | 509,942 | | 538,067 | | 533,206 | | 537,210 | | 533,431 | | 31,778 | |
| 2021 | | | | | | | 419,674 | | 427,037 | | 422,974 | | 421,678 | | 28,832 | |
| 2022 | | | | | | | | 260,346 | | 218,849 | | 221,806 | | 43,059 | |
| 2023 | | | | | | | | | 63,904 | | 60,979 | | 21,860 | |
| 2024 | | | | | | | | | | 28,826 | | 7,873 | |
| | | | | | | | | Total | $ | 3,458,454 | | |
| | | | | | | | | | | |
AXIS CAPITAL HOLDINGS LIMITED
NOTES TO CONSOLIDATED FINANCIAL STATEMENTS
DECEMBER 31, 2024, 2023 AND 2022
8. RESERVE FOR LOSSES AND LOSS EXPENSES (CONTINUED)
| | | | | | | | | | | | | | | | | | | | | | | | | | | | | | | | |
| Reinsurance run-off |
| Cumulative paid claims and allocated claim adjustment expenses, net of reinsurance |
| For the years ended December 31, |
| Accident year | 2015 unaudited | 2016 unaudited | 2017 unaudited | 2018 unaudited | 2019 unaudited | 2020 unaudited | 2021 unaudited | 2022 unaudited | 2023 unaudited | 2024 |
| 2015 | $ | 46,281 | | $ | 117,515 | | $ | 175,420 | | $ | 200,069 | | $ | 210,135 | | $ | 214,446 | | $ | 228,479 | | $ | 230,094 | | $ | 231,029 | | $ | 232,580 | |
| 2016 | | 63,381 | | 137,032 | | 195,162 | | 225,752 | | 239,689 | | 246,337 | | 251,662 | | 250,127 | | 252,695 | |
| 2017 | | | 163,739 | | 419,762 | | 533,804 | | 591,946 | | 615,721 | | 650,897 | | 661,617 | | 672,949 | |
| 2018 | | | | 116,822 | | 326,092 | | 419,373 | | 471,002 | | 517,408 | | 538,362 | | 546,510 | |
| 2019 | | | | | 55,275 | | 199,958 | | 256,712 | | 291,464 | | 315,548 | | 329,517 | |
| 2020 | | | | | | 104,927 | | 234,874 | | 316,569 | | 383,462 | | 429,759 | |
| 2021 | | | | | | | 87,733 | | 230,145 | | 292,521 | | 341,460 | |
| 2022 | | | | | | | | 49,727 | | 101,413 | | 133,777 | |
| 2023 | | | | | | | | | 22,862 | | 29,381 | |
| 2024 | | | | | | | | | | 11,372 | |
| Total | 2,980,000 | |
| |
| All outstanding liabilities before 2015, net of reinsurance | 38,605 | |
| |
| Liabilities for claims and claim adjustment expenses, net of reinsurance | $ | 517,059 | |
| | | | | | | | | | |
| | | | | | | | | | | | | | | | | | | | | | | | | | | | | |
| Reinsurance run-off |
| Average annual percentage payout of incurred claims by age, net of reinsurance (unaudited) |
| Year 1 | Year 2 | Year 3 | Year 4 | Year 5 | Year 6 | Year 7 | Year 8 | Year 9 | Year 10 |
| 24.0% | 28.8% | 17.2% | 10.3% | 6.0% | 3.3% | 2.7% | 0.6% | 0.7% | 0.6% |
AXIS CAPITAL HOLDINGS LIMITED
NOTES TO CONSOLIDATED FINANCIAL STATEMENTS
DECEMBER 31, 2024, 2023 AND 2022
8. RESERVE FOR LOSSES AND LOSS EXPENSES (CONTINUED)
Reconciliation of Loss Development Tables to Consolidated Balance Sheet
The following table reconciles the reserve for losses and loss expenses at December 31, 2024, included in the loss development tables to the reserve for losses and loss expenses reported in the consolidated balance sheet:
| | | | | | | | | | | | | | | | | | | | |
Reconciliation of the disclosure of incurred and paid claims development to the liability
for unpaid claims and claim adjustment expenses |
| | |
| | At December 31, 2024 |
| | Net outstanding liabilities | | Reinsurance recoverable on unpaid claims | | Gross outstanding liabilities |
| | | | | | |
| Insurance segment | | | | | | |
| Property | | $ | 810,674 | | | $ | 476,362 | | | $ | 1,287,036 | |
| Accident and health | | 134,285 | | | 9,565 | | | 143,850 | |
| Marine and aviation | | 795,884 | | | 348,062 | | | 1,143,946 | |
| Cyber | | 370,549 | | | 455,301 | | | 825,850 | |
| Professional lines | | 2,034,530 | | | 1,365,043 | | | 3,399,573 | |
| Credit and political risk | | 184,012 | | | 35,302 | | | 219,314 | |
| Liability | | 1,409,002 | | | 2,106,520 | | | 3,515,522 | |
| Total insurance segment | | 5,738,936 | | | 4,796,155 | | | 10,535,091 | |
| | | | | | |
| Reinsurance segment | | | | | | |
| Accident and health | | 187,670 | | | 61,724 | | | 249,394 | |
| Agriculture | | 177,971 | | | 10,917 | | | 188,888 | |
| Marine and aviation | | 149,344 | | | 26,273 | | | 175,617 | |
| Professional lines | | 943,175 | | | 440,572 | | | 1,383,747 | |
| Credit and surety | | 306,042 | | | 132,474 | | | 438,516 | |
| Motor | | 934,447 | | | 352,438 | | | 1,286,885 | |
| Liability | | 1,611,231 | | | 813,796 | | | 2,425,027 | |
| Run-off lines | | 517,059 | | | 206,548 | | | 723,607 | |
| Total reinsurance segment | | 4,826,939 | | | 2,044,742 | | | 6,871,681 | |
| | | | | | |
| | | | | | |
| Total | | $ | 10,565,875 | | | $ | 6,840,897 | | | 17,406,772 | |
| Unallocated claims adjustment expenses | | | | | | 212,623 | |
Foreign exchange and other(1) | | | | | | (10,992) | |
| Ceded reserves related to retroactive transactions | | | | | | (389,474) | |
| | | | | | |
| Total liability for unpaid claims and claims adjustment expense | | | | | | $ | 17,218,929 | |
| | | | | | |
(1) Non-U.S. dollar denominated loss data is converted to U.S dollar at the rates of exchange in effect at the balance sheet date for material underlying currencies. Fluctuations in currency exchange rates may cause material shifts in loss development. Reserves for losses and loss expenses disclosed in the consolidated balance sheets are also remeasured using rates of exchange in effect at the balance sheet date.
AXIS CAPITAL HOLDINGS LIMITED
NOTES TO CONSOLIDATED FINANCIAL STATEMENTS
DECEMBER 31, 2024, 2023 AND 2022
9. REINSURANCE
In the normal course of business, the Company purchases facultative and treaty reinsurance protection to limit ultimate losses and reduce loss aggregation risk.
Facultative reinsurance provides cover for all or a portion of the losses incurred for a single policy and the Company separately negotiates each facultative contract.
Treaty reinsurance provides cover for a specified type or category of risks. The Company's treaty reinsurance agreements provide this cover on either an excess of loss or a proportional basis. Excess of loss covers provide a contractually set amount of coverage after a specified loss amount has been reached. These treaties can provide cover for a number of lines of business within one contract. Under proportional reinsurance, the Company cedes an agreed percentage of the premiums and the losses and loss expenses on the policies it underwrites. These treaties provide the Company with a specified percentage of coverage from the first dollar of loss.
All of these reinsurance contracts provide the Company with the right to recover a specified amount of losses and loss expenses from reinsurers. To the extent that reinsurers do not meet their obligations under these agreements due to solvency issues, contractual disputes over contract language or coverage and/or other reasons, the Company remains liable.
The following table presents gross and net premiums written and earned:
| | | | | | | | | | | | | | | | | | | | | | | | | | | | | | | | | | | | | | | | | |
| | | | | | | | | | | | | |
| Year ended December 31, | 2024 | | 2023 | | 2022 | |
| | Premiums
written | | Premiums
earned | | Premiums
written | | Premiums
earned | | Premiums
written | | Premiums
earned | |
| | | | | | | | | | | | | |
| Gross | $ | 9,005,888 | | | $ | 8,529,567 | | | $ | 8,356,525 | | | $ | 7,973,577 | | | $ | 8,214,595 | | | $ | 7,936,382 | | |
| Ceded | (3,248,537) | | | (3,223,332) | | | (3,254,200) | | | (2,889,796) | | | (2,951,539) | | | (2,776,056) | | |
| Net | $ | 5,757,351 | | | $ | 5,306,235 | | | $ | 5,102,325 | | | $ | 5,083,781 | | | $ | 5,263,056 | | | $ | 5,160,326 | | |
| | | | | | | | | | | | | |
For the year ended December 31, 2024, the Company recognized ceded losses and loss expenses of $2,039 million (2023: $1,754 million; 2022: $1,754 million).
At December 31, 2024, the Company’s reinsurance recoverable on unpaid and paid losses and loss expenses was $7.4 billion (2023: $6.9 billion).
AXIS CAPITAL HOLDINGS LIMITED
NOTES TO CONSOLIDATED FINANCIAL STATEMENTS
DECEMBER 31, 2024, 2023 AND 2022
9. REINSURANCE (CONTINUED)
At December 31, 2024, the Company's allowance for expected credit losses to be recognized over the life of the Company’s reinsurance recoverables balance was $43 million (2023: $37 million; 2022: $31 million).
The following table provides a reconciliation of the beginning and ending balances of the allowance for expected credit losses related to the Company’s reinsurance recoverable balance:
| | | | | | | | | | | | | | | | | |
| | | | | |
| Year ended December 31, | 2024 | | 2023 | |
| | | | | |
| Beginning balance | $ | 36,611 | | | $ | 30,715 | | |
| Increase (decrease) in allowance for expected credit losses | 6,834 | | | 5,896 | | |
| Ending Balance | $ | 43,445 | | | $ | 36,611 | | |
| | | | | |
Loss Portfolio Transfer Reinsurance Agreement
On December 13, 2024, the Company entered into a loss portfolio transfer reinsurance agreement with Cavello Bay Reinsurance Limited, a wholly-owned subsidiary of Enstar Group Limited ("Enstar") to retrocede a portfolio of reinsurance business predominantly related to 2021 and prior underwriting years (refer to Note 18 'Related Party Transactions'). The transaction is subject to regulatory approvals and other customary conditions and is expected to close during the first half of 2025.
The transaction is structured as a 75% ground-up quota share retrocession of net reserves for losses and loss expenses of approximately $3.1 billion at September 30, 2024 and provides cover up to a policy limit of approximately $940 million. Pursuant to the LPT Agreement, the Company will maintain responsibility for claims management subject to certain administrative rights of Enstar and will enter into collateral agreements with the Reinsurer under which the Company may be obligated to maintain certain types of eligible assets as partial collateral securing the Reinsurer’s obligations with respect to the Subject Business.
The transaction is deemed to have met the established criteria for retroactive reinsurance accounting.
AXIS CAPITAL HOLDINGS LIMITED
NOTES TO CONSOLIDATED FINANCIAL STATEMENTS
DECEMBER 31, 2024, 2023 AND 2022
10. DEBT AND FINANCING ARRANGEMENTS
a) Debt
The following table summarizes the Company's debt: | | | | | | | | | | | | | | | | | |
| Year ended December 31, | 2024 | | 2023 | |
| | | | | |
| | | | | |
| 5.150% Senior Notes | $ | 246,873 | | | $ | 246,789 | | |
| 4.000% Senior Notes | 348,774 | | | 348,389 | | |
| 3.900% Senior Notes | 297,556 | | | 297,076 | | |
| Junior Subordinated Notes | 421,976 | | | 421,460 | | |
| Total Debt | $ | 1,315,179 | | | $ | 1,313,714 | | |
| | | | | |
The tables below provide the key terms of the Company's debt: | | | | | | | | | | | | | | | | | | | | | | | | | | | | | | | | | | | |
| Description | Issuance Date | | Aggregate Principal | | Issue Price | | Net Proceeds | | Maturity Date | |
| | | | | | | | | | | |
| 5.150% Senior Notes | March 13, 2014 | | $ | 250,000 | | | 99.474 | % | | $ | 246,000 | | | April 1, 2045 | |
| 4.000% Senior Notes | December 6, 2017 | | $ | 350,000 | | | 99.780 | % | | $ | 347,000 | | | December 6, 2027 | |
| 3.900% Senior Notes | June 19, 2019 | | $ | 300,000 | | | 99.360 | % | | $ | 296,000 | | | July 15, 2029 | |
| Junior Subordinated Notes | December 10, 2019 | | $ | 425,000 | | | 99.000 | % | | $ | 420,750 | | | January 15, 2040 | |
| | | | | | | | | | | |
| | | | | | | | | | | | | | | | | |
| Description | Interest Rate | | Interest Payments Due | |
| | | | | |
| 5.150% Senior Notes | 5.150 | % | | Semi-annually in arrears on April 1 and October 1 of each year | |
| 4.000% Senior Notes | 4.000 | % | | Semi-annually in arrears on June 6 and December 6 of each year | |
| 3.900% Senior Notes | 3.900 | % | | Semi-annually in arrears on January 15 and July 15 of each year | |
| Junior Subordinated Notes(1) | 4.900 | % | | Semi-annually on January 15 and July 15 of each year | |
| | | | | |
(1) The Junior Subordinated Notes accrue interest from the date of issuance to, but excluding, January 15, 2030 (the "Par Call Date") at the fixed rate of 4.900% and from, and including, the Par Call Date, at a rate equal to the Five-Year Treasury Rate as of the Reset Interest Determination Date, plus 3.186%. Interest on the Junior Notes is payable semi-annually on January 15 and July 15 of each year, beginning on July 15, 2020.
5.150% Senior Notes
The 5.150% Senior Notes are ranked as unsecured senior obligations of AXIS Specialty Finance PLC, a 100% owned finance subsidiary. AXIS Capital has fully and unconditionally guaranteed all obligations of AXIS Specialty Finance PLC under the 5.150% Senior Notes. AXIS Capital's obligations under this guarantee are unsecured senior obligations and rank equally with all other senior obligations of AXIS Capital.
4.000% Senior Notes
The 4.000% Senior Notes are ranked as unsecured senior obligations of AXIS Specialty Finance PLC, a 100% owned finance subsidiary. AXIS Capital has fully and unconditionally guaranteed all obligations of AXIS Specialty Finance PLC under the 4.000% Senior Notes. AXIS Capital's obligations under this guarantee are unsecured senior obligations and rank equally with all other senior obligations of AXIS Capital.
AXIS CAPITAL HOLDINGS LIMITED
NOTES TO CONSOLIDATED FINANCIAL STATEMENTS
DECEMBER 31, 2024, 2023 AND 2022
10. DEBT AND FINANCING ARRANGEMENTS (CONTINUED)
3.900% Senior Notes
The 3.900% Senior Notes are ranked as unsecured senior obligations of AXIS Specialty Finance LLC, a 100% owned finance subsidiary. AXIS Capital has fully and unconditionally guaranteed all obligations of AXIS Specialty Finance LLC under the 3.900% Senior Notes. AXIS Capital's obligations under this guarantee are unsecured senior obligations and rank equally with all other senior obligations of AXIS Capital.
The Company has the option to redeem the Senior Notes at any time and from time to time, in whole or in part, at a ''make-whole'' redemption price, which is equal to the greater of the aggregate principal amount or the sum of the present values of the remaining scheduled payments of principal and interest. The related indentures contain various covenants, including limitations on liens on the stock of restricted subsidiaries, restrictions as to the disposition of the stock of restricted subsidiaries and limitations on mergers and consolidations. The Company was in compliance with all the covenants contained in the indentures at December 31, 2024.
Interest expense recognized in relation to the Senior Notes includes interest payable, amortization of the offering discounts and amortization of debt offering expenses. The offering discounts and debt offering expenses are amortized over the period of time during which the Senior Notes are outstanding. For the year ended December 31, 2024, the Company incurred interest expense of $40 million (2023: $40 million, 2022: $40 million).
Junior Subordinated Notes
The 4.900% Fixed-Rate Reset Junior Notes are ranked as unsecured junior subordinated obligations of AXIS Specialty Finance LLC, a 100% owned finance subsidiary. AXIS Capital has fully and unconditionally guaranteed all obligations of AXIS Specialty Finance LLC under the Junior Notes. AXIS Capital's obligation under this guarantee is an unsecured junior subordinated obligation and ranks equally with all future unsecured junior subordinated obligations of AXIS Capital, and junior in right of payment to all outstanding and future senior obligations of AXIS Capital.
Interest expense recognized in relation to the Junior Notes includes interest payable and amortization of debt offering expenses. The debt offering expenses are amortized over the period of time during which the Junior Notes are outstanding. For the year ended December 31, 2024, the Company incurred interest expense of $21 million (2023: $21 million, 2022: $21 million).
Scheduled Debt Maturity
The following table provides the scheduled maturity of the Company's debt obligations at December 31, 2024: | | | | | | | | | | | |
| Year ended December 31, | | |
| | | |
| 2025 | $ | — | | |
| 2026 | — | | |
| 2027 | 350,000 | | |
| 2028 | — | | |
| 2029 | 300,000 | | |
| After 2029 | 675,000 | | |
| Unamortized discount and debt issuance expenses | (9,821) | | |
| Total senior notes and notes payable | $ | 1,315,179 | | |
| | | |
AXIS CAPITAL HOLDINGS LIMITED
NOTES TO CONSOLIDATED FINANCIAL STATEMENTS
DECEMBER 31, 2024, 2023 AND 2022
10. DEBT AND FINANCING ARRANGEMENTS (CONTINUED)
b) Loan Advances made to a Third Party Reinsurer
During 2024, the Company advanced $nil (2023: $102 million) to a third party reinsurer. Loans advanced in prior years are being repaid in a manner consistent with the timing of amounts due to the third party reinsurer under retrocession agreements. At December 31, 2024, $75 million (2023: $82 million) was repaid and was treated as a non-cash activity in the consolidated statement of cash flows. Loan advances made are expected to be repaid in full by February 15, 2026 (2023: February 15, 2026). The loan balance receivable at December 31, 2024, of $5 million (2023: $80 million) is included in loan advances made in the consolidated balance sheets. At December 31, 2023, the Company had committed to advance a further $26 million to the third party reinsurer. During 2024, the third party reinsurer advised the Company that this advance was no longer required.
Interest on this loan is payable at an interest rate of 5.4% (2023: interest rates between 0.8% and 4.0%). Interest of $nil (2023: $1 million) related to this loan was received in advance and is included in other liabilities in the consolidated balance sheets and was treated as a non-cash activity in the consolidated statement of cash flows.
c) Letter of Credit Facility
At December 31, 2023, certain of AXIS Capital’s operating subsidiaries (the "Participating Subsidiaries") had a $500 million letter of credit facility available from Citibank Europe plc ("Citibank") (the "$500 million Facility"), pursuant to a Master Reimbursement Agreement May 14, 2010, as amended, and Committed Letter of Credit Facility Letter dated December 18, 2015, as amended. (together, the "LOC Facility Documents").
Under the terms of the $500 million Facility, letters of credit to a maximum aggregate amount of $500 million are available for issuance on behalf of the Participating Subsidiaries. These letters of credit are principally used to support the reinsurance obligations of the Participating Subsidiaries. The $500 million Facility is subject to certain covenants, including the requirement to maintain sufficient collateral, as defined in the LOC Facility Documents to cover all of the obligations under the $500 million Facility. Such obligations include contingent reimbursement obligations for outstanding letters of credit and fees payable to Citibank. In the event of default, Citibank may exercise certain remedies, including the exercise of control over pledged collateral and the termination of the availability of the $500 million Facility to any or all of the Participating Subsidiaries.
On March 26, 2024, the $500 million Facility was amended to reduce the committed utilization capacity available under the Facility to $300 million (the "$300 million Facility"), enter into an uncommitted secured letter of credit facility with Citibank Europe plc, extend the tenors of issuable letters of credit to March 31, 2026 and make certain updates to the facility's collateral and fee arrangements.
At December 31, 2024, letters of credit outstanding under the LOC Facility were $235 million (2023: $325 million). At December 31, 2024, the Participating Subsidiaries were in compliance with all LOC Facility covenants.
AXIS CAPITAL HOLDINGS LIMITED
NOTES TO CONSOLIDATED FINANCIAL STATEMENTS
DECEMBER 31, 2024, 2023 AND 2022
11. FEDERAL HOME LOAN BANK ADVANCES
The Company's subsidiaries, AXIS Insurance Company and AXIS Surplus Insurance Company, are members of the Federal Home Loan Bank of Chicago ("FHLB").
Members may borrow from the FHLB at competitive rates subject to certain conditions. At December 31, 2024, the companies had admitted assets of approximately $3.2 billion (2023: $3.0 billion) which provides borrowing capacity of up to approximately $798 million (2023: $759 million). Conditions of membership include maintaining sufficient collateral deposits for funding, a requirement to maintain member stock at 0.4% of mortgage-related assets at December 31st of the prior year, and a requirement to purchase additional member stock of 2.0% or 4.5% of any amount borrowed.
At December 31, 2024, the Company had borrowings under the FHLB program of $66 million (2023: $86 million). On September 11, 2024, the Company repaid borrowings under the FHLB program of $10 million, at their stated maturity. On October 31, 2024, the Company repaid borrowings under the FHLB program of $9 million, at their stated maturity.
The FHLB advances have maturities in 2025 and interest payable at interest rates between 4.5% and 5.5% (2023: 5.6% and 5.9%). For the year ended December 31, 2024, the Company incurred interest expense of $4 million (2023: $5 million). The borrowings under the FHLB program are secured by cash and investments with a fair value of $72 million (2023: $95 million).
AXIS CAPITAL HOLDINGS LIMITED
NOTES TO CONSOLIDATED FINANCIAL STATEMENTS
DECEMBER 31, 2024, 2023 AND 2022
12. COMMITMENTS AND CONTINGENCIES
a) Concentrations of Credit Risk
Credit Risk Aggregation
The Company monitors and manages the aggregation of credit risk on a group-wide basis allowing it to consider exposure management strategies for individual companies, countries, regions, sectors and any other relevant inter-dependencies. The Company's credit exposures are aggregated based on the origin of risk. Credit risk aggregation is also managed through minimizing overlaps in underwriting, financing and investing activities. As part of its credit aggregation framework, the Company also assigns aggregate credit limits by country and by single counterparty (or parent of affiliated counterparties). These limits are based on and adjusted for a variety of factors including the prevailing economic environment and the nature of the underlying credit exposures.
The Company's credit aggregation measurement and reporting process is facilitated by its credit risk exposure database, which contains relevant information on counterparty details and credit risk exposures. The database is accessible by management throughout the Company, therefore providing transparency to allow for the implementation of active exposure management strategies. The Company also licenses third-party tools to provide credit risk assessments. The Company monitors all its credit aggregations and, where appropriate, adjusts its internal risk limits and/or takes specific actions to reduce our risk exposures.
The assets that potentially subject the Company to concentrations of credit risk consist principally of cash and investments, reinsurance recoverable on unpaid and paid claims, and insurance and reinsurance premiums balances receivable, as described below:
(i) Cash and Investments
In order to mitigate concentration and operational risks related to cash and cash equivalents, the Company limits the maximum amount of cash that can be deposited with a single counterparty and limits acceptable counterparties based on current rating, outlook and other relevant factors.
The Company's fixed maturities portfolio, which represents approximately $12.6 billion or 39% of its total assets, is exposed to potential losses arising from the diminished creditworthiness of issuers of bonds. The Company's investment portfolio is managed by external investment managers in accordance with its investment guidelines. The Company limits credit risk through diversification and issuer exposure limits graded by ratings and, with respect to custodians, through contractual and other legal remedies. Excluding Government and agency securities, the Company limits its concentration of credit risk to any single corporate issuer to 1% of its investment grade fixed maturities portfolio for securities rated A- or above and 0.5% of its investment grade fixed maturities portfolio for securities rated below A-.
At December 31, 2024, the Company was in compliance with these limits.
(ii) Reinsurance Recoverable on Unpaid and Paid Losses and Loss Expenses
The Company is exposed to the credit risk associated with reinsurance recoverable on unpaid and paid losses and loss expenses to the extent that any of its reinsurers fail to meet their obligations under reinsurance contracts. To help mitigate this risk, the Company's purchase of reinsurance is subject to financial security requirements specified by its Reinsurance Security Committee. This Committee maintains a list of approved reinsurers, performs credit risk assessments for potential new reinsurers, regularly monitors approved reinsurers with consideration for events which may have a material impact on their creditworthiness, recommends counterparty tolerance levels for different types of ceded business and monitors concentrations of credit risk. This assessment considers a wide range of individual attributes, including a review of the counterparty’s financial strength, industry position and other qualitative factors. Generally, the Committee requires that reinsurers who do not meet specified requirements provide collateral.
AXIS CAPITAL HOLDINGS LIMITED
NOTES TO CONSOLIDATED FINANCIAL STATEMENTS
DECEMBER 31, 2024, 2023 AND 2022
12. COMMITMENTS AND CONTINGENCIES (CONTINUED)
At December 31, 2024, the three largest balances by reinsurer accounted for 12%, 7% and 5% (2023: 14%, 9% and 4%) of reinsurance recoverable on unpaid and paid losses and loss expenses.
At December 31, 2024, amounts recoverable from reinsurers included 17% that is fully collateralized, 81% that is recoverable from reinsurers rated A- or higher by A.M. Best and 2% that is recoverable from reinsurers rated lower than A- by A.M. Best (2023: 14%, 83% and 3%, respectively).
(iii) Insurance and Reinsurance Premium Balances Receivable
The diversity of the Company's client base limits credit risk associated with its premium balances receivable. In addition, for insurance contracts the Company has contractual rights to cancel coverage for non-payment of premiums and for reinsurance contracts the Company has contractual rights to offset premium balances receivable against corresponding payments for losses and loss expenses.
Brokers and other intermediaries collect premiums from customers on behalf of the Company. The Company has procedures in place to manage and monitor credit risk from intermediaries with a focus on day-to-day monitoring of the largest positions.
These contractual rights contribute to the mitigation of credit risk, together with the monitoring of aged premium balances receivable. In light of these mitigating factors and considering that a significant portion of premium balances receivable are not currently due based on the terms of the underlying contracts, the Company does not utilize specific credit quality indicators to monitor its premium balances receivable.
At December 31, 2024, the Company’s premium balances receivable was $3 billion (2023 - $3 billion).
At December 31, 2024, the Company's allowance for expected credit losses to be recognized over the life of the Company’s premium balances receivable was $17 million (2023: $12 million). The following table provides a reconciliation of the beginning and ending balances of the allowance for expected credit losses related to the Company’s premiums balances receivable:
| | | | | | | | | | | | | | | | | |
| | | | | |
| Year ended December 31, | 2024 | | 2023 | |
| | | | | |
| Beginning balance | $ | 11,997 | | | $ | 9,521 | | |
| Increase (decrease) in allowance for expected credit losses | 5,342 | | | 2,476 | | |
| Ending balance | $ | 17,339 | | | $ | 11,997 | | |
| | | | | |
For the year ended December 31, 2024, bad debt expense was $3 million (2023: $2 million; 2022: $nil).
b) Brokers
The Company produces business through brokers.
For the year ended December 31, 2024, 2023 and 2022, three brokers accounted for 38%, 38% and 43% of gross premiums written, respectively. Aon plc accounted for 14% (2023: 15%, 2022: 17%), Marsh & McLennan Companies Inc. accounted for 14% (2023: 14%, 2022: 17%), and Arthur J. Gallagher & Co. accounted for 10% (2023: 9%, 2022: 9%).
No other broker and no single insured or reinsured accounted for more than 10% of gross premiums written in any of the last three years.
AXIS CAPITAL HOLDINGS LIMITED
NOTES TO CONSOLIDATED FINANCIAL STATEMENTS
DECEMBER 31, 2024, 2023 AND 2022
12. COMMITMENTS AND CONTINGENCIES (CONTINUED)
c) Reinsurance Purchase Commitment
In the normal course of business, the Company purchases reinsurance and retrocessional (collectively referred to as "reinsurance") protection for its insurance and reinsurance business. Minimum reinsurance premiums are contractually due in advance on a quarterly basis. At December 31, 2024, the Company had outstanding reinsurance purchase commitments of $nil (2023: $6 million due before June 2025). Actual payments under the reinsurance contracts will depend on the underlying subject premium and may exceed the minimum reinsurance premiums.
d) Legal Proceedings
From time to time, the Company is subject to routine legal proceedings, including arbitrations, arising in the ordinary course of business. These legal proceedings generally relate to claims asserted by or against the Company in the ordinary course of its insurance or reinsurance operations. Estimated amounts payable related to these proceedings are included in reserve for losses and loss expenses in the Company's consolidated balance sheets. The Company is not party to any material legal proceedings arising outside the ordinary course of business.
e) Investments
At December 31, 2024, the Company has $526 million (2023: $502 million) of unfunded investment commitments related to its other investment portfolio, which are callable by investment managers (refer to Note 5(e) 'Investments'). At December 31, 2024, the Company has $9 million (2023: $10 million) of unfunded investment commitments to purchase commercial mortgage loans and $94 million (2023: $16 million) of unfunded investment commitments to purchase corporate debt.
f) Funds at Lloyd's
The Company operates in the Lloyd’s market through its corporate members, AXIS Corporate Capital UK Limited and AXIS Corporate Capital UK II Limited. Lloyd’s sets capital requirements for corporate members annually through the application of a capital model that is based on regulatory rules pursuant to Solvency II.
The capital provided to support underwriting or FAL may be satisfied by cash, certain investments and letters of credit provided by approved banks.
At December 31, 2024, investments and cash of $883 million (2023: $893 million) were restricted to satisfy the Company's FAL requirements (refer to Note 5 'Investments' and Note 22 'Statutory Financial Information').
AXIS CAPITAL HOLDINGS LIMITED
NOTES TO CONSOLIDATED FINANCIAL STATEMENTS
DECEMBER 31, 2024, 2023 AND 2022
13. LEASES
In the ordinary course of business, the Company renews and enters into new leases for office property and equipment, which expire at various dates.
At the lease inception date, the Company assesses whether a contract is or contains a lease. At the commencement date, the Company determines the classification of each separate lease component as either a finance lease or an operating lease. The Company's leases are all currently classified as operating leases. For operating leases that have a lease term of more than 12 months, the Company recognizes a lease liability and a right-of-use asset in the Company's consolidated balance sheets at the present value of the lease payments at the lease commencement date.
At the commencement date, the Company determines lease terms by assuming the exercise of those renewal options that are deemed to be reasonably certain. The exercise of lease renewal options is at the sole discretion of the Company.
As the lease contracts generally do not provide an implicit discount rate, the Company uses its incremental borrowing rate based on information available at the commencement date to determine the present value of lease payments. The incremental borrowing rate is based on a borrowing with a term that is similar to the term of the associated lease. The Company has made an accounting policy election not to include renewal, termination, or purchase options that are not reasonably certain of exercise when determining the term of the borrowing.
The Company’s lease agreements do not contain any material residual value guarantees or material restrictive covenants.
Operating lease rentals are expensed on a straight-line basis over the life of the lease beginning on the commencement date.
The following table presents the Company’s total lease expense and the cash flows arising from lease transactions:
| | | | | | | | | | | | | | | | | | | | | | | |
| Year ended December 31, | 2024 | | 2023 | | 2022 | |
| | | | | | | |
| Lease cost: | | | | | | |
| Operating lease expense | $ | 17,273 | | $ | 21,499 | | $ | 20,611 | | |
| Short-term lease expense(1) | 781 | | 2,291 | | 813 | | |
| Sublease income(2) | (4,554) | | (4,531) | | (3,423) | | |
| Total lease expense | $ | 13,500 | | $ | 19,259 | | $ | 18,001 | | |
| | | | | | | |
| Other information: | | | | | | |
| Operating cash outflows from operating leases | $ | 17,035 | | $ | 20,190 | | | $ | 22,932 | | |
| | | | | | | |
| Right-of-use assets obtained in exchange for new operating lease liabilities(3) | $ | (3,209) | | $ | 34,988 | | | $ | 6,514 | | |
| | | | | | | |
| Weighted-average remaining lease term - operating leases(4) | 9.3 years | | 9.8 years | | 9.9 years | |
| | | | | | | |
| Weighted-average discount rate - operating lease(5) | 4.9% | | 4.4 | % | | 4.1 | % | |
(1) Short-term lease expense is recognized on a straight-line basis over the lease term.
(2) Sublease income largely relates to office properties in Chicago, Alpharetta and London.
(3) In 2024, the Company modified a lease agreement to reflect an increase in lease payments for its office property in London, terminated a lease agreement for its office property in Singapore and entered into a new lease agreement for an office property with a reduced floor in Singapore.
(4) Weighted-average remaining lease term was calculated on the basis of the remaining lease term and the lease liability balance for each lease at the reporting date.
(5) Weighted-average discount was calculated on the basis of the discount rate that was used to calculate the lease liability balance for each lease at the reporting date and the remaining balance of the lease payments for each lease at the reporting date.
AXIS CAPITAL HOLDINGS LIMITED
NOTES TO CONSOLIDATED FINANCIAL STATEMENTS
DECEMBER 31, 2024, 2023 AND 2022
13. LEASES (CONTINUED)
The following table presents the scheduled maturity of the Company's operating lease liabilities at December 31, 2024:
| | | | | | | | | | | |
| Year ended December 31, | Expected cash flows | |
| | | |
| 2025 | $ | 17,787 | | |
| 2026 | 15,181 | | |
| 2027 | 13,026 | | |
| 2028 | 12,283 | | |
| 2029 | 12,280 | | |
| Later years | 62,663 | | |
| Discount | (26,606) | | |
| Total discounted operating lease liabilities | $ | 106,614 | | |
| | | |
The following table presents the scheduled maturity of the Company's operating lease liabilities at December 31, 2023:
| | | | | | | | | | | |
| Year ended December 31, | Expected cash flows | |
| | | |
| 2024 | $ | 17,543 | | |
| 2025 | 18,122 | | |
| 2026 | 15,767 | | |
| 2027 | 13,519 | | |
| 2028 | 12,691 | | |
| Later years | 74,852 | | |
| Discount | (29,393) | | |
| Total discounted operating lease liabilities | $ | 123,101 | | |
| | | |
AXIS CAPITAL HOLDINGS LIMITED
NOTES TO CONSOLIDATED FINANCIAL STATEMENTS
DECEMBER 31, 2024, 2023 AND 2022
14. EARNINGS PER COMMON SHARE
The following table presents a comparison of earnings (loss) per common share and earnings (loss) per diluted common share: | | | | | | | | | | | | | | | | | | | | | | | |
| | | | | | | |
| At and year ended December 31, | 2024 | | 2023 | | 2022 | |
| | | | | | | |
| Earnings per common share | | | | | | |
| Net income | $ | 1,081,786 | | | $ | 376,292 | | | $ | 223,083 | | |
| | | | | | | |
| Less: Preferred share dividends | 30,250 | | | 30,250 | | | 30,250 | | |
| | | | | | | |
| Net income available to common shareholders | $ | 1,051,536 | | | $ | 346,042 | | | $ | 192,833 | | |
| Weighted average common shares outstanding | 84,165 | | | 85,142 | | | 84,864 | | |
| Earnings per common share | $ | 12.49 | | | $ | 4.06 | | | $ | 2.27 | | |
| | | | | | | |
| Earnings per diluted common share | | | | | | |
| Net income available to common shareholders | $ | 1,051,536 | | | $ | 346,042 | | | $ | 192,833 | | |
| | | | | | | |
| Weighted average common shares outstanding | 84,165 | | | 85,142 | | | 84,864 | | |
| | | | | | | |
| Share-based compensation plans | 1,011 | | | 870 | | | 805 | | |
| Weighted average diluted common shares outstanding | 85,176 | | | 86,012 | | | 85,669 | | |
| Earnings per diluted common share | $ | 12.35 | | | $ | 4.02 | | | $ | 2.25 | | |
| | | | | | | |
| Weighted average anti-dilutive shares excluded from the dilutive computation | 192 | | | 405 | | | 324 | | |
| | | | | | | |
15. SHAREHOLDERS' EQUITY
a) Common Shares
The Company's authorized share capital is 800,000,000 common shares, par value of $0.0125 per share.
The following table presents changes in common shares issued and outstanding:
| | | | | | | | | | | | | | | | | | | | | | | |
| | | | | | | |
| Year ended December 31, | 2024 | | 2023 | | 2022 | |
| | | | | | | |
| Shares issued, balance at beginning of year | 176,580 | | | 176,580 | | | 176,580 | | |
| Shares issued | — | | | — | | | — | | |
| Total shares issued at end of year | 176,580 | | | 176,580 | | | 176,580 | | |
| | | | | | | |
| Treasury shares, balance at beginning of year | (91,294) | | | (91,912) | | | (91,806) | | |
| Shares repurchased | (3,061) | | | (398) | | | (897) | | |
| Shares reissued | 759 | | | 1,016 | | | 791 | | |
| Total treasury shares at end of year | (93,596) | | | (91,294) | | | (91,912) | | |
| | | | | | | |
| Total shares outstanding | 82,984 | | | 85,286 | | | 84,668 | | |
| | | | | | | |
AXIS CAPITAL HOLDINGS LIMITED
NOTES TO CONSOLIDATED FINANCIAL STATEMENTS
DECEMBER 31, 2024, 2023 AND 2022
15. SHAREHOLDERS' EQUITY (CONTINUED)
Treasury Shares
On December 7, 2023, the Company's Board of Directors renewed its authorization for the repurchase of up to $100 million of the Company's common shares, effective January 1, 2024, through December 31, 2024. At June 30, 2024, authorization under the Company's share repurchase program approved in December 2023 was exhausted.
On May 16, 2024, the Company's Board of Directors approved a new share repurchase program for up to $300 million of the Company's common shares. The new share repurchase program is open-ended, allowing the Company to repurchase its shares from time to time in the open market or privately negotiated transactions, depending on market conditions.
The following table presents common shares repurchased from shares held in Treasury:
| | | | | | | | | | | | | | | | | | | | | | | |
| | | | | | | |
| Year ended December 31, | 2024 | | 2023 | | 2022 | |
| | | | | | | |
| In the open market: (1) | | | | | | |
| Total shares | 2,806 | | | — | | | 634 | | |
| Total cost | $ | 199,943 | | | $ | — | | | $ | 34,987 | | |
| Average price per share(2) | $ | 71.27 | | | $ | — | | | $ | 55.22 | | |
| | | | | | | |
| From employees:(3) | | | | | | |
| Total shares | 255 | | | 398 | | | 263 | | |
| Total cost | $ | 15,925 | | | $ | 23,596 | | | $ | 13,994 | | |
| Average price per share(2) | $ | 62.45 | | | $ | 59.15 | | | $ | 53.13 | | |
| | | | | | | |
| | | | | | | |
| | | | | | | |
| | | | | | | |
| | | | | | | |
| | | | | | | |
| Total shares repurchased: | | | | | | |
| Total shares | 3,061 | | | 398 | | | 897 | | |
| Total cost | $ | 215,868 | | | $ | 23,596 | | | $ | 48,981 | | |
| Average price per share(2) | $ | 70.53 | | | $ | 59.15 | | | $ | 54.61 | | |
| | | | | | | |
(1) Shares were repurchased pursuant to the Company's Board-authorized share repurchase programs.
(2) Calculated using whole numbers.
(3) Shares are repurchased from employees to satisfy personal withholding tax liabilities that arise on the vesting of share-settled restricted stock units.
b) Preferred Shares
Series E Preferred Shares
On November 7, 2016, the Company issued $550 million of 5.50% Series E preferred shares, par value $0.0125 per share, with a liquidation preference of $2,500 per share. The Company could redeem the Series E preferred shares on or after November 7, 2021 at a redemption price of $2,500 per share. Dividends on the Series E preferred shares are non-cumulative. Holders of the Series E preferred shares are entitled to receive, only when, as and if declared by the Board of Directors, non-cumulative cash dividends from the original issue date, quarterly in arrears on the fifteenth day of January, April, July and October of each year, commencing on January 15, 2017. To the extent declared, dividends accumulate, with respect to each dividend period, in an amount per share equal to 5.50% of the liquidation preference per annum.
AXIS CAPITAL HOLDINGS LIMITED
NOTES TO CONSOLIDATED FINANCIAL STATEMENTS
DECEMBER 31, 2024, 2023 AND 2022
15. SHAREHOLDERS' EQUITY (CONTINUED)
Dividends
The following table presents dividends declared and paid related to the Company's common and preferred shares:
| | | | | | | | | | | | | | | | | | | | | | | | |
| | Per share data | | |
| | Dividends declared | | Dividends paid in year of declaration | | Dividends paid in year following declaration | | |
| | | | | | | | |
| Year ended December 31, 2024 | | | | | | | |
| Common shares | $ | 1.76 | | | $ | 1.32 | | | $ | 0.44 | | | |
| Series E preferred shares | $ | 137.50 | | | $ | 103.13 | | | $ | 34.38 | | | |
| Year ended December 31, 2023 | | | | | | | |
| Common shares | $ | 1.76 | | | $ | 1.32 | | | $ | 0.44 | | | |
| Series E preferred shares | $ | 137.50 | | | $ | 103.13 | | | $ | 34.38 | | | |
| Year ended December 31, 2022 | | | | | | | |
| Common shares | $ | 1.73 | | | $ | 1.29 | | | $ | 0.44 | | | |
| | | | | | | | |
| | | | | | | | |
| Series E preferred shares | $ | 137.50 | | | $ | 103.13 | | | $ | 34.38 | | | |
| | | | | | | | |
| | | | | | | | |
| | | | | | | | |
| | | | | | | | |
| | | | | | | | |
| | | | | | | | |
| | | | | | | | |
16. RETIREMENT PLANS
The Company maintains defined contribution plans to provide retirement benefits to eligible employees. Contributions to the plans, which are managed externally, are based on eligible compensation.
For eligible U.S. employees, the Company provides a non-qualified deferred compensation plan that enables employees to make contributions to the plan that are in excess of those permitted under the Company's 401(k) Plan. In addition, employees are permitted to make additional contributions from any bonus received and to benefit from discretionary employer contribution to the Plan.
For the year ended December 31, 2024, total pension expenses were $35 million (2023: $35 million and 2022: $34 million) for the above retirement benefit.
AXIS CAPITAL HOLDINGS LIMITED
NOTES TO CONSOLIDATED FINANCIAL STATEMENTS
DECEMBER 31, 2024, 2023 AND 2022
17. SHARE-BASED COMPENSATION
In May 2017, shareholders approved the establishment of the AXIS Capital Holdings Limited 2017 Long-Term Equity Compensation Plan (the "2017 Plan"). The 2017 Plan provides for, among other things, the issuance of restricted shares, restricted stock units (share-settled awards and cash-settled awards), performance units (share-settled awards and cash-settled
awards), stock options, stock appreciation rights and other equity-based awards to the Company's employees and directors.
The 2017 Plan authorizes the issuance of a total of 3,400,000 common shares. On May 7, 2021, at the Annual General Meeting of Shareholders of the Company, the Company’s shareholders approved an amendment to the Company’s 2017 Plan to increase by 1,600,000 the number of common shares authorized for issuance under the Plan. On May 4, 2023, at the Annual General Meeting of Shareholders of the Company, the Company’s shareholders approved an amendment to the Company’s 2017 Plan to increase by 1,125,000 the number of common shares authorized for issuance under the Plan.
At December 31, 2024, 2,473,947 equity-based awards remained available for grant pursuant to the 2017 Plan.
Restricted Stock Units - Share-Settled
The grant date fair value of share-settled restricted stock units granted pursuant to the 2017 Plan is established at the fair market value of the Company's common shares at the date of grant. These awards either cliff vest at the end of a three year period, vest in accordance with a three year graded vesting schedule in three annual installments beginning on the grant date, or vest in accordance with a four year graded vesting schedule in four annual installments beginning on the grant date.
Restricted Stock Units - Cash-Settled
The grant date fair value of cash-settled restricted stock units granted pursuant to the 2017 Plan is established at the fair market value of the Company's common shares at the date of grant. These awards are liability awards and generally cliff vest at the end of a three year period, or vest in accordance with a four year graded vesting schedule in four annual installments beginning on the grant date.
Performance Restricted Stock Units - Share-Settled
Performance restricted stock units granted pursuant to the 2017 Plan represent the right to receive a specified number of common shares in the future, based on the achievement of established performance criteria and continued service during the applicable performance period.
The grant date fair value of performance restricted stock units granted subsequent to 2021 with a market condition were measured on the grant date using a Monte Carlo simulation model. The grant date fair value of performance restricted stock units granted in 2024 with a performance condition was determined based on the closing price of the Company's common shares on the grant date.
Awards granted pursuant to the 2017 Plan generally cliff vest at the end of a three year period. Compensation expense is recognized on a straight-line basis over the applicable requisite service period.
Acceleration Provisions
Grants provided under the 2017 Plan generally allow for accelerated vesting provisions on the employee’s death, permanent disability, or certain terminations following a change in control of the Company occurring within two years of the change in control event. Notwithstanding these vesting provisions, the Compensation Committee of the Company's Board of Directors has broad authority to accelerate vesting at its discretion.
AXIS CAPITAL HOLDINGS LIMITED
NOTES TO CONSOLIDATED FINANCIAL STATEMENTS
DECEMBER 31, 2024, 2023 AND 2022
17. SHARE-BASED COMPENSATION (CONTINUED)
Retirement Plan
In 2016, the Company established the AXIS Executive Restricted Stock Unit Retirement Plan (the "Plan") to reward certain eligible long-term employees of the Company for their dedicated service. The Plan was implemented in 2017. Subject to certain conditions being met, eligible employees do not forfeit all of their outstanding share-settled restricted stock units, share-settled performance restricted stock units or cash-settled restricted stock units on or following their retirement. Absent the Plan, outstanding restricted stock units are generally forfeited on termination of employment.
a) Performance Restricted Stock Units
Performance Restricted Stock Units granted in 2024, 2023 and 2022 with a market condition
Certain share-settled performance restricted stock units granted in 2024, and share-settled performance restricted stock units granted in 2023 and 2022 include a market condition which is the Company’s total shareholder return relative to its peer group ("Relative TSR") over the performance period. Relative TSR is calculated in accordance with the terms of the applicable award agreement. If performance goals are achieved, these awards will cliff vest at the end of a three-year performance period within a range of 0% to 200% of target.
Performance Restricted Stock Units granted in 2024 with a performance condition
Certain share-settled performance restricted stock units granted in 2024 include a performance condition which is the Company’s average annual growth in book value per diluted common share, plus accumulated dividends over the performance period, adjusted to exclude unrealized investment gains (losses) recognized in accumulated other comprehensive income (loss), and share repurchases during the performance period ("Adjusted DBVPS"). Adjusted DBVPS is calculated in accordance with the terms of the applicable award agreement. If performance goals are achieved, these awards will cliff vest at the end of a three-year performance period within a range of 0% to 200% of target.
Performance Restricted Stock Units granted in the three months ended March 31, 2023 in relation to senior leadership transition
Share-settled performance restricted stock units granted in the three months ended March 31, 2023 to one senior leader include a market condition which is the Company’s total shareholder return relative to its peer group ("Relative TSR") over the performance period. Relative TSR is calculated in accordance with the terms of the applicable award agreement. If performance goals are achieved, 50% of these awards will vest at the end of a one-year performance period, and the remaining 50% of these awards will vest at the end of a three-year vest period within a range of 0% to 200% of target.
Performance Restricted Stock Units granted in the three months ended June 30, 3023 in relation to senior leadership transition
Share-settled performance restricted stock units granted in the three months ended June 30, 2023 to one senior leader include a market condition which is the Company’s total shareholder return's compound annual growth rate ("TSR CAGR") over the performance period. TSR CAGR is calculated in accordance with the terms of the applicable award agreement. If performance goals are achieved, these awards will cliff vest at the end of a three-year performance period within a range of 0% to 200% of target.
AXIS CAPITAL HOLDINGS LIMITED
NOTES TO CONSOLIDATED FINANCIAL STATEMENTS
DECEMBER 31, 2024, 2023 AND 2022
17. SHARE-BASED COMPENSATION (CONTINUED)
Valuation assumptions
Performance Restricted Stock Units granted in 2024, 2023 and 2022 with a market condition
The fair values of these performance restricted stock units were measured on the grant date using a Monte Carlo simulation model.
The following table provides details of the significant inputs used in the Monte Carlo simulation model:
| | | | | | | | | | | | | | | | | | | | |
| Year ended December 31, | 2024 | 2023 (1) | 2023 (2) | 2023 (3) | 2022 |
| | | | | | |
| Expected volatility | 26.00% | 36.24% | 29.30% | 30.05% | 33.44% |
| Expected term (in years) | 3.0 | 3.0 | 1.0 | 3.0 | 3.0 |
| Expected dividend yield | n/a | n/a | n/a | n/a | n/a |
| Risk-free interest rate | 4.06% | 3.79% | 4.61% | 3.39% | 1.26% |
| | | | | | |
n/a - not applicable
(1) Performance restricted stock units granted in the ordinary course of business
(2) Performance restricted stock units granted in the three months ended March 31, 2023 in relation to senior leadership transition
(3) Performance restricted stock units granted in the three months ended June 30, 2023 in relation to senior leadership transition
Beginning share price, Ending share price and Expected term
Performance restricted stock units granted in 2024
The beginning share price for awards was based on the average closing share price over the 30 trading days preceding and including the start of the performance period. The ending share price was based on the average projected closing share price over the 30 trading days preceding and including the end of the performance period. Performance for these awards is measured from January 1, 2024 to December 31, 2026.
Performance restricted stock units granted in 2023 and 2022, and performance restricted stock units granted in the three months ended March 31, 2023 in relation to senior leadership transition
The beginning share price for awards was based on the average closing share price over the 10 trading days preceding and including the start of the performance period. The ending share price was based on the projected average closing share price over the 10 trading days preceding and including the end of the performance period. Performance for awards granted in 2023 is generally measured from January 1, 2023 to December 31, 2025, with performance for awards granted to one senior leader being measured from January 1, 2023 to December 31, 2023. Performance for awards granted in 2022 is generally measured January 1, 2022 to December 31, 2024,
Performance restricted stock units granted in the three months ended June 30, 2023 in relation to senior leadership transition
The beginning share price for awards was based on the average closing share price over the 30 trading days preceding and including the start of the performance period. The ending share price of the awards was based on the average closing share price over the 30 trading days preceding and including the end of the performance period. Performance for awards being measured from May 4, 2023 to May 4, 2026
Expected volatility
The expected volatility was estimated based on the Company's historical share price volatility.
Expected dividend yield
The expected dividend yield is not applicable to the performance restricted stock units as dividends are paid at the end of the vesting period and do not affect the value of the performance restricted stock units.
AXIS CAPITAL HOLDINGS LIMITED
NOTES TO CONSOLIDATED FINANCIAL STATEMENTS
DECEMBER 31, 2024, 2023 AND 2022
17. SHARE-BASED COMPENSATION (CONTINUED)
Risk-free interest rate
The risk-free rate was estimated based on the yield on a U.S. treasury zero-coupon bond issued with a remaining term equal to the vesting period of the performance restricted stock units.
Compensation expense associated with performance restricted stock units granted in 2024, 2023 and 2022 is determined on the grant date based on the fair value calculated by the Monte Carlo simulation model and is recognized on a straight-line basis over the requisite service period. During the three months ended March 31, 2023, the transition in our senior leadership resulted in a modification of the previously existing vesting terms of the outstanding restricted stock units and performance restricted stock units granted in 2022 and earlier of one senior leader, and a modification of the performance period of that leader's performance restricted stock units granted in 2022. The modifications did not result in incremental compensation expense.
Performance Restricted Stock Units granted in 2024 with a performance condition
The fair value of these performance restricted stock units was determined based on the closing price of the Company's common shares on the grant date, and compensation expense is recognized on a straight-line basis over the requisite service period, and is subject to periodic adjustment based on the achievement of established performance criteria during the performance period.
b) Share-Settled Awards
The following table provides an activity summary of the Company's share-settled restricted stock units: | | | | | | | | | | | | | | | | | | | | | | | | | | | | | |
| | | | | | | | | |
| | Share-Settled Performance
Restricted Stock Units | | Share-Settled Service
Restricted Stock Units | |
| | Number of
restricted
stock units | | Weighted average grant date
fair value | | Number of
restricted
stock units | | Weighted average
grant date
fair value | |
| | | | | | | | | |
| | | | | | | | | |
| | | | | | | | | |
| | | | | | | | | |
| | | | | | | | | |
| Nonvested restricted stock units - December 31, 2022 | 330 | | | $ | 60.01 | | | 2,117 | | | $ | 53.16 | | |
| Granted | 122 | | | 66.13 | | | 918 | | | 57.53 | | |
| Vested | (88) | | | 63.88 | | | (929) | | | 53.02 | | |
| Forfeited | (220) | | | 58.15 | | | (251) | | | 54.49 | | |
| Nonvested restricted stock units - December 31, 2023 | 144 | | | 65.69 | | | 1,855 | | | 55.21 | | |
| Granted | 104 | | | 65.77 | | | 748 | | | 60.50 | | |
| Vested | — | | | — | | | (759) | | | 54.65 | | |
| Forfeited | (1) | | | 65.78 | | | (202) | | | 56.66 | | |
| Nonvested restricted stock units - December 31, 2024 | 247 | | | $ | 65.73 | | | 1,642 | | | $ | 57.73 | | |
| | | | | | | | | |
AXIS CAPITAL HOLDINGS LIMITED
NOTES TO CONSOLIDATED FINANCIAL STATEMENTS
DECEMBER 31, 2024, 2023 AND 2022
17. SHARE-BASED COMPENSATION (CONTINUED)
c) Cash-Settled Awards
The following table provides an activity summary of the Company's cash-settled restricted stock units: | | | | | | | | | | | | | | |
| | | Cash-Settled Service Restricted Stock Units | |
| | | Number of
restricted stock units | |
| | | | |
| Nonvested restricted stock units - December 31, 2022 | | 60 | | |
| Granted | | — | | |
| | | | |
| Vested | | (59) | | |
| Forfeited | | (1) | | |
| Nonvested restricted stock units - December 31, 2023 (1) | | — | | |
| | | | |
(1) No further cash-settled restricted stock units were granted subsequent to 2019 and all cash-settled restricted stock units were vested at December 31, 2023.
The following table provides additional information related to share-based compensation: | | | | | | | | | | | | | | | | | | | | | | | |
| | | | | | | |
| Year ended December 31, | 2024 | | 2023 | | 2022 | |
| | | | | | | |
| Share-based compensation expense (1) | $ | 42,713 | | | $ | 57,729 | | | $ | 56,136 | | |
| Tax benefits associated with share-based compensation expense | $ | 8,007 | | | $ | 8,819 | | | $ | 8,839 | | |
| Liability for cash-settled restricted stock units (2) | $ | — | | | $ | — | | | $ | 4,792 | | |
| Fair value of restricted stock units vested (3) | $ | 46,884 | | | $ | 64,156 | | | $ | 49,792 | | |
| Unrecognized share-based compensation expense | $ | 60,192 | | | $ | 62,416 | | | $ | 74,601 | | |
| Expected weighted average period associated with the recognition of unrecognized share-based compensation expense | 2.4 years | | 2.4 years | | 2.3 years | |
| | | | | | | |
(1) Related to share-settled restricted stock units and cash-settled restricted stock units.
(2) Included in other liabilities in the consolidated balance sheets.
(3) Fair value is based on the closing price of the Company's common shares on the vest date.
AXIS CAPITAL HOLDINGS LIMITED
NOTES TO CONSOLIDATED FINANCIAL STATEMENTS
DECEMBER 31, 2024, 2023 AND 2022
18. RELATED PARTY TRANSACTIONS
Related Party Transactions with Stone Point Capital, LLC ("Stone Point")
A member of the Company’s Board of Directors, Mr. Charles Davis, is the Chief Executive Officer of Stone Point Capital, LLC ("Stone Point"). In the ordinary course of business, the Company engages SKY Harbor Capital Management, LLC, which is majority-owned by Stone Point's private equity fund Trident V, L.P. ("Trident V"), to provide asset management services for certain high yield debt portfolios. For the year ended December 31, 2024, total fees paid to SKY Harbor Capital Management, LLC, were $3 million (2023: $3 million; 2022: $2 million).
In addition, the Company has an investment of $3 million (2023: $17 million) in the Freedom Consumer Credit Fund, LLC - Series B. The manager of this fund is Freedom Financial Asset Management, LLC ("Freedom") which is an indirect subsidiary of Pantheon Partners, LLC ("Pantheon"). A Stone Point private equity fund, Trident VI, L.P. ("Trident VI") owns approximately 14.5% of Pantheon. For the year ended December 31, 2024, fees paid to Freedom were $nil (2023: $1 million; 2022: $2 million).
The Company has an investment of $92 million (2023: $87 million) in Stone Point's private equity fund, Trident VIII, L.P. ("Trident VIII") and co-investments of $30 million (2023: $26 million) with Trident VIII. For the year ended December 31, 2024, fees paid to Stone Point in relation to Trident VIII were $4 million (2023: $2 million; 2022: $2 million).
The Company has an investment of $39 million (2023: $24 million) in Stone Point's private equity fund, Trident IX, L.P. ("Trident IX"). For the year ended December 31, 2024, fees paid to Stone Point in relation to Trident IX were $3 million (2023: $1 million; 2022: $1 million).
The Company has an investment of $48 million (2023: $43 million) with Rialto Real Estate IV-Property ("Rialto") and co-investments of $23 million (2023: $19 million) with Rialto, a fund managed by a portfolio company of Stone Point's private equity fund, Trident VII, L.P. ("Trident VII"). For the year ended December 31, 2024, fees paid to Rialto were $2 million (2023: $2 million; 2022: $2 million).
The Company has an investment of $18 million (2023: $18 million) in Stone Point Credit Corporation. For the year ended December 31, 2024, fees paid to Stone Point in relation to Stone Point Credit Corporation were $0.5 million (2023: $0.5 million; 2022: $0.3 million).
The Company has an investment of $18 million (2023: $18 million) in Stone Point Credit Corporation bonds. For the year ended December 31, 2024, the Company earned income of $1 million (2023: $1 million; 2022: $0.6 million) in relation to this bond.
The Company has an investment of $7 million (2023: $7 million) in a loan to Eagle Point Credit Management LLC ("Eagle Point"), which is majority-owned by Trident IX. For the year ended December 31, 2024, the Company earned income of $0.7 million (2023: $0.5 million) in relation to this loan.
The Company has an investment of $6 million (2023: $6 million) in cumulative preferred shares of Aspida Holdings Ltd. ("Aspida"). The investment was syndicated to the Company by Stone Point Credit Corporation. For the year ended December 31, 2024 and 2023, the Company did not pay any fees to Aspida.
The Company has an investment of $43 million (2023: $22 million) in Monarch Point Re (refer to Note 5 'Investments'), a newly created collateralized reinsurer which is jointly sponsored by the Company and Stone Point Credit Adviser LLC. For the year ended December 31, 2024, fees paid by Monarch Point Re to Stone Point Credit Adviser LLC were $1 million (2023: $0.1 million).
At December 31, 2023, the Company had an investment of $5 million in a syndicated accounts receivable loan for which Sound Point Capital Management LP ("Sound Point"), an affiliate of Stone Point, was the lead originator. For the year ended December 31, 2023, the Company did not pay any fees to Sound Point.
At December 31, 2023, the Company had co-investments of $9 million with Gordon Brothers, which is majority-owned by Trident VII. For the year ended December 31, 2023, fees paid to Gordon Brothers were $0.1 million (2022: $0.1 million).
AXIS CAPITAL HOLDINGS LIMITED
NOTES TO CONSOLIDATED FINANCIAL STATEMENTS
DECEMBER 31, 2024, 2023 AND 2022
18. RELATED PARTY TRANSACTIONS (CONTINUED)
Commitments
At December 31, 2024, the Company had up to $25 million of unfunded commitments to Stone Point's private equity fund, Trident X L.P. ("Trident X").
At December 31, 2024, the Company had up to $60 million of unfunded commitments to a separately managed account ("SMA) that will be managed by Stone Point Credit LLC.
Stock Repurchase Agreement with Stone Point
On February 3, 2025, the Company entered into a stock repurchase agreement (the "Repurchase Agreement") with T-VIII PubOpps LP ("T8"), an investment vehicle managed by Stone Point, pursuant to which T8 agreed to sell 2,234,636 shares to the Company for an aggregate price of approximately $200 million (the "Repurchase").
Loss Portfolio Transfer Reinsurance Agreement with Enstar
On December 13, 2024, the Company entered into a loss portfolio transfer reinsurance agreement with Cavello Bay Reinsurance Limited, a wholly-owned subsidiary of Enstar Group Limited ("Enstar") to retrocede a portfolio of reinsurance business (refer to Note 19 'Reinsurance' for further details).
Stone Point serves as the manager of Trident V, L.P., Trident V Parallel Fund, L.P. and Trident V Professionals Fund, L.P. (collectively, "Trident V Funds"), that indirectly held an aggregate ownership interest of approximately 9.5% in Enstar at December 31, 2024.
Retrocession Agreement with Monarch Point Re
On September 22, 2023 (the "closing date"), the Company entered into an agreement, with an effective date of January 1, 2023, to retrocede a diversified portfolio of casualty reinsurance business to Monarch Point Re.
The agreement covers losses both on a prospective basis and on a retroactive basis. Therefore, the Company has bifurcated the prospective and retroactive elements of the agreement and is accounting for each element separately.
AXIS CAPITAL HOLDINGS LIMITED
NOTES TO CONSOLIDATED FINANCIAL STATEMENTS
DECEMBER 31, 2024, 2023 AND 2022
18. RELATED PARTY TRANSACTIONS (CONTINUED)
Retroactive element
Reinsurance premiums of $119 million were allocated to the retroactive element of the agreement which was deemed to have met the established criteria for retroactive reinsurance accounting. At the closing date, the Company recognized acquisition costs of $33 million and a loss expense of $7 million in the consolidated statement of operations associated with the retroactive element of the agreement. In addition, the Company recognized reinsurance recoverable on unpaid losses of $76 million and reinsurance recoverable on paid losses of $4 million in the consolidated balance sheets associated with the retroactive element of the agreement (refer to Note 8 'Reserve for Losses and Loss Expenses').
Prospective element
For the year ended December 31, 2024, the Company ceded reinsurance premiums of $323 million (2023: $287 million) and ceded losses of $214 million (2023: $37 million) to Monarch Point Re. In addition, Monarch Point Re paid certain acquisition costs and administrative fees to the Company.
At December 31, 2024, the amount of reinsurance recoverable on unpaid and paid losses was $246 million (2023: $37 million) and the amount of ceded reinsurance payable included in insurance and reinsurance balances payable was $226 million (2023: $166 million) in the consolidated balance sheets.
This transaction was conducted at market rates consistent with negotiated arms-length contracts.
Loan to Monarch Point Re
During 2024, the Company advanced $253 million (2023: $297 million) to Monarch Point Re. These loans will be repaid in a manner consistent with the timing of amounts due to Monarch Point Re under retrocession agreements. At December 31, 2024, an amount of $236 million (2023: $72 million) was repaid and was treated as a non-cash activity in the consolidated statement of cash flows. These loans are expected to be repaid in full by May 15, 2026. The loan balance receivable at December 31, 2024 of $243 million (2023: $225 million) is included in loan advances made in the consolidated balance sheets. At December 31, 2024, the Company had committed to advance a further $nil (2023: $16 million) to Monarch Point Re.
Interest on this loan is payable for this period at an interest rate of 4.7% and 5.5% (2023: interest rates between 5.7% and 5.9%). Interest related to this loan of $7 million (2023: $9 million) was received in advance and is included in other liabilities in the consolidated balance sheets.
Significant Influence considerations
The Company's investment portfolio includes certain investments where it is considered to have the ability to exercise significant influence over the operating and financial policies of the investee. Significant influence is generally deemed to exist where the Company has an investment of 20% or more in the common stock of a corporation or an investment greater than 3% to 5% in closed end funds, limited partnerships, LLCs or similar investment vehicles.
At December 31, 2024, the Company has $448 million (2023: $424 million) of investments where it is deemed to have the ability to exercise such significant influence. The Company generally pays management and performance fees to the investment managers of these investments. The Company considers all fees paid to the investment managers to be at market rates consistent with negotiated arms-length contracts.
AXIS CAPITAL HOLDINGS LIMITED
NOTES TO CONSOLIDATED FINANCIAL STATEMENTS
DECEMBER 31, 2024, 2023 AND 2022
18. RELATED PARTY TRANSACTIONS (CONTINUED)
Retrocession Agreement with Harrington Re
Harrington and Harrington Re commenced operations in 2016 (refer to Note 5 'Investments'). The Company has the ability to exercise significant influence over the operating and financial policies of Harrington and Harrington Re. In the normal course of business, the Company enters into certain reinsurance transactions with Harrington Re.
For the year ended December 31, 2024, the Company ceded reinsurance premiums of $218 million (2023: $298 million; 2022: $324 million) and ceded losses of $197 million (2023: $229 million; 2022: $234 million) to Harrington Re. In addition, Harrington Re paid certain acquisition costs and administrative fees to the Company.
At December 31, 2024, the amount of reinsurance recoverable on unpaid and paid losses was $884 million (2023: $933 million) and the amount of ceded reinsurance payable included in insurance and reinsurance balances payable was $181 million (2023: $219 million) in the consolidated balance sheets. This transaction was conducted at market rates consistent with negotiated arms-length contracts.
During 2018, the Company entered into a quota share retrocessional agreement with Harrington Re which was deemed to have met the established criteria for retroactive reinsurance accounting. During 2024, the Company entered into a reinsurer novation and replacement agreement with Harrington Re and a third-party reinsurer with respect to this quota share retrocession contract.
On June 29, 2021, the Company invested $10 million in 7.25% fixed to floating rate, senior unsecured notes ("Harrington Notes") due 2031, issued by Harrington. On June 29, 2024, the Harrington Notes were fully redeemed.
19. REORGANIZATION EXPENSES
For the year ended December 31, 2024, reorganization expenses were $26 million (2023: $29 million and 2022: $31 million).
In 2024, reorganization expenses were primarily related to severance costs attributable to the Company's "How We Work" program.
In 2023, reorganization expenses were primarily related to impairments of computer software assets and severance costs attributable to the Company's "How We Work" program which is focused on simplifying the Company’s operating structure.
In 2022, reorganization expenses were primarily related to severance costs and impairments of computer software assets mainly attributable to the Company's exit from catastrophe and property reinsurance lines of business in June.
AXIS CAPITAL HOLDINGS LIMITED
NOTES TO CONSOLIDATED FINANCIAL STATEMENTS
DECEMBER 31, 2024, 2023 AND 2022
20. INCOME TAXES
Under current Bermuda law, AXIS Capital's Bermuda subsidiaries are not required to pay any taxes in Bermuda on income or capital gains. The Company has received assurance from the Minister of Finance in Bermuda that, in the event of any taxes being imposed, it will be exempt from taxation in Bermuda until March 2035.
Notwithstanding the above, on December 27, 2023, the Bermuda government enacted a corporate income tax which will apply for fiscal years beginning on or after January 1, 2025. Importantly, under the Corporate Income Tax Act 2023 of Bermuda, any liability to the tax will apply regardless of any assurances previously provided under the Exempted Undertakings Tax Protection Act 1966 of Bermuda. The Act includes a provision referred to as the economic transition adjustment ("Bermuda ETA"), which is intended to provide a fair and equitable transition into the tax regime. Pursuant to the Act and subsequently issued guidance, the Company recorded a net deferred tax asset of $177 million in 2024.
AXIS Specialty Insurance Bermuda (refer to Note 1 'Organization') that is a wholly owned subsidiary of AXIS Specialty U.S. Holdings, Inc, is in the process of making an election to be treated as a U.S. taxpayer under section 953(d) of the Internal Revenue Code of 1986, as amended ("U.S. Internal Revenue Code"). AXIS Specialty Insurance Bermuda will be subject to tax in the U.S. in 2024 and in the U.S. and Bermuda in 2025, when applicable. Any U.S. tax incurred as a result of this election is expected to be fully creditable against the Bermuda corporate income tax.
AXIS Capital's primary Bermuda subsidiary has an operating branch in Singapore, which is subject to the relevant taxes in that jurisdiction. The Singapore branch is not under examination in that tax jurisdiction but remains subject to examination for tax years 2021 through 2024.
AXIS Capital's U.S. subsidiaries are subject to federal, state and local corporate income taxes, and other taxes applicable to U.S. corporations. The provision for federal income taxes has been determined under the principles of the consolidated tax provisions of the U.S. Internal Revenue Code. Should the U.S. subsidiaries pay a dividend outside the U.S. group, withholding taxes will apply. The U.S. subsidiaries are currently under examination for the 2019, 2021, and 2022 tax years and remain subject to examination for tax years 2019, and 2021 through 2024.
In Canada, AXIS Capital's U.S. reinsurance company operates through a branch and its U.S. service company has an unlimited liability company subsidiary based in Canada. The Canadian operations are subject to the relevant taxes in that jurisdiction and remain subject to examination for tax years 2020 through 2024.
AXIS Capital had subsidiaries in Ireland, the U.K., and Brazil with branches in the U.K., Switzerland, and Belgium. These subsidiaries and their branches are not under examination but remain subject to examination in all applicable jurisdictions for tax years 2020 through 2024.
In the U.K., the Company operates through a Lloyd’s syndicate whose income is subject to tax in the U.K., payable by its corporate members. The income from operations at Lloyd’s is also subject to taxes in other jurisdictions in which Lloyd's operates, including the U.S. Under a Closing Agreement between Lloyd’s and the IRS, Lloyd's corporate members pay U.S. income tax on U.S. connected income written by Lloyd’s syndicates. To the extent that the Lloyd’s syndicates incur taxes outside the U.K., they may claim a credit for foreign taxes incurred, limited to the U.K. equivalent tax on the same income.
AXIS CAPITAL HOLDINGS LIMITED
NOTES TO CONSOLIDATED FINANCIAL STATEMENTS
DECEMBER 31, 2024, 2023 AND 2022
20. INCOME TAXES (CONTINUED)
The following table provides an analysis of income tax expense (benefit) and net tax assets:
| | | | | | | | | | | | | | | | | | | | | | | |
| | | | | | | |
| Year ended December 31, | 2024 | | 2023 | | 2022 | |
| | | | | | | |
| Current income tax expense (benefit) | | | | | | |
| U.S. | $ | 84,255 | | | $ | 12,021 | | | $ | 11,491 | | |
| Europe | 19,260 | | | 32,386 | | | 2,366 | | |
| Bermuda | 3,425 | | | 291 | | | (147) | | |
| Deferred income tax expense (benefit) | | | | | | |
| U.S. | 716 | | | (24,042) | | | (8,147) | | |
| Europe | 7,290 | | | 18,932 | | | 16,474 | | |
| Bermuda(1) | (170,541) | | | (13,272) | | | — | | |
| Total income tax expense (benefit) | $ | (55,595) | | | $ | 26,316 | | | $ | 22,037 | | |
| | | | | | | |
| Net current tax receivables | $ | 42,991 | | | $ | 78,570 | | | $ | 46,704 | | |
| Net deferred tax assets (liabilities) | 278,474 | | | 72,850 | | | 108,220 | | |
| | | | | | | |
| Net tax assets | $ | 321,465 | | | $ | 151,420 | | | $ | 154,924 | | |
| | | | | | | |
(1) Reflects the recognition of a tax benefit related to the Bermuda ETA, offset by a partial reversal of the 2023 tax benefit on unrealized investment losses included in other comprehensive income (loss) due to the enactment of corporate income tax, effective January 1, 2025.
AXIS CAPITAL HOLDINGS LIMITED
NOTES TO CONSOLIDATED FINANCIAL STATEMENTS
DECEMBER 31, 2024, 2023 AND 2022
20. INCOME TAXES (CONTINUED)
Deferred income taxes reflect the tax impact of temporary differences between the carrying amounts of assets and liabilities for financial reporting and income tax purposes. The following table provides details of the significant components of deferred tax assets and liabilities:
| | | | | | | | | | | | | | | | | |
| | | | | |
| At December 31, | 2024 | | 2023 | |
| | | | | |
| Deferred tax assets: | | | | |
| Discounting of net reserves for losses and loss expenses | $ | 66,338 | | | $ | 62,316 | | |
| Unearned premiums | 62,656 | | | 54,104 | | |
| Net unrealized investments losses | 36,536 | | | 54,395 | | |
| Operating and capital loss carryforwards | 75,864 | | | 100,907 | | |
| Accruals not currently deductible | 36,253 | | | 36,407 | | |
| | | | | |
| Tax credits | 2,414 | | | 11,602 | | |
| | | | | |
| | | | | |
| Bermuda economic transition adjustment | 176,923 | | | — | | |
| Other deferred tax assets | 3,681 | | | 4,149 | | |
| Deferred tax assets before valuation allowance | 460,665 | | | 323,880 | | |
| Valuation allowance | (19,829) | | | (38,711) | | |
| Deferred tax assets net of valuation allowance | 440,836 | | | 285,169 | | |
| | | | | |
| Deferred tax liabilities: | | | | |
| Deferred acquisition costs | (35,401) | | | (27,109) | | |
| | | | | |
| Other investment adjustments and impairments | (7,933) | | | (7,173) | | |
| Intangible assets | (47,355) | | | (49,486) | | |
| | | | | |
| Depreciation and amortization | (7,586) | | | (1,140) | | |
| Equalization reserves | (2,347) | | | (2,726) | | |
| Acquisition adjustments (1) | — | | | (79,466) | | |
| Lloyd’s deferred year of account results | (51,770) | | | (38,194) | | |
| Other deferred tax liabilities | (9,970) | | | (7,025) | | |
| Deferred tax liabilities | (162,362) | | | (212,319) | | |
| Net deferred tax assets (liabilities) | $ | 278,474 | | | $ | 72,850 | | |
| | | | | |
(1) During the year ended December 31, 2024, the Company assessed that certain deferred tax assets and deferred tax liabilities related to acquisitions were no longer required.
AXIS CAPITAL HOLDINGS LIMITED
NOTES TO CONSOLIDATED FINANCIAL STATEMENTS
DECEMBER 31, 2024, 2023 AND 2022
20. INCOME TAXES (CONTINUED)
The following table summarizes total operating and capital loss carryforwards and tax credits: | | | | | | | | | | | | | | | | | |
| | | | | |
| At December 31, | 2024 | | 2023 | |
| | | | | |
| Operating and Capital Loss Carryforwards(1) | | | | |
| Singapore operating loss carryforward | $ | 91,924 | | | $ | 70,815 | | |
| U.K. operating loss carryforward | 216,928 | | | 293,533 | | |
| U.K. capital loss carryforward | 93 | | | — | | |
| | | | | |
| Ireland operating loss carryforward | 27 | | | 78,154 | | |
| Ireland capital loss carryforward | 1,372 | | | 716 | | |
| Switzerland operating loss carryforward(2) | 68,573 | | | 123,453 | | |
| U.S. capital loss carryforward(3) | 59,434 | | | — | | |
| | | | | |
| | | | | |
| Tax Credits(1) | | | | |
| Ireland foreign tax credit | $ | 333 | | | $ | 6,922 | | |
| | | | | |
| U.K. foreign tax credit | 504 | | | 2,605 | | |
| U.S. foreign tax credit(4) | 1,577 | | | 2,074 | | |
| | | | | |
(1) At December 31, 2024, the Singapore, U.K., and Ireland operating and capital loss carryforwards and tax credits can be carried forward indefinitely.
(2) At December 31, 2024, the Swiss net operating loss carryforwards expire in 2029.
(3) At December 31, 2024, the U.S. capital loss carryforwards expire in 2029.
(4) At December 31, 2024, the U.S. foreign tax credits expire in 2032.
The following table shows an analysis of the movement in the Company's valuation allowance:
| | | | | | | | | | | | | | | | | |
| | | | | |
| At December 31, | 2024 | | 2023 | |
| | | | | |
| Income tax expense (benefit): | | | | |
| Valuation allowance - beginning of year | $ | 31,688 | | | $ | 39,782 | | |
| Operating loss carryforwards | (6,572) | | | (8,713) | | |
| Foreign tax credit | (6,589) | | | 4,184 | | |
| U.K. branch assets and other foreign rate differentials | (1,567) | | | (3,565) | | |
| Capital loss carryforwards and impaired investments | 261 | | | — | | |
| | | | | |
| Valuation allowance - end of year | $ | 17,221 | | | $ | 31,688 | | |
| | | | | |
| Accumulated other comprehensive income (loss): | | | | |
| Valuation allowance - beginning of year | $ | 7,023 | | | $ | 20,287 | | |
| Change in investment - related items | (4,415) | | | (13,264) | | |
| Valuation allowance - end of year | 2,608 | | | 7,023 | | |
| | | | | |
| Total valuation allowance - end of year | $ | 19,829 | | | $ | 38,711 | | |
| | | | | |
At December 31, 2024 and 2023, the Company had a full valuation allowance on operating loss carryforwards relating to operations in Singapore, Ireland and Switzerland, foreign tax credits available in Ireland and certain other deferred tax assets related to branch operations.
AXIS CAPITAL HOLDINGS LIMITED
NOTES TO CONSOLIDATED FINANCIAL STATEMENTS
DECEMBER 31, 2024, 2023 AND 2022
20. INCOME TAXES (CONTINUED)
In 2024, the valuation allowance decreased by $19 million (2023: $21 million). The net gain incurred by the AXIS Re SE, the Irish reinsurance company, resulted in the release of a valuation allowance of $13 million (2023: $25 million) against the net deferred tax assets of AXIS Re SE and AXIS Re Europe, the Swiss branch of the Irish reinsurance company, of which $8 million (2023: $12 million) was released in net income (loss) and $5 million (2023: $13 million) was released in other comprehensive income (loss). In 2024, a valuation allowance of $7 million was released against foreign tax credits held by AXIS Specialty Europe and in 2023 a valuation allowance of $6 million was recorded against foreign tax credits held by AXIS Specialty Europe SE. In 2023, a valuation allowance of $2 million was also released against U.S. foreign tax credits that were utilized.
At December 31, 2024 and 2023, the Company's U.S. operations had a deferred tax asset of $19 million and $41 million, respectively, for the unrealized losses on its fixed maturities that were recorded in other comprehensive income (loss). The Company examined the need for a valuation allowance and after considering all positive and negative evidence concluded a valuation allowance against its net unrealized investment losses in the U.S was not required.
At December 31, 2024 and 2023, the Company’s Bermuda operations had a deferred tax asset of $17 million and $13 million, respectively for the unrealized losses on its fixed maturities that were recorded in other comprehensive income (loss). The Company examined the need for a valuation allowance and after considering all positive and negative evidence concluded a valuation allowance against its net unrealized investment losses in Bermuda was not required.
At December 31, 2024, the Company’s Bermuda operations had a deferred tax asset of $177 million related to the Bermuda ETA. The Company examined the need for a valuation allowance and after considering all positive and negative evidence concluded a valuation allowance against this asset in Bermuda was not required.
Although realization is not assured, management believes it is more likely than not that the tax benefit of the recorded net deferred tax assets will be realized. In evaluating the Company's ability to recover these tax assets within the jurisdiction from which they arise, it considered all available positive and negative evidence, including historical results, operating loss carry-back potential and scheduled reversals of deferred tax liabilities. The Company believes its U.S. and U.K. operations will produce significant taxable income in future periods and have deferred tax liabilities that will reverse in future periods, such that the Company believes sufficient ordinary taxable income is available to utilize all remaining ordinary deferred tax assets.
A deferred tax liability has not been recorded on undistributed earnings as the U.S. group satisfies the indefinite reversal criteria.
At December 31, 2024 and 2023, there were no unrecognized tax benefits.
AXIS CAPITAL HOLDINGS LIMITED
NOTES TO CONSOLIDATED FINANCIAL STATEMENTS
DECEMBER 31, 2024, 2023 AND 2022
20. INCOME TAXES (CONTINUED)
The following table presents the distribution of income before income taxes between domestic and foreign jurisdictions and a reconciliation of the actual income tax rate to the amount computed by applying the effective tax rate of 0% under Bermuda law to income before income taxes:
| | | | | | | | | | | | | | | | | | | | | | | |
| | | | | | | |
| Year ended December 31, | 2024 | | 2023 | | 2022 | |
| | | | | | | |
| Income (loss) before income taxes | | | | | | |
| Bermuda (domestic) | $ | 323,688 | | | $ | 213,539 | | | $ | 236,781 | | |
| Foreign | 702,503 | | | 189,067 | | | 8,340 | | |
| Total income before income taxes | $ | 1,026,191 | | | $ | 402,606 | | | $ | 245,121 | | |
| | | | | | | |
| Reconciliation of effective tax rate (% of income before income taxes) | | | | | | |
| Expected tax rate | 0.0 | % | | 0.0 | % | | 0.0 | % | |
| Foreign taxes at local expected rates: | | | | | | |
| U.S. | 8.4 | % | | (2.5 | %) | | 0.2 | % | |
| Europe | 6.0 | % | | 11.9 | % | | 1.9 | % | |
| | | | | | | |
| Valuation allowance | (1.4 | %) | | (2.0 | %) | | 9.5 | % | |
| Prior year adjustments | (1.5 | %) | | 1.3 | % | | (0.3 | %) | |
| Incremental branch taxes | 1.1 | % | | 0.9 | % | | (0.4 | %) | |
| | | | | | | |
| | | | | | | |
| Change in enacted tax rate(1) | (1.9 | %) | | (3.3 | %) | | (2.2 | %) | |
| Bermuda economic transition adjustment | (17.2 | %) | | — | % | | — | % | |
| Change in unrealized investment gain/(loss) | 0.6 | % | | — | % | | — | % | |
| Withholding tax | 0.3 | % | | — | % | | — | % | |
| Other | 0.2 | % | | 0.2 | % | | 0.3 | % | |
| Actual tax rate | (5.4 | %) | | 6.5 | % | | 9.0 | % | |
| | | | | | | |
(1) At December 31, 2024, the change in enacted tax rate represents the rate change related to deferred tax assets and deferred tax liabilities on acquisition adjustments no longer required. At December 31, 2023, the change in enacted tax rate represents the enactment of the Bermuda Corporate Income Tax Act of 2023 related to unrealized investment losses included in other comprehensive income (loss). At December 31, 2022, the change in enacted tax rate included a change in the UK tax rate from 19% to 25% and in Belgium from 30% to 25%.
AXIS CAPITAL HOLDINGS LIMITED
NOTES TO CONSOLIDATED FINANCIAL STATEMENTS
DECEMBER 31, 2024, 2023 AND 2022
21. OTHER COMPREHENSIVE INCOME (LOSS)
The following table presents the tax effects allocated to each component of other comprehensive income (loss):
| | | | | | | | | | | | | | | | | | | | | | | |
| | | |
| | Before tax amount | | Income tax (expense) benefit | | Net of tax amount | |
| | | | | | | |
| Year ended December 31, 2024 | | | | | | |
| Available for sale investments: | | | | | | |
| Unrealized gains (losses) arising during the year for which an allowance for expected credit losses has not been recognized | $ | (44,964) | | | $ | 11,934 | | | $ | (33,030) | | |
| Unrealized gains (losses) arising during the year for which an allowance for expected credit losses has been recognized | (278) | | | 30 | | | (248) | | |
| Adjustment for reclassification of net realized (gains) losses and impairment losses recognized in net income (loss) | 170,984 | | | (15,664) | | | 155,320 | | |
| Unrealized gains (losses) arising during the year, net of reclassification adjustment | 125,742 | | | (3,700) | | | 122,042 | | |
| | | | | | | |
| Foreign currency translation adjustment | (23,763) | | | — | | | (23,763) | | |
| Total other comprehensive income (loss), net of tax | $ | 101,979 | | | $ | (3,700) | | | $ | 98,279 | | |
| | | | | | | |
| Year ended December 31, 2023 | | | | | | |
| Available for sale investments: | | | | | | |
| Unrealized gains (losses) arising during the year for which an allowance for expected credit losses has not been recognized | $ | 294,933 | | | $ | (36,993) | | | $ | 257,940 | | |
| Unrealized gains (losses) arising during the year for which an allowance for expected credit losses has been recognized | 11,220 | | | (1,637) | | | 9,583 | | |
| Adjustment for reclassification of net realized (gains) losses and impairment losses recognized in net income (loss) | 142,324 | | | (13,811) | | | 128,513 | | |
| Unrealized gains (losses) arising during the year, net of reclassification adjustment | 448,477 | | | (52,441) | | | 396,036 | | |
| | | | | | | |
| Foreign currency translation adjustment | (1,572) | | | — | | | (1,572) | | |
| | | | | | | |
| | | | | | | |
| Total other comprehensive income (loss), net of tax | $ | 446,905 | | | $ | (52,441) | | | $ | 394,464 | | |
| | | | | | | |
| Year ended December 31, 2022 | | | | | | |
| Available for sale investments: | | | | | | |
| Unrealized gains (losses) arising during the year for which an allowance for expected credit losses has not been recognized | $ | (1,171,381) | | | $ | 127,756 | | | $ | (1,043,625) | | |
| Unrealized gains (losses) arising during the year for which an allowance
for expected credit losses has been recognized | (73,063) | | | 5,913 | | | (67,150) | | |
| Adjustment for reclassification of net realized (gains) losses and impairment losses recognized in net income (loss) | 335,294 | | | (30,369) | | | 304,925 | | |
| Unrealized gains (losses) arising during the year, net of reclassification adjustment | (909,150) | | | 103,300 | | | (805,850) | | |
| | | | | | | |
| Foreign currency translation adjustment | (10,986) | | | — | | | (10,986) | | |
| Total other comprehensive income (loss), net of tax | $ | (920,136) | | | $ | 103,300 | | | $ | (816,836) | | |
| | | | | | | |
AXIS CAPITAL HOLDINGS LIMITED
NOTES TO CONSOLIDATED FINANCIAL STATEMENTS
DECEMBER 31, 2024, 2023 AND 2022
21. OTHER COMPREHENSIVE INCOME (LOSS) (CONTINUED)
The following table presents details of amounts reclassified from accumulated other comprehensive income (loss) ("AOCI") to net income (loss):
| | | | | | | | | | | | | | | | | | | | | | | | | | | | | |
| | | Amounts reclassified from AOCI(1) | |
| AOCI components | Consolidated statement of operations line item that includes reclassification adjustment | Year ended December 31, | |
| 2024 | | 2023 | | 2022 | | |
| | | | | | | | | |
| Unrealized gains (losses) on available for sale investments | | | | | | | | |
| | Other realized and unrealized investment gains (losses) | $ | (170,576) | | | $ | (129,567) | | | $ | (322,726) | | | |
| | Impairment losses | (408) | | | (12,757) | | | (12,568) | | | |
| | | | | | | | | |
| | Total before tax | (170,984) | | | (142,324) | | | (335,294) | | | |
| | Income tax (expense) benefit | 15,664 | | | 13,811 | | | 30,369 | | | |
| | Net of tax | $ | (155,320) | | | $ | (128,513) | | | $ | (304,925) | | | |
| | | | | | | | | |
| | | | | | | | | |
| | | | | | | | | |
| | | | | | | | | |
| | | | | | | | | |
| | | | | | | | | |
(1) Amounts in parentheses are charges to net income (loss).
22. STATUTORY FINANCIAL INFORMATION
The Company's insurance and reinsurance operations are subject to laws and regulations in the jurisdictions in which they operate, the most significant of which include Bermuda, Ireland, and the U.S. In addition, the Company is regulated by Lloyd's. These regulations include certain restrictions on the amount of dividends or other distributions, such as loans or cash advances, available to shareholders without prior approval from insurance regulatory authorities.
The statutory capital and surplus in each of the Company's most significant regulatory jurisdictions is shown in the following table: | | | | | | | | | | | | | | | | | | | | | | | | | | | | | | | | |
| | | | | | | | | | |
| | Bermuda | | Ireland | | U.S. | |
| At December 31, | 2024 | 2023 | | 2024 | 2023 | | 2024 | 2023 | |
| | | | | | | | | | |
| Required statutory capital and surplus | $ | 1,982,025 | | $ | 1,269,943 | | | $ | 733,689 | | $ | 755,076 | | | $ | 675,672 | | $ | 739,829 | | |
| Available statutory capital and surplus | $ | 4,475,219 | | $ | 3,170,556 | | | $ | 1,197,127 | | $ | 1,160,932 | | | $ | 2,483,658 | | $ | 2,187,371 | | |
| | | | | | | | | | |
Bermuda
Under the Insurance Act 1978, amendments thereto and related regulations of Bermuda (the "Insurance Act"), the Company's Bermuda subsidiaries, AXIS Specialty Bermuda and AXIS Specialty Insurance Bermuda are required to maintain minimum statutory capital and surplus equal to the greater of a minimum solvency margin ("MSM") and the Enhanced Capital Requirement ("ECR").
The MSM is the greater of $100 million, 50% of net premiums written, 15% of net reserve for losses and loss expenses, and 25% of the ECR. The Company's ECR is based on an Economic Balance Sheet ("EBS") framework and is calculated using a standard risk-based capital model developed by the Bermuda Monetary Authority ("BMA").
At December 31, 2024 and 2023, the required and available statutory capital and surplus were based on this EBS framework.
AXIS CAPITAL HOLDINGS LIMITED
NOTES TO CONSOLIDATED FINANCIAL STATEMENTS
DECEMBER 31, 2024, 2023 AND 2022
22. STATUTORY FINANCIAL INFORMATION (CONTINUED)
Under the Act, AXIS Specialty Bermuda is restricted as to the payment of dividends for amounts greater than 25% of the prior year’s statutory capital and surplus, whereby an affidavit signed by at least two members of the Board of Directors is required, attesting that any dividend in excess of this amount would not cause the Company to fail to meet its relevant margins.
At December 31, 2024, the maximum dividend AXIS Specialty Bermuda could pay, without a signed affidavit, having met minimum levels of statutory capital and surplus requirements, was approximately $958 million (2023: $730 million).
Ireland
The Company's Irish subsidiaries, AXIS Specialty Europe and AXIS Re SE, are required to continuously maintain the Minimum Capital Requirement ("MCR") and the Solvency Capital Requirement ("SCR"). The capital requirements are calculated by reference to Solvency II definitions. If an entity falls below the MCR or SCR, the Central Bank of Ireland is authorized to take action to restore the financial position of the Company's Irish subsidiaries. During 2024 and 2023, the Company's Irish subsidiaries were in compliance with these requirements.
The Company's Irish subsidiaries may declare dividends subject to meeting their solvency and capital requirements. The maximum dividend is limited to "excess eligible own funds" which is defined as excess Solvency II capital over the SCR and may also be limited to "profits available for distribution'', which is defined as accumulated realized profits less accumulated realized losses and statutory reserves. In addition, a target coverage ratio range of excess eligible own funds to SCR is set by the Company’s Irish subsidiaries to ensure their ability to absorb stress events without breaches of required capital levels. Own Fund balances in excess of the target coverage ratio range may be considered for distribution back to Group.
At December 31, 2024, the maximum dividend the Company's Irish subsidiaries could pay, having met their target solvency and capital requirements was approximately $97 million (2023: $28 million).
United States
The Company's U.S. operations required statutory capital and surplus is determined using the risk-based capital formula ("RBC"), which is the National Association of Insurance Commissioners' (the "Commissioner") method of measuring the minimum capital appropriate for U.S. reporting entities to support its overall business operations in consideration of its size and risk profile. If a company falls below the authorized control level as determined under the RBC, the domiciliary states are authorized to take whatever regulatory actions may be considered necessary to protect policyholders and creditors.
The maximum dividend that may be paid by the Company's U.S. insurance subsidiaries is restricted by the regulatory requirements of the domiciliary states. Generally, the maximum dividend that may be paid by each of the Company's U.S. insurance subsidiaries is limited to unassigned surplus (statutory equivalent of retained earnings) and may also be limited to statutory net income, net investment income or 10% of total statutory capital and surplus.
At December 31, 2024, the maximum dividend that the Company's U.S. insurance operations could pay without regulatory approval was approximately $344 million (2023: $181 million).
Lloyd's of London
The Company operates in the Lloyd’s market through its corporate members, AXIS Corporate Capital UK Limited and AXIS Corporate Capital UK II Limited, that provided 70% and 30% capital support, respectively, to Syndicate 1686's through December 31, 2024. AXIS Corporate Capital UK II Limited will provide 100% capital support to Syndicate 1686 for underwriting activities effective January 1, 2025. AXIS Corporate Capital UK II Limited also provides 100% capital support to Syndicate 2050. Syndicate 1686 and Syndicate 2050 are managed by AXIS Managing Agency.
AXIS CAPITAL HOLDINGS LIMITED
NOTES TO CONSOLIDATED FINANCIAL STATEMENTS
DECEMBER 31, 2024, 2023 AND 2022
22. STATUTORY FINANCIAL INFORMATION (CONTINUED)
Corporate members of Lloyd’s and Lloyd’s syndicates are bound by the rules of Lloyd’s, which are prescribed by Bye-laws and Requirements made by the Council of Lloyd’s under powers conferred by the Lloyd’s Act 1982. These rules prescribe membership subscriptions, contributions to the Lloyd’s Central Fund and assets that must be deposited with Lloyd’s in support of members' underwriting. The Council of Lloyd’s has broad powers to sanction breaches of its rules, including the power to restrict or prohibit a member’s participation on Lloyd’s syndicates.
The capital provided to support underwriting, or FAL, is not available for distribution for the payment of dividends or for working capital requirements. Corporate members may also be required to maintain funds under the control of Lloyd’s in excess of their capital requirements and such funds also may not be available for distribution for the payment of dividends. Lloyd’s sets the corporate members’ required capital annually and reviews funds held compared to latest capital requirements on a quarterly basis. This process is supported by the application of a capital model that is based on regulatory rules pursuant to Solvency II.
FAL may be satisfied by cash, certain investments and letters of credit provided by approved banks. At December 31, 2024, fixed maturities and short-term investments with a fair value of $328 million (2023: $587 million) and cash of $4 million (2023: $13 million), respectively, were restricted to satisfy AXIS Corporate Capital UK Limited FAL requirements.
At December 31, 2024, fixed maturities and short-term investments with a fair value of $424 million (2023: $261 million), equity securities with a fair value of $27 million (2023: $27 million), and cash of $99 million (2023: $6 million) were restricted to satisfy AXIS Corporate Capital UK II Limited FAL requirements (refer to Note 5 'Investments' and Note 12 'Commitments and Contingencies').
Corporate members can apply to Lloyd's to release accumulated funds, whether syndicate profits or interest on FAL, which are in excess of the agreed FAL requirements on a quarterly basis. At December 31, 2024 and 2023, actual capital and assets exceeded the FAL requirements for Syndicate 1686 and Syndicate 2050.
Branch Offices
The Company's operating subsidiaries in Bermuda and the U.S. maintain branch offices in Singapore and Canada, respectively. The Company's Irish operating subsidiaries maintain branch offices in the U.K., Switzerland and Belgium. As branch offices are not considered separate entities for regulatory purposes, the required and actual statutory capital and surplus amounts for each jurisdiction in the table above, include amounts related to the applicable branch offices. The Company's branch offices in Singapore and Canada are subject to additional minimum capital or asset requirements in their countries of domicile. At December 31, 2024 and 2023, the actual capital/assets for each of these branches exceeded the relevant local regulatory requirements.
Total statutory net income (loss) of the Company's operating subsidiaries was $1.0 billion, $471 million, and $134 million for 2024, 2023 and 2022, respectively.
The differences between statutory financial statements and statements prepared in accordance with U.S. GAAP vary by jurisdiction, however, the primary differences are that statutory financial statements may not reflect deferred acquisition costs, certain net deferred tax assets, goodwill and intangible assets, unrealized gains (losses) on fixed maturities or certain unauthorized reinsurance recoverable balances.
AXIS CAPITAL HOLDINGS LIMITED
NOTES TO CONSOLIDATED FINANCIAL STATEMENTS
DECEMBER 31, 2024, 2023 AND 2022
23. SUBSEQUENT EVENTS
Share Repurchase program
On February 6, 2025, authorization under the Company's share repurchase program approved in May 2024 (refer to Note 15 'Shareholders' Equity') was exhausted.
On February 19, 2025, the Company's Board of Directors approved a new share repurchase program for up to $400 million of the Company's common shares. The new share repurchase program is open-ended, allowing the Company to repurchase its shares from time to time in the open market or privately negotiated transactions, depending on market conditions.
ITEM 9. CHANGES IN AND DISAGREEMENTS WITH ACCOUNTANTS ON ACCOUNTING AND FINANCIAL DISCLOSURE
None.
ITEM 9A. CONTROLS AND PROCEDURES
Disclosure Controls and Procedures
The Company’s management has performed an evaluation, with the participation of the Company’s Chief Executive Officer and Chief Financial Officer, of the effectiveness of the Company's disclosure controls and procedures (as defined in Rules 13a-15(e) and 15d-15(e) of the Securities Exchange Act of 1934 (the "Exchange Act")) at December 31, 2024. Based on that evaluation, the Company's Chief Executive Officer and Chief Financial Officer concluded that, at December 31, 2024, the Company's disclosure controls and procedures are effective to ensure that information required to be disclosed by the Company in reports that it files or submits under the Exchange Act is recorded, processed, summarized and reported within the time periods specified in the rules and forms of the SEC and is accumulated and communicated to management, including its principal executive and principal financial officers, as appropriate to allow timely decisions regarding required disclosures.
Management’s Annual Report on Internal Control Over Financial Reporting
The Company’s management is responsible for establishing and maintaining adequate internal control over financial reporting (as defined in Rules 13a-15(f) and 15d-15(f) of the Exchange Act). The Company’s management has performed an assessment, with the participation of the Company’s Chief Executive Officer and the Company’s Chief Financial Officer, of the Company's internal control over financial reporting at December 31, 2024. In making this assessment, management used the criteria set forth by the Committee of Sponsoring Organizations of the Treadway Commission in Internal Control-Integrated Framework (2013).
Based on that assessment, the Company’s management believes that, at December 31, 2024, the Company's internal control over financial reporting is effective to provide reasonable assurance regarding the reliability of financial reporting and the preparation of financial statements for external purposes in accordance with generally accepted accounting principles.
The Company's independent registered public accounting firm has issued an audit report on management's assessment of the Company's internal control over financial reporting at December 31, 2024. This report appears below.
All internal control systems, no matter how well designed, have inherent limitations. As a result, even those internal control systems determined to be effective can provide only reasonable assurance with respect to financial reporting and the preparation of financial statements.
Changes in Internal Control Over Financial Reporting
The Company’s management has performed an evaluation, with the participation of the Company’s Chief Executive Officer and the Company’s Chief Financial Officer, of changes in the Company’s internal control over financial reporting that occurred during the three months ended December 31, 2024. Based on that evaluation, there were no changes in the Company's internal control over financial reporting that occurred during the three months ended December 31, 2024 that have materially affected, or are reasonably likely to materially affect, the Company's internal control over financial reporting.
REPORT OF INDEPENDENT REGISTERED PUBLIC ACCOUNTING FIRM
To the Shareholders and the Board of Directors of AXIS Capital Holdings Limited
Opinion on Internal Control over Financial Reporting
We have audited the internal control over financial reporting of AXIS Capital Holdings Limited and subsidiaries (the “Company”) as of December 31, 2024, based on criteria established in Internal Control — Integrated Framework (2013) issued by the Committee of Sponsoring Organizations of the Treadway Commission (COSO). In our opinion, the Company maintained, in all material respects, effective internal control over financial reporting as of December 31, 2024, based on criteria established in Internal Control — Integrated Framework (2013) issued by COSO.
We have also audited, in accordance with the standards of the Public Company Accounting Oversight Board (United States) (PCAOB), the consolidated financial statements as of and for the year ended December 31, 2024, of the Company and our report dated February 26, 2025 expressed an unqualified opinion on those financial statements.
Basis for Opinion
The Company’s management is responsible for maintaining effective internal control over financial reporting and for its assessment of the effectiveness of internal control over financial reporting, included in the accompanying Management’s Annual Report on Internal Controls Over Financial Reporting. Our responsibility is to express an opinion on the Company’s internal control over financial reporting based on our audit. We are a public accounting firm registered with the PCAOB and are required to be independent with respect to the Company in accordance with the U.S. federal securities laws and the applicable rules and regulations of the Securities and Exchange Commission and the PCAOB.
We conducted our audit in accordance with the standards of the PCAOB. Those standards require that we plan and perform the audit to obtain reasonable assurance about whether effective internal control over financial reporting was maintained in all material respects. Our audit included obtaining an understanding of internal control over financial reporting, assessing the risk that a material weakness exists, testing and evaluating the design and operating effectiveness of internal control based on the assessed risk, and performing such other procedures as we considered necessary in the circumstances. We believe that our audit provides a reasonable basis for our opinion.
Definition and Limitations of Internal Control over Financial Reporting
A company’s internal control over financial reporting is a process designed to provide reasonable assurance regarding the reliability of financial reporting and the preparation of financial statements for external purposes in accordance with generally accepted accounting principles. A company’s internal control over financial reporting includes those policies and procedures that (1) pertain to the maintenance of records that, in reasonable detail, accurately and fairly reflect the transactions and dispositions of the assets of the company; (2) provide reasonable assurance that transactions are recorded as necessary to permit preparation of financial statements in accordance with generally accepted accounting principles, and that receipts and expenditures of the company are being made only in accordance with authorizations of management and directors of the company; and (3) provide reasonable assurance regarding prevention or timely detection of unauthorized acquisition, use, or disposition of the company’s assets that could have a material effect on the financial statements.
Because of its inherent limitations, internal control over financial reporting may not prevent or detect misstatements. Also, projections of any evaluation of effectiveness to future periods are subject to the risk that controls may become inadequate because of changes in conditions, or that the degree of compliance with the policies or procedures may deteriorate.
| | |
|
| /s/ Deloitte Ltd. |
| Hamilton, Bermuda |
| February 26, 2025 |
ITEM 9B. OTHER INFORMATION
Disclosure of Certain Activities Under Section 13(r) of the Securities Exchange Act of 1934
Section 13(r) of the Securities Exchange Act of 1934, as amended, requires issuers to disclose in their annual and quarterly reports whether they or any of their affiliates knowingly engaged in certain activities with Iran or with individuals or entities that are subject to certain sanctions under U.S. law. Issuers are required to provide this disclosure even where the activities, transactions or dealings are conducted outside of the U.S. in compliance with applicable law.
As and when allowed by the applicable law and regulations, certain of our non-U.S. subsidiaries provide treaty reinsurance coverage to non-U.S. insurers on a worldwide basis, including insurers of liability, marine, aviation and energy risks, and as a result, these underlying insurance and reinsurance portfolios may have some exposure to Iran. In addition, we provide insurance and facultative reinsurance on a global basis to non-U.S. insureds and insurers, including for liability, marine, aviation and energy risks. Coverage provided to non-Iranian business may indirectly cover an exposure in Iran. For example, certain of our operations underwrite global marine hull war and cargo policies that provide coverage for vessels navigating into and out of ports worldwide, including Iran. For the year ended December 31, 2024, there has been no material amount of premium allocated or apportioned to activities relating to Iran. We intend for our non-U.S. subsidiaries to continue to provide such coverage only to the extent permitted by applicable law.
Insider Trading Arrangements and Policies
During the three months ended December 31, 2024, no director or officer of the Company adopted, terminated or is currently party to a "Rule 10b5-1 trading arrangement" or "non-Rule 10b5-1 trading arrangement," as each term is defined in Item 408(a) of Regulation S-K.
ITEM 9C. DISCLOSURE REGARDING FOREIGN JURISDICTIONS THAT PREVENT INSPECTIONS
Not Applicable.
PART III
ITEM 10. DIRECTORS, EXECUTIVE OFFICERS AND CORPORATE GOVERNANCE
The information required by this item is incorporated by reference from the sections captioned "Proposal No. 1 – Election of Directors", "Corporate Governance", "Executive Officers", and "Other Compensation Topics" in the definitive proxy statement that will be filed with the Securities and Exchange Commission not later than 120 days after the close of the fiscal year ended December 31, 2024 pursuant to Regulation 14A.
ITEM 11. EXECUTIVE COMPENSATION
The information required by this item is incorporated by reference from the sections captioned "Executive Compensation", "Compensation Discussion and Analysis", "Director Compensation", "Human Capital and Compensation Committee Report" and "Human Capital and Compensation Committee Interlocks and Insider Participation" in the definitive proxy statement that will be filed with the Securities and Exchange Commission not later than 120 days after the close of the fiscal year ended December 31, 2024 pursuant to Regulation 14A.
ITEM 12. SECURITY OWNERSHIP OF CERTAIN BENEFICIAL OWNERS AND MANAGEMENT AND RELATED STOCKHOLDER MATTERS
The information required by this item is incorporated by reference from the sections captioned "Principal Shareholders" and "Equity Compensation Plan Information" in the definitive proxy statement that will be filed with the Securities and Exchange Commission not later than 120 days after the close of the fiscal year ended December 31, 2024 pursuant to Regulation 14A.
ITEM 13. CERTAIN RELATIONSHIPS AND RELATED TRANSACTIONS, AND DIRECTOR INDEPENDENCE
The information required by this item is incorporated by reference from the sections captioned "Certain Relationships and Related Transactions", and "Corporate Governance" in the definitive proxy statement that will be filed with the Securities and Exchange Commission not later than 120 days after the close of the fiscal year ended December 31, 2024 pursuant to Regulation 14A.
ITEM 14. PRINCIPAL ACCOUNTING FEES AND SERVICES
The information required by this item is incorporated by reference from the section captioned "Principal Accounting Fees and Services" in the definitive proxy statement that will be filed with the Securities and Exchange Commission not later than 120 days after the close of the fiscal year ended December 31, 2024 pursuant to Regulation 14A.
PART IV
ITEM 15. EXHIBITS AND FINANCIAL STATEMENT SCHEDULES
(a)Financial Statements, Financial Statement Schedules and Exhibits
1. Financial Statements
Included in Part II –Refer to Item 8 of this report.
2. Financial Statement Schedules
Report of Independent Registered Public Accounting Firm
Schedule I – Summary of Investments - Other than Investments in Related Parties
Schedule II – Condensed Financial Information of Registrant
Schedule III – Supplementary Insurance Information
Schedule IV – Supplementary Reinsurance Information
Schedules V and VI have been omitted as the information is provided in Item 8, Consolidated Financial Statements, or in the above schedules.
3. Exhibits | | | | | | | | |
Exhibit
Number | | Description of Document |
| | Rule 2.7 Announcement dated July 5, 2017 in connection with acquisition of Novae Group plc (incorporated by reference to Exhibit 2.1 to the Company's Current Report on Form 8-K filed on July 6, 2017). |
| | |
| | Rule 2.7 Announcement dated August 24, 2017 in connection with acquisition of Novae Group plc (incorporated by reference to Exhibit 2.1 to the Company's Current Report on Form 8-K filed on August 25, 2017). |
| | |
| | | | | | | | |
| | Certificate of Incorporation and Memorandum of Association of AXIS Capital Holdings Limited (incorporated by reference to Exhibit 3.1 to the Company's Registration Statement on Form S-1 (Amendment No. 1) (No. 333-103620) filed on April 16, 2003). |
| | |
| | Amended and Restated Bye-laws of AXIS Capital Holdings Limited (incorporated by reference to Exhibit 4.2 to the Company's Registration Statement on Form S-8 filed on May 15, 2009). |
| | |
| | Specimen Common Share Certificate (incorporated by reference to Exhibit 4.1 to the Company's Registration Statement on Form S-1 (Amendment No. 3) (No. 333-103620) filed on June 10, 2003). |
| | |
| | Senior Indenture among AXIS Specialty Finance LLC, AXIS Capital Holdings Limited and The Bank of New York Mellon Trust Company, N.A., as trustee, dated as of March 23, 2010 (incorporated by reference to Exhibit 4.4 to the Company's Quarterly Report on Form 10-Q filed on April 27, 2010). |
| | |
| | Senior Indenture among AXIS Specialty Finance PLC, as issuer, the Company, as guarantor, and The Bank of New York Mellon Trust Company, N.A., as trustee, dated as of March 13, 2014 (incorporated by reference to Exhibit 4.1 to the Company's Current Report on Form 8-K filed on March 13, 2014). |
| | |
| | First Supplemental Indenture, dated as of April 3, 2019, among AXIS Specialty Finance PLC, AXIS Capital Holdings Limited and The Bank of New York Mellon Trust Company, N.A., relating to the 5.150% Senior Notes due 2045 (incorporated by reference to Exhibit 4.1 to the Company's Current Report on Form 8-K filed on April 4, 2019). |
| | |
| | Junior Subordinated Indenture dated as of December 10, 2019, among AXIS Specialty Finance LLC, AXIS Capital Holdings Limited and The Bank of New York Mellon Trust Company, N.A. (incorporated by reference to Exhibit 4.1 to the Company's Current Report on Form 8-K filed on December 11, 2019). |
| | |
| | First Supplemental Indenture dated as of December 10, 2019, among AXIS Specialty Finance LLC, AXIS Capital Holdings Limited and The Bank of New York Mellon Trust Company, N.A., relating to the 4.900% Junior Subordinated Notes due 2040 (incorporated by reference to Exhibit 4.2 to the Company's Current Report on Form 8-K filed on December 11, 2019). |
| | |
| | Form of 5.150% Senior Notes due 2045 (incorporated by reference to Exhibit 4.3 to the Company's Current Report on Form 8-K filed on March 13, 2014). |
| | |
| | Form of 4.000% Senior Notes due 2027 (incorporated by reference to Exhibit 4.1 to the Company's Current Report on Form 8-K filed on December 6, 2017). |
| | |
| | Form of 3.900% Senior Notes due 2029 (incorporated by reference to Exhibit 4.1 to the Company's Current Report on Form 8-K filed on June 19, 2019). |
| | |
| | Form of 4.900% Junior Subordinated Notes due 2040 (incorporated by reference to Exhibit 4.2 (included as Exhibit A to Exhibit 4.2) to the Company's Current Report on Form 8-K filed on December 11, 2019). |
| | |
| | Certificate of Designations setting forth the specific rights, preferences, limitations and other terms of the 5.50% Series E Preferred Shares (incorporated by reference to Exhibit 3.1 to the Company's Current Report on Form 8-K filed on November 7, 2016). |
| | |
| | Description of AXIS Capital Holdings Limited's Securities Registered under Section 12 of the Exchange Act. |
| | |
| | Amended and Restated Shareholders Agreement dated December 31, 2002, among AXIS Capital Holdings Limited and each of the persons listed on Schedule A thereto (incorporated by reference to Exhibit 10.1 to the Company's Registration Statement on Form S-1 (Amendment No. 3) (No. 333-103620) filed on June 10, 2003). |
| | |
| | Employment Agreement by and between Peter Vogt and AXIS Specialty U.S. Services, Inc. dated December 11, 2017 (incorporated by reference to Exhibit 10.22 to the Company’s Annual Report on Form 10-K filed on February 28, 2018). |
| | |
| | Amendment No. 1 to Employment Agreement by and between Peter Vogt and AXIS Specialty U.S. Services, Inc. dated October 2, 2020 (incorporated by reference to Exhibit 10.1 to the Company's Current Report on Form 8-K filed on October 7, 2020). |
| | |
| | Amendment No. 2 to Employment Agreement by and between Peter Vogt and AXIS Specialty U.S. Services, Inc. dated June 17, 2021 (incorporated by reference to Exhibit 10.1 to the Company's Current Report on Form 8-K filed on June 21, 2021). |
| | |
| | | | | | | | |
| | Amendment No. 3 to Employment Agreement by and between Peter Vogt and AXIS Specialty U.S. Services, Inc. dated October 6, 2023 (incorporated by reference to Exhibit 10.1 to the Company's Current Report on Form 8-K filed on October 10, 2023). |
| | |
| | Employment Agreement by and between David Phillips and AXIS Specialty U.S. Services, Inc. dated March 21, 2014 (incorporated by reference to Exhibit 10.22 to the Company's Annual Report on Form 10-K filed on February 26, 2019). |
| | |
| | Amendment No. 1 to Employment Agreement by and between David Phillips and AXIS Specialty U.S. Services, Inc. dated June 17, 2021 (incorporated by reference to Exhibit 10.2 to the Company's Current Report on Form 8-K filed on June 21, 2021). |
| | |
| | Employment Agreement by and between Conrad D. Brooks and AXIS Specialty U.S. Services, Inc. dated December 14, 2016 (incorporated by reference to Exhibit 10.13 to the Company's Annual Report on Form 10-K filed on February 27, 2024). |
| | |
| | Employment Agreement by and between Vincent Tizzio, AXIS Capital Holdings Limited and AXIS Specialty U.S. Services, Inc. dated April 11, 2023 (incorporated by reference to Exhibit 10.1 to the Company's Current Report on Form 8-K/A filed on April 14, 2023). |
| | |
| | Employment Agreement by and between Daniel Draper and AXIS UK Services Limited dated January 19, 2023 (incorporated by reference to Exhibit 10.17 to the Company's Annual Report on Form 10-K filed on February 27, 2024). |
| | |
| | 2007 Long-Term Equity Compensation Plan, as amended (incorporated by reference to Exhibit 4.4 to the Company's Registration Statement on Form S-8 filed on May 15, 2012). |
| | |
| | Amended and Restated 2017 Long-Term Equity Compensation Plan (incorporated by reference to Exhibit 10.1 to the Company's Current Report on Form 8-K filed on May 11, 2021). |
| | |
| | Second Amended and Restated 2017 Long-Term Equity Compensation Plan (incorporated by reference to Exhibit 10.1 to the Company's Current Report on Form 8-K filed on May 8, 2023). |
| | |
| | Executive Long-Term Equity Compensation Program effective February 2021 (incorporated by reference to Exhibit 10.27 to the Company's Annual Report on Form 10-K filed on February 26, 2021). |
| | |
| | Amended and Restated Long-Term Equity Compensation Program effective February 2024 (incorporated by reference to Exhibit 10.22 to the Company's Annual Report on Form 10-K filed on February 27, 2024). |
| | |
| | Amended and Restated Executive Annual Incentive Plan effective February 2024 (incorporated by reference to Exhibit 10.23 to the Company's Annual Report on Form 10-K filed on February 27, 2024). |
| | |
| | Amended and Restated AXIS Executive RSU Retirement Plan (incorporated by reference to Exhibit 10.24 to the Company's Annual Report on Form 10-K filed on February 27, 2024). |
| | |
| | Form of Employee Restricted Stock Unit Award Agreement (incorporated by reference to Exhibit 10.37 to the Company's Annual Report on Form 10-K filed on February 26, 2019). |
| | |
| | Form of Employee Restricted Stock Unit Award Agreement (Performance Vesting) (incorporated by reference to Exhibit 10.40 to the Company's Annual Report on Form 10-K filed on February 26, 2021). |
| | |
| | Form of Employee Restricted Stock Unit Award Agreement (incorporated by reference to Exhibit 10.8 to the Company's Quarterly Report on Form 10-Q filed on May 1, 2024). |
| | |
| | Form of Employee Restricted Stock Unit Award Agreement (Three Year - Performance Vesting) (incorporated by reference to Exhibit 10.37 of the Company’s Form 10-K filed on February 27, 2023). |
| | |
| | Form of Employee Restricted Stock Unit Award Agreement (Three Year - Performance Vesting) (incorporated by reference to Exhibit 10.38 of the Company’s Form 10-K filed on February 27, 2023). |
| | |
| | Form of Employee Restricted Stock Unit Award Agreement (Three Year - Performance Vesting based on absolute total shareholder return compound annual growth rate) (incorporated by reference to Exhibit 10.2 to the Company's Quarterly Report on Form 10-Q filed on August 1, 2023). |
| | |
| | | | | | | | |
| | Form of Employee Restricted Stock Unit Award Agreement (Three Year - Performance Vesting based on relative total shareholder return and adjusted diluted book value per share) (incorporated by reference to Exhibit 10.39 to the Company's Annual Report on Form 10-K filed on February 27, 2024). |
| | |
| | Form of Employee Restricted Stock Unit Award Agreement (Three Year - Performance Vesting based on relative total shareholder return and adjusted diluted book value per share). |
| | |
| | AXIS Specialty U.S. Services, Inc. Supplemental Retirement Plan (incorporated by reference to Exhibit 10.23 to the Company's Annual Report on Form 10-K filed on February 26, 2008). |
| | |
| | AXIS Capital Holdings Limited Executive Severance Plan (incorporated by reference to Exhibit 10.1 to the Company's Current Report on Form 8-K filed on August 9, 2024). |
| | |
| | Directors Annual Compensation Program, effective January 1, 2024 (incorporated by reference to Exhibit 10.42 to the Company’s Annual Report on Form 10-K filed on February 27, 2024). |
| | |
| | Directors Annual Compensation Program, effective January 1, 2025. |
| | |
| | Master Reimbursement Agreement, dated as of May 14, 2010, by and among AXIS Specialty Limited, AXIS Re Limited, AXIS Specialty Europe Limited, AXIS Insurance Company, AXIS Surplus Insurance Company, AXIS Specialty Insurance Company, AXIS Reinsurance Company and Citibank Europe plc (incorporated by reference to Exhibit 10.1 to the Company's Current Report on Form 8-K filed on May 19, 2010). |
| | |
| | Amendment to Master Reimbursement Agreement dated January 27, 2012 by and among AXIS Specialty Limited, AXIS Re Limited, AXIS Specialty Europe Limited, AXIS Insurance Company, AXIS Surplus Insurance Company, AXIS Specialty Insurance Company and AXIS Reinsurance Company and Citibank Europe plc (incorporated by reference to Exhibit 10.1 to the Company's Current Report on Form 8-K filed on January 30, 2012). |
| | |
| | Amendment to Committed Facility Letter dated November 20, 2013 by and among AXIS Specialty Limited, AXIS Re SE, AXIS Specialty Europe SE, AXIS Insurance Company, AXIS Surplus Insurance Company and AXIS Reinsurance Company and Citibank Europe plc (incorporated by reference to Exhibit 10.1 to the Company's Current Report on Form 8-K filed on November 21, 2013). |
| | |
| | Amendment to Committed Facility Letter dated March 31, 2015 by and among AXIS Specialty Limited, AXIS Re SE, AXIS Specialty Europe SE, AXIS Insurance Company, AXIS Reinsurance Company, AXIS Surplus Insurance Company and Citibank Europe plc (incorporated by reference to Exhibit 10.1 to the Company's Current Report on Form 8-K filed on April 1, 2015). |
| | |
| | Amendment to Facility Fee Letter dated March 31, 2015 by and among AXIS Specialty Limited, AXIS Re SE, AXIS Specialty Europe SE, AXIS Insurance Company, AXIS Reinsurance Company, AXIS Surplus Insurance Company and Citibank Europe plc (incorporated by reference to Exhibit 10.2 to the Company's Current Report on Form 8-K filed on April 1, 2015). |
| | |
| | Committed Facility Letter dated December 18, 2015 by and among AXIS Specialty Limited, AXIS Re SE, AXIS Specialty Europe SE, AXIS Insurance Company, AXIS Surplus Insurance Company and AXIS Reinsurance Company and Citibank Europe plc (incorporated by reference to Exhibit 10.1 to the Company's Current Report on Form 8-K filed on December 22, 2015). |
| | |
| | Amendment to Master Reimbursement Agreement dated March 27, 2017 by and among AXIS Specialty Limited, AXIS Re Limited, AXIS Specialty Europe Limited, AXIS Insurance Company, AXIS Surplus Insurance Company, AXIS Reinsurance Company and Citibank Europe plc (incorporated by reference to Exhibit 10.2 to the Company's Current Report on Form 8-K filed on March 31, 2017). |
| | |
| | Deed of Amendment to $500 million secured letter of credit facility dated December 24, 2019 by and among AXIS Specialty Limited, AXIS Re SE, AXIS Specialty Europe SE, AXIS Insurance Company, AXIS Surplus Insurance Company, AXIS Reinsurance Company and Citibank Europe plc (incorporated by reference to Exhibit 10.1 to the Company's Current Report on Form 8-K filed on December 30, 2019). |
| | |
| | Deed of Amendment to $500 million secured letter of credit facility dated April 1, 2021 by and among AXIS Specialty Limited, AXIS Re SE, AXIS Specialty Europe SE, AXIS Insurance Company, AXIS Surplus Insurance Company, AXIS Reinsurance Company and Citibank Europe plc (incorporated by reference to Exhibit 10.1 to the Company's Current Report on Form 8-K filed on April 6, 2021). |
| | |
| | | | | | | | |
| | Deed of Amendment to $500 million secured letter of credit facility dated December 29, 2023 by and among AXIS Specialty Limited, AXIS Re SE, AXIS Specialty Europe SE, AXIS Insurance Company, AXIS Surplus Insurance Company, AXIS Reinsurance Company and Citibank Europe plc (incorporated by reference to Exhibit 10.1 to the Company's Current Report on Form 8-K filed on January 3, 2024). |
| | |
| | Amendment and Restatement Agreement dated March 26, 2024, by and among AXIS Specialty Limited, AXIS Re SE, AXIS Specialty Europe SE, AXIS Insurance Company, AXIS Reinsurance Company, AXIS Surplus Insurance Company and Citibank Europe plc (incorporated by reference to Exhibit 10.1 to the Company's Current Report on Form 8-K filed on March 28, 2024). |
| | |
| | Amendment to Master Agreement dated March 26, 2024, by and among AXIS Specialty Limited, AXIS Re SE, AXIS Specialty Europe SE, AXIS Insurance Company, AXIS Reinsurance Company, AXIS Surplus Insurance Company and Citibank Europe plc (incorporated by reference to Exhibit 10.2 to the Company's Current Report on Form 8-K filed on March 28, 2024). |
| | |
| | Amended and Restated Committed Letter of Credit Facility Letter dated March 26, 2024, by and among AXIS Specialty Limited, AXIS Re SE, AXIS Specialty Europe SE, AXIS Insurance Company, AXIS Reinsurance Company, AXIS Surplus Insurance Company and Citibank Europe plc (incorporated by reference to Exhibit 10.3 to the Company's Current Report on Form 8-K filed on March 28, 2024). |
| | |
| | Uncommitted Facility Letter for Issuance of Credits dated March 26, 2024, by and among AXIS Specialty Limited, AXIS Re SE, AXIS Specialty Europe SE, AXIS Insurance Company, AXIS Reinsurance Company, AXIS Surplus Insurance Company and Citibank Europe plc (incorporated by reference to Exhibit 10.4 to the Company's Current Report on Form 8-K filed on March 28, 2024). |
| | |
| | Reinsurance Agreement signed December 13, 2024 between AXIS Specialty Limited, AXIS Reinsurance Company, AXIS Re SE, and AXIS Managing Agency Ltd. for and on behalf of the Underwriting Members of Lloyd’s Syndicate 1686 and Cavello Bay Reinsurance Limited (incorporated by reference to Exhibit 10.1 to the Company's Current Report on Form 8-K filed on December 16, 2024). |
| | |
| | Stock Repurchase Agreement, dated February 3, 2025, between AXIS Capital Holdings Limited and T-VIII PubOpps LP (incorporated by reference to Exhibit 10.1 to the Company's Current Report on Form 8-K filed on February 3, 2025). |
| | |
| | AXIS Capital Holdings Limited Insider Trading Policy |
| | |
| | AXIS Capital Holdings Limited Trading Policies and Procedures |
| | |
| | Subsidiaries of the Registrant. |
| | |
| | Subsidiary Guarantors and Issuers of Guaranteed Securities. |
| | |
| | Consent of Deloitte Ltd. |
| | |
| †24.1 | | Power of Attorney (included as part of signature pages hereto). |
| | |
| | Certification of Chief Executive Officer pursuant to Section 302 of the Sarbanes-Oxley Act of 2002. |
| | |
| | Certification of Chief Financial Officer pursuant to Section 302 of the Sarbanes-Oxley Act of 2002. |
| | |
| | Certification of Chief Executive Officer pursuant to Section 906 of the Sarbanes-Oxley Act of 2002. |
| | |
| | Certification of Chief Financial Officer pursuant to Section 906 of the Sarbanes-Oxley Act of 2002. |
| | |
| | Amended and Restated Executive Compensation Recoupment Policy (incorporated by reference to Exhibit 97.1 to the Company's Annual Report on Form 10-K filed on February 27, 2024). |
| | |
| | | | | | | | |
| †101 | | The following financial information from AXIS Capital Holdings Limited’s Annual Report on Form 10-K for the year ended December 31, 2024 formatted in Inline XBRL: (i) Consolidated Balance Sheets at December 31, 2024 and 2023; (ii) Consolidated Statements of Operations for the years ended December 31, 2024, 2023 and 2022; (iii) Consolidated Statements of Comprehensive Income for the years ended December 31, 2024, 2023 and 2022; (iv) Consolidated Statements of Changes in Shareholders' Equity for the years ended December 31, 2024, 2023 and 2022; (v) Consolidated Statements of Cash Flows for the years ended December 31, 2024, 2023 and 2022; and (vi) Notes to Consolidated Financial Statements, tagged as blocks of text and in detail. |
| †104 | | Cover Page Interactive Data File (formatted as Inline XBRL and contained in Exhibit 101). |
* Management contract, compensatory plan or arrangement.
† Filed herewith.
The agreements and other documents filed as exhibits to this report are not intended to provide factual information or other disclosure other than with respect to the terms of the agreements or other documents themselves, and you should not rely on them for that purpose. In particular, any representations and warranties made by us in these agreements or other documents were made solely within the specific context of the relevant agreement or document and may not describe the actual state of affairs as of the date they were made or at any other time.
ITEM 16. FORM 10-K SUMMARY
None.
Pursuant to the requirements of Section 13 or 15(d) of the Securities Exchange Act of 1934, the registrant has duly caused this report to be signed on its behalf by the undersigned, thereunto duly authorized on February 26, 2025.
| | | | | | | | | | | | | | | | | | | | |
| | | | | | |
| | AXIS CAPITAL HOLDINGS LIMITED |
| | | |
| | By: | | /s/ VINCENT TIZZIO | | |
| | | | Vincent Tizzio | | |
| | | | President and Chief Executive Officer | | |
POWER OF ATTORNEY
We, the undersigned directors and executive officers of AXIS Capital Holdings Limited, hereby appoint Peter Vogt and Conrad D. Brooks, and each of them singly, as our true and lawful attorneys with full power to them and each of them to sign for us, and in our names in the capacities indicated below, any and all amendments to the Annual Report on Form 10-K filed with the Securities and Exchange Commission, hereby ratifying and confirming our signatures as they may be signed by our said attorneys to any and all amendments to said Annual Report on Form 10-K.
Pursuant to the requirements of the Securities Exchange Act of 1934, this report has been signed below by the following persons on behalf of the registrant and in the capacities indicated on February 26, 2025.
| | | | | | | | |
| | |
| Signature | | Title |
| |
| /s/ VINCENT TIZZIO | | Chief Executive Officer, President and Director
(Principal Executive Officer) |
| Vincent Tizzio | |
| |
| /s/ PETER VOGT | | Chief Financial Officer
(Principal Financial Officer) |
| Peter Vogt | |
| |
| /s/ KENT ZIEGLER | | Global Corporate Controller
(Principal Accounting Officer) |
| Kent Ziegler | |
| |
| /s/ W. MARSTON BECKER | | Director |
| W. Marston Becker | |
| |
| /s/ CHARLES DAVIS | | Director |
| Charles Davis | |
| |
| /s/ ANNE MELISSA DOWLING | | Director |
| Anne Melissa Dowling | |
| |
| | | | | | | | |
| | |
| Signature | | Title |
| | |
| /s/ STANLEY GALANSKI | | Director |
| Stanley Galanski | |
| |
| /s/ ELANOR HARDWICK | | Director |
| Elanor Hardwick | |
| | |
| /s/ MICHAEL MILLEGAN | | Director |
| Michael Millegan | |
| |
| /s/ THOMAS RAMEY | | Director |
| Thomas Ramey | |
| |
| /s/ HENRY SMITH | | Director |
| Henry Smith | |
| | |
| /s/ AXEL THEIS | | Director |
| Axel Theis | |
| | |
| /s/ BARBARA YASTINE | | Director |
| Barbara Yastine | |
| | |
| /s/ LIZABETH ZLATKUS | | Director |
| Lizabeth Zlatkus | | |
SCHEDULE I
AXIS CAPITAL HOLDINGS LIMITED
SUMMARY OF INVESTMENTS - OTHER THAN INVESTMENTS IN RELATED PARTIES
| | | | | | | | | | | | | | | | | | | | | | | |
| | At December 31, 2024 | |
| | Amortized cost | | Fair value | | Amount shown on the balance sheet | |
| (in thousands) | | | | | | |
| Type of investment: | | | | | | |
| Fixed maturities, available for sale, at fair value | | | | | | |
| U.S. government and agency | $ | 2,830,111 | | | $ | 2,802,986 | | | $ | 2,802,986 | | |
| Non-U.S. government | 753,315 | | | 729,939 | | | 729,939 | | |
| Corporate debt | 4,941,510 | | | 4,842,190 | | | 4,842,190 | | |
| Agency RMBS | 1,245,681 | | | 1,184,845 | | | 1,184,845 | | |
| CMBS | 852,534 | | | 819,608 | | | 819,608 | | |
| Non-agency RMBS | 132,116 | | | 122,536 | | | 122,536 | | |
| ABS | 1,547,350 | | | 1,539,832 | | | 1,539,832 | | |
| Municipals | 117,288 | | | 110,817 | | | 110,817 | | |
| Total fixed maturities, available for sale | $ | 12,419,905 | | | 12,152,753 | | | 12,152,753 | | |
| Fixed maturities, held to maturity, at amortized cost | | | | | | |
| Corporate debt | $ | 122,706 | | | 115,617 | | | 122,706 | | |
| ABS | 320,694 | | | 321,134 | | | 320,694 | | |
| Total fixed maturities, held to maturity | $ | 443,400 | | | 436,751 | | | 443,400 | | |
| Mortgage loans, held for investment, at fair value | | | 505,697 | | | 505,697 | | |
| Short-term investments, at fair value | | | 223,666 | | | 223,666 | | |
| Equity securities, at fair value | | | 579,274 | | | 579,274 | | |
| Other investments, at fair value (1) | | | 689,159 | | | 930,278 | | |
| Equity method investments (2) | | | — | | | 206,994 | | |
| Total investments | | | $ | 14,587,300 | | | $ | 15,042,062 | | |
| | | | | | | |
(1)In the fair value column in the table above, other investments exclude investments where the Company is considered to have the ability to exercise significant influence over the operating and financial policies of the investees.
(2)In the fair value column in the table above, equity method investments are excluded as the Company has the ability to exercise significant influence over the operating and financial policies of the investees.
SCHEDULE II
AXIS CAPITAL HOLDINGS LIMITED
CONDENSED BALANCE SHEETS – PARENT COMPANY
DECEMBER 31, 2024 AND 2023
| | | | | | | | | | | |
| 2024 | | 2023 |
| (in thousands) |
| Assets | | | |
| Investments in subsidiaries | $ | 6,209,792 | | | $ | 5,415,302 | |
| | | |
| Cash and cash equivalents | 3,768 | | | 412 | |
| Other assets | 4,465 | | | 4,751 | |
| Total assets | $ | 6,218,025 | | | $ | 5,420,465 | |
| | | |
| Liabilities | | | |
| Intercompany payable | $ | 70,183 | | | $ | 89,430 | |
| Dividends payable | 50,478 | | | 51,749 | |
| Other liabilities | 7,985 | | | 16,090 | |
| Total liabilities | 128,646 | | | 157,269 | |
| | | |
| Shareholders’ equity | | | |
| Preferred shares | 550,000 | | | 550,000 | |
Common shares (shares issued 2024: 176,580; 2023: 176,580 shares outstanding 2024: 82,984; 2023: 85,286) | 2,206 | | | 2,206 | |
| Additional paid-in capital | 2,394,063 | | | 2,383,030 | |
| Accumulated other comprehensive income (loss) | (267,557) | | | (365,836) | |
| Retained earnings | 7,341,569 | | | 6,440,528 | |
Treasury shares, at cost (2024: 93,596; 2023: 91,294) | (3,930,902) | | | (3,746,732) | |
| Total shareholders’ equity | 6,089,379 | | | 5,263,196 | |
| Total liabilities and shareholders’ equity | $ | 6,218,025 | | | $ | 5,420,465 | |
(1)AXIS Capital has fully and unconditionally guaranteed all obligations of AXIS Specialty Finance PLC, a 100% owned finance subsidiary, related to the issuance of $250 million aggregate principal amount of 5.15% senior unsecured notes. AXIS Capital's obligations under this guarantee are unsecured senior obligations and rank equally with all other senior obligations of AXIS Capital.
(2)AXIS Capital has fully and unconditionally guaranteed all obligations of AXIS Specialty Finance PLC, a 100% owned finance subsidiary, related to the issuance of $350 million aggregate principal amount of 4.0% senior unsecured notes. AXIS Capital's obligations under this guarantee are unsecured senior obligations and rank equally with all other senior obligations of AXIS Capital.
(3)AXIS Capital has fully and unconditionally guaranteed all obligations of AXIS Specialty Finance LLC, a 100% owned finance subsidiary, related to the issuance of $300 million aggregate principal amount of 3.9% senior unsecured notes. AXIS Capital's obligations under this guarantee are unsecured senior obligations and rank equally with all other senior obligations of AXIS Capital.
(4)AXIS Capital has fully and unconditionally guaranteed all obligations of AXIS Specialty Finance LLC, a 100% owned finance subsidiary, related to the issuance of $425 million aggregate principal amount of 4.9% fixed-rate reset junior unsecured notes. AXIS Capital's obligation under this guarantee is an unsecured junior subordinated obligation and ranks equally with all future unsecured and junior subordinated obligations of AXIS Capital, and junior in right of payment to all outstanding and future senior obligations of AXIS Capital.
SCHEDULE II
AXIS CAPITAL HOLDINGS LIMITED
CONDENSED STATEMENTS OF OPERATIONS – PARENT COMPANY
YEARS ENDED DECEMBER 31, 2024, 2023 AND 2022
| | | | | | | | | | | | | | | | | |
| 2024 | | 2023 | | 2022 |
| (in thousands) |
| Revenues | | | | | |
Net investment income | $ | — | | | $ | — | | | $ | — | |
| | | | | |
| Total revenues | — | | | — | | | — | |
| | | | | |
| Expenses | | | | | |
| General and administrative expenses | 52,599 | | | 52,334 | | | 60,252 | |
| | | | | |
| Total expenses | 52,599 | | | 52,334 | | | 60,252 | |
| | | | | |
| Income (loss) before equity in net income of subsidiaries | (52,599) | | | (52,334) | | | (60,252) | |
| Equity in net income of subsidiaries | 1,134,385 | | | 428,626 | | | 283,335 | |
| Net income | 1,081,786 | | | 376,292 | | | 223,083 | |
| Preferred share dividends | 30,250 | | | 30,250 | | | 30,250 | |
| | | | | |
| Net income available to common shareholders | $ | 1,051,536 | | | $ | 346,042 | | | $ | 192,833 | |
| | | | | |
| Comprehensive income (loss) | $ | 1,180,065 | | | $ | 770,756 | | | $ | (593,753) | |
SCHEDULE II
AXIS CAPITAL HOLDINGS LIMITED
CONDENSED STATEMENTS OF CASH FLOWS – PARENT COMPANY
YEARS ENDED DECEMBER 31, 2024, 2023 AND 2022
| | | | | | | | | | | | | | | | | |
| 2024 | | 2023 | | 2022 |
| | (in thousands) |
| Cash flows from operating activities: | | | | | |
| Net income | $ | 1,081,786 | | | $ | 376,292 | | | $ | 223,083 | |
| Adjustments to reconcile net income to net cash provided by operating activities: | | | | | |
| Equity in income loss of subsidiaries | (1,134,385) | | | (428,626) | | | (283,335) | |
| Change in intercompany payable | (19,247) | | | (136,059) | | | 32,871 | |
| Dividends received from subsidiaries | 459,000 | | | 375,000 | | | 225,000 | |
| Other items | (28,645) | | | (34,626) | | | (17,140) | |
| Share-based compensation expense, net of cash payments | 42,731 | | | 54,119 | | | 48,494 | |
| Net cash provided by operating activities | 401,240 | | | 206,100 | | | 228,973 | |
| | | | | |
| | | | | |
| | | | | |
| | | | | |
| | | | | |
| | | | | |
| Cash flows from financing activities: | | | | | |
| | | | | |
| | | | | |
| Taxes paid on withholding shares | (15,925) | | | (23,595) | | | (13,994) | |
| Dividends paid - common shares | (151,765) | | | (153,775) | | | (149,341) | |
| | | | | |
| Repurchase of common shares - open market | (199,944) | | | — | | | (34,987) | |
| Dividends paid - preferred shares | (30,250) | | | (30,250) | | | (30,250) | |
| | | | | |
| | | | | |
| Net cash used in financing activities | (397,884) | | | (207,620) | | | (228,572) | |
| | | | | |
| Increase (decrease) in cash, cash equivalents and restricted cash | 3,356 | | | (1,520) | | | 401 | |
| Cash, cash equivalents and restricted cash - beginning of year | 412 | | | 1,932 | | | 1,531 | |
| Cash, cash equivalents and restricted cash - end of year | $ | 3,768 | | | $ | 412 | | | $ | 1,932 | |
| | | | | |
| | | | | |
| | | | | |
| | | | | |
SCHEDULE III
AXIS CAPITAL HOLDINGS LIMITED
SUPPLEMENTARY INSURANCE INFORMATION
| | | | | | | | | | | | | | | | | | | | | | | | | | | | | | | | | | | | | | | | | | | | | | | | | | | | | | | | |
| | | | | | | | | | | | | | | | | | |
| | | At and year ended December 31, 2024 |
| (in thousands) | | Deferred
acquisition
costs | | Reserve
for losses
and loss
expenses | | Unearned
premiums | | Net
premiums
earned | | Net investment income(1) | | Net losses
and loss
expenses | | Acquisition
costs | | Other operating expenses(2) | | Net
premiums
written |
| Insurance | | $ | 343,476 | | | $ | 10,499,703 | | | $ | 3,859,162 | | | $ | 3,926,036 | | | $ | — | | | $ | 2,245,420 | | | $ | 766,915 | | | $ | 485,929 | | | $ | 4,250,545 | |
| Reinsurance | | 181,361 | | | 6,719,226 | | | 1,352,703 | | | 1,380,199 | | | — | | | 913,067 | | | 303,636 | | | 50,513 | | | 1,506,806 | |
| Corporate | | — | | | — | | | — | | | — | | | 759,229 | | | — | | | — | | | 129,760 | | | — | |
| Total | | $ | 524,837 | | | $ | 17,218,929 | | | $ | 5,211,865 | | | $ | 5,306,235 | | | $ | 759,229 | | | $ | 3,158,487 | | | $ | 1,070,551 | | | $ | 666,202 | | | $ | 5,757,351 | |
| | | | | | | | | | | | | | | | | | |
| | | At and year ended December 31, 2023 |
| (in thousands) | | Deferred
acquisition
costs | | Reserve
for losses
and loss
expenses | | Unearned
premiums | | Net
premiums
earned | | Net investment income(1) | | Net losses
and loss
expenses | | Acquisition
costs | | Other operating expenses(2) | | Net
premiums
written |
| Insurance | | $ | 298,249 | | | $ | 9,507,409 | | | $ | 3,507,519 | | | $ | 3,461,700 | | | $ | — | | | $ | 2,080,001 | | | $ | 648,463 | | | $ | 472,094 | | | $ | 3,758,720 | |
| Reinsurance | | 152,701 | | | 6,926,609 | | | 1,240,083 | | | 1,622,081 | | | — | | | 1,313,101 | | | 352,482 | | | 79,373 | | | 1,343,605 | |
| Corporate | | — | | | — | | | — | | | — | | | 611,742 | | | — | | | — | | | 132,979 | | | — | |
| Total | | $ | 450,950 | | | $ | 16,434,018 | | | $ | 4,747,602 | | | $ | 5,083,781 | | | $ | 611,742 | | | $ | 3,393,102 | | | $ | 1,000,945 | | | $ | 684,446 | | | $ | 5,102,325 | |
| | | | | | | | | | | | | | | | | | |
| | | At and year ended December 31, 2022 |
| (in thousands) | | Deferred
acquisition
costs | | Reserve
for losses
and loss
expenses | | Unearned
premiums | | Net
premiums
earned | | Net investment income(1) | | Net losses
and loss
expenses | | Acquisition
costs | | Other operating expenses(2) | | Net
premiums
written |
| Insurance | | $ | 249,407 | | | $ | 8,381,593 | | | $ | 3,077,628 | | | $ | 3,134,155 | | | $ | — | | | $ | 1,785,854 | | | $ | 577,838 | | | $ | 443,704 | | | $ | 3,377,906 | |
| Reinsurance | | 224,162 | | | 6,787,270 | | | 1,283,819 | | | 2,026,171 | | | — | | | 1,456,556 | | | 444,179 | | | 106,585 | | | 1,885,150 | |
| Corporate | | — | | | — | | | — | | | — | | | 418,829 | | | — | | | — | | | 130,054 | | | — | |
| Total | | $ | 473,569 | | | $ | 15,168,863 | | | $ | 4,361,447 | | | $ | 5,160,326 | | | $ | 418,829 | | | $ | 3,242,410 | | | $ | 1,022,017 | | | $ | 680,343 | | | $ | 5,263,056 | |
| | | | | | | | | | | | | | | | | | |
(1)The Company evaluates underwriting results of its reportable segments separately from the performance of its investment portfolio. Therefore, the Company believes it is appropriate to exclude net investment income from its underwriting profitability measure.
(2)Amounts related to the Company's reportable segments reflect underwriting-related general and administrative expenses, which includes those general and administrative expenses that are incremental and/or directly attributable to the Company's underwriting operations. Underwriting-related general and administrative expenses is a non-GAAP financial measure as defined in Item 10(e) of SEC Regulation S-K. The reconciliation to general and administrative expenses, the most comparable GAAP financial measure, presented in the table above, also includes corporate expenses of $130 million, $133 million, and $130 million for the years ended December 31, 2024, 2023 and 2022, respectively. Corporate expenses include holding company costs necessary to support our worldwide insurance and reinsurance operations and costs associated with operating as a publicly-traded company. As these costs are not incremental and/or directly attributable to the Company's underwriting operations, these expenses are excluded from underwriting-related general and administrative expenses.
SCHEDULE IV
AXIS CAPITAL HOLDINGS LIMITED
SUPPLEMENTARY REINSURANCE INFORMATION
YEARS ENDED DECEMBER 31, 2024, 2023 AND 2022
| | | | | | | | | | | | | | | | | | | | | | | | | | | | | | | | | | | | | | |
| (in thousands) | |
GROSS
AMOUNT | | CEDED TO
OTHER
COMPANIES | | ASSUMED
FROM
OTHER
COMPANIES | | NET
AMOUNT | | PERCENTAGE
OF AMOUNT
ASSUMED TO
NET | |
| | | | | | | | | | | | |
| 2024 | | | | | | | | | | | |
| Property and Casualty | | $ | 5,596,538 | | | $ | 3,085,338 | | | $ | 2,522,244 | | | $ | 5,033,444 | | | 50.1 | % | |
| Accident and Health | | 437,817 | | | 163,199 | | | 449,289 | | | 723,907 | | | 62.1 | % | |
| Total | | $ | 6,034,355 | | | $ | 3,248,537 | | | $ | 2,971,533 | | | $ | 5,757,351 | | | 51.6 | % | |
| | | | | | | | | | | | |
| 2023 | | | | | | | | | | | |
| Property and Casualty | | $ | 5,223,919 | | | $ | 3,161,438 | | | $ | 2,402,378 | | | $ | 4,464,859 | | | 53.8 | % | |
| Accident and Health | | 311,970 | | | 92,762 | | | 418,258 | | | 637,466 | | | 65.6 | % | |
| Total | | $ | 5,535,889 | | | $ | 3,254,200 | | | $ | 2,820,636 | | | $ | 5,102,325 | | | 55.3 | % | |
| | | | | | | | | | | | |
| 2022 | | | | | | | | | | | |
| Property and Casualty | | $ | 4,858,629 | | | $ | 2,900,300 | | | $ | 2,685,677 | | | $ | 4,644,006 | | | 57.8 | % | |
| Accident and Health | | 244,329 | | | 51,239 | | | 425,960 | | | 619,050 | | | 68.8 | % | |
| Total | | $ | 5,102,958 | | | $ | 2,951,539 | | | $ | 3,111,637 | | | $ | 5,263,056 | | | 59.1 | % | |