UNITED STATES
SECURITIES AND EXCHANGE COMMISSION
WASHINGTON, D.C. 20549
FORM N-CSR
CERTIFIED SHAREHOLDER REPORT OF REGISTERED MANAGEMENT
INVESTMENT COMPANIES
Investment Company Act file number 811-21290
Neiman Funds
(Exact name of registrant as specified in charter)
305 Spindrift Drive, Williamsville, NY 14221
(Address of principal executive offices)(Zip code)
Daniel Neiman
305 Spindrift Drive, Williamsville, NY 14221
(Name and address of agent for service) |
Registrant's telephone number, including area code: (716) 633-1515
Date of fiscal year end: September 30
Date of reporting period: March 31, 2021
Item 1. Report to Stockholders.

ADVISORS CAPITAL FUNDS
ADVISORS CAPITAL US DIVIDEND FUND
Ticker ACUSX
ADVISORS CAPITAL SMALL/MID CAP FUND
Ticker ACSMX
ADVISORS CAPITAL TACTICAL FIXED INCOME FUND
Ticker ACTIX
SEMI-ANNUAL REPORT
March 31, 2021
| Table of Contents | |
| |
| |
| |
| ADVISORS CAPITAL FUNDS | |
| Sector Allocation | 2 |
| Schedules of Investments | 4 |
| Statements of Assets and Liabilities | 9 |
| Statements of Operations | 9 |
| Statements of Changes in Net Assets | 11 |
| Financial Highlights | 13 |
| NOTES TO FINANCIAL STATEMENTS | 16 |
| DISCLOSURE OF EXPENSES | 21 |
| ADDITIONAL INFORMATION | 23 |
2021 Semi-Annual Report 1
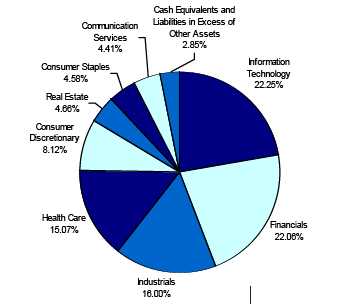
Advisors Capital Funds (Unaudited)
ADVISORS CAPITAL US DIVIDEND FUND
Sector Allocation as of March 31, 2021
(As a Percentage of Net Assets Held) |

ADVISORS CAPITAL SMALL/MID CAP FUND
Sector Allocation as of March 31, 2021
(As a Percentage of Net Assets Held) |
2021 Semi-Annual Report 2
Advisors Capital Funds (Unaudited)
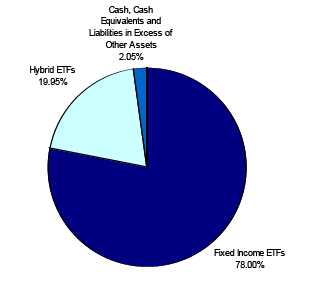
ADVISORS CAPITAL TACTICAL FIXED INCOME FUND
Sector Allocation as of March 31, 2021
(As a Percentage of Net Assets Held)
2021 Semi-Annual Report 3
| Advisors Capital US Dividend Fund | | | | |
| | | | Schedule of Investments |
| | | | March 31, 2021 (Unaudited) |
| Shares | | | Fair Value | % of Net Assets |
| |
| COMMON STOCKS | | | | |
| Aircraft Engines & Engine Parts | | | | |
| 49 | Honeywell International Inc. | $ | 10,636 | 3.07 | % |
| Auto Controls for Regulating Residential & Commercial Environments | | | | |
| 25 | Trane Technologies plc (Ireland) | | 4,139 | 1.19 | % |
| Ball & Roller Bearings | | | | |
| 50 | The Timken Company | | 4,058 | 1.17 | % |
| Biological Products, (No Diagnostic Substances) | | | | |
| 38 | Amgen Inc. | | 9,455 | 2.73 | % |
| Cable & Other Pay Television Services | | | | |
| 157 | Comcast Corporation - Class A | | 8,495 | | |
| 43 | The Walt Disney Company | | 7,934 | | |
| | | | 16,429 | 4.74 | % |
| Electromedical & Electrotherapeutic Apparatus | | | | |
| 80 | Medtronic plc (Ireland) | | 9,450 | 2.72 | % |
| Electronic Computers | | | | |
| 126 | Apple Inc. | | 15,391 | 4.44 | % |
| Guided Missiles & Space Vehicles & Parts | | | | |
| 26 | Lockheed Martin Corporation | | 9,607 | 2.77 | % |
| Industrial Inorganic Chemicals | | | | |
| 22 | Air Products and Chemicals, Inc. | | 6,189 | 1.78 | % |
| Insurance Agents, Brokers & Service | | | | |
| 30 | Aon plc - Class A ** | | 6,903 | 1.99 | % |
| Investment Advice | | | | |
| 84 | The Blackstone Group Inc. - Class A | | 6,261 | 1.80 | % |
| Measuring & Controlling Devices, NEC | | | | |
| 26 | Rockwell Automation, Inc. | | 6,901 | | |
| 18 | Thermo Fisher Scientific Inc. | | 8,215 | | |
| | | | 15,116 | 4.36 | % |
| Miscellaneous Industrial & Commercial Machinery & Equipment | | | | |
| 48 | Eaton Corporation plc ** | | 6,637 | 1.91 | % |
| Miscellaneous Food Preparations & Kindred Products | | | | |
| 164 | Utz Brands, Inc. - Class A | | 4,066 | 1.17 | % |
| National Commercial Banks | | | | |
| 53 | JPMorgan Chase & Co. * | | 8,068 | | |
| 131 | Truist Financial Corporation * | | 7,640 | | |
| 121 | Wells Fargo & Company * | | 4,727 | | |
| | | | 20,435 | 5.89 | % |
| Perfumes, Cosmetics & Other Toilet Preparations | | | | |
| 25 | The Estée Lauder Companies Inc. - Class A | | 7,271 | 2.10 | % |
| Petroleum Refining | | | | |
| 39 | Chevron Corporation | | 4,087 | 1.18 | % |
| Pharmaceutical Preparations | | | | |
| 67 | Abbott Laboratories | | 8,029 | | |
| 62 | Johnson & Johnson | | 10,190 | | |
| 31 | Zoetis Inc. - Class A | | 4,882 | | |
| | | | 23,101 | 6.66 | % |
| Radio & TV Broadcasting & Communications Equipment | | | | |
| 42 | QUALCOMM Incorporated | | 5,569 | 1.60 | % |
| Retail - Auto Dealers & Gasoline Stations | | | | |
| 29 | Casey's General Stores, Inc. | | 6,270 | 1.81 | % |
| Retail - Eating & Drinking Places | | | | |
| 70 | Starbucks Corporation | | 7,649 | 2.20 | % |
* Non-Income Producing Securities.
** ADR - American Depositary Receipt.
The accompanying notes are an integral part of these
financial statements. |
2021 Semi-Annual Report 4
| Advisors Capital US Dividend Fund |
| | | | Schedule of Investments |
| | | | March 31, 2021 (Unaudited) |
| Shares | | | Fair Value | | % of Net Assets |
| |
| COMMON STOCKS | | | | | | |
| Retail - Lumber & Other Building Materials Dealers | | | | | | |
| 39 | The Home Depot, Inc. | $ | 11,905 | | | 3.43 | % |
| Retail - Variety Stores | | | | | | |
| 20 | Costco Wholesale Corp. | | 7,050 | | | | |
| 49 | Walmart Inc. | | 6,656 | | | | |
| | | | 13,706 | | | 3.95 | % |
| Rubber & Plastic Footwear | | | | | | |
| 54 | Nike Inc. Class B | | 7,176 | | | 2.07 | % |
| Security & Commodity Brokers, Dealers, Exchanges & Services | | | | | | |
| 26 | CME Group Inc. | | 5,310 | | | 1.53 | % |
| Security Brokers, Dealers & Flotation Companies | | | | | | |
| 14 | BlackRock, Inc. | | 10,555 | | | 3.04 | % |
| Semiconductors & Related Devices | | | | | | |
| 21 | Broadcom Inc. | | 9,737 | | | | |
| 46 | Texas Instruments Incorporated | | 8,694 | | | | |
| | | | 18,431 | | | 5.31 | % |
| Services - Business Services, NEC | | | | | | |
| 39 | Accenture plc - Class A (Ireland) | | 10,774 | | | | |
| 47 | Fidelity National Information Services, Inc. | | 6,609 | | | | |
| 31 | MasterCard Incorporated - Class A | | 11,038 | | | | |
| | | | 28,421 | | | 8.19 | % |
| Services - Computer Programming, Data Processing, Etc. | | �� | | | | |
| 55 | Flutter Entertainment plc * ** | | 6,011 | | | 1.73 | % |
| Services - Prepackaged Software | | | | | | |
| 147 | Bentley Systems, Incorporated - Class B | | 6,899 | | | | |
| 73 | Microsoft Corporation | | 17,211 | | | | |
| | | | 24,110 | | | 6.95 | % |
| Wholesale - Electronic Parts & Equipment, NEC | | | | | | |
| 32 | TE Connectivity Ltd. (Switzerland) | | 4,132 | | | 1.19 | % |
| Wholesale - Miscellaneous Durable Goods | | | | | | |
| 10 | Pool Corporation | | 3,452 | | | 0.99 | % |
| Total for Common Stocks (Cost - $325,895) | | 331,928 | | | 95.66 | % |
| REAL ESTATE INVESTMENT TRUSTS | | | | | | |
| 46 | Prologis, Inc. | | 4,876 | | | | |
| 50 | QTS Realty Trust, Inc. - Class A | | 3,102 | | | | |
| Total for Real Estate Investment Trusts (Cost $7,860) | | 7,978 | | | 2.30 | % |
| MONEY MARKET FUNDS | | | | | | |
| 32,979 | Fidelity Investments Money Market Government Portfolio - | | 32,979 | | | 9.50 | % |
| | Class I 0.01% *** | | | | | | |
| Total for Money Market Funds (Cost $32,979) | | | | | | |
| | Total Investments (Cost - $366,734) | | 372,885 | | | 107.46 | % |
| | Liabilities in Excess of Other Assets | | (25,881 | ) | | -7.46 | % |
| | Net Assets | $ | 347,004 | | | 100.00 | % |
* Non-Income Producing Securities.
** ADR - American Depositary Receipt.
*** The rate shown represents the 7-day yield at March 31, 2021.
The accompanying notes are an integral part of these
financial statements. |
2021 Semi-Annual Report 5
| Advisors Capital Small/Mid Cap Fund | | | | |
| | | | Schedule of Investments |
| | | | March 31, 2021 (Unaudited) |
| Shares | | | Fair Value | % of Net Assets | |
| |
| COMMON STOCKS | | | | |
| Abrasive, Asbestos & Miscellaneous Nonmetallic Mineral Products | | | | |
| 101 | Owens Corning | $ | 9,301 | 2.69 | % |
| Ball & Roller Bearings | | | | |
| 71 | RBC Bearings Incorporated * | | 13,971 | | |
| 135 | The Timken Company | | 10,958 | | |
| | | | 24,929 | 7.22 | % |
| Blank Checks | | | | |
| 296 | RedBall Acquisition Corp. - Class A * | | 2,945 | 0.85 | % |
| Investment Advice | | | | |
| 32 | Evercore Inc. - Class A | | 4,216 | | |
| 171 | PJT Partners Inc. - Class A | | 11,568 | | |
| | | | 15,784 | 4.57 | % |
| Laboratory Analytical Instruments | | | | |
| 467 | Avantor, Inc. * | | 13,510 | 3.91 | % |
| Miscellaneous Food Preparations & Kindred Products | | | | |
| 246 | Utz Brands, Inc. - Class A | | 6,098 | 1.77 | % |
| Motor Vehicle Parts & Accessories | | | | |
| 135 | Gentex Corporation | | 4,816 | 1.39 | % |
| National Commercial Banks | | | | |
| 316 | Evans Bancorp, Inc. | | 10,709 | 3.10 | % |
| Pharmaceutical Preparations | | | | |
| 174 | Catalent, Inc. * | | 18,324 | 5.30 | % |
| Real Estate Agents & Managers (For Others) | | | | |
| 57 | Jones Lang LaSalle Incorporated | | 10,205 | 2.95 | % |
| Retail - Auto Dealers & Gasoline Stations | | | | |
| 45 | Casey's General Stores, Inc. | | 9,729 | 2.82 | % |
| Retail - Eating & Drinking Places | | | | |
| 257 | Cannae Holdings, Inc. * | | 10,182 | 2.95 | % |
| Retail - Variety Stores | | | | |
| 100 | Ollie's Bargain Outlet Holdings, Inc. * | | 8,700 | 2.52 | % |
| Security Brokers, Dealers & Flotation Companies | | | | |
| 404 | Virtu Financial, Inc. - Class A | | 12,544 | 3.63 | % |
| Services - Amusement & Recreation Services | | | | |
| 59 | Madison Square Garden Entertainment Corp. - Class A * | | 4,826 | 1.40 | % |
| Services - Business Services, NEC | | | | |
| 154 | Accolade, Inc. * | | 6,987 | 2.02 | % |
| Services - Medical Laboratories | | | | |
| 216 | Exagen Inc. * | | 3,780 | 1.09 | % |
| Services - Miscellaneous Amusement & Recreation | | | | |
| 28 | Madison Square Garden Sports Corp. - Class A * | | 5,025 | 1.45 | % |
| Services - Prepackaged Software | | | | |
| 93 | Avalara, Inc. | | 12,409 | | |
| 137 | Black Knight, Inc. * | | 10,137 | | |
| 108 | BlackLine, Inc. * | | 11,707 | | |
| 83 | Guidewire Software, Inc. * | | 8,435 | | |
| 135 | nCino, Inc. * | | 9,007 | | |
| 82 | Q2 Holdings, Inc. | | 8,217 | | |
| 65 | Veeva Systems Inc. - Class A * | | 16,981 | | |
| | | | 76,893 | 22.25 | % |
| State Commercial Banks | | | | |
| 650 | Coastal Financial Corporation * | | 17,043 | 4.93 | % |
* Non-Income Producing Securities.
The accompanying notes are an integral part of these
financial statements. |
2021 Semi-Annual Report 6
| Advisors Capital Small/Mid Cap Fund |
| | | | Schedule of Investments |
| | | | March 31, 2021 (Unaudited) |
| Shares | | Fair Value | | % of Net Assets |
| | | | | | | |
| COMMON STOCKS | | | | | | |
| Surgical & Medical Instruments & Apparatus | | | | | | |
| 145 | AtriCure, Inc. * | $ | 9,500 | | | 2.75 | % |
| Television Broadcasting Stations | | | | | | |
| 194 | The Liberty Braves Group - Series C * | | 5,397 | | | 1.56 | % |
| Title Insurance | | | | | | |
| 123 | First American Financial Corporation | | 6,968 | | | 2.02 | % |
| Transportation Services | | | | | | |
| 82 | XPO Logistics, Inc. * | | 10,111 | | | 2.93 | % |
| Wholesale - Hardware & Plumbing & Heating Equipment & Supplies | | | | | | |
| 42 | Watsco, Inc. | | 10,952 | | | 3.17 | % |
| Wholesale - Miscellaneous Durable Goods | | | | | | |
| 42 | Pool Corporation | | 14,500 | | | 4.20 | % |
| Total for Common Stocks (Cost - $325,062) | | 329,758 | | | 95.44 | % |
| REAL ESTATE INVESTMENT TRUSTS | | | | | | |
| 95 | QTS Realty Trust, Inc. - Class A | | 5,894 | | | 1.71 | % |
| Total for Real Estate Investment Trusts (Cost $5,877) | | | | | | |
| MONEY MARKET FUNDS | | | | | | |
| 30,858 | Fidelity Investments Money Market Government Portfolio - | | 30,858 | | | 8.93 | % |
| | Class I 0.01% *** | | | | | | |
| Total for Money Market Funds (Cost $30,858) | | | | | | |
| | Total Investments (Cost - $361,797) | | 366,510 | | | 106.08 | % |
| | Liabilities in Excess of Other Assets | | (20,993 | ) | | -6.08 | % |
| | Net Assets | $ | 345,517 | | | 100.00 | % |
* Non-Income Producing Securities.
*** The rate shown represents the 7-day yield at March 31, 2021.
The accompanying notes are an integral part of these
financial statements. |
2021 Semi-Annual Report 7
| Advisors Capital Tactical Fixed Income Fund |
| | | | Schedule of Investments |
| | | | March 31, 2021 (Unaudited) |
| Shares | | Fair Value | | % of Net Assets |
| |
| EXCHANGE TRADED FUNDS | | | | | | |
| Fixed Income | | | | | | |
| 167 | iShares Broad USD Investment Grade Corporate Bond ETF | $ | 9,860 | | | | |
| 429 | iShares 0-5 Year High Yield Corporate Bond ETF | | 19,653 | | | | |
| 1,625 | SPDR® Portfolio Intermediate Term Corporate Bond ETF (a) | | 58,906 | | | | |
| 602 | Vanguard Intermediate-Term Corporate Bond ETF (b) | | 56,004 | | | | |
| 197 | Xtrackers USD High Yield Corporate Bond ETF | | 9,848 | | | | |
| | | | 154,271 | | | 78.00 | % |
| Hybrid | | | | | | | |
| 387 | Global X U.S. Preferred ETF | | 9,872 | | | | |
| 1,973 | Invesco Preferred ETF | | 29,595 | | | | |
| | | | 39,467 | | | 19.95 | % |
| Total for Exchange Traded Funds (Cost - $193,149) | | 193,738 | | | 97.95 | % |
| MONEY MARKET FUNDS | | | | | | |
| 13,994 | Fidelity Investments Money Market Government Portfolio - | | 13,994 | | | 7.08 | % |
| | Class I 0.01% *** | | | | | | |
| Total for Money Market Funds (Cost $13,994) | | | | | | |
| |
| | Total Investments (Cost - $207,143) | | 207,732 | | | 105.03 | % |
| | Liabilities in Excess of Other Assets | | (9,942 | ) | | -5.03 | % |
| | Net Assets | $ | 197,790 | | | 100.00 | % |
(a) Additional information, including current Prospectus and Annual Report, is available at
https://www.ssga.com/us/en/institutional/etfs/funds/spdr-portfolio-intermediate-term-corporate-bond-etf-spib.
(b) Additional information, including current Prospectus and Annual Report, is available at
https://investor.vanguard.com/etf/profile/VCIT.
*** The rate shown represents the 7-day yield at March 31, 2021. |
The accompanying notes are an integral part of these
financial statements. |
2021 Semi-Annual Report 8
| Advisors Capital Funds |
| | |
| Statements of Assets and Liabilities (Unaudited) | | US Dividend | | | | Small/Mid | | |
| March 31, 2021 | | Fund | | | | Cap Fund | | |
| | |
| Assets: | | | | | | | | |
| Investment Securities at Fair Value* | $ | 372,885 | | | $ | 366,510 | | |
| Receivable for Fund Shares Sold | | 57 | | | | 57 | | |
| Dividends Receivable | | 51 | | | | - | | |
| Total Assets | | 372,993 | | | | 366,567 | | |
| Liabilities: | | | | | | | | |
| Payable for Securities Purchased | | 25,838 | | | | 20,902 | | |
| Management Fees Payable | | 128 | | | | 126 | | |
| Distribution Fees Payable | | 23 | | | | 22 | | |
| Total Liabilities | | 25,989 | | | | 21,050 | | |
| Net Assets | $ | 347,004 | | | $ | 345,517 | | |
| Net Assets Consist of: | | | | | | | | |
| Paid In Capital | $ | 340,953 | | | $ | 340,952 | | |
| Total Distributable Earnings | | 6,051 | | | | 4,565 | | |
| Net Assets | $ | 347,004 | | | $ | 345,517 | | |
| | |
| Net Asset Value, Offering Price and Redemption Price per Share | $ | 10.16 | | | $ | 9.91 | | |
| | |
| * Investments at Identified Cost | $ | 366,734 | | | $ | 361,797 | | |
| | |
| Shares Outstanding (Unlimited number of shares | | 34,165 | | | | 34,876 | | |
| authorized without par value) | | | | | | | | |
| | |
| Statements of Operations (Unaudited) | | | | | | | | |
| For the period March 19, 2021** through March 31, 2021 | | �� | | | | | | |
| | |
| Investment Income: | | | | | | | | |
| Dividends | $ | 51 | | | $ | - | | |
| Total Investment Income | | 51 | | | | - | | |
| Expenses: | | | | | | | | |
| Management Fees (Note 4) | | 128 | | | | 126 | | |
| Distribution Fees (Note 5) | | 23 | | | | 22 | | |
| Total Expenses | | 151 | | | | 148 | | |
| | |
| Net Investment Loss | | (100 | ) | | | (148 | ) | |
| | |
| Realized and Unrealized Gain on Investments: | | | | | | | | |
| Net Realized Gain on Investments | | - | | | | - | | |
| Net Change in Net Unrealized Appreciation on Investments | | 6,151 | | | | 4,713 | | |
| Net Realized and Unrealized Gain on Investments | | 6,151 | | | | 4,713 | | |
| | |
| Net Increase in Net Assets from Operations | $ | 6,051 | | | $ | 4,565 | | |
** Commencement of Operations.
The accompanying notes are an integral part of these
financial statements. |
2021 Semi-Annual Report 9
| Advisors Capital Funds |
| | |
| Statement of Assets and Liabilities (Unaudited) | | Tactical Fixed | | |
| March 31, 2021 | | Income | | |
| | | Fund | | |
| | |
| Assets: | | | | |
| Investment Securities at Fair Value* | $ | 207,732 | | |
| Cash | | 1,000 | | |
| Receivable for Fund Shares Sold | | 29 | | |
| Total Assets | | 208,761 | | |
| Liabilities: | | | | |
| Payable for Fund Shares Redeemed | | | | |
| Payable for Securities Purchased | | 10,883 | | |
| Management Fees Payable | | 75 | | |
| Distribution Fees Payable | | 13 | | |
| Total Liabilities | | 10,971 | | |
| Net Assets | $ | 197,790 | | |
| Net Assets Consist of: | | | | |
| Paid In Capital | $ | 197,245 | | |
| Total Distributable Earnings | | 545 | | |
| Net Assets | $ | 197,790 | | |
| | |
| Net Asset Value, Offering Price and Redemption Price per Share | $ | 10.05 | | |
| | |
| * Investments at Identified Cost | $ | 207,143 | | |
| | |
| Shares Outstanding (Unlimited number of shares | | 19,683 | | |
| authorized without par value) | | | | |
| | |
| Statement of Operations (Unaudited) | | | | |
| For the period March 19, 2021** through March 31, 2021 | | | | |
| | |
| Investment Income: | | | | |
| Dividends | $ | 44 | | |
| Total Investment Income | | 44 | | |
| Expenses: | | | | |
| Management Fees (Note 4) | | 75 | | |
| Distribution Fees (Note 5) | | 13 | | |
| Total Expenses | | 88 | | |
| | |
| Net Investment Loss | | (44 | ) | |
| | |
| Realized and Unrealized Gain on Investments: | | | | |
| Net Realized Gain on Investments | | - | | |
| Net Change in Net Unrealized Appreciation on Investments | | 589 | | |
| Net Realized and Unrealized Gain on Investments | | 589 | | |
| | |
| Net Increase in Net Assets from Operations | $ | 545 | | |
** Commencement of Operations.
The accompanying notes are an integral part of these
financial statements. |
2021 Semi-Annual Report 10
| Advisors Capital Funds |
| | |
| | | US Dividend | | | | Small/Mid Cap | | |
| Statements of Changes in Net Assets | | Fund | | | | Fund | | |
| | | (Unaudited) | | | | (Unaudited) | | |
| | | 3/19/2021* | | | | 3/19/2021* | | |
| | | to | | | | to | | |
| | | 3/31/2021 | | | | 3/31/2021 | | |
| From Operations: | | | | | | | | |
| Net Investment Loss | $ | (100 | ) | | $ | (148 | ) | |
| Net Realized Gain on Investments | | - | | | | - | | |
| Net Change in Unrealized Appreciation on Investments | | 6,151 | | | | 4,713 | | |
| Net Increase in Net Assets from Operations | | 6,051 | | | | 4,565 | | |
| From Distributions to Shareholders: | | - | | | | - | | |
| From Capital Share Transactions: | | | | | | | | |
| Proceeds From Sale of Shares | | 340,953 | | | | 340,952 | | |
| Shares Issued on Reinvestment of Dividends | | - | | | | - | | |
| Cost of Shares Redeemed | | - | | | | - | | |
| Net Increase from Shareholder Activity | | 340,953 | | | | 340,952 | | |
| Net Increase in Net Assets | | 347,004 | | | | 345,517 | | |
| | |
| Net Assets at Beginning of Period | | - | | | | - | | |
| | |
| Net Assets at End of Period | $ | 347,004 | | | $ | 345,517 | | |
| | |
| | |
| Share Transactions: | | | | | | | | |
| Issued | | 34,165 | | | | 34,876 | | |
| Reinvested | | - | | | | - | | |
| Redeemed | | - | | | | - | | |
| Net Increase in Shares | | 34,165 | | | | 34,876 | | |
| Shares Outstanding Beginning of Period | | - | | | | - | | |
| Shares Outstanding End of Period | | 34,165 | | | | 34,876 | | |
* Commencement of Operations.
The accompanying notes are an integral part of these
financial statements. |
2021 Semi-Annual Report 11
| Advisors Capital Funds |
| | |
| | | Tactical Fixed | | |
| Statement of Changes in Net Assets | | Income Fund | | |
| | | (Unaudited) | | |
| | | 3/19/2021* | | |
| | | to | | |
| | | 3/31/2021 | | |
| From Operations: | | | | |
| Net Investment Loss | $ | (44 | ) | |
| Net Realized Gain on Investments | | - | | |
| Net Change in Unrealized Appreciation on Investments | | 589 | | |
| Net Increase in Net Assets from Operations | | 545 | | |
| | |
| From Distributions to Shareholders: | | - | | |
| | |
| From Capital Share Transactions: | | | | |
| Proceeds From Sale of Shares | | 197,285 | | |
| Shares Issued on Reinvestment of Dividends | | - | | |
| Cost of Shares Redeemed | | (40 | ) | |
| Net Increase from Shareholder Activity | | 197,245 | | |
| Net Increase in Net Assets | | 197,790 | | |
| | |
| Net Assets at Beginning of Period | | - | | |
| | |
| Net Assets at End of Period | $ | 197,790 | | |
| | |
| | |
| Share Transactions: | | | | |
| Issued | | 19,687 | | |
| Reinvested | | - | | |
| Redeemed | | (4 | ) | |
| Net Increase in Shares | | 19,683 | | |
| Shares Outstanding Beginning of Period | | - | | |
| Shares Outstanding End of Period | | 19,683 | | |
* Commencement of Operations.
The accompanying notes are an integral part of these
financial statements. |
2021 Semi-Annual Report 12
| Advisors Capital US Dividend Fund |
| | |
| Financial Highlights | | | | |
| | | (Unaudited) | | |
| Selected data for a share outstanding throughout the period: | | 3/19/2021* | | |
| | | to | | |
| | | 3/31/2021 | | |
| Net Asset Value - Beginning of Period | $ | 10.00 | | |
| Net Investment Loss (a) | | - | | + |
| Net Gain on Investments (Realized and Unrealized) (b) | | 0.16 | | |
| Total from Investment Operations | | 0.16 | | |
| Distributions (From Net Investment Income) | | - | | |
| Distributions (From Capital Gains) | | - | | |
| Total Distributions | | - | | |
| Net Asset Value - End of Period | $ | 10.16 | | |
| Total Return (c) | | 1.60% | | ** |
| | |
| Ratios/Supplemental Data | | | | |
| Net Assets - End of Period (Thousands) | $ | 347 | | |
| | |
| Ratio of Expenses to Average Net Assets | | 1.99% | | *** |
| Ratio of Net Investment Loss to Average Net Assets | | (1.31)% | | *** |
| | |
| Portfolio Turnover Rate | | 0.00% | | ** |
* Commencement of Operations.
** Not Annualized.
*** Annualized.
+ Less than $0.005 per share.
(a) Per share amounts were calculated using the average shares method.
(b) Realized and unrealized gains and losses per share in this caption are balancing amounts
necessary to reconcile the change in net asset value for the period, and may not reconcile
with the aggregate gains and losses in the Statement of Operations due to share transactions
for the period.
(c) Total return represents the rate that the investor would have earned or lost on an
investment in the Fund assuming reinvestment of dividends and distributions, if any. |
The accompanying notes are an integral part of these
financial statements. |
2021 Semi-Annual Report 13
| Advisors Capital Small/Mid Cap Fund |
| | |
| Financial Highlights | | | | |
| | | (Unaudited) | | |
| Selected data for a share outstanding throughout the period: | | 3/19/2021* | | |
| | | to | | |
| | | 3/31/2021 | | |
| Net Asset Value - Beginning of Period | $ | 10.00 | | |
| Net Investment Loss (a) | | (0.01 | ) | |
| Net Gain on Investments (Realized and Unrealized) (b) | | (0.08 | ) | |
| Total from Investment Operations | | (0.09 | ) | |
| Distributions (From Net Investment Income) | | - | | |
| Distributions (From Capital Gains) | | - | | |
| Total Distributions | | - | | |
| | |
| Net Asset Value - End of Period | $ | 9.91 | | |
| Total Return (c) | | (0.90)% | | ** |
| Ratios/Supplemental Data | | | | |
| Net Assets - End of Period (Thousands) | $ | 346 | | |
| Ratio of Expenses to Average Net Assets | | 1.99% | | *** |
| Ratio of Net Investment Loss to Average Net Assets | | (1.99)% | | *** |
| Portfolio Turnover Rate | | 0.00% | | ** |
* Commencement of Operations.
** Not Annualized.
*** Annualized.
(a) Per share amounts were calculated using the average shares method.
(b) Realized and unrealized gains and losses per share in this caption are balancing amounts
necessary to reconcile the change in net asset value for the period, and may not reconcile
with the aggregate gains and losses in the Statement of Operations due to share transactions
for the period.
(c) Total return represents the rate that the investor would have earned or lost on an
investment in the Fund assuming reinvestment of dividends and distributions, if any. |
The accompanying notes are an integral part of these
financial statements. |
2021 Semi-Annual Report 14
| Advisors Capital Tactical Fixed Income Fund |
| | |
| Financial Highlights | | | | |
| | | (Unaudited) | | |
| Selected data for a share outstanding throughout the period: | | 3/19/2021* | | |
| | | to | | |
| | | 3/31/2021 | | |
| Net Asset Value - Beginning of Period | $ | 10.00 | | |
| Net Investment Loss (a) (e) | | - | | + |
| Net Gain on Investments (Realized and Unrealized) (b) | | 0.05 | | |
| Total from Investment Operations | | 0.05 | | |
| Distributions (From Net Investment Income) | | - | | |
| Distributions (From Capital Gains) | | - | | |
| Total Distributions | | - | | |
| Net Asset Value - End of Period | $ | 10.05 | | |
| Total Return (c) | | 0.50% | | ** |
| | |
| Ratios/Supplemental Data | | | | |
| Net Assets - End of Period (Thousands) | $ | 198 | | |
| Ratio of Expenses to Average Net Assets (d) | | 1.99% | | *** |
| Ratio of Net Investment Loss to Average Net Assets (d) (e) | | (0.99)% | | *** |
| Portfolio Turnover Rate | | 0.00% | | ** |
* Commencement of Operations.
** Not Annualized.
*** Annualized.
+ Less than $0.005 per share.
(a) Per share amounts were calculated using the average shares method.
(b) Realized and unrealized gains and losses per share in this caption are balancing amounts
necessary to reconcile the change in net asset value for the period, and may not reconcile
with the aggregate gains and losses in the Statement of Operations due to share transactions
for the period.
(c) Total return represents the rate that the investor would have earned or lost on an
investment in the Fund assuming reinvestment of dividends and distributions, if any.
(d) These ratios exclude the impact of expenses of the underlying investment security holdings
listed in the Schedule of Investments.
(e) Recognition of the net investment income/(loss) by the Fund is affected by the timing of the
declaration of dividends by the underlying investment security holdings listed on the Schedule
of Investments. |
The accompanying notes are an integral part of these
financial statements. |
2021 Semi-Annual Report 15
NOTES TO FINANCIAL STATEMENTS
ADVISORS CAPITAL FUNDS
MARCH 31, 2021
(UNAUDITED) |
1.) ORGANIZATION
The Advisors Capital Funds (the “Funds”) are series of Neiman Funds (the “Trust”). The Trust is an open-end investment company established under the laws of Ohio by an Agreement and Declaration of Trust dated January 3, 2003, that offers shares of beneficial interest in a number of separate series, each series representing a distinct fund with its own investment objectives and policies. Advisors Capital US Dividend Fund (“US Dividend Fund”), Advisors Capital Small/Mid Cap Fund (“Small/Mid Cap Fund”), and Advisors Capital Tactical Fixed Income Fund (“Tactical Fixed Income Fund”) (each a “Fund” and collectively the “Funds”) were each organized as a diversified series of the Trust, on February 1, 2021, and commenced operations on March 19, 2021. The investment advisor to the Funds is AC Funds, LLC (the “Advisor”). The sub-advisor to the Funds is Advisors Capital Management, LLC (the “Sub-Advisor”).
2.) SIGNIFICANT ACCOUNTING POLICIES
The Funds are investment companies and accordingly follow the investment company accounting and reporting guidance of the Financial Accounting Standards Board (“FASB”) Accounting Standards Codification Topic 946 Financial Services - Investment Companies. The financial statements are prepared in conformity with accounting principles generally accepted in the United States of America (“GAAP”). The Funds follow the significant accounting policies described in this section.
SECURITY VALUATION
All investments in securities are recorded at their estimated fair value, as described in Note 3.
SHARE VALUATION
Each Fund’s net asset value (the “NAV”) is calculated as of the close of trading on the New York Stock Exchange (the “Exchange”) (normally 4:00 p.m. Eastern time) every day the Exchange is open. The NAV for each Fund is calculated by taking the total value of the Fund’s assets, subtracting its liabilities, and then dividing by the total number of shares outstanding, rounded to the nearest cent.
FEDERAL INCOME TAXES
The Funds’ policy is to comply with the requirements of the Internal Revenue Code that are applicable to regulated investment companies and to distribute all of their taxable income to shareholders. Therefore, no federal income tax provision is required. It is the Funds’ policy to distribute annually, prior to the end of the calendar year, dividends sufficient to satisfy excise tax requirements of the Internal Revenue Code. This Internal Revenue Code requirement may cause an excess of distributions over the book year-end accumulated income. In addition, it is the Funds’ policy to distribute annually, after the end of the fiscal year, any remaining net investment income and net realized capital gains.
The Funds recognize the tax benefits of certain tax positions only where the position is “more likely than not” to be sustained assuming examination by tax authorities. Management has analyzed the Funds’ tax positions, and has concluded that no liability for unrecognized tax benefits should be recorded related to uncertain tax positions taken on returns filed for open tax years. The Funds identify their major tax jurisdictions as U.S. Federal and State tax authorities; however the Funds are not aware of any tax positions for which it is reasonably possible that the total amounts of unrecognized tax benefits will change materially in the next twelve months. The Funds recognize interest and penalties, if any, related to unrecognized tax benefits as income tax expense on the Statements of Operations. During the period March 19, 2021 through March 31, 2021, the Funds did not incur any interest or penalties.
DISTRIBUTIONS TO SHAREHOLDERS
Distributions to shareholders, which are determined in accordance with income tax regulations, are recorded on the ex-dividend date. The Funds may utilize earnings and profits distributed to shareholders on redemptions of shares as part of the dividends paid deduction. The treatment for financial reporting purposes of distributions made to shareholders during the year from net investment income or net realized capital gains may differ from their ultimate treatment for federal income tax purposes. These differences are caused primarily by differences in the timing of recognition of certain components of income, expense or realized capital gain for federal income tax purposes. Where such differences are permanent in nature, they are reclassified in the components of the net assets based on their ultimate characterization for federal income tax purposes. Any such reclassification will have no effect on net assets, results of operations or net asset values per share of any Fund.
2021 Semi-Annual Report 16
Notes to Financial Statements (Unaudited) - continued
USE OF ESTIMATES
The financial statements are prepared in accordance with GAAP, which requires management to make estimates and assumptions that affect the reported amounts of assets and liabilities and disclosure of contingent assets and liabilities at the date of the financial statements and the reported amounts of increases and decreases in net assets from operations during the reporting period. Actual results could differ from those estimates.
OTHER
The Funds record security transactions based on trade date for financial reporting purposes. Dividend income is recognized on the ex-dividend date, and interest income, if any, is recognized on an accrual basis. The Funds use the specific identification method in computing gain or loss on the sale of investment securities. Long-term capital gain distributions are recorded as capital gain distributions from investment companies, and short-term capital gain distributions are recorded as dividend income.
The Funds may invest in real estate investment trusts (“REITs”) that pay distributions to their shareholders based on available funds from operations. It is common for these distributions to exceed the REITs taxable earnings and profits resulting in the excess portion of such distribution to be designated as return of capital. Distributions received from REITs are generally recorded as dividend income and, if necessary, are reclassified annually in accordance with tax information provided by the underlying REITs. Withholding taxes on foreign dividends have been provided for in accordance with the Funds’ understanding of the applicable country’s tax rules and rates
ORGANIZATIONAL & OFFERING EXPENSES
All costs incurred by the Funds in connection with the organization, offering and initial registration of each Fund, principally professional fees, were paid on behalf of the Funds by the Advisor and will not be born by the Funds and are not recoupable in the future.
EXPENSES
Expenses incurred by the Trust that do not relate to a specific fund of the Trust are allocated to the individual Fund based on each Fund’s relative net assets or by another appropriate method.
3.) SECURITIES VALUATIONS
The Funds utilize various methods to measure the fair value of their investments on a recurring basis. GAAP establishes a hierarchy that prioritizes inputs to valuation methods. The three levels of inputs are:
Level 1 - Unadjusted quoted prices in active markets for identical assets or liabilities.
Level 2 - Observable inputs other than quoted prices included in level 1 that are observable for the asset or liability, either directly or indirectly. These inputs may include quoted prices for the identical instrument on an inactive market, prices for similar instruments, interest rates, prepayment speeds, credit risk, yield curves, default rates and similar data.
Level 3 - Unobservable inputs for the asset or liability, to the extent relevant observable inputs are not available, representing the Funds’ own assumptions about the assumptions a market participant would use in valuing the asset or liability, and would be based on the best information available.
The availability of observable inputs can vary from security to security and is affected by a wide variety of factors, including, for example, the type of security, whether the security is new and not yet established in the marketplace, the liquidity of markets, and other characteristics particular to the security. To the extent that valuation is based on models or inputs that are less observable or unobservable in the market, the determination of fair value requires more judgment. Accordingly, the degree of judgment exercised in determining fair value is greatest for instruments categorized in level 3.
The inputs used to measure fair value may fall into different levels of the fair value hierarchy. In such cases, for disclosure purposes, the level in the fair value hierarchy within which the fair value measurement falls in its entirety, is determined based on the lowest level input that is significant to the fair value measurement in its entirety.
FAIR VALUE MEASUREMENTS
A description of the valuation techniques applied to the Funds’ major categories of assets measured at fair value on a recurring basis follows.
Equity securities (common stocks, including ADRs, exchange traded funds and real estate investment trusts). Equity securities generally are valued by using market quotations, but may be valued on the basis of
2021 Semi-Annual Report 17
Notes to Financial Statements (Unaudited) - continued
prices furnished by a pricing service when the Advisor believes such prices accurately reflect the fair value of such securities. Securities that are traded on any stock exchange or on the NASDAQ over-the-counter market are generally valued by the pricing service at the last quoted sale price. Lacking a last sale price, an equity security is generally valued by the pricing service at its last bid price. Generally, if the security is traded in an active market and is valued at the last sale price, the security is categorized as a level 1 security, and if an equity security is valued by the pricing service at its last bid price, it is generally categorized as a level 2 security. When market quotations are not readily available, when the Advisor determines that the market quotation or the price provided by the pricing service does not accurately reflect the current fair value, or when restricted securities are being valued, such securities are valued as determined in good faith by the Advisor, subject to review of the Board of Trustees (the “Trustees” or the “Board”) and are categorized in level 2 or level 3, when appropriate.
Money market funds. Money market funds are valued at net asset value provided by the funds and are classified in level 1 of the fair value hierarchy.
In accordance with the Trust’s good faith pricing guidelines, the Advisor is required to consider all appropriate factors relevant to the value of securities for which it has determined other pricing sources are not available or reliable as described above. There is no single standard for determining fair value, since fair value depends upon the circumstances of each individual case. As a general principle, the current fair value of an issue of securities being valued by the Advisor would appear to be the amount which the owner might reasonably expect to receive for them upon their current sale. Methods which are in accordance with this principle may, for example, be based on (i) a multiple of earnings; (ii) a discount from market of a similar freely traded security (including a derivative security or a basket of securities traded on other markets, exchanges or among dealers); or (iii) yield to maturity with respect to debt issues, or a combination of these and other methods.
The following tables summarize the inputs used to value each Fund’s assets measured at fair value as of March 31, 2021:
| US Dividend Fund: | | | | | | |
| Valuation Inputs of Assets | | Level 1 | Level 2 | Level 3 | | Total |
| Common Stocks | | $331,928 | $ - | $ - | | $331,928 |
| Real Estate Investment Trusts | | 7,978 | - | - | | 7,978 |
| Money Market Funds | | 32,979 | - | - | | 32,979 |
| Total | | $372,885 | $ - | $ - | | $372,885 |
| |
| Small/Mid Cap Fund: | | | | | | |
| Valuation Inputs of Assets | | Level 1 | Level 2 | Level 3 | | Total |
| Common Stocks | | $329,758 | $ - | $ - | | $329,758 |
| Real Estate Investment Trusts | | 5,894 | - | - | | 5,894 |
| Money Market Funds | | 30,858 | - | - | | 30,858 |
| Total | | $366,510 | $ - | $ - | | $366,510 |
| |
| Tactical Fixed Income Fund: | | | | | | |
| Valuation Inputs of Assets | | Level 1 | Level 2 | Level 3 | | Total |
| Exchange Traded Funds | | $193,738 | $ - | $ - | | $193,738 |
| Money Market Funds | | 13,994 | - | - | | 13,994 |
| Total | | $207,732 | $ - | $ - | | $207,732 |
The Funds did not hold any level 3 assets during the period March 19, 2021 through March 31, 2021.
The Funds did not invest in derivative instruments during the period March 19, 2021 through March 31, 2021.
4.) INVESTMENT ADVISORY AGREEMENT
The Funds have entered into an investment advisory agreement (“Management Agreement”) with the Advisor. The Advisor manages the investment portfolio of each Fund, subject to the policies adopted by the Trust’s Board of Trustees. Under the Management Agreement, the Advisor, at its own expense and without reimbursement from the Trust, furnishes office space and all necessary office facilities, equipment and executive personnel necessary for managing the assets of each Fund. The Advisor receives a per-Fund fee equal to an annual fee of 1.69% of each Fund's average daily net assets. The Sub-Advisor of the Funds has responsibility for providing investment ideas and recommendations for the assets of the Funds, subject to the supervision of the Advisor. As full compensation for all services rendered, including investment ideas and recommendations for the assets of the Funds, the Advisor pays the Sub-Advisor a sub-advisor fee.
2021 Semi-Annual Report 18
Notes to Financial Statements (Unaudited) - continued
For the period March 19, 2021 through March 31, 2021, the Advisor earned management fees in the amounts of $128, $126, and $75 for the US Dividend Fund, Small/Mid Cap Fund and Tactical Fixed Income Fund, respectively. At March 31, 2021, $128, $126 and $75 was due to the Advisor from US Dividend Fund, Small/Mid Cap Fund and Tactical Fixed Income Fund, respectively.
5.) DISTRIBUTION AND SHAREHOLDER SERVICING PLAN
The Funds have adopted a plan pursuant to Rule 12b-1 under the 1940 Act (the “Plan”) that allows each Fund to pay distribution and other fees (“Rule 12b-1 Fees”) for the sale and distribution of the Fund’s shares and for services provided to shareholders by the Distributor or other service providers. The Plan permits the Funds to pay the Rule 12b-1 Fees as compensation for services and expenses in connection with the distribution each Fund shares. The Distributor must authorize all payments made under the plan and may pay any or all amounts received under the Plan to other persons for any distribution, promotional or shareholder support services. Up to 0.25% of the Rule 12b-1 Fee may be characterized as a shareholder servicing fee. Each Fund pays an annual Rule 12b-1 Fee equal to 0.30% of its average daily net assets.
During the period March 19, 2021 through March 31, 2021, there was $23, $22, and $13 of 12b-1 fees incurred by the US Dividend Fund, Small/Mid Cap Fund and Tactical Fixed Income Fund, respectively. As of March 31, 2021, the Funds had an accrued liability of $23, $22, and $13 for the US Dividend Fund, Small/Mid Cap Fund and Tactical Fixed Income Fund, respectively, which represents 12b-1 fees accrued and available for payment for qualified expenses under the Plan.
6.) RELATED PARTY TRANSACTIONS
Neiman Funds Management LLC (“Neiman”), acts as Administrative Service Consultant to the Trust and monitors the performance of the Funds’ outside service providers (other than the Sub-Advisor which is monitored by the Advisor), assists in the review of regulatory filings, financial statement preparation, and board meeting materials pursuant to a supervisory agreement. For its services Neiman receives a monthly fee from the Advisor.
In addition, Daniel Neiman of Neiman serves as an officer, including the Chief Compliance Officer, of the Trust. Mr. Neiman is compensated by the Advisor for serving as the Chief Compliance Officer for the Funds.
The Trustees who are not interested persons of the Funds were each paid $750, for a total of $2,250, in Trustees fees for the period March 19, 2021 through March 31, 2021 for the Trust. Under the Management Agreement, the Advisor pays these fees.
7.) INVESTMENTS
For the period March 19, 2021 through March 31, 2021, purchases and sales of investment securities other than U.S. Government obligations and short-term investments were as follows:
| | | US Dividend | | Small/Mid | | Tactical Fixed |
| | | Fund | | Cap Fund | | Income Fund |
| Purchases | | $333,755 | | $330,939 | | $193,149 |
| Sales | | $0 | | $0 | | $0 |
There were no purchases or sales of U.S. Government obligations.
8.) CONTROL OWNERSHIP
The beneficial ownership, either directly or indirectly, of more than 25% of the voting shares of a fund creates a presumption of control of the fund, under section 2(a)(9) of the Investment Company Act of 1940, as amended. At March 31, 2021, National Financial Services, LLC, located in New York, New York, for the benefit of its customers, held, in aggregate, 64.86% of US Dividend Fund, and therefore also may be deemed to control the US Dividend Fund. Also, Ameritrade, located in Omaha, Nebraska, for the benefit of its customers, held, in aggregate, 34.41% of US Dividend Fund, and therefore also may be deemed to control the US Dividend Fund. National Financial Services, LLC, located in New York, New York, for the benefit of its customers, held, in aggregate, 65.58% of Small/Mid Cap Fund, and therefore also may be deemed to control the Small/Mid Cap Fund. Also, Ameritrade, located in Omaha, Nebraska, for the benefit of its customers, held, in aggregate, 33.71% of Small/Mid Cap Fund, and therefore also may be deemed to control the Small/Mid Cap Fund. National Financial Services, LLC, located in New York, New York, for the benefit of its customers, held, in aggregate, 68.87% of Tactical Fixed Income Fund, and therefore also may be deemed to control the Tactical Fixed Income Fund. Also, Ameritrade, located in Omaha, Nebraska, for the benefit of its customers, held, in aggregate, 29.86% of Tactical Fixed Income Fund, and therefore also may be deemed to control the Tactical Fixed Income Fund. The Funds do not know whether any underlying accounts of National Financial Services, LLC or Ameritrade, owned or controlled 25% or more of the voting securities of each Fund.
2021 Semi-Annual Report 19
Notes to Financial Statements (Unaudited) - continued
9.) TAX MATTERS
For federal income tax purposes, at March 31, 2021 the cost of securities on a tax basis and the composition of gross unrealized appreciation (the excess of value over tax cost) and depreciation (the excess of tax cost over value) were as follows:
| | | US Dividend | | | Small/Mid | | | Tactical Fixed | |
| | | Fund | | | Cap Fund | | | Income Fund | |
| Cost of Investments | | $366,734 | | | $361,797 | | | $207,143 | |
| |
| Gross Unrealized Appreciation | | $ 7,249 | | | $ 8,048 | | | $ 647 | |
| Gross Unrealized Depreciation | | (1,098) | | | (3,335) | | | (58) | |
| Net Unrealized Appreciation | | | | | | | | | |
| (Depreciation) on Investments | | $ 6,151 | | | $ 4,713 | | | $ 589 | |
The Funds did not pay any distributions during the period March 19, 2021 through March 31, 2021.
10.) CONCENTRATION OF SECTOR RISK
If a Fund has significant investments in the securities of issuers in industries within a particular sector, any development affecting that sector will have a greater impact on the value of the net assets of the Fund than would be the case if the Fund did not have significant investments in that sector. In addition, this may increase the risk of loss of an investment in the Fund and increase the volatility of the Fund’s NAV per share. From time to time, circumstances may affect a particular sector and the companies within such sector. For instance, economic or market factors, regulation or deregulation, and technological or other developments may negatively impact all companies in a particular sector and therefore the value of a Fund’s portfolio will be adversely affected. As of March 31, 2021, the US Dividend Fund had 27.68% of the value of its net assets invested in stocks within the Information Technology sector.
11.) COVID-19 RISKS
Unexpected local, regional or global events, such as war; acts of terrorism; financial, political or social disruptions; natural, environmental or man-made disasters; the spread of infectious illnesses or other public health issues; and recessions and depressions could have a significant impact on each Fund and its investments and may impair market liquidity. Such events can cause investor fear, which can adversely affect the economies of nations, regions and the market in general, in ways that cannot necessarily be foreseen. An outbreak of infectious respiratory illness known as COVID-19, which is caused by a novel coronavirus (SARS-CoV-2), was first detected in China in December 2019 and subsequently spread globally. This coron-avirus has resulted in, among other things, travel restrictions, closed international borders, enhanced health screenings at ports of entry and elsewhere, disruption of and delays in healthcare service preparation and delivery, prolonged quarantines, significant disruptions to business operations, market closures, cancellations and restrictions, supply chain disruptions, lower consumer demand, and significant volatility and declines in global financial markets, as well as general concern and uncertainty. The impact of COVID-19 has adversely affected, and other infectious illness outbreaks that may arise in the future could adversely affect, the economies of many nations and the entire global economy, individual issuers and capital markets in ways that cannot necessarily be foreseen. Public health crises caused by the COVID-19 outbreak may exacerbate other pre-existing political, social and economic risks in certain countries or globally. The duration of the COVID-19 outbreak and its effects cannot be determined with certainty.
12.) SUBSEQUENT EVENTS
Subsequent events after the date of the Statements of Assets and Liabilities have been evaluated through the date the financial statements were issued. Management has concluded that there is no impact requiring adjustment to or disclosure in the financial statements.
2021 Semi-Annual Report 20
DISCLOSURE OF EXPENSES
(Unaudited) |
The ongoing costs to shareholders associated with the US Dividend Fund, Small/Mid Cap Fund and Tactical Fixed Income Fund consist solely of management fees and distribution and/or service (12b-1) fees. Although the Funds charge no sales loads or transaction fees, you will be assessed fees for outgoing wire transfers, returned checks and stop payment orders at prevailing rates charged by Mutual Shareholder Services, LLC, the Funds’ transfer agent. IRA accounts will be charged an $8.00 annual maintenance fee. The following example is intended to help you understand your ongoing costs of investing in the Funds and to compare these costs with similar costs of investing in other mutual funds. The example is based on an investment of $1,000 invested in the Funds on March 19, 2021 and held through March 31, 2021.
The first line of each table below provides information about actual account values and actual expenses. In order to estimate the expenses a shareholder paid during the period covered by this report, shareholders can divide their account value by $1,000 (for example, an $8,600 account value divided by $1,000 = 8.6) and then multiply the result by the number in the first line under the heading entitled “Expenses Paid During the Period.”
The second line of each table below provides information about hypothetical account values and hypothetical expenses based on the Funds’ actual expense ratios and an assumed rate of return of 5% per year before expenses, which is not the Funds’ actual return. The hypothetical account values and expenses may not be used to estimate the actual ending account balance or expenses paid by a shareholder for the period. Shareholders may use this information to compare the ongoing costs of investing in the Funds and other funds. In order to do so, compare these 5% hypothetical examples with the 5% hypothetical examples that appear in other funds’ shareholder reports.
Please note that the expenses shown in each table are meant to highlight your ongoing costs only and do not reflect any transactional costs, such as the annual maintenance fee charged to IRA accounts, redemption fees, or exchange fees. Therefore, the second line of the table is useful in comparing ongoing costs only, and will not help you determine the relative total costs of owning different funds. In addition, if these transactional costs were included, your costs would have been higher.
| US DIVIDEND FUND | | | | | | | |
| |
| | | | | | | Expenses Paid | |
| | | Beginning | | Ending | | During the Period | |
| | | Account Value | | Account Value | | March 19, 2021 to | |
| | | March 19, 2021 | | March 31, 2021 | | March 31, 2021 | |
| |
| Actual | | $1,000.00 | | $1,016.00 | | $0.71* | |
| |
| Hypothetical ** | | $1,000.00 | | $1,015.01 | | $10.00 | |
| (5% annual return | | | | | | | |
| before expenses) | | | | | | | |
| * | Expenses are equal to the Fund’s annualized expense ratio of 1.99%, multiplied by the average account value over the period, multiplied by 13/365 (to reflect the partial period). |
| |
| ** | The hypothetical example is calculated assuming that the Fund has been in operation for the full six-month period from October 1, 2020 to March 31, 2021. As a result, expenses shown in this row are equal to the Fund’s annualized expense ratio of 1.99%, multiplied by the average account value over the period, multiplied by 182/365 (to reflect the one-half year period). |
| |
2021 Semi-Annual Report 21
| Disclosure of Expenses (Unaudited) - continued | | | |
| |
| SMALL/MID CAP FUND | | | | | | | |
| |
| | | | | | | Expenses Paid | |
| | | Beginning | | Ending | | During the Period | |
| | | Account Value | | Account Value | | March 19, 2021 to | |
| | | March 19, 2021 | | March 31, 2021 | | March 31, 2021 | |
| |
| Actual | | $1,000.00 | | $991.00 | | $0.71* | |
| |
| Hypothetical ** | | $1,000.00 | | $1,015.01 | | $10.00 | |
| (5% annual return | | | | | | | |
| before expenses) | | | | | | | |
| * | Expenses are equal to the Fund’s annualized expense ratio of 1.99%, multiplied by the average account value over the period, multiplied by 13/365 (to reflect the partial period). |
| |
| ** | The hypothetical example is calculated assuming that the Fund has been in operation for the full six-month period from October 1, 2020 to March 31, 2021. As a result, expenses shown in this row are equal to the Fund’s annualized expense ratio of 1.99%, multiplied by the average account value over the period, multiplied by 182/365 (to reflect the one-half year period). |
| |
| TACTICAL FIXED INCOME FUND | | | | | |
| |
| | | | | | | Expenses Paid | |
| | | Beginning | | Ending | | During the Period | |
| | | Account Value | | Account Value | | March 19, 2021 to | |
| | | March 19, 2021 | | March 31, 2021 | | March 31, 2021 | |
| |
| Actual | | $1,000.00 | | $1,005.00 | | $0.71* | |
| |
| Hypothetical ** | | $1,000.00 | | $1,015.01 | | $10.00 | |
| (5% annual return | | | | | | | |
| before expenses) | | | | | | | |
| * | Expenses are equal to the Fund’s annualized expense ratio of 1.99%, multiplied by the average account value over the period, multiplied by 13/365 (to reflect the partial period). |
| |
| ** | The hypothetical example is calculated assuming that the Fund has been in operation for the full six-month period from October 1, 2020 to March 31, 2021. As a result, expenses shown in this row are equal to the Fund’s annualized expense ratio of 1.99%, multiplied by the average account value over the period, multiplied by 182/365 (to reflect the one-half year period). |
| |
2021 Semi-Annual Report 22
ADDITIONAL INFORMATION
MARCH 31, 2021
(UNAUDITED) |
1.) APPROVAL OF INVESTMENT ADVISORY AGREEMENT
At a meeting of the Board of Trustees held on December 14, 2020, the Board of Trustees considered the approval of the management agreement (the “Agreement”) between the Trust and AC Funds, LLC (the “Advisor”), on behalf of Advisors Capital US Dividend Fund, Advisors Capital Small/Mid Cap Fund, and Advisors Capital Tactical Fixed Income Fund (the “Funds”). Legal Counsel reviewed the memorandum provided by Thompson Hine LLP and explained that, in consideration of the approval of the Agreement, the Board should review as much information as is reasonably necessary to evaluate the terms of the contract and determine whether it is fair to the Funds and their shareholders. It was also explained that the Advisor had provided information to the Trustees necessary for evaluation of approval of the Agreement.
In reviewing the Agreement, the Board of Trustees received materials from the Advisor addressing the following factors: (i) the investment performance of the Funds and the Advisor; (ii) the nature, extent and quality of the services provided by the Advisor to the Funds; (iii) the cost of the services to be provided and the profits to be realized by the Advisor and its affiliates from the relationships with the Funds; (iv) the extent to which economies of scale will be realized as the Funds grow; and (v) whether the fee level reflects these economies of scale for the benefit of each Fund’s shareholders.
In considering the nature, extent, and quality of the services to be provided by the Advisor, the Trustees reviewed the responsibilities of the Advisor under the Agreement including a description of the services to be provided by the Advisor and those services retained by Advisors Capital Management, LLC (the proposed “Sub-Advisor” to the Funds), the professional personnel performing services that would perform services for the Funds, including the team of individuals that primarily monitor and execute the investment process. The Trustees also considered a certification from the Advisor certifying that it has adopted a Code of Ethics containing provisions reasonably necessary to prevent Access Persons, as that term is defined in Rule 17j-1 under the 1940 Act, from engaging in conduct prohibited by Rule 17j-1(b) and that it has adopted procedures reasonably necessary to prevent Access Persons from violating such Code of Ethics. In reaching their conclusions, the Trustees considered that the Advisor will delegate day-to-day investment decisions of the Funds to a sub-advisor and will generally provide management and operational oversight of the Sub-Advisor. The Trustees then reviewed practices for monitoring compliance with the Funds’ investment limitations and concluded that such practices were adequate. The Trustees also considered the coordination of services for the Funds among the Advisor and the service providers and the Advisor’s expected interactions with the Independent Trustees; and the expected efforts of the Advisor to promote the Funds and grow their assets. The Trustees noted the Advisor’s commitment to retain qualified personnel and to maintain its resources and systems to serve the Funds. The Trustees evaluated the Advisor’s personnel, including the education and experience of their personnel. The Board reviewed and discussed with the Advisor’s Form ADV and discussed the professionalism of the representative from the Advisor and the overall quality of their presentation to the Board. After reviewing the foregoing information and further information in the materials provided by the Advisor, the Board concluded that, considering all the facts and circumstances, the nature, extent, and quality of the services to be provided by the Advisor were satisfactory and adequate for the Funds.
The Trustees noted that as the Advisor is newly formed it does not manage any other accounts with similar strategies as those used on behalf of the Funds. The Trustees considered the investment management experience of key personnel of the Advisor related to investment management, investment oversight processes, broker selection and the management of the various trading platforms that may be used by the Sub-Advisor to manage the Funds’ portfolios. The Trustees concluded that the Advisor should be able to provide satisfactory oversight of the Sub-Advisor. After considering all these factors, the Board determined that the Advisor’s experience should result in satisfactory performance for each of the Funds and their shareholders.
As to the cost of the services to be provided and the profits to be realized by the Advisor from the relationship with the Funds, it was noted that the Advisor is responsible under the Management Agreement for paying most of the operating expenses of the Funds under a quasi-unitary fee structure that limits operating expenses. The Trustees concluded that the Advisor has sufficient financial resources to honor its fee commitment based on the projected asset sizes of the Funds. It was noted that because the Funds are each a new fund the Advisor expects to make no management related profits in year-one of operations and only modest profits in year two. The Trustees then discussed the Advisor’s financial condition and found it satisfactory. The Trustees also considered the fee split between the Advisor and Sub-Advisor reasonable based on their relative responsibilities.
2021 Semi-Annual Report 23
Additional Information (Unaudited) - continued
Turning to the level of fees, the Trustees reviewed the management fee of each Fund compared it’s the expected category and Peer Group and noted that the management fee was above both the expected category average and the Peer Group’s average management fees for each of the Funds. They noted that for the Advisors Capital US Dividend Fund and Advisors Capital Tactical Fixed Income Fund the management fee was within the range of reasonable fees as compared to the expected category and Peer Group viewed together. They also noted that for Advisors Capital Small/Mid Cap Fund the management fee would be within the range of reasonable fees as compared to the expected category and Peer Group viewed together if even a modest adjustment was made to account for the operating expenses paid under the Management Agreement. The Trustees also noted that total expenses for each Fund were within the range of reasonable fees as compared to the respective expected category and Peer Group viewed together. Management stated and the Trustees noted that because these are new Funds, and the Advisor is responsible under the Management Agreement for paying most of the operating expenses of the Funds, they expect net management to be substantially lower in the first few years of operation for each Fund.
As for potential economies of scale, the Trustees noted that since the Funds are new, economies of scale with respect to the management of the Funds will be considered as the Funds grow.
Next, the Independent Trustees met in executive session to discuss the approval of the Agreement. The officers of the Trust were excused during this discussion.
Upon reconvening, it was the Board’s consensus (including a majority of the Independent Trustees) that the fees to be paid to the Advisor pursuant to the Agreement are reasonable, that the overall arrangement provided under the terms of the Agreement was a reasonable business arrangement, and that the approval of the Agreement was in the best interest of each Fund’s shareholders.
2.) APPROVAL OF SUB-ADVISORY AGREEMENT
At the same December 14, 2020 Board Meeting, the Board of Trustees considered the approval of the Sub-Advisory agreement (the “Agreement”) between the Advisor and the Sub-Advisor, with respect to the Advisors Capital US Dividend Fund, Advisors Capital Small/Mid Cap Fund, and Advisors Capital Tactical Fixed Income Fund (the “Funds”). Legal Counsel reviewed the memorandum provided by Thompson Hine LLP and explained that, in consideration of the approval of the Agreement, the Board should review as much information as is reasonably necessary to evaluate the terms of the contract and determine whether it is fair to each Fund and its shareholders. He also explained that the Sub-Advisor had provided information to the Trustees necessary for evaluation of approval of the Agreement.
In reviewing the Agreement, the Board of Trustees received materials from the Sub-Advisor addressing the following factors: (i) the investment performance of the Sub-Advisor; (ii) the nature, extent and quality of the services provided by the Sub-Advisor to the Funds; (iii) the cost of the services to be provided and the profits to be realized by the Sub-Advisor and its affiliates from the relationship with the Funds; (iv) the extent to which economies of scale will be realized as the Funds grow; and (v) whether the fee levels reflect these economies of scale to the benefit of shareholders.
The Board discussed the background and investment management experience of the Sub-Advisor’s professional staff. Mr. D. Neiman reviewed the firm’s history, background and financial industry experience. The Sub-Advisor noted that the Advisors Capital US Dividend Fund, Advisors Capital Small/Mid Cap Fund, and Advisors Capital Tactical Fixed Income Fund have no performance since they are new funds. However, the Trustees reviewed prior performance information for composites of accounts with strategies similar to those to be employed for the Advisors Capital US Dividend Fund and Advisors Capital Small/Mid Cap Fund and found them satisfactory. Mr. D. Neiman then discussed the investment strategy the Sub-Advisor will use in managing each Fund. It was noted that the investment advisory services to be rendered by the Sub-Advisor to each Fund, including investment decisions and trade executions will be provided by a team of portfolio managers.
As for the nature, extent and quality of the services provided by the Sub-Advisor, the Trustees analyzed the Sub-Advisor’s experience and capabilities. The Board reviewed and discussed with the Sub-Advisor’s Form ADV and reviewed the information provided to the Board regarding the investment personnel of the Sub-Advisor. The Trustees also considered a certification from the Sub-Advisor certifying that it has adopted a Code of Ethics containing provisions reasonably necessary to prevent Access Persons, as that term is defined in Rule 17j-1 under the 1940 Act, from engaging in conduct prohibited by Rule 17j-1(b) and that it has adopted procedures reasonably necessary to prevent Access Persons from violating such Code of Ethics. They also reviewed the Sub-Advisor’s financial information and discussed the firm’s ability to meet its obligations under the Agreement. The Board concluded that the nature and extent of the services to be provided by the Sub-Advisor’s were consistent with their expectations. The Trustees also concluded that the Sub-Advisor has the resources to provide quality advisory services to each Fund.
2021 Semi-Annual Report 24
Additional Information (Unaudited) - continued
The Board then considered fees charged to Sub-Advisor clients with investment strategies similar to those to be employed for the Funds. The Trustees noted that while other client fees were lower they were not genuinely comparable because of the lower regulatory burden for such client accounts when compared to the Funds. As to the cost of the services to be provided and the profits to be realized by Advisors Capital Management, LLC from the relationship with the Funds, it was noted that the Sub-Advisor was not expected to be profitable in year one. The Sub-Advisor projected reasonable or no profits in year two. The Trustees then discussed Advisors Capital Management, LLC’s financial condition and found it satisfactory.
Turning to the level of sub-advisor fees, the Advisor has contractually agreed to pay the Sub-Advisor a per-Fund fee equal to an annual fee of 1.00% of each Fund's average daily net assets up to $67.5 million, 1.30% of each Fund's average daily net assets over $67.5 million and up to $225 million, 1.25% of each Fund's average daily net assets over $225 million and up to $450 million, 1.20% of each Fund's average daily net assets over $450 million and up to $1,350 million and 1.15% of each Fund's average daily net assets in excess of $1,350 million. The Trustees reviewed and accepted this payment schedule as a reasonable fee split between the Advisor and Sub-Advisor based on their relative responsibilities.
As for potential economies of scale, the Trustees noted that since the Funds are new, economies of scale with respect to the management of the Funds will be considered as the Funds grow.
Next, the independent Trustees met in executive session to discuss the approval of the Sub-Advisory contracts. The officers of the Trust were excused during this discussion.
Upon reconvening, it was the Board’s consensus (including a majority of the independent Trustees) that the fee to be paid to Advisors Capital Management, LLC pursuant to the Agreement was reasonable, that the overall arrangement provided under the terms of the Agreement was a reasonable business arrangement, and that the approval of the Agreement was in the best interest of each Fund’s shareholders.
3.) AVAILABILITY OF QUARTERLY SCHEDULE OF INVESTMENTS
The Funds publicly file their complete schedules of portfolio holdings with the Securities and Exchange Commission (“SEC”) for the first and third quarters of each fiscal year on Form N-PORT. The Funds’ Forms N-PORT are available on the SEC’s website at http://www.sec.gov.
4.) PROXY VOTING GUIDELINES
Advisors Capital Management, LLC, the Funds’ Sub-Advisor, is responsible for exercising the voting rights associated with the securities held by the Funds. A description of the policies and procedures used by the Sub-Advisor in fulfilling this responsibility is available without charge on the Funds’ website at www.advisorscapitalfunds.com. It is also included in the Funds’ Statement of Additional Information, which is available on the SEC’s website at http://www.sec.gov.
Information regarding how the Funds voted proxies, Form N-PX, relating to portfolio securities during the most recent 12-month period ended June 30 will be available without charge, upon request, by calling our toll free number (1-888-247-3841). This information is also available on the SEC’s website at http://www.sec.gov.
5.) ADDITIONAL INFORMATION
You will find more information about the Funds at www.advisorscapitalfunds.com. For shareholder inquiries, please call toll-free in the U.S. at 1-888-247-3841
2021 Semi-Annual Report 25
Board of Trustees
Darla Clark
George Cossolias, CPA
Suzanne Cowan Dimeff
Michael Lomas
Custodian
U.S. Bank, NA
Distributor
Arbor Court Capital, LLC
Fund Administrator
Premier Fund Solutions, Inc.
Independent Registered Public Accounting Firm
Cohen & Company, Ltd.
Investment Advisor
AC Funds LLC
Sub-Advisor
Advisors Capital Management, LLC
Legal Counsel
Thompson Hine LLP
Transfer Agent
Mutual Shareholder Services, LLC |
This report is provided for the general information of the shareholders of the Advisors
Capital Funds. This report is not intended for distribution to prospective investors in the
Funds, unless preceded or accompanied by an effective prospectus. |
Item 2. Code of Ethics. Not applicable.
Item 3. Audit Committee Financial Expert. Not applicable.
Item 4. Principal Accountant Fees and Services. Not applicable.
Item 5. Audit Committee of Listed Companies. Not applicable.
Item 6. Investments.
(a) Not applicable. Schedule filed with Item 1.
(b) Not applicable.
Item 7. Disclosure of Proxy Voting Policies and Procedures for Closed-End Management Investment Companies. Not applicable.
Item 8. Portfolio Managers of Closed-End Management Investment Companies. Not applicable.
Item 9. Purchases of Equity Securities by Closed-End Management Investment Companies and Affiliated Purchasers. Not applicable.
Item 10. Submission of Matters to a Vote of Security Holders.
The registrant has not adopted procedures by which shareholders may recommend nominees to the registrant’s board of trustees.
Item 11. Controls and Procedures.
(a) The Registrant’s president and chief financial officer concluded that the disclosure controls and procedures (as defined in Rule 30a-3(c) under the Act (17 CFR 270.30a -3(c))) as of a date within 90 days of the filing date of the report that includes the disclosure required by this paragraph, based on the evaluation of these controls and procedures required by Rule 30a-3(b) under the Act (17 CFR 270.30a -3(b)) and Rules 13a-15(b) or 15d-15(b) under the Exchange Act (17 CFR 240.13a -15(b) or 240.15d -15(b)).
(b) There were no changes in the registrant’s internal control over financial reporting (as defined in Rule 30a-3(d) under the Act (17 CFR 270.30a -3(d)) that occurred during the period covered by this report that has materially affected, or is reasonably likely to materially affect, the registrant’s internal control over financial reporting.
Item 12. Disclosure of Securities Lending Activities for Closed-End Management Investment Companies.
Not applicable.
Item 13. Exhibits.
(a)(1) Code of Ethics. Not applicable.
(a)(2) Certifications pursuant to Section 302 of the Sarbanes-Oxley Act of 2002. Filed herewith.
(a)(3) Not applicable.
(a)(4) Not applicable.
(b) Certification pursuant to Section 906 of the Sarbanes-Oxley Act of 2002. Filed herewith.
Pursuant to the requirements of the Securities Exchange Act of 1934 and the Investment Company Act of 1940, the registrant has duly caused this report to be signed on its behalf by the undersigned, thereunto duly authorized.
Neiman Funds
By: Daniel Neiman
Daniel Neiman President
Date: 06/08/2021
Pursuant to the requirements of the Securities Exchange Act of 1934 and the Investment Company Act of 1940, this report has been signed below by the following persons on behalf of the registrant and in the capacities and on the dates indicated.
By: Daniel Neiman
Daniel Neiman President
Date: 06/08/2021
By: Daniel Neiman
Daniel Neiman Chief Financial Officer
Date: 06/08/2021